Riverside borough, PA Map & Demographics
Riverside borough Overview
$39,961
PER CAPITA INCOME
$111,701
AVG FAMILY INCOME
$86,964
AVG HOUSEHOLD INCOME
21.8%
WAGE / INCOME GAP [ % ]
78.2¢/ $1
WAGE / INCOME GAP [ $ ]
0.40
INEQUALITY / GINI INDEX
2,316
TOTAL POPULATION
1,040
MALE POPULATION
1,276
FEMALE POPULATION
81.50
MALES / 100 FEMALES
122.69
FEMALES / 100 MALES
43.3
MEDIAN AGE
3.1
AVG FAMILY SIZE
2.5
AVG HOUSEHOLD SIZE
1,225
LABOR FORCE [ PEOPLE ]
64.6%
PERCENT IN LABOR FORCE
2.8%
UNEMPLOYMENT RATE
Income in Riverside borough
Income Overview in Riverside borough
Per Capita Income in Riverside borough is $39,961, while median incomes of families and households are $111,701 and $86,964 respectively.
| Characteristic | Number | Measure |
| Per Capita Income | 2,316 | $39,961 |
| Median Family Income | 639 | $111,701 |
| Mean Family Income | 639 | $122,306 |
| Median Household Income | 911 | $86,964 |
| Mean Household Income | 911 | $101,634 |
| Income Deficit | 639 | $0 |
| Wage / Income Gap (%) | 2,316 | 21.81% |
| Wage / Income Gap ($) | 2,316 | 78.19¢ per $1 |
| Gini / Inequality Index | 2,316 | 0.40 |
Earnings by Sex in Riverside borough
Average Earnings in Riverside borough are $53,068, $58,935 for men and $46,083 for women, a difference of 21.8%.
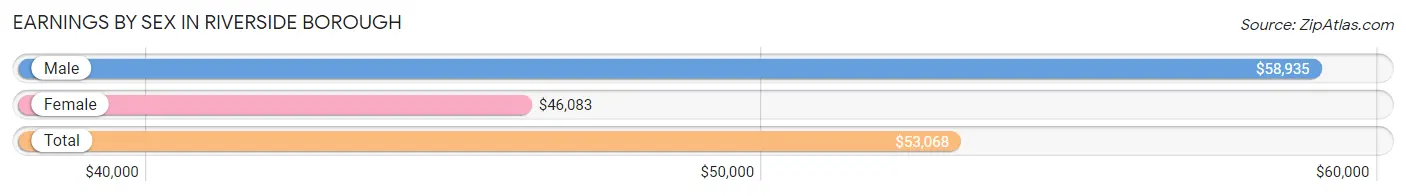
| Sex | Number | Average Earnings |
| Male | 633 (49.4%) | $58,935 |
| Female | 649 (50.6%) | $46,083 |
| Total | 1,282 (100.0%) | $53,068 |
Earnings by Sex by Income Bracket in Riverside borough
The most common earnings brackets in Riverside borough are $65,000 to $74,999 for men (104 | 16.4%) and $65,000 to $74,999 for women (97 | 14.9%).
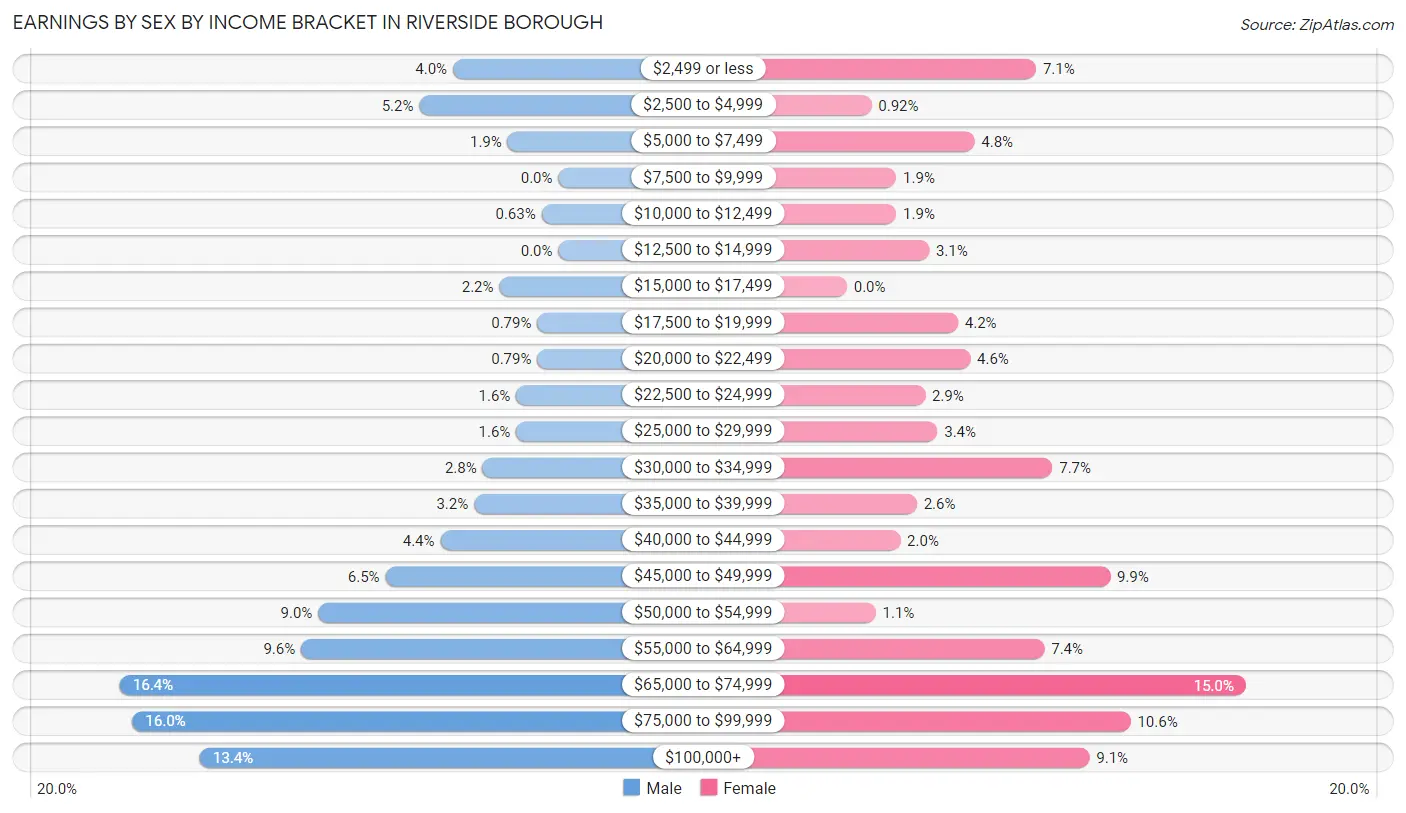
| Income | Male | Female |
| $2,499 or less | 25 (4.0%) | 46 (7.1%) |
| $2,500 to $4,999 | 33 (5.2%) | 6 (0.9%) |
| $5,000 to $7,499 | 12 (1.9%) | 31 (4.8%) |
| $7,500 to $9,999 | 0 (0.0%) | 12 (1.8%) |
| $10,000 to $12,499 | 4 (0.6%) | 12 (1.8%) |
| $12,500 to $14,999 | 0 (0.0%) | 20 (3.1%) |
| $15,000 to $17,499 | 14 (2.2%) | 0 (0.0%) |
| $17,500 to $19,999 | 5 (0.8%) | 27 (4.2%) |
| $20,000 to $22,499 | 5 (0.8%) | 30 (4.6%) |
| $22,500 to $24,999 | 10 (1.6%) | 19 (2.9%) |
| $25,000 to $29,999 | 10 (1.6%) | 22 (3.4%) |
| $30,000 to $34,999 | 18 (2.8%) | 50 (7.7%) |
| $35,000 to $39,999 | 20 (3.2%) | 17 (2.6%) |
| $40,000 to $44,999 | 28 (4.4%) | 13 (2.0%) |
| $45,000 to $49,999 | 41 (6.5%) | 64 (9.9%) |
| $50,000 to $54,999 | 57 (9.0%) | 7 (1.1%) |
| $55,000 to $64,999 | 61 (9.6%) | 48 (7.4%) |
| $65,000 to $74,999 | 104 (16.4%) | 97 (14.9%) |
| $75,000 to $99,999 | 101 (16.0%) | 69 (10.6%) |
| $100,000+ | 85 (13.4%) | 59 (9.1%) |
| Total | 633 (100.0%) | 649 (100.0%) |
Earnings by Sex by Educational Attainment in Riverside borough
Average earnings in Riverside borough are $66,133 for men and $49,934 for women, a difference of 24.5%. Men with an educational attainment of bachelor's degree enjoy the highest average annual earnings of $88,438, while those with high school diploma education earn the least with $46,442. Women with an educational attainment of graduate degree earn the most with the average annual earnings of $69,359, while those with high school diploma education have the smallest earnings of $29,632.
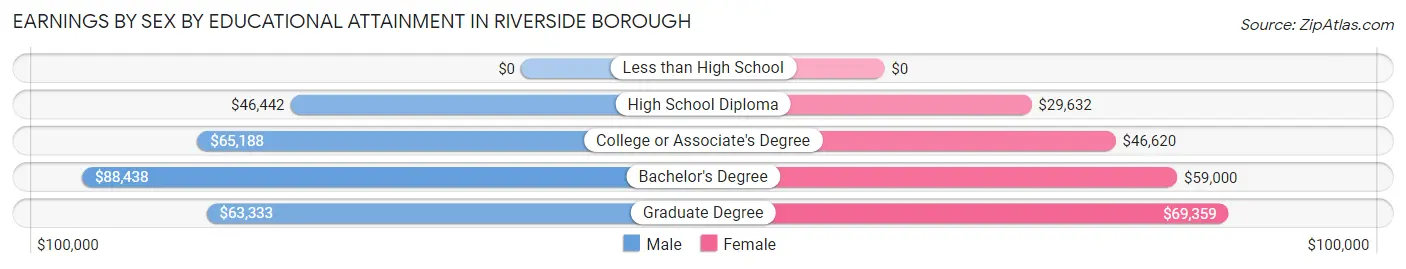
| Educational Attainment | Male Income | Female Income |
| Less than High School | - | - |
| High School Diploma | $46,442 | $29,632 |
| College or Associate's Degree | $65,188 | $46,620 |
| Bachelor's Degree | $88,438 | $59,000 |
| Graduate Degree | $63,333 | $69,359 |
| Total | $66,133 | $49,934 |
Family Income in Riverside borough
Family Income Brackets in Riverside borough
According to the Riverside borough family income data, there are 166 families falling into the $100,000 to $149,999 income range, which is the most common income bracket and makes up 26.0% of all families.
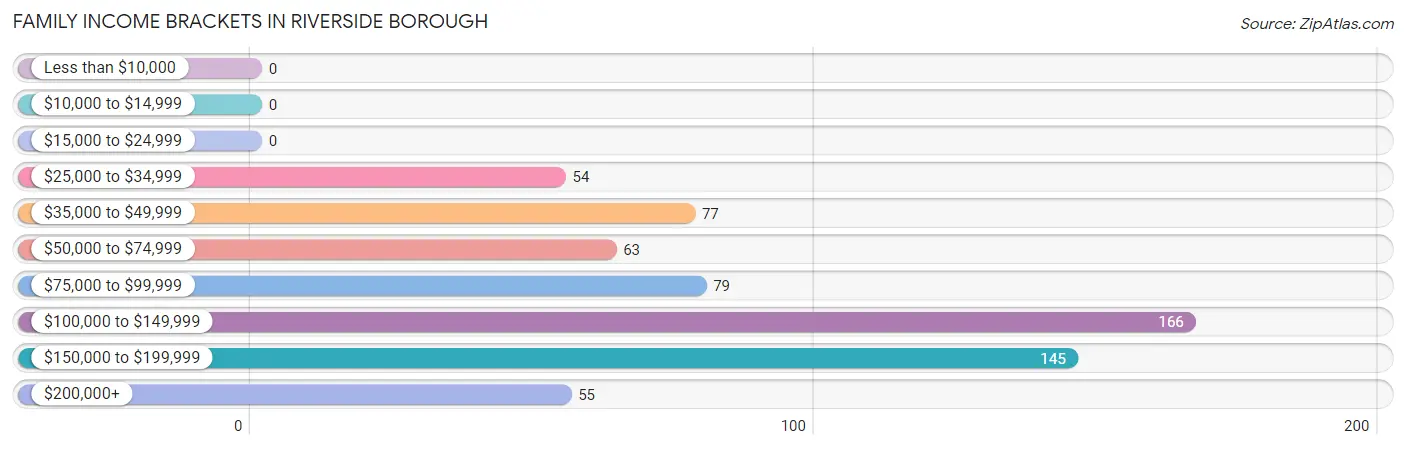
| Income Bracket | # Families | % Families |
| Less than $10,000 | 0 | 0.0% |
| $10,000 to $14,999 | 0 | 0.0% |
| $15,000 to $24,999 | 0 | 0.0% |
| $25,000 to $34,999 | 54 | 8.5% |
| $35,000 to $49,999 | 77 | 12.1% |
| $50,000 to $74,999 | 63 | 9.9% |
| $75,000 to $99,999 | 79 | 12.4% |
| $100,000 to $149,999 | 166 | 26.0% |
| $150,000 to $199,999 | 145 | 22.7% |
| $200,000+ | 55 | 8.6% |
Family Income by Famaliy Size in Riverside borough
6-person families (43 | 6.7%) account for the highest median family income in Riverside borough with $165,655 per family, while 2-person families (320 | 50.1%) have the highest median income of $41,458 per family member.
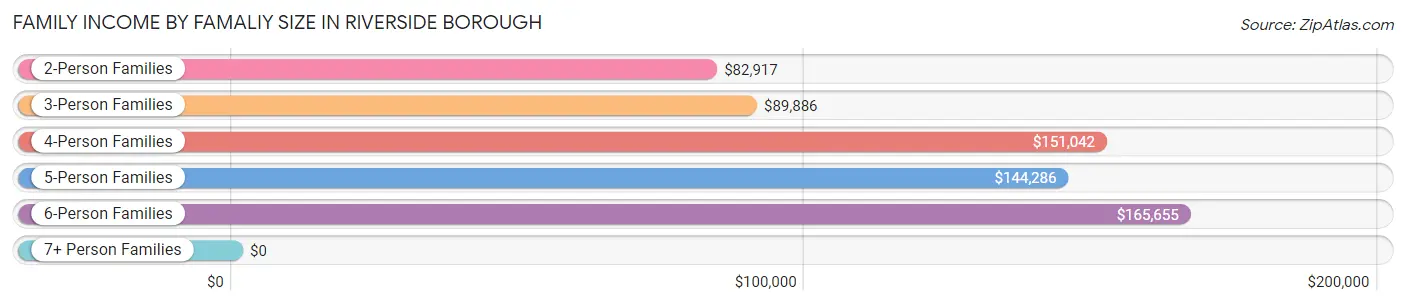
| Income Bracket | # Families | Median Income |
| 2-Person Families | 320 (50.1%) | $82,917 |
| 3-Person Families | 111 (17.4%) | $89,886 |
| 4-Person Families | 95 (14.9%) | $151,042 |
| 5-Person Families | 70 (11.0%) | $144,286 |
| 6-Person Families | 43 (6.7%) | $165,655 |
| 7+ Person Families | 0 (0.0%) | $0 |
| Total | 639 (100.0%) | $111,701 |
Family Income by Number of Earners in Riverside borough
The median family income in Riverside borough is $111,701, with families comprising 3+ earners (100) having the highest median family income of $181,071, while families with no earners (97) have the lowest median family income of $40,642, accounting for 15.7% and 15.2% of families, respectively.
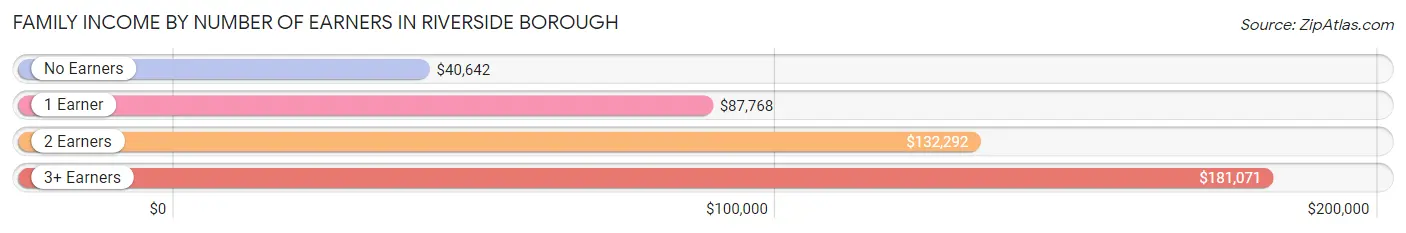
| Number of Earners | # Families | Median Income |
| No Earners | 97 (15.2%) | $40,642 |
| 1 Earner | 149 (23.3%) | $87,768 |
| 2 Earners | 293 (45.9%) | $132,292 |
| 3+ Earners | 100 (15.7%) | $181,071 |
| Total | 639 (100.0%) | $111,701 |
Household Income in Riverside borough
Household Income Brackets in Riverside borough
With 195 households falling in the category, the $100,000 to $149,999 income range is the most frequent in Riverside borough, accounting for 21.4% of all households. In contrast, only 20 households (2.2%) fall into the $10,000 to $14,999 income bracket, making it the least populous group.
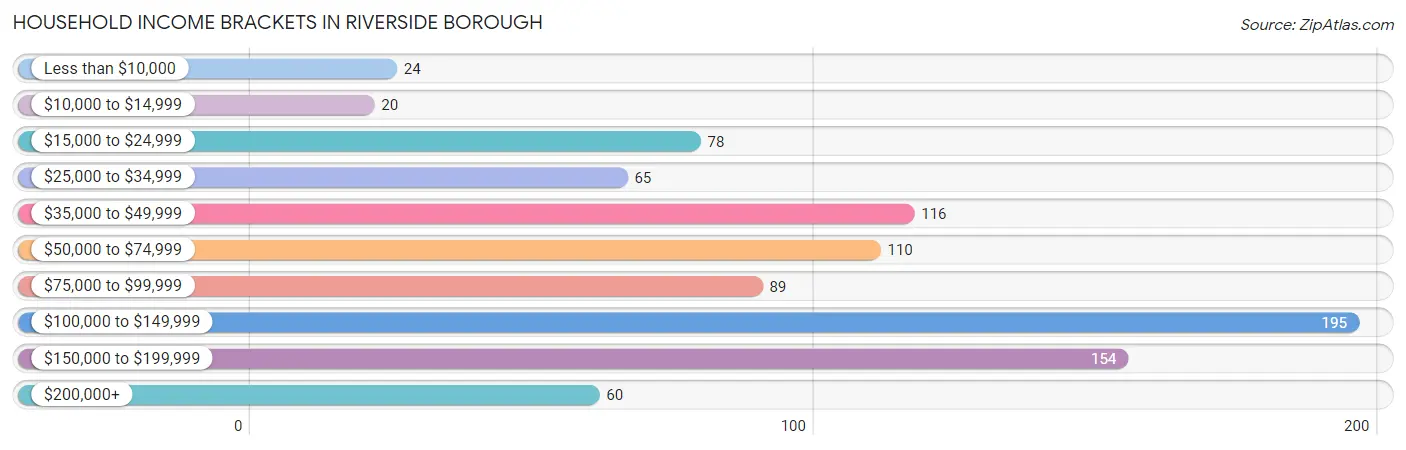
| Income Bracket | # Households | % Households |
| Less than $10,000 | 24 | 2.6% |
| $10,000 to $14,999 | 20 | 2.2% |
| $15,000 to $24,999 | 78 | 8.6% |
| $25,000 to $34,999 | 65 | 7.1% |
| $35,000 to $49,999 | 116 | 12.7% |
| $50,000 to $74,999 | 110 | 12.1% |
| $75,000 to $99,999 | 89 | 9.8% |
| $100,000 to $149,999 | 195 | 21.4% |
| $150,000 to $199,999 | 154 | 16.9% |
| $200,000+ | 60 | 6.6% |
Household Income by Householder Age in Riverside borough
The median household income in Riverside borough is $86,964, with the highest median household income of $120,938 found in the 45 to 64 years age bracket for the primary householder. A total of 343 households (37.7%) fall into this category. Meanwhile, the 15 to 24 years age bracket for the primary householder has the lowest median household income of $0, with 6 households (0.7%) in this group.
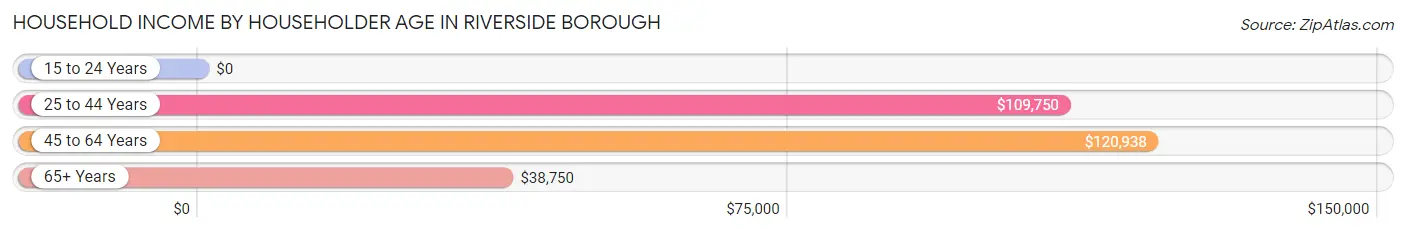
| Income Bracket | # Households | Median Income |
| 15 to 24 Years | 6 (0.7%) | $0 |
| 25 to 44 Years | 270 (29.6%) | $109,750 |
| 45 to 64 Years | 343 (37.7%) | $120,938 |
| 65+ Years | 292 (32.1%) | $38,750 |
| Total | 911 (100.0%) | $86,964 |
Poverty in Riverside borough
Income Below Poverty by Sex and Age in Riverside borough
With 2.1% poverty level for males and 2.8% for females among the residents of Riverside borough, 65 to 74 year old males and 25 to 34 year old females are the most vulnerable to poverty, with 14 males (13.5%) and 24 females (16.4%) in their respective age groups living below the poverty level.
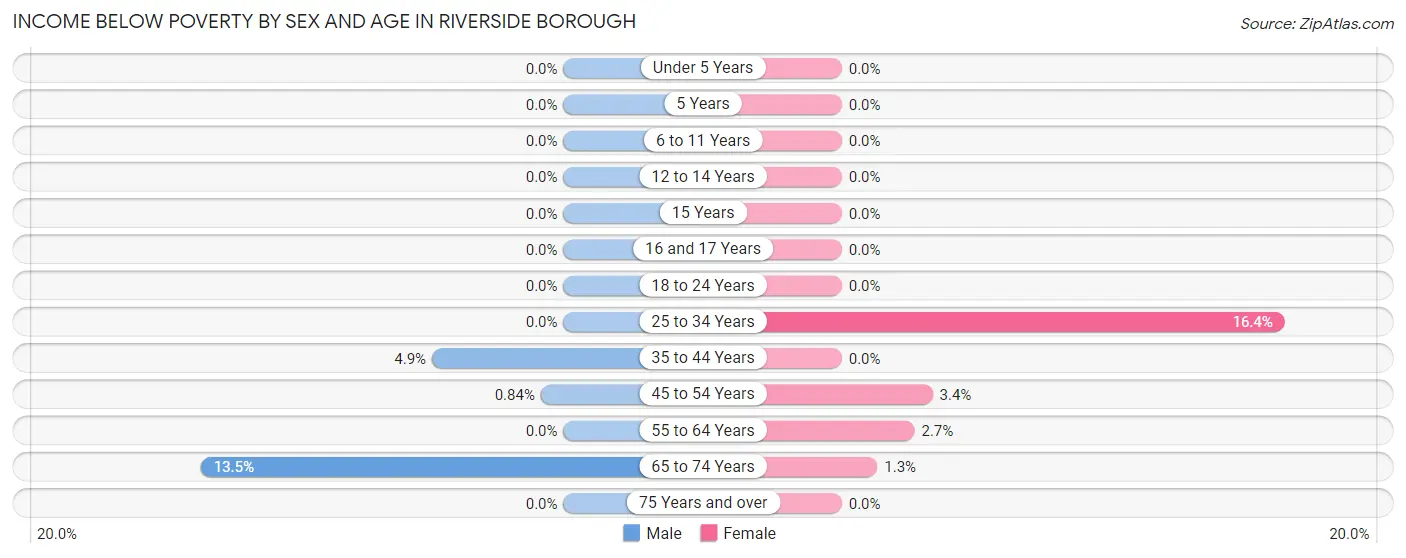
| Age Bracket | Male | Female |
| Under 5 Years | 0 (0.0%) | 0 (0.0%) |
| 5 Years | 0 (0.0%) | 0 (0.0%) |
| 6 to 11 Years | 0 (0.0%) | 0 (0.0%) |
| 12 to 14 Years | 0 (0.0%) | 0 (0.0%) |
| 15 Years | 0 (0.0%) | 0 (0.0%) |
| 16 and 17 Years | 0 (0.0%) | 0 (0.0%) |
| 18 to 24 Years | 0 (0.0%) | 0 (0.0%) |
| 25 to 34 Years | 0 (0.0%) | 24 (16.4%) |
| 35 to 44 Years | 6 (4.9%) | 0 (0.0%) |
| 45 to 54 Years | 2 (0.8%) | 6 (3.4%) |
| 55 to 64 Years | 0 (0.0%) | 4 (2.7%) |
| 65 to 74 Years | 14 (13.5%) | 2 (1.3%) |
| 75 Years and over | 0 (0.0%) | 0 (0.0%) |
| Total | 22 (2.1%) | 36 (2.8%) |
Income Above Poverty by Sex and Age in Riverside borough
According to the poverty statistics in Riverside borough, males aged under 5 years and females aged under 5 years are the age groups that are most secure financially, with 100.0% of males and 100.0% of females in these age groups living above the poverty line.
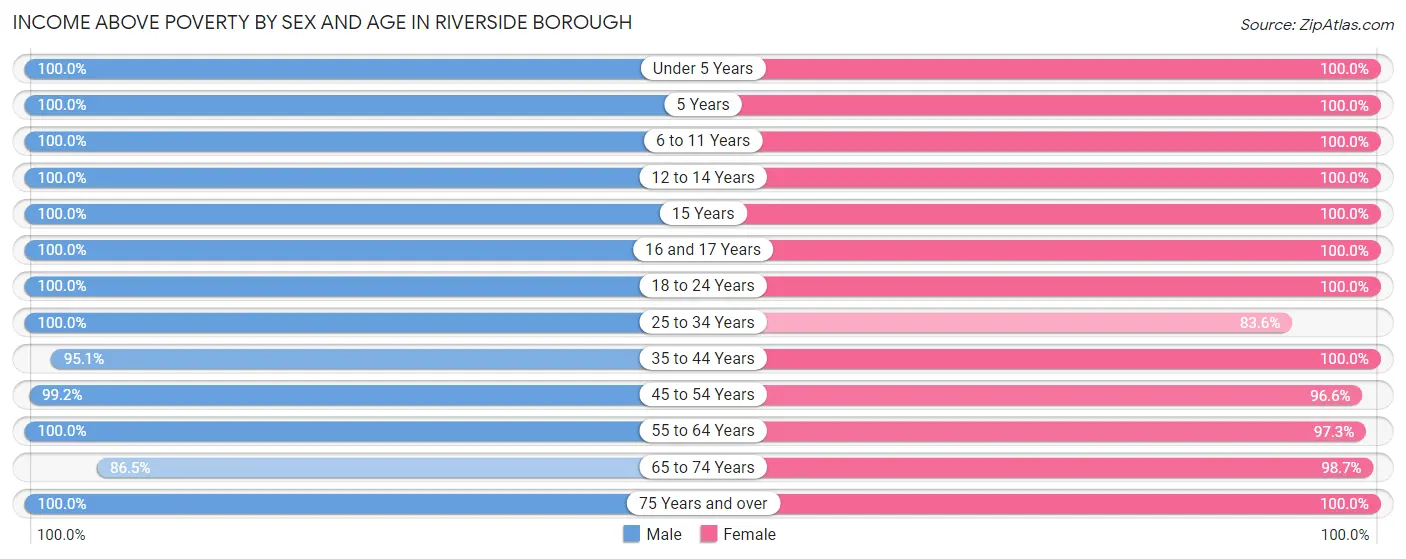
| Age Bracket | Male | Female |
| Under 5 Years | 56 (100.0%) | 71 (100.0%) |
| 5 Years | 16 (100.0%) | 17 (100.0%) |
| 6 to 11 Years | 103 (100.0%) | 60 (100.0%) |
| 12 to 14 Years | 21 (100.0%) | 37 (100.0%) |
| 15 Years | 7 (100.0%) | 32 (100.0%) |
| 16 and 17 Years | 57 (100.0%) | 27 (100.0%) |
| 18 to 24 Years | 49 (100.0%) | 109 (100.0%) |
| 25 to 34 Years | 107 (100.0%) | 122 (83.6%) |
| 35 to 44 Years | 117 (95.1%) | 148 (100.0%) |
| 45 to 54 Years | 236 (99.2%) | 172 (96.6%) |
| 55 to 64 Years | 92 (100.0%) | 144 (97.3%) |
| 65 to 74 Years | 90 (86.5%) | 150 (98.7%) |
| 75 Years and over | 67 (100.0%) | 151 (100.0%) |
| Total | 1,018 (97.9%) | 1,240 (97.2%) |
Income Below Poverty Among Married-Couple Families in Riverside borough
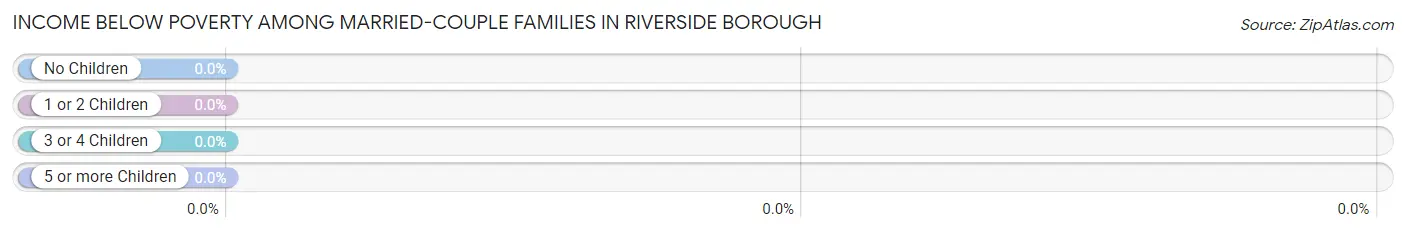
| Children | Above Poverty | Below Poverty |
| No Children | 323 (100.0%) | 0 (0.0%) |
| 1 or 2 Children | 179 (100.0%) | 0 (0.0%) |
| 3 or 4 Children | 64 (100.0%) | 0 (0.0%) |
| 5 or more Children | 0 (0.0%) | 0 (0.0%) |
| Total | 566 (100.0%) | 0 (0.0%) |
Income Below Poverty Among Single-Parent Households in Riverside borough
| Children | Single Father | Single Mother |
| No Children | 0 (0.0%) | 0 (0.0%) |
| 1 or 2 Children | 0 (0.0%) | 0 (0.0%) |
| 3 or 4 Children | 0 (0.0%) | 0 (0.0%) |
| 5 or more Children | 0 (0.0%) | 0 (0.0%) |
| Total | 0 (0.0%) | 0 (0.0%) |
Income Below Poverty Among Married-Couple vs Single-Parent Households in Riverside borough
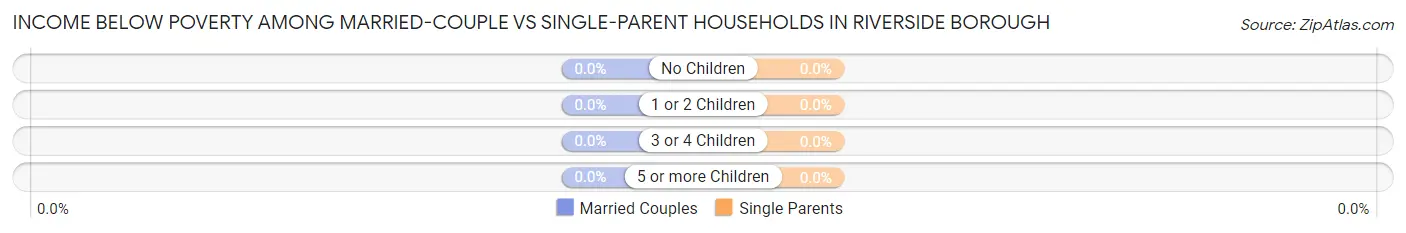
| Children | Married-Couple Families | Single-Parent Households |
| No Children | 0 (0.0%) | 0 (0.0%) |
| 1 or 2 Children | 0 (0.0%) | 0 (0.0%) |
| 3 or 4 Children | 0 (0.0%) | 0 (0.0%) |
| 5 or more Children | 0 (0.0%) | 0 (0.0%) |
| Total | 0 (0.0%) | 0 (0.0%) |
Race in Riverside borough
The most populous races in Riverside borough are White / Caucasian (2,066 | 89.2%), Two or more Races (136 | 5.9%), and Hispanic or Latino (103 | 4.4%).
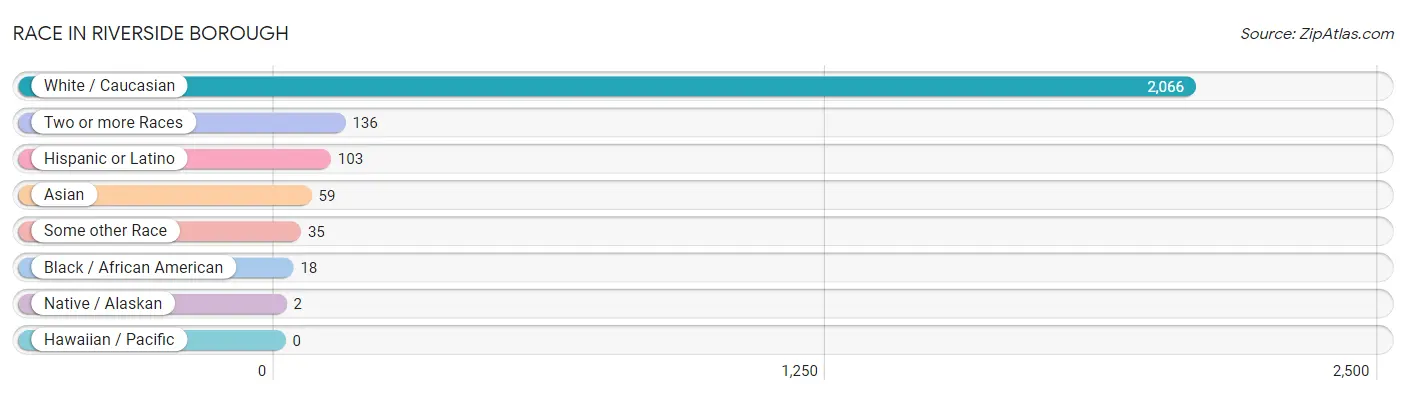
| Race | # Population | % Population |
| Asian | 59 | 2.5% |
| Black / African American | 18 | 0.8% |
| Hawaiian / Pacific | 0 | 0.0% |
| Hispanic or Latino | 103 | 4.4% |
| Native / Alaskan | 2 | 0.1% |
| White / Caucasian | 2,066 | 89.2% |
| Two or more Races | 136 | 5.9% |
| Some other Race | 35 | 1.5% |
| Total | 2,316 | 100.0% |
Ancestry in Riverside borough
The most populous ancestries reported in Riverside borough are German (1,003 | 43.3%), Irish (275 | 11.9%), English (272 | 11.7%), Italian (231 | 10.0%), and American (111 | 4.8%), together accounting for 81.7% of all Riverside borough residents.
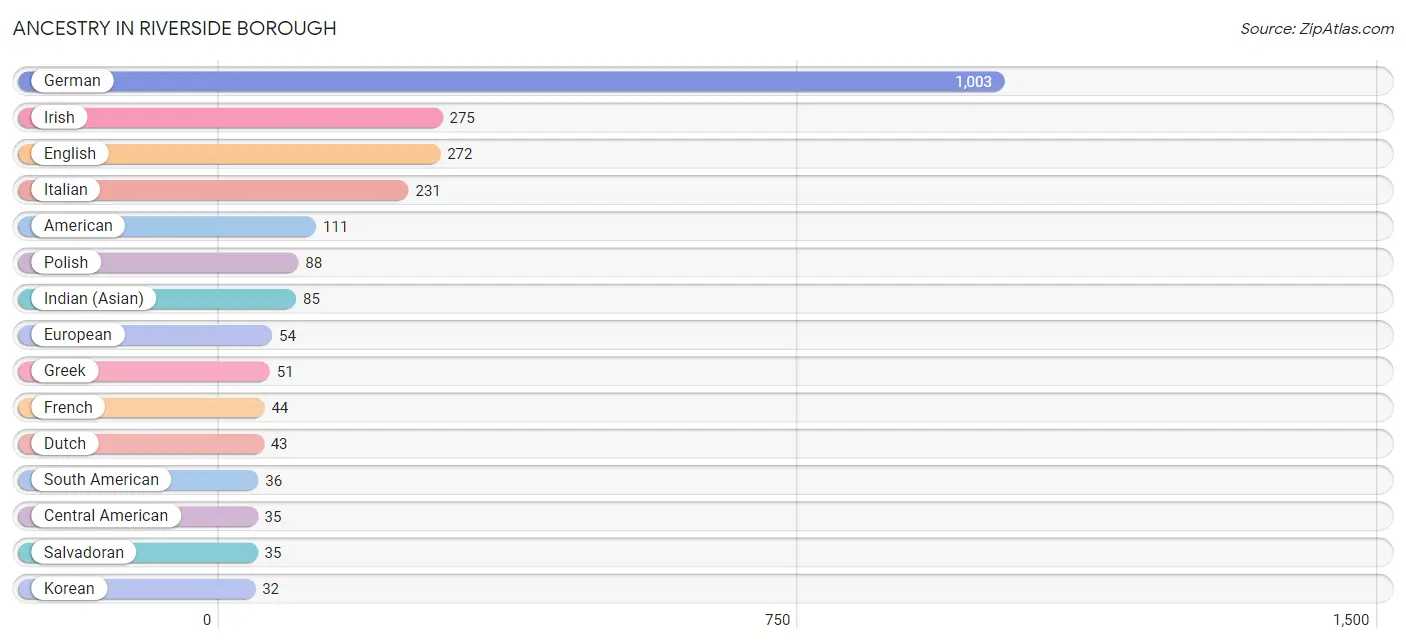
| Ancestry | # Population | % Population |
| American | 111 | 4.8% |
| Austrian | 5 | 0.2% |
| Belgian | 3 | 0.1% |
| Blackfeet | 2 | 0.1% |
| Central American | 35 | 1.5% |
| Chilean | 16 | 0.7% |
| Colombian | 20 | 0.9% |
| Czech | 11 | 0.5% |
| Danish | 4 | 0.2% |
| Dutch | 43 | 1.9% |
| Eastern European | 10 | 0.4% |
| English | 272 | 11.7% |
| European | 54 | 2.3% |
| French | 44 | 1.9% |
| German | 1,003 | 43.3% |
| Greek | 51 | 2.2% |
| Hungarian | 11 | 0.5% |
| Indian (Asian) | 85 | 3.7% |
| Irish | 275 | 11.9% |
| Iroquois | 4 | 0.2% |
| Italian | 231 | 10.0% |
| Jamaican | 5 | 0.2% |
| Korean | 32 | 1.4% |
| Lithuanian | 15 | 0.6% |
| Mexican | 32 | 1.4% |
| Nigerian | 13 | 0.6% |
| Pennsylvania German | 16 | 0.7% |
| Polish | 88 | 3.8% |
| Portuguese | 6 | 0.3% |
| Russian | 10 | 0.4% |
| Salvadoran | 35 | 1.5% |
| Scotch-Irish | 16 | 0.7% |
| Scottish | 15 | 0.6% |
| Slovak | 16 | 0.7% |
| Slovene | 2 | 0.1% |
| South American | 36 | 1.5% |
| Subsaharan African | 13 | 0.6% |
| Swedish | 7 | 0.3% |
| Thai | 6 | 0.3% |
| Welsh | 22 | 0.9% | View All 40 Rows |
Immigrants in Riverside borough
The most numerous immigrant groups reported in Riverside borough came from Latin America (25 | 1.1%), Colombia (20 | 0.9%), South America (20 | 0.9%), Africa (13 | 0.6%), and Nigeria (13 | 0.6%), together accounting for 3.9% of all Riverside borough residents.
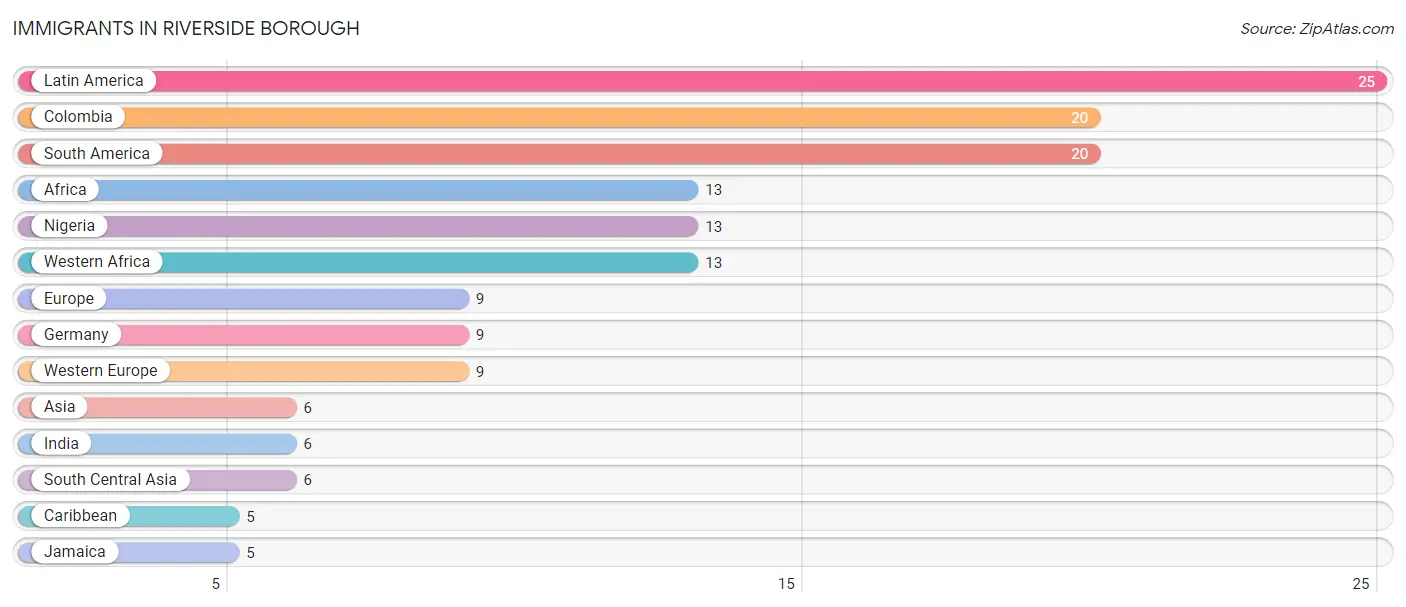
| Immigration Origin | # Population | % Population |
| Africa | 13 | 0.6% |
| Asia | 6 | 0.3% |
| Caribbean | 5 | 0.2% |
| Colombia | 20 | 0.9% |
| Europe | 9 | 0.4% |
| Germany | 9 | 0.4% |
| India | 6 | 0.3% |
| Jamaica | 5 | 0.2% |
| Latin America | 25 | 1.1% |
| Nigeria | 13 | 0.6% |
| South America | 20 | 0.9% |
| South Central Asia | 6 | 0.3% |
| Western Africa | 13 | 0.6% |
| Western Europe | 9 | 0.4% | View All 14 Rows |
Sex and Age in Riverside borough
Sex and Age in Riverside borough
The most populous age groups in Riverside borough are 45 to 49 Years (119 | 11.4%) for men and 45 to 49 Years (129 | 10.1%) for women.
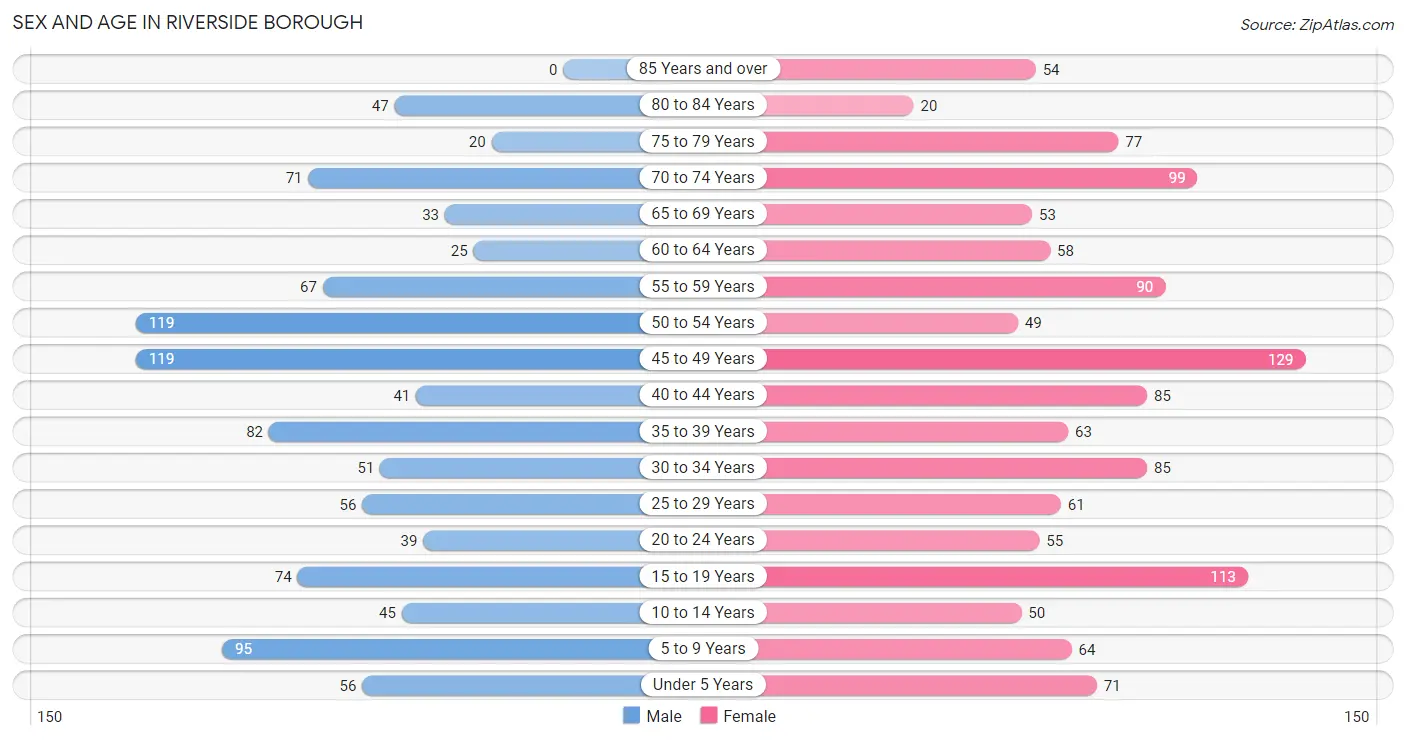
| Age Bracket | Male | Female |
| Under 5 Years | 56 (5.4%) | 71 (5.6%) |
| 5 to 9 Years | 95 (9.1%) | 64 (5.0%) |
| 10 to 14 Years | 45 (4.3%) | 50 (3.9%) |
| 15 to 19 Years | 74 (7.1%) | 113 (8.9%) |
| 20 to 24 Years | 39 (3.7%) | 55 (4.3%) |
| 25 to 29 Years | 56 (5.4%) | 61 (4.8%) |
| 30 to 34 Years | 51 (4.9%) | 85 (6.7%) |
| 35 to 39 Years | 82 (7.9%) | 63 (4.9%) |
| 40 to 44 Years | 41 (3.9%) | 85 (6.7%) |
| 45 to 49 Years | 119 (11.4%) | 129 (10.1%) |
| 50 to 54 Years | 119 (11.4%) | 49 (3.8%) |
| 55 to 59 Years | 67 (6.4%) | 90 (7.0%) |
| 60 to 64 Years | 25 (2.4%) | 58 (4.5%) |
| 65 to 69 Years | 33 (3.2%) | 53 (4.2%) |
| 70 to 74 Years | 71 (6.8%) | 99 (7.8%) |
| 75 to 79 Years | 20 (1.9%) | 77 (6.0%) |
| 80 to 84 Years | 47 (4.5%) | 20 (1.6%) |
| 85 Years and over | 0 (0.0%) | 54 (4.2%) |
| Total | 1,040 (100.0%) | 1,276 (100.0%) |
Families and Households in Riverside borough
Median Family Size in Riverside borough
The median family size in Riverside borough is 3.11 persons per family, with married-couple families (566 | 88.6%) accounting for the largest median family size of 3.13 persons per family. On the other hand, single male/father families (22 | 3.4%) represent the smallest median family size with 2.82 persons per family.
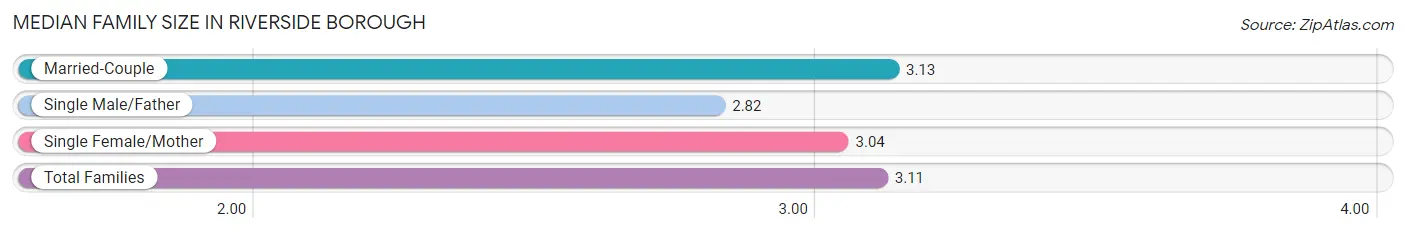
| Family Type | # Families | Family Size |
| Married-Couple | 566 (88.6%) | 3.13 |
| Single Male/Father | 22 (3.4%) | 2.82 |
| Single Female/Mother | 51 (8.0%) | 3.04 |
| Total Families | 639 (100.0%) | 3.11 |
Median Household Size in Riverside borough
The median household size in Riverside borough is 2.54 persons per household, with single female/mother households (51 | 5.6%) accounting for the largest median household size of 3.22 persons per household. non-family households (272 | 29.9%) represent the smallest median household size with 1.14 persons per household.
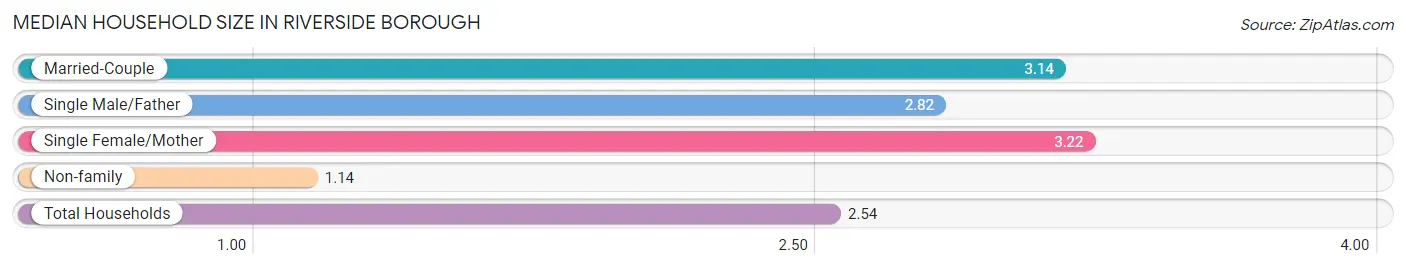
| Household Type | # Households | Household Size |
| Married-Couple | 566 (62.1%) | 3.14 |
| Single Male/Father | 22 (2.4%) | 2.82 |
| Single Female/Mother | 51 (5.6%) | 3.22 |
| Non-family | 272 (29.9%) | 1.14 |
| Total Households | 911 (100.0%) | 2.54 |
Household Size by Marriage Status in Riverside borough
Out of a total of 911 households in Riverside borough, 639 (70.1%) are family households, while 272 (29.9%) are nonfamily households. The most numerous type of family households are 2-person households, comprising 320, and the most common type of nonfamily households are 1-person households, comprising 229.
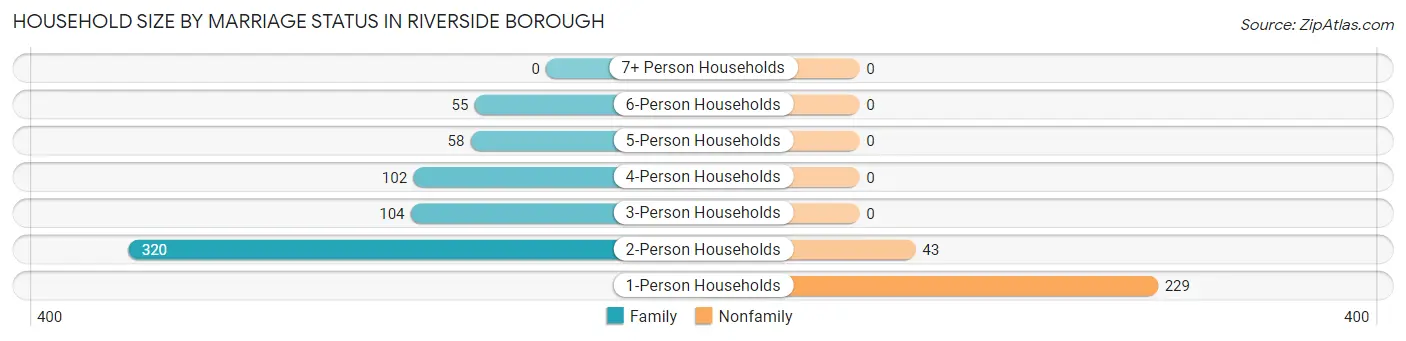
| Household Size | Family Households | Nonfamily Households |
| 1-Person Households | - | 229 (25.1%) |
| 2-Person Households | 320 (35.1%) | 43 (4.7%) |
| 3-Person Households | 104 (11.4%) | 0 (0.0%) |
| 4-Person Households | 102 (11.2%) | 0 (0.0%) |
| 5-Person Households | 58 (6.4%) | 0 (0.0%) |
| 6-Person Households | 55 (6.0%) | 0 (0.0%) |
| 7+ Person Households | 0 (0.0%) | 0 (0.0%) |
| Total | 639 (70.1%) | 272 (29.9%) |
Female Fertility in Riverside borough
Fertility by Age in Riverside borough
Average fertility rate in Riverside borough is 22.0 births per 1,000 women. Women in the age bracket of 20 to 34 years have the highest fertility rate with 70.0 births per 1,000 women. Women in the age bracket of 20 to 34 years acount for 100.0% of all women with births.
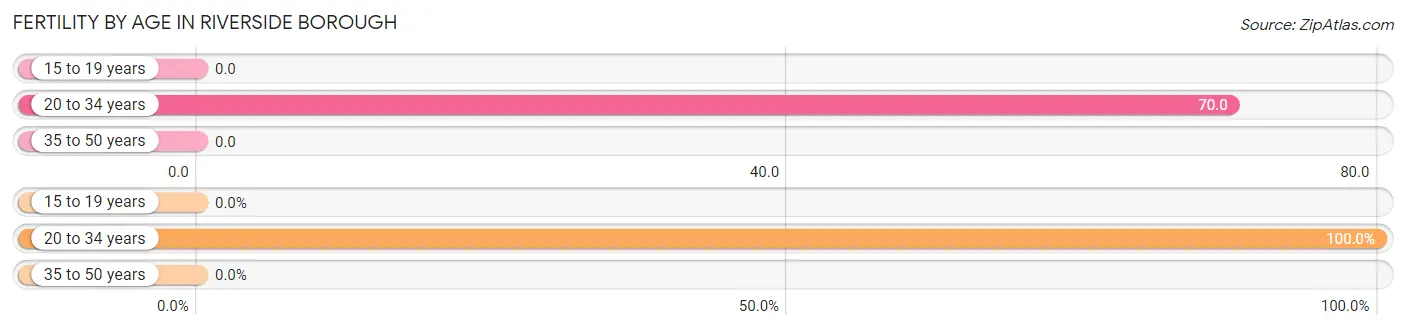
| Age Bracket | Women with Births | Births / 1,000 Women |
| 15 to 19 years | 0 (0.0%) | 0.0 |
| 20 to 34 years | 14 (100.0%) | 70.0 |
| 35 to 50 years | 0 (0.0%) | 0.0 |
| Total | 14 (100.0%) | 22.0 |
Fertility by Age by Marriage Status in Riverside borough
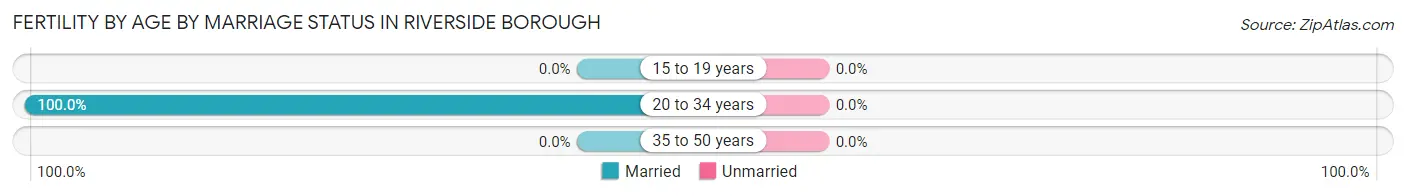
| Age Bracket | Married | Unmarried |
| 15 to 19 years | 0 (0.0%) | 0 (0.0%) |
| 20 to 34 years | 14 (100.0%) | 0 (0.0%) |
| 35 to 50 years | 0 (0.0%) | 0 (0.0%) |
| Total | 14 (100.0%) | 0 (0.0%) |
Fertility by Education in Riverside borough
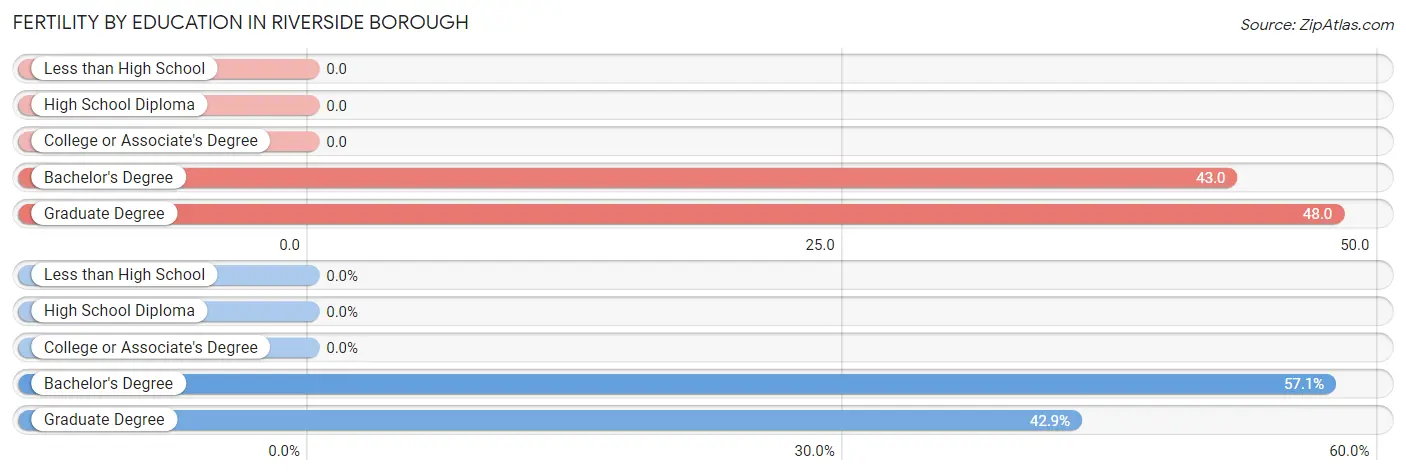
| Educational Attainment | Women with Births | Births / 1,000 Women |
| Less than High School | 0 (0.0%) | 0.0 |
| High School Diploma | 0 (0.0%) | 0.0 |
| College or Associate's Degree | 0 (0.0%) | 0.0 |
| Bachelor's Degree | 8 (57.1%) | 43.0 |
| Graduate Degree | 6 (42.9%) | 48.0 |
| Total | 14 (100.0%) | 22.0 |
Fertility by Education by Marriage Status in Riverside borough
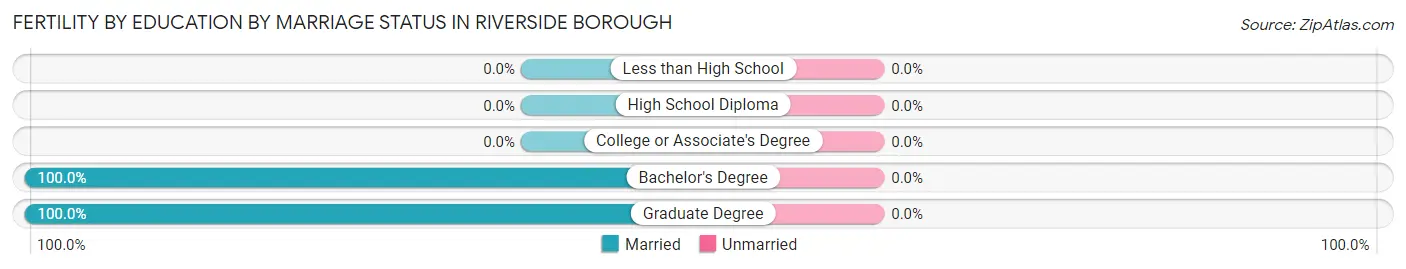
| Educational Attainment | Married | Unmarried |
| Less than High School | 0 (0.0%) | 0 (0.0%) |
| High School Diploma | 0 (0.0%) | 0 (0.0%) |
| College or Associate's Degree | 0 (0.0%) | 0 (0.0%) |
| Bachelor's Degree | 8 (100.0%) | 0 (0.0%) |
| Graduate Degree | 6 (100.0%) | 0 (0.0%) |
| Total | 14 (100.0%) | 0 (0.0%) |
Employment Characteristics in Riverside borough
Employment by Class of Employer in Riverside borough
Among the 1,190 employed individuals in Riverside borough, private company employees (568 | 47.7%), not-for-profit organizations (358 | 30.1%), and federal government employees (78 | 6.6%) make up the most common classes of employment.
| Employer Class | # Employees | % Employees |
| Private Company Employees | 568 | 47.7% |
| Self-Employed (Incorporated) | 16 | 1.3% |
| Self-Employed (Not Incorporated) | 77 | 6.5% |
| Not-for-profit Organizations | 358 | 30.1% |
| Local Government Employees | 63 | 5.3% |
| State Government Employees | 30 | 2.5% |
| Federal Government Employees | 78 | 6.6% |
| Unpaid Family Workers | 0 | 0.0% |
| Total | 1,190 | 100.0% |
Employment Status by Age in Riverside borough
According to the labor force statistics for Riverside borough, out of the total population over 16 years of age (1,896), 64.6% or 1,225 individuals are in the labor force, with 2.8% or 34 of them unemployed. The age group with the highest labor force participation rate is 35 to 44 years, with 95.9% or 260 individuals in the labor force. Within the labor force, the 20 to 24 years age range has the highest percentage of unemployed individuals, with 30.2% or 19 of them being unemployed.
| Age Bracket | In Labor Force | Unemployed |
| 16 to 19 Years | 70 (47.3%) | 0 (0.0%) |
| 20 to 24 Years | 63 (67.0%) | 19 (30.2%) |
| 25 to 29 Years | 100 (85.5%) | 0 (0.0%) |
| 30 to 34 Years | 113 (83.1%) | 0 (0.0%) |
| 35 to 44 Years | 260 (95.9%) | 0 (0.0%) |
| 45 to 54 Years | 381 (91.6%) | 15 (3.9%) |
| 55 to 59 Years | 136 (86.6%) | 0 (0.0%) |
| 60 to 64 Years | 32 (38.6%) | 0 (0.0%) |
| 65 to 74 Years | 29 (11.3%) | 0 (0.0%) |
| 75 Years and over | 40 (18.3%) | 0 (0.0%) |
| Total | 1,225 (64.6%) | 34 (2.8%) |
Employment Status by Educational Attainment in Riverside borough
According to labor force statistics for Riverside borough, 86.6% of individuals (1,022) out of the total population between 25 and 64 years of age (1,180) are in the labor force, with 1.5% or 15 of them being unemployed. The group with the highest labor force participation rate are those with the educational attainment of less than high school, with 100.0% or 7 individuals in the labor force. Within the labor force, individuals with college / associate degree education have the highest percentage of unemployment, with 2.1% or 6 of them being unemployed.
| Educational Attainment | In Labor Force | Unemployed |
| Less than High School | 7 (100.0%) | 0 (0.0%) |
| High School Diploma | 226 (76.6%) | 0 (0.0%) |
| College / Associate Degree | 292 (89.8%) | 7 (2.1%) |
| Bachelor's Degree or higher | 497 (89.9%) | 10 (1.8%) |
| Total | 1,022 (86.6%) | 18 (1.5%) |
Employment Occupations by Sex in Riverside borough
Management, Business, Science and Arts Occupations
The most common Management, Business, Science and Arts occupations in Riverside borough are Health Diagnosing & Treating (175 | 14.7%), Health Technologists (145 | 12.2%), Management (143 | 12.0%), Community & Social Service (106 | 8.9%), and Computers, Engineering & Science (103 | 8.7%).
Management, Business, Science and Arts Occupations by Sex
Within the Management, Business, Science and Arts occupations in Riverside borough, the most male-oriented occupations are Architecture & Engineering (100.0%), Legal Services & Support (100.0%), and Computers, Engineering & Science (45.6%), while the most female-oriented occupations are Life, Physical & Social Science (100.0%), Arts, Media & Entertainment (100.0%), and Education Instruction & Library (87.5%).
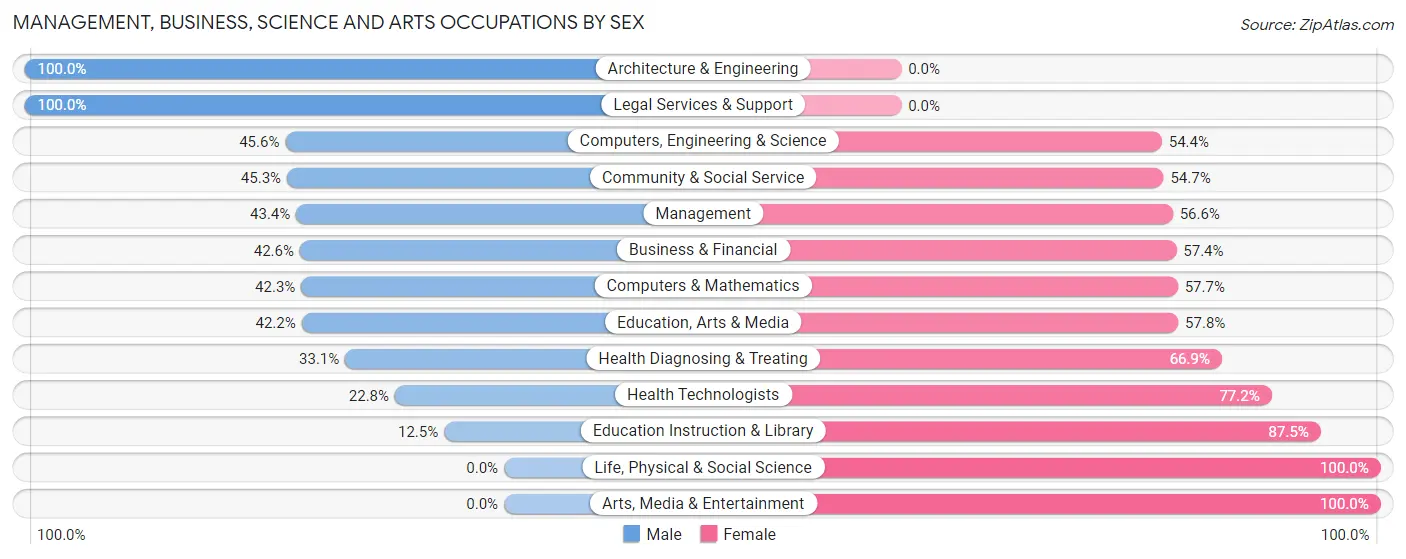
| Occupation | Male | Female |
| Management | 62 (43.4%) | 81 (56.6%) |
| Business & Financial | 23 (42.6%) | 31 (57.4%) |
| Computers, Engineering & Science | 47 (45.6%) | 56 (54.4%) |
| Computers & Mathematics | 33 (42.3%) | 45 (57.7%) |
| Architecture & Engineering | 14 (100.0%) | 0 (0.0%) |
| Life, Physical & Social Science | 0 (0.0%) | 11 (100.0%) |
| Community & Social Service | 48 (45.3%) | 58 (54.7%) |
| Education, Arts & Media | 19 (42.2%) | 26 (57.8%) |
| Legal Services & Support | 25 (100.0%) | 0 (0.0%) |
| Education Instruction & Library | 4 (12.5%) | 28 (87.5%) |
| Arts, Media & Entertainment | 0 (0.0%) | 4 (100.0%) |
| Health Diagnosing & Treating | 58 (33.1%) | 117 (66.9%) |
| Health Technologists | 33 (22.8%) | 112 (77.2%) |
| Total (Category) | 238 (41.0%) | 343 (59.0%) |
| Total (Overall) | 608 (51.1%) | 582 (48.9%) |
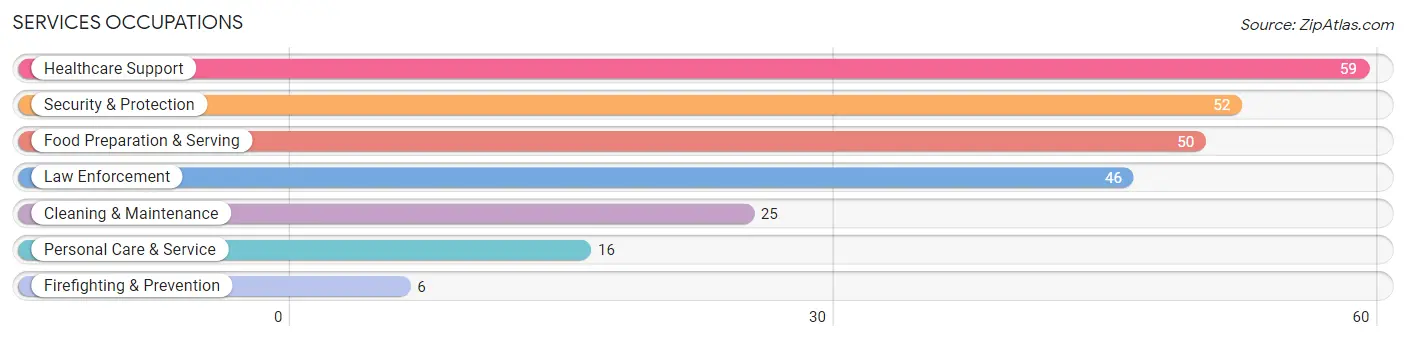
Services Occupations
The most common Services occupations in Riverside borough are Healthcare Support (59 | 5.0%), Security & Protection (52 | 4.4%), Food Preparation & Serving (50 | 4.2%), Law Enforcement (46 | 3.9%), and Cleaning & Maintenance (25 | 2.1%).
Services Occupations by Sex
Within the Services occupations in Riverside borough, the most male-oriented occupations are Firefighting & Prevention (100.0%), Security & Protection (92.3%), and Law Enforcement (91.3%), while the most female-oriented occupations are Personal Care & Service (100.0%), Healthcare Support (83.1%), and Cleaning & Maintenance (80.0%).
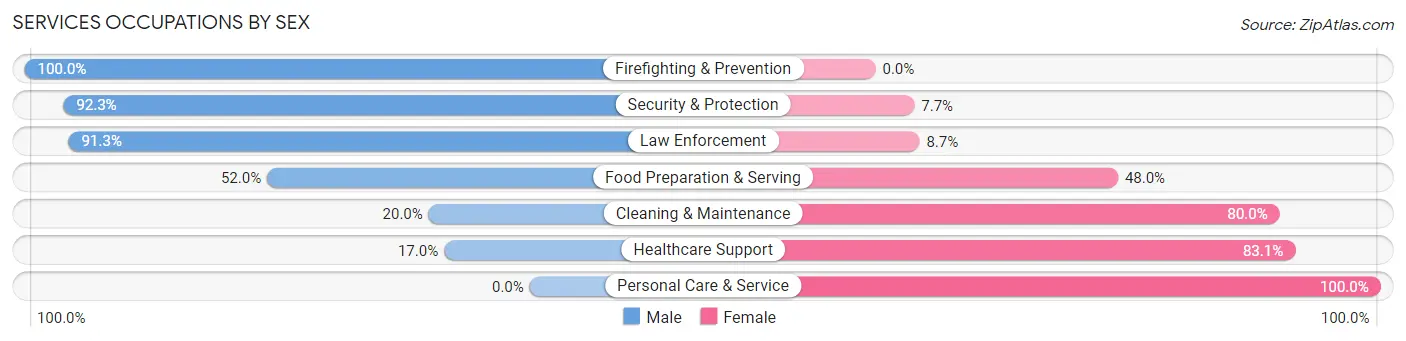
| Occupation | Male | Female |
| Healthcare Support | 10 (17.0%) | 49 (83.1%) |
| Security & Protection | 48 (92.3%) | 4 (7.7%) |
| Firefighting & Prevention | 6 (100.0%) | 0 (0.0%) |
| Law Enforcement | 42 (91.3%) | 4 (8.7%) |
| Food Preparation & Serving | 26 (52.0%) | 24 (48.0%) |
| Cleaning & Maintenance | 5 (20.0%) | 20 (80.0%) |
| Personal Care & Service | 0 (0.0%) | 16 (100.0%) |
| Total (Category) | 89 (44.1%) | 113 (55.9%) |
| Total (Overall) | 608 (51.1%) | 582 (48.9%) |
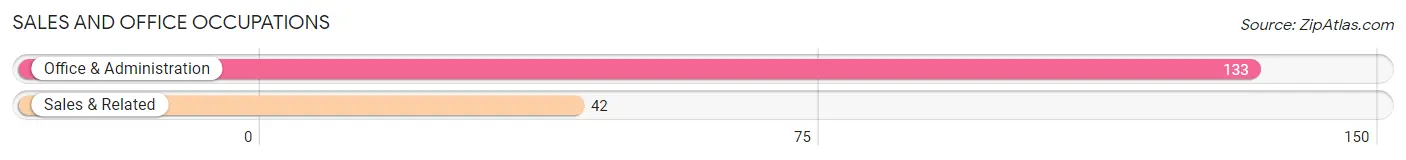
Sales and Office Occupations
The most common Sales and Office occupations in Riverside borough are Office & Administration (133 | 11.2%), and Sales & Related (42 | 3.5%).
Sales and Office Occupations by Sex
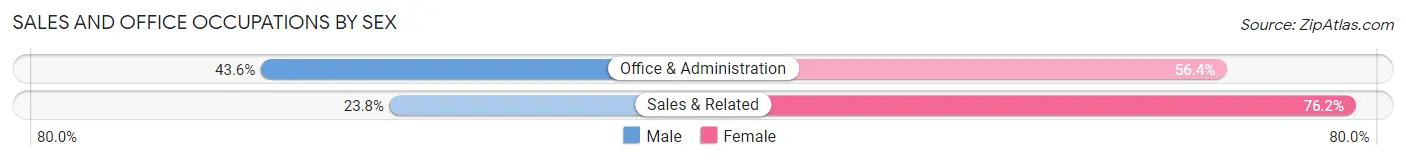
| Occupation | Male | Female |
| Sales & Related | 10 (23.8%) | 32 (76.2%) |
| Office & Administration | 58 (43.6%) | 75 (56.4%) |
| Total (Category) | 68 (38.9%) | 107 (61.1%) |
| Total (Overall) | 608 (51.1%) | 582 (48.9%) |
Natural Resources, Construction and Maintenance Occupations
The most common Natural Resources, Construction and Maintenance occupations in Riverside borough are Installation, Maintenance & Repair (51 | 4.3%), Construction & Extraction (18 | 1.5%), and Farming, Fishing & Forestry (5 | 0.4%).
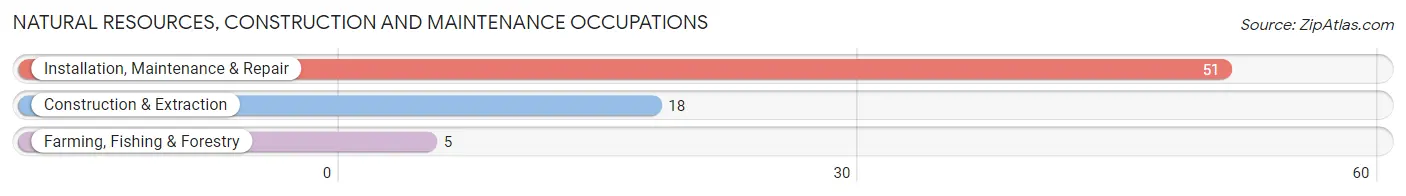
Natural Resources, Construction and Maintenance Occupations by Sex
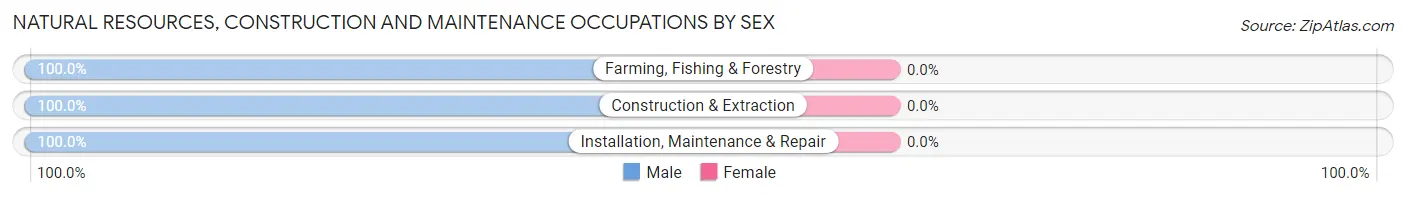
| Occupation | Male | Female |
| Farming, Fishing & Forestry | 5 (100.0%) | 0 (0.0%) |
| Construction & Extraction | 18 (100.0%) | 0 (0.0%) |
| Installation, Maintenance & Repair | 51 (100.0%) | 0 (0.0%) |
| Total (Category) | 74 (100.0%) | 0 (0.0%) |
| Total (Overall) | 608 (51.1%) | 582 (48.9%) |
Production, Transportation and Moving Occupations
The most common Production, Transportation and Moving occupations in Riverside borough are Material Moving (65 | 5.5%), Production (59 | 5.0%), and Transportation (34 | 2.9%).
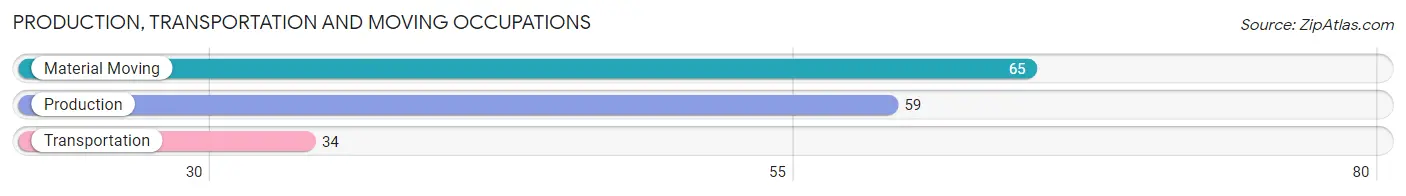
Production, Transportation and Moving Occupations by Sex
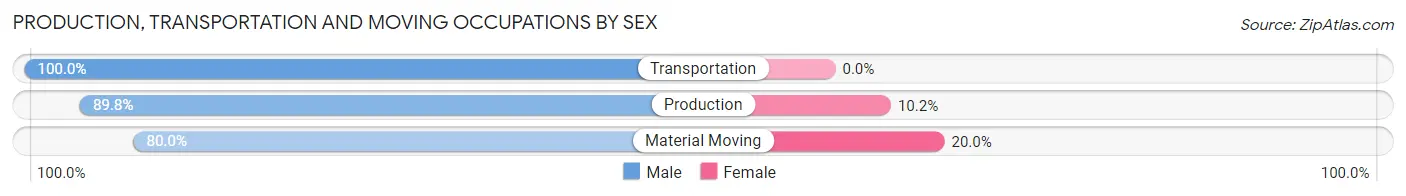
| Occupation | Male | Female |
| Production | 53 (89.8%) | 6 (10.2%) |
| Transportation | 34 (100.0%) | 0 (0.0%) |
| Material Moving | 52 (80.0%) | 13 (20.0%) |
| Total (Category) | 139 (88.0%) | 19 (12.0%) |
| Total (Overall) | 608 (51.1%) | 582 (48.9%) |
Employment Industries by Sex in Riverside borough
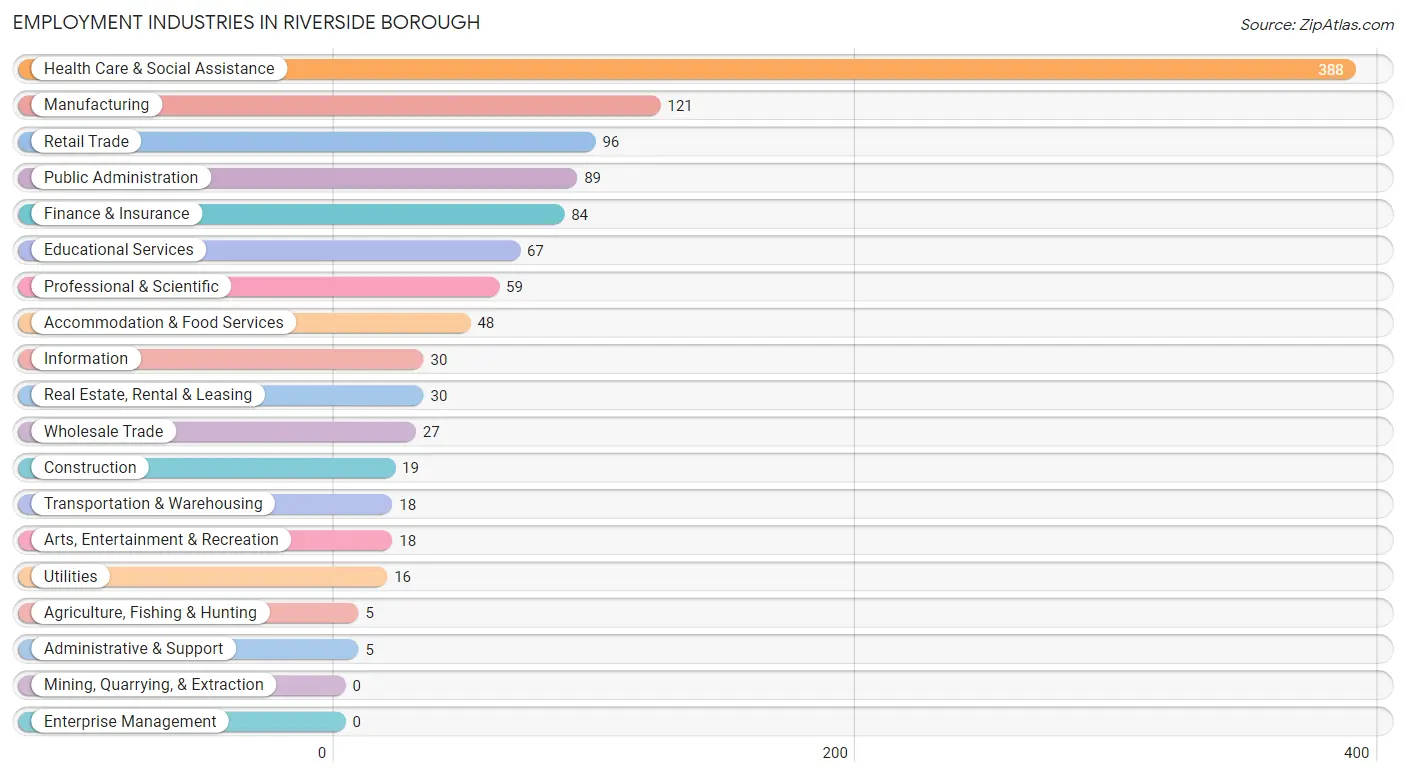
Employment Industries in Riverside borough
The major employment industries in Riverside borough include Health Care & Social Assistance (388 | 32.6%), Manufacturing (121 | 10.2%), Retail Trade (96 | 8.1%), Public Administration (89 | 7.5%), and Finance & Insurance (84 | 7.1%).
Employment Industries by Sex in Riverside borough
The Riverside borough industries that see more men than women are Agriculture, Fishing & Hunting (100.0%), Construction (100.0%), and Utilities (100.0%), whereas the industries that tend to have a higher number of women are Administrative & Support (100.0%), Arts, Entertainment & Recreation (100.0%), and Educational Services (83.6%).
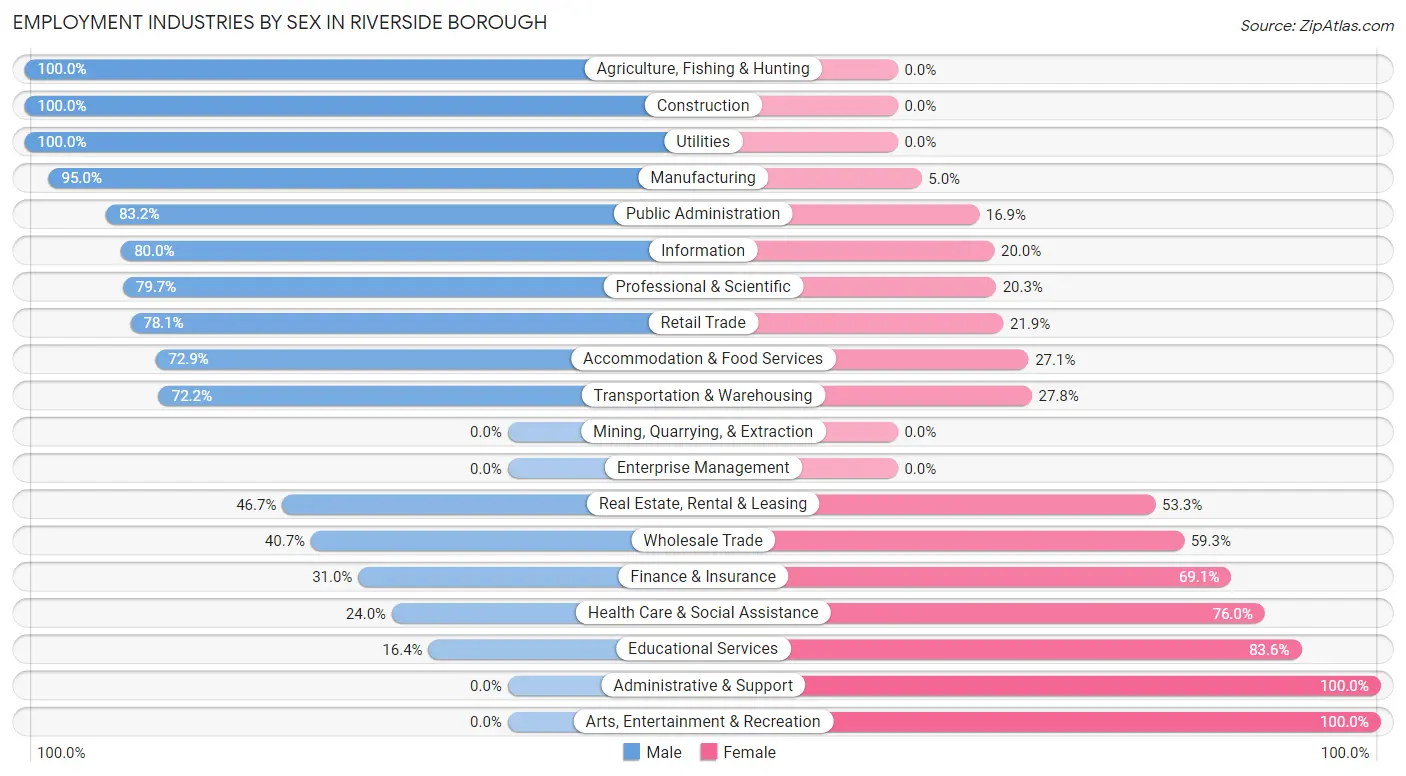
| Industry | Male | Female |
| Agriculture, Fishing & Hunting | 5 (100.0%) | 0 (0.0%) |
| Mining, Quarrying, & Extraction | 0 (0.0%) | 0 (0.0%) |
| Construction | 19 (100.0%) | 0 (0.0%) |
| Manufacturing | 115 (95.0%) | 6 (5.0%) |
| Wholesale Trade | 11 (40.7%) | 16 (59.3%) |
| Retail Trade | 75 (78.1%) | 21 (21.9%) |
| Transportation & Warehousing | 13 (72.2%) | 5 (27.8%) |
| Utilities | 16 (100.0%) | 0 (0.0%) |
| Information | 24 (80.0%) | 6 (20.0%) |
| Finance & Insurance | 26 (30.9%) | 58 (69.1%) |
| Real Estate, Rental & Leasing | 14 (46.7%) | 16 (53.3%) |
| Professional & Scientific | 47 (79.7%) | 12 (20.3%) |
| Enterprise Management | 0 (0.0%) | 0 (0.0%) |
| Administrative & Support | 0 (0.0%) | 5 (100.0%) |
| Educational Services | 11 (16.4%) | 56 (83.6%) |
| Health Care & Social Assistance | 93 (24.0%) | 295 (76.0%) |
| Arts, Entertainment & Recreation | 0 (0.0%) | 18 (100.0%) |
| Accommodation & Food Services | 35 (72.9%) | 13 (27.1%) |
| Public Administration | 74 (83.2%) | 15 (16.9%) |
| Total | 608 (51.1%) | 582 (48.9%) |
Education in Riverside borough
School Enrollment in Riverside borough
The most common levels of schooling among the 494 students in Riverside borough are high school (163 | 33.0%), elementary school (110 | 22.3%), and middle school (82 | 16.6%).
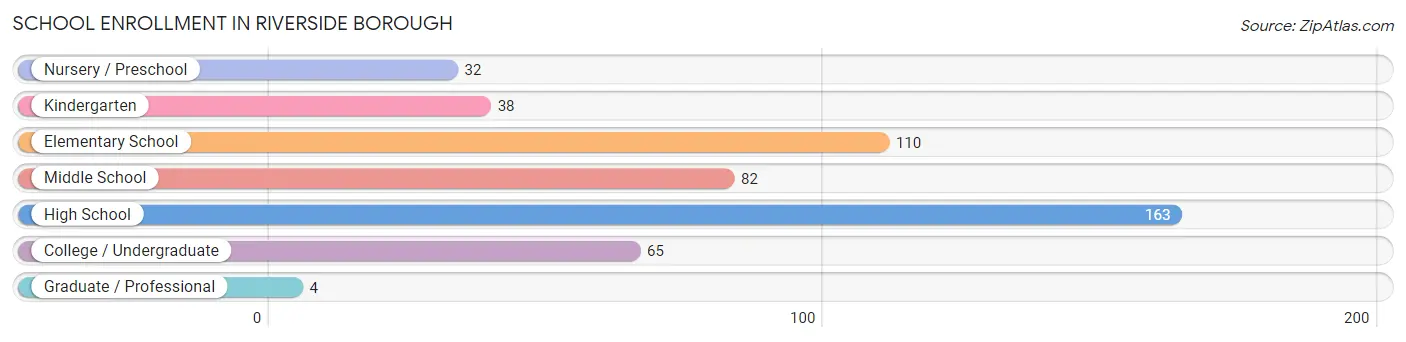
| School Level | # Students | % Students |
| Nursery / Preschool | 32 | 6.5% |
| Kindergarten | 38 | 7.7% |
| Elementary School | 110 | 22.3% |
| Middle School | 82 | 16.6% |
| High School | 163 | 33.0% |
| College / Undergraduate | 65 | 13.2% |
| Graduate / Professional | 4 | 0.8% |
| Total | 494 | 100.0% |
School Enrollment by Age by Funding Source in Riverside borough
Out of a total of 494 students who are enrolled in schools in Riverside borough, 45 (9.1%) attend a private institution, while the remaining 449 (90.9%) are enrolled in public schools. The age group of 3 to 4 year olds has the highest likelihood of being enrolled in private schools, with 8 (50.0% in the age bracket) enrolled. Conversely, the age group of 15 to 17 year olds has the lowest likelihood of being enrolled in a private school, with 123 (100.0% in the age bracket) attending a public institution.
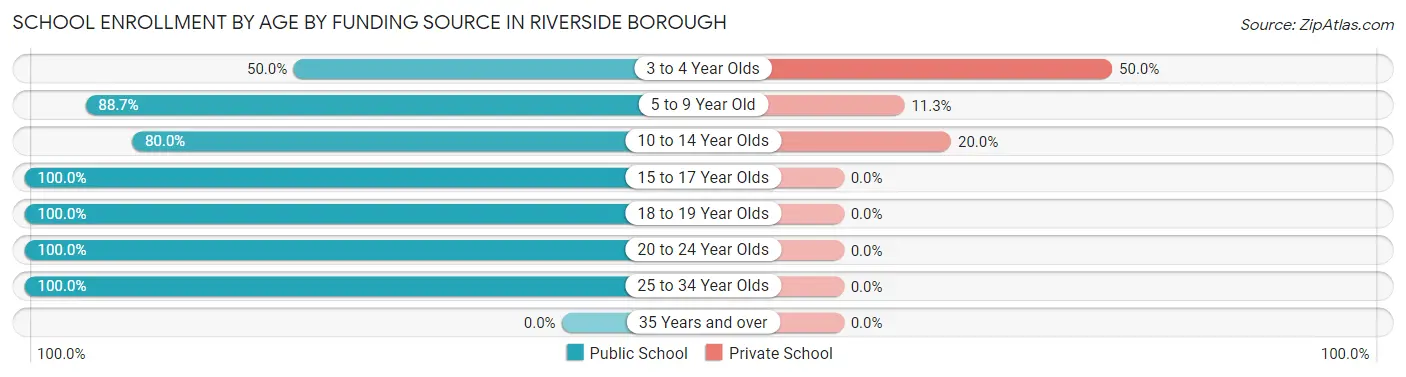
| Age Bracket | Public School | Private School |
| 3 to 4 Year Olds | 8 (50.0%) | 8 (50.0%) |
| 5 to 9 Year Old | 141 (88.7%) | 18 (11.3%) |
| 10 to 14 Year Olds | 76 (80.0%) | 19 (20.0%) |
| 15 to 17 Year Olds | 123 (100.0%) | 0 (0.0%) |
| 18 to 19 Year Olds | 58 (100.0%) | 0 (0.0%) |
| 20 to 24 Year Olds | 31 (100.0%) | 0 (0.0%) |
| 25 to 34 Year Olds | 12 (100.0%) | 0 (0.0%) |
| 35 Years and over | 0 (0.0%) | 0 (0.0%) |
| Total | 449 (90.9%) | 45 (9.1%) |
Educational Attainment by Field of Study in Riverside borough
Science & technology (162 | 22.6%), business (112 | 15.6%), arts & humanities (102 | 14.2%), social sciences (58 | 8.1%), and education (50 | 7.0%) are the most common fields of study among 718 individuals in Riverside borough who have obtained a bachelor's degree or higher.
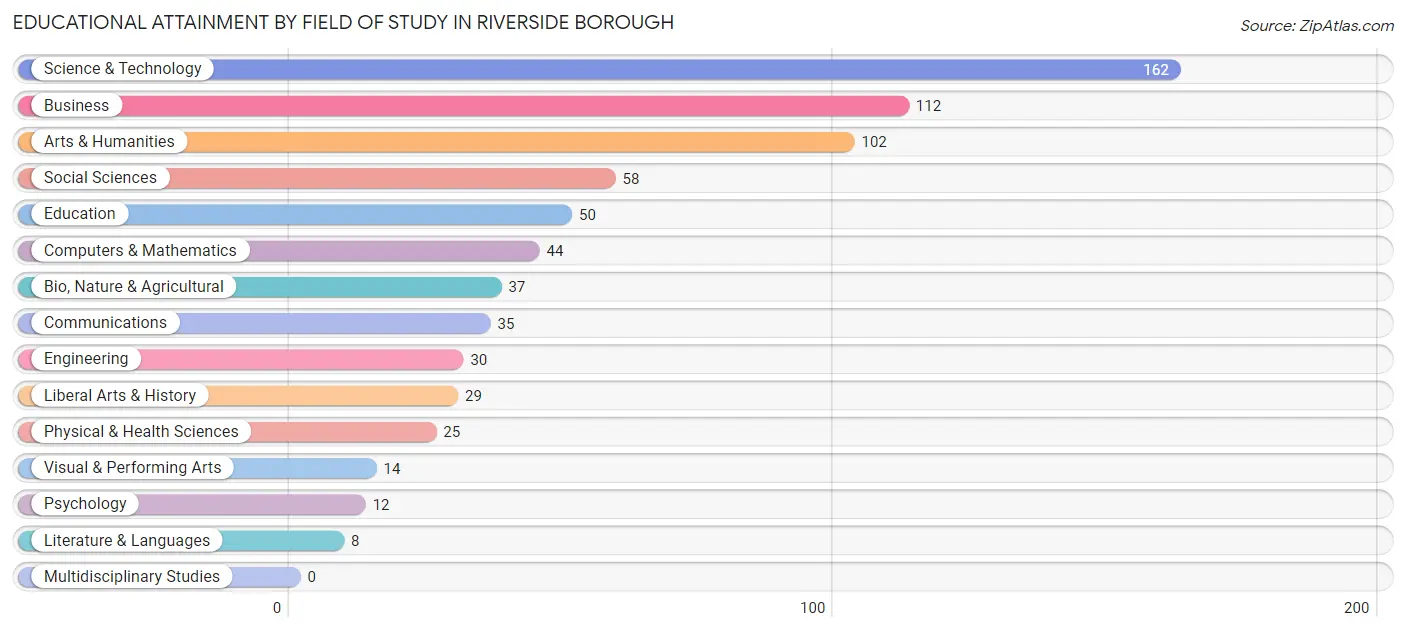
| Field of Study | # Graduates | % Graduates |
| Computers & Mathematics | 44 | 6.1% |
| Bio, Nature & Agricultural | 37 | 5.1% |
| Physical & Health Sciences | 25 | 3.5% |
| Psychology | 12 | 1.7% |
| Social Sciences | 58 | 8.1% |
| Engineering | 30 | 4.2% |
| Multidisciplinary Studies | 0 | 0.0% |
| Science & Technology | 162 | 22.6% |
| Business | 112 | 15.6% |
| Education | 50 | 7.0% |
| Literature & Languages | 8 | 1.1% |
| Liberal Arts & History | 29 | 4.0% |
| Visual & Performing Arts | 14 | 1.9% |
| Communications | 35 | 4.9% |
| Arts & Humanities | 102 | 14.2% |
| Total | 718 | 100.0% |
Transportation & Commute in Riverside borough
Vehicle Availability by Sex in Riverside borough
The most prevalent vehicle ownership categories in Riverside borough are males with 2 vehicles (293, accounting for 48.2%) and females with 2 vehicles (228, making up 50.3%).
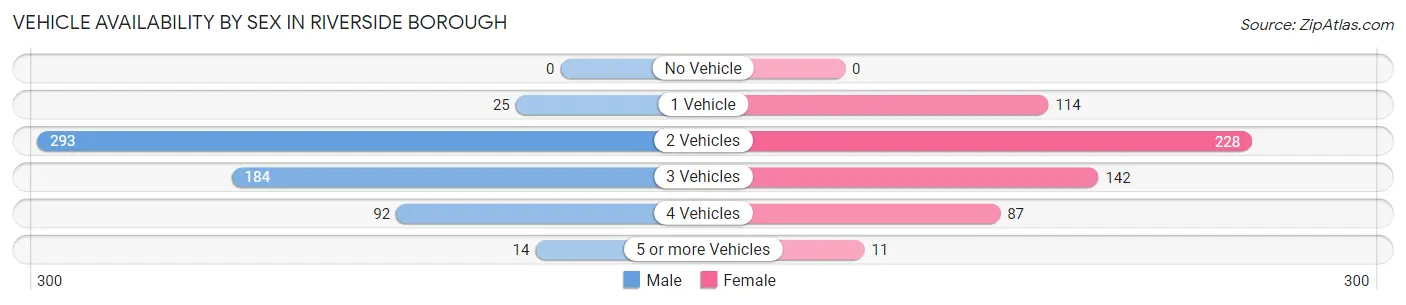
| Vehicles Available | Male | Female |
| No Vehicle | 0 (0.0%) | 0 (0.0%) |
| 1 Vehicle | 25 (4.1%) | 114 (19.6%) |
| 2 Vehicles | 293 (48.2%) | 228 (39.2%) |
| 3 Vehicles | 184 (30.3%) | 142 (24.4%) |
| 4 Vehicles | 92 (15.1%) | 87 (14.9%) |
| 5 or more Vehicles | 14 (2.3%) | 11 (1.9%) |
| Total | 608 (100.0%) | 582 (100.0%) |
Commute Time in Riverside borough
The most frequently occuring commute durations in Riverside borough are 10 to 14 minutes (228 commuters, 22.7%), 15 to 19 minutes (215 commuters, 21.4%), and 5 to 9 minutes (160 commuters, 15.9%).
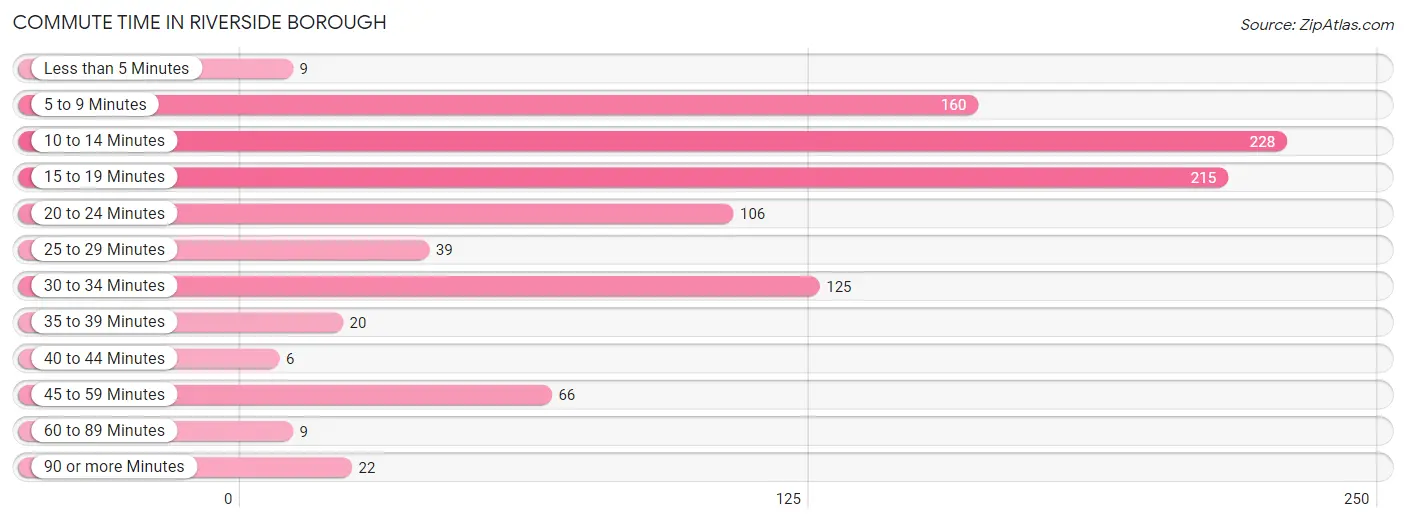
| Commute Time | # Commuters | % Commuters |
| Less than 5 Minutes | 9 | 0.9% |
| 5 to 9 Minutes | 160 | 15.9% |
| 10 to 14 Minutes | 228 | 22.7% |
| 15 to 19 Minutes | 215 | 21.4% |
| 20 to 24 Minutes | 106 | 10.5% |
| 25 to 29 Minutes | 39 | 3.9% |
| 30 to 34 Minutes | 125 | 12.4% |
| 35 to 39 Minutes | 20 | 2.0% |
| 40 to 44 Minutes | 6 | 0.6% |
| 45 to 59 Minutes | 66 | 6.6% |
| 60 to 89 Minutes | 9 | 0.9% |
| 90 or more Minutes | 22 | 2.2% |
Commute Time by Sex in Riverside borough
The most common commute times in Riverside borough are 30 to 34 minutes (101 commuters, 18.5%) for males and 10 to 14 minutes (134 commuters, 29.3%) for females.
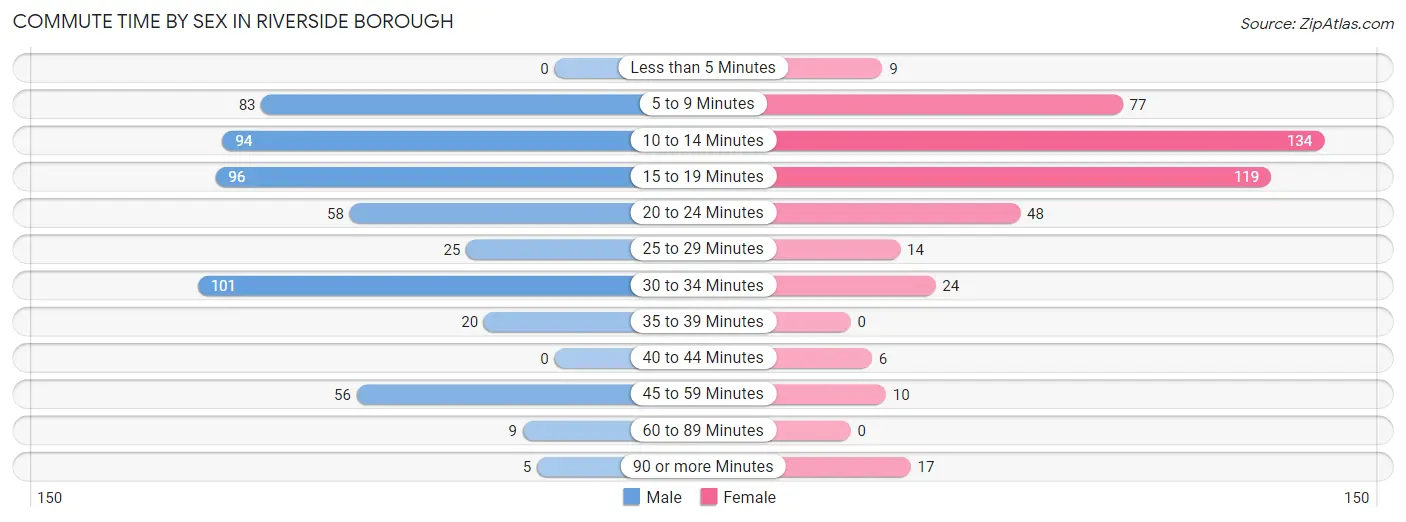
| Commute Time | Male | Female |
| Less than 5 Minutes | 0 (0.0%) | 9 (2.0%) |
| 5 to 9 Minutes | 83 (15.2%) | 77 (16.8%) |
| 10 to 14 Minutes | 94 (17.2%) | 134 (29.3%) |
| 15 to 19 Minutes | 96 (17.5%) | 119 (26.0%) |
| 20 to 24 Minutes | 58 (10.6%) | 48 (10.5%) |
| 25 to 29 Minutes | 25 (4.6%) | 14 (3.1%) |
| 30 to 34 Minutes | 101 (18.5%) | 24 (5.2%) |
| 35 to 39 Minutes | 20 (3.7%) | 0 (0.0%) |
| 40 to 44 Minutes | 0 (0.0%) | 6 (1.3%) |
| 45 to 59 Minutes | 56 (10.2%) | 10 (2.2%) |
| 60 to 89 Minutes | 9 (1.7%) | 0 (0.0%) |
| 90 or more Minutes | 5 (0.9%) | 17 (3.7%) |
Time of Departure to Work by Sex in Riverside borough
The most frequent times of departure to work in Riverside borough are 7:00 AM to 7:29 AM (83, 15.2%) for males and 7:00 AM to 7:29 AM (111, 24.2%) for females.
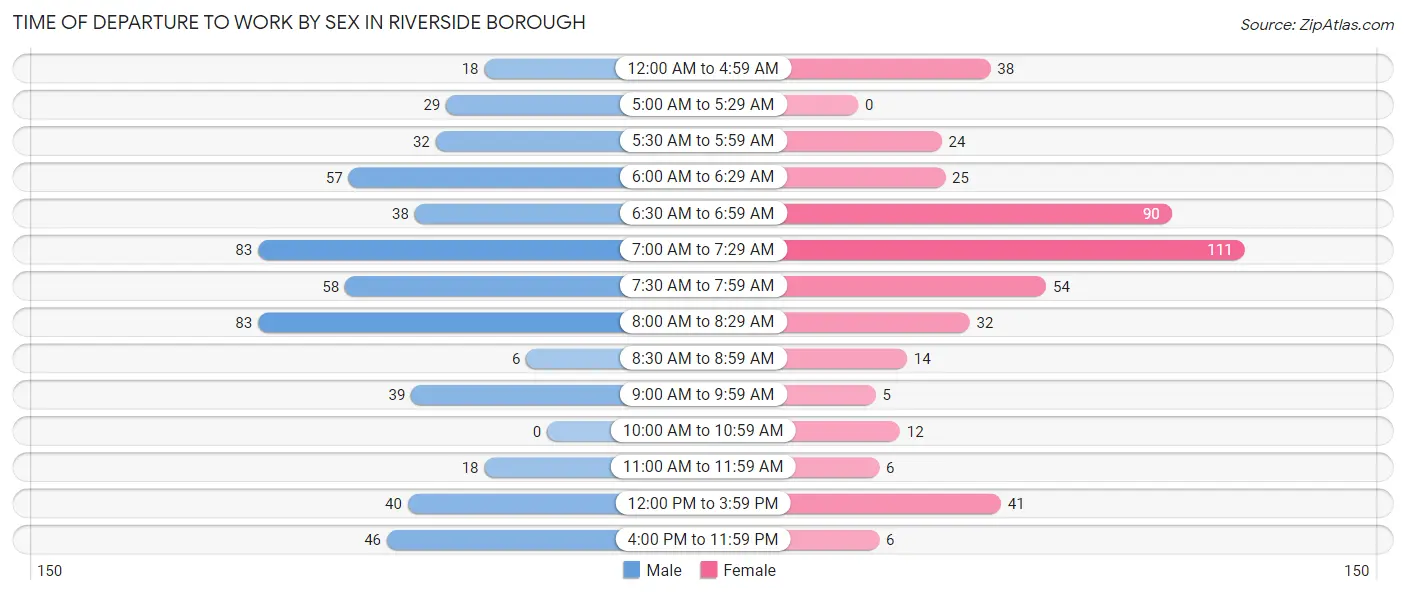
| Time of Departure | Male | Female |
| 12:00 AM to 4:59 AM | 18 (3.3%) | 38 (8.3%) |
| 5:00 AM to 5:29 AM | 29 (5.3%) | 0 (0.0%) |
| 5:30 AM to 5:59 AM | 32 (5.9%) | 24 (5.2%) |
| 6:00 AM to 6:29 AM | 57 (10.4%) | 25 (5.5%) |
| 6:30 AM to 6:59 AM | 38 (7.0%) | 90 (19.7%) |
| 7:00 AM to 7:29 AM | 83 (15.2%) | 111 (24.2%) |
| 7:30 AM to 7:59 AM | 58 (10.6%) | 54 (11.8%) |
| 8:00 AM to 8:29 AM | 83 (15.2%) | 32 (7.0%) |
| 8:30 AM to 8:59 AM | 6 (1.1%) | 14 (3.1%) |
| 9:00 AM to 9:59 AM | 39 (7.1%) | 5 (1.1%) |
| 10:00 AM to 10:59 AM | 0 (0.0%) | 12 (2.6%) |
| 11:00 AM to 11:59 AM | 18 (3.3%) | 6 (1.3%) |
| 12:00 PM to 3:59 PM | 40 (7.3%) | 41 (8.9%) |
| 4:00 PM to 11:59 PM | 46 (8.4%) | 6 (1.3%) |
| Total | 547 (100.0%) | 458 (100.0%) |
Housing Occupancy in Riverside borough
Occupancy by Ownership in Riverside borough
Of the total 911 dwellings in Riverside borough, owner-occupied units account for 818 (89.8%), while renter-occupied units make up 93 (10.2%).
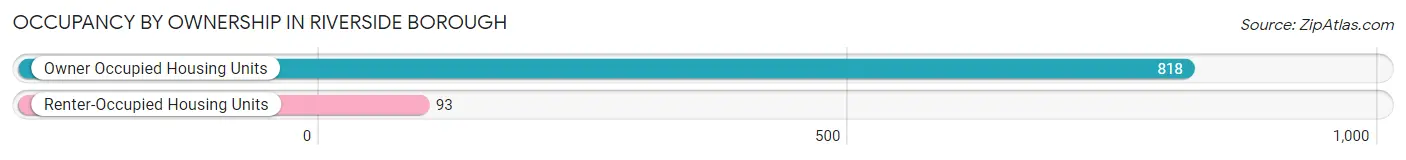
| Occupancy | # Housing Units | % Housing Units |
| Owner Occupied Housing Units | 818 | 89.8% |
| Renter-Occupied Housing Units | 93 | 10.2% |
| Total Occupied Housing Units | 911 | 100.0% |
Occupancy by Household Size in Riverside borough
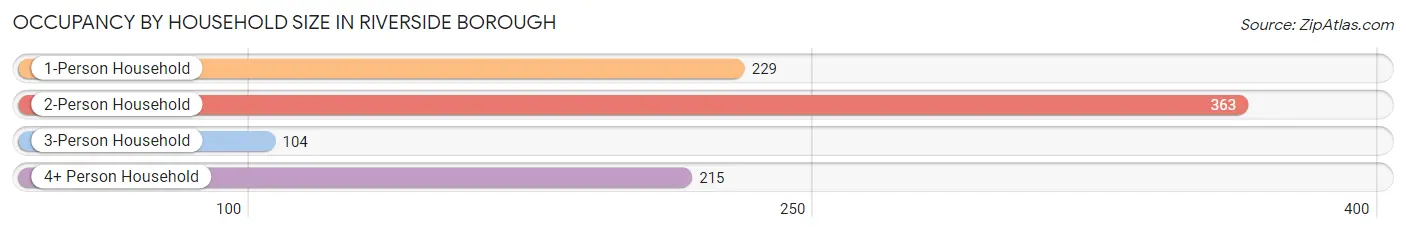
| Household Size | # Housing Units | % Housing Units |
| 1-Person Household | 229 | 25.1% |
| 2-Person Household | 363 | 39.9% |
| 3-Person Household | 104 | 11.4% |
| 4+ Person Household | 215 | 23.6% |
| Total Housing Units | 911 | 100.0% |
Occupancy by Ownership by Household Size in Riverside borough
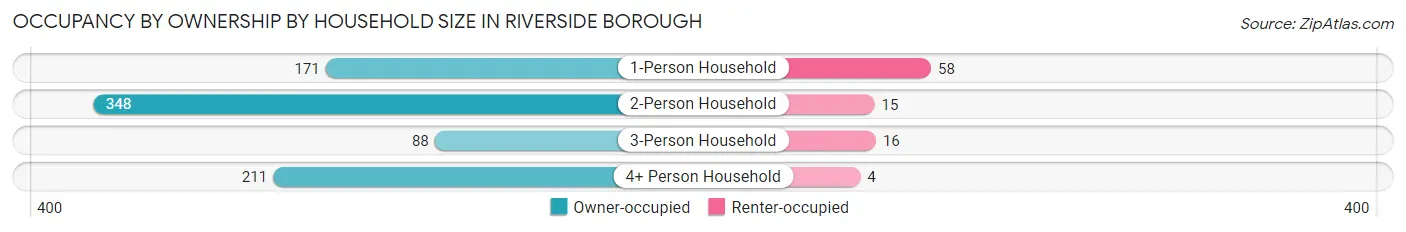
| Household Size | Owner-occupied | Renter-occupied |
| 1-Person Household | 171 (74.7%) | 58 (25.3%) |
| 2-Person Household | 348 (95.9%) | 15 (4.1%) |
| 3-Person Household | 88 (84.6%) | 16 (15.4%) |
| 4+ Person Household | 211 (98.1%) | 4 (1.9%) |
| Total Housing Units | 818 (89.8%) | 93 (10.2%) |
Occupancy by Educational Attainment in Riverside borough
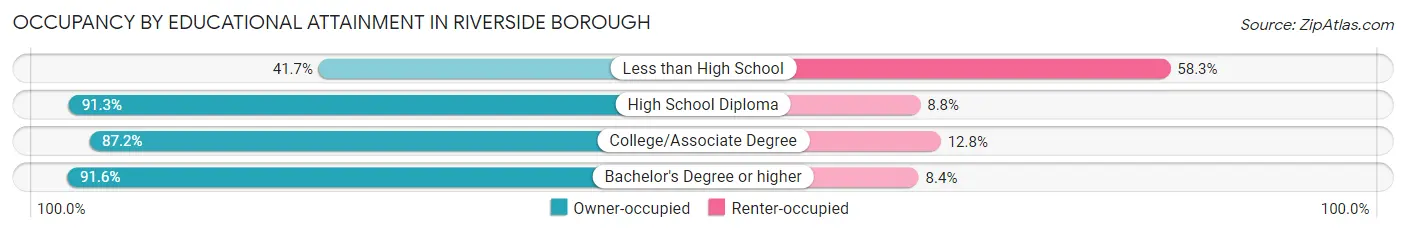
| Household Size | Owner-occupied | Renter-occupied |
| Less than High School | 5 (41.7%) | 7 (58.3%) |
| High School Diploma | 292 (91.2%) | 28 (8.7%) |
| College/Associate Degree | 184 (87.2%) | 27 (12.8%) |
| Bachelor's Degree or higher | 337 (91.6%) | 31 (8.4%) |
Occupancy by Age of Householder in Riverside borough
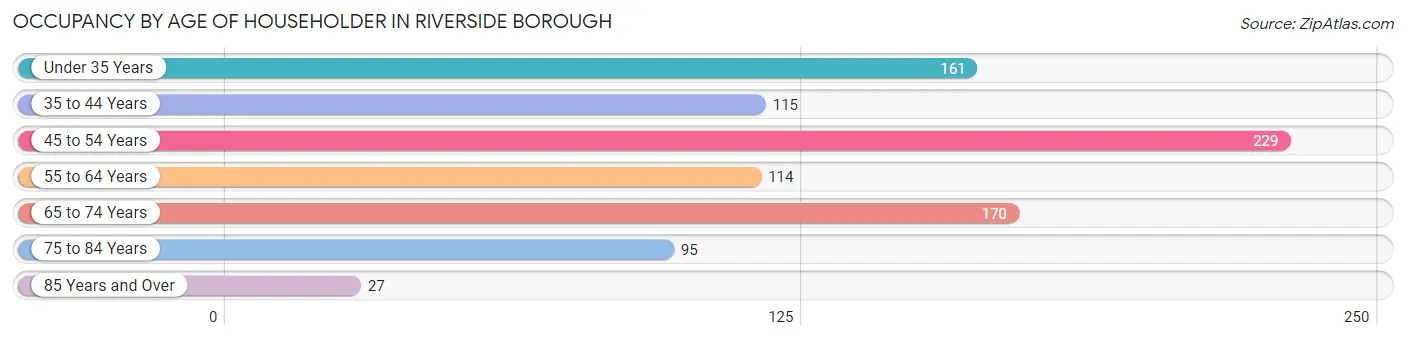
| Age Bracket | # Households | % Households |
| Under 35 Years | 161 | 17.7% |
| 35 to 44 Years | 115 | 12.6% |
| 45 to 54 Years | 229 | 25.1% |
| 55 to 64 Years | 114 | 12.5% |
| 65 to 74 Years | 170 | 18.7% |
| 75 to 84 Years | 95 | 10.4% |
| 85 Years and Over | 27 | 3.0% |
| Total | 911 | 100.0% |
Housing Finances in Riverside borough
Median Income by Occupancy in Riverside borough
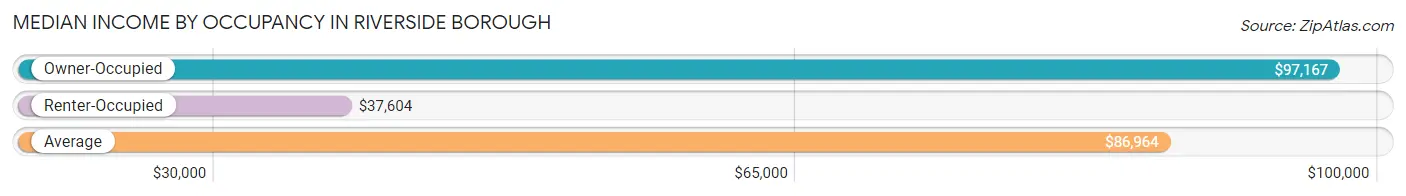
| Occupancy Type | # Households | Median Income |
| Owner-Occupied | 818 (89.8%) | $97,167 |
| Renter-Occupied | 93 (10.2%) | $37,604 |
| Average | 911 (100.0%) | $86,964 |
Occupancy by Householder Income Bracket in Riverside borough
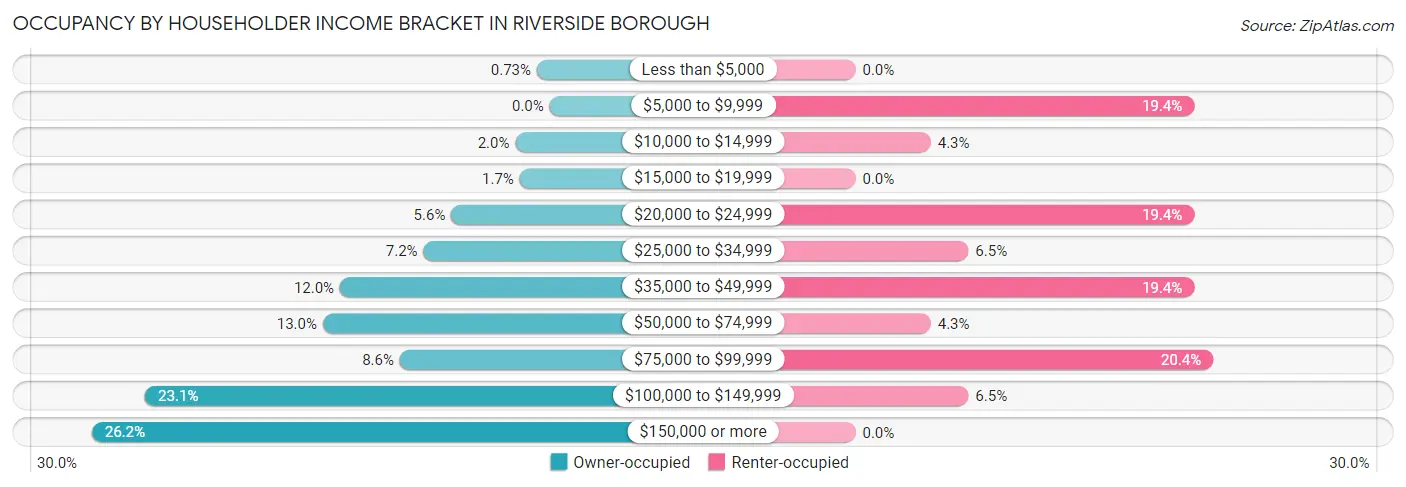
| Income Bracket | Owner-occupied | Renter-occupied |
| Less than $5,000 | 6 (0.7%) | 0 (0.0%) |
| $5,000 to $9,999 | 0 (0.0%) | 18 (19.4%) |
| $10,000 to $14,999 | 16 (2.0%) | 4 (4.3%) |
| $15,000 to $19,999 | 14 (1.7%) | 0 (0.0%) |
| $20,000 to $24,999 | 46 (5.6%) | 18 (19.4%) |
| $25,000 to $34,999 | 59 (7.2%) | 6 (6.5%) |
| $35,000 to $49,999 | 98 (12.0%) | 18 (19.4%) |
| $50,000 to $74,999 | 106 (13.0%) | 4 (4.3%) |
| $75,000 to $99,999 | 70 (8.6%) | 19 (20.4%) |
| $100,000 to $149,999 | 189 (23.1%) | 6 (6.5%) |
| $150,000 or more | 214 (26.2%) | 0 (0.0%) |
| Total | 818 (100.0%) | 93 (100.0%) |
Monthly Housing Cost Tiers in Riverside borough
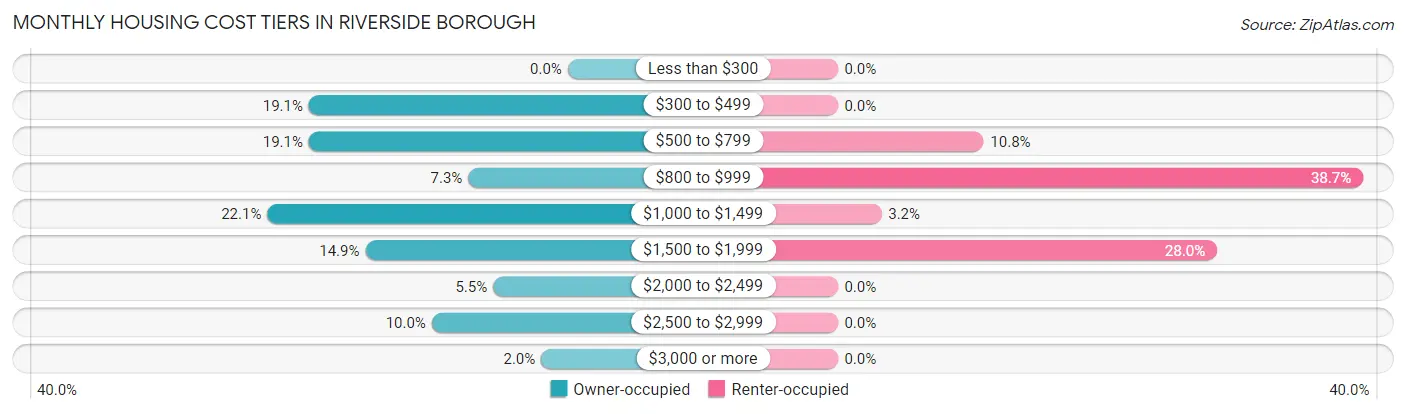
| Monthly Cost | Owner-occupied | Renter-occupied |
| Less than $300 | 0 (0.0%) | 0 (0.0%) |
| $300 to $499 | 156 (19.1%) | 0 (0.0%) |
| $500 to $799 | 156 (19.1%) | 10 (10.7%) |
| $800 to $999 | 60 (7.3%) | 36 (38.7%) |
| $1,000 to $1,499 | 181 (22.1%) | 3 (3.2%) |
| $1,500 to $1,999 | 122 (14.9%) | 26 (28.0%) |
| $2,000 to $2,499 | 45 (5.5%) | 0 (0.0%) |
| $2,500 to $2,999 | 82 (10.0%) | 0 (0.0%) |
| $3,000 or more | 16 (2.0%) | 0 (0.0%) |
| Total | 818 (100.0%) | 93 (100.0%) |
Physical Housing Characteristics in Riverside borough
Housing Structures in Riverside borough
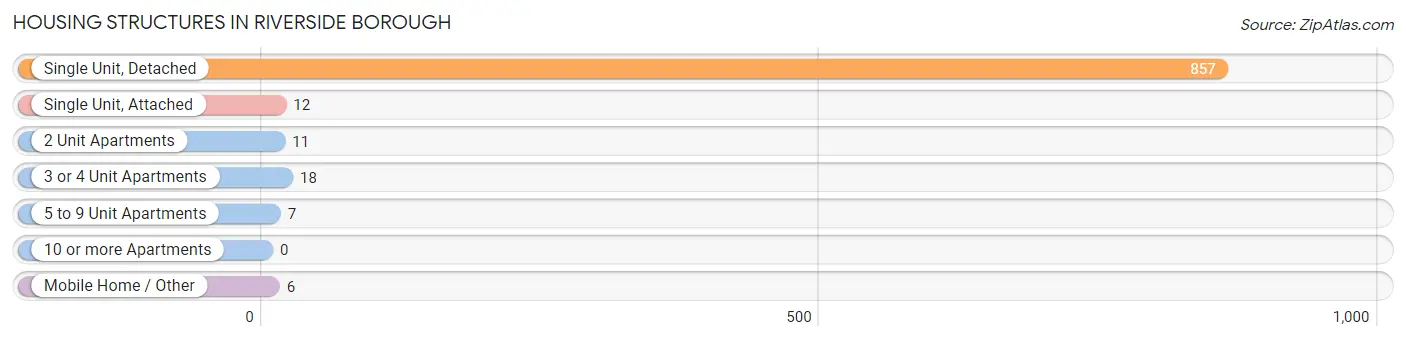
| Structure Type | # Housing Units | % Housing Units |
| Single Unit, Detached | 857 | 94.1% |
| Single Unit, Attached | 12 | 1.3% |
| 2 Unit Apartments | 11 | 1.2% |
| 3 or 4 Unit Apartments | 18 | 2.0% |
| 5 to 9 Unit Apartments | 7 | 0.8% |
| 10 or more Apartments | 0 | 0.0% |
| Mobile Home / Other | 6 | 0.7% |
| Total | 911 | 100.0% |
Housing Structures by Occupancy in Riverside borough
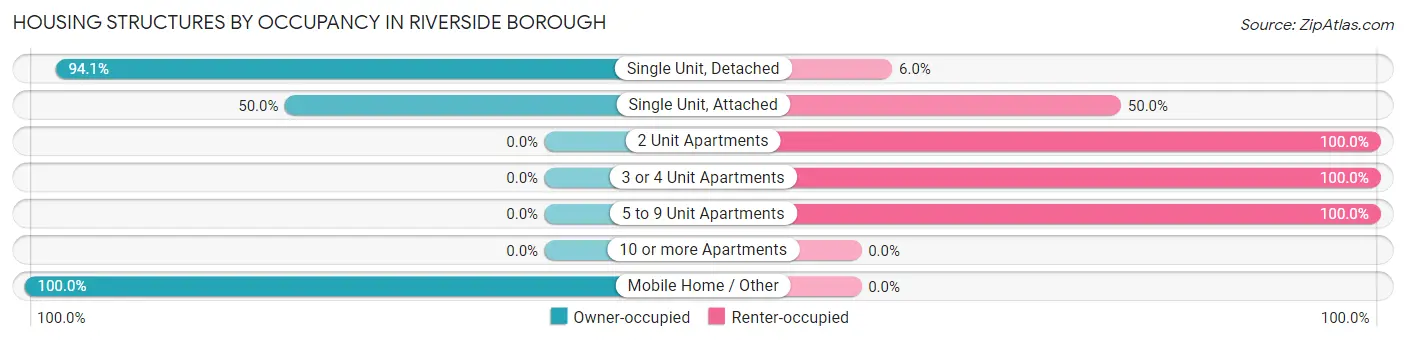
| Structure Type | Owner-occupied | Renter-occupied |
| Single Unit, Detached | 806 (94.1%) | 51 (5.9%) |
| Single Unit, Attached | 6 (50.0%) | 6 (50.0%) |
| 2 Unit Apartments | 0 (0.0%) | 11 (100.0%) |
| 3 or 4 Unit Apartments | 0 (0.0%) | 18 (100.0%) |
| 5 to 9 Unit Apartments | 0 (0.0%) | 7 (100.0%) |
| 10 or more Apartments | 0 (0.0%) | 0 (0.0%) |
| Mobile Home / Other | 6 (100.0%) | 0 (0.0%) |
| Total | 818 (89.8%) | 93 (10.2%) |
Housing Structures by Number of Rooms in Riverside borough
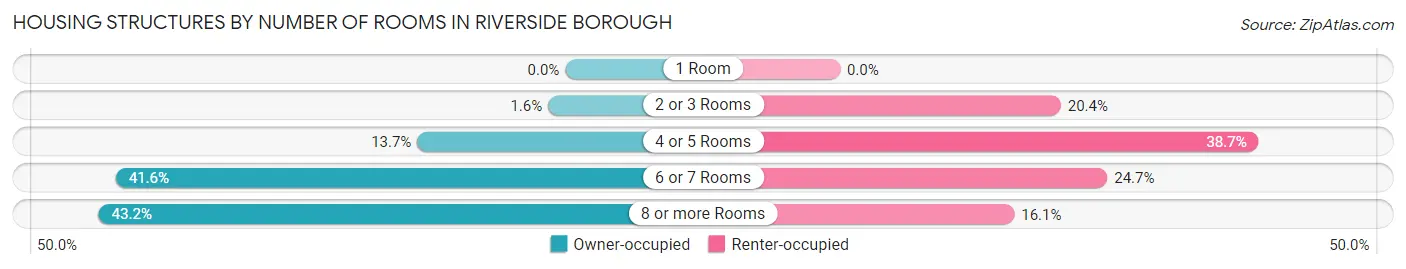
| Number of Rooms | Owner-occupied | Renter-occupied |
| 1 Room | 0 (0.0%) | 0 (0.0%) |
| 2 or 3 Rooms | 13 (1.6%) | 19 (20.4%) |
| 4 or 5 Rooms | 112 (13.7%) | 36 (38.7%) |
| 6 or 7 Rooms | 340 (41.6%) | 23 (24.7%) |
| 8 or more Rooms | 353 (43.1%) | 15 (16.1%) |
| Total | 818 (100.0%) | 93 (100.0%) |
Housing Structure by Heating Type in Riverside borough
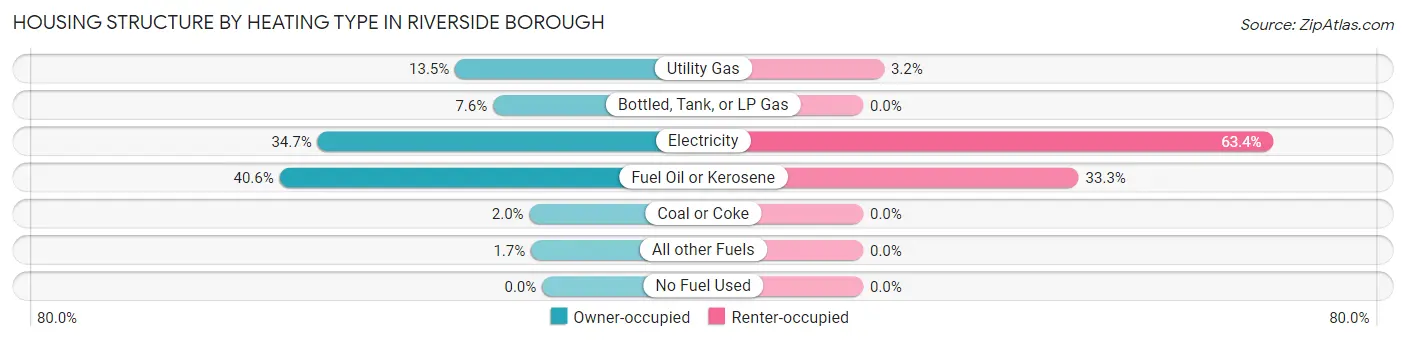
| Heating Type | Owner-occupied | Renter-occupied |
| Utility Gas | 110 (13.5%) | 3 (3.2%) |
| Bottled, Tank, or LP Gas | 62 (7.6%) | 0 (0.0%) |
| Electricity | 284 (34.7%) | 59 (63.4%) |
| Fuel Oil or Kerosene | 332 (40.6%) | 31 (33.3%) |
| Coal or Coke | 16 (2.0%) | 0 (0.0%) |
| All other Fuels | 14 (1.7%) | 0 (0.0%) |
| No Fuel Used | 0 (0.0%) | 0 (0.0%) |
| Total | 818 (100.0%) | 93 (100.0%) |
Household Vehicle Usage in Riverside borough
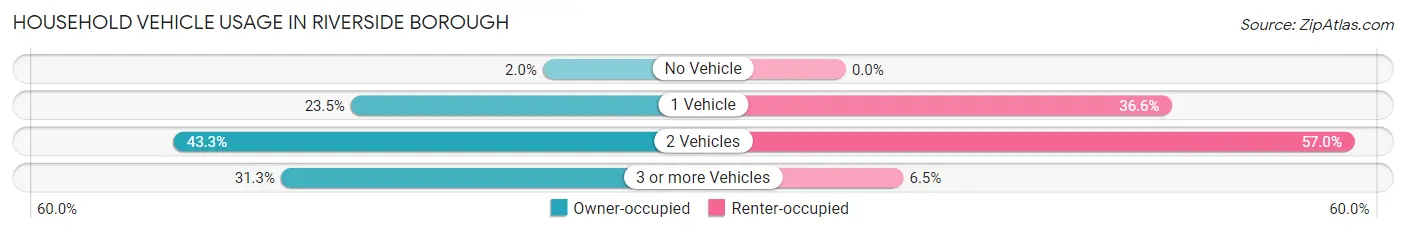
| Vehicles per Household | Owner-occupied | Renter-occupied |
| No Vehicle | 16 (2.0%) | 0 (0.0%) |
| 1 Vehicle | 192 (23.5%) | 34 (36.6%) |
| 2 Vehicles | 354 (43.3%) | 53 (57.0%) |
| 3 or more Vehicles | 256 (31.3%) | 6 (6.5%) |
| Total | 818 (100.0%) | 93 (100.0%) |
Real Estate & Mortgages in Riverside borough
Real Estate and Mortgage Overview in Riverside borough
| Characteristic | Without Mortgage | With Mortgage |
| Housing Units | 310 | 508 |
| Median Property Value | $257,100 | $222,900 |
| Median Household Income | $41,554 | $174 |
| Monthly Housing Costs | $506 | $16 |
| Real Estate Taxes | $2,273 | $2 |
Property Value by Mortgage Status in Riverside borough
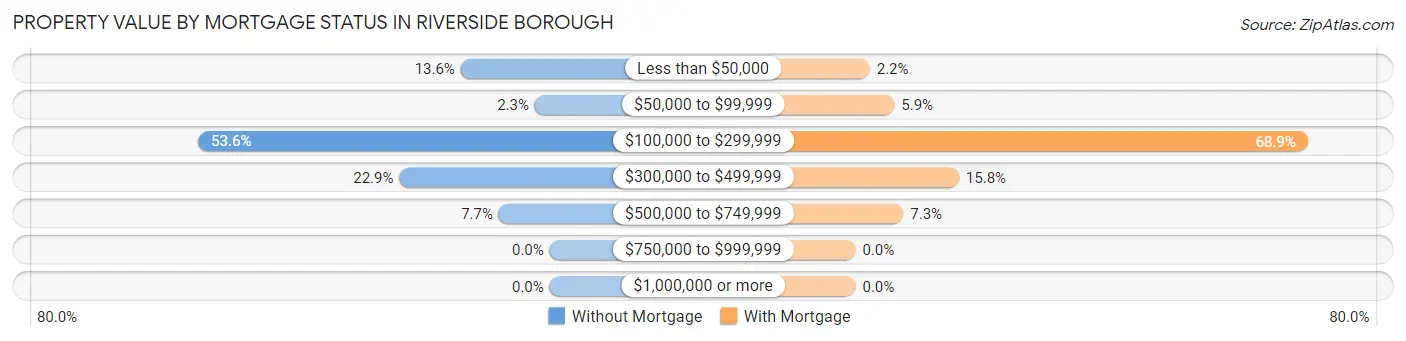
| Property Value | Without Mortgage | With Mortgage |
| Less than $50,000 | 42 (13.6%) | 11 (2.2%) |
| $50,000 to $99,999 | 7 (2.3%) | 30 (5.9%) |
| $100,000 to $299,999 | 166 (53.5%) | 350 (68.9%) |
| $300,000 to $499,999 | 71 (22.9%) | 80 (15.8%) |
| $500,000 to $749,999 | 24 (7.7%) | 37 (7.3%) |
| $750,000 to $999,999 | 0 (0.0%) | 0 (0.0%) |
| $1,000,000 or more | 0 (0.0%) | 0 (0.0%) |
| Total | 310 (100.0%) | 508 (100.0%) |
Household Income by Mortgage Status in Riverside borough
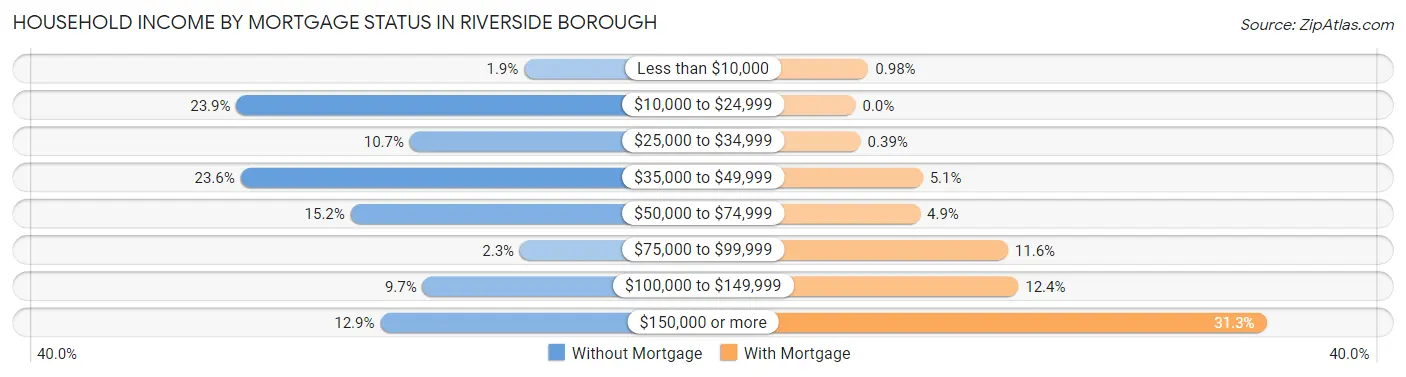
| Household Income | Without Mortgage | With Mortgage |
| Less than $10,000 | 6 (1.9%) | 5 (1.0%) |
| $10,000 to $24,999 | 74 (23.9%) | 0 (0.0%) |
| $25,000 to $34,999 | 33 (10.6%) | 2 (0.4%) |
| $35,000 to $49,999 | 73 (23.5%) | 26 (5.1%) |
| $50,000 to $74,999 | 47 (15.2%) | 25 (4.9%) |
| $75,000 to $99,999 | 7 (2.3%) | 59 (11.6%) |
| $100,000 to $149,999 | 30 (9.7%) | 63 (12.4%) |
| $150,000 or more | 40 (12.9%) | 159 (31.3%) |
| Total | 310 (100.0%) | 508 (100.0%) |
Property Value to Household Income Ratio in Riverside borough
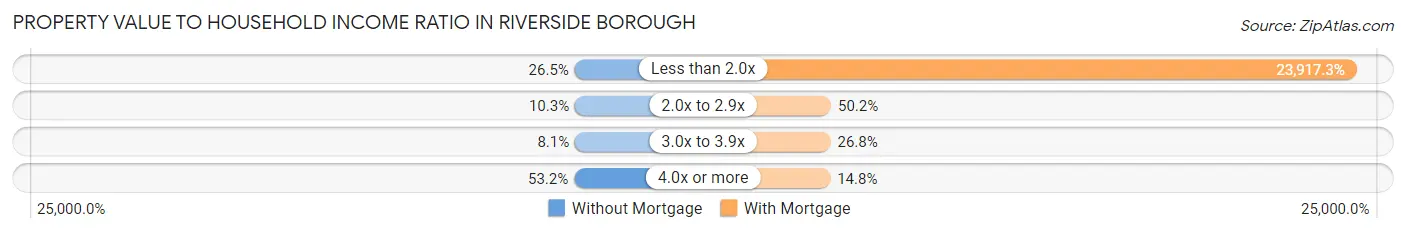
| Value-to-Income Ratio | Without Mortgage | With Mortgage |
| Less than 2.0x | 82 (26.5%) | 121,500 (23,917.3%) |
| 2.0x to 2.9x | 32 (10.3%) | 255 (50.2%) |
| 3.0x to 3.9x | 25 (8.1%) | 136 (26.8%) |
| 4.0x or more | 165 (53.2%) | 75 (14.8%) |
| Total | 310 (100.0%) | 508 (100.0%) |
Real Estate Taxes by Mortgage Status in Riverside borough
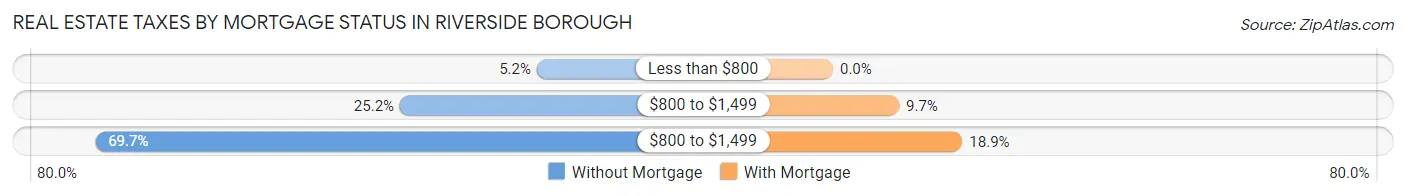
| Property Taxes | Without Mortgage | With Mortgage |
| Less than $800 | 16 (5.2%) | 0 (0.0%) |
| $800 to $1,499 | 78 (25.2%) | 49 (9.7%) |
| $800 to $1,499 | 216 (69.7%) | 96 (18.9%) |
| Total | 310 (100.0%) | 508 (100.0%) |
Health & Disability in Riverside borough
Health Insurance Coverage by Age in Riverside borough
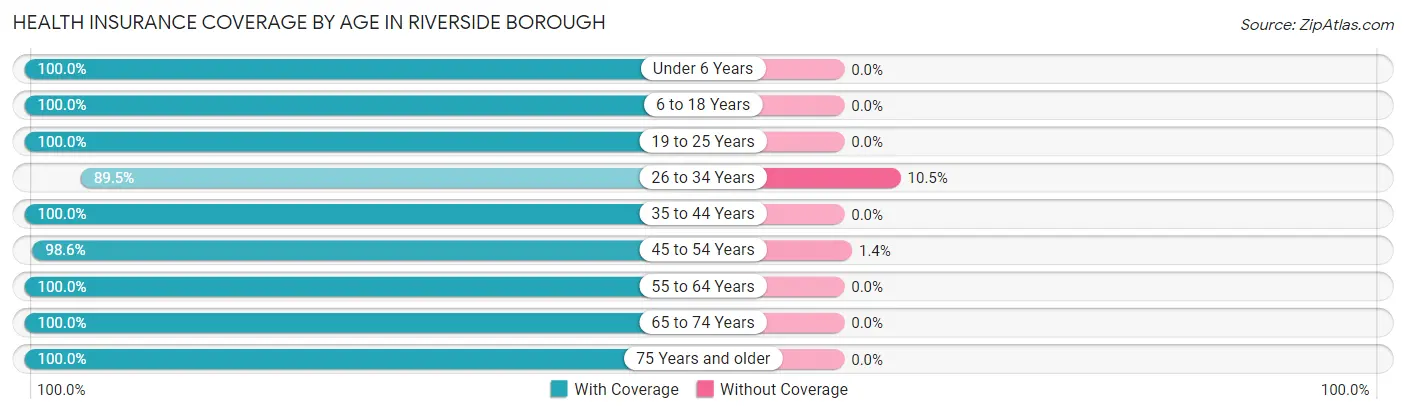
| Age Bracket | With Coverage | Without Coverage |
| Under 6 Years | 160 (100.0%) | 0 (0.0%) |
| 6 to 18 Years | 376 (100.0%) | 0 (0.0%) |
| 19 to 25 Years | 160 (100.0%) | 0 (0.0%) |
| 26 to 34 Years | 196 (89.5%) | 23 (10.5%) |
| 35 to 44 Years | 271 (100.0%) | 0 (0.0%) |
| 45 to 54 Years | 410 (98.6%) | 6 (1.4%) |
| 55 to 64 Years | 240 (100.0%) | 0 (0.0%) |
| 65 to 74 Years | 256 (100.0%) | 0 (0.0%) |
| 75 Years and older | 218 (100.0%) | 0 (0.0%) |
| Total | 2,287 (98.8%) | 29 (1.3%) |
Health Insurance Coverage by Citizenship Status in Riverside borough
| Citizenship Status | With Coverage | Without Coverage |
| Native Born | 160 (100.0%) | 0 (0.0%) |
| Foreign Born, Citizen | 376 (100.0%) | 0 (0.0%) |
| Foreign Born, not a Citizen | 160 (100.0%) | 0 (0.0%) |
Health Insurance Coverage by Household Income in Riverside borough
| Household Income | With Coverage | Without Coverage |
| Under $25,000 | 122 (100.0%) | 0 (0.0%) |
| $25,000 to $49,999 | 301 (98.1%) | 6 (1.9%) |
| $50,000 to $74,999 | 203 (92.3%) | 17 (7.7%) |
| $75,000 to $99,999 | 276 (97.9%) | 6 (2.1%) |
| $100,000 and over | 1,383 (100.0%) | 0 (0.0%) |
Public vs Private Health Insurance Coverage by Age in Riverside borough
| Age Bracket | Public Insurance | Private Insurance |
| Under 6 | 35 (21.9%) | 143 (89.4%) |
| 6 to 18 Years | 55 (14.6%) | 347 (92.3%) |
| 19 to 25 Years | 31 (19.4%) | 135 (84.4%) |
| 25 to 34 Years | 22 (10.1%) | 196 (89.5%) |
| 35 to 44 Years | 6 (2.2%) | 265 (97.8%) |
| 45 to 54 Years | 2 (0.5%) | 408 (98.1%) |
| 55 to 64 Years | 27 (11.3%) | 223 (92.9%) |
| 65 to 74 Years | 252 (98.4%) | 110 (43.0%) |
| 75 Years and over | 204 (93.6%) | 159 (72.9%) |
| Total | 634 (27.4%) | 1,986 (85.8%) |
Disability Status by Sex by Age in Riverside borough
| Age Bracket | Male | Female |
| Under 5 Years | 0 (0.0%) | 0 (0.0%) |
| 5 to 17 Years | 5 (2.5%) | 18 (10.4%) |
| 18 to 34 Years | 6 (3.8%) | 0 (0.0%) |
| 35 to 64 Years | 37 (8.2%) | 17 (3.6%) |
| 65 to 74 Years | 16 (15.4%) | 8 (5.3%) |
| 75 Years and over | 24 (35.8%) | 39 (25.8%) |
Disability Class by Sex by Age in Riverside borough
Disability Class: Hearing Difficulty
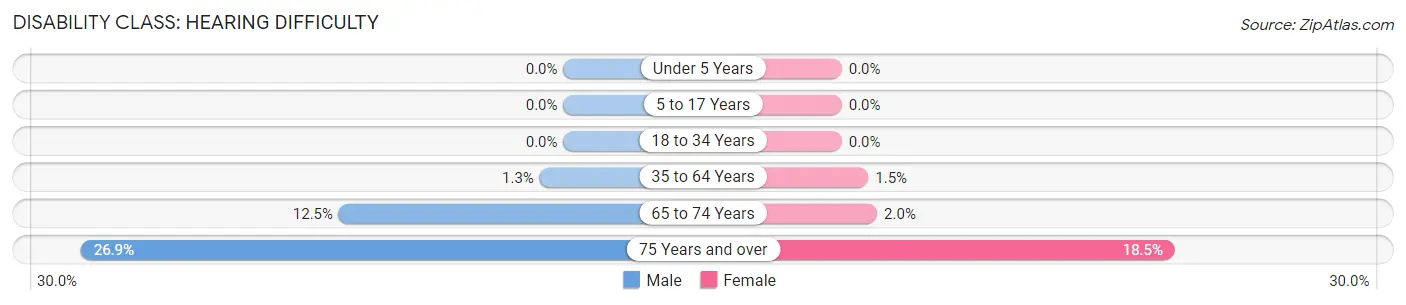
| Age Bracket | Male | Female |
| Under 5 Years | 0 (0.0%) | 0 (0.0%) |
| 5 to 17 Years | 0 (0.0%) | 0 (0.0%) |
| 18 to 34 Years | 0 (0.0%) | 0 (0.0%) |
| 35 to 64 Years | 6 (1.3%) | 7 (1.5%) |
| 65 to 74 Years | 13 (12.5%) | 3 (2.0%) |
| 75 Years and over | 18 (26.9%) | 28 (18.5%) |
Disability Class: Vision Difficulty
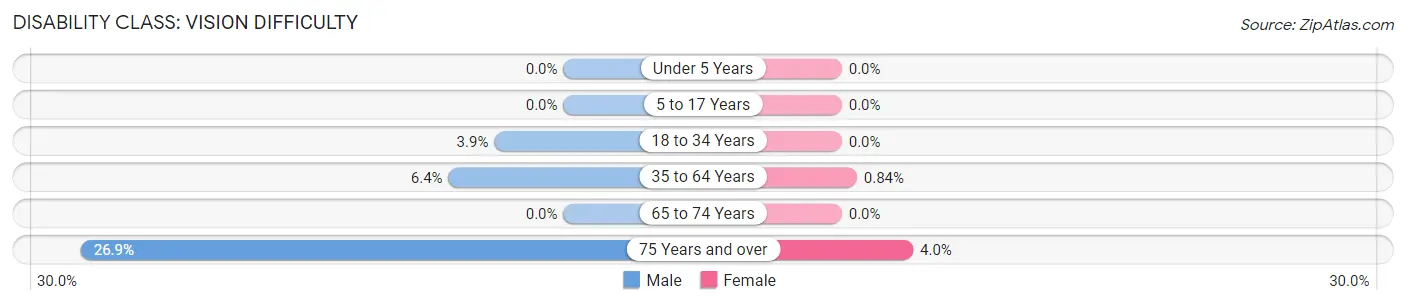
| Age Bracket | Male | Female |
| Under 5 Years | 0 (0.0%) | 0 (0.0%) |
| 5 to 17 Years | 0 (0.0%) | 0 (0.0%) |
| 18 to 34 Years | 6 (3.8%) | 0 (0.0%) |
| 35 to 64 Years | 29 (6.4%) | 4 (0.8%) |
| 65 to 74 Years | 0 (0.0%) | 0 (0.0%) |
| 75 Years and over | 18 (26.9%) | 6 (4.0%) |
Disability Class: Cognitive Difficulty
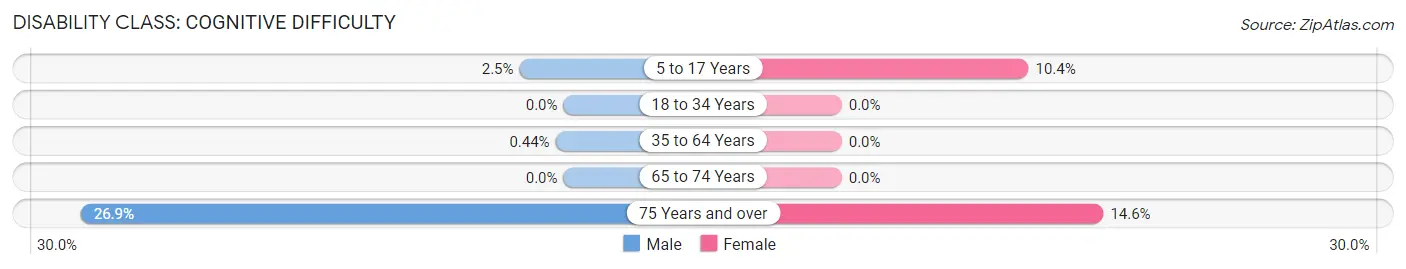
| Age Bracket | Male | Female |
| 5 to 17 Years | 5 (2.5%) | 18 (10.4%) |
| 18 to 34 Years | 0 (0.0%) | 0 (0.0%) |
| 35 to 64 Years | 2 (0.4%) | 0 (0.0%) |
| 65 to 74 Years | 0 (0.0%) | 0 (0.0%) |
| 75 Years and over | 18 (26.9%) | 22 (14.6%) |
Disability Class: Ambulatory Difficulty
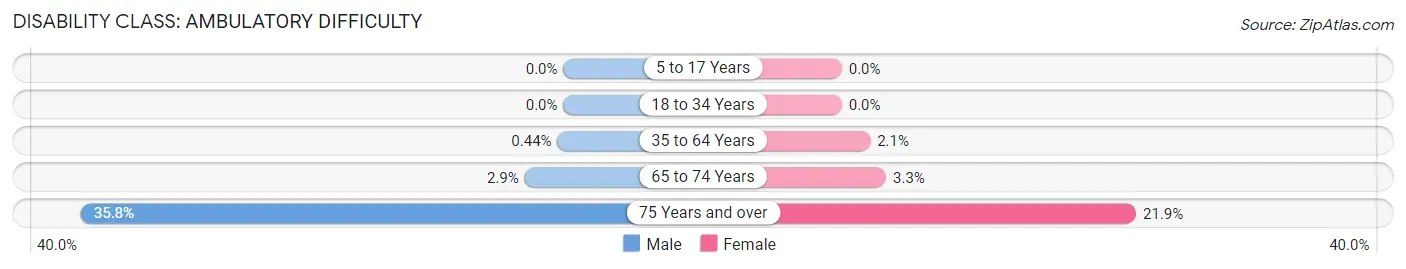
| Age Bracket | Male | Female |
| 5 to 17 Years | 0 (0.0%) | 0 (0.0%) |
| 18 to 34 Years | 0 (0.0%) | 0 (0.0%) |
| 35 to 64 Years | 2 (0.4%) | 10 (2.1%) |
| 65 to 74 Years | 3 (2.9%) | 5 (3.3%) |
| 75 Years and over | 24 (35.8%) | 33 (21.8%) |
Disability Class: Self-Care Difficulty
| Age Bracket | Male | Female |
| 5 to 17 Years | 0 (0.0%) | 0 (0.0%) |
| 18 to 34 Years | 0 (0.0%) | 0 (0.0%) |
| 35 to 64 Years | 2 (0.4%) | 4 (0.8%) |
| 65 to 74 Years | 3 (2.9%) | 0 (0.0%) |
| 75 Years and over | 24 (35.8%) | 12 (8.0%) |
Technology Access in Riverside borough
Computing Device Access in Riverside borough
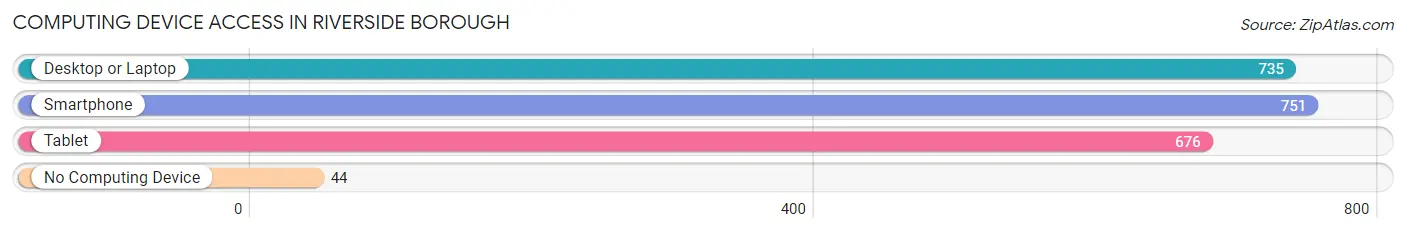
| Device Type | # Households | % Households |
| Desktop or Laptop | 735 | 80.7% |
| Smartphone | 751 | 82.4% |
| Tablet | 676 | 74.2% |
| No Computing Device | 44 | 4.8% |
| Total | 911 | 100.0% |
Internet Access in Riverside borough
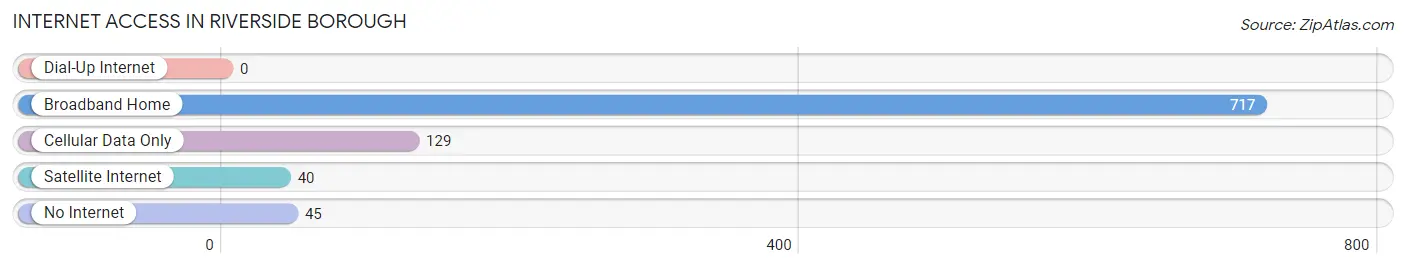
| Internet Type | # Households | % Households |
| Dial-Up Internet | 0 | 0.0% |
| Broadband Home | 717 | 78.7% |
| Cellular Data Only | 129 | 14.2% |
| Satellite Internet | 40 | 4.4% |
| No Internet | 45 | 4.9% |
| Total | 911 | 100.0% |
Riverside borough Summary
Riverside Borough is a small borough located in Beaver County, Pennsylvania. It is situated along the Ohio River, approximately 25 miles northwest of Pittsburgh. The borough has a population of 1,845 as of the 2010 census, and is part of the Pittsburgh metropolitan area.
History
Riverside Borough was founded in 1876, when the area was still part of Allegheny County. The borough was named for its location along the Ohio River. The first settlers in the area were of German and Irish descent, and the borough was originally a farming community. In the late 19th century, the borough began to develop into a small industrial center, with several factories and mills being built along the river.
In the early 20th century, Riverside Borough experienced a period of growth and development. The borough was incorporated in 1906, and the population grew to over 2,000 by the 1920s. During this time, the borough was home to several factories, including a steel mill, a glass factory, and a paper mill.
Geography
Riverside Borough is located in Beaver County, Pennsylvania, along the Ohio River. The borough is situated approximately 25 miles northwest of Pittsburgh. The borough has a total area of 1.2 square miles, all of which is land.
The borough is bordered by the Ohio River to the north, and by the boroughs of Monaca and Center Township to the east and south, respectively. The borough is also bordered by the townships of Brighton and Potter to the west.
Economy
Riverside Borough has a diverse economy, with a mix of manufacturing, retail, and service industries. The borough is home to several factories and mills, including a steel mill, a glass factory, and a paper mill. The borough also has several retail stores, restaurants, and other businesses.
The borough is also home to several educational institutions, including the Riverside School District, which serves the borough and surrounding areas. The district includes two elementary schools, one middle school, and one high school.
Demographics
As of the 2010 census, Riverside Borough had a population of 1,845. The racial makeup of the borough was 97.3% White, 0.9% African American, 0.2% Native American, 0.3% Asian, 0.2% from other races, and 0.9% from two or more races. Hispanic or Latino of any race were 0.7% of the population.
The median household income in Riverside Borough was $41,944, and the median family income was $50,000. The per capita income for the borough was $20,845. About 8.3% of families and 10.2% of the population were below the poverty line, including 14.2% of those under age 18 and 6.2% of those age 65 or over.
Common Questions
What is Per Capita Income in Riverside borough?
Per Capita income in Riverside borough is $39,961.
What is the Median Family Income in Riverside borough?
Median Family Income in Riverside borough is $111,701.
What is the Median Household income in Riverside borough?
Median Household Income in Riverside borough is $86,964.
What is Income or Wage Gap in Riverside borough?
Income or Wage Gap in Riverside borough is 21.8%.
Women in Riverside borough earn 78.2 cents for every dollar earned by a man.
What is Inequality or Gini Index in Riverside borough?
Inequality or Gini Index in Riverside borough is 0.40.
What is the Total Population of Riverside borough?
Total Population of Riverside borough is 2,316.
What is the Total Male Population of Riverside borough?
Total Male Population of Riverside borough is 1,040.
What is the Total Female Population of Riverside borough?
Total Female Population of Riverside borough is 1,276.
What is the Ratio of Males per 100 Females in Riverside borough?
There are 81.50 Males per 100 Females in Riverside borough.
What is the Ratio of Females per 100 Males in Riverside borough?
There are 122.69 Females per 100 Males in Riverside borough.
What is the Median Population Age in Riverside borough?
Median Population Age in Riverside borough is 43.3 Years.
What is the Average Family Size in Riverside borough
Average Family Size in Riverside borough is 3.1 People.
What is the Average Household Size in Riverside borough
Average Household Size in Riverside borough is 2.5 People.
How Large is the Labor Force in Riverside borough?
There are 1,225 People in the Labor Forcein in Riverside borough.
What is the Percentage of People in the Labor Force in Riverside borough?
64.6% of People are in the Labor Force in Riverside borough.
What is the Unemployment Rate in Riverside borough?
Unemployment Rate in Riverside borough is 2.8%.