Richfield, PA Map & Demographics
Richfield Map
Richfield Overview
$40,723
PER CAPITA INCOME
$84,722
AVG FAMILY INCOME
$68,214
AVG HOUSEHOLD INCOME
68.1%
WAGE / INCOME GAP [ % ]
31.9¢/ $1
WAGE / INCOME GAP [ $ ]
0.51
INEQUALITY / GINI INDEX
377
TOTAL POPULATION
176
MALE POPULATION
201
FEMALE POPULATION
87.56
MALES / 100 FEMALES
114.20
FEMALES / 100 MALES
59.3
MEDIAN AGE
2.8
AVG FAMILY SIZE
1.8
AVG HOUSEHOLD SIZE
180
LABOR FORCE [ PEOPLE ]
52.5%
PERCENT IN LABOR FORCE
Richfield Zip Codes
Richfield Area Codes
Income in Richfield
Income Overview in Richfield
Per Capita Income in Richfield is $40,723, while median incomes of families and households are $84,722 and $68,214 respectively.
| Characteristic | Number | Measure |
| Per Capita Income | 377 | $40,723 |
| Median Family Income | 76 | $84,722 |
| Mean Family Income | 76 | $123,797 |
| Median Household Income | 194 | $68,214 |
| Mean Household Income | 194 | $75,001 |
| Income Deficit | 76 | $0 |
| Wage / Income Gap (%) | 377 | 68.10% |
| Wage / Income Gap ($) | 377 | 31.90¢ per $1 |
| Gini / Inequality Index | 377 | 0.51 |
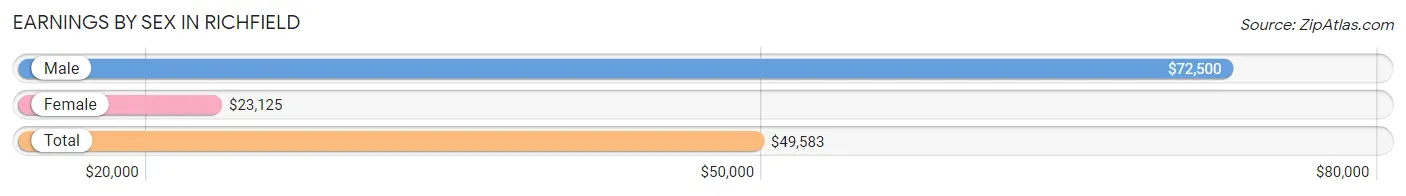
Earnings by Sex in Richfield
Average Earnings in Richfield are $49,583, $72,500 for men and $23,125 for women, a difference of 68.1%.
| Sex | Number | Average Earnings |
| Male | 122 (64.5%) | $72,500 |
| Female | 67 (35.4%) | $23,125 |
| Total | 189 (100.0%) | $49,583 |
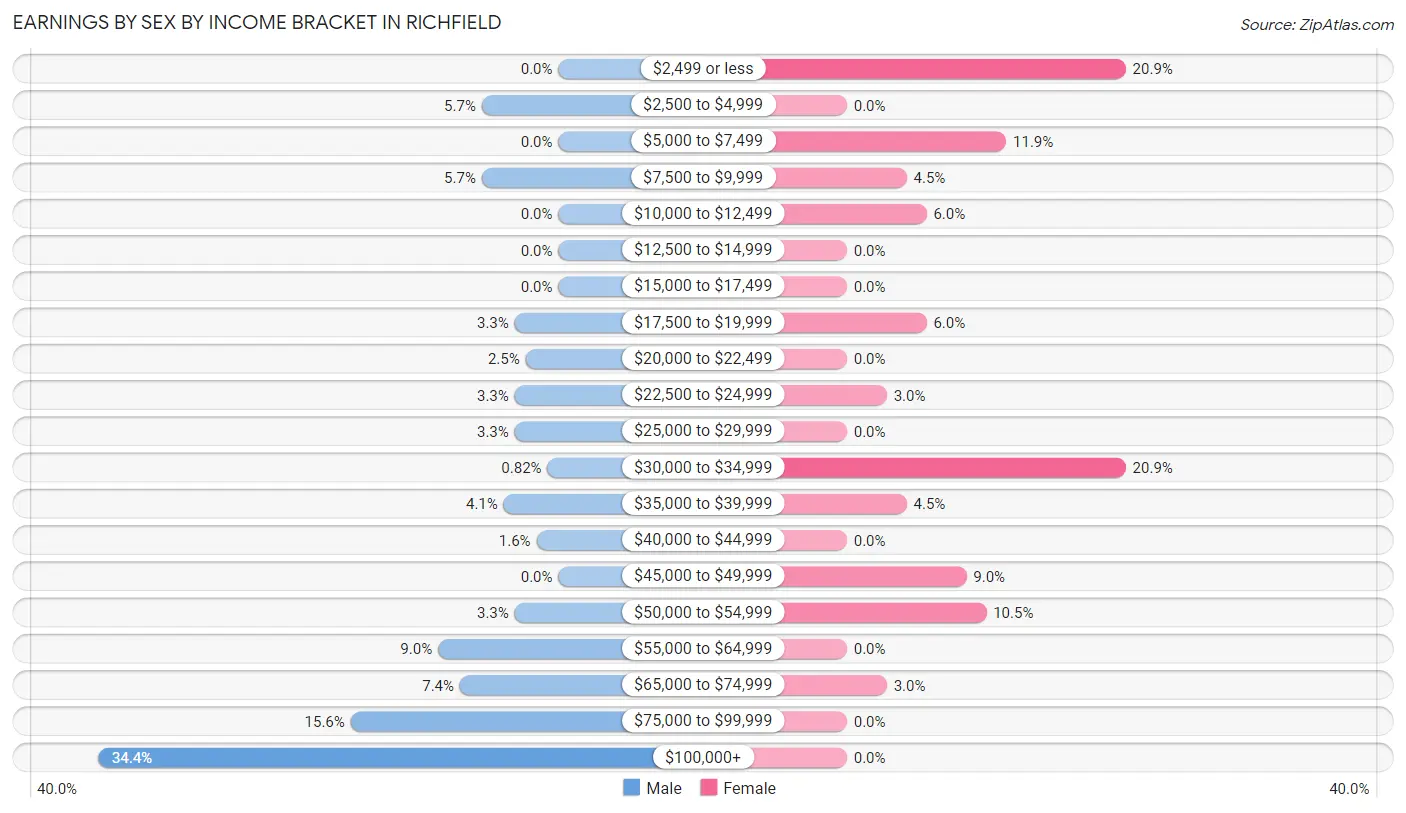
Earnings by Sex by Income Bracket in Richfield
The most common earnings brackets in Richfield are $100,000+ for men (42 | 34.4%) and $2,499 or less for women (14 | 20.9%).
| Income | Male | Female |
| $2,499 or less | 0 (0.0%) | 14 (20.9%) |
| $2,500 to $4,999 | 7 (5.7%) | 0 (0.0%) |
| $5,000 to $7,499 | 0 (0.0%) | 8 (11.9%) |
| $7,500 to $9,999 | 7 (5.7%) | 3 (4.5%) |
| $10,000 to $12,499 | 0 (0.0%) | 4 (6.0%) |
| $12,500 to $14,999 | 0 (0.0%) | 0 (0.0%) |
| $15,000 to $17,499 | 0 (0.0%) | 0 (0.0%) |
| $17,500 to $19,999 | 4 (3.3%) | 4 (6.0%) |
| $20,000 to $22,499 | 3 (2.5%) | 0 (0.0%) |
| $22,500 to $24,999 | 4 (3.3%) | 2 (3.0%) |
| $25,000 to $29,999 | 4 (3.3%) | 0 (0.0%) |
| $30,000 to $34,999 | 1 (0.8%) | 14 (20.9%) |
| $35,000 to $39,999 | 5 (4.1%) | 3 (4.5%) |
| $40,000 to $44,999 | 2 (1.6%) | 0 (0.0%) |
| $45,000 to $49,999 | 0 (0.0%) | 6 (9.0%) |
| $50,000 to $54,999 | 4 (3.3%) | 7 (10.4%) |
| $55,000 to $64,999 | 11 (9.0%) | 0 (0.0%) |
| $65,000 to $74,999 | 9 (7.4%) | 2 (3.0%) |
| $75,000 to $99,999 | 19 (15.6%) | 0 (0.0%) |
| $100,000+ | 42 (34.4%) | 0 (0.0%) |
| Total | 122 (100.0%) | 67 (100.0%) |
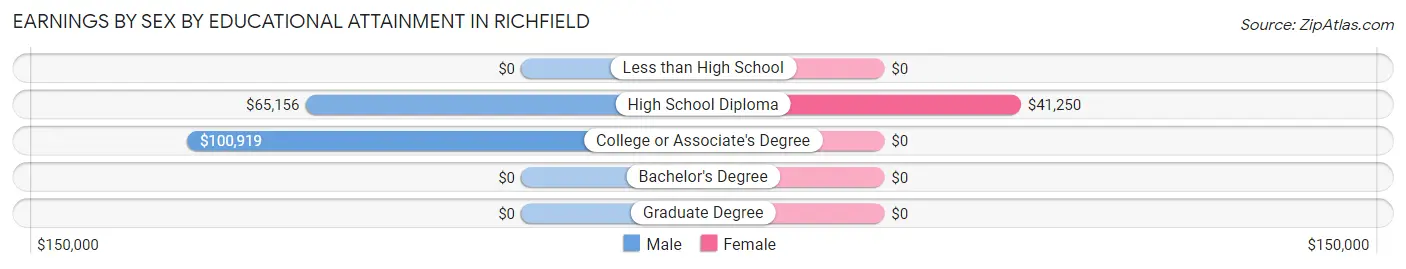
Earnings by Sex by Educational Attainment in Richfield
Average earnings in Richfield are $75,625 for men and $24,375 for women, a difference of 67.8%. Men with an educational attainment of college or associate's degree enjoy the highest average annual earnings of $100,919, while those with high school diploma education earn the least with $65,156. Women with an educational attainment of high school diploma earn the most with the average annual earnings of $41,250, while those with high school diploma education have the smallest earnings of $41,250.
| Educational Attainment | Male Income | Female Income |
| Less than High School | - | - |
| High School Diploma | $65,156 | $41,250 |
| College or Associate's Degree | $100,919 | $0 |
| Bachelor's Degree | - | - |
| Graduate Degree | - | - |
| Total | $75,625 | $24,375 |
Family Income in Richfield
Family Income Brackets in Richfield
According to the Richfield family income data, there are 35 families falling into the $75,000 to $99,999 income range, which is the most common income bracket and makes up 46.1% of all families.
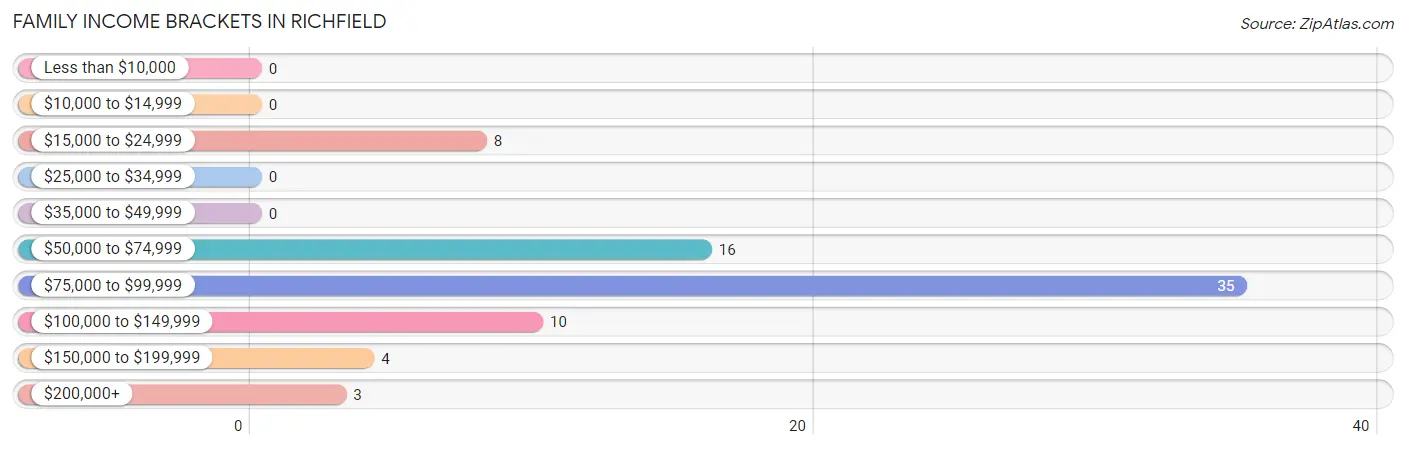
| Income Bracket | # Families | % Families |
| Less than $10,000 | 0 | 0.0% |
| $10,000 to $14,999 | 0 | 0.0% |
| $15,000 to $24,999 | 8 | 10.5% |
| $25,000 to $34,999 | 0 | 0.0% |
| $35,000 to $49,999 | 0 | 0.0% |
| $50,000 to $74,999 | 16 | 21.1% |
| $75,000 to $99,999 | 35 | 46.1% |
| $100,000 to $149,999 | 10 | 13.2% |
| $150,000 to $199,999 | 4 | 5.3% |
| $200,000+ | 3 | 3.9% |
Family Income by Famaliy Size in Richfield
3-person families (18 | 23.7%) account for the highest median family income in Richfield with $88,750 per family, while 2-person families (39 | 51.3%) have the highest median income of $43,282 per family member.
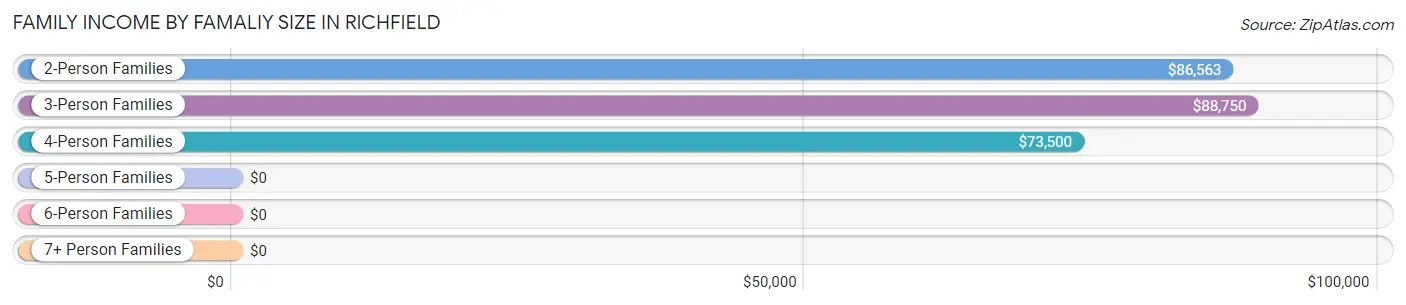
| Income Bracket | # Families | Median Income |
| 2-Person Families | 39 (51.3%) | $86,563 |
| 3-Person Families | 18 (23.7%) | $88,750 |
| 4-Person Families | 10 (13.2%) | $73,500 |
| 5-Person Families | 9 (11.8%) | $0 |
| 6-Person Families | 0 (0.0%) | $0 |
| 7+ Person Families | 0 (0.0%) | $0 |
| Total | 76 (100.0%) | $84,722 |
Family Income by Number of Earners in Richfield
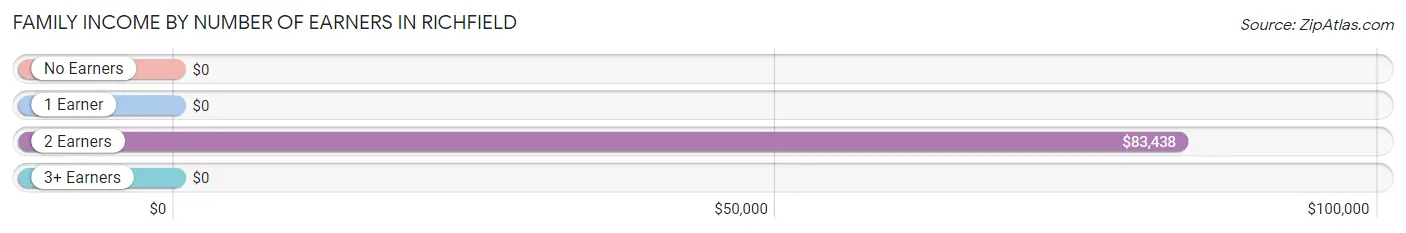
| Number of Earners | # Families | Median Income |
| No Earners | 10 (13.2%) | $0 |
| 1 Earner | 20 (26.3%) | $0 |
| 2 Earners | 41 (53.9%) | $83,438 |
| 3+ Earners | 5 (6.6%) | $0 |
| Total | 76 (100.0%) | $84,722 |
Household Income in Richfield
Household Income Brackets in Richfield
With 44 households falling in the category, the $100,000 to $149,999 income range is the most frequent in Richfield, accounting for 22.7% of all households.
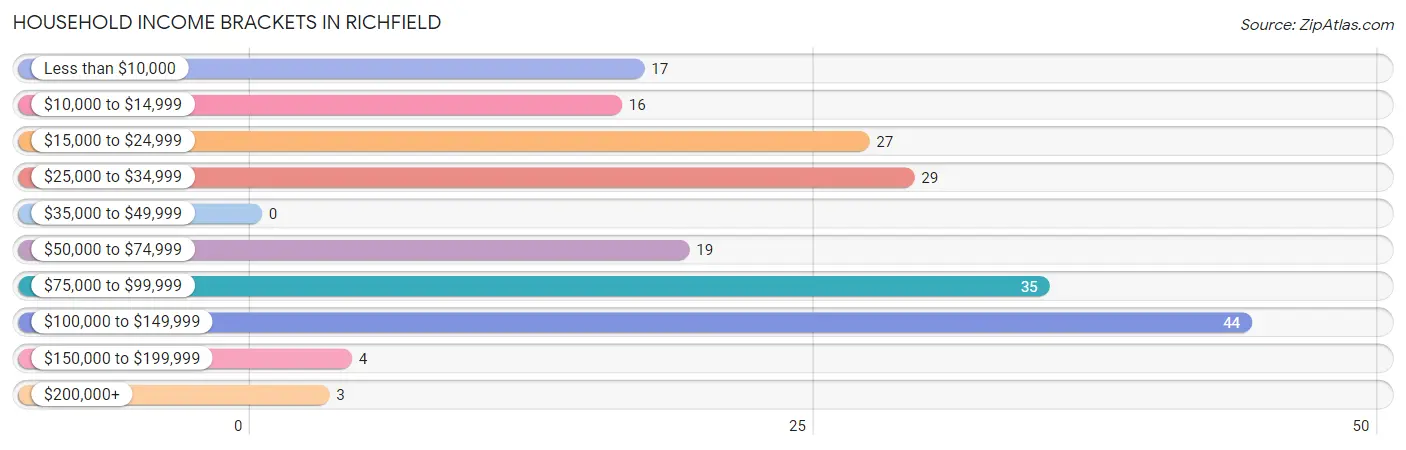
| Income Bracket | # Households | % Households |
| Less than $10,000 | 17 | 8.8% |
| $10,000 to $14,999 | 16 | 8.2% |
| $15,000 to $24,999 | 27 | 13.9% |
| $25,000 to $34,999 | 29 | 14.9% |
| $35,000 to $49,999 | 0 | 0.0% |
| $50,000 to $74,999 | 19 | 9.8% |
| $75,000 to $99,999 | 35 | 18.0% |
| $100,000 to $149,999 | 44 | 22.7% |
| $150,000 to $199,999 | 4 | 2.1% |
| $200,000+ | 3 | 1.5% |
Household Income by Householder Age in Richfield
The median household income in Richfield is $68,214, with the highest median household income of $79,375 found in the 45 to 64 years age bracket for the primary householder. A total of 58 households (29.9%) fall into this category.
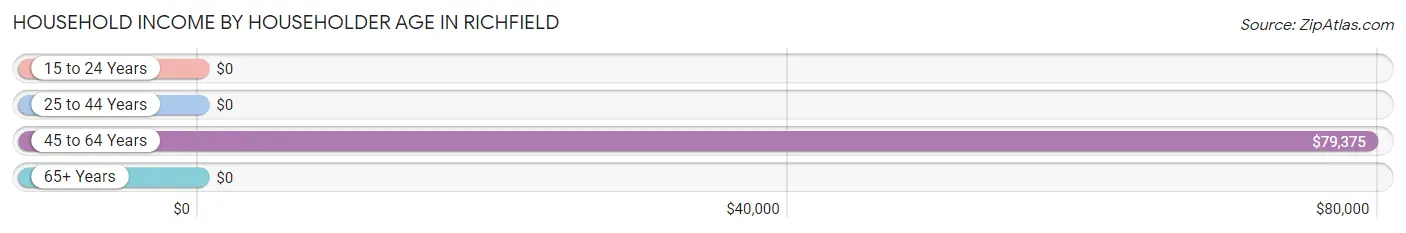
| Income Bracket | # Households | Median Income |
| 15 to 24 Years | 0 (0.0%) | $0 |
| 25 to 44 Years | 43 (22.2%) | $0 |
| 45 to 64 Years | 58 (29.9%) | $79,375 |
| 65+ Years | 93 (47.9%) | $0 |
| Total | 194 (100.0%) | $68,214 |
Poverty in Richfield
Income Below Poverty by Sex and Age in Richfield
With 17.1% poverty level for males and 12.3% for females among the residents of Richfield, 5 year old males and 45 to 54 year old females are the most vulnerable to poverty, with 1 males (100.0%) and 6 females (30.0%) in their respective age groups living below the poverty level.
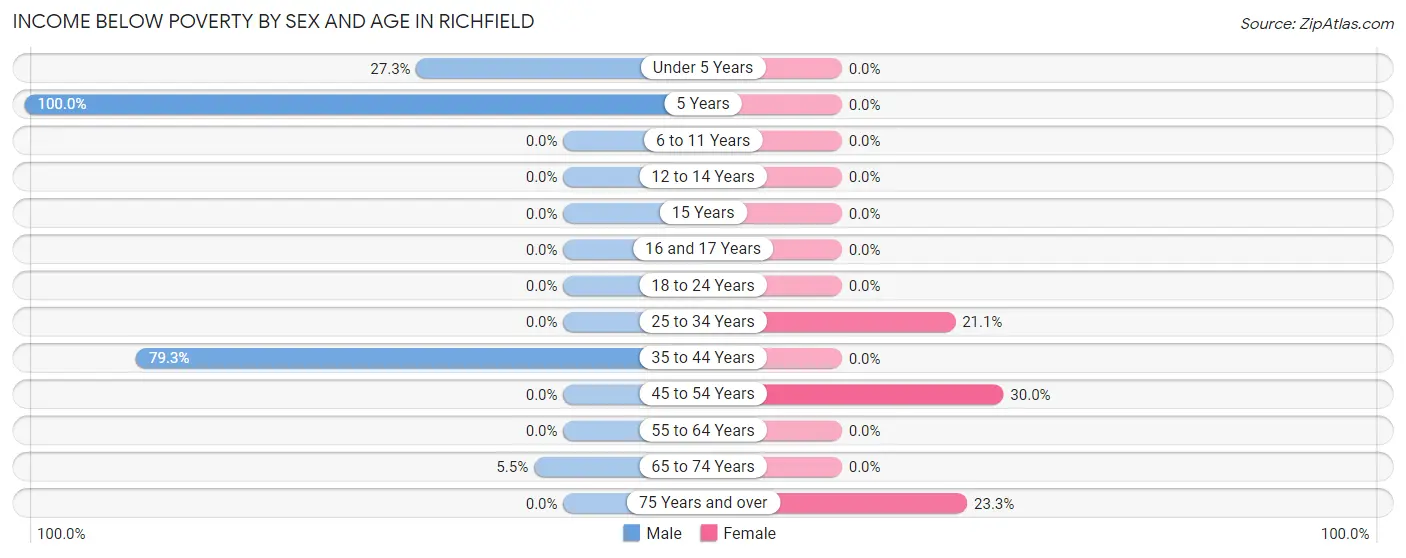
| Age Bracket | Male | Female |
| Under 5 Years | 3 (27.3%) | 0 (0.0%) |
| 5 Years | 1 (100.0%) | 0 (0.0%) |
| 6 to 11 Years | 0 (0.0%) | 0 (0.0%) |
| 12 to 14 Years | 0 (0.0%) | 0 (0.0%) |
| 15 Years | 0 (0.0%) | 0 (0.0%) |
| 16 and 17 Years | 0 (0.0%) | 0 (0.0%) |
| 18 to 24 Years | 0 (0.0%) | 0 (0.0%) |
| 25 to 34 Years | 0 (0.0%) | 4 (21.0%) |
| 35 to 44 Years | 23 (79.3%) | 0 (0.0%) |
| 45 to 54 Years | 0 (0.0%) | 6 (30.0%) |
| 55 to 64 Years | 0 (0.0%) | 0 (0.0%) |
| 65 to 74 Years | 3 (5.4%) | 0 (0.0%) |
| 75 Years and over | 0 (0.0%) | 10 (23.3%) |
| Total | 30 (17.1%) | 20 (12.3%) |
Income Above Poverty by Sex and Age in Richfield
According to the poverty statistics in Richfield, males aged 6 to 11 years and females aged under 5 years are the age groups that are most secure financially, with 100.0% of males and 100.0% of females in these age groups living above the poverty line.
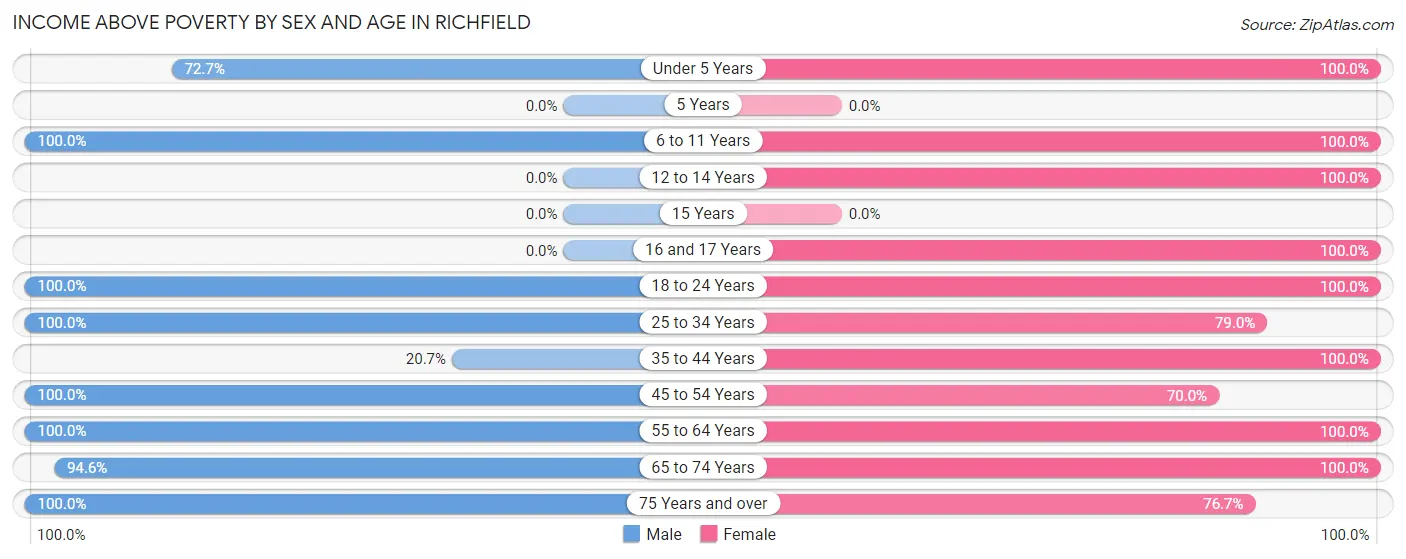
| Age Bracket | Male | Female |
| Under 5 Years | 8 (72.7%) | 8 (100.0%) |
| 5 Years | 0 (0.0%) | 0 (0.0%) |
| 6 to 11 Years | 2 (100.0%) | 9 (100.0%) |
| 12 to 14 Years | 0 (0.0%) | 3 (100.0%) |
| 15 Years | 0 (0.0%) | 0 (0.0%) |
| 16 and 17 Years | 0 (0.0%) | 11 (100.0%) |
| 18 to 24 Years | 11 (100.0%) | 2 (100.0%) |
| 25 to 34 Years | 18 (100.0%) | 15 (78.9%) |
| 35 to 44 Years | 6 (20.7%) | 7 (100.0%) |
| 45 to 54 Years | 16 (100.0%) | 14 (70.0%) |
| 55 to 64 Years | 20 (100.0%) | 33 (100.0%) |
| 65 to 74 Years | 52 (94.6%) | 8 (100.0%) |
| 75 Years and over | 13 (100.0%) | 33 (76.7%) |
| Total | 146 (83.0%) | 143 (87.7%) |
Income Below Poverty Among Married-Couple Families in Richfield
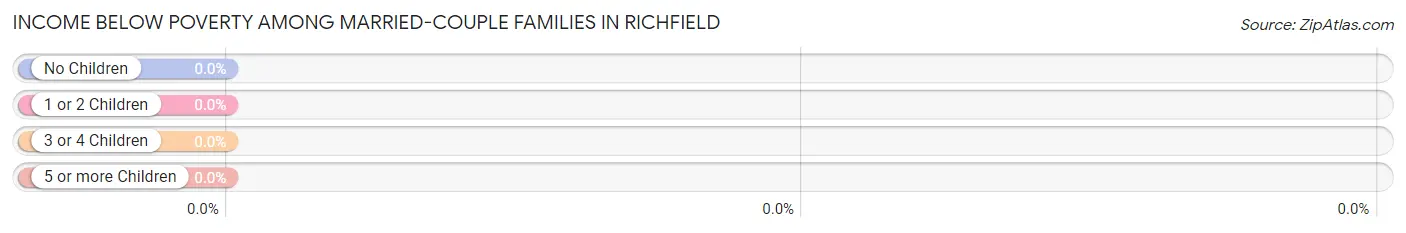
| Children | Above Poverty | Below Poverty |
| No Children | 41 (100.0%) | 0 (0.0%) |
| 1 or 2 Children | 28 (100.0%) | 0 (0.0%) |
| 3 or 4 Children | 4 (100.0%) | 0 (0.0%) |
| 5 or more Children | 0 (0.0%) | 0 (0.0%) |
| Total | 73 (100.0%) | 0 (0.0%) |
Income Below Poverty Among Single-Parent Households in Richfield
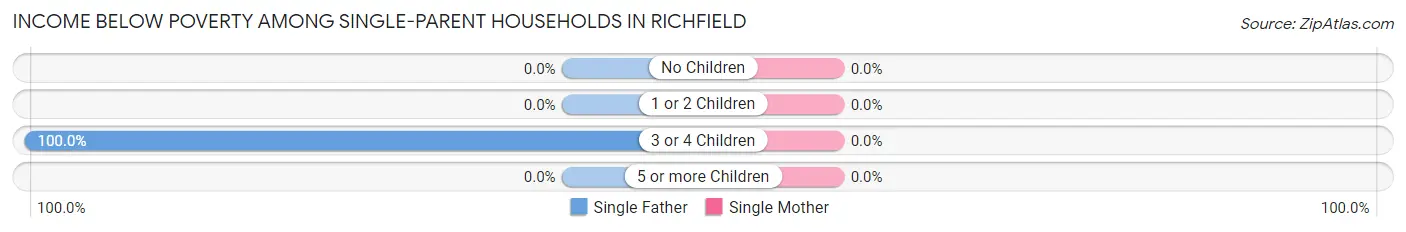
| Children | Single Father | Single Mother |
| No Children | 0 (0.0%) | 0 (0.0%) |
| 1 or 2 Children | 0 (0.0%) | 0 (0.0%) |
| 3 or 4 Children | 3 (100.0%) | 0 (0.0%) |
| 5 or more Children | 0 (0.0%) | 0 (0.0%) |
| Total | 3 (100.0%) | 0 (0.0%) |
Income Below Poverty Among Married-Couple vs Single-Parent Households in Richfield
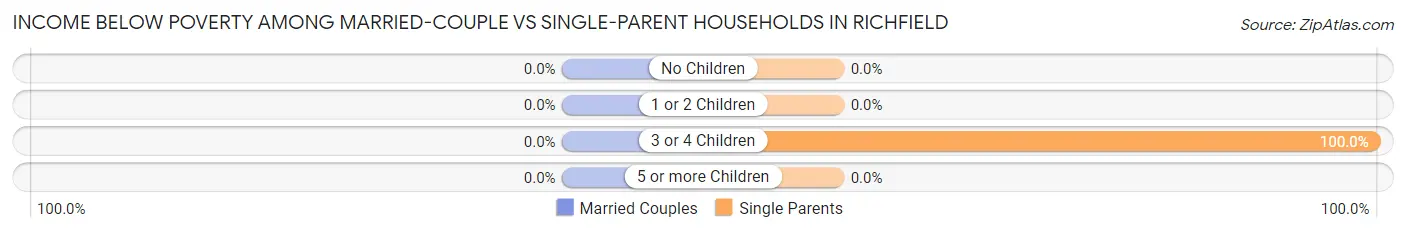
| Children | Married-Couple Families | Single-Parent Households |
| No Children | 0 (0.0%) | 0 (0.0%) |
| 1 or 2 Children | 0 (0.0%) | 0 (0.0%) |
| 3 or 4 Children | 0 (0.0%) | 3 (100.0%) |
| 5 or more Children | 0 (0.0%) | 0 (0.0%) |
| Total | 0 (0.0%) | 3 (100.0%) |
Race in Richfield
The most populous races in Richfield are White / Caucasian (356 | 94.4%), Hispanic or Latino (16 | 4.2%), and Asian (10 | 2.6%).
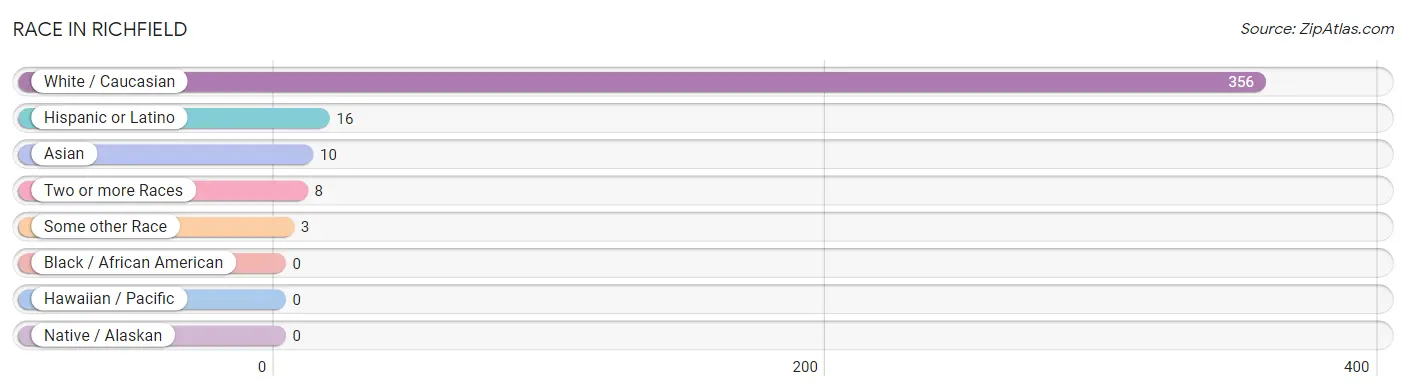
| Race | # Population | % Population |
| Asian | 10 | 2.6% |
| Black / African American | 0 | 0.0% |
| Hawaiian / Pacific | 0 | 0.0% |
| Hispanic or Latino | 16 | 4.2% |
| Native / Alaskan | 0 | 0.0% |
| White / Caucasian | 356 | 94.4% |
| Two or more Races | 8 | 2.1% |
| Some other Race | 3 | 0.8% |
| Total | 377 | 100.0% |
Ancestry in Richfield
The most populous ancestries reported in Richfield are German (172 | 45.6%), American (51 | 13.5%), Dutch (32 | 8.5%), English (24 | 6.4%), and Korean (18 | 4.8%), together accounting for 78.8% of all Richfield residents.
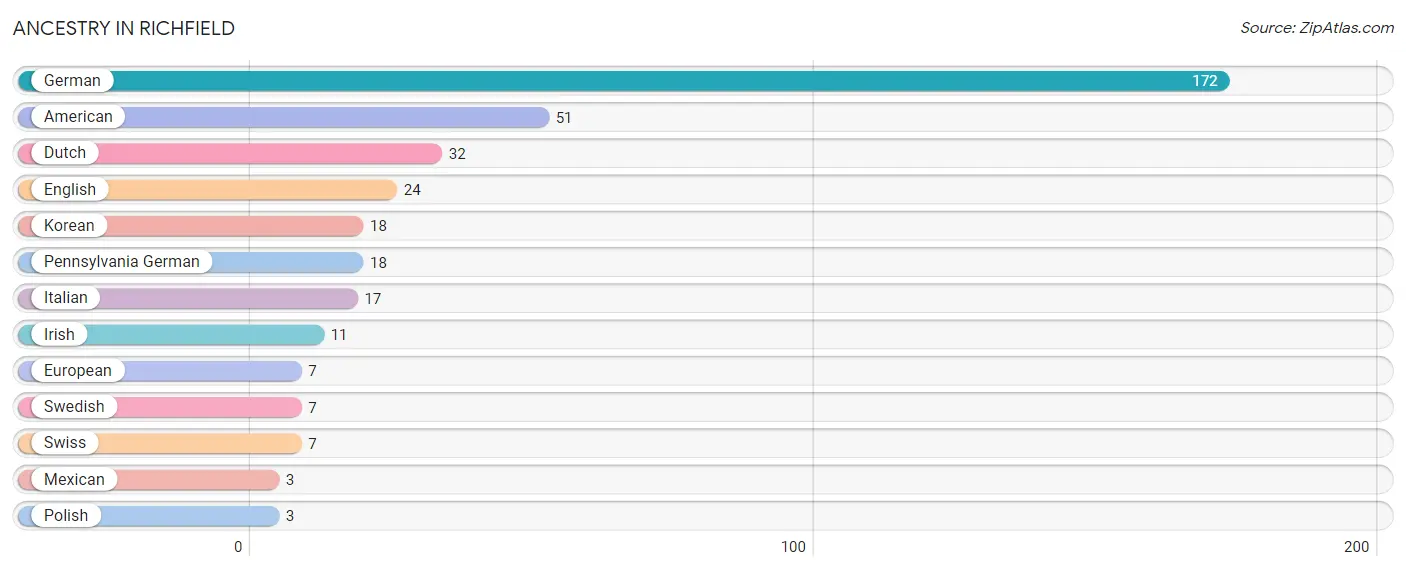
| Ancestry | # Population | % Population |
| American | 51 | 13.5% |
| Dutch | 32 | 8.5% |
| English | 24 | 6.4% |
| European | 7 | 1.9% |
| German | 172 | 45.6% |
| Irish | 11 | 2.9% |
| Italian | 17 | 4.5% |
| Korean | 18 | 4.8% |
| Mexican | 3 | 0.8% |
| Pennsylvania German | 18 | 4.8% |
| Polish | 3 | 0.8% |
| Swedish | 7 | 1.9% |
| Swiss | 7 | 1.9% | View All 13 Rows |
Immigrants in Richfield
The most numerous immigrant groups reported in Richfield came from Asia (10 | 2.6%), Philippines (10 | 2.6%), South Eastern Asia (10 | 2.6%), Central America (2 | 0.5%), and Honduras (2 | 0.5%), together accounting for 9.0% of all Richfield residents.
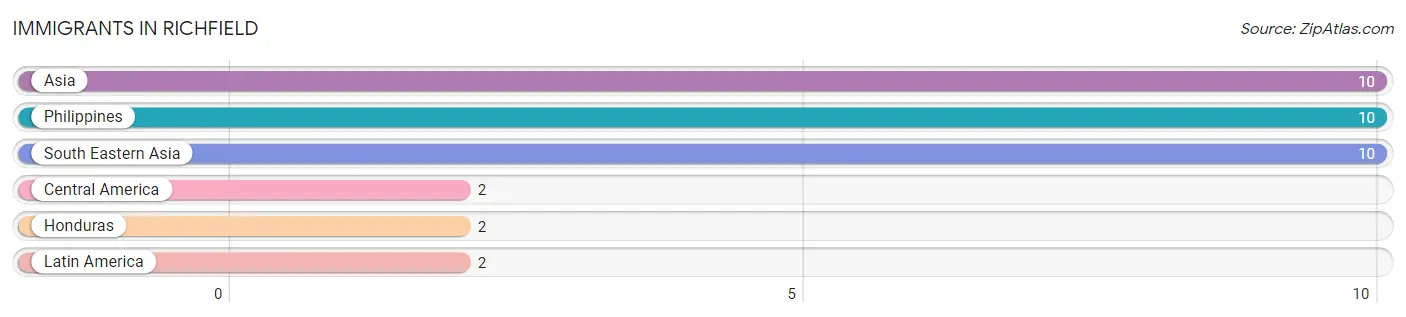
| Immigration Origin | # Population | % Population |
| Asia | 10 | 2.6% |
| Central America | 2 | 0.5% |
| Honduras | 2 | 0.5% |
| Latin America | 2 | 0.5% |
| Philippines | 10 | 2.6% |
| South Eastern Asia | 10 | 2.6% | View All 6 Rows |
Sex and Age in Richfield
Sex and Age in Richfield
The most populous age groups in Richfield are 65 to 69 Years (48 | 27.3%) for men and 85 Years and over (48 | 23.9%) for women.
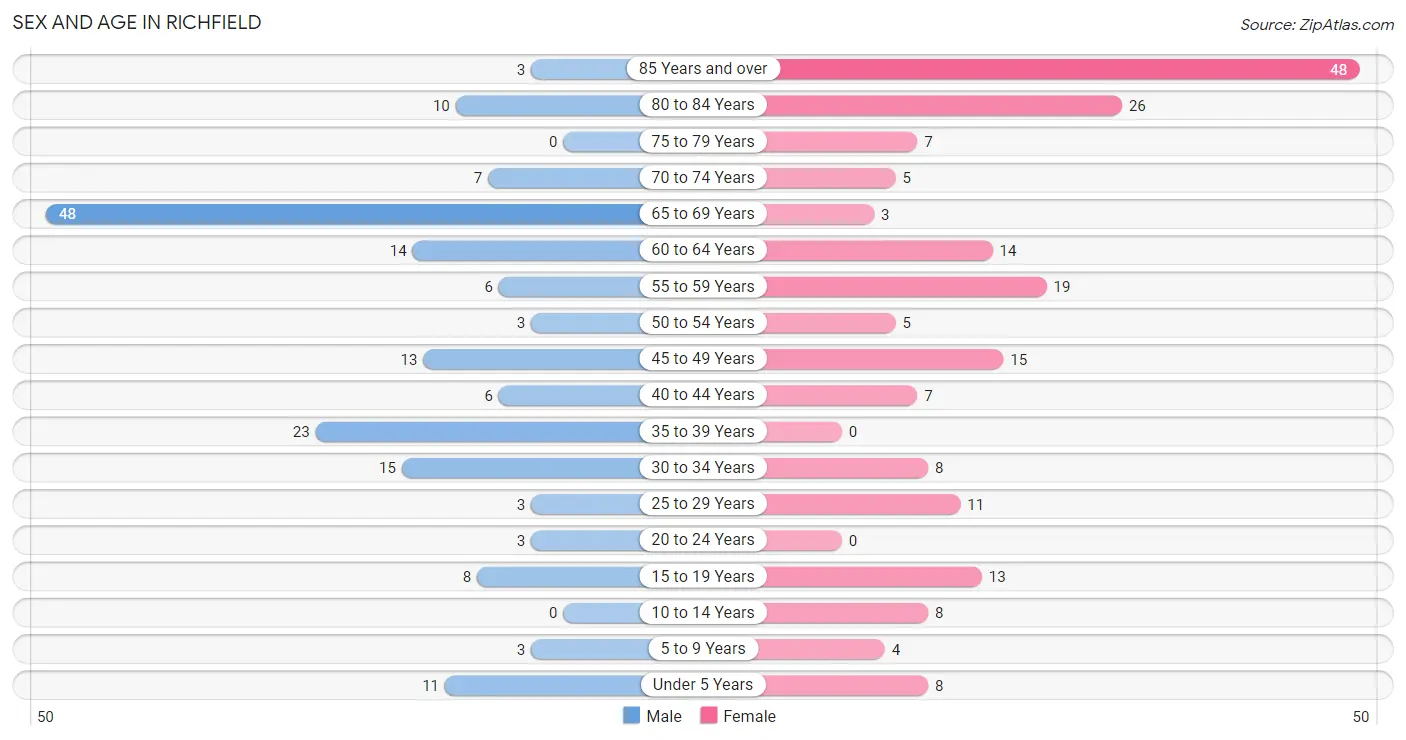
| Age Bracket | Male | Female |
| Under 5 Years | 11 (6.2%) | 8 (4.0%) |
| 5 to 9 Years | 3 (1.7%) | 4 (2.0%) |
| 10 to 14 Years | 0 (0.0%) | 8 (4.0%) |
| 15 to 19 Years | 8 (4.5%) | 13 (6.5%) |
| 20 to 24 Years | 3 (1.7%) | 0 (0.0%) |
| 25 to 29 Years | 3 (1.7%) | 11 (5.5%) |
| 30 to 34 Years | 15 (8.5%) | 8 (4.0%) |
| 35 to 39 Years | 23 (13.1%) | 0 (0.0%) |
| 40 to 44 Years | 6 (3.4%) | 7 (3.5%) |
| 45 to 49 Years | 13 (7.4%) | 15 (7.5%) |
| 50 to 54 Years | 3 (1.7%) | 5 (2.5%) |
| 55 to 59 Years | 6 (3.4%) | 19 (9.5%) |
| 60 to 64 Years | 14 (8.0%) | 14 (7.0%) |
| 65 to 69 Years | 48 (27.3%) | 3 (1.5%) |
| 70 to 74 Years | 7 (4.0%) | 5 (2.5%) |
| 75 to 79 Years | 0 (0.0%) | 7 (3.5%) |
| 80 to 84 Years | 10 (5.7%) | 26 (12.9%) |
| 85 Years and over | 3 (1.7%) | 48 (23.9%) |
| Total | 176 (100.0%) | 201 (100.0%) |
Families and Households in Richfield
Median Family Size in Richfield
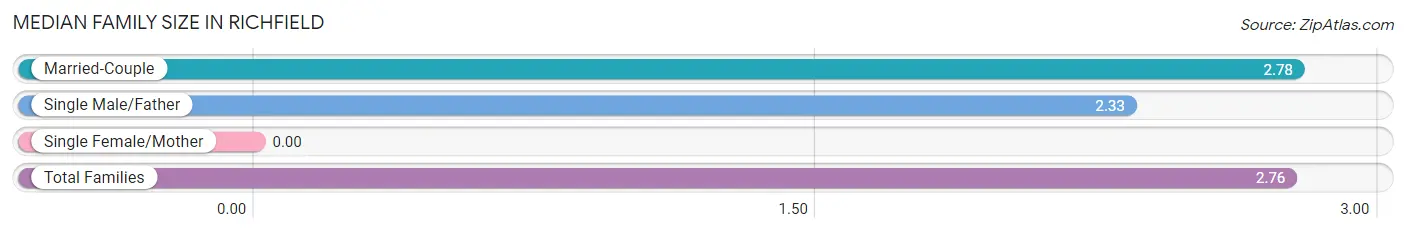
| Family Type | # Families | Family Size |
| Married-Couple | 73 (96.1%) | 2.78 |
| Single Male/Father | 3 (4.0%) | 2.33 |
| Single Female/Mother | 0 (0.0%) | - |
| Total Families | 76 (100.0%) | 2.76 |
Median Household Size in Richfield
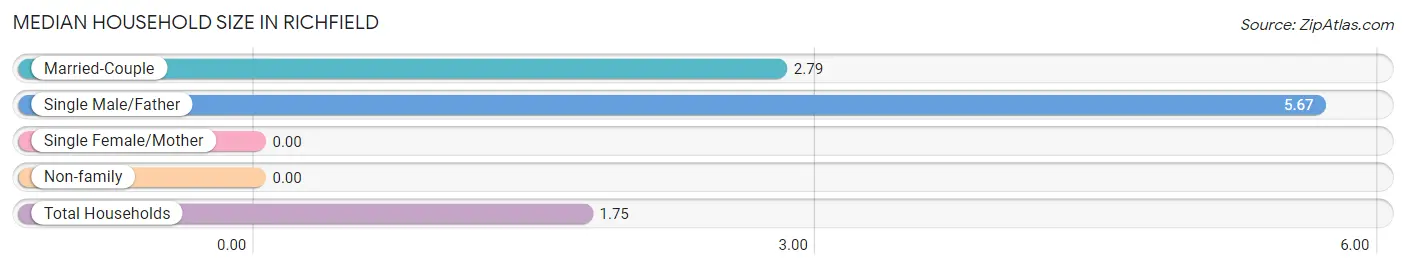
| Household Type | # Households | Household Size |
| Married-Couple | 73 (37.6%) | 2.79 |
| Single Male/Father | 3 (1.5%) | 5.67 |
| Single Female/Mother | 0 (0.0%) | - |
| Non-family | 118 (60.8%) | - |
| Total Households | 194 (100.0%) | 1.75 |
Household Size by Marriage Status in Richfield
Out of a total of 194 households in Richfield, 76 (39.2%) are family households, while 118 (60.8%) are nonfamily households. The most numerous type of family households are 2-person households, comprising 39, and the most common type of nonfamily households are 1-person households, comprising 118.
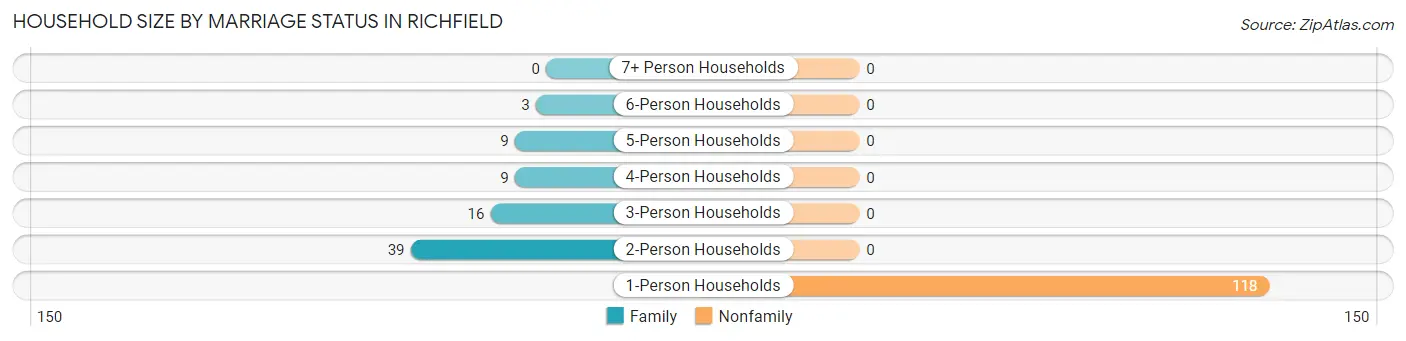
| Household Size | Family Households | Nonfamily Households |
| 1-Person Households | - | 118 (60.8%) |
| 2-Person Households | 39 (20.1%) | 0 (0.0%) |
| 3-Person Households | 16 (8.3%) | 0 (0.0%) |
| 4-Person Households | 9 (4.6%) | 0 (0.0%) |
| 5-Person Households | 9 (4.6%) | 0 (0.0%) |
| 6-Person Households | 3 (1.5%) | 0 (0.0%) |
| 7+ Person Households | 0 (0.0%) | 0 (0.0%) |
| Total | 76 (39.2%) | 118 (60.8%) |
Female Fertility in Richfield
Fertility by Age in Richfield
Average fertility rate in Richfield is 111.0 births per 1,000 women. Women in the age bracket of 20 to 34 years have the highest fertility rate with 316.0 births per 1,000 women. Women in the age bracket of 20 to 34 years acount for 100.0% of all women with births.
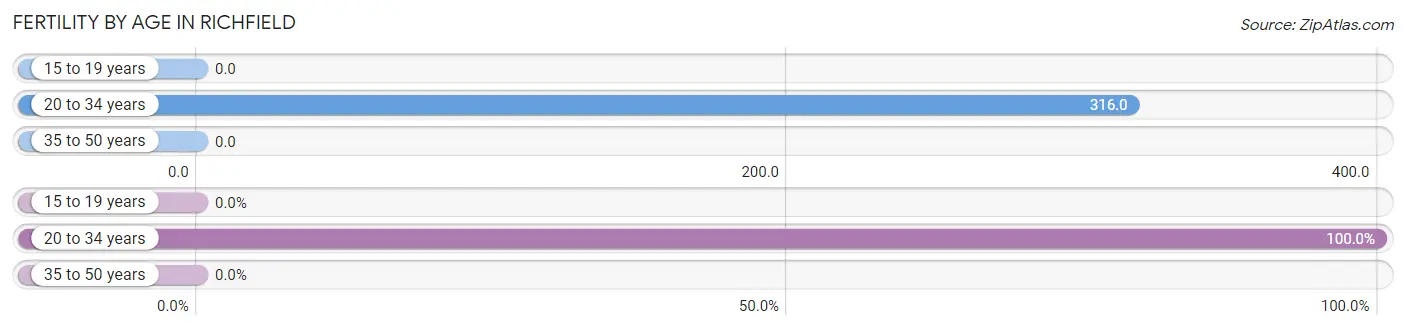
| Age Bracket | Women with Births | Births / 1,000 Women |
| 15 to 19 years | 0 (0.0%) | 0.0 |
| 20 to 34 years | 6 (100.0%) | 316.0 |
| 35 to 50 years | 0 (0.0%) | 0.0 |
| Total | 6 (100.0%) | 111.0 |
Fertility by Age by Marriage Status in Richfield
33.3% of women with births (6) in Richfield are married. The highest percentage of unmarried women with births falls into 20 to 34 years age bracket with 66.7% of them unmarried at the time of birth, while the lowest percentage of unmarried women with births belong to 20 to 34 years age bracket with 66.7% of them unmarried.
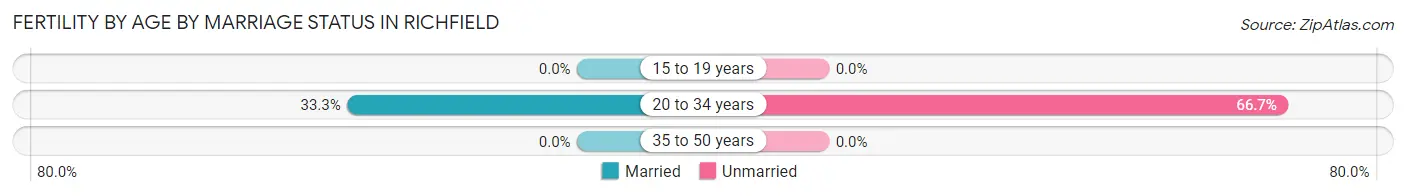
| Age Bracket | Married | Unmarried |
| 15 to 19 years | 0 (0.0%) | 0 (0.0%) |
| 20 to 34 years | 2 (33.3%) | 4 (66.7%) |
| 35 to 50 years | 0 (0.0%) | 0 (0.0%) |
| Total | 2 (33.3%) | 4 (66.7%) |
Fertility by Education in Richfield
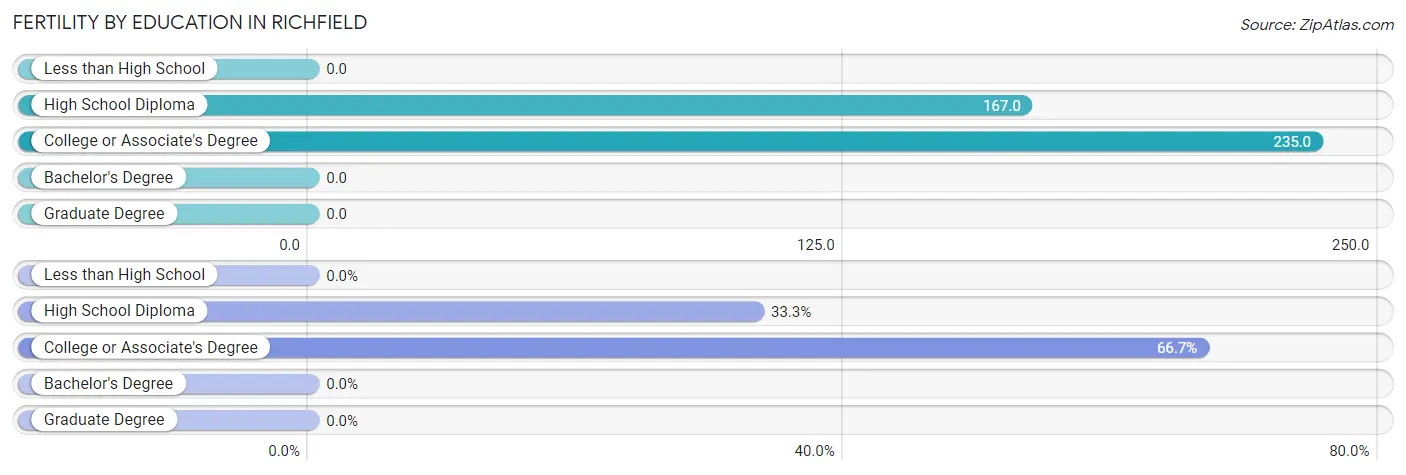
| Educational Attainment | Women with Births | Births / 1,000 Women |
| Less than High School | 0 (0.0%) | 0.0 |
| High School Diploma | 2 (33.3%) | 167.0 |
| College or Associate's Degree | 4 (66.7%) | 235.0 |
| Bachelor's Degree | 0 (0.0%) | 0.0 |
| Graduate Degree | 0 (0.0%) | 0.0 |
| Total | 6 (100.0%) | 111.0 |
Fertility by Education by Marriage Status in Richfield
66.7% of women with births in Richfield are unmarried. Women with the educational attainment of high school diploma are most likely to be married with 100.0% of them married at childbirth, while women with the educational attainment of college or associate's degree are least likely to be married with 100.0% of them unmarried at childbirth.
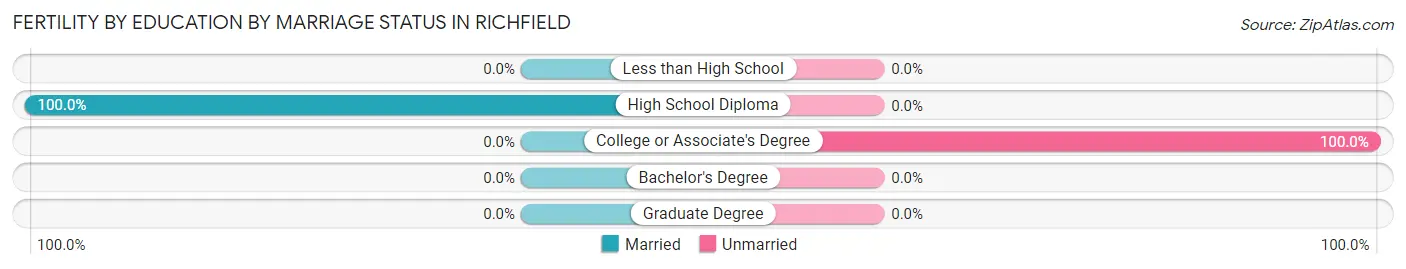
| Educational Attainment | Married | Unmarried |
| Less than High School | 0 (0.0%) | 0 (0.0%) |
| High School Diploma | 2 (100.0%) | 0 (0.0%) |
| College or Associate's Degree | 0 (0.0%) | 4 (100.0%) |
| Bachelor's Degree | 0 (0.0%) | 0 (0.0%) |
| Graduate Degree | 0 (0.0%) | 0 (0.0%) |
| Total | 2 (33.3%) | 4 (66.7%) |
Employment Characteristics in Richfield
Employment by Class of Employer in Richfield
Among the 180 employed individuals in Richfield, private company employees (144 | 80.0%), self-employed (not incorporated) (19 | 10.6%), and self-employed (incorporated) (7 | 3.9%) make up the most common classes of employment.
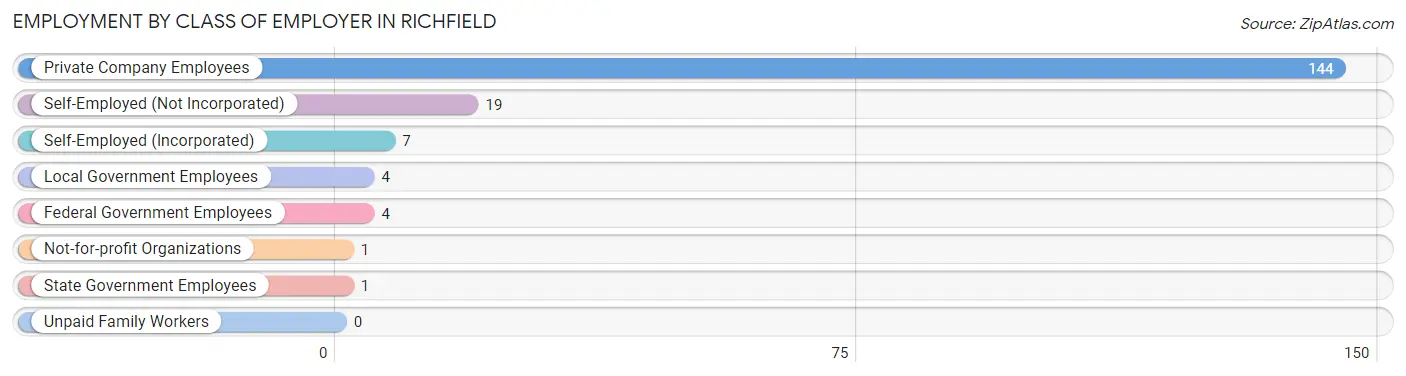
| Employer Class | # Employees | % Employees |
| Private Company Employees | 144 | 80.0% |
| Self-Employed (Incorporated) | 7 | 3.9% |
| Self-Employed (Not Incorporated) | 19 | 10.6% |
| Not-for-profit Organizations | 1 | 0.6% |
| Local Government Employees | 4 | 2.2% |
| State Government Employees | 1 | 0.6% |
| Federal Government Employees | 4 | 2.2% |
| Unpaid Family Workers | 0 | 0.0% |
| Total | 180 | 100.0% |
Employment Status by Age in Richfield
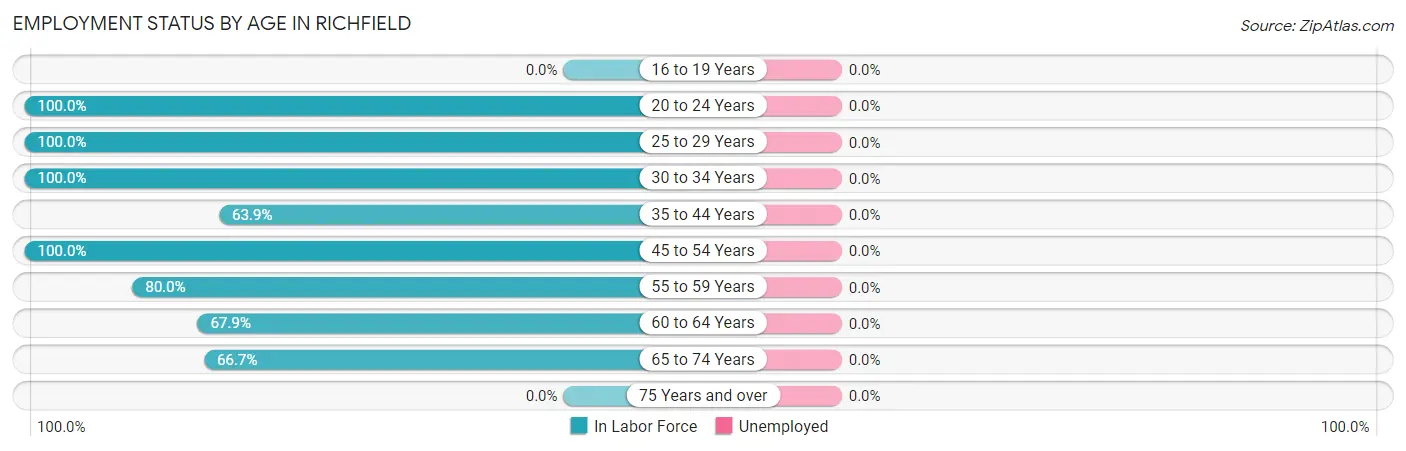
| Age Bracket | In Labor Force | Unemployed |
| 16 to 19 Years | 0 (0.0%) | 0 (0.0%) |
| 20 to 24 Years | 3 (100.0%) | 0 (0.0%) |
| 25 to 29 Years | 14 (100.0%) | 0 (0.0%) |
| 30 to 34 Years | 23 (100.0%) | 0 (0.0%) |
| 35 to 44 Years | 23 (63.9%) | 0 (0.0%) |
| 45 to 54 Years | 36 (100.0%) | 0 (0.0%) |
| 55 to 59 Years | 20 (80.0%) | 0 (0.0%) |
| 60 to 64 Years | 19 (67.9%) | 0 (0.0%) |
| 65 to 74 Years | 42 (66.7%) | 0 (0.0%) |
| 75 Years and over | 0 (0.0%) | 0 (0.0%) |
| Total | 180 (52.5%) | 0 (0.0%) |
Employment Status by Educational Attainment in Richfield
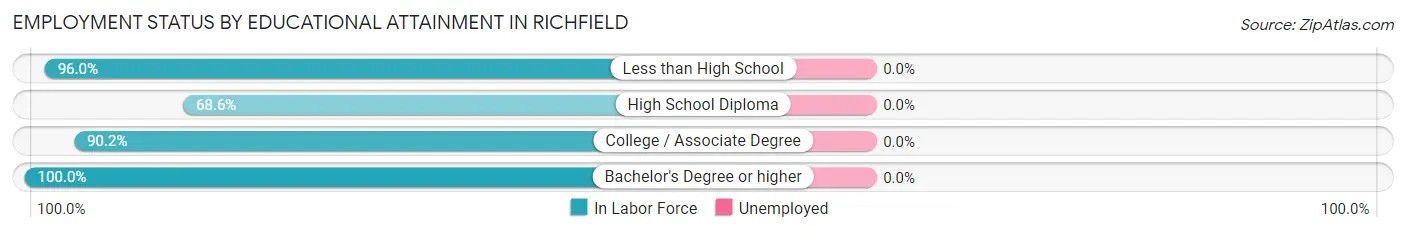
| Educational Attainment | In Labor Force | Unemployed |
| Less than High School | 24 (96.0%) | 0 (0.0%) |
| High School Diploma | 48 (68.6%) | 0 (0.0%) |
| College / Associate Degree | 37 (90.2%) | 0 (0.0%) |
| Bachelor's Degree or higher | 26 (100.0%) | 0 (0.0%) |
| Total | 135 (83.3%) | 0 (0.0%) |
Employment Occupations by Sex in Richfield
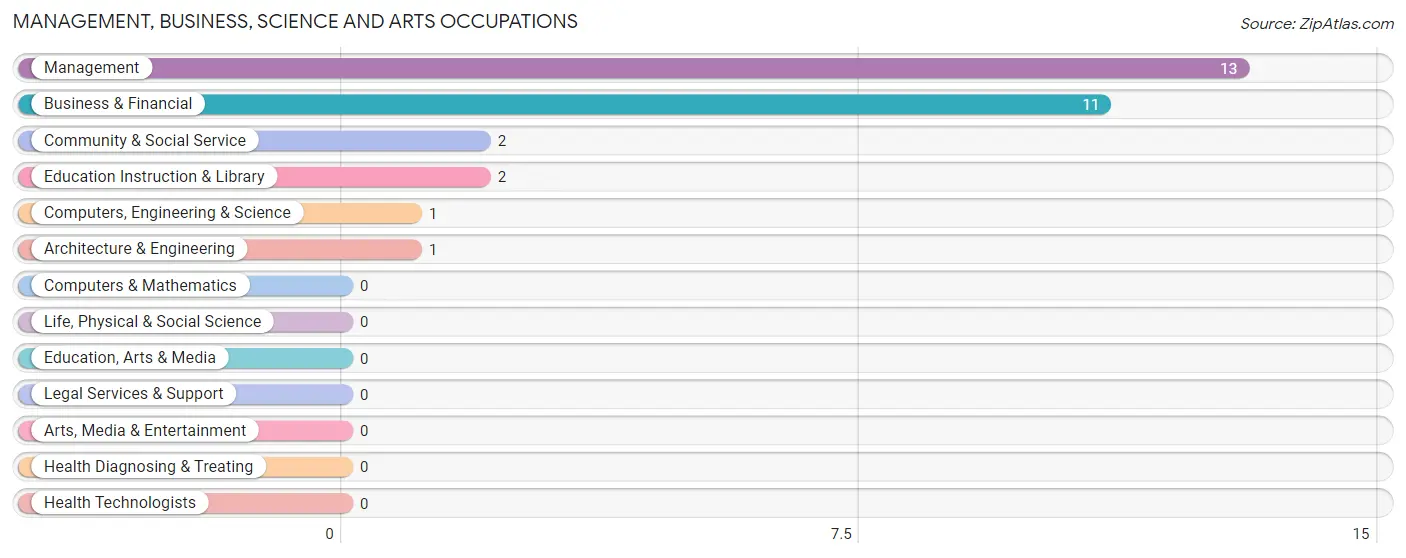
Management, Business, Science and Arts Occupations
The most common Management, Business, Science and Arts occupations in Richfield are Management (13 | 7.2%), Business & Financial (11 | 6.1%), Community & Social Service (2 | 1.1%), Education Instruction & Library (2 | 1.1%), and Computers, Engineering & Science (1 | 0.6%).
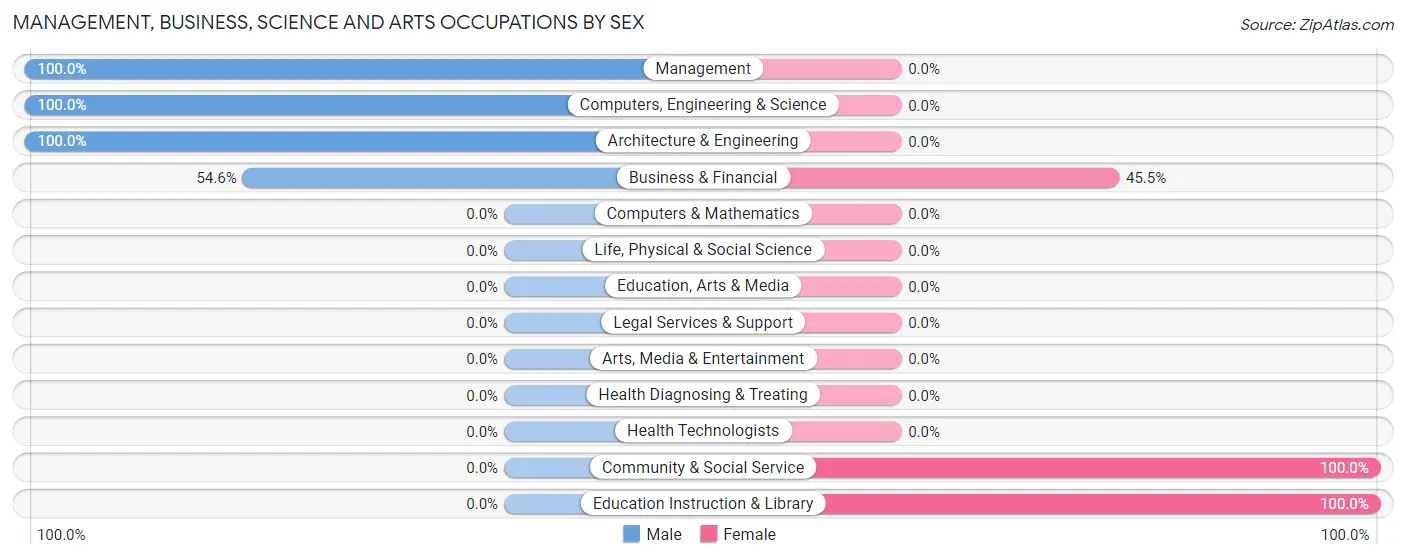
Management, Business, Science and Arts Occupations by Sex
Within the Management, Business, Science and Arts occupations in Richfield, the most male-oriented occupations are Management (100.0%), Computers, Engineering & Science (100.0%), and Architecture & Engineering (100.0%), while the most female-oriented occupations are Community & Social Service (100.0%), Education Instruction & Library (100.0%), and Business & Financial (45.5%).
| Occupation | Male | Female |
| Management | 13 (100.0%) | 0 (0.0%) |
| Business & Financial | 6 (54.5%) | 5 (45.5%) |
| Computers, Engineering & Science | 1 (100.0%) | 0 (0.0%) |
| Computers & Mathematics | 0 (0.0%) | 0 (0.0%) |
| Architecture & Engineering | 1 (100.0%) | 0 (0.0%) |
| Life, Physical & Social Science | 0 (0.0%) | 0 (0.0%) |
| Community & Social Service | 0 (0.0%) | 2 (100.0%) |
| Education, Arts & Media | 0 (0.0%) | 0 (0.0%) |
| Legal Services & Support | 0 (0.0%) | 0 (0.0%) |
| Education Instruction & Library | 0 (0.0%) | 2 (100.0%) |
| Arts, Media & Entertainment | 0 (0.0%) | 0 (0.0%) |
| Health Diagnosing & Treating | 0 (0.0%) | 0 (0.0%) |
| Health Technologists | 0 (0.0%) | 0 (0.0%) |
| Total (Category) | 20 (74.1%) | 7 (25.9%) |
| Total (Overall) | 115 (63.9%) | 65 (36.1%) |
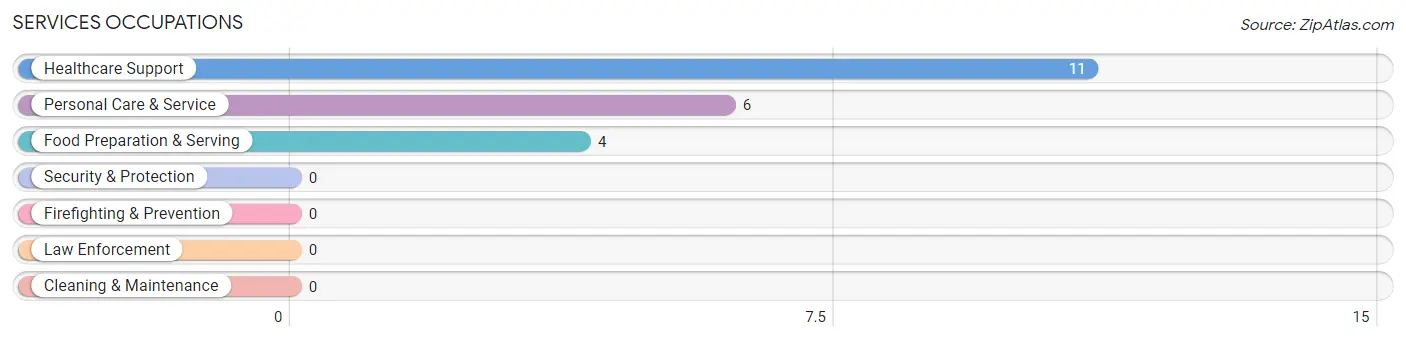
Services Occupations
The most common Services occupations in Richfield are Healthcare Support (11 | 6.1%), Personal Care & Service (6 | 3.3%), and Food Preparation & Serving (4 | 2.2%).
Services Occupations by Sex
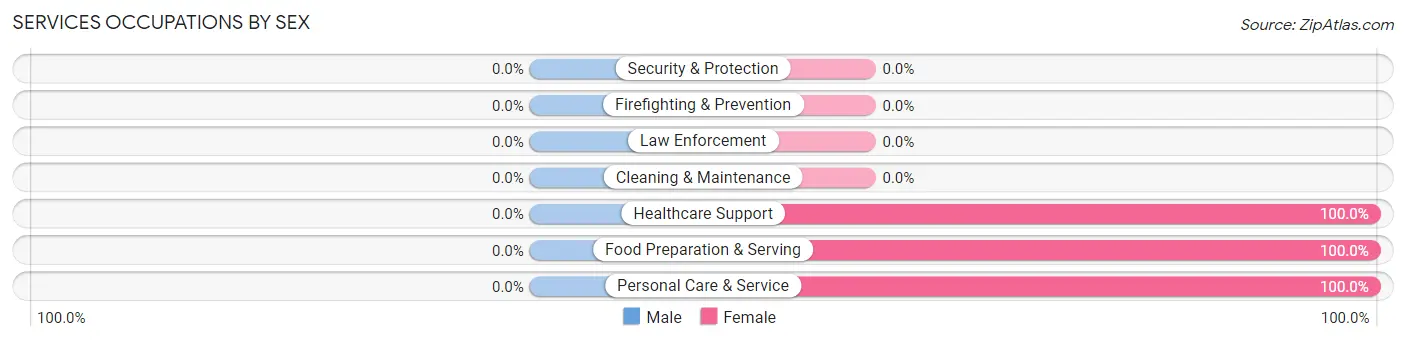
| Occupation | Male | Female |
| Healthcare Support | 0 (0.0%) | 11 (100.0%) |
| Security & Protection | 0 (0.0%) | 0 (0.0%) |
| Firefighting & Prevention | 0 (0.0%) | 0 (0.0%) |
| Law Enforcement | 0 (0.0%) | 0 (0.0%) |
| Food Preparation & Serving | 0 (0.0%) | 4 (100.0%) |
| Cleaning & Maintenance | 0 (0.0%) | 0 (0.0%) |
| Personal Care & Service | 0 (0.0%) | 6 (100.0%) |
| Total (Category) | 0 (0.0%) | 21 (100.0%) |
| Total (Overall) | 115 (63.9%) | 65 (36.1%) |
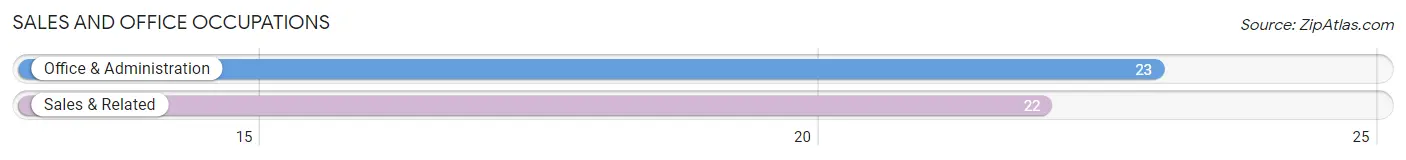
Sales and Office Occupations
The most common Sales and Office occupations in Richfield are Office & Administration (23 | 12.8%), and Sales & Related (22 | 12.2%).
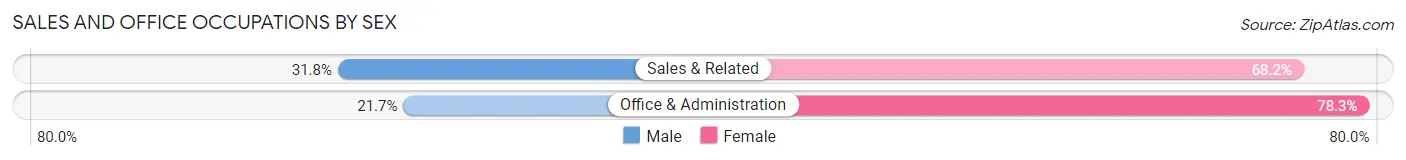
Sales and Office Occupations by Sex
| Occupation | Male | Female |
| Sales & Related | 7 (31.8%) | 15 (68.2%) |
| Office & Administration | 5 (21.7%) | 18 (78.3%) |
| Total (Category) | 12 (26.7%) | 33 (73.3%) |
| Total (Overall) | 115 (63.9%) | 65 (36.1%) |
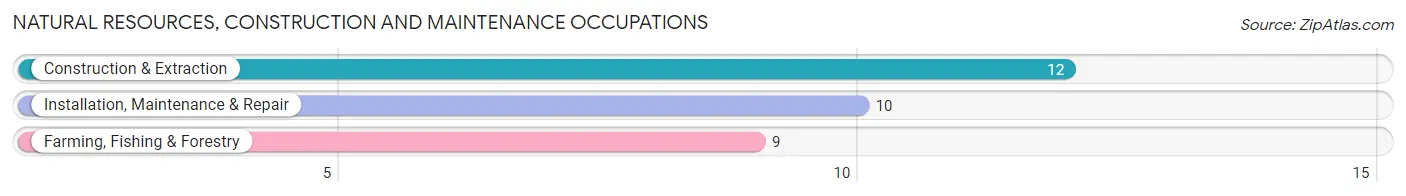
Natural Resources, Construction and Maintenance Occupations
The most common Natural Resources, Construction and Maintenance occupations in Richfield are Construction & Extraction (12 | 6.7%), Installation, Maintenance & Repair (10 | 5.6%), and Farming, Fishing & Forestry (9 | 5.0%).
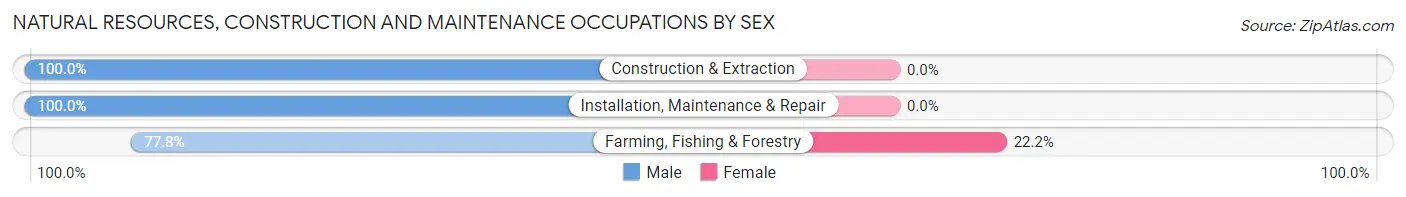
Natural Resources, Construction and Maintenance Occupations by Sex
| Occupation | Male | Female |
| Farming, Fishing & Forestry | 7 (77.8%) | 2 (22.2%) |
| Construction & Extraction | 12 (100.0%) | 0 (0.0%) |
| Installation, Maintenance & Repair | 10 (100.0%) | 0 (0.0%) |
| Total (Category) | 29 (93.5%) | 2 (6.5%) |
| Total (Overall) | 115 (63.9%) | 65 (36.1%) |
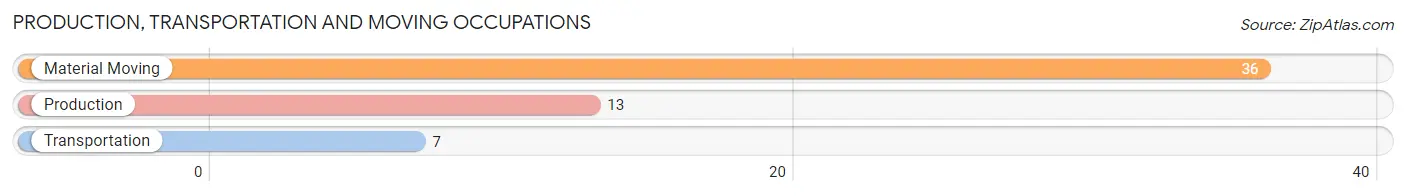
Production, Transportation and Moving Occupations
The most common Production, Transportation and Moving occupations in Richfield are Material Moving (36 | 20.0%), Production (13 | 7.2%), and Transportation (7 | 3.9%).
Production, Transportation and Moving Occupations by Sex
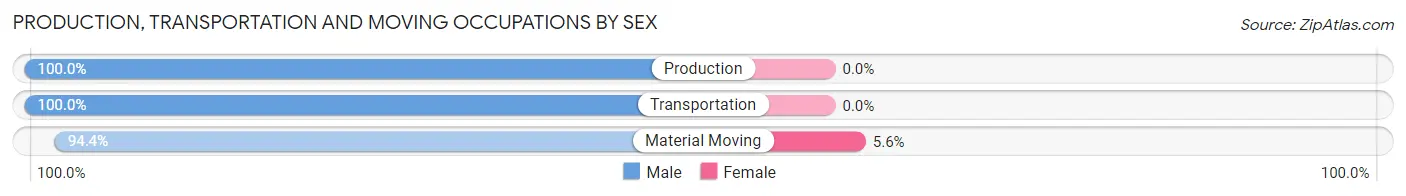
| Occupation | Male | Female |
| Production | 13 (100.0%) | 0 (0.0%) |
| Transportation | 7 (100.0%) | 0 (0.0%) |
| Material Moving | 34 (94.4%) | 2 (5.6%) |
| Total (Category) | 54 (96.4%) | 2 (3.6%) |
| Total (Overall) | 115 (63.9%) | 65 (36.1%) |
Employment Industries by Sex in Richfield
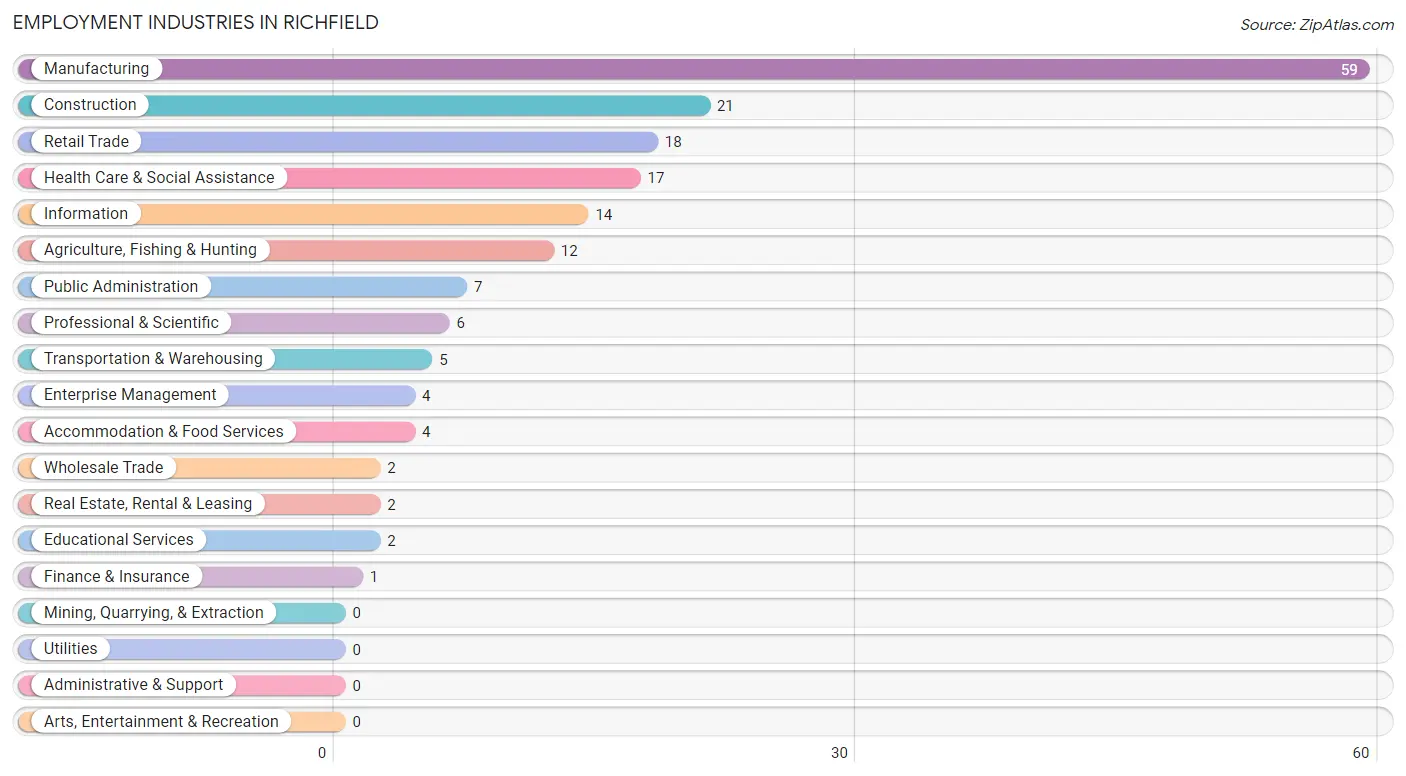
Employment Industries in Richfield
The major employment industries in Richfield include Manufacturing (59 | 32.8%), Construction (21 | 11.7%), Retail Trade (18 | 10.0%), Health Care & Social Assistance (17 | 9.4%), and Information (14 | 7.8%).
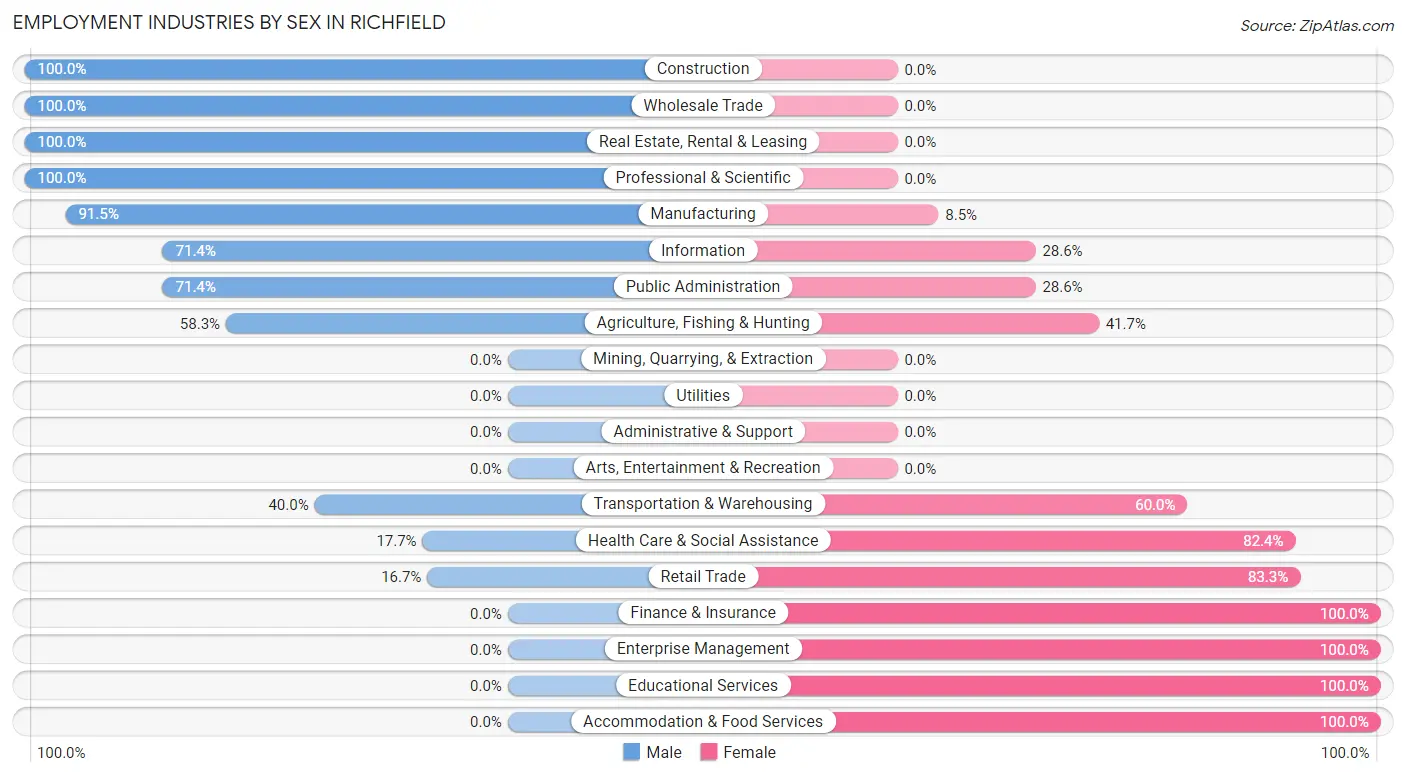
Employment Industries by Sex in Richfield
The Richfield industries that see more men than women are Construction (100.0%), Wholesale Trade (100.0%), and Real Estate, Rental & Leasing (100.0%), whereas the industries that tend to have a higher number of women are Finance & Insurance (100.0%), Enterprise Management (100.0%), and Educational Services (100.0%).
| Industry | Male | Female |
| Agriculture, Fishing & Hunting | 7 (58.3%) | 5 (41.7%) |
| Mining, Quarrying, & Extraction | 0 (0.0%) | 0 (0.0%) |
| Construction | 21 (100.0%) | 0 (0.0%) |
| Manufacturing | 54 (91.5%) | 5 (8.5%) |
| Wholesale Trade | 2 (100.0%) | 0 (0.0%) |
| Retail Trade | 3 (16.7%) | 15 (83.3%) |
| Transportation & Warehousing | 2 (40.0%) | 3 (60.0%) |
| Utilities | 0 (0.0%) | 0 (0.0%) |
| Information | 10 (71.4%) | 4 (28.6%) |
| Finance & Insurance | 0 (0.0%) | 1 (100.0%) |
| Real Estate, Rental & Leasing | 2 (100.0%) | 0 (0.0%) |
| Professional & Scientific | 6 (100.0%) | 0 (0.0%) |
| Enterprise Management | 0 (0.0%) | 4 (100.0%) |
| Administrative & Support | 0 (0.0%) | 0 (0.0%) |
| Educational Services | 0 (0.0%) | 2 (100.0%) |
| Health Care & Social Assistance | 3 (17.6%) | 14 (82.4%) |
| Arts, Entertainment & Recreation | 0 (0.0%) | 0 (0.0%) |
| Accommodation & Food Services | 0 (0.0%) | 4 (100.0%) |
| Public Administration | 5 (71.4%) | 2 (28.6%) |
| Total | 115 (63.9%) | 65 (36.1%) |
Education in Richfield
School Enrollment in Richfield
The most common levels of schooling among the 42 students in Richfield are high school (11 | 26.2%), elementary school (7 | 16.7%), and college / undergraduate (7 | 16.7%).
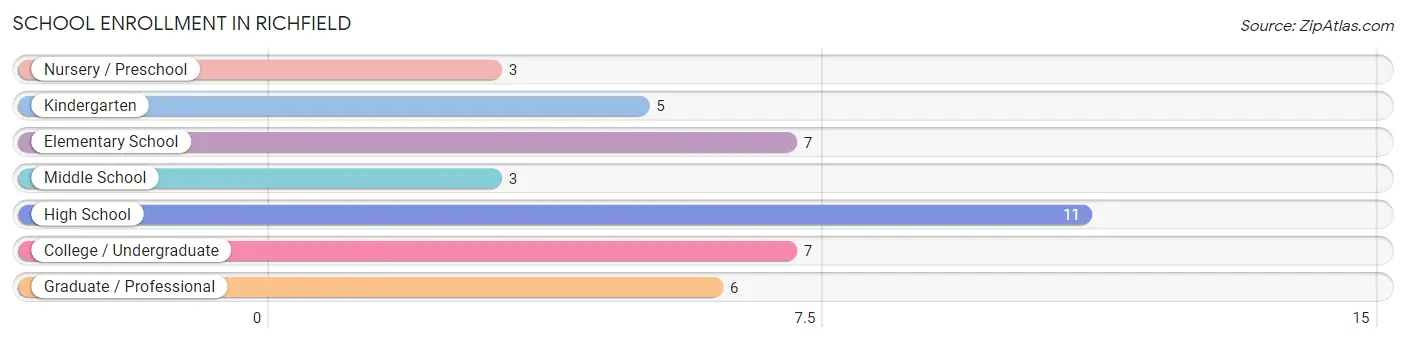
| School Level | # Students | % Students |
| Nursery / Preschool | 3 | 7.1% |
| Kindergarten | 5 | 11.9% |
| Elementary School | 7 | 16.7% |
| Middle School | 3 | 7.1% |
| High School | 11 | 26.2% |
| College / Undergraduate | 7 | 16.7% |
| Graduate / Professional | 6 | 14.3% |
| Total | 42 | 100.0% |
School Enrollment by Age by Funding Source in Richfield
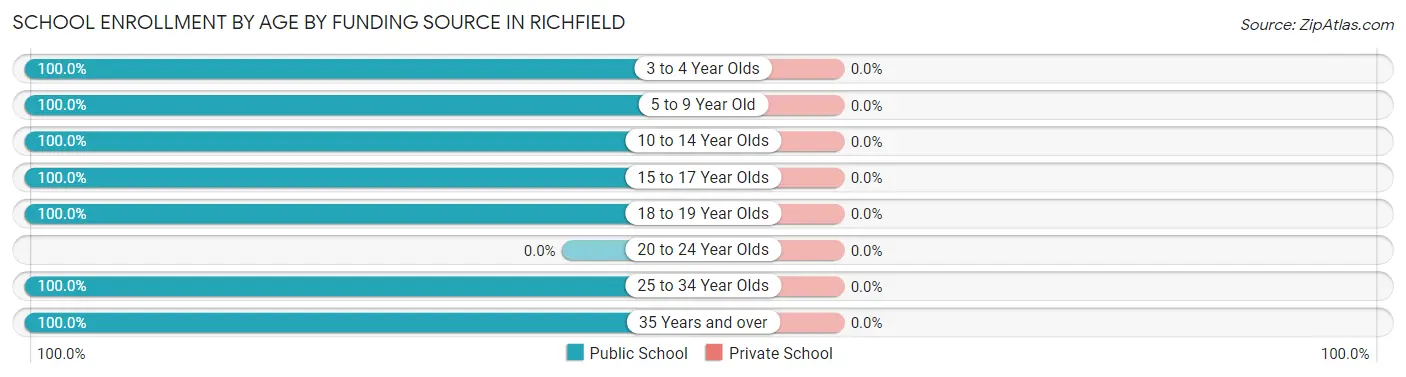
| Age Bracket | Public School | Private School |
| 3 to 4 Year Olds | 3 (100.0%) | 0 (0.0%) |
| 5 to 9 Year Old | 7 (100.0%) | 0 (0.0%) |
| 10 to 14 Year Olds | 8 (100.0%) | 0 (0.0%) |
| 15 to 17 Year Olds | 11 (100.0%) | 0 (0.0%) |
| 18 to 19 Year Olds | 2 (100.0%) | 0 (0.0%) |
| 20 to 24 Year Olds | 0 (0.0%) | 0 (0.0%) |
| 25 to 34 Year Olds | 5 (100.0%) | 0 (0.0%) |
| 35 Years and over | 6 (100.0%) | 0 (0.0%) |
| Total | 42 (100.0%) | 0 (0.0%) |
Educational Attainment by Field of Study in Richfield
Education (13 | 43.3%), psychology (6 | 20.0%), science & technology (6 | 20.0%), communications (4 | 13.3%), and business (1 | 3.3%) are the most common fields of study among 30 individuals in Richfield who have obtained a bachelor's degree or higher.
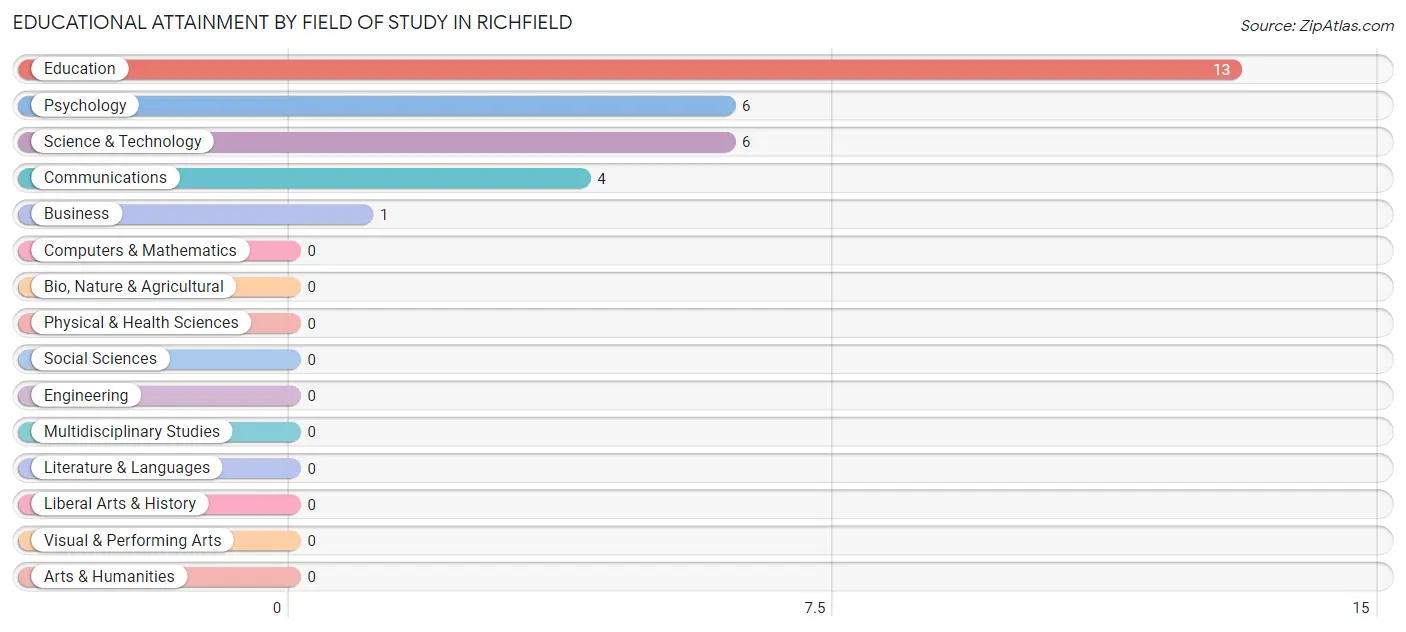
| Field of Study | # Graduates | % Graduates |
| Computers & Mathematics | 0 | 0.0% |
| Bio, Nature & Agricultural | 0 | 0.0% |
| Physical & Health Sciences | 0 | 0.0% |
| Psychology | 6 | 20.0% |
| Social Sciences | 0 | 0.0% |
| Engineering | 0 | 0.0% |
| Multidisciplinary Studies | 0 | 0.0% |
| Science & Technology | 6 | 20.0% |
| Business | 1 | 3.3% |
| Education | 13 | 43.3% |
| Literature & Languages | 0 | 0.0% |
| Liberal Arts & History | 0 | 0.0% |
| Visual & Performing Arts | 0 | 0.0% |
| Communications | 4 | 13.3% |
| Arts & Humanities | 0 | 0.0% |
| Total | 30 | 100.0% |
Transportation & Commute in Richfield
Vehicle Availability by Sex in Richfield
The most prevalent vehicle ownership categories in Richfield are males with 2 vehicles (74, accounting for 64.3%) and females with 2 vehicles (27, making up 113.9%).
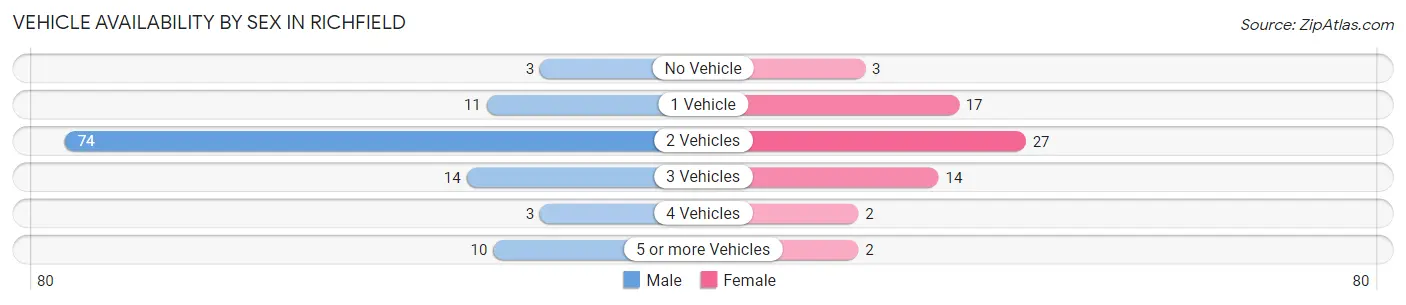
| Vehicles Available | Male | Female |
| No Vehicle | 3 (2.6%) | 3 (4.6%) |
| 1 Vehicle | 11 (9.6%) | 17 (26.2%) |
| 2 Vehicles | 74 (64.3%) | 27 (41.5%) |
| 3 Vehicles | 14 (12.2%) | 14 (21.5%) |
| 4 Vehicles | 3 (2.6%) | 2 (3.1%) |
| 5 or more Vehicles | 10 (8.7%) | 2 (3.1%) |
| Total | 115 (100.0%) | 65 (100.0%) |
Commute Time in Richfield
The most frequently occuring commute durations in Richfield are 20 to 24 minutes (51 commuters, 30.9%), 25 to 29 minutes (21 commuters, 12.7%), and 60 to 89 minutes (21 commuters, 12.7%).
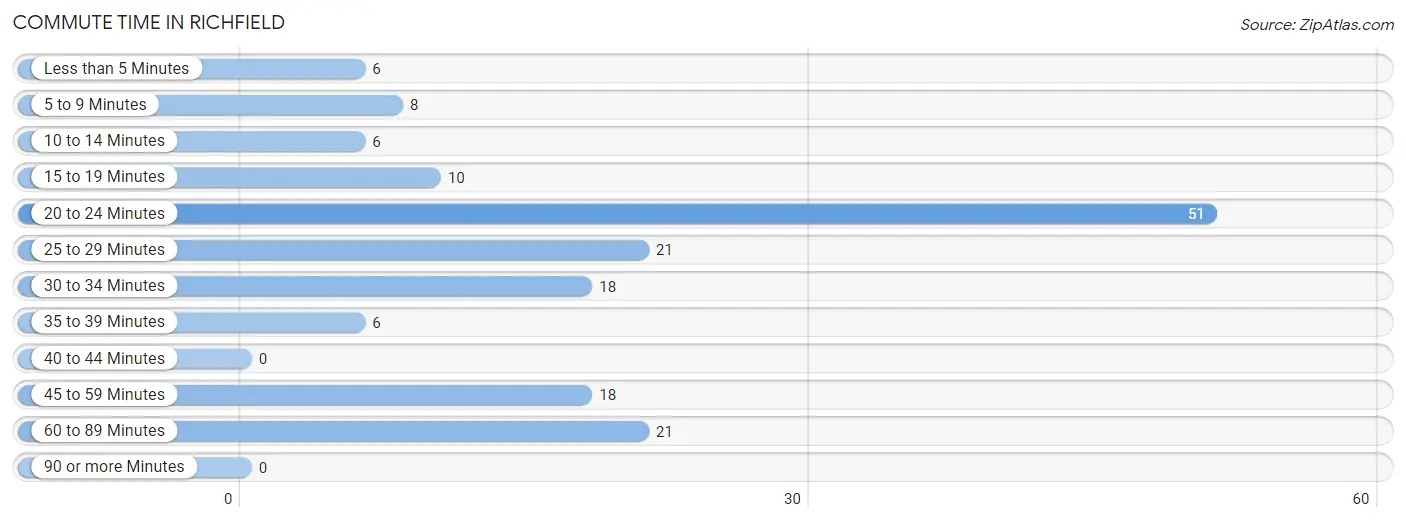
| Commute Time | # Commuters | % Commuters |
| Less than 5 Minutes | 6 | 3.6% |
| 5 to 9 Minutes | 8 | 4.9% |
| 10 to 14 Minutes | 6 | 3.6% |
| 15 to 19 Minutes | 10 | 6.1% |
| 20 to 24 Minutes | 51 | 30.9% |
| 25 to 29 Minutes | 21 | 12.7% |
| 30 to 34 Minutes | 18 | 10.9% |
| 35 to 39 Minutes | 6 | 3.6% |
| 40 to 44 Minutes | 0 | 0.0% |
| 45 to 59 Minutes | 18 | 10.9% |
| 60 to 89 Minutes | 21 | 12.7% |
| 90 or more Minutes | 0 | 0.0% |
Commute Time by Sex in Richfield
The most common commute times in Richfield are 20 to 24 minutes (51 commuters, 44.4%) for males and 45 to 59 minutes (11 commuters, 22.0%) for females.
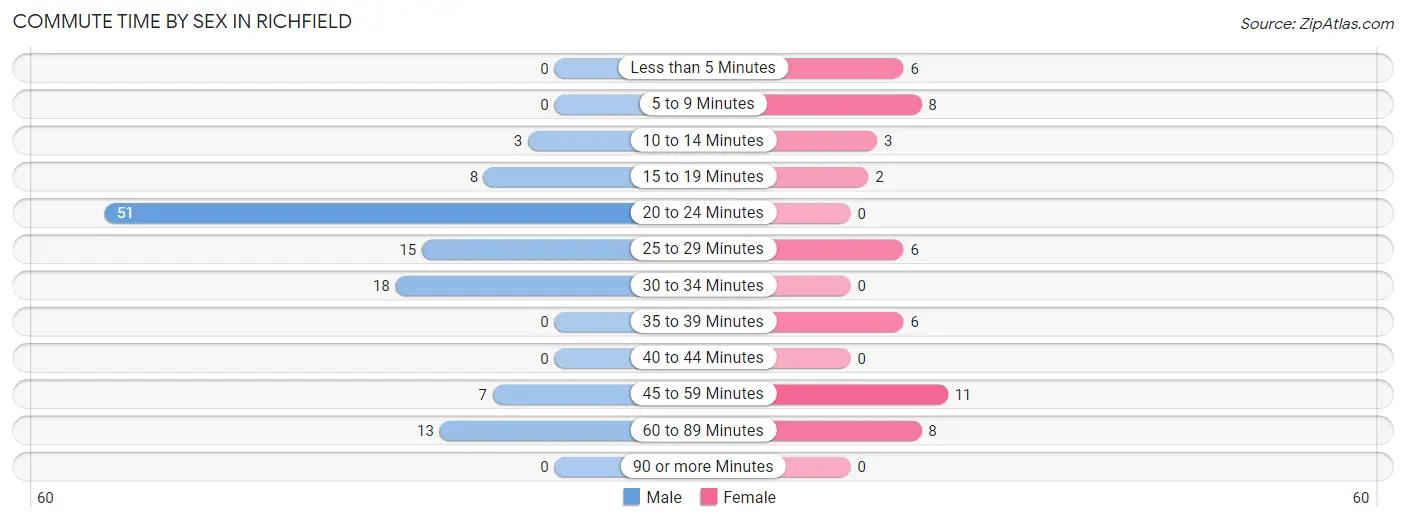
| Commute Time | Male | Female |
| Less than 5 Minutes | 0 (0.0%) | 6 (12.0%) |
| 5 to 9 Minutes | 0 (0.0%) | 8 (16.0%) |
| 10 to 14 Minutes | 3 (2.6%) | 3 (6.0%) |
| 15 to 19 Minutes | 8 (7.0%) | 2 (4.0%) |
| 20 to 24 Minutes | 51 (44.4%) | 0 (0.0%) |
| 25 to 29 Minutes | 15 (13.0%) | 6 (12.0%) |
| 30 to 34 Minutes | 18 (15.7%) | 0 (0.0%) |
| 35 to 39 Minutes | 0 (0.0%) | 6 (12.0%) |
| 40 to 44 Minutes | 0 (0.0%) | 0 (0.0%) |
| 45 to 59 Minutes | 7 (6.1%) | 11 (22.0%) |
| 60 to 89 Minutes | 13 (11.3%) | 8 (16.0%) |
| 90 or more Minutes | 0 (0.0%) | 0 (0.0%) |
Time of Departure to Work by Sex in Richfield
The most frequent times of departure to work in Richfield are 4:00 PM to 11:59 PM (34, 29.6%) for males and 7:30 AM to 7:59 AM (25, 50.0%) for females.
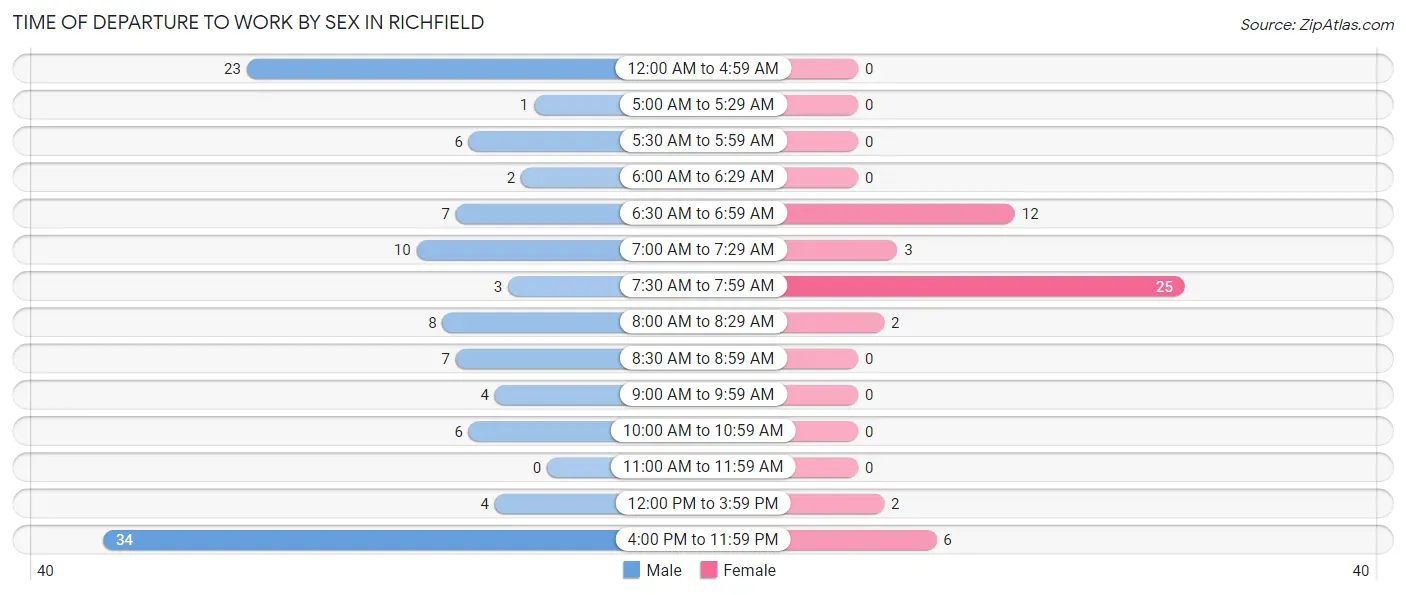
| Time of Departure | Male | Female |
| 12:00 AM to 4:59 AM | 23 (20.0%) | 0 (0.0%) |
| 5:00 AM to 5:29 AM | 1 (0.9%) | 0 (0.0%) |
| 5:30 AM to 5:59 AM | 6 (5.2%) | 0 (0.0%) |
| 6:00 AM to 6:29 AM | 2 (1.7%) | 0 (0.0%) |
| 6:30 AM to 6:59 AM | 7 (6.1%) | 12 (24.0%) |
| 7:00 AM to 7:29 AM | 10 (8.7%) | 3 (6.0%) |
| 7:30 AM to 7:59 AM | 3 (2.6%) | 25 (50.0%) |
| 8:00 AM to 8:29 AM | 8 (7.0%) | 2 (4.0%) |
| 8:30 AM to 8:59 AM | 7 (6.1%) | 0 (0.0%) |
| 9:00 AM to 9:59 AM | 4 (3.5%) | 0 (0.0%) |
| 10:00 AM to 10:59 AM | 6 (5.2%) | 0 (0.0%) |
| 11:00 AM to 11:59 AM | 0 (0.0%) | 0 (0.0%) |
| 12:00 PM to 3:59 PM | 4 (3.5%) | 2 (4.0%) |
| 4:00 PM to 11:59 PM | 34 (29.6%) | 6 (12.0%) |
| Total | 115 (100.0%) | 50 (100.0%) |
Housing Occupancy in Richfield
Occupancy by Ownership in Richfield
Of the total 194 dwellings in Richfield, owner-occupied units account for 108 (55.7%), while renter-occupied units make up 86 (44.3%).
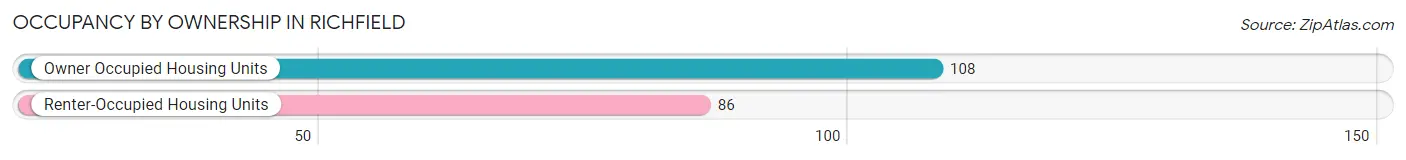
| Occupancy | # Housing Units | % Housing Units |
| Owner Occupied Housing Units | 108 | 55.7% |
| Renter-Occupied Housing Units | 86 | 44.3% |
| Total Occupied Housing Units | 194 | 100.0% |
Occupancy by Household Size in Richfield
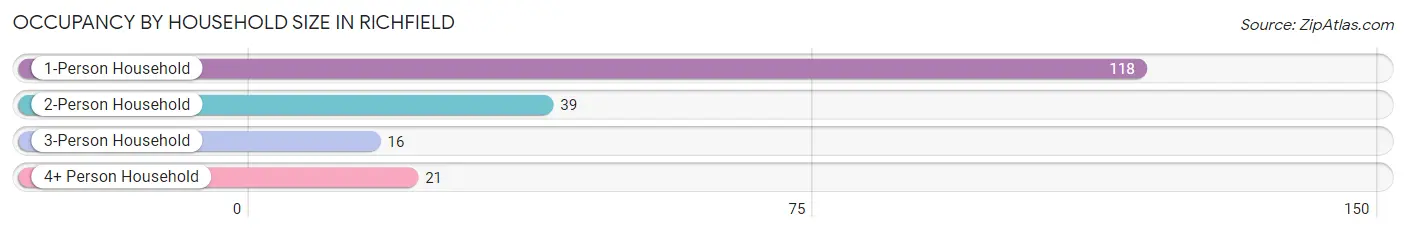
| Household Size | # Housing Units | % Housing Units |
| 1-Person Household | 118 | 60.8% |
| 2-Person Household | 39 | 20.1% |
| 3-Person Household | 16 | 8.3% |
| 4+ Person Household | 21 | 10.8% |
| Total Housing Units | 194 | 100.0% |
Occupancy by Ownership by Household Size in Richfield
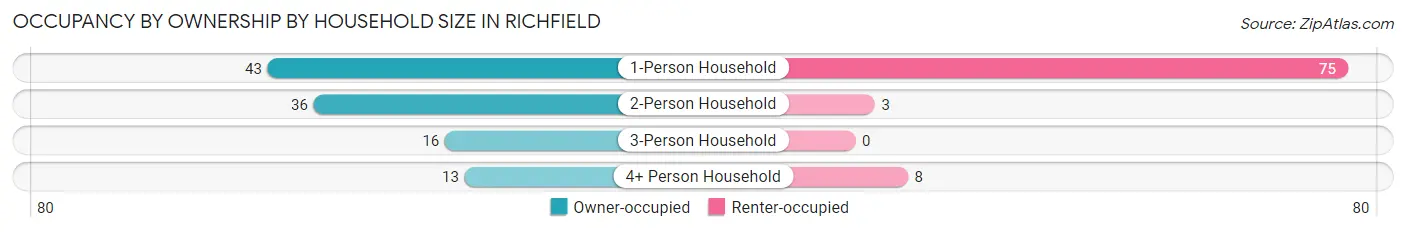
| Household Size | Owner-occupied | Renter-occupied |
| 1-Person Household | 43 (36.4%) | 75 (63.6%) |
| 2-Person Household | 36 (92.3%) | 3 (7.7%) |
| 3-Person Household | 16 (100.0%) | 0 (0.0%) |
| 4+ Person Household | 13 (61.9%) | 8 (38.1%) |
| Total Housing Units | 108 (55.7%) | 86 (44.3%) |
Occupancy by Educational Attainment in Richfield
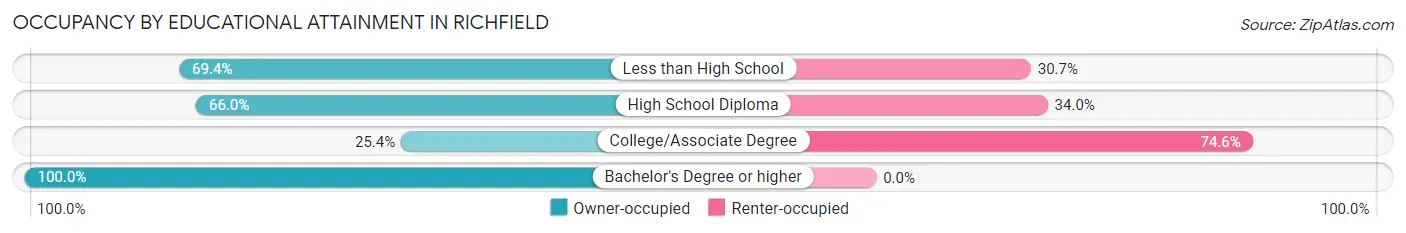
| Household Size | Owner-occupied | Renter-occupied |
| Less than High School | 43 (69.4%) | 19 (30.6%) |
| High School Diploma | 33 (66.0%) | 17 (34.0%) |
| College/Associate Degree | 17 (25.4%) | 50 (74.6%) |
| Bachelor's Degree or higher | 15 (100.0%) | 0 (0.0%) |
Occupancy by Age of Householder in Richfield
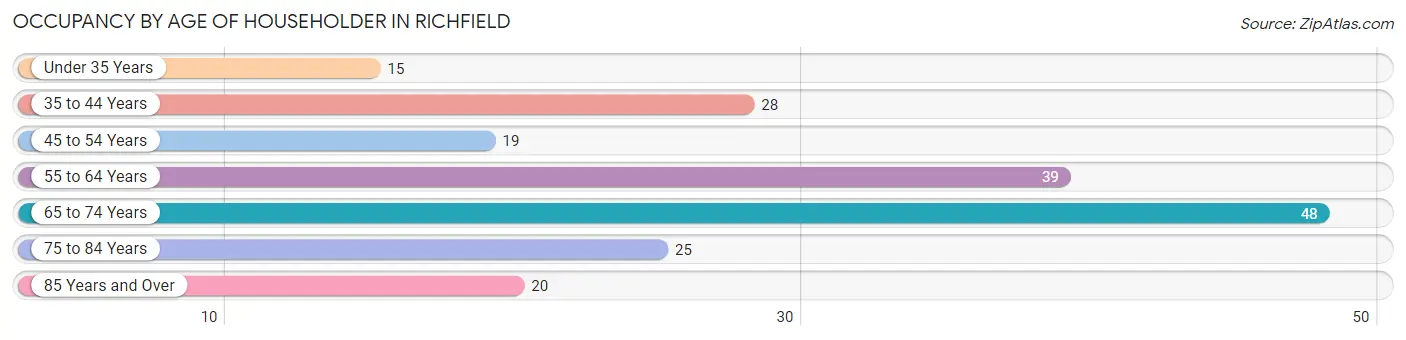
| Age Bracket | # Households | % Households |
| Under 35 Years | 15 | 7.7% |
| 35 to 44 Years | 28 | 14.4% |
| 45 to 54 Years | 19 | 9.8% |
| 55 to 64 Years | 39 | 20.1% |
| 65 to 74 Years | 48 | 24.7% |
| 75 to 84 Years | 25 | 12.9% |
| 85 Years and Over | 20 | 10.3% |
| Total | 194 | 100.0% |
Housing Finances in Richfield
Median Income by Occupancy in Richfield
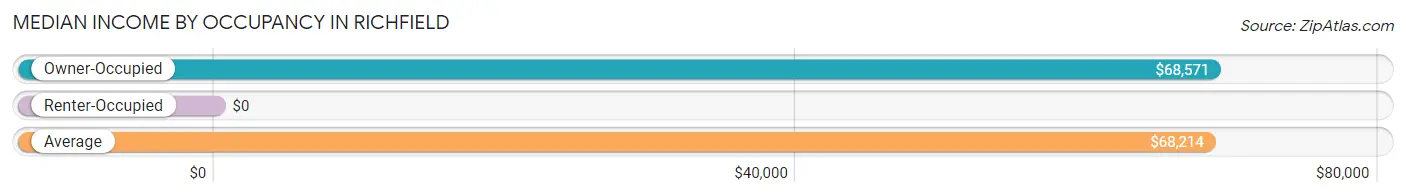
| Occupancy Type | # Households | Median Income |
| Owner-Occupied | 108 (55.7%) | $68,571 |
| Renter-Occupied | 86 (44.3%) | $0 |
| Average | 194 (100.0%) | $68,214 |
Occupancy by Householder Income Bracket in Richfield
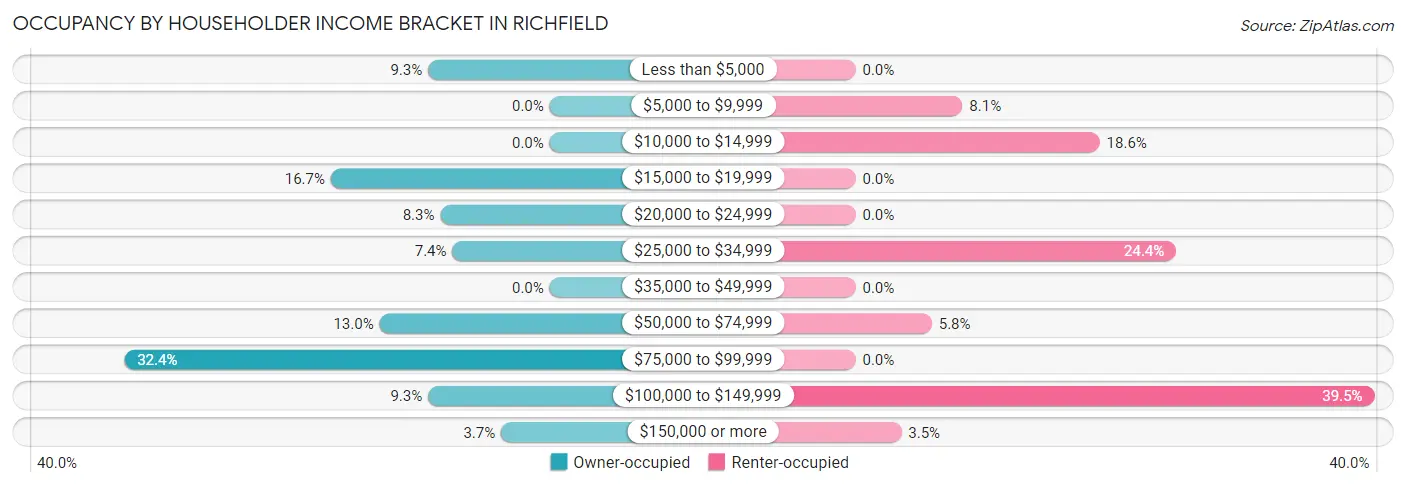
| Income Bracket | Owner-occupied | Renter-occupied |
| Less than $5,000 | 10 (9.3%) | 0 (0.0%) |
| $5,000 to $9,999 | 0 (0.0%) | 7 (8.1%) |
| $10,000 to $14,999 | 0 (0.0%) | 16 (18.6%) |
| $15,000 to $19,999 | 18 (16.7%) | 0 (0.0%) |
| $20,000 to $24,999 | 9 (8.3%) | 0 (0.0%) |
| $25,000 to $34,999 | 8 (7.4%) | 21 (24.4%) |
| $35,000 to $49,999 | 0 (0.0%) | 0 (0.0%) |
| $50,000 to $74,999 | 14 (13.0%) | 5 (5.8%) |
| $75,000 to $99,999 | 35 (32.4%) | 0 (0.0%) |
| $100,000 to $149,999 | 10 (9.3%) | 34 (39.5%) |
| $150,000 or more | 4 (3.7%) | 3 (3.5%) |
| Total | 108 (100.0%) | 86 (100.0%) |
Monthly Housing Cost Tiers in Richfield
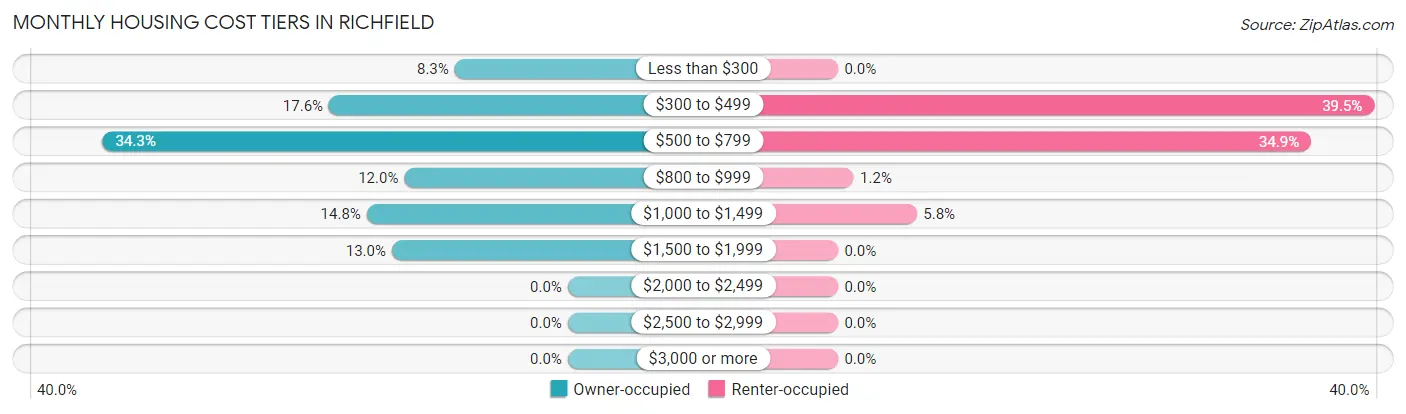
| Monthly Cost | Owner-occupied | Renter-occupied |
| Less than $300 | 9 (8.3%) | 0 (0.0%) |
| $300 to $499 | 19 (17.6%) | 34 (39.5%) |
| $500 to $799 | 37 (34.3%) | 30 (34.9%) |
| $800 to $999 | 13 (12.0%) | 1 (1.2%) |
| $1,000 to $1,499 | 16 (14.8%) | 5 (5.8%) |
| $1,500 to $1,999 | 14 (13.0%) | 0 (0.0%) |
| $2,000 to $2,499 | 0 (0.0%) | 0 (0.0%) |
| $2,500 to $2,999 | 0 (0.0%) | 0 (0.0%) |
| $3,000 or more | 0 (0.0%) | 0 (0.0%) |
| Total | 108 (100.0%) | 86 (100.0%) |
Physical Housing Characteristics in Richfield
Housing Structures in Richfield
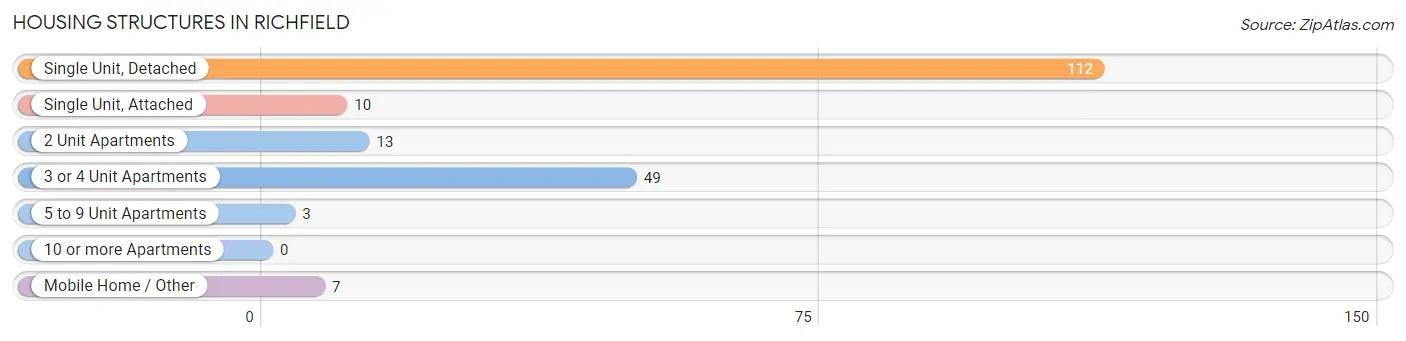
| Structure Type | # Housing Units | % Housing Units |
| Single Unit, Detached | 112 | 57.7% |
| Single Unit, Attached | 10 | 5.1% |
| 2 Unit Apartments | 13 | 6.7% |
| 3 or 4 Unit Apartments | 49 | 25.3% |
| 5 to 9 Unit Apartments | 3 | 1.5% |
| 10 or more Apartments | 0 | 0.0% |
| Mobile Home / Other | 7 | 3.6% |
| Total | 194 | 100.0% |
Housing Structures by Occupancy in Richfield
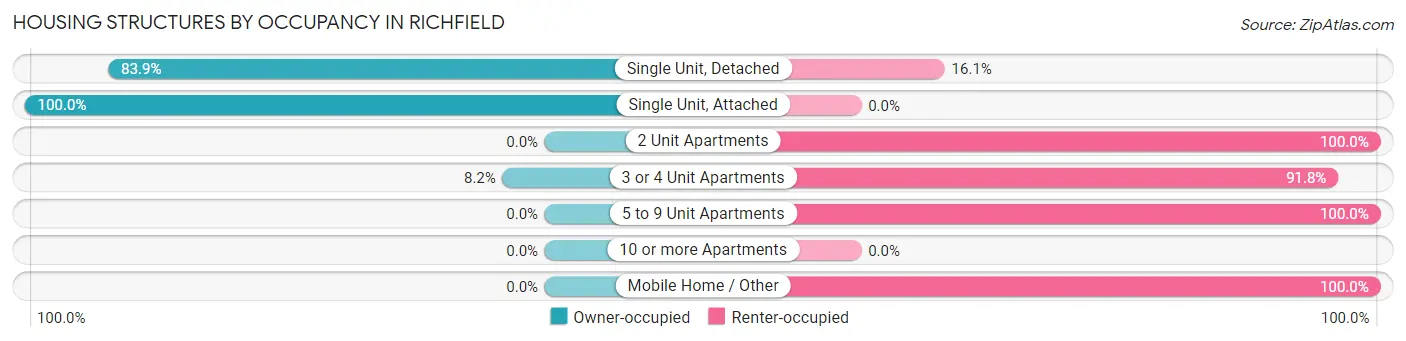
| Structure Type | Owner-occupied | Renter-occupied |
| Single Unit, Detached | 94 (83.9%) | 18 (16.1%) |
| Single Unit, Attached | 10 (100.0%) | 0 (0.0%) |
| 2 Unit Apartments | 0 (0.0%) | 13 (100.0%) |
| 3 or 4 Unit Apartments | 4 (8.2%) | 45 (91.8%) |
| 5 to 9 Unit Apartments | 0 (0.0%) | 3 (100.0%) |
| 10 or more Apartments | 0 (0.0%) | 0 (0.0%) |
| Mobile Home / Other | 0 (0.0%) | 7 (100.0%) |
| Total | 108 (55.7%) | 86 (44.3%) |
Housing Structures by Number of Rooms in Richfield
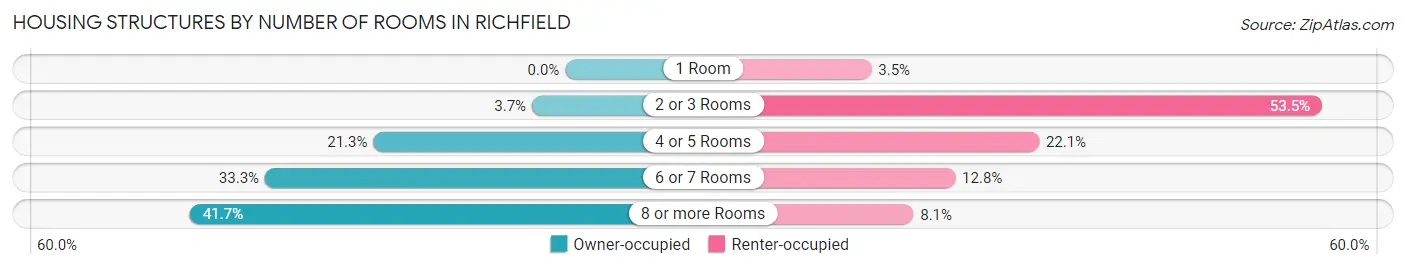
| Number of Rooms | Owner-occupied | Renter-occupied |
| 1 Room | 0 (0.0%) | 3 (3.5%) |
| 2 or 3 Rooms | 4 (3.7%) | 46 (53.5%) |
| 4 or 5 Rooms | 23 (21.3%) | 19 (22.1%) |
| 6 or 7 Rooms | 36 (33.3%) | 11 (12.8%) |
| 8 or more Rooms | 45 (41.7%) | 7 (8.1%) |
| Total | 108 (100.0%) | 86 (100.0%) |
Housing Structure by Heating Type in Richfield
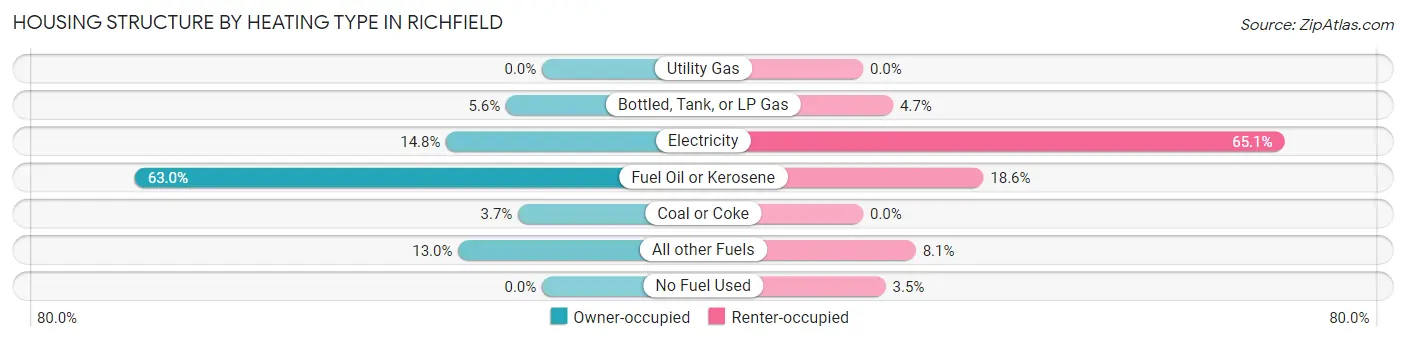
| Heating Type | Owner-occupied | Renter-occupied |
| Utility Gas | 0 (0.0%) | 0 (0.0%) |
| Bottled, Tank, or LP Gas | 6 (5.6%) | 4 (4.6%) |
| Electricity | 16 (14.8%) | 56 (65.1%) |
| Fuel Oil or Kerosene | 68 (63.0%) | 16 (18.6%) |
| Coal or Coke | 4 (3.7%) | 0 (0.0%) |
| All other Fuels | 14 (13.0%) | 7 (8.1%) |
| No Fuel Used | 0 (0.0%) | 3 (3.5%) |
| Total | 108 (100.0%) | 86 (100.0%) |
Household Vehicle Usage in Richfield
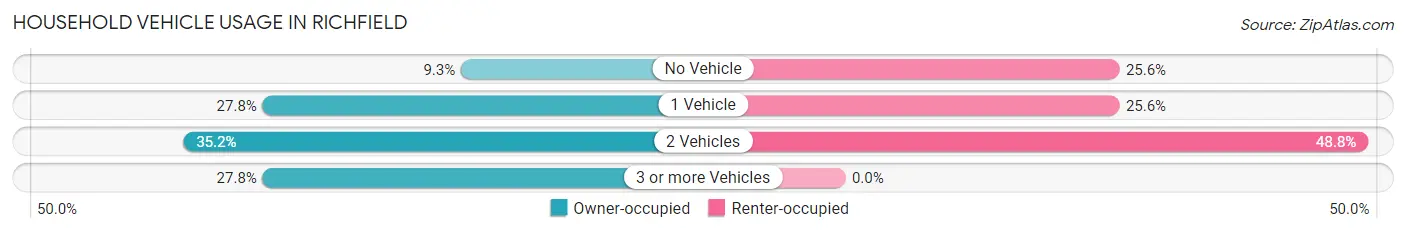
| Vehicles per Household | Owner-occupied | Renter-occupied |
| No Vehicle | 10 (9.3%) | 22 (25.6%) |
| 1 Vehicle | 30 (27.8%) | 22 (25.6%) |
| 2 Vehicles | 38 (35.2%) | 42 (48.8%) |
| 3 or more Vehicles | 30 (27.8%) | 0 (0.0%) |
| Total | 108 (100.0%) | 86 (100.0%) |
Real Estate & Mortgages in Richfield
Real Estate and Mortgage Overview in Richfield
| Characteristic | Without Mortgage | With Mortgage |
| Housing Units | 49 | 59 |
| Median Property Value | $162,500 | $117,200 |
| Median Household Income | - | - |
| Monthly Housing Costs | $507 | $0 |
| Real Estate Taxes | - | - |
Property Value by Mortgage Status in Richfield
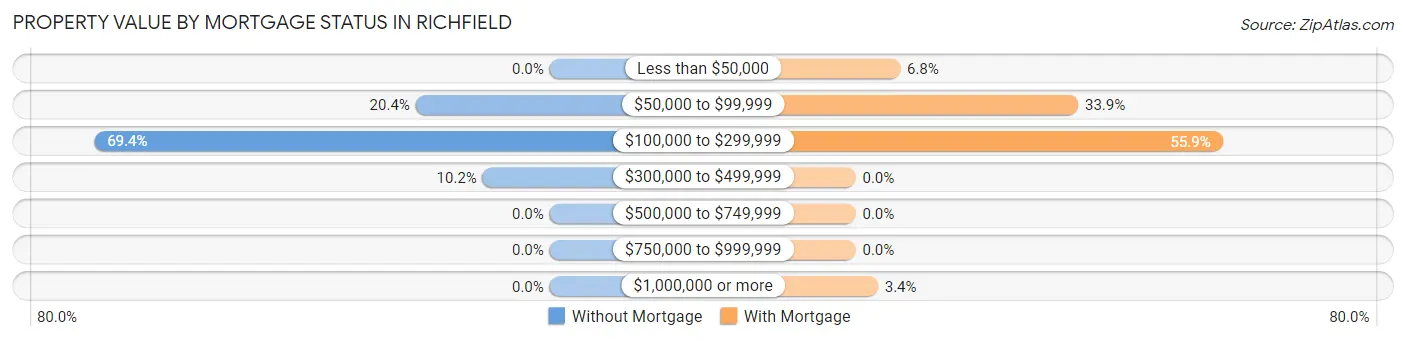
| Property Value | Without Mortgage | With Mortgage |
| Less than $50,000 | 0 (0.0%) | 4 (6.8%) |
| $50,000 to $99,999 | 10 (20.4%) | 20 (33.9%) |
| $100,000 to $299,999 | 34 (69.4%) | 33 (55.9%) |
| $300,000 to $499,999 | 5 (10.2%) | 0 (0.0%) |
| $500,000 to $749,999 | 0 (0.0%) | 0 (0.0%) |
| $750,000 to $999,999 | 0 (0.0%) | 0 (0.0%) |
| $1,000,000 or more | 0 (0.0%) | 2 (3.4%) |
| Total | 49 (100.0%) | 59 (100.0%) |
Household Income by Mortgage Status in Richfield
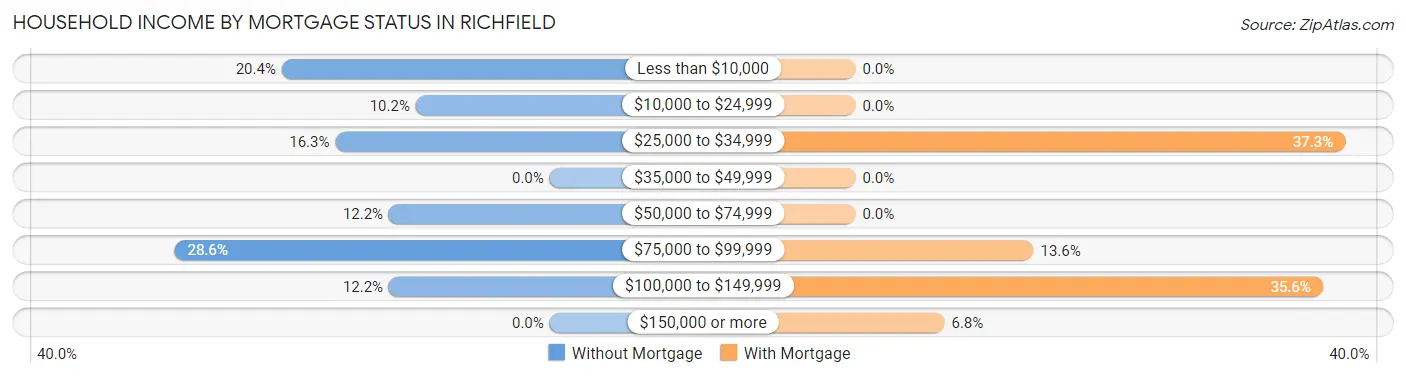
| Household Income | Without Mortgage | With Mortgage |
| Less than $10,000 | 10 (20.4%) | 0 (0.0%) |
| $10,000 to $24,999 | 5 (10.2%) | 0 (0.0%) |
| $25,000 to $34,999 | 8 (16.3%) | 22 (37.3%) |
| $35,000 to $49,999 | 0 (0.0%) | 0 (0.0%) |
| $50,000 to $74,999 | 6 (12.2%) | 0 (0.0%) |
| $75,000 to $99,999 | 14 (28.6%) | 8 (13.6%) |
| $100,000 to $149,999 | 6 (12.2%) | 21 (35.6%) |
| $150,000 or more | 0 (0.0%) | 4 (6.8%) |
| Total | 49 (100.0%) | 59 (100.0%) |
Property Value to Household Income Ratio in Richfield
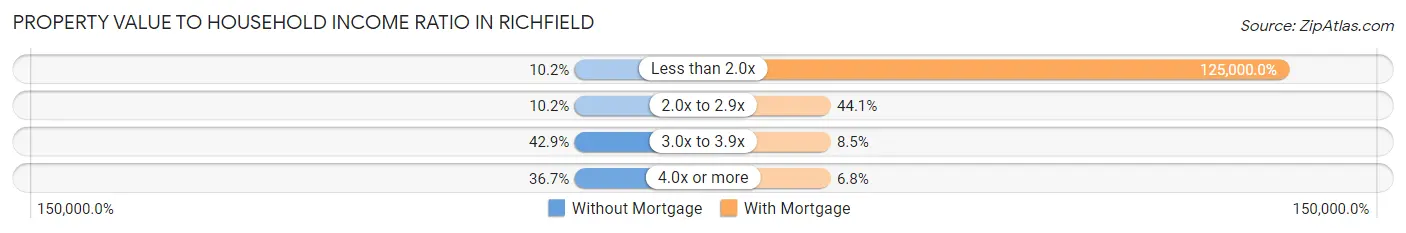
| Value-to-Income Ratio | Without Mortgage | With Mortgage |
| Less than 2.0x | 5 (10.2%) | 73,750 (125,000.0%) |
| 2.0x to 2.9x | 5 (10.2%) | 26 (44.1%) |
| 3.0x to 3.9x | 21 (42.9%) | 5 (8.5%) |
| 4.0x or more | 18 (36.7%) | 4 (6.8%) |
| Total | 49 (100.0%) | 59 (100.0%) |
Real Estate Taxes by Mortgage Status in Richfield
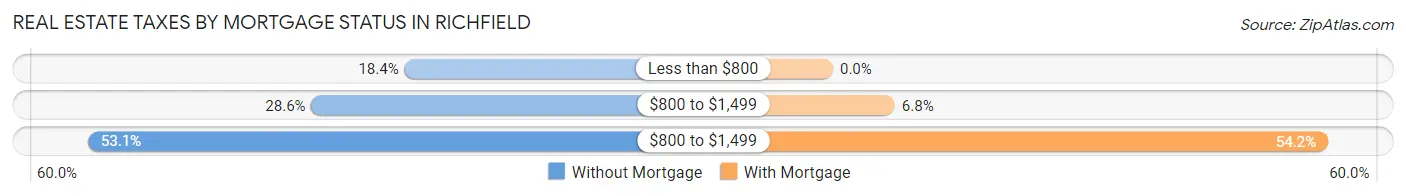
| Property Taxes | Without Mortgage | With Mortgage |
| Less than $800 | 9 (18.4%) | 0 (0.0%) |
| $800 to $1,499 | 14 (28.6%) | 4 (6.8%) |
| $800 to $1,499 | 26 (53.1%) | 32 (54.2%) |
| Total | 49 (100.0%) | 59 (100.0%) |
Health & Disability in Richfield
Health Insurance Coverage by Age in Richfield
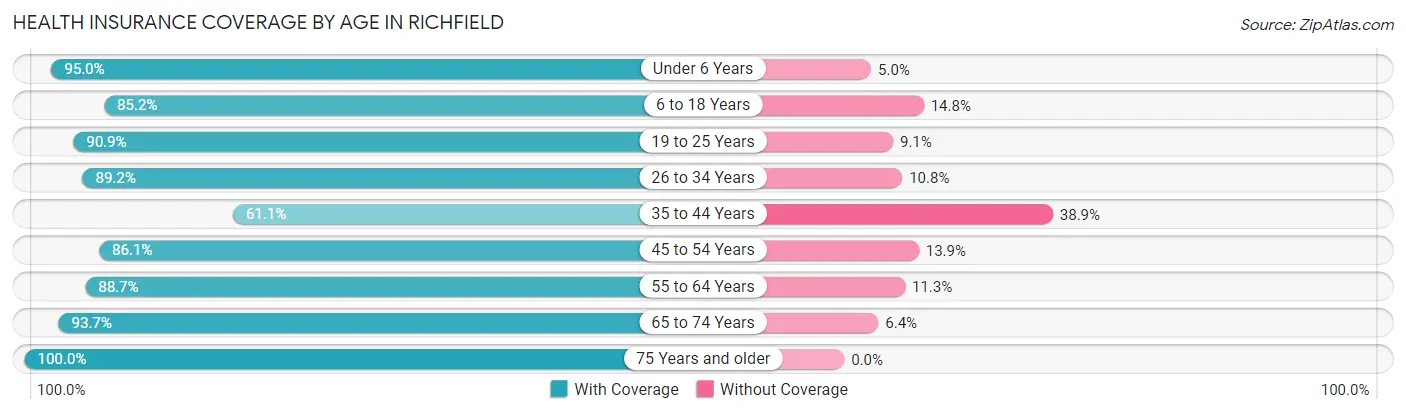
| Age Bracket | With Coverage | Without Coverage |
| Under 6 Years | 19 (95.0%) | 1 (5.0%) |
| 6 to 18 Years | 23 (85.2%) | 4 (14.8%) |
| 19 to 25 Years | 10 (90.9%) | 1 (9.1%) |
| 26 to 34 Years | 33 (89.2%) | 4 (10.8%) |
| 35 to 44 Years | 22 (61.1%) | 14 (38.9%) |
| 45 to 54 Years | 31 (86.1%) | 5 (13.9%) |
| 55 to 64 Years | 47 (88.7%) | 6 (11.3%) |
| 65 to 74 Years | 59 (93.6%) | 4 (6.4%) |
| 75 Years and older | 56 (100.0%) | 0 (0.0%) |
| Total | 300 (88.5%) | 39 (11.5%) |
Health Insurance Coverage by Citizenship Status in Richfield
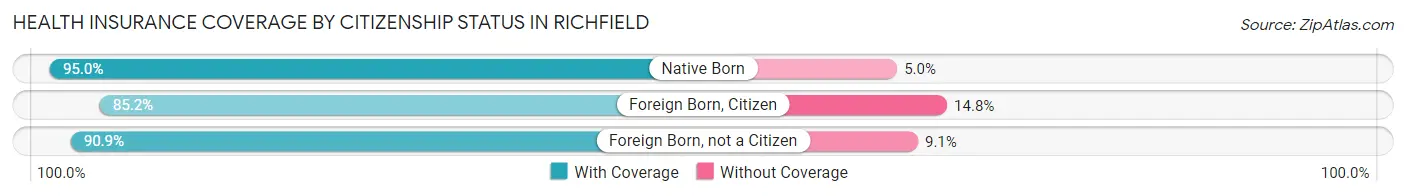
| Citizenship Status | With Coverage | Without Coverage |
| Native Born | 19 (95.0%) | 1 (5.0%) |
| Foreign Born, Citizen | 23 (85.2%) | 4 (14.8%) |
| Foreign Born, not a Citizen | 10 (90.9%) | 1 (9.1%) |
Health Insurance Coverage by Household Income in Richfield
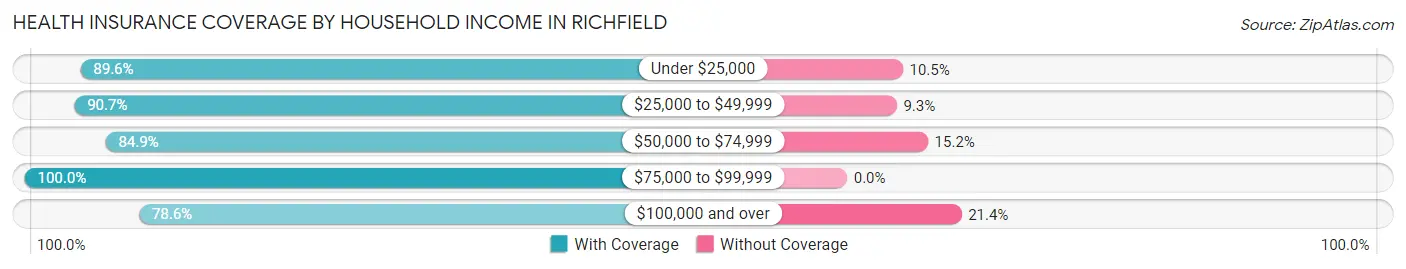
| Household Income | With Coverage | Without Coverage |
| Under $25,000 | 60 (89.5%) | 7 (10.4%) |
| $25,000 to $49,999 | 39 (90.7%) | 4 (9.3%) |
| $50,000 to $74,999 | 56 (84.9%) | 10 (15.1%) |
| $75,000 to $99,999 | 79 (100.0%) | 0 (0.0%) |
| $100,000 and over | 66 (78.6%) | 18 (21.4%) |
Public vs Private Health Insurance Coverage by Age in Richfield
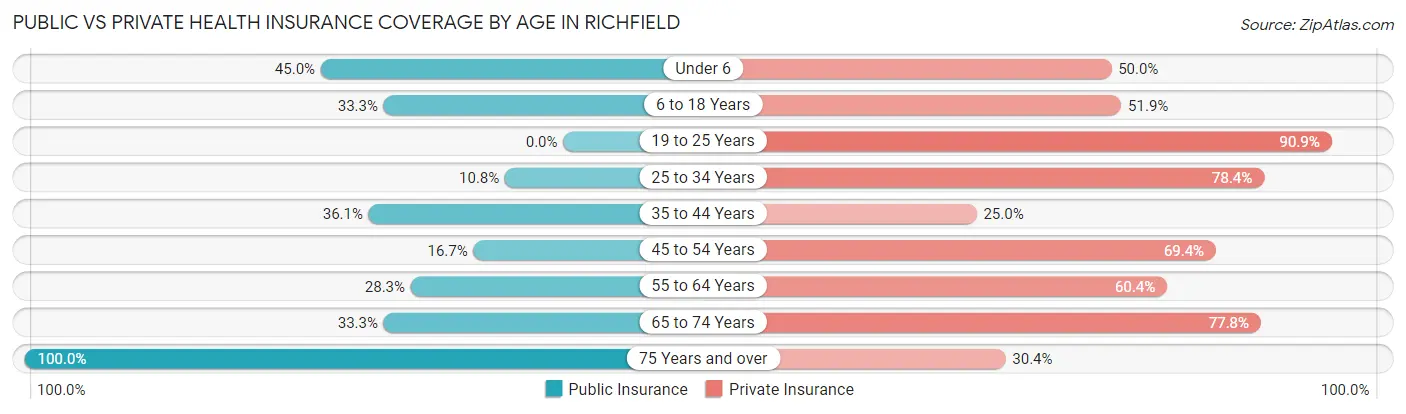
| Age Bracket | Public Insurance | Private Insurance |
| Under 6 | 9 (45.0%) | 10 (50.0%) |
| 6 to 18 Years | 9 (33.3%) | 14 (51.8%) |
| 19 to 25 Years | 0 (0.0%) | 10 (90.9%) |
| 25 to 34 Years | 4 (10.8%) | 29 (78.4%) |
| 35 to 44 Years | 13 (36.1%) | 9 (25.0%) |
| 45 to 54 Years | 6 (16.7%) | 25 (69.4%) |
| 55 to 64 Years | 15 (28.3%) | 32 (60.4%) |
| 65 to 74 Years | 21 (33.3%) | 49 (77.8%) |
| 75 Years and over | 56 (100.0%) | 17 (30.4%) |
| Total | 133 (39.2%) | 195 (57.5%) |
Disability Status by Sex by Age in Richfield
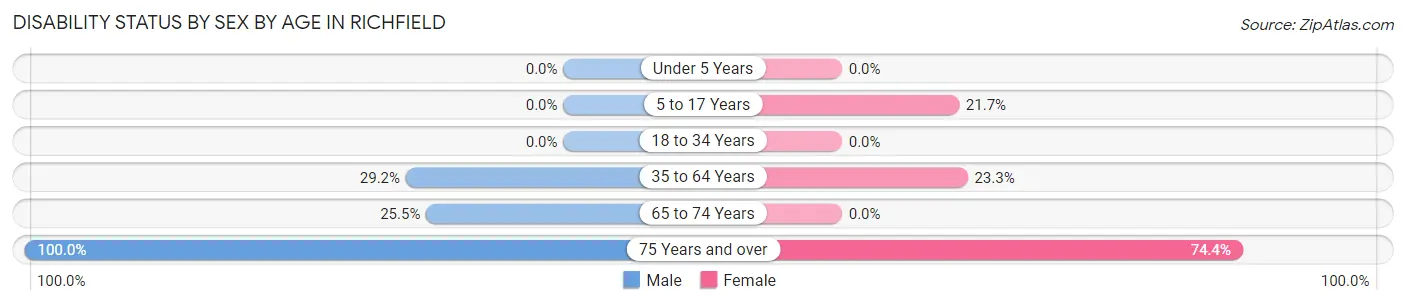
| Age Bracket | Male | Female |
| Under 5 Years | 0 (0.0%) | 0 (0.0%) |
| 5 to 17 Years | 0 (0.0%) | 5 (21.7%) |
| 18 to 34 Years | 0 (0.0%) | 0 (0.0%) |
| 35 to 64 Years | 19 (29.2%) | 14 (23.3%) |
| 65 to 74 Years | 14 (25.5%) | 0 (0.0%) |
| 75 Years and over | 13 (100.0%) | 32 (74.4%) |
Disability Class by Sex by Age in Richfield
Disability Class: Hearing Difficulty
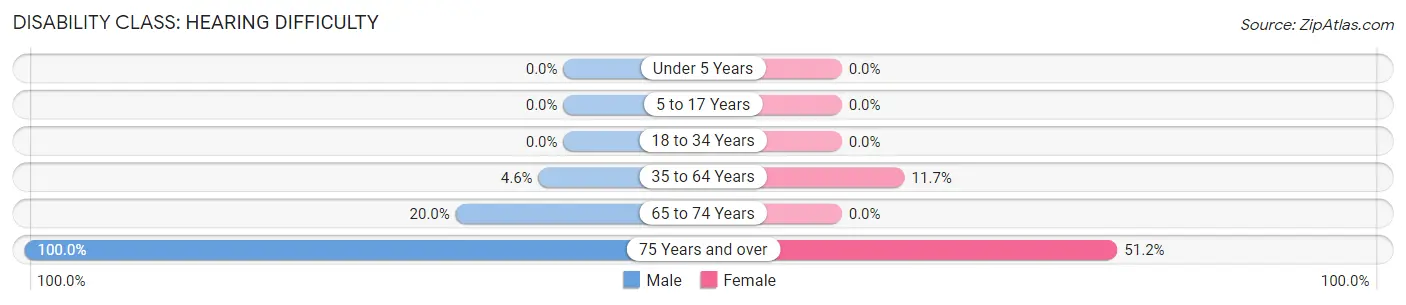
| Age Bracket | Male | Female |
| Under 5 Years | 0 (0.0%) | 0 (0.0%) |
| 5 to 17 Years | 0 (0.0%) | 0 (0.0%) |
| 18 to 34 Years | 0 (0.0%) | 0 (0.0%) |
| 35 to 64 Years | 3 (4.6%) | 7 (11.7%) |
| 65 to 74 Years | 11 (20.0%) | 0 (0.0%) |
| 75 Years and over | 13 (100.0%) | 22 (51.2%) |
Disability Class: Vision Difficulty
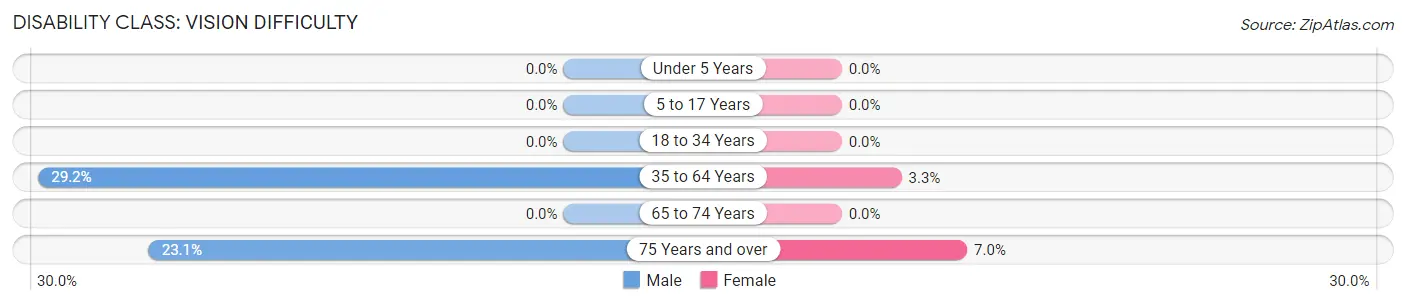
| Age Bracket | Male | Female |
| Under 5 Years | 0 (0.0%) | 0 (0.0%) |
| 5 to 17 Years | 0 (0.0%) | 0 (0.0%) |
| 18 to 34 Years | 0 (0.0%) | 0 (0.0%) |
| 35 to 64 Years | 19 (29.2%) | 2 (3.3%) |
| 65 to 74 Years | 0 (0.0%) | 0 (0.0%) |
| 75 Years and over | 3 (23.1%) | 3 (7.0%) |
Disability Class: Cognitive Difficulty
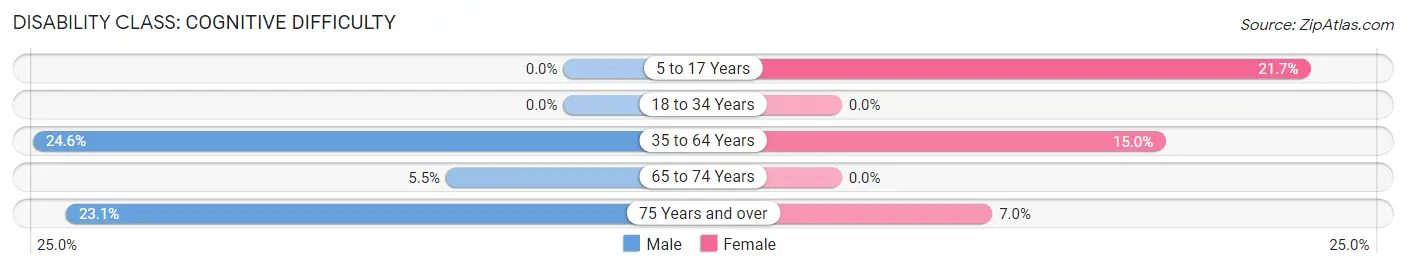
| Age Bracket | Male | Female |
| 5 to 17 Years | 0 (0.0%) | 5 (21.7%) |
| 18 to 34 Years | 0 (0.0%) | 0 (0.0%) |
| 35 to 64 Years | 16 (24.6%) | 9 (15.0%) |
| 65 to 74 Years | 3 (5.4%) | 0 (0.0%) |
| 75 Years and over | 3 (23.1%) | 3 (7.0%) |
Disability Class: Ambulatory Difficulty
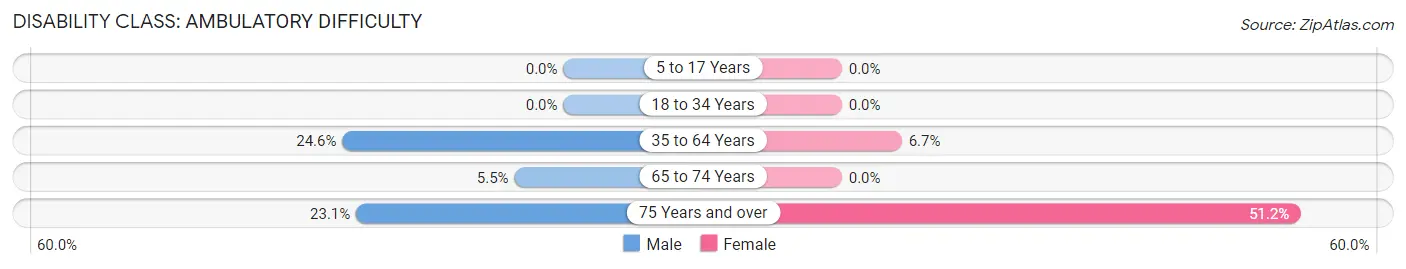
| Age Bracket | Male | Female |
| 5 to 17 Years | 0 (0.0%) | 0 (0.0%) |
| 18 to 34 Years | 0 (0.0%) | 0 (0.0%) |
| 35 to 64 Years | 16 (24.6%) | 4 (6.7%) |
| 65 to 74 Years | 3 (5.4%) | 0 (0.0%) |
| 75 Years and over | 3 (23.1%) | 22 (51.2%) |
Disability Class: Self-Care Difficulty
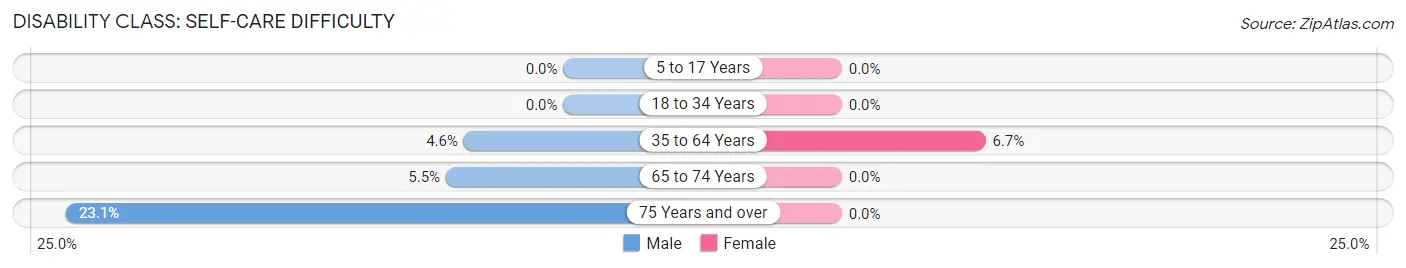
| Age Bracket | Male | Female |
| 5 to 17 Years | 0 (0.0%) | 0 (0.0%) |
| 18 to 34 Years | 0 (0.0%) | 0 (0.0%) |
| 35 to 64 Years | 3 (4.6%) | 4 (6.7%) |
| 65 to 74 Years | 3 (5.4%) | 0 (0.0%) |
| 75 Years and over | 3 (23.1%) | 0 (0.0%) |
Technology Access in Richfield
Computing Device Access in Richfield
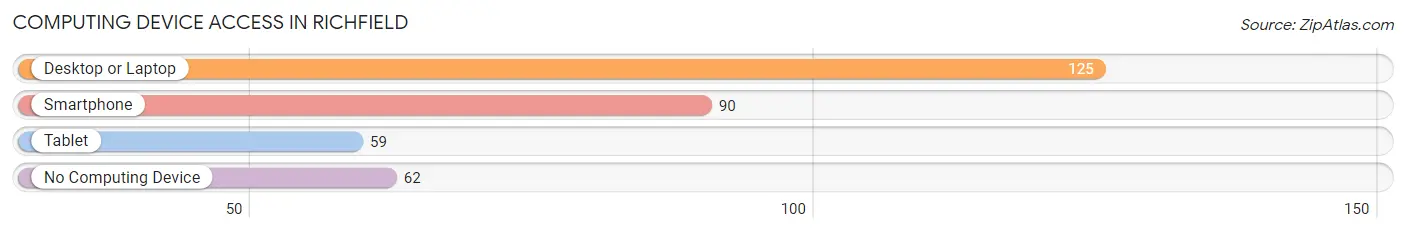
| Device Type | # Households | % Households |
| Desktop or Laptop | 125 | 64.4% |
| Smartphone | 90 | 46.4% |
| Tablet | 59 | 30.4% |
| No Computing Device | 62 | 32.0% |
| Total | 194 | 100.0% |
Internet Access in Richfield
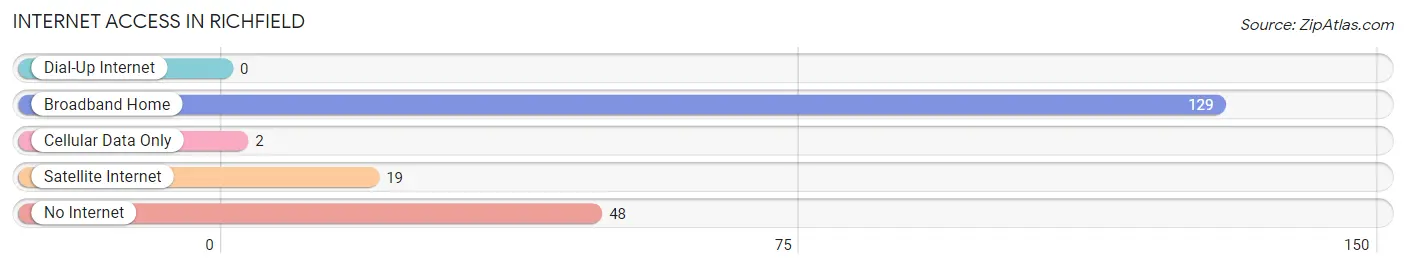
| Internet Type | # Households | % Households |
| Dial-Up Internet | 0 | 0.0% |
| Broadband Home | 129 | 66.5% |
| Cellular Data Only | 2 | 1.0% |
| Satellite Internet | 19 | 9.8% |
| No Internet | 48 | 24.7% |
| Total | 194 | 100.0% |
Richfield Summary
Richfield is a borough located in the state of Pennsylvania in the United States. It is situated in the western part of the state, in the Allegheny Mountains region. The borough is located in the county of Beaver, and is part of the Pittsburgh metropolitan area. As of the 2010 census, the population of Richfield was 1,845.
History
Richfield was first settled in 1795 by a group of settlers from New Jersey. The town was originally known as Richland, but the name was changed to Richfield in 1817. The town was officially incorporated in 1837.
In the early 19th century, Richfield was a small farming community. The town was known for its production of apples, and the local economy was largely based on agriculture. In the late 19th century, the town began to grow and develop as a result of the coal and oil industries. The town was home to several coal mines, and the oil industry was also important to the local economy.
Geography
Richfield is located in western Pennsylvania, in the Allegheny Mountains region. The borough is situated in the county of Beaver, and is part of the Pittsburgh metropolitan area. The borough is located at an elevation of 1,068 feet (326 m).
The borough covers an area of 1.2 square miles (3.2 km2), all of which is land. The borough is bordered by the boroughs of New Galilee to the north, Hookstown to the east, and Georgetown to the south. The borough is also bordered by the townships of Hanover to the west and Greene to the northwest.
Economy
Richfield’s economy is largely based on the coal and oil industries. The town is home to several coal mines, and the oil industry is also important to the local economy. The town is also home to several small businesses, including restaurants, retail stores, and service providers.
Demographics
As of the 2010 census, the population of Richfield was 1,845. The racial makeup of the borough was 97.3% White, 0.9% African American, 0.2% Native American, 0.2% Asian, 0.2% from other races, and 1.2% from two or more races. Hispanic or Latino of any race were 0.7% of the population.
The median household income in Richfield was $41,250, and the median family income was $50,000. The per capita income for the borough was $20,845. About 8.3% of families and 10.2% of the population were below the poverty line, including 14.3% of those under age 18 and 6.2% of those age 65 or over.
Common Questions
What is Per Capita Income in Richfield?
Per Capita income in Richfield is $40,723.
What is the Median Family Income in Richfield?
Median Family Income in Richfield is $84,722.
What is the Median Household income in Richfield?
Median Household Income in Richfield is $68,214.
What is Income or Wage Gap in Richfield?
Income or Wage Gap in Richfield is 68.1%.
Women in Richfield earn 31.9 cents for every dollar earned by a man.
What is Inequality or Gini Index in Richfield?
Inequality or Gini Index in Richfield is 0.51.
What is the Total Population of Richfield?
Total Population of Richfield is 377.
What is the Total Male Population of Richfield?
Total Male Population of Richfield is 176.
What is the Total Female Population of Richfield?
Total Female Population of Richfield is 201.
What is the Ratio of Males per 100 Females in Richfield?
There are 87.56 Males per 100 Females in Richfield.
What is the Ratio of Females per 100 Males in Richfield?
There are 114.20 Females per 100 Males in Richfield.
What is the Median Population Age in Richfield?
Median Population Age in Richfield is 59.3 Years.
What is the Average Family Size in Richfield
Average Family Size in Richfield is 2.8 People.
What is the Average Household Size in Richfield
Average Household Size in Richfield is 1.8 People.
How Large is the Labor Force in Richfield?
There are 180 People in the Labor Forcein in Richfield.
What is the Percentage of People in the Labor Force in Richfield?
52.5% of People are in the Labor Force in Richfield.