Philipsburg borough, PA Map & Demographics
Philipsburg borough Overview
$31,382
PER CAPITA INCOME
$71,815
AVG FAMILY INCOME
$45,530
AVG HOUSEHOLD INCOME
4.4%
WAGE / INCOME GAP [ % ]
95.6¢/ $1
WAGE / INCOME GAP [ $ ]
0.42
INEQUALITY / GINI INDEX
2,782
TOTAL POPULATION
1,535
MALE POPULATION
1,247
FEMALE POPULATION
123.10
MALES / 100 FEMALES
81.24
FEMALES / 100 MALES
42.1
MEDIAN AGE
2.8
AVG FAMILY SIZE
2.0
AVG HOUSEHOLD SIZE
1,474
LABOR FORCE [ PEOPLE ]
63.7%
PERCENT IN LABOR FORCE
1.6%
UNEMPLOYMENT RATE
Income in Philipsburg borough
Income Overview in Philipsburg borough
Per Capita Income in Philipsburg borough is $31,382, while median incomes of families and households are $71,815 and $45,530 respectively.
| Characteristic | Number | Measure |
| Per Capita Income | 2,782 | $31,382 |
| Median Family Income | 651 | $71,815 |
| Mean Family Income | 651 | $80,276 |
| Median Household Income | 1,364 | $45,530 |
| Mean Household Income | 1,364 | $60,117 |
| Income Deficit | 651 | $0 |
| Wage / Income Gap (%) | 2,782 | 4.43% |
| Wage / Income Gap ($) | 2,782 | 95.57¢ per $1 |
| Gini / Inequality Index | 2,782 | 0.42 |
Earnings by Sex in Philipsburg borough
Average Earnings in Philipsburg borough are $35,565, $36,576 for men and $34,957 for women, a difference of 4.4%.
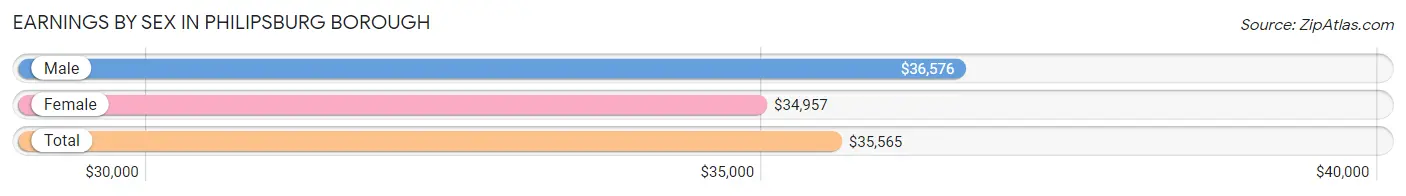
| Sex | Number | Average Earnings |
| Male | 925 (60.8%) | $36,576 |
| Female | 597 (39.2%) | $34,957 |
| Total | 1,522 (100.0%) | $35,565 |
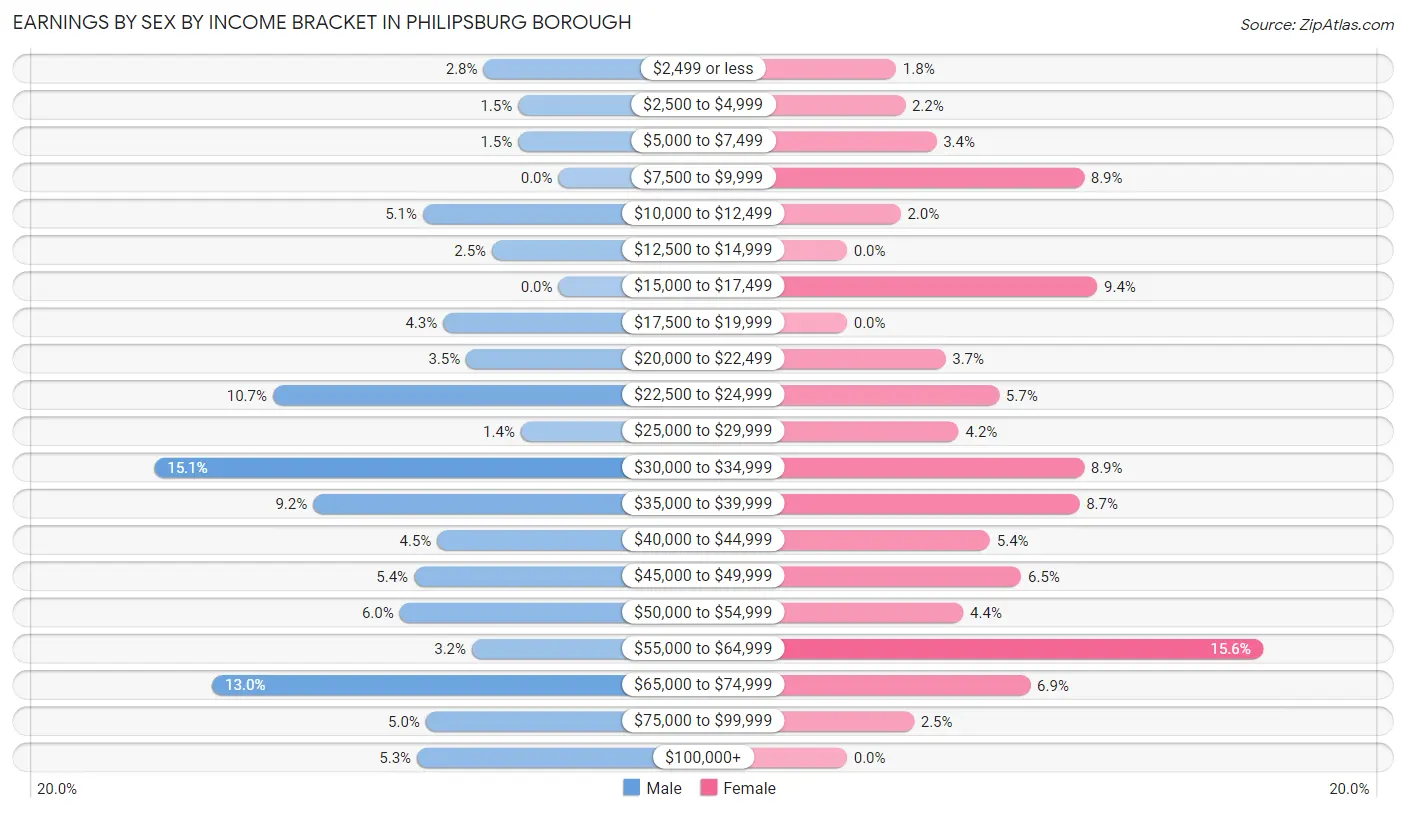
Earnings by Sex by Income Bracket in Philipsburg borough
The most common earnings brackets in Philipsburg borough are $30,000 to $34,999 for men (140 | 15.1%) and $55,000 to $64,999 for women (93 | 15.6%).
| Income | Male | Female |
| $2,499 or less | 26 (2.8%) | 11 (1.8%) |
| $2,500 to $4,999 | 14 (1.5%) | 13 (2.2%) |
| $5,000 to $7,499 | 14 (1.5%) | 20 (3.4%) |
| $7,500 to $9,999 | 0 (0.0%) | 53 (8.9%) |
| $10,000 to $12,499 | 47 (5.1%) | 12 (2.0%) |
| $12,500 to $14,999 | 23 (2.5%) | 0 (0.0%) |
| $15,000 to $17,499 | 0 (0.0%) | 56 (9.4%) |
| $17,500 to $19,999 | 40 (4.3%) | 0 (0.0%) |
| $20,000 to $22,499 | 32 (3.5%) | 22 (3.7%) |
| $22,500 to $24,999 | 99 (10.7%) | 34 (5.7%) |
| $25,000 to $29,999 | 13 (1.4%) | 25 (4.2%) |
| $30,000 to $34,999 | 140 (15.1%) | 53 (8.9%) |
| $35,000 to $39,999 | 85 (9.2%) | 52 (8.7%) |
| $40,000 to $44,999 | 42 (4.5%) | 32 (5.4%) |
| $45,000 to $49,999 | 50 (5.4%) | 39 (6.5%) |
| $50,000 to $54,999 | 55 (5.9%) | 26 (4.4%) |
| $55,000 to $64,999 | 30 (3.2%) | 93 (15.6%) |
| $65,000 to $74,999 | 120 (13.0%) | 41 (6.9%) |
| $75,000 to $99,999 | 46 (5.0%) | 15 (2.5%) |
| $100,000+ | 49 (5.3%) | 0 (0.0%) |
| Total | 925 (100.0%) | 597 (100.0%) |
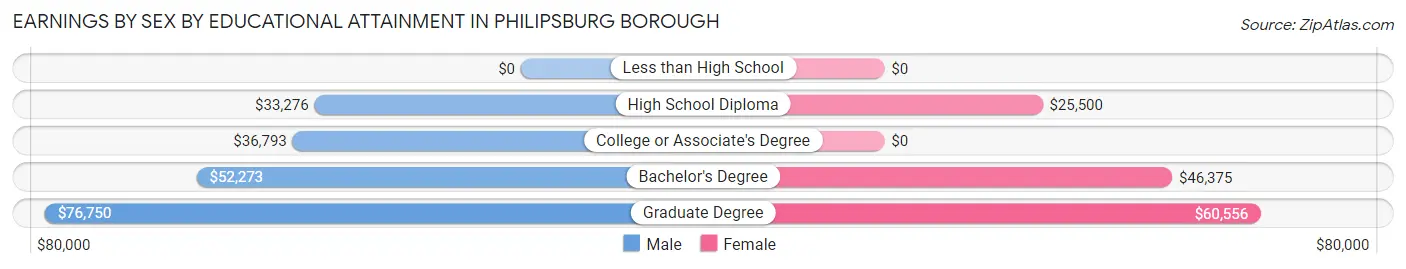
Earnings by Sex by Educational Attainment in Philipsburg borough
Average earnings in Philipsburg borough are $37,756 for men and $36,827 for women, a difference of 2.5%. Men with an educational attainment of graduate degree enjoy the highest average annual earnings of $76,750, while those with high school diploma education earn the least with $33,276. Women with an educational attainment of graduate degree earn the most with the average annual earnings of $60,556, while those with high school diploma education have the smallest earnings of $25,500.
| Educational Attainment | Male Income | Female Income |
| Less than High School | - | - |
| High School Diploma | $33,276 | $25,500 |
| College or Associate's Degree | $36,793 | $0 |
| Bachelor's Degree | $52,273 | $46,375 |
| Graduate Degree | $76,750 | $60,556 |
| Total | $37,756 | $36,827 |
Family Income in Philipsburg borough
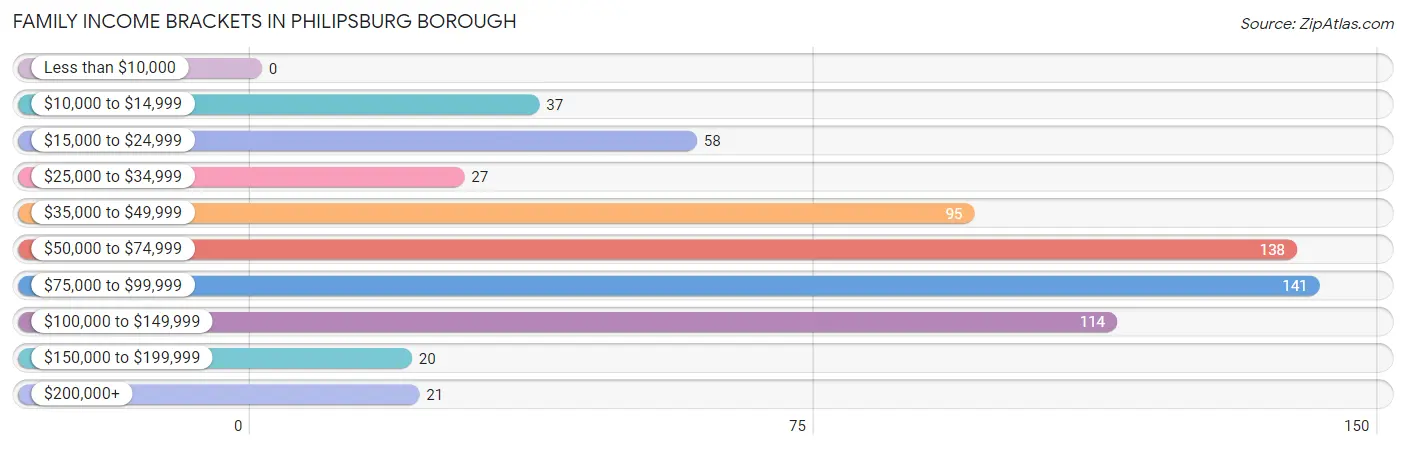
Family Income Brackets in Philipsburg borough
According to the Philipsburg borough family income data, there are 141 families falling into the $75,000 to $99,999 income range, which is the most common income bracket and makes up 21.7% of all families.
| Income Bracket | # Families | % Families |
| Less than $10,000 | 0 | 0.0% |
| $10,000 to $14,999 | 37 | 5.7% |
| $15,000 to $24,999 | 58 | 8.9% |
| $25,000 to $34,999 | 27 | 4.1% |
| $35,000 to $49,999 | 95 | 14.6% |
| $50,000 to $74,999 | 138 | 21.2% |
| $75,000 to $99,999 | 141 | 21.7% |
| $100,000 to $149,999 | 114 | 17.5% |
| $150,000 to $199,999 | 20 | 3.1% |
| $200,000+ | 21 | 3.2% |
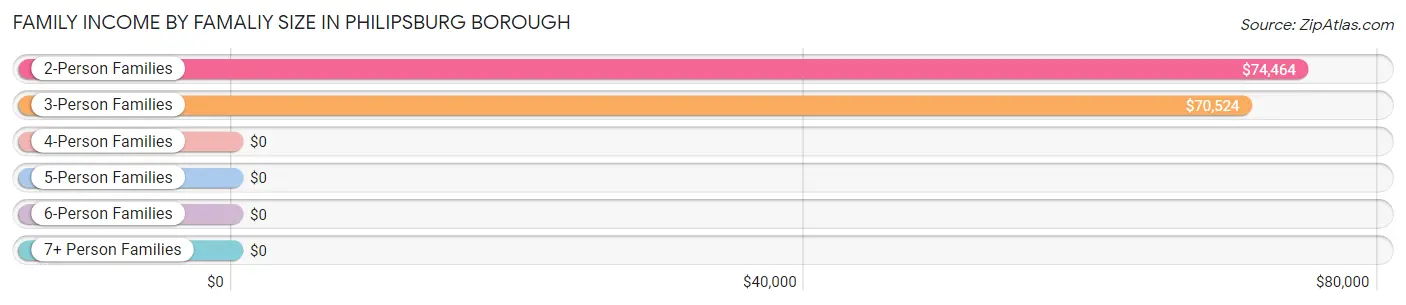
Family Income by Famaliy Size in Philipsburg borough
2-person families (373 | 57.3%) account for the highest median family income in Philipsburg borough with $74,464 per family, while 2-person families (373 | 57.3%) have the highest median income of $37,232 per family member.
| Income Bracket | # Families | Median Income |
| 2-Person Families | 373 (57.3%) | $74,464 |
| 3-Person Families | 121 (18.6%) | $70,524 |
| 4-Person Families | 157 (24.1%) | $0 |
| 5-Person Families | 0 (0.0%) | $0 |
| 6-Person Families | 0 (0.0%) | $0 |
| 7+ Person Families | 0 (0.0%) | $0 |
| Total | 651 (100.0%) | $71,815 |
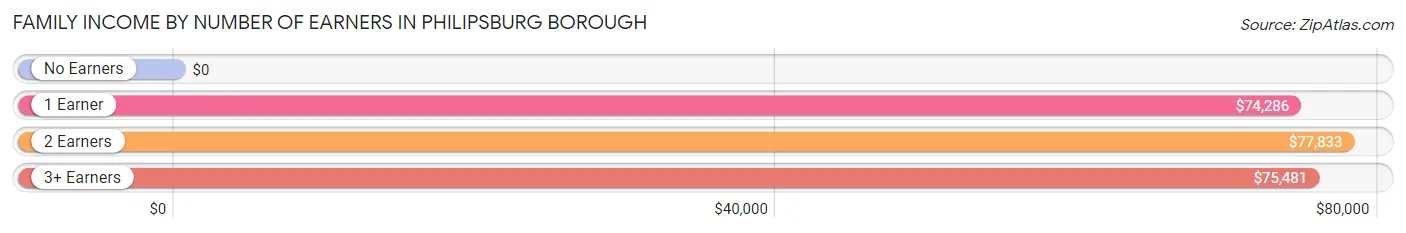
Family Income by Number of Earners in Philipsburg borough
| Number of Earners | # Families | Median Income |
| No Earners | 102 (15.7%) | $0 |
| 1 Earner | 224 (34.4%) | $74,286 |
| 2 Earners | 226 (34.7%) | $77,833 |
| 3+ Earners | 99 (15.2%) | $75,481 |
| Total | 651 (100.0%) | $71,815 |
Household Income in Philipsburg borough
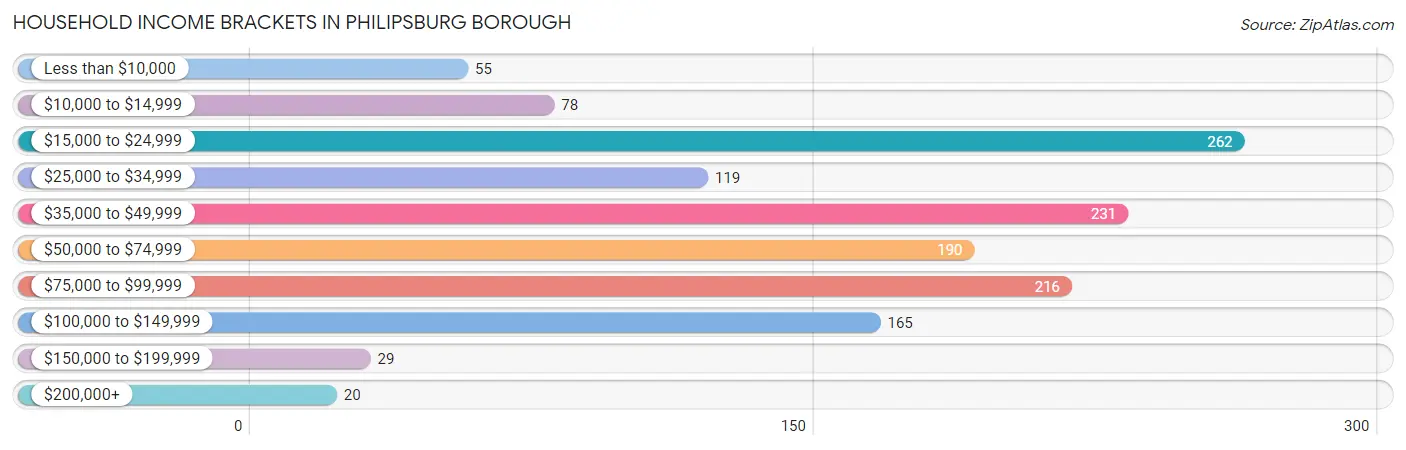
Household Income Brackets in Philipsburg borough
With 262 households falling in the category, the $15,000 to $24,999 income range is the most frequent in Philipsburg borough, accounting for 19.2% of all households. In contrast, only 20 households (1.5%) fall into the $200,000+ income bracket, making it the least populous group.
| Income Bracket | # Households | % Households |
| Less than $10,000 | 55 | 4.0% |
| $10,000 to $14,999 | 78 | 5.7% |
| $15,000 to $24,999 | 262 | 19.2% |
| $25,000 to $34,999 | 119 | 8.7% |
| $35,000 to $49,999 | 231 | 16.9% |
| $50,000 to $74,999 | 190 | 13.9% |
| $75,000 to $99,999 | 216 | 15.8% |
| $100,000 to $149,999 | 165 | 12.1% |
| $150,000 to $199,999 | 29 | 2.1% |
| $200,000+ | 20 | 1.5% |
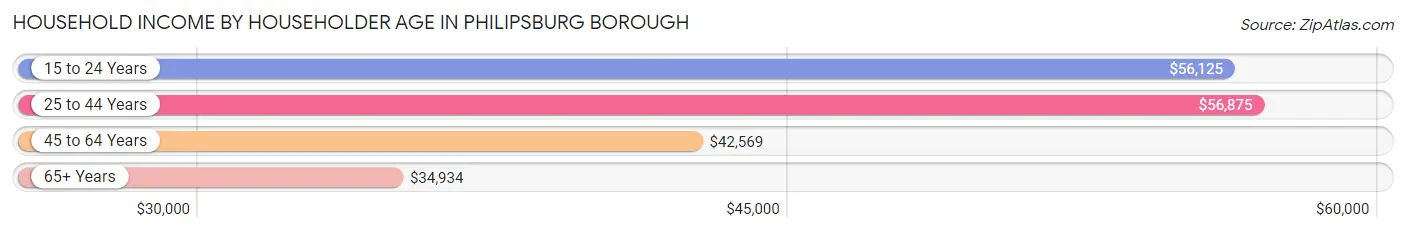
Household Income by Householder Age in Philipsburg borough
The median household income in Philipsburg borough is $45,530, with the highest median household income of $56,875 found in the 25 to 44 years age bracket for the primary householder. A total of 367 households (26.9%) fall into this category. Meanwhile, the 65+ years age bracket for the primary householder has the lowest median household income of $34,934, with 398 households (29.2%) in this group.
| Income Bracket | # Households | Median Income |
| 15 to 24 Years | 91 (6.7%) | $56,125 |
| 25 to 44 Years | 367 (26.9%) | $56,875 |
| 45 to 64 Years | 508 (37.2%) | $42,569 |
| 65+ Years | 398 (29.2%) | $34,934 |
| Total | 1,364 (100.0%) | $45,530 |
Poverty in Philipsburg borough
Income Below Poverty by Sex and Age in Philipsburg borough
With 13.6% poverty level for males and 12.3% for females among the residents of Philipsburg borough, under 5 year old males and 12 to 14 year old females are the most vulnerable to poverty, with 26 males (37.7%) and 33 females (100.0%) in their respective age groups living below the poverty level.
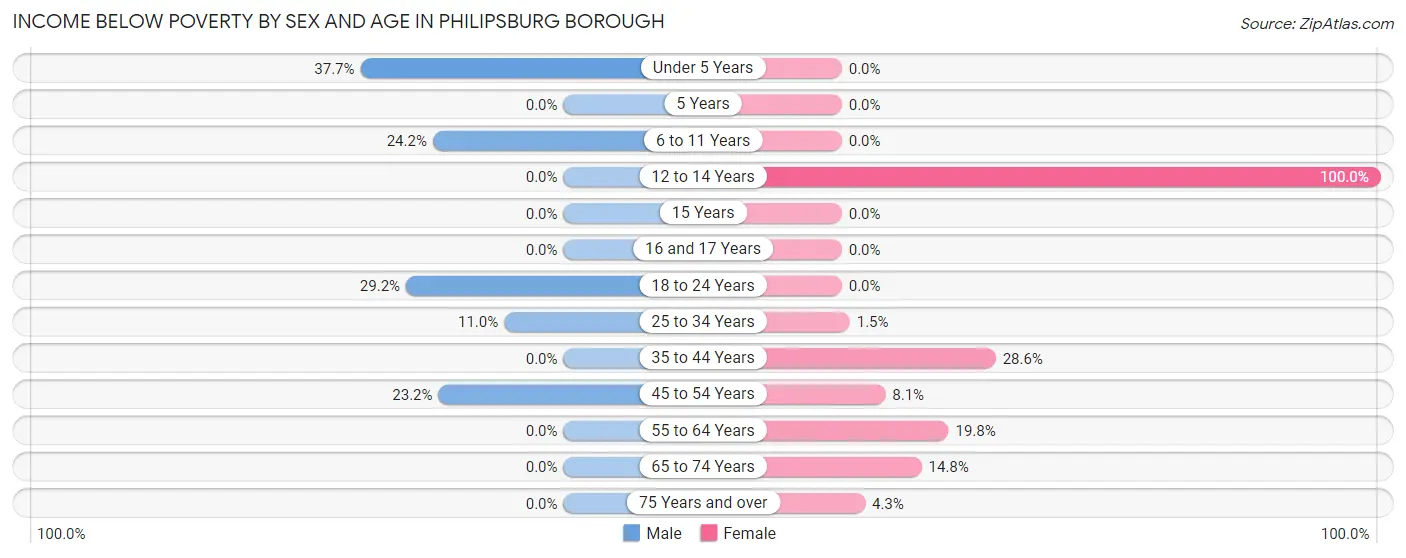
| Age Bracket | Male | Female |
| Under 5 Years | 26 (37.7%) | 0 (0.0%) |
| 5 Years | 0 (0.0%) | 0 (0.0%) |
| 6 to 11 Years | 40 (24.2%) | 0 (0.0%) |
| 12 to 14 Years | 0 (0.0%) | 33 (100.0%) |
| 15 Years | 0 (0.0%) | 0 (0.0%) |
| 16 and 17 Years | 0 (0.0%) | 0 (0.0%) |
| 18 to 24 Years | 64 (29.2%) | 0 (0.0%) |
| 25 to 34 Years | 32 (11.0%) | 2 (1.5%) |
| 35 to 44 Years | 0 (0.0%) | 48 (28.6%) |
| 45 to 54 Years | 45 (23.2%) | 16 (8.1%) |
| 55 to 64 Years | 0 (0.0%) | 21 (19.8%) |
| 65 to 74 Years | 0 (0.0%) | 24 (14.8%) |
| 75 Years and over | 0 (0.0%) | 9 (4.3%) |
| Total | 207 (13.6%) | 153 (12.3%) |
Income Above Poverty by Sex and Age in Philipsburg borough
According to the poverty statistics in Philipsburg borough, males aged 12 to 14 years and females aged under 5 years are the age groups that are most secure financially, with 100.0% of males and 100.0% of females in these age groups living above the poverty line.
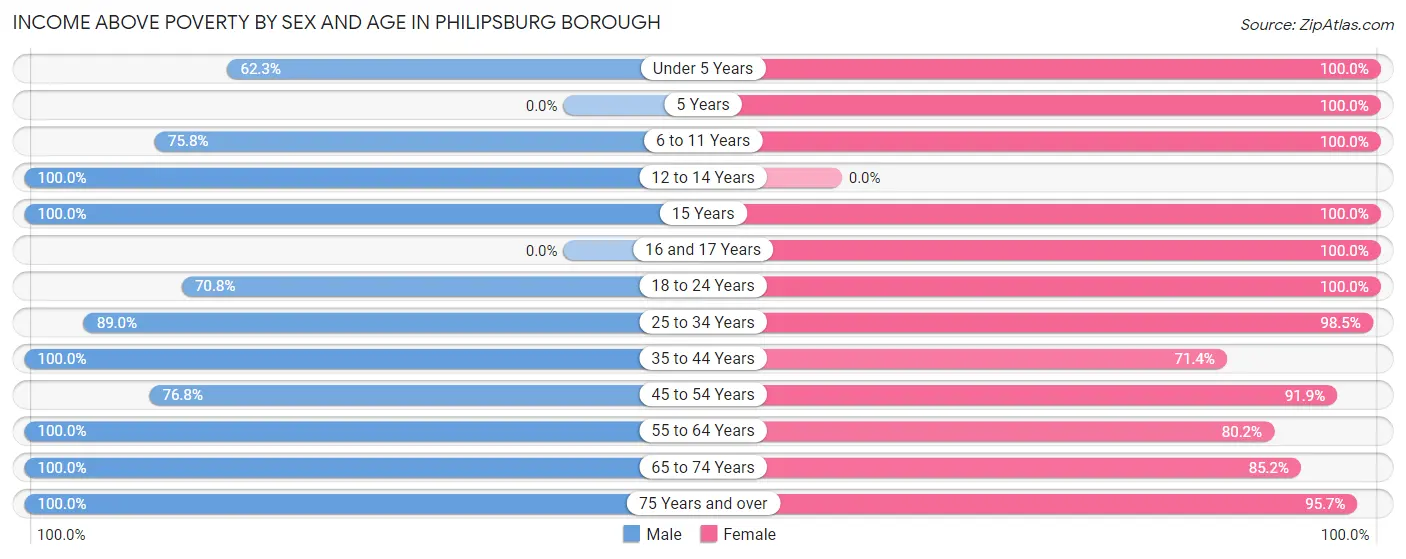
| Age Bracket | Male | Female |
| Under 5 Years | 43 (62.3%) | 37 (100.0%) |
| 5 Years | 0 (0.0%) | 29 (100.0%) |
| 6 to 11 Years | 125 (75.8%) | 53 (100.0%) |
| 12 to 14 Years | 30 (100.0%) | 0 (0.0%) |
| 15 Years | 30 (100.0%) | 13 (100.0%) |
| 16 and 17 Years | 0 (0.0%) | 10 (100.0%) |
| 18 to 24 Years | 155 (70.8%) | 94 (100.0%) |
| 25 to 34 Years | 259 (89.0%) | 133 (98.5%) |
| 35 to 44 Years | 142 (100.0%) | 120 (71.4%) |
| 45 to 54 Years | 149 (76.8%) | 182 (91.9%) |
| 55 to 64 Years | 277 (100.0%) | 85 (80.2%) |
| 65 to 74 Years | 76 (100.0%) | 138 (85.2%) |
| 75 Years and over | 33 (100.0%) | 200 (95.7%) |
| Total | 1,319 (86.4%) | 1,094 (87.7%) |
Income Below Poverty Among Married-Couple Families in Philipsburg borough
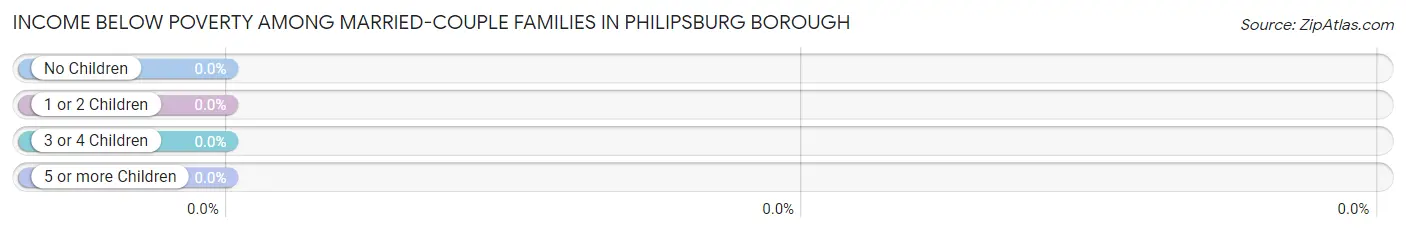
| Children | Above Poverty | Below Poverty |
| No Children | 218 (100.0%) | 0 (0.0%) |
| 1 or 2 Children | 173 (100.0%) | 0 (0.0%) |
| 3 or 4 Children | 0 (0.0%) | 0 (0.0%) |
| 5 or more Children | 0 (0.0%) | 0 (0.0%) |
| Total | 391 (100.0%) | 0 (0.0%) |
Income Below Poverty Among Single-Parent Households in Philipsburg borough
According to the poverty data in Philipsburg borough, 52.8% or 56 single-father households and 8.4% or 13 single-mother households are living below the poverty line. Among single-father households, those with 1 or 2 children have the highest poverty rate, with 56 households (78.9%) experiencing poverty. Likewise, among single-mother households, those with no children have the highest poverty rate, with 13 households (22.0%) falling below the poverty line.
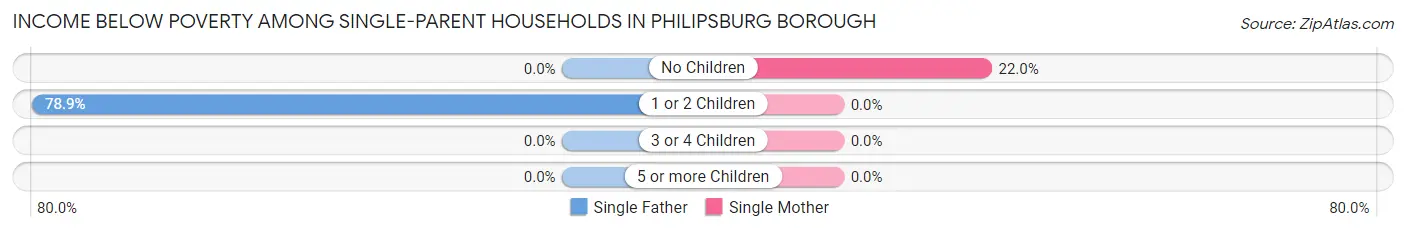
| Children | Single Father | Single Mother |
| No Children | 0 (0.0%) | 13 (22.0%) |
| 1 or 2 Children | 56 (78.9%) | 0 (0.0%) |
| 3 or 4 Children | 0 (0.0%) | 0 (0.0%) |
| 5 or more Children | 0 (0.0%) | 0 (0.0%) |
| Total | 56 (52.8%) | 13 (8.4%) |
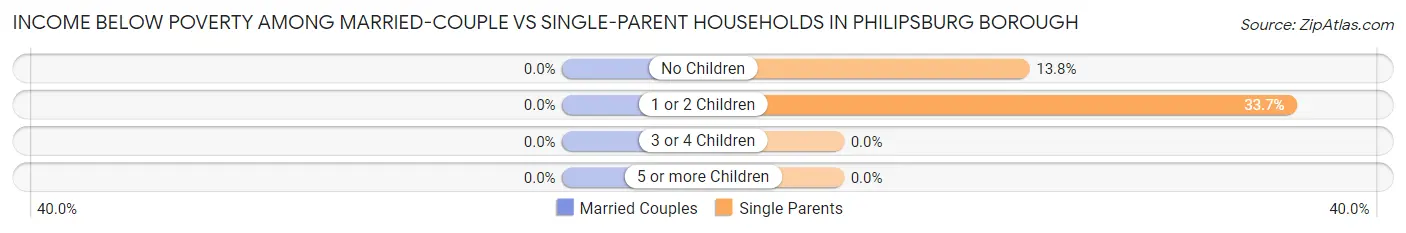
Income Below Poverty Among Married-Couple vs Single-Parent Households in Philipsburg borough
| Children | Married-Couple Families | Single-Parent Households |
| No Children | 0 (0.0%) | 13 (13.8%) |
| 1 or 2 Children | 0 (0.0%) | 56 (33.7%) |
| 3 or 4 Children | 0 (0.0%) | 0 (0.0%) |
| 5 or more Children | 0 (0.0%) | 0 (0.0%) |
| Total | 0 (0.0%) | 69 (26.5%) |
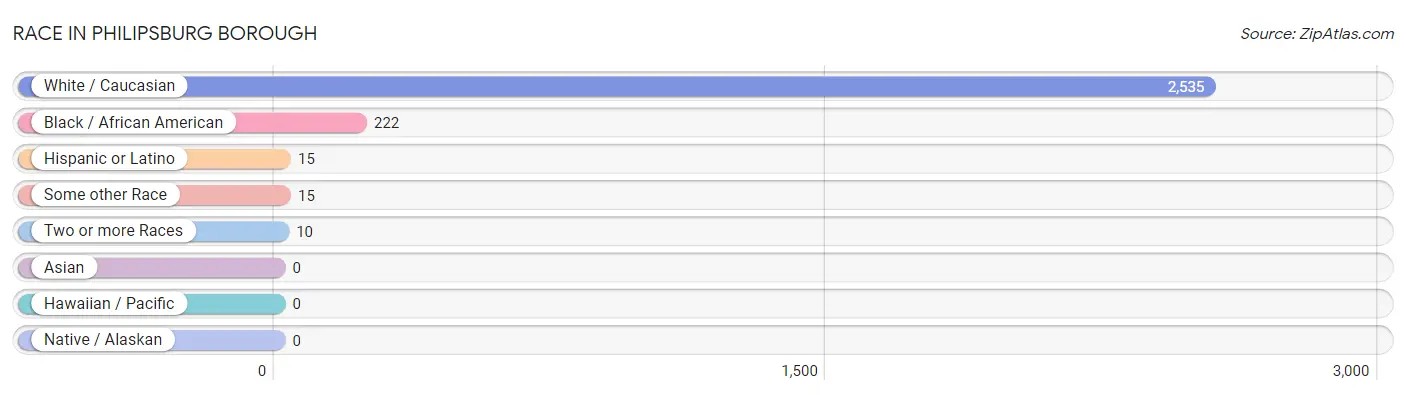
Race in Philipsburg borough
The most populous races in Philipsburg borough are White / Caucasian (2,535 | 91.1%), Black / African American (222 | 8.0%), and Hispanic or Latino (15 | 0.5%).
| Race | # Population | % Population |
| Asian | 0 | 0.0% |
| Black / African American | 222 | 8.0% |
| Hawaiian / Pacific | 0 | 0.0% |
| Hispanic or Latino | 15 | 0.5% |
| Native / Alaskan | 0 | 0.0% |
| White / Caucasian | 2,535 | 91.1% |
| Two or more Races | 10 | 0.4% |
| Some other Race | 15 | 0.5% |
| Total | 2,782 | 100.0% |
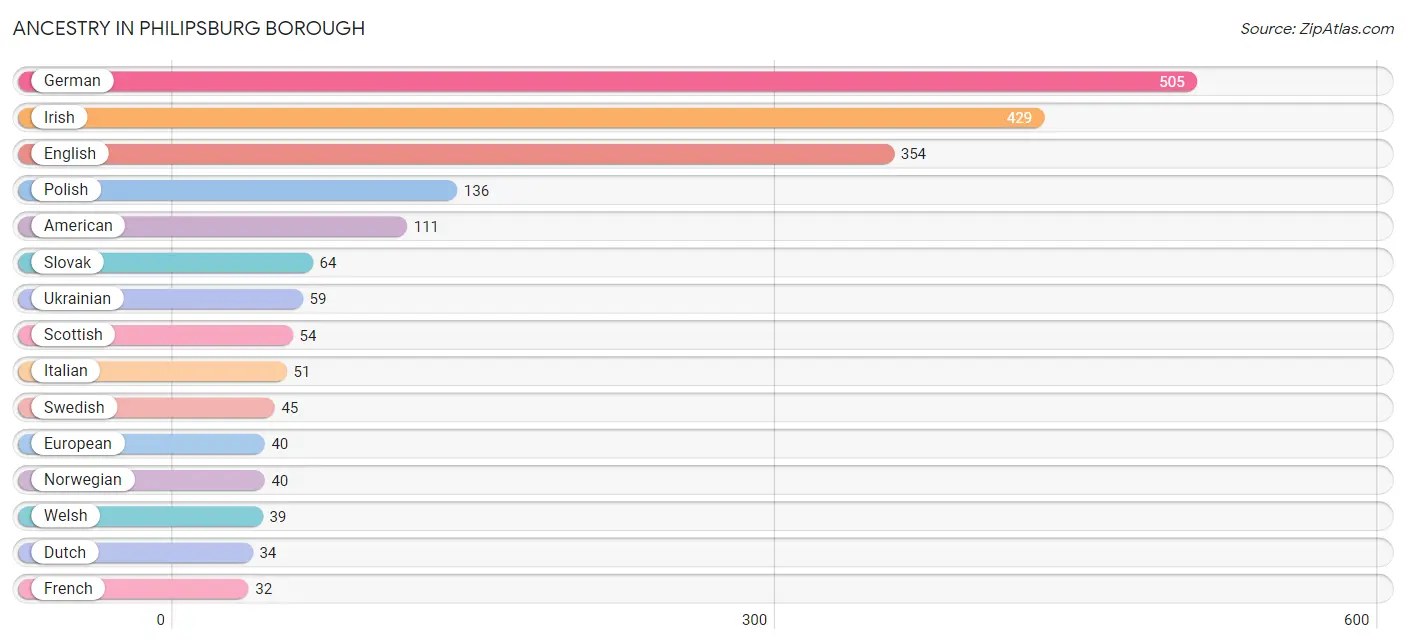
Ancestry in Philipsburg borough
The most populous ancestries reported in Philipsburg borough are German (505 | 18.1%), Irish (429 | 15.4%), English (354 | 12.7%), Polish (136 | 4.9%), and American (111 | 4.0%), together accounting for 55.2% of all Philipsburg borough residents.
| Ancestry | # Population | % Population |
| African | 1 | 0.0% |
| American | 111 | 4.0% |
| Austrian | 14 | 0.5% |
| British | 15 | 0.5% |
| Cherokee | 4 | 0.1% |
| Colombian | 9 | 0.3% |
| Croatian | 14 | 0.5% |
| Czech | 31 | 1.1% |
| Dutch | 34 | 1.2% |
| English | 354 | 12.7% |
| European | 40 | 1.4% |
| French | 32 | 1.1% |
| French Canadian | 14 | 0.5% |
| German | 505 | 18.1% |
| Irish | 429 | 15.4% |
| Italian | 51 | 1.8% |
| Norwegian | 40 | 1.4% |
| Polish | 136 | 4.9% |
| Puerto Rican | 6 | 0.2% |
| Russian | 10 | 0.4% |
| Scotch-Irish | 19 | 0.7% |
| Scottish | 54 | 1.9% |
| Slavic | 7 | 0.3% |
| Slovak | 64 | 2.3% |
| South American | 9 | 0.3% |
| Subsaharan African | 1 | 0.0% |
| Swedish | 45 | 1.6% |
| Ukrainian | 59 | 2.1% |
| Welsh | 39 | 1.4% | View All 29 Rows |
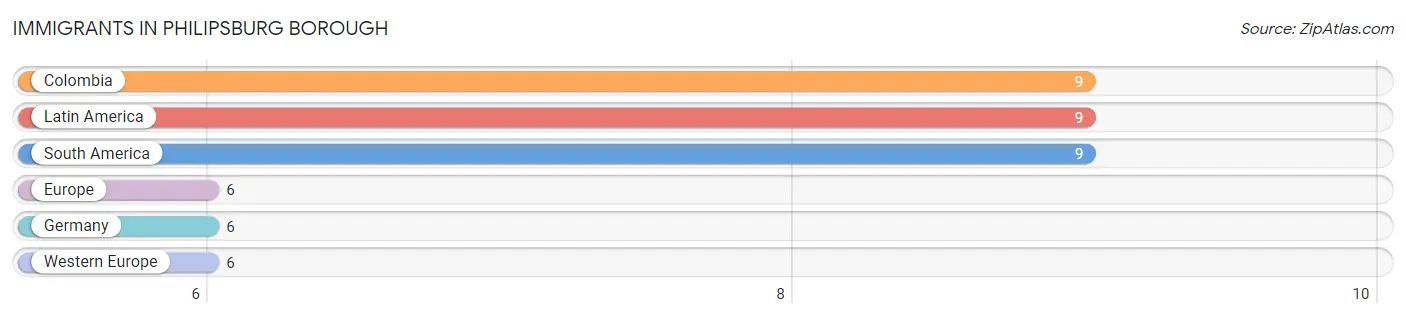
Immigrants in Philipsburg borough
The most numerous immigrant groups reported in Philipsburg borough came from Colombia (9 | 0.3%), Latin America (9 | 0.3%), South America (9 | 0.3%), Europe (6 | 0.2%), and Germany (6 | 0.2%), together accounting for 1.4% of all Philipsburg borough residents.
| Immigration Origin | # Population | % Population |
| Colombia | 9 | 0.3% |
| Europe | 6 | 0.2% |
| Germany | 6 | 0.2% |
| Latin America | 9 | 0.3% |
| South America | 9 | 0.3% |
| Western Europe | 6 | 0.2% | View All 6 Rows |
Sex and Age in Philipsburg borough
Sex and Age in Philipsburg borough
The most populous age groups in Philipsburg borough are 20 to 24 Years (196 | 12.8%) for men and 45 to 49 Years (137 | 11.0%) for women.
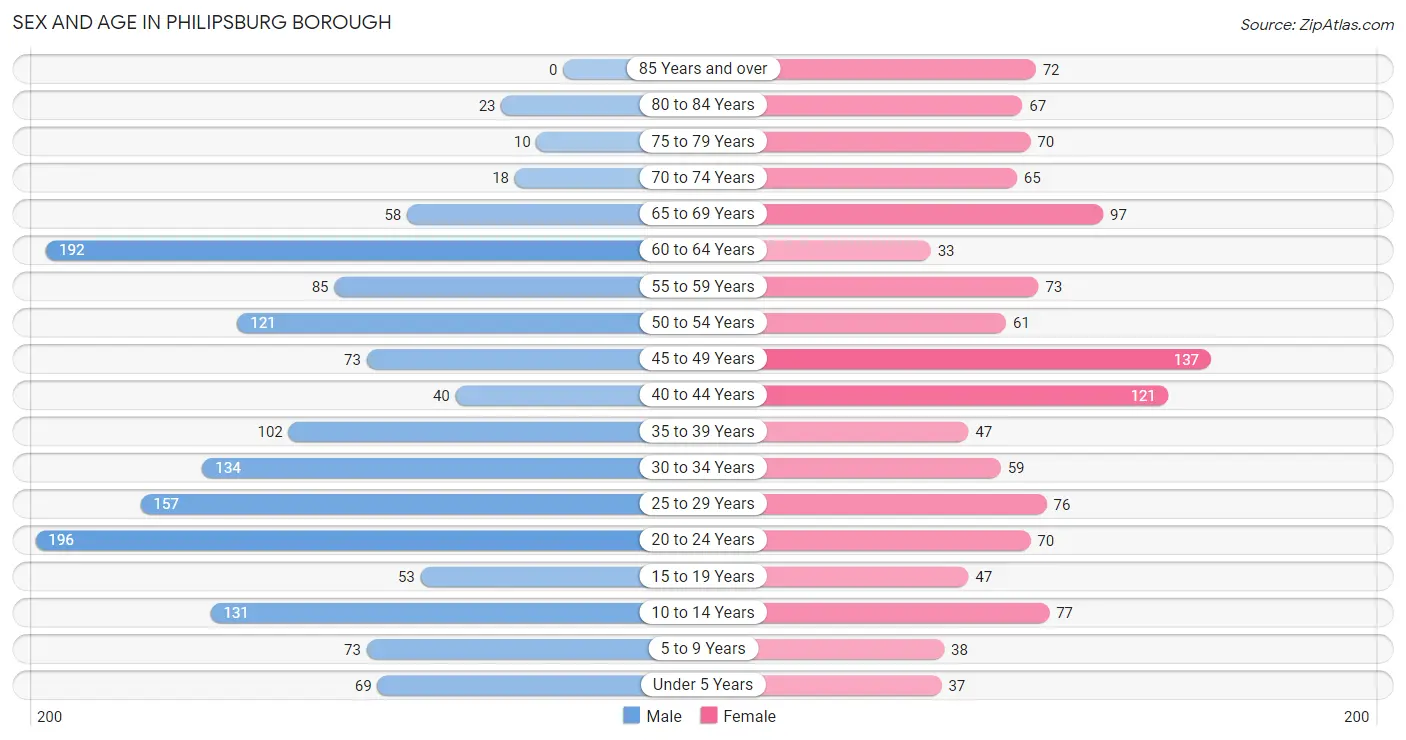
| Age Bracket | Male | Female |
| Under 5 Years | 69 (4.5%) | 37 (3.0%) |
| 5 to 9 Years | 73 (4.8%) | 38 (3.0%) |
| 10 to 14 Years | 131 (8.5%) | 77 (6.2%) |
| 15 to 19 Years | 53 (3.5%) | 47 (3.8%) |
| 20 to 24 Years | 196 (12.8%) | 70 (5.6%) |
| 25 to 29 Years | 157 (10.2%) | 76 (6.1%) |
| 30 to 34 Years | 134 (8.7%) | 59 (4.7%) |
| 35 to 39 Years | 102 (6.6%) | 47 (3.8%) |
| 40 to 44 Years | 40 (2.6%) | 121 (9.7%) |
| 45 to 49 Years | 73 (4.8%) | 137 (11.0%) |
| 50 to 54 Years | 121 (7.9%) | 61 (4.9%) |
| 55 to 59 Years | 85 (5.5%) | 73 (5.9%) |
| 60 to 64 Years | 192 (12.5%) | 33 (2.6%) |
| 65 to 69 Years | 58 (3.8%) | 97 (7.8%) |
| 70 to 74 Years | 18 (1.2%) | 65 (5.2%) |
| 75 to 79 Years | 10 (0.6%) | 70 (5.6%) |
| 80 to 84 Years | 23 (1.5%) | 67 (5.4%) |
| 85 Years and over | 0 (0.0%) | 72 (5.8%) |
| Total | 1,535 (100.0%) | 1,247 (100.0%) |
Families and Households in Philipsburg borough
Median Family Size in Philipsburg borough
The median family size in Philipsburg borough is 2.78 persons per family, with single male/father families (106 | 16.3%) accounting for the largest median family size of 3.3 persons per family. On the other hand, single female/mother families (154 | 23.7%) represent the smallest median family size with 2.51 persons per family.
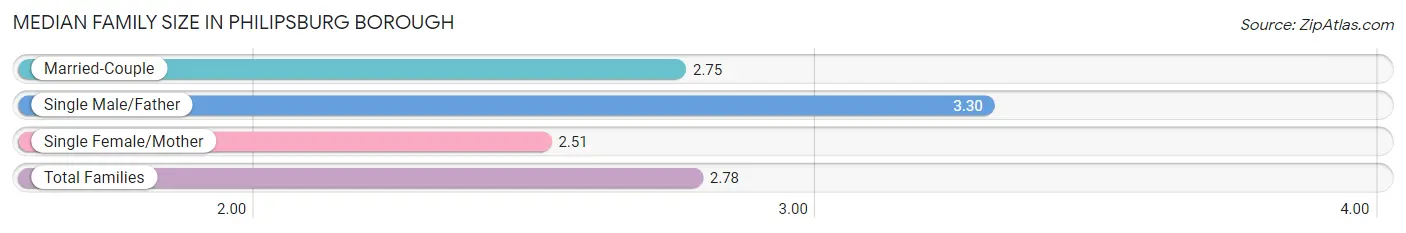
| Family Type | # Families | Family Size |
| Married-Couple | 391 (60.1%) | 2.75 |
| Single Male/Father | 106 (16.3%) | 3.30 |
| Single Female/Mother | 154 (23.7%) | 2.51 |
| Total Families | 651 (100.0%) | 2.78 |
Median Household Size in Philipsburg borough
The median household size in Philipsburg borough is 2.04 persons per household, with single male/father households (106 | 7.8%) accounting for the largest median household size of 3.91 persons per household. non-family households (713 | 52.3%) represent the smallest median household size with 1.15 persons per household.
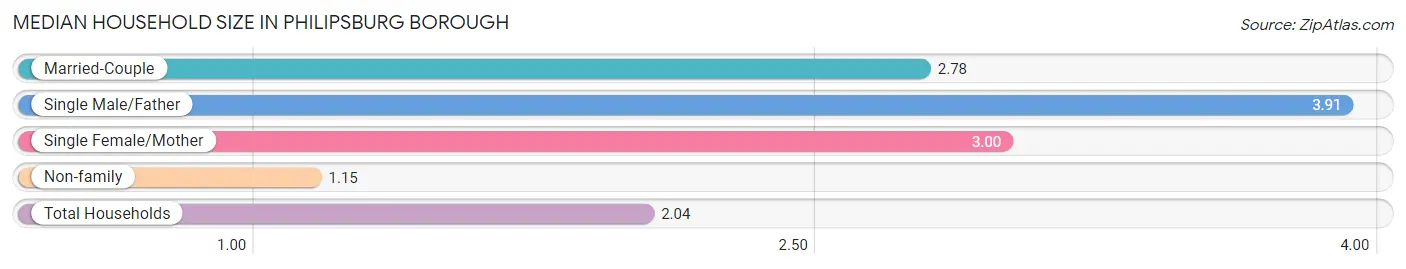
| Household Type | # Households | Household Size |
| Married-Couple | 391 (28.7%) | 2.78 |
| Single Male/Father | 106 (7.8%) | 3.91 |
| Single Female/Mother | 154 (11.3%) | 3.00 |
| Non-family | 713 (52.3%) | 1.15 |
| Total Households | 1,364 (100.0%) | 2.04 |
Household Size by Marriage Status in Philipsburg borough
Out of a total of 1,364 households in Philipsburg borough, 651 (47.7%) are family households, while 713 (52.3%) are nonfamily households. The most numerous type of family households are 2-person households, comprising 306, and the most common type of nonfamily households are 1-person households, comprising 664.
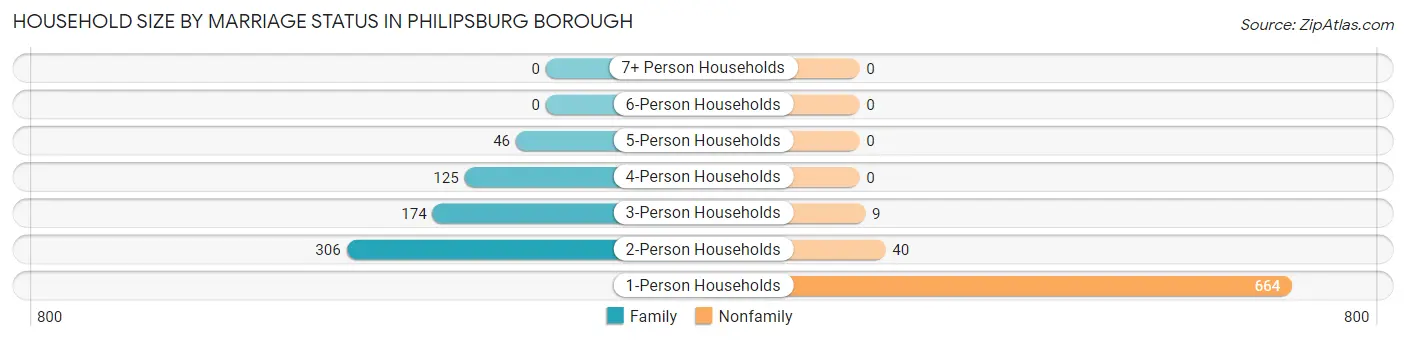
| Household Size | Family Households | Nonfamily Households |
| 1-Person Households | - | 664 (48.7%) |
| 2-Person Households | 306 (22.4%) | 40 (2.9%) |
| 3-Person Households | 174 (12.8%) | 9 (0.7%) |
| 4-Person Households | 125 (9.2%) | 0 (0.0%) |
| 5-Person Households | 46 (3.4%) | 0 (0.0%) |
| 6-Person Households | 0 (0.0%) | 0 (0.0%) |
| 7+ Person Households | 0 (0.0%) | 0 (0.0%) |
| Total | 651 (47.7%) | 713 (52.3%) |
Female Fertility in Philipsburg borough
Fertility by Age in Philipsburg borough
Average fertility rate in Philipsburg borough is 49.0 births per 1,000 women. Women in the age bracket of 20 to 34 years have the highest fertility rate with 137.0 births per 1,000 women. Women in the age bracket of 20 to 34 years acount for 100.0% of all women with births.
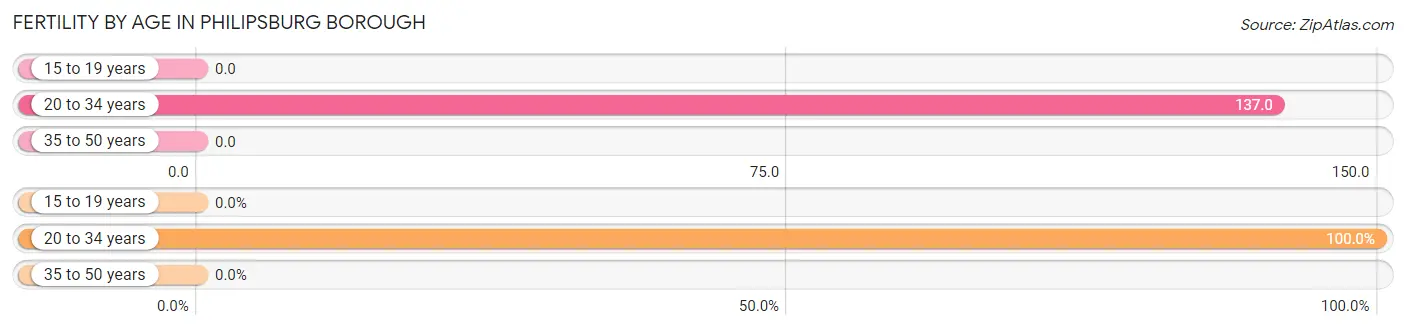
| Age Bracket | Women with Births | Births / 1,000 Women |
| 15 to 19 years | 0 (0.0%) | 0.0 |
| 20 to 34 years | 28 (100.0%) | 137.0 |
| 35 to 50 years | 0 (0.0%) | 0.0 |
| Total | 28 (100.0%) | 49.0 |
Fertility by Age by Marriage Status in Philipsburg borough
28.6% of women with births (28) in Philipsburg borough are married. The highest percentage of unmarried women with births falls into 20 to 34 years age bracket with 71.4% of them unmarried at the time of birth, while the lowest percentage of unmarried women with births belong to 20 to 34 years age bracket with 71.4% of them unmarried.
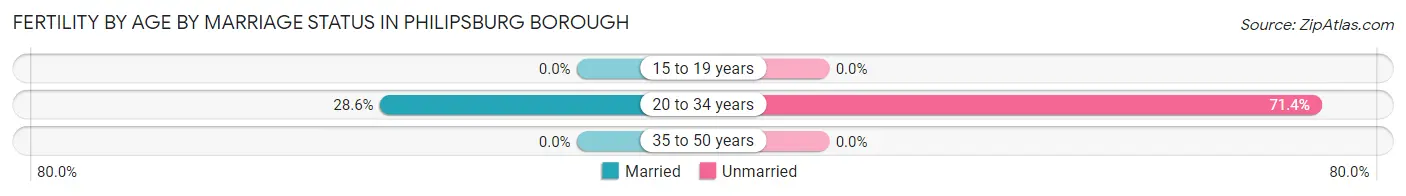
| Age Bracket | Married | Unmarried |
| 15 to 19 years | 0 (0.0%) | 0 (0.0%) |
| 20 to 34 years | 8 (28.6%) | 20 (71.4%) |
| 35 to 50 years | 0 (0.0%) | 0 (0.0%) |
| Total | 8 (28.6%) | 20 (71.4%) |
Fertility by Education in Philipsburg borough
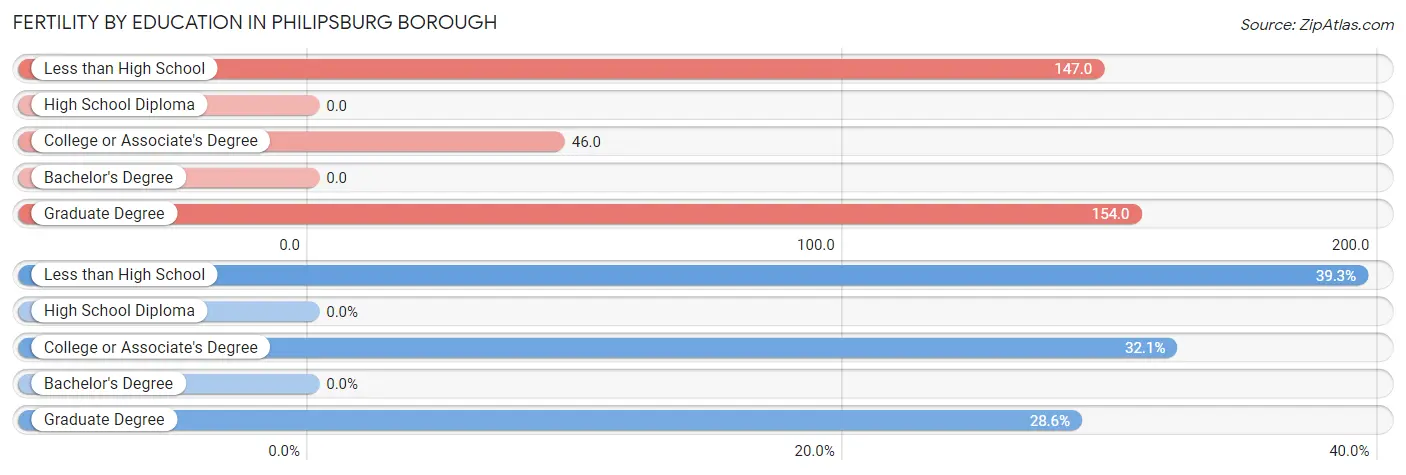
| Educational Attainment | Women with Births | Births / 1,000 Women |
| Less than High School | 11 (39.3%) | 147.0 |
| High School Diploma | 0 (0.0%) | 0.0 |
| College or Associate's Degree | 9 (32.1%) | 46.0 |
| Bachelor's Degree | 0 (0.0%) | 0.0 |
| Graduate Degree | 8 (28.6%) | 154.0 |
| Total | 28 (100.0%) | 49.0 |
Fertility by Education by Marriage Status in Philipsburg borough
71.4% of women with births in Philipsburg borough are unmarried. Women with the educational attainment of graduate degree are most likely to be married with 100.0% of them married at childbirth, while women with the educational attainment of less than high school are least likely to be married with 100.0% of them unmarried at childbirth.
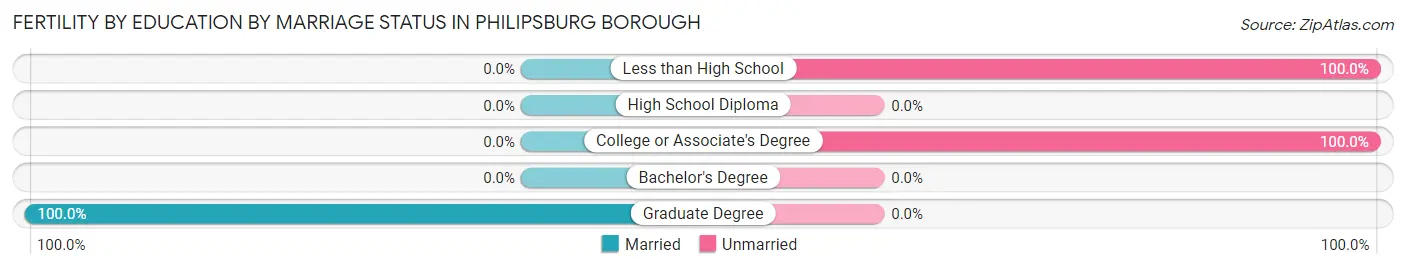
| Educational Attainment | Married | Unmarried |
| Less than High School | 0 (0.0%) | 11 (100.0%) |
| High School Diploma | 0 (0.0%) | 0 (0.0%) |
| College or Associate's Degree | 0 (0.0%) | 9 (100.0%) |
| Bachelor's Degree | 0 (0.0%) | 0 (0.0%) |
| Graduate Degree | 8 (100.0%) | 0 (0.0%) |
| Total | 8 (28.6%) | 20 (71.4%) |
Employment Characteristics in Philipsburg borough
Employment by Class of Employer in Philipsburg borough
Among the 1,438 employed individuals in Philipsburg borough, private company employees (940 | 65.4%), not-for-profit organizations (141 | 9.8%), and state government employees (107 | 7.4%) make up the most common classes of employment.
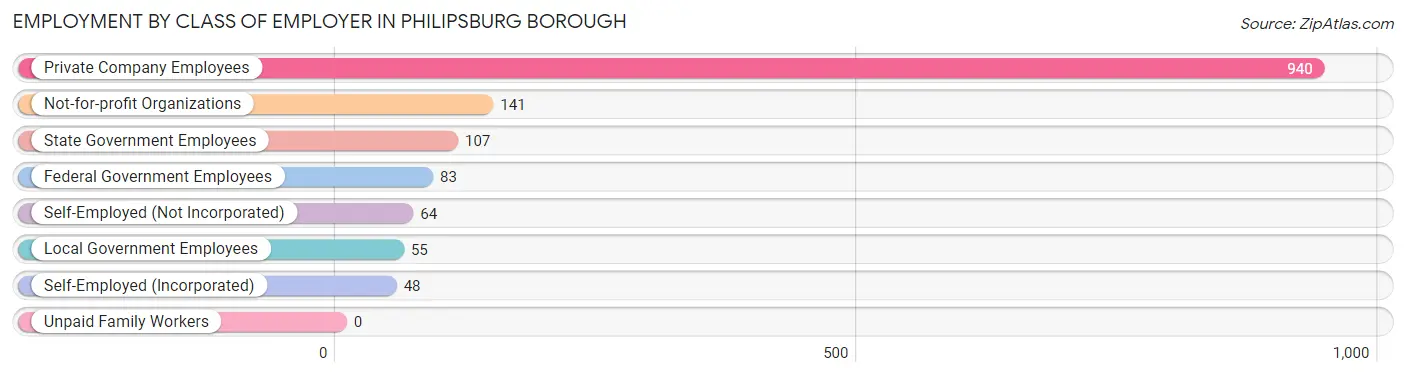
| Employer Class | # Employees | % Employees |
| Private Company Employees | 940 | 65.4% |
| Self-Employed (Incorporated) | 48 | 3.3% |
| Self-Employed (Not Incorporated) | 64 | 4.4% |
| Not-for-profit Organizations | 141 | 9.8% |
| Local Government Employees | 55 | 3.8% |
| State Government Employees | 107 | 7.4% |
| Federal Government Employees | 83 | 5.8% |
| Unpaid Family Workers | 0 | 0.0% |
| Total | 1,438 | 100.0% |
Employment Status by Age in Philipsburg borough
According to the labor force statistics for Philipsburg borough, out of the total population over 16 years of age (2,314), 63.7% or 1,474 individuals are in the labor force, with 1.6% or 24 of them unemployed. The age group with the highest labor force participation rate is 16 to 19 years, with 100.0% or 57 individuals in the labor force. Within the labor force, the 35 to 44 years age range has the highest percentage of unemployed individuals, with 5.3% or 14 of them being unemployed.
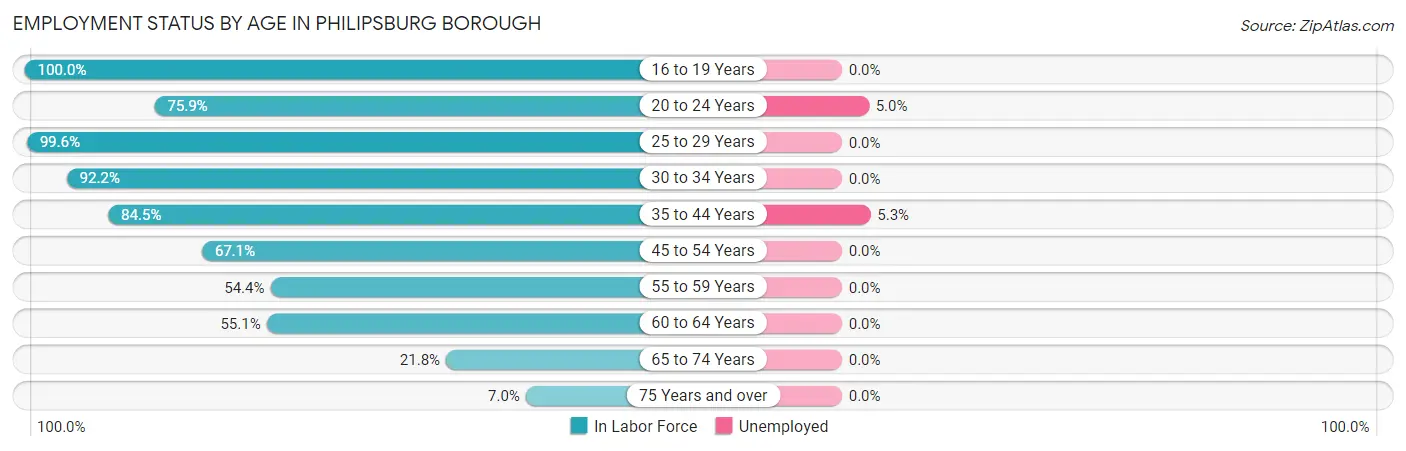
| Age Bracket | In Labor Force | Unemployed |
| 16 to 19 Years | 57 (100.0%) | 0 (0.0%) |
| 20 to 24 Years | 202 (75.9%) | 10 (5.0%) |
| 25 to 29 Years | 232 (99.6%) | 0 (0.0%) |
| 30 to 34 Years | 178 (92.2%) | 0 (0.0%) |
| 35 to 44 Years | 262 (84.5%) | 14 (5.3%) |
| 45 to 54 Years | 263 (67.1%) | 0 (0.0%) |
| 55 to 59 Years | 86 (54.4%) | 0 (0.0%) |
| 60 to 64 Years | 124 (55.1%) | 0 (0.0%) |
| 65 to 74 Years | 52 (21.8%) | 0 (0.0%) |
| 75 Years and over | 17 (7.0%) | 0 (0.0%) |
| Total | 1,474 (63.7%) | 24 (1.6%) |
Employment Status by Educational Attainment in Philipsburg borough
According to labor force statistics for Philipsburg borough, 75.8% of individuals (1,145) out of the total population between 25 and 64 years of age (1,511) are in the labor force, with 1.2% or 14 of them being unemployed. The group with the highest labor force participation rate are those with the educational attainment of college / associate degree, with 81.8% or 504 individuals in the labor force. Within the labor force, individuals with college / associate degree education have the highest percentage of unemployment, with 2.8% or 14 of them being unemployed.
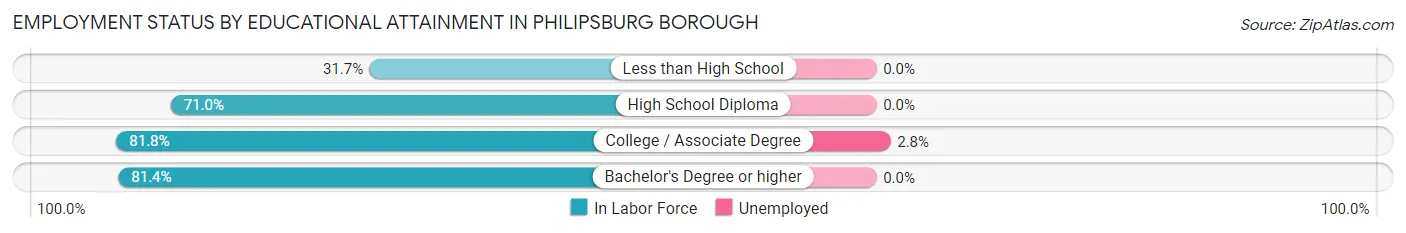
| Educational Attainment | In Labor Force | Unemployed |
| Less than High School | 32 (31.7%) | 0 (0.0%) |
| High School Diploma | 255 (71.0%) | 0 (0.0%) |
| College / Associate Degree | 504 (81.8%) | 17 (2.8%) |
| Bachelor's Degree or higher | 354 (81.4%) | 0 (0.0%) |
| Total | 1,145 (75.8%) | 18 (1.2%) |
Employment Occupations by Sex in Philipsburg borough
Management, Business, Science and Arts Occupations
The most common Management, Business, Science and Arts occupations in Philipsburg borough are Community & Social Service (220 | 15.2%), Management (99 | 6.8%), Education Instruction & Library (96 | 6.6%), Computers, Engineering & Science (95 | 6.6%), and Arts, Media & Entertainment (66 | 4.5%).
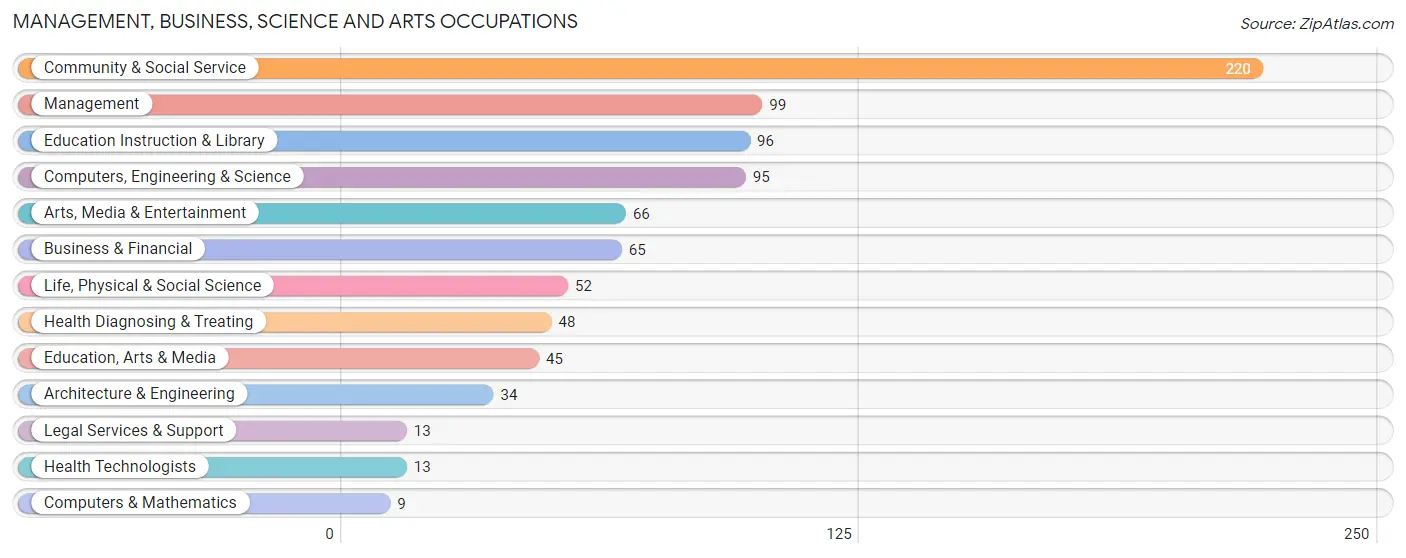
Management, Business, Science and Arts Occupations by Sex
Within the Management, Business, Science and Arts occupations in Philipsburg borough, the most male-oriented occupations are Computers, Engineering & Science (100.0%), Computers & Mathematics (100.0%), and Architecture & Engineering (100.0%), while the most female-oriented occupations are Education Instruction & Library (100.0%), Health Technologists (100.0%), and Education, Arts & Media (75.6%).
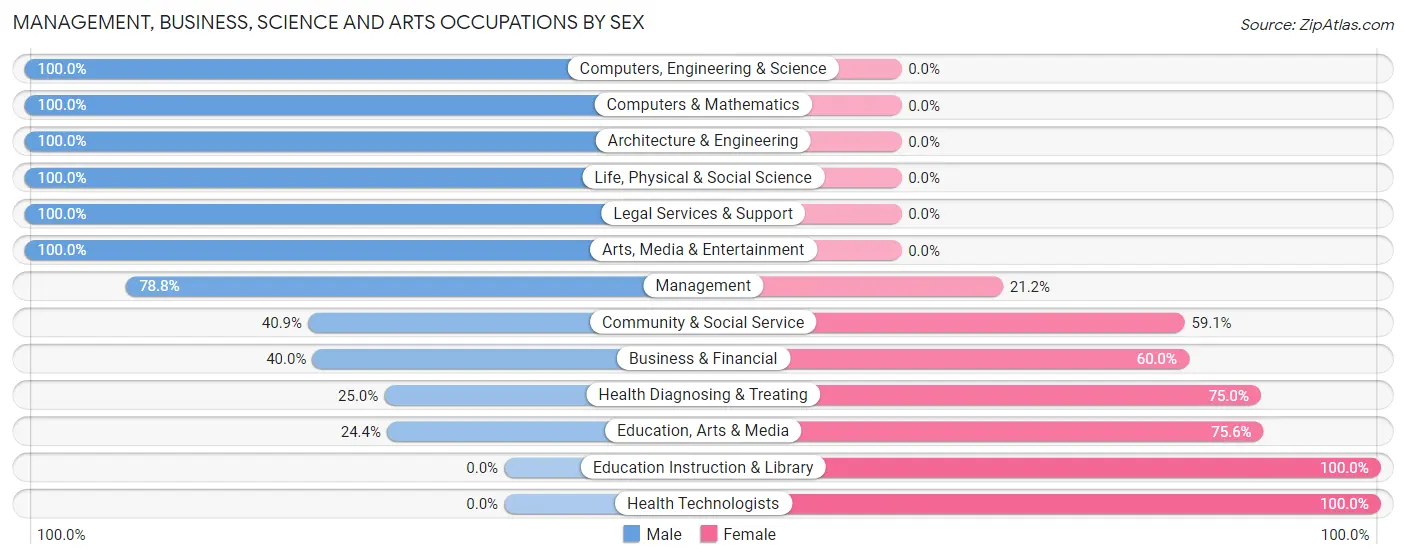
| Occupation | Male | Female |
| Management | 78 (78.8%) | 21 (21.2%) |
| Business & Financial | 26 (40.0%) | 39 (60.0%) |
| Computers, Engineering & Science | 95 (100.0%) | 0 (0.0%) |
| Computers & Mathematics | 9 (100.0%) | 0 (0.0%) |
| Architecture & Engineering | 34 (100.0%) | 0 (0.0%) |
| Life, Physical & Social Science | 52 (100.0%) | 0 (0.0%) |
| Community & Social Service | 90 (40.9%) | 130 (59.1%) |
| Education, Arts & Media | 11 (24.4%) | 34 (75.6%) |
| Legal Services & Support | 13 (100.0%) | 0 (0.0%) |
| Education Instruction & Library | 0 (0.0%) | 96 (100.0%) |
| Arts, Media & Entertainment | 66 (100.0%) | 0 (0.0%) |
| Health Diagnosing & Treating | 12 (25.0%) | 36 (75.0%) |
| Health Technologists | 0 (0.0%) | 13 (100.0%) |
| Total (Category) | 301 (57.1%) | 226 (42.9%) |
| Total (Overall) | 885 (61.1%) | 564 (38.9%) |
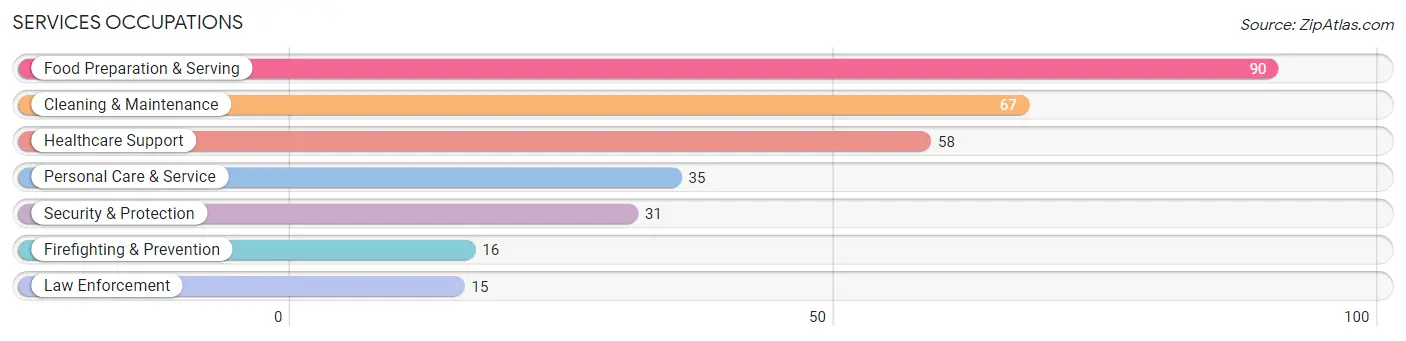
Services Occupations
The most common Services occupations in Philipsburg borough are Food Preparation & Serving (90 | 6.2%), Cleaning & Maintenance (67 | 4.6%), Healthcare Support (58 | 4.0%), Personal Care & Service (35 | 2.4%), and Security & Protection (31 | 2.1%).
Services Occupations by Sex
Within the Services occupations in Philipsburg borough, the most male-oriented occupations are Firefighting & Prevention (100.0%), Security & Protection (77.4%), and Cleaning & Maintenance (70.2%), while the most female-oriented occupations are Healthcare Support (100.0%), Personal Care & Service (65.7%), and Food Preparation & Serving (53.3%).
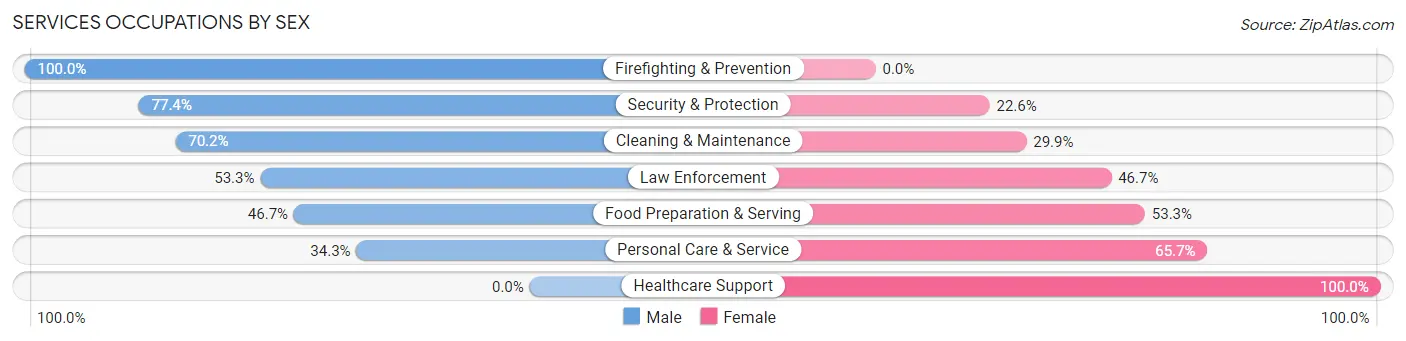
| Occupation | Male | Female |
| Healthcare Support | 0 (0.0%) | 58 (100.0%) |
| Security & Protection | 24 (77.4%) | 7 (22.6%) |
| Firefighting & Prevention | 16 (100.0%) | 0 (0.0%) |
| Law Enforcement | 8 (53.3%) | 7 (46.7%) |
| Food Preparation & Serving | 42 (46.7%) | 48 (53.3%) |
| Cleaning & Maintenance | 47 (70.2%) | 20 (29.8%) |
| Personal Care & Service | 12 (34.3%) | 23 (65.7%) |
| Total (Category) | 125 (44.5%) | 156 (55.5%) |
| Total (Overall) | 885 (61.1%) | 564 (38.9%) |
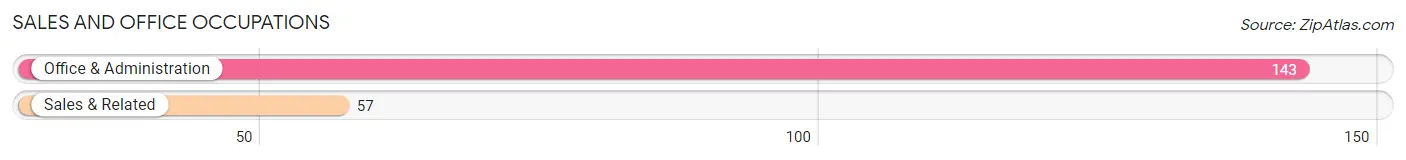
Sales and Office Occupations
The most common Sales and Office occupations in Philipsburg borough are Office & Administration (143 | 9.9%), and Sales & Related (57 | 3.9%).
Sales and Office Occupations by Sex
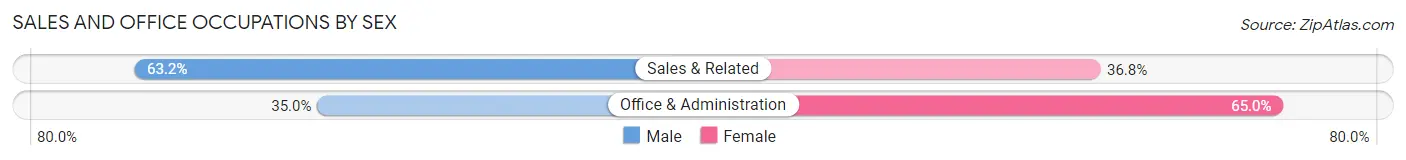
| Occupation | Male | Female |
| Sales & Related | 36 (63.2%) | 21 (36.8%) |
| Office & Administration | 50 (35.0%) | 93 (65.0%) |
| Total (Category) | 86 (43.0%) | 114 (57.0%) |
| Total (Overall) | 885 (61.1%) | 564 (38.9%) |
Natural Resources, Construction and Maintenance Occupations
The most common Natural Resources, Construction and Maintenance occupations in Philipsburg borough are Construction & Extraction (118 | 8.1%), and Installation, Maintenance & Repair (94 | 6.5%).
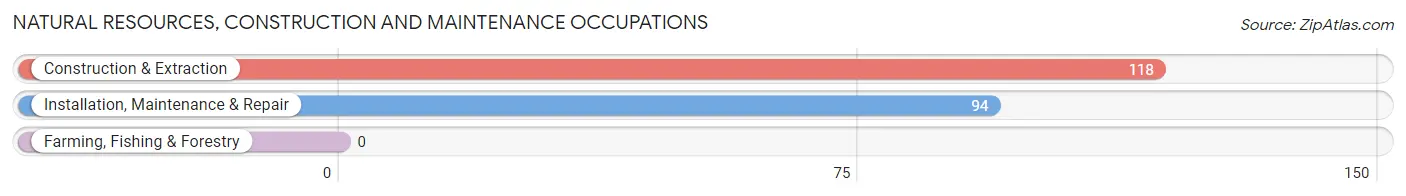
Natural Resources, Construction and Maintenance Occupations by Sex

| Occupation | Male | Female |
| Farming, Fishing & Forestry | 0 (0.0%) | 0 (0.0%) |
| Construction & Extraction | 118 (100.0%) | 0 (0.0%) |
| Installation, Maintenance & Repair | 94 (100.0%) | 0 (0.0%) |
| Total (Category) | 212 (100.0%) | 0 (0.0%) |
| Total (Overall) | 885 (61.1%) | 564 (38.9%) |
Production, Transportation and Moving Occupations
The most common Production, Transportation and Moving occupations in Philipsburg borough are Production (130 | 9.0%), Transportation (60 | 4.1%), and Material Moving (39 | 2.7%).
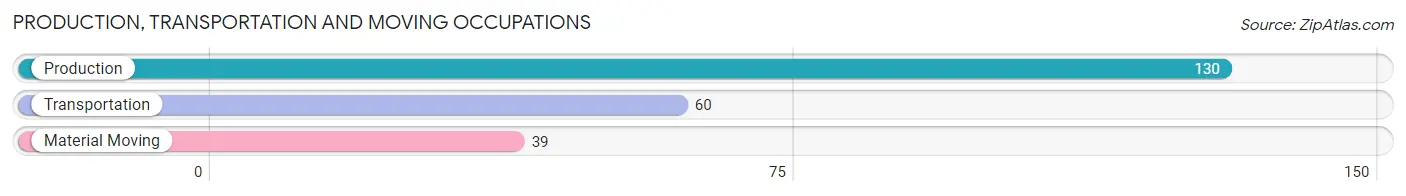
Production, Transportation and Moving Occupations by Sex
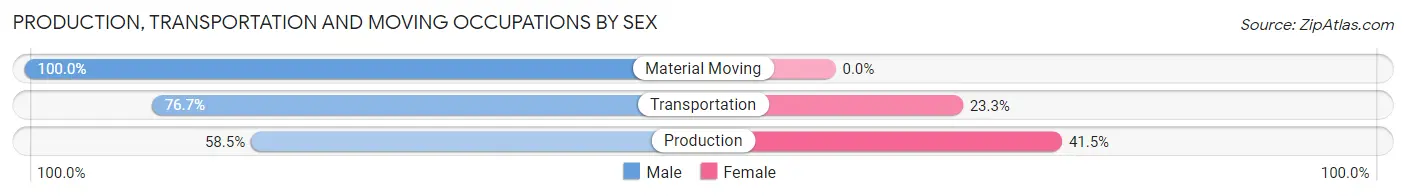
| Occupation | Male | Female |
| Production | 76 (58.5%) | 54 (41.5%) |
| Transportation | 46 (76.7%) | 14 (23.3%) |
| Material Moving | 39 (100.0%) | 0 (0.0%) |
| Total (Category) | 161 (70.3%) | 68 (29.7%) |
| Total (Overall) | 885 (61.1%) | 564 (38.9%) |
Employment Industries by Sex in Philipsburg borough
Employment Industries in Philipsburg borough
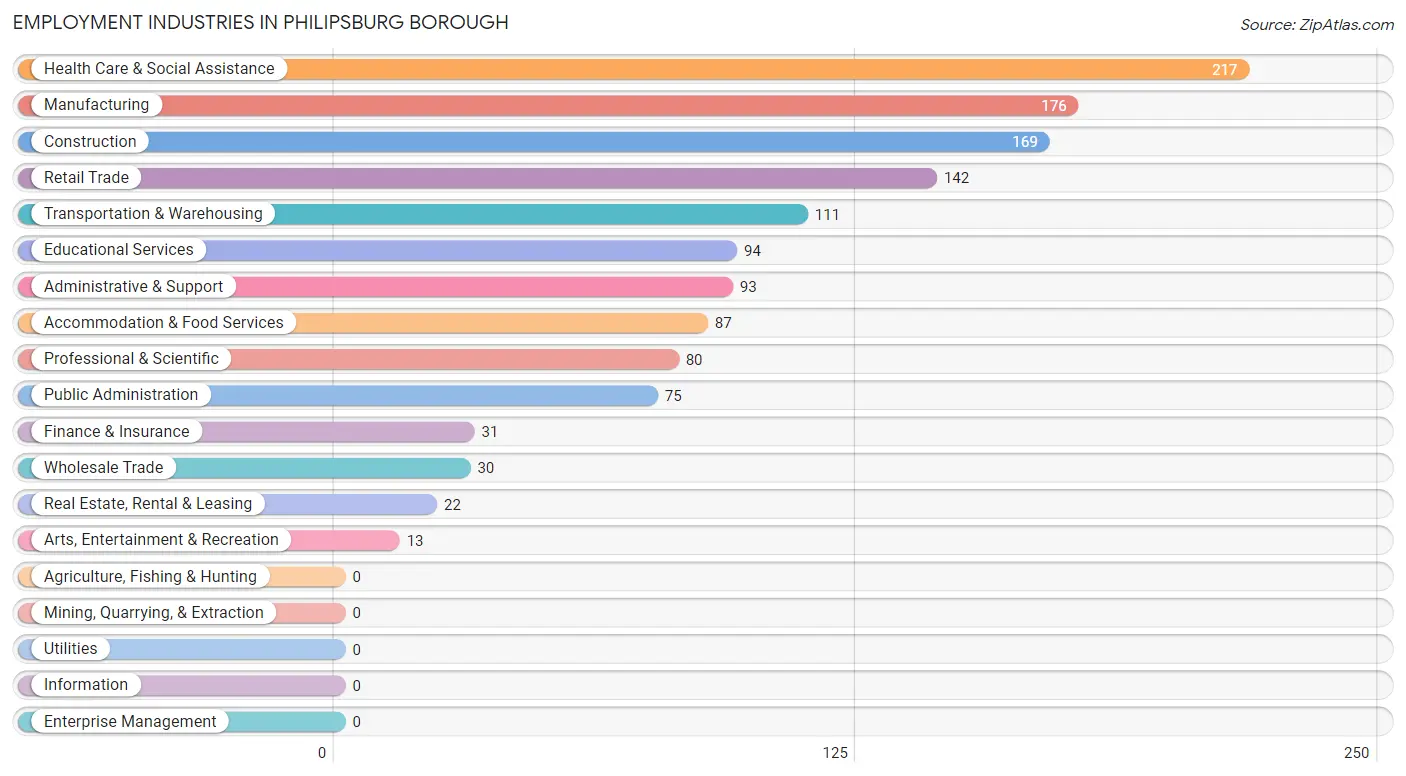
The major employment industries in Philipsburg borough include Health Care & Social Assistance (217 | 15.0%), Manufacturing (176 | 12.1%), Construction (169 | 11.7%), Retail Trade (142 | 9.8%), and Transportation & Warehousing (111 | 7.7%).
Employment Industries by Sex in Philipsburg borough
The Philipsburg borough industries that see more men than women are Construction (100.0%), Professional & Scientific (83.8%), and Transportation & Warehousing (82.9%), whereas the industries that tend to have a higher number of women are Wholesale Trade (100.0%), Arts, Entertainment & Recreation (100.0%), and Health Care & Social Assistance (85.3%).
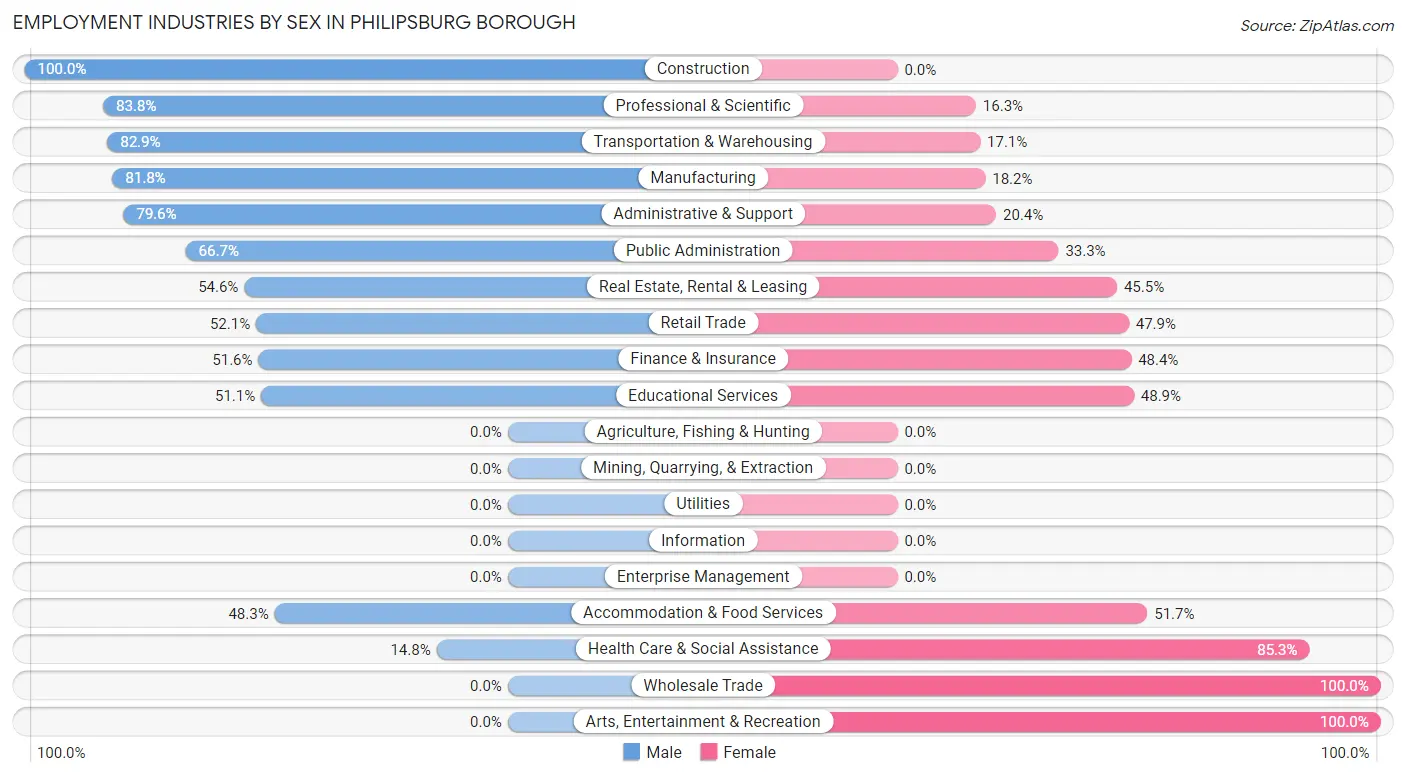
| Industry | Male | Female |
| Agriculture, Fishing & Hunting | 0 (0.0%) | 0 (0.0%) |
| Mining, Quarrying, & Extraction | 0 (0.0%) | 0 (0.0%) |
| Construction | 169 (100.0%) | 0 (0.0%) |
| Manufacturing | 144 (81.8%) | 32 (18.2%) |
| Wholesale Trade | 0 (0.0%) | 30 (100.0%) |
| Retail Trade | 74 (52.1%) | 68 (47.9%) |
| Transportation & Warehousing | 92 (82.9%) | 19 (17.1%) |
| Utilities | 0 (0.0%) | 0 (0.0%) |
| Information | 0 (0.0%) | 0 (0.0%) |
| Finance & Insurance | 16 (51.6%) | 15 (48.4%) |
| Real Estate, Rental & Leasing | 12 (54.5%) | 10 (45.5%) |
| Professional & Scientific | 67 (83.8%) | 13 (16.3%) |
| Enterprise Management | 0 (0.0%) | 0 (0.0%) |
| Administrative & Support | 74 (79.6%) | 19 (20.4%) |
| Educational Services | 48 (51.1%) | 46 (48.9%) |
| Health Care & Social Assistance | 32 (14.7%) | 185 (85.3%) |
| Arts, Entertainment & Recreation | 0 (0.0%) | 13 (100.0%) |
| Accommodation & Food Services | 42 (48.3%) | 45 (51.7%) |
| Public Administration | 50 (66.7%) | 25 (33.3%) |
| Total | 885 (61.1%) | 564 (38.9%) |
Education in Philipsburg borough
School Enrollment in Philipsburg borough
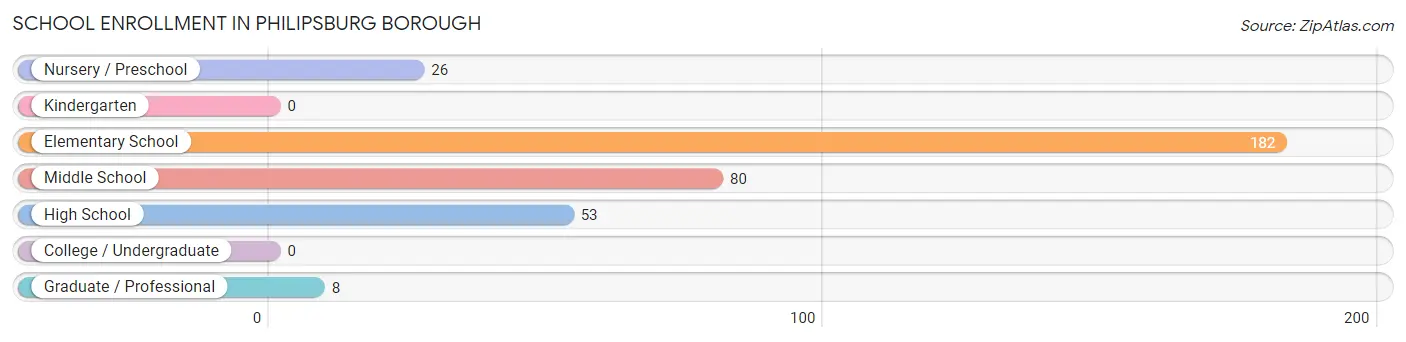
The most common levels of schooling among the 349 students in Philipsburg borough are elementary school (182 | 52.1%), middle school (80 | 22.9%), and high school (53 | 15.2%).
| School Level | # Students | % Students |
| Nursery / Preschool | 26 | 7.4% |
| Kindergarten | 0 | 0.0% |
| Elementary School | 182 | 52.1% |
| Middle School | 80 | 22.9% |
| High School | 53 | 15.2% |
| College / Undergraduate | 0 | 0.0% |
| Graduate / Professional | 8 | 2.3% |
| Total | 349 | 100.0% |
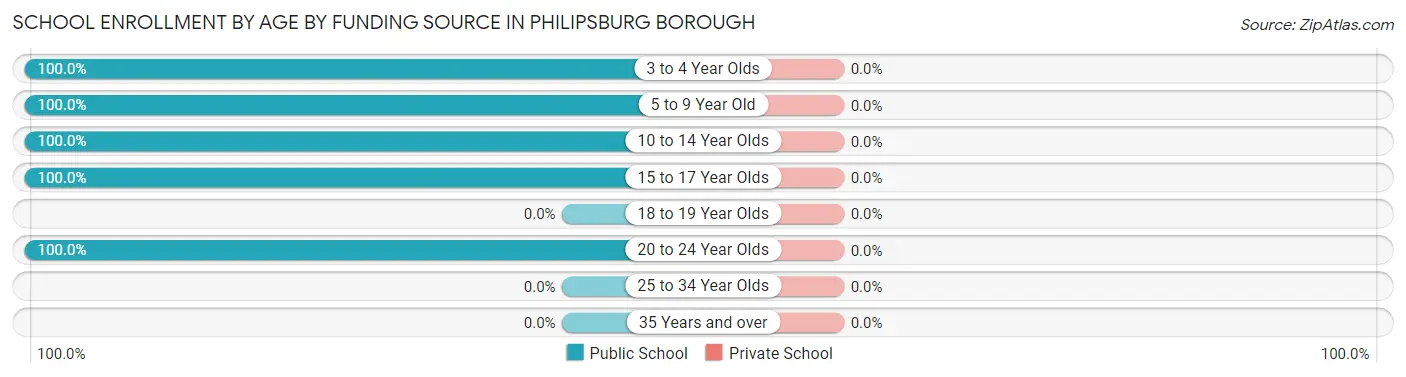
School Enrollment by Age by Funding Source in Philipsburg borough
| Age Bracket | Public School | Private School |
| 3 to 4 Year Olds | 8 (100.0%) | 0 (0.0%) |
| 5 to 9 Year Old | 100 (100.0%) | 0 (0.0%) |
| 10 to 14 Year Olds | 180 (100.0%) | 0 (0.0%) |
| 15 to 17 Year Olds | 53 (100.0%) | 0 (0.0%) |
| 18 to 19 Year Olds | 0 (0.0%) | 0 (0.0%) |
| 20 to 24 Year Olds | 8 (100.0%) | 0 (0.0%) |
| 25 to 34 Year Olds | 0 (0.0%) | 0 (0.0%) |
| 35 Years and over | 0 (0.0%) | 0 (0.0%) |
| Total | 349 (100.0%) | 0 (0.0%) |
Educational Attainment by Field of Study in Philipsburg borough
Science & technology (106 | 18.0%), education (101 | 17.2%), bio, nature & agricultural (96 | 16.3%), arts & humanities (88 | 14.9%), and physical & health sciences (49 | 8.3%) are the most common fields of study among 589 individuals in Philipsburg borough who have obtained a bachelor's degree or higher.
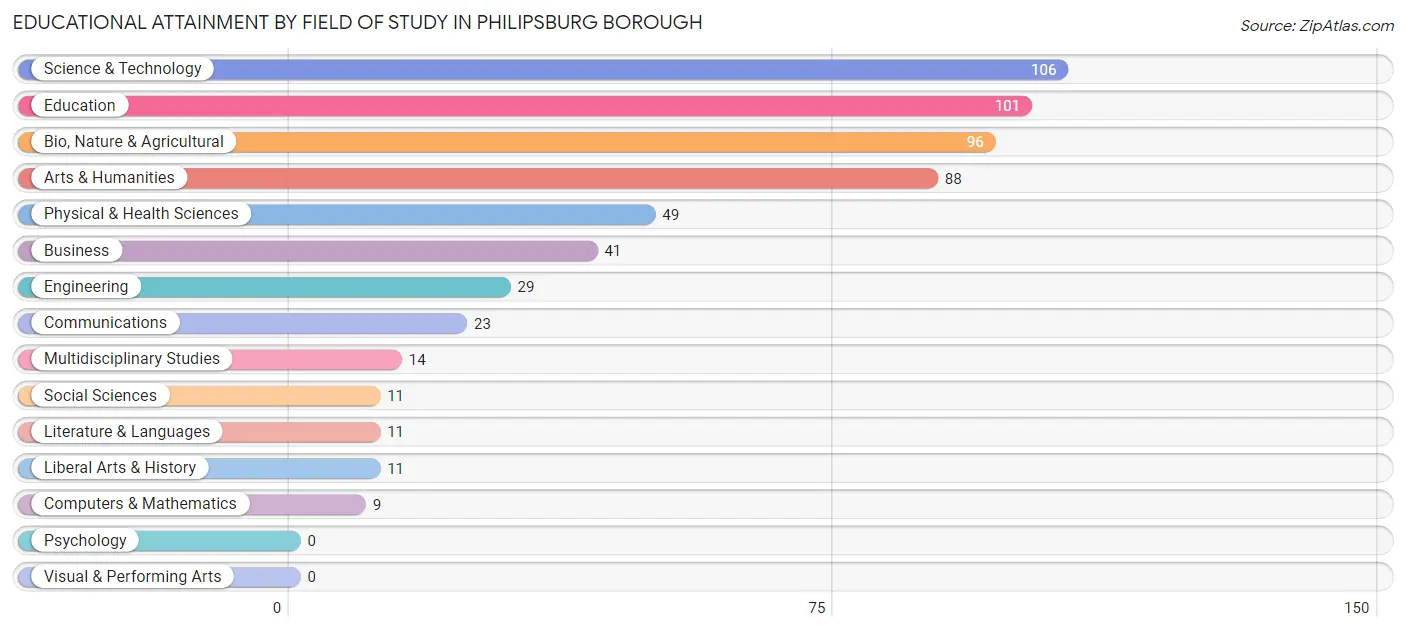
| Field of Study | # Graduates | % Graduates |
| Computers & Mathematics | 9 | 1.5% |
| Bio, Nature & Agricultural | 96 | 16.3% |
| Physical & Health Sciences | 49 | 8.3% |
| Psychology | 0 | 0.0% |
| Social Sciences | 11 | 1.9% |
| Engineering | 29 | 4.9% |
| Multidisciplinary Studies | 14 | 2.4% |
| Science & Technology | 106 | 18.0% |
| Business | 41 | 7.0% |
| Education | 101 | 17.2% |
| Literature & Languages | 11 | 1.9% |
| Liberal Arts & History | 11 | 1.9% |
| Visual & Performing Arts | 0 | 0.0% |
| Communications | 23 | 3.9% |
| Arts & Humanities | 88 | 14.9% |
| Total | 589 | 100.0% |
Transportation & Commute in Philipsburg borough
Vehicle Availability by Sex in Philipsburg borough
The most prevalent vehicle ownership categories in Philipsburg borough are males with 2 vehicles (373, accounting for 42.1%) and females with 2 vehicles (265, making up 67.4%).
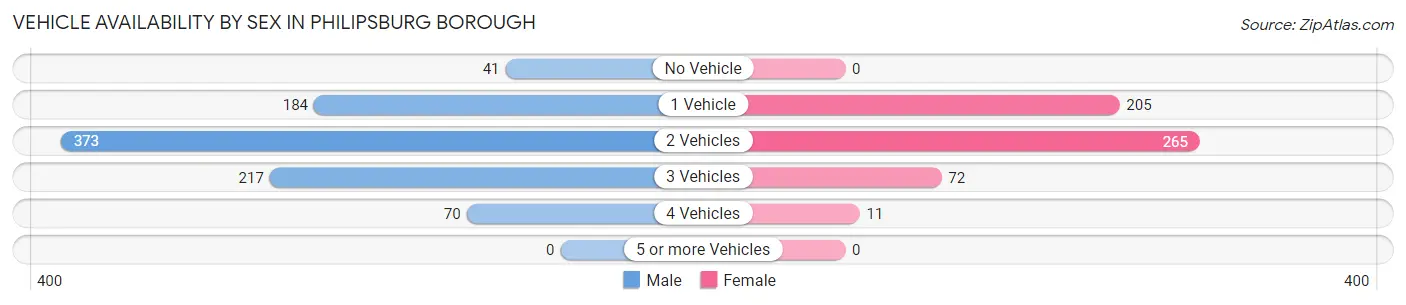
| Vehicles Available | Male | Female |
| No Vehicle | 41 (4.6%) | 0 (0.0%) |
| 1 Vehicle | 184 (20.8%) | 205 (37.1%) |
| 2 Vehicles | 373 (42.1%) | 265 (47.9%) |
| 3 Vehicles | 217 (24.5%) | 72 (13.0%) |
| 4 Vehicles | 70 (7.9%) | 11 (2.0%) |
| 5 or more Vehicles | 0 (0.0%) | 0 (0.0%) |
| Total | 885 (100.0%) | 553 (100.0%) |
Commute Time in Philipsburg borough
The most frequently occuring commute durations in Philipsburg borough are 30 to 34 minutes (432 commuters, 32.2%), 5 to 9 minutes (227 commuters, 16.9%), and 45 to 59 minutes (173 commuters, 12.9%).
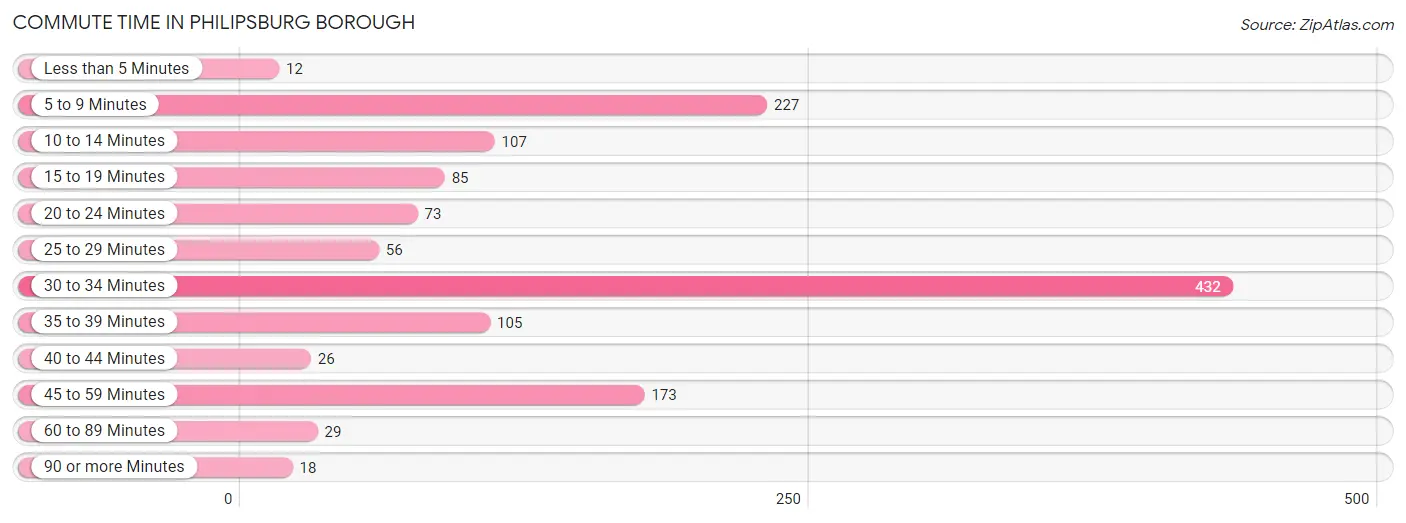
| Commute Time | # Commuters | % Commuters |
| Less than 5 Minutes | 12 | 0.9% |
| 5 to 9 Minutes | 227 | 16.9% |
| 10 to 14 Minutes | 107 | 8.0% |
| 15 to 19 Minutes | 85 | 6.3% |
| 20 to 24 Minutes | 73 | 5.4% |
| 25 to 29 Minutes | 56 | 4.2% |
| 30 to 34 Minutes | 432 | 32.2% |
| 35 to 39 Minutes | 105 | 7.8% |
| 40 to 44 Minutes | 26 | 1.9% |
| 45 to 59 Minutes | 173 | 12.9% |
| 60 to 89 Minutes | 29 | 2.2% |
| 90 or more Minutes | 18 | 1.3% |
Commute Time by Sex in Philipsburg borough
The most common commute times in Philipsburg borough are 30 to 34 minutes (268 commuters, 32.5%) for males and 30 to 34 minutes (164 commuters, 31.7%) for females.
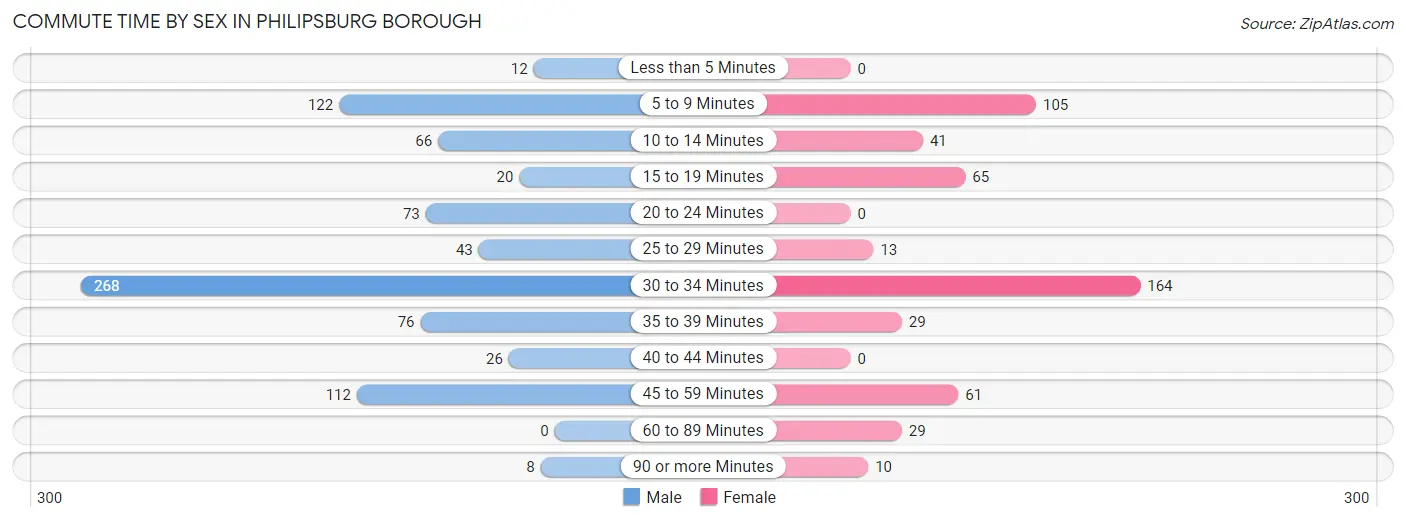
| Commute Time | Male | Female |
| Less than 5 Minutes | 12 (1.5%) | 0 (0.0%) |
| 5 to 9 Minutes | 122 (14.8%) | 105 (20.3%) |
| 10 to 14 Minutes | 66 (8.0%) | 41 (7.9%) |
| 15 to 19 Minutes | 20 (2.4%) | 65 (12.6%) |
| 20 to 24 Minutes | 73 (8.8%) | 0 (0.0%) |
| 25 to 29 Minutes | 43 (5.2%) | 13 (2.5%) |
| 30 to 34 Minutes | 268 (32.5%) | 164 (31.7%) |
| 35 to 39 Minutes | 76 (9.2%) | 29 (5.6%) |
| 40 to 44 Minutes | 26 (3.2%) | 0 (0.0%) |
| 45 to 59 Minutes | 112 (13.6%) | 61 (11.8%) |
| 60 to 89 Minutes | 0 (0.0%) | 29 (5.6%) |
| 90 or more Minutes | 8 (1.0%) | 10 (1.9%) |
Time of Departure to Work by Sex in Philipsburg borough
The most frequent times of departure to work in Philipsburg borough are 6:00 AM to 6:29 AM (212, 25.7%) for males and 7:30 AM to 7:59 AM (80, 15.5%) for females.
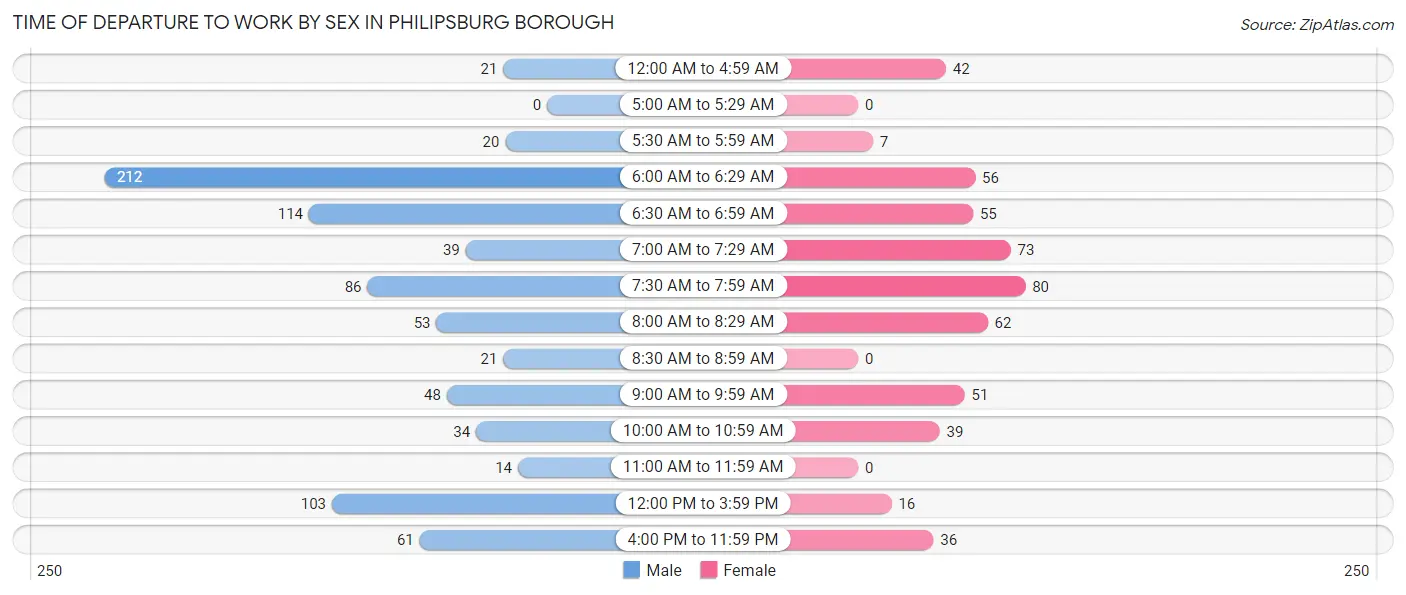
| Time of Departure | Male | Female |
| 12:00 AM to 4:59 AM | 21 (2.5%) | 42 (8.1%) |
| 5:00 AM to 5:29 AM | 0 (0.0%) | 0 (0.0%) |
| 5:30 AM to 5:59 AM | 20 (2.4%) | 7 (1.3%) |
| 6:00 AM to 6:29 AM | 212 (25.7%) | 56 (10.8%) |
| 6:30 AM to 6:59 AM | 114 (13.8%) | 55 (10.6%) |
| 7:00 AM to 7:29 AM | 39 (4.7%) | 73 (14.1%) |
| 7:30 AM to 7:59 AM | 86 (10.4%) | 80 (15.5%) |
| 8:00 AM to 8:29 AM | 53 (6.4%) | 62 (12.0%) |
| 8:30 AM to 8:59 AM | 21 (2.5%) | 0 (0.0%) |
| 9:00 AM to 9:59 AM | 48 (5.8%) | 51 (9.9%) |
| 10:00 AM to 10:59 AM | 34 (4.1%) | 39 (7.5%) |
| 11:00 AM to 11:59 AM | 14 (1.7%) | 0 (0.0%) |
| 12:00 PM to 3:59 PM | 103 (12.5%) | 16 (3.1%) |
| 4:00 PM to 11:59 PM | 61 (7.4%) | 36 (7.0%) |
| Total | 826 (100.0%) | 517 (100.0%) |
Housing Occupancy in Philipsburg borough
Occupancy by Ownership in Philipsburg borough
Of the total 1,364 dwellings in Philipsburg borough, owner-occupied units account for 717 (52.6%), while renter-occupied units make up 647 (47.4%).
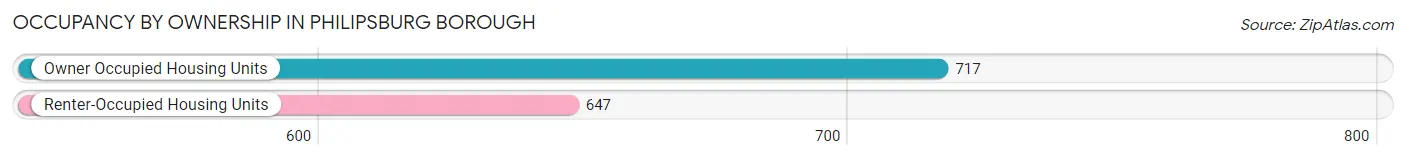
| Occupancy | # Housing Units | % Housing Units |
| Owner Occupied Housing Units | 717 | 52.6% |
| Renter-Occupied Housing Units | 647 | 47.4% |
| Total Occupied Housing Units | 1,364 | 100.0% |
Occupancy by Household Size in Philipsburg borough
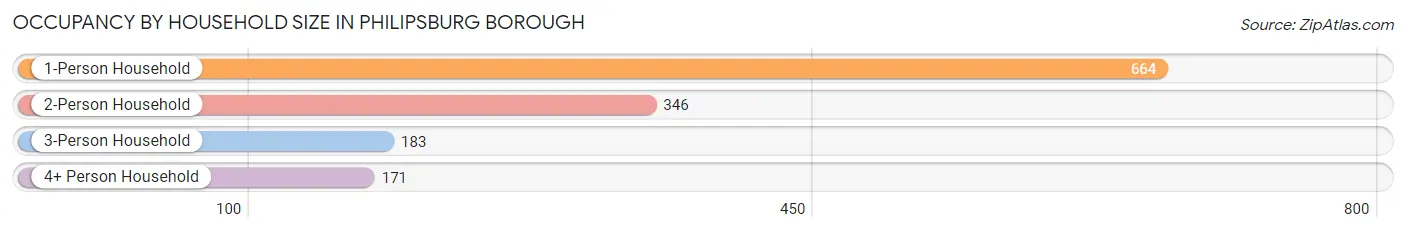
| Household Size | # Housing Units | % Housing Units |
| 1-Person Household | 664 | 48.7% |
| 2-Person Household | 346 | 25.4% |
| 3-Person Household | 183 | 13.4% |
| 4+ Person Household | 171 | 12.5% |
| Total Housing Units | 1,364 | 100.0% |
Occupancy by Ownership by Household Size in Philipsburg borough
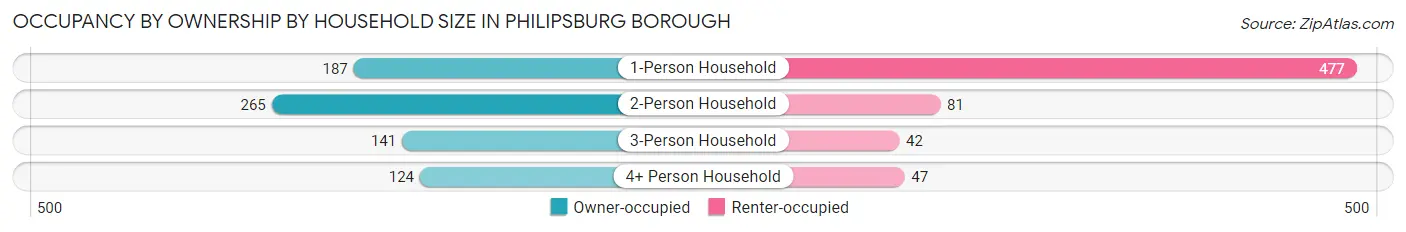
| Household Size | Owner-occupied | Renter-occupied |
| 1-Person Household | 187 (28.2%) | 477 (71.8%) |
| 2-Person Household | 265 (76.6%) | 81 (23.4%) |
| 3-Person Household | 141 (77.0%) | 42 (23.0%) |
| 4+ Person Household | 124 (72.5%) | 47 (27.5%) |
| Total Housing Units | 717 (52.6%) | 647 (47.4%) |
Occupancy by Educational Attainment in Philipsburg borough
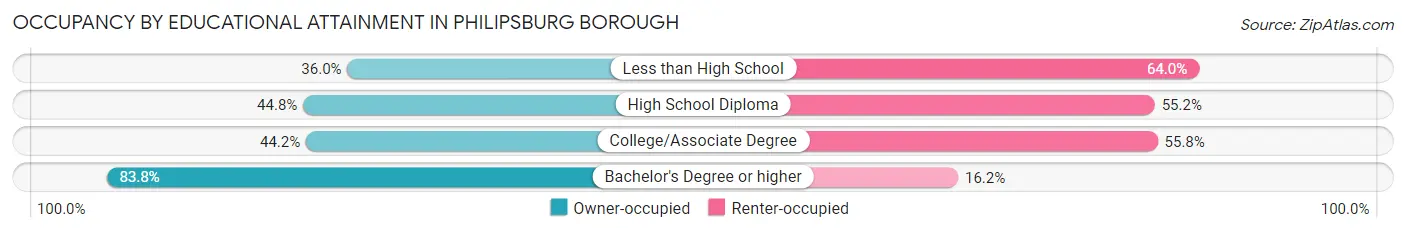
| Household Size | Owner-occupied | Renter-occupied |
| Less than High School | 45 (36.0%) | 80 (64.0%) |
| High School Diploma | 197 (44.8%) | 243 (55.2%) |
| College/Associate Degree | 217 (44.2%) | 274 (55.8%) |
| Bachelor's Degree or higher | 258 (83.8%) | 50 (16.2%) |
Occupancy by Age of Householder in Philipsburg borough
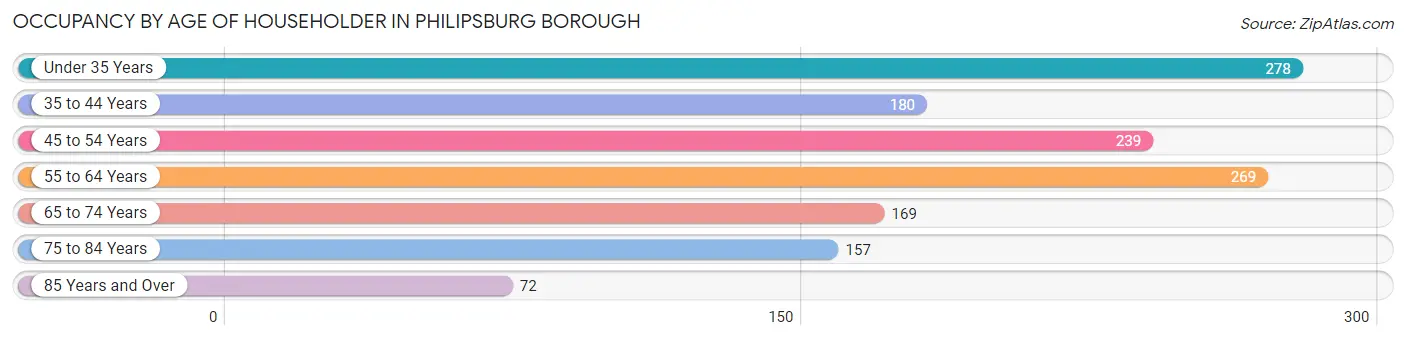
| Age Bracket | # Households | % Households |
| Under 35 Years | 278 | 20.4% |
| 35 to 44 Years | 180 | 13.2% |
| 45 to 54 Years | 239 | 17.5% |
| 55 to 64 Years | 269 | 19.7% |
| 65 to 74 Years | 169 | 12.4% |
| 75 to 84 Years | 157 | 11.5% |
| 85 Years and Over | 72 | 5.3% |
| Total | 1,364 | 100.0% |
Housing Finances in Philipsburg borough
Median Income by Occupancy in Philipsburg borough
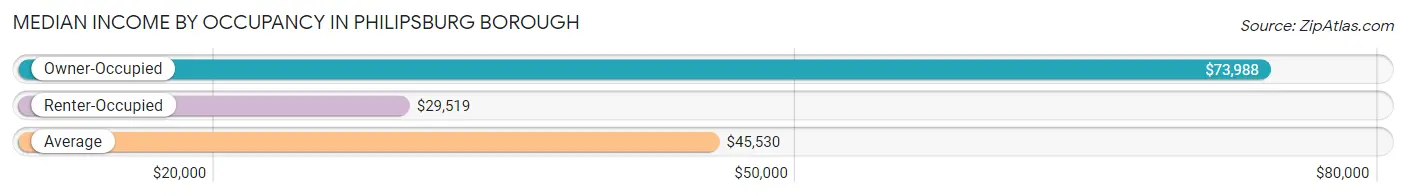
| Occupancy Type | # Households | Median Income |
| Owner-Occupied | 717 (52.6%) | $73,988 |
| Renter-Occupied | 647 (47.4%) | $29,519 |
| Average | 1,364 (100.0%) | $45,530 |
Occupancy by Householder Income Bracket in Philipsburg borough
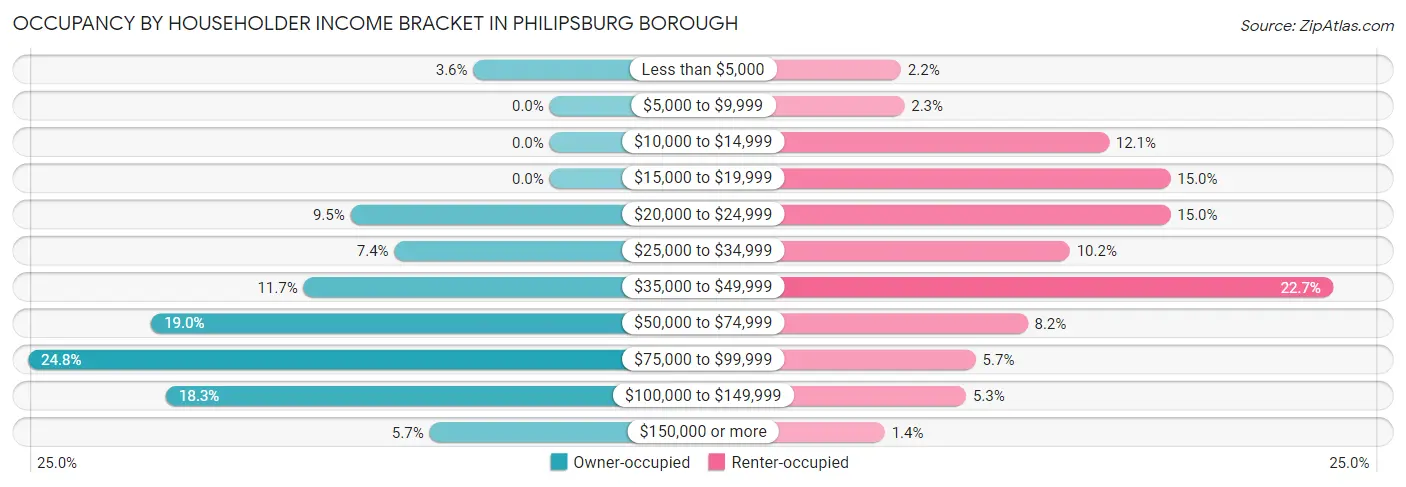
| Income Bracket | Owner-occupied | Renter-occupied |
| Less than $5,000 | 26 (3.6%) | 14 (2.2%) |
| $5,000 to $9,999 | 0 (0.0%) | 15 (2.3%) |
| $10,000 to $14,999 | 0 (0.0%) | 78 (12.1%) |
| $15,000 to $19,999 | 0 (0.0%) | 97 (15.0%) |
| $20,000 to $24,999 | 68 (9.5%) | 97 (15.0%) |
| $25,000 to $34,999 | 53 (7.4%) | 66 (10.2%) |
| $35,000 to $49,999 | 84 (11.7%) | 147 (22.7%) |
| $50,000 to $74,999 | 136 (19.0%) | 53 (8.2%) |
| $75,000 to $99,999 | 178 (24.8%) | 37 (5.7%) |
| $100,000 to $149,999 | 131 (18.3%) | 34 (5.3%) |
| $150,000 or more | 41 (5.7%) | 9 (1.4%) |
| Total | 717 (100.0%) | 647 (100.0%) |
Monthly Housing Cost Tiers in Philipsburg borough
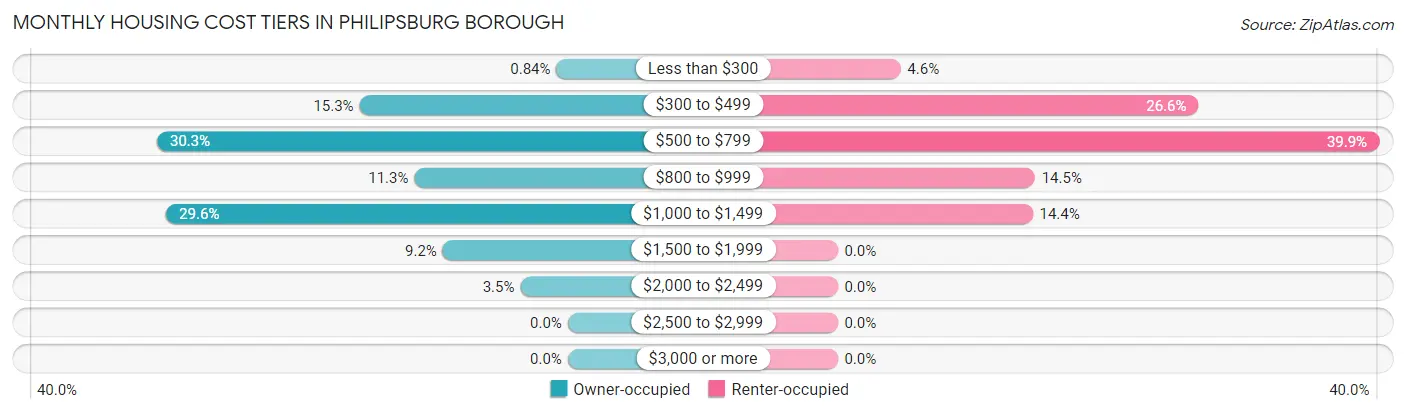
| Monthly Cost | Owner-occupied | Renter-occupied |
| Less than $300 | 6 (0.8%) | 30 (4.6%) |
| $300 to $499 | 110 (15.3%) | 172 (26.6%) |
| $500 to $799 | 217 (30.3%) | 258 (39.9%) |
| $800 to $999 | 81 (11.3%) | 94 (14.5%) |
| $1,000 to $1,499 | 212 (29.6%) | 93 (14.4%) |
| $1,500 to $1,999 | 66 (9.2%) | 0 (0.0%) |
| $2,000 to $2,499 | 25 (3.5%) | 0 (0.0%) |
| $2,500 to $2,999 | 0 (0.0%) | 0 (0.0%) |
| $3,000 or more | 0 (0.0%) | 0 (0.0%) |
| Total | 717 (100.0%) | 647 (100.0%) |
Physical Housing Characteristics in Philipsburg borough
Housing Structures in Philipsburg borough
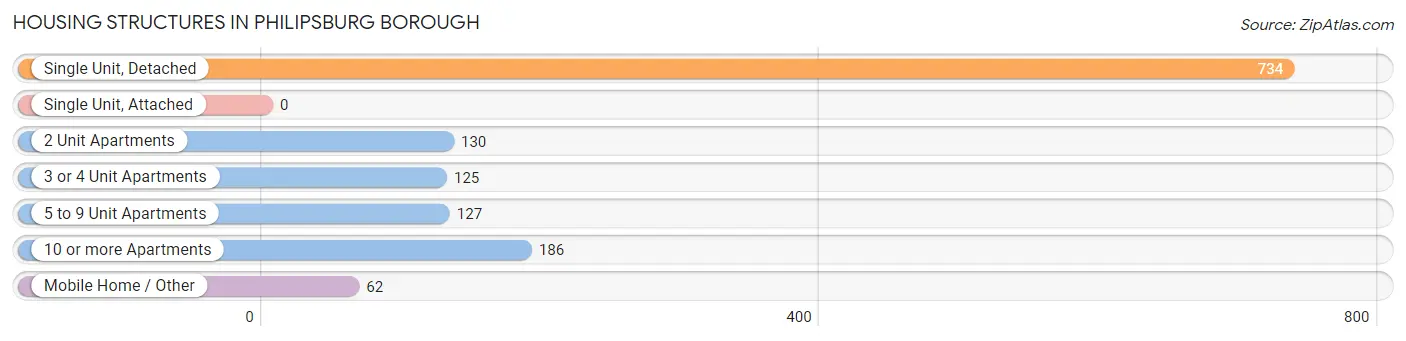
| Structure Type | # Housing Units | % Housing Units |
| Single Unit, Detached | 734 | 53.8% |
| Single Unit, Attached | 0 | 0.0% |
| 2 Unit Apartments | 130 | 9.5% |
| 3 or 4 Unit Apartments | 125 | 9.2% |
| 5 to 9 Unit Apartments | 127 | 9.3% |
| 10 or more Apartments | 186 | 13.6% |
| Mobile Home / Other | 62 | 4.5% |
| Total | 1,364 | 100.0% |
Housing Structures by Occupancy in Philipsburg borough
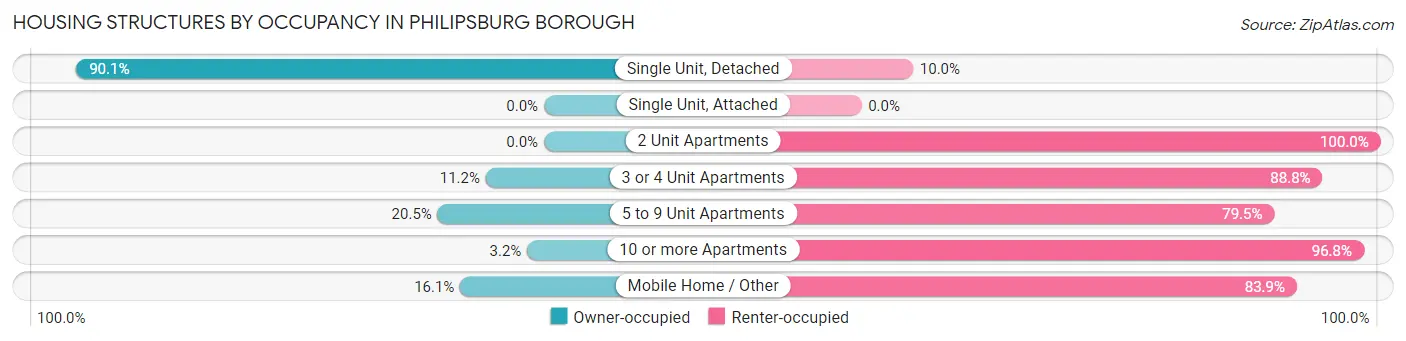
| Structure Type | Owner-occupied | Renter-occupied |
| Single Unit, Detached | 661 (90.0%) | 73 (10.0%) |
| Single Unit, Attached | 0 (0.0%) | 0 (0.0%) |
| 2 Unit Apartments | 0 (0.0%) | 130 (100.0%) |
| 3 or 4 Unit Apartments | 14 (11.2%) | 111 (88.8%) |
| 5 to 9 Unit Apartments | 26 (20.5%) | 101 (79.5%) |
| 10 or more Apartments | 6 (3.2%) | 180 (96.8%) |
| Mobile Home / Other | 10 (16.1%) | 52 (83.9%) |
| Total | 717 (52.6%) | 647 (47.4%) |
Housing Structures by Number of Rooms in Philipsburg borough
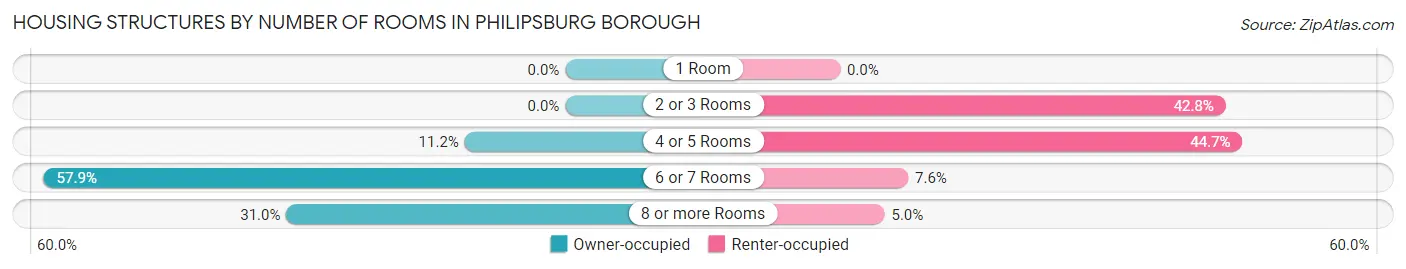
| Number of Rooms | Owner-occupied | Renter-occupied |
| 1 Room | 0 (0.0%) | 0 (0.0%) |
| 2 or 3 Rooms | 0 (0.0%) | 277 (42.8%) |
| 4 or 5 Rooms | 80 (11.2%) | 289 (44.7%) |
| 6 or 7 Rooms | 415 (57.9%) | 49 (7.6%) |
| 8 or more Rooms | 222 (31.0%) | 32 (5.0%) |
| Total | 717 (100.0%) | 647 (100.0%) |
Housing Structure by Heating Type in Philipsburg borough
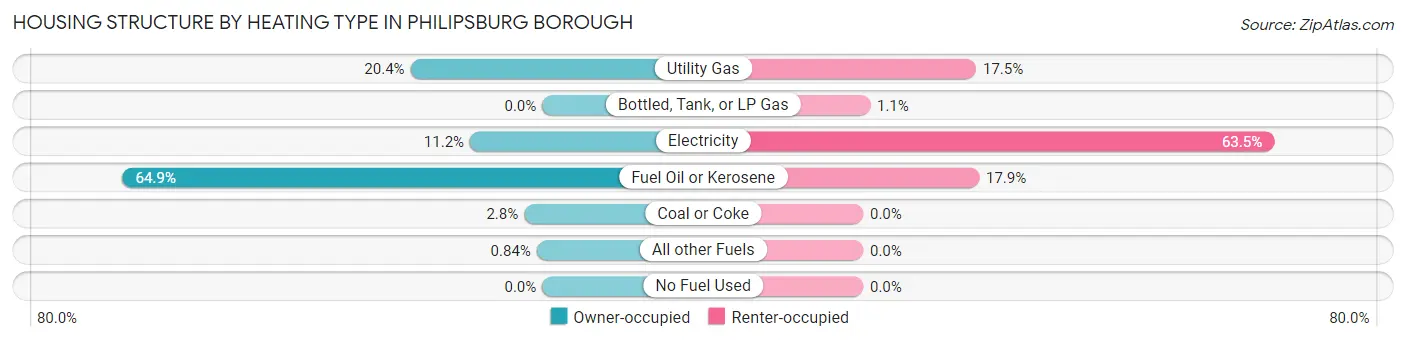
| Heating Type | Owner-occupied | Renter-occupied |
| Utility Gas | 146 (20.4%) | 113 (17.5%) |
| Bottled, Tank, or LP Gas | 0 (0.0%) | 7 (1.1%) |
| Electricity | 80 (11.2%) | 411 (63.5%) |
| Fuel Oil or Kerosene | 465 (64.8%) | 116 (17.9%) |
| Coal or Coke | 20 (2.8%) | 0 (0.0%) |
| All other Fuels | 6 (0.8%) | 0 (0.0%) |
| No Fuel Used | 0 (0.0%) | 0 (0.0%) |
| Total | 717 (100.0%) | 647 (100.0%) |
Household Vehicle Usage in Philipsburg borough
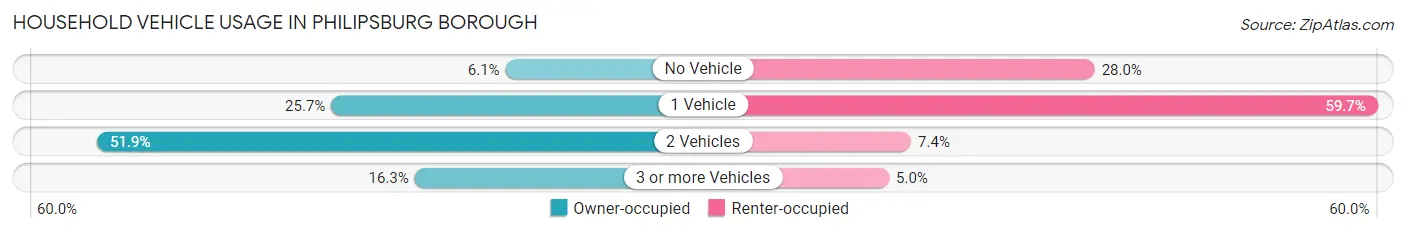
| Vehicles per Household | Owner-occupied | Renter-occupied |
| No Vehicle | 44 (6.1%) | 181 (28.0%) |
| 1 Vehicle | 184 (25.7%) | 386 (59.7%) |
| 2 Vehicles | 372 (51.9%) | 48 (7.4%) |
| 3 or more Vehicles | 117 (16.3%) | 32 (5.0%) |
| Total | 717 (100.0%) | 647 (100.0%) |
Real Estate & Mortgages in Philipsburg borough
Real Estate and Mortgage Overview in Philipsburg borough
| Characteristic | Without Mortgage | With Mortgage |
| Housing Units | 292 | 425 |
| Median Property Value | $150,700 | $112,600 |
| Median Household Income | $59,375 | $28 |
| Monthly Housing Costs | $552 | $0 |
| Real Estate Taxes | $1,580 | $0 |
Property Value by Mortgage Status in Philipsburg borough
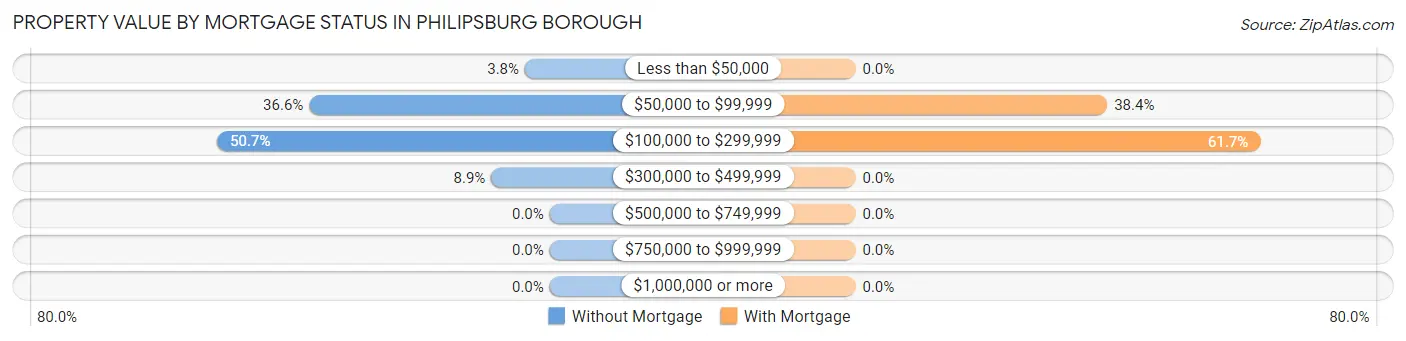
| Property Value | Without Mortgage | With Mortgage |
| Less than $50,000 | 11 (3.8%) | 0 (0.0%) |
| $50,000 to $99,999 | 107 (36.6%) | 163 (38.4%) |
| $100,000 to $299,999 | 148 (50.7%) | 262 (61.7%) |
| $300,000 to $499,999 | 26 (8.9%) | 0 (0.0%) |
| $500,000 to $749,999 | 0 (0.0%) | 0 (0.0%) |
| $750,000 to $999,999 | 0 (0.0%) | 0 (0.0%) |
| $1,000,000 or more | 0 (0.0%) | 0 (0.0%) |
| Total | 292 (100.0%) | 425 (100.0%) |
Household Income by Mortgage Status in Philipsburg borough
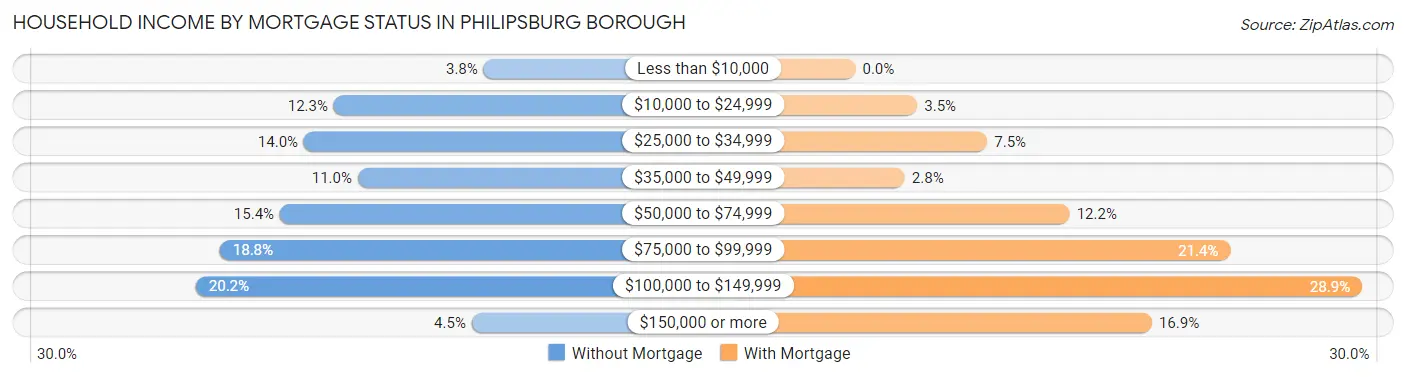
| Household Income | Without Mortgage | With Mortgage |
| Less than $10,000 | 11 (3.8%) | 0 (0.0%) |
| $10,000 to $24,999 | 36 (12.3%) | 15 (3.5%) |
| $25,000 to $34,999 | 41 (14.0%) | 32 (7.5%) |
| $35,000 to $49,999 | 32 (11.0%) | 12 (2.8%) |
| $50,000 to $74,999 | 45 (15.4%) | 52 (12.2%) |
| $75,000 to $99,999 | 55 (18.8%) | 91 (21.4%) |
| $100,000 to $149,999 | 59 (20.2%) | 123 (28.9%) |
| $150,000 or more | 13 (4.4%) | 72 (16.9%) |
| Total | 292 (100.0%) | 425 (100.0%) |
Property Value to Household Income Ratio in Philipsburg borough
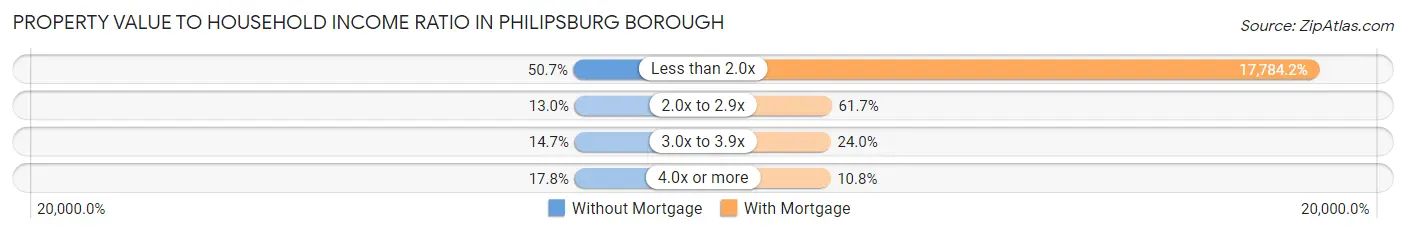
| Value-to-Income Ratio | Without Mortgage | With Mortgage |
| Less than 2.0x | 148 (50.7%) | 75,583 (17,784.2%) |
| 2.0x to 2.9x | 38 (13.0%) | 262 (61.7%) |
| 3.0x to 3.9x | 43 (14.7%) | 102 (24.0%) |
| 4.0x or more | 52 (17.8%) | 46 (10.8%) |
| Total | 292 (100.0%) | 425 (100.0%) |
Real Estate Taxes by Mortgage Status in Philipsburg borough
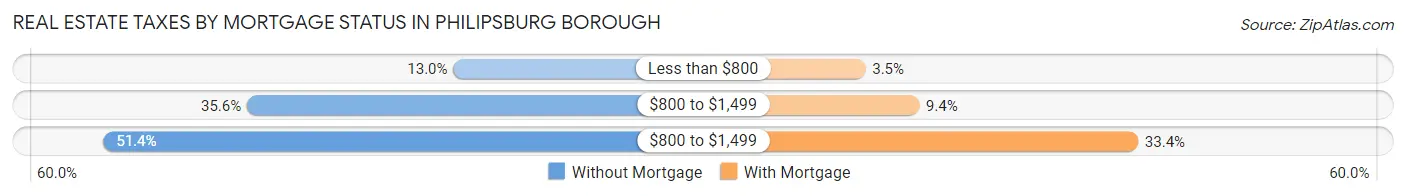
| Property Taxes | Without Mortgage | With Mortgage |
| Less than $800 | 38 (13.0%) | 15 (3.5%) |
| $800 to $1,499 | 104 (35.6%) | 40 (9.4%) |
| $800 to $1,499 | 150 (51.4%) | 142 (33.4%) |
| Total | 292 (100.0%) | 425 (100.0%) |
Health & Disability in Philipsburg borough
Health Insurance Coverage by Age in Philipsburg borough
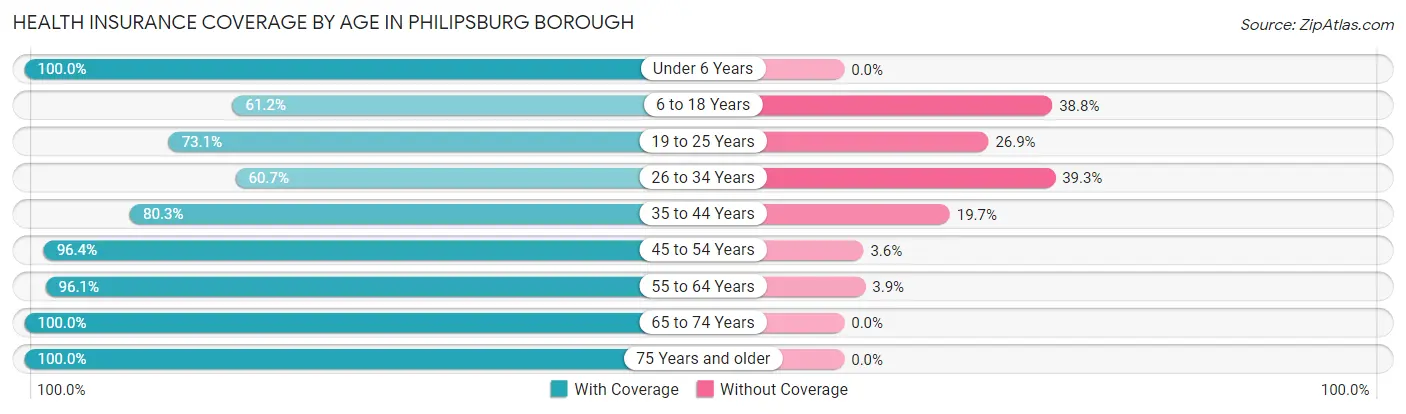
| Age Bracket | With Coverage | Without Coverage |
| Under 6 Years | 135 (100.0%) | 0 (0.0%) |
| 6 to 18 Years | 210 (61.2%) | 133 (38.8%) |
| 19 to 25 Years | 321 (73.1%) | 118 (26.9%) |
| 26 to 34 Years | 182 (60.7%) | 118 (39.3%) |
| 35 to 44 Years | 249 (80.3%) | 61 (19.7%) |
| 45 to 54 Years | 378 (96.4%) | 14 (3.6%) |
| 55 to 64 Years | 368 (96.1%) | 15 (3.9%) |
| 65 to 74 Years | 238 (100.0%) | 0 (0.0%) |
| 75 Years and older | 242 (100.0%) | 0 (0.0%) |
| Total | 2,323 (83.5%) | 459 (16.5%) |
Health Insurance Coverage by Citizenship Status in Philipsburg borough
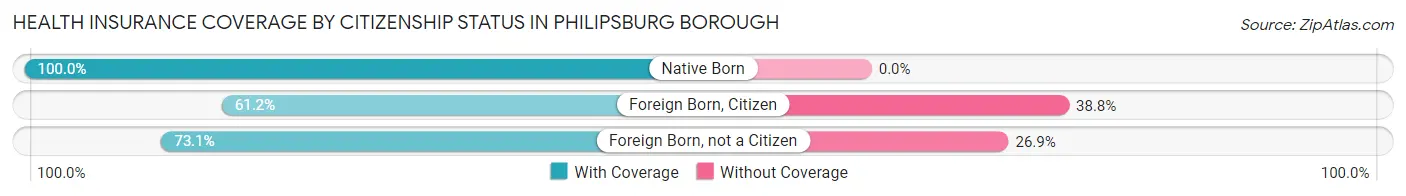
| Citizenship Status | With Coverage | Without Coverage |
| Native Born | 135 (100.0%) | 0 (0.0%) |
| Foreign Born, Citizen | 210 (61.2%) | 133 (38.8%) |
| Foreign Born, not a Citizen | 321 (73.1%) | 118 (26.9%) |
Health Insurance Coverage by Household Income in Philipsburg borough
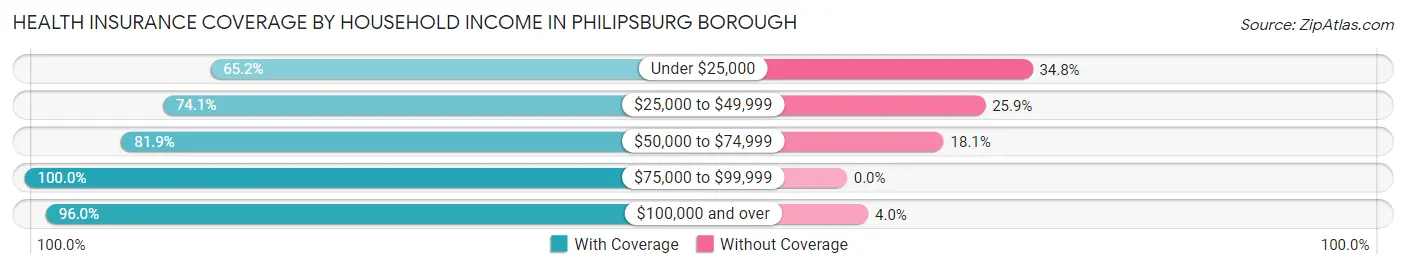
| Household Income | With Coverage | Without Coverage |
| Under $25,000 | 392 (65.2%) | 209 (34.8%) |
| $25,000 to $49,999 | 417 (74.1%) | 146 (25.9%) |
| $50,000 to $74,999 | 352 (81.9%) | 78 (18.1%) |
| $75,000 to $99,999 | 534 (100.0%) | 0 (0.0%) |
| $100,000 and over | 625 (96.0%) | 26 (4.0%) |
Public vs Private Health Insurance Coverage by Age in Philipsburg borough
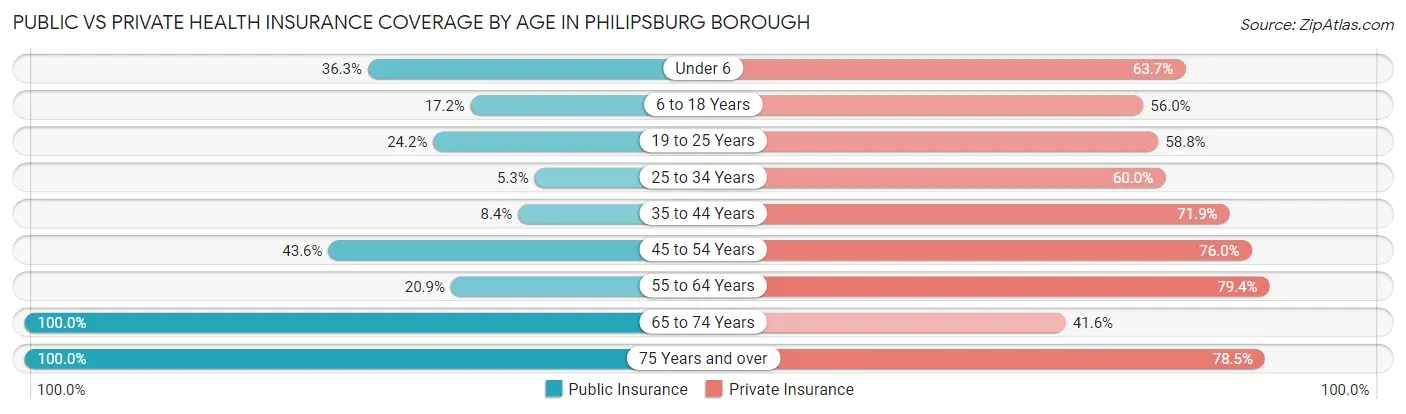
| Age Bracket | Public Insurance | Private Insurance |
| Under 6 | 49 (36.3%) | 86 (63.7%) |
| 6 to 18 Years | 59 (17.2%) | 192 (56.0%) |
| 19 to 25 Years | 106 (24.1%) | 258 (58.8%) |
| 25 to 34 Years | 16 (5.3%) | 180 (60.0%) |
| 35 to 44 Years | 26 (8.4%) | 223 (71.9%) |
| 45 to 54 Years | 171 (43.6%) | 298 (76.0%) |
| 55 to 64 Years | 80 (20.9%) | 304 (79.4%) |
| 65 to 74 Years | 238 (100.0%) | 99 (41.6%) |
| 75 Years and over | 242 (100.0%) | 190 (78.5%) |
| Total | 987 (35.5%) | 1,830 (65.8%) |
Disability Status by Sex by Age in Philipsburg borough
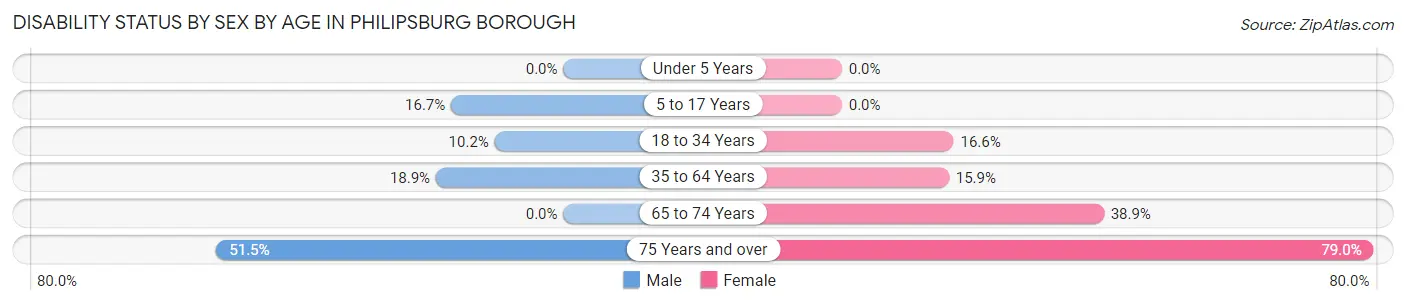
| Age Bracket | Male | Female |
| Under 5 Years | 0 (0.0%) | 0 (0.0%) |
| 5 to 17 Years | 39 (16.7%) | 0 (0.0%) |
| 18 to 34 Years | 52 (10.2%) | 38 (16.6%) |
| 35 to 64 Years | 116 (18.9%) | 75 (15.9%) |
| 65 to 74 Years | 0 (0.0%) | 63 (38.9%) |
| 75 Years and over | 17 (51.5%) | 165 (78.9%) |
Disability Class by Sex by Age in Philipsburg borough
Disability Class: Hearing Difficulty
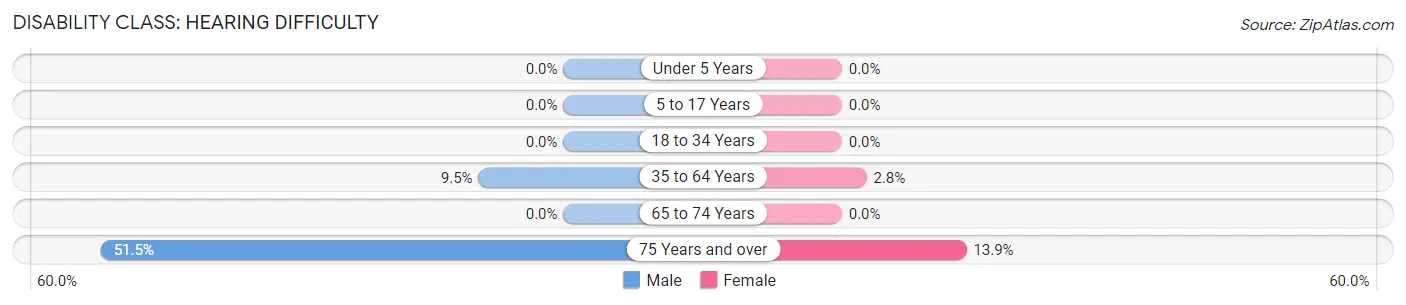
| Age Bracket | Male | Female |
| Under 5 Years | 0 (0.0%) | 0 (0.0%) |
| 5 to 17 Years | 0 (0.0%) | 0 (0.0%) |
| 18 to 34 Years | 0 (0.0%) | 0 (0.0%) |
| 35 to 64 Years | 58 (9.5%) | 13 (2.8%) |
| 65 to 74 Years | 0 (0.0%) | 0 (0.0%) |
| 75 Years and over | 17 (51.5%) | 29 (13.9%) |
Disability Class: Vision Difficulty
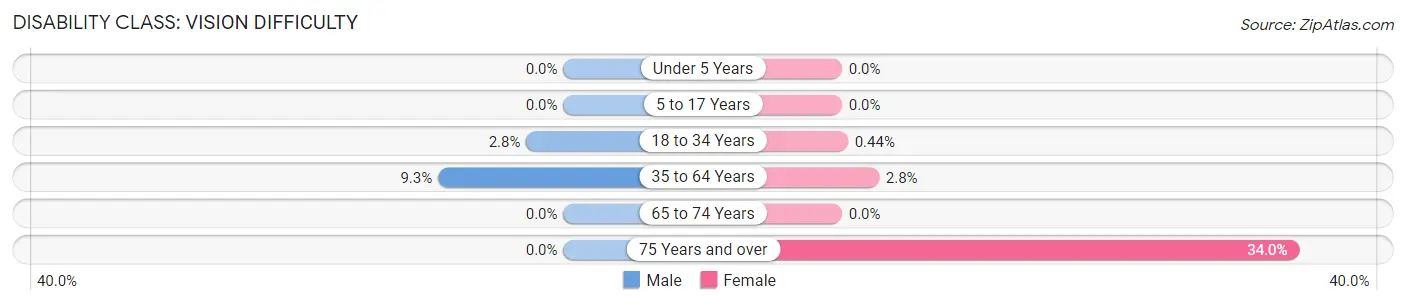
| Age Bracket | Male | Female |
| Under 5 Years | 0 (0.0%) | 0 (0.0%) |
| 5 to 17 Years | 0 (0.0%) | 0 (0.0%) |
| 18 to 34 Years | 14 (2.8%) | 1 (0.4%) |
| 35 to 64 Years | 57 (9.3%) | 13 (2.8%) |
| 65 to 74 Years | 0 (0.0%) | 0 (0.0%) |
| 75 Years and over | 0 (0.0%) | 71 (34.0%) |
Disability Class: Cognitive Difficulty
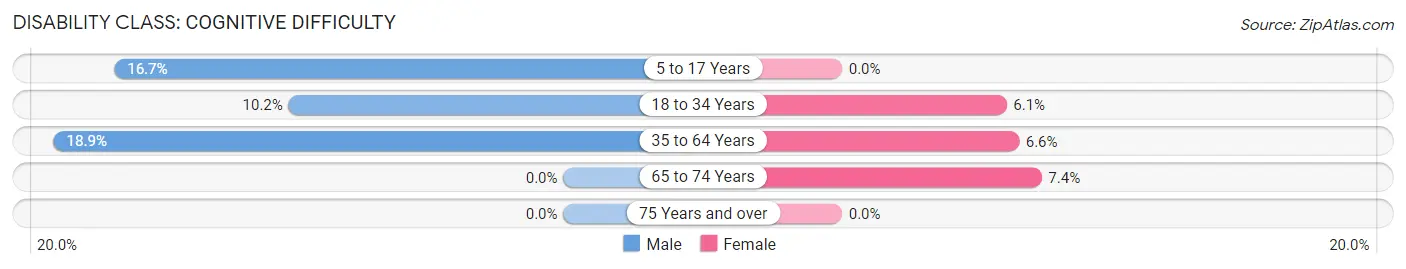
| Age Bracket | Male | Female |
| 5 to 17 Years | 39 (16.7%) | 0 (0.0%) |
| 18 to 34 Years | 52 (10.2%) | 14 (6.1%) |
| 35 to 64 Years | 116 (18.9%) | 31 (6.6%) |
| 65 to 74 Years | 0 (0.0%) | 12 (7.4%) |
| 75 Years and over | 0 (0.0%) | 0 (0.0%) |
Disability Class: Ambulatory Difficulty
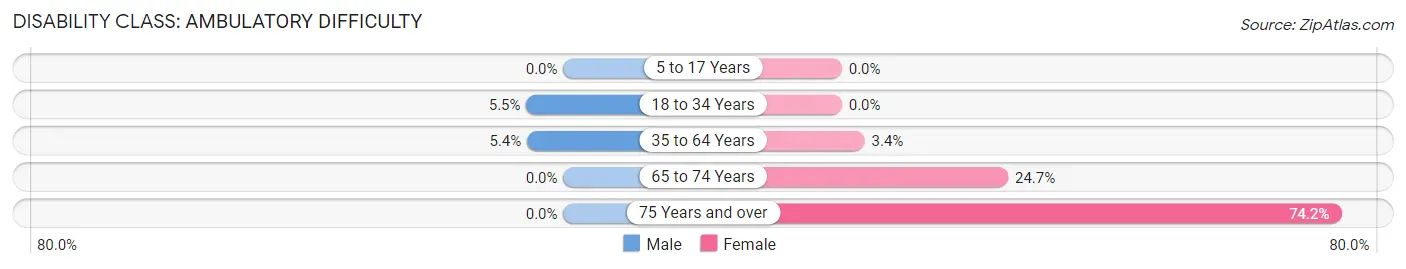
| Age Bracket | Male | Female |
| 5 to 17 Years | 0 (0.0%) | 0 (0.0%) |
| 18 to 34 Years | 28 (5.5%) | 0 (0.0%) |
| 35 to 64 Years | 33 (5.4%) | 16 (3.4%) |
| 65 to 74 Years | 0 (0.0%) | 40 (24.7%) |
| 75 Years and over | 0 (0.0%) | 155 (74.2%) |
Disability Class: Self-Care Difficulty
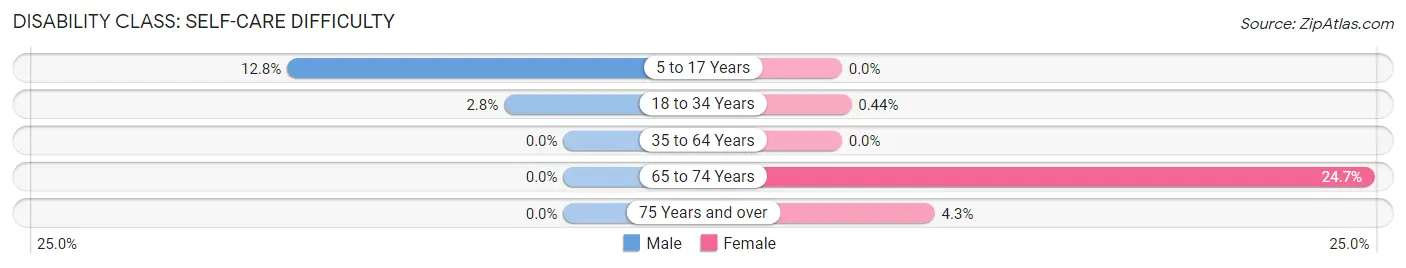
| Age Bracket | Male | Female |
| 5 to 17 Years | 30 (12.8%) | 0 (0.0%) |
| 18 to 34 Years | 14 (2.8%) | 1 (0.4%) |
| 35 to 64 Years | 0 (0.0%) | 0 (0.0%) |
| 65 to 74 Years | 0 (0.0%) | 40 (24.7%) |
| 75 Years and over | 0 (0.0%) | 9 (4.3%) |
Technology Access in Philipsburg borough
Computing Device Access in Philipsburg borough
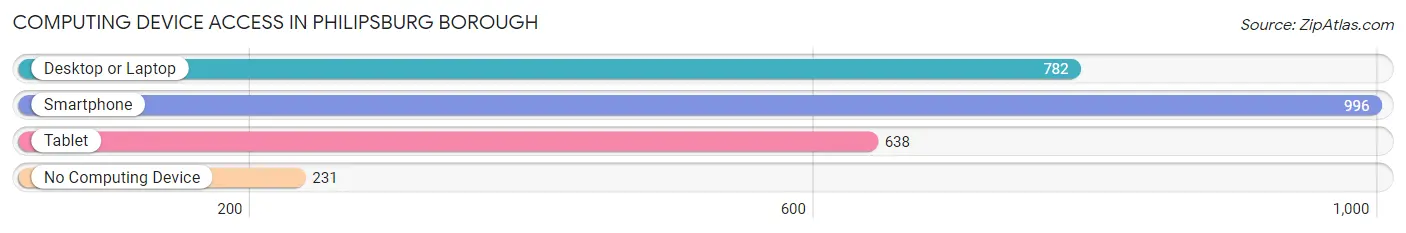
| Device Type | # Households | % Households |
| Desktop or Laptop | 782 | 57.3% |
| Smartphone | 996 | 73.0% |
| Tablet | 638 | 46.8% |
| No Computing Device | 231 | 16.9% |
| Total | 1,364 | 100.0% |
Internet Access in Philipsburg borough
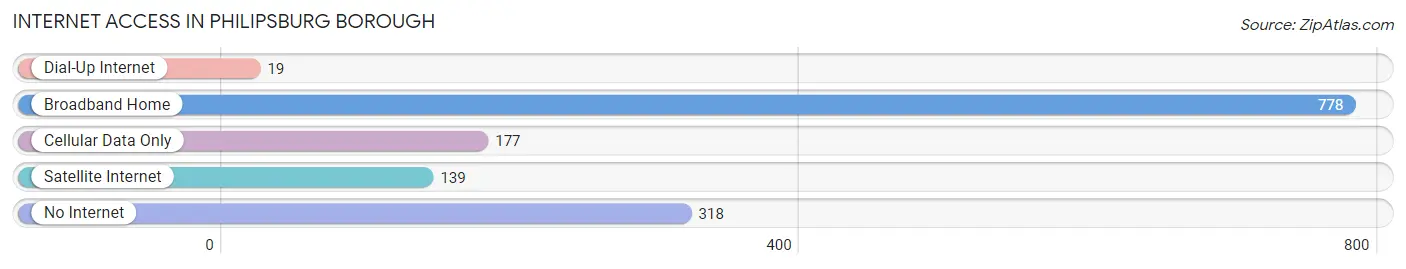
| Internet Type | # Households | % Households |
| Dial-Up Internet | 19 | 1.4% |
| Broadband Home | 778 | 57.0% |
| Cellular Data Only | 177 | 13.0% |
| Satellite Internet | 139 | 10.2% |
| No Internet | 318 | 23.3% |
| Total | 1,364 | 100.0% |
Philipsburg borough Summary
Philipsburg Borough is a borough located in Centre County, Pennsylvania, United States. It is part of the State College, Pennsylvania Metropolitan Statistical Area. The population was 2,890 at the 2010 census.
History
The area that is now Philipsburg Borough was first settled in 1795 by John Philips, a Revolutionary War veteran. Philips built a log cabin and a grist mill on the banks of Bald Eagle Creek. The area was known as Philipsburg until 1831, when it was incorporated as a borough.
The town grew rapidly in the 19th century, becoming a center of industry and commerce. The Philipsburg Manufacturing Company was established in 1845 and produced a variety of products, including woolen goods, leather, and paper. The Philipsburg Foundry and Machine Shop was established in 1854 and produced a variety of products, including stoves, plows, and threshing machines. The Philipsburg National Bank was established in 1864 and is still in operation today.
The town was also home to several other businesses, including a tannery, a brewery, a distillery, a brickyard, and a furniture factory. The town was also home to several churches, including the First Presbyterian Church, which was established in 1817.
Geography
Philipsburg Borough is located at 40°51'17" North, 78°1'17" West (40.854722, -78.021389). According to the United States Census Bureau, the borough has a total area of 1.2 square miles (3.1 km2), all of it land.
Economy
The economy of Philipsburg Borough is largely based on tourism and retail. The town is home to several restaurants, shops, and other businesses. The Philipsburg National Bank is the largest employer in the borough. Other major employers include the Philipsburg Manufacturing Company, the Philipsburg Foundry and Machine Shop, and the Philipsburg Tannery.
Demographics
As of the census of 2010, there were 2,890 people, 1,220 households, and 745 families residing in the borough. The population density was 2,408.3 people per square mile (929.7/km2). There were 1,320 housing units at an average density of 1,093.3 per square mile (422.3/km2). The racial makeup of the borough was 97.2% White, 0.7% African American, 0.2% Native American, 0.4% Asian, 0.1% Pacific Islander, 0.4% from other races, and 1.0% from two or more races. Hispanic or Latino of any race were 1.2% of the population.
There were 1,220 households, out of which 28.2% had children under the age of 18 living with them, 44.2% were married couples living together, 13.2% had a female householder with no husband present, and 37.2% were non-families. 32.2% of all households were made up of individuals, and 14.2% had someone living alone who was 65 years of age or older. The average household size was 2.35 and the average family size was 2.94.
In the borough the population was spread out, with 24.2% under the age of 18, 8.2% from 18 to 24, 28.2% from 25 to 44, 22.2% from 45 to 64, and 17.2% who were 65 years of age or older. The median age was 38 years. For every 100 females, there were 91.2 males. For every 100 females age 18 and over, there were 87.2 males.
The median income for a household in the borough was $35,000, and the median income for a family was $45,000. Males had a median income of $31,000 versus $22,000 for females. The per capita income for the borough was $18,000. About 8.2% of families and 11.2% of the population were below the poverty line, including 15.2% of those under age 18 and 8.2% of those age 65 or over.
Common Questions
What is Per Capita Income in Philipsburg borough?
Per Capita income in Philipsburg borough is $31,382.
What is the Median Family Income in Philipsburg borough?
Median Family Income in Philipsburg borough is $71,815.
What is the Median Household income in Philipsburg borough?
Median Household Income in Philipsburg borough is $45,530.
What is Income or Wage Gap in Philipsburg borough?
Income or Wage Gap in Philipsburg borough is 4.4%.
Women in Philipsburg borough earn 95.6 cents for every dollar earned by a man.
What is Inequality or Gini Index in Philipsburg borough?
Inequality or Gini Index in Philipsburg borough is 0.42.
What is the Total Population of Philipsburg borough?
Total Population of Philipsburg borough is 2,782.
What is the Total Male Population of Philipsburg borough?
Total Male Population of Philipsburg borough is 1,535.
What is the Total Female Population of Philipsburg borough?
Total Female Population of Philipsburg borough is 1,247.
What is the Ratio of Males per 100 Females in Philipsburg borough?
There are 123.10 Males per 100 Females in Philipsburg borough.
What is the Ratio of Females per 100 Males in Philipsburg borough?
There are 81.24 Females per 100 Males in Philipsburg borough.
What is the Median Population Age in Philipsburg borough?
Median Population Age in Philipsburg borough is 42.1 Years.
What is the Average Family Size in Philipsburg borough
Average Family Size in Philipsburg borough is 2.8 People.
What is the Average Household Size in Philipsburg borough
Average Household Size in Philipsburg borough is 2.0 People.
How Large is the Labor Force in Philipsburg borough?
There are 1,474 People in the Labor Forcein in Philipsburg borough.
What is the Percentage of People in the Labor Force in Philipsburg borough?
63.7% of People are in the Labor Force in Philipsburg borough.
What is the Unemployment Rate in Philipsburg borough?
Unemployment Rate in Philipsburg borough is 1.6%.