Pennville, PA Map & Demographics
Pennville Map
Pennville Overview
$42,192
PER CAPITA INCOME
$75,556
AVG FAMILY INCOME
$72,619
AVG HOUSEHOLD INCOME
18.8%
WAGE / INCOME GAP [ % ]
81.2¢/ $1
WAGE / INCOME GAP [ $ ]
0.44
INEQUALITY / GINI INDEX
2,258
TOTAL POPULATION
1,064
MALE POPULATION
1,194
FEMALE POPULATION
89.11
MALES / 100 FEMALES
112.22
FEMALES / 100 MALES
42.7
MEDIAN AGE
2.8
AVG FAMILY SIZE
2.4
AVG HOUSEHOLD SIZE
977
LABOR FORCE [ PEOPLE ]
52.9%
PERCENT IN LABOR FORCE
3.1%
UNEMPLOYMENT RATE
Income in Pennville
Income Overview in Pennville
Per Capita Income in Pennville is $42,192, while median incomes of families and households are $75,556 and $72,619 respectively.
| Characteristic | Number | Measure |
| Per Capita Income | 2,258 | $42,192 |
| Median Family Income | 638 | $75,556 |
| Mean Family Income | 638 | $118,008 |
| Median Household Income | 888 | $72,619 |
| Mean Household Income | 888 | $102,155 |
| Income Deficit | 638 | $0 |
| Wage / Income Gap (%) | 2,258 | 18.77% |
| Wage / Income Gap ($) | 2,258 | 81.23¢ per $1 |
| Gini / Inequality Index | 2,258 | 0.44 |
Earnings by Sex in Pennville
Average Earnings in Pennville are $39,323, $39,904 for men and $32,414 for women, a difference of 18.8%.
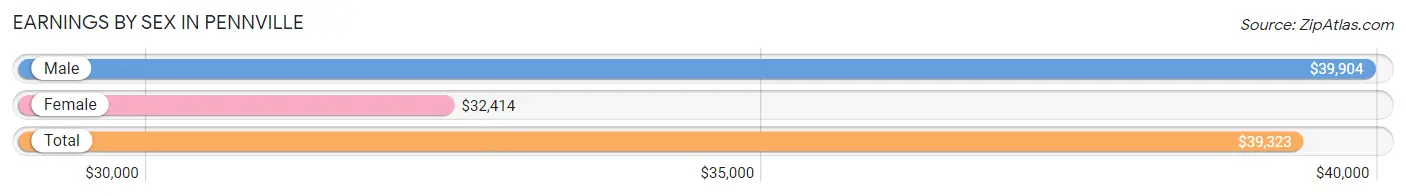
| Sex | Number | Average Earnings |
| Male | 511 (50.5%) | $39,904 |
| Female | 500 (49.5%) | $32,414 |
| Total | 1,011 (100.0%) | $39,323 |
Earnings by Sex by Income Bracket in Pennville
The most common earnings brackets in Pennville are $40,000 to $44,999 for men (102 | 20.0%) and $5,000 to $7,499 for women (93 | 18.6%).
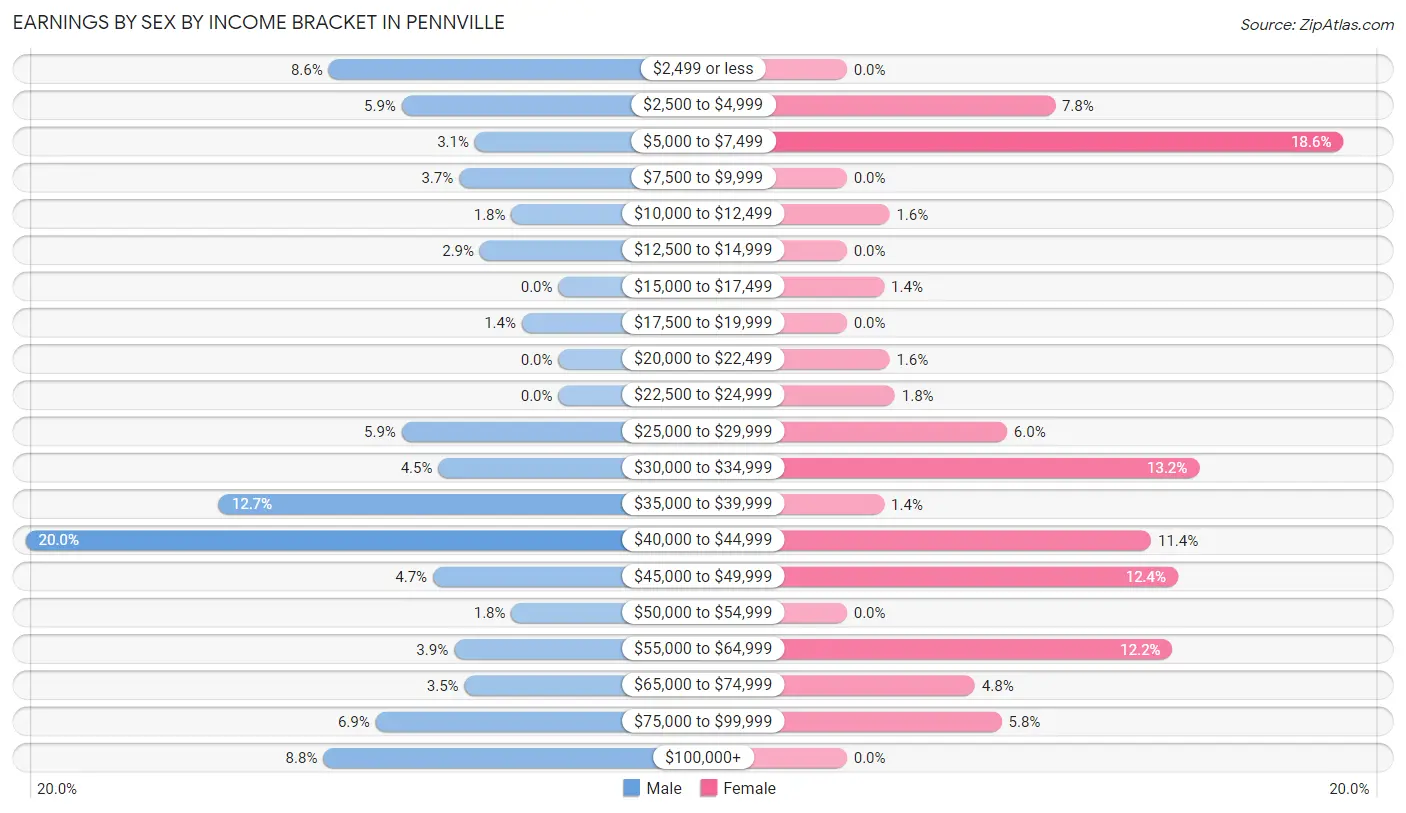
| Income | Male | Female |
| $2,499 or less | 44 (8.6%) | 0 (0.0%) |
| $2,500 to $4,999 | 30 (5.9%) | 39 (7.8%) |
| $5,000 to $7,499 | 16 (3.1%) | 93 (18.6%) |
| $7,500 to $9,999 | 19 (3.7%) | 0 (0.0%) |
| $10,000 to $12,499 | 9 (1.8%) | 8 (1.6%) |
| $12,500 to $14,999 | 15 (2.9%) | 0 (0.0%) |
| $15,000 to $17,499 | 0 (0.0%) | 7 (1.4%) |
| $17,500 to $19,999 | 7 (1.4%) | 0 (0.0%) |
| $20,000 to $22,499 | 0 (0.0%) | 8 (1.6%) |
| $22,500 to $24,999 | 0 (0.0%) | 9 (1.8%) |
| $25,000 to $29,999 | 30 (5.9%) | 30 (6.0%) |
| $30,000 to $34,999 | 23 (4.5%) | 66 (13.2%) |
| $35,000 to $39,999 | 65 (12.7%) | 7 (1.4%) |
| $40,000 to $44,999 | 102 (20.0%) | 57 (11.4%) |
| $45,000 to $49,999 | 24 (4.7%) | 62 (12.4%) |
| $50,000 to $54,999 | 9 (1.8%) | 0 (0.0%) |
| $55,000 to $64,999 | 20 (3.9%) | 61 (12.2%) |
| $65,000 to $74,999 | 18 (3.5%) | 24 (4.8%) |
| $75,000 to $99,999 | 35 (6.9%) | 29 (5.8%) |
| $100,000+ | 45 (8.8%) | 0 (0.0%) |
| Total | 511 (100.0%) | 500 (100.0%) |
Earnings by Sex by Educational Attainment in Pennville
Average earnings in Pennville are $43,233 for men and $40,707 for women, a difference of 5.8%. Men with an educational attainment of college or associate's degree enjoy the highest average annual earnings of $50,417, while those with high school diploma education earn the least with $41,000. Women with an educational attainment of bachelor's degree earn the most with the average annual earnings of $48,083, while those with high school diploma education have the smallest earnings of $41,929.
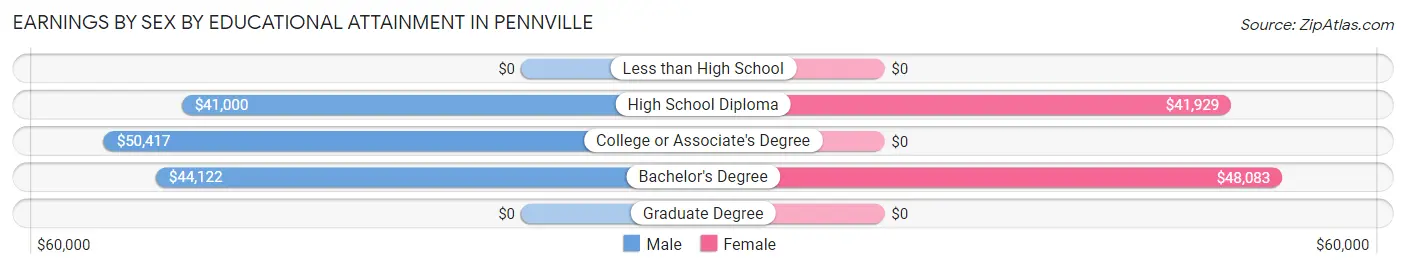
| Educational Attainment | Male Income | Female Income |
| Less than High School | - | - |
| High School Diploma | $41,000 | $41,929 |
| College or Associate's Degree | $50,417 | $0 |
| Bachelor's Degree | $44,122 | $48,083 |
| Graduate Degree | - | - |
| Total | $43,233 | $40,707 |
Family Income in Pennville
Family Income Brackets in Pennville
According to the Pennville family income data, there are 157 families falling into the $50,000 to $74,999 income range, which is the most common income bracket and makes up 24.6% of all families.

| Income Bracket | # Families | % Families |
| Less than $10,000 | 9 | 1.4% |
| $10,000 to $14,999 | 0 | 0.0% |
| $15,000 to $24,999 | 0 | 0.0% |
| $25,000 to $34,999 | 102 | 16.0% |
| $35,000 to $49,999 | 49 | 7.7% |
| $50,000 to $74,999 | 157 | 24.6% |
| $75,000 to $99,999 | 93 | 14.6% |
| $100,000 to $149,999 | 86 | 13.5% |
| $150,000 to $199,999 | 73 | 11.4% |
| $200,000+ | 69 | 10.8% |
Family Income by Famaliy Size in Pennville
4-person families (72 | 11.3%) account for the highest median family income in Pennville with $141,944 per family, while 2-person families (419 | 65.7%) have the highest median income of $38,264 per family member.
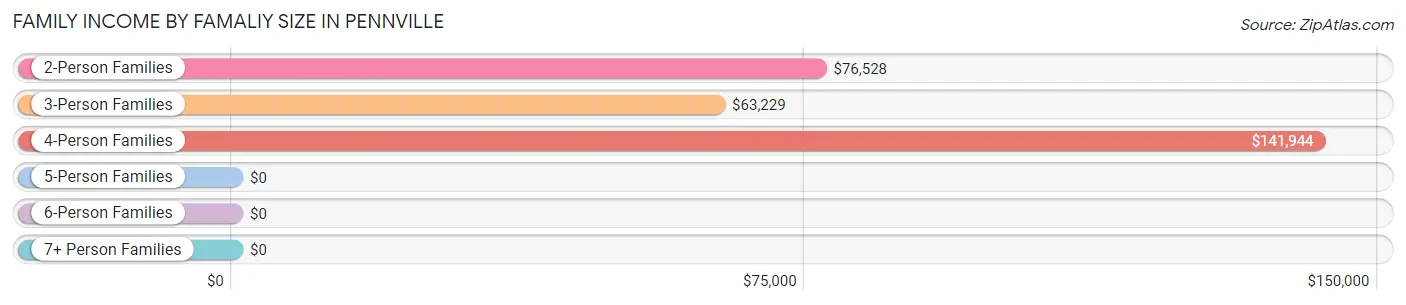
| Income Bracket | # Families | Median Income |
| 2-Person Families | 419 (65.7%) | $76,528 |
| 3-Person Families | 79 (12.4%) | $63,229 |
| 4-Person Families | 72 (11.3%) | $141,944 |
| 5-Person Families | 68 (10.7%) | $0 |
| 6-Person Families | 0 (0.0%) | $0 |
| 7+ Person Families | 0 (0.0%) | $0 |
| Total | 638 (100.0%) | $75,556 |
Family Income by Number of Earners in Pennville
The median family income in Pennville is $75,556, with families comprising 2 earners (145) having the highest median family income of $123,493, while families with 1 earner (181) have the lowest median family income of $49,618, accounting for 22.7% and 28.4% of families, respectively.
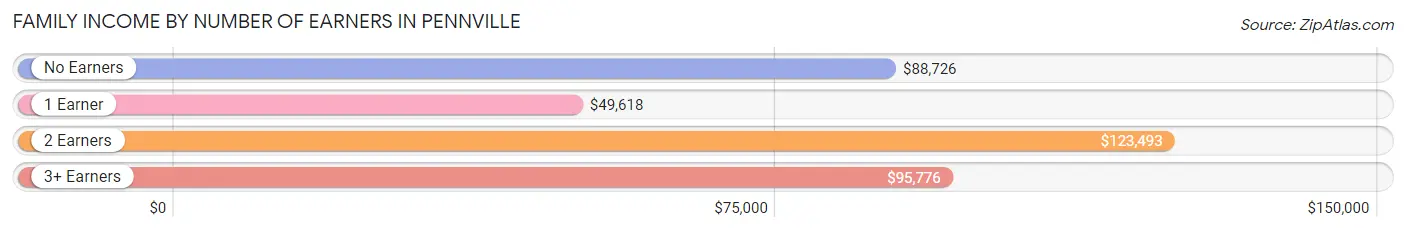
| Number of Earners | # Families | Median Income |
| No Earners | 226 (35.4%) | $88,726 |
| 1 Earner | 181 (28.4%) | $49,618 |
| 2 Earners | 145 (22.7%) | $123,493 |
| 3+ Earners | 86 (13.5%) | $95,776 |
| Total | 638 (100.0%) | $75,556 |
Household Income in Pennville
Household Income Brackets in Pennville
With 243 households falling in the category, the $50,000 to $74,999 income range is the most frequent in Pennville, accounting for 27.4% of all households. In contrast, only 6 households (0.7%) fall into the $10,000 to $14,999 income bracket, making it the least populous group.
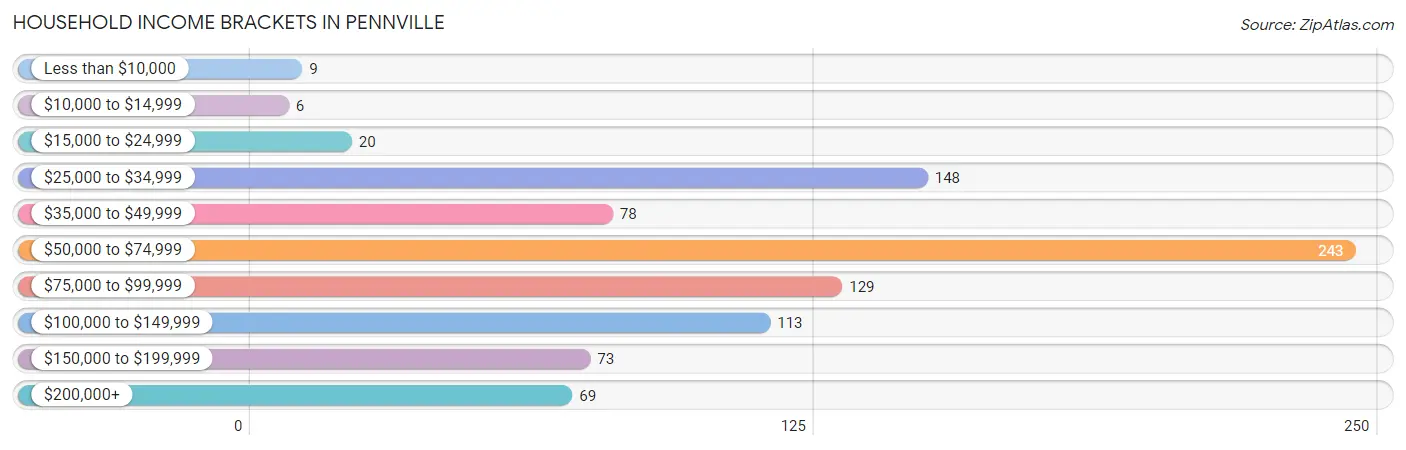
| Income Bracket | # Households | % Households |
| Less than $10,000 | 9 | 1.0% |
| $10,000 to $14,999 | 6 | 0.7% |
| $15,000 to $24,999 | 20 | 2.3% |
| $25,000 to $34,999 | 148 | 16.7% |
| $35,000 to $49,999 | 78 | 8.8% |
| $50,000 to $74,999 | 243 | 27.4% |
| $75,000 to $99,999 | 129 | 14.5% |
| $100,000 to $149,999 | 113 | 12.7% |
| $150,000 to $199,999 | 73 | 8.2% |
| $200,000+ | 69 | 7.8% |
Household Income by Householder Age in Pennville
The median household income in Pennville is $72,619, with the highest median household income of $95,560 found in the 45 to 64 years age bracket for the primary householder. A total of 205 households (23.1%) fall into this category. Meanwhile, the 15 to 24 years age bracket for the primary householder has the lowest median household income of $0, with 30 households (3.4%) in this group.
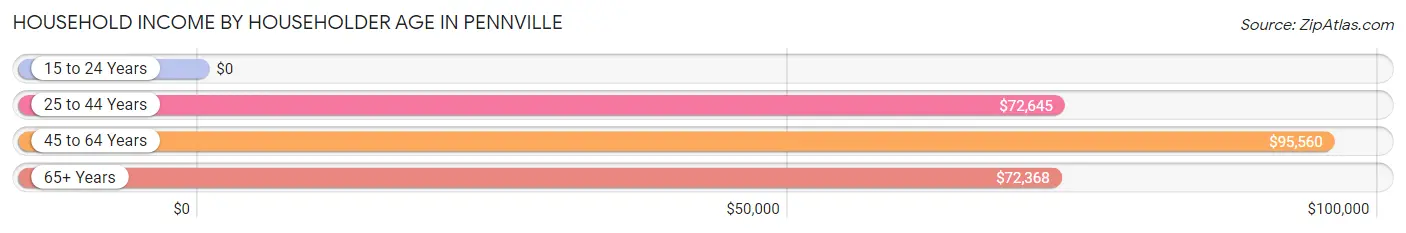
| Income Bracket | # Households | Median Income |
| 15 to 24 Years | 30 (3.4%) | $0 |
| 25 to 44 Years | 233 (26.2%) | $72,645 |
| 45 to 64 Years | 205 (23.1%) | $95,560 |
| 65+ Years | 420 (47.3%) | $72,368 |
| Total | 888 (100.0%) | $72,619 |
Poverty in Pennville
Income Below Poverty by Sex and Age in Pennville
With 3.0% poverty level for males and 1.3% for females among the residents of Pennville, 18 to 24 year old males and 65 to 74 year old females are the most vulnerable to poverty, with 22 males (30.1%) and 6 females (8.5%) in their respective age groups living below the poverty level.
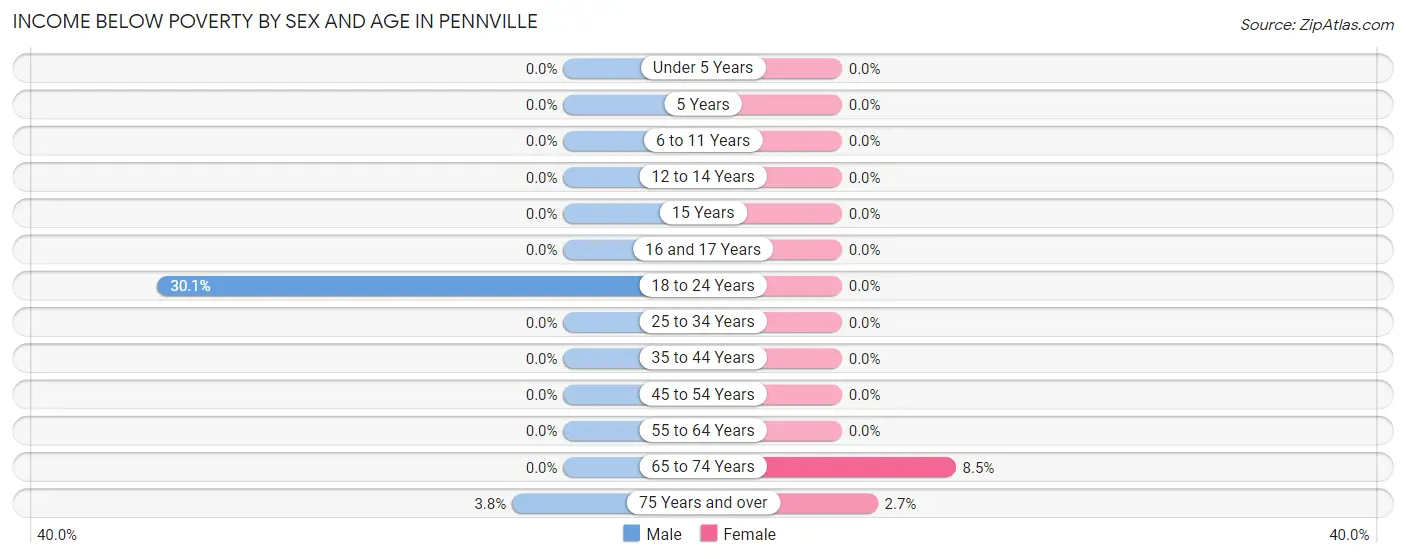
| Age Bracket | Male | Female |
| Under 5 Years | 0 (0.0%) | 0 (0.0%) |
| 5 Years | 0 (0.0%) | 0 (0.0%) |
| 6 to 11 Years | 0 (0.0%) | 0 (0.0%) |
| 12 to 14 Years | 0 (0.0%) | 0 (0.0%) |
| 15 Years | 0 (0.0%) | 0 (0.0%) |
| 16 and 17 Years | 0 (0.0%) | 0 (0.0%) |
| 18 to 24 Years | 22 (30.1%) | 0 (0.0%) |
| 25 to 34 Years | 0 (0.0%) | 0 (0.0%) |
| 35 to 44 Years | 0 (0.0%) | 0 (0.0%) |
| 45 to 54 Years | 0 (0.0%) | 0 (0.0%) |
| 55 to 64 Years | 0 (0.0%) | 0 (0.0%) |
| 65 to 74 Years | 0 (0.0%) | 6 (8.5%) |
| 75 Years and over | 9 (3.8%) | 8 (2.7%) |
| Total | 31 (3.0%) | 14 (1.3%) |
Income Above Poverty by Sex and Age in Pennville
According to the poverty statistics in Pennville, males aged under 5 years and females aged under 5 years are the age groups that are most secure financially, with 100.0% of males and 100.0% of females in these age groups living above the poverty line.
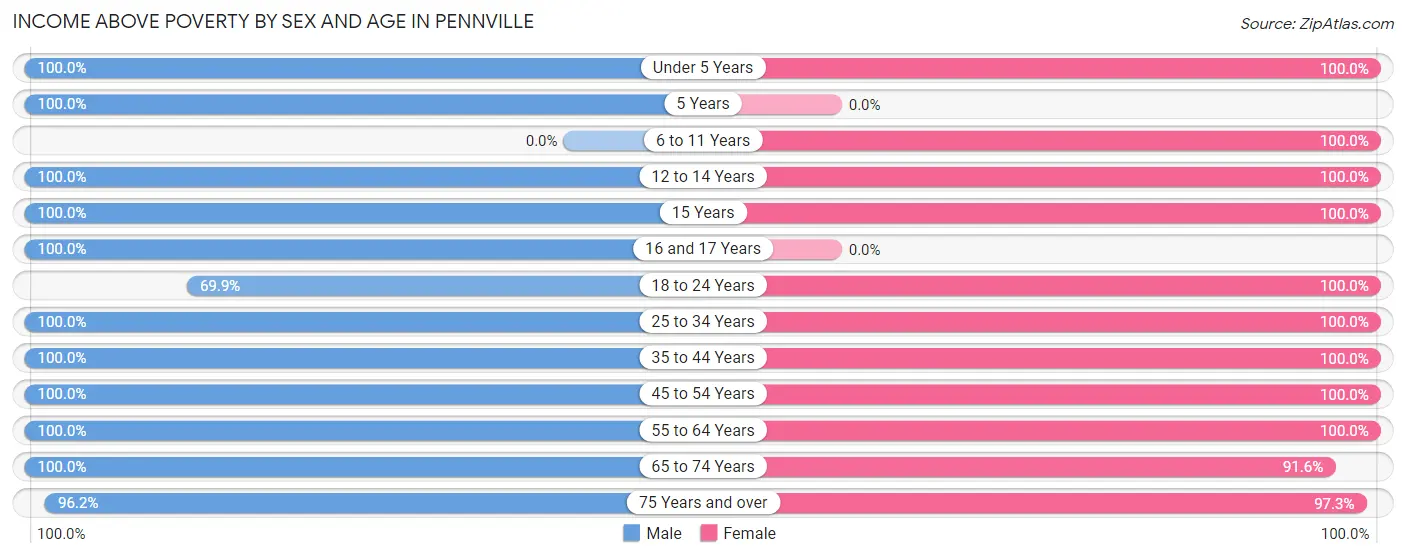
| Age Bracket | Male | Female |
| Under 5 Years | 77 (100.0%) | 15 (100.0%) |
| 5 Years | 52 (100.0%) | 0 (0.0%) |
| 6 to 11 Years | 0 (0.0%) | 40 (100.0%) |
| 12 to 14 Years | 62 (100.0%) | 121 (100.0%) |
| 15 Years | 35 (100.0%) | 9 (100.0%) |
| 16 and 17 Years | 45 (100.0%) | 0 (0.0%) |
| 18 to 24 Years | 51 (69.9%) | 91 (100.0%) |
| 25 to 34 Years | 183 (100.0%) | 50 (100.0%) |
| 35 to 44 Years | 117 (100.0%) | 207 (100.0%) |
| 45 to 54 Years | 74 (100.0%) | 104 (100.0%) |
| 55 to 64 Years | 32 (100.0%) | 84 (100.0%) |
| 65 to 74 Years | 52 (100.0%) | 65 (91.5%) |
| 75 Years and over | 227 (96.2%) | 293 (97.3%) |
| Total | 1,007 (97.0%) | 1,079 (98.7%) |
Income Below Poverty Among Married-Couple Families in Pennville
The poverty statistics for married-couple families in Pennville show that 1.9% or 9 of the total 482 families live below the poverty line. Families with no children have the highest poverty rate of 2.7%, comprising of 9 families. On the other hand, families with 1 or 2 children have the lowest poverty rate of 0.0%, which includes 0 families.
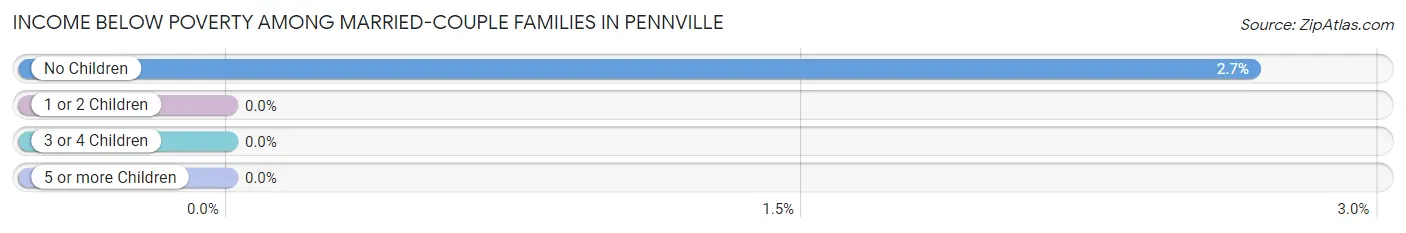
| Children | Above Poverty | Below Poverty |
| No Children | 328 (97.3%) | 9 (2.7%) |
| 1 or 2 Children | 77 (100.0%) | 0 (0.0%) |
| 3 or 4 Children | 68 (100.0%) | 0 (0.0%) |
| 5 or more Children | 0 (0.0%) | 0 (0.0%) |
| Total | 473 (98.1%) | 9 (1.9%) |
Income Below Poverty Among Single-Parent Households in Pennville
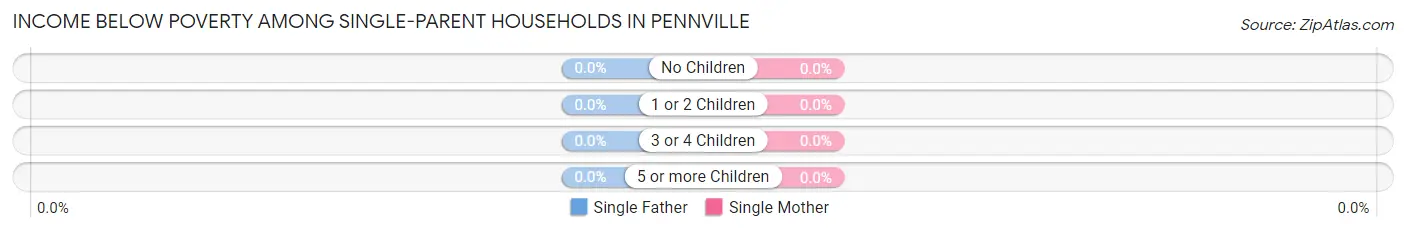
| Children | Single Father | Single Mother |
| No Children | 0 (0.0%) | 0 (0.0%) |
| 1 or 2 Children | 0 (0.0%) | 0 (0.0%) |
| 3 or 4 Children | 0 (0.0%) | 0 (0.0%) |
| 5 or more Children | 0 (0.0%) | 0 (0.0%) |
| Total | 0 (0.0%) | 0 (0.0%) |
Income Below Poverty Among Married-Couple vs Single-Parent Households in Pennville
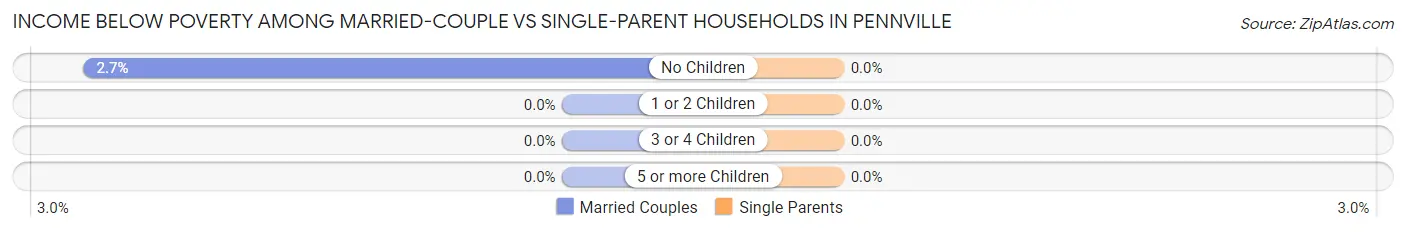
| Children | Married-Couple Families | Single-Parent Households |
| No Children | 9 (2.7%) | 0 (0.0%) |
| 1 or 2 Children | 0 (0.0%) | 0 (0.0%) |
| 3 or 4 Children | 0 (0.0%) | 0 (0.0%) |
| 5 or more Children | 0 (0.0%) | 0 (0.0%) |
| Total | 9 (1.9%) | 0 (0.0%) |
Race in Pennville
The most populous races in Pennville are White / Caucasian (1,994 | 88.3%), Hispanic or Latino (259 | 11.5%), and Two or more Races (245 | 10.8%).
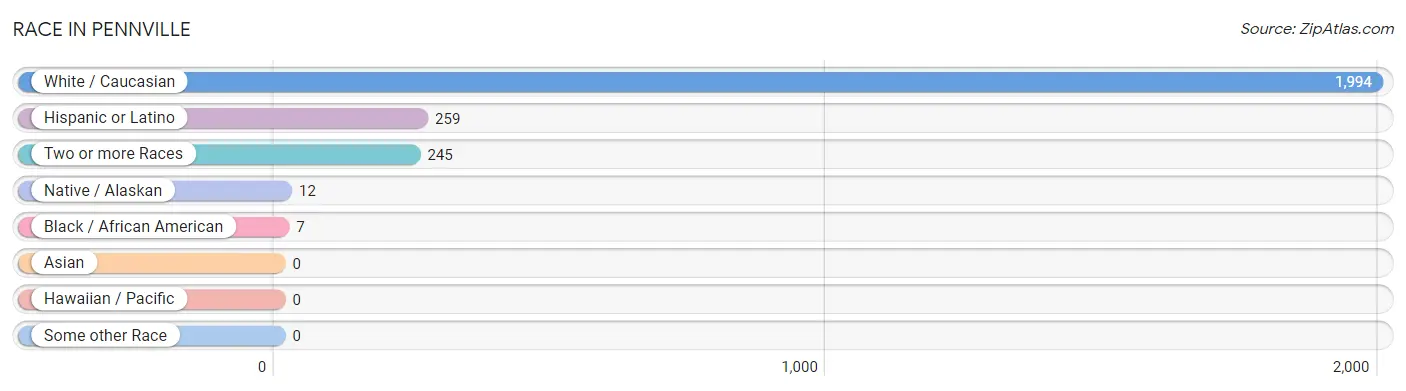
| Race | # Population | % Population |
| Asian | 0 | 0.0% |
| Black / African American | 7 | 0.3% |
| Hawaiian / Pacific | 0 | 0.0% |
| Hispanic or Latino | 259 | 11.5% |
| Native / Alaskan | 12 | 0.5% |
| White / Caucasian | 1,994 | 88.3% |
| Two or more Races | 245 | 10.8% |
| Some other Race | 0 | 0.0% |
| Total | 2,258 | 100.0% |
Ancestry in Pennville
The most populous ancestries reported in Pennville are German (801 | 35.5%), Irish (423 | 18.7%), English (369 | 16.3%), American (255 | 11.3%), and Mexican (241 | 10.7%), together accounting for 92.5% of all Pennville residents.
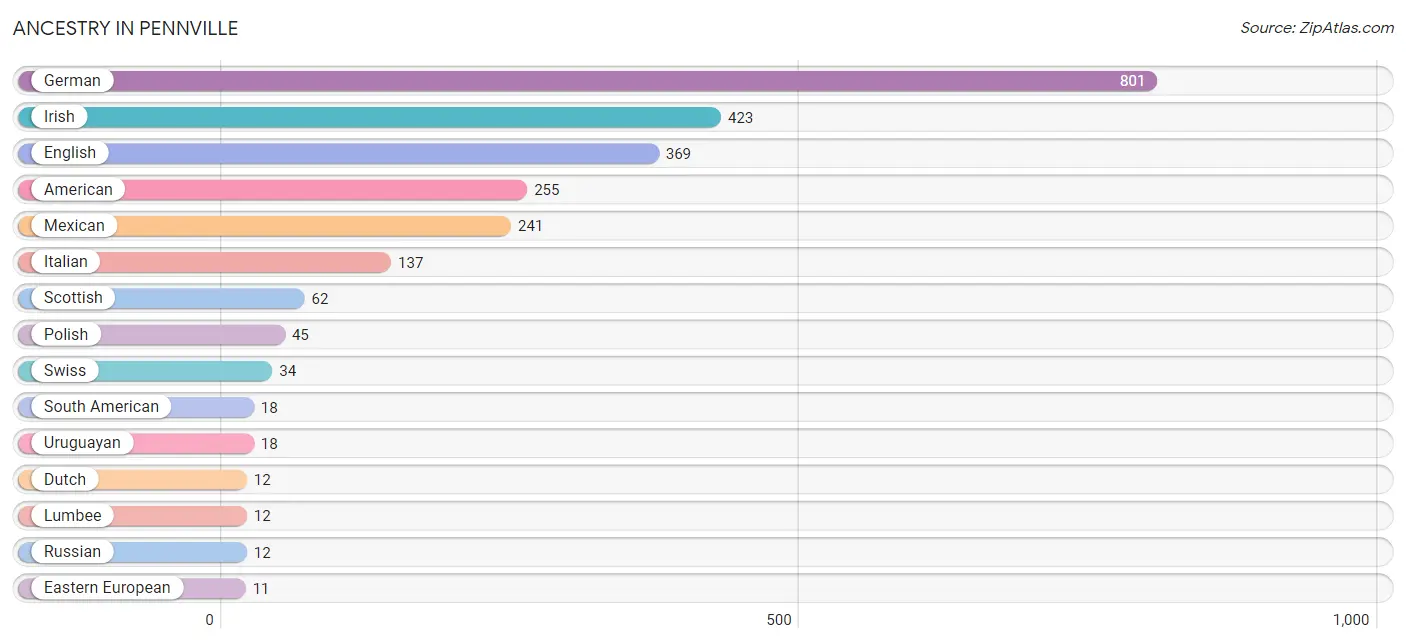
| Ancestry | # Population | % Population |
| African | 7 | 0.3% |
| American | 255 | 11.3% |
| Arab | 8 | 0.4% |
| British | 9 | 0.4% |
| Dutch | 12 | 0.5% |
| Eastern European | 11 | 0.5% |
| English | 369 | 16.3% |
| French | 6 | 0.3% |
| German | 801 | 35.5% |
| Irish | 423 | 18.7% |
| Italian | 137 | 6.1% |
| Lumbee | 12 | 0.5% |
| Mexican | 241 | 10.7% |
| Moroccan | 8 | 0.4% |
| Northern European | 9 | 0.4% |
| Pennsylvania German | 7 | 0.3% |
| Polish | 45 | 2.0% |
| Russian | 12 | 0.5% |
| Scottish | 62 | 2.8% |
| South American | 18 | 0.8% |
| Subsaharan African | 7 | 0.3% |
| Swiss | 34 | 1.5% |
| Uruguayan | 18 | 0.8% |
| Welsh | 10 | 0.4% | View All 24 Rows |
Immigrants in Pennville
The most numerous immigrant groups reported in Pennville came from Latin America (111 | 4.9%), Central America (93 | 4.1%), Mexico (93 | 4.1%), Canada (34 | 1.5%), and South America (18 | 0.8%), together accounting for 15.5% of all Pennville residents.
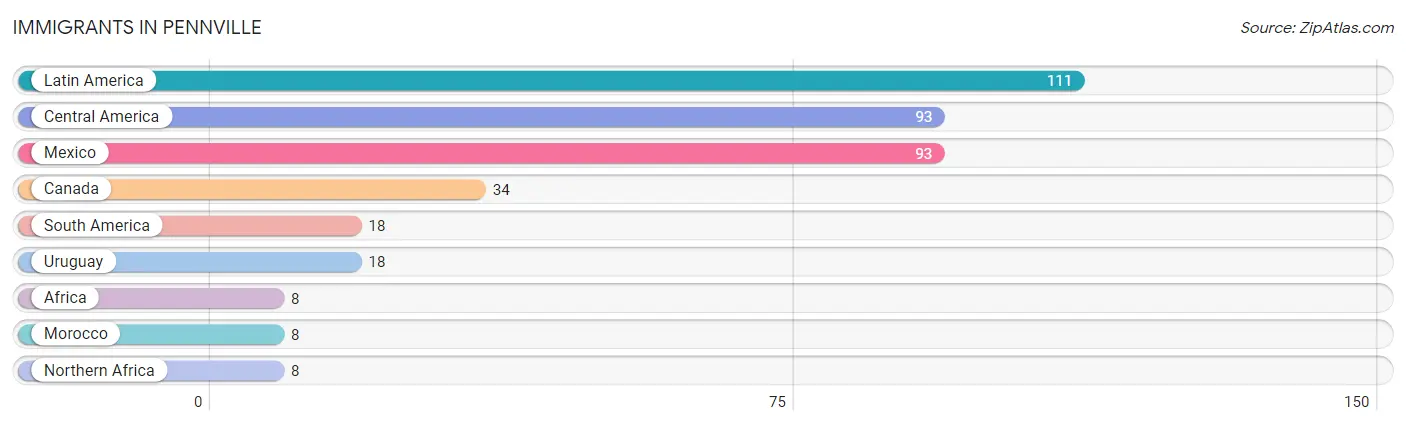
| Immigration Origin | # Population | % Population |
| Africa | 8 | 0.4% |
| Canada | 34 | 1.5% |
| Central America | 93 | 4.1% |
| Latin America | 111 | 4.9% |
| Mexico | 93 | 4.1% |
| Morocco | 8 | 0.4% |
| Northern Africa | 8 | 0.4% |
| South America | 18 | 0.8% |
| Uruguay | 18 | 0.8% | View All 9 Rows |
Sex and Age in Pennville
Sex and Age in Pennville
The most populous age groups in Pennville are 85 Years and over (132 | 12.4%) for men and 10 to 14 Years (154 | 12.9%) for women.
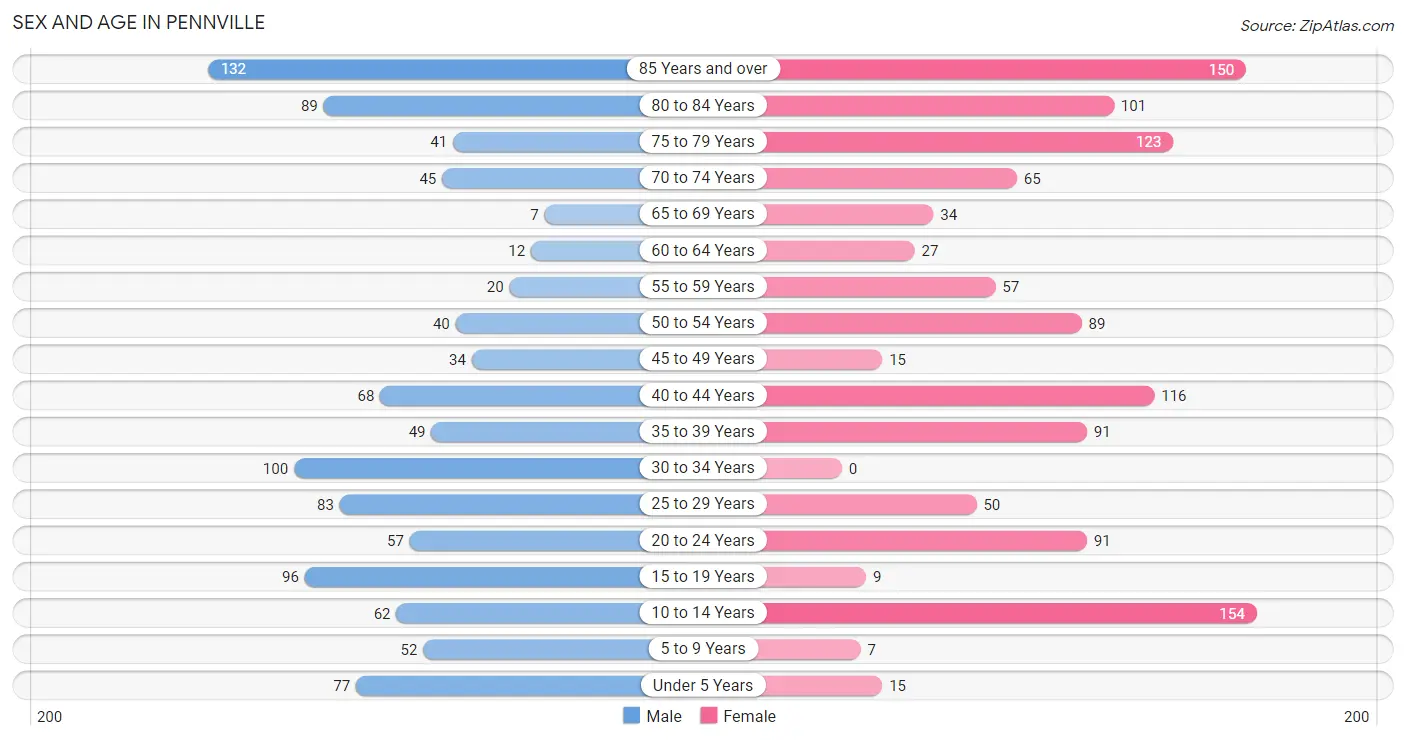
| Age Bracket | Male | Female |
| Under 5 Years | 77 (7.2%) | 15 (1.3%) |
| 5 to 9 Years | 52 (4.9%) | 7 (0.6%) |
| 10 to 14 Years | 62 (5.8%) | 154 (12.9%) |
| 15 to 19 Years | 96 (9.0%) | 9 (0.7%) |
| 20 to 24 Years | 57 (5.4%) | 91 (7.6%) |
| 25 to 29 Years | 83 (7.8%) | 50 (4.2%) |
| 30 to 34 Years | 100 (9.4%) | 0 (0.0%) |
| 35 to 39 Years | 49 (4.6%) | 91 (7.6%) |
| 40 to 44 Years | 68 (6.4%) | 116 (9.7%) |
| 45 to 49 Years | 34 (3.2%) | 15 (1.3%) |
| 50 to 54 Years | 40 (3.8%) | 89 (7.4%) |
| 55 to 59 Years | 20 (1.9%) | 57 (4.8%) |
| 60 to 64 Years | 12 (1.1%) | 27 (2.3%) |
| 65 to 69 Years | 7 (0.7%) | 34 (2.9%) |
| 70 to 74 Years | 45 (4.2%) | 65 (5.4%) |
| 75 to 79 Years | 41 (3.8%) | 123 (10.3%) |
| 80 to 84 Years | 89 (8.4%) | 101 (8.5%) |
| 85 Years and over | 132 (12.4%) | 150 (12.6%) |
| Total | 1,064 (100.0%) | 1,194 (100.0%) |
Families and Households in Pennville
Median Family Size in Pennville
The median family size in Pennville is 2.79 persons per family, with married-couple families (482 | 75.5%) accounting for the largest median family size of 2.98 persons per family. On the other hand, single female/mother families (109 | 17.1%) represent the smallest median family size with 2.04 persons per family.
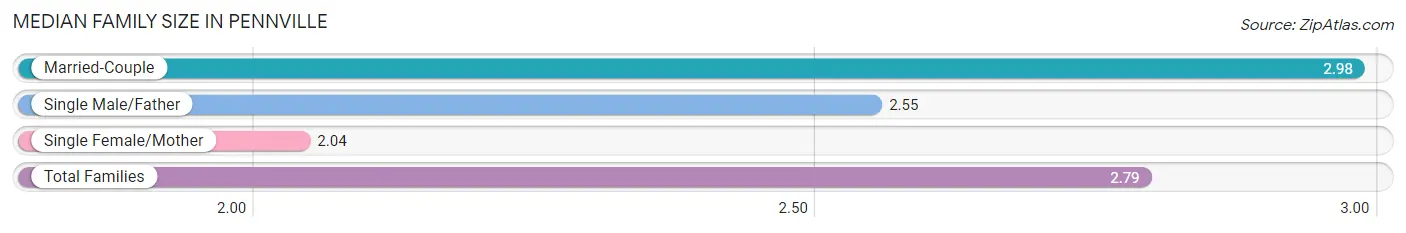
| Family Type | # Families | Family Size |
| Married-Couple | 482 (75.5%) | 2.98 |
| Single Male/Father | 47 (7.4%) | 2.55 |
| Single Female/Mother | 109 (17.1%) | 2.04 |
| Total Families | 638 (100.0%) | 2.79 |
Median Household Size in Pennville
The median household size in Pennville is 2.40 persons per household, with single male/father households (47 | 5.3%) accounting for the largest median household size of 3.43 persons per household. non-family households (250 | 28.1%) represent the smallest median household size with 1.24 persons per household.
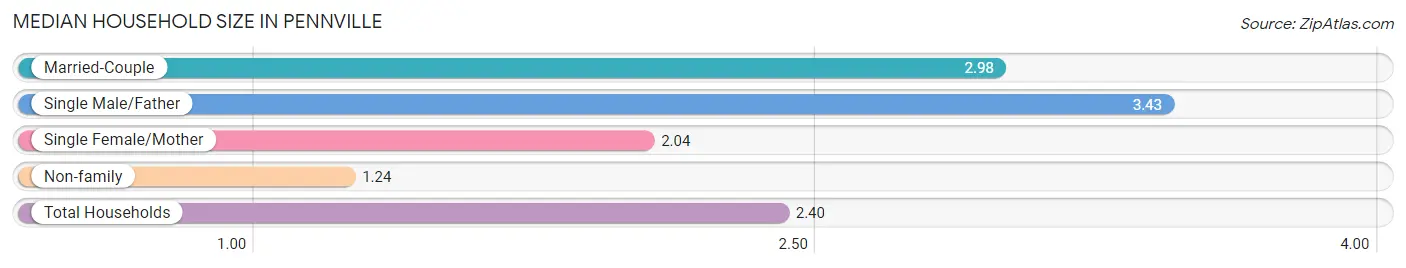
| Household Type | # Households | Household Size |
| Married-Couple | 482 (54.3%) | 2.98 |
| Single Male/Father | 47 (5.3%) | 3.43 |
| Single Female/Mother | 109 (12.3%) | 2.04 |
| Non-family | 250 (28.1%) | 1.24 |
| Total Households | 888 (100.0%) | 2.40 |
Household Size by Marriage Status in Pennville
Out of a total of 888 households in Pennville, 638 (71.9%) are family households, while 250 (28.1%) are nonfamily households. The most numerous type of family households are 2-person households, comprising 412, and the most common type of nonfamily households are 1-person households, comprising 184.
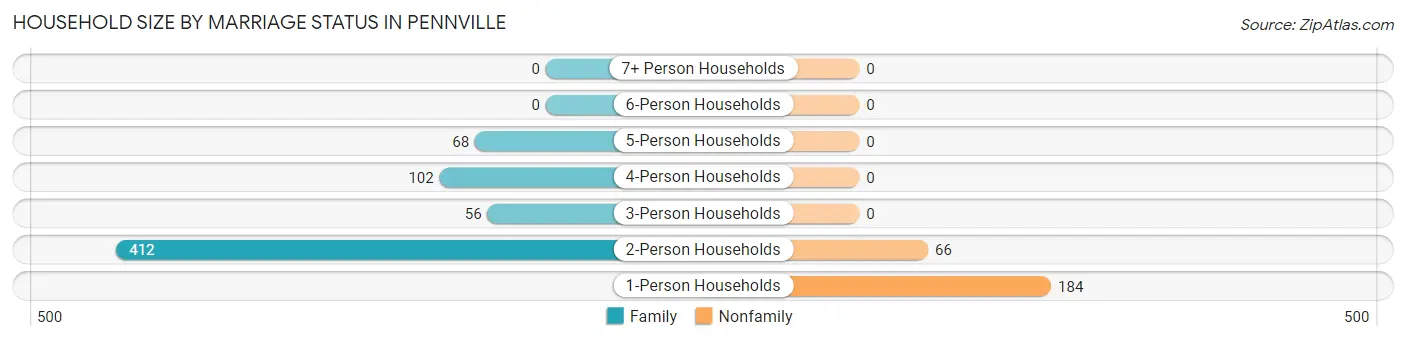
| Household Size | Family Households | Nonfamily Households |
| 1-Person Households | - | 184 (20.7%) |
| 2-Person Households | 412 (46.4%) | 66 (7.4%) |
| 3-Person Households | 56 (6.3%) | 0 (0.0%) |
| 4-Person Households | 102 (11.5%) | 0 (0.0%) |
| 5-Person Households | 68 (7.7%) | 0 (0.0%) |
| 6-Person Households | 0 (0.0%) | 0 (0.0%) |
| 7+ Person Households | 0 (0.0%) | 0 (0.0%) |
| Total | 638 (71.9%) | 250 (28.1%) |
Female Fertility in Pennville
Fertility by Age in Pennville
Average fertility rate in Pennville is 128.0 births per 1,000 women. Women in the age bracket of 20 to 34 years have the highest fertility rate with 340.0 births per 1,000 women. Women in the age bracket of 20 to 34 years acount for 88.9% of all women with births.
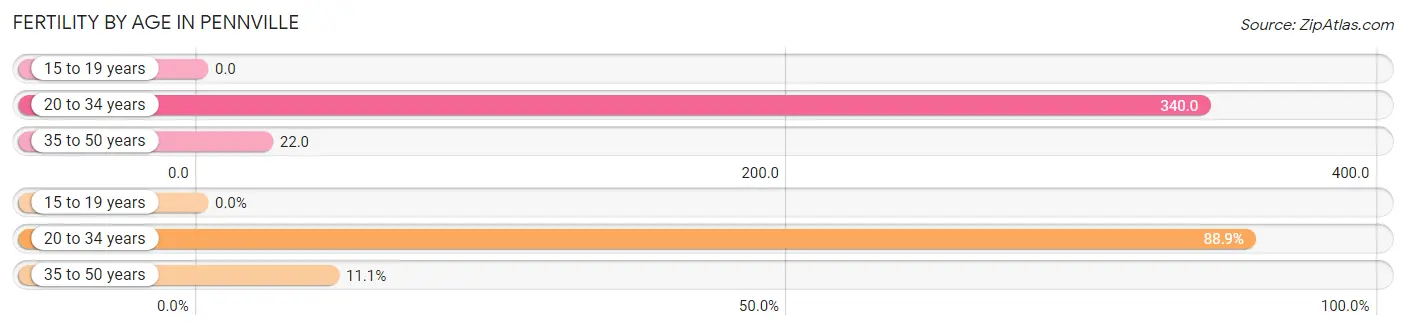
| Age Bracket | Women with Births | Births / 1,000 Women |
| 15 to 19 years | 0 (0.0%) | 0.0 |
| 20 to 34 years | 48 (88.9%) | 340.0 |
| 35 to 50 years | 6 (11.1%) | 22.0 |
| Total | 54 (100.0%) | 128.0 |
Fertility by Age by Marriage Status in Pennville
31.5% of women with births (54) in Pennville are married. The highest percentage of unmarried women with births falls into 20 to 34 years age bracket with 77.1% of them unmarried at the time of birth, while the lowest percentage of unmarried women with births belong to 35 to 50 years age bracket with 0.0% of them unmarried.
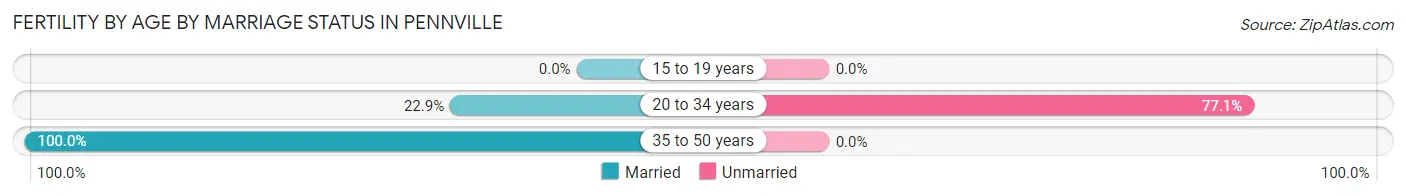
| Age Bracket | Married | Unmarried |
| 15 to 19 years | 0 (0.0%) | 0 (0.0%) |
| 20 to 34 years | 11 (22.9%) | 37 (77.1%) |
| 35 to 50 years | 6 (100.0%) | 0 (0.0%) |
| Total | 17 (31.5%) | 37 (68.5%) |
Fertility by Education in Pennville
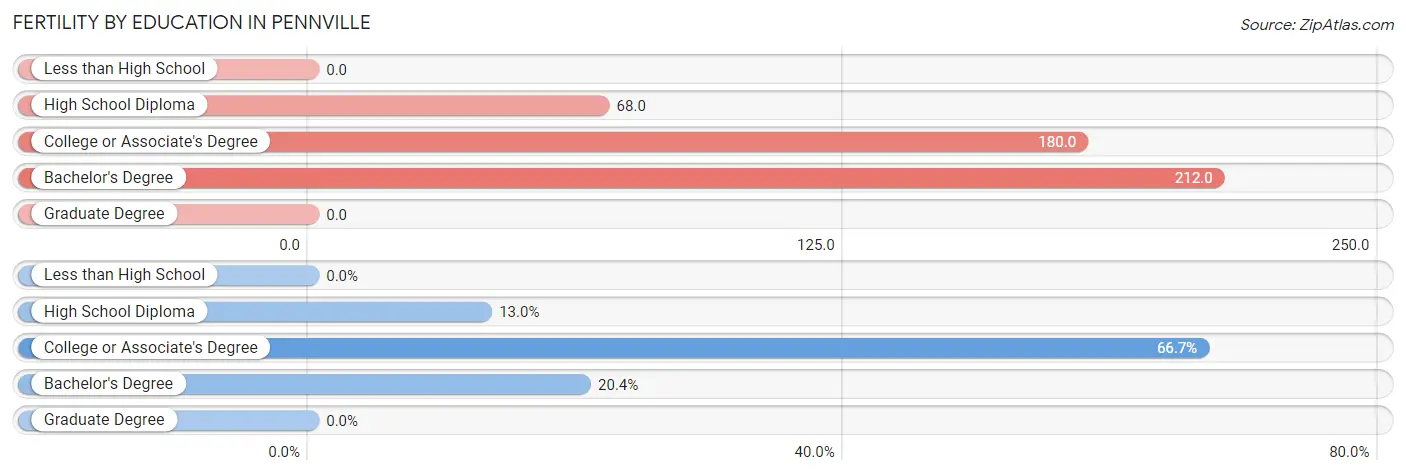
| Educational Attainment | Women with Births | Births / 1,000 Women |
| Less than High School | 0 (0.0%) | 0.0 |
| High School Diploma | 7 (13.0%) | 68.0 |
| College or Associate's Degree | 36 (66.7%) | 180.0 |
| Bachelor's Degree | 11 (20.4%) | 212.0 |
| Graduate Degree | 0 (0.0%) | 0.0 |
| Total | 54 (100.0%) | 128.0 |
Fertility by Education by Marriage Status in Pennville
68.5% of women with births in Pennville are unmarried. Women with the educational attainment of bachelor's degree are most likely to be married with 100.0% of them married at childbirth, while women with the educational attainment of high school diploma are least likely to be married with 100.0% of them unmarried at childbirth.
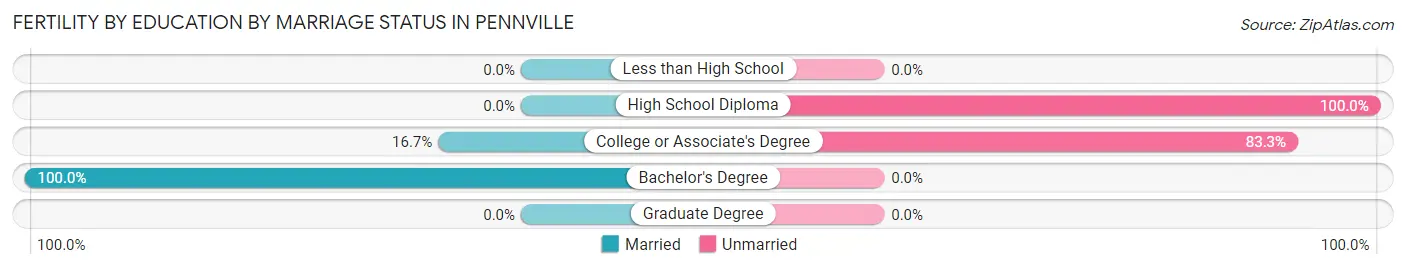
| Educational Attainment | Married | Unmarried |
| Less than High School | 0 (0.0%) | 0 (0.0%) |
| High School Diploma | 0 (0.0%) | 7 (100.0%) |
| College or Associate's Degree | 6 (16.7%) | 30 (83.3%) |
| Bachelor's Degree | 11 (100.0%) | 0 (0.0%) |
| Graduate Degree | 0 (0.0%) | 0 (0.0%) |
| Total | 17 (31.5%) | 37 (68.5%) |
Employment Characteristics in Pennville
Employment by Class of Employer in Pennville
Among the 845 employed individuals in Pennville, private company employees (695 | 82.3%), not-for-profit organizations (85 | 10.1%), and local government employees (27 | 3.2%) make up the most common classes of employment.
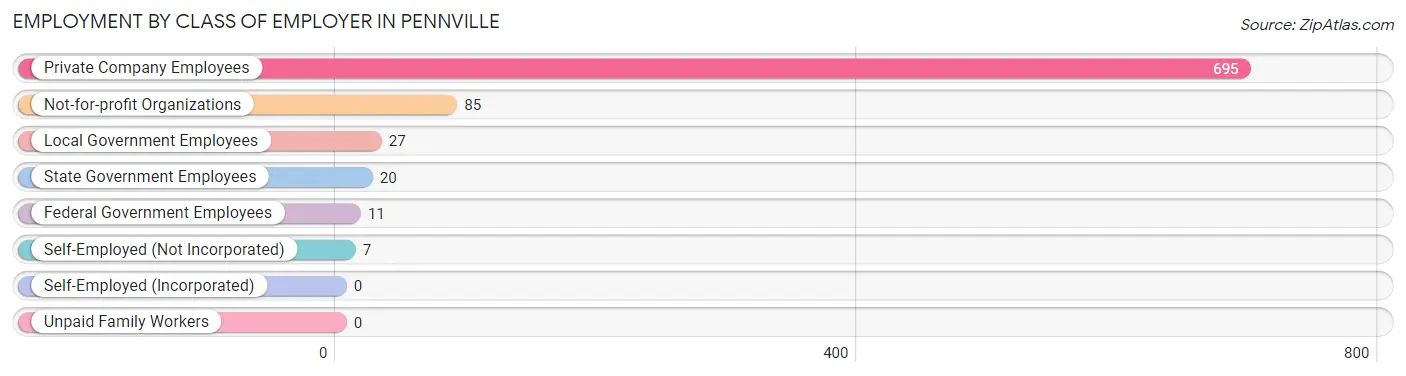
| Employer Class | # Employees | % Employees |
| Private Company Employees | 695 | 82.3% |
| Self-Employed (Incorporated) | 0 | 0.0% |
| Self-Employed (Not Incorporated) | 7 | 0.8% |
| Not-for-profit Organizations | 85 | 10.1% |
| Local Government Employees | 27 | 3.2% |
| State Government Employees | 20 | 2.4% |
| Federal Government Employees | 11 | 1.3% |
| Unpaid Family Workers | 0 | 0.0% |
| Total | 845 | 100.0% |
Employment Status by Age in Pennville
According to the labor force statistics for Pennville, out of the total population over 16 years of age (1,847), 52.9% or 977 individuals are in the labor force, with 3.1% or 30 of them unemployed. The age group with the highest labor force participation rate is 30 to 34 years, with 100.0% or 100 individuals in the labor force. Within the labor force, the 20 to 24 years age range has the highest percentage of unemployed individuals, with 38.0% or 30 of them being unemployed.
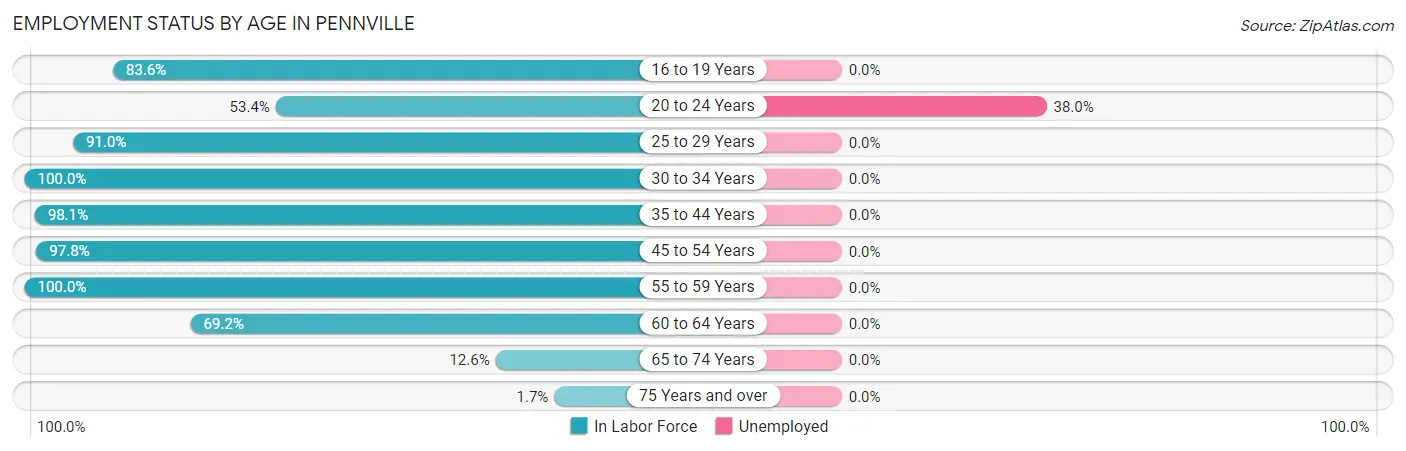
| Age Bracket | In Labor Force | Unemployed |
| 16 to 19 Years | 51 (83.6%) | 0 (0.0%) |
| 20 to 24 Years | 79 (53.4%) | 30 (38.0%) |
| 25 to 29 Years | 121 (91.0%) | 0 (0.0%) |
| 30 to 34 Years | 100 (100.0%) | 0 (0.0%) |
| 35 to 44 Years | 318 (98.1%) | 0 (0.0%) |
| 45 to 54 Years | 174 (97.8%) | 0 (0.0%) |
| 55 to 59 Years | 77 (100.0%) | 0 (0.0%) |
| 60 to 64 Years | 27 (69.2%) | 0 (0.0%) |
| 65 to 74 Years | 19 (12.6%) | 0 (0.0%) |
| 75 Years and over | 11 (1.7%) | 0 (0.0%) |
| Total | 977 (52.9%) | 30 (3.1%) |
Employment Status by Educational Attainment in Pennville
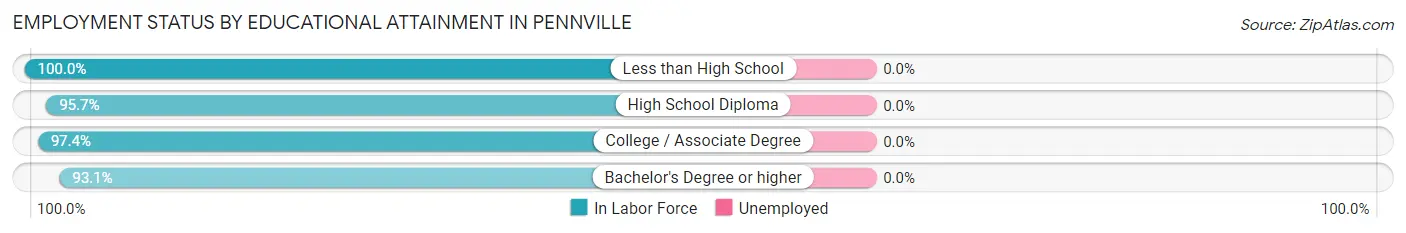
| Educational Attainment | In Labor Force | Unemployed |
| Less than High School | 8 (100.0%) | 0 (0.0%) |
| High School Diploma | 269 (95.7%) | 0 (0.0%) |
| College / Associate Degree | 378 (97.4%) | 0 (0.0%) |
| Bachelor's Degree or higher | 162 (93.1%) | 0 (0.0%) |
| Total | 817 (96.0%) | 0 (0.0%) |
Employment Occupations by Sex in Pennville
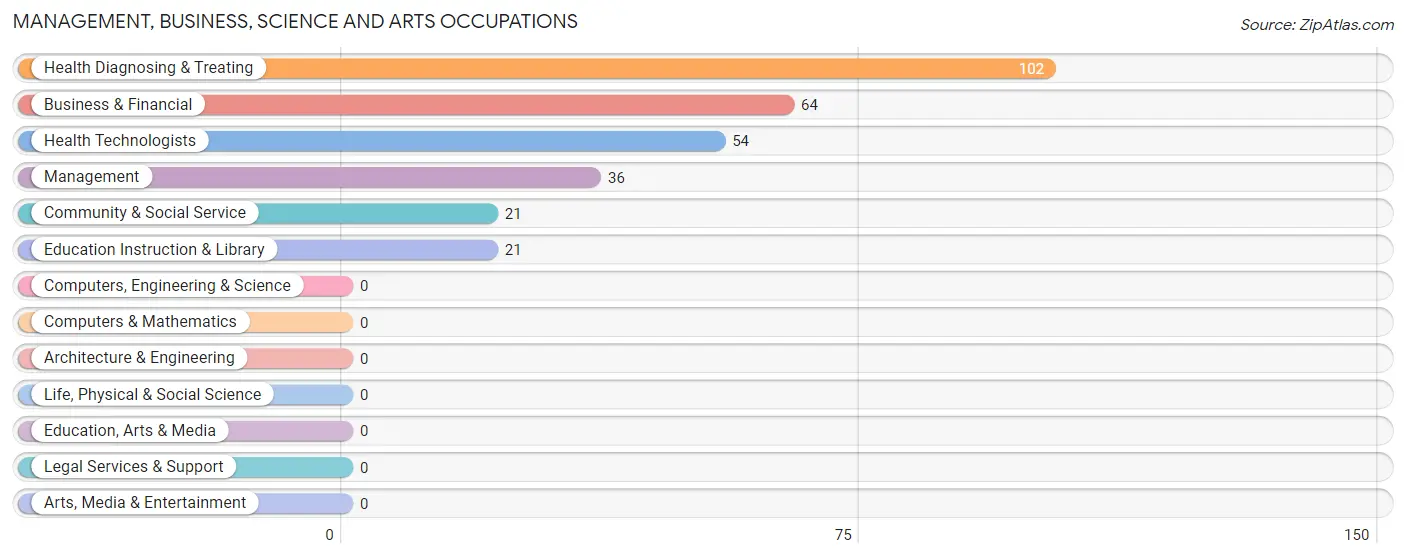
Management, Business, Science and Arts Occupations
The most common Management, Business, Science and Arts occupations in Pennville are Health Diagnosing & Treating (102 | 10.8%), Business & Financial (64 | 6.8%), Health Technologists (54 | 5.7%), Management (36 | 3.8%), and Community & Social Service (21 | 2.2%).
Management, Business, Science and Arts Occupations by Sex
Within the Management, Business, Science and Arts occupations in Pennville, the most male-oriented occupations are Business & Financial (70.3%), Health Technologists (31.5%), and Community & Social Service (19.1%), while the most female-oriented occupations are Management (100.0%), Health Diagnosing & Treating (83.3%), and Community & Social Service (80.9%).
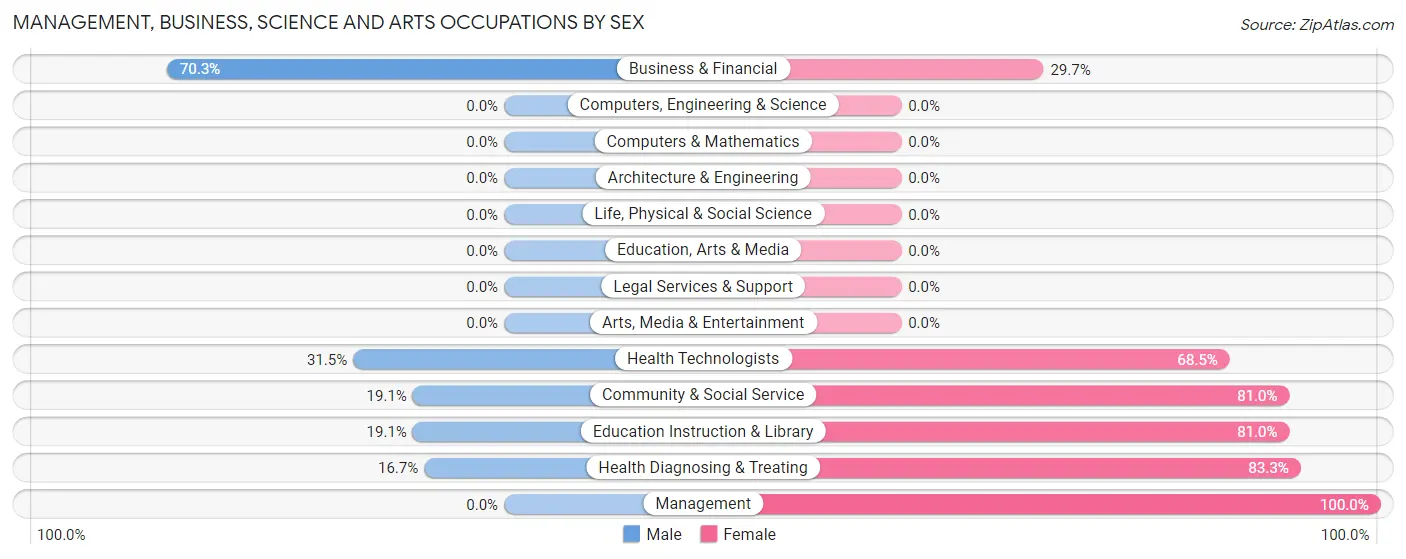
| Occupation | Male | Female |
| Management | 0 (0.0%) | 36 (100.0%) |
| Business & Financial | 45 (70.3%) | 19 (29.7%) |
| Computers, Engineering & Science | 0 (0.0%) | 0 (0.0%) |
| Computers & Mathematics | 0 (0.0%) | 0 (0.0%) |
| Architecture & Engineering | 0 (0.0%) | 0 (0.0%) |
| Life, Physical & Social Science | 0 (0.0%) | 0 (0.0%) |
| Community & Social Service | 4 (19.1%) | 17 (80.9%) |
| Education, Arts & Media | 0 (0.0%) | 0 (0.0%) |
| Legal Services & Support | 0 (0.0%) | 0 (0.0%) |
| Education Instruction & Library | 4 (19.1%) | 17 (80.9%) |
| Arts, Media & Entertainment | 0 (0.0%) | 0 (0.0%) |
| Health Diagnosing & Treating | 17 (16.7%) | 85 (83.3%) |
| Health Technologists | 17 (31.5%) | 37 (68.5%) |
| Total (Category) | 66 (29.6%) | 157 (70.4%) |
| Total (Overall) | 486 (51.3%) | 461 (48.7%) |
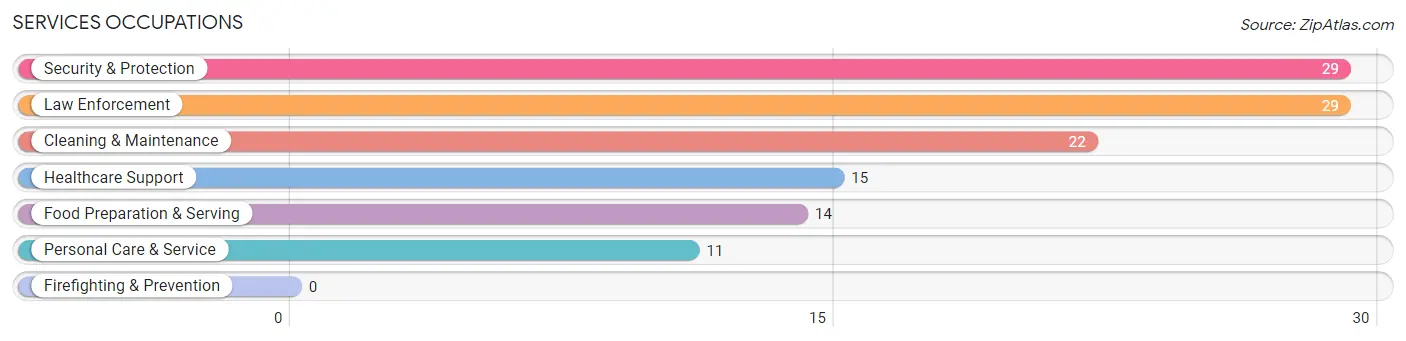
Services Occupations
The most common Services occupations in Pennville are Security & Protection (29 | 3.1%), Law Enforcement (29 | 3.1%), Cleaning & Maintenance (22 | 2.3%), Healthcare Support (15 | 1.6%), and Food Preparation & Serving (14 | 1.5%).
Services Occupations by Sex
Within the Services occupations in Pennville, the most male-oriented occupations are Security & Protection (100.0%), Law Enforcement (100.0%), and Food Preparation & Serving (100.0%), while the most female-oriented occupations are Healthcare Support (100.0%), Personal Care & Service (100.0%), and Cleaning & Maintenance (63.6%).
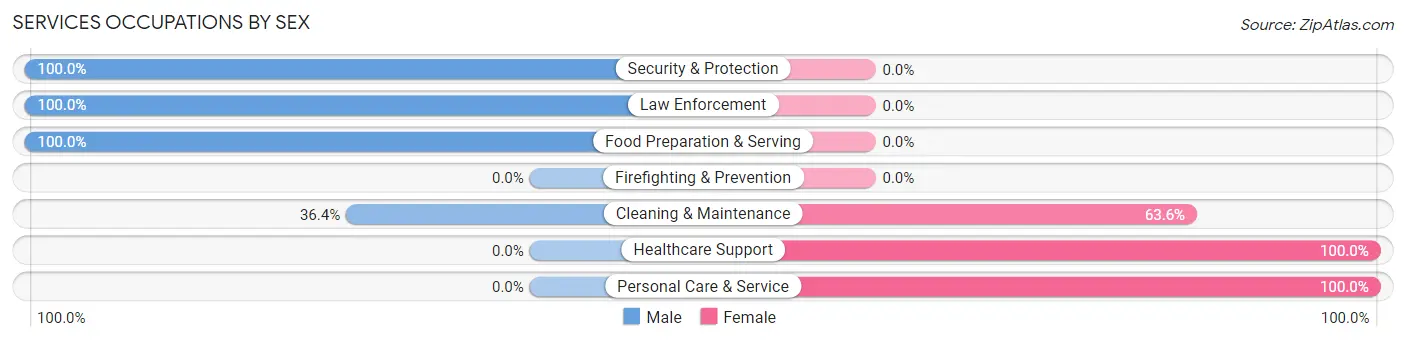
| Occupation | Male | Female |
| Healthcare Support | 0 (0.0%) | 15 (100.0%) |
| Security & Protection | 29 (100.0%) | 0 (0.0%) |
| Firefighting & Prevention | 0 (0.0%) | 0 (0.0%) |
| Law Enforcement | 29 (100.0%) | 0 (0.0%) |
| Food Preparation & Serving | 14 (100.0%) | 0 (0.0%) |
| Cleaning & Maintenance | 8 (36.4%) | 14 (63.6%) |
| Personal Care & Service | 0 (0.0%) | 11 (100.0%) |
| Total (Category) | 51 (56.0%) | 40 (44.0%) |
| Total (Overall) | 486 (51.3%) | 461 (48.7%) |
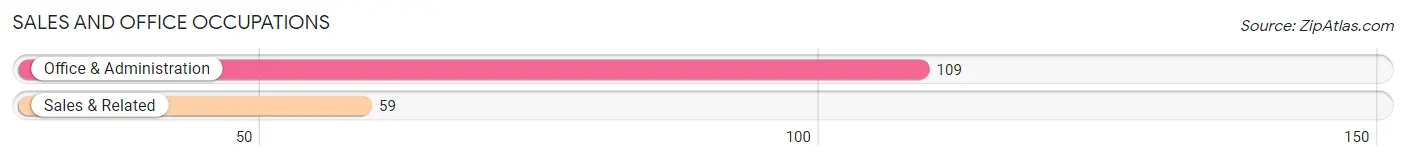
Sales and Office Occupations
The most common Sales and Office occupations in Pennville are Office & Administration (109 | 11.5%), and Sales & Related (59 | 6.2%).
Sales and Office Occupations by Sex
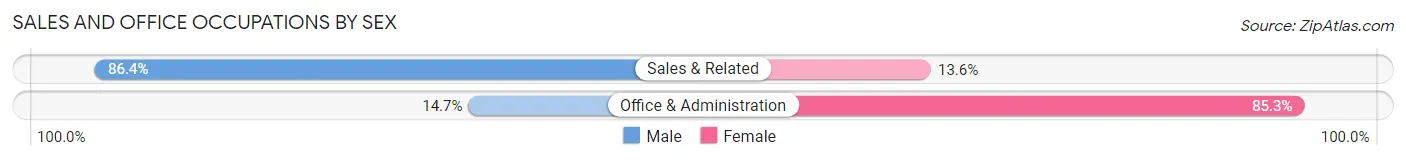
| Occupation | Male | Female |
| Sales & Related | 51 (86.4%) | 8 (13.6%) |
| Office & Administration | 16 (14.7%) | 93 (85.3%) |
| Total (Category) | 67 (39.9%) | 101 (60.1%) |
| Total (Overall) | 486 (51.3%) | 461 (48.7%) |
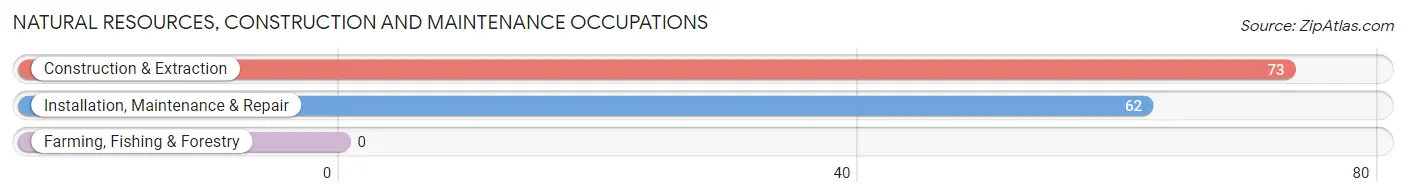
Natural Resources, Construction and Maintenance Occupations
The most common Natural Resources, Construction and Maintenance occupations in Pennville are Construction & Extraction (73 | 7.7%), and Installation, Maintenance & Repair (62 | 6.6%).
Natural Resources, Construction and Maintenance Occupations by Sex
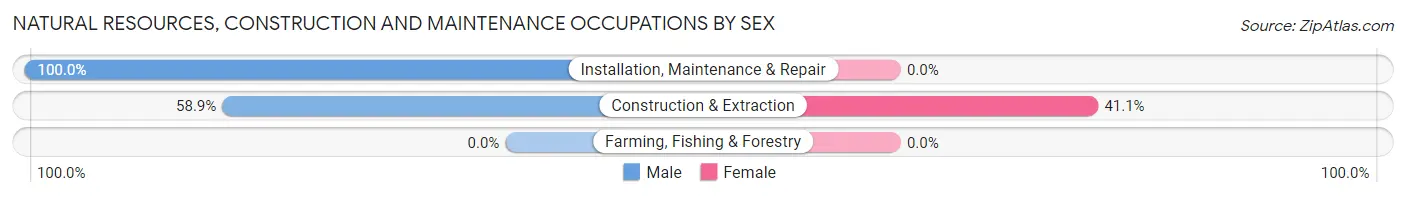
| Occupation | Male | Female |
| Farming, Fishing & Forestry | 0 (0.0%) | 0 (0.0%) |
| Construction & Extraction | 43 (58.9%) | 30 (41.1%) |
| Installation, Maintenance & Repair | 62 (100.0%) | 0 (0.0%) |
| Total (Category) | 105 (77.8%) | 30 (22.2%) |
| Total (Overall) | 486 (51.3%) | 461 (48.7%) |
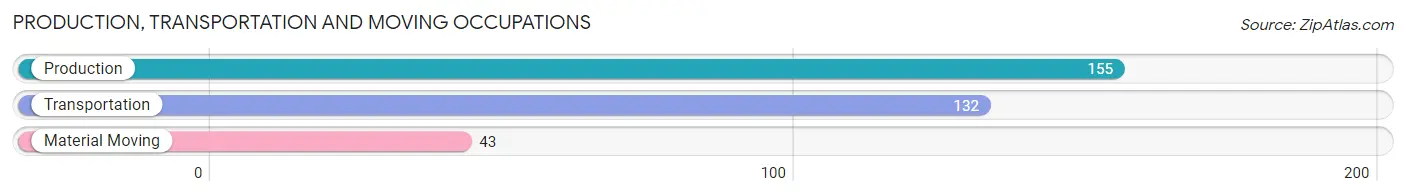
Production, Transportation and Moving Occupations
The most common Production, Transportation and Moving occupations in Pennville are Production (155 | 16.4%), Transportation (132 | 13.9%), and Material Moving (43 | 4.5%).
Production, Transportation and Moving Occupations by Sex
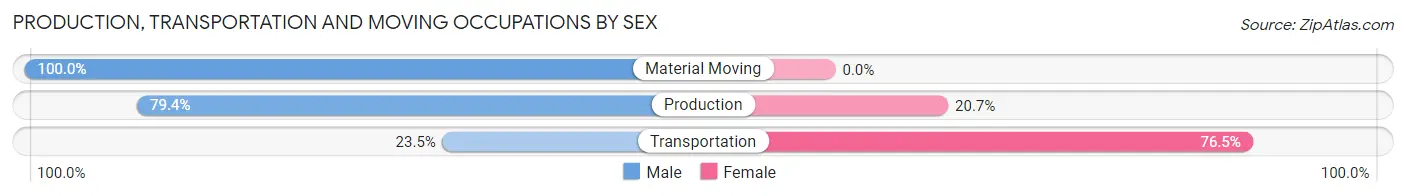
| Occupation | Male | Female |
| Production | 123 (79.3%) | 32 (20.6%) |
| Transportation | 31 (23.5%) | 101 (76.5%) |
| Material Moving | 43 (100.0%) | 0 (0.0%) |
| Total (Category) | 197 (59.7%) | 133 (40.3%) |
| Total (Overall) | 486 (51.3%) | 461 (48.7%) |
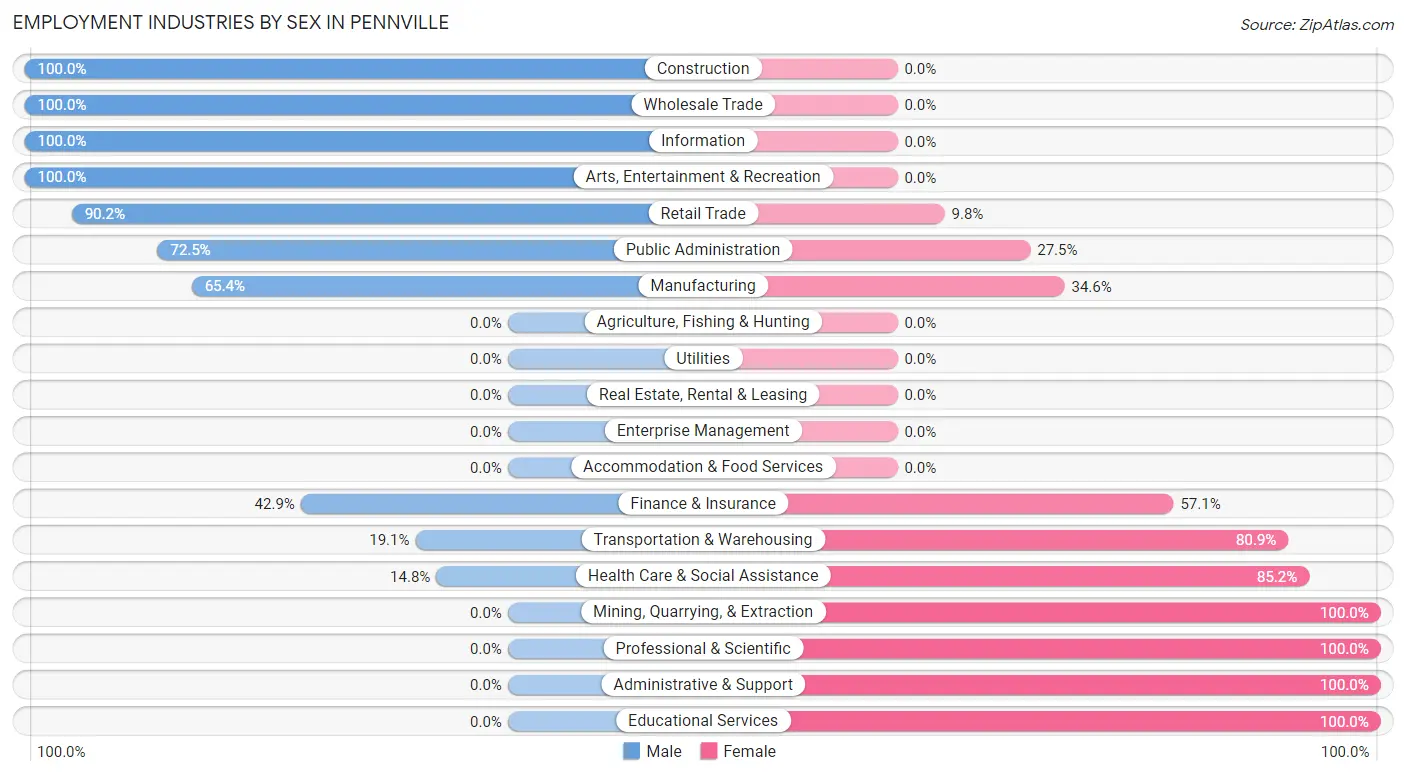
Employment Industries by Sex in Pennville
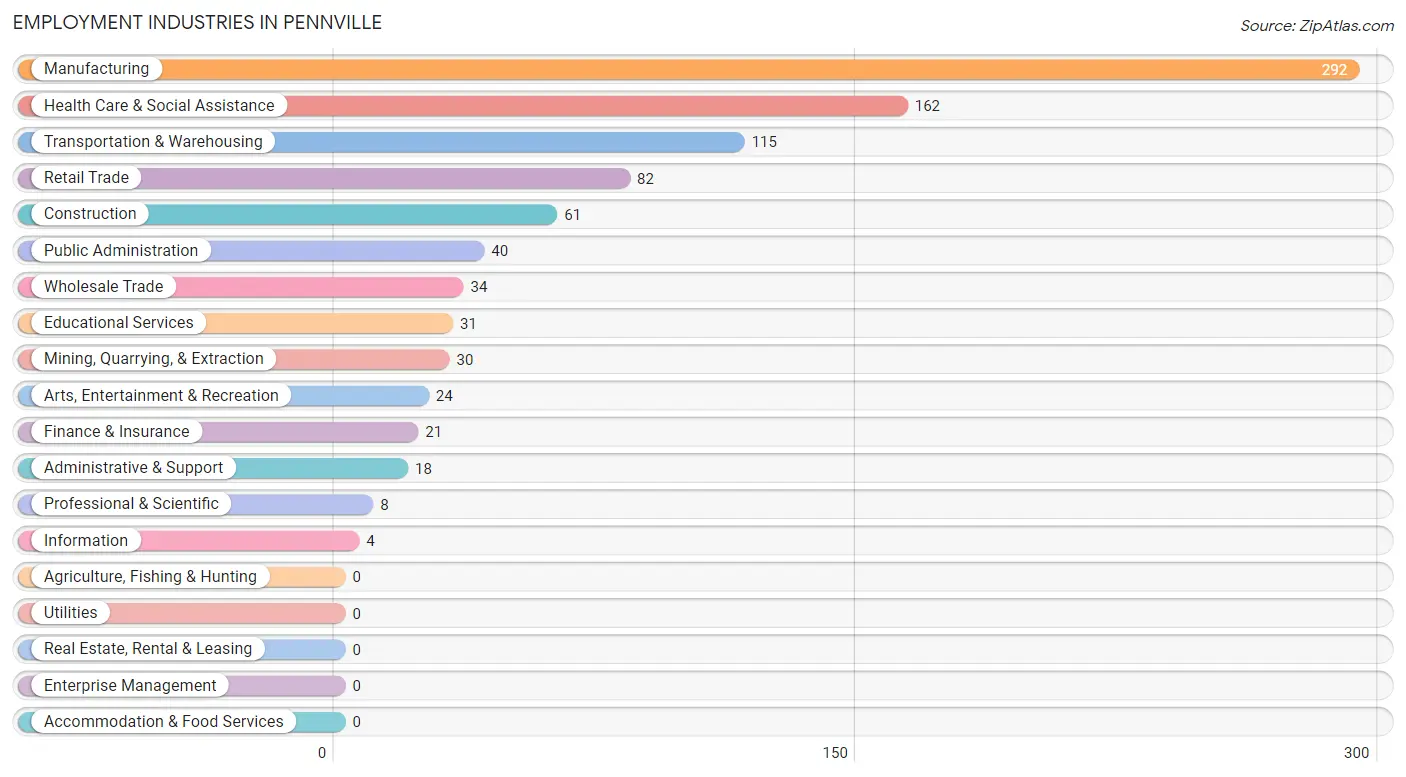
Employment Industries in Pennville
The major employment industries in Pennville include Manufacturing (292 | 30.8%), Health Care & Social Assistance (162 | 17.1%), Transportation & Warehousing (115 | 12.1%), Retail Trade (82 | 8.7%), and Construction (61 | 6.4%).
Employment Industries by Sex in Pennville
The Pennville industries that see more men than women are Construction (100.0%), Wholesale Trade (100.0%), and Information (100.0%), whereas the industries that tend to have a higher number of women are Mining, Quarrying, & Extraction (100.0%), Professional & Scientific (100.0%), and Administrative & Support (100.0%).
| Industry | Male | Female |
| Agriculture, Fishing & Hunting | 0 (0.0%) | 0 (0.0%) |
| Mining, Quarrying, & Extraction | 0 (0.0%) | 30 (100.0%) |
| Construction | 61 (100.0%) | 0 (0.0%) |
| Manufacturing | 191 (65.4%) | 101 (34.6%) |
| Wholesale Trade | 34 (100.0%) | 0 (0.0%) |
| Retail Trade | 74 (90.2%) | 8 (9.8%) |
| Transportation & Warehousing | 22 (19.1%) | 93 (80.9%) |
| Utilities | 0 (0.0%) | 0 (0.0%) |
| Information | 4 (100.0%) | 0 (0.0%) |
| Finance & Insurance | 9 (42.9%) | 12 (57.1%) |
| Real Estate, Rental & Leasing | 0 (0.0%) | 0 (0.0%) |
| Professional & Scientific | 0 (0.0%) | 8 (100.0%) |
| Enterprise Management | 0 (0.0%) | 0 (0.0%) |
| Administrative & Support | 0 (0.0%) | 18 (100.0%) |
| Educational Services | 0 (0.0%) | 31 (100.0%) |
| Health Care & Social Assistance | 24 (14.8%) | 138 (85.2%) |
| Arts, Entertainment & Recreation | 24 (100.0%) | 0 (0.0%) |
| Accommodation & Food Services | 0 (0.0%) | 0 (0.0%) |
| Public Administration | 29 (72.5%) | 11 (27.5%) |
| Total | 486 (51.3%) | 461 (48.7%) |
Education in Pennville
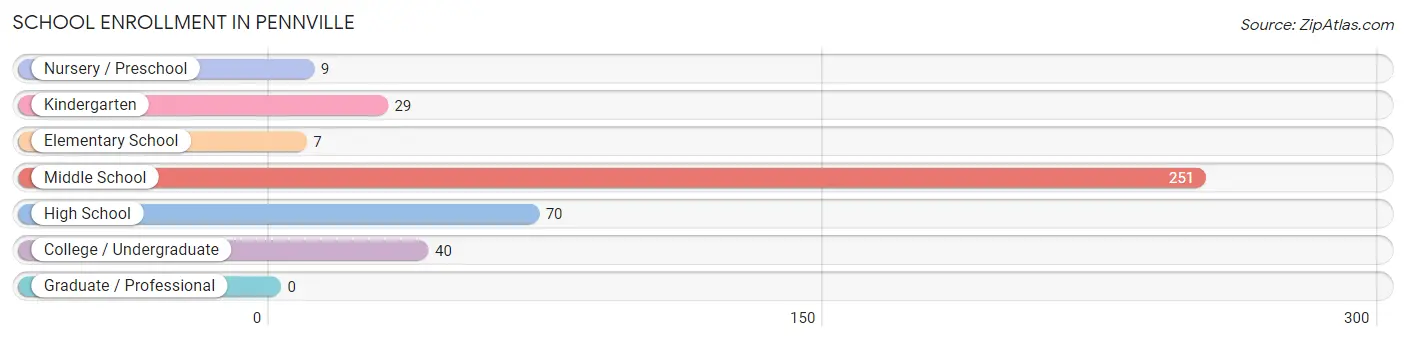
School Enrollment in Pennville
The most common levels of schooling among the 406 students in Pennville are middle school (251 | 61.8%), high school (70 | 17.2%), and college / undergraduate (40 | 9.9%).
| School Level | # Students | % Students |
| Nursery / Preschool | 9 | 2.2% |
| Kindergarten | 29 | 7.1% |
| Elementary School | 7 | 1.7% |
| Middle School | 251 | 61.8% |
| High School | 70 | 17.2% |
| College / Undergraduate | 40 | 9.9% |
| Graduate / Professional | 0 | 0.0% |
| Total | 406 | 100.0% |
School Enrollment by Age by Funding Source in Pennville
Out of a total of 406 students who are enrolled in schools in Pennville, 16 (3.9%) attend a private institution, while the remaining 390 (96.1%) are enrolled in public schools. The age group of 20 to 24 year olds has the highest likelihood of being enrolled in private schools, with 16 (100.0% in the age bracket) enrolled. Conversely, the age group of 3 to 4 year olds has the lowest likelihood of being enrolled in a private school, with 9 (100.0% in the age bracket) attending a public institution.
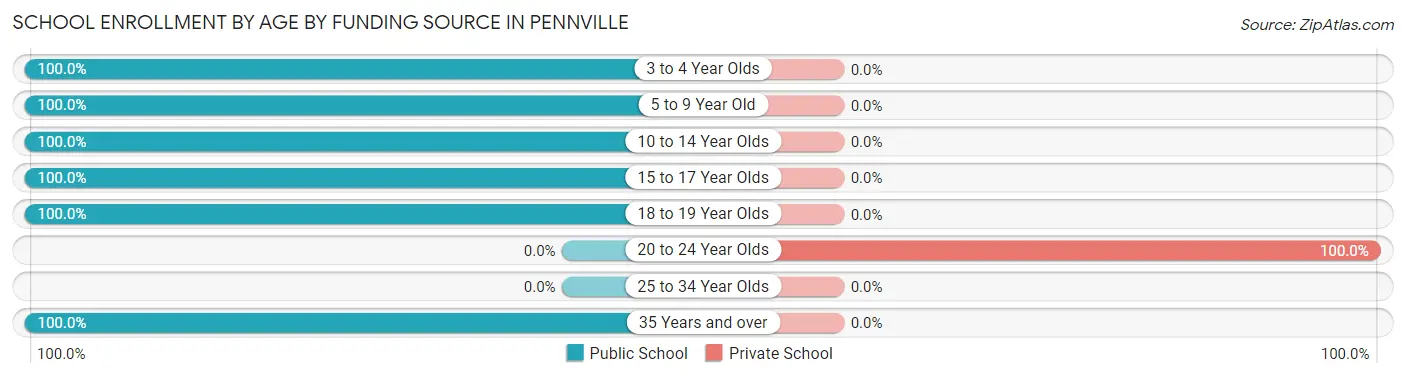
| Age Bracket | Public School | Private School |
| 3 to 4 Year Olds | 9 (100.0%) | 0 (0.0%) |
| 5 to 9 Year Old | 36 (100.0%) | 0 (0.0%) |
| 10 to 14 Year Olds | 216 (100.0%) | 0 (0.0%) |
| 15 to 17 Year Olds | 89 (100.0%) | 0 (0.0%) |
| 18 to 19 Year Olds | 16 (100.0%) | 0 (0.0%) |
| 20 to 24 Year Olds | 0 (0.0%) | 16 (100.0%) |
| 25 to 34 Year Olds | 0 (0.0%) | 0 (0.0%) |
| 35 Years and over | 24 (100.0%) | 0 (0.0%) |
| Total | 390 (96.1%) | 16 (3.9%) |
Educational Attainment by Field of Study in Pennville
Education (101 | 20.4%), business (99 | 20.0%), social sciences (66 | 13.3%), psychology (37 | 7.5%), and science & technology (33 | 6.7%) are the most common fields of study among 496 individuals in Pennville who have obtained a bachelor's degree or higher.
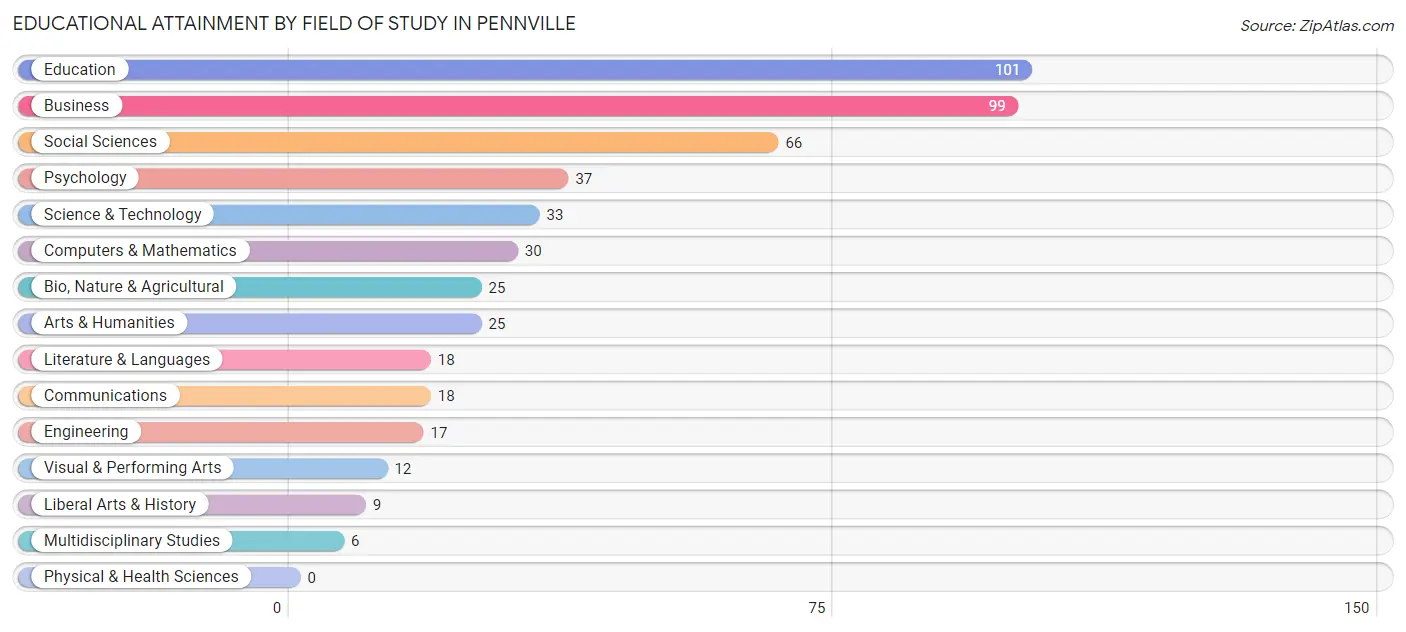
| Field of Study | # Graduates | % Graduates |
| Computers & Mathematics | 30 | 6.0% |
| Bio, Nature & Agricultural | 25 | 5.0% |
| Physical & Health Sciences | 0 | 0.0% |
| Psychology | 37 | 7.5% |
| Social Sciences | 66 | 13.3% |
| Engineering | 17 | 3.4% |
| Multidisciplinary Studies | 6 | 1.2% |
| Science & Technology | 33 | 6.7% |
| Business | 99 | 20.0% |
| Education | 101 | 20.4% |
| Literature & Languages | 18 | 3.6% |
| Liberal Arts & History | 9 | 1.8% |
| Visual & Performing Arts | 12 | 2.4% |
| Communications | 18 | 3.6% |
| Arts & Humanities | 25 | 5.0% |
| Total | 496 | 100.0% |
Transportation & Commute in Pennville
Vehicle Availability by Sex in Pennville
The most prevalent vehicle ownership categories in Pennville are males with 3 vehicles (171, accounting for 35.8%) and females with 3 vehicles (83, making up 46.5%).
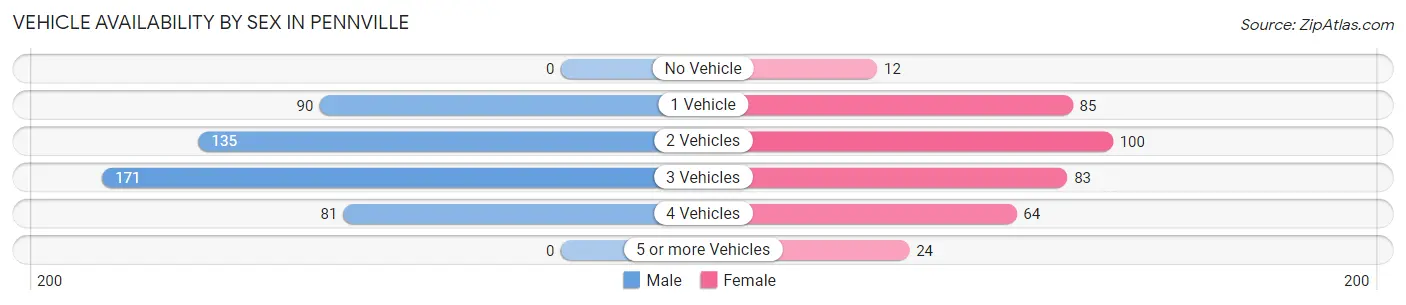
| Vehicles Available | Male | Female |
| No Vehicle | 0 (0.0%) | 12 (3.3%) |
| 1 Vehicle | 90 (18.9%) | 85 (23.1%) |
| 2 Vehicles | 135 (28.3%) | 100 (27.2%) |
| 3 Vehicles | 171 (35.8%) | 83 (22.6%) |
| 4 Vehicles | 81 (17.0%) | 64 (17.4%) |
| 5 or more Vehicles | 0 (0.0%) | 24 (6.5%) |
| Total | 477 (100.0%) | 368 (100.0%) |
Commute Time in Pennville
The most frequently occuring commute durations in Pennville are 10 to 14 minutes (281 commuters, 37.2%), 20 to 24 minutes (96 commuters, 12.7%), and 45 to 59 minutes (94 commuters, 12.4%).
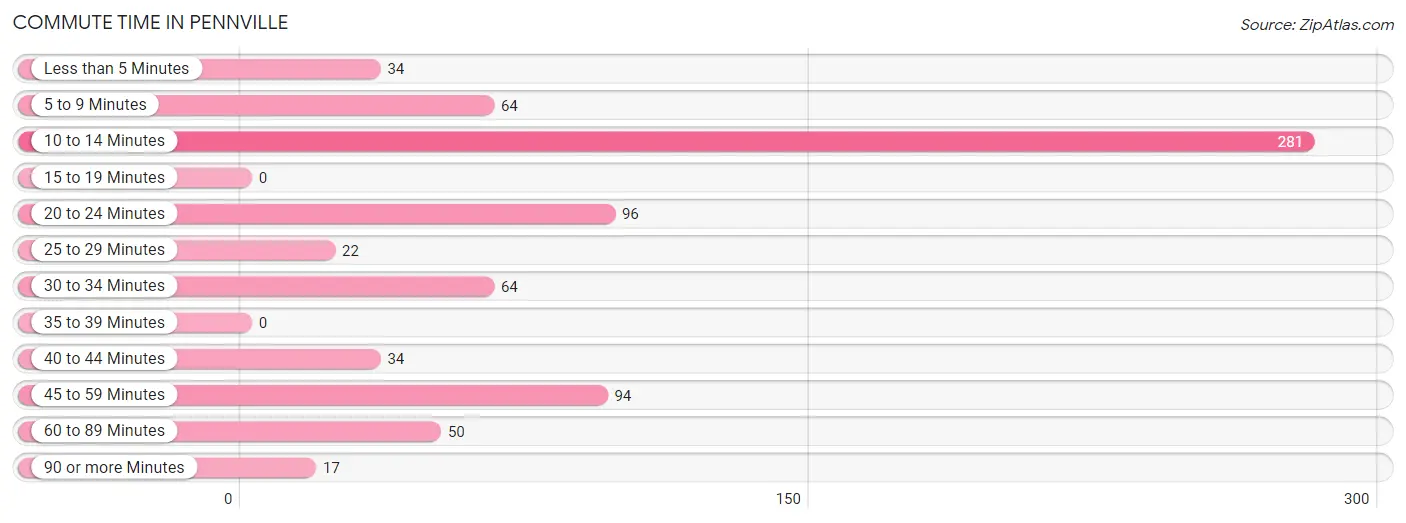
| Commute Time | # Commuters | % Commuters |
| Less than 5 Minutes | 34 | 4.5% |
| 5 to 9 Minutes | 64 | 8.5% |
| 10 to 14 Minutes | 281 | 37.2% |
| 15 to 19 Minutes | 0 | 0.0% |
| 20 to 24 Minutes | 96 | 12.7% |
| 25 to 29 Minutes | 22 | 2.9% |
| 30 to 34 Minutes | 64 | 8.5% |
| 35 to 39 Minutes | 0 | 0.0% |
| 40 to 44 Minutes | 34 | 4.5% |
| 45 to 59 Minutes | 94 | 12.4% |
| 60 to 89 Minutes | 50 | 6.6% |
| 90 or more Minutes | 17 | 2.2% |
Commute Time by Sex in Pennville
The most common commute times in Pennville are 10 to 14 minutes (153 commuters, 32.1%) for males and 10 to 14 minutes (128 commuters, 45.9%) for females.
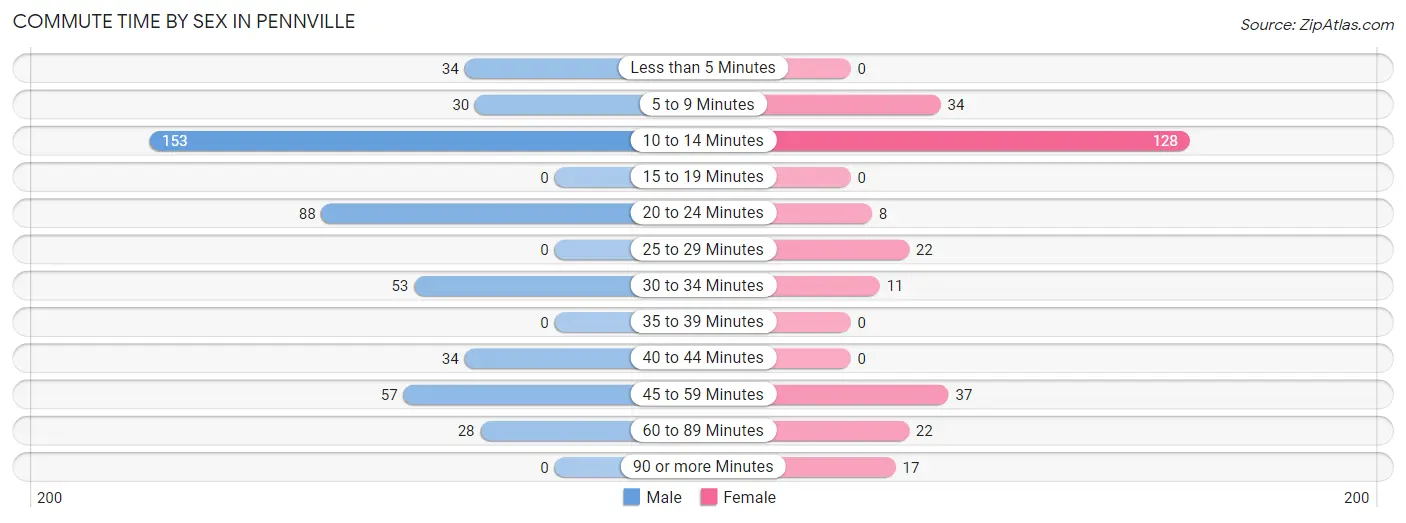
| Commute Time | Male | Female |
| Less than 5 Minutes | 34 (7.1%) | 0 (0.0%) |
| 5 to 9 Minutes | 30 (6.3%) | 34 (12.2%) |
| 10 to 14 Minutes | 153 (32.1%) | 128 (45.9%) |
| 15 to 19 Minutes | 0 (0.0%) | 0 (0.0%) |
| 20 to 24 Minutes | 88 (18.4%) | 8 (2.9%) |
| 25 to 29 Minutes | 0 (0.0%) | 22 (7.9%) |
| 30 to 34 Minutes | 53 (11.1%) | 11 (3.9%) |
| 35 to 39 Minutes | 0 (0.0%) | 0 (0.0%) |
| 40 to 44 Minutes | 34 (7.1%) | 0 (0.0%) |
| 45 to 59 Minutes | 57 (11.9%) | 37 (13.3%) |
| 60 to 89 Minutes | 28 (5.9%) | 22 (7.9%) |
| 90 or more Minutes | 0 (0.0%) | 17 (6.1%) |
Time of Departure to Work by Sex in Pennville
The most frequent times of departure to work in Pennville are 4:00 PM to 11:59 PM (118, 24.7%) for males and 6:00 AM to 6:29 AM (66, 23.7%) for females.
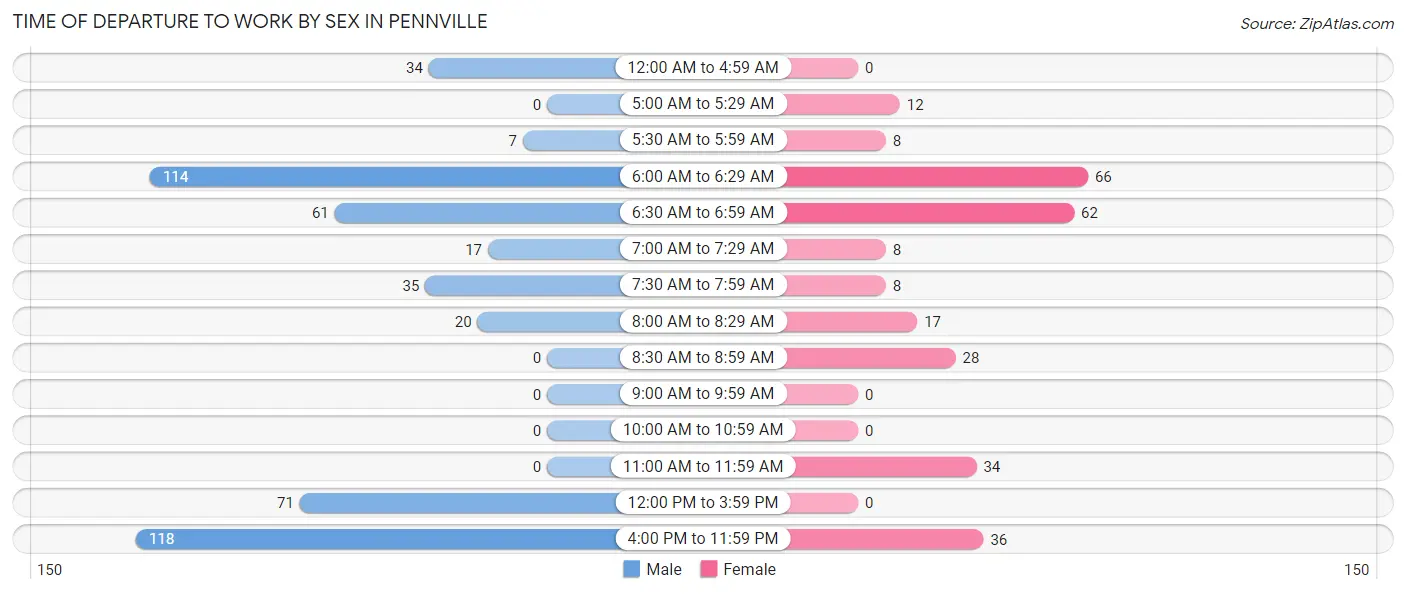
| Time of Departure | Male | Female |
| 12:00 AM to 4:59 AM | 34 (7.1%) | 0 (0.0%) |
| 5:00 AM to 5:29 AM | 0 (0.0%) | 12 (4.3%) |
| 5:30 AM to 5:59 AM | 7 (1.5%) | 8 (2.9%) |
| 6:00 AM to 6:29 AM | 114 (23.9%) | 66 (23.7%) |
| 6:30 AM to 6:59 AM | 61 (12.8%) | 62 (22.2%) |
| 7:00 AM to 7:29 AM | 17 (3.6%) | 8 (2.9%) |
| 7:30 AM to 7:59 AM | 35 (7.3%) | 8 (2.9%) |
| 8:00 AM to 8:29 AM | 20 (4.2%) | 17 (6.1%) |
| 8:30 AM to 8:59 AM | 0 (0.0%) | 28 (10.0%) |
| 9:00 AM to 9:59 AM | 0 (0.0%) | 0 (0.0%) |
| 10:00 AM to 10:59 AM | 0 (0.0%) | 0 (0.0%) |
| 11:00 AM to 11:59 AM | 0 (0.0%) | 34 (12.2%) |
| 12:00 PM to 3:59 PM | 71 (14.9%) | 0 (0.0%) |
| 4:00 PM to 11:59 PM | 118 (24.7%) | 36 (12.9%) |
| Total | 477 (100.0%) | 279 (100.0%) |
Housing Occupancy in Pennville
Occupancy by Ownership in Pennville
Of the total 888 dwellings in Pennville, owner-occupied units account for 688 (77.5%), while renter-occupied units make up 200 (22.5%).
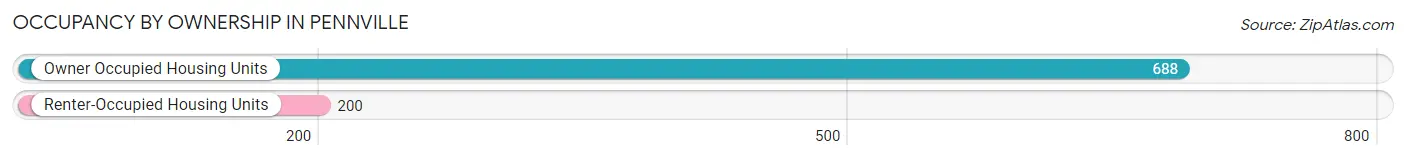
| Occupancy | # Housing Units | % Housing Units |
| Owner Occupied Housing Units | 688 | 77.5% |
| Renter-Occupied Housing Units | 200 | 22.5% |
| Total Occupied Housing Units | 888 | 100.0% |
Occupancy by Household Size in Pennville
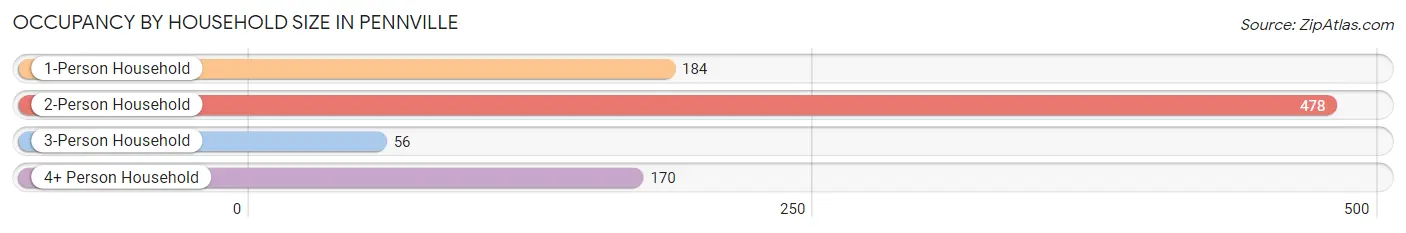
| Household Size | # Housing Units | % Housing Units |
| 1-Person Household | 184 | 20.7% |
| 2-Person Household | 478 | 53.8% |
| 3-Person Household | 56 | 6.3% |
| 4+ Person Household | 170 | 19.1% |
| Total Housing Units | 888 | 100.0% |
Occupancy by Ownership by Household Size in Pennville
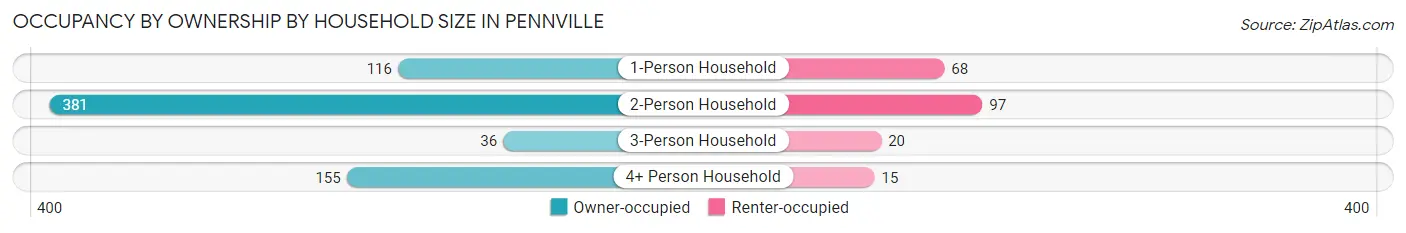
| Household Size | Owner-occupied | Renter-occupied |
| 1-Person Household | 116 (63.0%) | 68 (37.0%) |
| 2-Person Household | 381 (79.7%) | 97 (20.3%) |
| 3-Person Household | 36 (64.3%) | 20 (35.7%) |
| 4+ Person Household | 155 (91.2%) | 15 (8.8%) |
| Total Housing Units | 688 (77.5%) | 200 (22.5%) |
Occupancy by Educational Attainment in Pennville
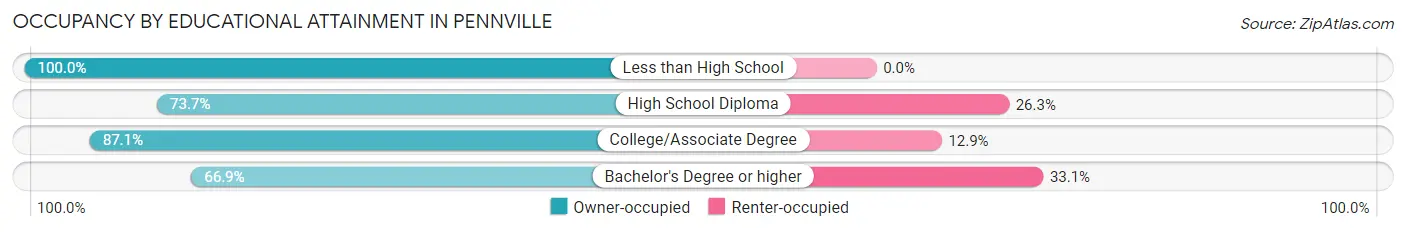
| Household Size | Owner-occupied | Renter-occupied |
| Less than High School | 20 (100.0%) | 0 (0.0%) |
| High School Diploma | 202 (73.7%) | 72 (26.3%) |
| College/Associate Degree | 296 (87.1%) | 44 (12.9%) |
| Bachelor's Degree or higher | 170 (66.9%) | 84 (33.1%) |
Occupancy by Age of Householder in Pennville
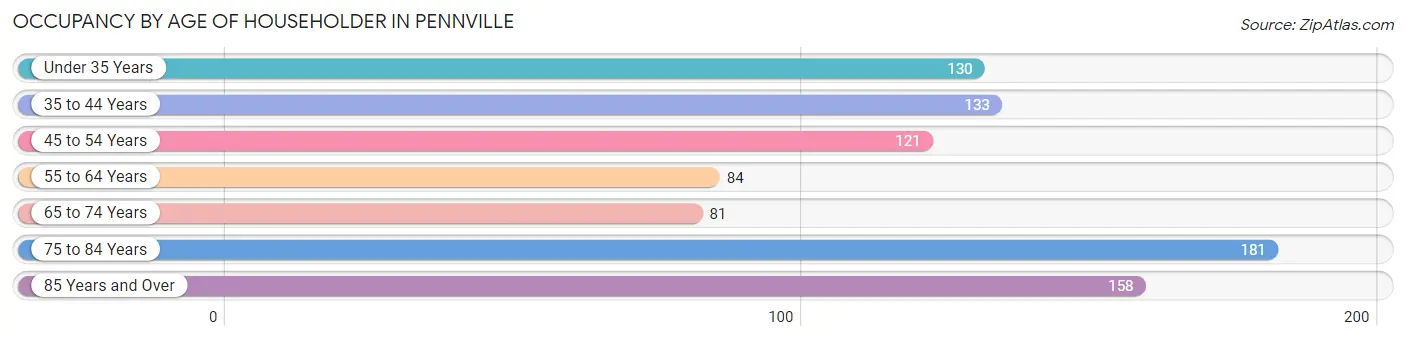
| Age Bracket | # Households | % Households |
| Under 35 Years | 130 | 14.6% |
| 35 to 44 Years | 133 | 15.0% |
| 45 to 54 Years | 121 | 13.6% |
| 55 to 64 Years | 84 | 9.5% |
| 65 to 74 Years | 81 | 9.1% |
| 75 to 84 Years | 181 | 20.4% |
| 85 Years and Over | 158 | 17.8% |
| Total | 888 | 100.0% |
Housing Finances in Pennville
Median Income by Occupancy in Pennville
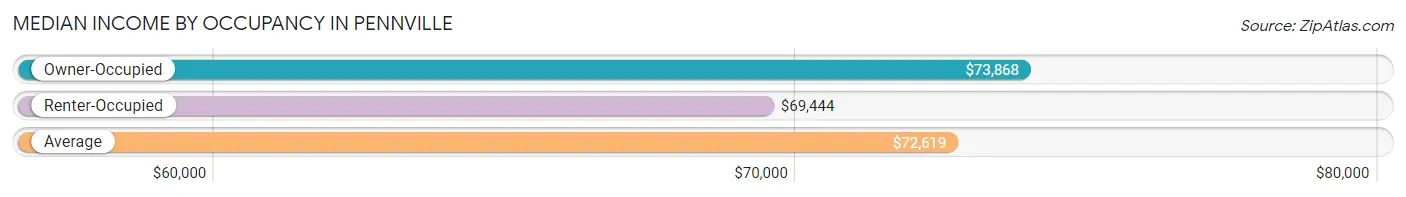
| Occupancy Type | # Households | Median Income |
| Owner-Occupied | 688 (77.5%) | $73,868 |
| Renter-Occupied | 200 (22.5%) | $69,444 |
| Average | 888 (100.0%) | $72,619 |
Occupancy by Householder Income Bracket in Pennville
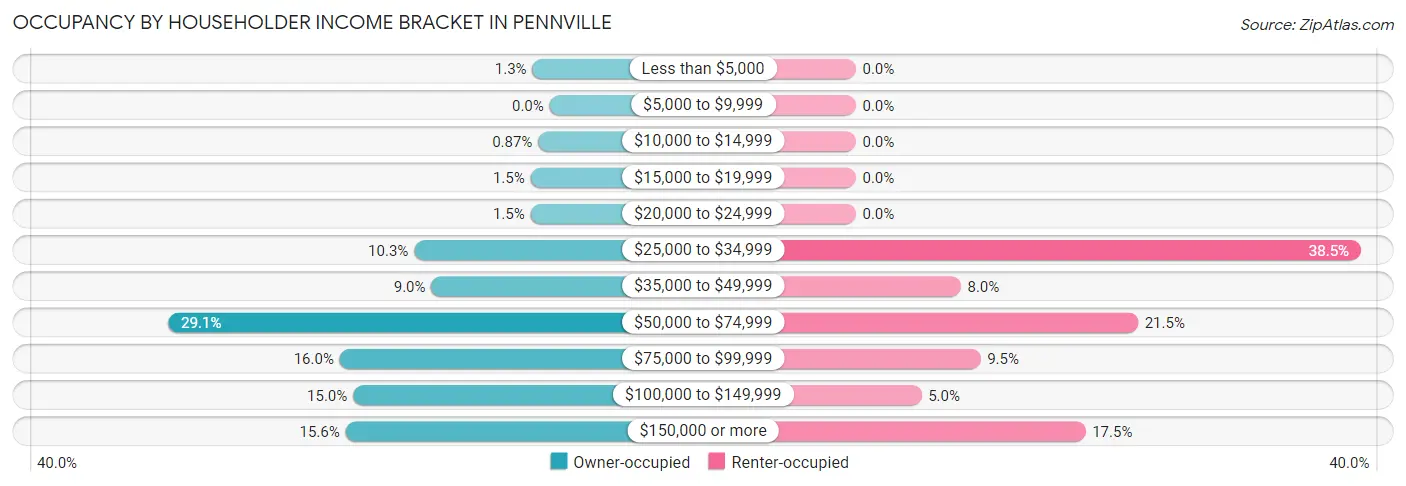
| Income Bracket | Owner-occupied | Renter-occupied |
| Less than $5,000 | 9 (1.3%) | 0 (0.0%) |
| $5,000 to $9,999 | 0 (0.0%) | 0 (0.0%) |
| $10,000 to $14,999 | 6 (0.9%) | 0 (0.0%) |
| $15,000 to $19,999 | 10 (1.5%) | 0 (0.0%) |
| $20,000 to $24,999 | 10 (1.5%) | 0 (0.0%) |
| $25,000 to $34,999 | 71 (10.3%) | 77 (38.5%) |
| $35,000 to $49,999 | 62 (9.0%) | 16 (8.0%) |
| $50,000 to $74,999 | 200 (29.1%) | 43 (21.5%) |
| $75,000 to $99,999 | 110 (16.0%) | 19 (9.5%) |
| $100,000 to $149,999 | 103 (15.0%) | 10 (5.0%) |
| $150,000 or more | 107 (15.5%) | 35 (17.5%) |
| Total | 688 (100.0%) | 200 (100.0%) |
Monthly Housing Cost Tiers in Pennville
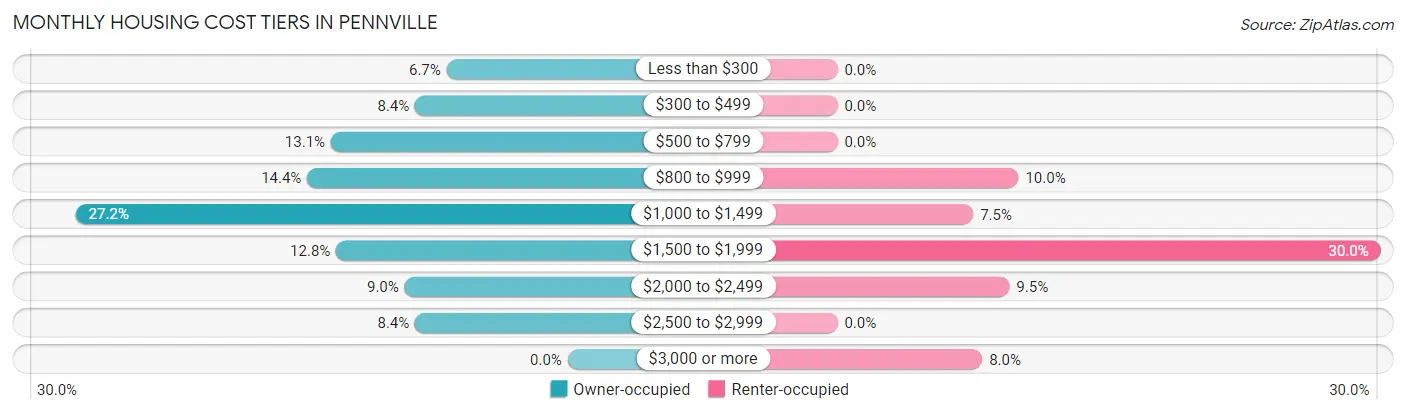
| Monthly Cost | Owner-occupied | Renter-occupied |
| Less than $300 | 46 (6.7%) | 0 (0.0%) |
| $300 to $499 | 58 (8.4%) | 0 (0.0%) |
| $500 to $799 | 90 (13.1%) | 0 (0.0%) |
| $800 to $999 | 99 (14.4%) | 20 (10.0%) |
| $1,000 to $1,499 | 187 (27.2%) | 15 (7.5%) |
| $1,500 to $1,999 | 88 (12.8%) | 60 (30.0%) |
| $2,000 to $2,499 | 62 (9.0%) | 19 (9.5%) |
| $2,500 to $2,999 | 58 (8.4%) | 0 (0.0%) |
| $3,000 or more | 0 (0.0%) | 16 (8.0%) |
| Total | 688 (100.0%) | 200 (100.0%) |
Physical Housing Characteristics in Pennville
Housing Structures in Pennville
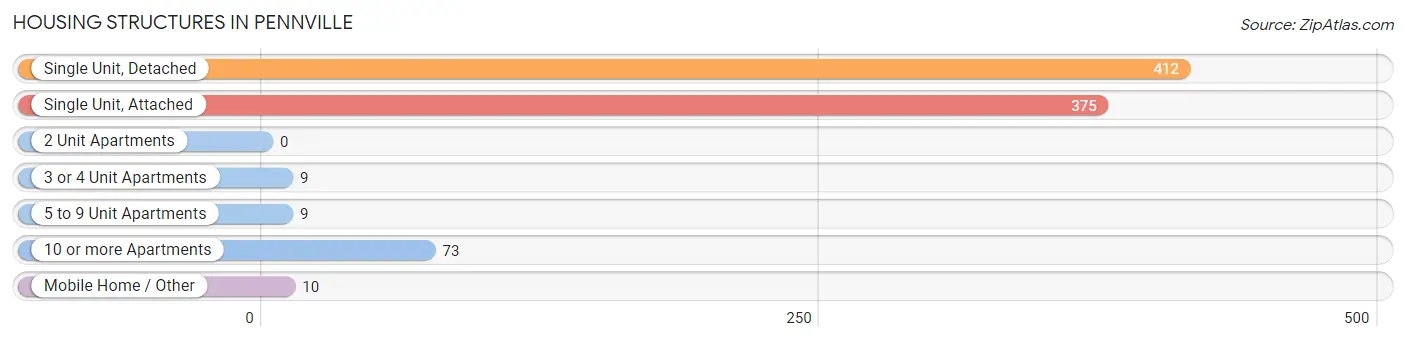
| Structure Type | # Housing Units | % Housing Units |
| Single Unit, Detached | 412 | 46.4% |
| Single Unit, Attached | 375 | 42.2% |
| 2 Unit Apartments | 0 | 0.0% |
| 3 or 4 Unit Apartments | 9 | 1.0% |
| 5 to 9 Unit Apartments | 9 | 1.0% |
| 10 or more Apartments | 73 | 8.2% |
| Mobile Home / Other | 10 | 1.1% |
| Total | 888 | 100.0% |
Housing Structures by Occupancy in Pennville
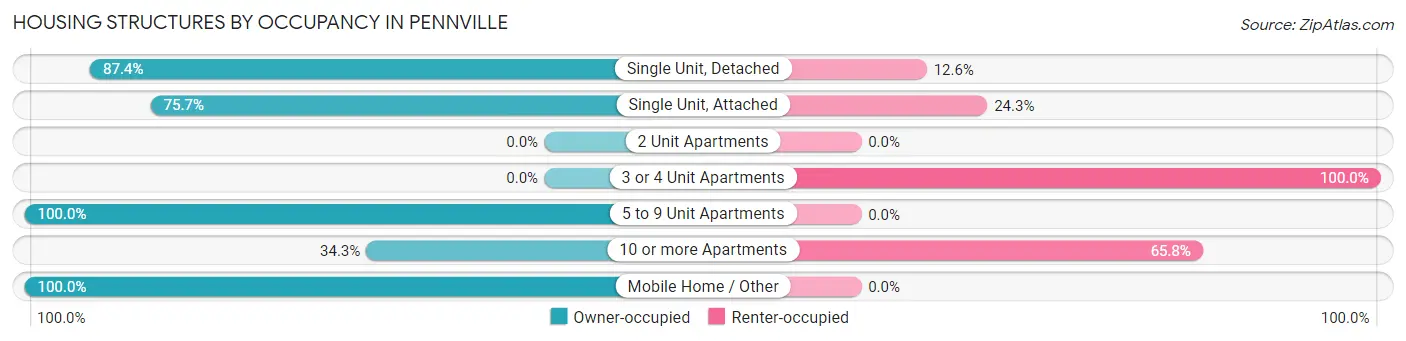
| Structure Type | Owner-occupied | Renter-occupied |
| Single Unit, Detached | 360 (87.4%) | 52 (12.6%) |
| Single Unit, Attached | 284 (75.7%) | 91 (24.3%) |
| 2 Unit Apartments | 0 (0.0%) | 0 (0.0%) |
| 3 or 4 Unit Apartments | 0 (0.0%) | 9 (100.0%) |
| 5 to 9 Unit Apartments | 9 (100.0%) | 0 (0.0%) |
| 10 or more Apartments | 25 (34.3%) | 48 (65.7%) |
| Mobile Home / Other | 10 (100.0%) | 0 (0.0%) |
| Total | 688 (77.5%) | 200 (22.5%) |
Housing Structures by Number of Rooms in Pennville
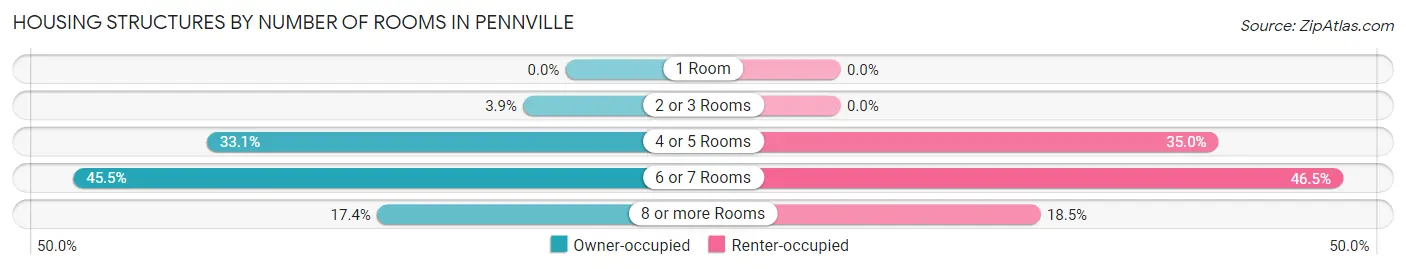
| Number of Rooms | Owner-occupied | Renter-occupied |
| 1 Room | 0 (0.0%) | 0 (0.0%) |
| 2 or 3 Rooms | 27 (3.9%) | 0 (0.0%) |
| 4 or 5 Rooms | 228 (33.1%) | 70 (35.0%) |
| 6 or 7 Rooms | 313 (45.5%) | 93 (46.5%) |
| 8 or more Rooms | 120 (17.4%) | 37 (18.5%) |
| Total | 688 (100.0%) | 200 (100.0%) |
Housing Structure by Heating Type in Pennville
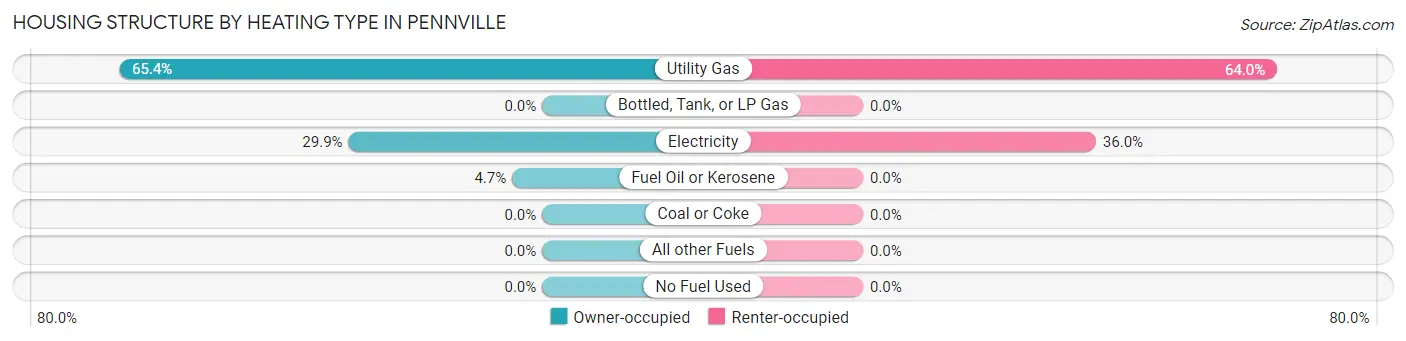
| Heating Type | Owner-occupied | Renter-occupied |
| Utility Gas | 450 (65.4%) | 128 (64.0%) |
| Bottled, Tank, or LP Gas | 0 (0.0%) | 0 (0.0%) |
| Electricity | 206 (29.9%) | 72 (36.0%) |
| Fuel Oil or Kerosene | 32 (4.6%) | 0 (0.0%) |
| Coal or Coke | 0 (0.0%) | 0 (0.0%) |
| All other Fuels | 0 (0.0%) | 0 (0.0%) |
| No Fuel Used | 0 (0.0%) | 0 (0.0%) |
| Total | 688 (100.0%) | 200 (100.0%) |
Household Vehicle Usage in Pennville
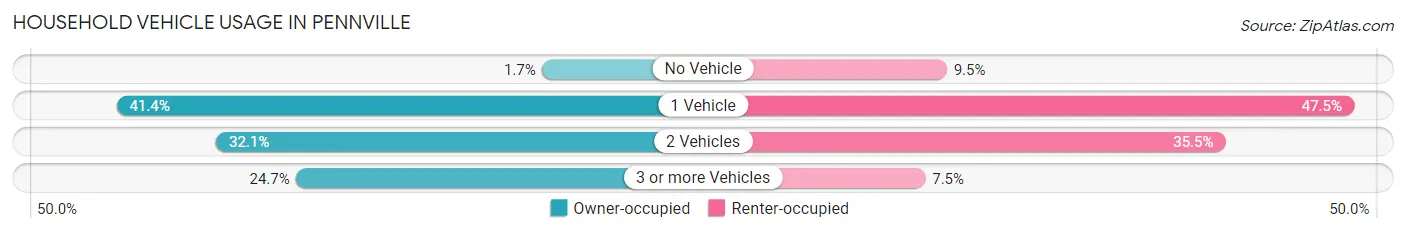
| Vehicles per Household | Owner-occupied | Renter-occupied |
| No Vehicle | 12 (1.7%) | 19 (9.5%) |
| 1 Vehicle | 285 (41.4%) | 95 (47.5%) |
| 2 Vehicles | 221 (32.1%) | 71 (35.5%) |
| 3 or more Vehicles | 170 (24.7%) | 15 (7.5%) |
| Total | 688 (100.0%) | 200 (100.0%) |
Real Estate & Mortgages in Pennville
Real Estate and Mortgage Overview in Pennville
| Characteristic | Without Mortgage | With Mortgage |
| Housing Units | 266 | 422 |
| Median Property Value | $237,500 | $186,800 |
| Median Household Income | $88,175 | $51 |
| Monthly Housing Costs | $610 | $0 |
| Real Estate Taxes | $3,451 | $7 |
Property Value by Mortgage Status in Pennville
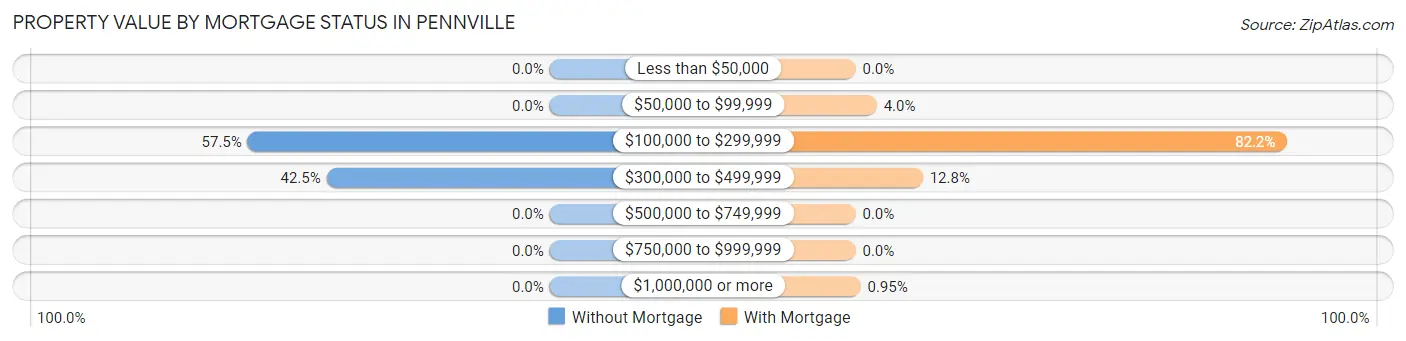
| Property Value | Without Mortgage | With Mortgage |
| Less than $50,000 | 0 (0.0%) | 0 (0.0%) |
| $50,000 to $99,999 | 0 (0.0%) | 17 (4.0%) |
| $100,000 to $299,999 | 153 (57.5%) | 347 (82.2%) |
| $300,000 to $499,999 | 113 (42.5%) | 54 (12.8%) |
| $500,000 to $749,999 | 0 (0.0%) | 0 (0.0%) |
| $750,000 to $999,999 | 0 (0.0%) | 0 (0.0%) |
| $1,000,000 or more | 0 (0.0%) | 4 (0.9%) |
| Total | 266 (100.0%) | 422 (100.0%) |
Household Income by Mortgage Status in Pennville
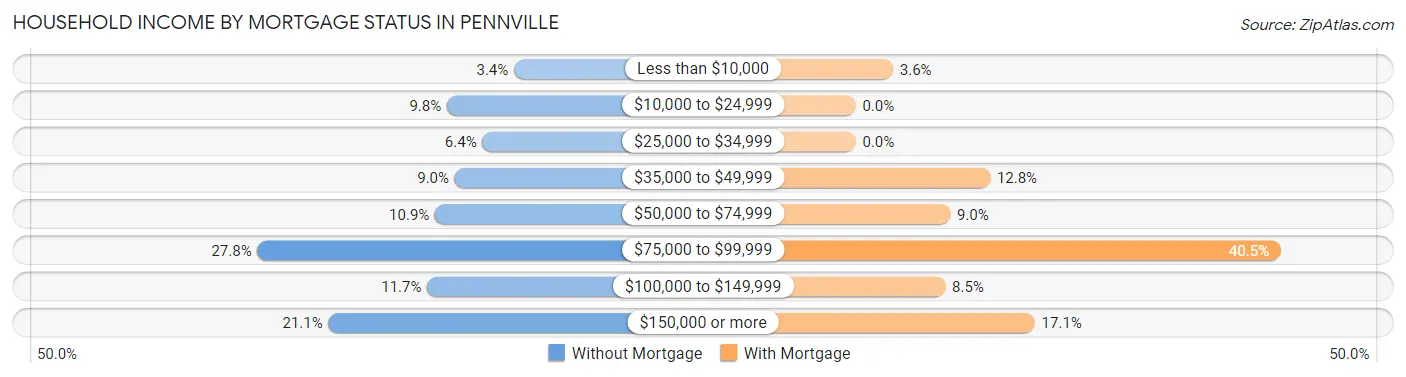
| Household Income | Without Mortgage | With Mortgage |
| Less than $10,000 | 9 (3.4%) | 15 (3.5%) |
| $10,000 to $24,999 | 26 (9.8%) | 0 (0.0%) |
| $25,000 to $34,999 | 17 (6.4%) | 0 (0.0%) |
| $35,000 to $49,999 | 24 (9.0%) | 54 (12.8%) |
| $50,000 to $74,999 | 29 (10.9%) | 38 (9.0%) |
| $75,000 to $99,999 | 74 (27.8%) | 171 (40.5%) |
| $100,000 to $149,999 | 31 (11.7%) | 36 (8.5%) |
| $150,000 or more | 56 (21.0%) | 72 (17.1%) |
| Total | 266 (100.0%) | 422 (100.0%) |
Property Value to Household Income Ratio in Pennville
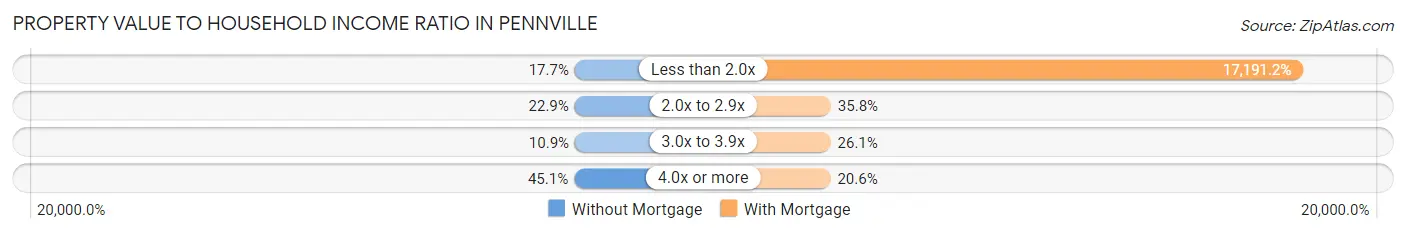
| Value-to-Income Ratio | Without Mortgage | With Mortgage |
| Less than 2.0x | 47 (17.7%) | 72,547 (17,191.2%) |
| 2.0x to 2.9x | 61 (22.9%) | 151 (35.8%) |
| 3.0x to 3.9x | 29 (10.9%) | 110 (26.1%) |
| 4.0x or more | 120 (45.1%) | 87 (20.6%) |
| Total | 266 (100.0%) | 422 (100.0%) |
Real Estate Taxes by Mortgage Status in Pennville
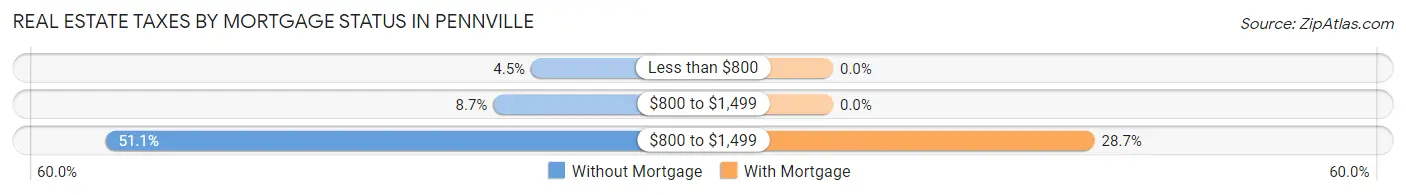
| Property Taxes | Without Mortgage | With Mortgage |
| Less than $800 | 12 (4.5%) | 0 (0.0%) |
| $800 to $1,499 | 23 (8.6%) | 0 (0.0%) |
| $800 to $1,499 | 136 (51.1%) | 121 (28.7%) |
| Total | 266 (100.0%) | 422 (100.0%) |
Health & Disability in Pennville
Health Insurance Coverage by Age in Pennville
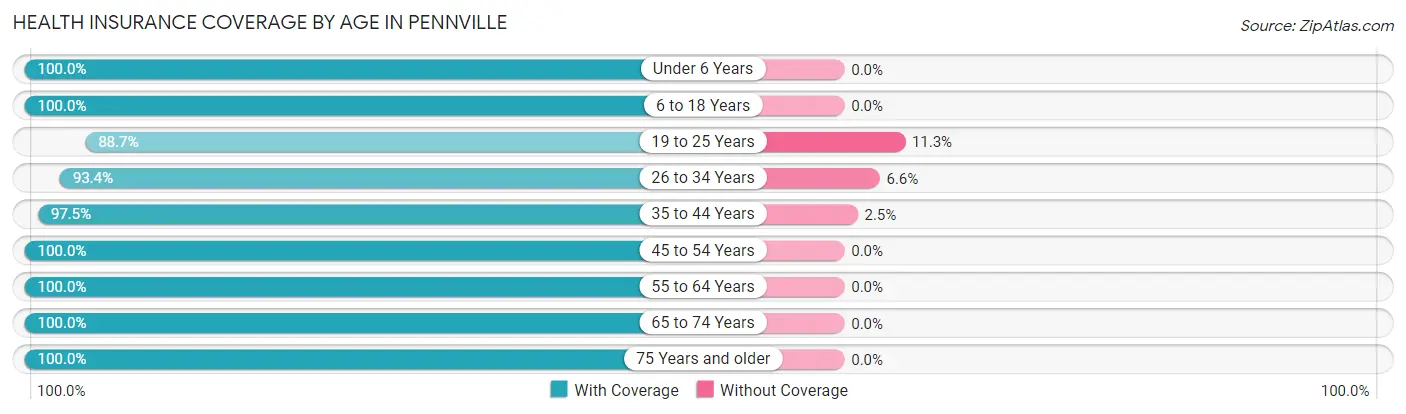
| Age Bracket | With Coverage | Without Coverage |
| Under 6 Years | 144 (100.0%) | 0 (0.0%) |
| 6 to 18 Years | 328 (100.0%) | 0 (0.0%) |
| 19 to 25 Years | 149 (88.7%) | 19 (11.3%) |
| 26 to 34 Years | 199 (93.4%) | 14 (6.6%) |
| 35 to 44 Years | 316 (97.5%) | 8 (2.5%) |
| 45 to 54 Years | 178 (100.0%) | 0 (0.0%) |
| 55 to 64 Years | 116 (100.0%) | 0 (0.0%) |
| 65 to 74 Years | 123 (100.0%) | 0 (0.0%) |
| 75 Years and older | 537 (100.0%) | 0 (0.0%) |
| Total | 2,090 (98.1%) | 41 (1.9%) |
Health Insurance Coverage by Citizenship Status in Pennville
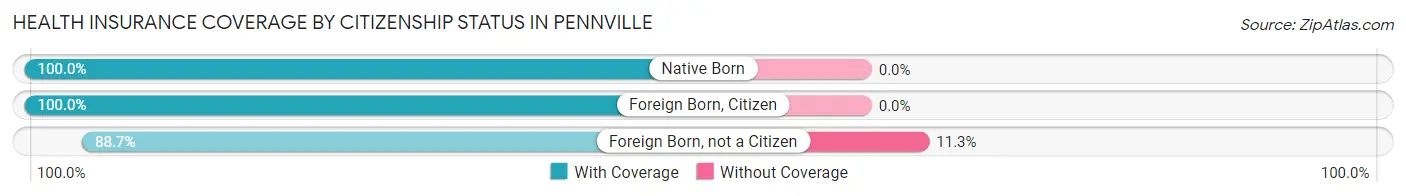
| Citizenship Status | With Coverage | Without Coverage |
| Native Born | 144 (100.0%) | 0 (0.0%) |
| Foreign Born, Citizen | 328 (100.0%) | 0 (0.0%) |
| Foreign Born, not a Citizen | 149 (88.7%) | 19 (11.3%) |
Health Insurance Coverage by Household Income in Pennville
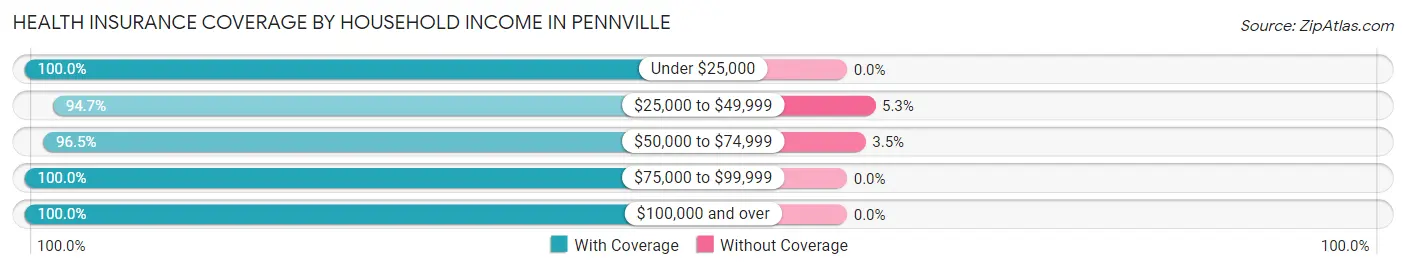
| Household Income | With Coverage | Without Coverage |
| Under $25,000 | 43 (100.0%) | 0 (0.0%) |
| $25,000 to $49,999 | 340 (94.7%) | 19 (5.3%) |
| $50,000 to $74,999 | 610 (96.5%) | 22 (3.5%) |
| $75,000 to $99,999 | 286 (100.0%) | 0 (0.0%) |
| $100,000 and over | 811 (100.0%) | 0 (0.0%) |
Public vs Private Health Insurance Coverage by Age in Pennville
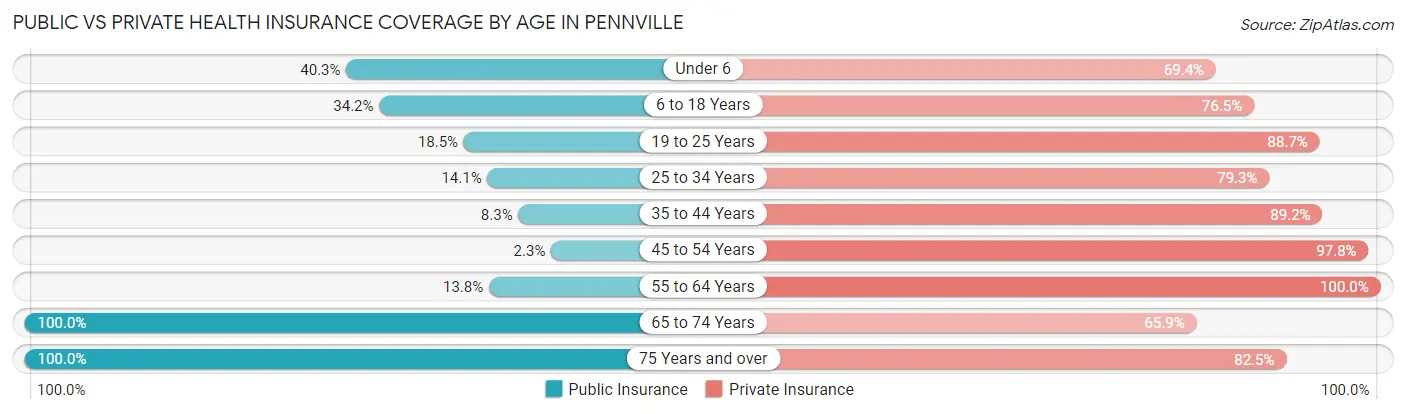
| Age Bracket | Public Insurance | Private Insurance |
| Under 6 | 58 (40.3%) | 100 (69.4%) |
| 6 to 18 Years | 112 (34.2%) | 251 (76.5%) |
| 19 to 25 Years | 31 (18.4%) | 149 (88.7%) |
| 25 to 34 Years | 30 (14.1%) | 169 (79.3%) |
| 35 to 44 Years | 27 (8.3%) | 289 (89.2%) |
| 45 to 54 Years | 4 (2.2%) | 174 (97.8%) |
| 55 to 64 Years | 16 (13.8%) | 116 (100.0%) |
| 65 to 74 Years | 123 (100.0%) | 81 (65.8%) |
| 75 Years and over | 537 (100.0%) | 443 (82.5%) |
| Total | 938 (44.0%) | 1,772 (83.2%) |
Disability Status by Sex by Age in Pennville
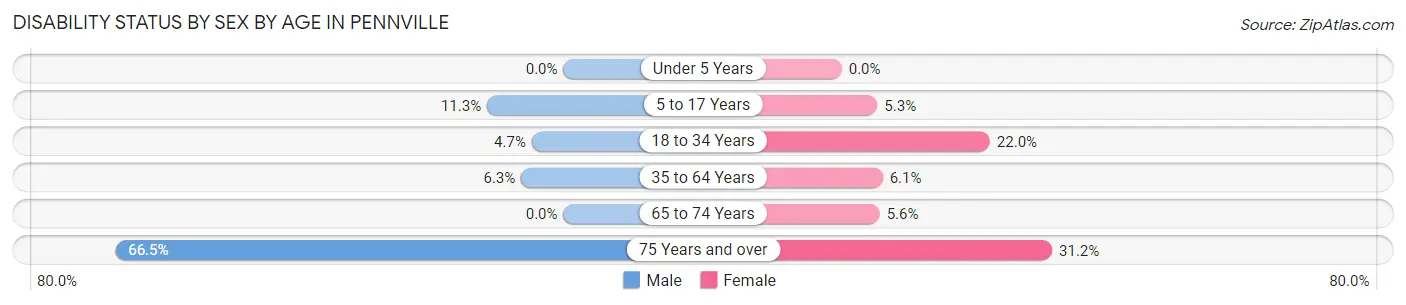
| Age Bracket | Male | Female |
| Under 5 Years | 0 (0.0%) | 0 (0.0%) |
| 5 to 17 Years | 22 (11.3%) | 9 (5.3%) |
| 18 to 34 Years | 12 (4.7%) | 31 (22.0%) |
| 35 to 64 Years | 14 (6.3%) | 24 (6.1%) |
| 65 to 74 Years | 0 (0.0%) | 4 (5.6%) |
| 75 Years and over | 157 (66.5%) | 94 (31.2%) |
Disability Class by Sex by Age in Pennville
Disability Class: Hearing Difficulty
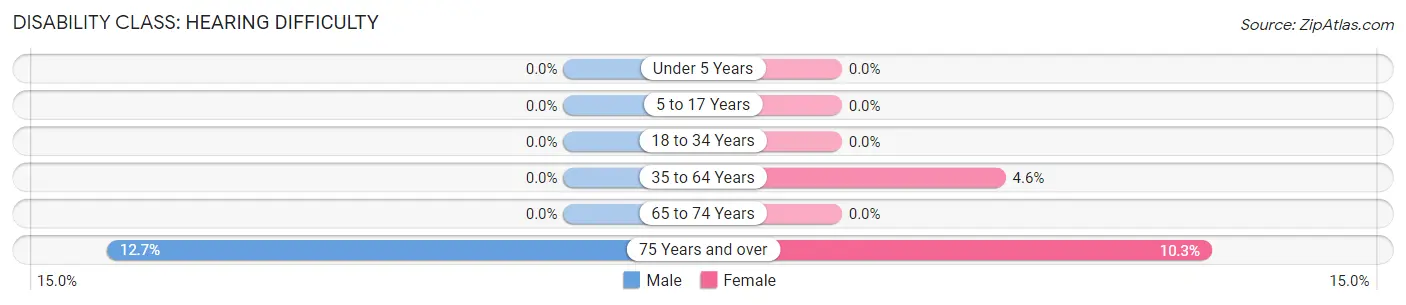
| Age Bracket | Male | Female |
| Under 5 Years | 0 (0.0%) | 0 (0.0%) |
| 5 to 17 Years | 0 (0.0%) | 0 (0.0%) |
| 18 to 34 Years | 0 (0.0%) | 0 (0.0%) |
| 35 to 64 Years | 0 (0.0%) | 18 (4.6%) |
| 65 to 74 Years | 0 (0.0%) | 0 (0.0%) |
| 75 Years and over | 30 (12.7%) | 31 (10.3%) |
Disability Class: Vision Difficulty
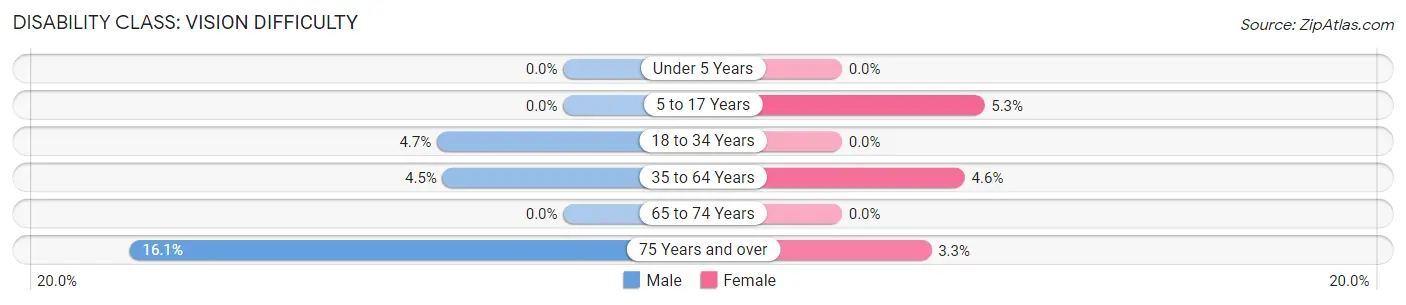
| Age Bracket | Male | Female |
| Under 5 Years | 0 (0.0%) | 0 (0.0%) |
| 5 to 17 Years | 0 (0.0%) | 9 (5.3%) |
| 18 to 34 Years | 12 (4.7%) | 0 (0.0%) |
| 35 to 64 Years | 10 (4.5%) | 18 (4.6%) |
| 65 to 74 Years | 0 (0.0%) | 0 (0.0%) |
| 75 Years and over | 38 (16.1%) | 10 (3.3%) |
Disability Class: Cognitive Difficulty
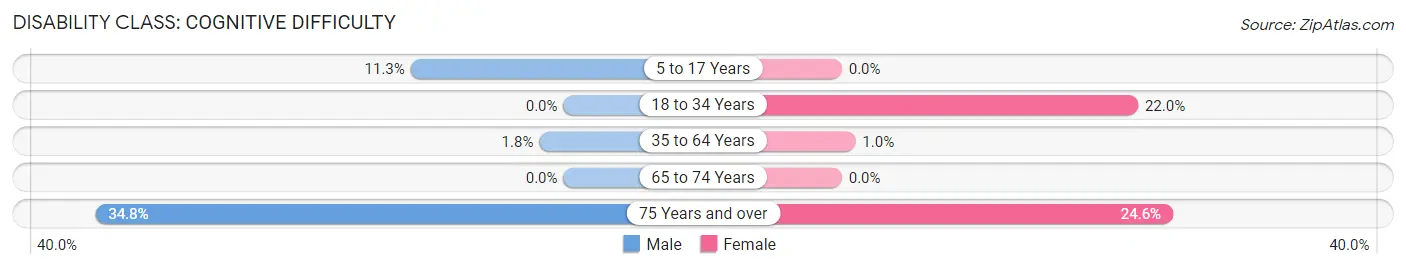
| Age Bracket | Male | Female |
| 5 to 17 Years | 22 (11.3%) | 0 (0.0%) |
| 18 to 34 Years | 0 (0.0%) | 31 (22.0%) |
| 35 to 64 Years | 4 (1.8%) | 4 (1.0%) |
| 65 to 74 Years | 0 (0.0%) | 0 (0.0%) |
| 75 Years and over | 82 (34.7%) | 74 (24.6%) |
Disability Class: Ambulatory Difficulty
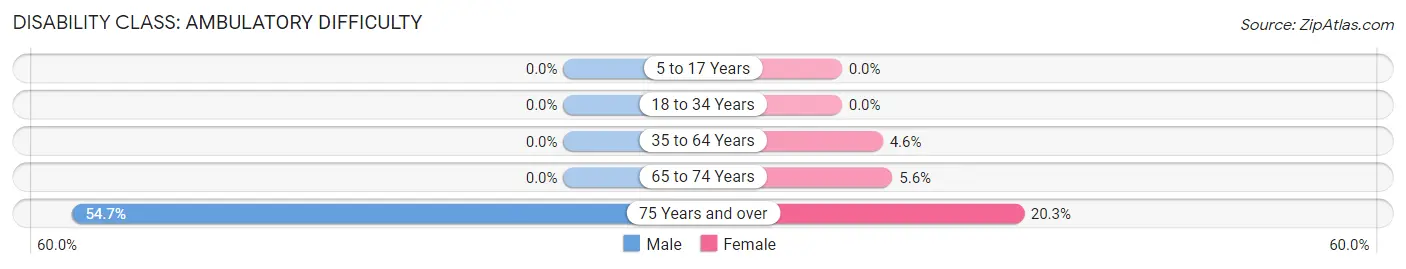
| Age Bracket | Male | Female |
| 5 to 17 Years | 0 (0.0%) | 0 (0.0%) |
| 18 to 34 Years | 0 (0.0%) | 0 (0.0%) |
| 35 to 64 Years | 0 (0.0%) | 18 (4.6%) |
| 65 to 74 Years | 0 (0.0%) | 4 (5.6%) |
| 75 Years and over | 129 (54.7%) | 61 (20.3%) |
Disability Class: Self-Care Difficulty
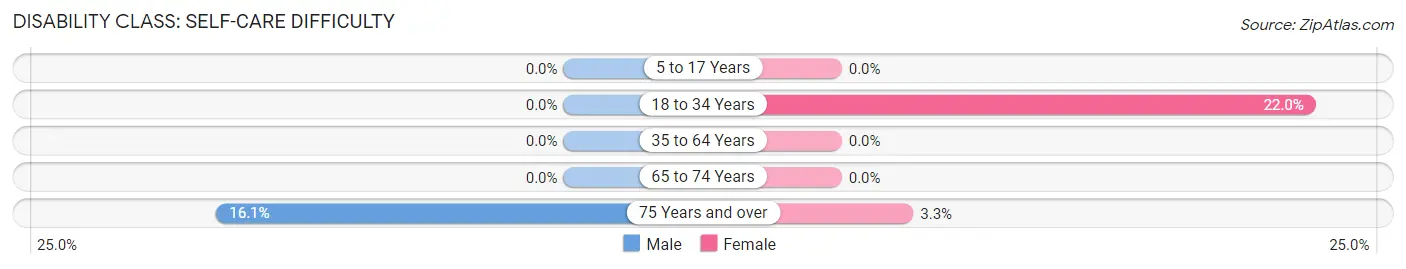
| Age Bracket | Male | Female |
| 5 to 17 Years | 0 (0.0%) | 0 (0.0%) |
| 18 to 34 Years | 0 (0.0%) | 31 (22.0%) |
| 35 to 64 Years | 0 (0.0%) | 0 (0.0%) |
| 65 to 74 Years | 0 (0.0%) | 0 (0.0%) |
| 75 Years and over | 38 (16.1%) | 10 (3.3%) |
Technology Access in Pennville
Computing Device Access in Pennville
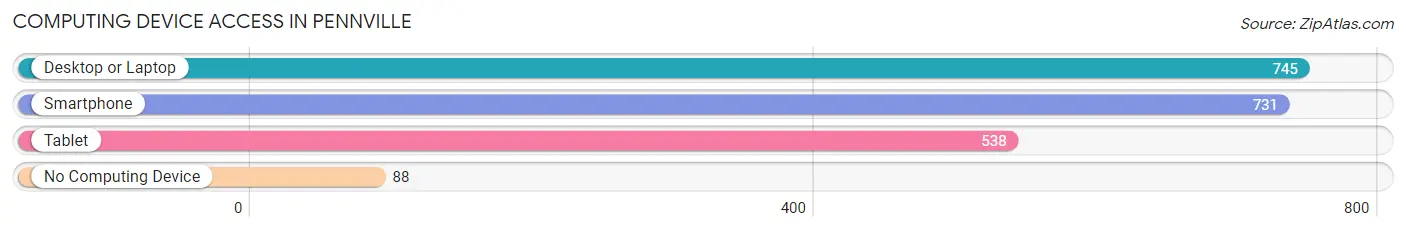
| Device Type | # Households | % Households |
| Desktop or Laptop | 745 | 83.9% |
| Smartphone | 731 | 82.3% |
| Tablet | 538 | 60.6% |
| No Computing Device | 88 | 9.9% |
| Total | 888 | 100.0% |
Internet Access in Pennville
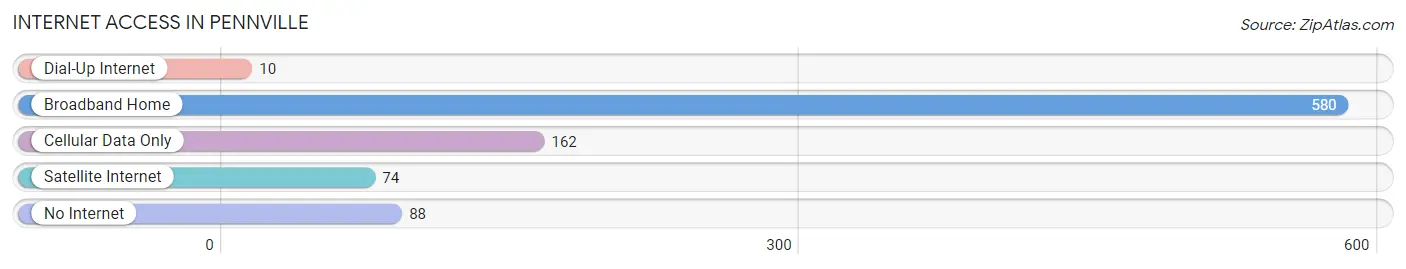
| Internet Type | # Households | % Households |
| Dial-Up Internet | 10 | 1.1% |
| Broadband Home | 580 | 65.3% |
| Cellular Data Only | 162 | 18.2% |
| Satellite Internet | 74 | 8.3% |
| No Internet | 88 | 9.9% |
| Total | 888 | 100.0% |
Pennville Summary
Pennville is a small borough located in the state of Pennsylvania, United States. It is situated in the southeastern corner of the state, in the county of Lancaster. The borough is located in the heart of the Pennsylvania Dutch Country, and is home to a population of approximately 1,000 people.
Geography
Pennville is located in the southeastern corner of Lancaster County, Pennsylvania. It is situated in the heart of the Pennsylvania Dutch Country, and is bordered by the townships of East Lampeter, West Lampeter, and East Earl. The borough is located approximately 20 miles east of the city of Lancaster, and is situated at an elevation of approximately 500 feet above sea level. The borough is situated in a rural area, and is surrounded by rolling hills and farmland.
The climate in Pennville is typical of the mid-Atlantic region, with hot, humid summers and cold, wet winters. The average annual temperature is approximately 54 degrees Fahrenheit, with an average annual precipitation of approximately 40 inches.
Economy
The economy of Pennville is largely based on agriculture and tourism. The borough is home to a number of small family farms, which produce a variety of crops, including corn, soybeans, wheat, and hay. The borough is also home to a number of small businesses, including restaurants, retail stores, and service providers.
Tourism is an important part of the economy of Pennville. The borough is home to a number of attractions, including the Pennsylvania Dutch Countryside, the Strasburg Rail Road, and the National Toy Train Museum. The borough is also home to a number of festivals and events, including the Pennsylvania Dutch Festival, the Pennsylvania Dutch Days, and the Pennsylvania Dutch Folk Festival.
Demographics
As of the 2010 census, the population of Pennville was 1,000 people. The racial makeup of the borough was 97.2% White, 0.7% African American, 0.3% Native American, 0.3% Asian, and 1.5% from other races. The median household income in Pennville was $45,000, and the median family income was $50,000.
The population of Pennville is largely composed of Pennsylvania Dutch, or Amish, people. The Amish are a religious group that follows a strict set of beliefs and practices, and are known for their traditional lifestyle and dress. The Amish are a major part of the culture and economy of Pennville, and are a major tourist attraction in the area.
History
Pennville was founded in 1737 by a group of German immigrants. The borough was originally known as “Penn’s Village”, after William Penn, the founder of the Pennsylvania colony. The borough was officially incorporated in 1845, and was named after the Penn family.
Pennville has a long history of agriculture and industry. The borough was home to a number of mills and factories, including a paper mill, a flour mill, and a sawmill. The borough was also home to a number of small family farms, which produced a variety of crops, including corn, soybeans, wheat, and hay.
In the late 19th century, the borough began to attract a large number of Pennsylvania Dutch, or Amish, people. The Amish are a religious group that follows a strict set of beliefs and practices, and are known for their traditional lifestyle and dress. The Amish are a major part of the culture and economy of Pennville, and are a major tourist attraction in the area.
Common Questions
What is Per Capita Income in Pennville?
Per Capita income in Pennville is $42,192.
What is the Median Family Income in Pennville?
Median Family Income in Pennville is $75,556.
What is the Median Household income in Pennville?
Median Household Income in Pennville is $72,619.
What is Income or Wage Gap in Pennville?
Income or Wage Gap in Pennville is 18.8%.
Women in Pennville earn 81.2 cents for every dollar earned by a man.
What is Inequality or Gini Index in Pennville?
Inequality or Gini Index in Pennville is 0.44.
What is the Total Population of Pennville?
Total Population of Pennville is 2,258.
What is the Total Male Population of Pennville?
Total Male Population of Pennville is 1,064.
What is the Total Female Population of Pennville?
Total Female Population of Pennville is 1,194.
What is the Ratio of Males per 100 Females in Pennville?
There are 89.11 Males per 100 Females in Pennville.
What is the Ratio of Females per 100 Males in Pennville?
There are 112.22 Females per 100 Males in Pennville.
What is the Median Population Age in Pennville?
Median Population Age in Pennville is 42.7 Years.
What is the Average Family Size in Pennville
Average Family Size in Pennville is 2.8 People.
What is the Average Household Size in Pennville
Average Household Size in Pennville is 2.4 People.
How Large is the Labor Force in Pennville?
There are 977 People in the Labor Forcein in Pennville.
What is the Percentage of People in the Labor Force in Pennville?
52.9% of People are in the Labor Force in Pennville.
What is the Unemployment Rate in Pennville?
Unemployment Rate in Pennville is 3.1%.