Patton borough, PA Map & Demographics
Patton borough Overview
$25,226
PER CAPITA INCOME
$66,900
AVG FAMILY INCOME
$55,583
AVG HOUSEHOLD INCOME
27.0%
WAGE / INCOME GAP [ % ]
73.0¢/ $1
WAGE / INCOME GAP [ $ ]
0.40
INEQUALITY / GINI INDEX
1,888
TOTAL POPULATION
920
MALE POPULATION
968
FEMALE POPULATION
95.04
MALES / 100 FEMALES
105.22
FEMALES / 100 MALES
41.7
MEDIAN AGE
3.0
AVG FAMILY SIZE
2.4
AVG HOUSEHOLD SIZE
834
LABOR FORCE [ PEOPLE ]
53.2%
PERCENT IN LABOR FORCE
4.0%
UNEMPLOYMENT RATE
Income in Patton borough
Income Overview in Patton borough
Per Capita Income in Patton borough is $25,226, while median incomes of families and households are $66,900 and $55,583 respectively.
| Characteristic | Number | Measure |
| Per Capita Income | 1,888 | $25,226 |
| Median Family Income | 484 | $66,900 |
| Mean Family Income | 484 | $70,753 |
| Median Household Income | 786 | $55,583 |
| Mean Household Income | 786 | $59,756 |
| Income Deficit | 484 | $0 |
| Wage / Income Gap (%) | 1,888 | 26.97% |
| Wage / Income Gap ($) | 1,888 | 73.03¢ per $1 |
| Gini / Inequality Index | 1,888 | 0.40 |
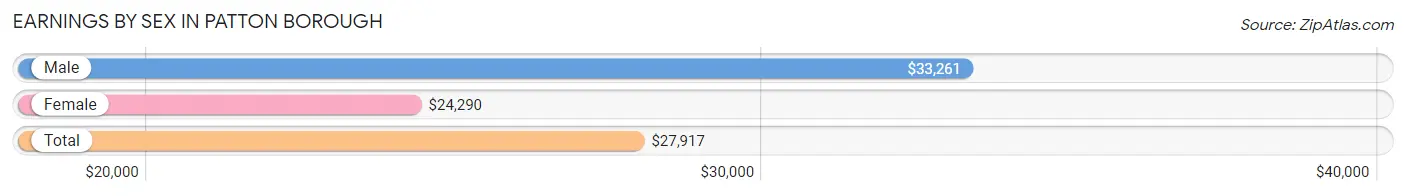
Earnings by Sex in Patton borough
Average Earnings in Patton borough are $27,917, $33,261 for men and $24,290 for women, a difference of 27.0%.
| Sex | Number | Average Earnings |
| Male | 414 (47.9%) | $33,261 |
| Female | 451 (52.1%) | $24,290 |
| Total | 865 (100.0%) | $27,917 |
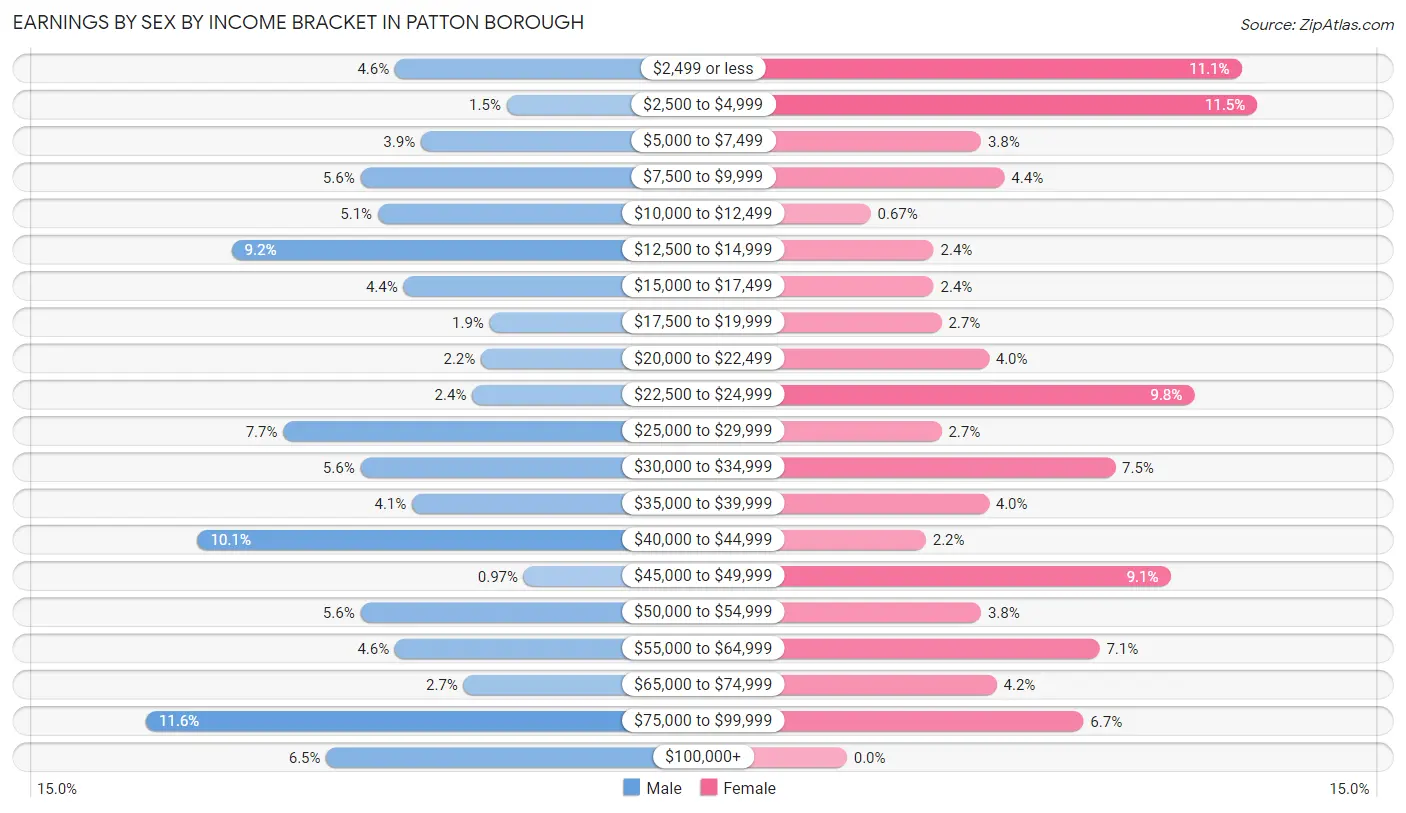
Earnings by Sex by Income Bracket in Patton borough
The most common earnings brackets in Patton borough are $75,000 to $99,999 for men (48 | 11.6%) and $2,500 to $4,999 for women (52 | 11.5%).
| Income | Male | Female |
| $2,499 or less | 19 (4.6%) | 50 (11.1%) |
| $2,500 to $4,999 | 6 (1.5%) | 52 (11.5%) |
| $5,000 to $7,499 | 16 (3.9%) | 17 (3.8%) |
| $7,500 to $9,999 | 23 (5.6%) | 20 (4.4%) |
| $10,000 to $12,499 | 21 (5.1%) | 3 (0.7%) |
| $12,500 to $14,999 | 38 (9.2%) | 11 (2.4%) |
| $15,000 to $17,499 | 18 (4.3%) | 11 (2.4%) |
| $17,500 to $19,999 | 8 (1.9%) | 12 (2.7%) |
| $20,000 to $22,499 | 9 (2.2%) | 18 (4.0%) |
| $22,500 to $24,999 | 10 (2.4%) | 44 (9.8%) |
| $25,000 to $29,999 | 32 (7.7%) | 12 (2.7%) |
| $30,000 to $34,999 | 23 (5.6%) | 34 (7.5%) |
| $35,000 to $39,999 | 17 (4.1%) | 18 (4.0%) |
| $40,000 to $44,999 | 42 (10.1%) | 10 (2.2%) |
| $45,000 to $49,999 | 4 (1.0%) | 41 (9.1%) |
| $50,000 to $54,999 | 23 (5.6%) | 17 (3.8%) |
| $55,000 to $64,999 | 19 (4.6%) | 32 (7.1%) |
| $65,000 to $74,999 | 11 (2.7%) | 19 (4.2%) |
| $75,000 to $99,999 | 48 (11.6%) | 30 (6.7%) |
| $100,000+ | 27 (6.5%) | 0 (0.0%) |
| Total | 414 (100.0%) | 451 (100.0%) |
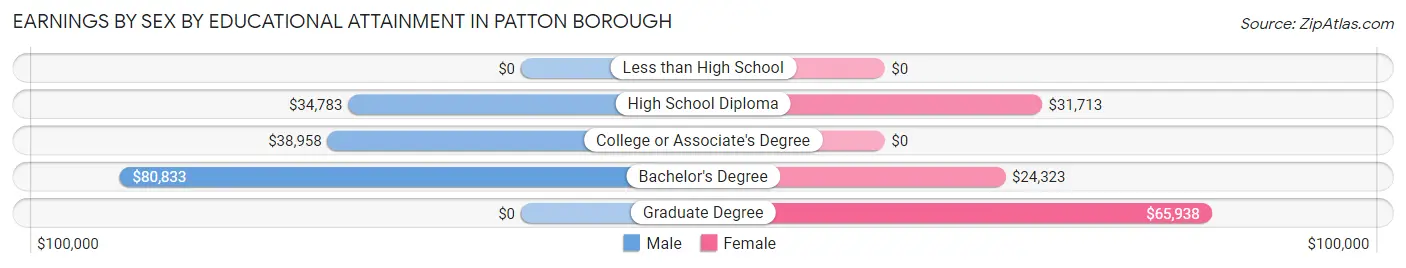
Earnings by Sex by Educational Attainment in Patton borough
Average earnings in Patton borough are $38,958 for men and $30,972 for women, a difference of 20.5%. Men with an educational attainment of bachelor's degree enjoy the highest average annual earnings of $80,833, while those with high school diploma education earn the least with $34,783. Women with an educational attainment of graduate degree earn the most with the average annual earnings of $65,938, while those with bachelor's degree education have the smallest earnings of $24,323.
| Educational Attainment | Male Income | Female Income |
| Less than High School | - | - |
| High School Diploma | $34,783 | $31,713 |
| College or Associate's Degree | $38,958 | $0 |
| Bachelor's Degree | $80,833 | $24,323 |
| Graduate Degree | - | - |
| Total | $38,958 | $30,972 |
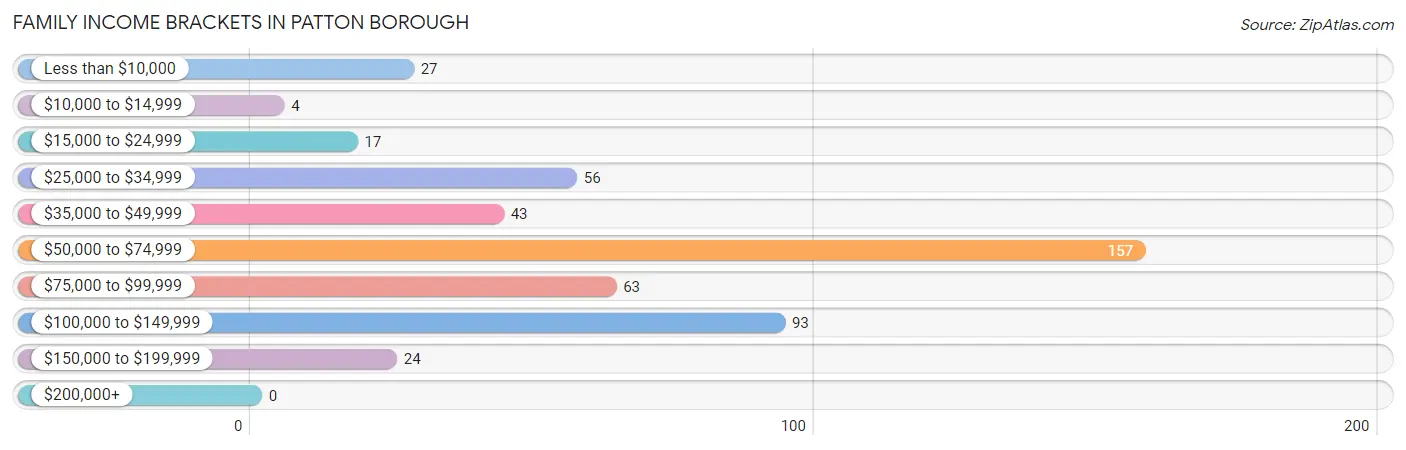
Family Income in Patton borough
Family Income Brackets in Patton borough
According to the Patton borough family income data, there are 157 families falling into the $50,000 to $74,999 income range, which is the most common income bracket and makes up 32.4% of all families.
| Income Bracket | # Families | % Families |
| Less than $10,000 | 27 | 5.6% |
| $10,000 to $14,999 | 4 | 0.8% |
| $15,000 to $24,999 | 17 | 3.5% |
| $25,000 to $34,999 | 56 | 11.6% |
| $35,000 to $49,999 | 43 | 8.9% |
| $50,000 to $74,999 | 157 | 32.4% |
| $75,000 to $99,999 | 63 | 13.0% |
| $100,000 to $149,999 | 93 | 19.2% |
| $150,000 to $199,999 | 24 | 5.0% |
| $200,000+ | 0 | 0.0% |
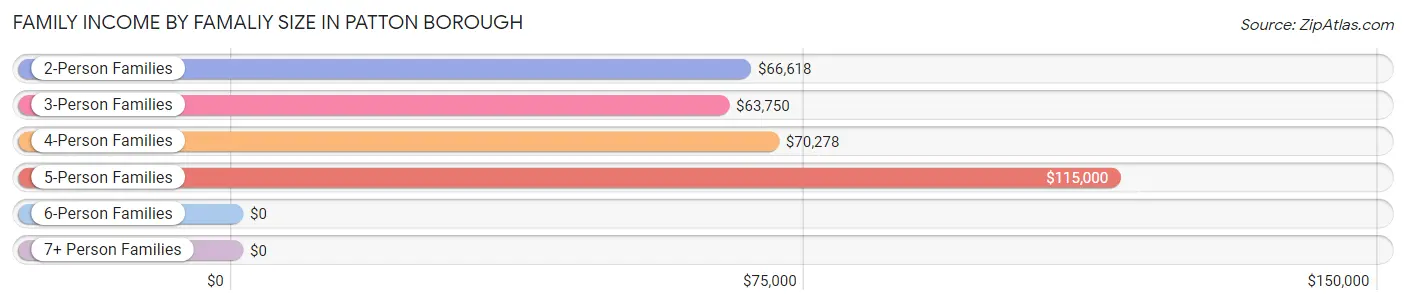
Family Income by Famaliy Size in Patton borough
5-person families (16 | 3.3%) account for the highest median family income in Patton borough with $115,000 per family, while 2-person families (216 | 44.6%) have the highest median income of $33,309 per family member.
| Income Bracket | # Families | Median Income |
| 2-Person Families | 216 (44.6%) | $66,618 |
| 3-Person Families | 135 (27.9%) | $63,750 |
| 4-Person Families | 108 (22.3%) | $70,278 |
| 5-Person Families | 16 (3.3%) | $115,000 |
| 6-Person Families | 7 (1.5%) | $0 |
| 7+ Person Families | 2 (0.4%) | $0 |
| Total | 484 (100.0%) | $66,900 |
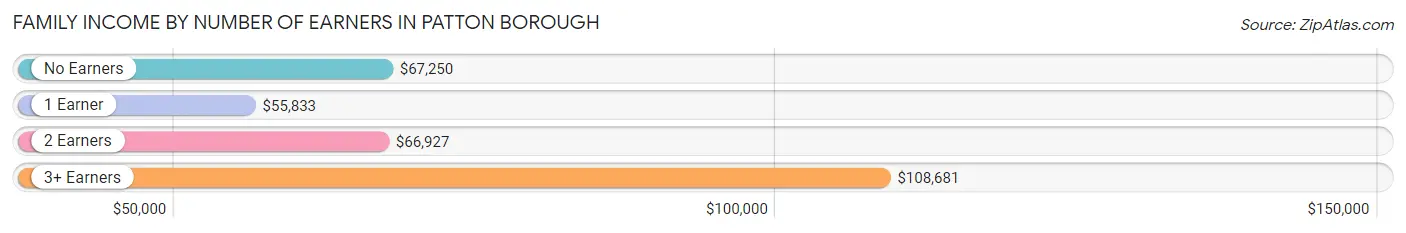
Family Income by Number of Earners in Patton borough
The median family income in Patton borough is $66,900, with families comprising 3+ earners (47) having the highest median family income of $108,681, while families with 1 earner (190) have the lowest median family income of $55,833, accounting for 9.7% and 39.3% of families, respectively.
| Number of Earners | # Families | Median Income |
| No Earners | 84 (17.4%) | $67,250 |
| 1 Earner | 190 (39.3%) | $55,833 |
| 2 Earners | 163 (33.7%) | $66,927 |
| 3+ Earners | 47 (9.7%) | $108,681 |
| Total | 484 (100.0%) | $66,900 |
Household Income in Patton borough
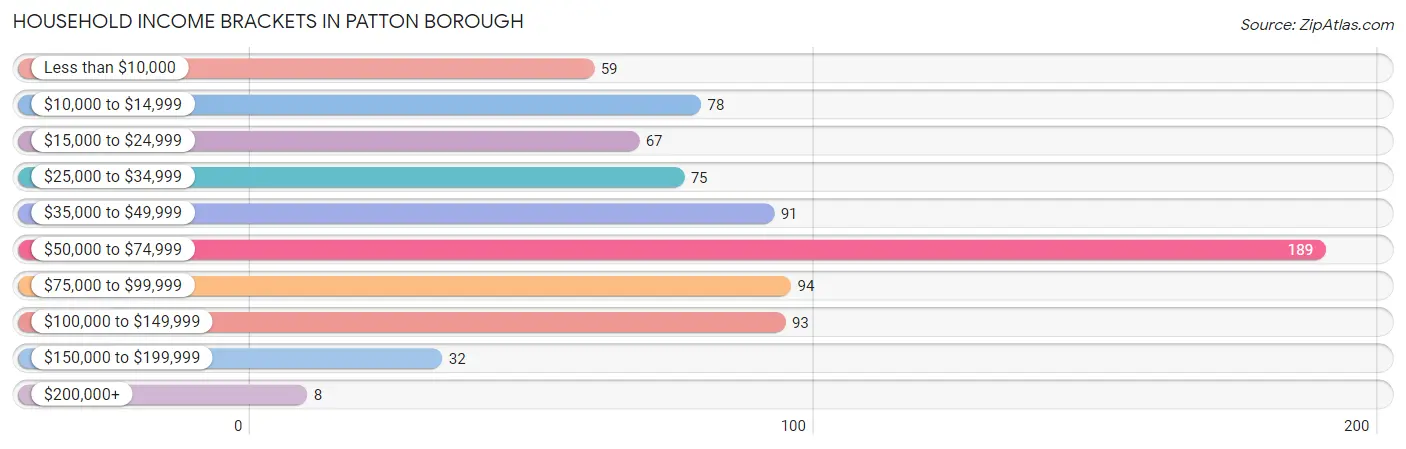
Household Income Brackets in Patton borough
With 189 households falling in the category, the $50,000 to $74,999 income range is the most frequent in Patton borough, accounting for 24.0% of all households. In contrast, only 8 households (1.0%) fall into the $200,000+ income bracket, making it the least populous group.
| Income Bracket | # Households | % Households |
| Less than $10,000 | 59 | 7.5% |
| $10,000 to $14,999 | 78 | 9.9% |
| $15,000 to $24,999 | 67 | 8.5% |
| $25,000 to $34,999 | 75 | 9.5% |
| $35,000 to $49,999 | 91 | 11.6% |
| $50,000 to $74,999 | 189 | 24.0% |
| $75,000 to $99,999 | 94 | 12.0% |
| $100,000 to $149,999 | 93 | 11.8% |
| $150,000 to $199,999 | 32 | 4.1% |
| $200,000+ | 8 | 1.0% |
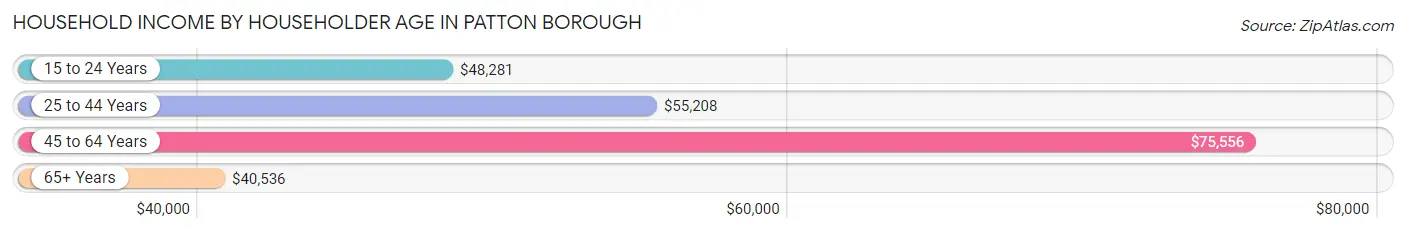
Household Income by Householder Age in Patton borough
The median household income in Patton borough is $55,583, with the highest median household income of $75,556 found in the 45 to 64 years age bracket for the primary householder. A total of 282 households (35.9%) fall into this category. Meanwhile, the 65+ years age bracket for the primary householder has the lowest median household income of $40,536, with 231 households (29.4%) in this group.
| Income Bracket | # Households | Median Income |
| 15 to 24 Years | 19 (2.4%) | $48,281 |
| 25 to 44 Years | 254 (32.3%) | $55,208 |
| 45 to 64 Years | 282 (35.9%) | $75,556 |
| 65+ Years | 231 (29.4%) | $40,536 |
| Total | 786 (100.0%) | $55,583 |
Poverty in Patton borough
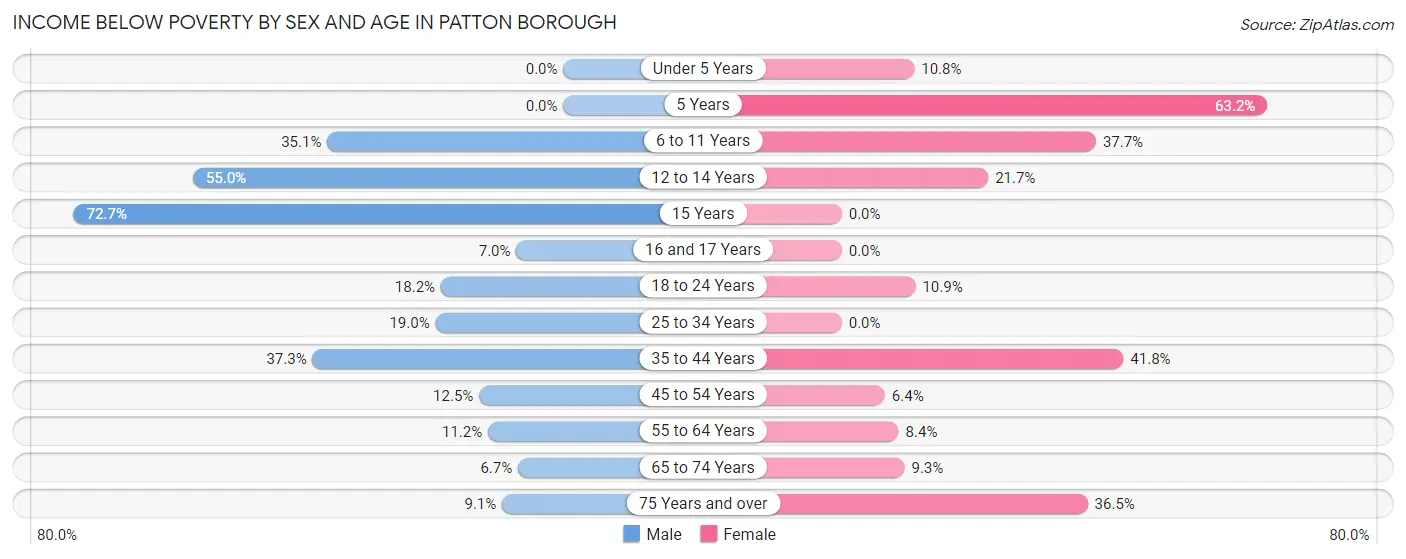
Income Below Poverty by Sex and Age in Patton borough
With 19.2% poverty level for males and 15.7% for females among the residents of Patton borough, 15 year old males and 5 year old females are the most vulnerable to poverty, with 16 males (72.7%) and 12 females (63.2%) in their respective age groups living below the poverty level.
| Age Bracket | Male | Female |
| Under 5 Years | 0 (0.0%) | 7 (10.8%) |
| 5 Years | 0 (0.0%) | 12 (63.2%) |
| 6 to 11 Years | 27 (35.1%) | 20 (37.7%) |
| 12 to 14 Years | 11 (55.0%) | 5 (21.7%) |
| 15 Years | 16 (72.7%) | 0 (0.0%) |
| 16 and 17 Years | 3 (7.0%) | 0 (0.0%) |
| 18 to 24 Years | 10 (18.2%) | 7 (10.9%) |
| 25 to 34 Years | 30 (19.0%) | 0 (0.0%) |
| 35 to 44 Years | 38 (37.2%) | 46 (41.8%) |
| 45 to 54 Years | 12 (12.5%) | 8 (6.4%) |
| 55 to 64 Years | 18 (11.2%) | 13 (8.4%) |
| 65 to 74 Years | 7 (6.7%) | 11 (9.3%) |
| 75 Years and over | 4 (9.1%) | 23 (36.5%) |
| Total | 176 (19.2%) | 152 (15.7%) |
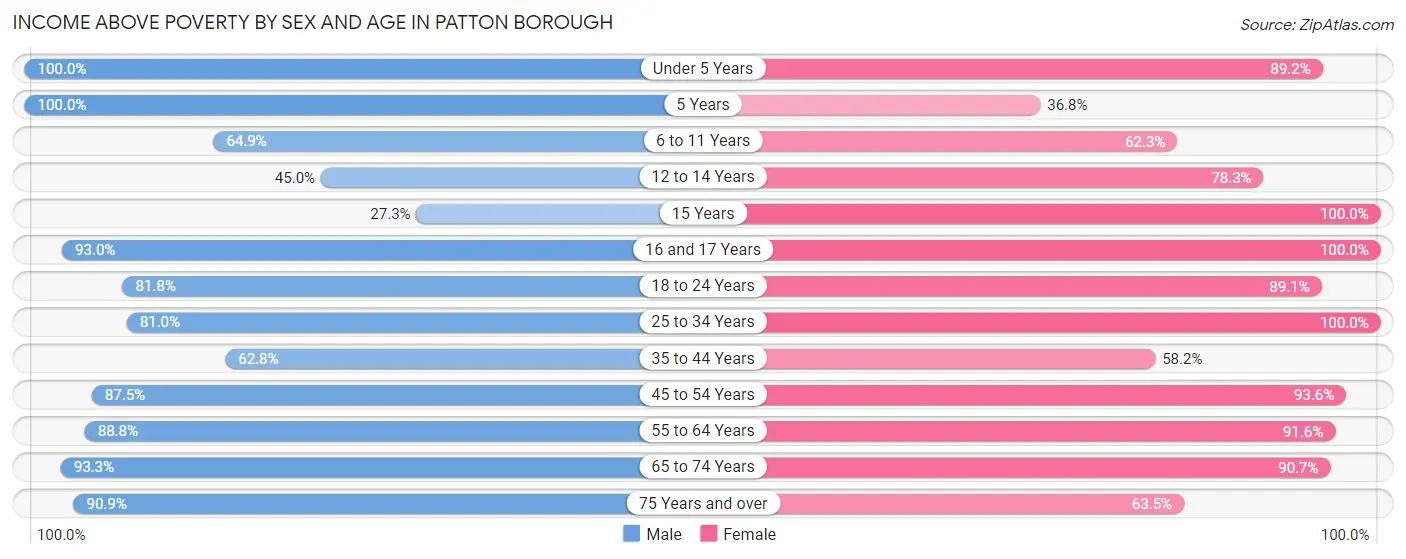
Income Above Poverty by Sex and Age in Patton borough
According to the poverty statistics in Patton borough, males aged under 5 years and females aged 15 years are the age groups that are most secure financially, with 100.0% of males and 100.0% of females in these age groups living above the poverty line.
| Age Bracket | Male | Female |
| Under 5 Years | 33 (100.0%) | 58 (89.2%) |
| 5 Years | 2 (100.0%) | 7 (36.8%) |
| 6 to 11 Years | 50 (64.9%) | 33 (62.3%) |
| 12 to 14 Years | 9 (45.0%) | 18 (78.3%) |
| 15 Years | 6 (27.3%) | 4 (100.0%) |
| 16 and 17 Years | 40 (93.0%) | 41 (100.0%) |
| 18 to 24 Years | 45 (81.8%) | 57 (89.1%) |
| 25 to 34 Years | 128 (81.0%) | 129 (100.0%) |
| 35 to 44 Years | 64 (62.7%) | 64 (58.2%) |
| 45 to 54 Years | 84 (87.5%) | 117 (93.6%) |
| 55 to 64 Years | 143 (88.8%) | 141 (91.6%) |
| 65 to 74 Years | 97 (93.3%) | 107 (90.7%) |
| 75 Years and over | 40 (90.9%) | 40 (63.5%) |
| Total | 741 (80.8%) | 816 (84.3%) |
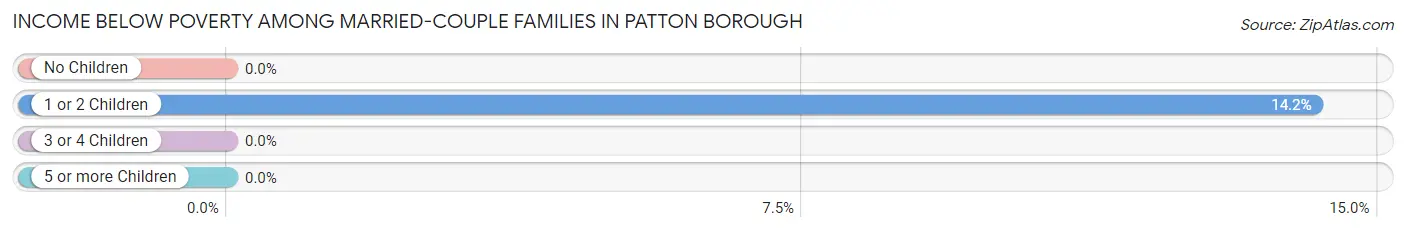
Income Below Poverty Among Married-Couple Families in Patton borough
The poverty statistics for married-couple families in Patton borough show that 5.5% or 18 of the total 326 families live below the poverty line. Families with 1 or 2 children have the highest poverty rate of 14.2%, comprising of 18 families. On the other hand, families with no children have the lowest poverty rate of 0.0%, which includes 0 families.
| Children | Above Poverty | Below Poverty |
| No Children | 187 (100.0%) | 0 (0.0%) |
| 1 or 2 Children | 109 (85.8%) | 18 (14.2%) |
| 3 or 4 Children | 10 (100.0%) | 0 (0.0%) |
| 5 or more Children | 2 (100.0%) | 0 (0.0%) |
| Total | 308 (94.5%) | 18 (5.5%) |
Income Below Poverty Among Single-Parent Households in Patton borough
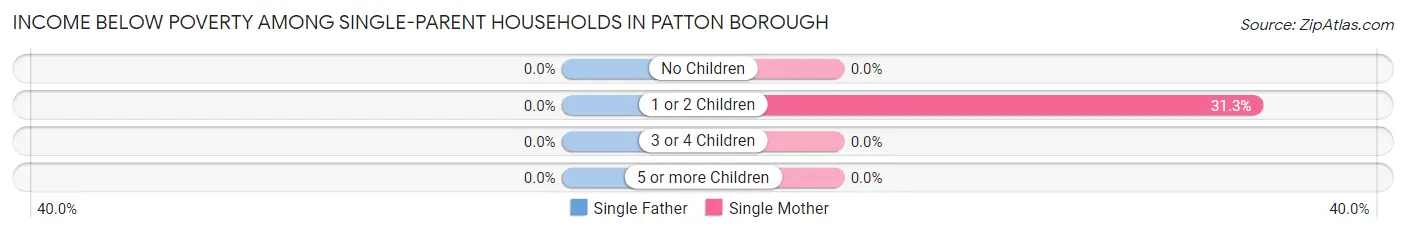
| Children | Single Father | Single Mother |
| No Children | 0 (0.0%) | 0 (0.0%) |
| 1 or 2 Children | 0 (0.0%) | 30 (31.2%) |
| 3 or 4 Children | 0 (0.0%) | 0 (0.0%) |
| 5 or more Children | 0 (0.0%) | 0 (0.0%) |
| Total | 0 (0.0%) | 30 (24.0%) |
Income Below Poverty Among Married-Couple vs Single-Parent Households in Patton borough
The poverty data for Patton borough shows that 18 of the married-couple family households (5.5%) and 30 of the single-parent households (19.0%) are living below the poverty level. Within the married-couple family households, those with 1 or 2 children have the highest poverty rate, with 18 households (14.2%) falling below the poverty line. Among the single-parent households, those with 1 or 2 children have the highest poverty rate, with 30 household (28.6%) living below poverty.
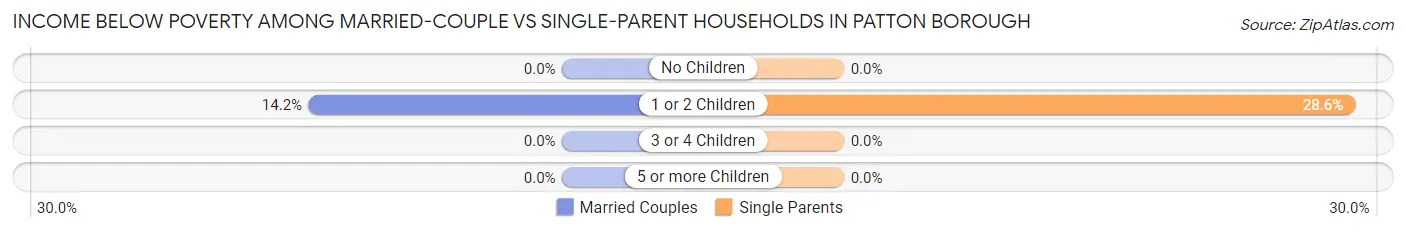
| Children | Married-Couple Families | Single-Parent Households |
| No Children | 0 (0.0%) | 0 (0.0%) |
| 1 or 2 Children | 18 (14.2%) | 30 (28.6%) |
| 3 or 4 Children | 0 (0.0%) | 0 (0.0%) |
| 5 or more Children | 0 (0.0%) | 0 (0.0%) |
| Total | 18 (5.5%) | 30 (19.0%) |
Race in Patton borough
The most populous races in Patton borough are White / Caucasian (1,813 | 96.0%), Two or more Races (75 | 4.0%), and Hispanic or Latino (28 | 1.5%).
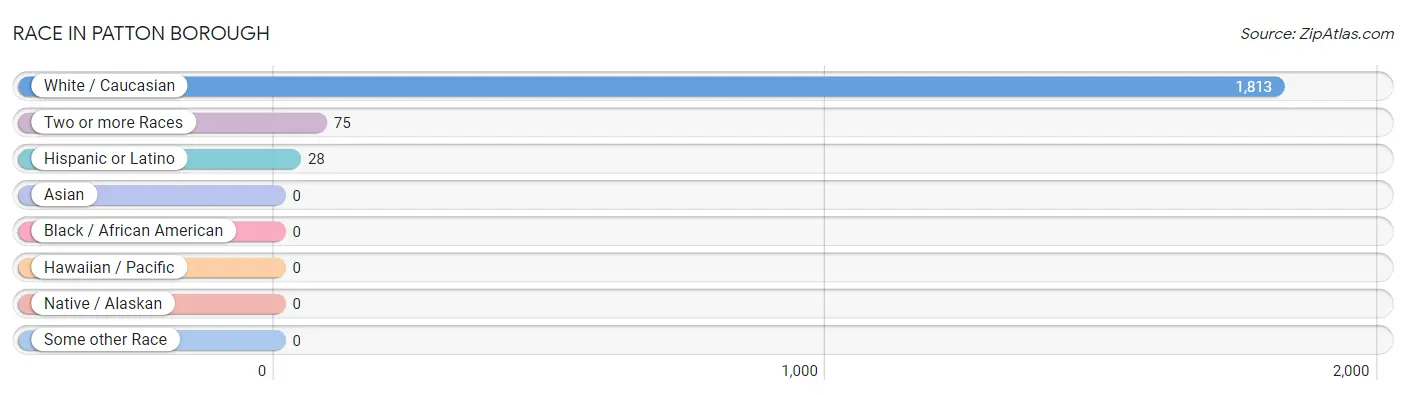
| Race | # Population | % Population |
| Asian | 0 | 0.0% |
| Black / African American | 0 | 0.0% |
| Hawaiian / Pacific | 0 | 0.0% |
| Hispanic or Latino | 28 | 1.5% |
| Native / Alaskan | 0 | 0.0% |
| White / Caucasian | 1,813 | 96.0% |
| Two or more Races | 75 | 4.0% |
| Some other Race | 0 | 0.0% |
| Total | 1,888 | 100.0% |
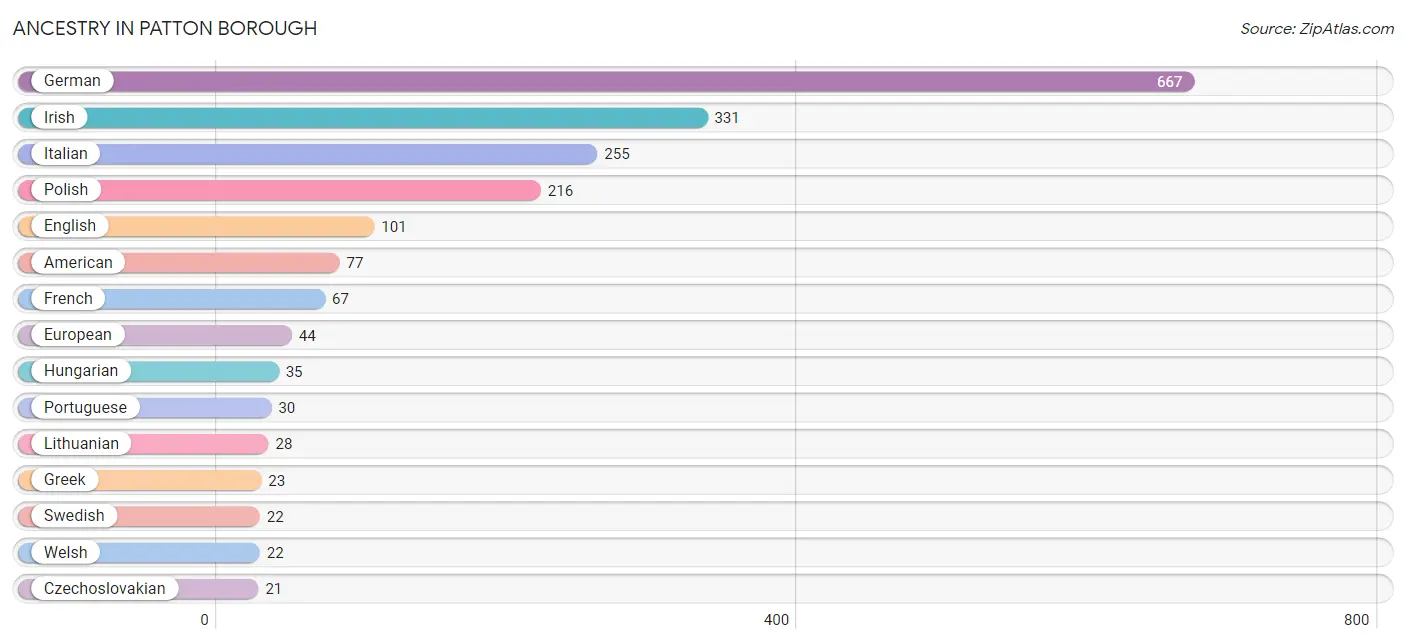
Ancestry in Patton borough
The most populous ancestries reported in Patton borough are German (667 | 35.3%), Irish (331 | 17.5%), Italian (255 | 13.5%), Polish (216 | 11.4%), and English (101 | 5.3%), together accounting for 83.2% of all Patton borough residents.
| Ancestry | # Population | % Population |
| American | 77 | 4.1% |
| Austrian | 10 | 0.5% |
| Belgian | 5 | 0.3% |
| Burmese | 10 | 0.5% |
| Chippewa | 2 | 0.1% |
| Croatian | 12 | 0.6% |
| Cuban | 3 | 0.2% |
| Czech | 4 | 0.2% |
| Czechoslovakian | 21 | 1.1% |
| Dutch | 13 | 0.7% |
| English | 101 | 5.3% |
| European | 44 | 2.3% |
| French | 67 | 3.5% |
| French Canadian | 7 | 0.4% |
| German | 667 | 35.3% |
| Greek | 23 | 1.2% |
| Hungarian | 35 | 1.8% |
| Irish | 331 | 17.5% |
| Italian | 255 | 13.5% |
| Lithuanian | 28 | 1.5% |
| Mexican | 21 | 1.1% |
| Native Hawaiian | 4 | 0.2% |
| Norwegian | 2 | 0.1% |
| Polish | 216 | 11.4% |
| Portuguese | 30 | 1.6% |
| Russian | 3 | 0.2% |
| Scottish | 6 | 0.3% |
| Slavic | 5 | 0.3% |
| Slovak | 19 | 1.0% |
| Spanish | 4 | 0.2% |
| Swedish | 22 | 1.2% |
| Swiss | 10 | 0.5% |
| Welsh | 22 | 1.2% | View All 33 Rows |
Immigrants in Patton borough
The most numerous immigrant groups reported in Patton borough came from , and Canada (3 | 0.2%), together accounting for 0.2% of all Patton borough residents.

| Immigration Origin | # Population | % Population |
| Canada | 3 | 0.2% | View All 1 Rows |
Sex and Age in Patton borough
Sex and Age in Patton borough
The most populous age groups in Patton borough are 25 to 29 Years (125 | 13.6%) for men and 60 to 64 Years (87 | 9.0%) for women.
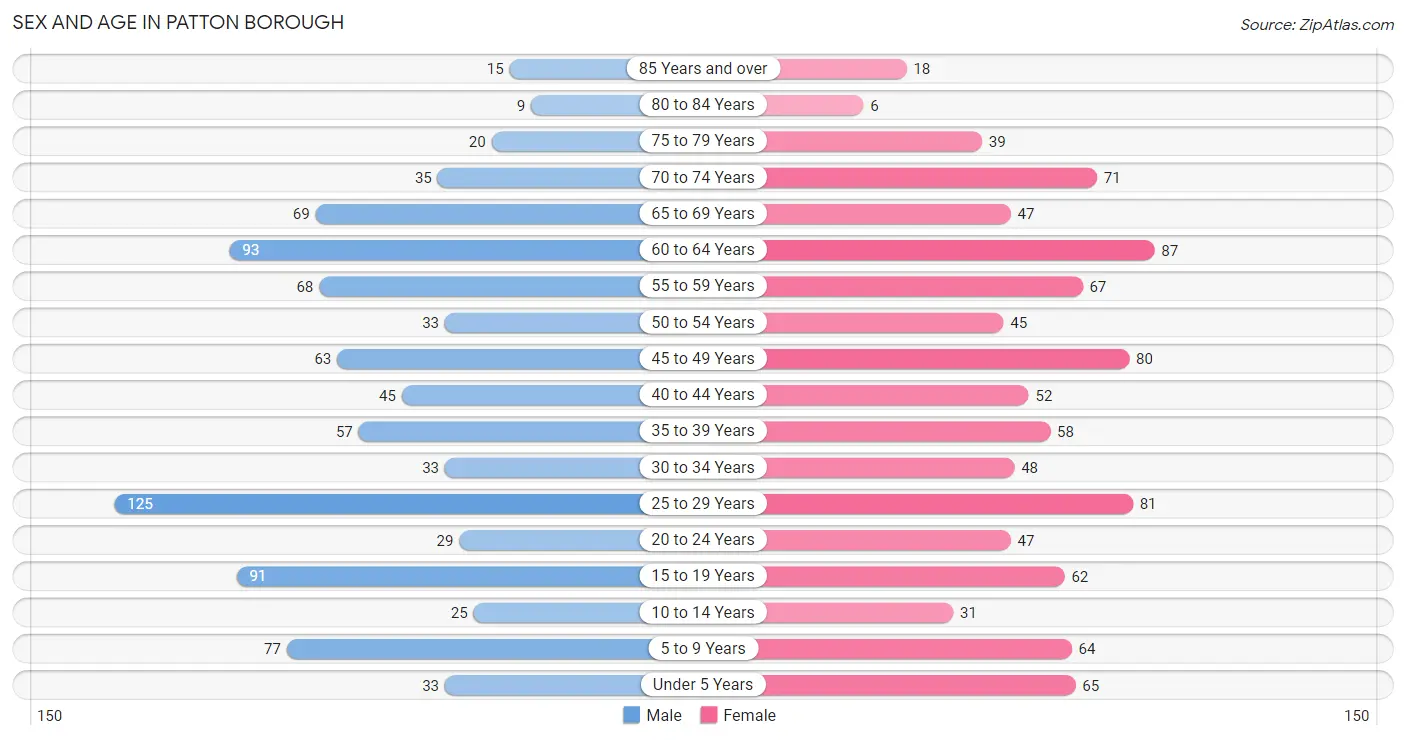
| Age Bracket | Male | Female |
| Under 5 Years | 33 (3.6%) | 65 (6.7%) |
| 5 to 9 Years | 77 (8.4%) | 64 (6.6%) |
| 10 to 14 Years | 25 (2.7%) | 31 (3.2%) |
| 15 to 19 Years | 91 (9.9%) | 62 (6.4%) |
| 20 to 24 Years | 29 (3.2%) | 47 (4.9%) |
| 25 to 29 Years | 125 (13.6%) | 81 (8.4%) |
| 30 to 34 Years | 33 (3.6%) | 48 (5.0%) |
| 35 to 39 Years | 57 (6.2%) | 58 (6.0%) |
| 40 to 44 Years | 45 (4.9%) | 52 (5.4%) |
| 45 to 49 Years | 63 (6.9%) | 80 (8.3%) |
| 50 to 54 Years | 33 (3.6%) | 45 (4.6%) |
| 55 to 59 Years | 68 (7.4%) | 67 (6.9%) |
| 60 to 64 Years | 93 (10.1%) | 87 (9.0%) |
| 65 to 69 Years | 69 (7.5%) | 47 (4.9%) |
| 70 to 74 Years | 35 (3.8%) | 71 (7.3%) |
| 75 to 79 Years | 20 (2.2%) | 39 (4.0%) |
| 80 to 84 Years | 9 (1.0%) | 6 (0.6%) |
| 85 Years and over | 15 (1.6%) | 18 (1.9%) |
| Total | 920 (100.0%) | 968 (100.0%) |
Families and Households in Patton borough
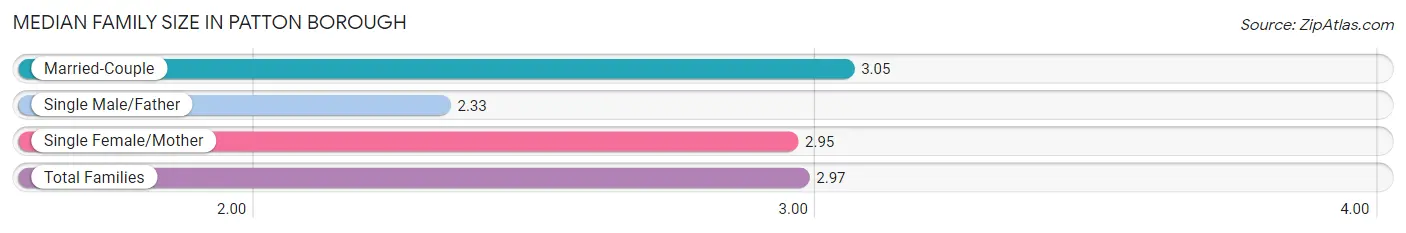
Median Family Size in Patton borough
The median family size in Patton borough is 2.97 persons per family, with married-couple families (326 | 67.4%) accounting for the largest median family size of 3.05 persons per family. On the other hand, single male/father families (33 | 6.8%) represent the smallest median family size with 2.33 persons per family.
| Family Type | # Families | Family Size |
| Married-Couple | 326 (67.4%) | 3.05 |
| Single Male/Father | 33 (6.8%) | 2.33 |
| Single Female/Mother | 125 (25.8%) | 2.95 |
| Total Families | 484 (100.0%) | 2.97 |
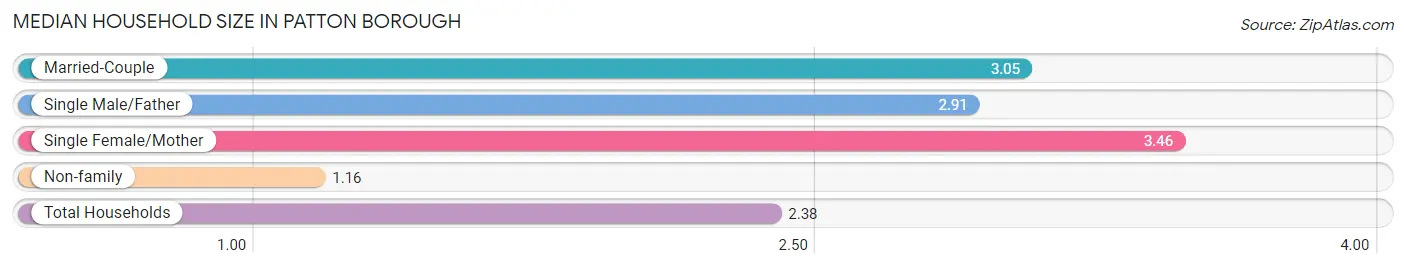
Median Household Size in Patton borough
The median household size in Patton borough is 2.38 persons per household, with single female/mother households (125 | 15.9%) accounting for the largest median household size of 3.46 persons per household. non-family households (302 | 38.4%) represent the smallest median household size with 1.16 persons per household.
| Household Type | # Households | Household Size |
| Married-Couple | 326 (41.5%) | 3.05 |
| Single Male/Father | 33 (4.2%) | 2.91 |
| Single Female/Mother | 125 (15.9%) | 3.46 |
| Non-family | 302 (38.4%) | 1.16 |
| Total Households | 786 (100.0%) | 2.38 |
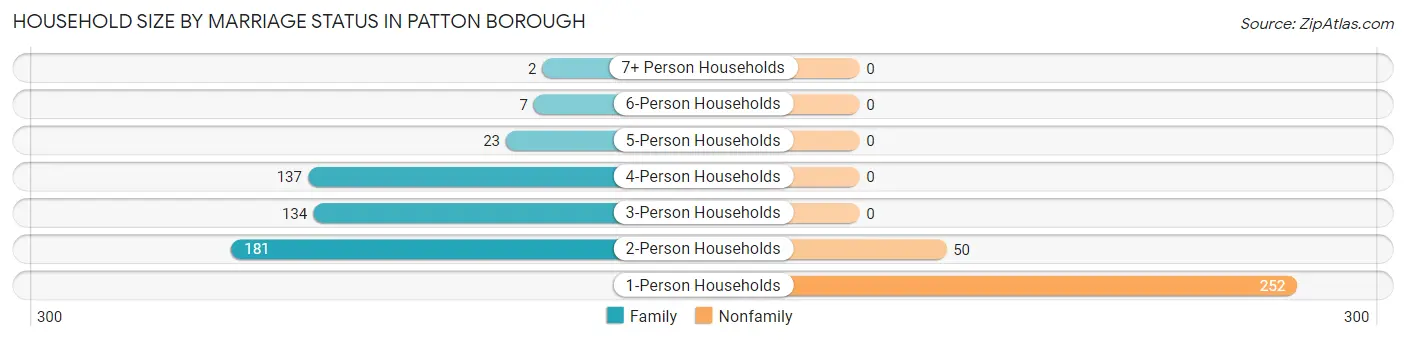
Household Size by Marriage Status in Patton borough
Out of a total of 786 households in Patton borough, 484 (61.6%) are family households, while 302 (38.4%) are nonfamily households. The most numerous type of family households are 2-person households, comprising 181, and the most common type of nonfamily households are 1-person households, comprising 252.
| Household Size | Family Households | Nonfamily Households |
| 1-Person Households | - | 252 (32.1%) |
| 2-Person Households | 181 (23.0%) | 50 (6.4%) |
| 3-Person Households | 134 (17.1%) | 0 (0.0%) |
| 4-Person Households | 137 (17.4%) | 0 (0.0%) |
| 5-Person Households | 23 (2.9%) | 0 (0.0%) |
| 6-Person Households | 7 (0.9%) | 0 (0.0%) |
| 7+ Person Households | 2 (0.3%) | 0 (0.0%) |
| Total | 484 (61.6%) | 302 (38.4%) |
Female Fertility in Patton borough
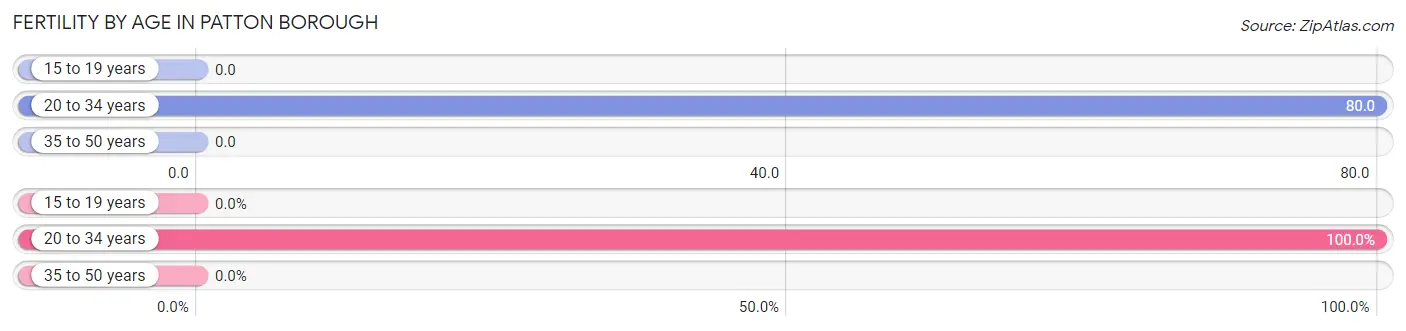
Fertility by Age in Patton borough
Average fertility rate in Patton borough is 32.0 births per 1,000 women. Women in the age bracket of 20 to 34 years have the highest fertility rate with 80.0 births per 1,000 women. Women in the age bracket of 20 to 34 years acount for 100.0% of all women with births.
| Age Bracket | Women with Births | Births / 1,000 Women |
| 15 to 19 years | 0 (0.0%) | 0.0 |
| 20 to 34 years | 14 (100.0%) | 80.0 |
| 35 to 50 years | 0 (0.0%) | 0.0 |
| Total | 14 (100.0%) | 32.0 |
Fertility by Age by Marriage Status in Patton borough
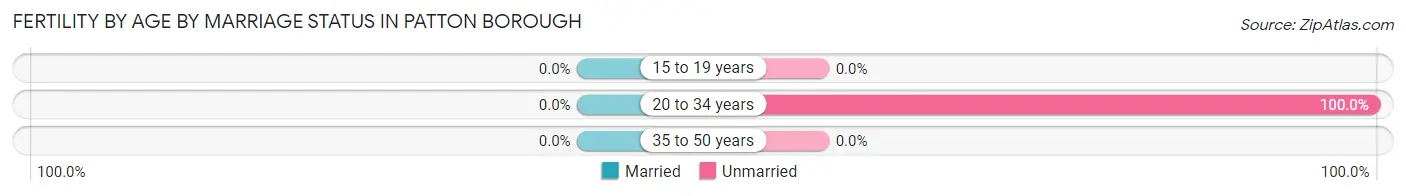
| Age Bracket | Married | Unmarried |
| 15 to 19 years | 0 (0.0%) | 0 (0.0%) |
| 20 to 34 years | 0 (0.0%) | 14 (100.0%) |
| 35 to 50 years | 0 (0.0%) | 0 (0.0%) |
| Total | 0 (0.0%) | 14 (100.0%) |
Fertility by Education in Patton borough
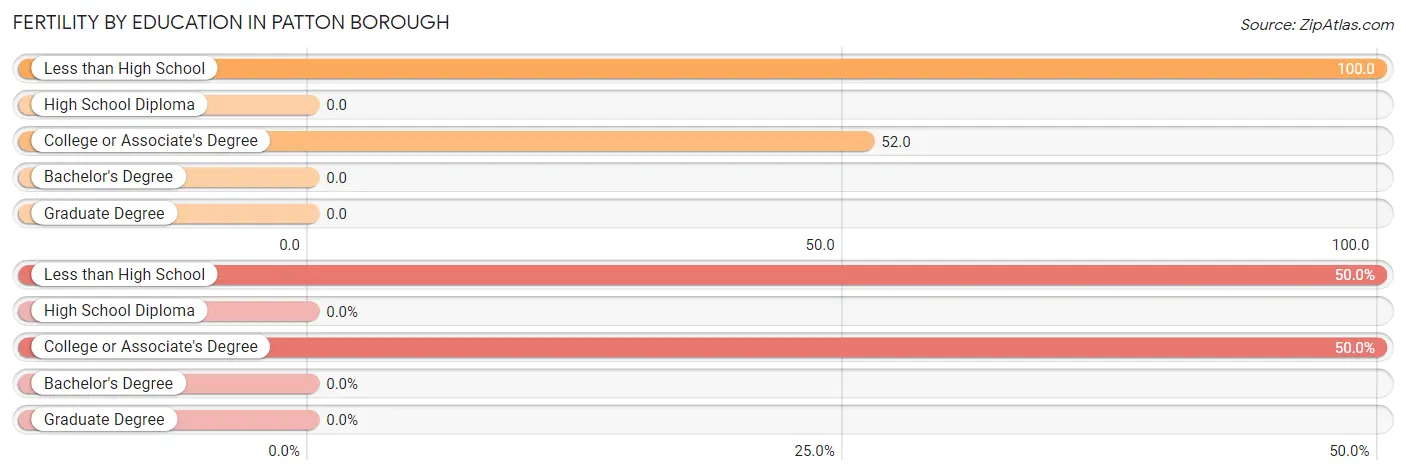
| Educational Attainment | Women with Births | Births / 1,000 Women |
| Less than High School | 7 (50.0%) | 100.0 |
| High School Diploma | 0 (0.0%) | 0.0 |
| College or Associate's Degree | 7 (50.0%) | 52.0 |
| Bachelor's Degree | 0 (0.0%) | 0.0 |
| Graduate Degree | 0 (0.0%) | 0.0 |
| Total | 14 (100.0%) | 32.0 |
Fertility by Education by Marriage Status in Patton borough
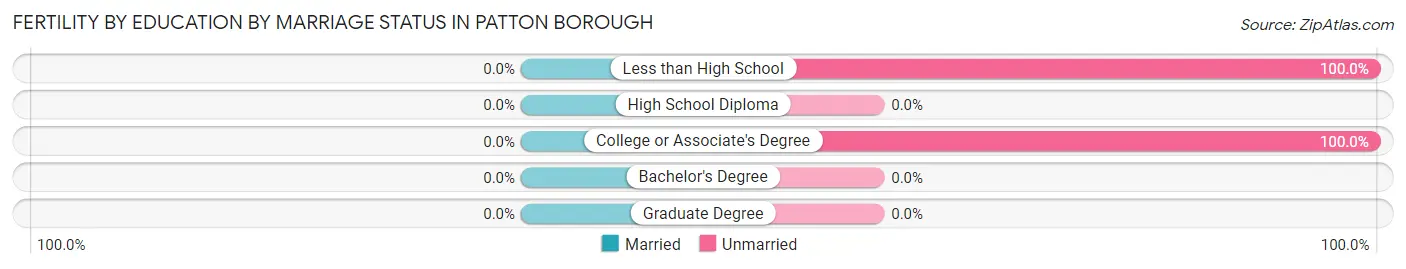
| Educational Attainment | Married | Unmarried |
| Less than High School | 0 (0.0%) | 7 (100.0%) |
| High School Diploma | 0 (0.0%) | 0 (0.0%) |
| College or Associate's Degree | 0 (0.0%) | 7 (100.0%) |
| Bachelor's Degree | 0 (0.0%) | 0 (0.0%) |
| Graduate Degree | 0 (0.0%) | 0 (0.0%) |
| Total | 0 (0.0%) | 14 (100.0%) |
Employment Characteristics in Patton borough
Employment by Class of Employer in Patton borough
Among the 767 employed individuals in Patton borough, private company employees (562 | 73.3%), not-for-profit organizations (89 | 11.6%), and local government employees (40 | 5.2%) make up the most common classes of employment.
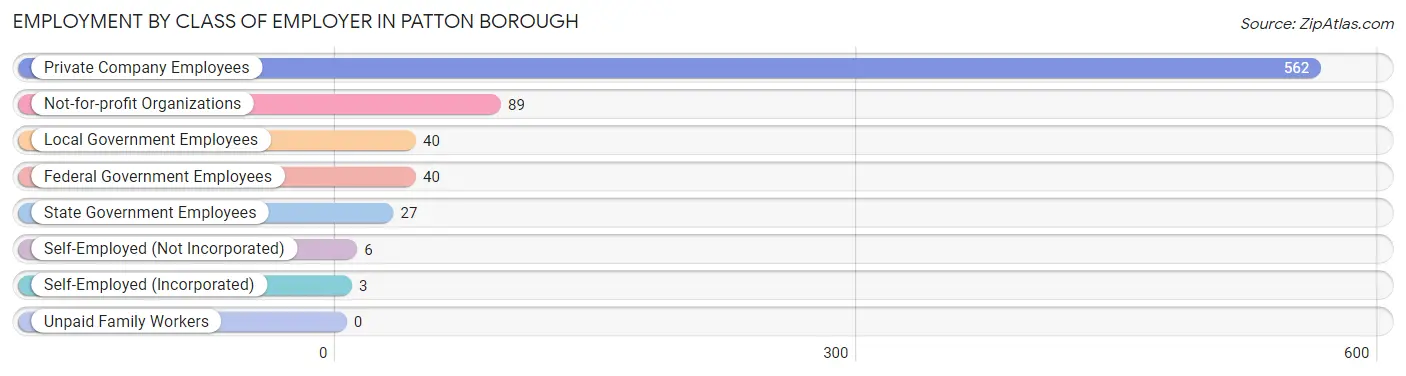
| Employer Class | # Employees | % Employees |
| Private Company Employees | 562 | 73.3% |
| Self-Employed (Incorporated) | 3 | 0.4% |
| Self-Employed (Not Incorporated) | 6 | 0.8% |
| Not-for-profit Organizations | 89 | 11.6% |
| Local Government Employees | 40 | 5.2% |
| State Government Employees | 27 | 3.5% |
| Federal Government Employees | 40 | 5.2% |
| Unpaid Family Workers | 0 | 0.0% |
| Total | 767 | 100.0% |
Employment Status by Age in Patton borough
According to the labor force statistics for Patton borough, out of the total population over 16 years of age (1,567), 53.2% or 834 individuals are in the labor force, with 4.0% or 33 of them unemployed. The age group with the highest labor force participation rate is 30 to 34 years, with 93.8% or 76 individuals in the labor force. Within the labor force, the 20 to 24 years age range has the highest percentage of unemployed individuals, with 15.9% or 11 of them being unemployed.
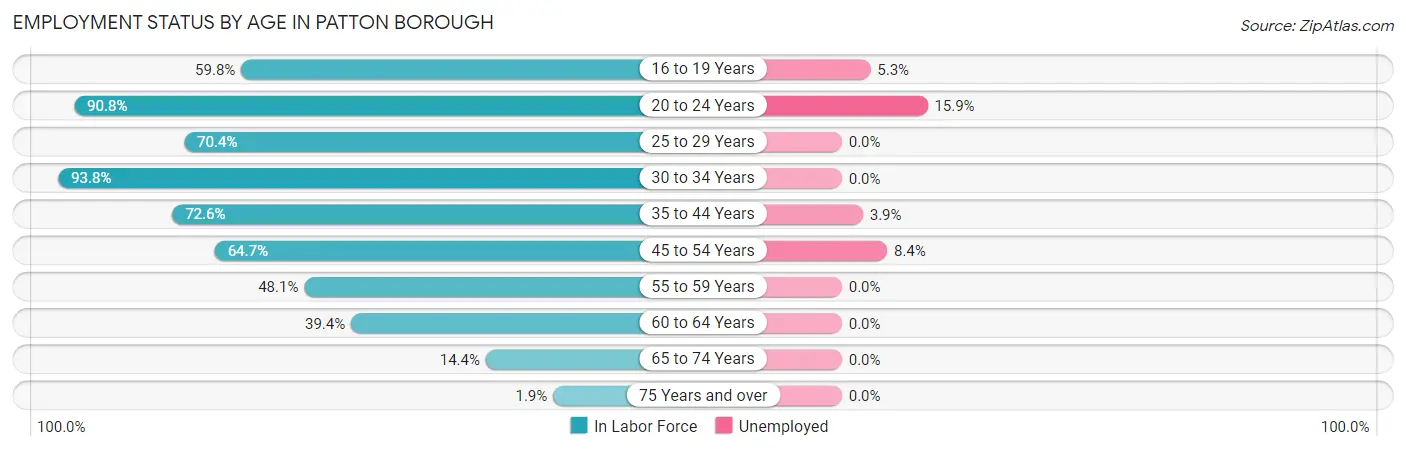
| Age Bracket | In Labor Force | Unemployed |
| 16 to 19 Years | 76 (59.8%) | 4 (5.3%) |
| 20 to 24 Years | 69 (90.8%) | 11 (15.9%) |
| 25 to 29 Years | 145 (70.4%) | 0 (0.0%) |
| 30 to 34 Years | 76 (93.8%) | 0 (0.0%) |
| 35 to 44 Years | 154 (72.6%) | 6 (3.9%) |
| 45 to 54 Years | 143 (64.7%) | 12 (8.4%) |
| 55 to 59 Years | 65 (48.1%) | 0 (0.0%) |
| 60 to 64 Years | 71 (39.4%) | 0 (0.0%) |
| 65 to 74 Years | 32 (14.4%) | 0 (0.0%) |
| 75 Years and over | 2 (1.9%) | 0 (0.0%) |
| Total | 834 (53.2%) | 33 (4.0%) |
Employment Status by Educational Attainment in Patton borough
According to labor force statistics for Patton borough, 63.2% of individuals (654) out of the total population between 25 and 64 years of age (1,035) are in the labor force, with 2.8% or 18 of them being unemployed. The group with the highest labor force participation rate are those with the educational attainment of bachelor's degree or higher, with 77.7% or 94 individuals in the labor force. Within the labor force, individuals with less than high school education have the highest percentage of unemployment, with 10.7% or 3 of them being unemployed.
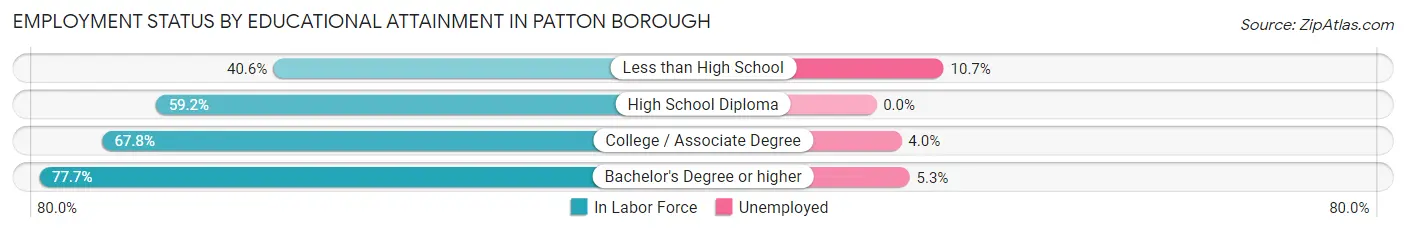
| Educational Attainment | In Labor Force | Unemployed |
| Less than High School | 28 (40.6%) | 7 (10.7%) |
| High School Diploma | 282 (59.2%) | 0 (0.0%) |
| College / Associate Degree | 250 (67.8%) | 15 (4.0%) |
| Bachelor's Degree or higher | 94 (77.7%) | 6 (5.3%) |
| Total | 654 (63.2%) | 29 (2.8%) |
Employment Occupations by Sex in Patton borough
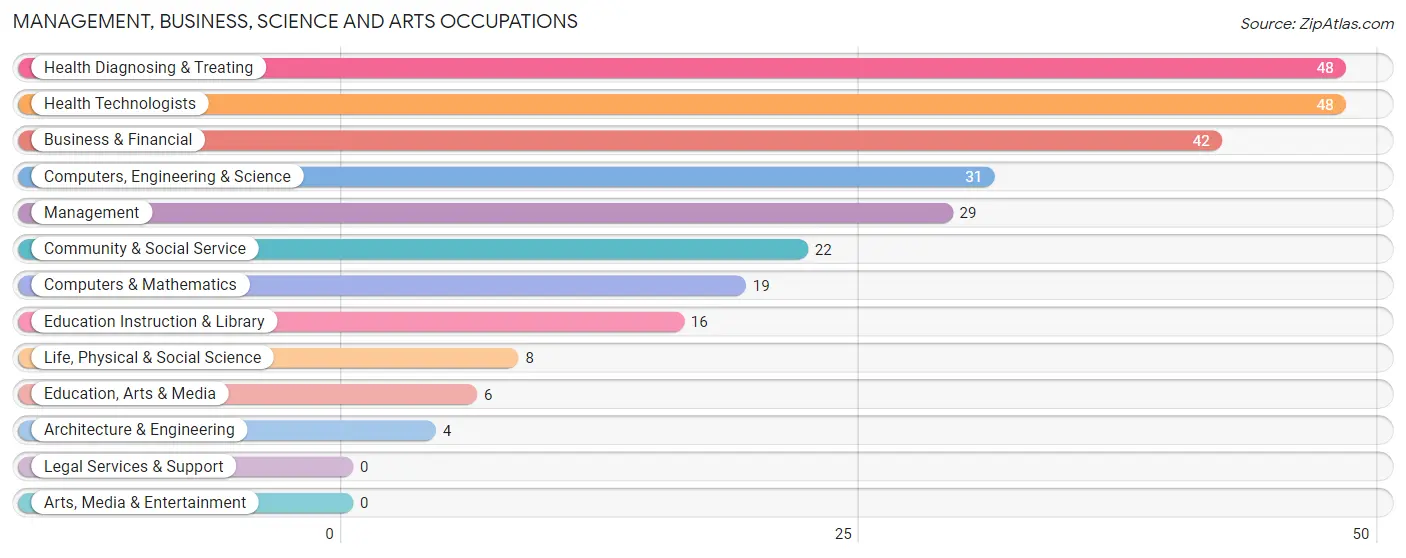
Management, Business, Science and Arts Occupations
The most common Management, Business, Science and Arts occupations in Patton borough are Health Diagnosing & Treating (48 | 6.0%), Health Technologists (48 | 6.0%), Business & Financial (42 | 5.2%), Computers, Engineering & Science (31 | 3.9%), and Management (29 | 3.6%).
Management, Business, Science and Arts Occupations by Sex
Within the Management, Business, Science and Arts occupations in Patton borough, the most male-oriented occupations are Architecture & Engineering (100.0%), Life, Physical & Social Science (100.0%), and Education, Arts & Media (100.0%), while the most female-oriented occupations are Health Diagnosing & Treating (93.8%), Health Technologists (93.8%), and Education Instruction & Library (87.5%).
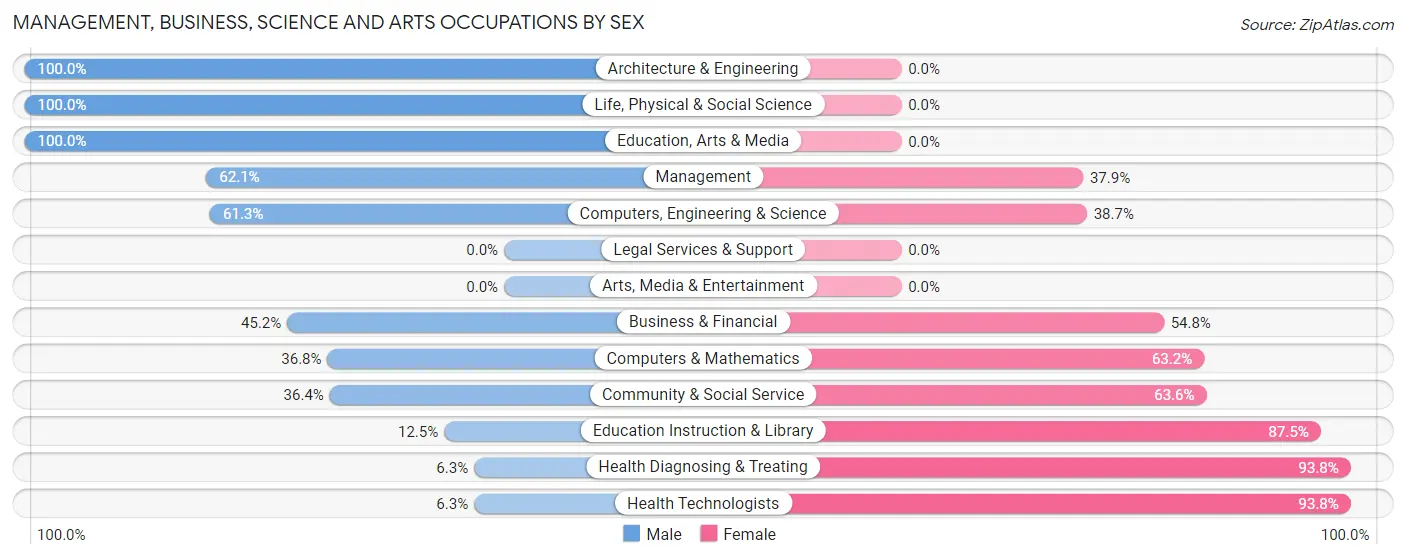
| Occupation | Male | Female |
| Management | 18 (62.1%) | 11 (37.9%) |
| Business & Financial | 19 (45.2%) | 23 (54.8%) |
| Computers, Engineering & Science | 19 (61.3%) | 12 (38.7%) |
| Computers & Mathematics | 7 (36.8%) | 12 (63.2%) |
| Architecture & Engineering | 4 (100.0%) | 0 (0.0%) |
| Life, Physical & Social Science | 8 (100.0%) | 0 (0.0%) |
| Community & Social Service | 8 (36.4%) | 14 (63.6%) |
| Education, Arts & Media | 6 (100.0%) | 0 (0.0%) |
| Legal Services & Support | 0 (0.0%) | 0 (0.0%) |
| Education Instruction & Library | 2 (12.5%) | 14 (87.5%) |
| Arts, Media & Entertainment | 0 (0.0%) | 0 (0.0%) |
| Health Diagnosing & Treating | 3 (6.2%) | 45 (93.8%) |
| Health Technologists | 3 (6.2%) | 45 (93.8%) |
| Total (Category) | 67 (39.0%) | 105 (61.1%) |
| Total (Overall) | 407 (50.9%) | 393 (49.1%) |
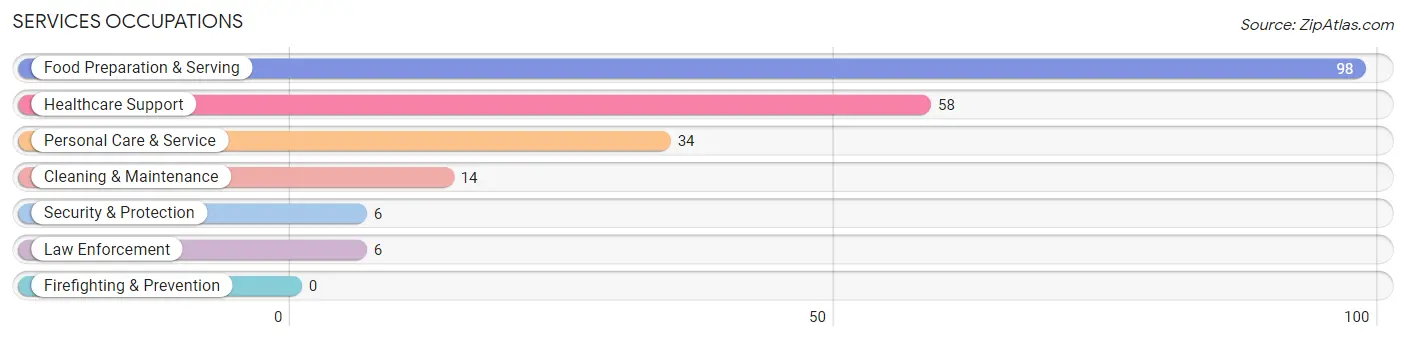
Services Occupations
The most common Services occupations in Patton borough are Food Preparation & Serving (98 | 12.2%), Healthcare Support (58 | 7.2%), Personal Care & Service (34 | 4.3%), Cleaning & Maintenance (14 | 1.8%), and Security & Protection (6 | 0.7%).
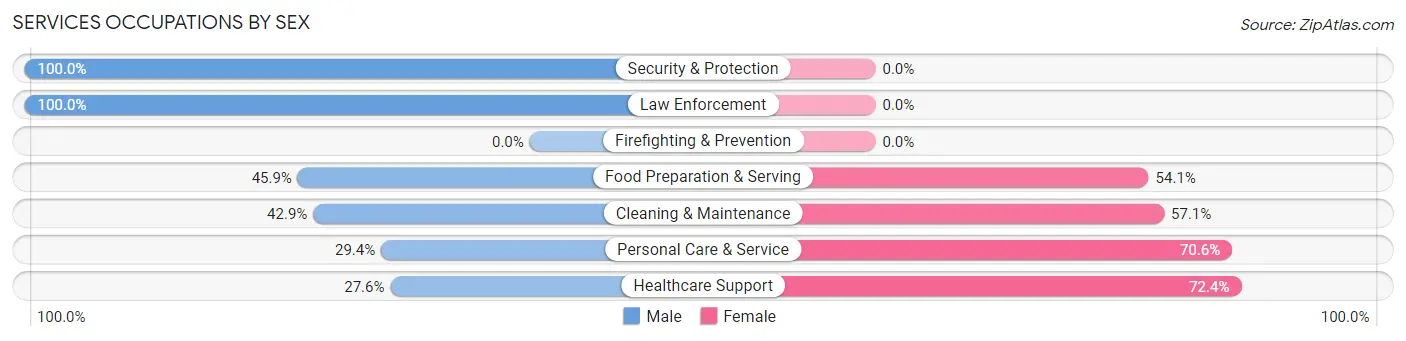
Services Occupations by Sex
Within the Services occupations in Patton borough, the most male-oriented occupations are Security & Protection (100.0%), Law Enforcement (100.0%), and Food Preparation & Serving (45.9%), while the most female-oriented occupations are Healthcare Support (72.4%), Personal Care & Service (70.6%), and Cleaning & Maintenance (57.1%).
| Occupation | Male | Female |
| Healthcare Support | 16 (27.6%) | 42 (72.4%) |
| Security & Protection | 6 (100.0%) | 0 (0.0%) |
| Firefighting & Prevention | 0 (0.0%) | 0 (0.0%) |
| Law Enforcement | 6 (100.0%) | 0 (0.0%) |
| Food Preparation & Serving | 45 (45.9%) | 53 (54.1%) |
| Cleaning & Maintenance | 6 (42.9%) | 8 (57.1%) |
| Personal Care & Service | 10 (29.4%) | 24 (70.6%) |
| Total (Category) | 83 (39.5%) | 127 (60.5%) |
| Total (Overall) | 407 (50.9%) | 393 (49.1%) |
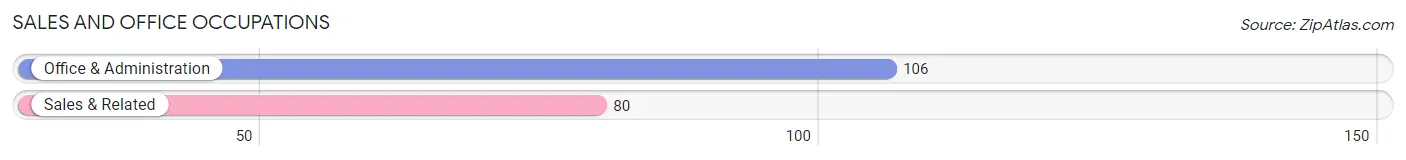
Sales and Office Occupations
The most common Sales and Office occupations in Patton borough are Office & Administration (106 | 13.3%), and Sales & Related (80 | 10.0%).
Sales and Office Occupations by Sex
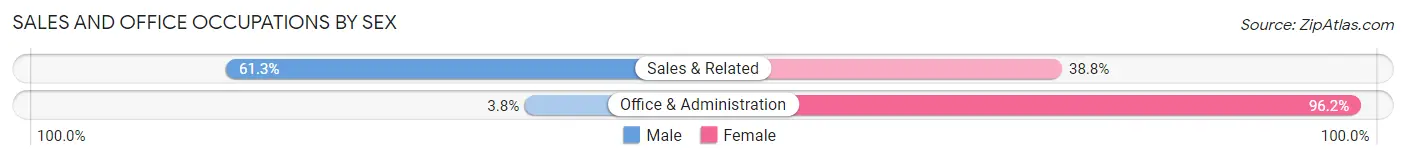
| Occupation | Male | Female |
| Sales & Related | 49 (61.3%) | 31 (38.8%) |
| Office & Administration | 4 (3.8%) | 102 (96.2%) |
| Total (Category) | 53 (28.5%) | 133 (71.5%) |
| Total (Overall) | 407 (50.9%) | 393 (49.1%) |
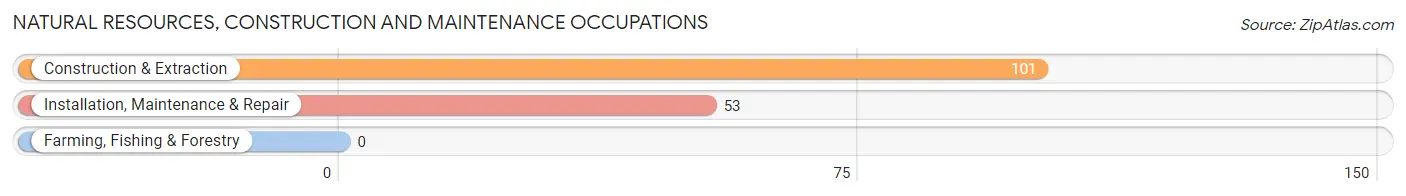
Natural Resources, Construction and Maintenance Occupations
The most common Natural Resources, Construction and Maintenance occupations in Patton borough are Construction & Extraction (101 | 12.6%), and Installation, Maintenance & Repair (53 | 6.6%).
Natural Resources, Construction and Maintenance Occupations by Sex
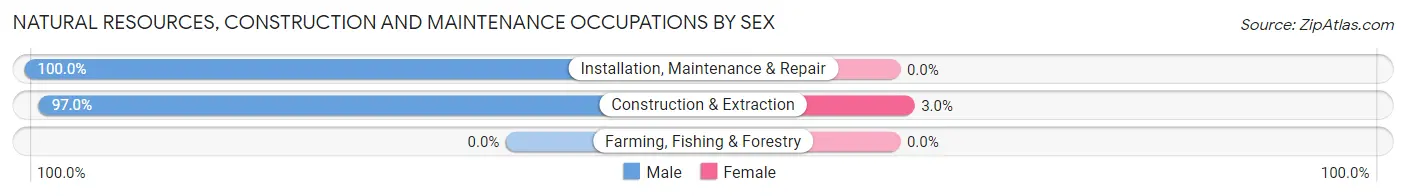
| Occupation | Male | Female |
| Farming, Fishing & Forestry | 0 (0.0%) | 0 (0.0%) |
| Construction & Extraction | 98 (97.0%) | 3 (3.0%) |
| Installation, Maintenance & Repair | 53 (100.0%) | 0 (0.0%) |
| Total (Category) | 151 (98.1%) | 3 (1.9%) |
| Total (Overall) | 407 (50.9%) | 393 (49.1%) |
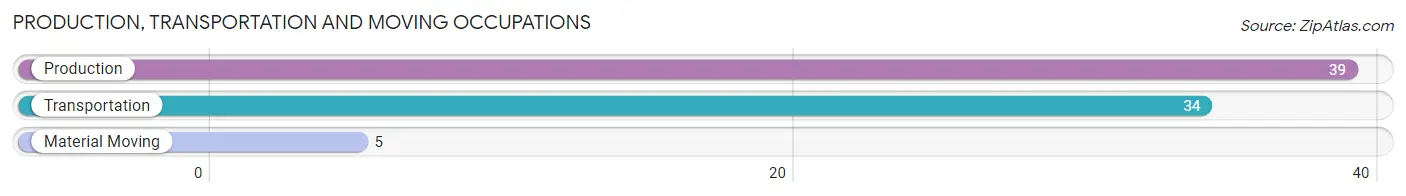
Production, Transportation and Moving Occupations
The most common Production, Transportation and Moving occupations in Patton borough are Production (39 | 4.9%), Transportation (34 | 4.3%), and Material Moving (5 | 0.6%).
Production, Transportation and Moving Occupations by Sex
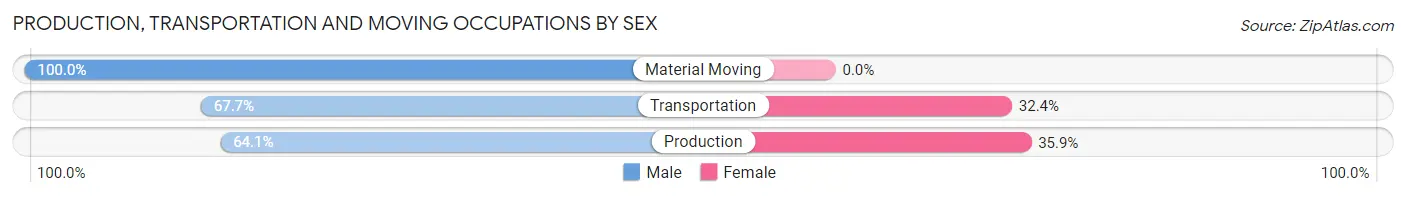
| Occupation | Male | Female |
| Production | 25 (64.1%) | 14 (35.9%) |
| Transportation | 23 (67.6%) | 11 (32.4%) |
| Material Moving | 5 (100.0%) | 0 (0.0%) |
| Total (Category) | 53 (67.9%) | 25 (32.1%) |
| Total (Overall) | 407 (50.9%) | 393 (49.1%) |
Employment Industries by Sex in Patton borough
Employment Industries in Patton borough
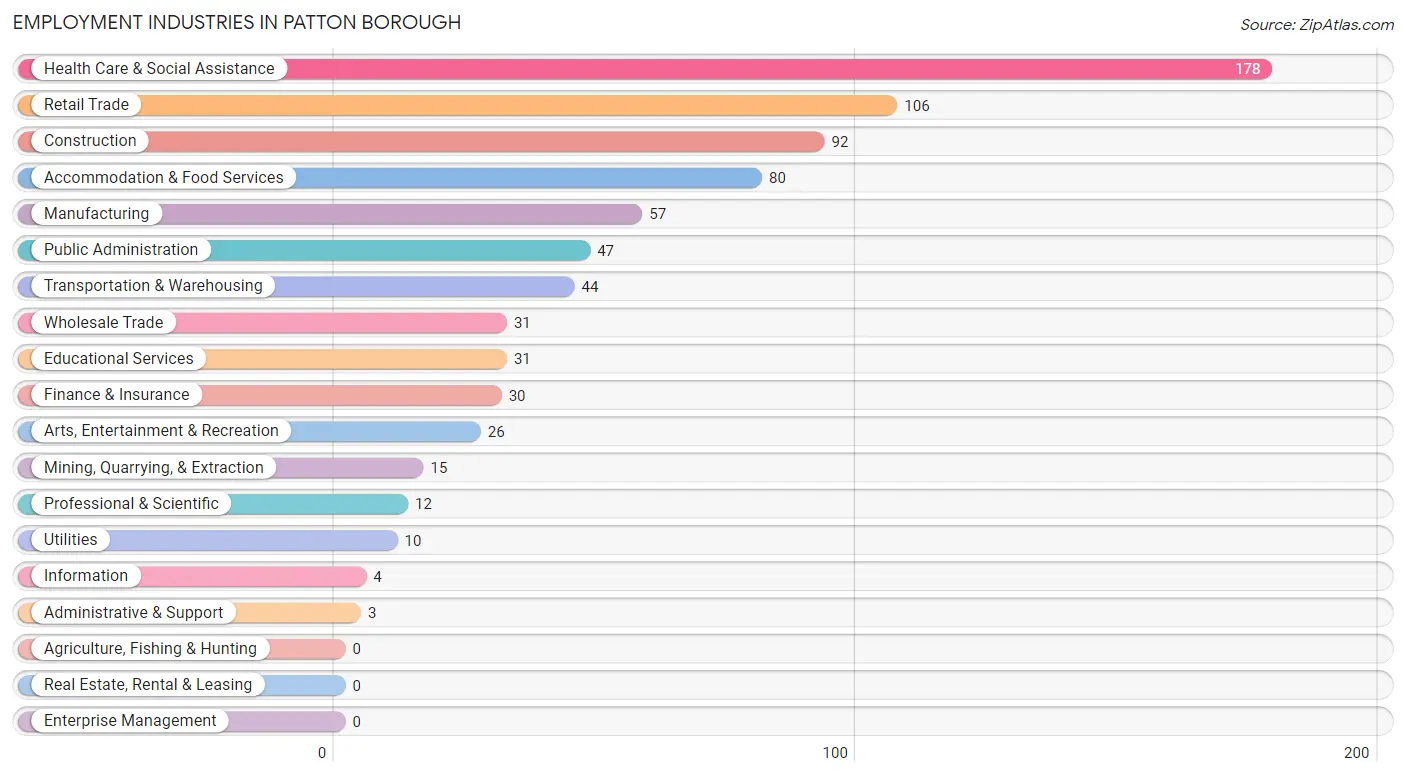
The major employment industries in Patton borough include Health Care & Social Assistance (178 | 22.3%), Retail Trade (106 | 13.3%), Construction (92 | 11.5%), Accommodation & Food Services (80 | 10.0%), and Manufacturing (57 | 7.1%).
Employment Industries by Sex in Patton borough
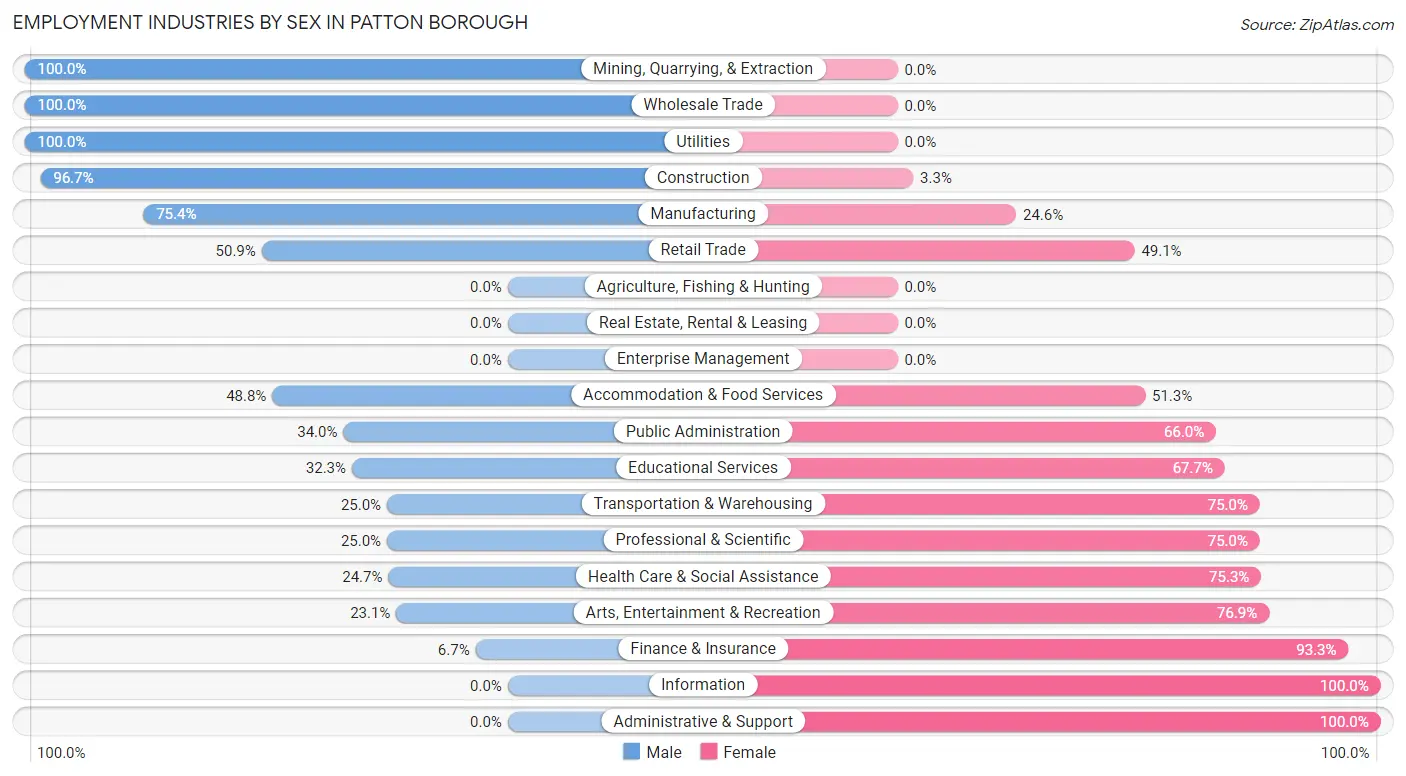
The Patton borough industries that see more men than women are Mining, Quarrying, & Extraction (100.0%), Wholesale Trade (100.0%), and Utilities (100.0%), whereas the industries that tend to have a higher number of women are Information (100.0%), Administrative & Support (100.0%), and Finance & Insurance (93.3%).
| Industry | Male | Female |
| Agriculture, Fishing & Hunting | 0 (0.0%) | 0 (0.0%) |
| Mining, Quarrying, & Extraction | 15 (100.0%) | 0 (0.0%) |
| Construction | 89 (96.7%) | 3 (3.3%) |
| Manufacturing | 43 (75.4%) | 14 (24.6%) |
| Wholesale Trade | 31 (100.0%) | 0 (0.0%) |
| Retail Trade | 54 (50.9%) | 52 (49.1%) |
| Transportation & Warehousing | 11 (25.0%) | 33 (75.0%) |
| Utilities | 10 (100.0%) | 0 (0.0%) |
| Information | 0 (0.0%) | 4 (100.0%) |
| Finance & Insurance | 2 (6.7%) | 28 (93.3%) |
| Real Estate, Rental & Leasing | 0 (0.0%) | 0 (0.0%) |
| Professional & Scientific | 3 (25.0%) | 9 (75.0%) |
| Enterprise Management | 0 (0.0%) | 0 (0.0%) |
| Administrative & Support | 0 (0.0%) | 3 (100.0%) |
| Educational Services | 10 (32.3%) | 21 (67.7%) |
| Health Care & Social Assistance | 44 (24.7%) | 134 (75.3%) |
| Arts, Entertainment & Recreation | 6 (23.1%) | 20 (76.9%) |
| Accommodation & Food Services | 39 (48.7%) | 41 (51.2%) |
| Public Administration | 16 (34.0%) | 31 (66.0%) |
| Total | 407 (50.9%) | 393 (49.1%) |
Education in Patton borough
School Enrollment in Patton borough
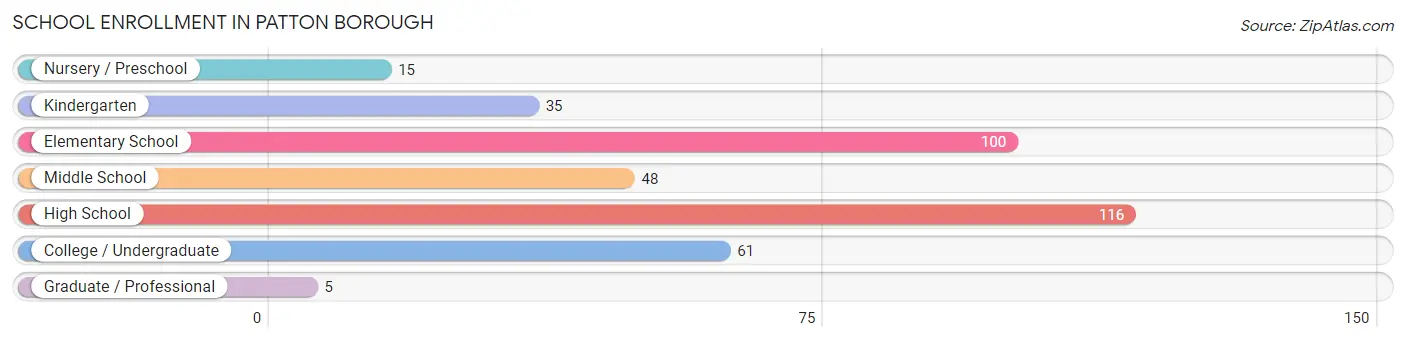
The most common levels of schooling among the 380 students in Patton borough are high school (116 | 30.5%), elementary school (100 | 26.3%), and college / undergraduate (61 | 16.1%).
| School Level | # Students | % Students |
| Nursery / Preschool | 15 | 4.0% |
| Kindergarten | 35 | 9.2% |
| Elementary School | 100 | 26.3% |
| Middle School | 48 | 12.6% |
| High School | 116 | 30.5% |
| College / Undergraduate | 61 | 16.1% |
| Graduate / Professional | 5 | 1.3% |
| Total | 380 | 100.0% |
School Enrollment by Age by Funding Source in Patton borough
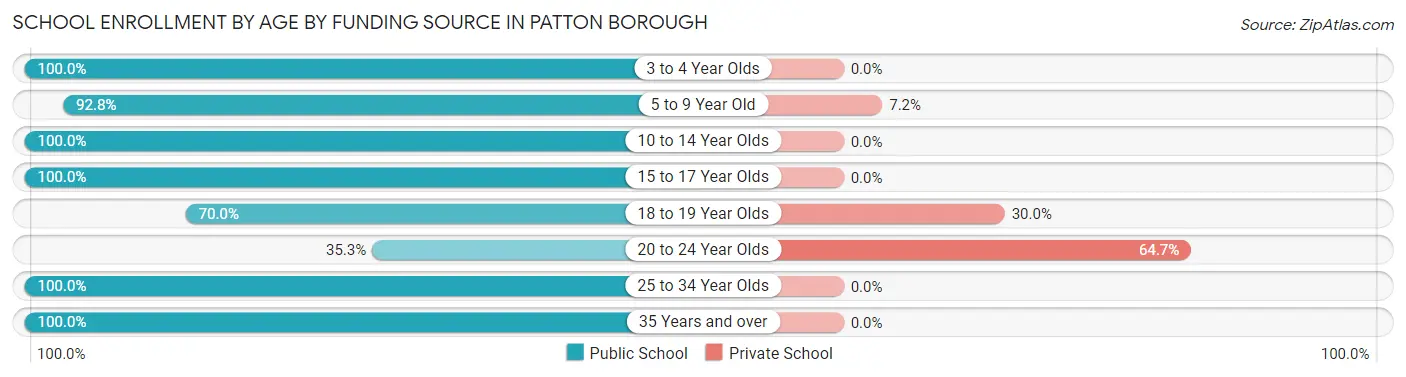
Out of a total of 380 students who are enrolled in schools in Patton borough, 24 (6.3%) attend a private institution, while the remaining 356 (93.7%) are enrolled in public schools. The age group of 20 to 24 year olds has the highest likelihood of being enrolled in private schools, with 11 (64.7% in the age bracket) enrolled. Conversely, the age group of 3 to 4 year olds has the lowest likelihood of being enrolled in a private school, with 11 (100.0% in the age bracket) attending a public institution.
| Age Bracket | Public School | Private School |
| 3 to 4 Year Olds | 11 (100.0%) | 0 (0.0%) |
| 5 to 9 Year Old | 129 (92.8%) | 10 (7.2%) |
| 10 to 14 Year Olds | 50 (100.0%) | 0 (0.0%) |
| 15 to 17 Year Olds | 110 (100.0%) | 0 (0.0%) |
| 18 to 19 Year Olds | 7 (70.0%) | 3 (30.0%) |
| 20 to 24 Year Olds | 6 (35.3%) | 11 (64.7%) |
| 25 to 34 Year Olds | 27 (100.0%) | 0 (0.0%) |
| 35 Years and over | 16 (100.0%) | 0 (0.0%) |
| Total | 356 (93.7%) | 24 (6.3%) |
Educational Attainment by Field of Study in Patton borough
Education (34 | 20.5%), science & technology (32 | 19.3%), business (27 | 16.3%), bio, nature & agricultural (24 | 14.5%), and engineering (19 | 11.5%) are the most common fields of study among 166 individuals in Patton borough who have obtained a bachelor's degree or higher.
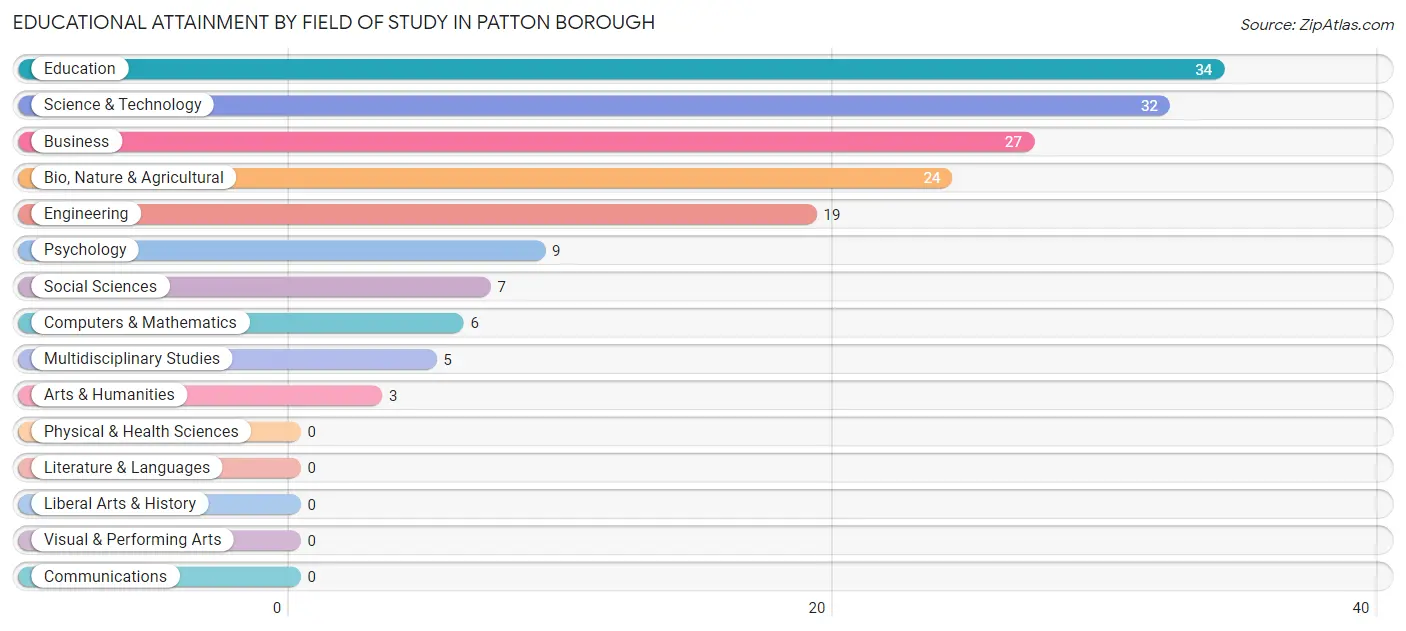
| Field of Study | # Graduates | % Graduates |
| Computers & Mathematics | 6 | 3.6% |
| Bio, Nature & Agricultural | 24 | 14.5% |
| Physical & Health Sciences | 0 | 0.0% |
| Psychology | 9 | 5.4% |
| Social Sciences | 7 | 4.2% |
| Engineering | 19 | 11.5% |
| Multidisciplinary Studies | 5 | 3.0% |
| Science & Technology | 32 | 19.3% |
| Business | 27 | 16.3% |
| Education | 34 | 20.5% |
| Literature & Languages | 0 | 0.0% |
| Liberal Arts & History | 0 | 0.0% |
| Visual & Performing Arts | 0 | 0.0% |
| Communications | 0 | 0.0% |
| Arts & Humanities | 3 | 1.8% |
| Total | 166 | 100.0% |
Transportation & Commute in Patton borough
Vehicle Availability by Sex in Patton borough
The most prevalent vehicle ownership categories in Patton borough are males with 2 vehicles (185, accounting for 46.8%) and females with 2 vehicles (199, making up 49.7%).
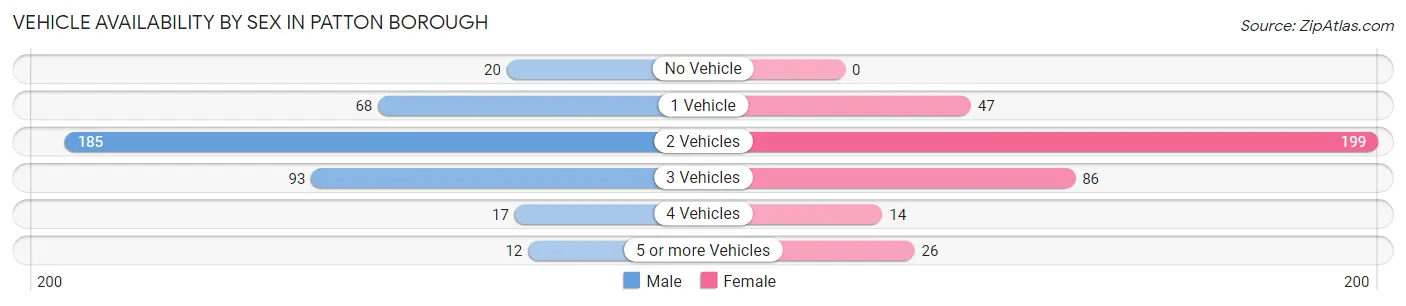
| Vehicles Available | Male | Female |
| No Vehicle | 20 (5.1%) | 0 (0.0%) |
| 1 Vehicle | 68 (17.2%) | 47 (12.6%) |
| 2 Vehicles | 185 (46.8%) | 199 (53.5%) |
| 3 Vehicles | 93 (23.5%) | 86 (23.1%) |
| 4 Vehicles | 17 (4.3%) | 14 (3.8%) |
| 5 or more Vehicles | 12 (3.0%) | 26 (7.0%) |
| Total | 395 (100.0%) | 372 (100.0%) |
Commute Time in Patton borough
The most frequently occuring commute durations in Patton borough are 5 to 9 minutes (128 commuters, 17.2%), 30 to 34 minutes (91 commuters, 12.2%), and 10 to 14 minutes (81 commuters, 10.9%).
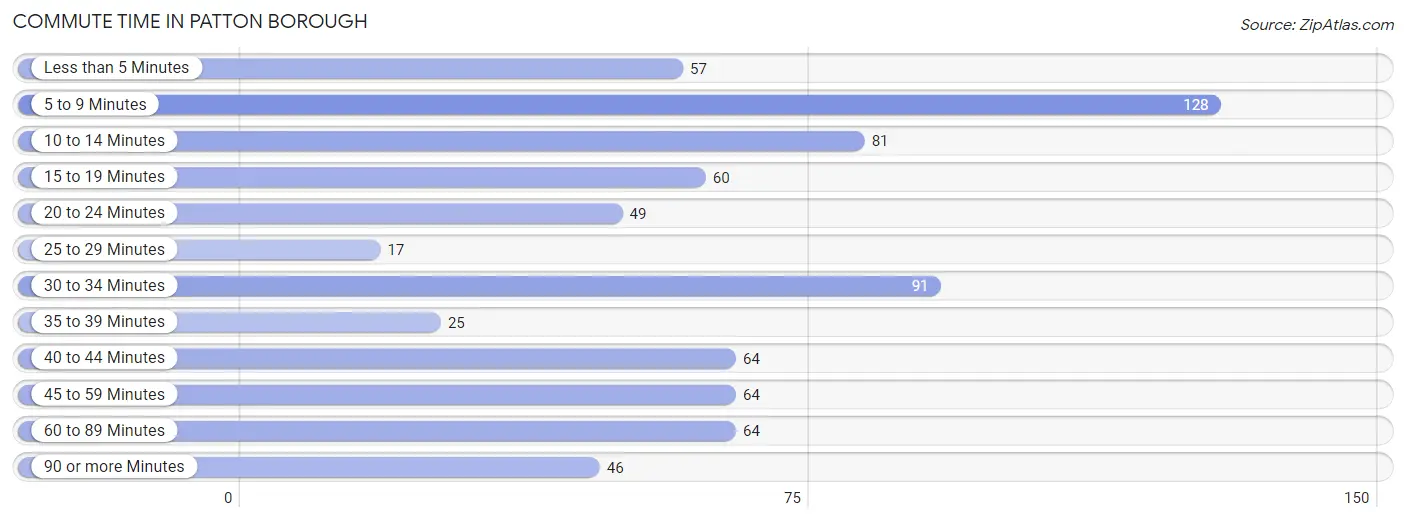
| Commute Time | # Commuters | % Commuters |
| Less than 5 Minutes | 57 | 7.6% |
| 5 to 9 Minutes | 128 | 17.2% |
| 10 to 14 Minutes | 81 | 10.9% |
| 15 to 19 Minutes | 60 | 8.0% |
| 20 to 24 Minutes | 49 | 6.6% |
| 25 to 29 Minutes | 17 | 2.3% |
| 30 to 34 Minutes | 91 | 12.2% |
| 35 to 39 Minutes | 25 | 3.4% |
| 40 to 44 Minutes | 64 | 8.6% |
| 45 to 59 Minutes | 64 | 8.6% |
| 60 to 89 Minutes | 64 | 8.6% |
| 90 or more Minutes | 46 | 6.2% |
Commute Time by Sex in Patton borough
The most common commute times in Patton borough are 20 to 24 minutes (49 commuters, 12.7%) for males and 5 to 9 minutes (80 commuters, 22.3%) for females.
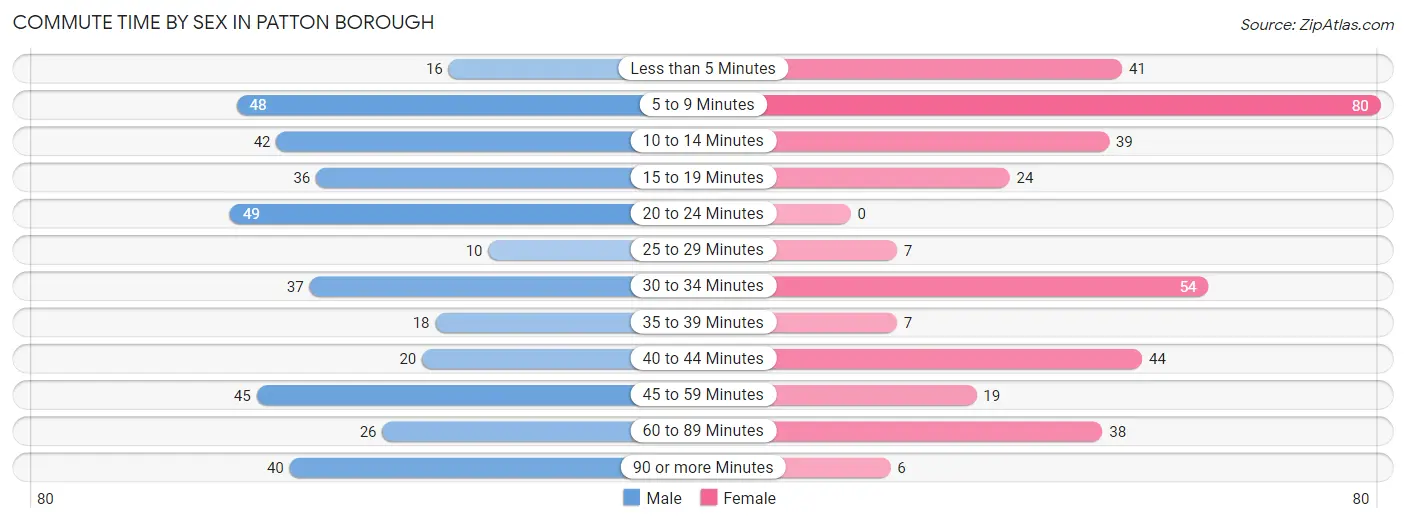
| Commute Time | Male | Female |
| Less than 5 Minutes | 16 (4.1%) | 41 (11.4%) |
| 5 to 9 Minutes | 48 (12.4%) | 80 (22.3%) |
| 10 to 14 Minutes | 42 (10.8%) | 39 (10.9%) |
| 15 to 19 Minutes | 36 (9.3%) | 24 (6.7%) |
| 20 to 24 Minutes | 49 (12.7%) | 0 (0.0%) |
| 25 to 29 Minutes | 10 (2.6%) | 7 (1.9%) |
| 30 to 34 Minutes | 37 (9.6%) | 54 (15.0%) |
| 35 to 39 Minutes | 18 (4.6%) | 7 (1.9%) |
| 40 to 44 Minutes | 20 (5.2%) | 44 (12.3%) |
| 45 to 59 Minutes | 45 (11.6%) | 19 (5.3%) |
| 60 to 89 Minutes | 26 (6.7%) | 38 (10.6%) |
| 90 or more Minutes | 40 (10.3%) | 6 (1.7%) |
Time of Departure to Work by Sex in Patton borough
The most frequent times of departure to work in Patton borough are 6:30 AM to 6:59 AM (76, 19.6%) for males and 7:00 AM to 7:29 AM (93, 25.9%) for females.
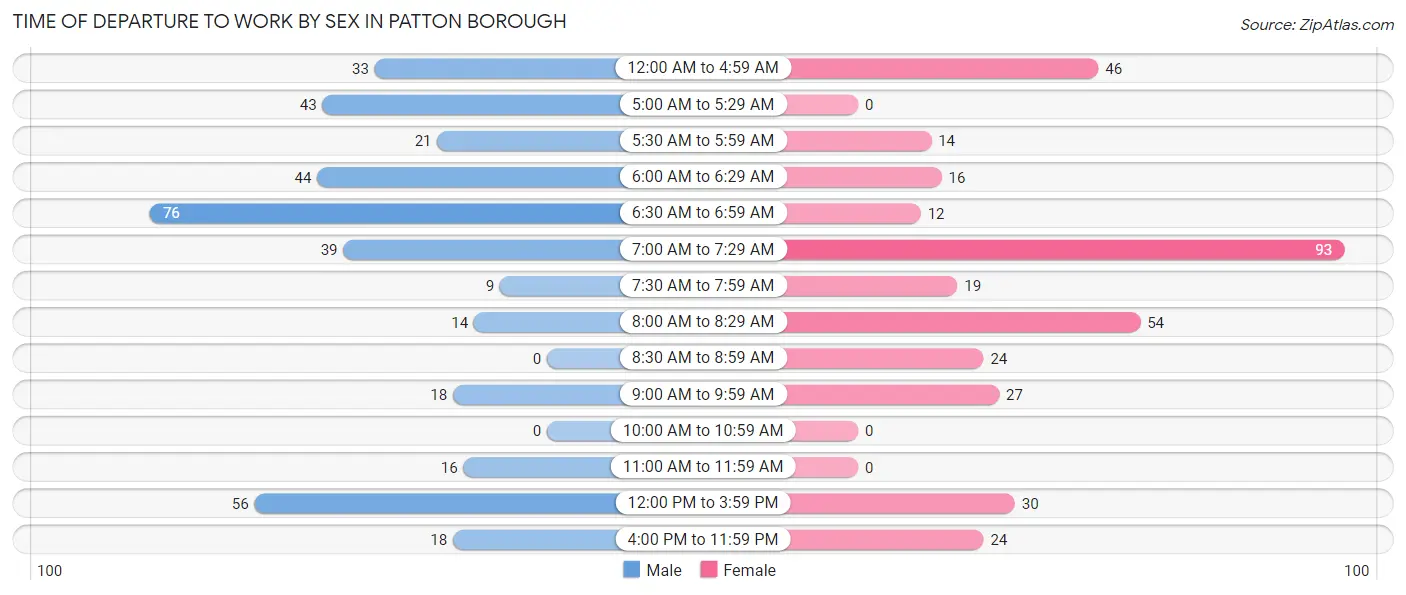
| Time of Departure | Male | Female |
| 12:00 AM to 4:59 AM | 33 (8.5%) | 46 (12.8%) |
| 5:00 AM to 5:29 AM | 43 (11.1%) | 0 (0.0%) |
| 5:30 AM to 5:59 AM | 21 (5.4%) | 14 (3.9%) |
| 6:00 AM to 6:29 AM | 44 (11.4%) | 16 (4.5%) |
| 6:30 AM to 6:59 AM | 76 (19.6%) | 12 (3.3%) |
| 7:00 AM to 7:29 AM | 39 (10.1%) | 93 (25.9%) |
| 7:30 AM to 7:59 AM | 9 (2.3%) | 19 (5.3%) |
| 8:00 AM to 8:29 AM | 14 (3.6%) | 54 (15.0%) |
| 8:30 AM to 8:59 AM | 0 (0.0%) | 24 (6.7%) |
| 9:00 AM to 9:59 AM | 18 (4.6%) | 27 (7.5%) |
| 10:00 AM to 10:59 AM | 0 (0.0%) | 0 (0.0%) |
| 11:00 AM to 11:59 AM | 16 (4.1%) | 0 (0.0%) |
| 12:00 PM to 3:59 PM | 56 (14.5%) | 30 (8.4%) |
| 4:00 PM to 11:59 PM | 18 (4.6%) | 24 (6.7%) |
| Total | 387 (100.0%) | 359 (100.0%) |
Housing Occupancy in Patton borough
Occupancy by Ownership in Patton borough
Of the total 786 dwellings in Patton borough, owner-occupied units account for 582 (74.1%), while renter-occupied units make up 204 (26.0%).
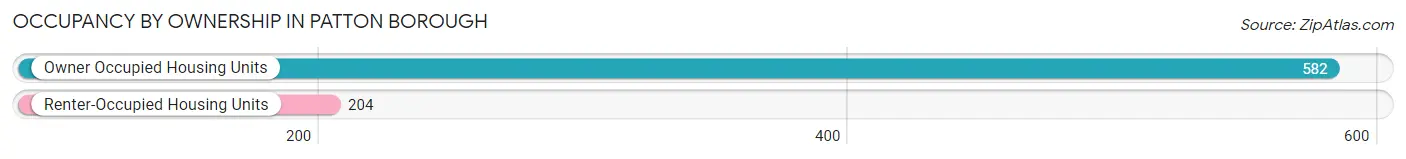
| Occupancy | # Housing Units | % Housing Units |
| Owner Occupied Housing Units | 582 | 74.1% |
| Renter-Occupied Housing Units | 204 | 26.0% |
| Total Occupied Housing Units | 786 | 100.0% |
Occupancy by Household Size in Patton borough
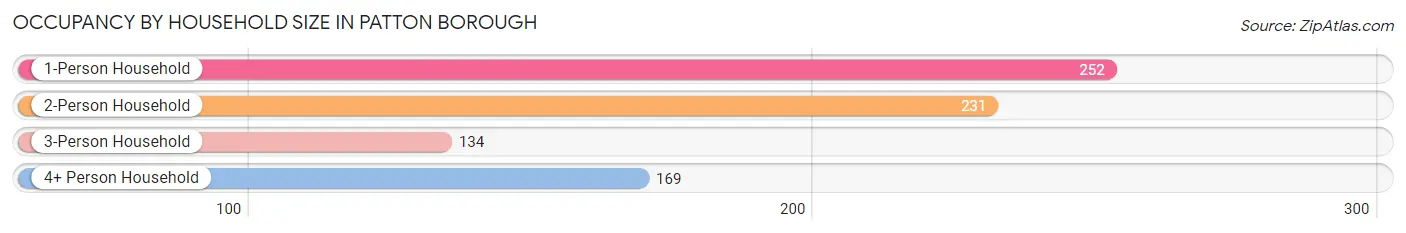
| Household Size | # Housing Units | % Housing Units |
| 1-Person Household | 252 | 32.1% |
| 2-Person Household | 231 | 29.4% |
| 3-Person Household | 134 | 17.1% |
| 4+ Person Household | 169 | 21.5% |
| Total Housing Units | 786 | 100.0% |
Occupancy by Ownership by Household Size in Patton borough
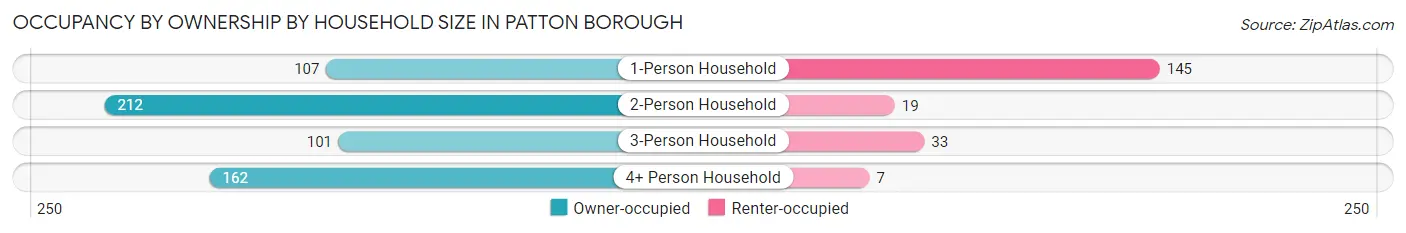
| Household Size | Owner-occupied | Renter-occupied |
| 1-Person Household | 107 (42.5%) | 145 (57.5%) |
| 2-Person Household | 212 (91.8%) | 19 (8.2%) |
| 3-Person Household | 101 (75.4%) | 33 (24.6%) |
| 4+ Person Household | 162 (95.9%) | 7 (4.1%) |
| Total Housing Units | 582 (74.1%) | 204 (26.0%) |
Occupancy by Educational Attainment in Patton borough
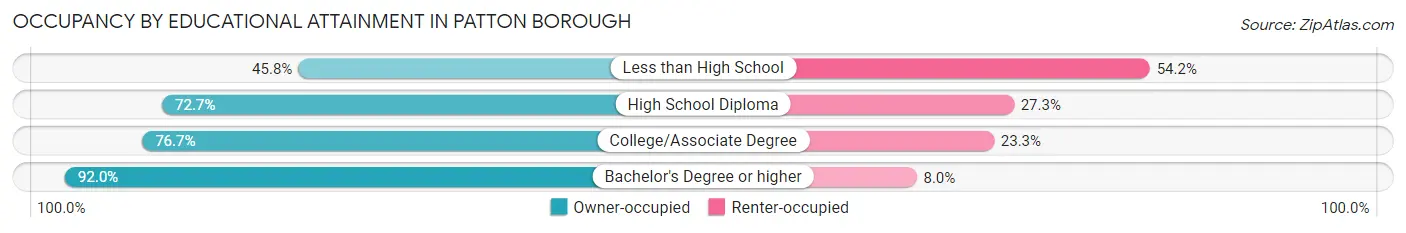
| Household Size | Owner-occupied | Renter-occupied |
| Less than High School | 27 (45.8%) | 32 (54.2%) |
| High School Diploma | 256 (72.7%) | 96 (27.3%) |
| College/Associate Degree | 230 (76.7%) | 70 (23.3%) |
| Bachelor's Degree or higher | 69 (92.0%) | 6 (8.0%) |
Occupancy by Age of Householder in Patton borough
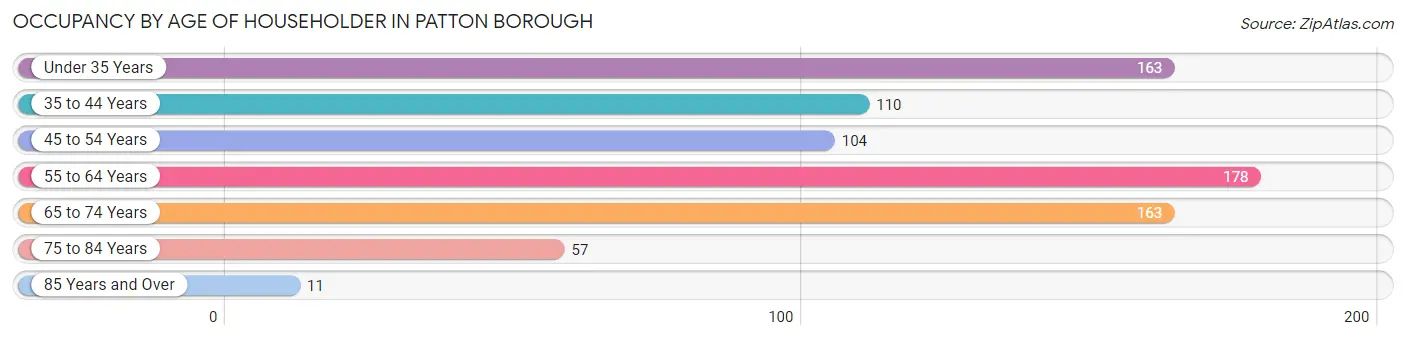
| Age Bracket | # Households | % Households |
| Under 35 Years | 163 | 20.7% |
| 35 to 44 Years | 110 | 14.0% |
| 45 to 54 Years | 104 | 13.2% |
| 55 to 64 Years | 178 | 22.7% |
| 65 to 74 Years | 163 | 20.7% |
| 75 to 84 Years | 57 | 7.2% |
| 85 Years and Over | 11 | 1.4% |
| Total | 786 | 100.0% |
Housing Finances in Patton borough
Median Income by Occupancy in Patton borough
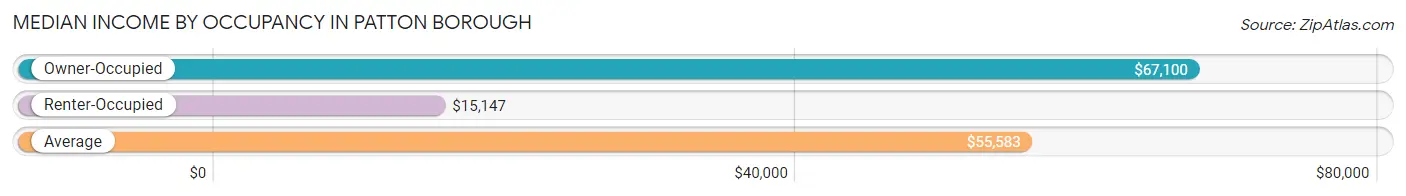
| Occupancy Type | # Households | Median Income |
| Owner-Occupied | 582 (74.1%) | $67,100 |
| Renter-Occupied | 204 (26.0%) | $15,147 |
| Average | 786 (100.0%) | $55,583 |
Occupancy by Householder Income Bracket in Patton borough
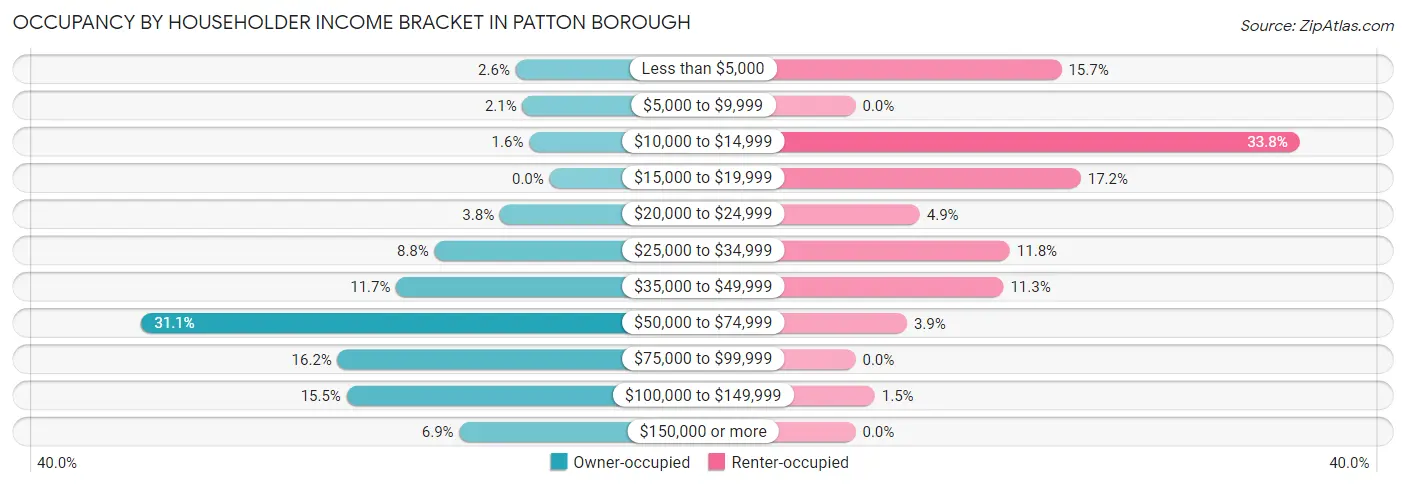
| Income Bracket | Owner-occupied | Renter-occupied |
| Less than $5,000 | 15 (2.6%) | 32 (15.7%) |
| $5,000 to $9,999 | 12 (2.1%) | 0 (0.0%) |
| $10,000 to $14,999 | 9 (1.5%) | 69 (33.8%) |
| $15,000 to $19,999 | 0 (0.0%) | 35 (17.2%) |
| $20,000 to $24,999 | 22 (3.8%) | 10 (4.9%) |
| $25,000 to $34,999 | 51 (8.8%) | 24 (11.8%) |
| $35,000 to $49,999 | 68 (11.7%) | 23 (11.3%) |
| $50,000 to $74,999 | 181 (31.1%) | 8 (3.9%) |
| $75,000 to $99,999 | 94 (16.2%) | 0 (0.0%) |
| $100,000 to $149,999 | 90 (15.5%) | 3 (1.5%) |
| $150,000 or more | 40 (6.9%) | 0 (0.0%) |
| Total | 582 (100.0%) | 204 (100.0%) |
Monthly Housing Cost Tiers in Patton borough
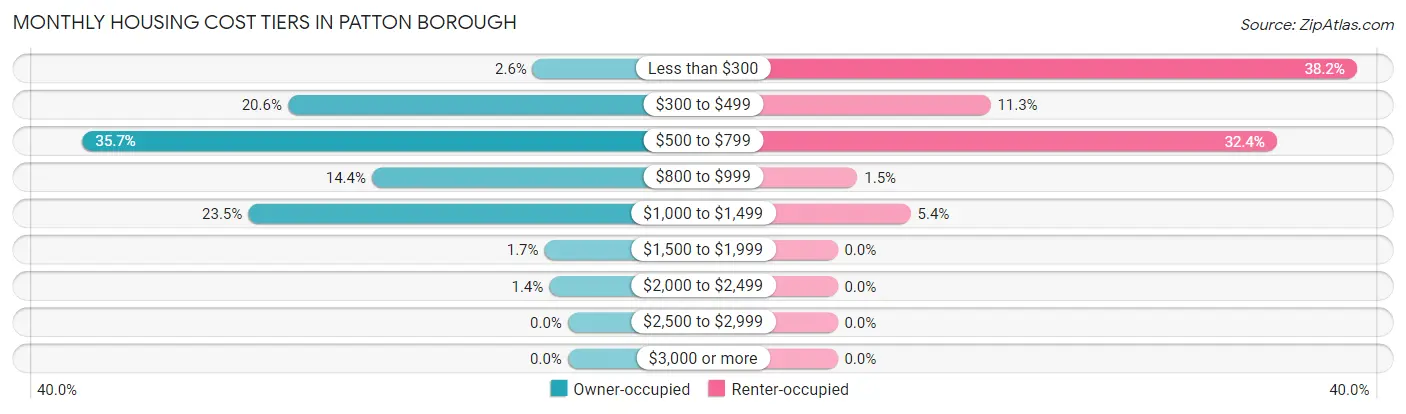
| Monthly Cost | Owner-occupied | Renter-occupied |
| Less than $300 | 15 (2.6%) | 78 (38.2%) |
| $300 to $499 | 120 (20.6%) | 23 (11.3%) |
| $500 to $799 | 208 (35.7%) | 66 (32.4%) |
| $800 to $999 | 84 (14.4%) | 3 (1.5%) |
| $1,000 to $1,499 | 137 (23.5%) | 11 (5.4%) |
| $1,500 to $1,999 | 10 (1.7%) | 0 (0.0%) |
| $2,000 to $2,499 | 8 (1.4%) | 0 (0.0%) |
| $2,500 to $2,999 | 0 (0.0%) | 0 (0.0%) |
| $3,000 or more | 0 (0.0%) | 0 (0.0%) |
| Total | 582 (100.0%) | 204 (100.0%) |
Physical Housing Characteristics in Patton borough
Housing Structures in Patton borough
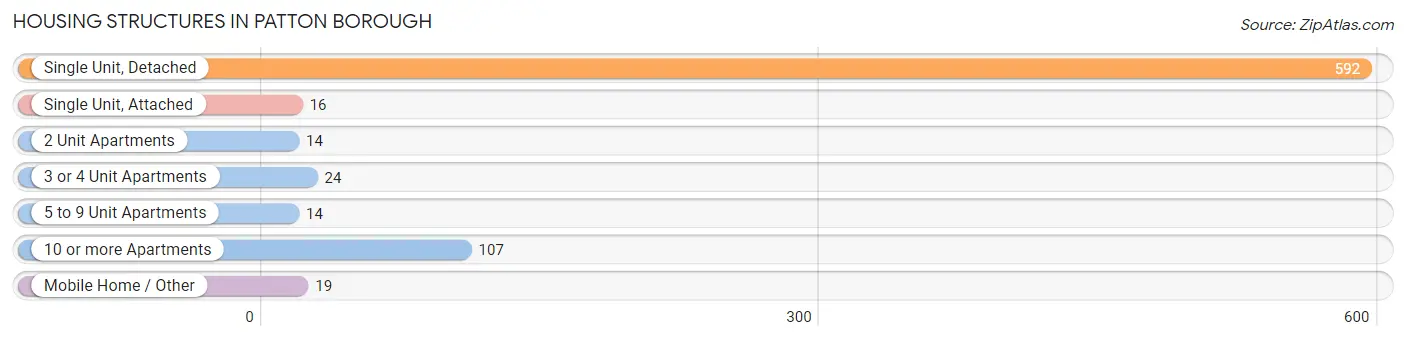
| Structure Type | # Housing Units | % Housing Units |
| Single Unit, Detached | 592 | 75.3% |
| Single Unit, Attached | 16 | 2.0% |
| 2 Unit Apartments | 14 | 1.8% |
| 3 or 4 Unit Apartments | 24 | 3.0% |
| 5 to 9 Unit Apartments | 14 | 1.8% |
| 10 or more Apartments | 107 | 13.6% |
| Mobile Home / Other | 19 | 2.4% |
| Total | 786 | 100.0% |
Housing Structures by Occupancy in Patton borough
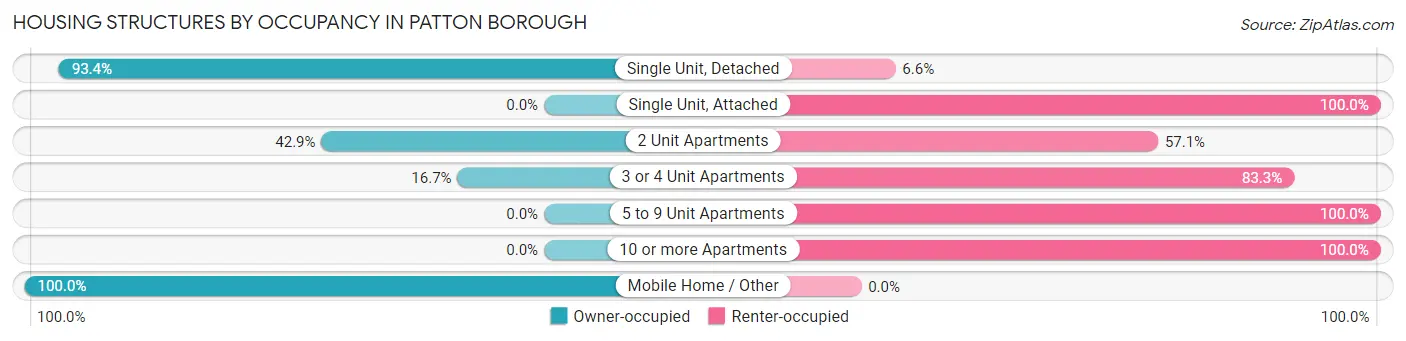
| Structure Type | Owner-occupied | Renter-occupied |
| Single Unit, Detached | 553 (93.4%) | 39 (6.6%) |
| Single Unit, Attached | 0 (0.0%) | 16 (100.0%) |
| 2 Unit Apartments | 6 (42.9%) | 8 (57.1%) |
| 3 or 4 Unit Apartments | 4 (16.7%) | 20 (83.3%) |
| 5 to 9 Unit Apartments | 0 (0.0%) | 14 (100.0%) |
| 10 or more Apartments | 0 (0.0%) | 107 (100.0%) |
| Mobile Home / Other | 19 (100.0%) | 0 (0.0%) |
| Total | 582 (74.1%) | 204 (26.0%) |
Housing Structures by Number of Rooms in Patton borough
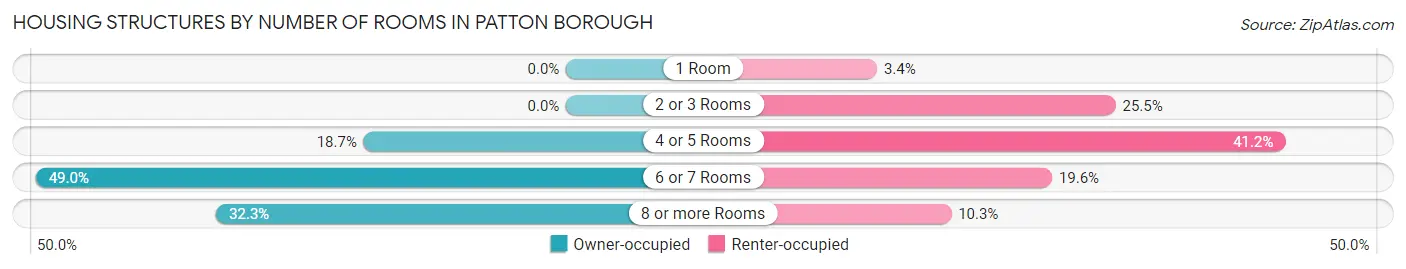
| Number of Rooms | Owner-occupied | Renter-occupied |
| 1 Room | 0 (0.0%) | 7 (3.4%) |
| 2 or 3 Rooms | 0 (0.0%) | 52 (25.5%) |
| 4 or 5 Rooms | 109 (18.7%) | 84 (41.2%) |
| 6 or 7 Rooms | 285 (49.0%) | 40 (19.6%) |
| 8 or more Rooms | 188 (32.3%) | 21 (10.3%) |
| Total | 582 (100.0%) | 204 (100.0%) |
Housing Structure by Heating Type in Patton borough
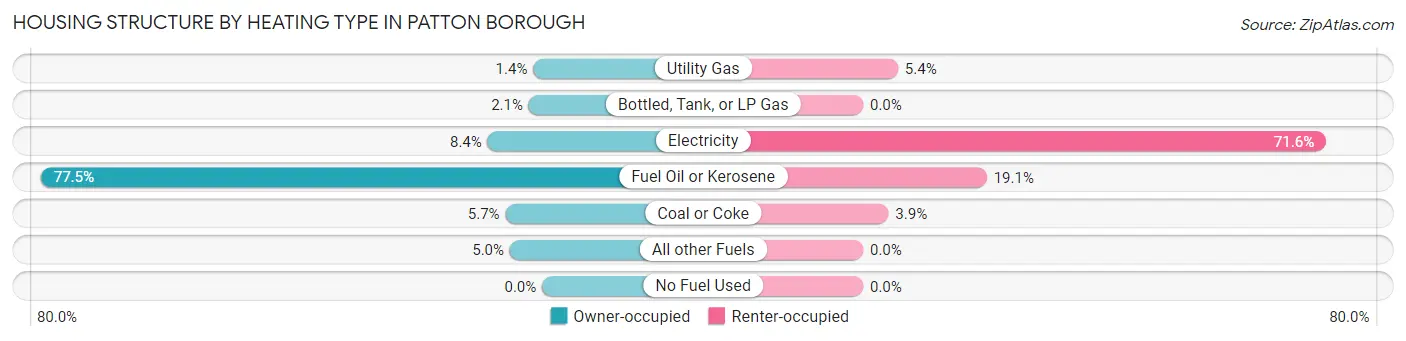
| Heating Type | Owner-occupied | Renter-occupied |
| Utility Gas | 8 (1.4%) | 11 (5.4%) |
| Bottled, Tank, or LP Gas | 12 (2.1%) | 0 (0.0%) |
| Electricity | 49 (8.4%) | 146 (71.6%) |
| Fuel Oil or Kerosene | 451 (77.5%) | 39 (19.1%) |
| Coal or Coke | 33 (5.7%) | 8 (3.9%) |
| All other Fuels | 29 (5.0%) | 0 (0.0%) |
| No Fuel Used | 0 (0.0%) | 0 (0.0%) |
| Total | 582 (100.0%) | 204 (100.0%) |
Household Vehicle Usage in Patton borough
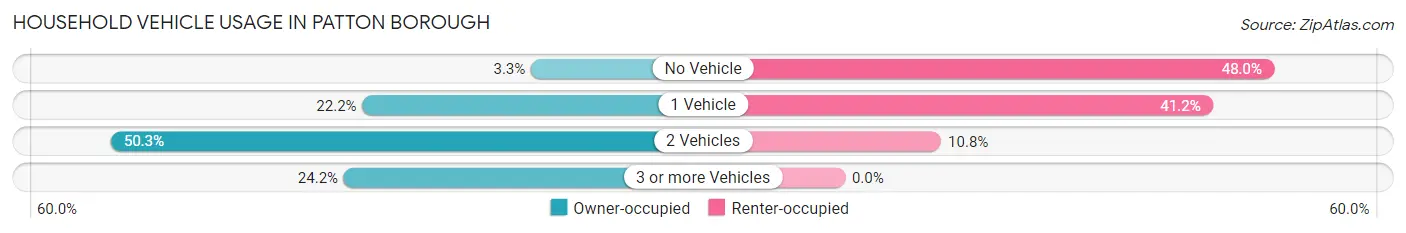
| Vehicles per Household | Owner-occupied | Renter-occupied |
| No Vehicle | 19 (3.3%) | 98 (48.0%) |
| 1 Vehicle | 129 (22.2%) | 84 (41.2%) |
| 2 Vehicles | 293 (50.3%) | 22 (10.8%) |
| 3 or more Vehicles | 141 (24.2%) | 0 (0.0%) |
| Total | 582 (100.0%) | 204 (100.0%) |
Real Estate & Mortgages in Patton borough
Real Estate and Mortgage Overview in Patton borough
| Characteristic | Without Mortgage | With Mortgage |
| Housing Units | 323 | 259 |
| Median Property Value | $75,400 | $85,900 |
| Median Household Income | $59,712 | $36 |
| Monthly Housing Costs | $525 | $0 |
| Real Estate Taxes | $1,222 | $0 |
Property Value by Mortgage Status in Patton borough
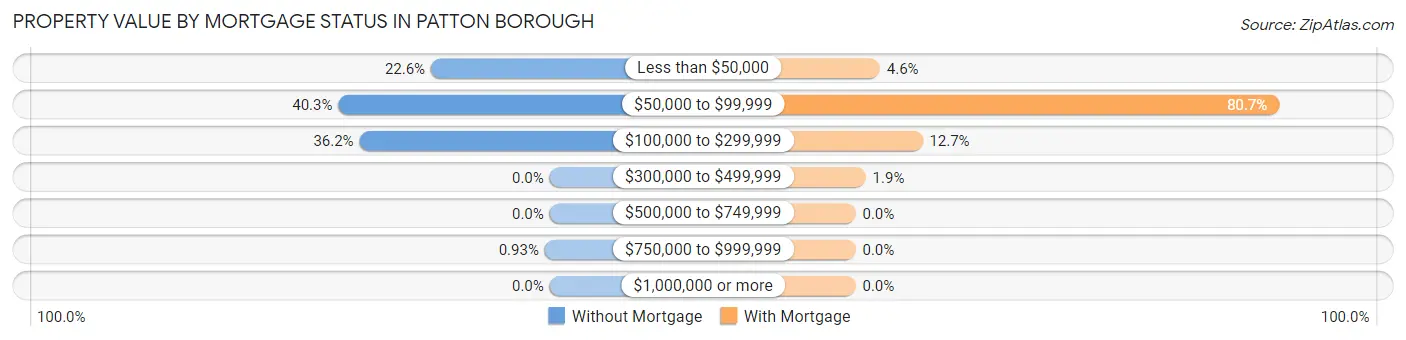
| Property Value | Without Mortgage | With Mortgage |
| Less than $50,000 | 73 (22.6%) | 12 (4.6%) |
| $50,000 to $99,999 | 130 (40.3%) | 209 (80.7%) |
| $100,000 to $299,999 | 117 (36.2%) | 33 (12.7%) |
| $300,000 to $499,999 | 0 (0.0%) | 5 (1.9%) |
| $500,000 to $749,999 | 0 (0.0%) | 0 (0.0%) |
| $750,000 to $999,999 | 3 (0.9%) | 0 (0.0%) |
| $1,000,000 or more | 0 (0.0%) | 0 (0.0%) |
| Total | 323 (100.0%) | 259 (100.0%) |
Household Income by Mortgage Status in Patton borough
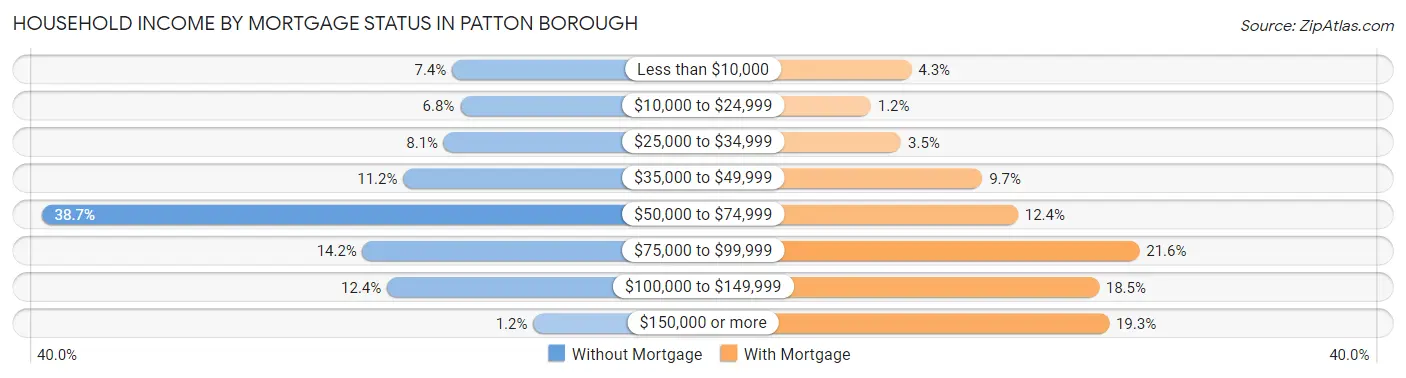
| Household Income | Without Mortgage | With Mortgage |
| Less than $10,000 | 24 (7.4%) | 11 (4.3%) |
| $10,000 to $24,999 | 22 (6.8%) | 3 (1.2%) |
| $25,000 to $34,999 | 26 (8.1%) | 9 (3.5%) |
| $35,000 to $49,999 | 36 (11.2%) | 25 (9.7%) |
| $50,000 to $74,999 | 125 (38.7%) | 32 (12.4%) |
| $75,000 to $99,999 | 46 (14.2%) | 56 (21.6%) |
| $100,000 to $149,999 | 40 (12.4%) | 48 (18.5%) |
| $150,000 or more | 4 (1.2%) | 50 (19.3%) |
| Total | 323 (100.0%) | 259 (100.0%) |
Property Value to Household Income Ratio in Patton borough
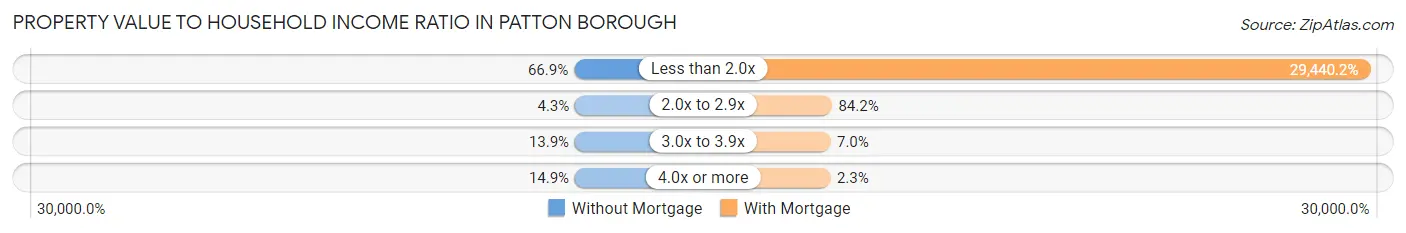
| Value-to-Income Ratio | Without Mortgage | With Mortgage |
| Less than 2.0x | 216 (66.9%) | 76,250 (29,440.1%) |
| 2.0x to 2.9x | 14 (4.3%) | 218 (84.2%) |
| 3.0x to 3.9x | 45 (13.9%) | 18 (7.0%) |
| 4.0x or more | 48 (14.9%) | 6 (2.3%) |
| Total | 323 (100.0%) | 259 (100.0%) |
Real Estate Taxes by Mortgage Status in Patton borough
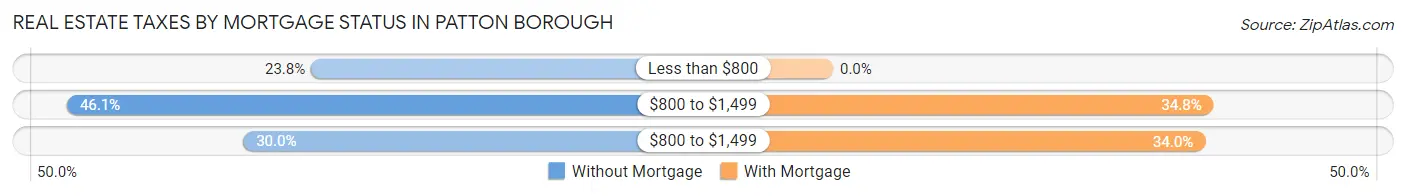
| Property Taxes | Without Mortgage | With Mortgage |
| Less than $800 | 77 (23.8%) | 0 (0.0%) |
| $800 to $1,499 | 149 (46.1%) | 90 (34.7%) |
| $800 to $1,499 | 97 (30.0%) | 88 (34.0%) |
| Total | 323 (100.0%) | 259 (100.0%) |
Health & Disability in Patton borough
Health Insurance Coverage by Age in Patton borough
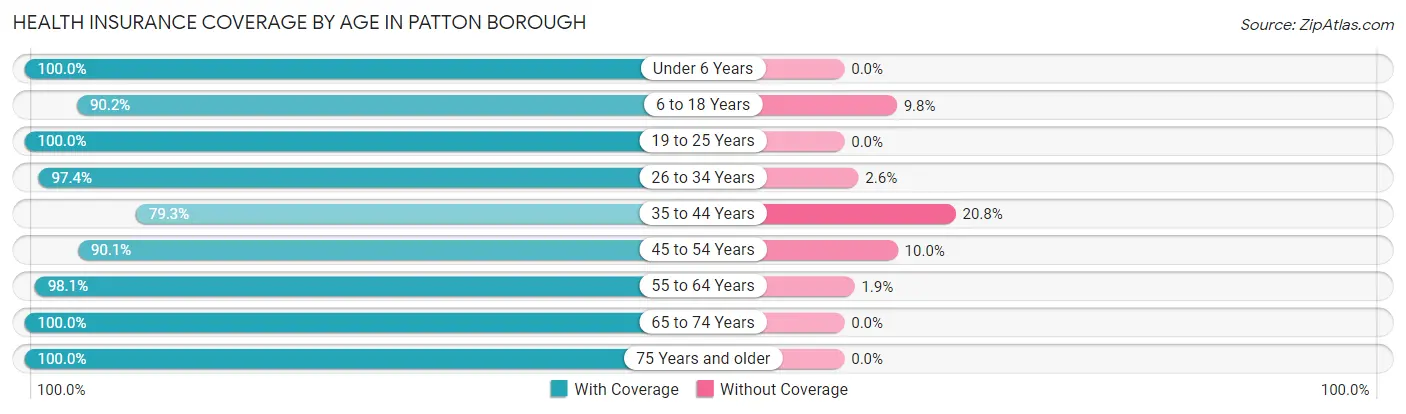
| Age Bracket | With Coverage | Without Coverage |
| Under 6 Years | 119 (100.0%) | 0 (0.0%) |
| 6 to 18 Years | 277 (90.2%) | 30 (9.8%) |
| 19 to 25 Years | 157 (100.0%) | 0 (0.0%) |
| 26 to 34 Years | 222 (97.4%) | 6 (2.6%) |
| 35 to 44 Years | 168 (79.2%) | 44 (20.7%) |
| 45 to 54 Years | 199 (90.0%) | 22 (10.0%) |
| 55 to 64 Years | 309 (98.1%) | 6 (1.9%) |
| 65 to 74 Years | 222 (100.0%) | 0 (0.0%) |
| 75 Years and older | 107 (100.0%) | 0 (0.0%) |
| Total | 1,780 (94.3%) | 108 (5.7%) |
Health Insurance Coverage by Citizenship Status in Patton borough
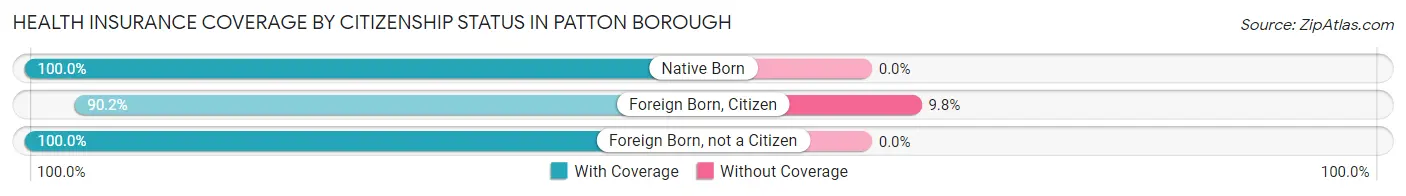
| Citizenship Status | With Coverage | Without Coverage |
| Native Born | 119 (100.0%) | 0 (0.0%) |
| Foreign Born, Citizen | 277 (90.2%) | 30 (9.8%) |
| Foreign Born, not a Citizen | 157 (100.0%) | 0 (0.0%) |
Health Insurance Coverage by Household Income in Patton borough
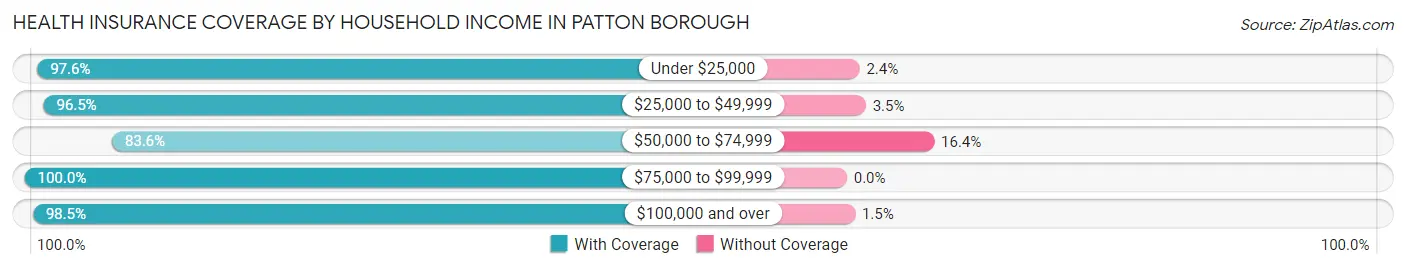
| Household Income | With Coverage | Without Coverage |
| Under $25,000 | 330 (97.6%) | 8 (2.4%) |
| $25,000 to $49,999 | 327 (96.5%) | 12 (3.5%) |
| $50,000 to $74,999 | 414 (83.6%) | 81 (16.4%) |
| $75,000 to $99,999 | 240 (100.0%) | 0 (0.0%) |
| $100,000 and over | 452 (98.5%) | 7 (1.5%) |
Public vs Private Health Insurance Coverage by Age in Patton borough
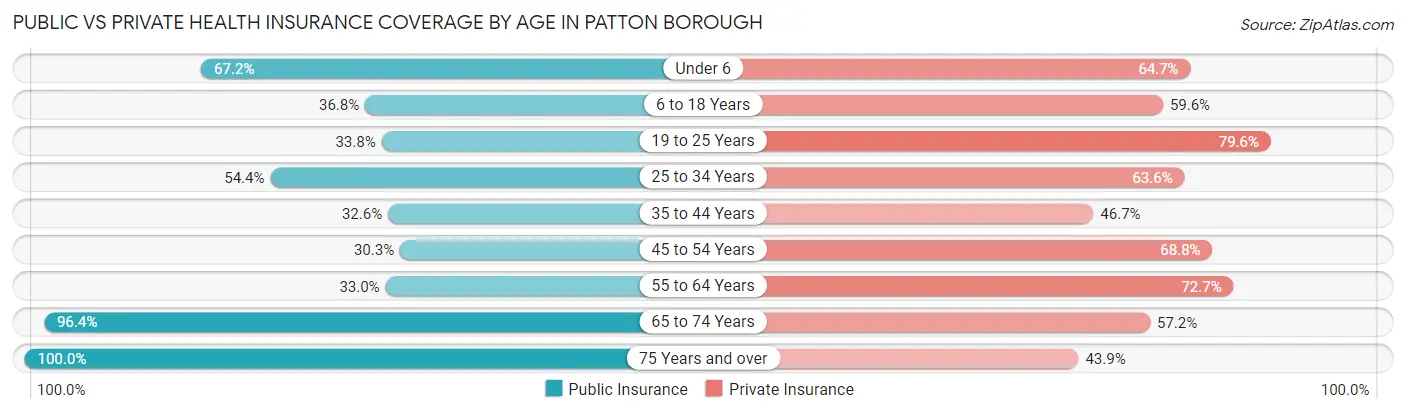
| Age Bracket | Public Insurance | Private Insurance |
| Under 6 | 80 (67.2%) | 77 (64.7%) |
| 6 to 18 Years | 113 (36.8%) | 183 (59.6%) |
| 19 to 25 Years | 53 (33.8%) | 125 (79.6%) |
| 25 to 34 Years | 124 (54.4%) | 145 (63.6%) |
| 35 to 44 Years | 69 (32.6%) | 99 (46.7%) |
| 45 to 54 Years | 67 (30.3%) | 152 (68.8%) |
| 55 to 64 Years | 104 (33.0%) | 229 (72.7%) |
| 65 to 74 Years | 214 (96.4%) | 127 (57.2%) |
| 75 Years and over | 107 (100.0%) | 47 (43.9%) |
| Total | 931 (49.3%) | 1,184 (62.7%) |
Disability Status by Sex by Age in Patton borough
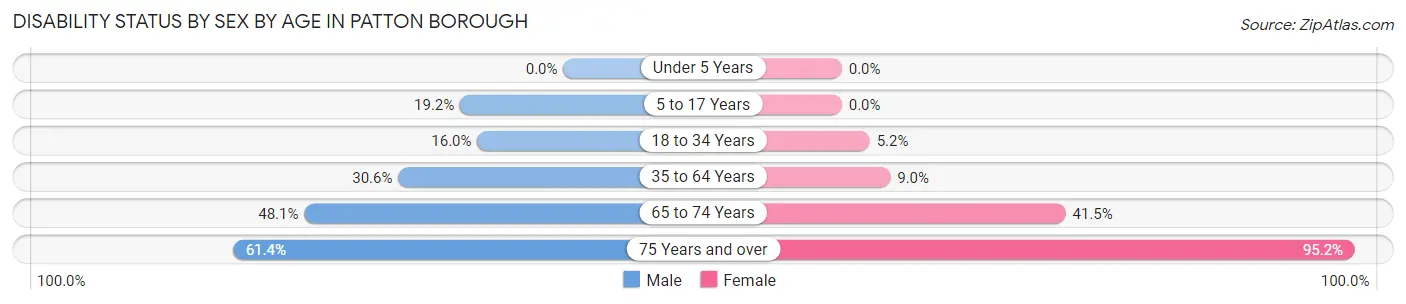
| Age Bracket | Male | Female |
| Under 5 Years | 0 (0.0%) | 0 (0.0%) |
| 5 to 17 Years | 32 (19.2%) | 0 (0.0%) |
| 18 to 34 Years | 34 (16.0%) | 10 (5.2%) |
| 35 to 64 Years | 110 (30.6%) | 35 (9.0%) |
| 65 to 74 Years | 50 (48.1%) | 49 (41.5%) |
| 75 Years and over | 27 (61.4%) | 60 (95.2%) |
Disability Class by Sex by Age in Patton borough
Disability Class: Hearing Difficulty
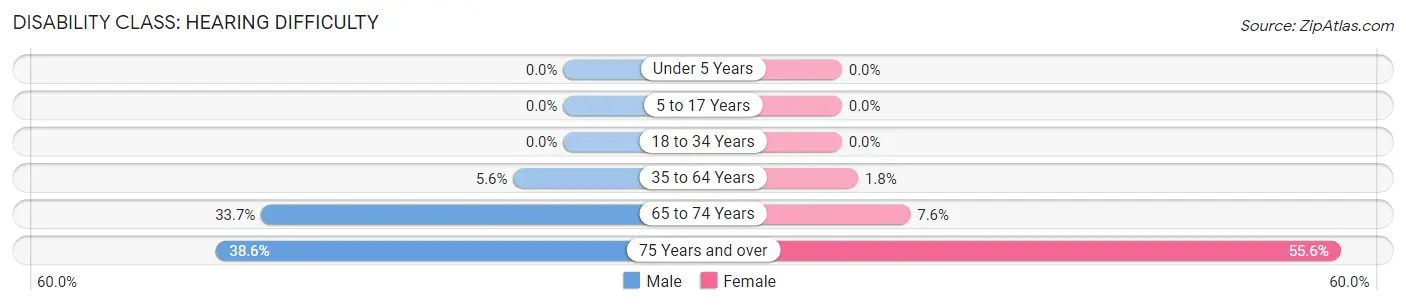
| Age Bracket | Male | Female |
| Under 5 Years | 0 (0.0%) | 0 (0.0%) |
| 5 to 17 Years | 0 (0.0%) | 0 (0.0%) |
| 18 to 34 Years | 0 (0.0%) | 0 (0.0%) |
| 35 to 64 Years | 20 (5.6%) | 7 (1.8%) |
| 65 to 74 Years | 35 (33.7%) | 9 (7.6%) |
| 75 Years and over | 17 (38.6%) | 35 (55.6%) |
Disability Class: Vision Difficulty
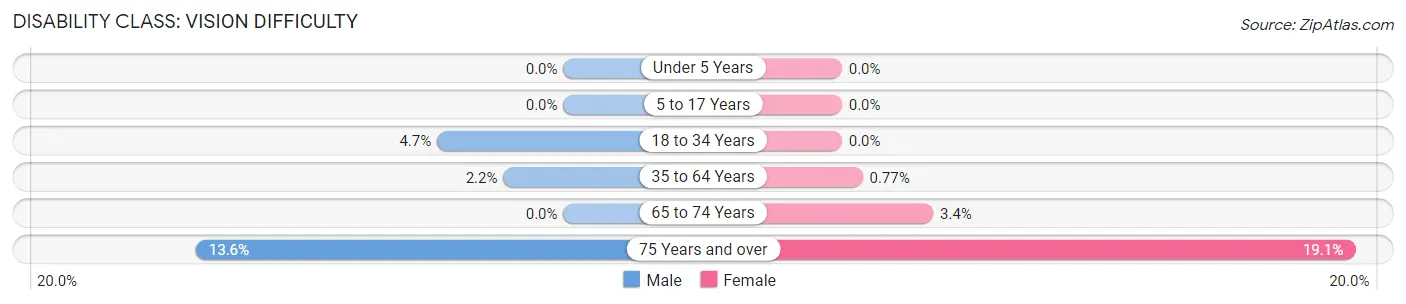
| Age Bracket | Male | Female |
| Under 5 Years | 0 (0.0%) | 0 (0.0%) |
| 5 to 17 Years | 0 (0.0%) | 0 (0.0%) |
| 18 to 34 Years | 10 (4.7%) | 0 (0.0%) |
| 35 to 64 Years | 8 (2.2%) | 3 (0.8%) |
| 65 to 74 Years | 0 (0.0%) | 4 (3.4%) |
| 75 Years and over | 6 (13.6%) | 12 (19.1%) |
Disability Class: Cognitive Difficulty
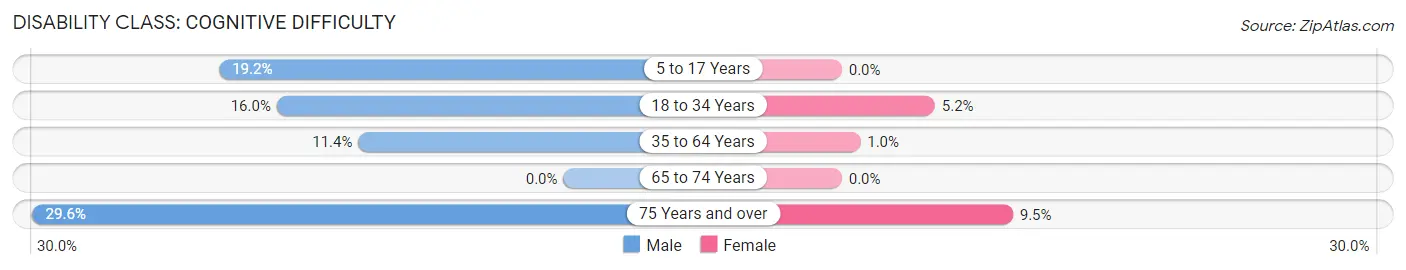
| Age Bracket | Male | Female |
| 5 to 17 Years | 32 (19.2%) | 0 (0.0%) |
| 18 to 34 Years | 34 (16.0%) | 10 (5.2%) |
| 35 to 64 Years | 41 (11.4%) | 4 (1.0%) |
| 65 to 74 Years | 0 (0.0%) | 0 (0.0%) |
| 75 Years and over | 13 (29.5%) | 6 (9.5%) |
Disability Class: Ambulatory Difficulty
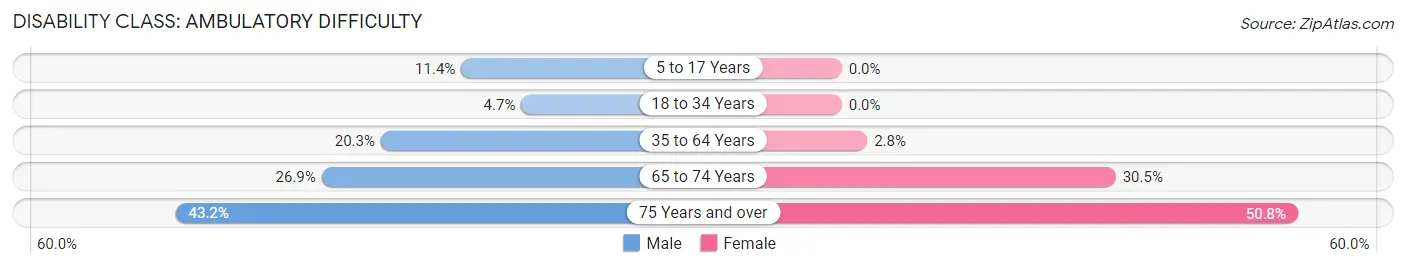
| Age Bracket | Male | Female |
| 5 to 17 Years | 19 (11.4%) | 0 (0.0%) |
| 18 to 34 Years | 10 (4.7%) | 0 (0.0%) |
| 35 to 64 Years | 73 (20.3%) | 11 (2.8%) |
| 65 to 74 Years | 28 (26.9%) | 36 (30.5%) |
| 75 Years and over | 19 (43.2%) | 32 (50.8%) |
Disability Class: Self-Care Difficulty
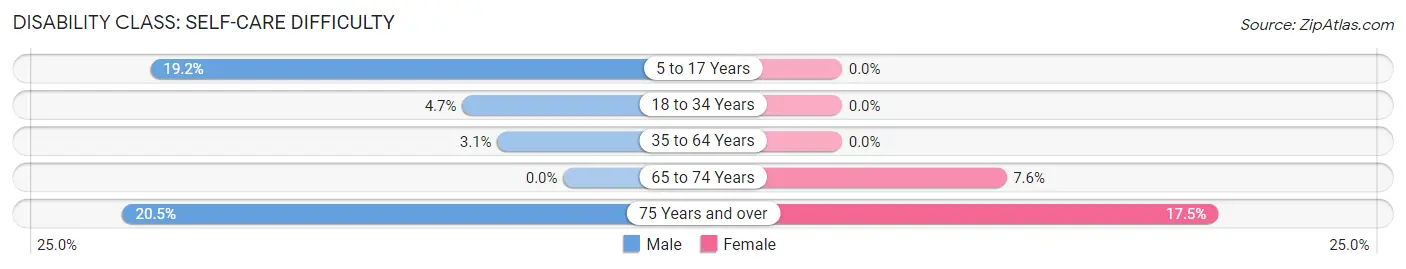
| Age Bracket | Male | Female |
| 5 to 17 Years | 32 (19.2%) | 0 (0.0%) |
| 18 to 34 Years | 10 (4.7%) | 0 (0.0%) |
| 35 to 64 Years | 11 (3.1%) | 0 (0.0%) |
| 65 to 74 Years | 0 (0.0%) | 9 (7.6%) |
| 75 Years and over | 9 (20.4%) | 11 (17.5%) |
Technology Access in Patton borough
Computing Device Access in Patton borough
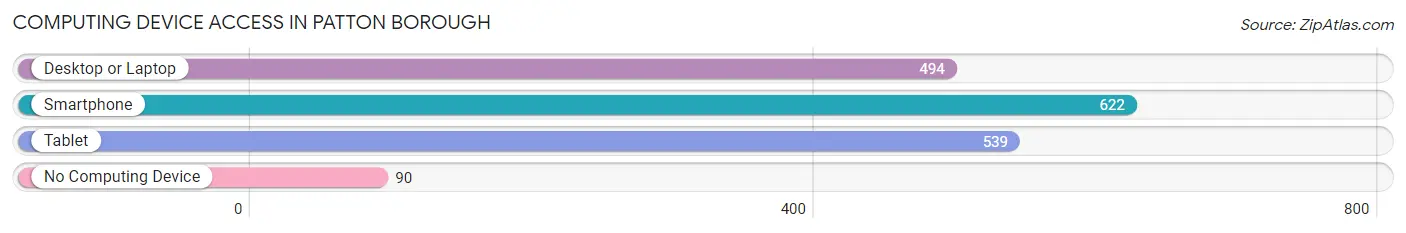
| Device Type | # Households | % Households |
| Desktop or Laptop | 494 | 62.8% |
| Smartphone | 622 | 79.1% |
| Tablet | 539 | 68.6% |
| No Computing Device | 90 | 11.5% |
| Total | 786 | 100.0% |
Internet Access in Patton borough
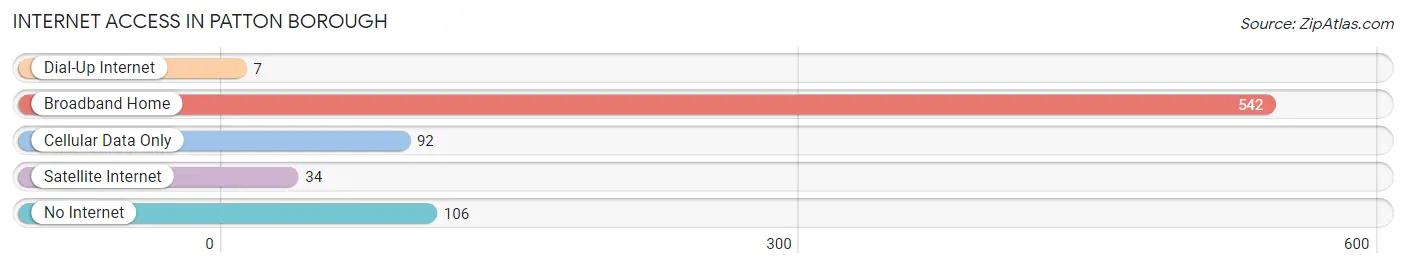
| Internet Type | # Households | % Households |
| Dial-Up Internet | 7 | 0.9% |
| Broadband Home | 542 | 69.0% |
| Cellular Data Only | 92 | 11.7% |
| Satellite Internet | 34 | 4.3% |
| No Internet | 106 | 13.5% |
| Total | 786 | 100.0% |
Patton borough Summary
Patton Borough is a small borough located in Cambria County, Pennsylvania. It is situated in the foothills of the Allegheny Mountains, approximately 10 miles east of Johnstown. The borough was founded in 1876 and is home to a population of approximately 1,500 people.
History
Patton Borough was founded in 1876 by a group of settlers from the nearby town of Ebensburg. The settlers were looking for a place to build a new community and chose the area due to its proximity to the Allegheny Mountains. The town was named after General George S. Patton, who was a hero of the Civil War.
The first settlers of Patton Borough were mostly farmers and miners. The town quickly grew and by the early 1900s, it had become a thriving community. The town was home to several businesses, including a hotel, a bank, a post office, a blacksmith shop, and a general store.
In the early 1900s, Patton Borough was a popular destination for tourists. The town was known for its scenic beauty and its proximity to the Allegheny Mountains. The town was also home to several resorts, which attracted visitors from all over the country.
In the late 1950s, the town began to decline. Many of the businesses closed and the population began to decline. In the 1970s, the town was revitalized by the construction of a new highway, which connected the town to Johnstown. This allowed for increased economic activity and the town began to grow again.
Geography
Patton Borough is located in the foothills of the Allegheny Mountains in Cambria County, Pennsylvania. The borough is situated on the banks of the Little Conemaugh River and is surrounded by rolling hills and forests. The town is located approximately 10 miles east of Johnstown and is accessible via the Pennsylvania Turnpike.
The climate in Patton Borough is humid continental, with cold winters and hot summers. The average annual temperature is around 50 degrees Fahrenheit. The average annual precipitation is around 40 inches.
Economy
The economy of Patton Borough is largely based on tourism. The town is home to several resorts and is a popular destination for outdoor activities such as fishing, hunting, and camping. The town is also home to several small businesses, including restaurants, shops, and a post office.
Demographics
As of the 2010 census, the population of Patton Borough was 1,500. The racial makeup of the town was 97.3% White, 0.7% African American, 0.3% Native American, 0.3% Asian, and 1.3% from other races. The median household income was $37,500 and the median family income was $45,000.
Conclusion
Patton Borough is a small borough located in Cambria County, Pennsylvania. It was founded in 1876 and is home to a population of approximately 1,500 people. The town is situated in the foothills of the Allegheny Mountains and is a popular destination for tourists. The economy of the town is largely based on tourism and the town is home to several small businesses. The population of the town is predominantly White and the median household income is around $37,500.
Common Questions
What is Per Capita Income in Patton borough?
Per Capita income in Patton borough is $25,226.
What is the Median Family Income in Patton borough?
Median Family Income in Patton borough is $66,900.
What is the Median Household income in Patton borough?
Median Household Income in Patton borough is $55,583.
What is Income or Wage Gap in Patton borough?
Income or Wage Gap in Patton borough is 27.0%.
Women in Patton borough earn 73.0 cents for every dollar earned by a man.
What is Inequality or Gini Index in Patton borough?
Inequality or Gini Index in Patton borough is 0.40.
What is the Total Population of Patton borough?
Total Population of Patton borough is 1,888.
What is the Total Male Population of Patton borough?
Total Male Population of Patton borough is 920.
What is the Total Female Population of Patton borough?
Total Female Population of Patton borough is 968.
What is the Ratio of Males per 100 Females in Patton borough?
There are 95.04 Males per 100 Females in Patton borough.
What is the Ratio of Females per 100 Males in Patton borough?
There are 105.22 Females per 100 Males in Patton borough.
What is the Median Population Age in Patton borough?
Median Population Age in Patton borough is 41.7 Years.
What is the Average Family Size in Patton borough
Average Family Size in Patton borough is 3.0 People.
What is the Average Household Size in Patton borough
Average Household Size in Patton borough is 2.4 People.
How Large is the Labor Force in Patton borough?
There are 834 People in the Labor Forcein in Patton borough.
What is the Percentage of People in the Labor Force in Patton borough?
53.2% of People are in the Labor Force in Patton borough.
What is the Unemployment Rate in Patton borough?
Unemployment Rate in Patton borough is 4.0%.