Osceola Mills borough, PA Map & Demographics
Osceola Mills borough Overview
$32,828
PER CAPITA INCOME
$64,732
AVG FAMILY INCOME
$58,125
AVG HOUSEHOLD INCOME
50.1%
WAGE / INCOME GAP [ % ]
49.9¢/ $1
WAGE / INCOME GAP [ $ ]
0.43
INEQUALITY / GINI INDEX
1,176
TOTAL POPULATION
528
MALE POPULATION
648
FEMALE POPULATION
81.48
MALES / 100 FEMALES
122.73
FEMALES / 100 MALES
44.1
MEDIAN AGE
2.7
AVG FAMILY SIZE
2.3
AVG HOUSEHOLD SIZE
531
LABOR FORCE [ PEOPLE ]
53.6%
PERCENT IN LABOR FORCE
7.5%
UNEMPLOYMENT RATE
Income in Osceola Mills borough
Income Overview in Osceola Mills borough
Per Capita Income in Osceola Mills borough is $32,828, while median incomes of families and households are $64,732 and $58,125 respectively.
| Characteristic | Number | Measure |
| Per Capita Income | 1,176 | $32,828 |
| Median Family Income | 361 | $64,732 |
| Mean Family Income | 361 | $77,170 |
| Median Household Income | 513 | $58,125 |
| Mean Household Income | 513 | $79,413 |
| Income Deficit | 361 | $0 |
| Wage / Income Gap (%) | 1,176 | 50.12% |
| Wage / Income Gap ($) | 1,176 | 49.88¢ per $1 |
| Gini / Inequality Index | 1,176 | 0.43 |
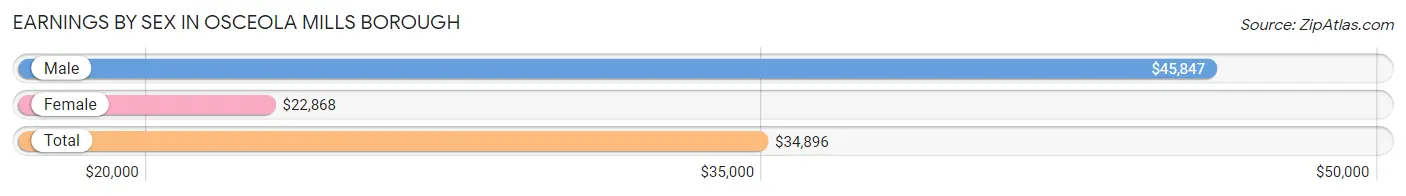
Earnings by Sex in Osceola Mills borough
Average Earnings in Osceola Mills borough are $34,896, $45,847 for men and $22,868 for women, a difference of 50.1%.
| Sex | Number | Average Earnings |
| Male | 309 (51.8%) | $45,847 |
| Female | 287 (48.1%) | $22,868 |
| Total | 596 (100.0%) | $34,896 |
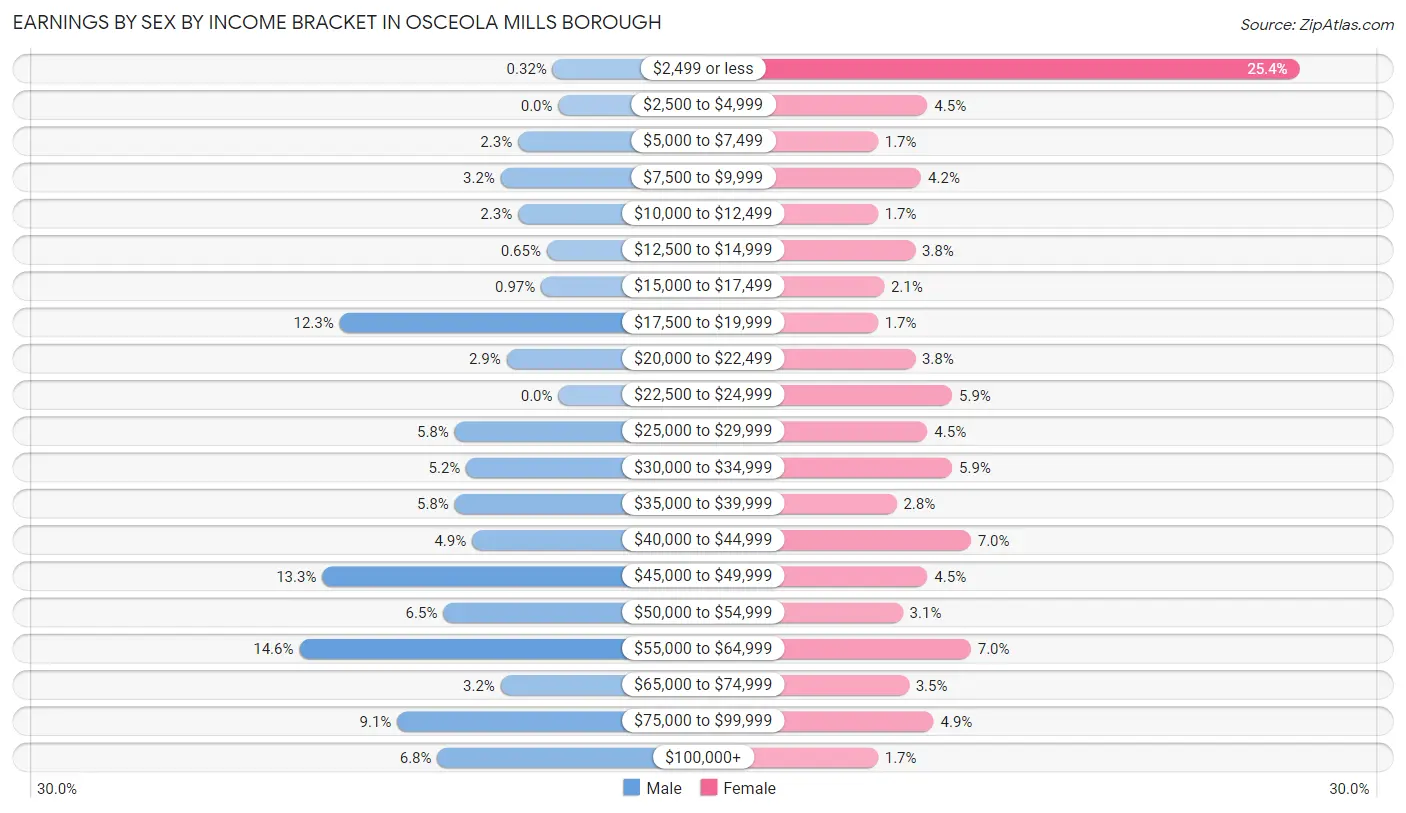
Earnings by Sex by Income Bracket in Osceola Mills borough
The most common earnings brackets in Osceola Mills borough are $55,000 to $64,999 for men (45 | 14.6%) and $2,499 or less for women (73 | 25.4%).
| Income | Male | Female |
| $2,499 or less | 1 (0.3%) | 73 (25.4%) |
| $2,500 to $4,999 | 0 (0.0%) | 13 (4.5%) |
| $5,000 to $7,499 | 7 (2.3%) | 5 (1.7%) |
| $7,500 to $9,999 | 10 (3.2%) | 12 (4.2%) |
| $10,000 to $12,499 | 7 (2.3%) | 5 (1.7%) |
| $12,500 to $14,999 | 2 (0.6%) | 11 (3.8%) |
| $15,000 to $17,499 | 3 (1.0%) | 6 (2.1%) |
| $17,500 to $19,999 | 38 (12.3%) | 5 (1.7%) |
| $20,000 to $22,499 | 9 (2.9%) | 11 (3.8%) |
| $22,500 to $24,999 | 0 (0.0%) | 17 (5.9%) |
| $25,000 to $29,999 | 18 (5.8%) | 13 (4.5%) |
| $30,000 to $34,999 | 16 (5.2%) | 17 (5.9%) |
| $35,000 to $39,999 | 18 (5.8%) | 8 (2.8%) |
| $40,000 to $44,999 | 15 (4.9%) | 20 (7.0%) |
| $45,000 to $49,999 | 41 (13.3%) | 13 (4.5%) |
| $50,000 to $54,999 | 20 (6.5%) | 9 (3.1%) |
| $55,000 to $64,999 | 45 (14.6%) | 20 (7.0%) |
| $65,000 to $74,999 | 10 (3.2%) | 10 (3.5%) |
| $75,000 to $99,999 | 28 (9.1%) | 14 (4.9%) |
| $100,000+ | 21 (6.8%) | 5 (1.7%) |
| Total | 309 (100.0%) | 287 (100.0%) |
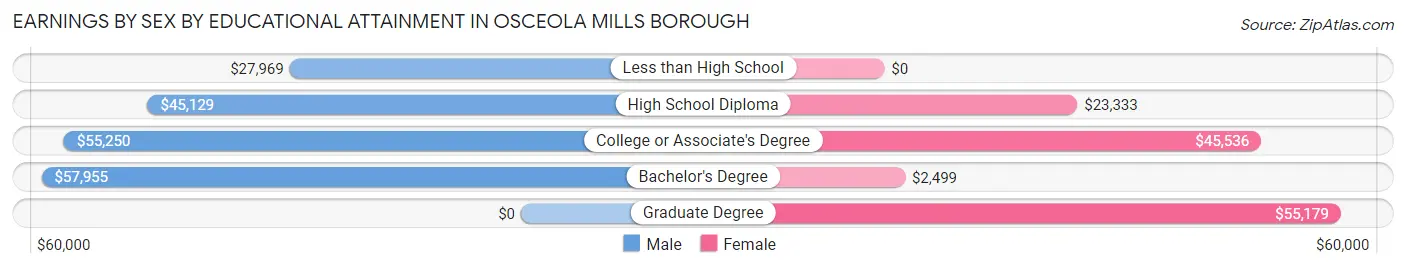
Earnings by Sex by Educational Attainment in Osceola Mills borough
Average earnings in Osceola Mills borough are $46,331 for men and $25,781 for women, a difference of 44.4%. Men with an educational attainment of bachelor's degree enjoy the highest average annual earnings of $57,955, while those with less than high school education earn the least with $27,969. Women with an educational attainment of graduate degree earn the most with the average annual earnings of $55,179, while those with bachelor's degree education have the smallest earnings of $2,499.
| Educational Attainment | Male Income | Female Income |
| Less than High School | $27,969 | $0 |
| High School Diploma | $45,129 | $23,333 |
| College or Associate's Degree | $55,250 | $45,536 |
| Bachelor's Degree | $57,955 | $2,499 |
| Graduate Degree | - | - |
| Total | $46,331 | $25,781 |
Family Income in Osceola Mills borough
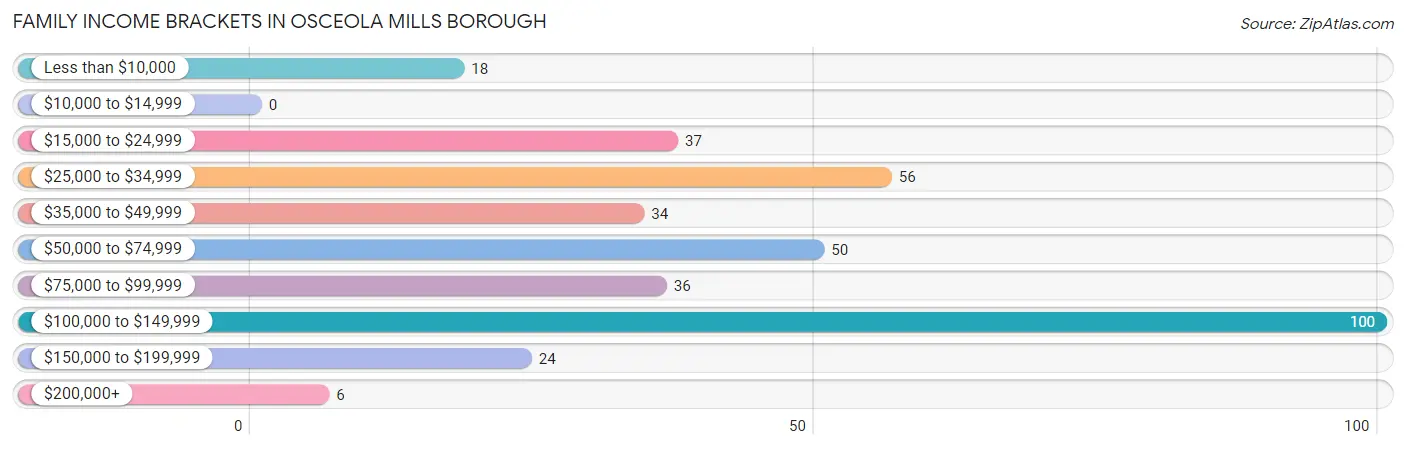
Family Income Brackets in Osceola Mills borough
According to the Osceola Mills borough family income data, there are 100 families falling into the $100,000 to $149,999 income range, which is the most common income bracket and makes up 27.7% of all families.
| Income Bracket | # Families | % Families |
| Less than $10,000 | 18 | 5.0% |
| $10,000 to $14,999 | 0 | 0.0% |
| $15,000 to $24,999 | 37 | 10.2% |
| $25,000 to $34,999 | 56 | 15.5% |
| $35,000 to $49,999 | 34 | 9.4% |
| $50,000 to $74,999 | 50 | 13.9% |
| $75,000 to $99,999 | 36 | 10.0% |
| $100,000 to $149,999 | 100 | 27.7% |
| $150,000 to $199,999 | 24 | 6.6% |
| $200,000+ | 6 | 1.7% |
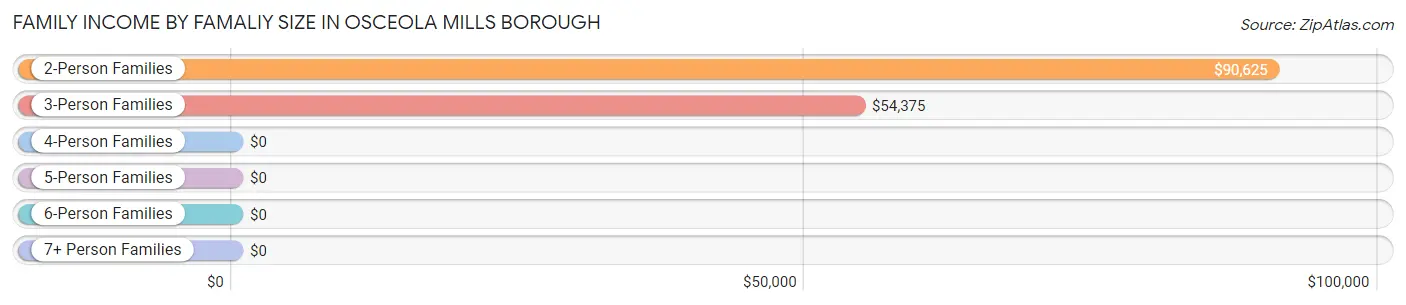
Family Income by Famaliy Size in Osceola Mills borough
2-person families (196 | 54.3%) account for the highest median family income in Osceola Mills borough with $90,625 per family, while 2-person families (196 | 54.3%) have the highest median income of $45,312 per family member.
| Income Bracket | # Families | Median Income |
| 2-Person Families | 196 (54.3%) | $90,625 |
| 3-Person Families | 61 (16.9%) | $54,375 |
| 4-Person Families | 100 (27.7%) | $0 |
| 5-Person Families | 2 (0.5%) | $0 |
| 6-Person Families | 2 (0.5%) | $0 |
| 7+ Person Families | 0 (0.0%) | $0 |
| Total | 361 (100.0%) | $64,732 |
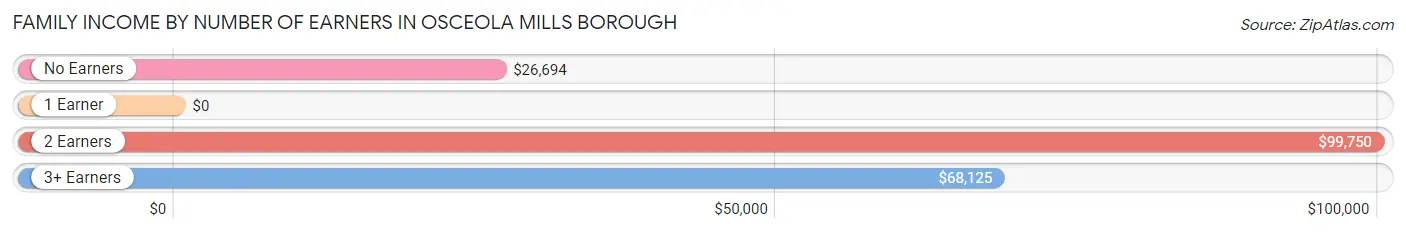
Family Income by Number of Earners in Osceola Mills borough
| Number of Earners | # Families | Median Income |
| No Earners | 71 (19.7%) | $26,694 |
| 1 Earner | 157 (43.5%) | $0 |
| 2 Earners | 118 (32.7%) | $99,750 |
| 3+ Earners | 15 (4.2%) | $68,125 |
| Total | 361 (100.0%) | $64,732 |
Household Income in Osceola Mills borough
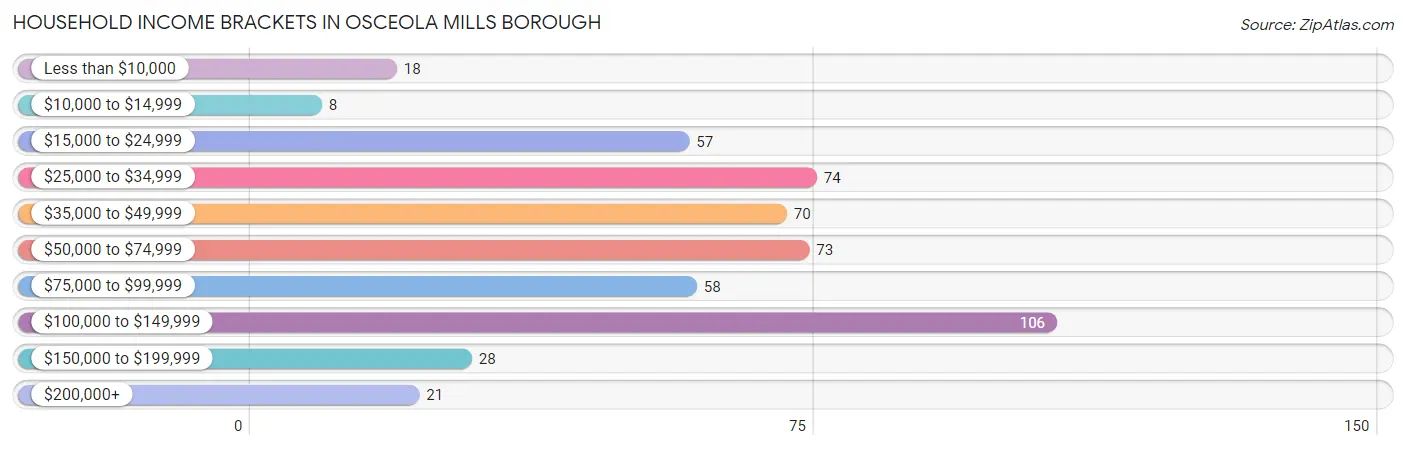
Household Income Brackets in Osceola Mills borough
With 106 households falling in the category, the $100,000 to $149,999 income range is the most frequent in Osceola Mills borough, accounting for 20.7% of all households. In contrast, only 8 households (1.6%) fall into the $10,000 to $14,999 income bracket, making it the least populous group.
| Income Bracket | # Households | % Households |
| Less than $10,000 | 18 | 3.5% |
| $10,000 to $14,999 | 8 | 1.6% |
| $15,000 to $24,999 | 57 | 11.1% |
| $25,000 to $34,999 | 74 | 14.4% |
| $35,000 to $49,999 | 70 | 13.6% |
| $50,000 to $74,999 | 73 | 14.2% |
| $75,000 to $99,999 | 58 | 11.3% |
| $100,000 to $149,999 | 106 | 20.7% |
| $150,000 to $199,999 | 28 | 5.5% |
| $200,000+ | 21 | 4.1% |
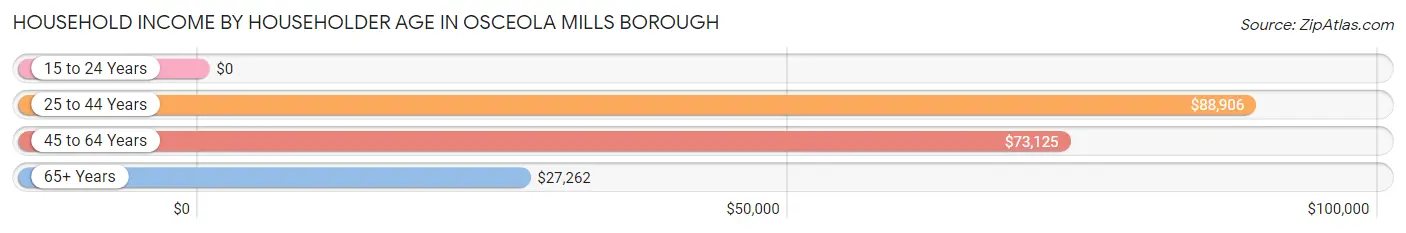
Household Income by Householder Age in Osceola Mills borough
The median household income in Osceola Mills borough is $58,125, with the highest median household income of $88,906 found in the 25 to 44 years age bracket for the primary householder. A total of 149 households (29.0%) fall into this category. Meanwhile, the 15 to 24 years age bracket for the primary householder has the lowest median household income of $0, with 3 households (0.6%) in this group.
| Income Bracket | # Households | Median Income |
| 15 to 24 Years | 3 (0.6%) | $0 |
| 25 to 44 Years | 149 (29.0%) | $88,906 |
| 45 to 64 Years | 223 (43.5%) | $73,125 |
| 65+ Years | 138 (26.9%) | $27,262 |
| Total | 513 (100.0%) | $58,125 |
Poverty in Osceola Mills borough
Income Below Poverty by Sex and Age in Osceola Mills borough
With 12.6% poverty level for males and 12.2% for females among the residents of Osceola Mills borough, under 5 year old males and 16 and 17 year old females are the most vulnerable to poverty, with 10 males (50.0%) and 9 females (81.8%) in their respective age groups living below the poverty level.
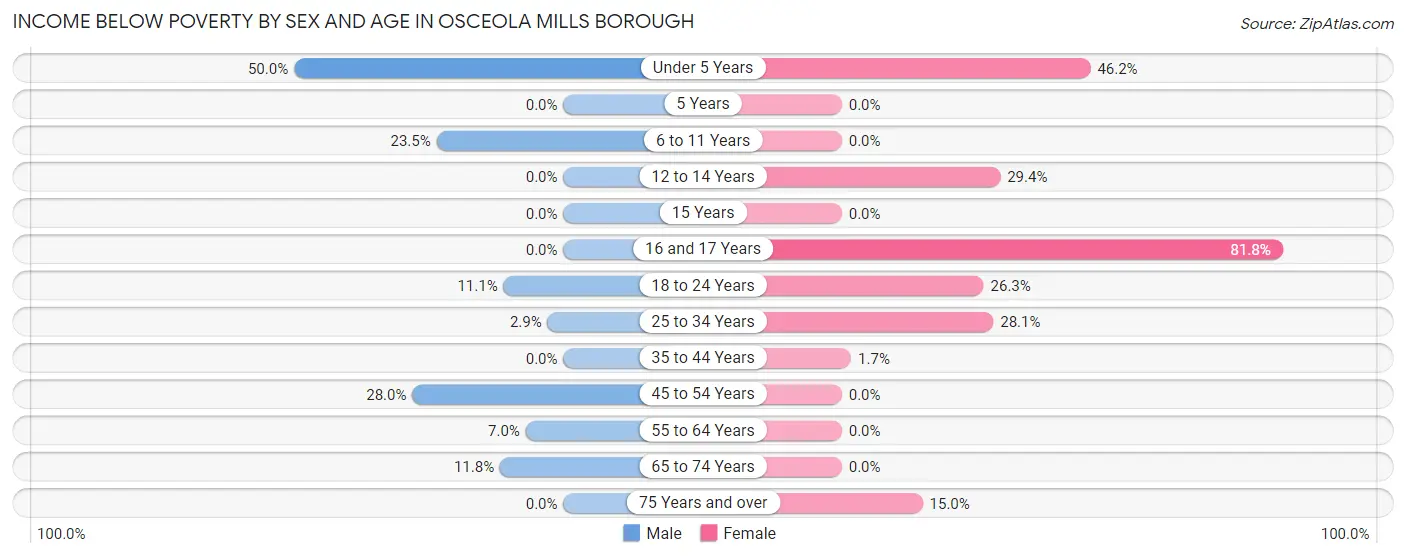
| Age Bracket | Male | Female |
| Under 5 Years | 10 (50.0%) | 18 (46.2%) |
| 5 Years | 0 (0.0%) | 0 (0.0%) |
| 6 to 11 Years | 8 (23.5%) | 0 (0.0%) |
| 12 to 14 Years | 0 (0.0%) | 10 (29.4%) |
| 15 Years | 0 (0.0%) | 0 (0.0%) |
| 16 and 17 Years | 0 (0.0%) | 9 (81.8%) |
| 18 to 24 Years | 5 (11.1%) | 10 (26.3%) |
| 25 to 34 Years | 2 (2.9%) | 18 (28.1%) |
| 35 to 44 Years | 0 (0.0%) | 2 (1.7%) |
| 45 to 54 Years | 30 (28.0%) | 0 (0.0%) |
| 55 to 64 Years | 7 (7.0%) | 0 (0.0%) |
| 65 to 74 Years | 4 (11.8%) | 0 (0.0%) |
| 75 Years and over | 0 (0.0%) | 12 (15.0%) |
| Total | 66 (12.6%) | 79 (12.2%) |
Income Above Poverty by Sex and Age in Osceola Mills borough
According to the poverty statistics in Osceola Mills borough, males aged 12 to 14 years and females aged 6 to 11 years are the age groups that are most secure financially, with 100.0% of males and 100.0% of females in these age groups living above the poverty line.
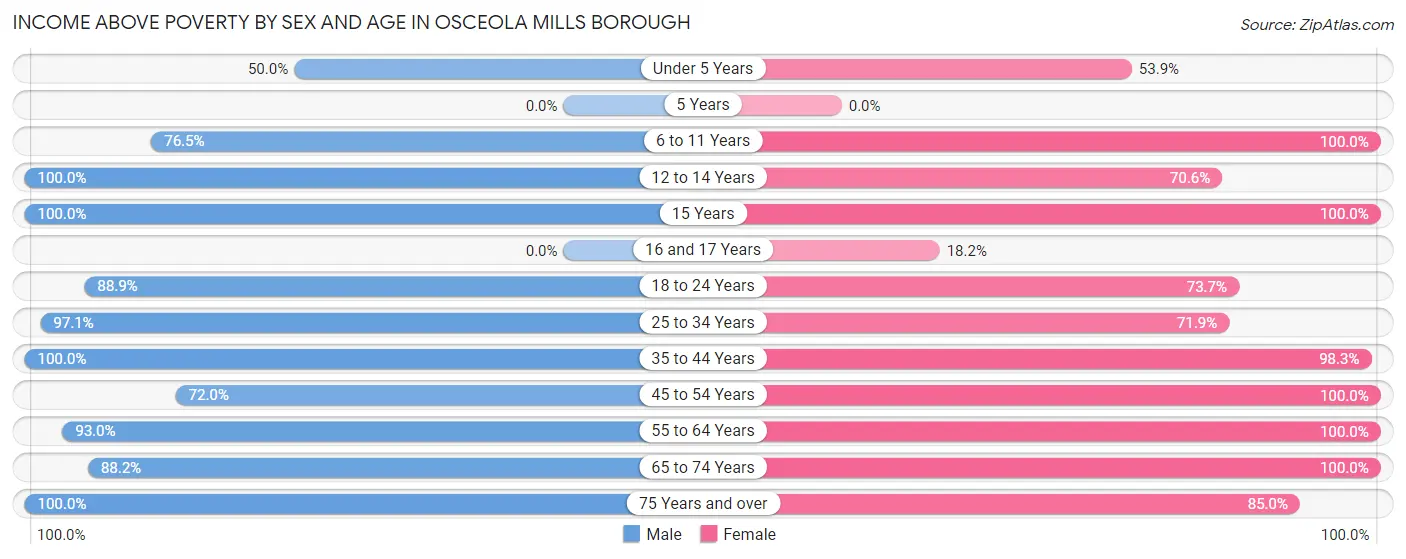
| Age Bracket | Male | Female |
| Under 5 Years | 10 (50.0%) | 21 (53.8%) |
| 5 Years | 0 (0.0%) | 0 (0.0%) |
| 6 to 11 Years | 26 (76.5%) | 28 (100.0%) |
| 12 to 14 Years | 3 (100.0%) | 24 (70.6%) |
| 15 Years | 11 (100.0%) | 15 (100.0%) |
| 16 and 17 Years | 0 (0.0%) | 2 (18.2%) |
| 18 to 24 Years | 40 (88.9%) | 28 (73.7%) |
| 25 to 34 Years | 66 (97.1%) | 46 (71.9%) |
| 35 to 44 Years | 81 (100.0%) | 113 (98.3%) |
| 45 to 54 Years | 77 (72.0%) | 82 (100.0%) |
| 55 to 64 Years | 93 (93.0%) | 103 (100.0%) |
| 65 to 74 Years | 30 (88.2%) | 39 (100.0%) |
| 75 Years and over | 23 (100.0%) | 68 (85.0%) |
| Total | 460 (87.5%) | 569 (87.8%) |
Income Below Poverty Among Married-Couple Families in Osceola Mills borough
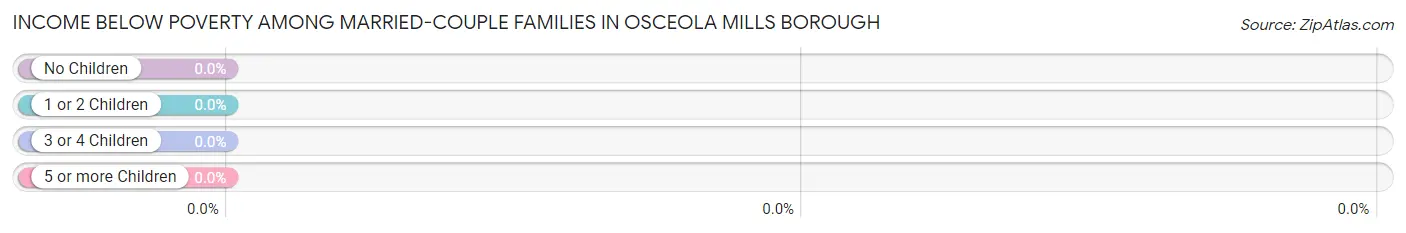
| Children | Above Poverty | Below Poverty |
| No Children | 105 (100.0%) | 0 (0.0%) |
| 1 or 2 Children | 66 (100.0%) | 0 (0.0%) |
| 3 or 4 Children | 2 (100.0%) | 0 (0.0%) |
| 5 or more Children | 0 (0.0%) | 0 (0.0%) |
| Total | 173 (100.0%) | 0 (0.0%) |
Income Below Poverty Among Single-Parent Households in Osceola Mills borough
According to the poverty data in Osceola Mills borough, 70.2% or 33 single-father households and 12.1% or 17 single-mother households are living below the poverty line. Among single-father households, those with 3 or 4 children have the highest poverty rate, with 27 households (100.0%) experiencing poverty. Likewise, among single-mother households, those with 1 or 2 children have the highest poverty rate, with 17 households (50.0%) falling below the poverty line.
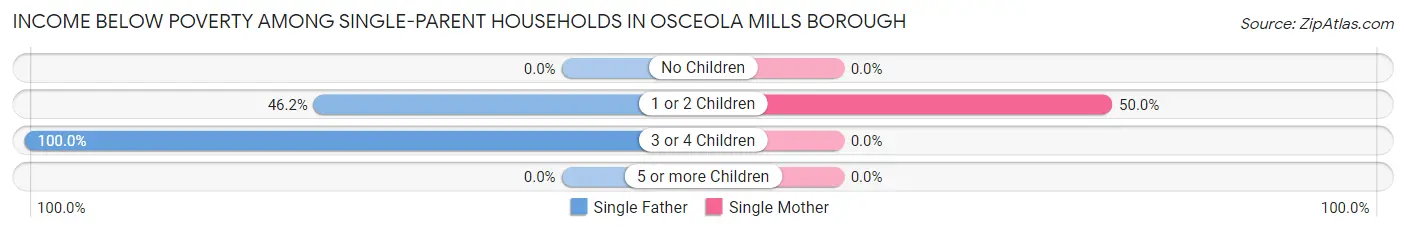
| Children | Single Father | Single Mother |
| No Children | 0 (0.0%) | 0 (0.0%) |
| 1 or 2 Children | 6 (46.2%) | 17 (50.0%) |
| 3 or 4 Children | 27 (100.0%) | 0 (0.0%) |
| 5 or more Children | 0 (0.0%) | 0 (0.0%) |
| Total | 33 (70.2%) | 17 (12.1%) |
Income Below Poverty Among Married-Couple vs Single-Parent Households in Osceola Mills borough
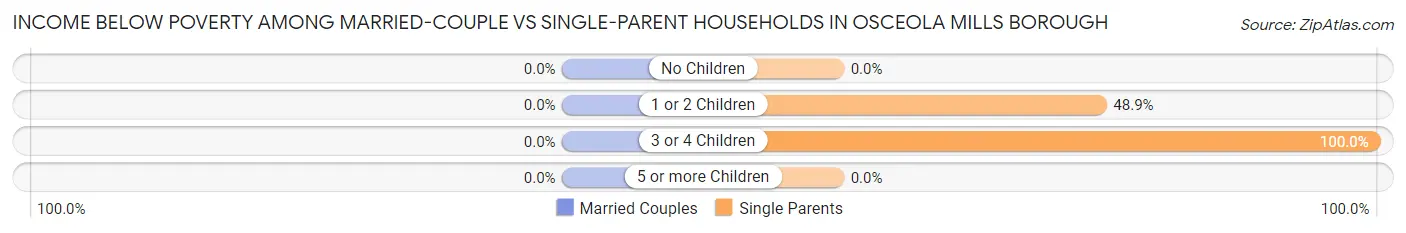
| Children | Married-Couple Families | Single-Parent Households |
| No Children | 0 (0.0%) | 0 (0.0%) |
| 1 or 2 Children | 0 (0.0%) | 23 (48.9%) |
| 3 or 4 Children | 0 (0.0%) | 27 (100.0%) |
| 5 or more Children | 0 (0.0%) | 0 (0.0%) |
| Total | 0 (0.0%) | 50 (26.6%) |
Race in Osceola Mills borough
The most populous races in Osceola Mills borough are White / Caucasian (1,126 | 95.8%), Hispanic or Latino (47 | 4.0%), and Some other Race (47 | 4.0%).
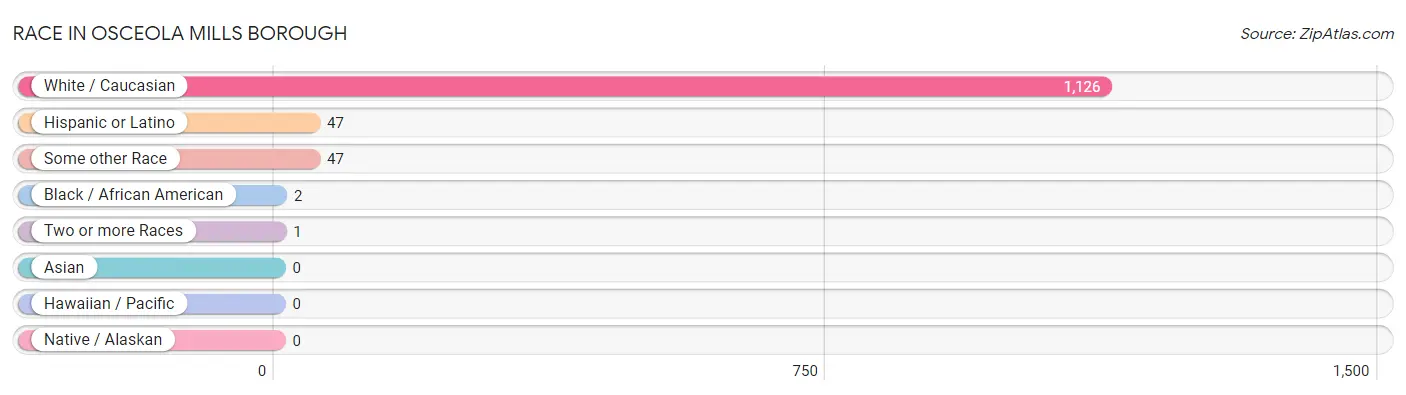
| Race | # Population | % Population |
| Asian | 0 | 0.0% |
| Black / African American | 2 | 0.2% |
| Hawaiian / Pacific | 0 | 0.0% |
| Hispanic or Latino | 47 | 4.0% |
| Native / Alaskan | 0 | 0.0% |
| White / Caucasian | 1,126 | 95.8% |
| Two or more Races | 1 | 0.1% |
| Some other Race | 47 | 4.0% |
| Total | 1,176 | 100.0% |
Ancestry in Osceola Mills borough
The most populous ancestries reported in Osceola Mills borough are German (280 | 23.8%), English (196 | 16.7%), Irish (165 | 14.0%), Polish (147 | 12.5%), and American (91 | 7.7%), together accounting for 74.8% of all Osceola Mills borough residents.
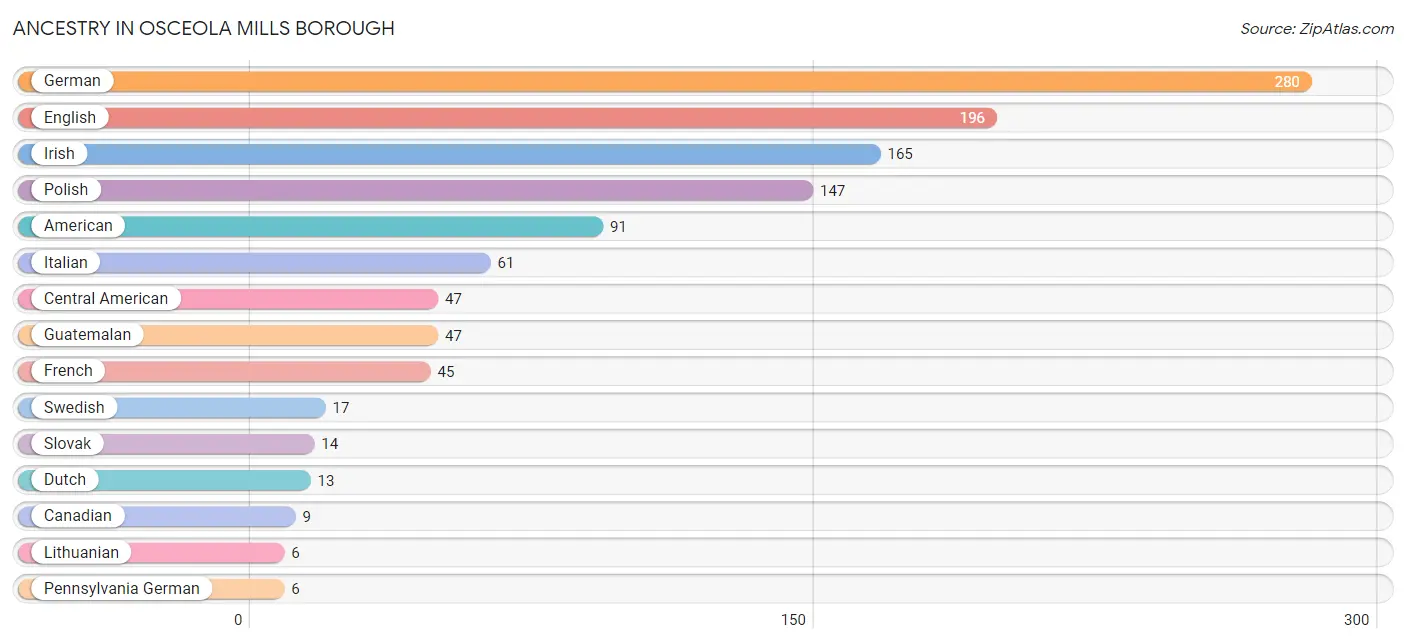
| Ancestry | # Population | % Population |
| American | 91 | 7.7% |
| Austrian | 4 | 0.3% |
| Canadian | 9 | 0.8% |
| Carpatho Rusyn | 3 | 0.3% |
| Central American | 47 | 4.0% |
| Dutch | 13 | 1.1% |
| English | 196 | 16.7% |
| European | 3 | 0.3% |
| French | 45 | 3.8% |
| French Canadian | 4 | 0.3% |
| German | 280 | 23.8% |
| Guatemalan | 47 | 4.0% |
| Irish | 165 | 14.0% |
| Italian | 61 | 5.2% |
| Latvian | 4 | 0.3% |
| Lithuanian | 6 | 0.5% |
| Norwegian | 3 | 0.3% |
| Pennsylvania German | 6 | 0.5% |
| Polish | 147 | 12.5% |
| Scottish | 3 | 0.3% |
| Slovak | 14 | 1.2% |
| Swedish | 17 | 1.5% |
| Swiss | 3 | 0.3% |
| Yugoslavian | 2 | 0.2% | View All 24 Rows |
Immigrants in Osceola Mills borough
The most numerous immigrant groups reported in Osceola Mills borough came from Central America (27 | 2.3%), Guatemala (27 | 2.3%), Latin America (27 | 2.3%), Eastern Europe (3 | 0.3%), and Europe (3 | 0.3%), together accounting for 7.4% of all Osceola Mills borough residents.
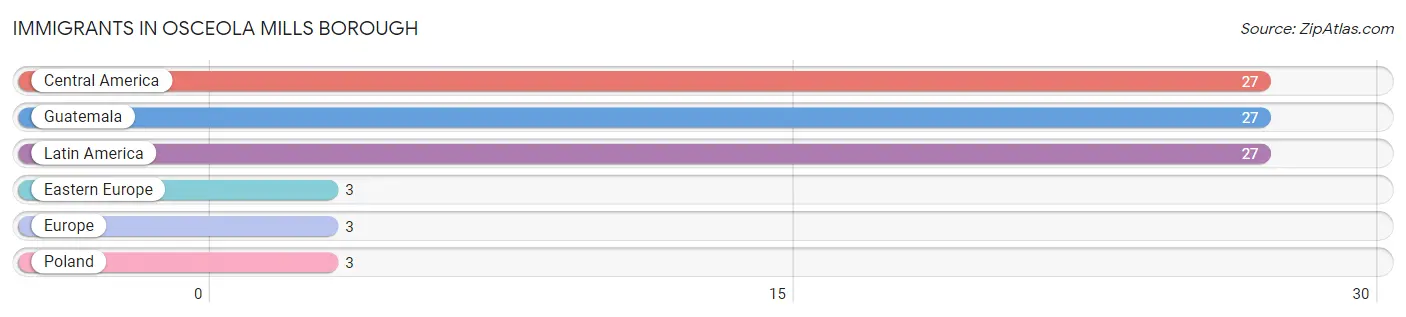
| Immigration Origin | # Population | % Population |
| Central America | 27 | 2.3% |
| Eastern Europe | 3 | 0.3% |
| Europe | 3 | 0.3% |
| Guatemala | 27 | 2.3% |
| Latin America | 27 | 2.3% |
| Poland | 3 | 0.3% | View All 6 Rows |
Sex and Age in Osceola Mills borough
Sex and Age in Osceola Mills borough
The most populous age groups in Osceola Mills borough are 55 to 59 Years (65 | 12.3%) for men and 35 to 39 Years (88 | 13.6%) for women.
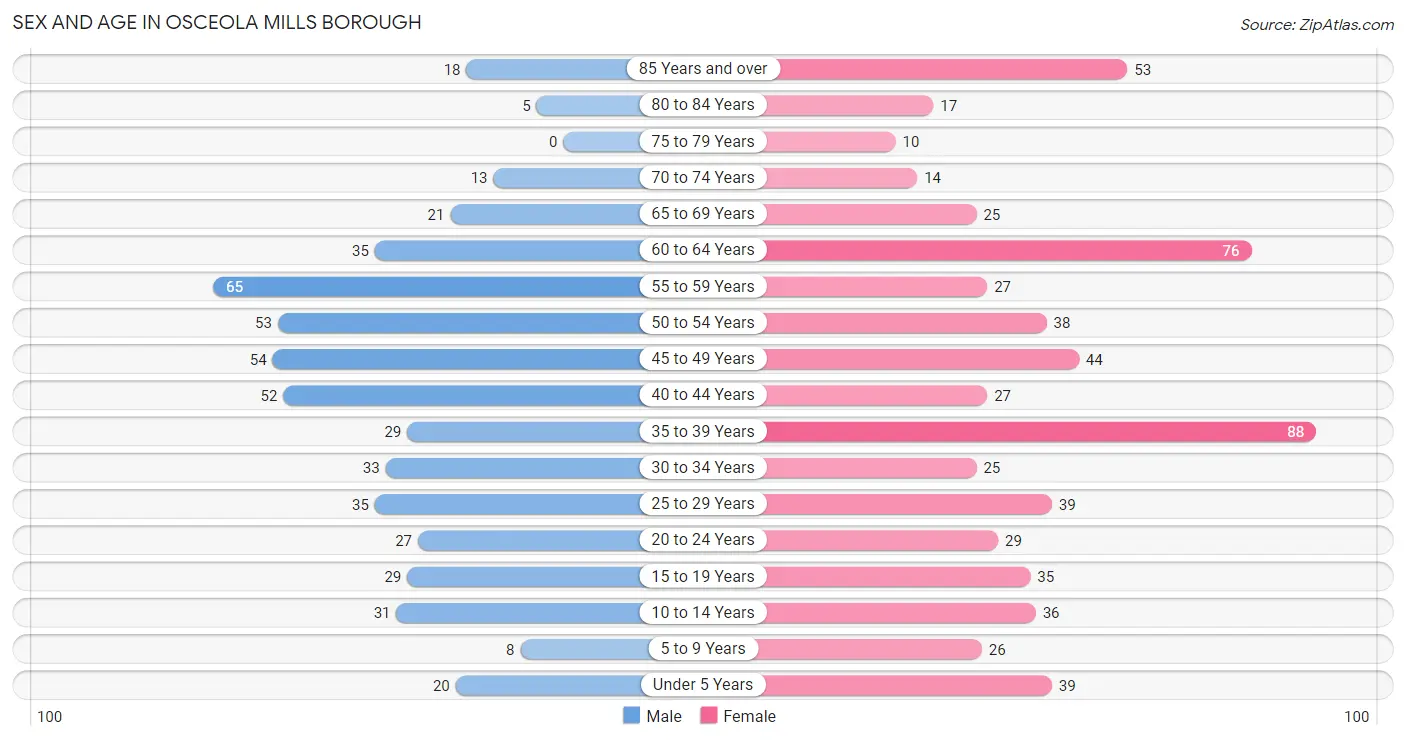
| Age Bracket | Male | Female |
| Under 5 Years | 20 (3.8%) | 39 (6.0%) |
| 5 to 9 Years | 8 (1.5%) | 26 (4.0%) |
| 10 to 14 Years | 31 (5.9%) | 36 (5.6%) |
| 15 to 19 Years | 29 (5.5%) | 35 (5.4%) |
| 20 to 24 Years | 27 (5.1%) | 29 (4.5%) |
| 25 to 29 Years | 35 (6.6%) | 39 (6.0%) |
| 30 to 34 Years | 33 (6.2%) | 25 (3.9%) |
| 35 to 39 Years | 29 (5.5%) | 88 (13.6%) |
| 40 to 44 Years | 52 (9.9%) | 27 (4.2%) |
| 45 to 49 Years | 54 (10.2%) | 44 (6.8%) |
| 50 to 54 Years | 53 (10.0%) | 38 (5.9%) |
| 55 to 59 Years | 65 (12.3%) | 27 (4.2%) |
| 60 to 64 Years | 35 (6.6%) | 76 (11.7%) |
| 65 to 69 Years | 21 (4.0%) | 25 (3.9%) |
| 70 to 74 Years | 13 (2.5%) | 14 (2.2%) |
| 75 to 79 Years | 0 (0.0%) | 10 (1.5%) |
| 80 to 84 Years | 5 (0.9%) | 17 (2.6%) |
| 85 Years and over | 18 (3.4%) | 53 (8.2%) |
| Total | 528 (100.0%) | 648 (100.0%) |
Families and Households in Osceola Mills borough
Median Family Size in Osceola Mills borough
The median family size in Osceola Mills borough is 2.70 persons per family, with married-couple families (173 | 47.9%) accounting for the largest median family size of 3.02 persons per family. On the other hand, single male/father families (47 | 13.0%) represent the smallest median family size with 2.09 persons per family.
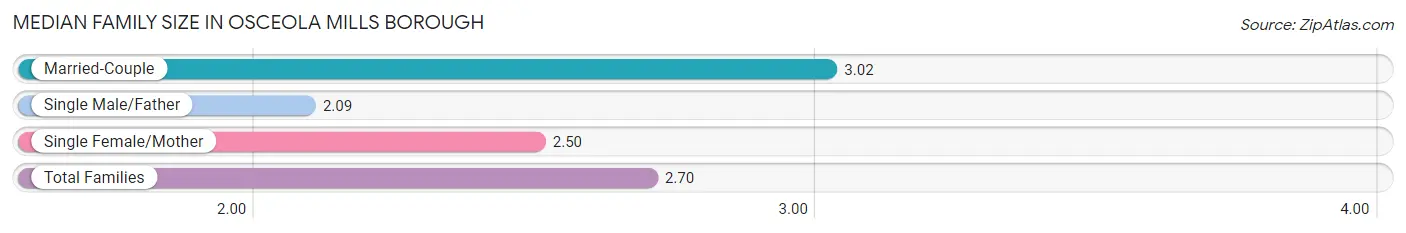
| Family Type | # Families | Family Size |
| Married-Couple | 173 (47.9%) | 3.02 |
| Single Male/Father | 47 (13.0%) | 2.09 |
| Single Female/Mother | 141 (39.1%) | 2.50 |
| Total Families | 361 (100.0%) | 2.70 |
Median Household Size in Osceola Mills borough
The median household size in Osceola Mills borough is 2.29 persons per household, with married-couple households (173 | 33.7%) accounting for the largest median household size of 3.02 persons per household. non-family households (152 | 29.6%) represent the smallest median household size with 1.14 persons per household.
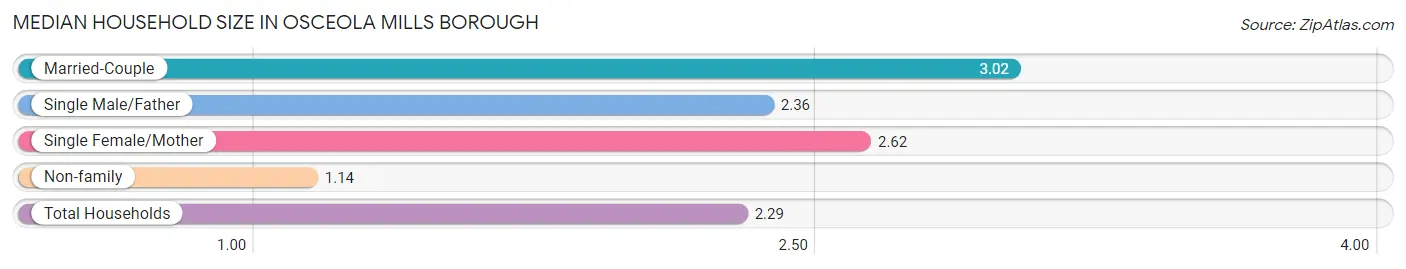
| Household Type | # Households | Household Size |
| Married-Couple | 173 (33.7%) | 3.02 |
| Single Male/Father | 47 (9.2%) | 2.36 |
| Single Female/Mother | 141 (27.5%) | 2.62 |
| Non-family | 152 (29.6%) | 1.14 |
| Total Households | 513 (100.0%) | 2.29 |
Household Size by Marriage Status in Osceola Mills borough
Out of a total of 513 households in Osceola Mills borough, 361 (70.4%) are family households, while 152 (29.6%) are nonfamily households. The most numerous type of family households are 2-person households, comprising 192, and the most common type of nonfamily households are 1-person households, comprising 134.
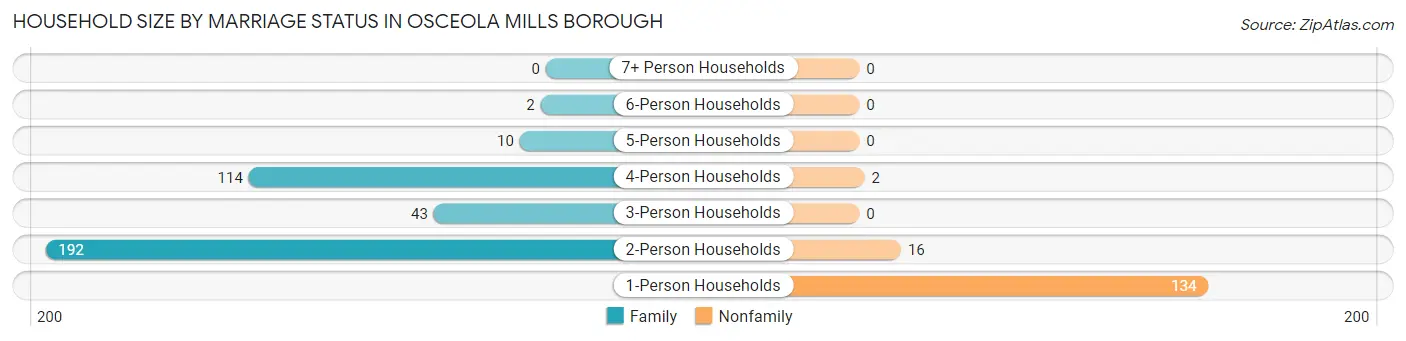
| Household Size | Family Households | Nonfamily Households |
| 1-Person Households | - | 134 (26.1%) |
| 2-Person Households | 192 (37.4%) | 16 (3.1%) |
| 3-Person Households | 43 (8.4%) | 0 (0.0%) |
| 4-Person Households | 114 (22.2%) | 2 (0.4%) |
| 5-Person Households | 10 (1.9%) | 0 (0.0%) |
| 6-Person Households | 2 (0.4%) | 0 (0.0%) |
| 7+ Person Households | 0 (0.0%) | 0 (0.0%) |
| Total | 361 (70.4%) | 152 (29.6%) |
Female Fertility in Osceola Mills borough
Fertility by Age in Osceola Mills borough
Average fertility rate in Osceola Mills borough is 110.0 births per 1,000 women. Women in the age bracket of 20 to 34 years have the highest fertility rate with 344.0 births per 1,000 women. Women in the age bracket of 20 to 34 years acount for 100.0% of all women with births.
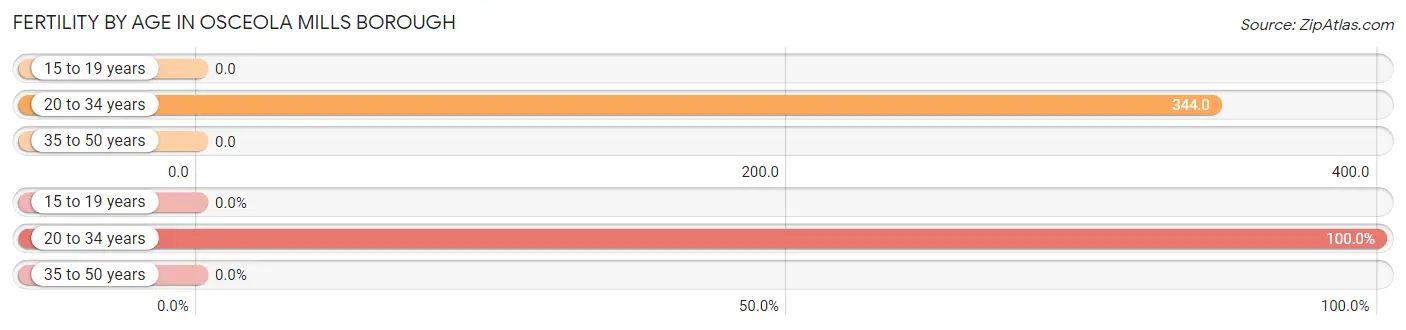
| Age Bracket | Women with Births | Births / 1,000 Women |
| 15 to 19 years | 0 (0.0%) | 0.0 |
| 20 to 34 years | 32 (100.0%) | 344.0 |
| 35 to 50 years | 0 (0.0%) | 0.0 |
| Total | 32 (100.0%) | 110.0 |
Fertility by Age by Marriage Status in Osceola Mills borough
87.5% of women with births (32) in Osceola Mills borough are married. The highest percentage of unmarried women with births falls into 20 to 34 years age bracket with 12.5% of them unmarried at the time of birth, while the lowest percentage of unmarried women with births belong to 20 to 34 years age bracket with 12.5% of them unmarried.
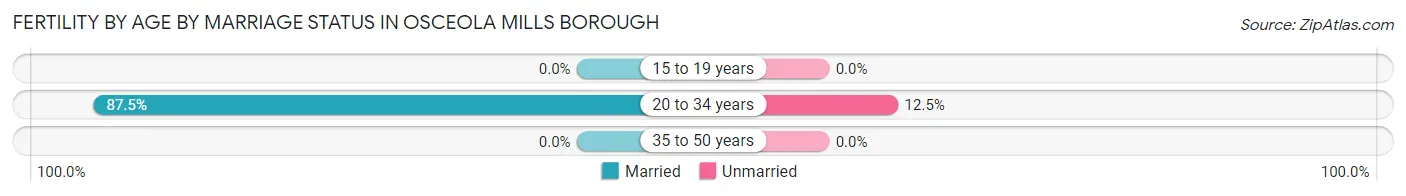
| Age Bracket | Married | Unmarried |
| 15 to 19 years | 0 (0.0%) | 0 (0.0%) |
| 20 to 34 years | 28 (87.5%) | 4 (12.5%) |
| 35 to 50 years | 0 (0.0%) | 0 (0.0%) |
| Total | 28 (87.5%) | 4 (12.5%) |
Fertility by Education in Osceola Mills borough
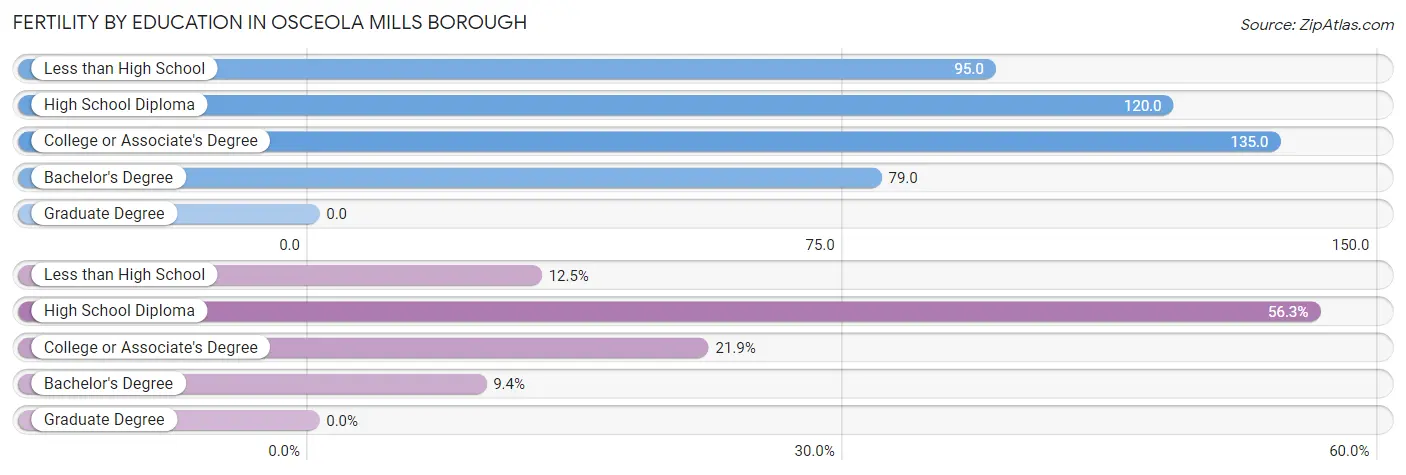
| Educational Attainment | Women with Births | Births / 1,000 Women |
| Less than High School | 4 (12.5%) | 95.0 |
| High School Diploma | 18 (56.2%) | 120.0 |
| College or Associate's Degree | 7 (21.9%) | 135.0 |
| Bachelor's Degree | 3 (9.4%) | 79.0 |
| Graduate Degree | 0 (0.0%) | 0.0 |
| Total | 32 (100.0%) | 110.0 |
Fertility by Education by Marriage Status in Osceola Mills borough
12.5% of women with births in Osceola Mills borough are unmarried. Women with the educational attainment of high school diploma are most likely to be married with 100.0% of them married at childbirth, while women with the educational attainment of less than high school are least likely to be married with 100.0% of them unmarried at childbirth.
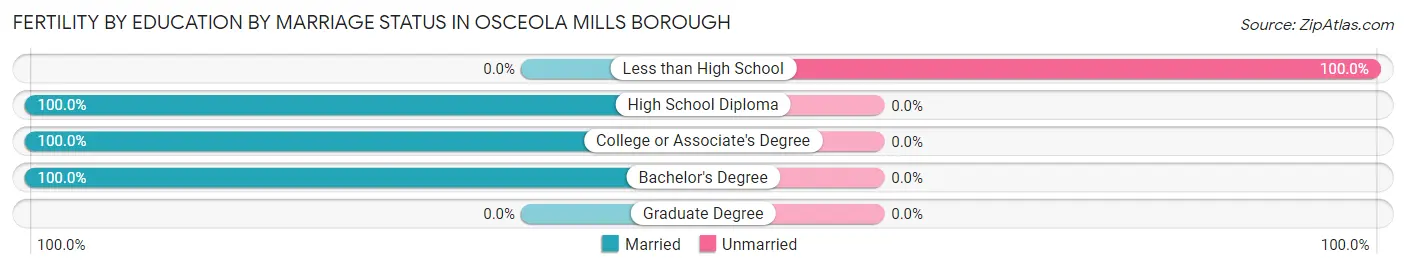
| Educational Attainment | Married | Unmarried |
| Less than High School | 0 (0.0%) | 4 (100.0%) |
| High School Diploma | 18 (100.0%) | 0 (0.0%) |
| College or Associate's Degree | 7 (100.0%) | 0 (0.0%) |
| Bachelor's Degree | 3 (100.0%) | 0 (0.0%) |
| Graduate Degree | 0 (0.0%) | 0 (0.0%) |
| Total | 28 (87.5%) | 4 (12.5%) |
Employment Characteristics in Osceola Mills borough
Employment by Class of Employer in Osceola Mills borough
Among the 491 employed individuals in Osceola Mills borough, private company employees (306 | 62.3%), not-for-profit organizations (65 | 13.2%), and self-employed (not incorporated) (44 | 9.0%) make up the most common classes of employment.
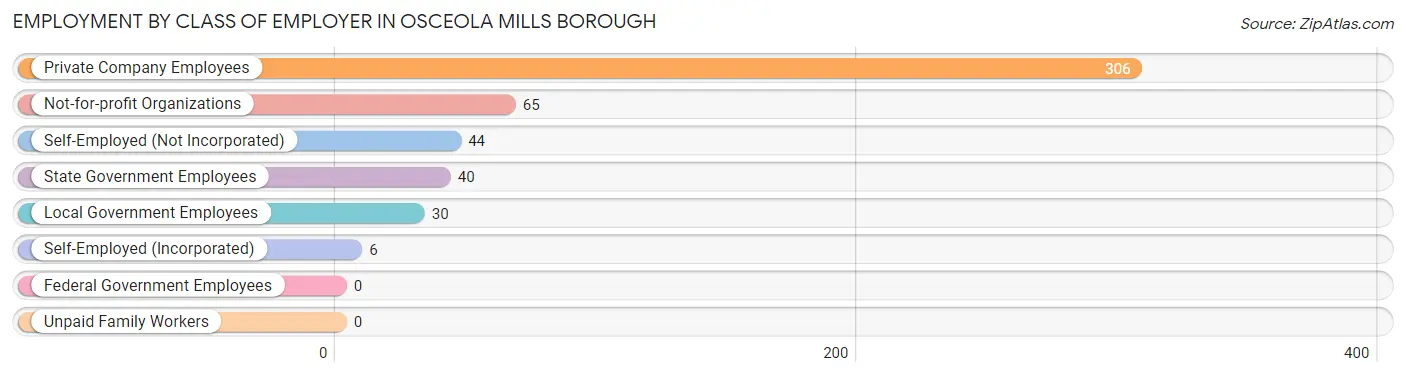
| Employer Class | # Employees | % Employees |
| Private Company Employees | 306 | 62.3% |
| Self-Employed (Incorporated) | 6 | 1.2% |
| Self-Employed (Not Incorporated) | 44 | 9.0% |
| Not-for-profit Organizations | 65 | 13.2% |
| Local Government Employees | 30 | 6.1% |
| State Government Employees | 40 | 8.2% |
| Federal Government Employees | 0 | 0.0% |
| Unpaid Family Workers | 0 | 0.0% |
| Total | 491 | 100.0% |
Employment Status by Age in Osceola Mills borough
According to the labor force statistics for Osceola Mills borough, out of the total population over 16 years of age (990), 53.6% or 531 individuals are in the labor force, with 7.5% or 40 of them unemployed. The age group with the highest labor force participation rate is 25 to 29 years, with 100.0% or 74 individuals in the labor force. Within the labor force, the 16 to 19 years age range has the highest percentage of unemployed individuals, with 30.4% or 7 of them being unemployed.
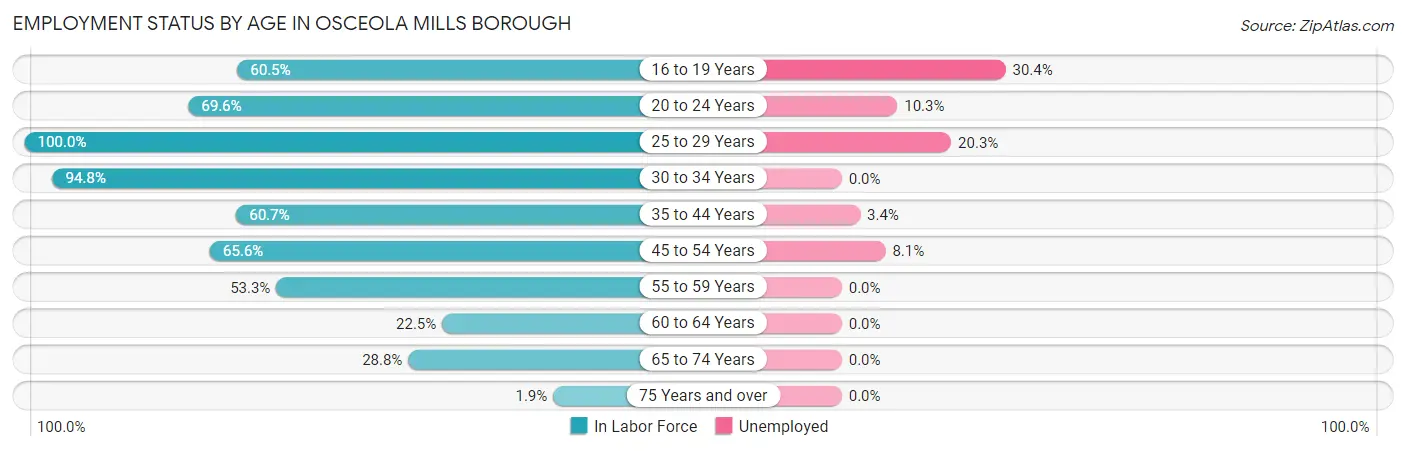
| Age Bracket | In Labor Force | Unemployed |
| 16 to 19 Years | 23 (60.5%) | 7 (30.4%) |
| 20 to 24 Years | 39 (69.6%) | 4 (10.3%) |
| 25 to 29 Years | 74 (100.0%) | 15 (20.3%) |
| 30 to 34 Years | 55 (94.8%) | 0 (0.0%) |
| 35 to 44 Years | 119 (60.7%) | 4 (3.4%) |
| 45 to 54 Years | 124 (65.6%) | 10 (8.1%) |
| 55 to 59 Years | 49 (53.3%) | 0 (0.0%) |
| 60 to 64 Years | 25 (22.5%) | 0 (0.0%) |
| 65 to 74 Years | 21 (28.8%) | 0 (0.0%) |
| 75 Years and over | 2 (1.9%) | 0 (0.0%) |
| Total | 531 (53.6%) | 40 (7.5%) |
Employment Status by Educational Attainment in Osceola Mills borough
According to labor force statistics for Osceola Mills borough, 61.9% of individuals (446) out of the total population between 25 and 64 years of age (720) are in the labor force, with 6.5% or 29 of them being unemployed. The group with the highest labor force participation rate are those with the educational attainment of college / associate degree, with 74.1% or 129 individuals in the labor force. Within the labor force, individuals with high school diploma education have the highest percentage of unemployment, with 10.8% or 24 of them being unemployed.
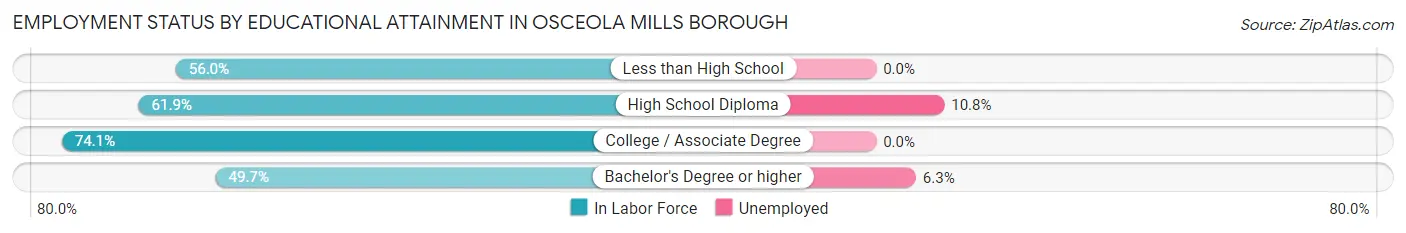
| Educational Attainment | In Labor Force | Unemployed |
| Less than High School | 14 (56.0%) | 0 (0.0%) |
| High School Diploma | 223 (61.9%) | 39 (10.8%) |
| College / Associate Degree | 129 (74.1%) | 0 (0.0%) |
| Bachelor's Degree or higher | 80 (49.7%) | 10 (6.3%) |
| Total | 446 (61.9%) | 47 (6.5%) |
Employment Occupations by Sex in Osceola Mills borough
Management, Business, Science and Arts Occupations
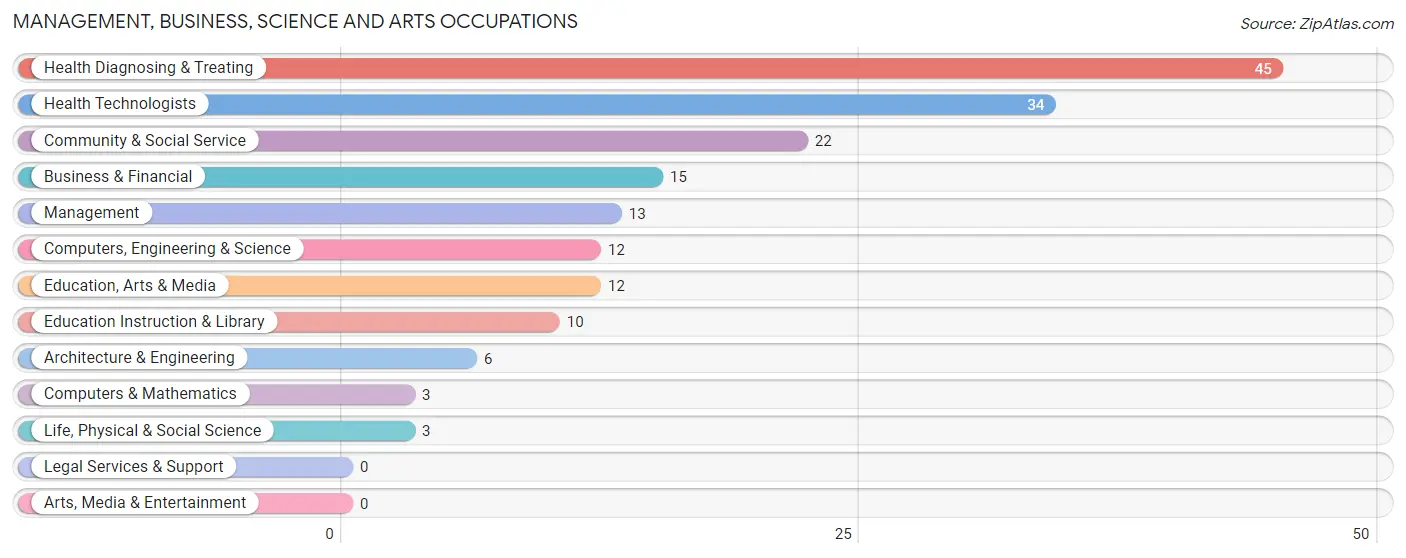
The most common Management, Business, Science and Arts occupations in Osceola Mills borough are Health Diagnosing & Treating (45 | 9.2%), Health Technologists (34 | 6.9%), Community & Social Service (22 | 4.5%), Business & Financial (15 | 3.0%), and Management (13 | 2.6%).
Management, Business, Science and Arts Occupations by Sex
Within the Management, Business, Science and Arts occupations in Osceola Mills borough, the most male-oriented occupations are Architecture & Engineering (100.0%), Life, Physical & Social Science (100.0%), and Education, Arts & Media (100.0%), while the most female-oriented occupations are Computers & Mathematics (100.0%), Education Instruction & Library (100.0%), and Business & Financial (80.0%).
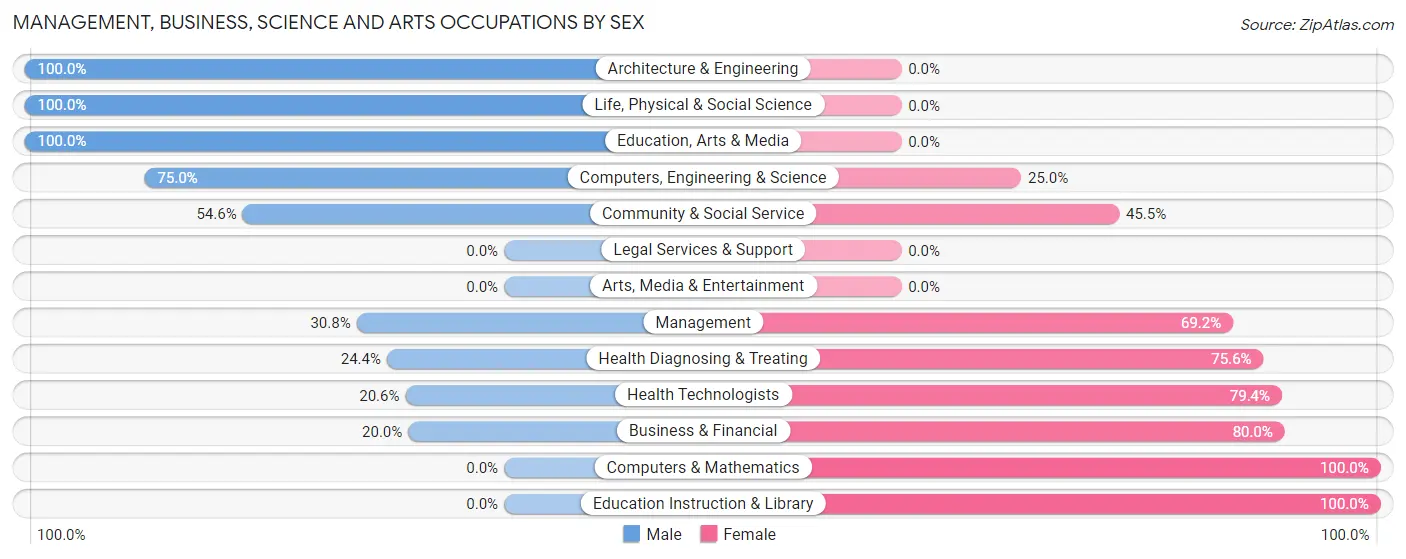
| Occupation | Male | Female |
| Management | 4 (30.8%) | 9 (69.2%) |
| Business & Financial | 3 (20.0%) | 12 (80.0%) |
| Computers, Engineering & Science | 9 (75.0%) | 3 (25.0%) |
| Computers & Mathematics | 0 (0.0%) | 3 (100.0%) |
| Architecture & Engineering | 6 (100.0%) | 0 (0.0%) |
| Life, Physical & Social Science | 3 (100.0%) | 0 (0.0%) |
| Community & Social Service | 12 (54.5%) | 10 (45.5%) |
| Education, Arts & Media | 12 (100.0%) | 0 (0.0%) |
| Legal Services & Support | 0 (0.0%) | 0 (0.0%) |
| Education Instruction & Library | 0 (0.0%) | 10 (100.0%) |
| Arts, Media & Entertainment | 0 (0.0%) | 0 (0.0%) |
| Health Diagnosing & Treating | 11 (24.4%) | 34 (75.6%) |
| Health Technologists | 7 (20.6%) | 27 (79.4%) |
| Total (Category) | 39 (36.4%) | 68 (63.5%) |
| Total (Overall) | 265 (54.0%) | 226 (46.0%) |
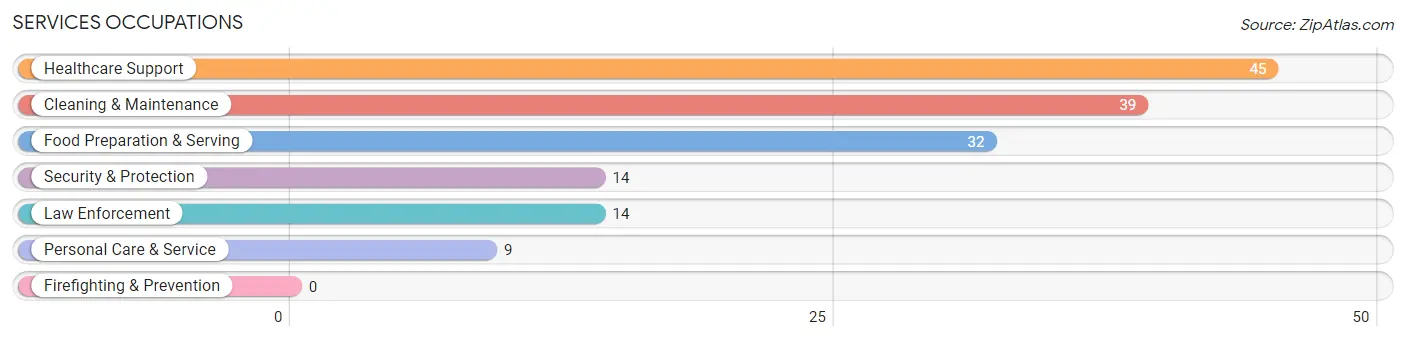
Services Occupations
The most common Services occupations in Osceola Mills borough are Healthcare Support (45 | 9.2%), Cleaning & Maintenance (39 | 7.9%), Food Preparation & Serving (32 | 6.5%), Security & Protection (14 | 2.9%), and Law Enforcement (14 | 2.9%).
Services Occupations by Sex
Within the Services occupations in Osceola Mills borough, the most male-oriented occupations are Security & Protection (100.0%), Law Enforcement (100.0%), and Food Preparation & Serving (84.4%), while the most female-oriented occupations are Healthcare Support (93.3%), Personal Care & Service (77.8%), and Cleaning & Maintenance (28.2%).
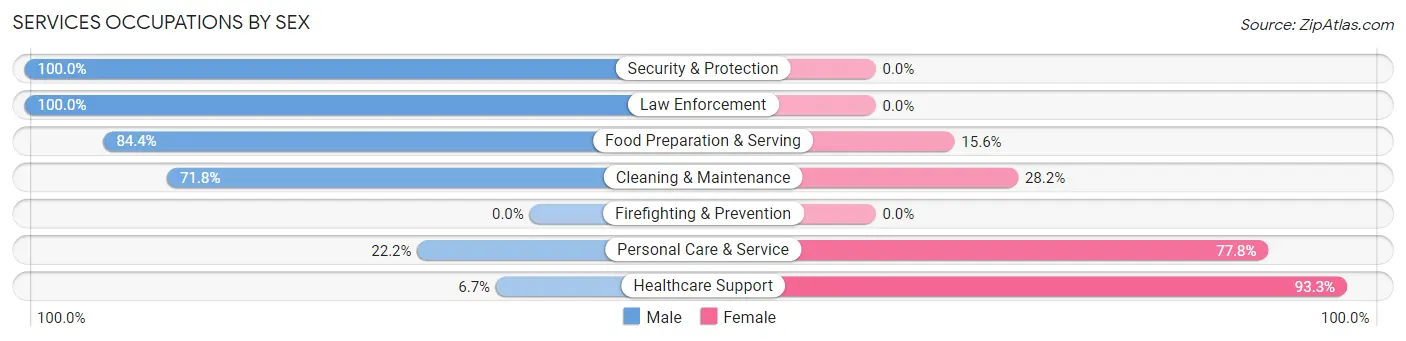
| Occupation | Male | Female |
| Healthcare Support | 3 (6.7%) | 42 (93.3%) |
| Security & Protection | 14 (100.0%) | 0 (0.0%) |
| Firefighting & Prevention | 0 (0.0%) | 0 (0.0%) |
| Law Enforcement | 14 (100.0%) | 0 (0.0%) |
| Food Preparation & Serving | 27 (84.4%) | 5 (15.6%) |
| Cleaning & Maintenance | 28 (71.8%) | 11 (28.2%) |
| Personal Care & Service | 2 (22.2%) | 7 (77.8%) |
| Total (Category) | 74 (53.2%) | 65 (46.8%) |
| Total (Overall) | 265 (54.0%) | 226 (46.0%) |
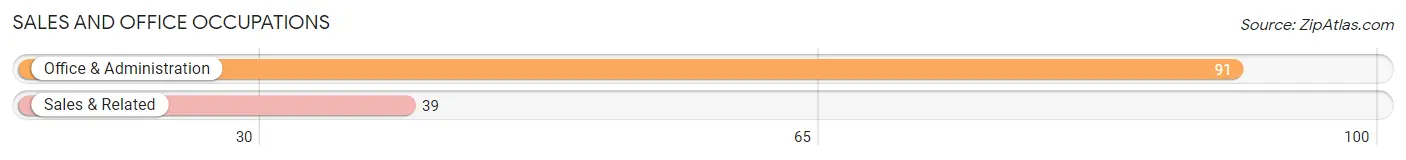
Sales and Office Occupations
The most common Sales and Office occupations in Osceola Mills borough are Office & Administration (91 | 18.5%), and Sales & Related (39 | 7.9%).
Sales and Office Occupations by Sex
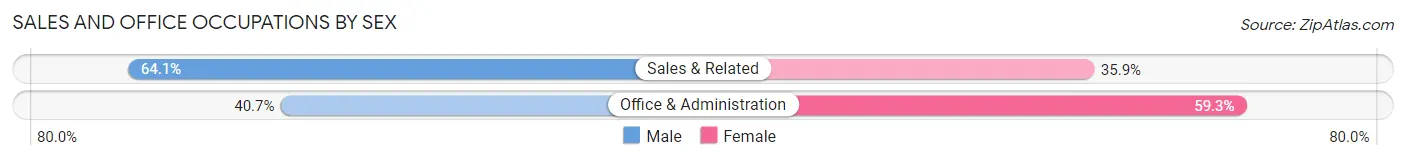
| Occupation | Male | Female |
| Sales & Related | 25 (64.1%) | 14 (35.9%) |
| Office & Administration | 37 (40.7%) | 54 (59.3%) |
| Total (Category) | 62 (47.7%) | 68 (52.3%) |
| Total (Overall) | 265 (54.0%) | 226 (46.0%) |
Natural Resources, Construction and Maintenance Occupations
The most common Natural Resources, Construction and Maintenance occupations in Osceola Mills borough are Installation, Maintenance & Repair (18 | 3.7%), and Construction & Extraction (15 | 3.0%).
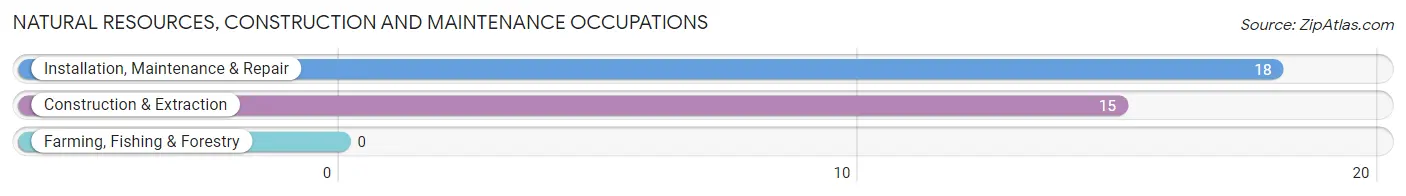
Natural Resources, Construction and Maintenance Occupations by Sex

| Occupation | Male | Female |
| Farming, Fishing & Forestry | 0 (0.0%) | 0 (0.0%) |
| Construction & Extraction | 13 (86.7%) | 2 (13.3%) |
| Installation, Maintenance & Repair | 14 (77.8%) | 4 (22.2%) |
| Total (Category) | 27 (81.8%) | 6 (18.2%) |
| Total (Overall) | 265 (54.0%) | 226 (46.0%) |
Production, Transportation and Moving Occupations
The most common Production, Transportation and Moving occupations in Osceola Mills borough are Production (42 | 8.6%), Material Moving (29 | 5.9%), and Transportation (11 | 2.2%).
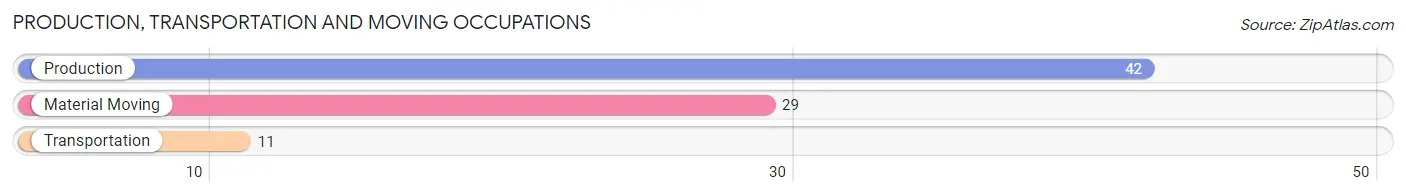
Production, Transportation and Moving Occupations by Sex
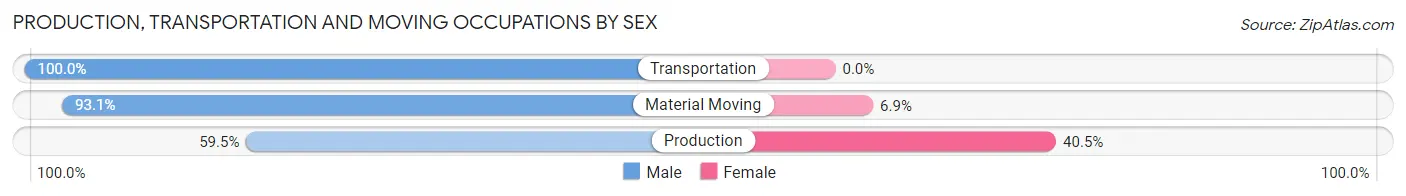
| Occupation | Male | Female |
| Production | 25 (59.5%) | 17 (40.5%) |
| Transportation | 11 (100.0%) | 0 (0.0%) |
| Material Moving | 27 (93.1%) | 2 (6.9%) |
| Total (Category) | 63 (76.8%) | 19 (23.2%) |
| Total (Overall) | 265 (54.0%) | 226 (46.0%) |
Employment Industries by Sex in Osceola Mills borough
Employment Industries in Osceola Mills borough
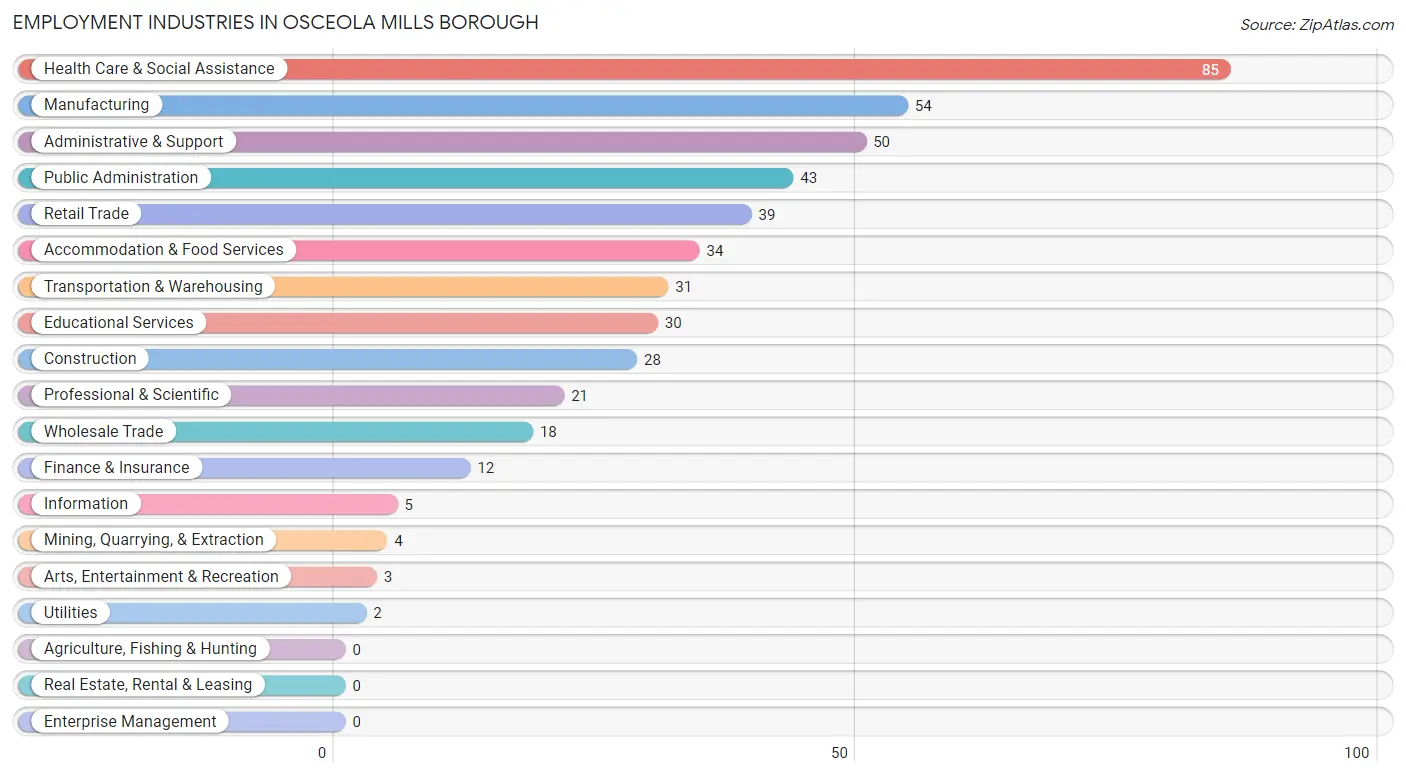
The major employment industries in Osceola Mills borough include Health Care & Social Assistance (85 | 17.3%), Manufacturing (54 | 11.0%), Administrative & Support (50 | 10.2%), Public Administration (43 | 8.8%), and Retail Trade (39 | 7.9%).
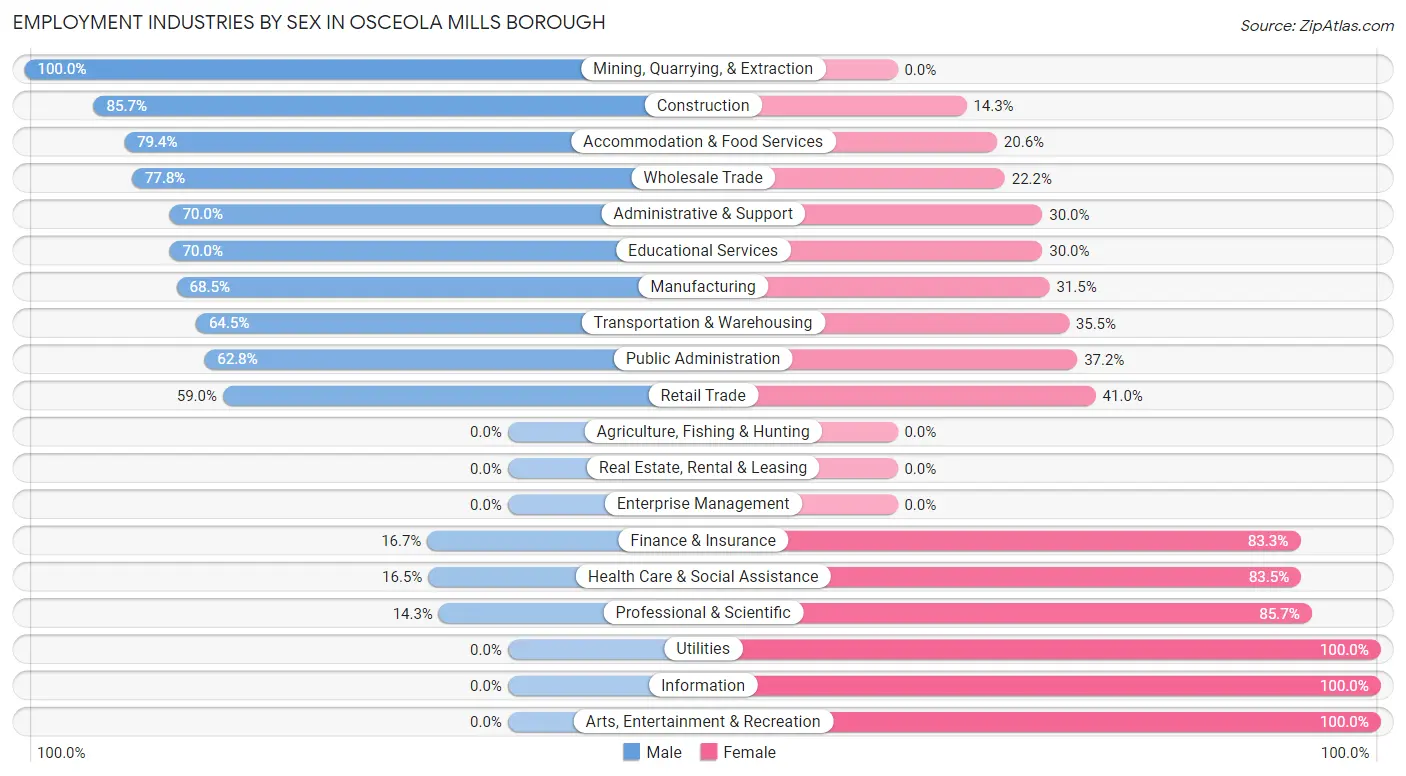
Employment Industries by Sex in Osceola Mills borough
The Osceola Mills borough industries that see more men than women are Mining, Quarrying, & Extraction (100.0%), Construction (85.7%), and Accommodation & Food Services (79.4%), whereas the industries that tend to have a higher number of women are Utilities (100.0%), Information (100.0%), and Arts, Entertainment & Recreation (100.0%).
| Industry | Male | Female |
| Agriculture, Fishing & Hunting | 0 (0.0%) | 0 (0.0%) |
| Mining, Quarrying, & Extraction | 4 (100.0%) | 0 (0.0%) |
| Construction | 24 (85.7%) | 4 (14.3%) |
| Manufacturing | 37 (68.5%) | 17 (31.5%) |
| Wholesale Trade | 14 (77.8%) | 4 (22.2%) |
| Retail Trade | 23 (59.0%) | 16 (41.0%) |
| Transportation & Warehousing | 20 (64.5%) | 11 (35.5%) |
| Utilities | 0 (0.0%) | 2 (100.0%) |
| Information | 0 (0.0%) | 5 (100.0%) |
| Finance & Insurance | 2 (16.7%) | 10 (83.3%) |
| Real Estate, Rental & Leasing | 0 (0.0%) | 0 (0.0%) |
| Professional & Scientific | 3 (14.3%) | 18 (85.7%) |
| Enterprise Management | 0 (0.0%) | 0 (0.0%) |
| Administrative & Support | 35 (70.0%) | 15 (30.0%) |
| Educational Services | 21 (70.0%) | 9 (30.0%) |
| Health Care & Social Assistance | 14 (16.5%) | 71 (83.5%) |
| Arts, Entertainment & Recreation | 0 (0.0%) | 3 (100.0%) |
| Accommodation & Food Services | 27 (79.4%) | 7 (20.6%) |
| Public Administration | 27 (62.8%) | 16 (37.2%) |
| Total | 265 (54.0%) | 226 (46.0%) |
Education in Osceola Mills borough
School Enrollment in Osceola Mills borough
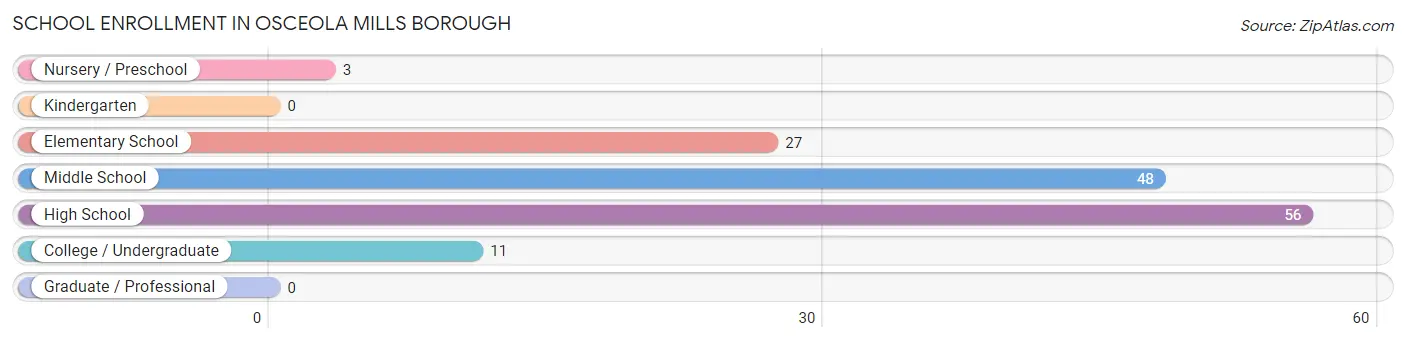
The most common levels of schooling among the 145 students in Osceola Mills borough are high school (56 | 38.6%), middle school (48 | 33.1%), and elementary school (27 | 18.6%).
| School Level | # Students | % Students |
| Nursery / Preschool | 3 | 2.1% |
| Kindergarten | 0 | 0.0% |
| Elementary School | 27 | 18.6% |
| Middle School | 48 | 33.1% |
| High School | 56 | 38.6% |
| College / Undergraduate | 11 | 7.6% |
| Graduate / Professional | 0 | 0.0% |
| Total | 145 | 100.0% |
School Enrollment by Age by Funding Source in Osceola Mills borough
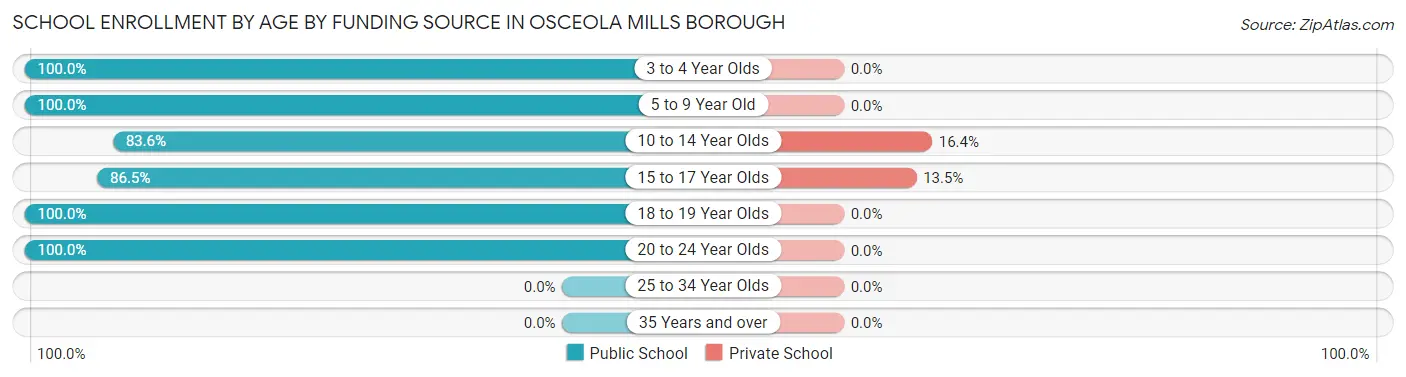
Out of a total of 145 students who are enrolled in schools in Osceola Mills borough, 16 (11.0%) attend a private institution, while the remaining 129 (89.0%) are enrolled in public schools. The age group of 10 to 14 year olds has the highest likelihood of being enrolled in private schools, with 11 (16.4% in the age bracket) enrolled. Conversely, the age group of 3 to 4 year olds has the lowest likelihood of being enrolled in a private school, with 3 (100.0% in the age bracket) attending a public institution.
| Age Bracket | Public School | Private School |
| 3 to 4 Year Olds | 3 (100.0%) | 0 (0.0%) |
| 5 to 9 Year Old | 23 (100.0%) | 0 (0.0%) |
| 10 to 14 Year Olds | 56 (83.6%) | 11 (16.4%) |
| 15 to 17 Year Olds | 32 (86.5%) | 5 (13.5%) |
| 18 to 19 Year Olds | 4 (100.0%) | 0 (0.0%) |
| 20 to 24 Year Olds | 11 (100.0%) | 0 (0.0%) |
| 25 to 34 Year Olds | 0 (0.0%) | 0 (0.0%) |
| 35 Years and over | 0 (0.0%) | 0 (0.0%) |
| Total | 129 (89.0%) | 16 (11.0%) |
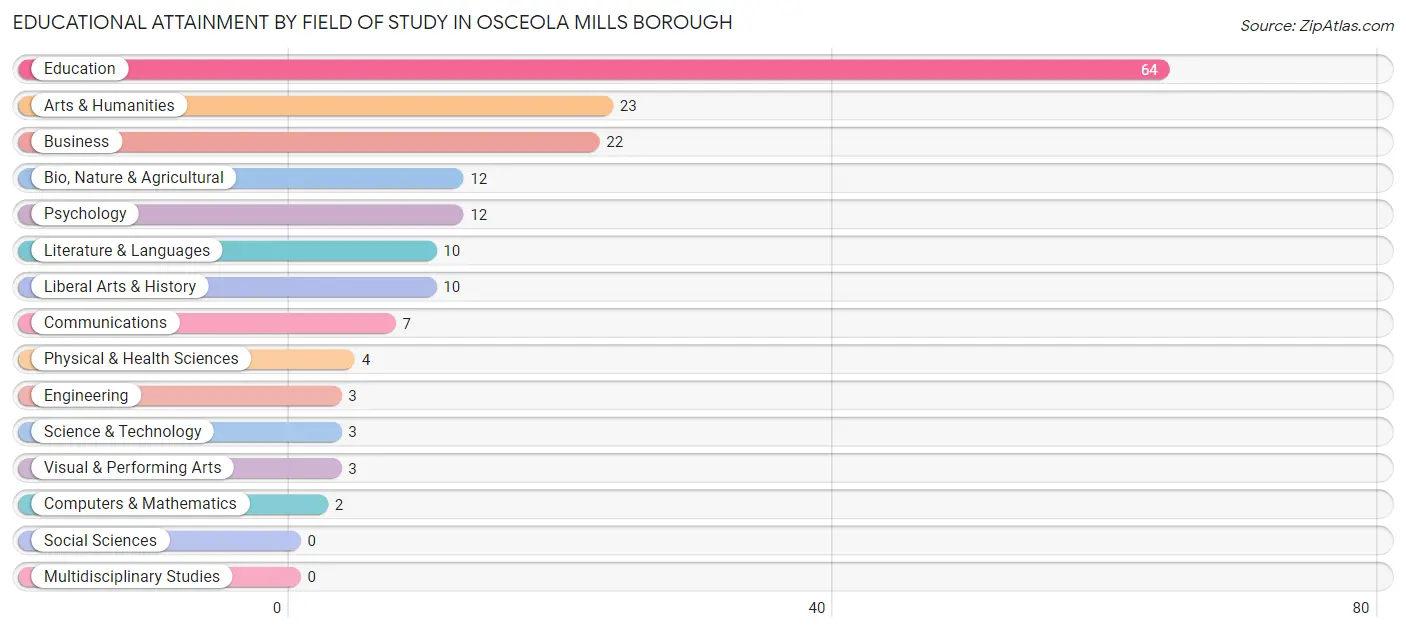
Educational Attainment by Field of Study in Osceola Mills borough
Education (64 | 36.6%), arts & humanities (23 | 13.1%), business (22 | 12.6%), bio, nature & agricultural (12 | 6.9%), and psychology (12 | 6.9%) are the most common fields of study among 175 individuals in Osceola Mills borough who have obtained a bachelor's degree or higher.
| Field of Study | # Graduates | % Graduates |
| Computers & Mathematics | 2 | 1.1% |
| Bio, Nature & Agricultural | 12 | 6.9% |
| Physical & Health Sciences | 4 | 2.3% |
| Psychology | 12 | 6.9% |
| Social Sciences | 0 | 0.0% |
| Engineering | 3 | 1.7% |
| Multidisciplinary Studies | 0 | 0.0% |
| Science & Technology | 3 | 1.7% |
| Business | 22 | 12.6% |
| Education | 64 | 36.6% |
| Literature & Languages | 10 | 5.7% |
| Liberal Arts & History | 10 | 5.7% |
| Visual & Performing Arts | 3 | 1.7% |
| Communications | 7 | 4.0% |
| Arts & Humanities | 23 | 13.1% |
| Total | 175 | 100.0% |
Transportation & Commute in Osceola Mills borough
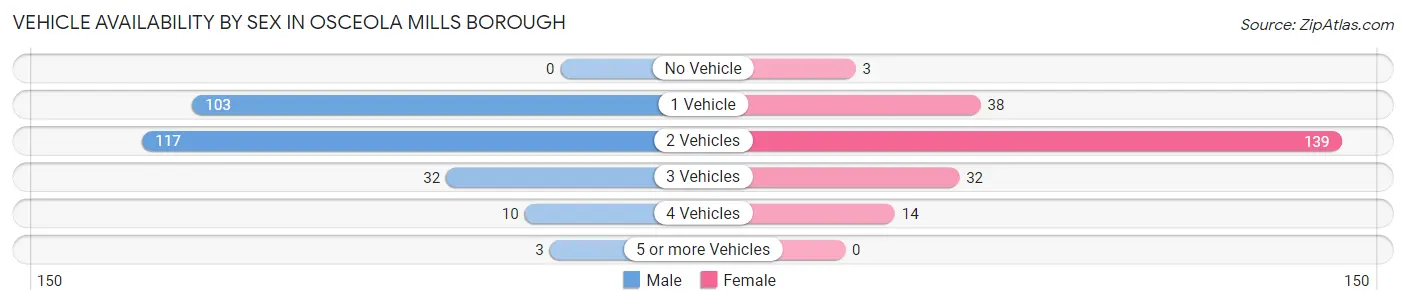
Vehicle Availability by Sex in Osceola Mills borough
The most prevalent vehicle ownership categories in Osceola Mills borough are males with 2 vehicles (117, accounting for 44.2%) and females with 2 vehicles (139, making up 51.8%).
| Vehicles Available | Male | Female |
| No Vehicle | 0 (0.0%) | 3 (1.3%) |
| 1 Vehicle | 103 (38.9%) | 38 (16.8%) |
| 2 Vehicles | 117 (44.2%) | 139 (61.5%) |
| 3 Vehicles | 32 (12.1%) | 32 (14.2%) |
| 4 Vehicles | 10 (3.8%) | 14 (6.2%) |
| 5 or more Vehicles | 3 (1.1%) | 0 (0.0%) |
| Total | 265 (100.0%) | 226 (100.0%) |
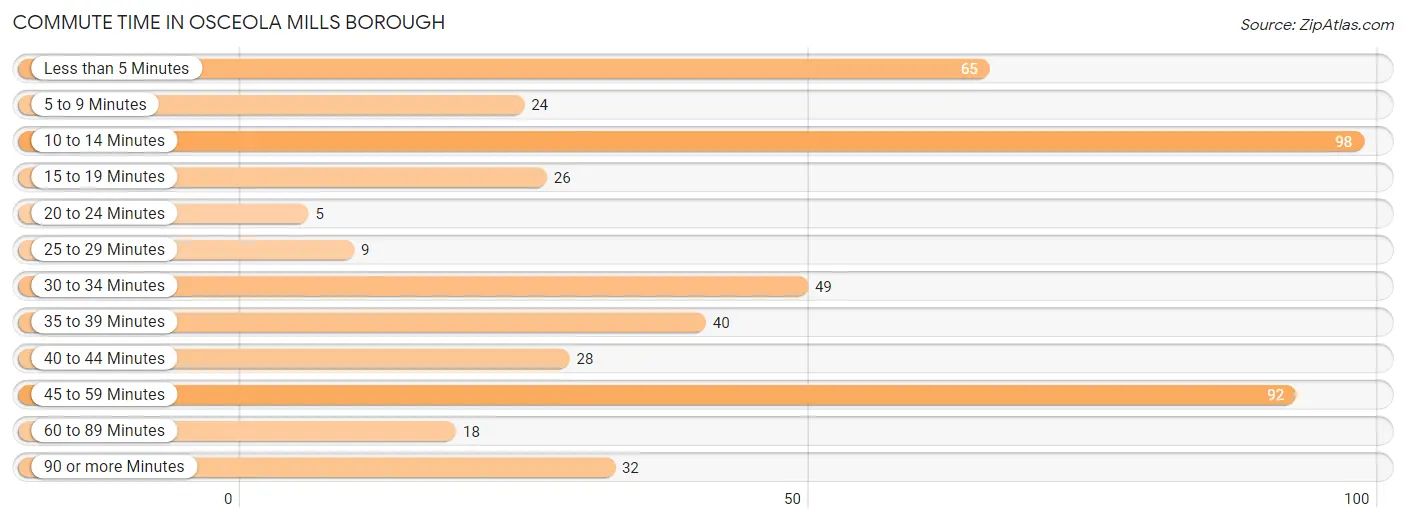
Commute Time in Osceola Mills borough
The most frequently occuring commute durations in Osceola Mills borough are 10 to 14 minutes (98 commuters, 20.2%), 45 to 59 minutes (92 commuters, 18.9%), and less than 5 minutes (65 commuters, 13.4%).
| Commute Time | # Commuters | % Commuters |
| Less than 5 Minutes | 65 | 13.4% |
| 5 to 9 Minutes | 24 | 4.9% |
| 10 to 14 Minutes | 98 | 20.2% |
| 15 to 19 Minutes | 26 | 5.3% |
| 20 to 24 Minutes | 5 | 1.0% |
| 25 to 29 Minutes | 9 | 1.8% |
| 30 to 34 Minutes | 49 | 10.1% |
| 35 to 39 Minutes | 40 | 8.2% |
| 40 to 44 Minutes | 28 | 5.8% |
| 45 to 59 Minutes | 92 | 18.9% |
| 60 to 89 Minutes | 18 | 3.7% |
| 90 or more Minutes | 32 | 6.6% |
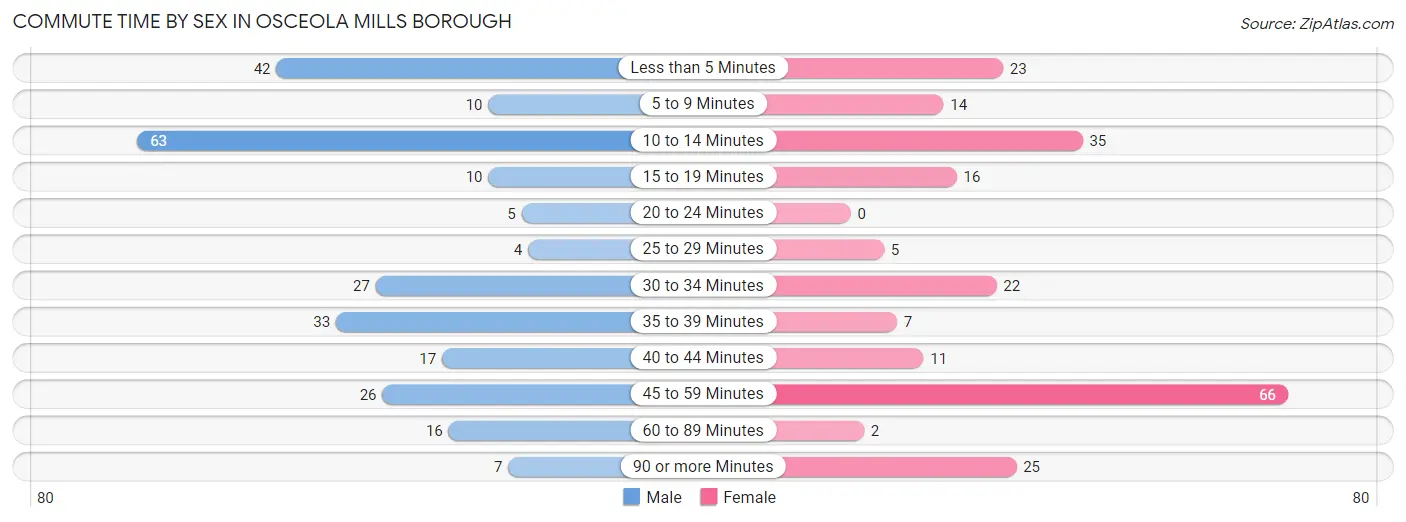
Commute Time by Sex in Osceola Mills borough
The most common commute times in Osceola Mills borough are 10 to 14 minutes (63 commuters, 24.2%) for males and 45 to 59 minutes (66 commuters, 29.2%) for females.
| Commute Time | Male | Female |
| Less than 5 Minutes | 42 (16.2%) | 23 (10.2%) |
| 5 to 9 Minutes | 10 (3.8%) | 14 (6.2%) |
| 10 to 14 Minutes | 63 (24.2%) | 35 (15.5%) |
| 15 to 19 Minutes | 10 (3.8%) | 16 (7.1%) |
| 20 to 24 Minutes | 5 (1.9%) | 0 (0.0%) |
| 25 to 29 Minutes | 4 (1.5%) | 5 (2.2%) |
| 30 to 34 Minutes | 27 (10.4%) | 22 (9.7%) |
| 35 to 39 Minutes | 33 (12.7%) | 7 (3.1%) |
| 40 to 44 Minutes | 17 (6.5%) | 11 (4.9%) |
| 45 to 59 Minutes | 26 (10.0%) | 66 (29.2%) |
| 60 to 89 Minutes | 16 (6.1%) | 2 (0.9%) |
| 90 or more Minutes | 7 (2.7%) | 25 (11.1%) |
Time of Departure to Work by Sex in Osceola Mills borough
The most frequent times of departure to work in Osceola Mills borough are 9:00 AM to 9:59 AM (47, 18.1%) for males and 7:30 AM to 7:59 AM (38, 16.8%) for females.
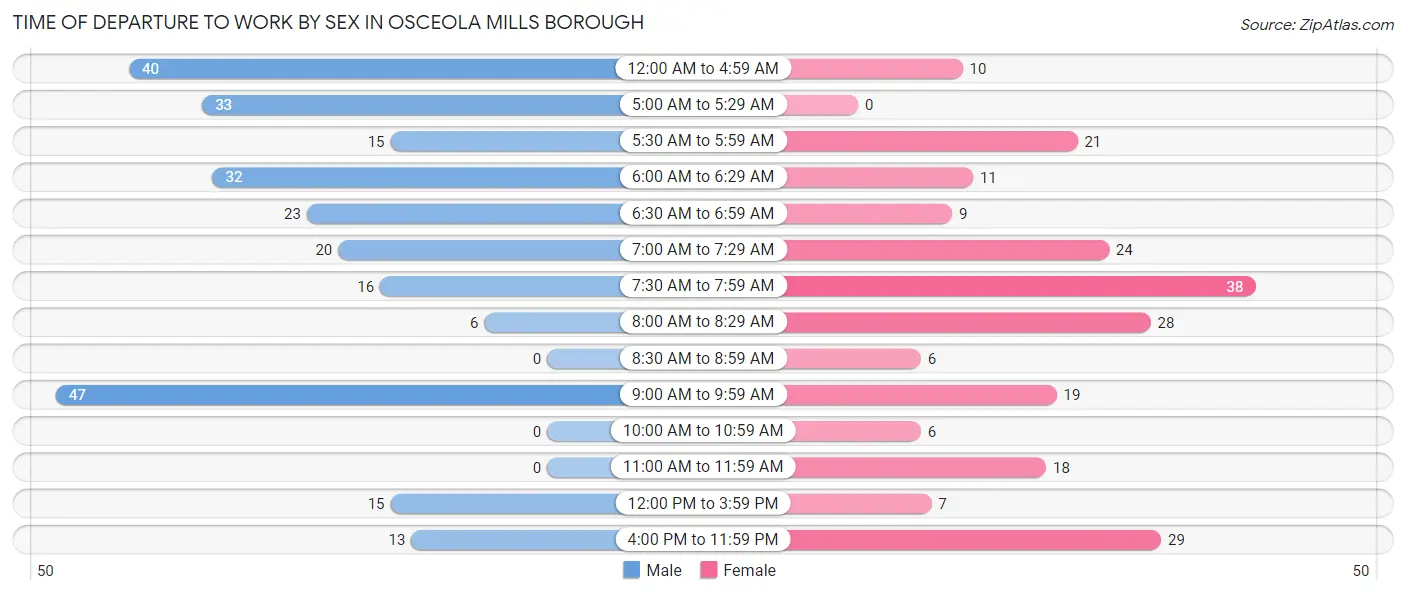
| Time of Departure | Male | Female |
| 12:00 AM to 4:59 AM | 40 (15.4%) | 10 (4.4%) |
| 5:00 AM to 5:29 AM | 33 (12.7%) | 0 (0.0%) |
| 5:30 AM to 5:59 AM | 15 (5.8%) | 21 (9.3%) |
| 6:00 AM to 6:29 AM | 32 (12.3%) | 11 (4.9%) |
| 6:30 AM to 6:59 AM | 23 (8.8%) | 9 (4.0%) |
| 7:00 AM to 7:29 AM | 20 (7.7%) | 24 (10.6%) |
| 7:30 AM to 7:59 AM | 16 (6.1%) | 38 (16.8%) |
| 8:00 AM to 8:29 AM | 6 (2.3%) | 28 (12.4%) |
| 8:30 AM to 8:59 AM | 0 (0.0%) | 6 (2.6%) |
| 9:00 AM to 9:59 AM | 47 (18.1%) | 19 (8.4%) |
| 10:00 AM to 10:59 AM | 0 (0.0%) | 6 (2.6%) |
| 11:00 AM to 11:59 AM | 0 (0.0%) | 18 (8.0%) |
| 12:00 PM to 3:59 PM | 15 (5.8%) | 7 (3.1%) |
| 4:00 PM to 11:59 PM | 13 (5.0%) | 29 (12.8%) |
| Total | 260 (100.0%) | 226 (100.0%) |
Housing Occupancy in Osceola Mills borough
Occupancy by Ownership in Osceola Mills borough
Of the total 513 dwellings in Osceola Mills borough, owner-occupied units account for 462 (90.1%), while renter-occupied units make up 51 (9.9%).
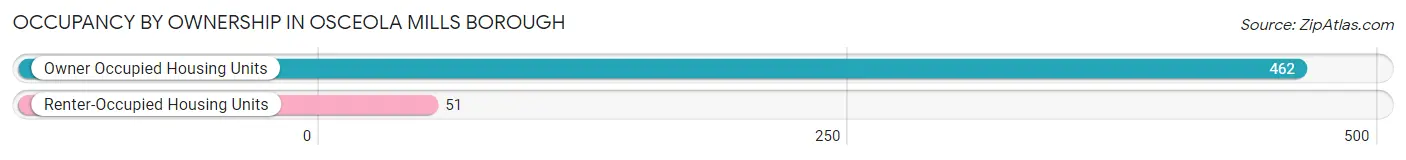
| Occupancy | # Housing Units | % Housing Units |
| Owner Occupied Housing Units | 462 | 90.1% |
| Renter-Occupied Housing Units | 51 | 9.9% |
| Total Occupied Housing Units | 513 | 100.0% |
Occupancy by Household Size in Osceola Mills borough
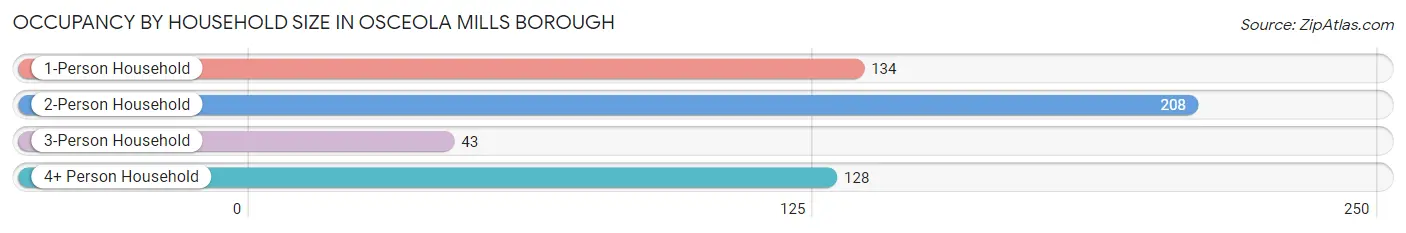
| Household Size | # Housing Units | % Housing Units |
| 1-Person Household | 134 | 26.1% |
| 2-Person Household | 208 | 40.6% |
| 3-Person Household | 43 | 8.4% |
| 4+ Person Household | 128 | 24.9% |
| Total Housing Units | 513 | 100.0% |
Occupancy by Ownership by Household Size in Osceola Mills borough
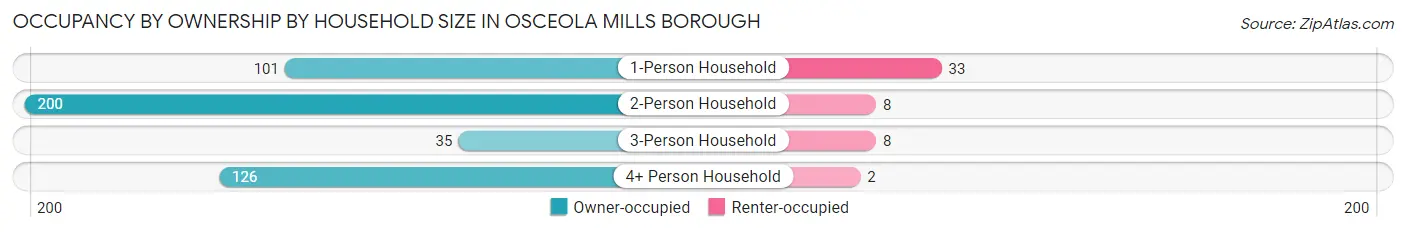
| Household Size | Owner-occupied | Renter-occupied |
| 1-Person Household | 101 (75.4%) | 33 (24.6%) |
| 2-Person Household | 200 (96.2%) | 8 (3.8%) |
| 3-Person Household | 35 (81.4%) | 8 (18.6%) |
| 4+ Person Household | 126 (98.4%) | 2 (1.6%) |
| Total Housing Units | 462 (90.1%) | 51 (9.9%) |
Occupancy by Educational Attainment in Osceola Mills borough
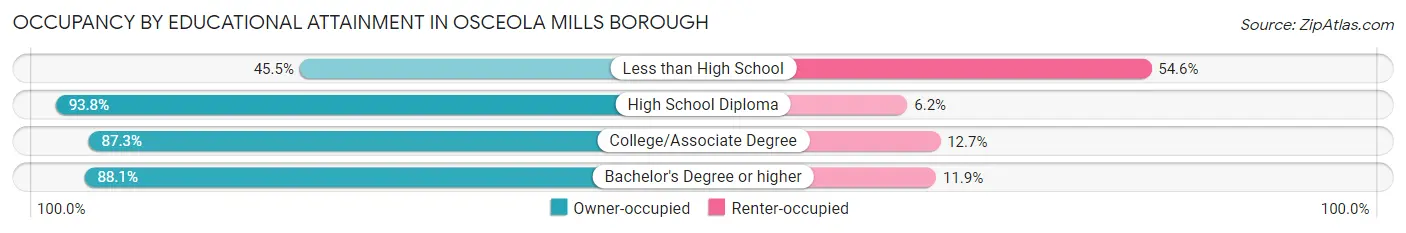
| Household Size | Owner-occupied | Renter-occupied |
| Less than High School | 5 (45.5%) | 6 (54.5%) |
| High School Diploma | 258 (93.8%) | 17 (6.2%) |
| College/Associate Degree | 110 (87.3%) | 16 (12.7%) |
| Bachelor's Degree or higher | 89 (88.1%) | 12 (11.9%) |
Occupancy by Age of Householder in Osceola Mills borough
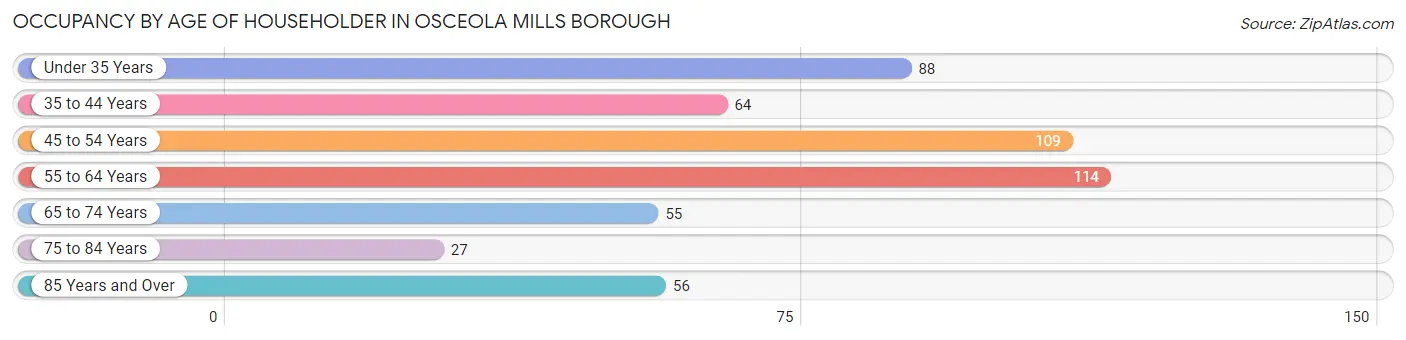
| Age Bracket | # Households | % Households |
| Under 35 Years | 88 | 17.2% |
| 35 to 44 Years | 64 | 12.5% |
| 45 to 54 Years | 109 | 21.2% |
| 55 to 64 Years | 114 | 22.2% |
| 65 to 74 Years | 55 | 10.7% |
| 75 to 84 Years | 27 | 5.3% |
| 85 Years and Over | 56 | 10.9% |
| Total | 513 | 100.0% |
Housing Finances in Osceola Mills borough
Median Income by Occupancy in Osceola Mills borough
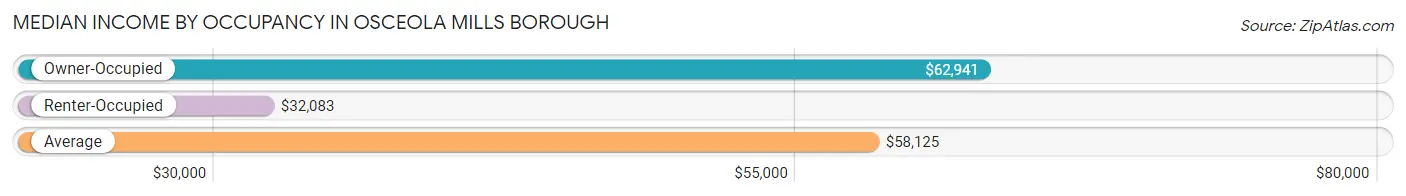
| Occupancy Type | # Households | Median Income |
| Owner-Occupied | 462 (90.1%) | $62,941 |
| Renter-Occupied | 51 (9.9%) | $32,083 |
| Average | 513 (100.0%) | $58,125 |
Occupancy by Householder Income Bracket in Osceola Mills borough
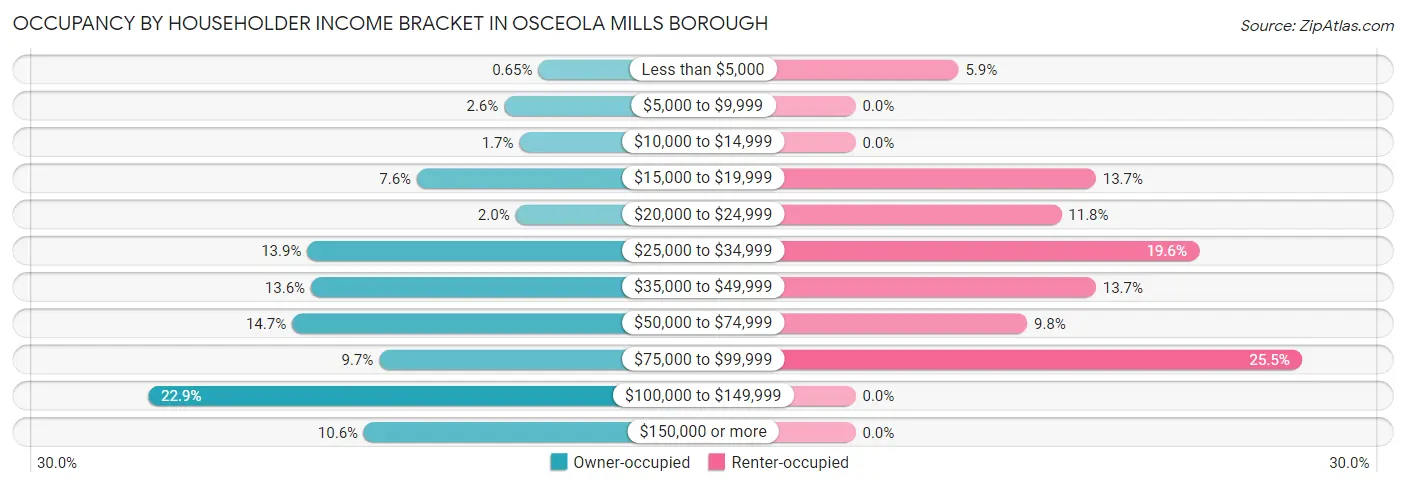
| Income Bracket | Owner-occupied | Renter-occupied |
| Less than $5,000 | 3 (0.6%) | 3 (5.9%) |
| $5,000 to $9,999 | 12 (2.6%) | 0 (0.0%) |
| $10,000 to $14,999 | 8 (1.7%) | 0 (0.0%) |
| $15,000 to $19,999 | 35 (7.6%) | 7 (13.7%) |
| $20,000 to $24,999 | 9 (1.9%) | 6 (11.8%) |
| $25,000 to $34,999 | 64 (13.9%) | 10 (19.6%) |
| $35,000 to $49,999 | 63 (13.6%) | 7 (13.7%) |
| $50,000 to $74,999 | 68 (14.7%) | 5 (9.8%) |
| $75,000 to $99,999 | 45 (9.7%) | 13 (25.5%) |
| $100,000 to $149,999 | 106 (22.9%) | 0 (0.0%) |
| $150,000 or more | 49 (10.6%) | 0 (0.0%) |
| Total | 462 (100.0%) | 51 (100.0%) |
Monthly Housing Cost Tiers in Osceola Mills borough
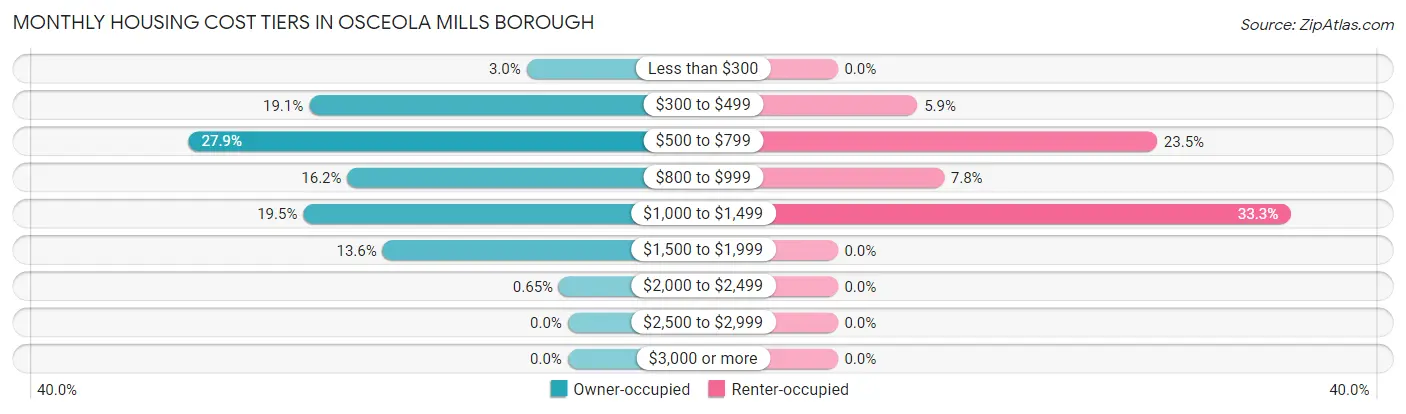
| Monthly Cost | Owner-occupied | Renter-occupied |
| Less than $300 | 14 (3.0%) | 0 (0.0%) |
| $300 to $499 | 88 (19.1%) | 3 (5.9%) |
| $500 to $799 | 129 (27.9%) | 12 (23.5%) |
| $800 to $999 | 75 (16.2%) | 4 (7.8%) |
| $1,000 to $1,499 | 90 (19.5%) | 17 (33.3%) |
| $1,500 to $1,999 | 63 (13.6%) | 0 (0.0%) |
| $2,000 to $2,499 | 3 (0.6%) | 0 (0.0%) |
| $2,500 to $2,999 | 0 (0.0%) | 0 (0.0%) |
| $3,000 or more | 0 (0.0%) | 0 (0.0%) |
| Total | 462 (100.0%) | 51 (100.0%) |
Physical Housing Characteristics in Osceola Mills borough
Housing Structures in Osceola Mills borough
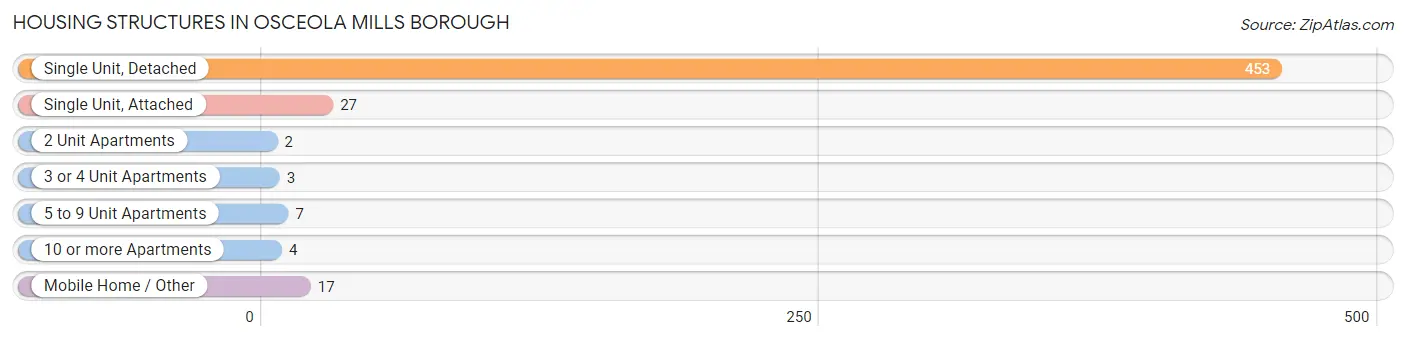
| Structure Type | # Housing Units | % Housing Units |
| Single Unit, Detached | 453 | 88.3% |
| Single Unit, Attached | 27 | 5.3% |
| 2 Unit Apartments | 2 | 0.4% |
| 3 or 4 Unit Apartments | 3 | 0.6% |
| 5 to 9 Unit Apartments | 7 | 1.4% |
| 10 or more Apartments | 4 | 0.8% |
| Mobile Home / Other | 17 | 3.3% |
| Total | 513 | 100.0% |
Housing Structures by Occupancy in Osceola Mills borough
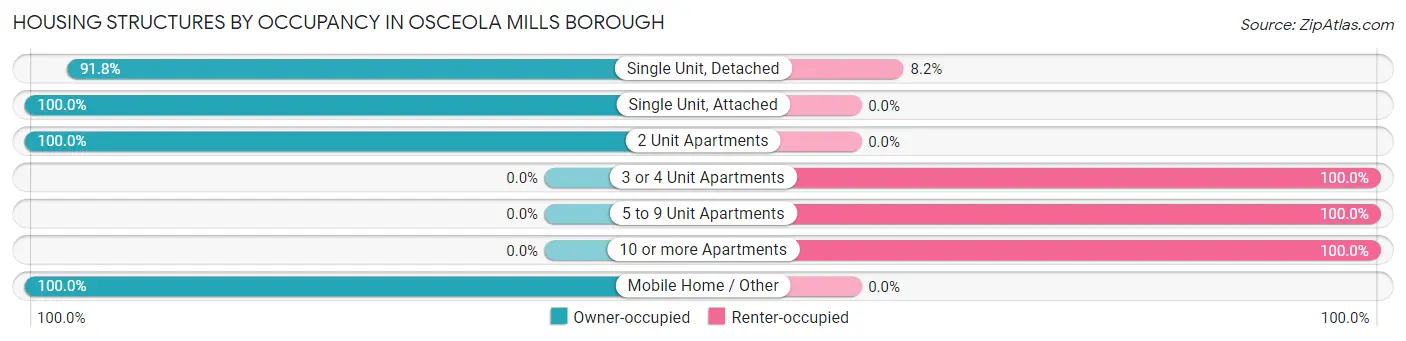
| Structure Type | Owner-occupied | Renter-occupied |
| Single Unit, Detached | 416 (91.8%) | 37 (8.2%) |
| Single Unit, Attached | 27 (100.0%) | 0 (0.0%) |
| 2 Unit Apartments | 2 (100.0%) | 0 (0.0%) |
| 3 or 4 Unit Apartments | 0 (0.0%) | 3 (100.0%) |
| 5 to 9 Unit Apartments | 0 (0.0%) | 7 (100.0%) |
| 10 or more Apartments | 0 (0.0%) | 4 (100.0%) |
| Mobile Home / Other | 17 (100.0%) | 0 (0.0%) |
| Total | 462 (90.1%) | 51 (9.9%) |
Housing Structures by Number of Rooms in Osceola Mills borough
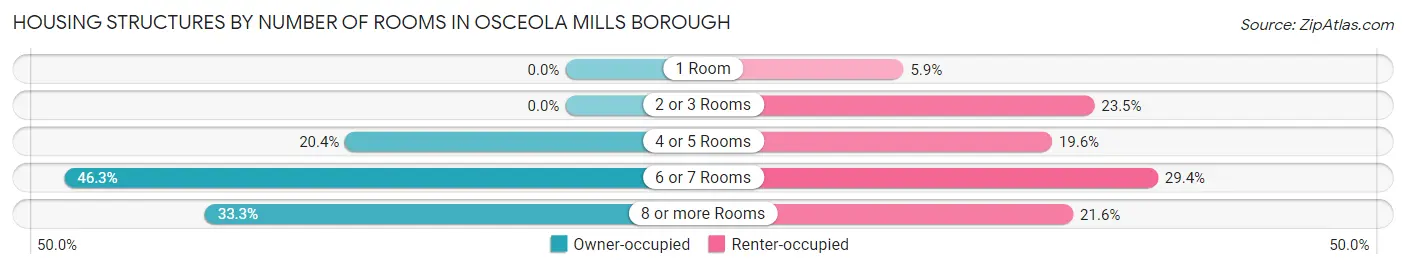
| Number of Rooms | Owner-occupied | Renter-occupied |
| 1 Room | 0 (0.0%) | 3 (5.9%) |
| 2 or 3 Rooms | 0 (0.0%) | 12 (23.5%) |
| 4 or 5 Rooms | 94 (20.3%) | 10 (19.6%) |
| 6 or 7 Rooms | 214 (46.3%) | 15 (29.4%) |
| 8 or more Rooms | 154 (33.3%) | 11 (21.6%) |
| Total | 462 (100.0%) | 51 (100.0%) |
Housing Structure by Heating Type in Osceola Mills borough
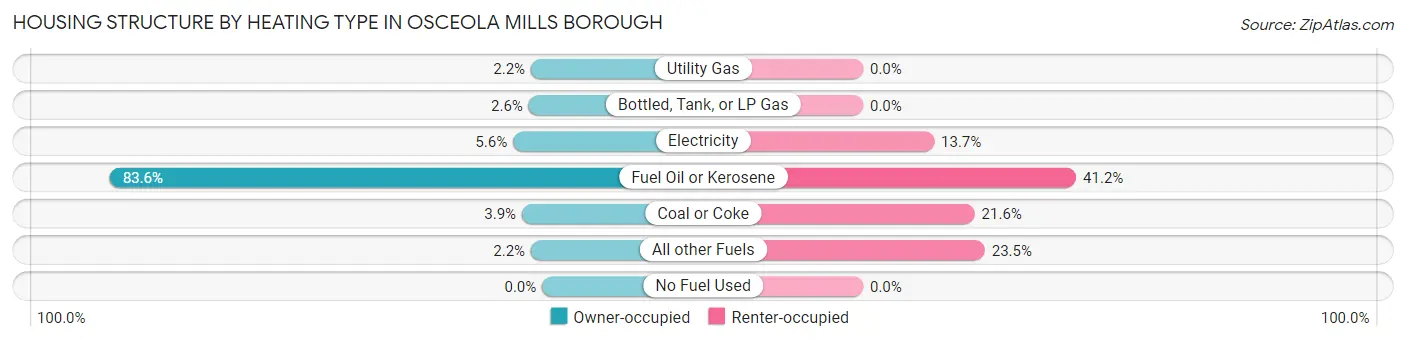
| Heating Type | Owner-occupied | Renter-occupied |
| Utility Gas | 10 (2.2%) | 0 (0.0%) |
| Bottled, Tank, or LP Gas | 12 (2.6%) | 0 (0.0%) |
| Electricity | 26 (5.6%) | 7 (13.7%) |
| Fuel Oil or Kerosene | 386 (83.6%) | 21 (41.2%) |
| Coal or Coke | 18 (3.9%) | 11 (21.6%) |
| All other Fuels | 10 (2.2%) | 12 (23.5%) |
| No Fuel Used | 0 (0.0%) | 0 (0.0%) |
| Total | 462 (100.0%) | 51 (100.0%) |
Household Vehicle Usage in Osceola Mills borough
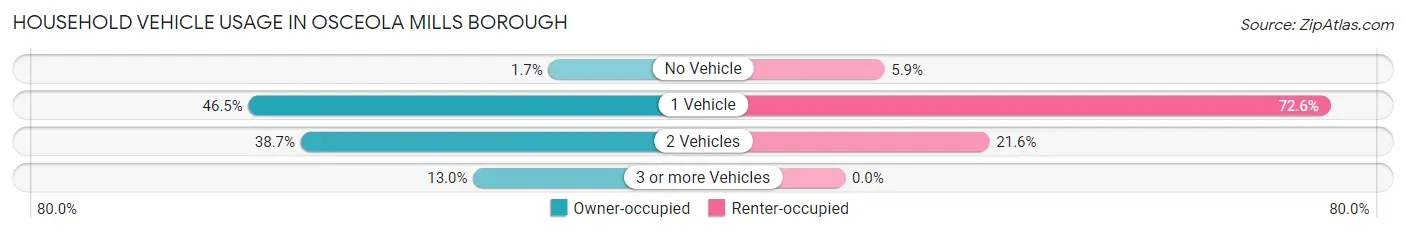
| Vehicles per Household | Owner-occupied | Renter-occupied |
| No Vehicle | 8 (1.7%) | 3 (5.9%) |
| 1 Vehicle | 215 (46.5%) | 37 (72.6%) |
| 2 Vehicles | 179 (38.7%) | 11 (21.6%) |
| 3 or more Vehicles | 60 (13.0%) | 0 (0.0%) |
| Total | 462 (100.0%) | 51 (100.0%) |
Real Estate & Mortgages in Osceola Mills borough
Real Estate and Mortgage Overview in Osceola Mills borough
| Characteristic | Without Mortgage | With Mortgage |
| Housing Units | 227 | 235 |
| Median Property Value | $78,300 | $95,400 |
| Median Household Income | $38,875 | $32 |
| Monthly Housing Costs | $566 | $0 |
| Real Estate Taxes | $905 | $2 |
Property Value by Mortgage Status in Osceola Mills borough
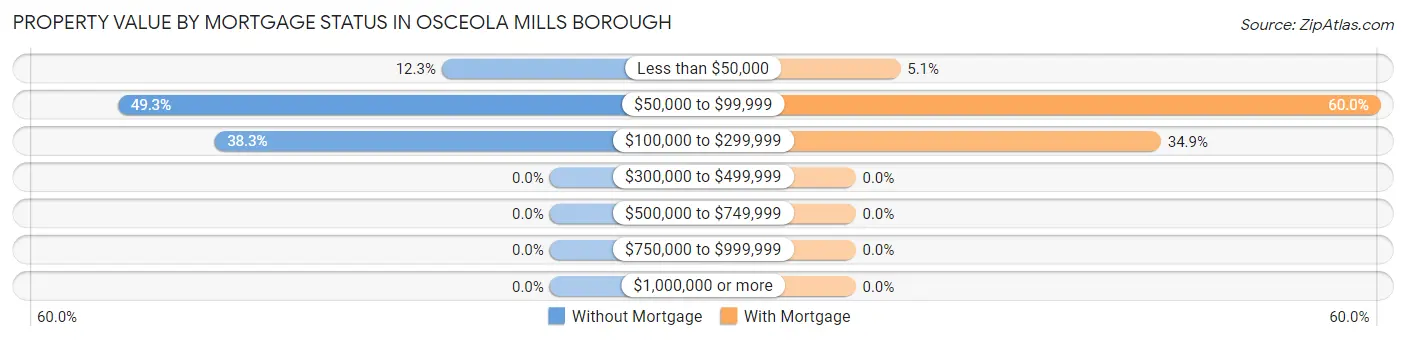
| Property Value | Without Mortgage | With Mortgage |
| Less than $50,000 | 28 (12.3%) | 12 (5.1%) |
| $50,000 to $99,999 | 112 (49.3%) | 141 (60.0%) |
| $100,000 to $299,999 | 87 (38.3%) | 82 (34.9%) |
| $300,000 to $499,999 | 0 (0.0%) | 0 (0.0%) |
| $500,000 to $749,999 | 0 (0.0%) | 0 (0.0%) |
| $750,000 to $999,999 | 0 (0.0%) | 0 (0.0%) |
| $1,000,000 or more | 0 (0.0%) | 0 (0.0%) |
| Total | 227 (100.0%) | 235 (100.0%) |
Household Income by Mortgage Status in Osceola Mills borough
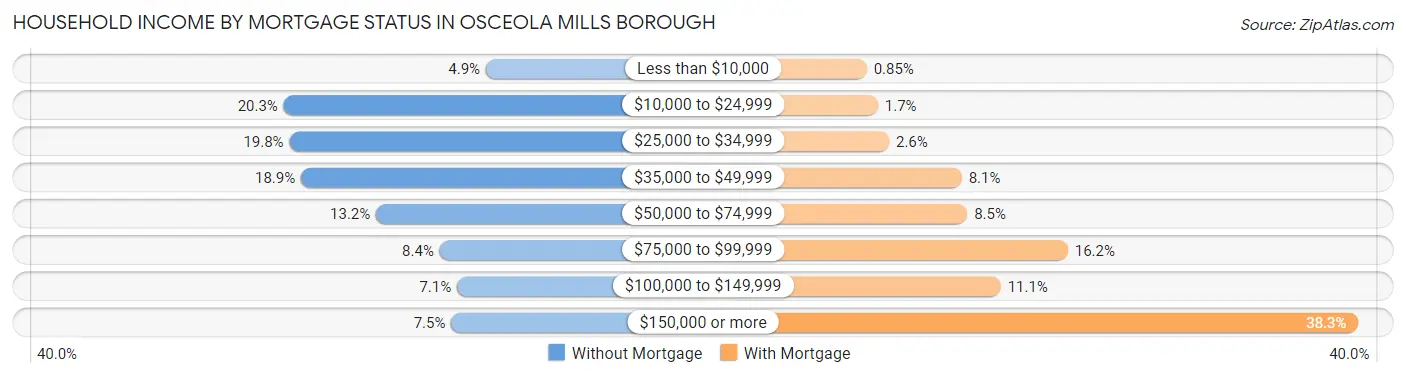
| Household Income | Without Mortgage | With Mortgage |
| Less than $10,000 | 11 (4.9%) | 2 (0.9%) |
| $10,000 to $24,999 | 46 (20.3%) | 4 (1.7%) |
| $25,000 to $34,999 | 45 (19.8%) | 6 (2.5%) |
| $35,000 to $49,999 | 43 (18.9%) | 19 (8.1%) |
| $50,000 to $74,999 | 30 (13.2%) | 20 (8.5%) |
| $75,000 to $99,999 | 19 (8.4%) | 38 (16.2%) |
| $100,000 to $149,999 | 16 (7.0%) | 26 (11.1%) |
| $150,000 or more | 17 (7.5%) | 90 (38.3%) |
| Total | 227 (100.0%) | 235 (100.0%) |
Property Value to Household Income Ratio in Osceola Mills borough
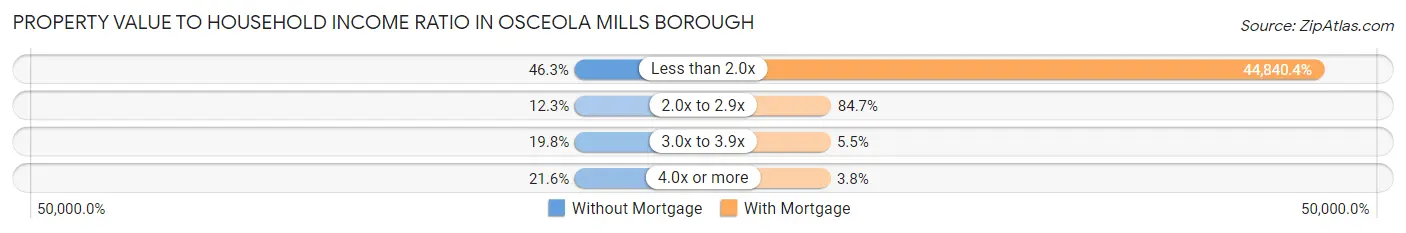
| Value-to-Income Ratio | Without Mortgage | With Mortgage |
| Less than 2.0x | 105 (46.3%) | 105,375 (44,840.4%) |
| 2.0x to 2.9x | 28 (12.3%) | 199 (84.7%) |
| 3.0x to 3.9x | 45 (19.8%) | 13 (5.5%) |
| 4.0x or more | 49 (21.6%) | 9 (3.8%) |
| Total | 227 (100.0%) | 235 (100.0%) |
Real Estate Taxes by Mortgage Status in Osceola Mills borough
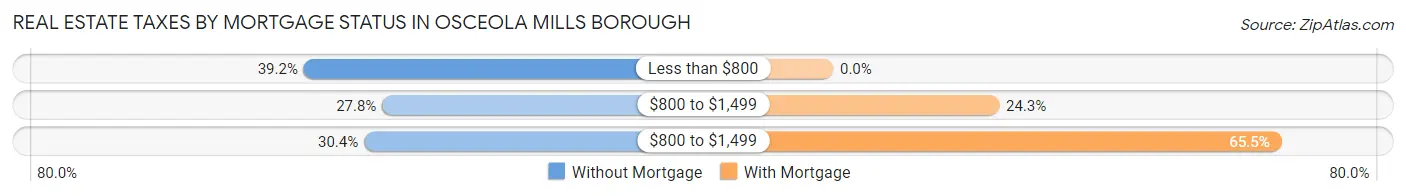
| Property Taxes | Without Mortgage | With Mortgage |
| Less than $800 | 89 (39.2%) | 0 (0.0%) |
| $800 to $1,499 | 63 (27.8%) | 57 (24.3%) |
| $800 to $1,499 | 69 (30.4%) | 154 (65.5%) |
| Total | 227 (100.0%) | 235 (100.0%) |
Health & Disability in Osceola Mills borough
Health Insurance Coverage by Age in Osceola Mills borough
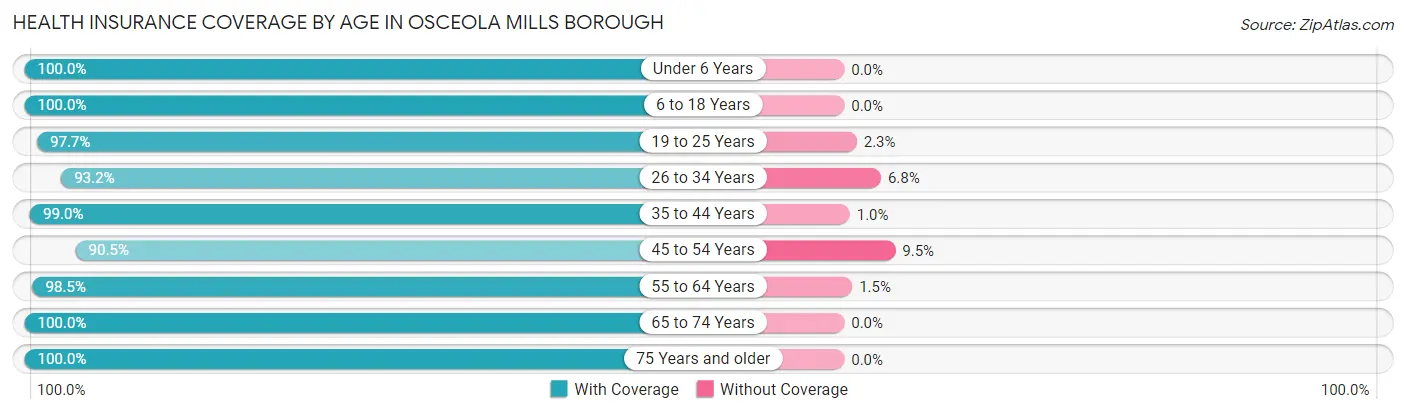
| Age Bracket | With Coverage | Without Coverage |
| Under 6 Years | 59 (100.0%) | 0 (0.0%) |
| 6 to 18 Years | 150 (100.0%) | 0 (0.0%) |
| 19 to 25 Years | 84 (97.7%) | 2 (2.3%) |
| 26 to 34 Years | 109 (93.2%) | 8 (6.8%) |
| 35 to 44 Years | 194 (99.0%) | 2 (1.0%) |
| 45 to 54 Years | 171 (90.5%) | 18 (9.5%) |
| 55 to 64 Years | 200 (98.5%) | 3 (1.5%) |
| 65 to 74 Years | 73 (100.0%) | 0 (0.0%) |
| 75 Years and older | 103 (100.0%) | 0 (0.0%) |
| Total | 1,143 (97.2%) | 33 (2.8%) |
Health Insurance Coverage by Citizenship Status in Osceola Mills borough
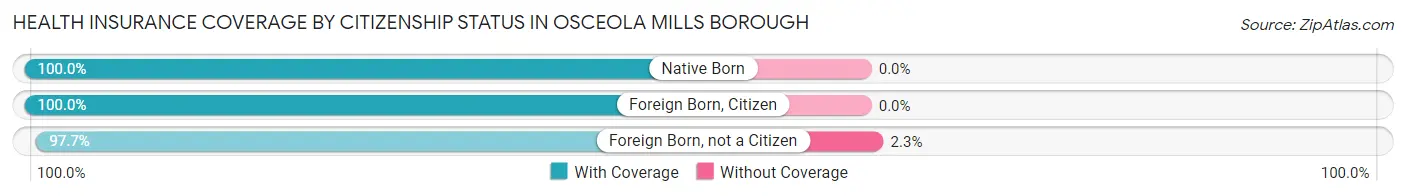
| Citizenship Status | With Coverage | Without Coverage |
| Native Born | 59 (100.0%) | 0 (0.0%) |
| Foreign Born, Citizen | 150 (100.0%) | 0 (0.0%) |
| Foreign Born, not a Citizen | 84 (97.7%) | 2 (2.3%) |
Health Insurance Coverage by Household Income in Osceola Mills borough
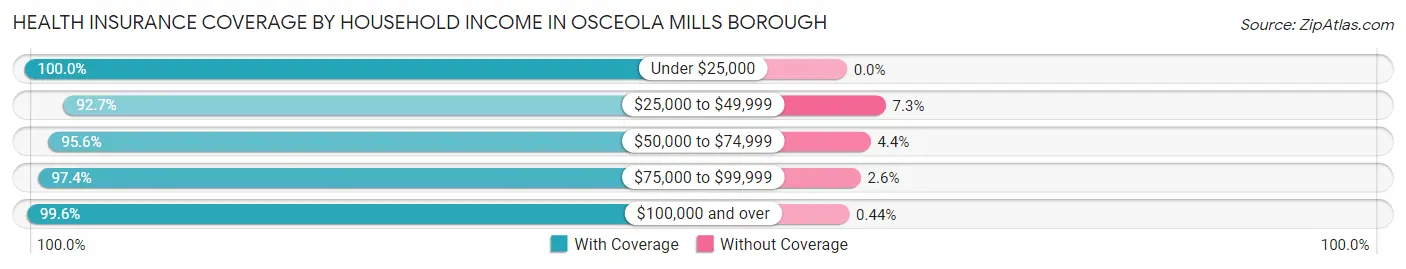
| Household Income | With Coverage | Without Coverage |
| Under $25,000 | 123 (100.0%) | 0 (0.0%) |
| $25,000 to $49,999 | 242 (92.7%) | 19 (7.3%) |
| $50,000 to $74,999 | 172 (95.6%) | 8 (4.4%) |
| $75,000 to $99,999 | 150 (97.4%) | 4 (2.6%) |
| $100,000 and over | 456 (99.6%) | 2 (0.4%) |
Public vs Private Health Insurance Coverage by Age in Osceola Mills borough
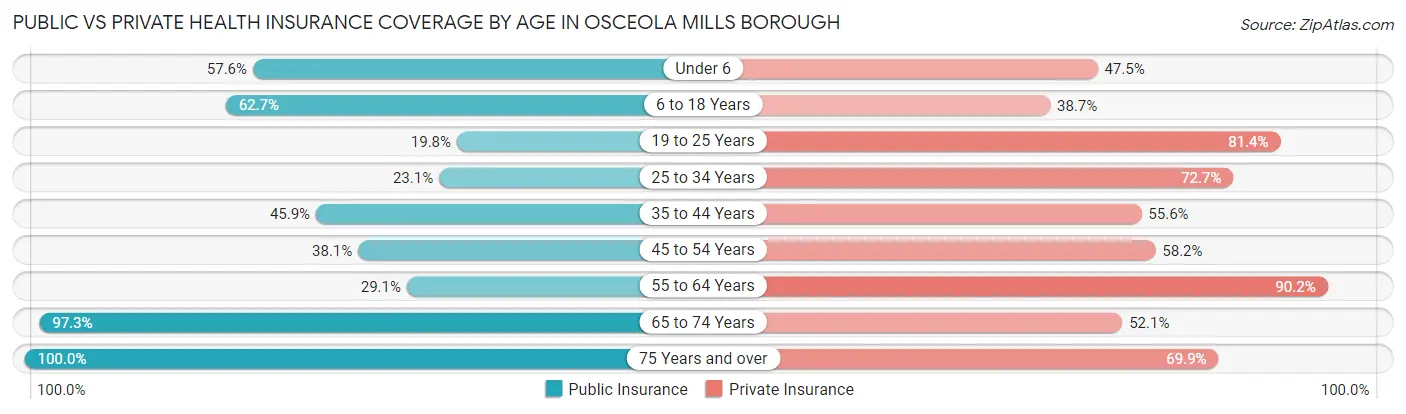
| Age Bracket | Public Insurance | Private Insurance |
| Under 6 | 34 (57.6%) | 28 (47.5%) |
| 6 to 18 Years | 94 (62.7%) | 58 (38.7%) |
| 19 to 25 Years | 17 (19.8%) | 70 (81.4%) |
| 25 to 34 Years | 27 (23.1%) | 85 (72.7%) |
| 35 to 44 Years | 90 (45.9%) | 109 (55.6%) |
| 45 to 54 Years | 72 (38.1%) | 110 (58.2%) |
| 55 to 64 Years | 59 (29.1%) | 183 (90.1%) |
| 65 to 74 Years | 71 (97.3%) | 38 (52.0%) |
| 75 Years and over | 103 (100.0%) | 72 (69.9%) |
| Total | 567 (48.2%) | 753 (64.0%) |
Disability Status by Sex by Age in Osceola Mills borough
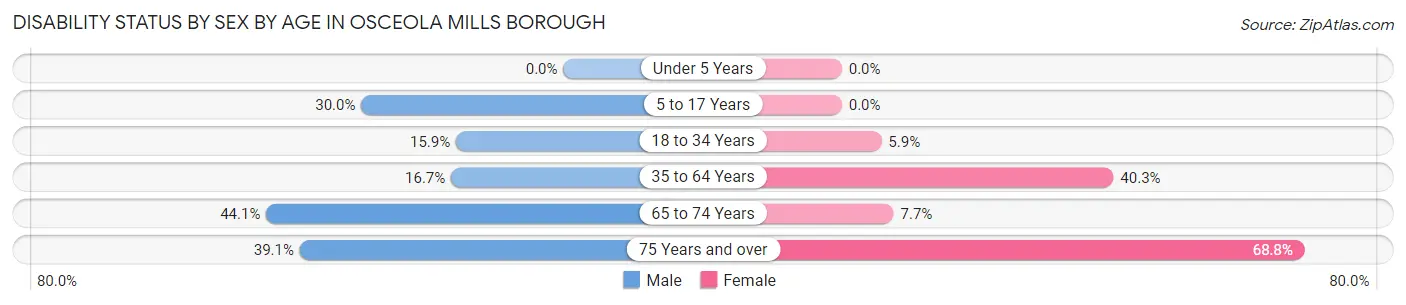
| Age Bracket | Male | Female |
| Under 5 Years | 0 (0.0%) | 0 (0.0%) |
| 5 to 17 Years | 15 (30.0%) | 0 (0.0%) |
| 18 to 34 Years | 18 (15.9%) | 6 (5.9%) |
| 35 to 64 Years | 48 (16.7%) | 121 (40.3%) |
| 65 to 74 Years | 15 (44.1%) | 3 (7.7%) |
| 75 Years and over | 9 (39.1%) | 55 (68.8%) |
Disability Class by Sex by Age in Osceola Mills borough
Disability Class: Hearing Difficulty
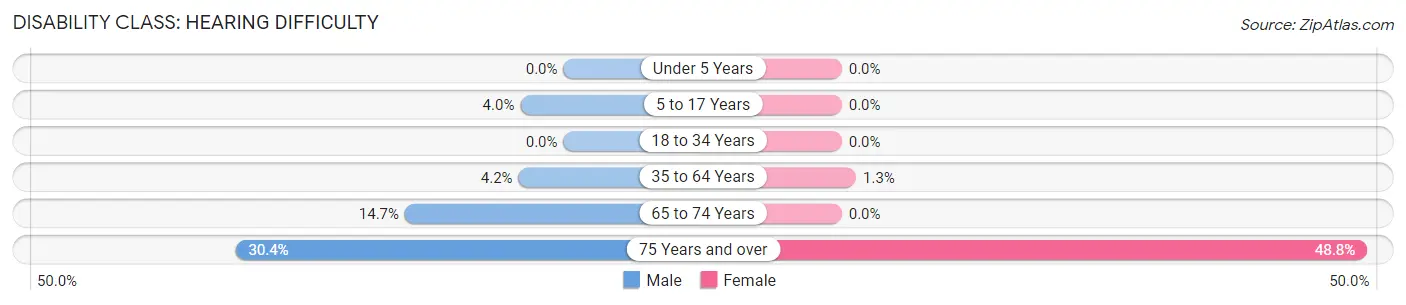
| Age Bracket | Male | Female |
| Under 5 Years | 0 (0.0%) | 0 (0.0%) |
| 5 to 17 Years | 2 (4.0%) | 0 (0.0%) |
| 18 to 34 Years | 0 (0.0%) | 0 (0.0%) |
| 35 to 64 Years | 12 (4.2%) | 4 (1.3%) |
| 65 to 74 Years | 5 (14.7%) | 0 (0.0%) |
| 75 Years and over | 7 (30.4%) | 39 (48.7%) |
Disability Class: Vision Difficulty
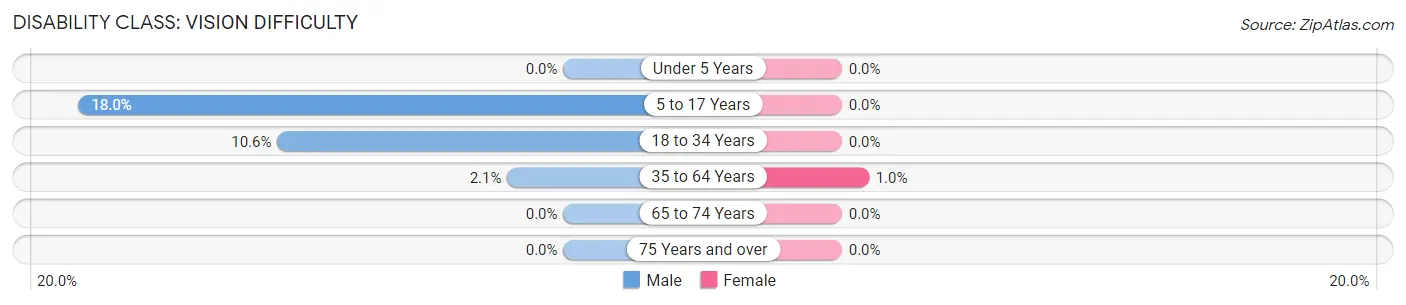
| Age Bracket | Male | Female |
| Under 5 Years | 0 (0.0%) | 0 (0.0%) |
| 5 to 17 Years | 9 (18.0%) | 0 (0.0%) |
| 18 to 34 Years | 12 (10.6%) | 0 (0.0%) |
| 35 to 64 Years | 6 (2.1%) | 3 (1.0%) |
| 65 to 74 Years | 0 (0.0%) | 0 (0.0%) |
| 75 Years and over | 0 (0.0%) | 0 (0.0%) |
Disability Class: Cognitive Difficulty
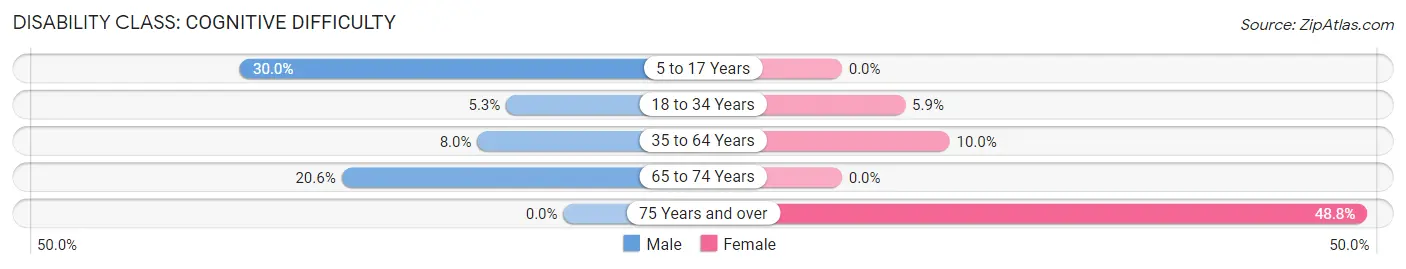
| Age Bracket | Male | Female |
| 5 to 17 Years | 15 (30.0%) | 0 (0.0%) |
| 18 to 34 Years | 6 (5.3%) | 6 (5.9%) |
| 35 to 64 Years | 23 (8.0%) | 30 (10.0%) |
| 65 to 74 Years | 7 (20.6%) | 0 (0.0%) |
| 75 Years and over | 0 (0.0%) | 39 (48.7%) |
Disability Class: Ambulatory Difficulty
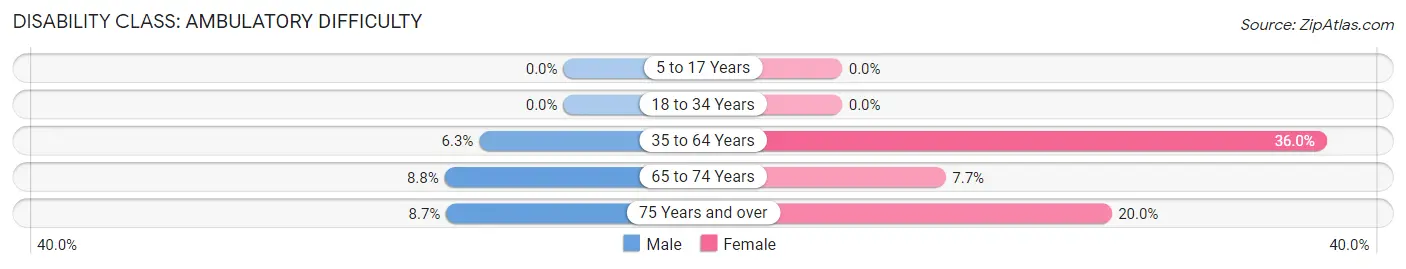
| Age Bracket | Male | Female |
| 5 to 17 Years | 0 (0.0%) | 0 (0.0%) |
| 18 to 34 Years | 0 (0.0%) | 0 (0.0%) |
| 35 to 64 Years | 18 (6.2%) | 108 (36.0%) |
| 65 to 74 Years | 3 (8.8%) | 3 (7.7%) |
| 75 Years and over | 2 (8.7%) | 16 (20.0%) |
Disability Class: Self-Care Difficulty
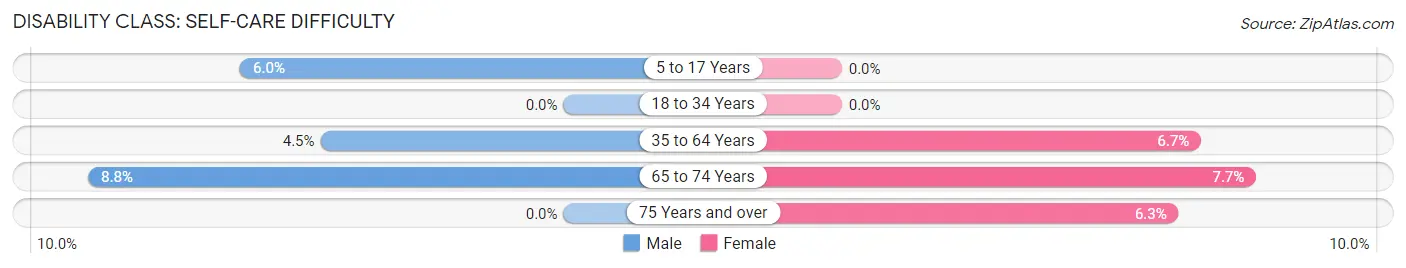
| Age Bracket | Male | Female |
| 5 to 17 Years | 3 (6.0%) | 0 (0.0%) |
| 18 to 34 Years | 0 (0.0%) | 0 (0.0%) |
| 35 to 64 Years | 13 (4.5%) | 20 (6.7%) |
| 65 to 74 Years | 3 (8.8%) | 3 (7.7%) |
| 75 Years and over | 0 (0.0%) | 5 (6.2%) |
Technology Access in Osceola Mills borough
Computing Device Access in Osceola Mills borough
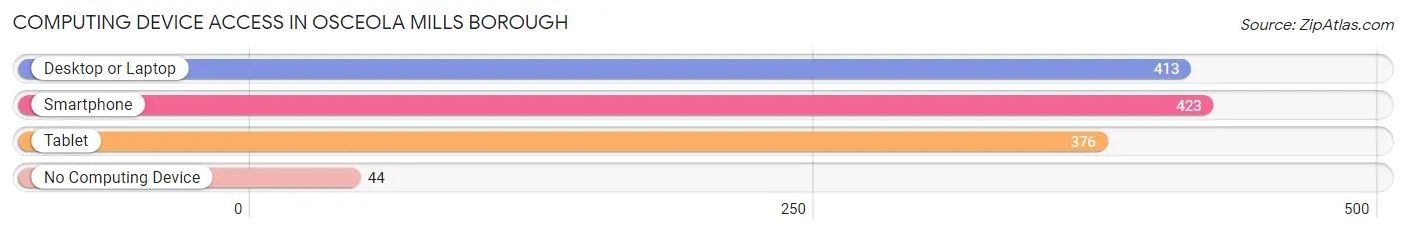
| Device Type | # Households | % Households |
| Desktop or Laptop | 413 | 80.5% |
| Smartphone | 423 | 82.5% |
| Tablet | 376 | 73.3% |
| No Computing Device | 44 | 8.6% |
| Total | 513 | 100.0% |
Internet Access in Osceola Mills borough
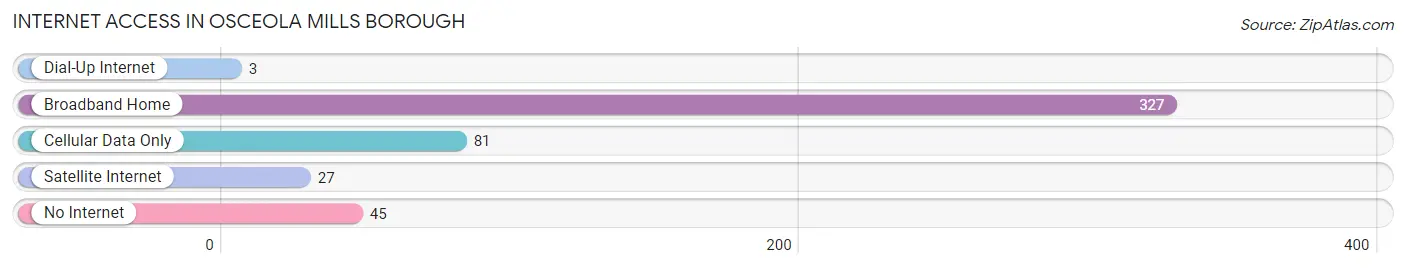
| Internet Type | # Households | % Households |
| Dial-Up Internet | 3 | 0.6% |
| Broadband Home | 327 | 63.7% |
| Cellular Data Only | 81 | 15.8% |
| Satellite Internet | 27 | 5.3% |
| No Internet | 45 | 8.8% |
| Total | 513 | 100.0% |
Osceola Mills borough Summary
Osceola Mills Borough is a small borough located in Clearfield County, Pennsylvania. It is situated in the western part of the state, about 90 miles northeast of Pittsburgh. The borough is bordered by the townships of Decatur, Huston, and Morris, and the borough of Brisbin. As of the 2010 census, the population of Osceola Mills was 1,093.
History
Osceola Mills was founded in 1872 by the Pennsylvania Railroad. The railroad had been looking for a place to build a station and chose the area because of its proximity to the Clearfield Creek. The town was named after the Seminole leader Osceola, who had died in 1838. The first post office was established in 1873.
In the late 19th century, Osceola Mills was a thriving industrial center. The town was home to several coal mines, a brickyard, a sawmill, and a tannery. The Pennsylvania Railroad also had a large presence in the town, with a roundhouse, a freight station, and a passenger station.
In the early 20th century, the town began to decline. The coal mines closed, and the railroad began to reduce its presence in the town. By the 1950s, the town had become a quiet, rural community.
Geography
Osceola Mills is located at 40°55'N 78°25'W. It is situated in the western part of Clearfield County, about 90 miles northeast of Pittsburgh. The borough is bordered by the townships of Decatur, Huston, and Morris, and the borough of Brisbin.
Osceola Mills has a total area of 0.7 square miles, all of which is land. The borough is located in the Allegheny Plateau region of Pennsylvania. The terrain is mostly flat, with some rolling hills. The Clearfield Creek runs through the town.
Economy
Osceola Mills is a small, rural community with a limited economy. The town is home to several small businesses, including a grocery store, a hardware store, and a few restaurants. The town also has a few manufacturing companies, including a plastics factory and a metal fabrication plant.
The town is also home to a few tourist attractions, including the Osceola Mills Historic District and the Osceola Mills Railroad Museum. The town also hosts several annual events, including the Osceola Mills Fall Festival and the Osceola Mills Christmas Parade.
Demographics
As of the 2010 census, the population of Osceola Mills was 1,093. The racial makeup of the town was 97.3% White, 0.7% African American, 0.2% Native American, 0.2% Asian, 0.2% from other races, and 1.6% from two or more races. Hispanic or Latino of any race were 0.7% of the population.
The median household income in Osceola Mills was $31,250, and the median family income was $37,500. The per capita income was $17,845. About 15.2% of the population was below the poverty line.
Common Questions
What is Per Capita Income in Osceola Mills borough?
Per Capita income in Osceola Mills borough is $32,828.
What is the Median Family Income in Osceola Mills borough?
Median Family Income in Osceola Mills borough is $64,732.
What is the Median Household income in Osceola Mills borough?
Median Household Income in Osceola Mills borough is $58,125.
What is Income or Wage Gap in Osceola Mills borough?
Income or Wage Gap in Osceola Mills borough is 50.1%.
Women in Osceola Mills borough earn 49.9 cents for every dollar earned by a man.
What is Inequality or Gini Index in Osceola Mills borough?
Inequality or Gini Index in Osceola Mills borough is 0.43.
What is the Total Population of Osceola Mills borough?
Total Population of Osceola Mills borough is 1,176.
What is the Total Male Population of Osceola Mills borough?
Total Male Population of Osceola Mills borough is 528.
What is the Total Female Population of Osceola Mills borough?
Total Female Population of Osceola Mills borough is 648.
What is the Ratio of Males per 100 Females in Osceola Mills borough?
There are 81.48 Males per 100 Females in Osceola Mills borough.
What is the Ratio of Females per 100 Males in Osceola Mills borough?
There are 122.73 Females per 100 Males in Osceola Mills borough.
What is the Median Population Age in Osceola Mills borough?
Median Population Age in Osceola Mills borough is 44.1 Years.
What is the Average Family Size in Osceola Mills borough
Average Family Size in Osceola Mills borough is 2.7 People.
What is the Average Household Size in Osceola Mills borough
Average Household Size in Osceola Mills borough is 2.3 People.
How Large is the Labor Force in Osceola Mills borough?
There are 531 People in the Labor Forcein in Osceola Mills borough.
What is the Percentage of People in the Labor Force in Osceola Mills borough?
53.6% of People are in the Labor Force in Osceola Mills borough.
What is the Unemployment Rate in Osceola Mills borough?
Unemployment Rate in Osceola Mills borough is 7.5%.