Oreland, PA Map & Demographics
Oreland Map
Oreland Overview
$49,133
PER CAPITA INCOME
$118,883
AVG FAMILY INCOME
$99,625
AVG HOUSEHOLD INCOME
11.8%
WAGE / INCOME GAP [ % ]
88.2¢/ $1
WAGE / INCOME GAP [ $ ]
0.40
INEQUALITY / GINI INDEX
6,123
TOTAL POPULATION
2,997
MALE POPULATION
3,126
FEMALE POPULATION
95.87
MALES / 100 FEMALES
104.30
FEMALES / 100 MALES
40.3
MEDIAN AGE
3.2
AVG FAMILY SIZE
2.7
AVG HOUSEHOLD SIZE
3,364
LABOR FORCE [ PEOPLE ]
71.5%
PERCENT IN LABOR FORCE
5.6%
UNEMPLOYMENT RATE
Oreland Zip Codes
Income in Oreland
Income Overview in Oreland
Per Capita Income in Oreland is $49,133, while median incomes of families and households are $118,883 and $99,625 respectively.
| Characteristic | Number | Measure |
| Per Capita Income | 6,123 | $49,133 |
| Median Family Income | 1,652 | $118,883 |
| Mean Family Income | 1,652 | $148,732 |
| Median Household Income | 2,264 | $99,625 |
| Mean Household Income | 2,264 | $128,233 |
| Income Deficit | 1,652 | $0 |
| Wage / Income Gap (%) | 6,123 | 11.84% |
| Wage / Income Gap ($) | 6,123 | 88.16¢ per $1 |
| Gini / Inequality Index | 6,123 | 0.40 |
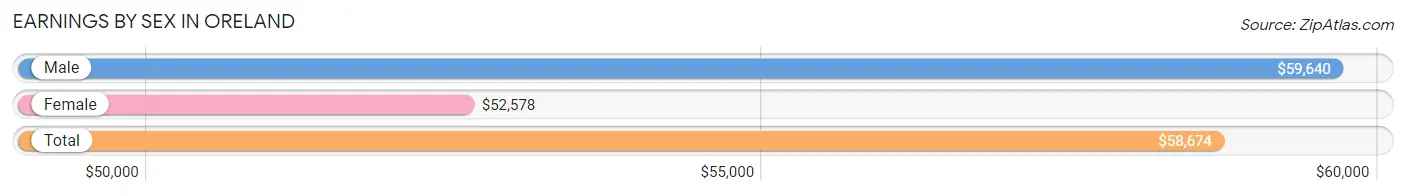
Earnings by Sex in Oreland
Average Earnings in Oreland are $58,674, $59,640 for men and $52,578 for women, a difference of 11.8%.
| Sex | Number | Average Earnings |
| Male | 1,879 (53.7%) | $59,640 |
| Female | 1,623 (46.3%) | $52,578 |
| Total | 3,502 (100.0%) | $58,674 |
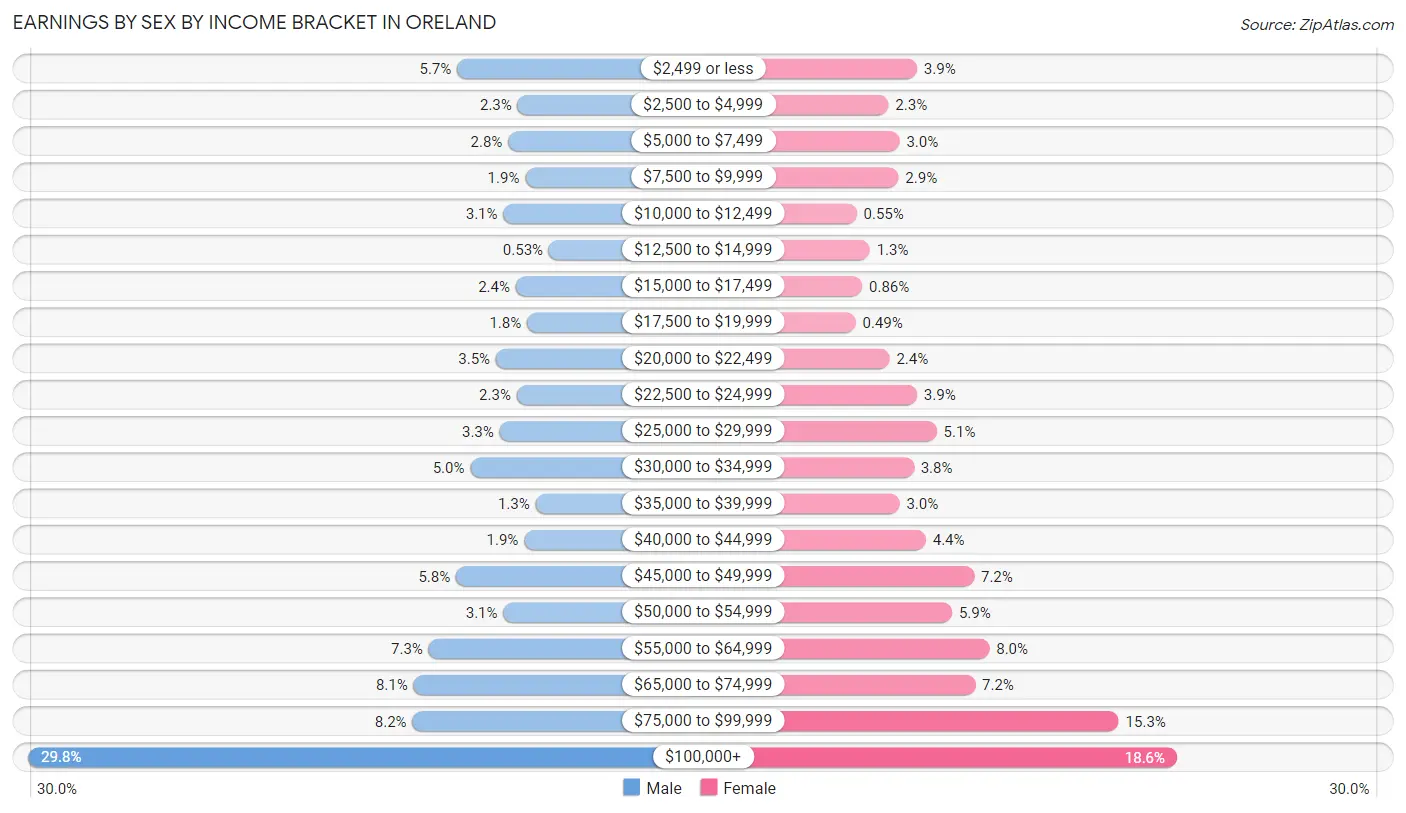
Earnings by Sex by Income Bracket in Oreland
The most common earnings brackets in Oreland are $100,000+ for men (560 | 29.8%) and $100,000+ for women (301 | 18.5%).
| Income | Male | Female |
| $2,499 or less | 107 (5.7%) | 64 (3.9%) |
| $2,500 to $4,999 | 43 (2.3%) | 38 (2.3%) |
| $5,000 to $7,499 | 53 (2.8%) | 48 (3.0%) |
| $7,500 to $9,999 | 35 (1.9%) | 47 (2.9%) |
| $10,000 to $12,499 | 58 (3.1%) | 9 (0.5%) |
| $12,500 to $14,999 | 10 (0.5%) | 21 (1.3%) |
| $15,000 to $17,499 | 45 (2.4%) | 14 (0.9%) |
| $17,500 to $19,999 | 33 (1.8%) | 8 (0.5%) |
| $20,000 to $22,499 | 66 (3.5%) | 39 (2.4%) |
| $22,500 to $24,999 | 44 (2.3%) | 64 (3.9%) |
| $25,000 to $29,999 | 62 (3.3%) | 82 (5.1%) |
| $30,000 to $34,999 | 93 (5.0%) | 61 (3.8%) |
| $35,000 to $39,999 | 24 (1.3%) | 48 (3.0%) |
| $40,000 to $44,999 | 36 (1.9%) | 72 (4.4%) |
| $45,000 to $49,999 | 108 (5.8%) | 116 (7.1%) |
| $50,000 to $54,999 | 58 (3.1%) | 96 (5.9%) |
| $55,000 to $64,999 | 137 (7.3%) | 130 (8.0%) |
| $65,000 to $74,999 | 153 (8.1%) | 117 (7.2%) |
| $75,000 to $99,999 | 154 (8.2%) | 248 (15.3%) |
| $100,000+ | 560 (29.8%) | 301 (18.5%) |
| Total | 1,879 (100.0%) | 1,623 (100.0%) |
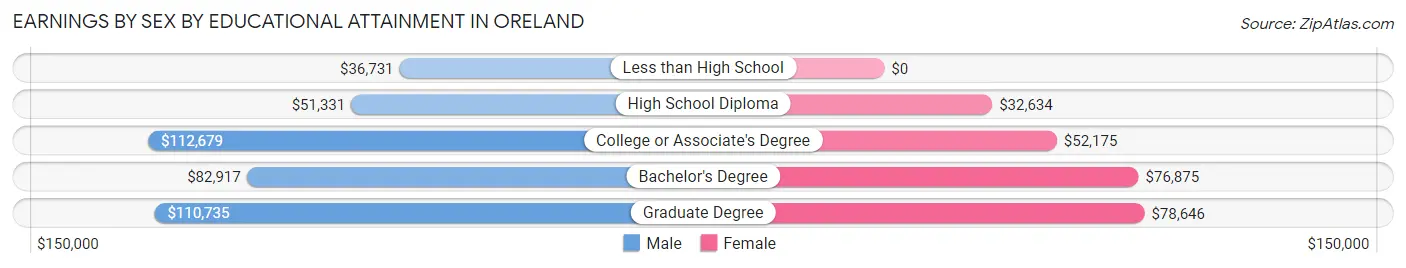
Earnings by Sex by Educational Attainment in Oreland
Average earnings in Oreland are $70,613 for men and $63,230 for women, a difference of 10.5%. Men with an educational attainment of college or associate's degree enjoy the highest average annual earnings of $112,679, while those with less than high school education earn the least with $36,731. Women with an educational attainment of graduate degree earn the most with the average annual earnings of $78,646, while those with high school diploma education have the smallest earnings of $32,634.
| Educational Attainment | Male Income | Female Income |
| Less than High School | $36,731 | $0 |
| High School Diploma | $51,331 | $32,634 |
| College or Associate's Degree | $112,679 | $52,175 |
| Bachelor's Degree | $82,917 | $76,875 |
| Graduate Degree | $110,735 | $78,646 |
| Total | $70,613 | $63,230 |
Family Income in Oreland
Family Income Brackets in Oreland
According to the Oreland family income data, there are 367 families falling into the $200,000+ income range, which is the most common income bracket and makes up 22.2% of all families. Conversely, the less than $10,000 income bracket is the least frequent group with only 8 families (0.5%) belonging to this category.
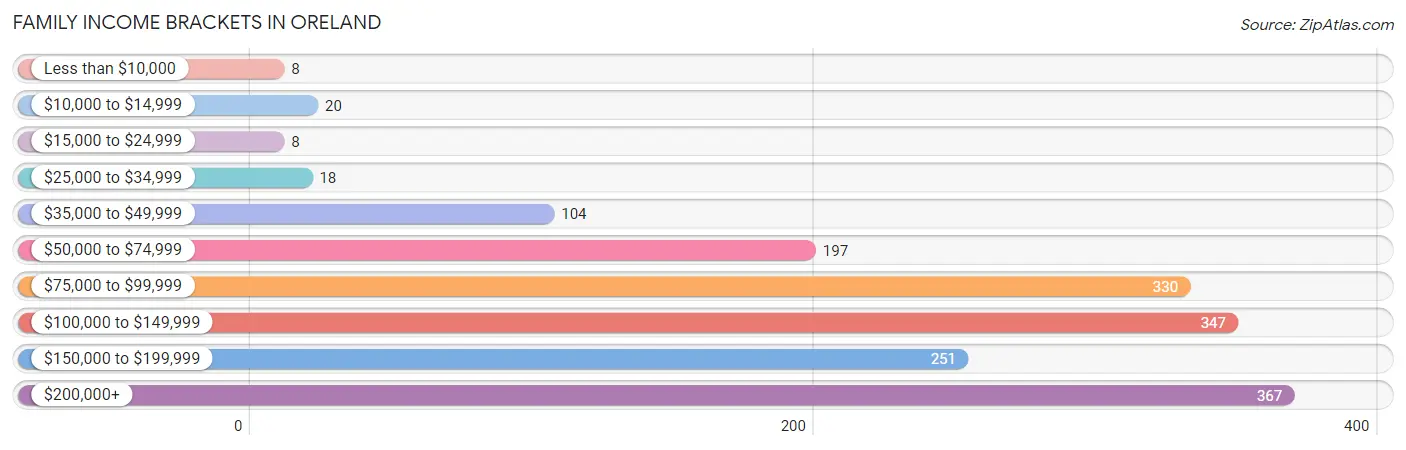
| Income Bracket | # Families | % Families |
| Less than $10,000 | 8 | 0.5% |
| $10,000 to $14,999 | 20 | 1.2% |
| $15,000 to $24,999 | 8 | 0.5% |
| $25,000 to $34,999 | 18 | 1.1% |
| $35,000 to $49,999 | 104 | 6.3% |
| $50,000 to $74,999 | 197 | 11.9% |
| $75,000 to $99,999 | 330 | 20.0% |
| $100,000 to $149,999 | 347 | 21.0% |
| $150,000 to $199,999 | 251 | 15.2% |
| $200,000+ | 367 | 22.2% |
Family Income by Famaliy Size in Oreland
6-person families (42 | 2.5%) account for the highest median family income in Oreland with $176,458 per family, while 2-person families (702 | 42.5%) have the highest median income of $47,036 per family member.
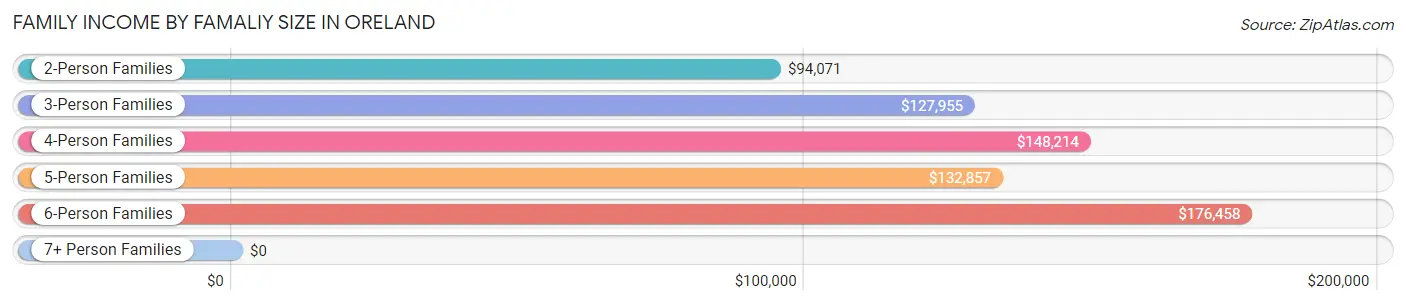
| Income Bracket | # Families | Median Income |
| 2-Person Families | 702 (42.5%) | $94,071 |
| 3-Person Families | 332 (20.1%) | $127,955 |
| 4-Person Families | 430 (26.0%) | $148,214 |
| 5-Person Families | 146 (8.8%) | $132,857 |
| 6-Person Families | 42 (2.5%) | $176,458 |
| 7+ Person Families | 0 (0.0%) | $0 |
| Total | 1,652 (100.0%) | $118,883 |
Family Income by Number of Earners in Oreland
The median family income in Oreland is $118,883, with families comprising 2 earners (708) having the highest median family income of $167,976, while families with no earners (184) have the lowest median family income of $66,250, accounting for 42.9% and 11.1% of families, respectively.
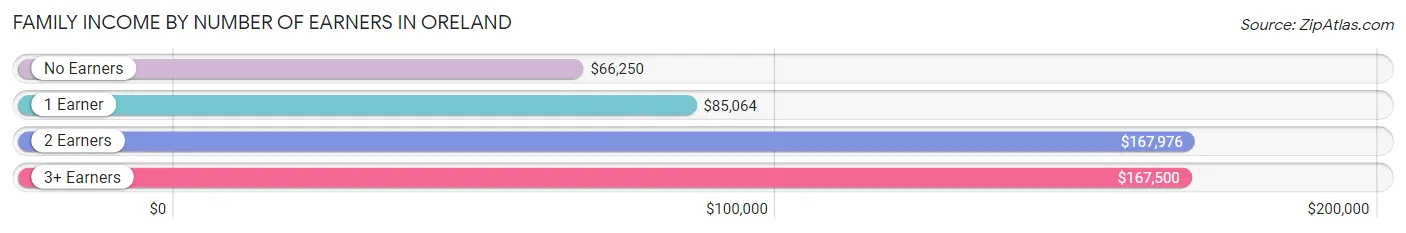
| Number of Earners | # Families | Median Income |
| No Earners | 184 (11.1%) | $66,250 |
| 1 Earner | 508 (30.7%) | $85,064 |
| 2 Earners | 708 (42.9%) | $167,976 |
| 3+ Earners | 252 (15.2%) | $167,500 |
| Total | 1,652 (100.0%) | $118,883 |
Household Income in Oreland
Household Income Brackets in Oreland
With 448 households falling in the category, the $100,000 to $149,999 income range is the most frequent in Oreland, accounting for 19.8% of all households. In contrast, only 18 households (0.8%) fall into the $15,000 to $24,999 income bracket, making it the least populous group.
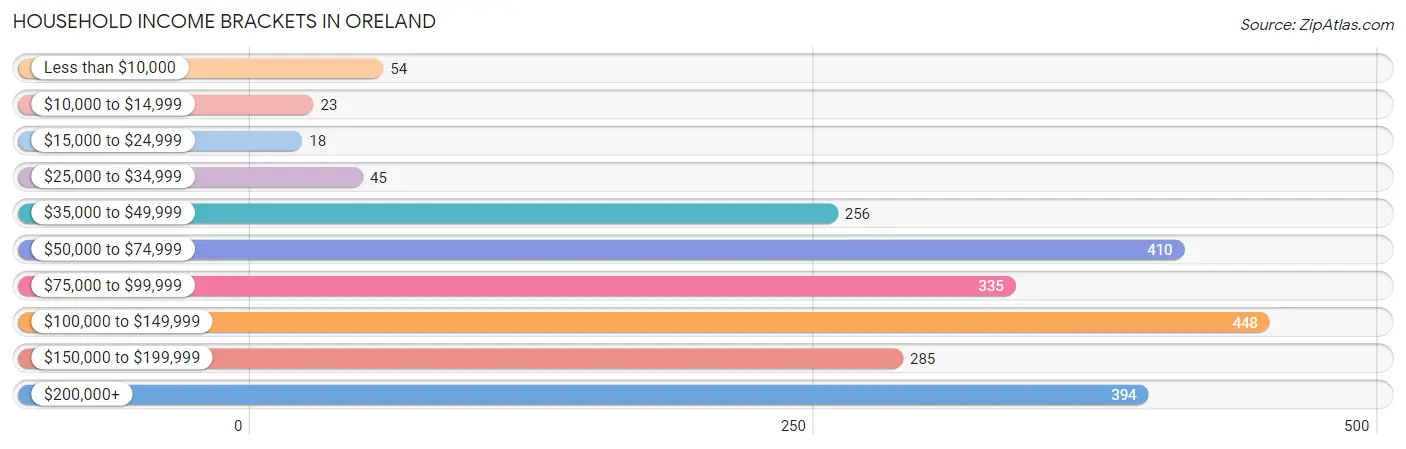
| Income Bracket | # Households | % Households |
| Less than $10,000 | 54 | 2.4% |
| $10,000 to $14,999 | 23 | 1.0% |
| $15,000 to $24,999 | 18 | 0.8% |
| $25,000 to $34,999 | 45 | 2.0% |
| $35,000 to $49,999 | 256 | 11.3% |
| $50,000 to $74,999 | 410 | 18.1% |
| $75,000 to $99,999 | 335 | 14.8% |
| $100,000 to $149,999 | 448 | 19.8% |
| $150,000 to $199,999 | 285 | 12.6% |
| $200,000+ | 394 | 17.4% |
Household Income by Householder Age in Oreland
The median household income in Oreland is $99,625, with the highest median household income of $132,708 found in the 45 to 64 years age bracket for the primary householder. A total of 828 households (36.6%) fall into this category. Meanwhile, the 15 to 24 years age bracket for the primary householder has the lowest median household income of $0, with 19 households (0.8%) in this group.
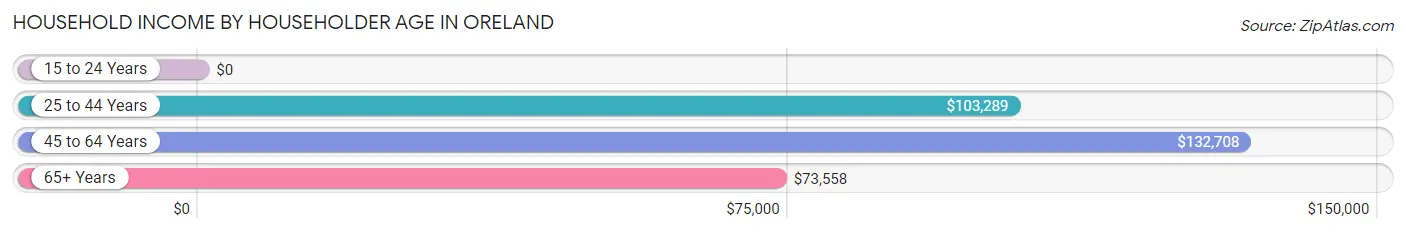
| Income Bracket | # Households | Median Income |
| 15 to 24 Years | 19 (0.8%) | $0 |
| 25 to 44 Years | 794 (35.1%) | $103,289 |
| 45 to 64 Years | 828 (36.6%) | $132,708 |
| 65+ Years | 623 (27.5%) | $73,558 |
| Total | 2,264 (100.0%) | $99,625 |
Poverty in Oreland
Income Below Poverty by Sex and Age in Oreland
With 3.0% poverty level for males and 4.2% for females among the residents of Oreland, 5 year old males and 25 to 34 year old females are the most vulnerable to poverty, with 8 males (14.5%) and 40 females (15.8%) in their respective age groups living below the poverty level.
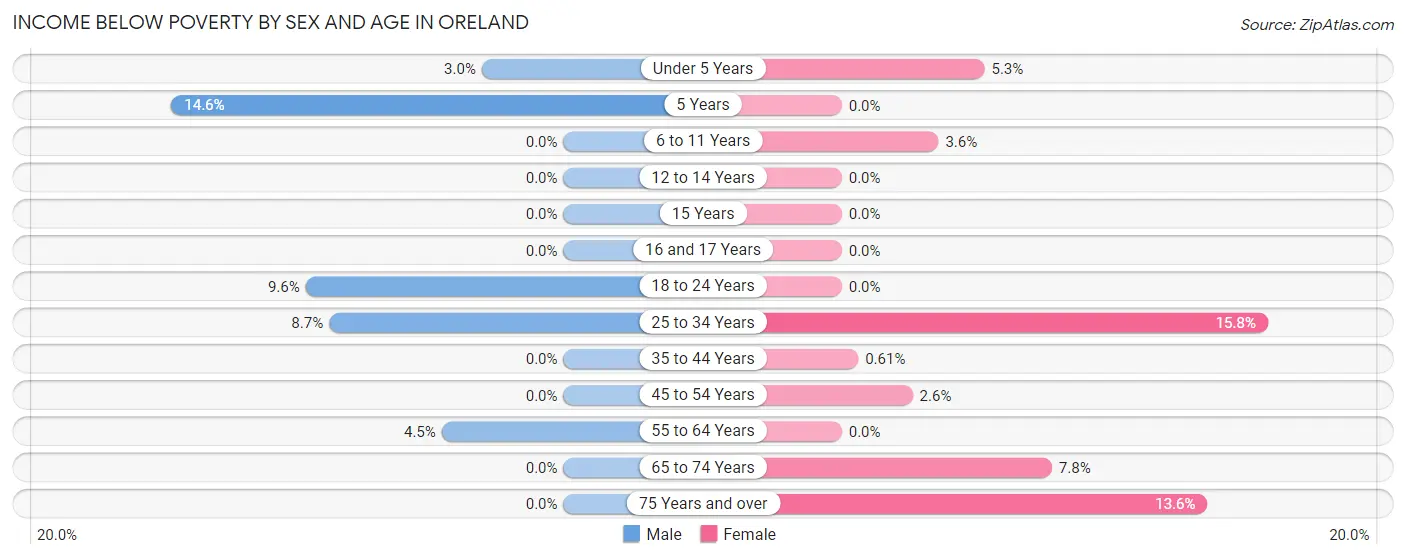
| Age Bracket | Male | Female |
| Under 5 Years | 7 (3.0%) | 7 (5.3%) |
| 5 Years | 8 (14.5%) | 0 (0.0%) |
| 6 to 11 Years | 0 (0.0%) | 16 (3.6%) |
| 12 to 14 Years | 0 (0.0%) | 0 (0.0%) |
| 15 Years | 0 (0.0%) | 0 (0.0%) |
| 16 and 17 Years | 0 (0.0%) | 0 (0.0%) |
| 18 to 24 Years | 31 (9.6%) | 0 (0.0%) |
| 25 to 34 Years | 24 (8.7%) | 40 (15.8%) |
| 35 to 44 Years | 0 (0.0%) | 3 (0.6%) |
| 45 to 54 Years | 0 (0.0%) | 9 (2.6%) |
| 55 to 64 Years | 20 (4.5%) | 0 (0.0%) |
| 65 to 74 Years | 0 (0.0%) | 22 (7.8%) |
| 75 Years and over | 0 (0.0%) | 35 (13.6%) |
| Total | 90 (3.0%) | 132 (4.2%) |
Income Above Poverty by Sex and Age in Oreland
According to the poverty statistics in Oreland, males aged 6 to 11 years and females aged 5 years are the age groups that are most secure financially, with 100.0% of males and 100.0% of females in these age groups living above the poverty line.
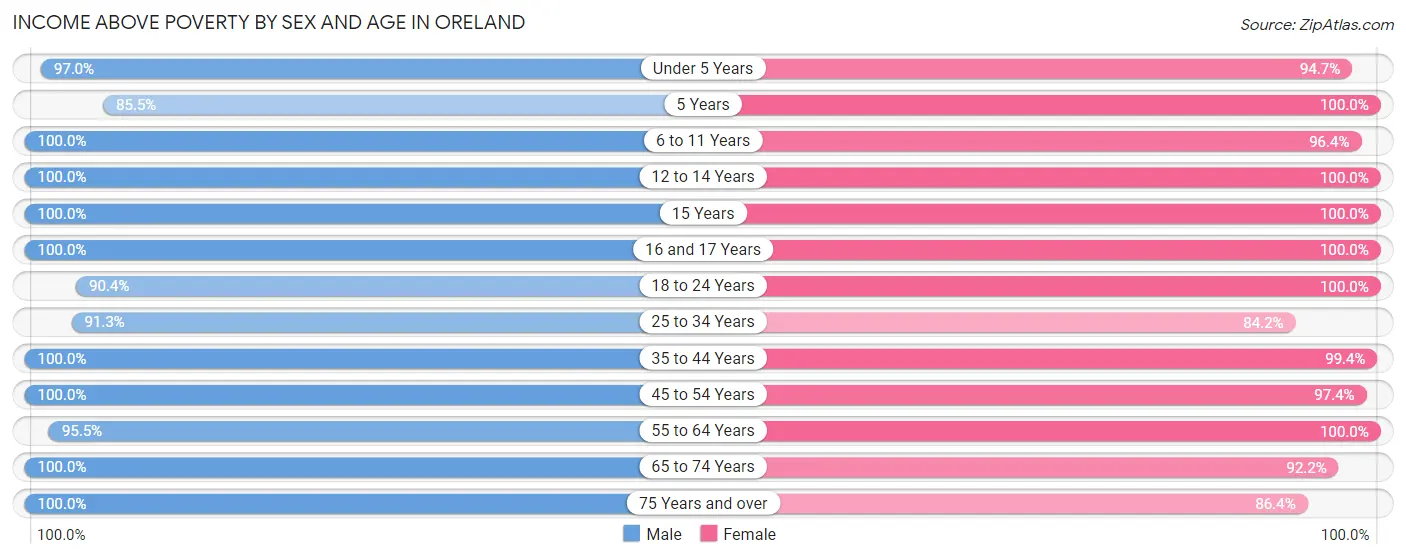
| Age Bracket | Male | Female |
| Under 5 Years | 224 (97.0%) | 125 (94.7%) |
| 5 Years | 47 (85.5%) | 52 (100.0%) |
| 6 to 11 Years | 214 (100.0%) | 430 (96.4%) |
| 12 to 14 Years | 139 (100.0%) | 92 (100.0%) |
| 15 Years | 16 (100.0%) | 23 (100.0%) |
| 16 and 17 Years | 25 (100.0%) | 81 (100.0%) |
| 18 to 24 Years | 293 (90.4%) | 156 (100.0%) |
| 25 to 34 Years | 252 (91.3%) | 213 (84.2%) |
| 35 to 44 Years | 504 (100.0%) | 490 (99.4%) |
| 45 to 54 Years | 314 (100.0%) | 333 (97.4%) |
| 55 to 64 Years | 422 (95.5%) | 507 (100.0%) |
| 65 to 74 Years | 272 (100.0%) | 260 (92.2%) |
| 75 Years and over | 176 (100.0%) | 223 (86.4%) |
| Total | 2,898 (97.0%) | 2,985 (95.8%) |
Income Below Poverty Among Married-Couple Families in Oreland
The poverty statistics for married-couple families in Oreland show that 0.7% or 9 of the total 1,360 families live below the poverty line. Families with 1 or 2 children have the highest poverty rate of 2.0%, comprising of 9 families. On the other hand, families with no children have the lowest poverty rate of 0.0%, which includes 0 families.
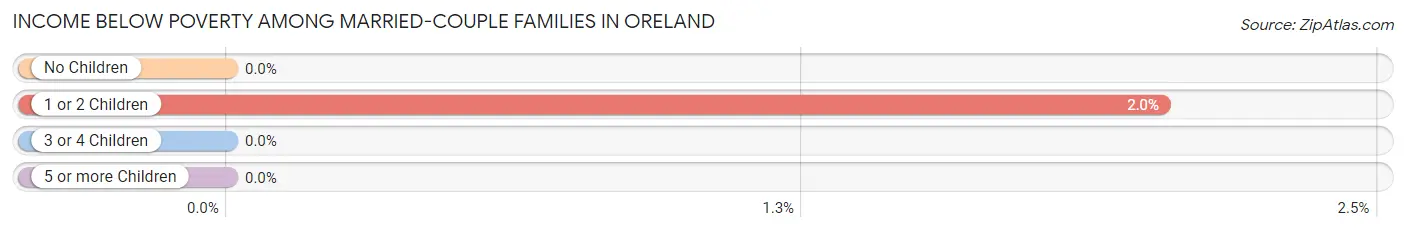
| Children | Above Poverty | Below Poverty |
| No Children | 779 (100.0%) | 0 (0.0%) |
| 1 or 2 Children | 435 (98.0%) | 9 (2.0%) |
| 3 or 4 Children | 137 (100.0%) | 0 (0.0%) |
| 5 or more Children | 0 (0.0%) | 0 (0.0%) |
| Total | 1,351 (99.3%) | 9 (0.7%) |
Income Below Poverty Among Single-Parent Households in Oreland
According to the poverty data in Oreland, 20.0% or 11 single-father households and 3.8% or 9 single-mother households are living below the poverty line. Among single-father households, those with no children have the highest poverty rate, with 11 households (39.3%) experiencing poverty. Likewise, among single-mother households, those with 3 or 4 children have the highest poverty rate, with 9 households (56.2%) falling below the poverty line.
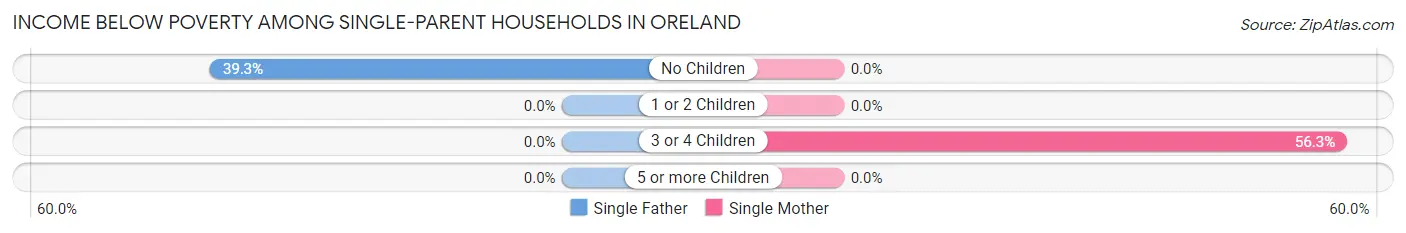
| Children | Single Father | Single Mother |
| No Children | 11 (39.3%) | 0 (0.0%) |
| 1 or 2 Children | 0 (0.0%) | 0 (0.0%) |
| 3 or 4 Children | 0 (0.0%) | 9 (56.2%) |
| 5 or more Children | 0 (0.0%) | 0 (0.0%) |
| Total | 11 (20.0%) | 9 (3.8%) |
Income Below Poverty Among Married-Couple vs Single-Parent Households in Oreland
The poverty data for Oreland shows that 9 of the married-couple family households (0.7%) and 20 of the single-parent households (6.9%) are living below the poverty level. Within the married-couple family households, those with 1 or 2 children have the highest poverty rate, with 9 households (2.0%) falling below the poverty line. Among the single-parent households, those with 3 or 4 children have the highest poverty rate, with 9 household (37.5%) living below poverty.
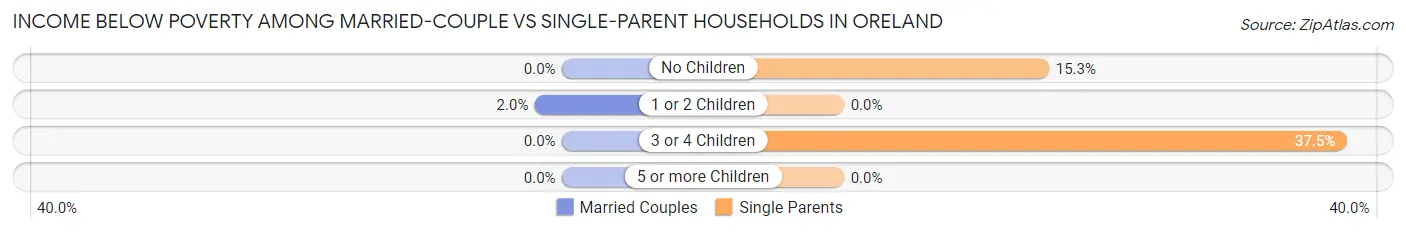
| Children | Married-Couple Families | Single-Parent Households |
| No Children | 0 (0.0%) | 11 (15.3%) |
| 1 or 2 Children | 9 (2.0%) | 0 (0.0%) |
| 3 or 4 Children | 0 (0.0%) | 9 (37.5%) |
| 5 or more Children | 0 (0.0%) | 0 (0.0%) |
| Total | 9 (0.7%) | 20 (6.9%) |
Race in Oreland
The most populous races in Oreland are White / Caucasian (5,114 | 83.5%), Black / African American (479 | 7.8%), and Hispanic or Latino (396 | 6.5%).
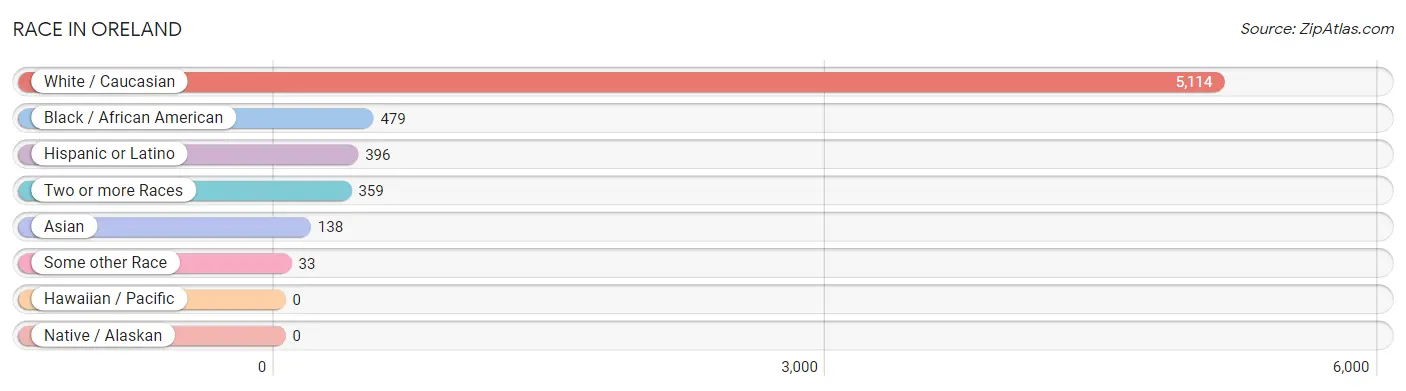
| Race | # Population | % Population |
| Asian | 138 | 2.2% |
| Black / African American | 479 | 7.8% |
| Hawaiian / Pacific | 0 | 0.0% |
| Hispanic or Latino | 396 | 6.5% |
| Native / Alaskan | 0 | 0.0% |
| White / Caucasian | 5,114 | 83.5% |
| Two or more Races | 359 | 5.9% |
| Some other Race | 33 | 0.5% |
| Total | 6,123 | 100.0% |
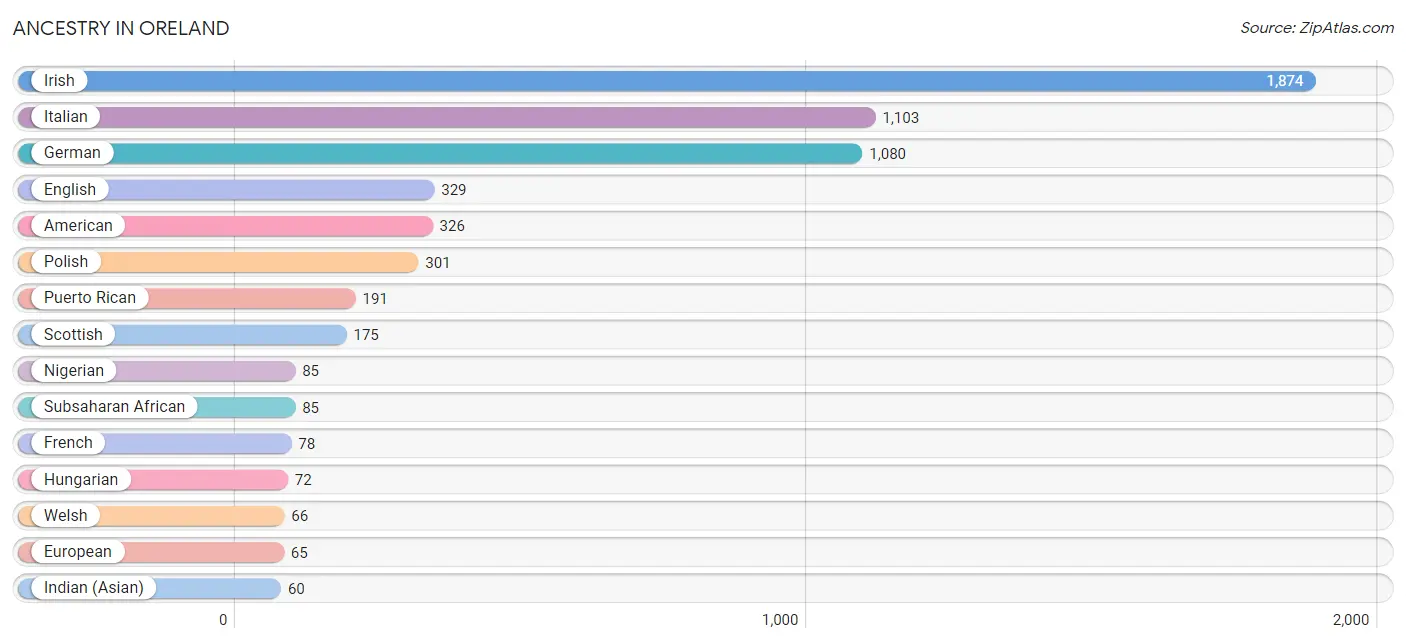
Ancestry in Oreland
The most populous ancestries reported in Oreland are Irish (1,874 | 30.6%), Italian (1,103 | 18.0%), German (1,080 | 17.6%), English (329 | 5.4%), and American (326 | 5.3%), together accounting for 76.9% of all Oreland residents.
| Ancestry | # Population | % Population |
| American | 326 | 5.3% |
| Arab | 28 | 0.5% |
| Austrian | 12 | 0.2% |
| British | 22 | 0.4% |
| British West Indian | 14 | 0.2% |
| Central American | 45 | 0.7% |
| Cherokee | 18 | 0.3% |
| Croatian | 8 | 0.1% |
| Cuban | 43 | 0.7% |
| Czech | 3 | 0.1% |
| Czechoslovakian | 4 | 0.1% |
| Danish | 11 | 0.2% |
| Dutch | 22 | 0.4% |
| Eastern European | 48 | 0.8% |
| Egyptian | 8 | 0.1% |
| English | 329 | 5.4% |
| European | 65 | 1.1% |
| Filipino | 3 | 0.1% |
| French | 78 | 1.3% |
| German | 1,080 | 17.6% |
| Greek | 13 | 0.2% |
| Guatemalan | 45 | 0.7% |
| Hungarian | 72 | 1.2% |
| Indian (Asian) | 60 | 1.0% |
| Irish | 1,874 | 30.6% |
| Italian | 1,103 | 18.0% |
| Jamaican | 56 | 0.9% |
| Japanese | 47 | 0.8% |
| Korean | 6 | 0.1% |
| Lebanese | 20 | 0.3% |
| Lithuanian | 3 | 0.1% |
| Maltese | 48 | 0.8% |
| Mexican | 39 | 0.6% |
| Nigerian | 85 | 1.4% |
| Northern European | 4 | 0.1% |
| Norwegian | 49 | 0.8% |
| Pennsylvania German | 4 | 0.1% |
| Polish | 301 | 4.9% |
| Puerto Rican | 191 | 3.1% |
| Romanian | 17 | 0.3% |
| Russian | 59 | 1.0% |
| Samoan | 12 | 0.2% |
| Scandinavian | 7 | 0.1% |
| Scotch-Irish | 46 | 0.7% |
| Scottish | 175 | 2.9% |
| Slovak | 13 | 0.2% |
| Subsaharan African | 85 | 1.4% |
| Swedish | 32 | 0.5% |
| Swiss | 17 | 0.3% |
| Thai | 22 | 0.4% |
| Ukrainian | 20 | 0.3% |
| Welsh | 66 | 1.1% | View All 52 Rows |
Immigrants in Oreland
The most numerous immigrant groups reported in Oreland came from Latin America (94 | 1.5%), Asia (88 | 1.4%), Europe (69 | 1.1%), Africa (66 | 1.1%), and South Eastern Asia (61 | 1.0%), together accounting for 6.2% of all Oreland residents.
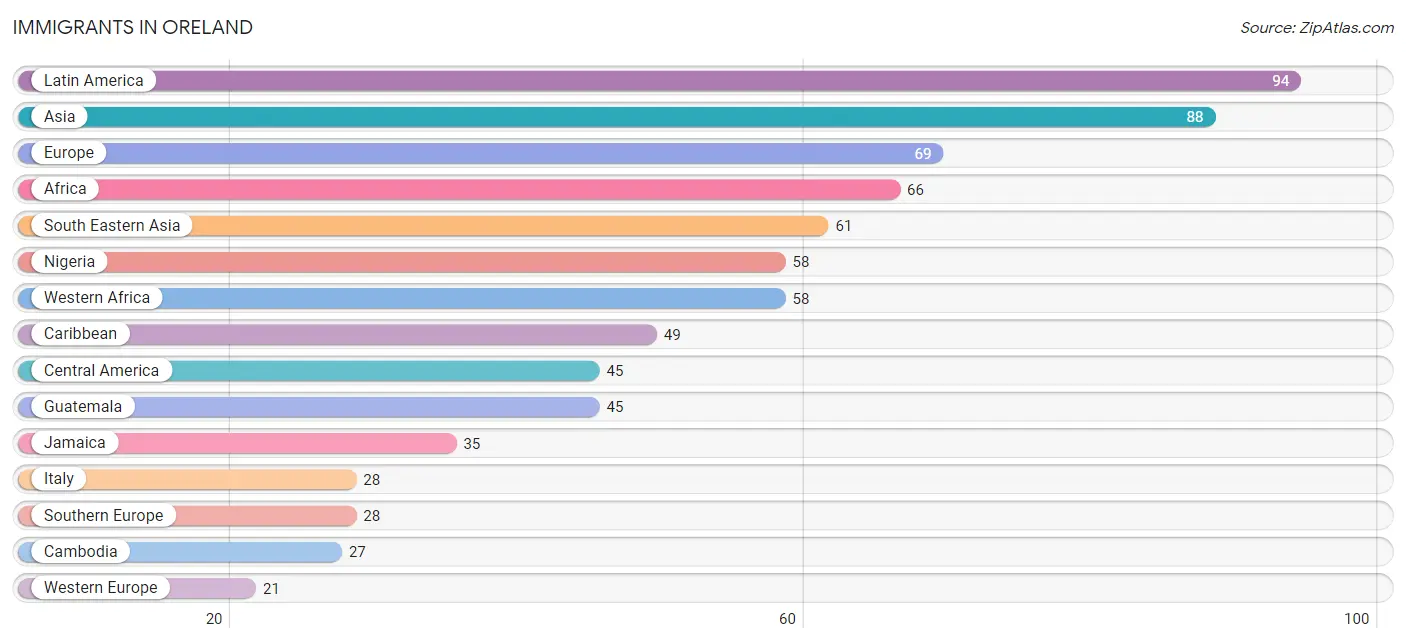
| Immigration Origin | # Population | % Population |
| Africa | 66 | 1.1% |
| Asia | 88 | 1.4% |
| Cambodia | 27 | 0.4% |
| Caribbean | 49 | 0.8% |
| Central America | 45 | 0.7% |
| China | 16 | 0.3% |
| Eastern Asia | 16 | 0.3% |
| Eastern Europe | 12 | 0.2% |
| Egypt | 8 | 0.1% |
| England | 8 | 0.1% |
| Europe | 69 | 1.1% |
| France | 6 | 0.1% |
| Germany | 15 | 0.2% |
| Guatemala | 45 | 0.7% |
| Hong Kong | 13 | 0.2% |
| India | 11 | 0.2% |
| Italy | 28 | 0.5% |
| Jamaica | 35 | 0.6% |
| Latin America | 94 | 1.5% |
| Malaysia | 14 | 0.2% |
| Nigeria | 58 | 0.9% |
| Northern Africa | 8 | 0.1% |
| Northern Europe | 8 | 0.1% |
| Oceania | 12 | 0.2% |
| Russia | 12 | 0.2% |
| Singapore | 8 | 0.1% |
| South Central Asia | 11 | 0.2% |
| South Eastern Asia | 61 | 1.0% |
| Southern Europe | 28 | 0.5% |
| Taiwan | 3 | 0.1% |
| Trinidad and Tobago | 14 | 0.2% |
| Vietnam | 12 | 0.2% |
| Western Africa | 58 | 0.9% |
| Western Europe | 21 | 0.3% | View All 34 Rows |
Sex and Age in Oreland
Sex and Age in Oreland
The most populous age groups in Oreland are 40 to 44 Years (311 | 10.4%) for men and 5 to 9 Years (363 | 11.6%) for women.
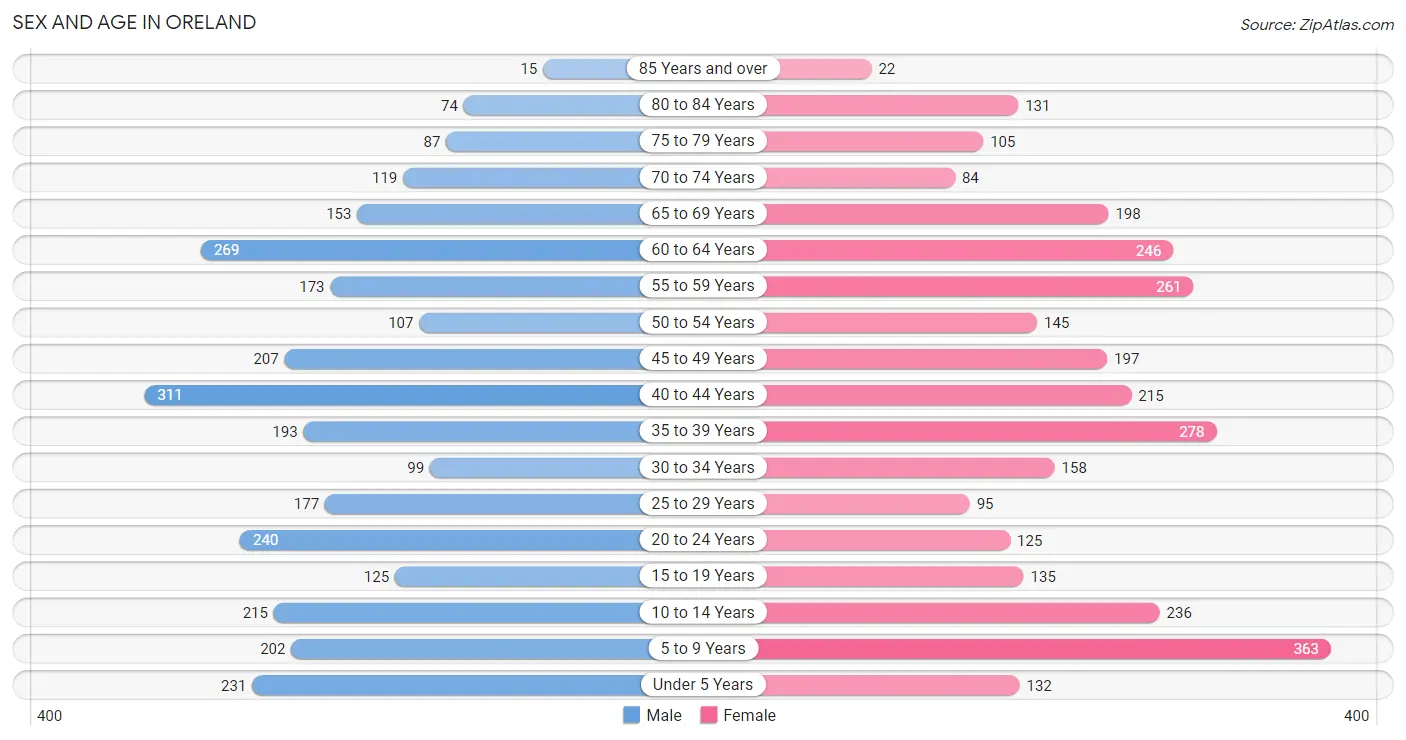
| Age Bracket | Male | Female |
| Under 5 Years | 231 (7.7%) | 132 (4.2%) |
| 5 to 9 Years | 202 (6.7%) | 363 (11.6%) |
| 10 to 14 Years | 215 (7.2%) | 236 (7.5%) |
| 15 to 19 Years | 125 (4.2%) | 135 (4.3%) |
| 20 to 24 Years | 240 (8.0%) | 125 (4.0%) |
| 25 to 29 Years | 177 (5.9%) | 95 (3.0%) |
| 30 to 34 Years | 99 (3.3%) | 158 (5.1%) |
| 35 to 39 Years | 193 (6.4%) | 278 (8.9%) |
| 40 to 44 Years | 311 (10.4%) | 215 (6.9%) |
| 45 to 49 Years | 207 (6.9%) | 197 (6.3%) |
| 50 to 54 Years | 107 (3.6%) | 145 (4.6%) |
| 55 to 59 Years | 173 (5.8%) | 261 (8.4%) |
| 60 to 64 Years | 269 (9.0%) | 246 (7.9%) |
| 65 to 69 Years | 153 (5.1%) | 198 (6.3%) |
| 70 to 74 Years | 119 (4.0%) | 84 (2.7%) |
| 75 to 79 Years | 87 (2.9%) | 105 (3.4%) |
| 80 to 84 Years | 74 (2.5%) | 131 (4.2%) |
| 85 Years and over | 15 (0.5%) | 22 (0.7%) |
| Total | 2,997 (100.0%) | 3,126 (100.0%) |
Families and Households in Oreland
Median Family Size in Oreland
The median family size in Oreland is 3.21 persons per family, with single male/father families (55 | 3.3%) accounting for the largest median family size of 3.33 persons per family. On the other hand, single female/mother families (237 | 14.3%) represent the smallest median family size with 2.85 persons per family.
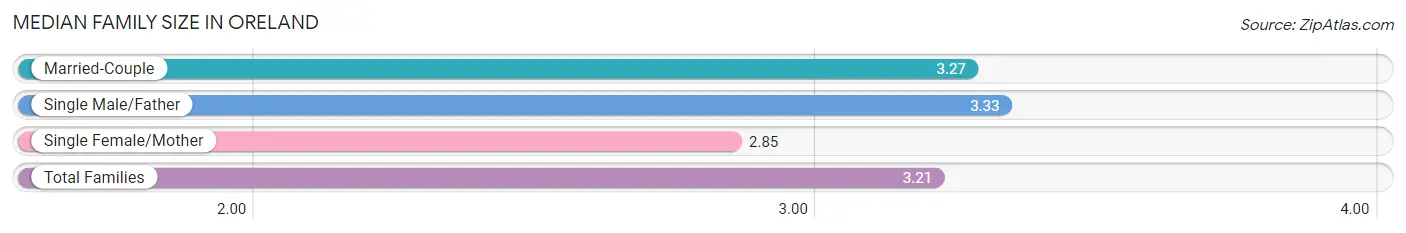
| Family Type | # Families | Family Size |
| Married-Couple | 1,360 (82.3%) | 3.27 |
| Single Male/Father | 55 (3.3%) | 3.33 |
| Single Female/Mother | 237 (14.3%) | 2.85 |
| Total Families | 1,652 (100.0%) | 3.21 |
Median Household Size in Oreland
The median household size in Oreland is 2.70 persons per household, with single male/father households (55 | 2.4%) accounting for the largest median household size of 3.71 persons per household. non-family households (612 | 27.0%) represent the smallest median household size with 1.17 persons per household.
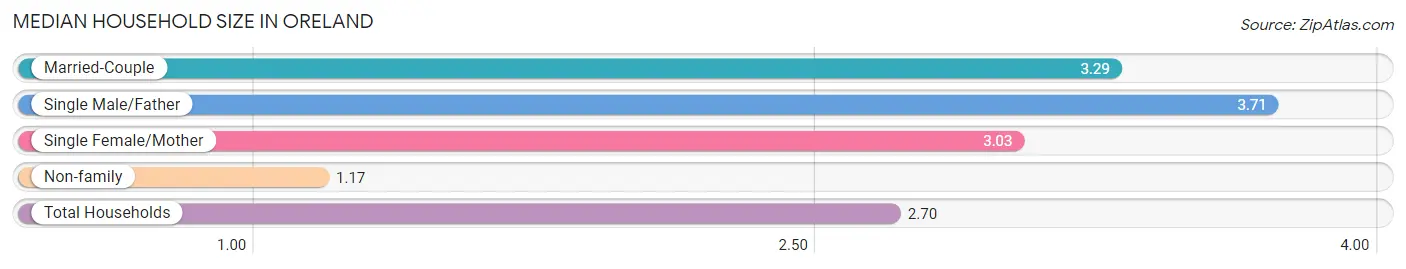
| Household Type | # Households | Household Size |
| Married-Couple | 1,360 (60.1%) | 3.29 |
| Single Male/Father | 55 (2.4%) | 3.71 |
| Single Female/Mother | 237 (10.5%) | 3.03 |
| Non-family | 612 (27.0%) | 1.17 |
| Total Households | 2,264 (100.0%) | 2.70 |
Household Size by Marriage Status in Oreland
Out of a total of 2,264 households in Oreland, 1,652 (73.0%) are family households, while 612 (27.0%) are nonfamily households. The most numerous type of family households are 2-person households, comprising 682, and the most common type of nonfamily households are 1-person households, comprising 537.
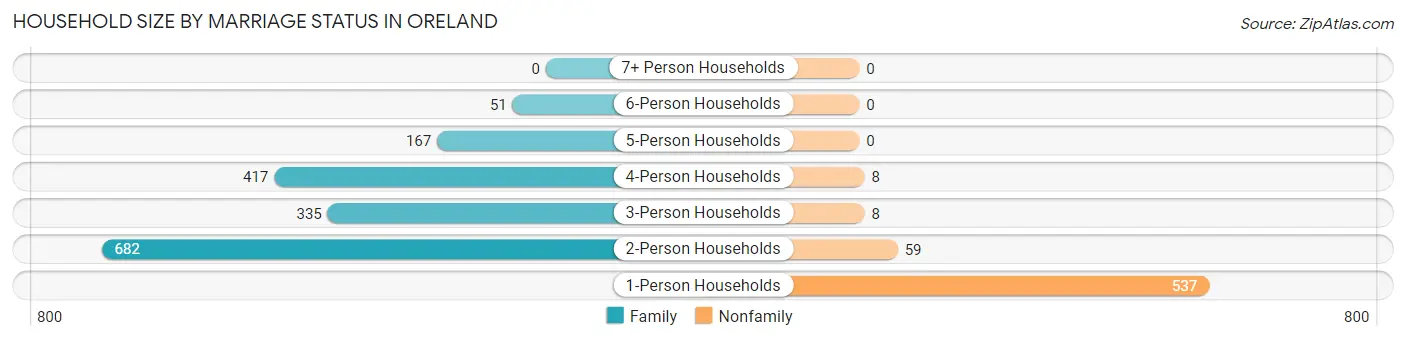
| Household Size | Family Households | Nonfamily Households |
| 1-Person Households | - | 537 (23.7%) |
| 2-Person Households | 682 (30.1%) | 59 (2.6%) |
| 3-Person Households | 335 (14.8%) | 8 (0.4%) |
| 4-Person Households | 417 (18.4%) | 8 (0.4%) |
| 5-Person Households | 167 (7.4%) | 0 (0.0%) |
| 6-Person Households | 51 (2.2%) | 0 (0.0%) |
| 7+ Person Households | 0 (0.0%) | 0 (0.0%) |
| Total | 1,652 (73.0%) | 612 (27.0%) |
Female Fertility in Oreland
Fertility by Age in Oreland
Average fertility rate in Oreland is 43.0 births per 1,000 women. Women in the age bracket of 20 to 34 years have the highest fertility rate with 90.0 births per 1,000 women. Women in the age bracket of 20 to 34 years acount for 64.1% of all women with births.
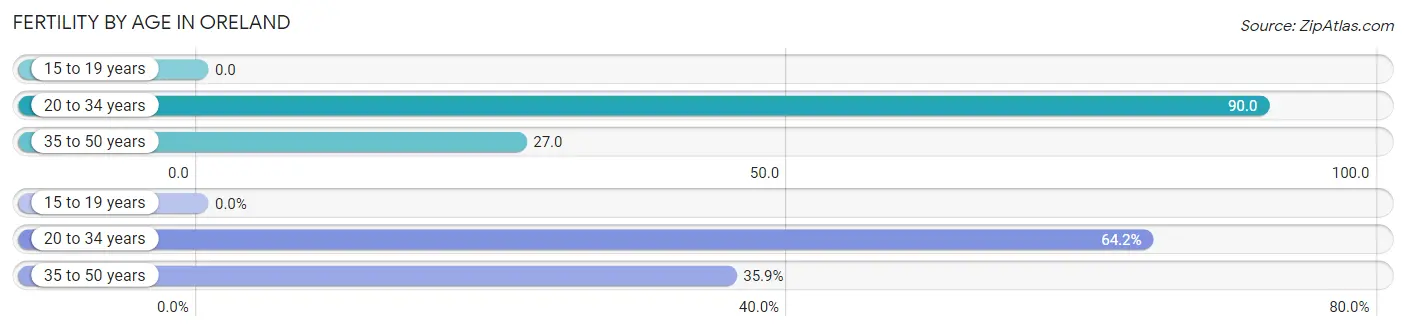
| Age Bracket | Women with Births | Births / 1,000 Women |
| 15 to 19 years | 0 (0.0%) | 0.0 |
| 20 to 34 years | 34 (64.1%) | 90.0 |
| 35 to 50 years | 19 (35.8%) | 27.0 |
| Total | 53 (100.0%) | 43.0 |
Fertility by Age by Marriage Status in Oreland
60.4% of women with births (53) in Oreland are married. The highest percentage of unmarried women with births falls into 20 to 34 years age bracket with 61.8% of them unmarried at the time of birth, while the lowest percentage of unmarried women with births belong to 35 to 50 years age bracket with 0.0% of them unmarried.
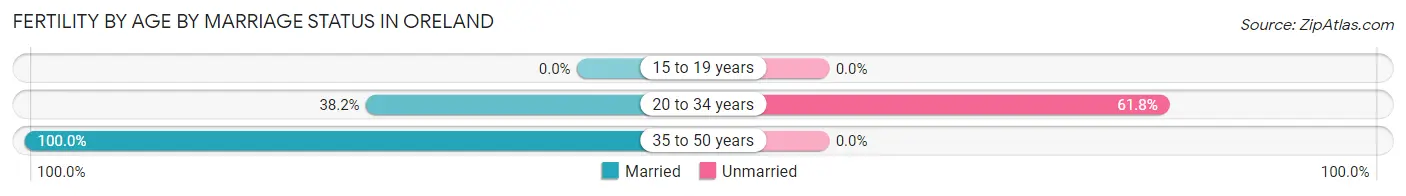
| Age Bracket | Married | Unmarried |
| 15 to 19 years | 0 (0.0%) | 0 (0.0%) |
| 20 to 34 years | 13 (38.2%) | 21 (61.8%) |
| 35 to 50 years | 19 (100.0%) | 0 (0.0%) |
| Total | 32 (60.4%) | 21 (39.6%) |
Fertility by Education in Oreland
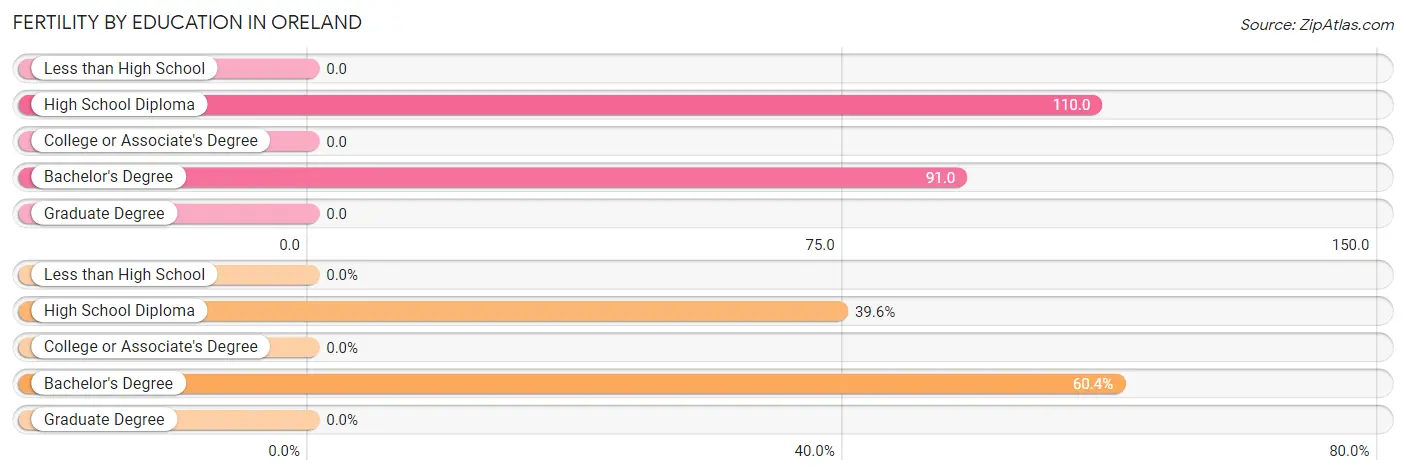
| Educational Attainment | Women with Births | Births / 1,000 Women |
| Less than High School | 0 (0.0%) | 0.0 |
| High School Diploma | 21 (39.6%) | 110.0 |
| College or Associate's Degree | 0 (0.0%) | 0.0 |
| Bachelor's Degree | 32 (60.4%) | 91.0 |
| Graduate Degree | 0 (0.0%) | 0.0 |
| Total | 53 (100.0%) | 43.0 |
Fertility by Education by Marriage Status in Oreland
39.6% of women with births in Oreland are unmarried. Women with the educational attainment of bachelor's degree are most likely to be married with 100.0% of them married at childbirth, while women with the educational attainment of high school diploma are least likely to be married with 100.0% of them unmarried at childbirth.

| Educational Attainment | Married | Unmarried |
| Less than High School | 0 (0.0%) | 0 (0.0%) |
| High School Diploma | 0 (0.0%) | 21 (100.0%) |
| College or Associate's Degree | 0 (0.0%) | 0 (0.0%) |
| Bachelor's Degree | 32 (100.0%) | 0 (0.0%) |
| Graduate Degree | 0 (0.0%) | 0 (0.0%) |
| Total | 32 (60.4%) | 21 (39.6%) |
Employment Characteristics in Oreland
Employment by Class of Employer in Oreland
Among the 3,132 employed individuals in Oreland, private company employees (1,821 | 58.1%), not-for-profit organizations (507 | 16.2%), and local government employees (313 | 10.0%) make up the most common classes of employment.
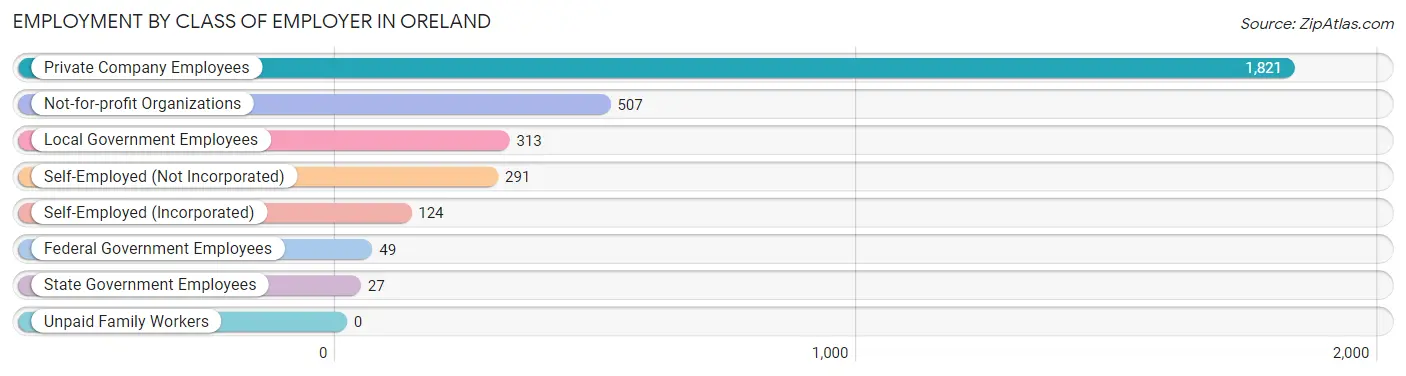
| Employer Class | # Employees | % Employees |
| Private Company Employees | 1,821 | 58.1% |
| Self-Employed (Incorporated) | 124 | 4.0% |
| Self-Employed (Not Incorporated) | 291 | 9.3% |
| Not-for-profit Organizations | 507 | 16.2% |
| Local Government Employees | 313 | 10.0% |
| State Government Employees | 27 | 0.9% |
| Federal Government Employees | 49 | 1.6% |
| Unpaid Family Workers | 0 | 0.0% |
| Total | 3,132 | 100.0% |
Employment Status by Age in Oreland
According to the labor force statistics for Oreland, out of the total population over 16 years of age (4,705), 71.5% or 3,364 individuals are in the labor force, with 5.6% or 188 of them unemployed. The age group with the highest labor force participation rate is 25 to 29 years, with 91.5% or 249 individuals in the labor force. Within the labor force, the 16 to 19 years age range has the highest percentage of unemployed individuals, with 31.8% or 21 of them being unemployed.
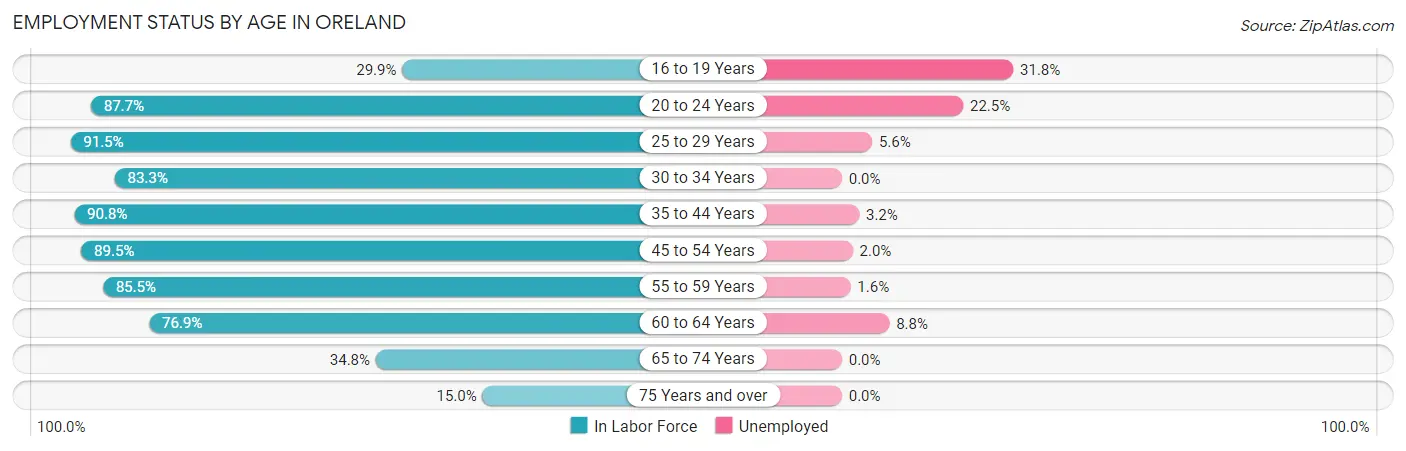
| Age Bracket | In Labor Force | Unemployed |
| 16 to 19 Years | 66 (29.9%) | 21 (31.8%) |
| 20 to 24 Years | 320 (87.7%) | 72 (22.5%) |
| 25 to 29 Years | 249 (91.5%) | 14 (5.6%) |
| 30 to 34 Years | 214 (83.3%) | 0 (0.0%) |
| 35 to 44 Years | 905 (90.8%) | 29 (3.2%) |
| 45 to 54 Years | 587 (89.5%) | 12 (2.0%) |
| 55 to 59 Years | 371 (85.5%) | 6 (1.6%) |
| 60 to 64 Years | 396 (76.9%) | 35 (8.8%) |
| 65 to 74 Years | 193 (34.8%) | 0 (0.0%) |
| 75 Years and over | 65 (15.0%) | 0 (0.0%) |
| Total | 3,364 (71.5%) | 188 (5.6%) |
Employment Status by Educational Attainment in Oreland
According to labor force statistics for Oreland, 86.9% of individuals (2,721) out of the total population between 25 and 64 years of age (3,131) are in the labor force, with 3.5% or 95 of them being unemployed. The group with the highest labor force participation rate are those with the educational attainment of college / associate degree, with 92.6% or 490 individuals in the labor force. Within the labor force, individuals with college / associate degree education have the highest percentage of unemployment, with 6.1% or 30 of them being unemployed.
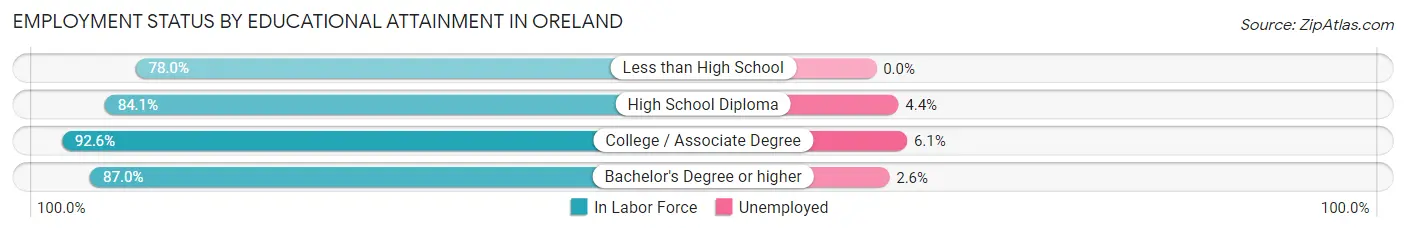
| Educational Attainment | In Labor Force | Unemployed |
| Less than High School | 96 (78.0%) | 0 (0.0%) |
| High School Diploma | 587 (84.1%) | 31 (4.4%) |
| College / Associate Degree | 490 (92.6%) | 32 (6.1%) |
| Bachelor's Degree or higher | 1,549 (87.0%) | 46 (2.6%) |
| Total | 2,721 (86.9%) | 110 (3.5%) |
Employment Occupations by Sex in Oreland
Management, Business, Science and Arts Occupations
The most common Management, Business, Science and Arts occupations in Oreland are Community & Social Service (416 | 13.1%), Management (354 | 11.1%), Business & Financial (321 | 10.1%), Education Instruction & Library (270 | 8.5%), and Computers, Engineering & Science (228 | 7.2%).
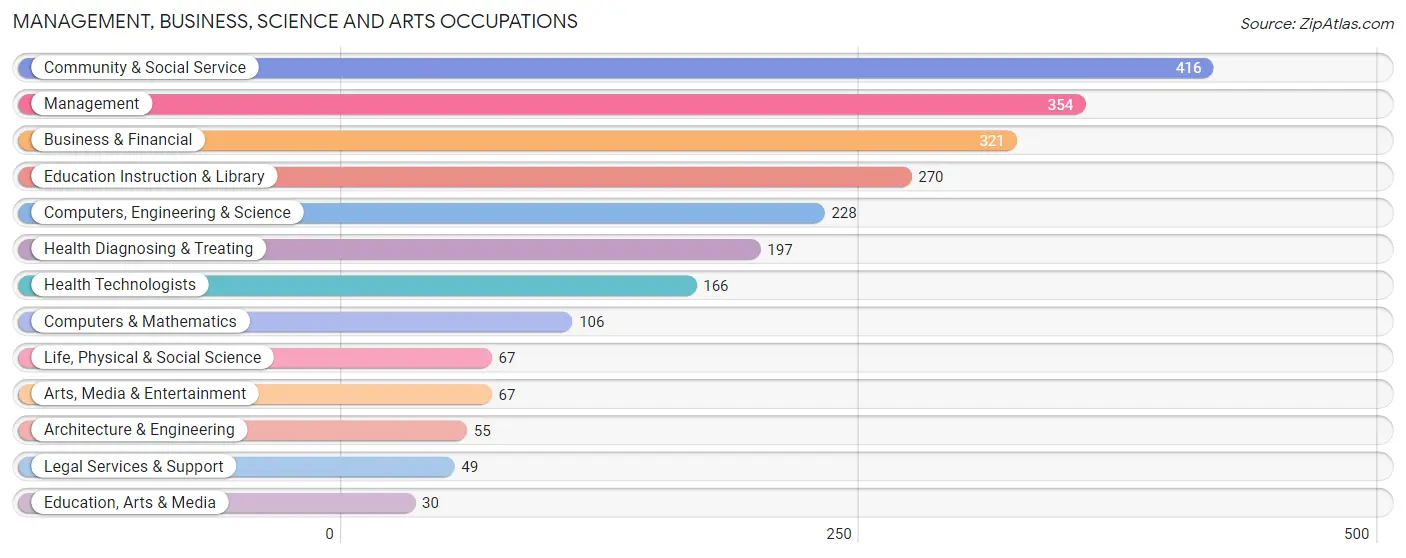
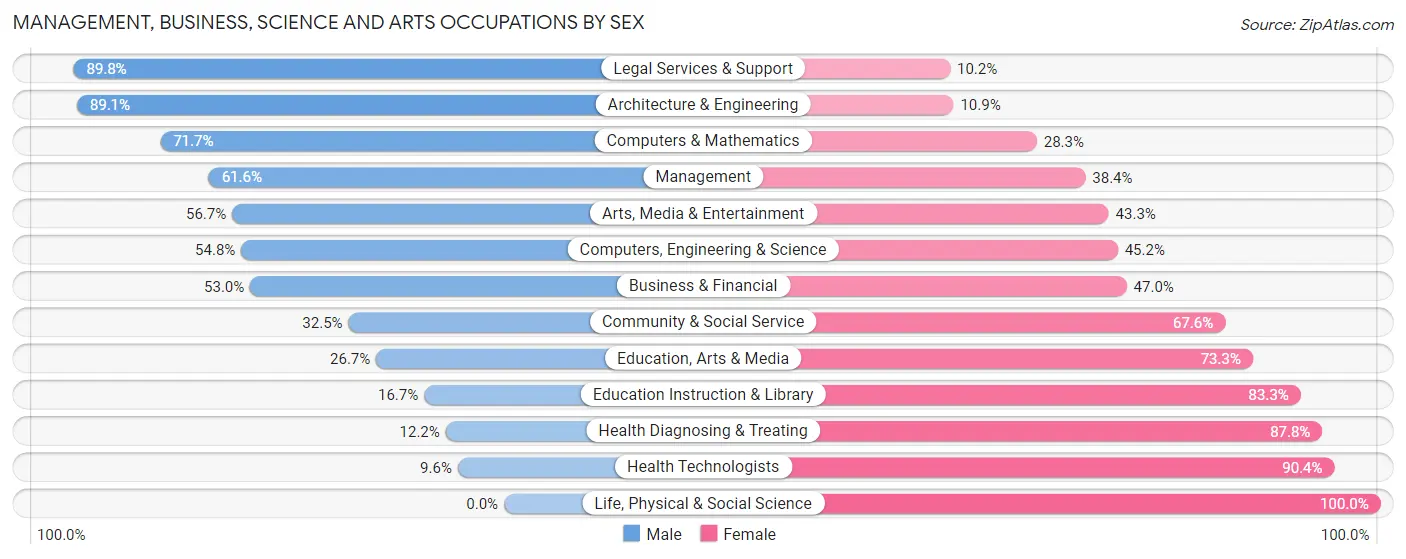
Management, Business, Science and Arts Occupations by Sex
Within the Management, Business, Science and Arts occupations in Oreland, the most male-oriented occupations are Legal Services & Support (89.8%), Architecture & Engineering (89.1%), and Computers & Mathematics (71.7%), while the most female-oriented occupations are Life, Physical & Social Science (100.0%), Health Technologists (90.4%), and Health Diagnosing & Treating (87.8%).
| Occupation | Male | Female |
| Management | 218 (61.6%) | 136 (38.4%) |
| Business & Financial | 170 (53.0%) | 151 (47.0%) |
| Computers, Engineering & Science | 125 (54.8%) | 103 (45.2%) |
| Computers & Mathematics | 76 (71.7%) | 30 (28.3%) |
| Architecture & Engineering | 49 (89.1%) | 6 (10.9%) |
| Life, Physical & Social Science | 0 (0.0%) | 67 (100.0%) |
| Community & Social Service | 135 (32.5%) | 281 (67.5%) |
| Education, Arts & Media | 8 (26.7%) | 22 (73.3%) |
| Legal Services & Support | 44 (89.8%) | 5 (10.2%) |
| Education Instruction & Library | 45 (16.7%) | 225 (83.3%) |
| Arts, Media & Entertainment | 38 (56.7%) | 29 (43.3%) |
| Health Diagnosing & Treating | 24 (12.2%) | 173 (87.8%) |
| Health Technologists | 16 (9.6%) | 150 (90.4%) |
| Total (Category) | 672 (44.3%) | 844 (55.7%) |
| Total (Overall) | 1,674 (52.7%) | 1,503 (47.3%) |
Services Occupations
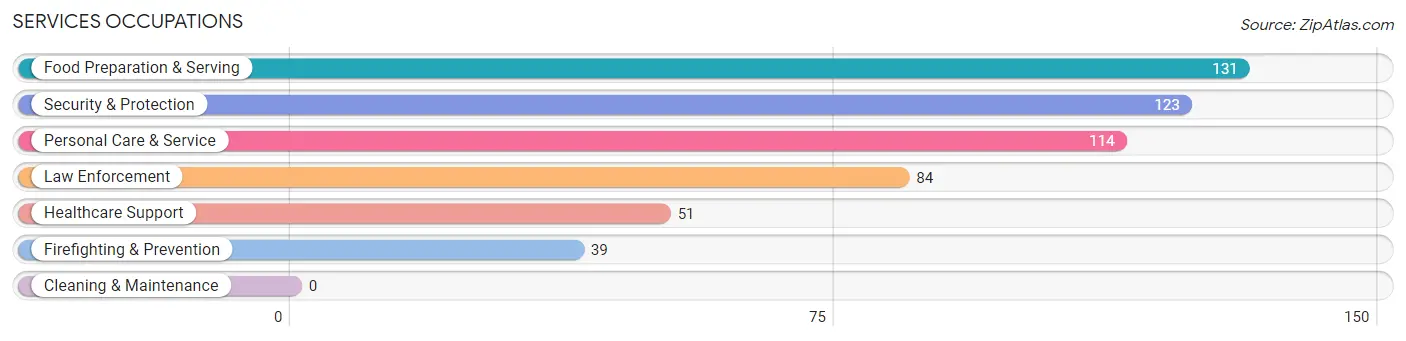
The most common Services occupations in Oreland are Food Preparation & Serving (131 | 4.1%), Security & Protection (123 | 3.9%), Personal Care & Service (114 | 3.6%), Law Enforcement (84 | 2.6%), and Healthcare Support (51 | 1.6%).
Services Occupations by Sex
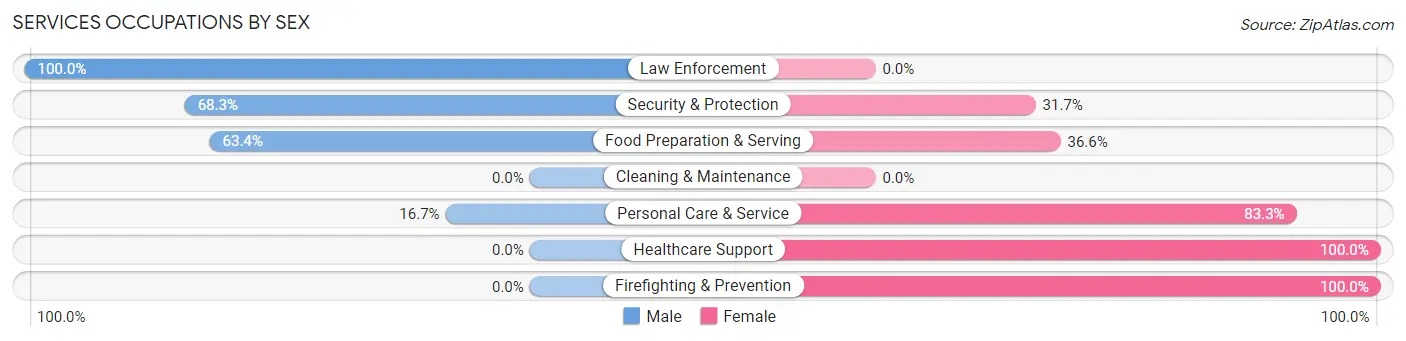
Within the Services occupations in Oreland, the most male-oriented occupations are Law Enforcement (100.0%), Security & Protection (68.3%), and Food Preparation & Serving (63.4%), while the most female-oriented occupations are Healthcare Support (100.0%), Firefighting & Prevention (100.0%), and Personal Care & Service (83.3%).
| Occupation | Male | Female |
| Healthcare Support | 0 (0.0%) | 51 (100.0%) |
| Security & Protection | 84 (68.3%) | 39 (31.7%) |
| Firefighting & Prevention | 0 (0.0%) | 39 (100.0%) |
| Law Enforcement | 84 (100.0%) | 0 (0.0%) |
| Food Preparation & Serving | 83 (63.4%) | 48 (36.6%) |
| Cleaning & Maintenance | 0 (0.0%) | 0 (0.0%) |
| Personal Care & Service | 19 (16.7%) | 95 (83.3%) |
| Total (Category) | 186 (44.4%) | 233 (55.6%) |
| Total (Overall) | 1,674 (52.7%) | 1,503 (47.3%) |
Sales and Office Occupations
The most common Sales and Office occupations in Oreland are Sales & Related (402 | 12.7%), and Office & Administration (251 | 7.9%).

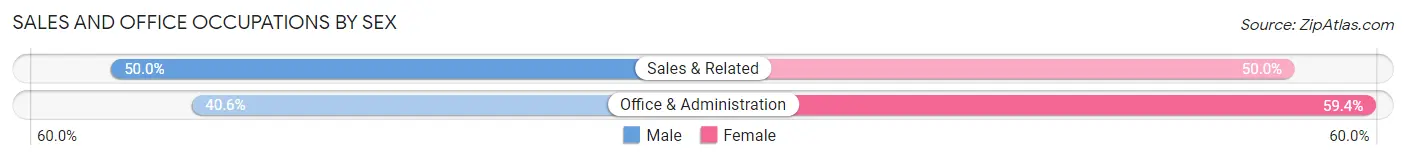
Sales and Office Occupations by Sex
| Occupation | Male | Female |
| Sales & Related | 201 (50.0%) | 201 (50.0%) |
| Office & Administration | 102 (40.6%) | 149 (59.4%) |
| Total (Category) | 303 (46.4%) | 350 (53.6%) |
| Total (Overall) | 1,674 (52.7%) | 1,503 (47.3%) |
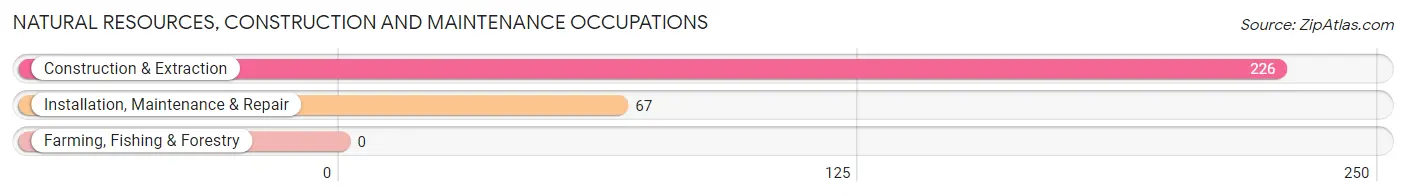
Natural Resources, Construction and Maintenance Occupations
The most common Natural Resources, Construction and Maintenance occupations in Oreland are Construction & Extraction (226 | 7.1%), and Installation, Maintenance & Repair (67 | 2.1%).
Natural Resources, Construction and Maintenance Occupations by Sex
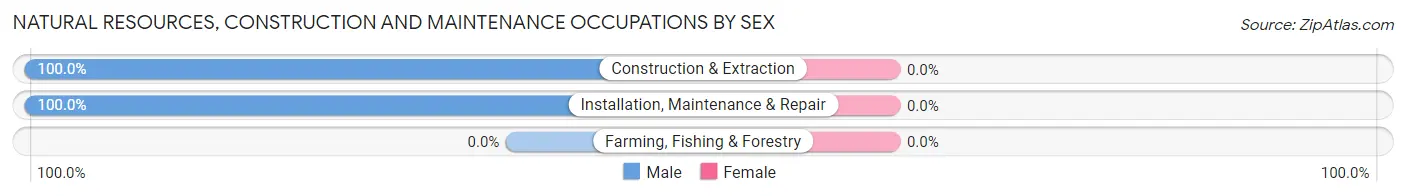
| Occupation | Male | Female |
| Farming, Fishing & Forestry | 0 (0.0%) | 0 (0.0%) |
| Construction & Extraction | 226 (100.0%) | 0 (0.0%) |
| Installation, Maintenance & Repair | 67 (100.0%) | 0 (0.0%) |
| Total (Category) | 293 (100.0%) | 0 (0.0%) |
| Total (Overall) | 1,674 (52.7%) | 1,503 (47.3%) |
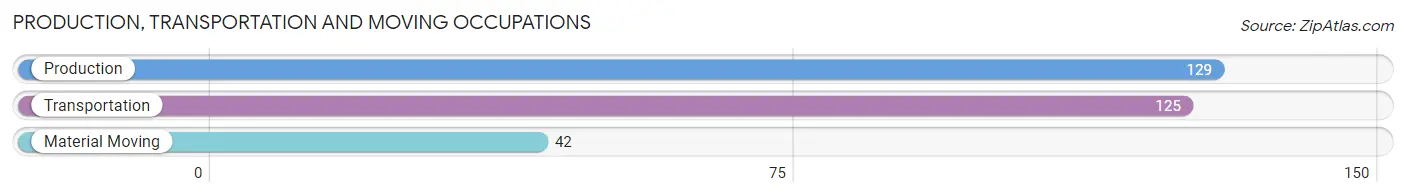
Production, Transportation and Moving Occupations
The most common Production, Transportation and Moving occupations in Oreland are Production (129 | 4.1%), Transportation (125 | 3.9%), and Material Moving (42 | 1.3%).
Production, Transportation and Moving Occupations by Sex
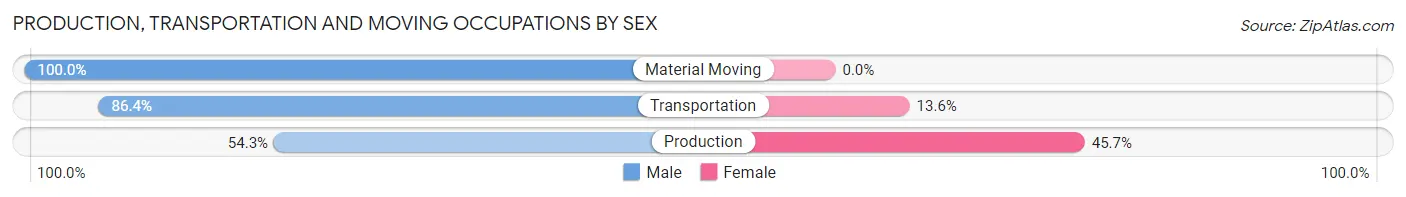
| Occupation | Male | Female |
| Production | 70 (54.3%) | 59 (45.7%) |
| Transportation | 108 (86.4%) | 17 (13.6%) |
| Material Moving | 42 (100.0%) | 0 (0.0%) |
| Total (Category) | 220 (74.3%) | 76 (25.7%) |
| Total (Overall) | 1,674 (52.7%) | 1,503 (47.3%) |
Employment Industries by Sex in Oreland
Employment Industries in Oreland
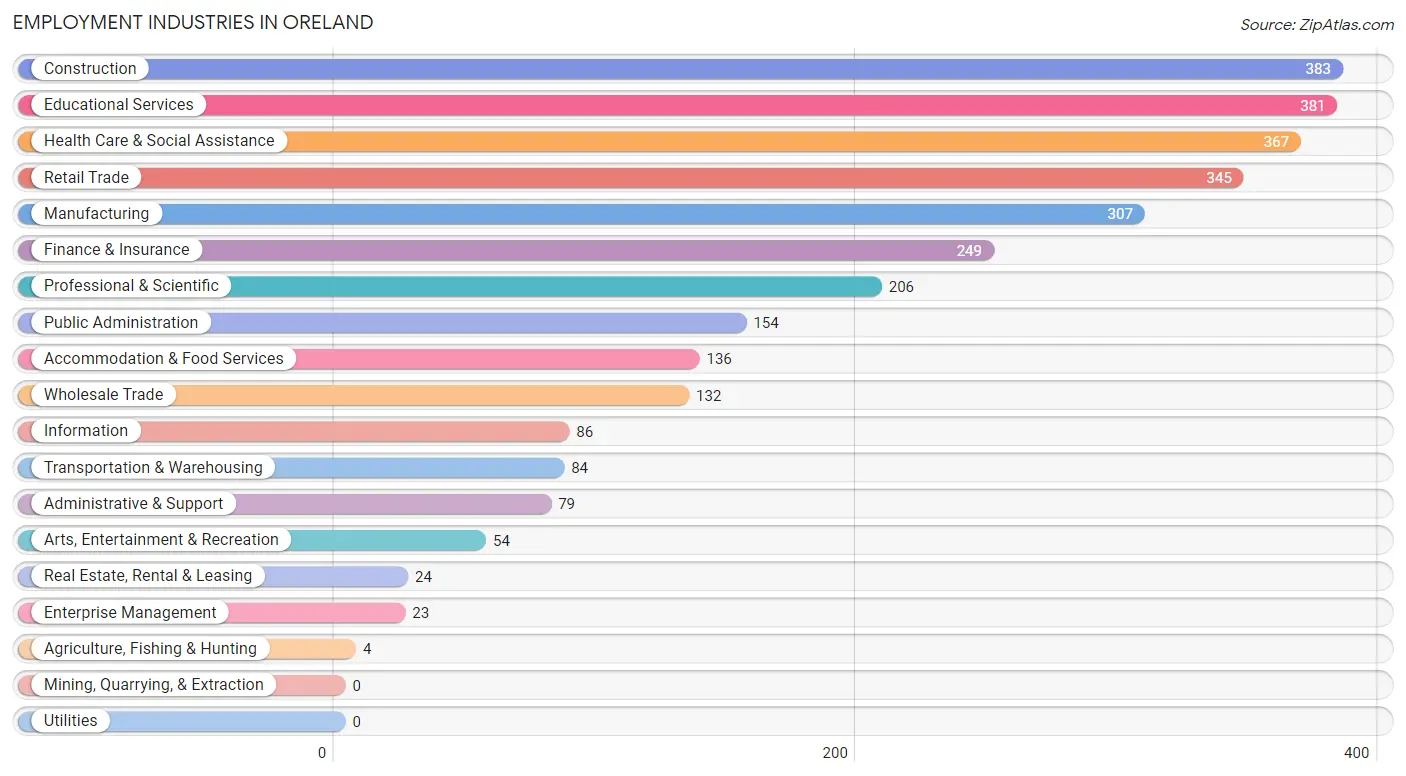
The major employment industries in Oreland include Construction (383 | 12.1%), Educational Services (381 | 12.0%), Health Care & Social Assistance (367 | 11.6%), Retail Trade (345 | 10.9%), and Manufacturing (307 | 9.7%).
Employment Industries by Sex in Oreland
The Oreland industries that see more men than women are Construction (96.1%), Administrative & Support (84.8%), and Public Administration (81.8%), whereas the industries that tend to have a higher number of women are Agriculture, Fishing & Hunting (100.0%), Enterprise Management (100.0%), and Health Care & Social Assistance (85.8%).
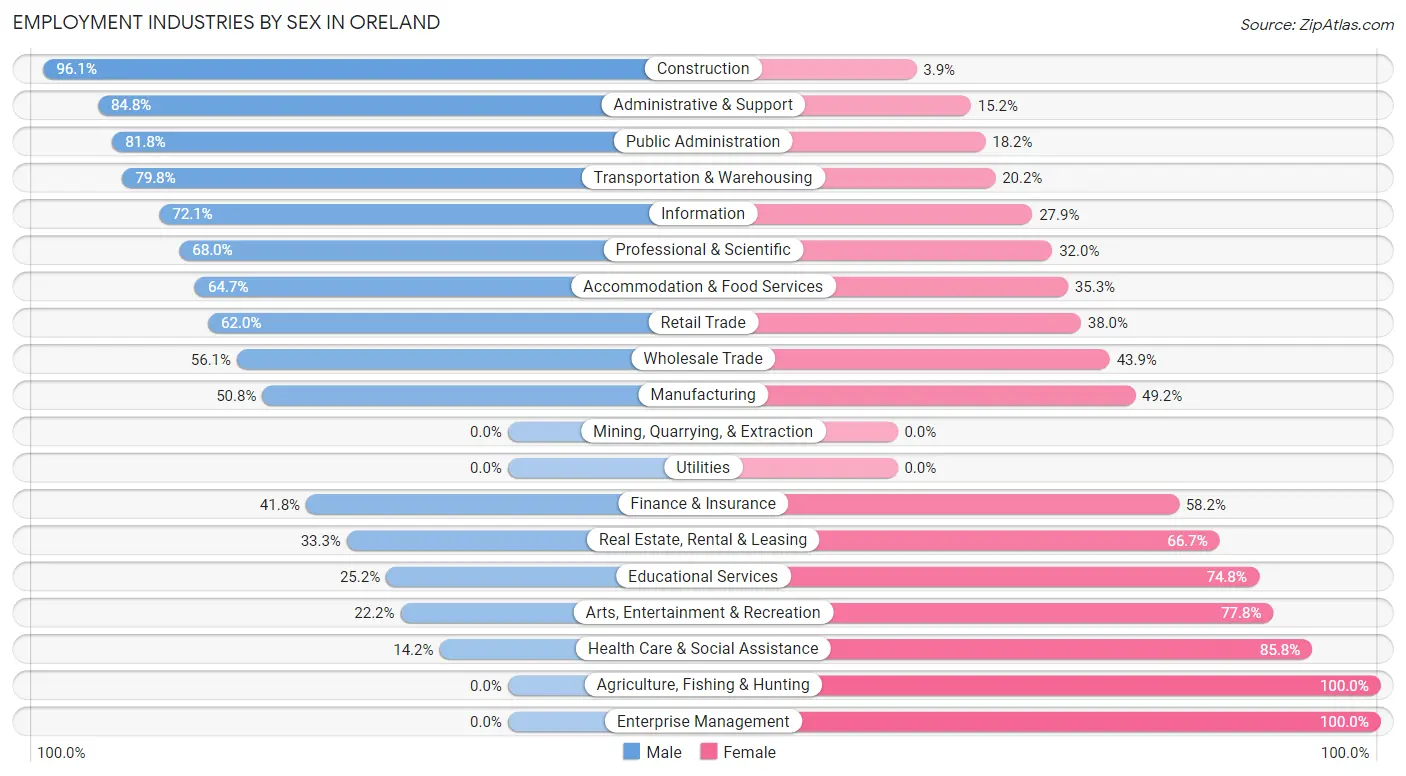
| Industry | Male | Female |
| Agriculture, Fishing & Hunting | 0 (0.0%) | 4 (100.0%) |
| Mining, Quarrying, & Extraction | 0 (0.0%) | 0 (0.0%) |
| Construction | 368 (96.1%) | 15 (3.9%) |
| Manufacturing | 156 (50.8%) | 151 (49.2%) |
| Wholesale Trade | 74 (56.1%) | 58 (43.9%) |
| Retail Trade | 214 (62.0%) | 131 (38.0%) |
| Transportation & Warehousing | 67 (79.8%) | 17 (20.2%) |
| Utilities | 0 (0.0%) | 0 (0.0%) |
| Information | 62 (72.1%) | 24 (27.9%) |
| Finance & Insurance | 104 (41.8%) | 145 (58.2%) |
| Real Estate, Rental & Leasing | 8 (33.3%) | 16 (66.7%) |
| Professional & Scientific | 140 (68.0%) | 66 (32.0%) |
| Enterprise Management | 0 (0.0%) | 23 (100.0%) |
| Administrative & Support | 67 (84.8%) | 12 (15.2%) |
| Educational Services | 96 (25.2%) | 285 (74.8%) |
| Health Care & Social Assistance | 52 (14.2%) | 315 (85.8%) |
| Arts, Entertainment & Recreation | 12 (22.2%) | 42 (77.8%) |
| Accommodation & Food Services | 88 (64.7%) | 48 (35.3%) |
| Public Administration | 126 (81.8%) | 28 (18.2%) |
| Total | 1,674 (52.7%) | 1,503 (47.3%) |
Education in Oreland
School Enrollment in Oreland
The most common levels of schooling among the 1,509 students in Oreland are elementary school (476 | 31.5%), middle school (319 | 21.1%), and college / undergraduate (228 | 15.1%).
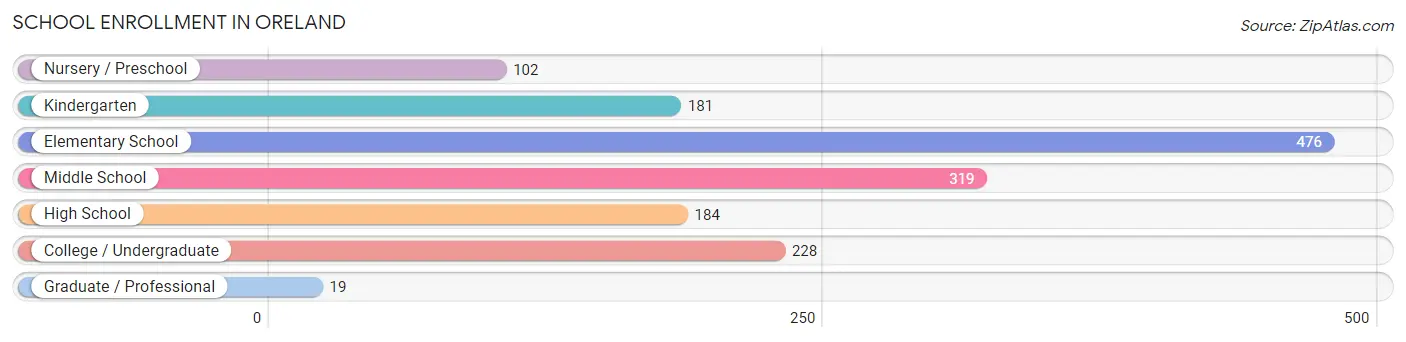
| School Level | # Students | % Students |
| Nursery / Preschool | 102 | 6.8% |
| Kindergarten | 181 | 12.0% |
| Elementary School | 476 | 31.5% |
| Middle School | 319 | 21.1% |
| High School | 184 | 12.2% |
| College / Undergraduate | 228 | 15.1% |
| Graduate / Professional | 19 | 1.3% |
| Total | 1,509 | 100.0% |
School Enrollment by Age by Funding Source in Oreland
Out of a total of 1,509 students who are enrolled in schools in Oreland, 305 (20.2%) attend a private institution, while the remaining 1,204 (79.8%) are enrolled in public schools. The age group of 18 to 19 year olds has the highest likelihood of being enrolled in private schools, with 54 (58.1% in the age bracket) enrolled. Conversely, the age group of 10 to 14 year olds has the lowest likelihood of being enrolled in a private school, with 428 (94.9% in the age bracket) attending a public institution.
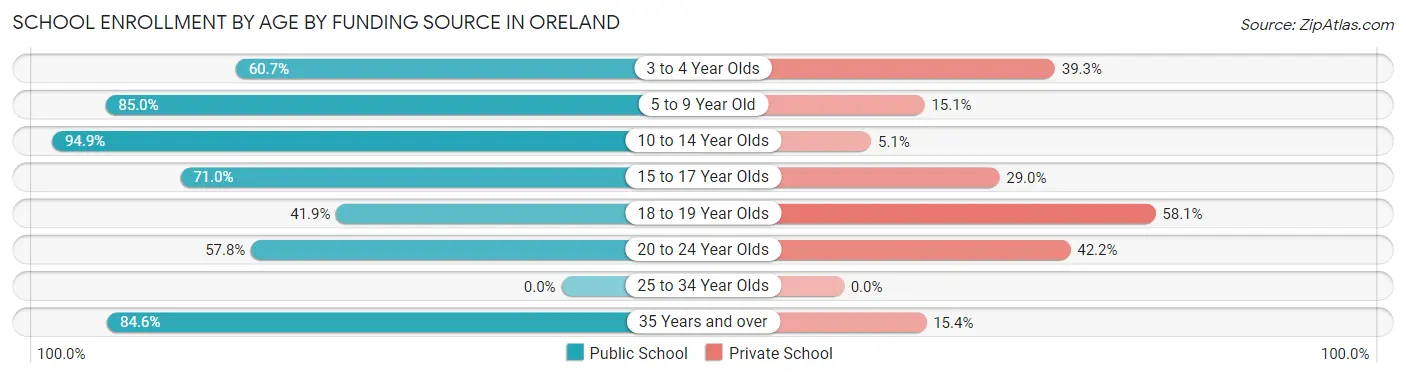
| Age Bracket | Public School | Private School |
| 3 to 4 Year Olds | 54 (60.7%) | 35 (39.3%) |
| 5 to 9 Year Old | 474 (85.0%) | 84 (15.0%) |
| 10 to 14 Year Olds | 428 (94.9%) | 23 (5.1%) |
| 15 to 17 Year Olds | 98 (71.0%) | 40 (29.0%) |
| 18 to 19 Year Olds | 39 (41.9%) | 54 (58.1%) |
| 20 to 24 Year Olds | 89 (57.8%) | 65 (42.2%) |
| 25 to 34 Year Olds | 0 (0.0%) | 0 (0.0%) |
| 35 Years and over | 22 (84.6%) | 4 (15.4%) |
| Total | 1,204 (79.8%) | 305 (20.2%) |
Educational Attainment by Field of Study in Oreland
Business (452 | 19.9%), science & technology (266 | 11.7%), education (223 | 9.8%), social sciences (212 | 9.3%), and bio, nature & agricultural (159 | 7.0%) are the most common fields of study among 2,270 individuals in Oreland who have obtained a bachelor's degree or higher.
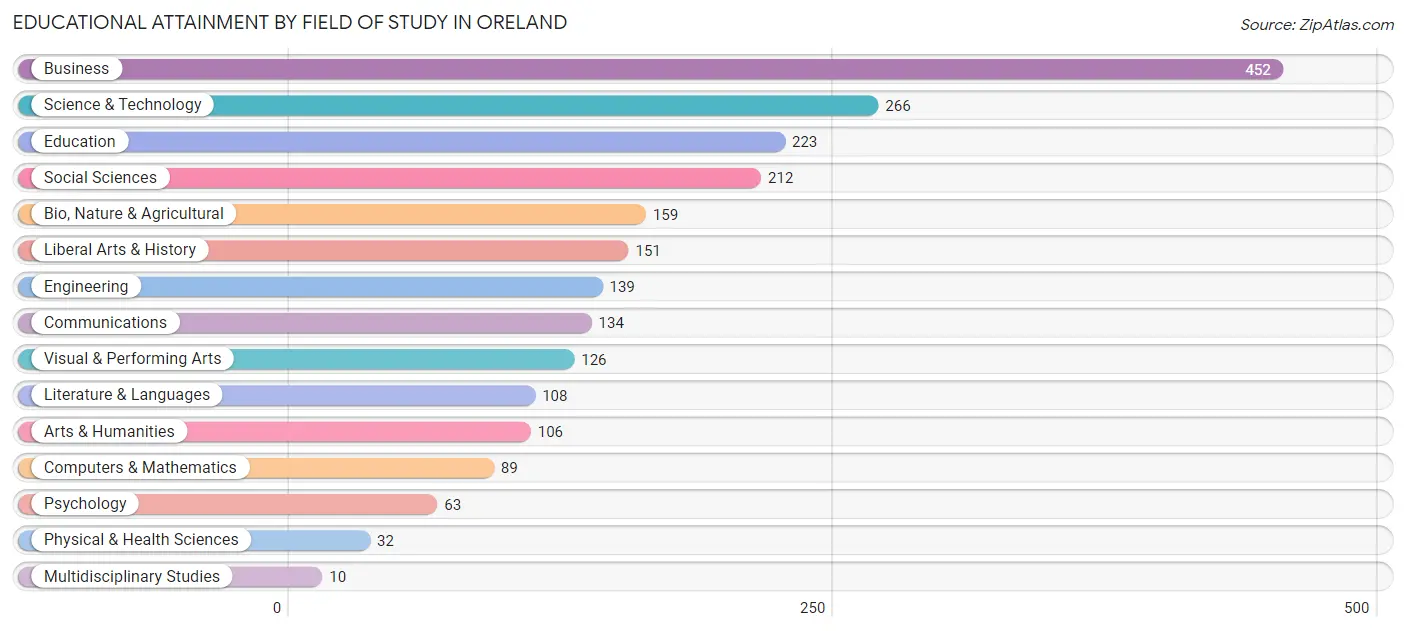
| Field of Study | # Graduates | % Graduates |
| Computers & Mathematics | 89 | 3.9% |
| Bio, Nature & Agricultural | 159 | 7.0% |
| Physical & Health Sciences | 32 | 1.4% |
| Psychology | 63 | 2.8% |
| Social Sciences | 212 | 9.3% |
| Engineering | 139 | 6.1% |
| Multidisciplinary Studies | 10 | 0.4% |
| Science & Technology | 266 | 11.7% |
| Business | 452 | 19.9% |
| Education | 223 | 9.8% |
| Literature & Languages | 108 | 4.8% |
| Liberal Arts & History | 151 | 6.7% |
| Visual & Performing Arts | 126 | 5.6% |
| Communications | 134 | 5.9% |
| Arts & Humanities | 106 | 4.7% |
| Total | 2,270 | 100.0% |
Transportation & Commute in Oreland
Vehicle Availability by Sex in Oreland
The most prevalent vehicle ownership categories in Oreland are males with 2 vehicles (826, accounting for 50.2%) and females with 2 vehicles (637, making up 55.6%).
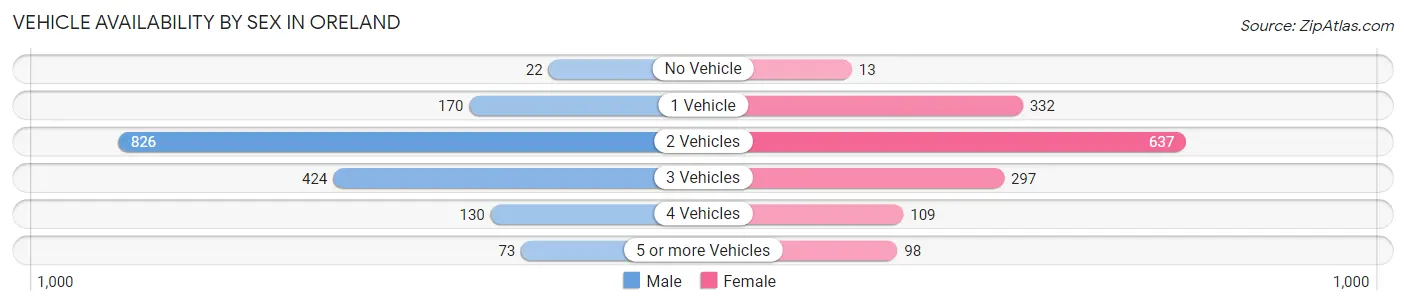
| Vehicles Available | Male | Female |
| No Vehicle | 22 (1.3%) | 13 (0.9%) |
| 1 Vehicle | 170 (10.3%) | 332 (22.3%) |
| 2 Vehicles | 826 (50.2%) | 637 (42.9%) |
| 3 Vehicles | 424 (25.8%) | 297 (20.0%) |
| 4 Vehicles | 130 (7.9%) | 109 (7.3%) |
| 5 or more Vehicles | 73 (4.4%) | 98 (6.6%) |
| Total | 1,645 (100.0%) | 1,486 (100.0%) |
Commute Time in Oreland
The most frequently occuring commute durations in Oreland are 15 to 19 minutes (370 commuters, 14.3%), 20 to 24 minutes (337 commuters, 13.0%), and 30 to 34 minutes (302 commuters, 11.6%).
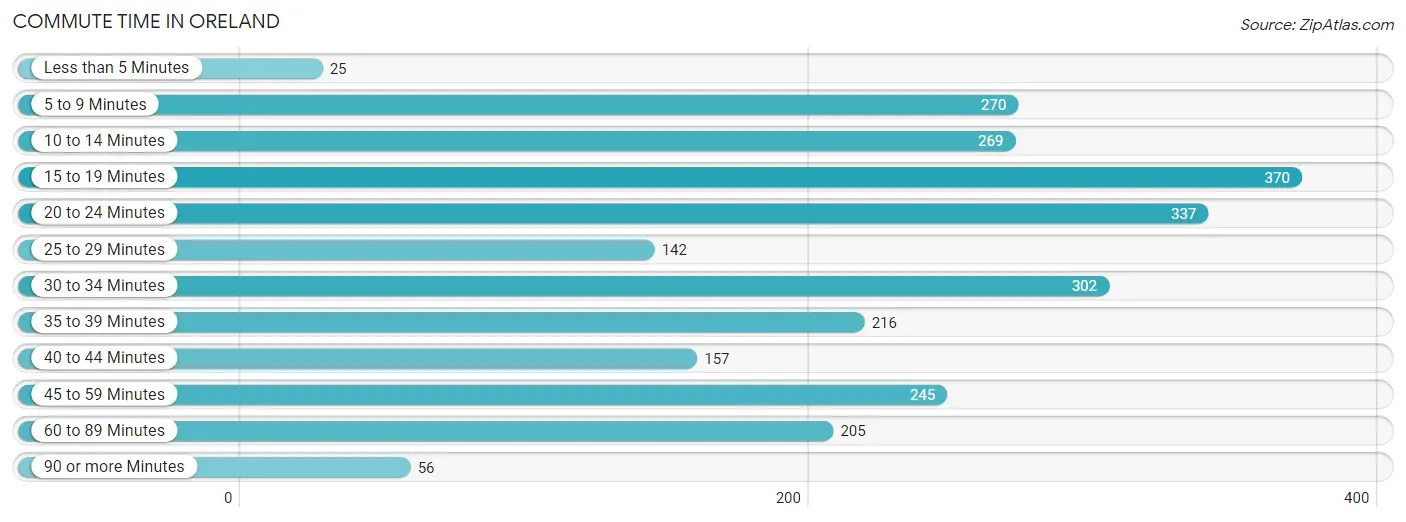
| Commute Time | # Commuters | % Commuters |
| Less than 5 Minutes | 25 | 1.0% |
| 5 to 9 Minutes | 270 | 10.4% |
| 10 to 14 Minutes | 269 | 10.4% |
| 15 to 19 Minutes | 370 | 14.3% |
| 20 to 24 Minutes | 337 | 13.0% |
| 25 to 29 Minutes | 142 | 5.5% |
| 30 to 34 Minutes | 302 | 11.6% |
| 35 to 39 Minutes | 216 | 8.3% |
| 40 to 44 Minutes | 157 | 6.0% |
| 45 to 59 Minutes | 245 | 9.4% |
| 60 to 89 Minutes | 205 | 7.9% |
| 90 or more Minutes | 56 | 2.2% |
Commute Time by Sex in Oreland
The most common commute times in Oreland are 30 to 34 minutes (201 commuters, 14.9%) for males and 15 to 19 minutes (208 commuters, 16.7%) for females.
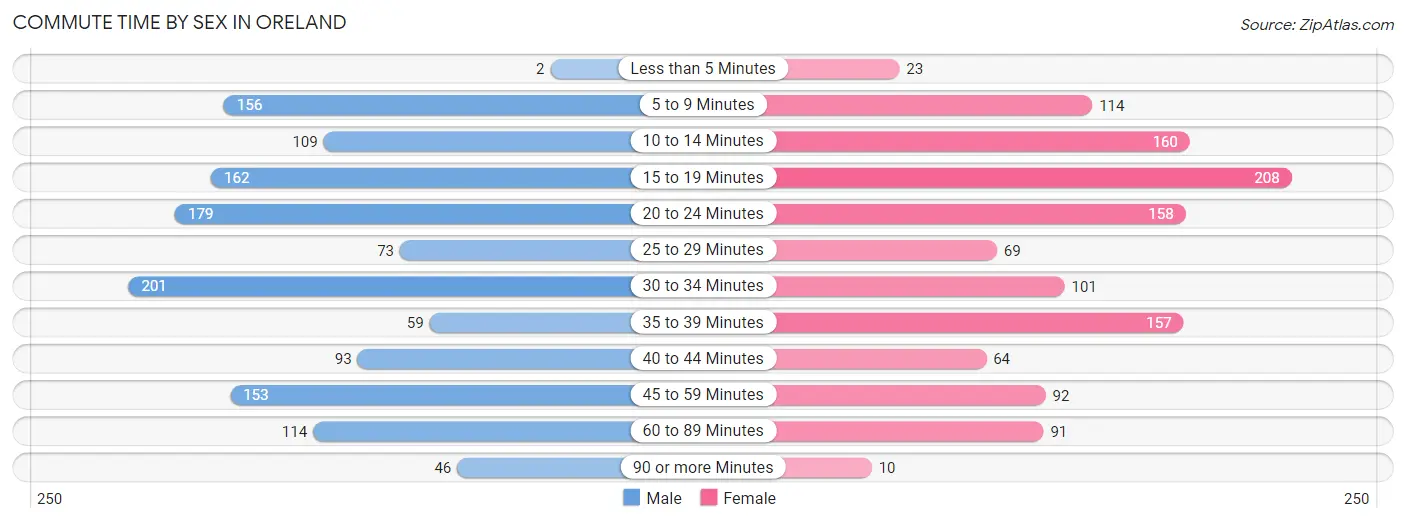
| Commute Time | Male | Female |
| Less than 5 Minutes | 2 (0.2%) | 23 (1.8%) |
| 5 to 9 Minutes | 156 (11.6%) | 114 (9.1%) |
| 10 to 14 Minutes | 109 (8.1%) | 160 (12.8%) |
| 15 to 19 Minutes | 162 (12.0%) | 208 (16.7%) |
| 20 to 24 Minutes | 179 (13.3%) | 158 (12.7%) |
| 25 to 29 Minutes | 73 (5.4%) | 69 (5.5%) |
| 30 to 34 Minutes | 201 (14.9%) | 101 (8.1%) |
| 35 to 39 Minutes | 59 (4.4%) | 157 (12.6%) |
| 40 to 44 Minutes | 93 (6.9%) | 64 (5.1%) |
| 45 to 59 Minutes | 153 (11.4%) | 92 (7.4%) |
| 60 to 89 Minutes | 114 (8.5%) | 91 (7.3%) |
| 90 or more Minutes | 46 (3.4%) | 10 (0.8%) |
Time of Departure to Work by Sex in Oreland
The most frequent times of departure to work in Oreland are 7:00 AM to 7:29 AM (238, 17.7%) for males and 7:00 AM to 7:29 AM (208, 16.7%) for females.
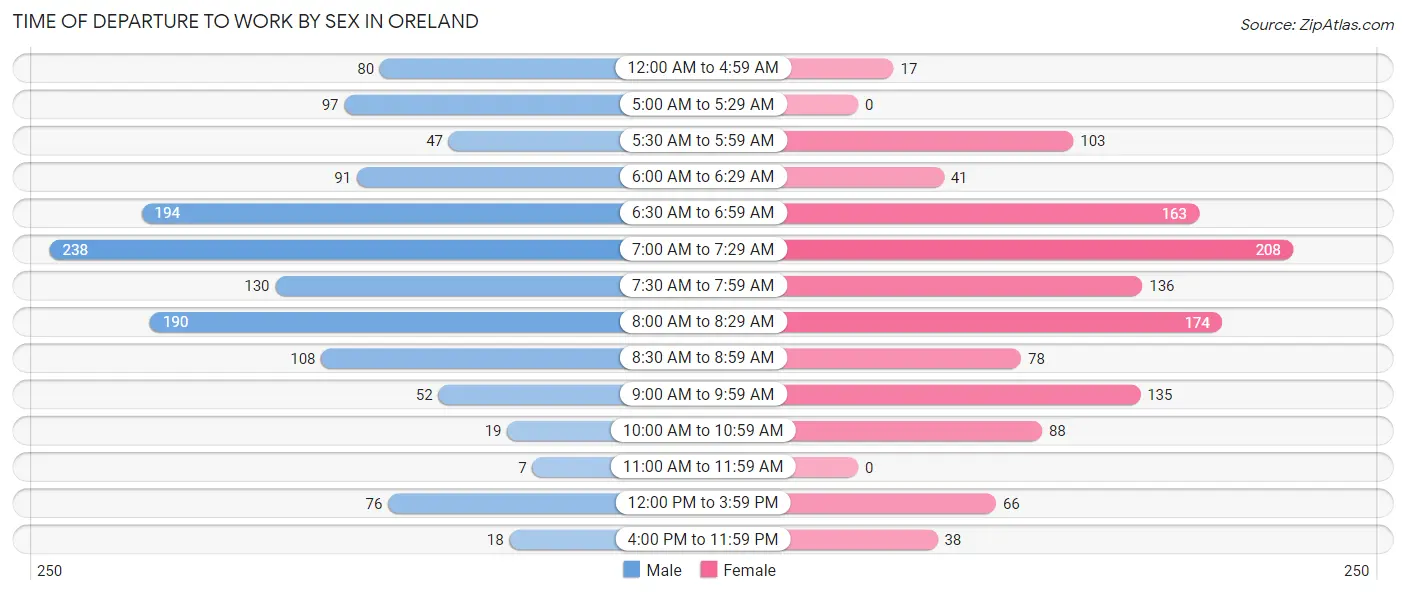
| Time of Departure | Male | Female |
| 12:00 AM to 4:59 AM | 80 (5.9%) | 17 (1.4%) |
| 5:00 AM to 5:29 AM | 97 (7.2%) | 0 (0.0%) |
| 5:30 AM to 5:59 AM | 47 (3.5%) | 103 (8.3%) |
| 6:00 AM to 6:29 AM | 91 (6.8%) | 41 (3.3%) |
| 6:30 AM to 6:59 AM | 194 (14.4%) | 163 (13.1%) |
| 7:00 AM to 7:29 AM | 238 (17.7%) | 208 (16.7%) |
| 7:30 AM to 7:59 AM | 130 (9.7%) | 136 (10.9%) |
| 8:00 AM to 8:29 AM | 190 (14.1%) | 174 (14.0%) |
| 8:30 AM to 8:59 AM | 108 (8.0%) | 78 (6.3%) |
| 9:00 AM to 9:59 AM | 52 (3.9%) | 135 (10.8%) |
| 10:00 AM to 10:59 AM | 19 (1.4%) | 88 (7.1%) |
| 11:00 AM to 11:59 AM | 7 (0.5%) | 0 (0.0%) |
| 12:00 PM to 3:59 PM | 76 (5.6%) | 66 (5.3%) |
| 4:00 PM to 11:59 PM | 18 (1.3%) | 38 (3.0%) |
| Total | 1,347 (100.0%) | 1,247 (100.0%) |
Housing Occupancy in Oreland
Occupancy by Ownership in Oreland
Of the total 2,264 dwellings in Oreland, owner-occupied units account for 1,959 (86.5%), while renter-occupied units make up 305 (13.5%).
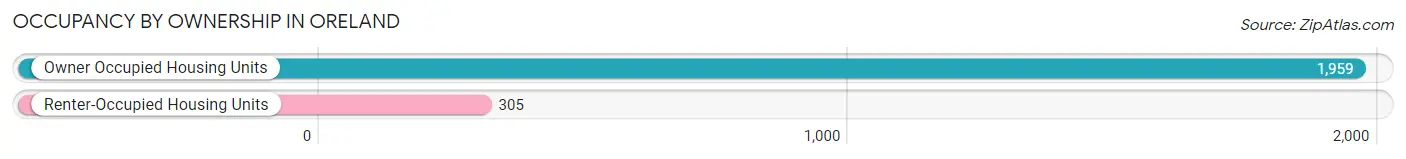
| Occupancy | # Housing Units | % Housing Units |
| Owner Occupied Housing Units | 1,959 | 86.5% |
| Renter-Occupied Housing Units | 305 | 13.5% |
| Total Occupied Housing Units | 2,264 | 100.0% |
Occupancy by Household Size in Oreland
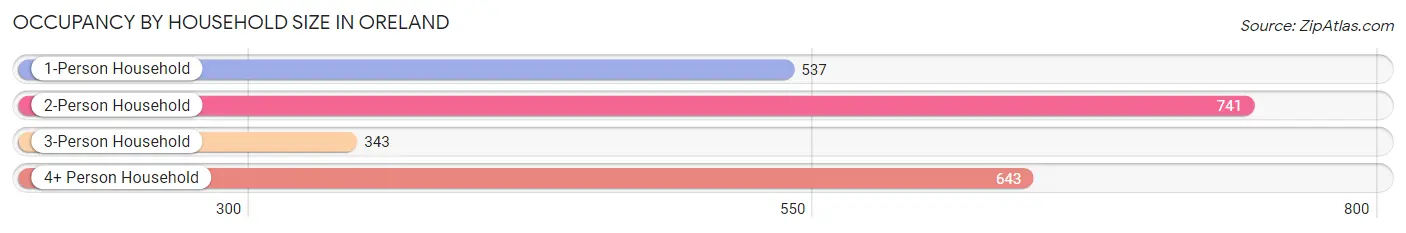
| Household Size | # Housing Units | % Housing Units |
| 1-Person Household | 537 | 23.7% |
| 2-Person Household | 741 | 32.7% |
| 3-Person Household | 343 | 15.1% |
| 4+ Person Household | 643 | 28.4% |
| Total Housing Units | 2,264 | 100.0% |
Occupancy by Ownership by Household Size in Oreland
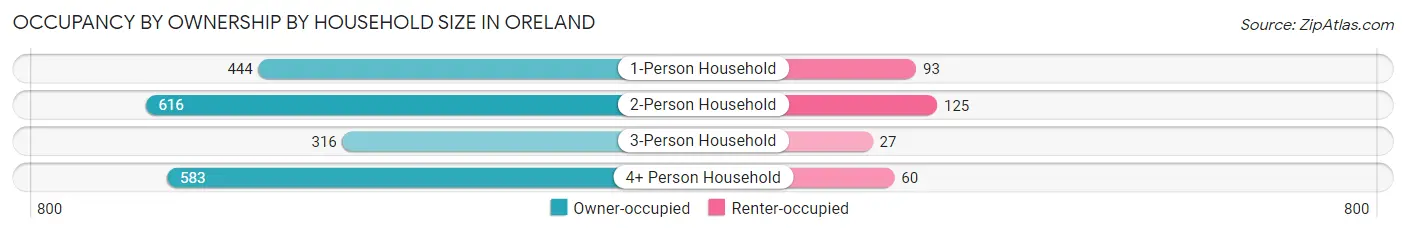
| Household Size | Owner-occupied | Renter-occupied |
| 1-Person Household | 444 (82.7%) | 93 (17.3%) |
| 2-Person Household | 616 (83.1%) | 125 (16.9%) |
| 3-Person Household | 316 (92.1%) | 27 (7.9%) |
| 4+ Person Household | 583 (90.7%) | 60 (9.3%) |
| Total Housing Units | 1,959 (86.5%) | 305 (13.5%) |
Occupancy by Educational Attainment in Oreland
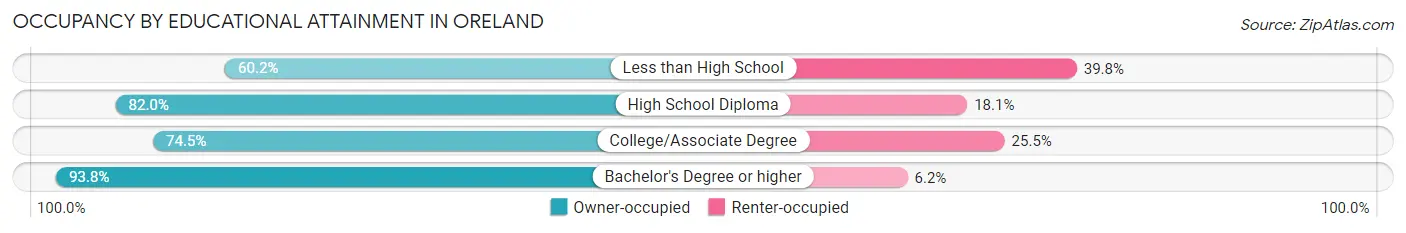
| Household Size | Owner-occupied | Renter-occupied |
| Less than High School | 53 (60.2%) | 35 (39.8%) |
| High School Diploma | 445 (82.0%) | 98 (18.0%) |
| College/Associate Degree | 272 (74.5%) | 93 (25.5%) |
| Bachelor's Degree or higher | 1,189 (93.8%) | 79 (6.2%) |
Occupancy by Age of Householder in Oreland
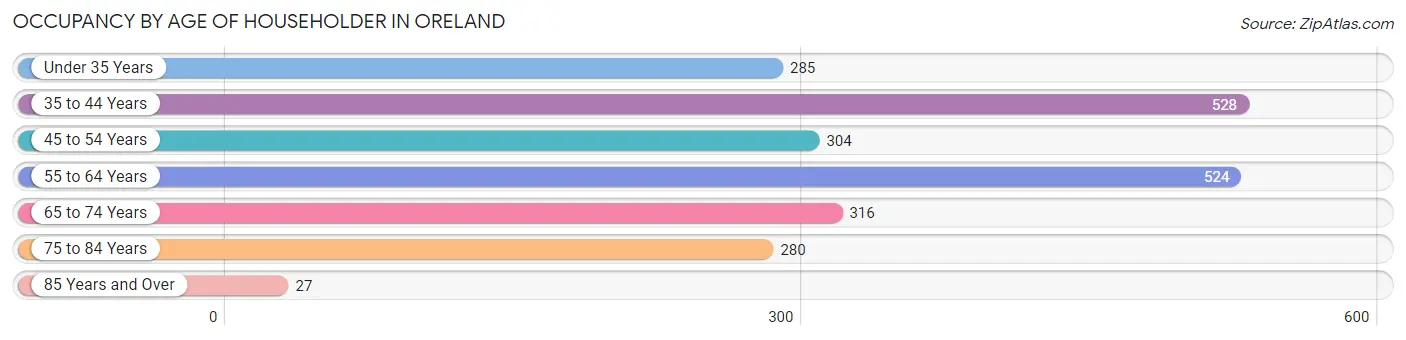
| Age Bracket | # Households | % Households |
| Under 35 Years | 285 | 12.6% |
| 35 to 44 Years | 528 | 23.3% |
| 45 to 54 Years | 304 | 13.4% |
| 55 to 64 Years | 524 | 23.1% |
| 65 to 74 Years | 316 | 14.0% |
| 75 to 84 Years | 280 | 12.4% |
| 85 Years and Over | 27 | 1.2% |
| Total | 2,264 | 100.0% |
Housing Finances in Oreland
Median Income by Occupancy in Oreland
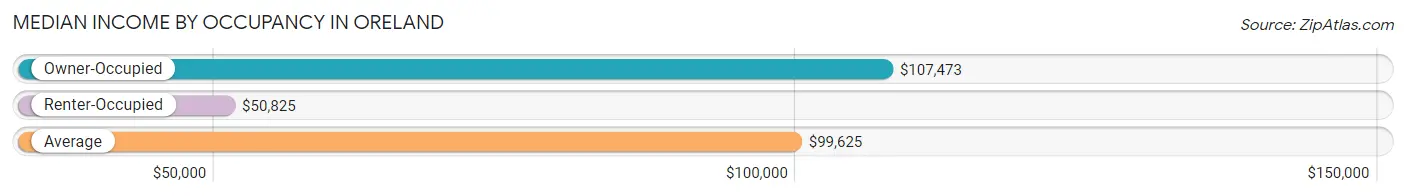
| Occupancy Type | # Households | Median Income |
| Owner-Occupied | 1,959 (86.5%) | $107,473 |
| Renter-Occupied | 305 (13.5%) | $50,825 |
| Average | 2,264 (100.0%) | $99,625 |
Occupancy by Householder Income Bracket in Oreland
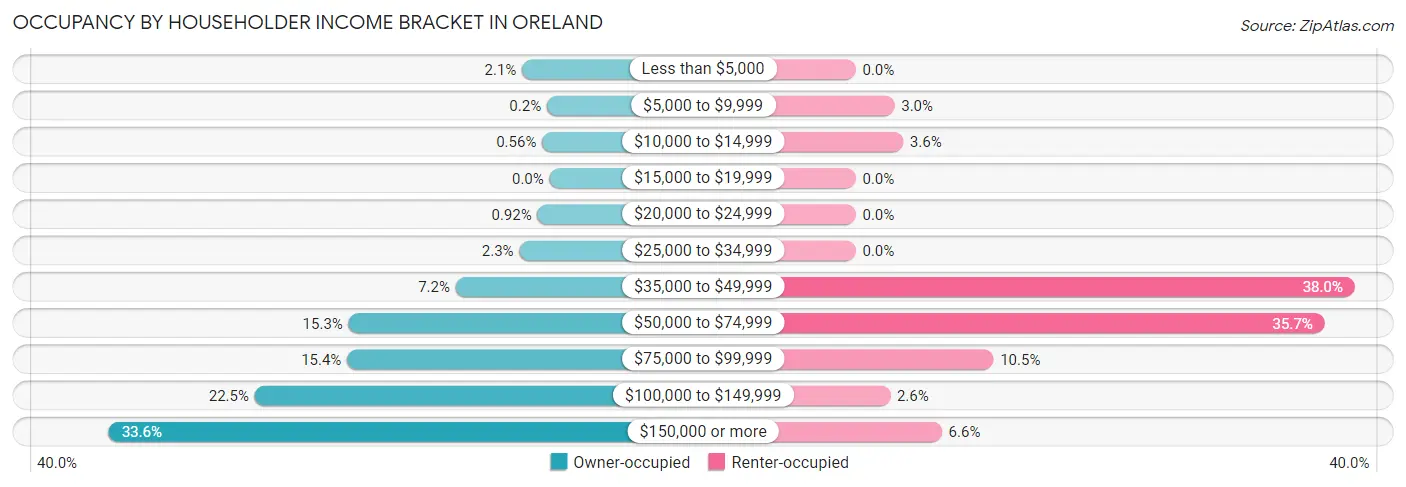
| Income Bracket | Owner-occupied | Renter-occupied |
| Less than $5,000 | 41 (2.1%) | 0 (0.0%) |
| $5,000 to $9,999 | 4 (0.2%) | 9 (2.9%) |
| $10,000 to $14,999 | 11 (0.6%) | 11 (3.6%) |
| $15,000 to $19,999 | 0 (0.0%) | 0 (0.0%) |
| $20,000 to $24,999 | 18 (0.9%) | 0 (0.0%) |
| $25,000 to $34,999 | 45 (2.3%) | 0 (0.0%) |
| $35,000 to $49,999 | 140 (7.1%) | 116 (38.0%) |
| $50,000 to $74,999 | 300 (15.3%) | 109 (35.7%) |
| $75,000 to $99,999 | 302 (15.4%) | 32 (10.5%) |
| $100,000 to $149,999 | 440 (22.5%) | 8 (2.6%) |
| $150,000 or more | 658 (33.6%) | 20 (6.6%) |
| Total | 1,959 (100.0%) | 305 (100.0%) |
Monthly Housing Cost Tiers in Oreland
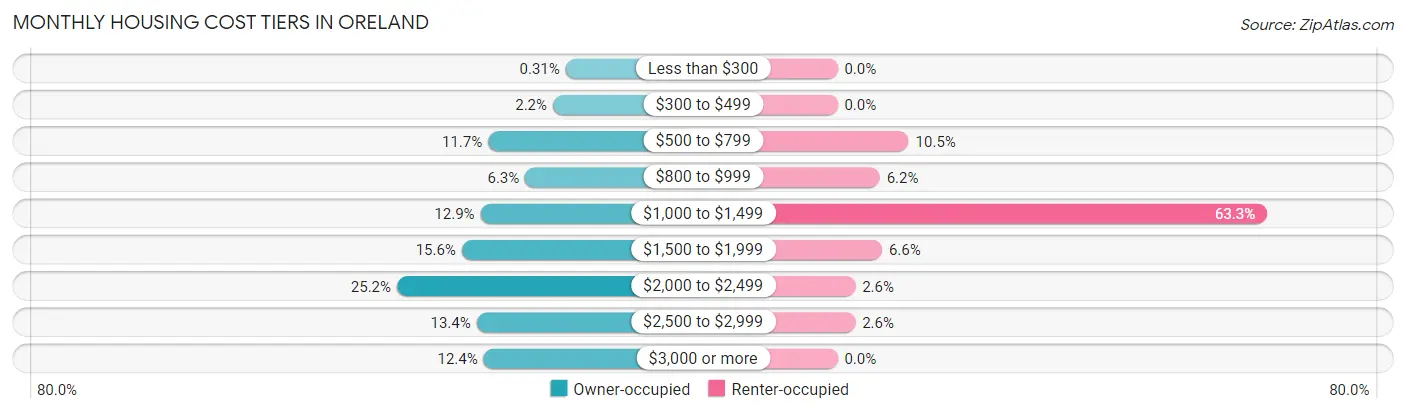
| Monthly Cost | Owner-occupied | Renter-occupied |
| Less than $300 | 6 (0.3%) | 0 (0.0%) |
| $300 to $499 | 43 (2.2%) | 0 (0.0%) |
| $500 to $799 | 230 (11.7%) | 32 (10.5%) |
| $800 to $999 | 123 (6.3%) | 19 (6.2%) |
| $1,000 to $1,499 | 252 (12.9%) | 193 (63.3%) |
| $1,500 to $1,999 | 306 (15.6%) | 20 (6.6%) |
| $2,000 to $2,499 | 493 (25.2%) | 8 (2.6%) |
| $2,500 to $2,999 | 263 (13.4%) | 8 (2.6%) |
| $3,000 or more | 243 (12.4%) | 0 (0.0%) |
| Total | 1,959 (100.0%) | 305 (100.0%) |
Physical Housing Characteristics in Oreland
Housing Structures in Oreland
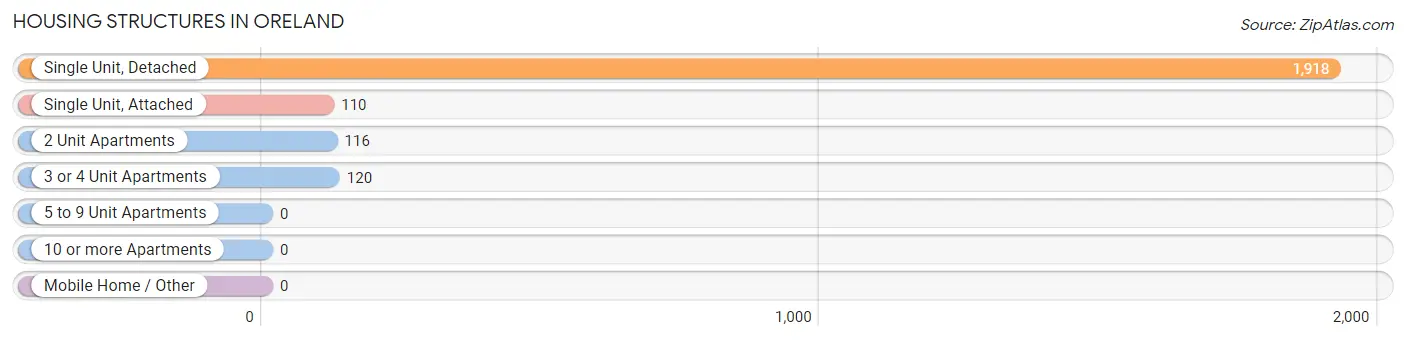
| Structure Type | # Housing Units | % Housing Units |
| Single Unit, Detached | 1,918 | 84.7% |
| Single Unit, Attached | 110 | 4.9% |
| 2 Unit Apartments | 116 | 5.1% |
| 3 or 4 Unit Apartments | 120 | 5.3% |
| 5 to 9 Unit Apartments | 0 | 0.0% |
| 10 or more Apartments | 0 | 0.0% |
| Mobile Home / Other | 0 | 0.0% |
| Total | 2,264 | 100.0% |
Housing Structures by Occupancy in Oreland
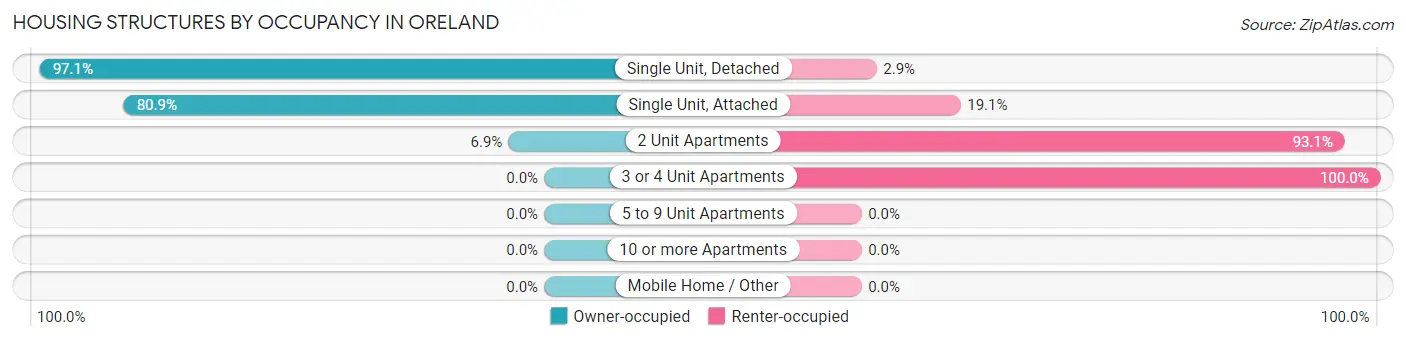
| Structure Type | Owner-occupied | Renter-occupied |
| Single Unit, Detached | 1,862 (97.1%) | 56 (2.9%) |
| Single Unit, Attached | 89 (80.9%) | 21 (19.1%) |
| 2 Unit Apartments | 8 (6.9%) | 108 (93.1%) |
| 3 or 4 Unit Apartments | 0 (0.0%) | 120 (100.0%) |
| 5 to 9 Unit Apartments | 0 (0.0%) | 0 (0.0%) |
| 10 or more Apartments | 0 (0.0%) | 0 (0.0%) |
| Mobile Home / Other | 0 (0.0%) | 0 (0.0%) |
| Total | 1,959 (86.5%) | 305 (13.5%) |
Housing Structures by Number of Rooms in Oreland
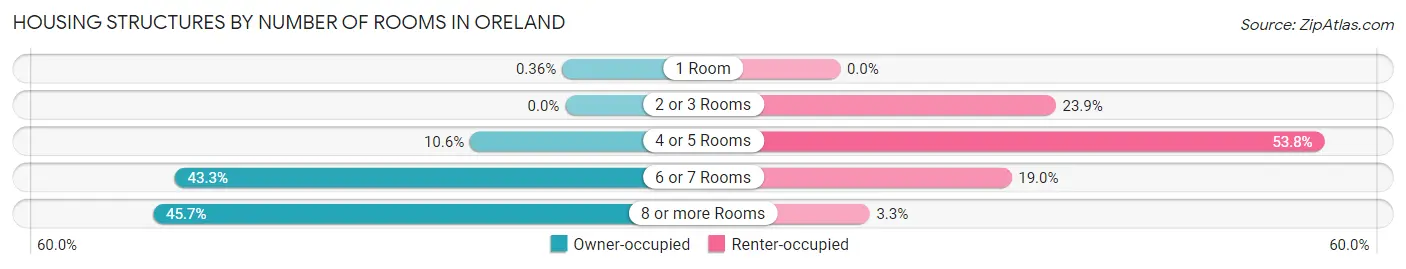
| Number of Rooms | Owner-occupied | Renter-occupied |
| 1 Room | 7 (0.4%) | 0 (0.0%) |
| 2 or 3 Rooms | 0 (0.0%) | 73 (23.9%) |
| 4 or 5 Rooms | 207 (10.6%) | 164 (53.8%) |
| 6 or 7 Rooms | 849 (43.3%) | 58 (19.0%) |
| 8 or more Rooms | 896 (45.7%) | 10 (3.3%) |
| Total | 1,959 (100.0%) | 305 (100.0%) |
Housing Structure by Heating Type in Oreland
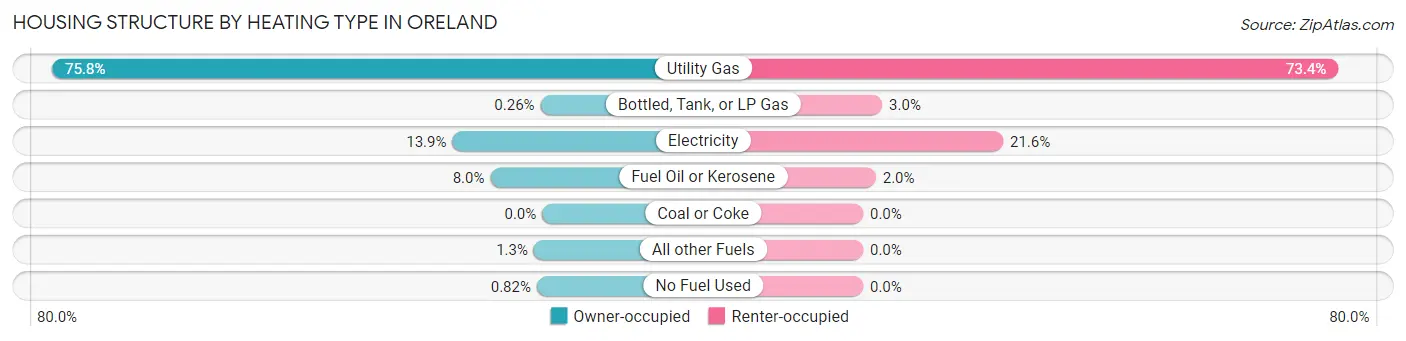
| Heating Type | Owner-occupied | Renter-occupied |
| Utility Gas | 1,484 (75.7%) | 224 (73.4%) |
| Bottled, Tank, or LP Gas | 5 (0.3%) | 9 (2.9%) |
| Electricity | 272 (13.9%) | 66 (21.6%) |
| Fuel Oil or Kerosene | 157 (8.0%) | 6 (2.0%) |
| Coal or Coke | 0 (0.0%) | 0 (0.0%) |
| All other Fuels | 25 (1.3%) | 0 (0.0%) |
| No Fuel Used | 16 (0.8%) | 0 (0.0%) |
| Total | 1,959 (100.0%) | 305 (100.0%) |
Household Vehicle Usage in Oreland
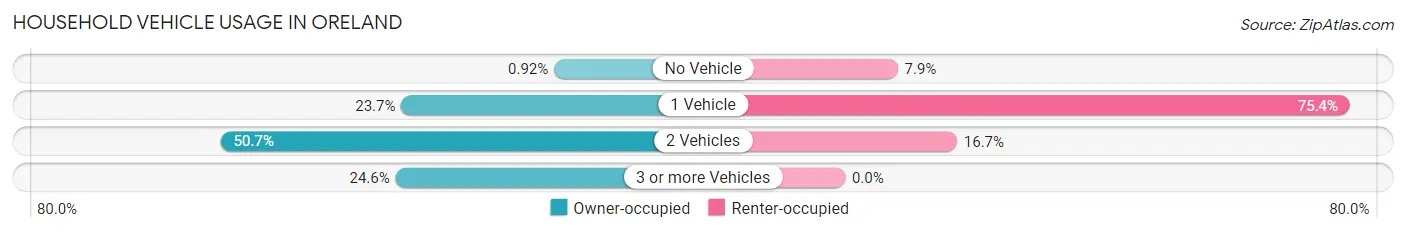
| Vehicles per Household | Owner-occupied | Renter-occupied |
| No Vehicle | 18 (0.9%) | 24 (7.9%) |
| 1 Vehicle | 465 (23.7%) | 230 (75.4%) |
| 2 Vehicles | 994 (50.7%) | 51 (16.7%) |
| 3 or more Vehicles | 482 (24.6%) | 0 (0.0%) |
| Total | 1,959 (100.0%) | 305 (100.0%) |
Real Estate & Mortgages in Oreland
Real Estate and Mortgage Overview in Oreland
| Characteristic | Without Mortgage | With Mortgage |
| Housing Units | 593 | 1,366 |
| Median Property Value | $368,200 | $393,900 |
| Median Household Income | $93,102 | $526 |
| Monthly Housing Costs | $835 | $243 |
| Real Estate Taxes | $5,669 | $61 |
Property Value by Mortgage Status in Oreland
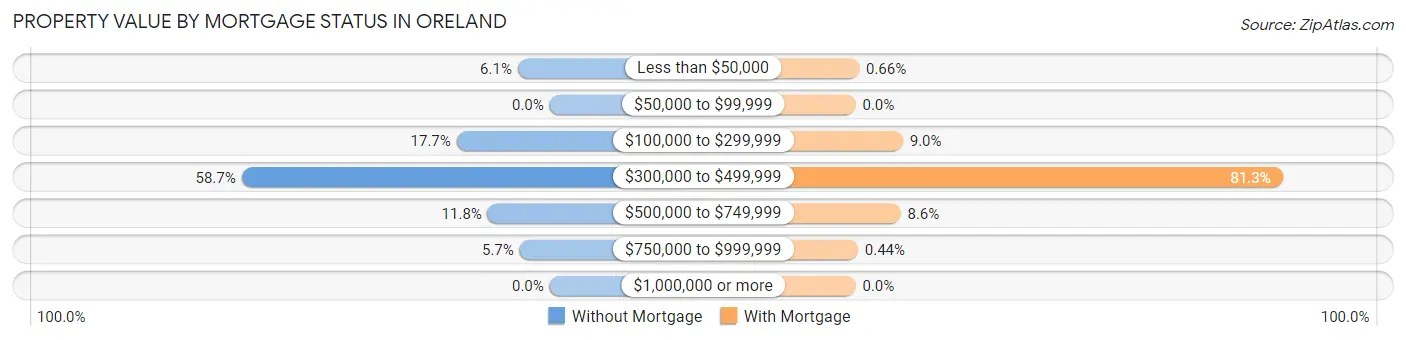
| Property Value | Without Mortgage | With Mortgage |
| Less than $50,000 | 36 (6.1%) | 9 (0.7%) |
| $50,000 to $99,999 | 0 (0.0%) | 0 (0.0%) |
| $100,000 to $299,999 | 105 (17.7%) | 123 (9.0%) |
| $300,000 to $499,999 | 348 (58.7%) | 1,111 (81.3%) |
| $500,000 to $749,999 | 70 (11.8%) | 117 (8.6%) |
| $750,000 to $999,999 | 34 (5.7%) | 6 (0.4%) |
| $1,000,000 or more | 0 (0.0%) | 0 (0.0%) |
| Total | 593 (100.0%) | 1,366 (100.0%) |
Household Income by Mortgage Status in Oreland
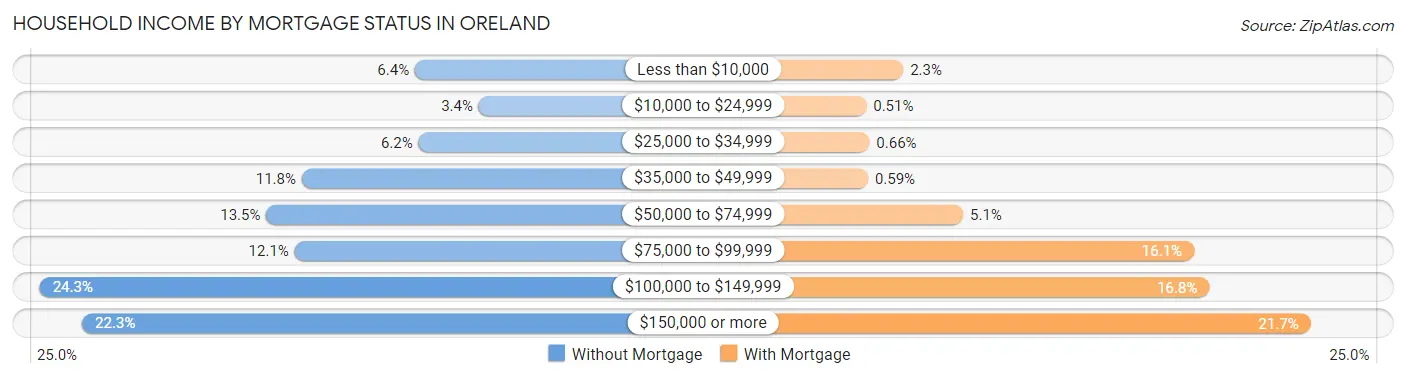
| Household Income | Without Mortgage | With Mortgage |
| Less than $10,000 | 38 (6.4%) | 31 (2.3%) |
| $10,000 to $24,999 | 20 (3.4%) | 7 (0.5%) |
| $25,000 to $34,999 | 37 (6.2%) | 9 (0.7%) |
| $35,000 to $49,999 | 70 (11.8%) | 8 (0.6%) |
| $50,000 to $74,999 | 80 (13.5%) | 70 (5.1%) |
| $75,000 to $99,999 | 72 (12.1%) | 220 (16.1%) |
| $100,000 to $149,999 | 144 (24.3%) | 230 (16.8%) |
| $150,000 or more | 132 (22.3%) | 296 (21.7%) |
| Total | 593 (100.0%) | 1,366 (100.0%) |
Property Value to Household Income Ratio in Oreland
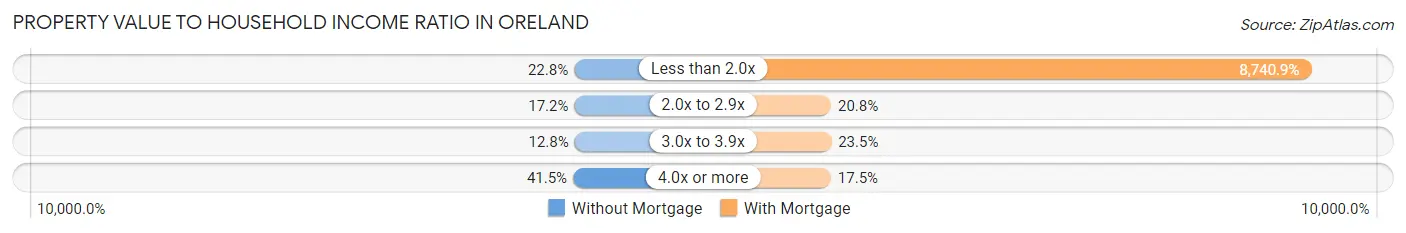
| Value-to-Income Ratio | Without Mortgage | With Mortgage |
| Less than 2.0x | 135 (22.8%) | 119,400 (8,740.9%) |
| 2.0x to 2.9x | 102 (17.2%) | 284 (20.8%) |
| 3.0x to 3.9x | 76 (12.8%) | 321 (23.5%) |
| 4.0x or more | 246 (41.5%) | 239 (17.5%) |
| Total | 593 (100.0%) | 1,366 (100.0%) |
Real Estate Taxes by Mortgage Status in Oreland
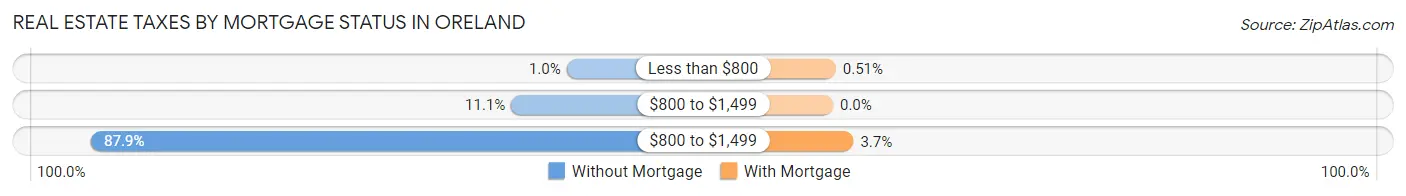
| Property Taxes | Without Mortgage | With Mortgage |
| Less than $800 | 6 (1.0%) | 7 (0.5%) |
| $800 to $1,499 | 66 (11.1%) | 0 (0.0%) |
| $800 to $1,499 | 521 (87.9%) | 51 (3.7%) |
| Total | 593 (100.0%) | 1,366 (100.0%) |
Health & Disability in Oreland
Health Insurance Coverage by Age in Oreland
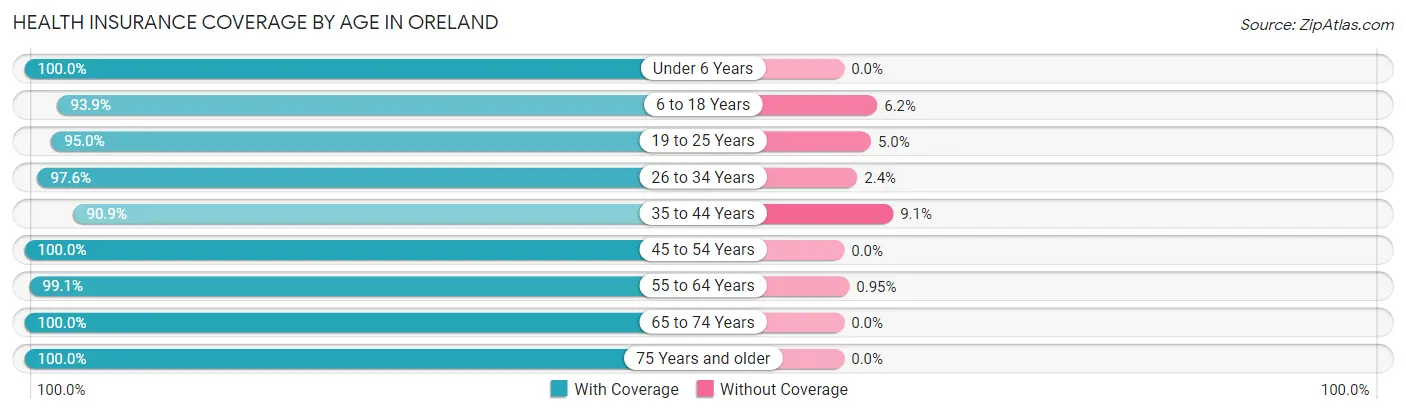
| Age Bracket | With Coverage | Without Coverage |
| Under 6 Years | 470 (100.0%) | 0 (0.0%) |
| 6 to 18 Years | 1,023 (93.9%) | 67 (6.1%) |
| 19 to 25 Years | 496 (95.0%) | 26 (5.0%) |
| 26 to 34 Years | 440 (97.6%) | 11 (2.4%) |
| 35 to 44 Years | 906 (90.9%) | 91 (9.1%) |
| 45 to 54 Years | 656 (100.0%) | 0 (0.0%) |
| 55 to 64 Years | 940 (99.1%) | 9 (0.9%) |
| 65 to 74 Years | 554 (100.0%) | 0 (0.0%) |
| 75 Years and older | 434 (100.0%) | 0 (0.0%) |
| Total | 5,919 (96.7%) | 204 (3.3%) |
Health Insurance Coverage by Citizenship Status in Oreland
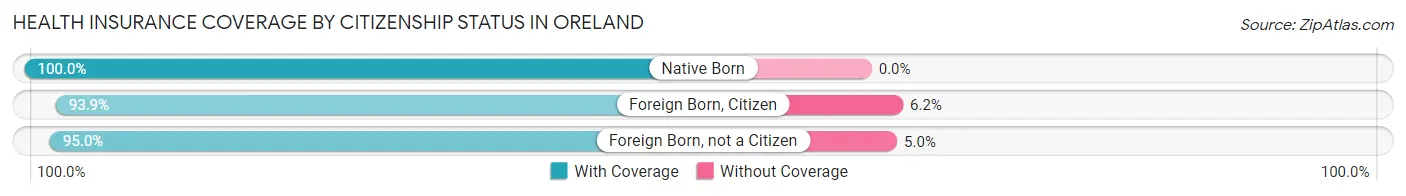
| Citizenship Status | With Coverage | Without Coverage |
| Native Born | 470 (100.0%) | 0 (0.0%) |
| Foreign Born, Citizen | 1,023 (93.9%) | 67 (6.1%) |
| Foreign Born, not a Citizen | 496 (95.0%) | 26 (5.0%) |
Health Insurance Coverage by Household Income in Oreland
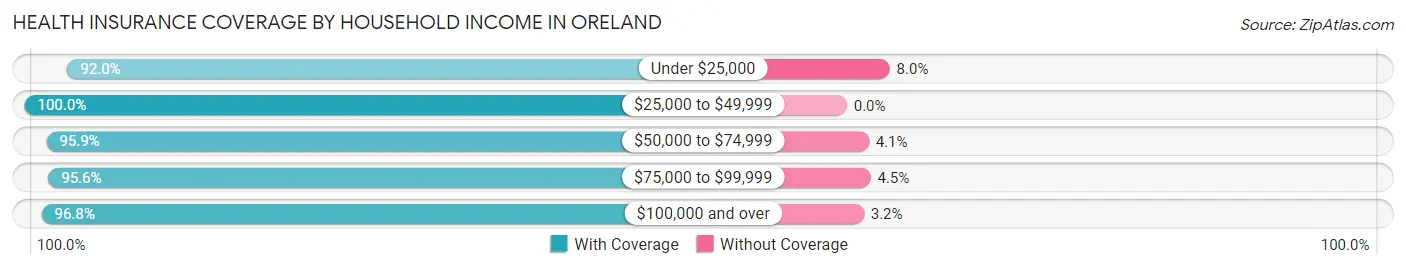
| Household Income | With Coverage | Without Coverage |
| Under $25,000 | 126 (92.0%) | 11 (8.0%) |
| $25,000 to $49,999 | 555 (100.0%) | 0 (0.0%) |
| $50,000 to $74,999 | 818 (95.9%) | 35 (4.1%) |
| $75,000 to $99,999 | 966 (95.6%) | 45 (4.4%) |
| $100,000 and over | 3,440 (96.8%) | 113 (3.2%) |
Public vs Private Health Insurance Coverage by Age in Oreland
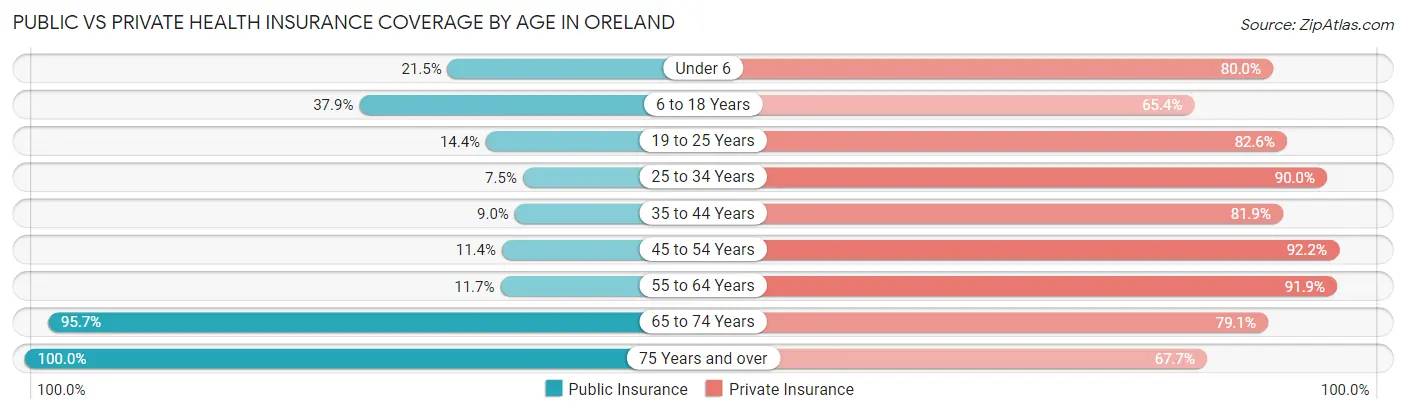
| Age Bracket | Public Insurance | Private Insurance |
| Under 6 | 101 (21.5%) | 376 (80.0%) |
| 6 to 18 Years | 413 (37.9%) | 713 (65.4%) |
| 19 to 25 Years | 75 (14.4%) | 431 (82.6%) |
| 25 to 34 Years | 34 (7.5%) | 406 (90.0%) |
| 35 to 44 Years | 90 (9.0%) | 816 (81.9%) |
| 45 to 54 Years | 75 (11.4%) | 605 (92.2%) |
| 55 to 64 Years | 111 (11.7%) | 872 (91.9%) |
| 65 to 74 Years | 530 (95.7%) | 438 (79.1%) |
| 75 Years and over | 434 (100.0%) | 294 (67.7%) |
| Total | 1,863 (30.4%) | 4,951 (80.9%) |
Disability Status by Sex by Age in Oreland
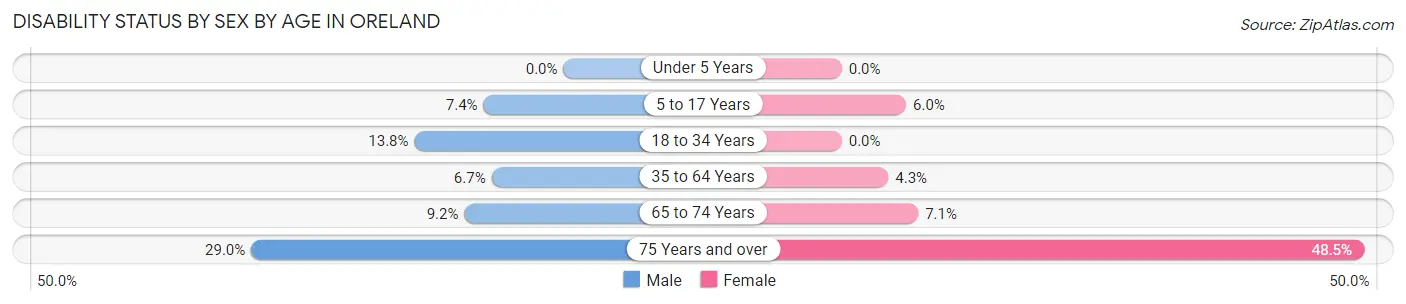
| Age Bracket | Male | Female |
| Under 5 Years | 0 (0.0%) | 0 (0.0%) |
| 5 to 17 Years | 34 (7.4%) | 42 (6.0%) |
| 18 to 34 Years | 83 (13.8%) | 0 (0.0%) |
| 35 to 64 Years | 84 (6.7%) | 58 (4.3%) |
| 65 to 74 Years | 25 (9.2%) | 20 (7.1%) |
| 75 Years and over | 51 (29.0%) | 125 (48.4%) |
Disability Class by Sex by Age in Oreland
Disability Class: Hearing Difficulty
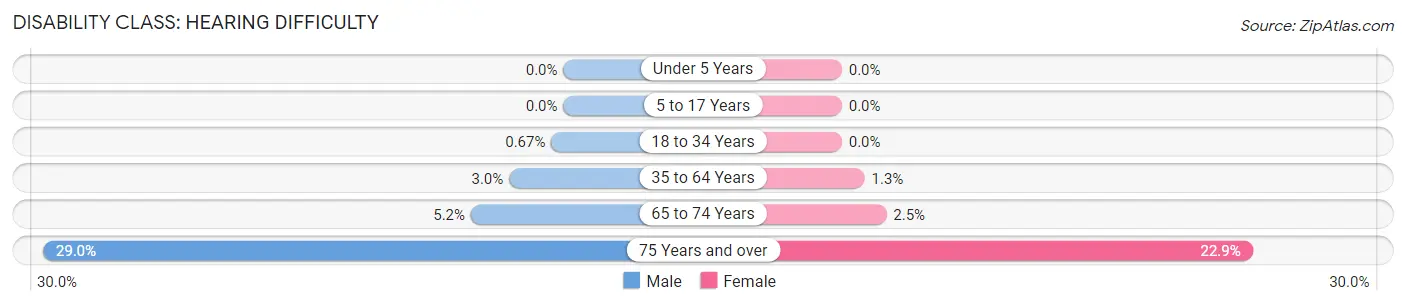
| Age Bracket | Male | Female |
| Under 5 Years | 0 (0.0%) | 0 (0.0%) |
| 5 to 17 Years | 0 (0.0%) | 0 (0.0%) |
| 18 to 34 Years | 4 (0.7%) | 0 (0.0%) |
| 35 to 64 Years | 38 (3.0%) | 17 (1.3%) |
| 65 to 74 Years | 14 (5.1%) | 7 (2.5%) |
| 75 Years and over | 51 (29.0%) | 59 (22.9%) |
Disability Class: Vision Difficulty
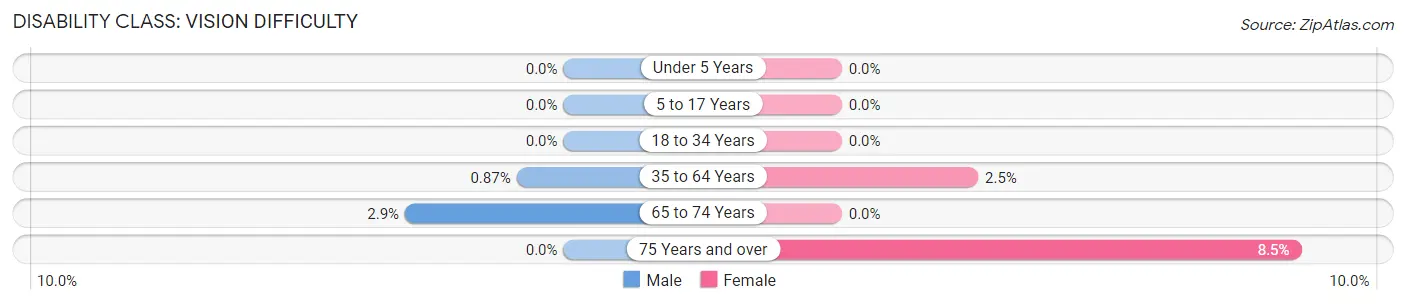
| Age Bracket | Male | Female |
| Under 5 Years | 0 (0.0%) | 0 (0.0%) |
| 5 to 17 Years | 0 (0.0%) | 0 (0.0%) |
| 18 to 34 Years | 0 (0.0%) | 0 (0.0%) |
| 35 to 64 Years | 11 (0.9%) | 34 (2.5%) |
| 65 to 74 Years | 8 (2.9%) | 0 (0.0%) |
| 75 Years and over | 0 (0.0%) | 22 (8.5%) |
Disability Class: Cognitive Difficulty
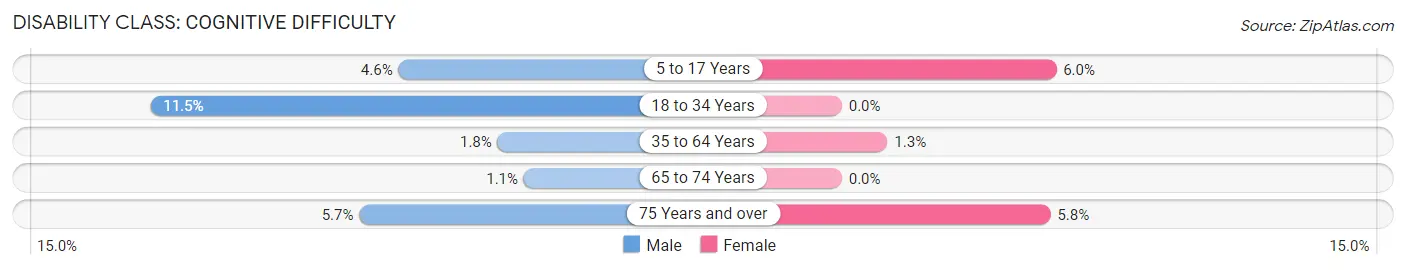
| Age Bracket | Male | Female |
| 5 to 17 Years | 21 (4.6%) | 42 (6.0%) |
| 18 to 34 Years | 69 (11.5%) | 0 (0.0%) |
| 35 to 64 Years | 23 (1.8%) | 17 (1.3%) |
| 65 to 74 Years | 3 (1.1%) | 0 (0.0%) |
| 75 Years and over | 10 (5.7%) | 15 (5.8%) |
Disability Class: Ambulatory Difficulty
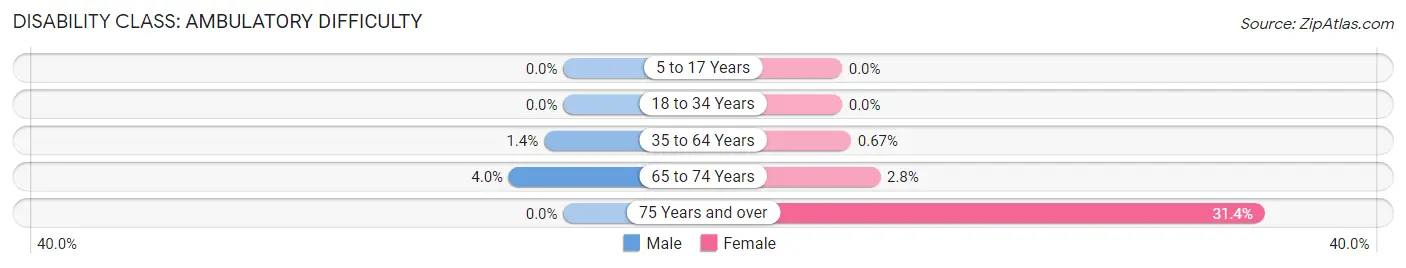
| Age Bracket | Male | Female |
| 5 to 17 Years | 0 (0.0%) | 0 (0.0%) |
| 18 to 34 Years | 0 (0.0%) | 0 (0.0%) |
| 35 to 64 Years | 18 (1.4%) | 9 (0.7%) |
| 65 to 74 Years | 11 (4.0%) | 8 (2.8%) |
| 75 Years and over | 0 (0.0%) | 81 (31.4%) |
Disability Class: Self-Care Difficulty
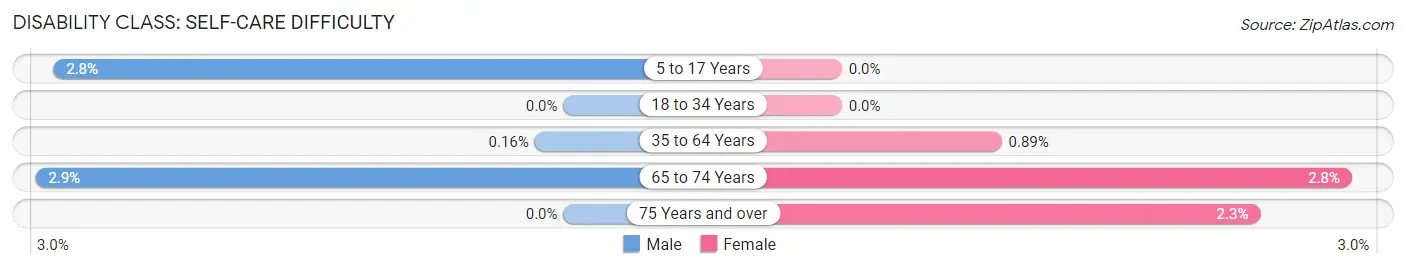
| Age Bracket | Male | Female |
| 5 to 17 Years | 13 (2.8%) | 0 (0.0%) |
| 18 to 34 Years | 0 (0.0%) | 0 (0.0%) |
| 35 to 64 Years | 2 (0.2%) | 12 (0.9%) |
| 65 to 74 Years | 8 (2.9%) | 8 (2.8%) |
| 75 Years and over | 0 (0.0%) | 6 (2.3%) |
Technology Access in Oreland
Computing Device Access in Oreland
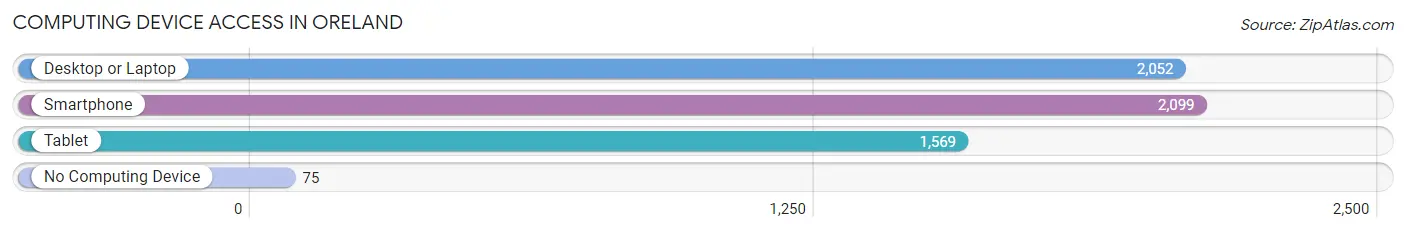
| Device Type | # Households | % Households |
| Desktop or Laptop | 2,052 | 90.6% |
| Smartphone | 2,099 | 92.7% |
| Tablet | 1,569 | 69.3% |
| No Computing Device | 75 | 3.3% |
| Total | 2,264 | 100.0% |
Internet Access in Oreland
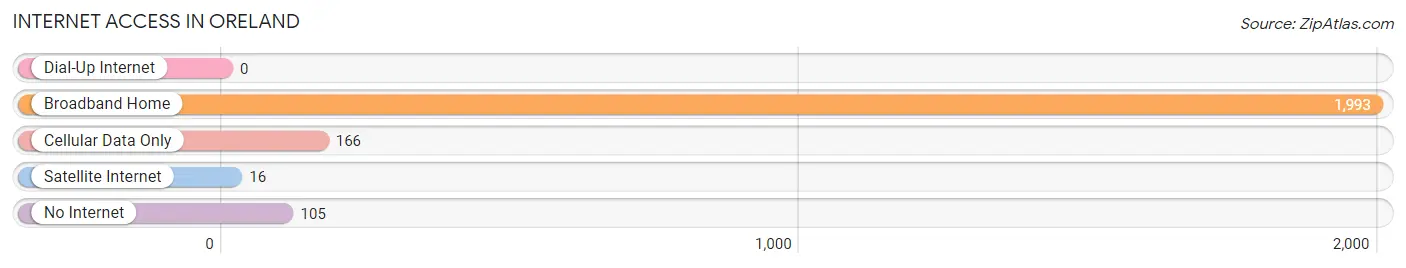
| Internet Type | # Households | % Households |
| Dial-Up Internet | 0 | 0.0% |
| Broadband Home | 1,993 | 88.0% |
| Cellular Data Only | 166 | 7.3% |
| Satellite Internet | 16 | 0.7% |
| No Internet | 105 | 4.6% |
| Total | 2,264 | 100.0% |
Oreland Summary
Orelend, Pennsylvania is a small borough located in Montgomery County, Pennsylvania. It is situated on the edge of the Wissahickon Valley, a part of the larger Philadelphia metropolitan area. The borough is home to a population of approximately 2,000 people, and is known for its rural charm and historic buildings.
Geography
Orelend is located in southeastern Pennsylvania, approximately 20 miles northwest of Philadelphia. It is situated on the edge of the Wissahickon Valley, a part of the larger Philadelphia metropolitan area. The borough is bordered by Upper Dublin Township to the north, Springfield Township to the east, Whitemarsh Township to the south, and Lower Gwynedd Township to the west. The borough is situated on a hillside, with the highest elevation being approximately 500 feet above sea level.
The borough is home to several parks and recreational areas, including the Oreland Recreation Center, Oreland Park, and Oreland Nature Preserve. The Oreland Nature Preserve is a protected area of over 200 acres of woodlands, meadows, and wetlands. It is home to a variety of wildlife, including deer, foxes, and a variety of birds.
Economy
The economy of Oreland is largely based on small businesses and local services. The borough is home to a variety of small businesses, including restaurants, retail stores, and professional services. The borough is also home to a number of industrial and manufacturing businesses, including a paper mill and a printing company.
The borough is also home to a number of educational institutions, including the Oreland Elementary School, Oreland Middle School, and Oreland High School. The Oreland School District serves the borough and the surrounding area.
Demographics
As of the 2010 census, the population of Oreland was 2,037. The racial makeup of the borough was 94.3% White, 1.7% African American, 0.2% Native American, 1.2% Asian, 0.1% Pacific Islander, 1.2% from other races, and 1.5% from two or more races. Hispanic or Latino of any race were 3.2% of the population.
The median household income in Oreland was $68,958, and the median family income was $76,958. The per capita income for the borough was $30,958. About 4.2% of families and 5.2% of the population were below the poverty line, including 6.2% of those under age 18 and 4.2% of those age 65 or over.
History
Oreland was first settled in the early 1700s by a group of Quakers from England. The borough was officially incorporated in 1874, and was named after the Oreland family, who were among the first settlers.
In the late 19th century, Oreland was a popular summer resort destination for wealthy Philadelphians. The borough was home to several large estates, including the Oreland Mansion, which was built in 1876. The mansion is now a historic landmark and is open to the public.
In the early 20th century, Oreland began to transition from a rural farming community to a suburban residential area. The borough was home to a number of large estates, which were eventually subdivided into smaller lots. The borough is now primarily residential, with a few small businesses and industrial sites.
Common Questions
What is Per Capita Income in Oreland?
Per Capita income in Oreland is $49,133.
What is the Median Family Income in Oreland?
Median Family Income in Oreland is $118,883.
What is the Median Household income in Oreland?
Median Household Income in Oreland is $99,625.
What is Income or Wage Gap in Oreland?
Income or Wage Gap in Oreland is 11.8%.
Women in Oreland earn 88.2 cents for every dollar earned by a man.
What is Inequality or Gini Index in Oreland?
Inequality or Gini Index in Oreland is 0.40.
What is the Total Population of Oreland?
Total Population of Oreland is 6,123.
What is the Total Male Population of Oreland?
Total Male Population of Oreland is 2,997.
What is the Total Female Population of Oreland?
Total Female Population of Oreland is 3,126.
What is the Ratio of Males per 100 Females in Oreland?
There are 95.87 Males per 100 Females in Oreland.
What is the Ratio of Females per 100 Males in Oreland?
There are 104.30 Females per 100 Males in Oreland.
What is the Median Population Age in Oreland?
Median Population Age in Oreland is 40.3 Years.
What is the Average Family Size in Oreland
Average Family Size in Oreland is 3.2 People.
What is the Average Household Size in Oreland
Average Household Size in Oreland is 2.7 People.
How Large is the Labor Force in Oreland?
There are 3,364 People in the Labor Forcein in Oreland.
What is the Percentage of People in the Labor Force in Oreland?
71.5% of People are in the Labor Force in Oreland.
What is the Unemployment Rate in Oreland?
Unemployment Rate in Oreland is 5.6%.