Oklahoma borough, PA Map & Demographics
Oklahoma borough Overview
$36,548
PER CAPITA INCOME
$76,875
AVG FAMILY INCOME
$62,188
AVG HOUSEHOLD INCOME
28.2%
WAGE / INCOME GAP [ % ]
71.8¢/ $1
WAGE / INCOME GAP [ $ ]
0.41
INEQUALITY / GINI INDEX
964
TOTAL POPULATION
462
MALE POPULATION
502
FEMALE POPULATION
92.03
MALES / 100 FEMALES
108.66
FEMALES / 100 MALES
52.4
MEDIAN AGE
2.8
AVG FAMILY SIZE
2.3
AVG HOUSEHOLD SIZE
460
LABOR FORCE [ PEOPLE ]
55.4%
PERCENT IN LABOR FORCE
Income in Oklahoma borough
Income Overview in Oklahoma borough
Per Capita Income in Oklahoma borough is $36,548, while median incomes of families and households are $76,875 and $62,188 respectively.
| Characteristic | Number | Measure |
| Per Capita Income | 964 | $36,548 |
| Median Family Income | 288 | $76,875 |
| Mean Family Income | 288 | $93,980 |
| Median Household Income | 424 | $62,188 |
| Mean Household Income | 424 | $82,219 |
| Income Deficit | 288 | $0 |
| Wage / Income Gap (%) | 964 | 28.21% |
| Wage / Income Gap ($) | 964 | 71.79¢ per $1 |
| Gini / Inequality Index | 964 | 0.41 |
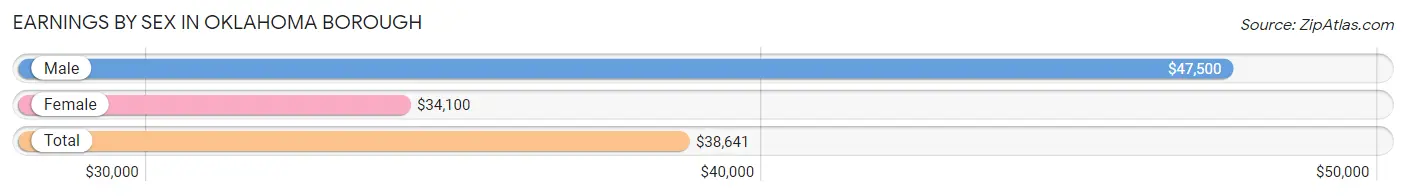
Earnings by Sex in Oklahoma borough
Average Earnings in Oklahoma borough are $38,641, $47,500 for men and $34,100 for women, a difference of 28.2%.
| Sex | Number | Average Earnings |
| Male | 210 (43.9%) | $47,500 |
| Female | 268 (56.1%) | $34,100 |
| Total | 478 (100.0%) | $38,641 |
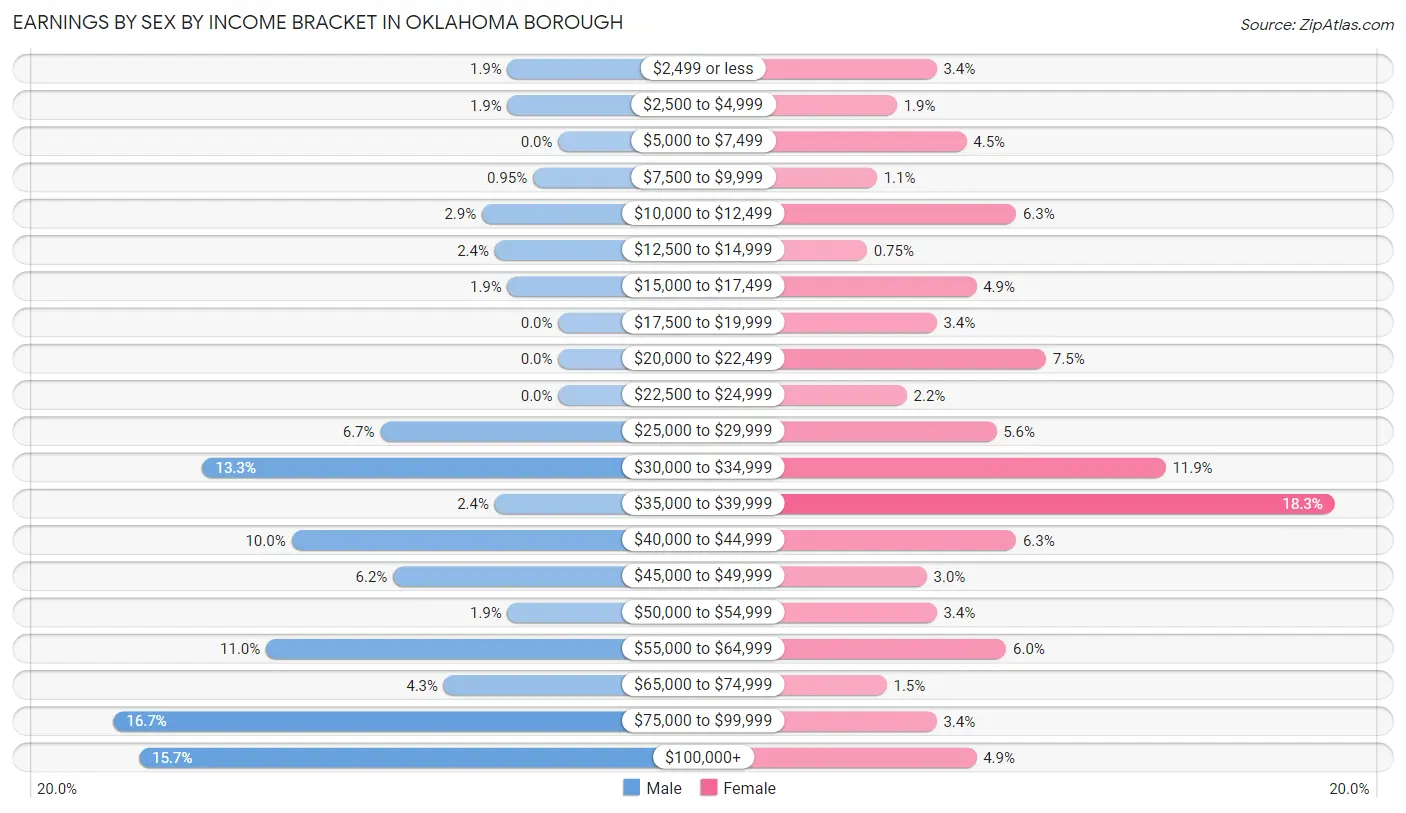
Earnings by Sex by Income Bracket in Oklahoma borough
The most common earnings brackets in Oklahoma borough are $75,000 to $99,999 for men (35 | 16.7%) and $35,000 to $39,999 for women (49 | 18.3%).
| Income | Male | Female |
| $2,499 or less | 4 (1.9%) | 9 (3.4%) |
| $2,500 to $4,999 | 4 (1.9%) | 5 (1.9%) |
| $5,000 to $7,499 | 0 (0.0%) | 12 (4.5%) |
| $7,500 to $9,999 | 2 (0.9%) | 3 (1.1%) |
| $10,000 to $12,499 | 6 (2.9%) | 17 (6.3%) |
| $12,500 to $14,999 | 5 (2.4%) | 2 (0.7%) |
| $15,000 to $17,499 | 4 (1.9%) | 13 (4.9%) |
| $17,500 to $19,999 | 0 (0.0%) | 9 (3.4%) |
| $20,000 to $22,499 | 0 (0.0%) | 20 (7.5%) |
| $22,500 to $24,999 | 0 (0.0%) | 6 (2.2%) |
| $25,000 to $29,999 | 14 (6.7%) | 15 (5.6%) |
| $30,000 to $34,999 | 28 (13.3%) | 32 (11.9%) |
| $35,000 to $39,999 | 5 (2.4%) | 49 (18.3%) |
| $40,000 to $44,999 | 21 (10.0%) | 17 (6.3%) |
| $45,000 to $49,999 | 13 (6.2%) | 8 (3.0%) |
| $50,000 to $54,999 | 4 (1.9%) | 9 (3.4%) |
| $55,000 to $64,999 | 23 (11.0%) | 16 (6.0%) |
| $65,000 to $74,999 | 9 (4.3%) | 4 (1.5%) |
| $75,000 to $99,999 | 35 (16.7%) | 9 (3.4%) |
| $100,000+ | 33 (15.7%) | 13 (4.9%) |
| Total | 210 (100.0%) | 268 (100.0%) |
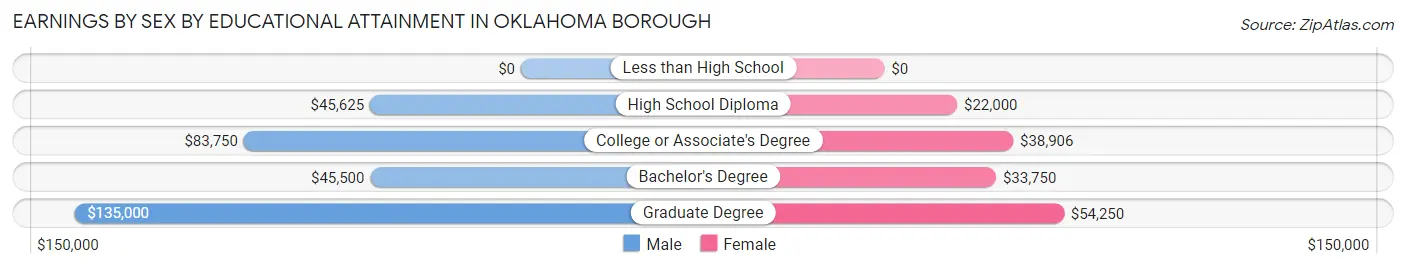
Earnings by Sex by Educational Attainment in Oklahoma borough
Average earnings in Oklahoma borough are $56,429 for men and $34,600 for women, a difference of 38.7%. Men with an educational attainment of graduate degree enjoy the highest average annual earnings of $135,000, while those with bachelor's degree education earn the least with $45,500. Women with an educational attainment of graduate degree earn the most with the average annual earnings of $54,250, while those with high school diploma education have the smallest earnings of $22,000.
| Educational Attainment | Male Income | Female Income |
| Less than High School | - | - |
| High School Diploma | $45,625 | $22,000 |
| College or Associate's Degree | $83,750 | $38,906 |
| Bachelor's Degree | $45,500 | $33,750 |
| Graduate Degree | $135,000 | $54,250 |
| Total | $56,429 | $34,600 |
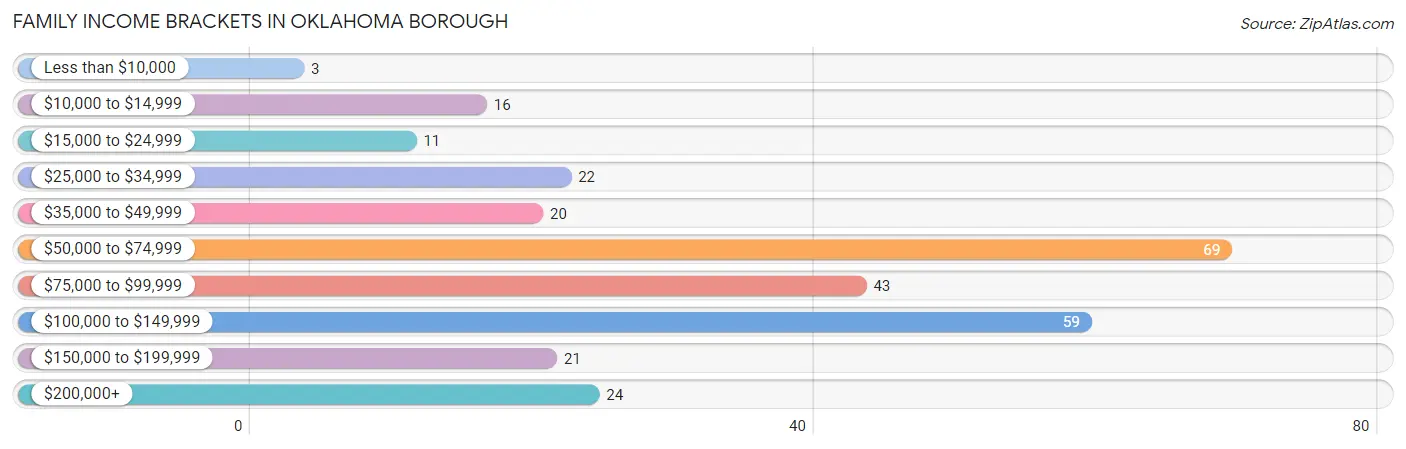
Family Income in Oklahoma borough
Family Income Brackets in Oklahoma borough
According to the Oklahoma borough family income data, there are 69 families falling into the $50,000 to $74,999 income range, which is the most common income bracket and makes up 24.0% of all families. Conversely, the less than $10,000 income bracket is the least frequent group with only 3 families (1.0%) belonging to this category.
| Income Bracket | # Families | % Families |
| Less than $10,000 | 3 | 1.0% |
| $10,000 to $14,999 | 16 | 5.6% |
| $15,000 to $24,999 | 11 | 3.8% |
| $25,000 to $34,999 | 22 | 7.6% |
| $35,000 to $49,999 | 20 | 6.9% |
| $50,000 to $74,999 | 69 | 24.0% |
| $75,000 to $99,999 | 43 | 14.9% |
| $100,000 to $149,999 | 59 | 20.5% |
| $150,000 to $199,999 | 21 | 7.3% |
| $200,000+ | 24 | 8.3% |
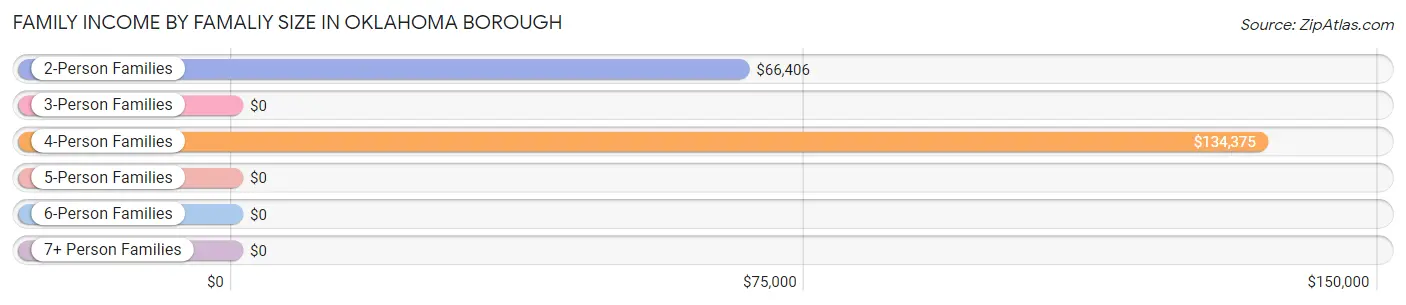
Family Income by Famaliy Size in Oklahoma borough
4-person families (28 | 9.7%) account for the highest median family income in Oklahoma borough with $134,375 per family, while 4-person families (28 | 9.7%) have the highest median income of $33,594 per family member.
| Income Bracket | # Families | Median Income |
| 2-Person Families | 183 (63.5%) | $66,406 |
| 3-Person Families | 55 (19.1%) | $0 |
| 4-Person Families | 28 (9.7%) | $134,375 |
| 5-Person Families | 10 (3.5%) | $0 |
| 6-Person Families | 12 (4.2%) | $0 |
| 7+ Person Families | 0 (0.0%) | $0 |
| Total | 288 (100.0%) | $76,875 |
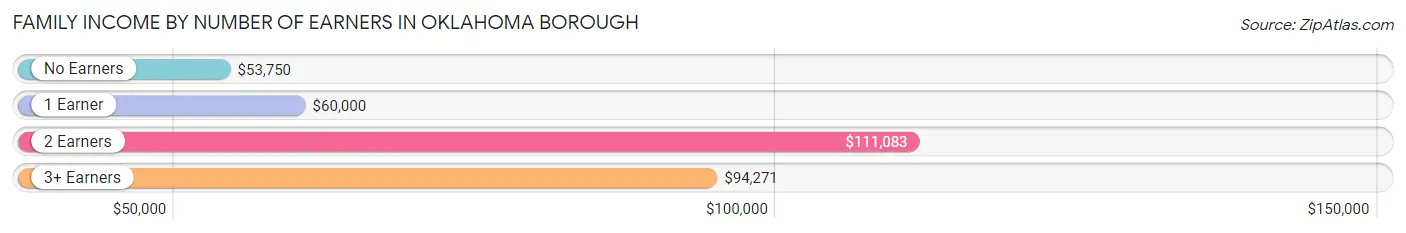
Family Income by Number of Earners in Oklahoma borough
The median family income in Oklahoma borough is $76,875, with families comprising 2 earners (99) having the highest median family income of $111,083, while families with no earners (70) have the lowest median family income of $53,750, accounting for 34.4% and 24.3% of families, respectively.
| Number of Earners | # Families | Median Income |
| No Earners | 70 (24.3%) | $53,750 |
| 1 Earner | 96 (33.3%) | $60,000 |
| 2 Earners | 99 (34.4%) | $111,083 |
| 3+ Earners | 23 (8.0%) | $94,271 |
| Total | 288 (100.0%) | $76,875 |
Household Income in Oklahoma borough
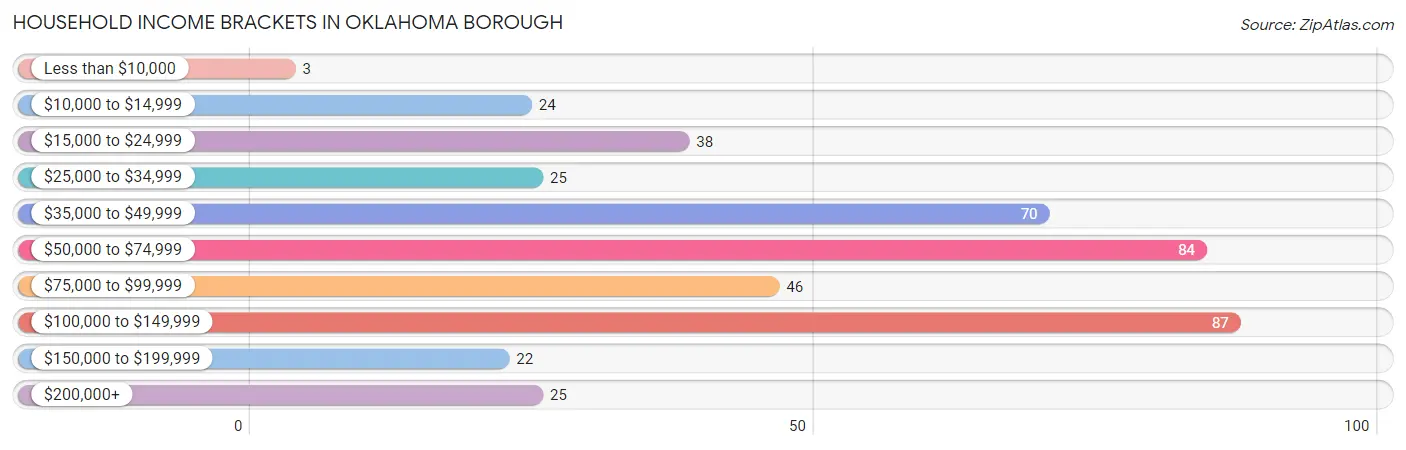
Household Income Brackets in Oklahoma borough
With 87 households falling in the category, the $100,000 to $149,999 income range is the most frequent in Oklahoma borough, accounting for 20.5% of all households. In contrast, only 3 households (0.7%) fall into the less than $10,000 income bracket, making it the least populous group.
| Income Bracket | # Households | % Households |
| Less than $10,000 | 3 | 0.7% |
| $10,000 to $14,999 | 24 | 5.7% |
| $15,000 to $24,999 | 38 | 9.0% |
| $25,000 to $34,999 | 25 | 5.9% |
| $35,000 to $49,999 | 70 | 16.5% |
| $50,000 to $74,999 | 84 | 19.8% |
| $75,000 to $99,999 | 46 | 10.8% |
| $100,000 to $149,999 | 87 | 20.5% |
| $150,000 to $199,999 | 22 | 5.2% |
| $200,000+ | 25 | 5.9% |
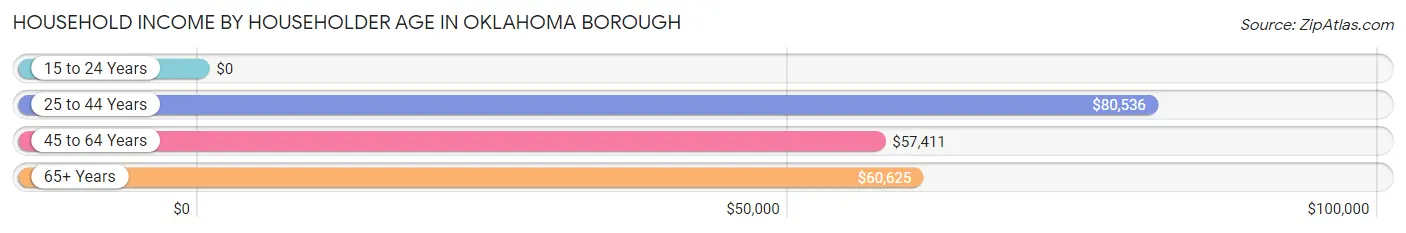
Household Income by Householder Age in Oklahoma borough
The median household income in Oklahoma borough is $62,188, with the highest median household income of $80,536 found in the 25 to 44 years age bracket for the primary householder. A total of 121 households (28.5%) fall into this category. Meanwhile, the 15 to 24 years age bracket for the primary householder has the lowest median household income of $0, with 4 households (0.9%) in this group.
| Income Bracket | # Households | Median Income |
| 15 to 24 Years | 4 (0.9%) | $0 |
| 25 to 44 Years | 121 (28.5%) | $80,536 |
| 45 to 64 Years | 167 (39.4%) | $57,411 |
| 65+ Years | 132 (31.1%) | $60,625 |
| Total | 424 (100.0%) | $62,188 |
Poverty in Oklahoma borough
Income Below Poverty by Sex and Age in Oklahoma borough
With 14.3% poverty level for males and 7.9% for females among the residents of Oklahoma borough, 15 year old males and 5 year old females are the most vulnerable to poverty, with 4 males (33.3%) and 4 females (50.0%) in their respective age groups living below the poverty level.
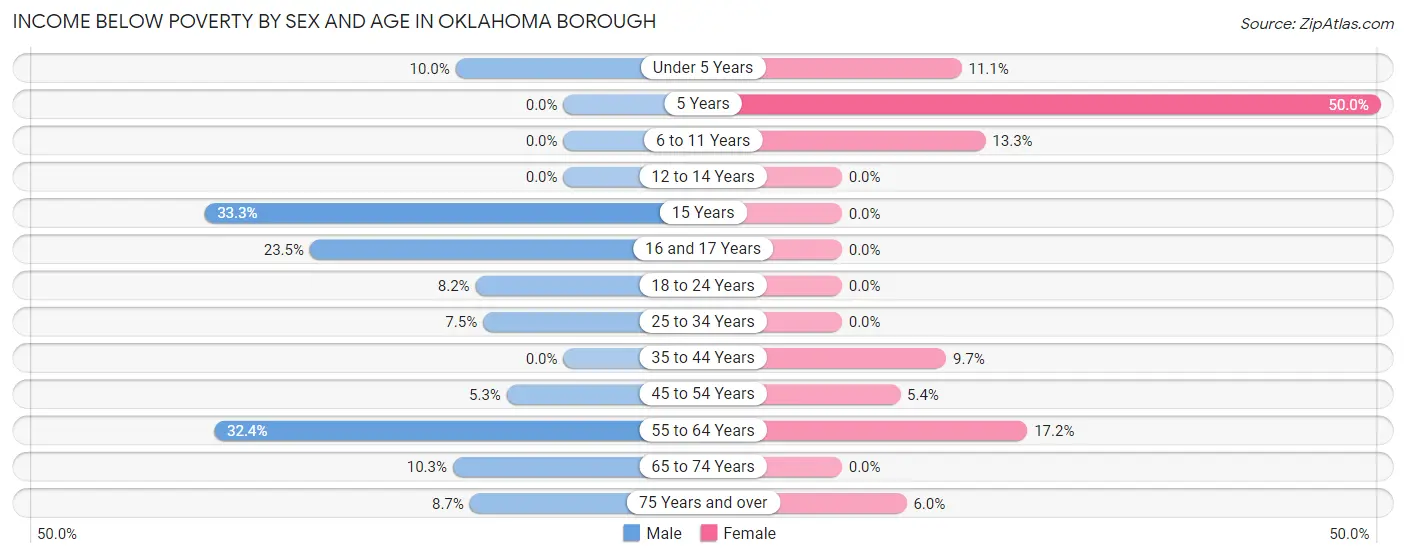
| Age Bracket | Male | Female |
| Under 5 Years | 2 (10.0%) | 2 (11.1%) |
| 5 Years | 0 (0.0%) | 4 (50.0%) |
| 6 to 11 Years | 0 (0.0%) | 4 (13.3%) |
| 12 to 14 Years | 0 (0.0%) | 0 (0.0%) |
| 15 Years | 4 (33.3%) | 0 (0.0%) |
| 16 and 17 Years | 4 (23.5%) | 0 (0.0%) |
| 18 to 24 Years | 4 (8.2%) | 0 (0.0%) |
| 25 to 34 Years | 5 (7.5%) | 0 (0.0%) |
| 35 to 44 Years | 0 (0.0%) | 3 (9.7%) |
| 45 to 54 Years | 2 (5.3%) | 2 (5.4%) |
| 55 to 64 Years | 35 (32.4%) | 21 (17.2%) |
| 65 to 74 Years | 8 (10.3%) | 0 (0.0%) |
| 75 Years and over | 2 (8.7%) | 3 (6.0%) |
| Total | 66 (14.3%) | 39 (7.9%) |
Income Above Poverty by Sex and Age in Oklahoma borough
According to the poverty statistics in Oklahoma borough, males aged 5 years and females aged 12 to 14 years are the age groups that are most secure financially, with 100.0% of males and 100.0% of females in these age groups living above the poverty line.
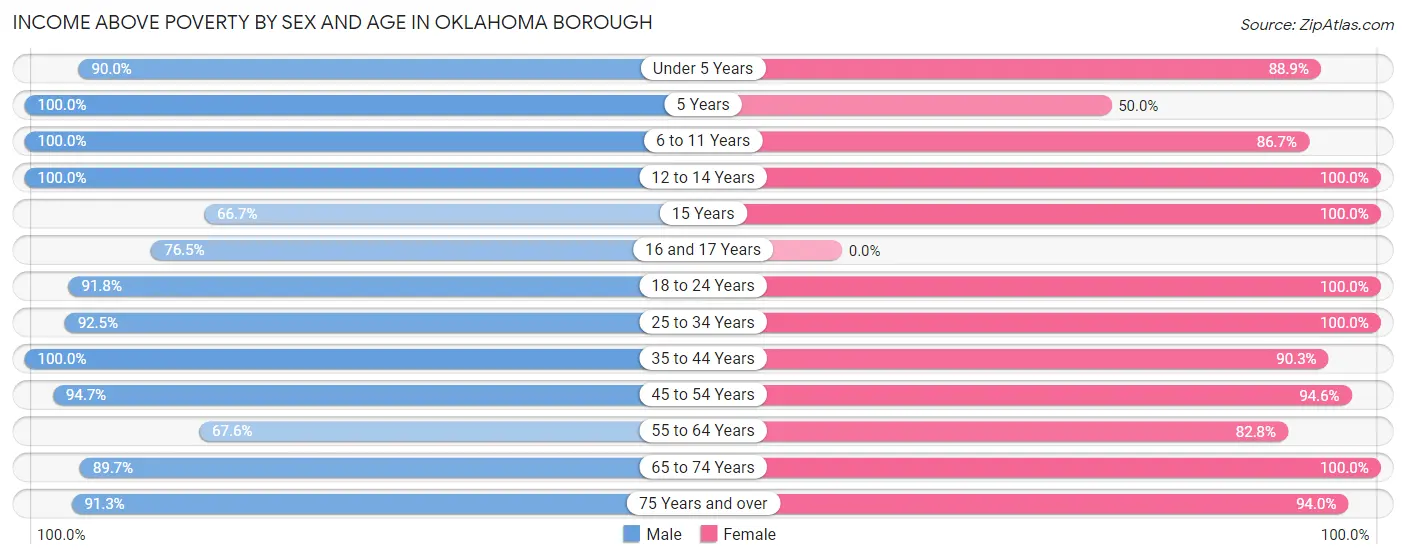
| Age Bracket | Male | Female |
| Under 5 Years | 18 (90.0%) | 16 (88.9%) |
| 5 Years | 12 (100.0%) | 4 (50.0%) |
| 6 to 11 Years | 6 (100.0%) | 26 (86.7%) |
| 12 to 14 Years | 12 (100.0%) | 7 (100.0%) |
| 15 Years | 8 (66.7%) | 1 (100.0%) |
| 16 and 17 Years | 13 (76.5%) | 0 (0.0%) |
| 18 to 24 Years | 45 (91.8%) | 18 (100.0%) |
| 25 to 34 Years | 62 (92.5%) | 102 (100.0%) |
| 35 to 44 Years | 20 (100.0%) | 28 (90.3%) |
| 45 to 54 Years | 36 (94.7%) | 35 (94.6%) |
| 55 to 64 Years | 73 (67.6%) | 101 (82.8%) |
| 65 to 74 Years | 70 (89.7%) | 71 (100.0%) |
| 75 Years and over | 21 (91.3%) | 47 (94.0%) |
| Total | 396 (85.7%) | 456 (92.1%) |
Income Below Poverty Among Married-Couple Families in Oklahoma borough
The poverty statistics for married-couple families in Oklahoma borough show that 3.7% or 8 of the total 214 families live below the poverty line. Families with no children have the highest poverty rate of 4.9%, comprising of 8 families. On the other hand, families with 1 or 2 children have the lowest poverty rate of 0.0%, which includes 0 families.
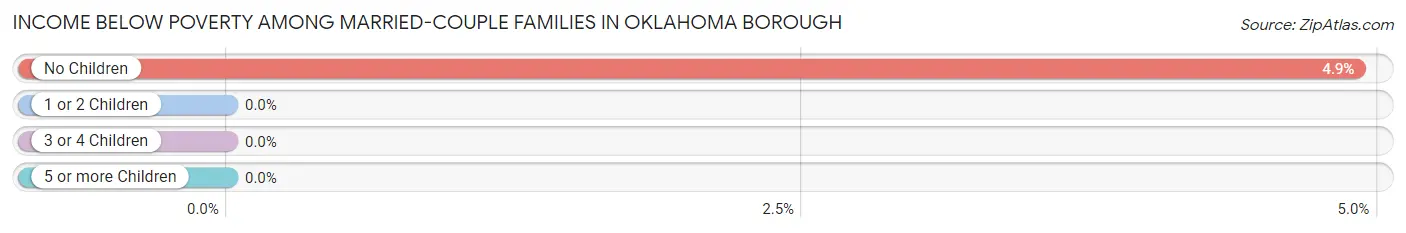
| Children | Above Poverty | Below Poverty |
| No Children | 155 (95.1%) | 8 (4.9%) |
| 1 or 2 Children | 51 (100.0%) | 0 (0.0%) |
| 3 or 4 Children | 0 (0.0%) | 0 (0.0%) |
| 5 or more Children | 0 (0.0%) | 0 (0.0%) |
| Total | 206 (96.3%) | 8 (3.7%) |
Income Below Poverty Among Single-Parent Households in Oklahoma borough
According to the poverty data in Oklahoma borough, 36.8% or 7 single-father households and 23.6% or 13 single-mother households are living below the poverty line. Among single-father households, those with no children have the highest poverty rate, with 7 households (36.8%) experiencing poverty. Likewise, among single-mother households, those with 3 or 4 children have the highest poverty rate, with 3 households (100.0%) falling below the poverty line.
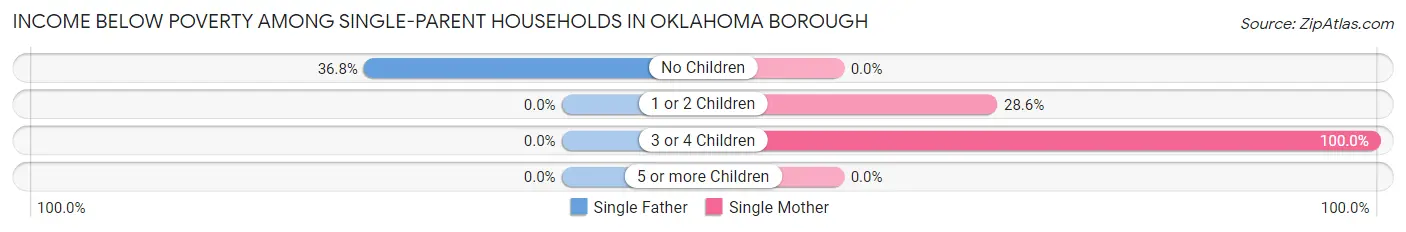
| Children | Single Father | Single Mother |
| No Children | 7 (36.8%) | 0 (0.0%) |
| 1 or 2 Children | 0 (0.0%) | 10 (28.6%) |
| 3 or 4 Children | 0 (0.0%) | 3 (100.0%) |
| 5 or more Children | 0 (0.0%) | 0 (0.0%) |
| Total | 7 (36.8%) | 13 (23.6%) |
Income Below Poverty Among Married-Couple vs Single-Parent Households in Oklahoma borough
The poverty data for Oklahoma borough shows that 8 of the married-couple family households (3.7%) and 20 of the single-parent households (27.0%) are living below the poverty level. Within the married-couple family households, those with no children have the highest poverty rate, with 8 households (4.9%) falling below the poverty line. Among the single-parent households, those with 3 or 4 children have the highest poverty rate, with 3 household (100.0%) living below poverty.
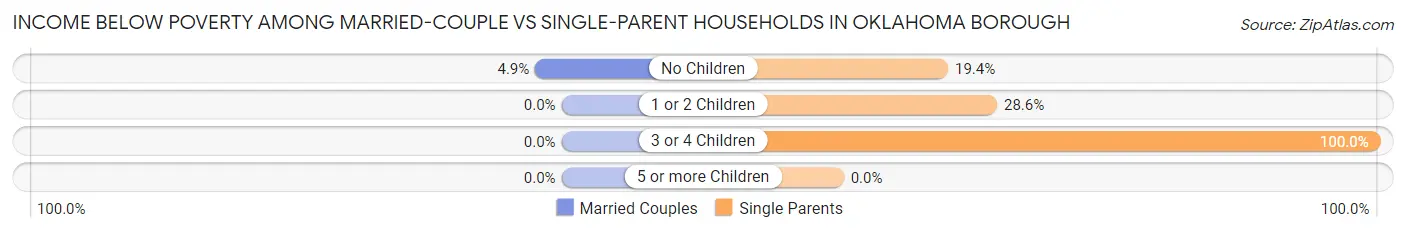
| Children | Married-Couple Families | Single-Parent Households |
| No Children | 8 (4.9%) | 7 (19.4%) |
| 1 or 2 Children | 0 (0.0%) | 10 (28.6%) |
| 3 or 4 Children | 0 (0.0%) | 3 (100.0%) |
| 5 or more Children | 0 (0.0%) | 0 (0.0%) |
| Total | 8 (3.7%) | 20 (27.0%) |
Race in Oklahoma borough
The most populous races in Oklahoma borough are White / Caucasian (918 | 95.2%), Hispanic or Latino (41 | 4.3%), and Two or more Races (28 | 2.9%).
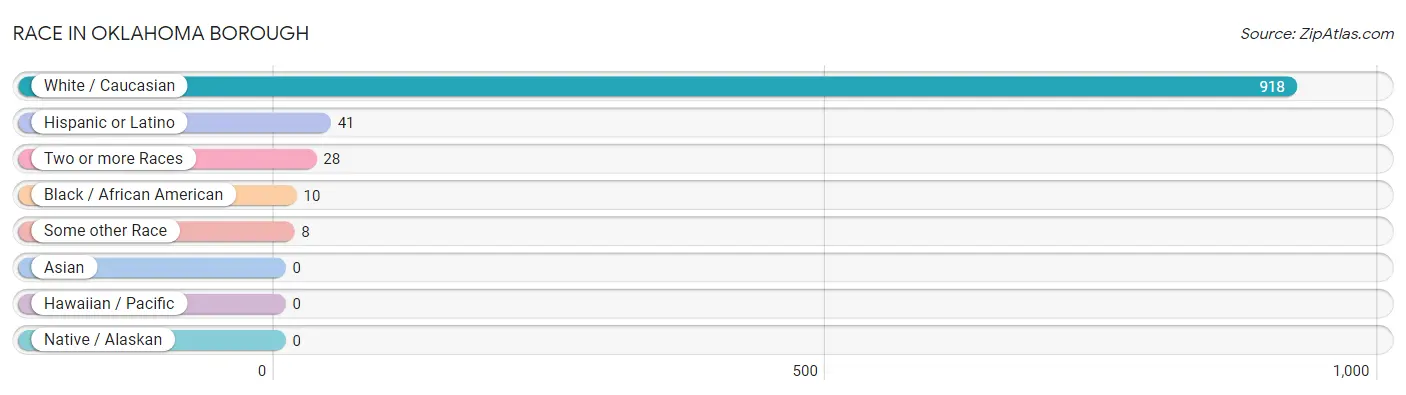
| Race | # Population | % Population |
| Asian | 0 | 0.0% |
| Black / African American | 10 | 1.0% |
| Hawaiian / Pacific | 0 | 0.0% |
| Hispanic or Latino | 41 | 4.3% |
| Native / Alaskan | 0 | 0.0% |
| White / Caucasian | 918 | 95.2% |
| Two or more Races | 28 | 2.9% |
| Some other Race | 8 | 0.8% |
| Total | 964 | 100.0% |
Ancestry in Oklahoma borough
The most populous ancestries reported in Oklahoma borough are German (278 | 28.8%), Irish (198 | 20.5%), English (164 | 17.0%), Italian (161 | 16.7%), and Polish (60 | 6.2%), together accounting for 89.3% of all Oklahoma borough residents.
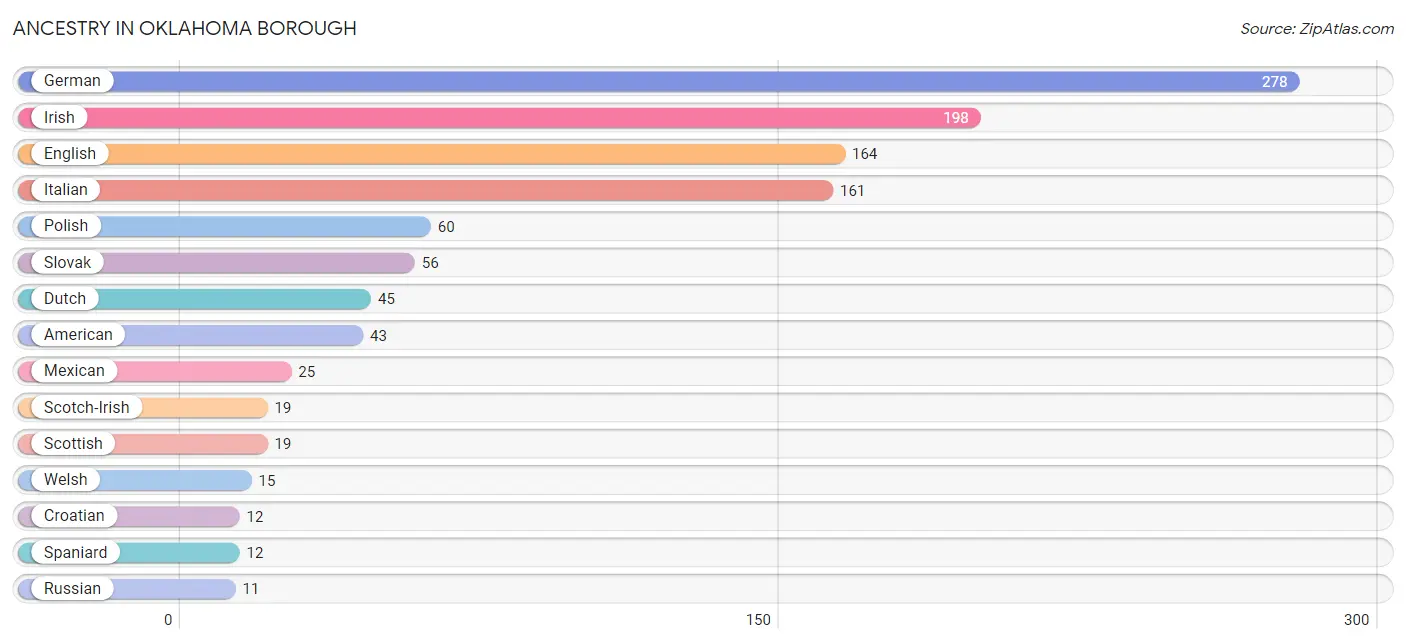
| Ancestry | # Population | % Population |
| American | 43 | 4.5% |
| Arab | 2 | 0.2% |
| British | 6 | 0.6% |
| Cherokee | 7 | 0.7% |
| Croatian | 12 | 1.2% |
| Czech | 2 | 0.2% |
| Dutch | 45 | 4.7% |
| English | 164 | 17.0% |
| French | 4 | 0.4% |
| German | 278 | 28.8% |
| Hungarian | 4 | 0.4% |
| Irish | 198 | 20.5% |
| Italian | 161 | 16.7% |
| Lithuanian | 5 | 0.5% |
| Mexican | 25 | 2.6% |
| Northern European | 3 | 0.3% |
| Pennsylvania German | 8 | 0.8% |
| Polish | 60 | 6.2% |
| Puerto Rican | 4 | 0.4% |
| Russian | 11 | 1.1% |
| Scotch-Irish | 19 | 2.0% |
| Scottish | 19 | 2.0% |
| Slovak | 56 | 5.8% |
| Spaniard | 12 | 1.2% |
| Swedish | 3 | 0.3% |
| Swiss | 2 | 0.2% |
| Ukrainian | 2 | 0.2% |
| Welsh | 15 | 1.6% | View All 28 Rows |
Immigrants in Oklahoma borough
The most numerous immigrant groups reported in Oklahoma borough came from Europe (3 | 0.3%), Canada (2 | 0.2%), Germany (2 | 0.2%), Western Europe (2 | 0.2%), and England (1 | 0.1%), together accounting for 1.0% of all Oklahoma borough residents.
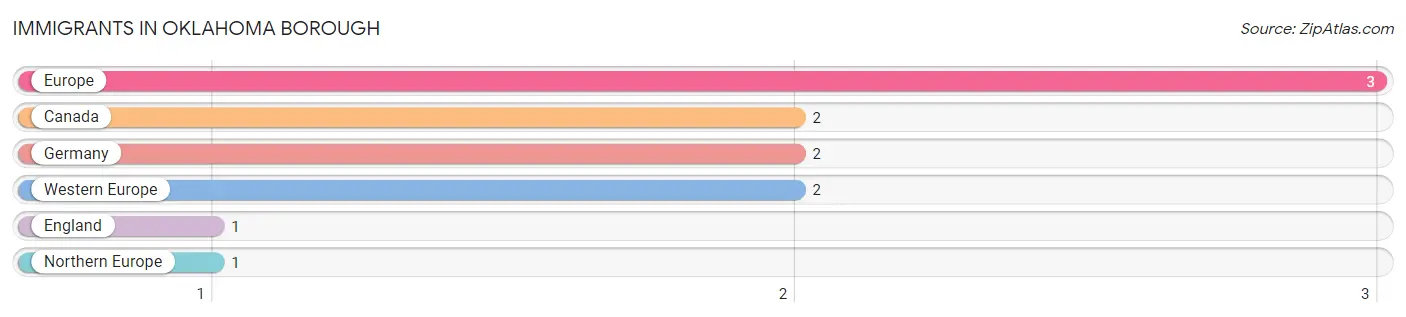
| Immigration Origin | # Population | % Population |
| Canada | 2 | 0.2% |
| England | 1 | 0.1% |
| Europe | 3 | 0.3% |
| Germany | 2 | 0.2% |
| Northern Europe | 1 | 0.1% |
| Western Europe | 2 | 0.2% | View All 6 Rows |
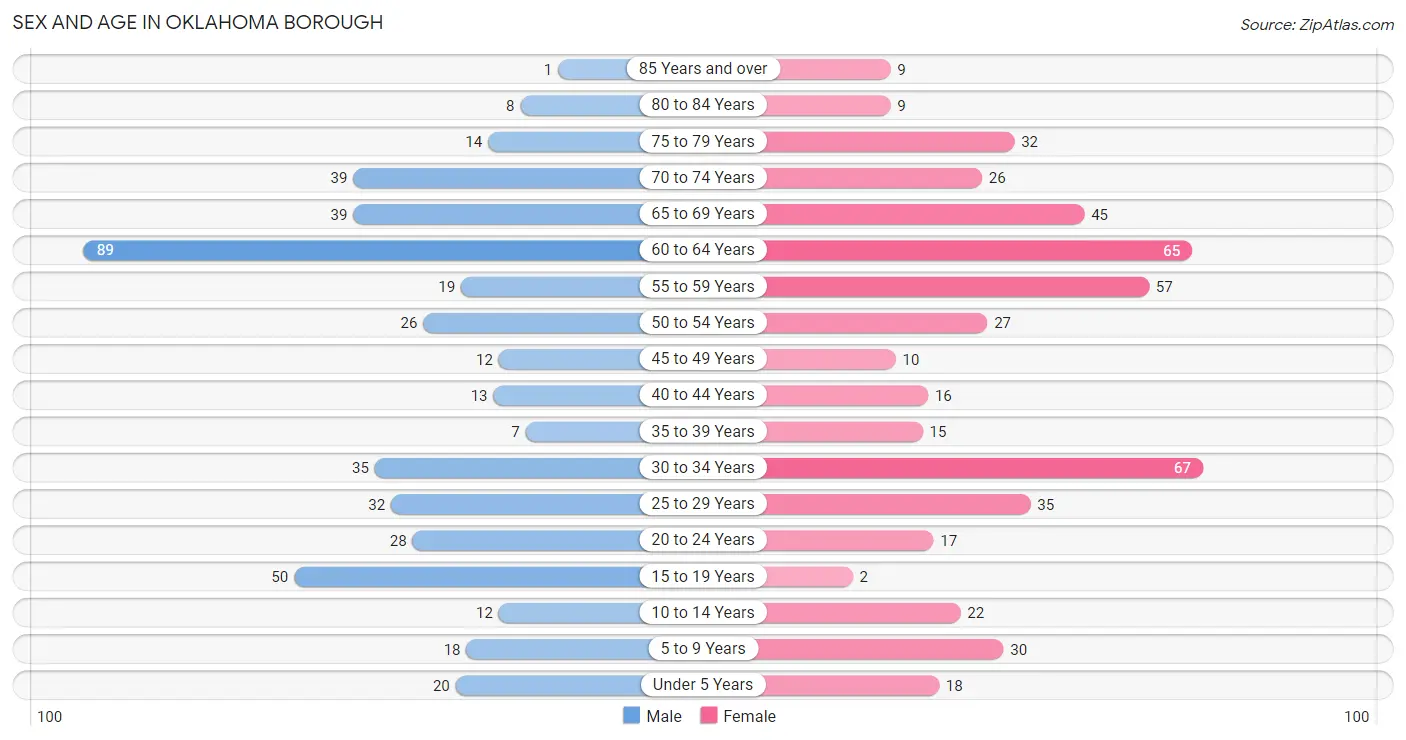
Sex and Age in Oklahoma borough
Sex and Age in Oklahoma borough
The most populous age groups in Oklahoma borough are 60 to 64 Years (89 | 19.3%) for men and 30 to 34 Years (67 | 13.4%) for women.
| Age Bracket | Male | Female |
| Under 5 Years | 20 (4.3%) | 18 (3.6%) |
| 5 to 9 Years | 18 (3.9%) | 30 (6.0%) |
| 10 to 14 Years | 12 (2.6%) | 22 (4.4%) |
| 15 to 19 Years | 50 (10.8%) | 2 (0.4%) |
| 20 to 24 Years | 28 (6.1%) | 17 (3.4%) |
| 25 to 29 Years | 32 (6.9%) | 35 (7.0%) |
| 30 to 34 Years | 35 (7.6%) | 67 (13.4%) |
| 35 to 39 Years | 7 (1.5%) | 15 (3.0%) |
| 40 to 44 Years | 13 (2.8%) | 16 (3.2%) |
| 45 to 49 Years | 12 (2.6%) | 10 (2.0%) |
| 50 to 54 Years | 26 (5.6%) | 27 (5.4%) |
| 55 to 59 Years | 19 (4.1%) | 57 (11.4%) |
| 60 to 64 Years | 89 (19.3%) | 65 (13.0%) |
| 65 to 69 Years | 39 (8.4%) | 45 (9.0%) |
| 70 to 74 Years | 39 (8.4%) | 26 (5.2%) |
| 75 to 79 Years | 14 (3.0%) | 32 (6.4%) |
| 80 to 84 Years | 8 (1.7%) | 9 (1.8%) |
| 85 Years and over | 1 (0.2%) | 9 (1.8%) |
| Total | 462 (100.0%) | 502 (100.0%) |
Families and Households in Oklahoma borough
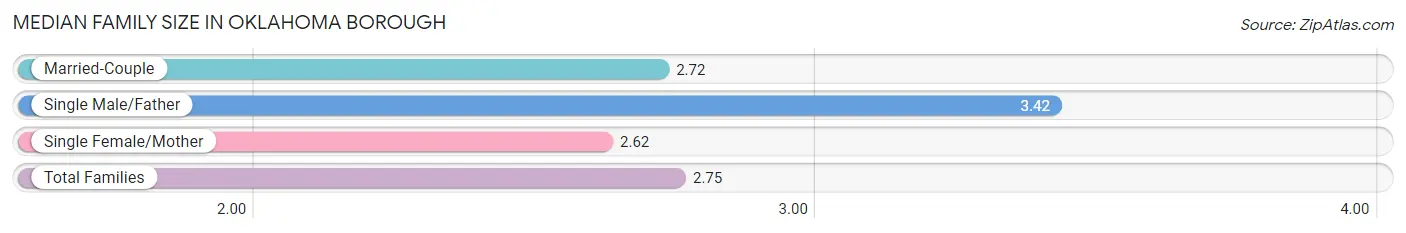
Median Family Size in Oklahoma borough
The median family size in Oklahoma borough is 2.75 persons per family, with single male/father families (19 | 6.6%) accounting for the largest median family size of 3.42 persons per family. On the other hand, single female/mother families (55 | 19.1%) represent the smallest median family size with 2.62 persons per family.
| Family Type | # Families | Family Size |
| Married-Couple | 214 (74.3%) | 2.72 |
| Single Male/Father | 19 (6.6%) | 3.42 |
| Single Female/Mother | 55 (19.1%) | 2.62 |
| Total Families | 288 (100.0%) | 2.75 |
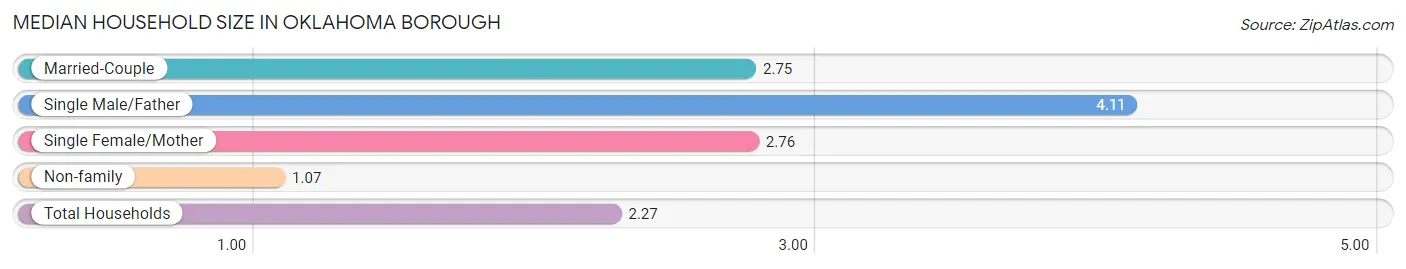
Median Household Size in Oklahoma borough
The median household size in Oklahoma borough is 2.27 persons per household, with single male/father households (19 | 4.5%) accounting for the largest median household size of 4.11 persons per household. non-family households (136 | 32.1%) represent the smallest median household size with 1.07 persons per household.
| Household Type | # Households | Household Size |
| Married-Couple | 214 (50.5%) | 2.75 |
| Single Male/Father | 19 (4.5%) | 4.11 |
| Single Female/Mother | 55 (13.0%) | 2.76 |
| Non-family | 136 (32.1%) | 1.07 |
| Total Households | 424 (100.0%) | 2.27 |
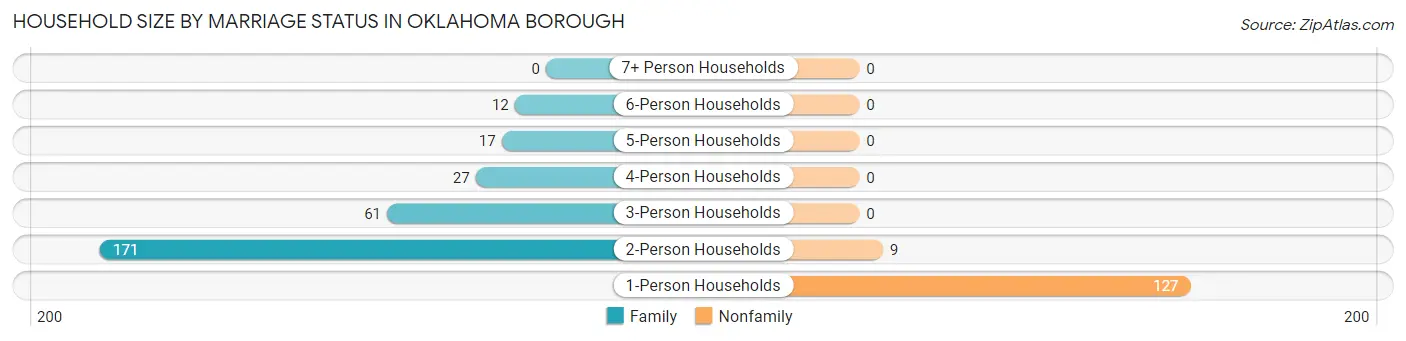
Household Size by Marriage Status in Oklahoma borough
Out of a total of 424 households in Oklahoma borough, 288 (67.9%) are family households, while 136 (32.1%) are nonfamily households. The most numerous type of family households are 2-person households, comprising 171, and the most common type of nonfamily households are 1-person households, comprising 127.
| Household Size | Family Households | Nonfamily Households |
| 1-Person Households | - | 127 (29.9%) |
| 2-Person Households | 171 (40.3%) | 9 (2.1%) |
| 3-Person Households | 61 (14.4%) | 0 (0.0%) |
| 4-Person Households | 27 (6.4%) | 0 (0.0%) |
| 5-Person Households | 17 (4.0%) | 0 (0.0%) |
| 6-Person Households | 12 (2.8%) | 0 (0.0%) |
| 7+ Person Households | 0 (0.0%) | 0 (0.0%) |
| Total | 288 (67.9%) | 136 (32.1%) |
Female Fertility in Oklahoma borough
Fertility by Age in Oklahoma borough
| Age Bracket | Women with Births | Births / 1,000 Women |
| 15 to 19 years | 0 (0.0%) | 0.0 |
| 20 to 34 years | 0 (0.0%) | 0.0 |
| 35 to 50 years | 0 (0.0%) | 0.0 |
| Total | 0 (0.0%) | 0.0 |
Fertility by Age by Marriage Status in Oklahoma borough
| Age Bracket | Married | Unmarried |
| 15 to 19 years | 0 (0.0%) | 0 (0.0%) |
| 20 to 34 years | 0 (0.0%) | 0 (0.0%) |
| 35 to 50 years | 0 (0.0%) | 0 (0.0%) |
| Total | 0 (0.0%) | 0 (0.0%) |
Fertility by Education in Oklahoma borough
| Educational Attainment | Women with Births | Births / 1,000 Women |
| Less than High School | 0 (0.0%) | 0.0 |
| High School Diploma | 0 (0.0%) | 0.0 |
| College or Associate's Degree | 0 (0.0%) | 0.0 |
| Bachelor's Degree | 0 (0.0%) | 0.0 |
| Graduate Degree | 0 (0.0%) | 0.0 |
| Total | 0 (0.0%) | 0.0 |
Fertility by Education by Marriage Status in Oklahoma borough
| Educational Attainment | Married | Unmarried |
| Less than High School | 0 (0.0%) | 0 (0.0%) |
| High School Diploma | 0 (0.0%) | 0 (0.0%) |
| College or Associate's Degree | 0 (0.0%) | 0 (0.0%) |
| Bachelor's Degree | 0 (0.0%) | 0 (0.0%) |
| Graduate Degree | 0 (0.0%) | 0 (0.0%) |
| Total | 0 (0.0%) | 0 (0.0%) |
Employment Characteristics in Oklahoma borough
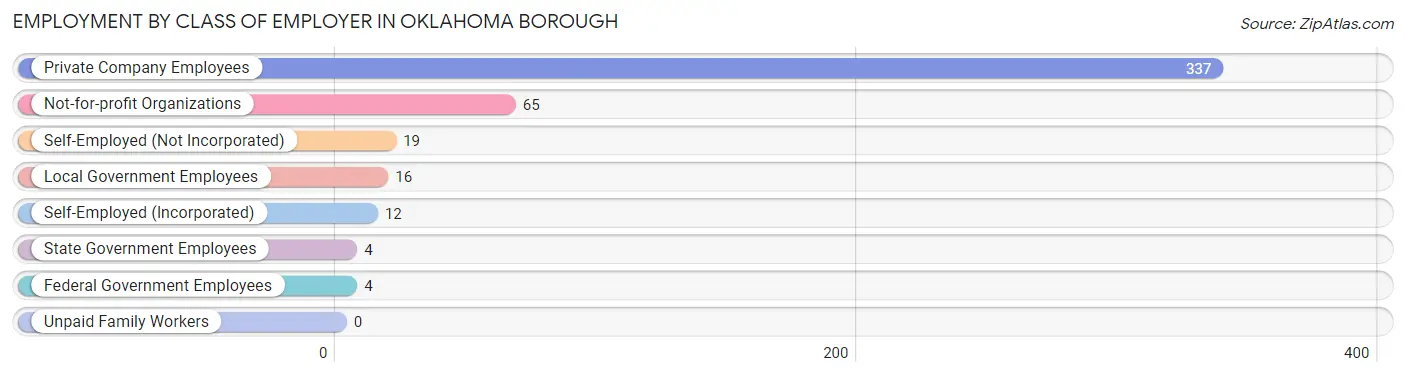
Employment by Class of Employer in Oklahoma borough
Among the 457 employed individuals in Oklahoma borough, private company employees (337 | 73.7%), not-for-profit organizations (65 | 14.2%), and self-employed (not incorporated) (19 | 4.2%) make up the most common classes of employment.
| Employer Class | # Employees | % Employees |
| Private Company Employees | 337 | 73.7% |
| Self-Employed (Incorporated) | 12 | 2.6% |
| Self-Employed (Not Incorporated) | 19 | 4.2% |
| Not-for-profit Organizations | 65 | 14.2% |
| Local Government Employees | 16 | 3.5% |
| State Government Employees | 4 | 0.9% |
| Federal Government Employees | 4 | 0.9% |
| Unpaid Family Workers | 0 | 0.0% |
| Total | 457 | 100.0% |
Employment Status by Age in Oklahoma borough
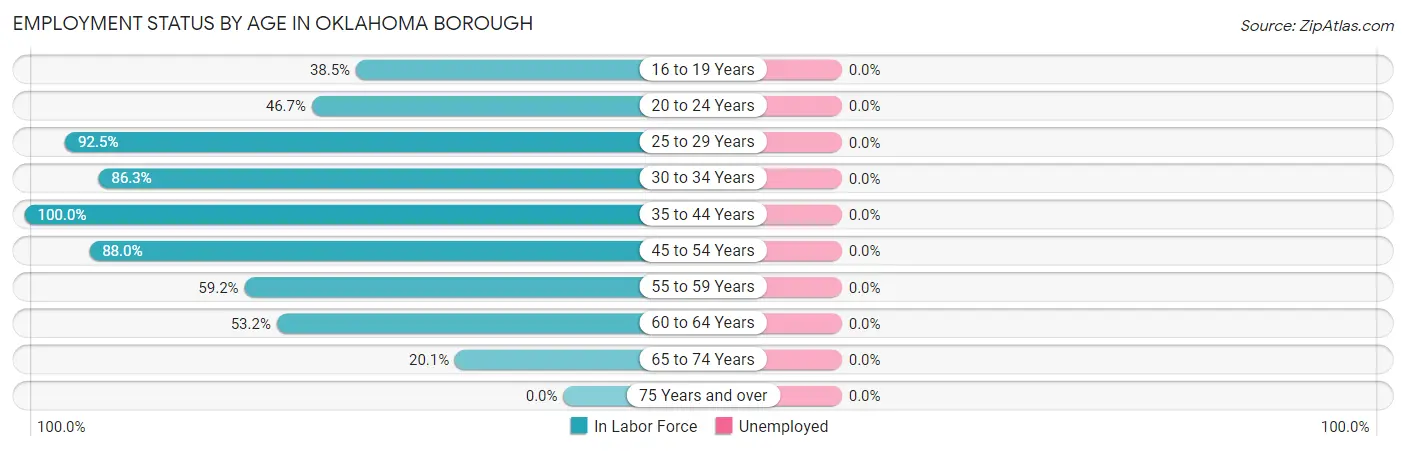
| Age Bracket | In Labor Force | Unemployed |
| 16 to 19 Years | 15 (38.5%) | 0 (0.0%) |
| 20 to 24 Years | 21 (46.7%) | 0 (0.0%) |
| 25 to 29 Years | 62 (92.5%) | 0 (0.0%) |
| 30 to 34 Years | 88 (86.3%) | 0 (0.0%) |
| 35 to 44 Years | 51 (100.0%) | 0 (0.0%) |
| 45 to 54 Years | 66 (88.0%) | 0 (0.0%) |
| 55 to 59 Years | 45 (59.2%) | 0 (0.0%) |
| 60 to 64 Years | 82 (53.2%) | 0 (0.0%) |
| 65 to 74 Years | 30 (20.1%) | 0 (0.0%) |
| 75 Years and over | 0 (0.0%) | 0 (0.0%) |
| Total | 460 (55.4%) | 0 (0.0%) |
Employment Status by Educational Attainment in Oklahoma borough
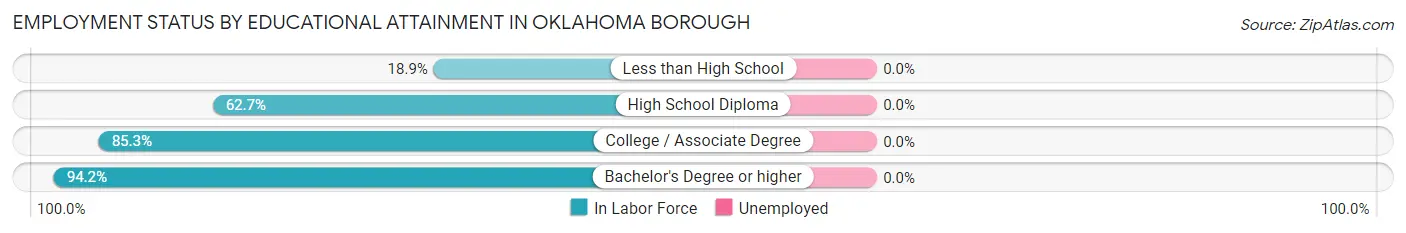
| Educational Attainment | In Labor Force | Unemployed |
| Less than High School | 7 (18.9%) | 0 (0.0%) |
| High School Diploma | 111 (62.7%) | 0 (0.0%) |
| College / Associate Degree | 163 (85.3%) | 0 (0.0%) |
| Bachelor's Degree or higher | 113 (94.2%) | 0 (0.0%) |
| Total | 394 (75.0%) | 0 (0.0%) |
Employment Occupations by Sex in Oklahoma borough
Management, Business, Science and Arts Occupations
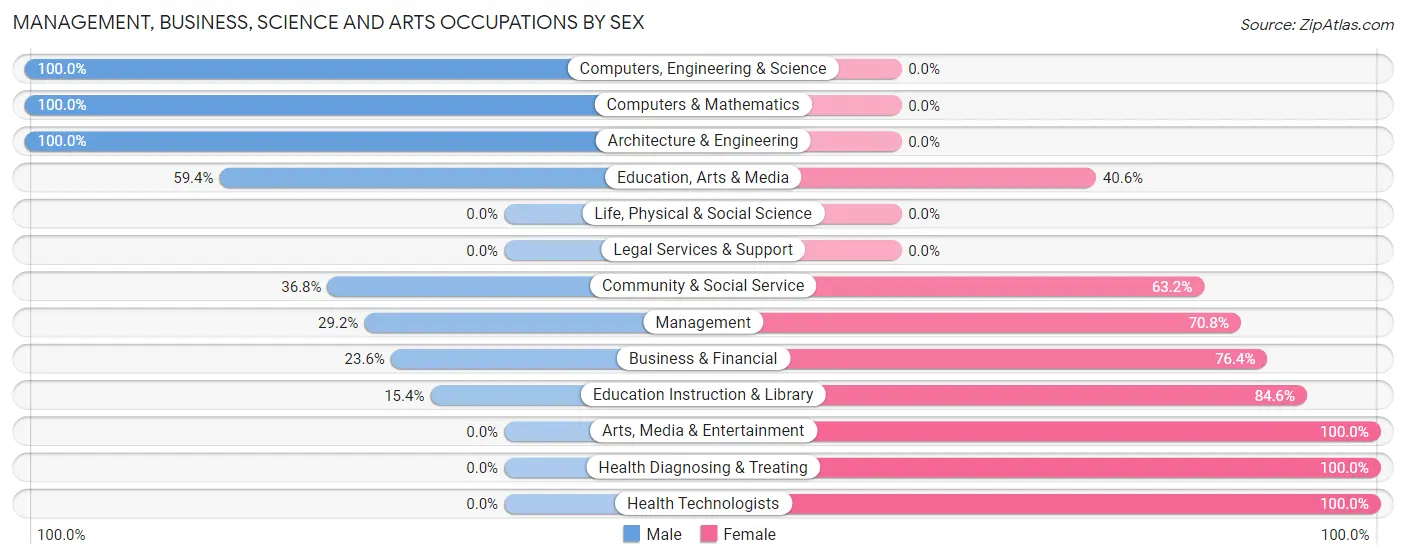
The most common Management, Business, Science and Arts occupations in Oklahoma borough are Community & Social Service (57 | 12.4%), Business & Financial (55 | 12.0%), Education, Arts & Media (32 | 7.0%), Health Diagnosing & Treating (32 | 7.0%), and Management (24 | 5.2%).
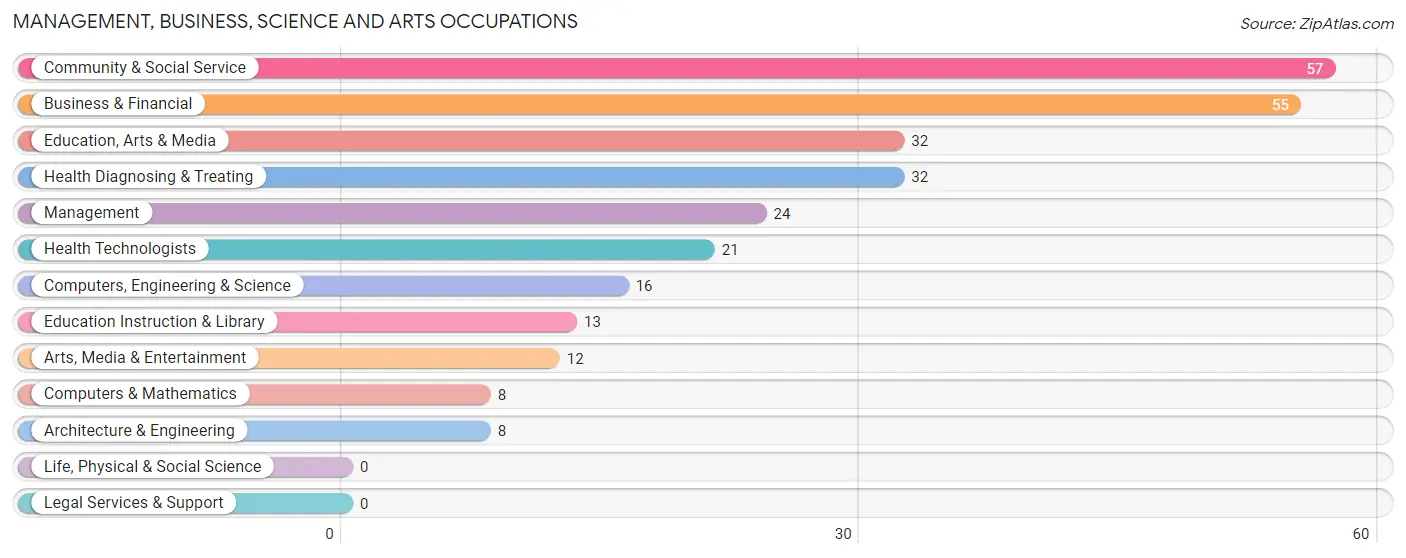
Management, Business, Science and Arts Occupations by Sex
Within the Management, Business, Science and Arts occupations in Oklahoma borough, the most male-oriented occupations are Computers, Engineering & Science (100.0%), Computers & Mathematics (100.0%), and Architecture & Engineering (100.0%), while the most female-oriented occupations are Arts, Media & Entertainment (100.0%), Health Diagnosing & Treating (100.0%), and Health Technologists (100.0%).
| Occupation | Male | Female |
| Management | 7 (29.2%) | 17 (70.8%) |
| Business & Financial | 13 (23.6%) | 42 (76.4%) |
| Computers, Engineering & Science | 16 (100.0%) | 0 (0.0%) |
| Computers & Mathematics | 8 (100.0%) | 0 (0.0%) |
| Architecture & Engineering | 8 (100.0%) | 0 (0.0%) |
| Life, Physical & Social Science | 0 (0.0%) | 0 (0.0%) |
| Community & Social Service | 21 (36.8%) | 36 (63.2%) |
| Education, Arts & Media | 19 (59.4%) | 13 (40.6%) |
| Legal Services & Support | 0 (0.0%) | 0 (0.0%) |
| Education Instruction & Library | 2 (15.4%) | 11 (84.6%) |
| Arts, Media & Entertainment | 0 (0.0%) | 12 (100.0%) |
| Health Diagnosing & Treating | 0 (0.0%) | 32 (100.0%) |
| Health Technologists | 0 (0.0%) | 21 (100.0%) |
| Total (Category) | 57 (31.0%) | 127 (69.0%) |
| Total (Overall) | 195 (42.4%) | 265 (57.6%) |
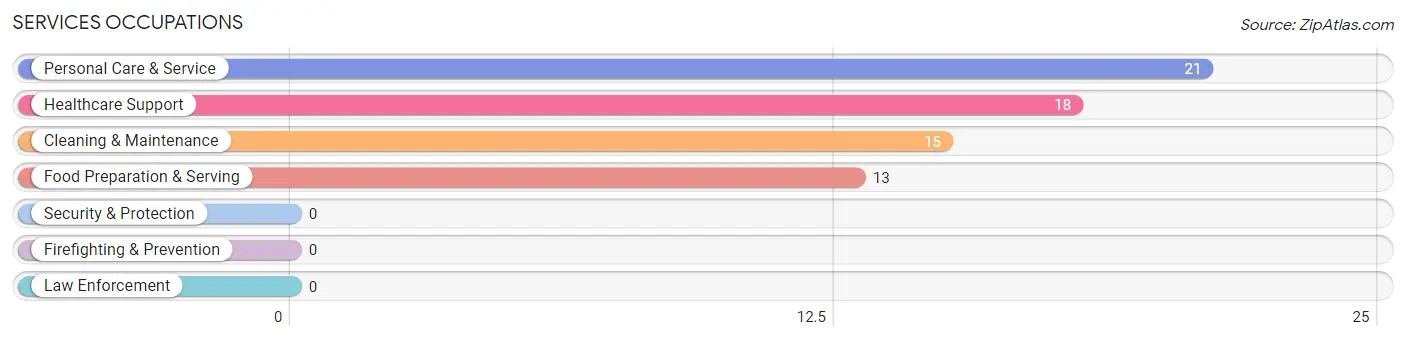
Services Occupations
The most common Services occupations in Oklahoma borough are Personal Care & Service (21 | 4.6%), Healthcare Support (18 | 3.9%), Cleaning & Maintenance (15 | 3.3%), and Food Preparation & Serving (13 | 2.8%).
Services Occupations by Sex
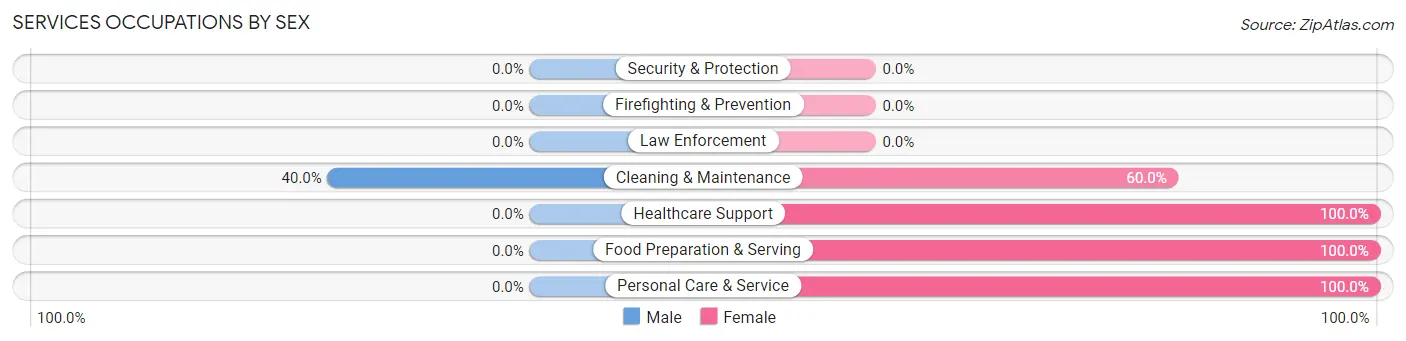
| Occupation | Male | Female |
| Healthcare Support | 0 (0.0%) | 18 (100.0%) |
| Security & Protection | 0 (0.0%) | 0 (0.0%) |
| Firefighting & Prevention | 0 (0.0%) | 0 (0.0%) |
| Law Enforcement | 0 (0.0%) | 0 (0.0%) |
| Food Preparation & Serving | 0 (0.0%) | 13 (100.0%) |
| Cleaning & Maintenance | 6 (40.0%) | 9 (60.0%) |
| Personal Care & Service | 0 (0.0%) | 21 (100.0%) |
| Total (Category) | 6 (9.0%) | 61 (91.0%) |
| Total (Overall) | 195 (42.4%) | 265 (57.6%) |
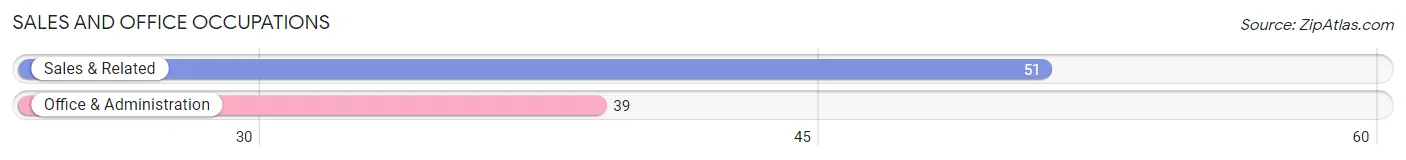
Sales and Office Occupations
The most common Sales and Office occupations in Oklahoma borough are Sales & Related (51 | 11.1%), and Office & Administration (39 | 8.5%).
Sales and Office Occupations by Sex
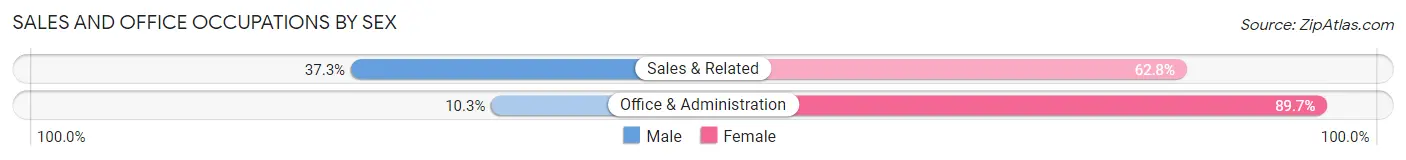
| Occupation | Male | Female |
| Sales & Related | 19 (37.2%) | 32 (62.7%) |
| Office & Administration | 4 (10.3%) | 35 (89.7%) |
| Total (Category) | 23 (25.6%) | 67 (74.4%) |
| Total (Overall) | 195 (42.4%) | 265 (57.6%) |
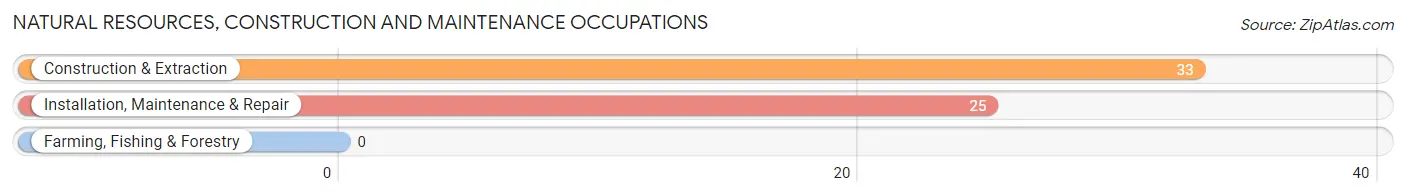
Natural Resources, Construction and Maintenance Occupations
The most common Natural Resources, Construction and Maintenance occupations in Oklahoma borough are Construction & Extraction (33 | 7.2%), and Installation, Maintenance & Repair (25 | 5.4%).
Natural Resources, Construction and Maintenance Occupations by Sex
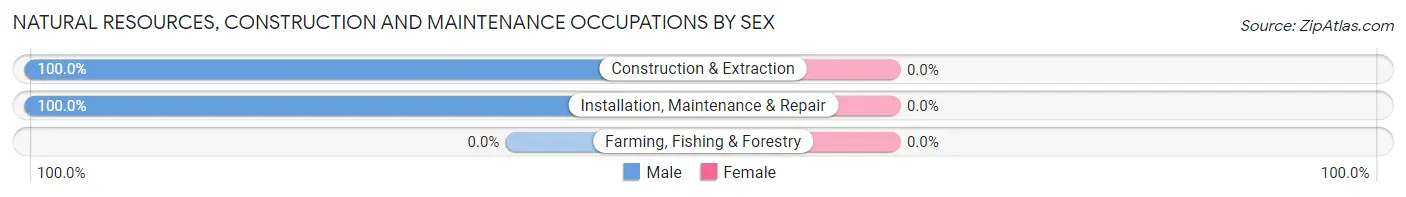
| Occupation | Male | Female |
| Farming, Fishing & Forestry | 0 (0.0%) | 0 (0.0%) |
| Construction & Extraction | 33 (100.0%) | 0 (0.0%) |
| Installation, Maintenance & Repair | 25 (100.0%) | 0 (0.0%) |
| Total (Category) | 58 (100.0%) | 0 (0.0%) |
| Total (Overall) | 195 (42.4%) | 265 (57.6%) |
Production, Transportation and Moving Occupations
The most common Production, Transportation and Moving occupations in Oklahoma borough are Production (38 | 8.3%), Material Moving (16 | 3.5%), and Transportation (7 | 1.5%).
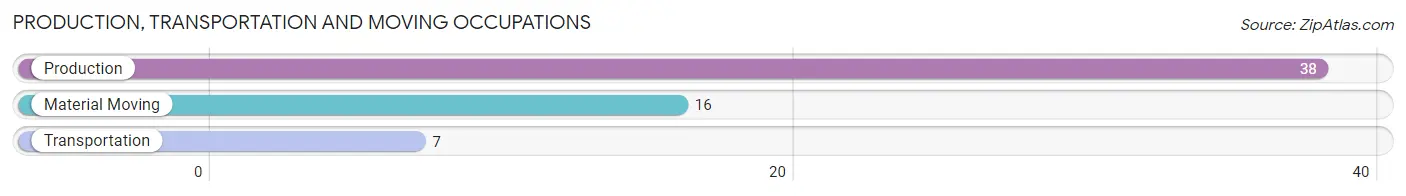
Production, Transportation and Moving Occupations by Sex
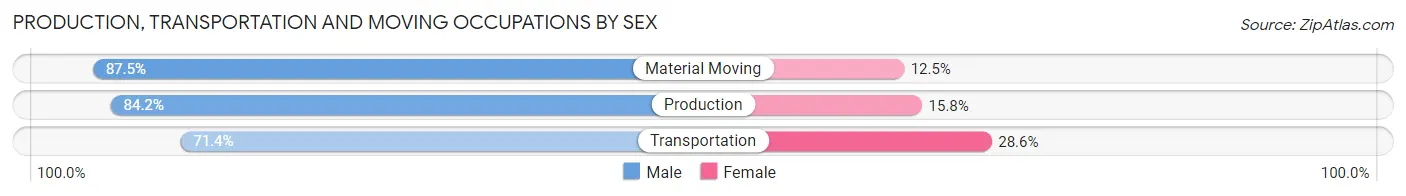
| Occupation | Male | Female |
| Production | 32 (84.2%) | 6 (15.8%) |
| Transportation | 5 (71.4%) | 2 (28.6%) |
| Material Moving | 14 (87.5%) | 2 (12.5%) |
| Total (Category) | 51 (83.6%) | 10 (16.4%) |
| Total (Overall) | 195 (42.4%) | 265 (57.6%) |
Employment Industries by Sex in Oklahoma borough
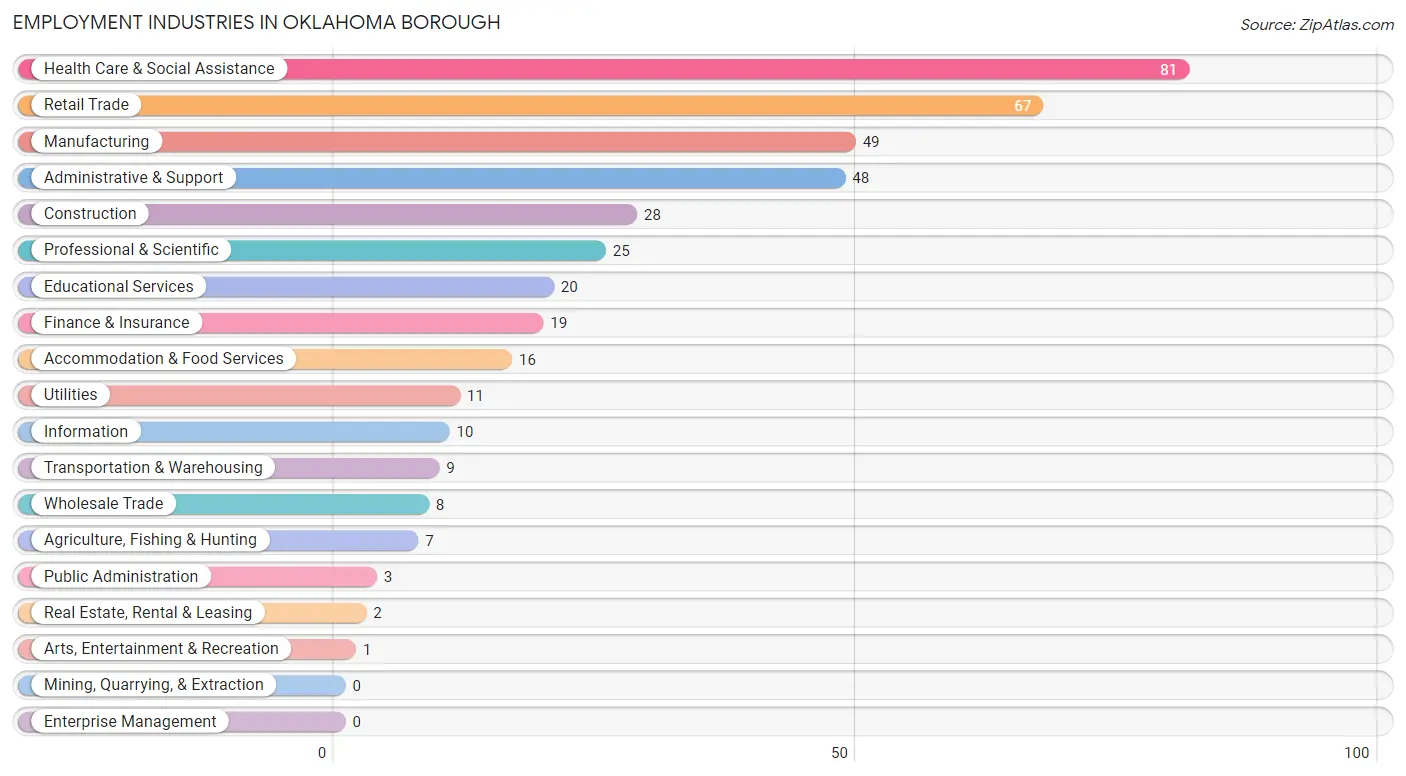
Employment Industries in Oklahoma borough
The major employment industries in Oklahoma borough include Health Care & Social Assistance (81 | 17.6%), Retail Trade (67 | 14.6%), Manufacturing (49 | 10.6%), Administrative & Support (48 | 10.4%), and Construction (28 | 6.1%).
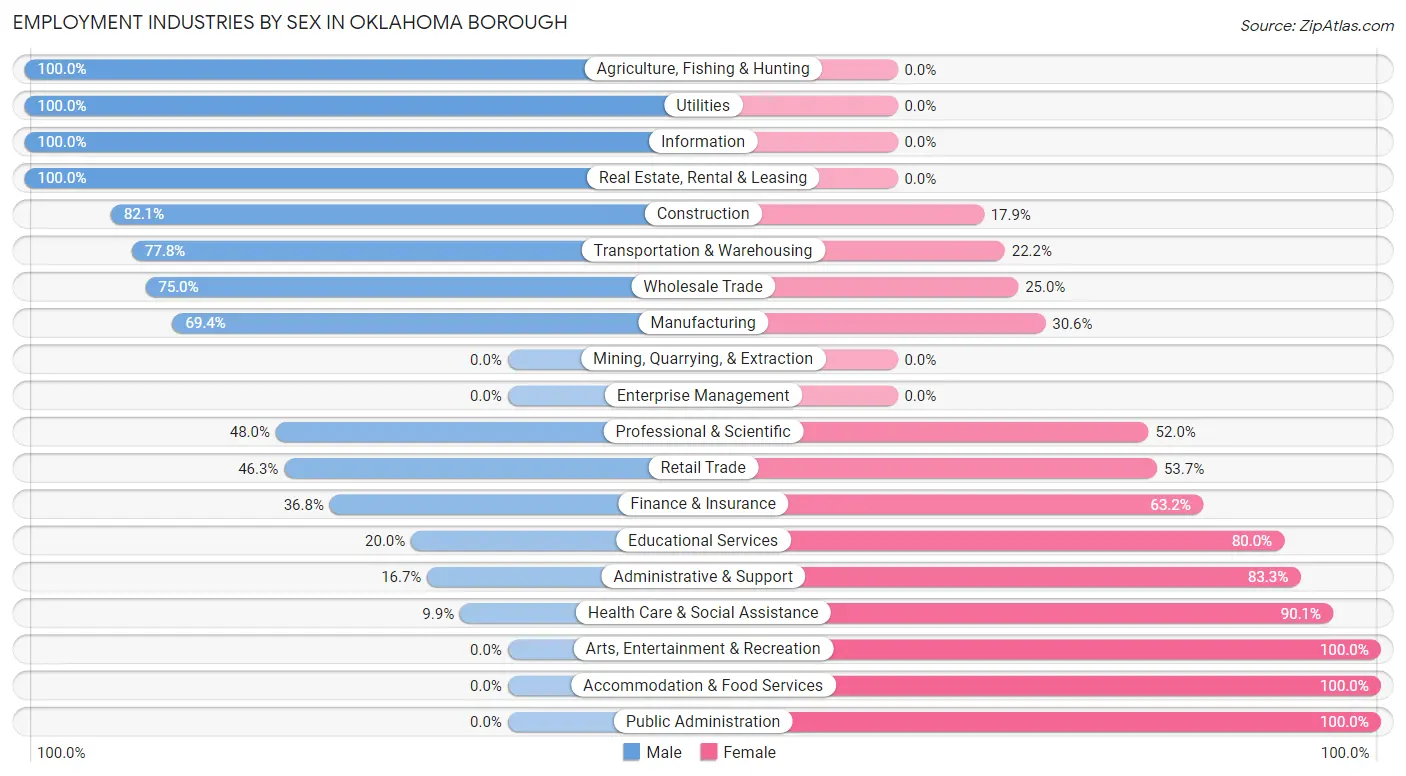
Employment Industries by Sex in Oklahoma borough
The Oklahoma borough industries that see more men than women are Agriculture, Fishing & Hunting (100.0%), Utilities (100.0%), and Information (100.0%), whereas the industries that tend to have a higher number of women are Arts, Entertainment & Recreation (100.0%), Accommodation & Food Services (100.0%), and Public Administration (100.0%).
| Industry | Male | Female |
| Agriculture, Fishing & Hunting | 7 (100.0%) | 0 (0.0%) |
| Mining, Quarrying, & Extraction | 0 (0.0%) | 0 (0.0%) |
| Construction | 23 (82.1%) | 5 (17.9%) |
| Manufacturing | 34 (69.4%) | 15 (30.6%) |
| Wholesale Trade | 6 (75.0%) | 2 (25.0%) |
| Retail Trade | 31 (46.3%) | 36 (53.7%) |
| Transportation & Warehousing | 7 (77.8%) | 2 (22.2%) |
| Utilities | 11 (100.0%) | 0 (0.0%) |
| Information | 10 (100.0%) | 0 (0.0%) |
| Finance & Insurance | 7 (36.8%) | 12 (63.2%) |
| Real Estate, Rental & Leasing | 2 (100.0%) | 0 (0.0%) |
| Professional & Scientific | 12 (48.0%) | 13 (52.0%) |
| Enterprise Management | 0 (0.0%) | 0 (0.0%) |
| Administrative & Support | 8 (16.7%) | 40 (83.3%) |
| Educational Services | 4 (20.0%) | 16 (80.0%) |
| Health Care & Social Assistance | 8 (9.9%) | 73 (90.1%) |
| Arts, Entertainment & Recreation | 0 (0.0%) | 1 (100.0%) |
| Accommodation & Food Services | 0 (0.0%) | 16 (100.0%) |
| Public Administration | 0 (0.0%) | 3 (100.0%) |
| Total | 195 (42.4%) | 265 (57.6%) |
Education in Oklahoma borough
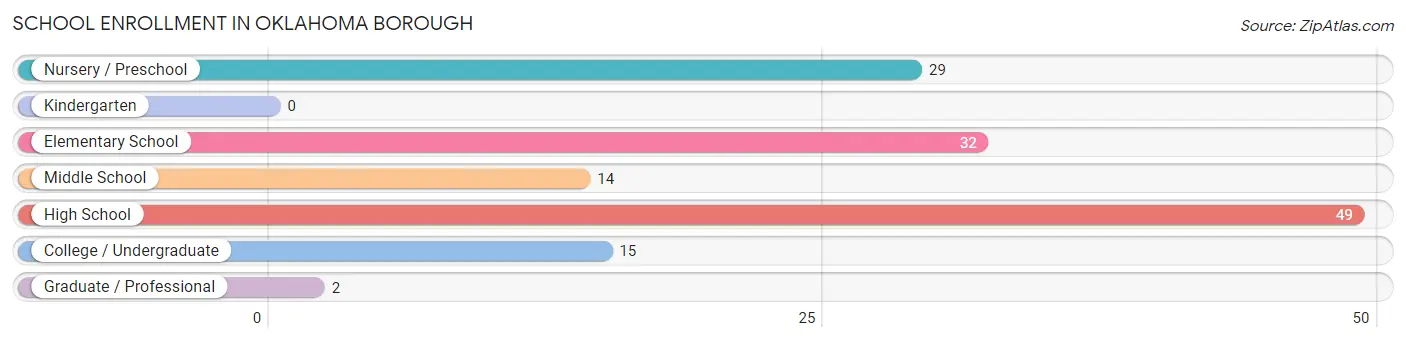
School Enrollment in Oklahoma borough
The most common levels of schooling among the 141 students in Oklahoma borough are high school (49 | 34.7%), elementary school (32 | 22.7%), and nursery / preschool (29 | 20.6%).
| School Level | # Students | % Students |
| Nursery / Preschool | 29 | 20.6% |
| Kindergarten | 0 | 0.0% |
| Elementary School | 32 | 22.7% |
| Middle School | 14 | 9.9% |
| High School | 49 | 34.7% |
| College / Undergraduate | 15 | 10.6% |
| Graduate / Professional | 2 | 1.4% |
| Total | 141 | 100.0% |
School Enrollment by Age by Funding Source in Oklahoma borough
Out of a total of 141 students who are enrolled in schools in Oklahoma borough, 12 (8.5%) attend a private institution, while the remaining 129 (91.5%) are enrolled in public schools. The age group of 5 to 9 year old has the highest likelihood of being enrolled in private schools, with 12 (27.3% in the age bracket) enrolled. Conversely, the age group of 3 to 4 year olds has the lowest likelihood of being enrolled in a private school, with 13 (100.0% in the age bracket) attending a public institution.
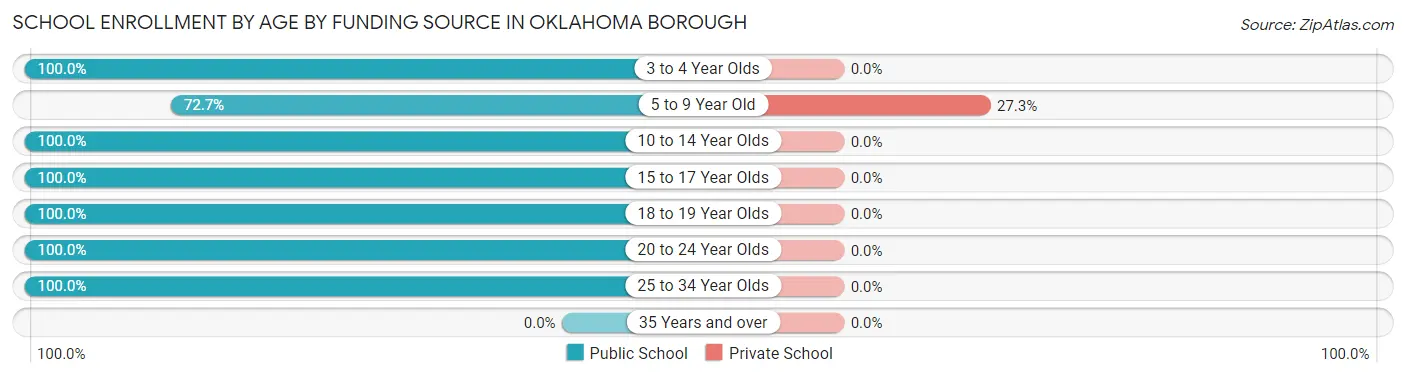
| Age Bracket | Public School | Private School |
| 3 to 4 Year Olds | 13 (100.0%) | 0 (0.0%) |
| 5 to 9 Year Old | 32 (72.7%) | 12 (27.3%) |
| 10 to 14 Year Olds | 34 (100.0%) | 0 (0.0%) |
| 15 to 17 Year Olds | 30 (100.0%) | 0 (0.0%) |
| 18 to 19 Year Olds | 8 (100.0%) | 0 (0.0%) |
| 20 to 24 Year Olds | 2 (100.0%) | 0 (0.0%) |
| 25 to 34 Year Olds | 10 (100.0%) | 0 (0.0%) |
| 35 Years and over | 0 (0.0%) | 0 (0.0%) |
| Total | 129 (91.5%) | 12 (8.5%) |
Educational Attainment by Field of Study in Oklahoma borough
Business (39 | 23.4%), education (37 | 22.2%), science & technology (17 | 10.2%), psychology (16 | 9.6%), and engineering (12 | 7.2%) are the most common fields of study among 167 individuals in Oklahoma borough who have obtained a bachelor's degree or higher.
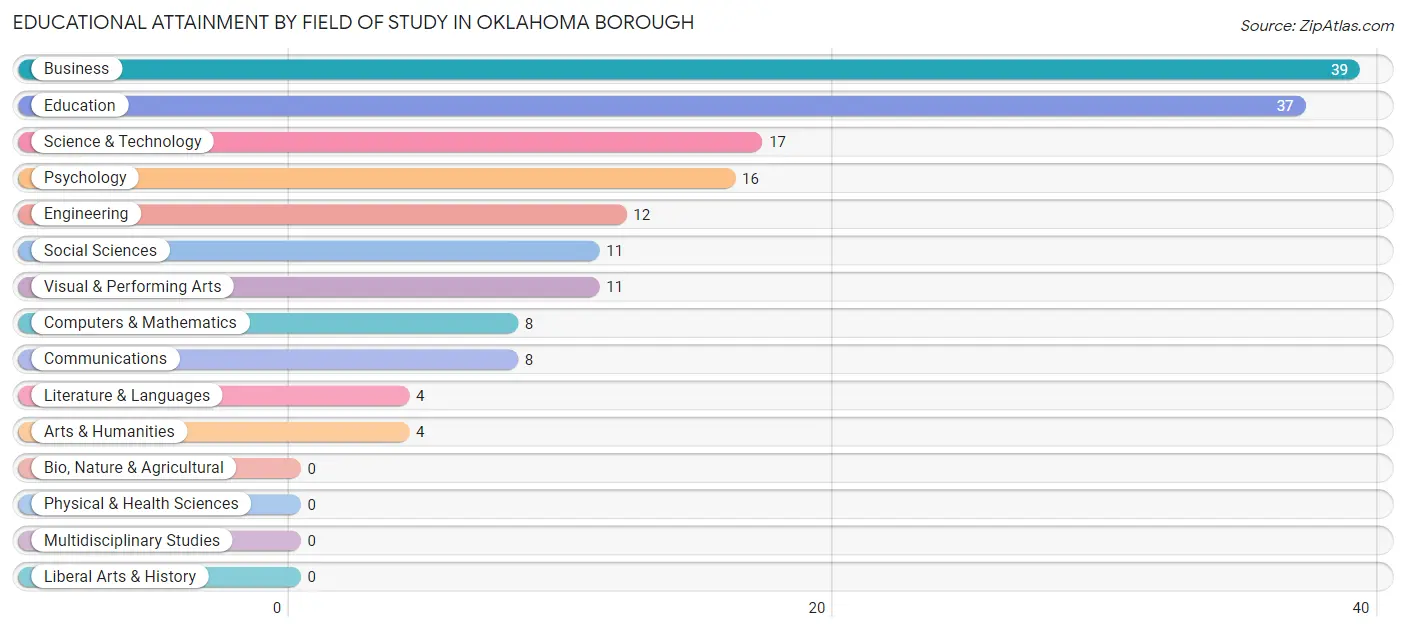
| Field of Study | # Graduates | % Graduates |
| Computers & Mathematics | 8 | 4.8% |
| Bio, Nature & Agricultural | 0 | 0.0% |
| Physical & Health Sciences | 0 | 0.0% |
| Psychology | 16 | 9.6% |
| Social Sciences | 11 | 6.6% |
| Engineering | 12 | 7.2% |
| Multidisciplinary Studies | 0 | 0.0% |
| Science & Technology | 17 | 10.2% |
| Business | 39 | 23.4% |
| Education | 37 | 22.2% |
| Literature & Languages | 4 | 2.4% |
| Liberal Arts & History | 0 | 0.0% |
| Visual & Performing Arts | 11 | 6.6% |
| Communications | 8 | 4.8% |
| Arts & Humanities | 4 | 2.4% |
| Total | 167 | 100.0% |
Transportation & Commute in Oklahoma borough
Vehicle Availability by Sex in Oklahoma borough
The most prevalent vehicle ownership categories in Oklahoma borough are males with 2 vehicles (118, accounting for 61.5%) and females with 2 vehicles (127, making up 44.5%).
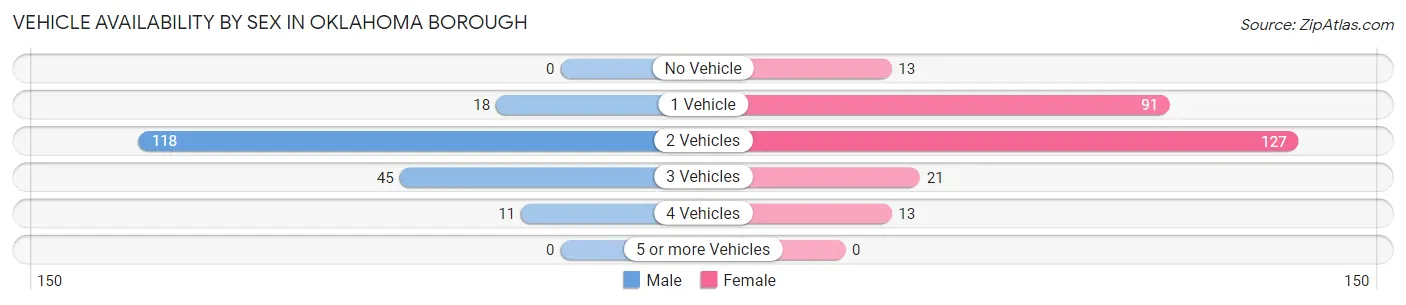
| Vehicles Available | Male | Female |
| No Vehicle | 0 (0.0%) | 13 (4.9%) |
| 1 Vehicle | 18 (9.4%) | 91 (34.3%) |
| 2 Vehicles | 118 (61.5%) | 127 (47.9%) |
| 3 Vehicles | 45 (23.4%) | 21 (7.9%) |
| 4 Vehicles | 11 (5.7%) | 13 (4.9%) |
| 5 or more Vehicles | 0 (0.0%) | 0 (0.0%) |
| Total | 192 (100.0%) | 265 (100.0%) |
Commute Time in Oklahoma borough
The most frequently occuring commute durations in Oklahoma borough are 30 to 34 minutes (73 commuters, 17.6%), 10 to 14 minutes (58 commuters, 14.0%), and 35 to 39 minutes (58 commuters, 14.0%).
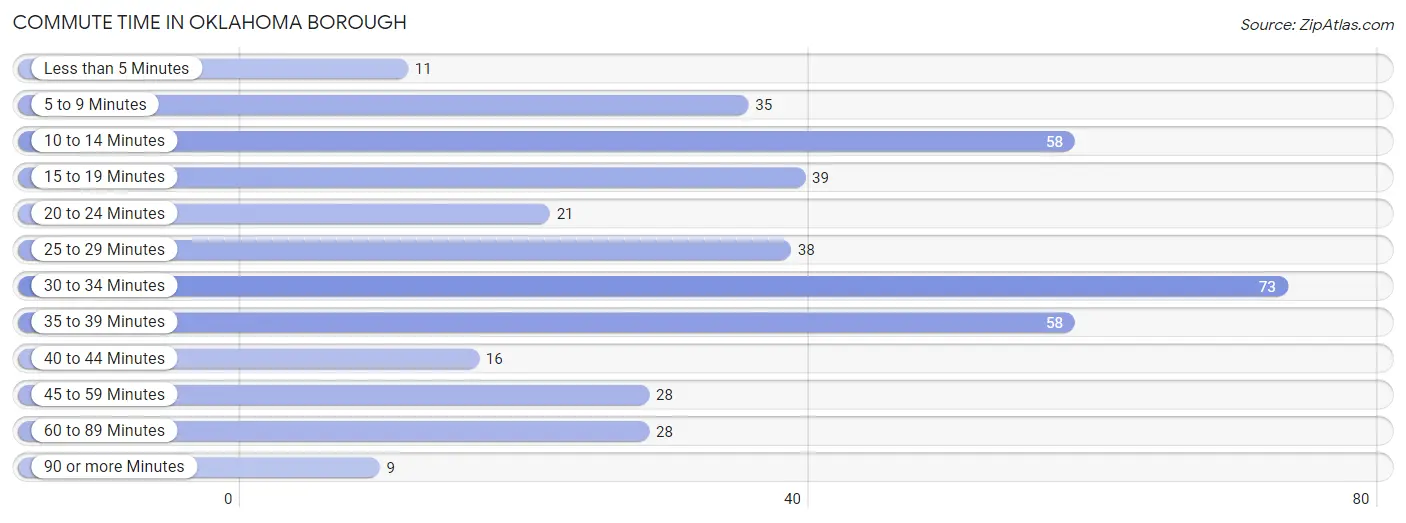
| Commute Time | # Commuters | % Commuters |
| Less than 5 Minutes | 11 | 2.7% |
| 5 to 9 Minutes | 35 | 8.5% |
| 10 to 14 Minutes | 58 | 14.0% |
| 15 to 19 Minutes | 39 | 9.4% |
| 20 to 24 Minutes | 21 | 5.1% |
| 25 to 29 Minutes | 38 | 9.2% |
| 30 to 34 Minutes | 73 | 17.6% |
| 35 to 39 Minutes | 58 | 14.0% |
| 40 to 44 Minutes | 16 | 3.9% |
| 45 to 59 Minutes | 28 | 6.8% |
| 60 to 89 Minutes | 28 | 6.8% |
| 90 or more Minutes | 9 | 2.2% |
Commute Time by Sex in Oklahoma borough
The most common commute times in Oklahoma borough are 35 to 39 minutes (36 commuters, 20.2%) for males and 30 to 34 minutes (64 commuters, 27.1%) for females.
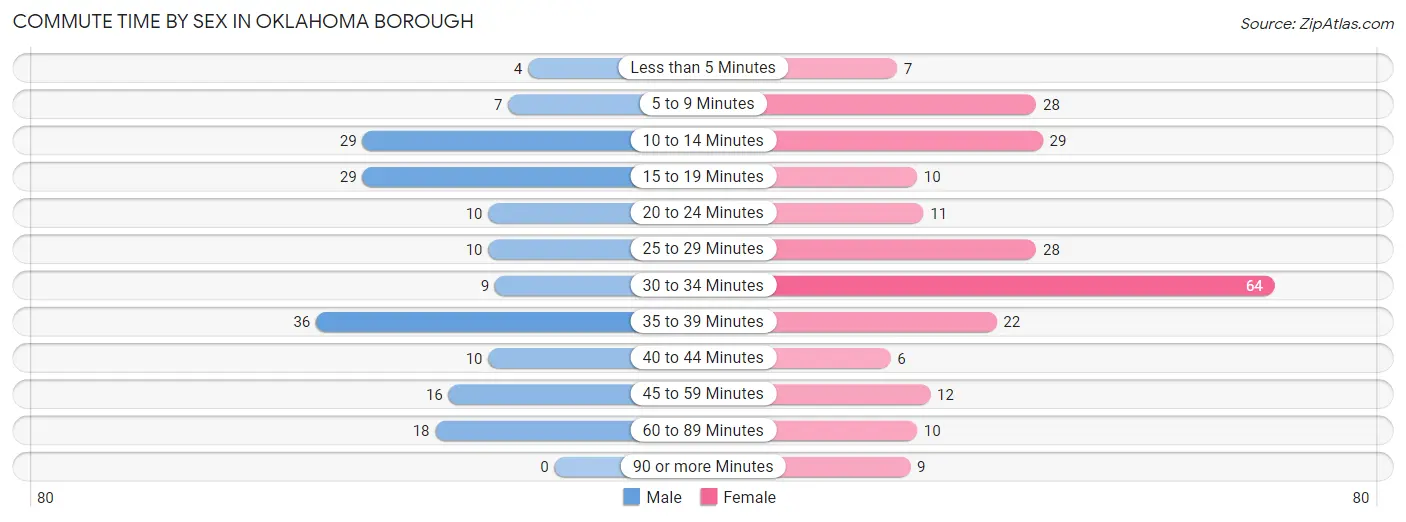
| Commute Time | Male | Female |
| Less than 5 Minutes | 4 (2.2%) | 7 (3.0%) |
| 5 to 9 Minutes | 7 (3.9%) | 28 (11.9%) |
| 10 to 14 Minutes | 29 (16.3%) | 29 (12.3%) |
| 15 to 19 Minutes | 29 (16.3%) | 10 (4.2%) |
| 20 to 24 Minutes | 10 (5.6%) | 11 (4.7%) |
| 25 to 29 Minutes | 10 (5.6%) | 28 (11.9%) |
| 30 to 34 Minutes | 9 (5.1%) | 64 (27.1%) |
| 35 to 39 Minutes | 36 (20.2%) | 22 (9.3%) |
| 40 to 44 Minutes | 10 (5.6%) | 6 (2.5%) |
| 45 to 59 Minutes | 16 (9.0%) | 12 (5.1%) |
| 60 to 89 Minutes | 18 (10.1%) | 10 (4.2%) |
| 90 or more Minutes | 0 (0.0%) | 9 (3.8%) |
Time of Departure to Work by Sex in Oklahoma borough
The most frequent times of departure to work in Oklahoma borough are 5:00 AM to 5:29 AM (38, 21.3%) for males and 7:00 AM to 7:29 AM (89, 37.7%) for females.
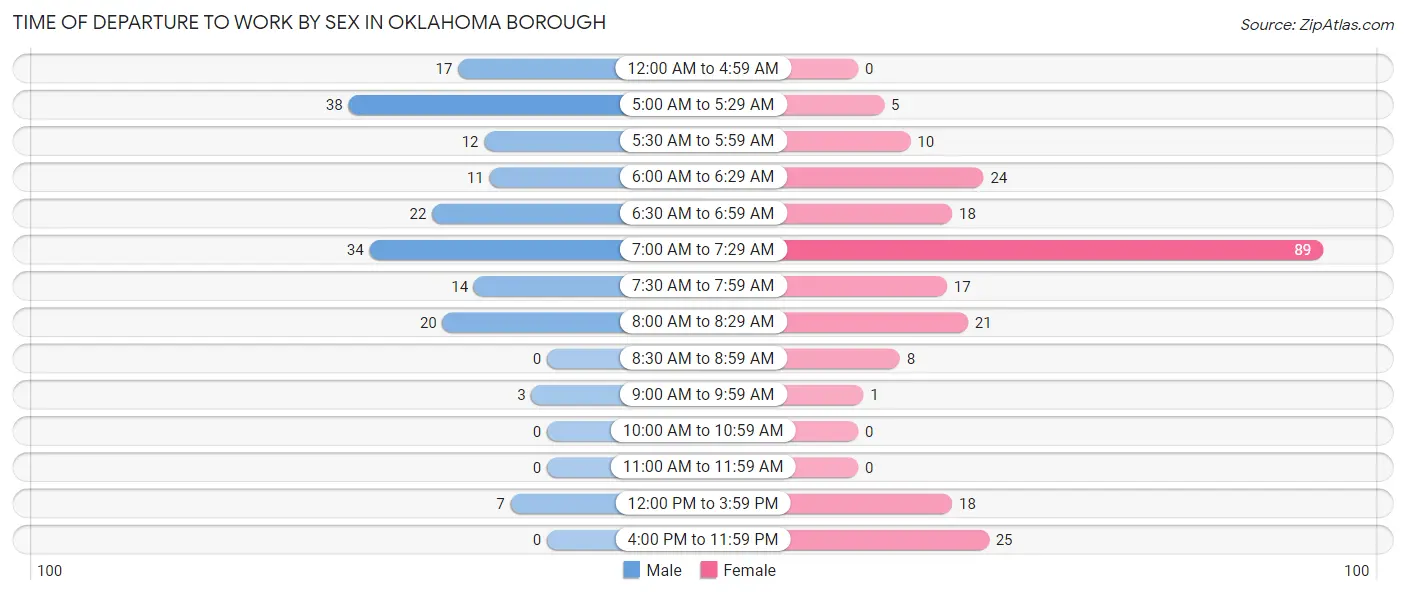
| Time of Departure | Male | Female |
| 12:00 AM to 4:59 AM | 17 (9.6%) | 0 (0.0%) |
| 5:00 AM to 5:29 AM | 38 (21.3%) | 5 (2.1%) |
| 5:30 AM to 5:59 AM | 12 (6.7%) | 10 (4.2%) |
| 6:00 AM to 6:29 AM | 11 (6.2%) | 24 (10.2%) |
| 6:30 AM to 6:59 AM | 22 (12.4%) | 18 (7.6%) |
| 7:00 AM to 7:29 AM | 34 (19.1%) | 89 (37.7%) |
| 7:30 AM to 7:59 AM | 14 (7.9%) | 17 (7.2%) |
| 8:00 AM to 8:29 AM | 20 (11.2%) | 21 (8.9%) |
| 8:30 AM to 8:59 AM | 0 (0.0%) | 8 (3.4%) |
| 9:00 AM to 9:59 AM | 3 (1.7%) | 1 (0.4%) |
| 10:00 AM to 10:59 AM | 0 (0.0%) | 0 (0.0%) |
| 11:00 AM to 11:59 AM | 0 (0.0%) | 0 (0.0%) |
| 12:00 PM to 3:59 PM | 7 (3.9%) | 18 (7.6%) |
| 4:00 PM to 11:59 PM | 0 (0.0%) | 25 (10.6%) |
| Total | 178 (100.0%) | 236 (100.0%) |
Housing Occupancy in Oklahoma borough
Occupancy by Ownership in Oklahoma borough
Of the total 424 dwellings in Oklahoma borough, owner-occupied units account for 280 (66.0%), while renter-occupied units make up 144 (34.0%).
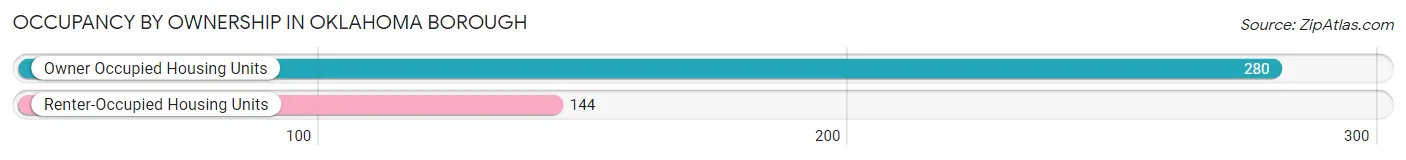
| Occupancy | # Housing Units | % Housing Units |
| Owner Occupied Housing Units | 280 | 66.0% |
| Renter-Occupied Housing Units | 144 | 34.0% |
| Total Occupied Housing Units | 424 | 100.0% |
Occupancy by Household Size in Oklahoma borough
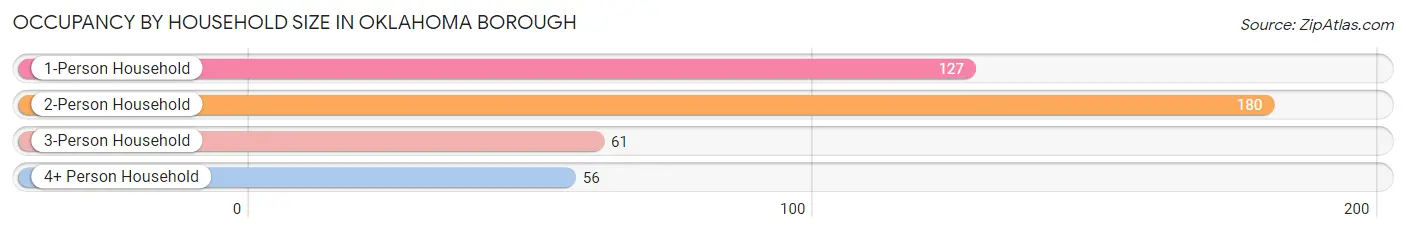
| Household Size | # Housing Units | % Housing Units |
| 1-Person Household | 127 | 29.9% |
| 2-Person Household | 180 | 42.4% |
| 3-Person Household | 61 | 14.4% |
| 4+ Person Household | 56 | 13.2% |
| Total Housing Units | 424 | 100.0% |
Occupancy by Ownership by Household Size in Oklahoma borough
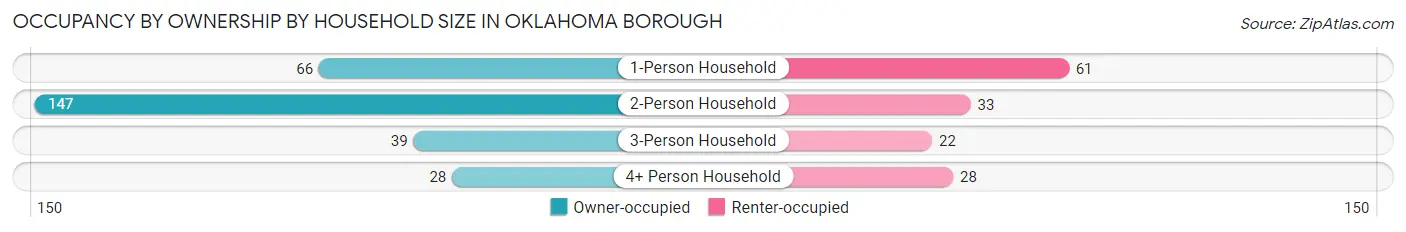
| Household Size | Owner-occupied | Renter-occupied |
| 1-Person Household | 66 (52.0%) | 61 (48.0%) |
| 2-Person Household | 147 (81.7%) | 33 (18.3%) |
| 3-Person Household | 39 (63.9%) | 22 (36.1%) |
| 4+ Person Household | 28 (50.0%) | 28 (50.0%) |
| Total Housing Units | 280 (66.0%) | 144 (34.0%) |
Occupancy by Educational Attainment in Oklahoma borough
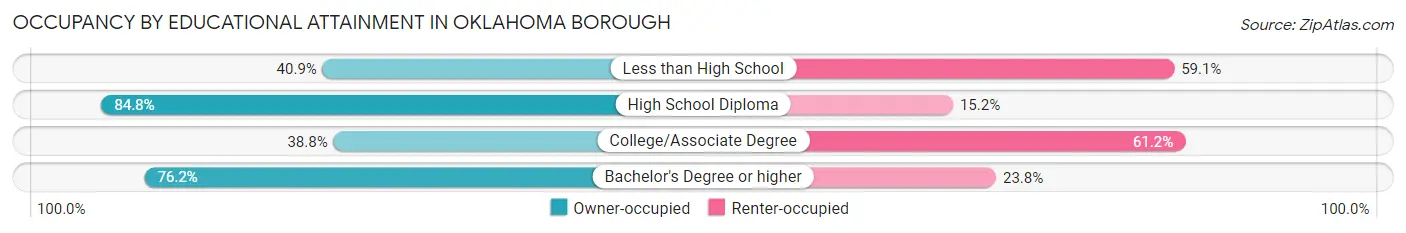
| Household Size | Owner-occupied | Renter-occupied |
| Less than High School | 9 (40.9%) | 13 (59.1%) |
| High School Diploma | 128 (84.8%) | 23 (15.2%) |
| College/Associate Degree | 50 (38.8%) | 79 (61.2%) |
| Bachelor's Degree or higher | 93 (76.2%) | 29 (23.8%) |
Occupancy by Age of Householder in Oklahoma borough
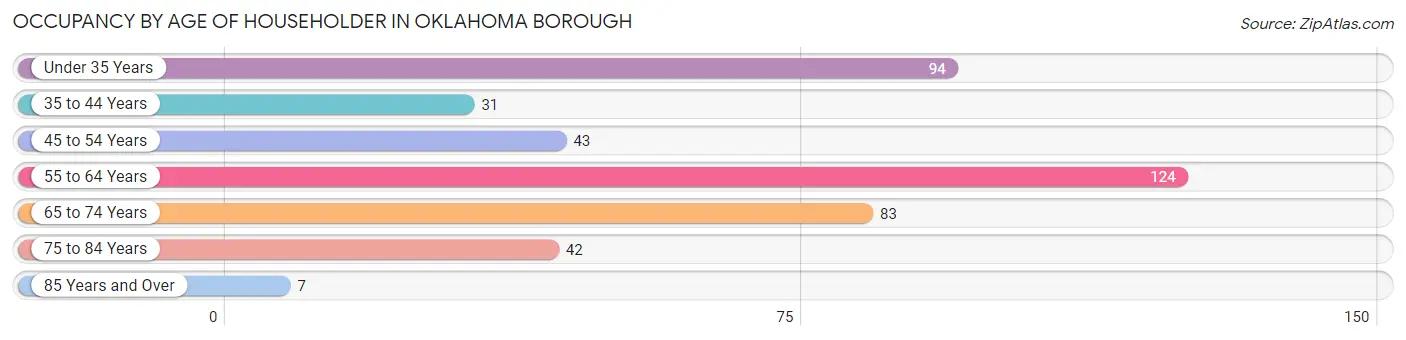
| Age Bracket | # Households | % Households |
| Under 35 Years | 94 | 22.2% |
| 35 to 44 Years | 31 | 7.3% |
| 45 to 54 Years | 43 | 10.1% |
| 55 to 64 Years | 124 | 29.2% |
| 65 to 74 Years | 83 | 19.6% |
| 75 to 84 Years | 42 | 9.9% |
| 85 Years and Over | 7 | 1.7% |
| Total | 424 | 100.0% |
Housing Finances in Oklahoma borough
Median Income by Occupancy in Oklahoma borough
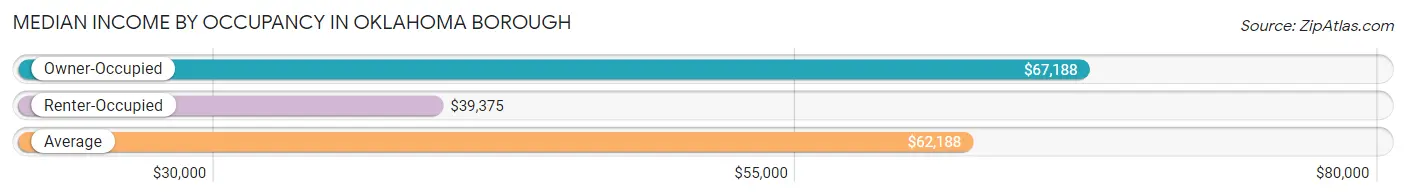
| Occupancy Type | # Households | Median Income |
| Owner-Occupied | 280 (66.0%) | $67,188 |
| Renter-Occupied | 144 (34.0%) | $39,375 |
| Average | 424 (100.0%) | $62,188 |
Occupancy by Householder Income Bracket in Oklahoma borough
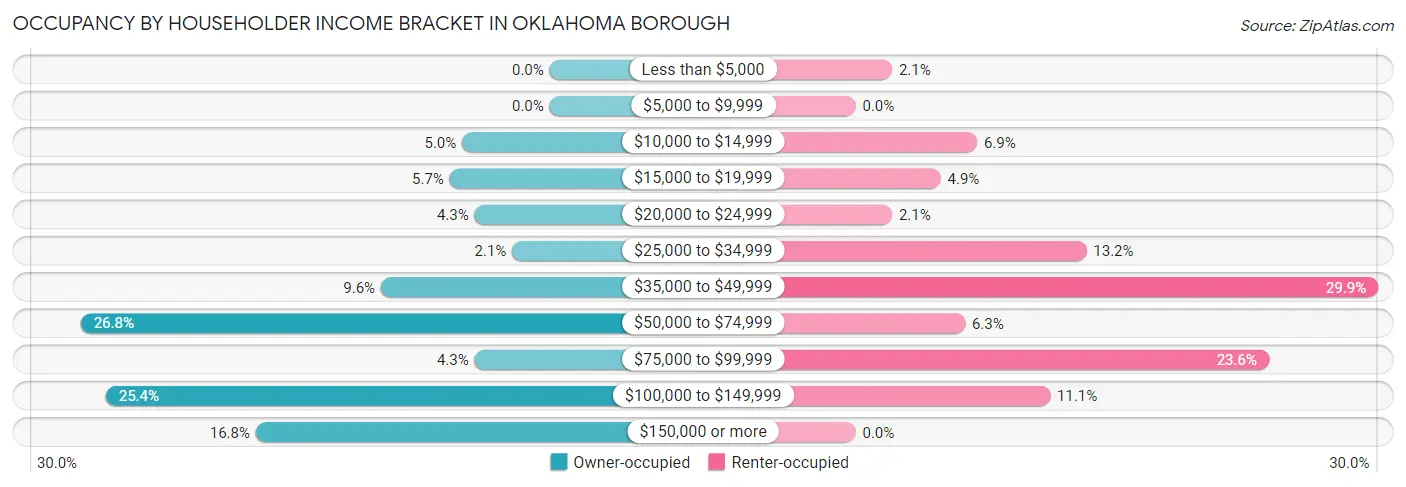
| Income Bracket | Owner-occupied | Renter-occupied |
| Less than $5,000 | 0 (0.0%) | 3 (2.1%) |
| $5,000 to $9,999 | 0 (0.0%) | 0 (0.0%) |
| $10,000 to $14,999 | 14 (5.0%) | 10 (6.9%) |
| $15,000 to $19,999 | 16 (5.7%) | 7 (4.9%) |
| $20,000 to $24,999 | 12 (4.3%) | 3 (2.1%) |
| $25,000 to $34,999 | 6 (2.1%) | 19 (13.2%) |
| $35,000 to $49,999 | 27 (9.6%) | 43 (29.9%) |
| $50,000 to $74,999 | 75 (26.8%) | 9 (6.2%) |
| $75,000 to $99,999 | 12 (4.3%) | 34 (23.6%) |
| $100,000 to $149,999 | 71 (25.4%) | 16 (11.1%) |
| $150,000 or more | 47 (16.8%) | 0 (0.0%) |
| Total | 280 (100.0%) | 144 (100.0%) |
Monthly Housing Cost Tiers in Oklahoma borough
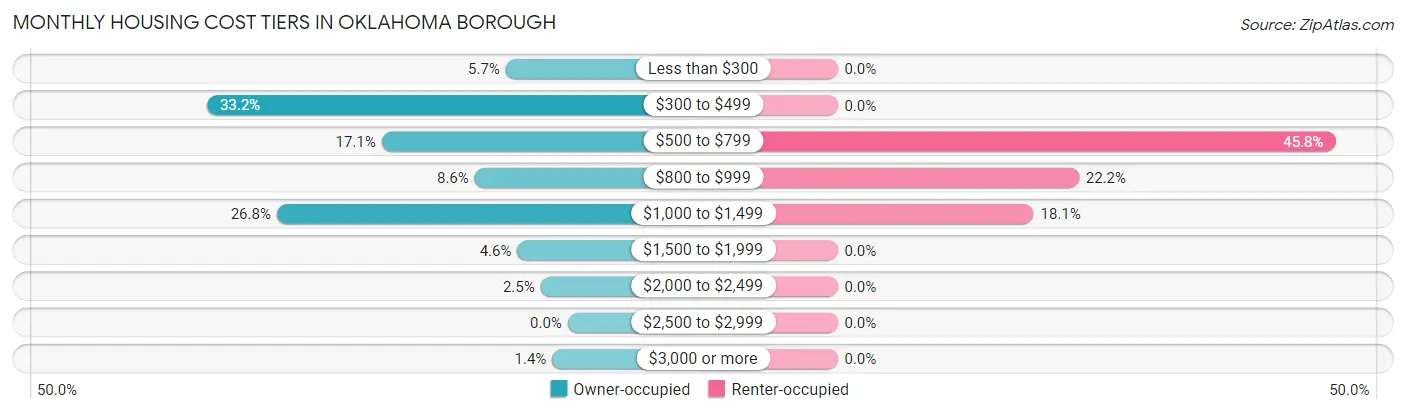
| Monthly Cost | Owner-occupied | Renter-occupied |
| Less than $300 | 16 (5.7%) | 0 (0.0%) |
| $300 to $499 | 93 (33.2%) | 0 (0.0%) |
| $500 to $799 | 48 (17.1%) | 66 (45.8%) |
| $800 to $999 | 24 (8.6%) | 32 (22.2%) |
| $1,000 to $1,499 | 75 (26.8%) | 26 (18.1%) |
| $1,500 to $1,999 | 13 (4.6%) | 0 (0.0%) |
| $2,000 to $2,499 | 7 (2.5%) | 0 (0.0%) |
| $2,500 to $2,999 | 0 (0.0%) | 0 (0.0%) |
| $3,000 or more | 4 (1.4%) | 0 (0.0%) |
| Total | 280 (100.0%) | 144 (100.0%) |
Physical Housing Characteristics in Oklahoma borough
Housing Structures in Oklahoma borough
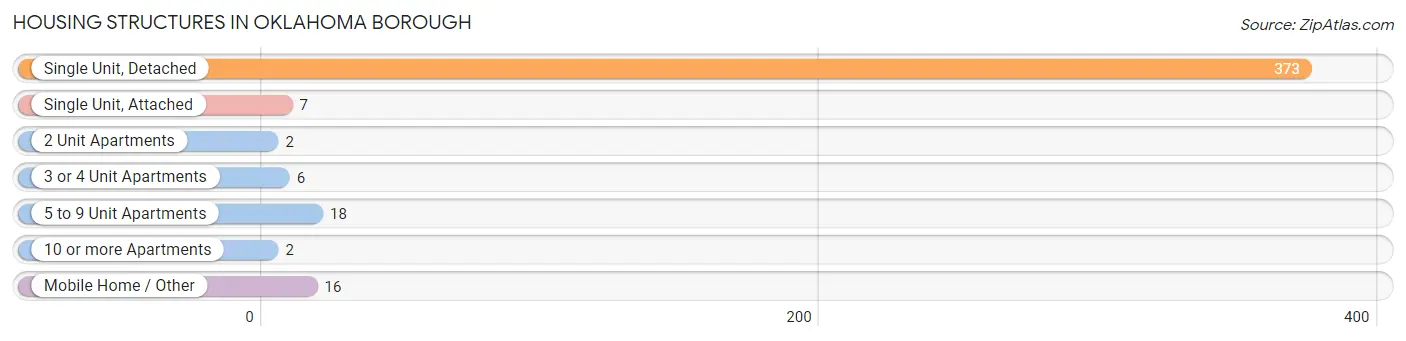
| Structure Type | # Housing Units | % Housing Units |
| Single Unit, Detached | 373 | 88.0% |
| Single Unit, Attached | 7 | 1.7% |
| 2 Unit Apartments | 2 | 0.5% |
| 3 or 4 Unit Apartments | 6 | 1.4% |
| 5 to 9 Unit Apartments | 18 | 4.3% |
| 10 or more Apartments | 2 | 0.5% |
| Mobile Home / Other | 16 | 3.8% |
| Total | 424 | 100.0% |
Housing Structures by Occupancy in Oklahoma borough
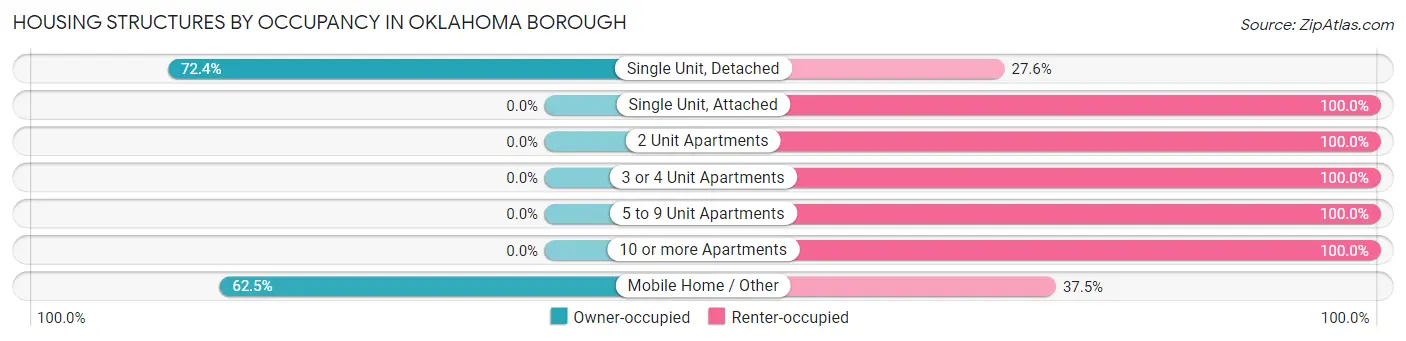
| Structure Type | Owner-occupied | Renter-occupied |
| Single Unit, Detached | 270 (72.4%) | 103 (27.6%) |
| Single Unit, Attached | 0 (0.0%) | 7 (100.0%) |
| 2 Unit Apartments | 0 (0.0%) | 2 (100.0%) |
| 3 or 4 Unit Apartments | 0 (0.0%) | 6 (100.0%) |
| 5 to 9 Unit Apartments | 0 (0.0%) | 18 (100.0%) |
| 10 or more Apartments | 0 (0.0%) | 2 (100.0%) |
| Mobile Home / Other | 10 (62.5%) | 6 (37.5%) |
| Total | 280 (66.0%) | 144 (34.0%) |
Housing Structures by Number of Rooms in Oklahoma borough
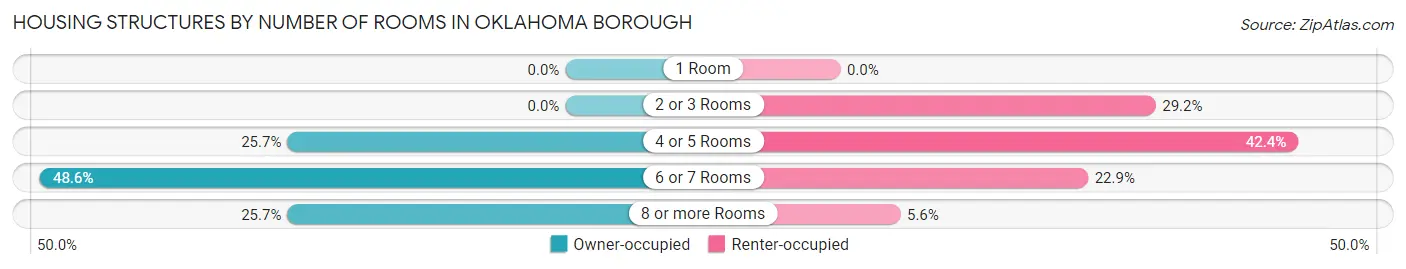
| Number of Rooms | Owner-occupied | Renter-occupied |
| 1 Room | 0 (0.0%) | 0 (0.0%) |
| 2 or 3 Rooms | 0 (0.0%) | 42 (29.2%) |
| 4 or 5 Rooms | 72 (25.7%) | 61 (42.4%) |
| 6 or 7 Rooms | 136 (48.6%) | 33 (22.9%) |
| 8 or more Rooms | 72 (25.7%) | 8 (5.6%) |
| Total | 280 (100.0%) | 144 (100.0%) |
Housing Structure by Heating Type in Oklahoma borough
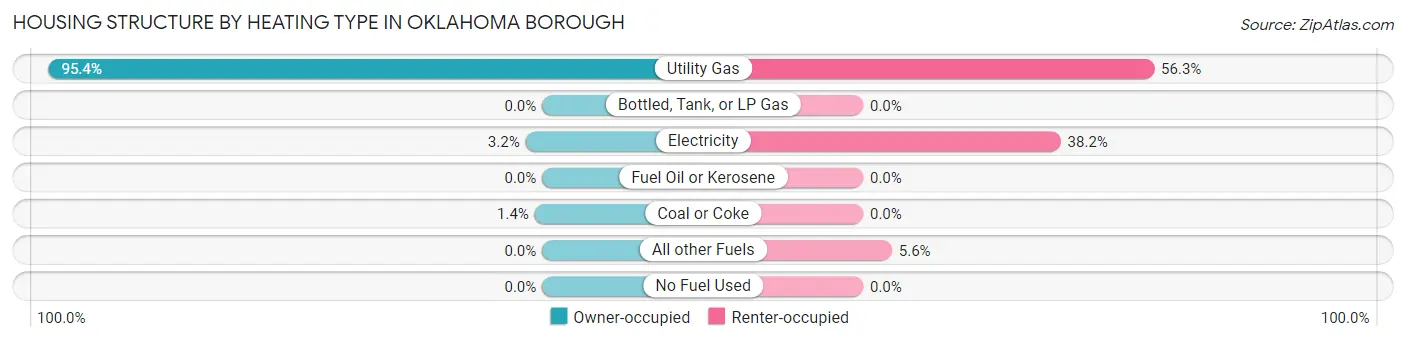
| Heating Type | Owner-occupied | Renter-occupied |
| Utility Gas | 267 (95.4%) | 81 (56.2%) |
| Bottled, Tank, or LP Gas | 0 (0.0%) | 0 (0.0%) |
| Electricity | 9 (3.2%) | 55 (38.2%) |
| Fuel Oil or Kerosene | 0 (0.0%) | 0 (0.0%) |
| Coal or Coke | 4 (1.4%) | 0 (0.0%) |
| All other Fuels | 0 (0.0%) | 8 (5.6%) |
| No Fuel Used | 0 (0.0%) | 0 (0.0%) |
| Total | 280 (100.0%) | 144 (100.0%) |
Household Vehicle Usage in Oklahoma borough
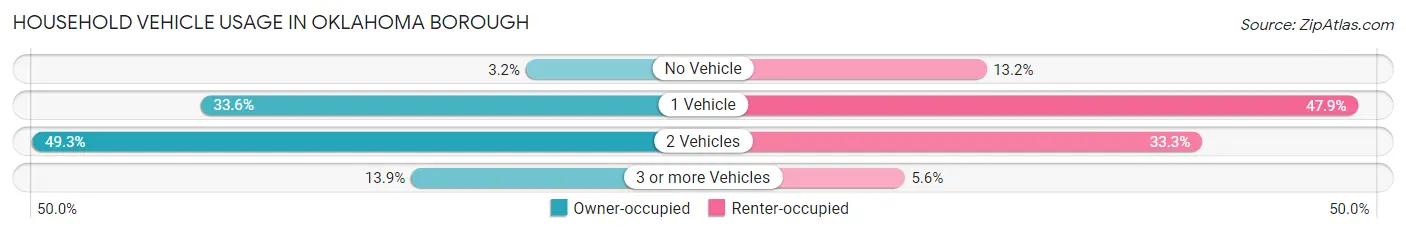
| Vehicles per Household | Owner-occupied | Renter-occupied |
| No Vehicle | 9 (3.2%) | 19 (13.2%) |
| 1 Vehicle | 94 (33.6%) | 69 (47.9%) |
| 2 Vehicles | 138 (49.3%) | 48 (33.3%) |
| 3 or more Vehicles | 39 (13.9%) | 8 (5.6%) |
| Total | 280 (100.0%) | 144 (100.0%) |
Real Estate & Mortgages in Oklahoma borough
Real Estate and Mortgage Overview in Oklahoma borough
| Characteristic | Without Mortgage | With Mortgage |
| Housing Units | 153 | 127 |
| Median Property Value | $116,400 | $163,500 |
| Median Household Income | $61,406 | $31 |
| Monthly Housing Costs | $456 | $4 |
| Real Estate Taxes | $1,725 | $4 |
Property Value by Mortgage Status in Oklahoma borough
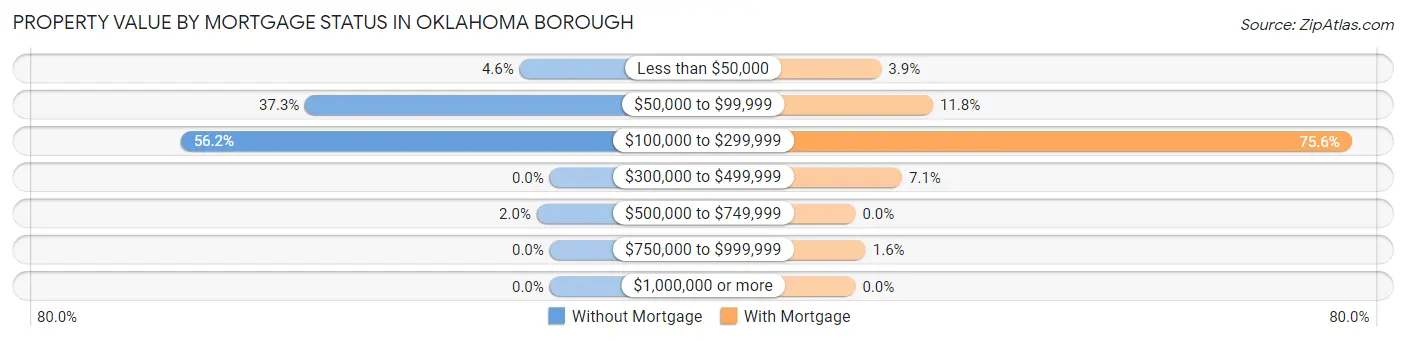
| Property Value | Without Mortgage | With Mortgage |
| Less than $50,000 | 7 (4.6%) | 5 (3.9%) |
| $50,000 to $99,999 | 57 (37.2%) | 15 (11.8%) |
| $100,000 to $299,999 | 86 (56.2%) | 96 (75.6%) |
| $300,000 to $499,999 | 0 (0.0%) | 9 (7.1%) |
| $500,000 to $749,999 | 3 (2.0%) | 0 (0.0%) |
| $750,000 to $999,999 | 0 (0.0%) | 2 (1.6%) |
| $1,000,000 or more | 0 (0.0%) | 0 (0.0%) |
| Total | 153 (100.0%) | 127 (100.0%) |
Household Income by Mortgage Status in Oklahoma borough
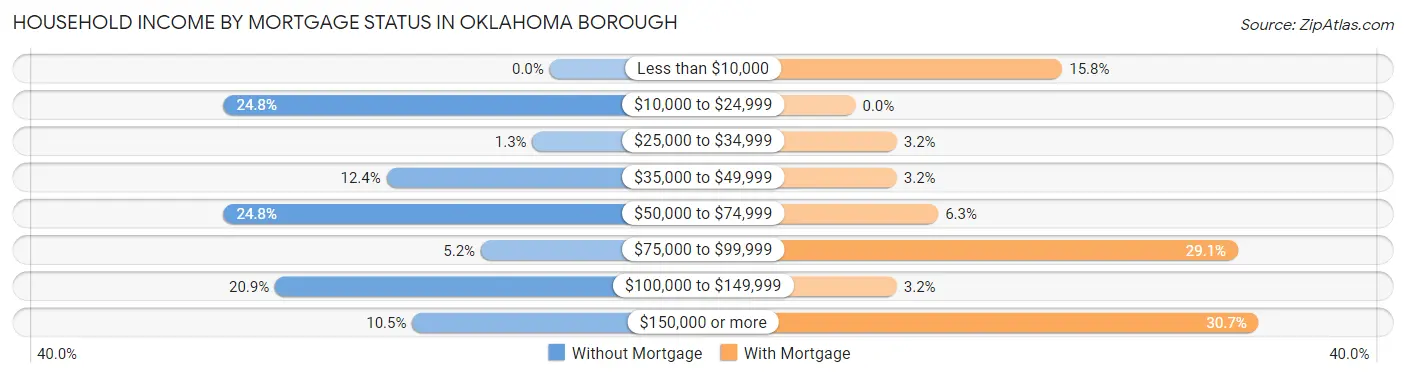
| Household Income | Without Mortgage | With Mortgage |
| Less than $10,000 | 0 (0.0%) | 20 (15.8%) |
| $10,000 to $24,999 | 38 (24.8%) | 0 (0.0%) |
| $25,000 to $34,999 | 2 (1.3%) | 4 (3.2%) |
| $35,000 to $49,999 | 19 (12.4%) | 4 (3.2%) |
| $50,000 to $74,999 | 38 (24.8%) | 8 (6.3%) |
| $75,000 to $99,999 | 8 (5.2%) | 37 (29.1%) |
| $100,000 to $149,999 | 32 (20.9%) | 4 (3.2%) |
| $150,000 or more | 16 (10.5%) | 39 (30.7%) |
| Total | 153 (100.0%) | 127 (100.0%) |
Property Value to Household Income Ratio in Oklahoma borough
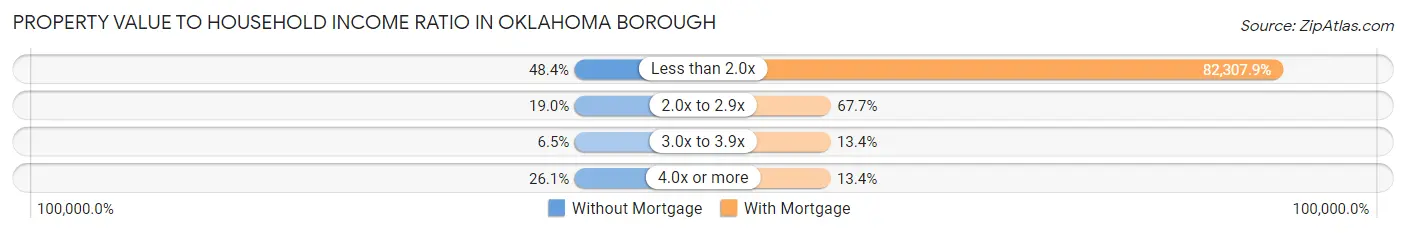
| Value-to-Income Ratio | Without Mortgage | With Mortgage |
| Less than 2.0x | 74 (48.4%) | 104,531 (82,307.9%) |
| 2.0x to 2.9x | 29 (19.0%) | 86 (67.7%) |
| 3.0x to 3.9x | 10 (6.5%) | 17 (13.4%) |
| 4.0x or more | 40 (26.1%) | 17 (13.4%) |
| Total | 153 (100.0%) | 127 (100.0%) |
Real Estate Taxes by Mortgage Status in Oklahoma borough
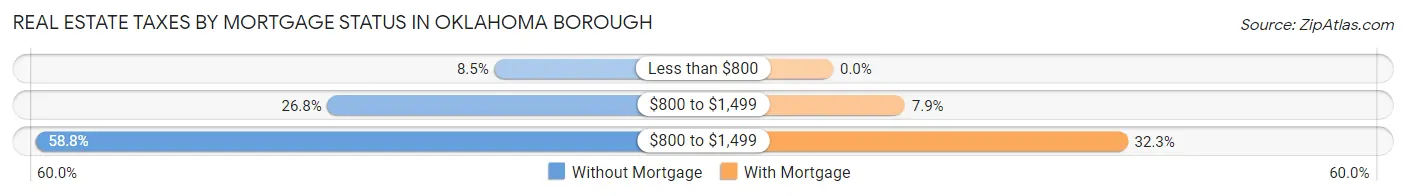
| Property Taxes | Without Mortgage | With Mortgage |
| Less than $800 | 13 (8.5%) | 0 (0.0%) |
| $800 to $1,499 | 41 (26.8%) | 10 (7.9%) |
| $800 to $1,499 | 90 (58.8%) | 41 (32.3%) |
| Total | 153 (100.0%) | 127 (100.0%) |
Health & Disability in Oklahoma borough
Health Insurance Coverage by Age in Oklahoma borough
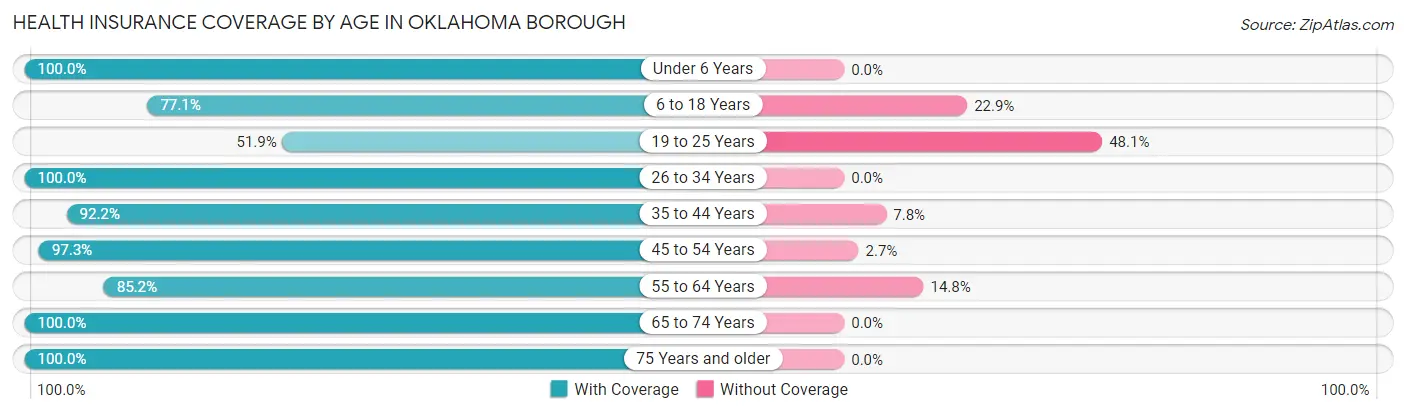
| Age Bracket | With Coverage | Without Coverage |
| Under 6 Years | 58 (100.0%) | 0 (0.0%) |
| 6 to 18 Years | 74 (77.1%) | 22 (22.9%) |
| 19 to 25 Years | 41 (51.9%) | 38 (48.1%) |
| 26 to 34 Years | 153 (100.0%) | 0 (0.0%) |
| 35 to 44 Years | 47 (92.2%) | 4 (7.8%) |
| 45 to 54 Years | 73 (97.3%) | 2 (2.7%) |
| 55 to 64 Years | 196 (85.2%) | 34 (14.8%) |
| 65 to 74 Years | 149 (100.0%) | 0 (0.0%) |
| 75 Years and older | 73 (100.0%) | 0 (0.0%) |
| Total | 864 (89.6%) | 100 (10.4%) |
Health Insurance Coverage by Citizenship Status in Oklahoma borough
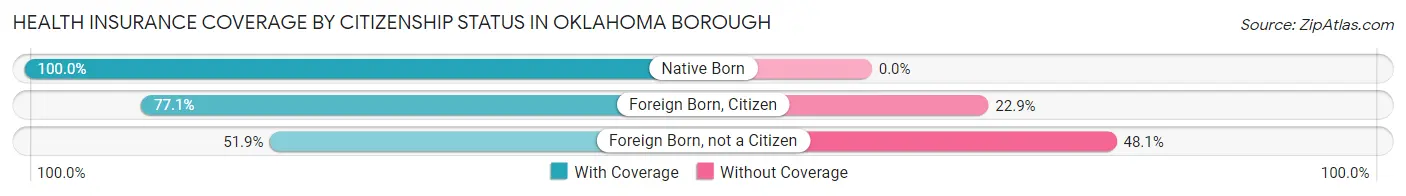
| Citizenship Status | With Coverage | Without Coverage |
| Native Born | 58 (100.0%) | 0 (0.0%) |
| Foreign Born, Citizen | 74 (77.1%) | 22 (22.9%) |
| Foreign Born, not a Citizen | 41 (51.9%) | 38 (48.1%) |
Health Insurance Coverage by Household Income in Oklahoma borough
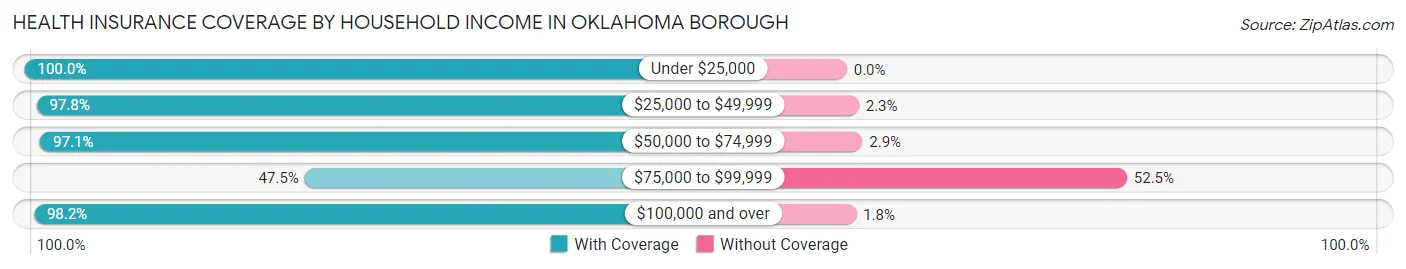
| Household Income | With Coverage | Without Coverage |
| Under $25,000 | 113 (100.0%) | 0 (0.0%) |
| $25,000 to $49,999 | 174 (97.8%) | 4 (2.2%) |
| $50,000 to $74,999 | 166 (97.1%) | 5 (2.9%) |
| $75,000 to $99,999 | 77 (47.5%) | 85 (52.5%) |
| $100,000 and over | 334 (98.2%) | 6 (1.8%) |
Public vs Private Health Insurance Coverage by Age in Oklahoma borough
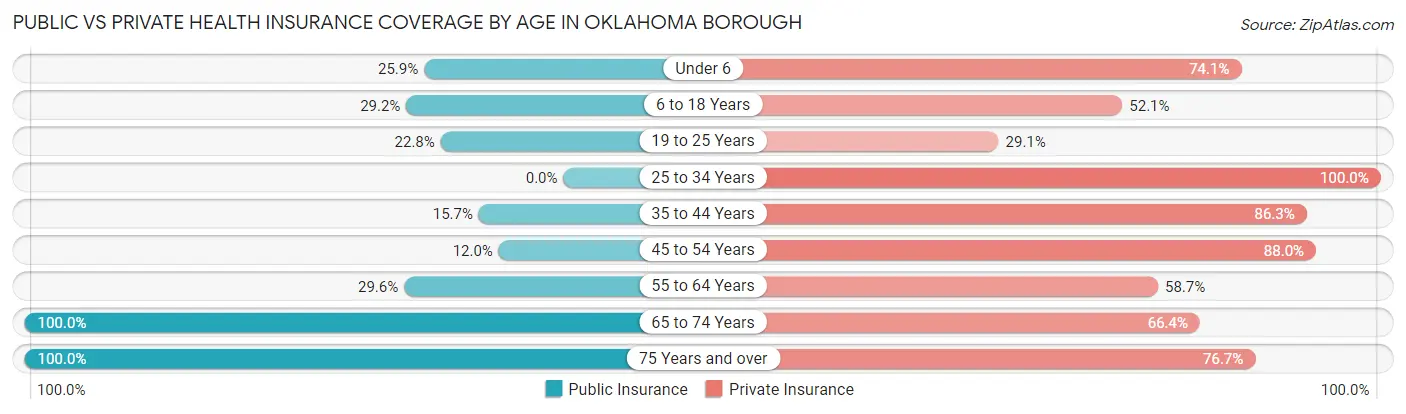
| Age Bracket | Public Insurance | Private Insurance |
| Under 6 | 15 (25.9%) | 43 (74.1%) |
| 6 to 18 Years | 28 (29.2%) | 50 (52.1%) |
| 19 to 25 Years | 18 (22.8%) | 23 (29.1%) |
| 25 to 34 Years | 0 (0.0%) | 153 (100.0%) |
| 35 to 44 Years | 8 (15.7%) | 44 (86.3%) |
| 45 to 54 Years | 9 (12.0%) | 66 (88.0%) |
| 55 to 64 Years | 68 (29.6%) | 135 (58.7%) |
| 65 to 74 Years | 149 (100.0%) | 99 (66.4%) |
| 75 Years and over | 73 (100.0%) | 56 (76.7%) |
| Total | 368 (38.2%) | 669 (69.4%) |
Disability Status by Sex by Age in Oklahoma borough
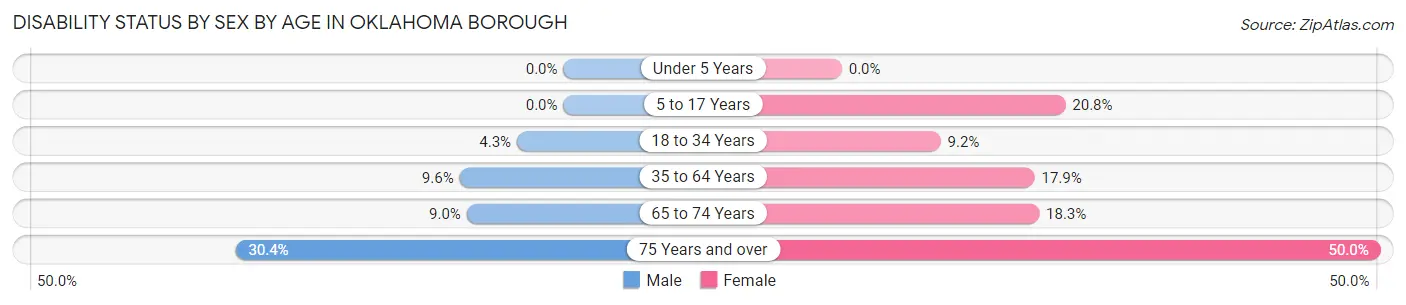
| Age Bracket | Male | Female |
| Under 5 Years | 0 (0.0%) | 0 (0.0%) |
| 5 to 17 Years | 0 (0.0%) | 11 (20.7%) |
| 18 to 34 Years | 5 (4.3%) | 11 (9.2%) |
| 35 to 64 Years | 16 (9.6%) | 34 (17.9%) |
| 65 to 74 Years | 7 (9.0%) | 13 (18.3%) |
| 75 Years and over | 7 (30.4%) | 25 (50.0%) |
Disability Class by Sex by Age in Oklahoma borough
Disability Class: Hearing Difficulty
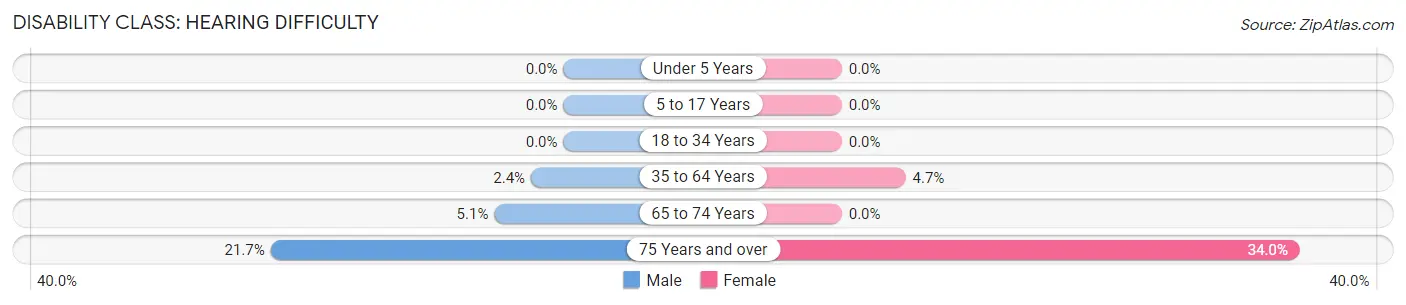
| Age Bracket | Male | Female |
| Under 5 Years | 0 (0.0%) | 0 (0.0%) |
| 5 to 17 Years | 0 (0.0%) | 0 (0.0%) |
| 18 to 34 Years | 0 (0.0%) | 0 (0.0%) |
| 35 to 64 Years | 4 (2.4%) | 9 (4.7%) |
| 65 to 74 Years | 4 (5.1%) | 0 (0.0%) |
| 75 Years and over | 5 (21.7%) | 17 (34.0%) |
Disability Class: Vision Difficulty
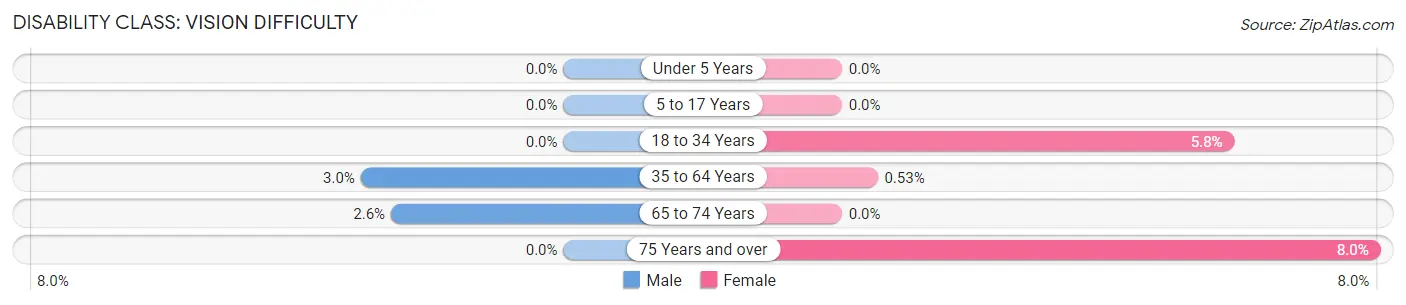
| Age Bracket | Male | Female |
| Under 5 Years | 0 (0.0%) | 0 (0.0%) |
| 5 to 17 Years | 0 (0.0%) | 0 (0.0%) |
| 18 to 34 Years | 0 (0.0%) | 7 (5.8%) |
| 35 to 64 Years | 5 (3.0%) | 1 (0.5%) |
| 65 to 74 Years | 2 (2.6%) | 0 (0.0%) |
| 75 Years and over | 0 (0.0%) | 4 (8.0%) |
Disability Class: Cognitive Difficulty
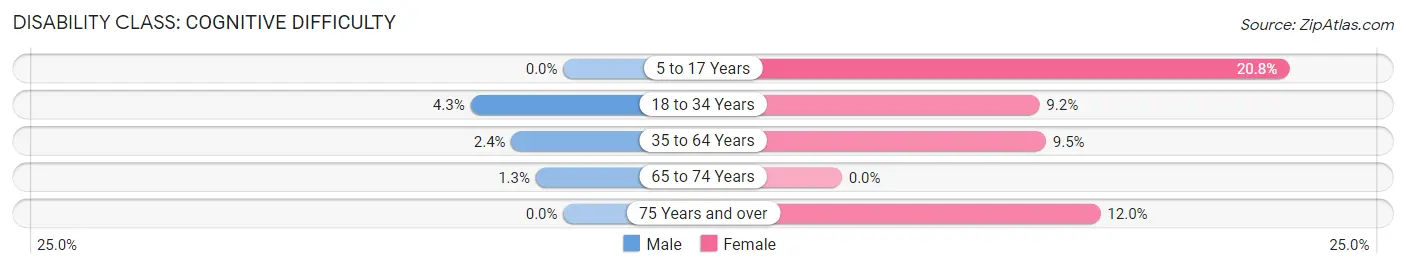
| Age Bracket | Male | Female |
| 5 to 17 Years | 0 (0.0%) | 11 (20.7%) |
| 18 to 34 Years | 5 (4.3%) | 11 (9.2%) |
| 35 to 64 Years | 4 (2.4%) | 18 (9.5%) |
| 65 to 74 Years | 1 (1.3%) | 0 (0.0%) |
| 75 Years and over | 0 (0.0%) | 6 (12.0%) |
Disability Class: Ambulatory Difficulty
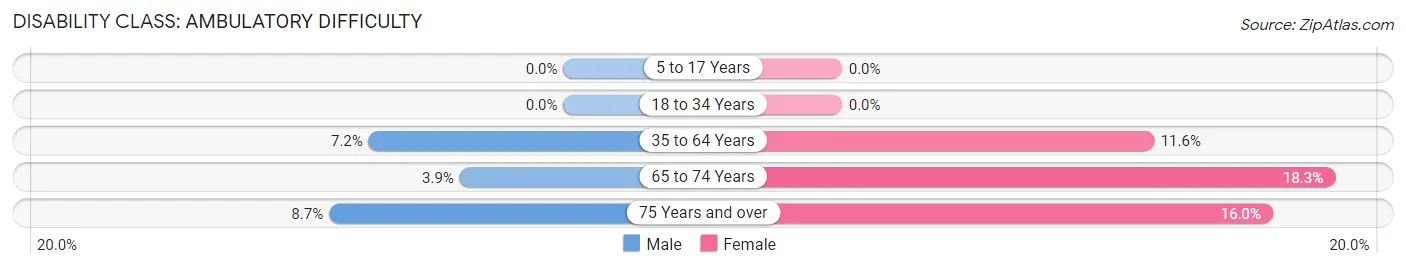
| Age Bracket | Male | Female |
| 5 to 17 Years | 0 (0.0%) | 0 (0.0%) |
| 18 to 34 Years | 0 (0.0%) | 0 (0.0%) |
| 35 to 64 Years | 12 (7.2%) | 22 (11.6%) |
| 65 to 74 Years | 3 (3.8%) | 13 (18.3%) |
| 75 Years and over | 2 (8.7%) | 8 (16.0%) |
Disability Class: Self-Care Difficulty
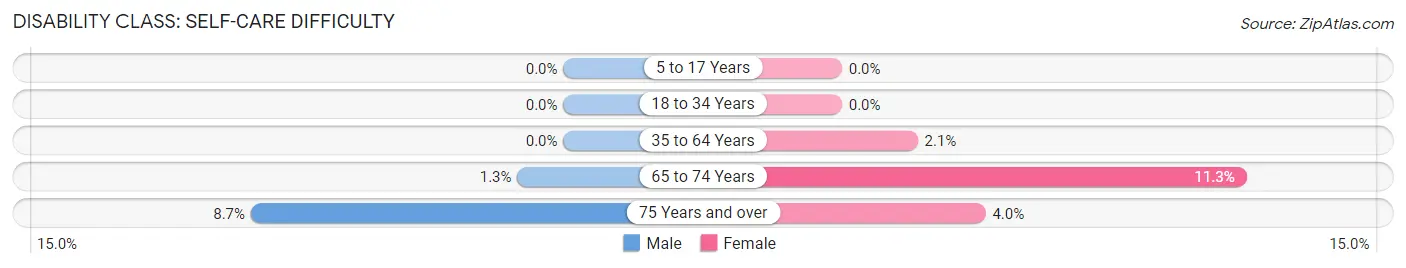
| Age Bracket | Male | Female |
| 5 to 17 Years | 0 (0.0%) | 0 (0.0%) |
| 18 to 34 Years | 0 (0.0%) | 0 (0.0%) |
| 35 to 64 Years | 0 (0.0%) | 4 (2.1%) |
| 65 to 74 Years | 1 (1.3%) | 8 (11.3%) |
| 75 Years and over | 2 (8.7%) | 2 (4.0%) |
Technology Access in Oklahoma borough
Computing Device Access in Oklahoma borough
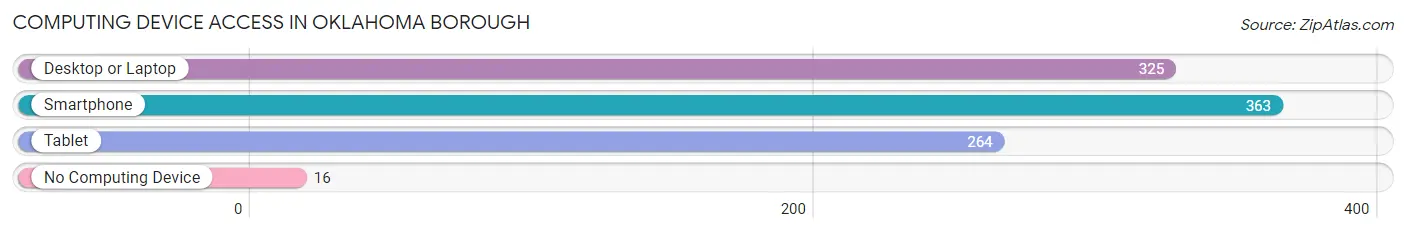
| Device Type | # Households | % Households |
| Desktop or Laptop | 325 | 76.6% |
| Smartphone | 363 | 85.6% |
| Tablet | 264 | 62.3% |
| No Computing Device | 16 | 3.8% |
| Total | 424 | 100.0% |
Internet Access in Oklahoma borough
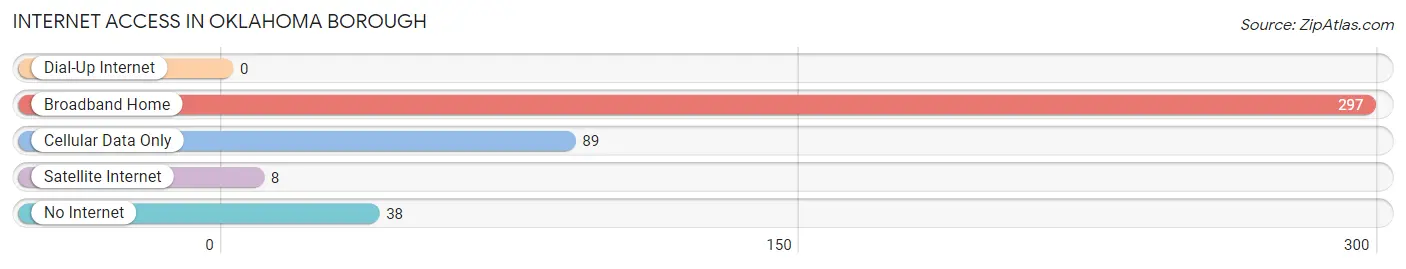
| Internet Type | # Households | % Households |
| Dial-Up Internet | 0 | 0.0% |
| Broadband Home | 297 | 70.1% |
| Cellular Data Only | 89 | 21.0% |
| Satellite Internet | 8 | 1.9% |
| No Internet | 38 | 9.0% |
| Total | 424 | 100.0% |
Oklahoma borough Summary
Oklahoma Borough is a small borough located in Beaver County, Pennsylvania. It is situated in the southwestern corner of the county, and is bordered by the townships of Hanover, Raccoon, and Independence. The population of Oklahoma Borough was 1,845 at the 2010 census.
History
The area that is now Oklahoma Borough was first settled in the late 1700s by German immigrants. The town was originally known as “Oklahoma”, after the Native American tribe of the same name. The name was changed to “Oklahoma Borough” in 1876 when it was incorporated as a borough.
The town was a small farming community until the early 1900s, when the coal industry began to boom in the area. The coal industry brought jobs and economic growth to the area, and the population of Oklahoma Borough began to grow.
Geography
Oklahoma Borough is located in southwestern Beaver County, Pennsylvania. It is bordered by the townships of Hanover, Raccoon, and Independence. The borough is situated on the banks of the Ohio River, and is located approximately 25 miles northwest of Pittsburgh.
The borough has a total area of 1.2 square miles, all of which is land. The terrain is mostly flat, with some rolling hills in the northern part of the borough.
Economy
The economy of Oklahoma Borough is largely based on the coal industry. The town is home to several coal mines, and the coal industry provides jobs for many of the residents.
In addition to the coal industry, Oklahoma Borough is home to several small businesses, including restaurants, retail stores, and service providers. The town also has a small manufacturing sector, which produces a variety of products, including furniture and clothing.
Demographics
As of the 2010 census, the population of Oklahoma Borough was 1,845. The racial makeup of the borough was 97.3% White, 0.9% African American, 0.2% Native American, 0.2% Asian, 0.1% from other races, and 1.3% from two or more races. Hispanic or Latino of any race were 0.7% of the population.
The median income for a household in Oklahoma Borough was $37,917, and the median income for a family was $45,000. The per capita income for the borough was $18,945. About 11.2% of families and 13.2% of the population were below the poverty line, including 17.2% of those under age 18 and 8.2% of those age 65 or over.
Conclusion
Oklahoma Borough is a small borough located in Beaver County, Pennsylvania. It is situated in the southwestern corner of the county, and is bordered by the townships of Hanover, Raccoon, and Independence. The population of Oklahoma Borough was 1,845 at the 2010 census. The economy of the borough is largely based on the coal industry, and the town is also home to several small businesses. The racial makeup of the borough is predominantly White, with a small percentage of African American, Native American, and Asian residents. The median income for a household in Oklahoma Borough was $37,917, and the per capita income for the borough was $18,945.
Common Questions
What is Per Capita Income in Oklahoma borough?
Per Capita income in Oklahoma borough is $36,548.
What is the Median Family Income in Oklahoma borough?
Median Family Income in Oklahoma borough is $76,875.
What is the Median Household income in Oklahoma borough?
Median Household Income in Oklahoma borough is $62,188.
What is Income or Wage Gap in Oklahoma borough?
Income or Wage Gap in Oklahoma borough is 28.2%.
Women in Oklahoma borough earn 71.8 cents for every dollar earned by a man.
What is Inequality or Gini Index in Oklahoma borough?
Inequality or Gini Index in Oklahoma borough is 0.41.
What is the Total Population of Oklahoma borough?
Total Population of Oklahoma borough is 964.
What is the Total Male Population of Oklahoma borough?
Total Male Population of Oklahoma borough is 462.
What is the Total Female Population of Oklahoma borough?
Total Female Population of Oklahoma borough is 502.
What is the Ratio of Males per 100 Females in Oklahoma borough?
There are 92.03 Males per 100 Females in Oklahoma borough.
What is the Ratio of Females per 100 Males in Oklahoma borough?
There are 108.66 Females per 100 Males in Oklahoma borough.
What is the Median Population Age in Oklahoma borough?
Median Population Age in Oklahoma borough is 52.4 Years.
What is the Average Family Size in Oklahoma borough
Average Family Size in Oklahoma borough is 2.8 People.
What is the Average Household Size in Oklahoma borough
Average Household Size in Oklahoma borough is 2.3 People.
How Large is the Labor Force in Oklahoma borough?
There are 460 People in the Labor Forcein in Oklahoma borough.
What is the Percentage of People in the Labor Force in Oklahoma borough?
55.4% of People are in the Labor Force in Oklahoma borough.