Oil City, PA Map & Demographics
Oil City Map
Oil City Overview
$28,567
PER CAPITA INCOME
$64,764
AVG FAMILY INCOME
$48,632
AVG HOUSEHOLD INCOME
17.5%
WAGE / INCOME GAP [ % ]
82.5¢/ $1
WAGE / INCOME GAP [ $ ]
0.47
INEQUALITY / GINI INDEX
9,599
TOTAL POPULATION
4,869
MALE POPULATION
4,730
FEMALE POPULATION
102.94
MALES / 100 FEMALES
97.15
FEMALES / 100 MALES
43.5
MEDIAN AGE
2.9
AVG FAMILY SIZE
2.3
AVG HOUSEHOLD SIZE
4,554
LABOR FORCE [ PEOPLE ]
56.7%
PERCENT IN LABOR FORCE
7.8%
UNEMPLOYMENT RATE
Oil City Zip Codes
Oil City Area Codes
Income in Oil City
Income Overview in Oil City
Per Capita Income in Oil City is $28,567, while median incomes of families and households are $64,764 and $48,632 respectively.
| Characteristic | Number | Measure |
| Per Capita Income | 9,599 | $28,567 |
| Median Family Income | 2,294 | $64,764 |
| Mean Family Income | 2,294 | $74,343 |
| Median Household Income | 4,054 | $48,632 |
| Mean Household Income | 4,054 | $66,224 |
| Income Deficit | 2,294 | $0 |
| Wage / Income Gap (%) | 9,599 | 17.54% |
| Wage / Income Gap ($) | 9,599 | 82.46¢ per $1 |
| Gini / Inequality Index | 9,599 | 0.47 |
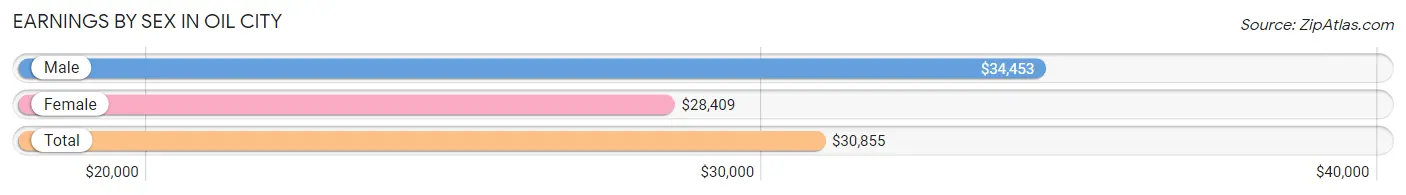
Earnings by Sex in Oil City
Average Earnings in Oil City are $30,855, $34,453 for men and $28,409 for women, a difference of 17.5%.
| Sex | Number | Average Earnings |
| Male | 2,632 (55.2%) | $34,453 |
| Female | 2,134 (44.8%) | $28,409 |
| Total | 4,766 (100.0%) | $30,855 |
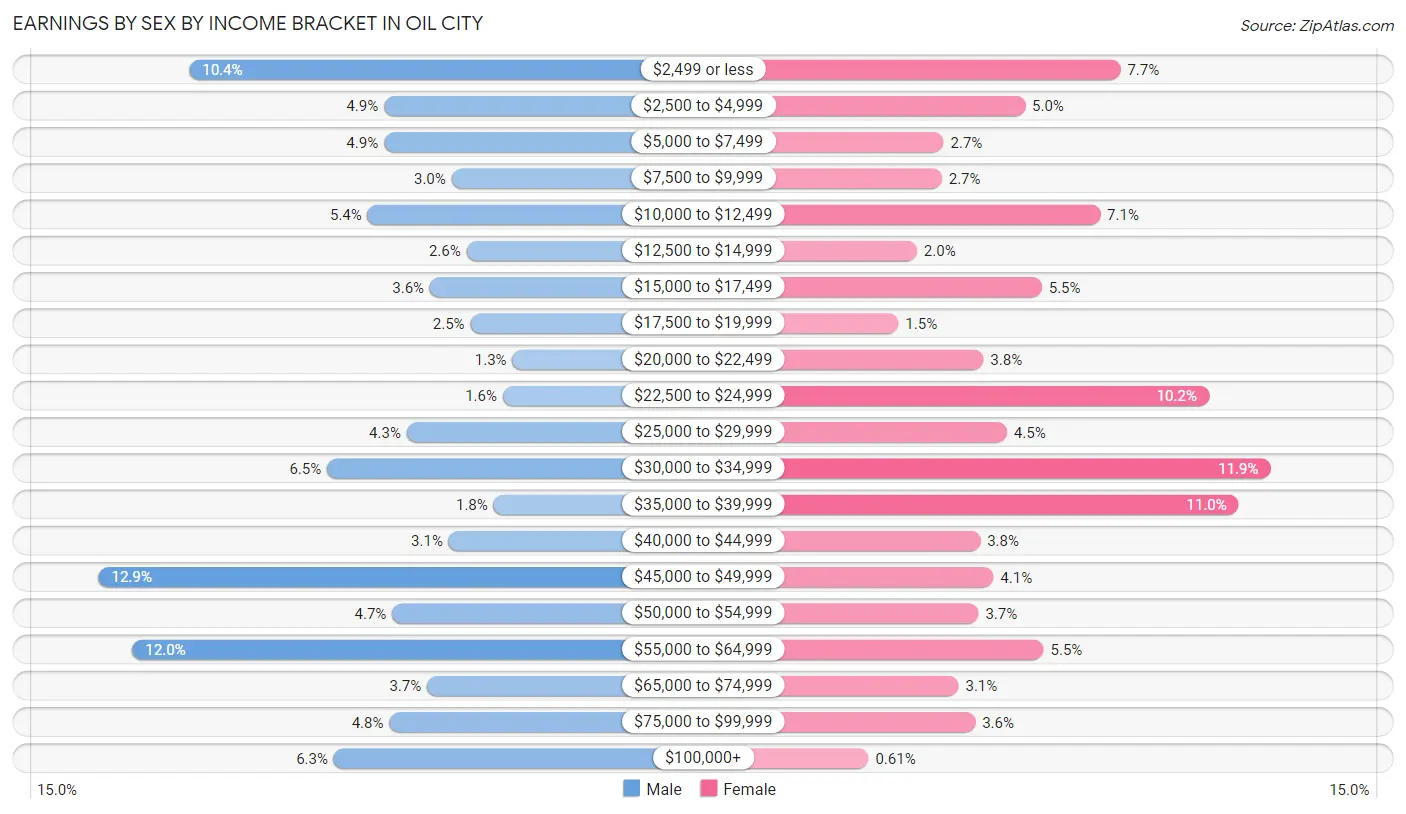
Earnings by Sex by Income Bracket in Oil City
The most common earnings brackets in Oil City are $45,000 to $49,999 for men (340 | 12.9%) and $30,000 to $34,999 for women (254 | 11.9%).
| Income | Male | Female |
| $2,499 or less | 273 (10.4%) | 164 (7.7%) |
| $2,500 to $4,999 | 129 (4.9%) | 107 (5.0%) |
| $5,000 to $7,499 | 129 (4.9%) | 58 (2.7%) |
| $7,500 to $9,999 | 79 (3.0%) | 57 (2.7%) |
| $10,000 to $12,499 | 141 (5.4%) | 152 (7.1%) |
| $12,500 to $14,999 | 68 (2.6%) | 42 (2.0%) |
| $15,000 to $17,499 | 95 (3.6%) | 117 (5.5%) |
| $17,500 to $19,999 | 65 (2.5%) | 31 (1.5%) |
| $20,000 to $22,499 | 34 (1.3%) | 82 (3.8%) |
| $22,500 to $24,999 | 41 (1.6%) | 217 (10.2%) |
| $25,000 to $29,999 | 112 (4.3%) | 96 (4.5%) |
| $30,000 to $34,999 | 171 (6.5%) | 254 (11.9%) |
| $35,000 to $39,999 | 48 (1.8%) | 235 (11.0%) |
| $40,000 to $44,999 | 81 (3.1%) | 80 (3.7%) |
| $45,000 to $49,999 | 340 (12.9%) | 88 (4.1%) |
| $50,000 to $54,999 | 123 (4.7%) | 79 (3.7%) |
| $55,000 to $64,999 | 315 (12.0%) | 118 (5.5%) |
| $65,000 to $74,999 | 97 (3.7%) | 67 (3.1%) |
| $75,000 to $99,999 | 125 (4.8%) | 77 (3.6%) |
| $100,000+ | 166 (6.3%) | 13 (0.6%) |
| Total | 2,632 (100.0%) | 2,134 (100.0%) |
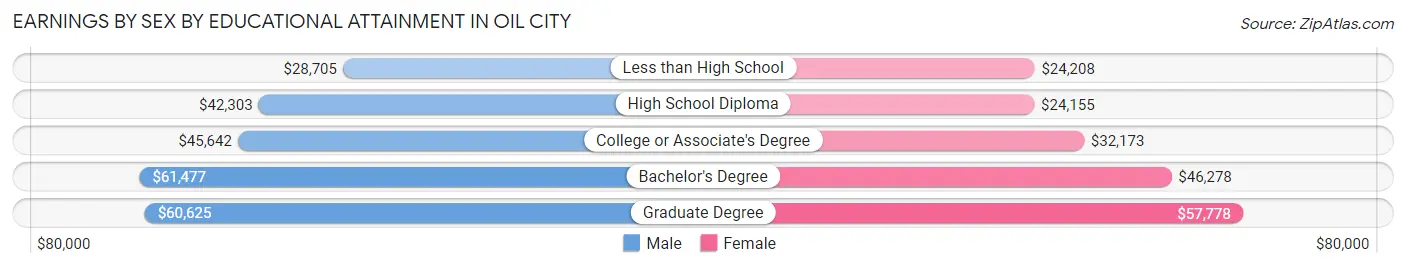
Earnings by Sex by Educational Attainment in Oil City
Average earnings in Oil City are $45,286 for men and $31,225 for women, a difference of 31.0%. Men with an educational attainment of bachelor's degree enjoy the highest average annual earnings of $61,477, while those with less than high school education earn the least with $28,705. Women with an educational attainment of graduate degree earn the most with the average annual earnings of $57,778, while those with high school diploma education have the smallest earnings of $24,155.
| Educational Attainment | Male Income | Female Income |
| Less than High School | $28,705 | $24,208 |
| High School Diploma | $42,303 | $24,155 |
| College or Associate's Degree | $45,642 | $32,173 |
| Bachelor's Degree | $61,477 | $46,278 |
| Graduate Degree | $60,625 | $57,778 |
| Total | $45,286 | $31,225 |
Family Income in Oil City
Family Income Brackets in Oil City
According to the Oil City family income data, there are 521 families falling into the $100,000 to $149,999 income range, which is the most common income bracket and makes up 22.7% of all families. Conversely, the $150,000 to $199,999 income bracket is the least frequent group with only 41 families (1.8%) belonging to this category.
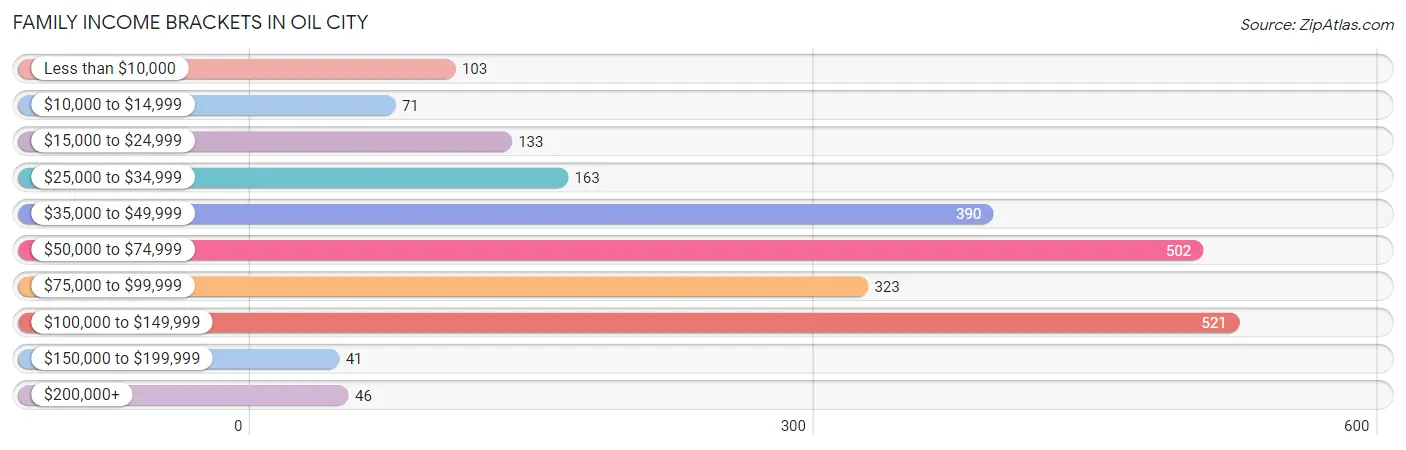
| Income Bracket | # Families | % Families |
| Less than $10,000 | 103 | 4.5% |
| $10,000 to $14,999 | 71 | 3.1% |
| $15,000 to $24,999 | 133 | 5.8% |
| $25,000 to $34,999 | 163 | 7.1% |
| $35,000 to $49,999 | 390 | 17.0% |
| $50,000 to $74,999 | 502 | 21.9% |
| $75,000 to $99,999 | 323 | 14.1% |
| $100,000 to $149,999 | 521 | 22.7% |
| $150,000 to $199,999 | 41 | 1.8% |
| $200,000+ | 46 | 2.0% |
Family Income by Famaliy Size in Oil City
6-person families (49 | 2.1%) account for the highest median family income in Oil City with $100,417 per family, while 3-person families (525 | 22.9%) have the highest median income of $26,676 per family member.
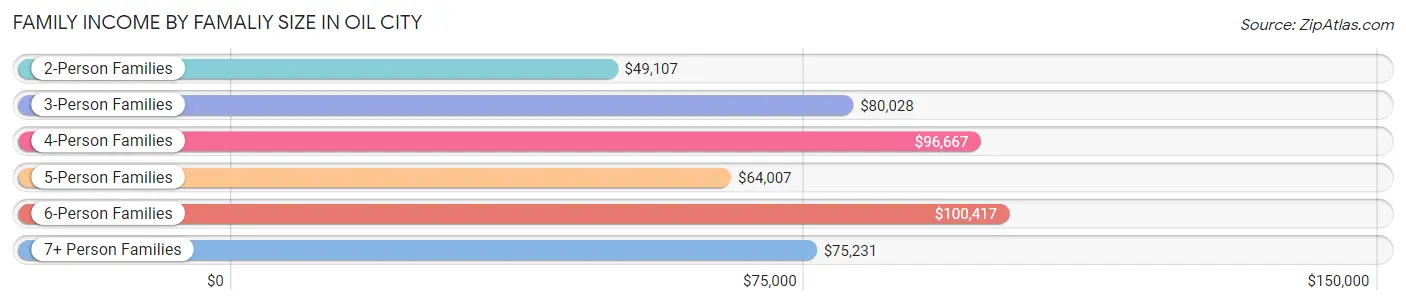
| Income Bracket | # Families | Median Income |
| 2-Person Families | 1,252 (54.6%) | $49,107 |
| 3-Person Families | 525 (22.9%) | $80,028 |
| 4-Person Families | 224 (9.8%) | $96,667 |
| 5-Person Families | 57 (2.5%) | $64,007 |
| 6-Person Families | 49 (2.1%) | $100,417 |
| 7+ Person Families | 187 (8.2%) | $75,231 |
| Total | 2,294 (100.0%) | $64,764 |
Family Income by Number of Earners in Oil City
The median family income in Oil City is $64,764, with families comprising 3+ earners (338) having the highest median family income of $105,000, while families with no earners (509) have the lowest median family income of $35,821, accounting for 14.7% and 22.2% of families, respectively.
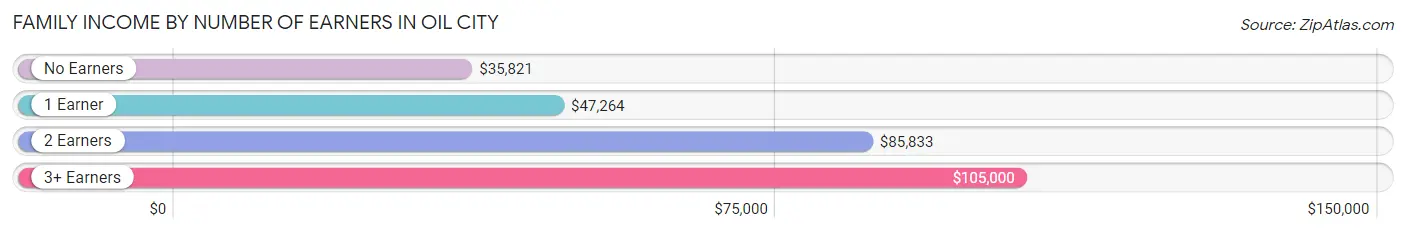
| Number of Earners | # Families | Median Income |
| No Earners | 509 (22.2%) | $35,821 |
| 1 Earner | 729 (31.8%) | $47,264 |
| 2 Earners | 718 (31.3%) | $85,833 |
| 3+ Earners | 338 (14.7%) | $105,000 |
| Total | 2,294 (100.0%) | $64,764 |
Household Income in Oil City
Household Income Brackets in Oil City
With 701 households falling in the category, the $50,000 to $74,999 income range is the most frequent in Oil City, accounting for 17.3% of all households. In contrast, only 61 households (1.5%) fall into the $200,000+ income bracket, making it the least populous group.
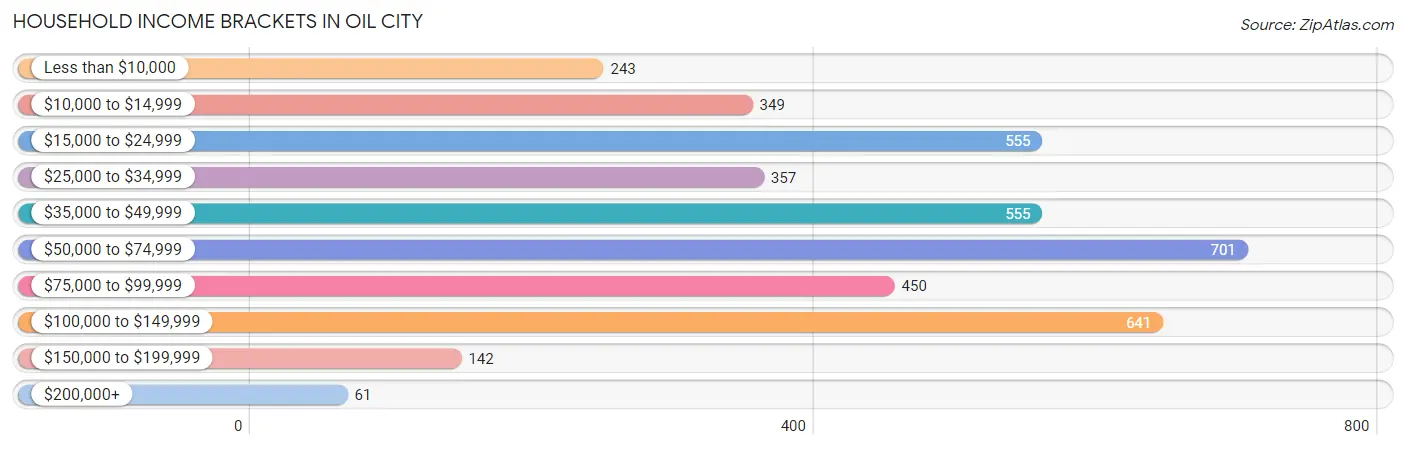
| Income Bracket | # Households | % Households |
| Less than $10,000 | 243 | 6.0% |
| $10,000 to $14,999 | 349 | 8.6% |
| $15,000 to $24,999 | 555 | 13.7% |
| $25,000 to $34,999 | 357 | 8.8% |
| $35,000 to $49,999 | 555 | 13.7% |
| $50,000 to $74,999 | 701 | 17.3% |
| $75,000 to $99,999 | 450 | 11.1% |
| $100,000 to $149,999 | 641 | 15.8% |
| $150,000 to $199,999 | 142 | 3.5% |
| $200,000+ | 61 | 1.5% |
Household Income by Householder Age in Oil City
The median household income in Oil City is $48,632, with the highest median household income of $57,528 found in the 25 to 44 years age bracket for the primary householder. A total of 977 households (24.1%) fall into this category. Meanwhile, the 15 to 24 years age bracket for the primary householder has the lowest median household income of $17,297, with 150 households (3.7%) in this group.
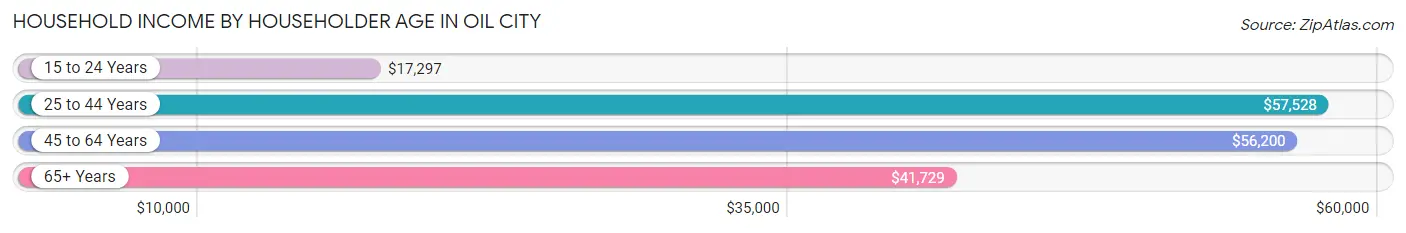
| Income Bracket | # Households | Median Income |
| 15 to 24 Years | 150 (3.7%) | $17,297 |
| 25 to 44 Years | 977 (24.1%) | $57,528 |
| 45 to 64 Years | 1,734 (42.8%) | $56,200 |
| 65+ Years | 1,193 (29.4%) | $41,729 |
| Total | 4,054 (100.0%) | $48,632 |
Poverty in Oil City
Income Below Poverty by Sex and Age in Oil City
With 15.1% poverty level for males and 18.3% for females among the residents of Oil City, 5 year old males and 18 to 24 year old females are the most vulnerable to poverty, with 19 males (57.6%) and 118 females (39.5%) in their respective age groups living below the poverty level.
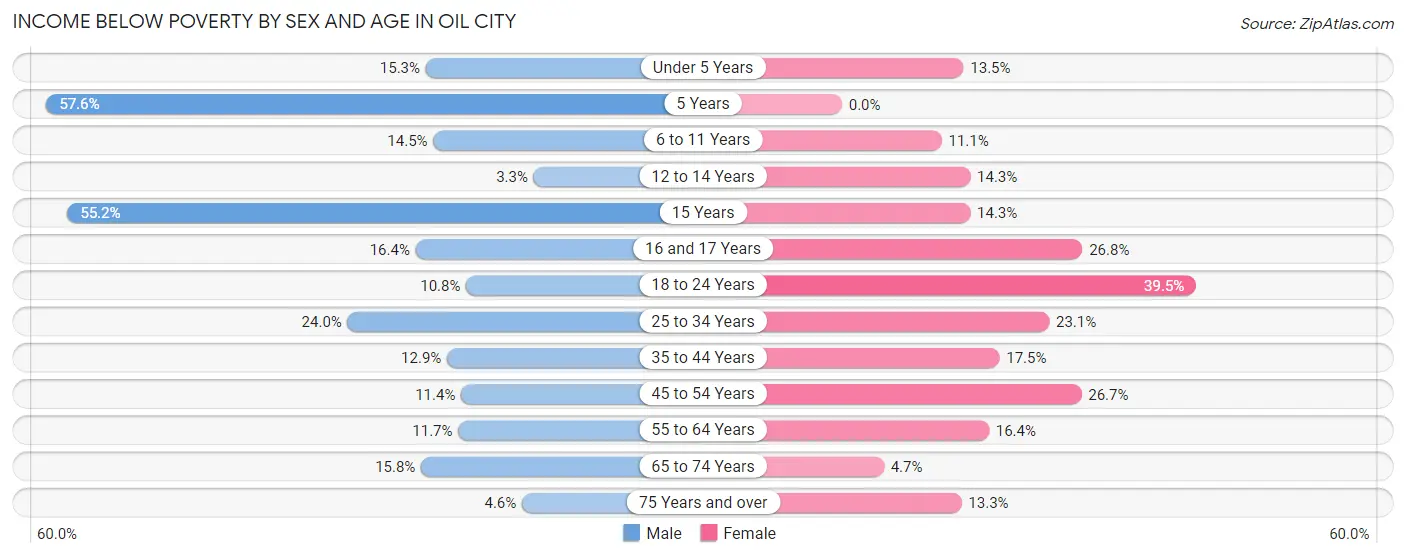
| Age Bracket | Male | Female |
| Under 5 Years | 30 (15.3%) | 26 (13.5%) |
| 5 Years | 19 (57.6%) | 0 (0.0%) |
| 6 to 11 Years | 44 (14.5%) | 35 (11.1%) |
| 12 to 14 Years | 5 (3.3%) | 18 (14.3%) |
| 15 Years | 79 (55.2%) | 1 (14.3%) |
| 16 and 17 Years | 24 (16.4%) | 49 (26.8%) |
| 18 to 24 Years | 52 (10.8%) | 118 (39.5%) |
| 25 to 34 Years | 129 (24.0%) | 99 (23.1%) |
| 35 to 44 Years | 73 (12.9%) | 121 (17.5%) |
| 45 to 54 Years | 72 (11.4%) | 172 (26.7%) |
| 55 to 64 Years | 72 (11.7%) | 118 (16.4%) |
| 65 to 74 Years | 91 (15.8%) | 23 (4.7%) |
| 75 Years and over | 13 (4.6%) | 61 (13.3%) |
| Total | 703 (15.1%) | 841 (18.3%) |
Income Above Poverty by Sex and Age in Oil City
According to the poverty statistics in Oil City, males aged 12 to 14 years and females aged 5 years are the age groups that are most secure financially, with 96.7% of males and 100.0% of females in these age groups living above the poverty line.
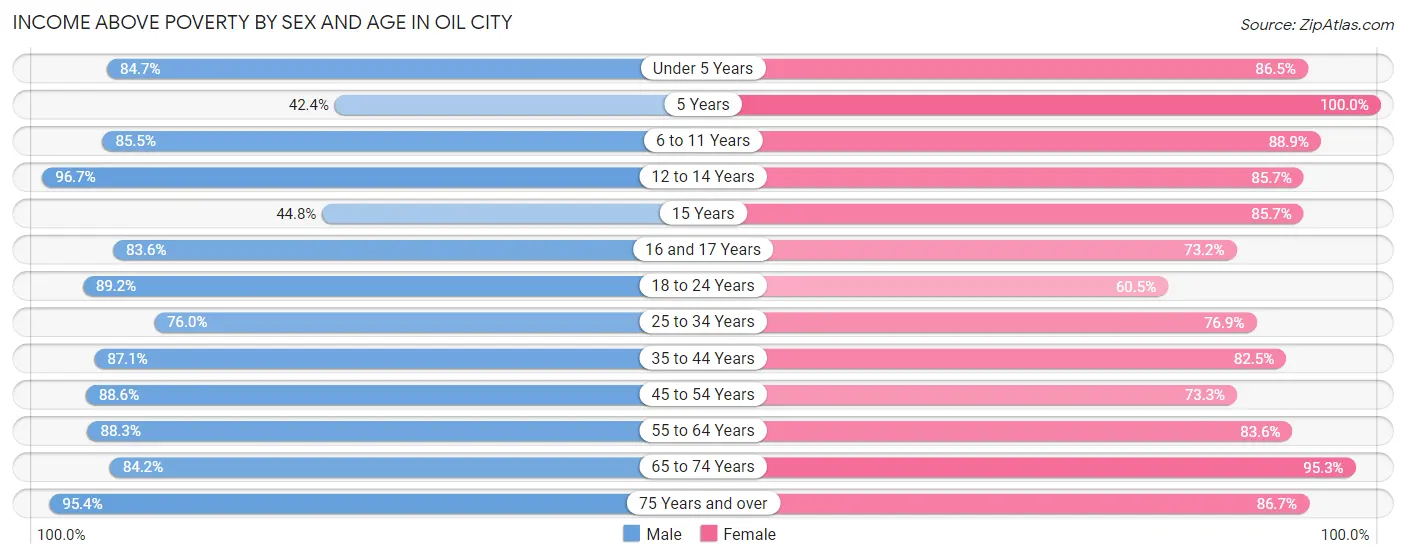
| Age Bracket | Male | Female |
| Under 5 Years | 166 (84.7%) | 166 (86.5%) |
| 5 Years | 14 (42.4%) | 38 (100.0%) |
| 6 to 11 Years | 260 (85.5%) | 280 (88.9%) |
| 12 to 14 Years | 147 (96.7%) | 108 (85.7%) |
| 15 Years | 64 (44.8%) | 6 (85.7%) |
| 16 and 17 Years | 122 (83.6%) | 134 (73.2%) |
| 18 to 24 Years | 429 (89.2%) | 181 (60.5%) |
| 25 to 34 Years | 408 (76.0%) | 330 (76.9%) |
| 35 to 44 Years | 491 (87.1%) | 569 (82.5%) |
| 45 to 54 Years | 561 (88.6%) | 473 (73.3%) |
| 55 to 64 Years | 544 (88.3%) | 603 (83.6%) |
| 65 to 74 Years | 484 (84.2%) | 469 (95.3%) |
| 75 Years and over | 270 (95.4%) | 397 (86.7%) |
| Total | 3,960 (84.9%) | 3,754 (81.7%) |
Income Below Poverty Among Married-Couple Families in Oil City
The poverty statistics for married-couple families in Oil City show that 3.8% or 60 of the total 1,586 families live below the poverty line. Families with no children have the highest poverty rate of 5.3%, comprising of 49 families. On the other hand, families with 5 or more children have the lowest poverty rate of 0.0%, which includes 0 families.
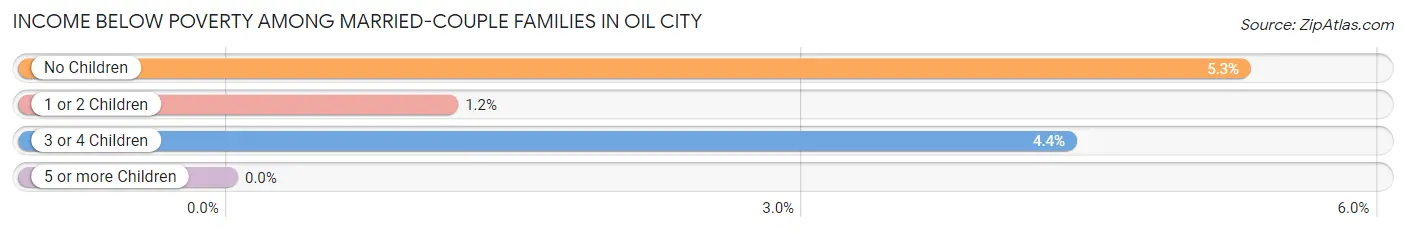
| Children | Above Poverty | Below Poverty |
| No Children | 878 (94.7%) | 49 (5.3%) |
| 1 or 2 Children | 429 (98.9%) | 5 (1.1%) |
| 3 or 4 Children | 131 (95.6%) | 6 (4.4%) |
| 5 or more Children | 88 (100.0%) | 0 (0.0%) |
| Total | 1,526 (96.2%) | 60 (3.8%) |
Income Below Poverty Among Single-Parent Households in Oil City
According to the poverty data in Oil City, 10.9% or 21 single-father households and 37.6% or 194 single-mother households are living below the poverty line. Among single-father households, those with 1 or 2 children have the highest poverty rate, with 21 households (27.3%) experiencing poverty. Likewise, among single-mother households, those with 3 or 4 children have the highest poverty rate, with 49 households (100.0%) falling below the poverty line.
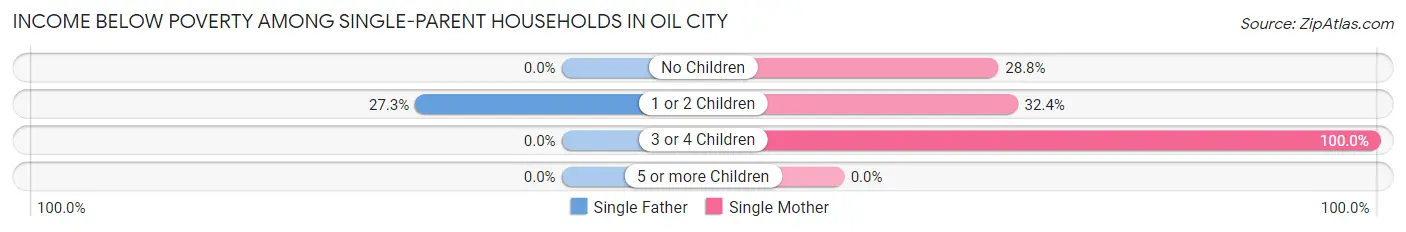
| Children | Single Father | Single Mother |
| No Children | 0 (0.0%) | 51 (28.8%) |
| 1 or 2 Children | 21 (27.3%) | 94 (32.4%) |
| 3 or 4 Children | 0 (0.0%) | 49 (100.0%) |
| 5 or more Children | 0 (0.0%) | 0 (0.0%) |
| Total | 21 (10.9%) | 194 (37.6%) |
Income Below Poverty Among Married-Couple vs Single-Parent Households in Oil City
The poverty data for Oil City shows that 60 of the married-couple family households (3.8%) and 215 of the single-parent households (30.4%) are living below the poverty level. Within the married-couple family households, those with no children have the highest poverty rate, with 49 households (5.3%) falling below the poverty line. Among the single-parent households, those with 3 or 4 children have the highest poverty rate, with 49 household (87.5%) living below poverty.
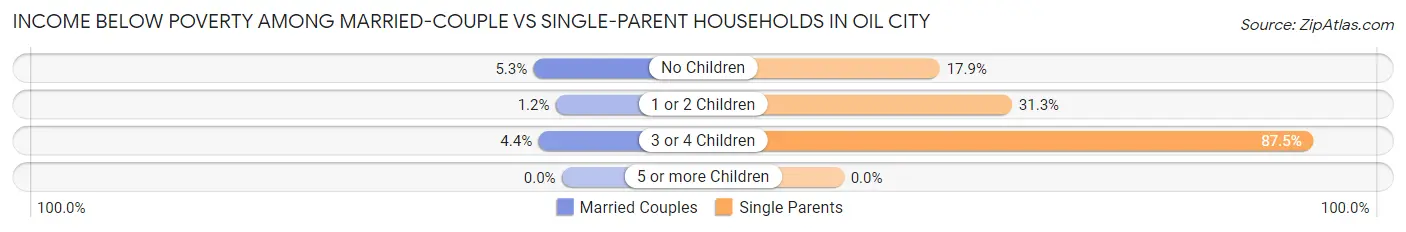
| Children | Married-Couple Families | Single-Parent Households |
| No Children | 49 (5.3%) | 51 (17.9%) |
| 1 or 2 Children | 5 (1.1%) | 115 (31.3%) |
| 3 or 4 Children | 6 (4.4%) | 49 (87.5%) |
| 5 or more Children | 0 (0.0%) | 0 (0.0%) |
| Total | 60 (3.8%) | 215 (30.4%) |
Race in Oil City
The most populous races in Oil City are White / Caucasian (9,188 | 95.7%), Two or more Races (273 | 2.8%), and Hispanic or Latino (168 | 1.8%).
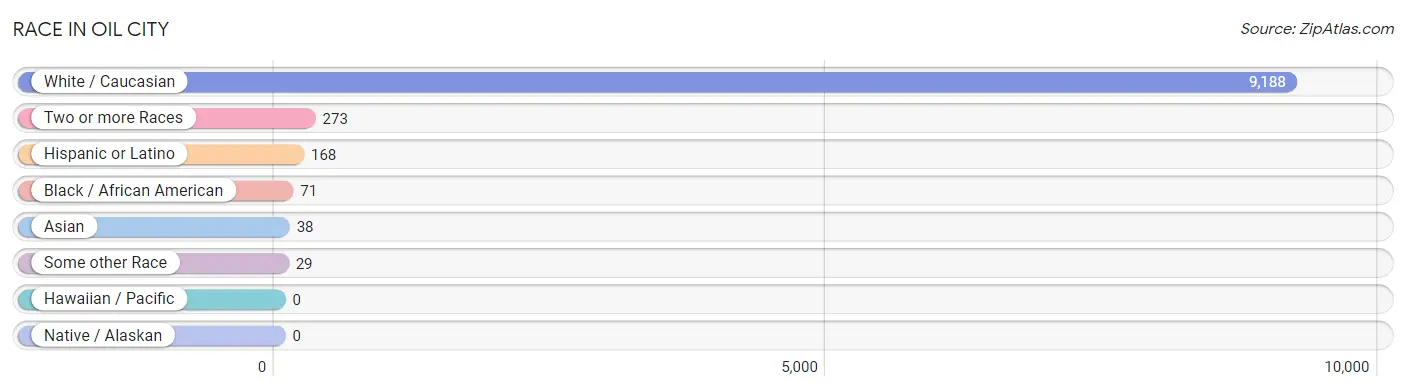
| Race | # Population | % Population |
| Asian | 38 | 0.4% |
| Black / African American | 71 | 0.7% |
| Hawaiian / Pacific | 0 | 0.0% |
| Hispanic or Latino | 168 | 1.8% |
| Native / Alaskan | 0 | 0.0% |
| White / Caucasian | 9,188 | 95.7% |
| Two or more Races | 273 | 2.8% |
| Some other Race | 29 | 0.3% |
| Total | 9,599 | 100.0% |
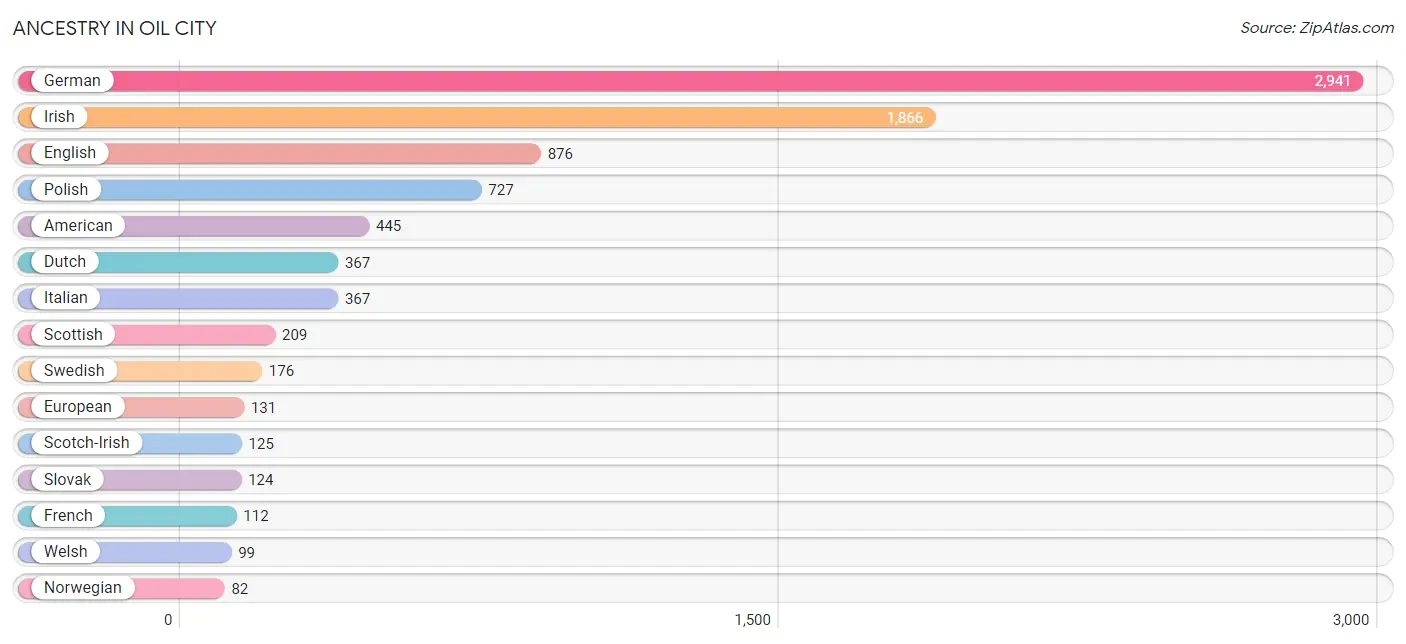
Ancestry in Oil City
The most populous ancestries reported in Oil City are German (2,941 | 30.6%), Irish (1,866 | 19.4%), English (876 | 9.1%), Polish (727 | 7.6%), and American (445 | 4.6%), together accounting for 71.4% of all Oil City residents.
| Ancestry | # Population | % Population |
| African | 6 | 0.1% |
| American | 445 | 4.6% |
| Austrian | 14 | 0.2% |
| British | 30 | 0.3% |
| Cherokee | 5 | 0.1% |
| Czechoslovakian | 9 | 0.1% |
| Danish | 34 | 0.4% |
| Dominican | 7 | 0.1% |
| Dutch | 367 | 3.8% |
| Eastern European | 9 | 0.1% |
| Ecuadorian | 2 | 0.0% |
| English | 876 | 9.1% |
| European | 131 | 1.4% |
| French | 112 | 1.2% |
| German | 2,941 | 30.6% |
| Greek | 75 | 0.8% |
| Hungarian | 42 | 0.4% |
| Irish | 1,866 | 19.4% |
| Iroquois | 1 | 0.0% |
| Israeli | 7 | 0.1% |
| Italian | 367 | 3.8% |
| Latvian | 9 | 0.1% |
| Lithuanian | 20 | 0.2% |
| Mexican | 70 | 0.7% |
| Norwegian | 82 | 0.9% |
| Pennsylvania German | 24 | 0.3% |
| Polish | 727 | 7.6% |
| Portuguese | 11 | 0.1% |
| Puerto Rican | 82 | 0.9% |
| Russian | 13 | 0.1% |
| Scotch-Irish | 125 | 1.3% |
| Scottish | 209 | 2.2% |
| Slavic | 16 | 0.2% |
| Slovak | 124 | 1.3% |
| Slovene | 11 | 0.1% |
| South American | 2 | 0.0% |
| Sri Lankan | 19 | 0.2% |
| Subsaharan African | 6 | 0.1% |
| Swedish | 176 | 1.8% |
| Swiss | 19 | 0.2% |
| Thai | 19 | 0.2% |
| Ugandan | 1 | 0.0% |
| Ukrainian | 19 | 0.2% |
| Welsh | 99 | 1.0% | View All 44 Rows |
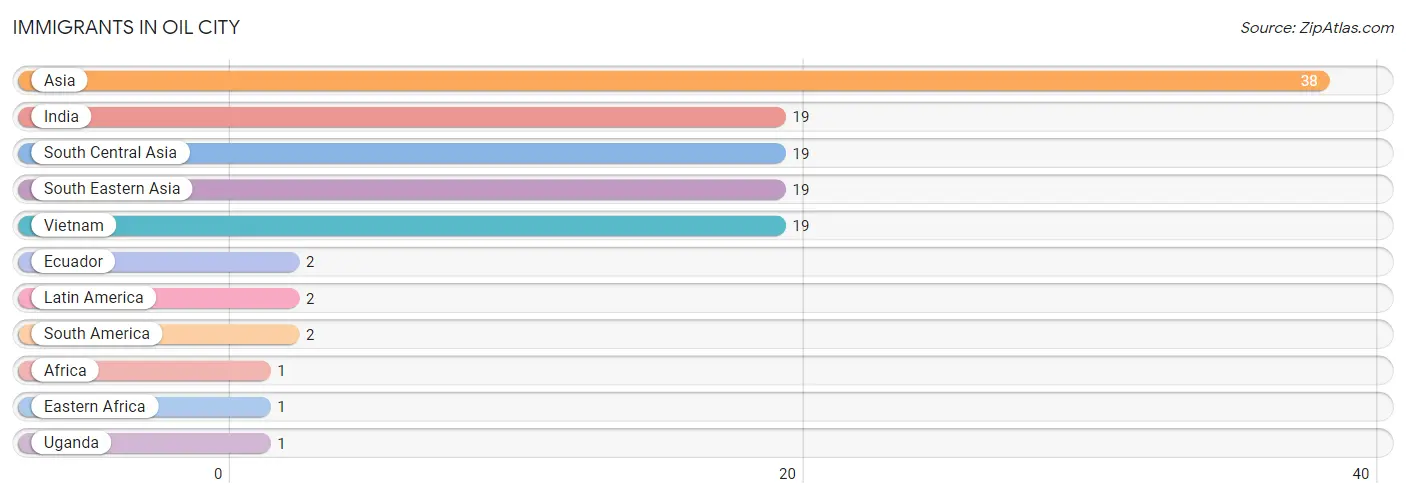
Immigrants in Oil City
The most numerous immigrant groups reported in Oil City came from Asia (38 | 0.4%), India (19 | 0.2%), South Central Asia (19 | 0.2%), South Eastern Asia (19 | 0.2%), and Vietnam (19 | 0.2%), together accounting for 1.2% of all Oil City residents.
| Immigration Origin | # Population | % Population |
| Africa | 1 | 0.0% |
| Asia | 38 | 0.4% |
| Eastern Africa | 1 | 0.0% |
| Ecuador | 2 | 0.0% |
| India | 19 | 0.2% |
| Latin America | 2 | 0.0% |
| South America | 2 | 0.0% |
| South Central Asia | 19 | 0.2% |
| South Eastern Asia | 19 | 0.2% |
| Uganda | 1 | 0.0% |
| Vietnam | 19 | 0.2% | View All 11 Rows |
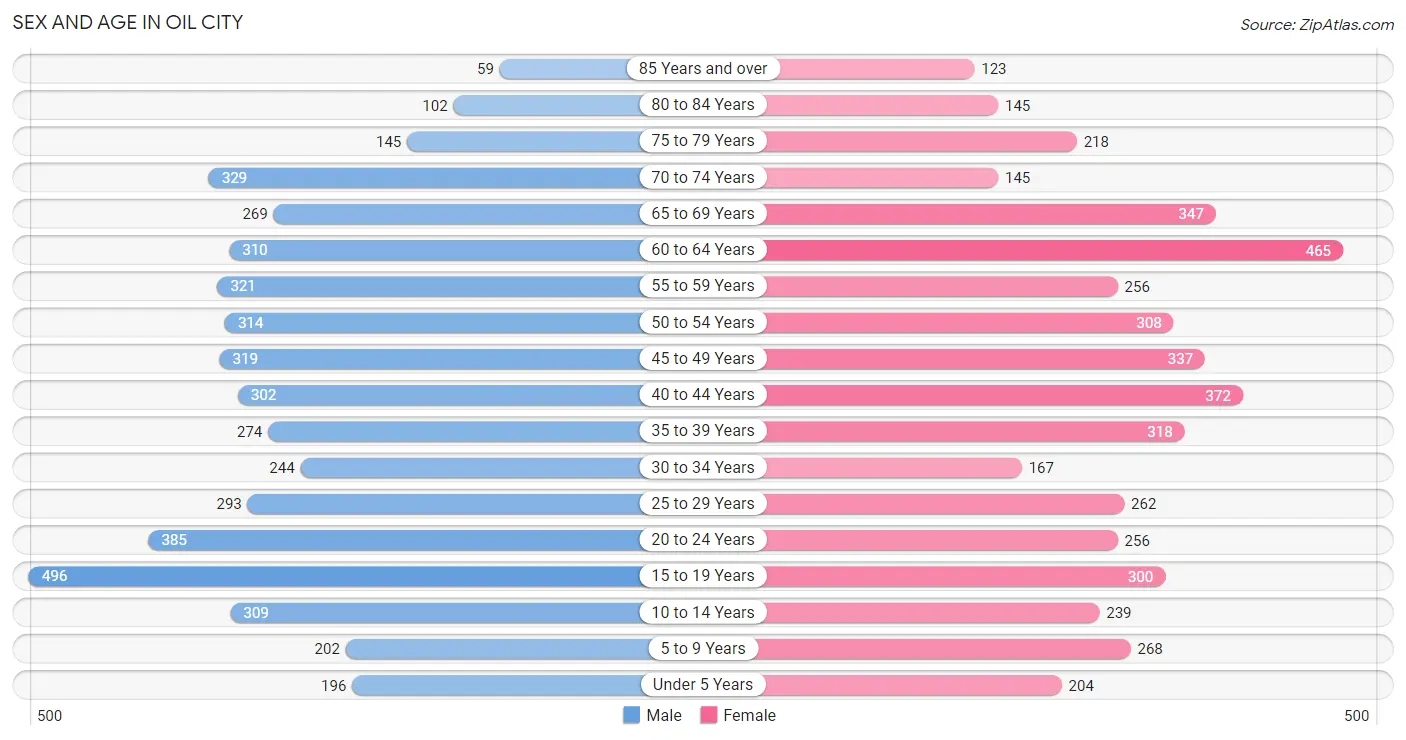
Sex and Age in Oil City
Sex and Age in Oil City
The most populous age groups in Oil City are 15 to 19 Years (496 | 10.2%) for men and 60 to 64 Years (465 | 9.8%) for women.
| Age Bracket | Male | Female |
| Under 5 Years | 196 (4.0%) | 204 (4.3%) |
| 5 to 9 Years | 202 (4.2%) | 268 (5.7%) |
| 10 to 14 Years | 309 (6.4%) | 239 (5.1%) |
| 15 to 19 Years | 496 (10.2%) | 300 (6.3%) |
| 20 to 24 Years | 385 (7.9%) | 256 (5.4%) |
| 25 to 29 Years | 293 (6.0%) | 262 (5.5%) |
| 30 to 34 Years | 244 (5.0%) | 167 (3.5%) |
| 35 to 39 Years | 274 (5.6%) | 318 (6.7%) |
| 40 to 44 Years | 302 (6.2%) | 372 (7.9%) |
| 45 to 49 Years | 319 (6.6%) | 337 (7.1%) |
| 50 to 54 Years | 314 (6.5%) | 308 (6.5%) |
| 55 to 59 Years | 321 (6.6%) | 256 (5.4%) |
| 60 to 64 Years | 310 (6.4%) | 465 (9.8%) |
| 65 to 69 Years | 269 (5.5%) | 347 (7.3%) |
| 70 to 74 Years | 329 (6.8%) | 145 (3.1%) |
| 75 to 79 Years | 145 (3.0%) | 218 (4.6%) |
| 80 to 84 Years | 102 (2.1%) | 145 (3.1%) |
| 85 Years and over | 59 (1.2%) | 123 (2.6%) |
| Total | 4,869 (100.0%) | 4,730 (100.0%) |
Families and Households in Oil City
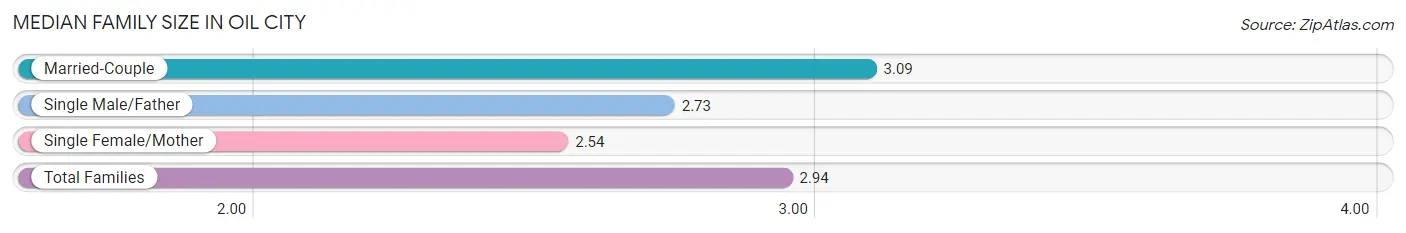
Median Family Size in Oil City
The median family size in Oil City is 2.94 persons per family, with married-couple families (1,586 | 69.1%) accounting for the largest median family size of 3.09 persons per family. On the other hand, single female/mother families (516 | 22.5%) represent the smallest median family size with 2.54 persons per family.
| Family Type | # Families | Family Size |
| Married-Couple | 1,586 (69.1%) | 3.09 |
| Single Male/Father | 192 (8.4%) | 2.73 |
| Single Female/Mother | 516 (22.5%) | 2.54 |
| Total Families | 2,294 (100.0%) | 2.94 |
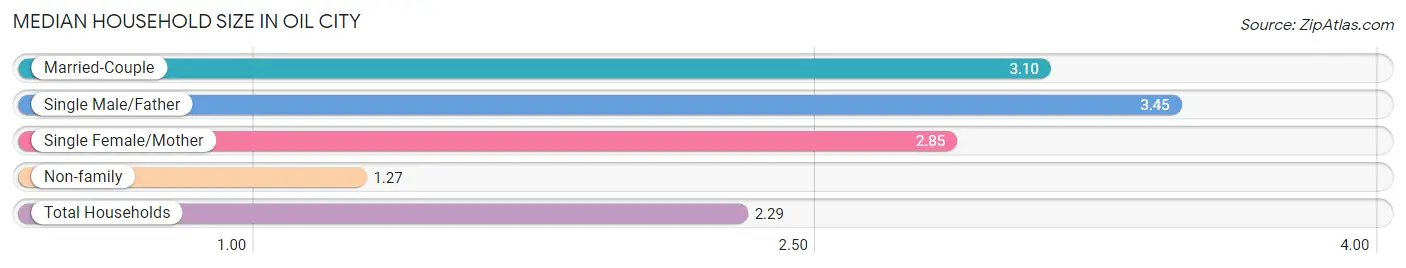
Median Household Size in Oil City
The median household size in Oil City is 2.29 persons per household, with single male/father households (192 | 4.7%) accounting for the largest median household size of 3.45 persons per household. non-family households (1,760 | 43.4%) represent the smallest median household size with 1.27 persons per household.
| Household Type | # Households | Household Size |
| Married-Couple | 1,586 (39.1%) | 3.10 |
| Single Male/Father | 192 (4.7%) | 3.45 |
| Single Female/Mother | 516 (12.7%) | 2.85 |
| Non-family | 1,760 (43.4%) | 1.27 |
| Total Households | 4,054 (100.0%) | 2.29 |
Household Size by Marriage Status in Oil City
Out of a total of 4,054 households in Oil City, 2,294 (56.6%) are family households, while 1,760 (43.4%) are nonfamily households. The most numerous type of family households are 2-person households, comprising 1,143, and the most common type of nonfamily households are 1-person households, comprising 1,384.
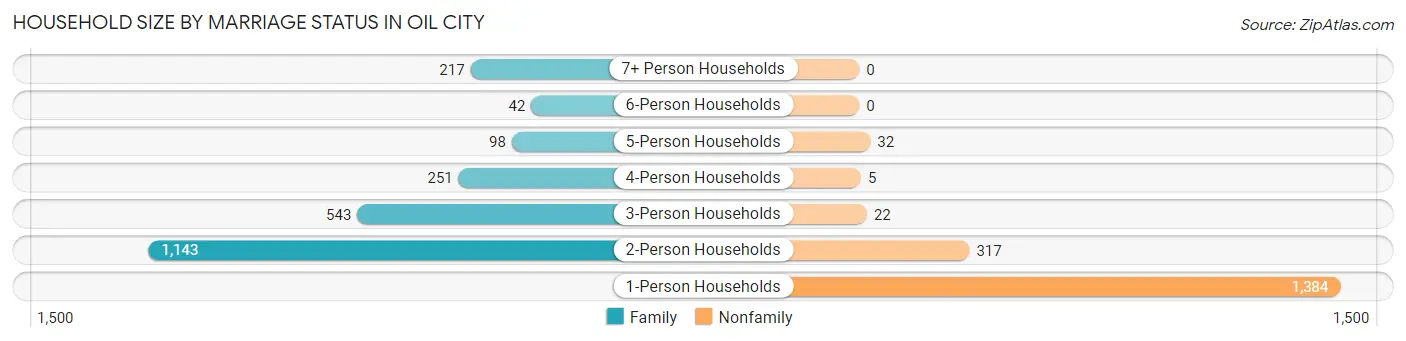
| Household Size | Family Households | Nonfamily Households |
| 1-Person Households | - | 1,384 (34.1%) |
| 2-Person Households | 1,143 (28.2%) | 317 (7.8%) |
| 3-Person Households | 543 (13.4%) | 22 (0.5%) |
| 4-Person Households | 251 (6.2%) | 5 (0.1%) |
| 5-Person Households | 98 (2.4%) | 32 (0.8%) |
| 6-Person Households | 42 (1.0%) | 0 (0.0%) |
| 7+ Person Households | 217 (5.3%) | 0 (0.0%) |
| Total | 2,294 (56.6%) | 1,760 (43.4%) |
Female Fertility in Oil City
Fertility by Age in Oil City
Average fertility rate in Oil City is 50.0 births per 1,000 women. Women in the age bracket of 20 to 34 years have the highest fertility rate with 131.0 births per 1,000 women. Women in the age bracket of 20 to 34 years acount for 88.2% of all women with births.
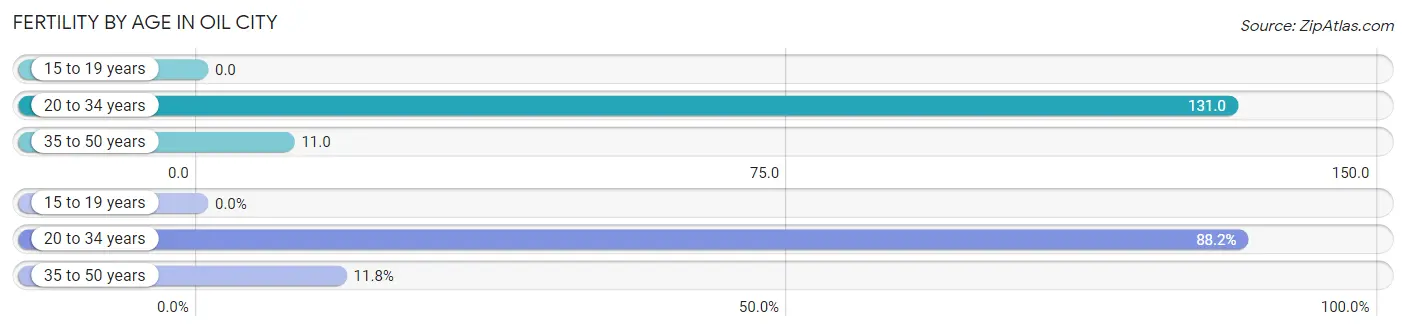
| Age Bracket | Women with Births | Births / 1,000 Women |
| 15 to 19 years | 0 (0.0%) | 0.0 |
| 20 to 34 years | 90 (88.2%) | 131.0 |
| 35 to 50 years | 12 (11.8%) | 11.0 |
| Total | 102 (100.0%) | 50.0 |
Fertility by Age by Marriage Status in Oil City
61.8% of women with births (102) in Oil City are married. The highest percentage of unmarried women with births falls into 35 to 50 years age bracket with 100.0% of them unmarried at the time of birth, while the lowest percentage of unmarried women with births belong to 20 to 34 years age bracket with 30.0% of them unmarried.
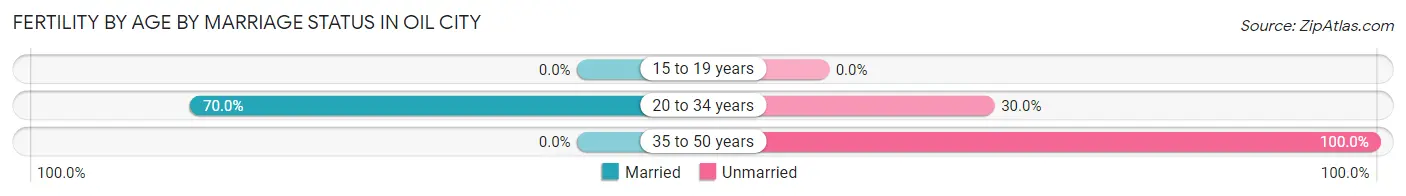
| Age Bracket | Married | Unmarried |
| 15 to 19 years | 0 (0.0%) | 0 (0.0%) |
| 20 to 34 years | 63 (70.0%) | 27 (30.0%) |
| 35 to 50 years | 0 (0.0%) | 12 (100.0%) |
| Total | 63 (61.8%) | 39 (38.2%) |
Fertility by Education in Oil City
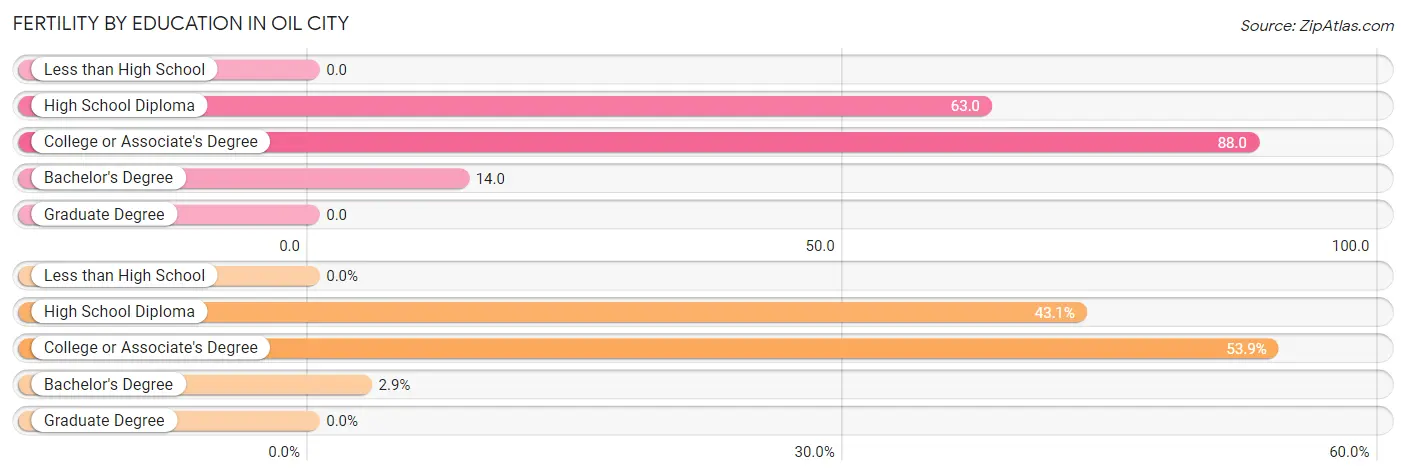
| Educational Attainment | Women with Births | Births / 1,000 Women |
| Less than High School | 0 (0.0%) | 0.0 |
| High School Diploma | 44 (43.1%) | 63.0 |
| College or Associate's Degree | 55 (53.9%) | 88.0 |
| Bachelor's Degree | 3 (2.9%) | 14.0 |
| Graduate Degree | 0 (0.0%) | 0.0 |
| Total | 102 (100.0%) | 50.0 |
Fertility by Education by Marriage Status in Oil City
38.2% of women with births in Oil City are unmarried. Women with the educational attainment of bachelor's degree are most likely to be married with 100.0% of them married at childbirth, while women with the educational attainment of high school diploma are least likely to be married with 70.5% of them unmarried at childbirth.
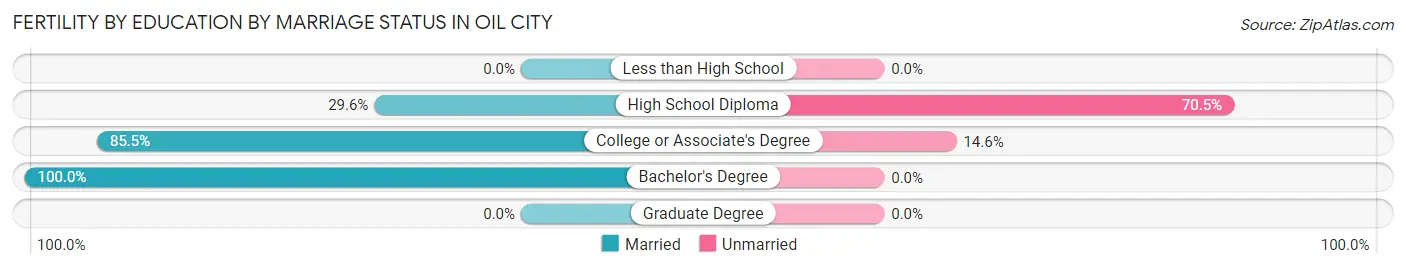
| Educational Attainment | Married | Unmarried |
| Less than High School | 0 (0.0%) | 0 (0.0%) |
| High School Diploma | 13 (29.5%) | 31 (70.5%) |
| College or Associate's Degree | 47 (85.5%) | 8 (14.5%) |
| Bachelor's Degree | 3 (100.0%) | 0 (0.0%) |
| Graduate Degree | 0 (0.0%) | 0 (0.0%) |
| Total | 63 (61.8%) | 39 (38.2%) |
Employment Characteristics in Oil City
Employment by Class of Employer in Oil City
Among the 4,094 employed individuals in Oil City, private company employees (2,606 | 63.6%), not-for-profit organizations (568 | 13.9%), and local government employees (417 | 10.2%) make up the most common classes of employment.
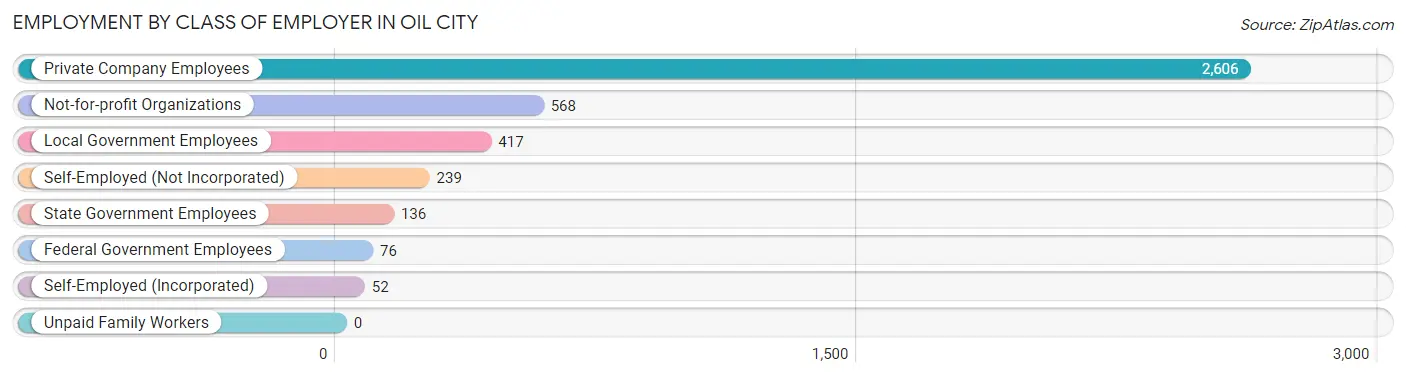
| Employer Class | # Employees | % Employees |
| Private Company Employees | 2,606 | 63.6% |
| Self-Employed (Incorporated) | 52 | 1.3% |
| Self-Employed (Not Incorporated) | 239 | 5.8% |
| Not-for-profit Organizations | 568 | 13.9% |
| Local Government Employees | 417 | 10.2% |
| State Government Employees | 136 | 3.3% |
| Federal Government Employees | 76 | 1.9% |
| Unpaid Family Workers | 0 | 0.0% |
| Total | 4,094 | 100.0% |
Employment Status by Age in Oil City
According to the labor force statistics for Oil City, out of the total population over 16 years of age (8,031), 56.7% or 4,554 individuals are in the labor force, with 7.8% or 355 of them unemployed. The age group with the highest labor force participation rate is 25 to 29 years, with 93.2% or 517 individuals in the labor force. Within the labor force, the 25 to 29 years age range has the highest percentage of unemployed individuals, with 23.6% or 122 of them being unemployed.
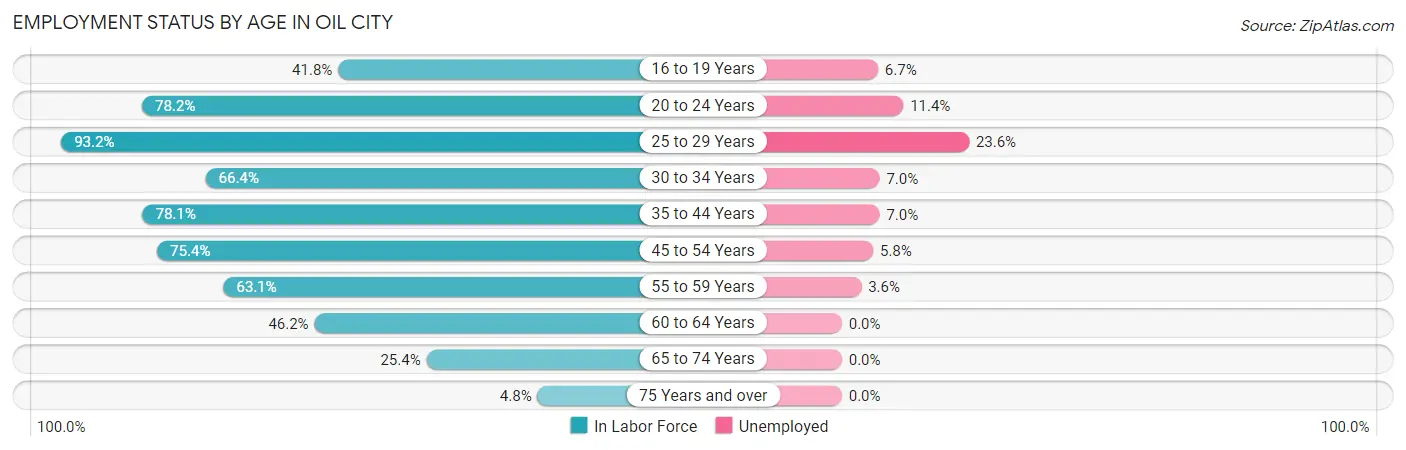
| Age Bracket | In Labor Force | Unemployed |
| 16 to 19 Years | 270 (41.8%) | 18 (6.7%) |
| 20 to 24 Years | 501 (78.2%) | 57 (11.4%) |
| 25 to 29 Years | 517 (93.2%) | 122 (23.6%) |
| 30 to 34 Years | 273 (66.4%) | 19 (7.0%) |
| 35 to 44 Years | 989 (78.1%) | 69 (7.0%) |
| 45 to 54 Years | 964 (75.4%) | 56 (5.8%) |
| 55 to 59 Years | 364 (63.1%) | 13 (3.6%) |
| 60 to 64 Years | 358 (46.2%) | 0 (0.0%) |
| 65 to 74 Years | 277 (25.4%) | 0 (0.0%) |
| 75 Years and over | 38 (4.8%) | 0 (0.0%) |
| Total | 4,554 (56.7%) | 355 (7.8%) |
Employment Status by Educational Attainment in Oil City
According to labor force statistics for Oil City, 71.2% of individuals (3,462) out of the total population between 25 and 64 years of age (4,862) are in the labor force, with 8.0% or 277 of them being unemployed. The group with the highest labor force participation rate are those with the educational attainment of college / associate degree, with 78.0% or 1,063 individuals in the labor force. Within the labor force, individuals with less than high school education have the highest percentage of unemployment, with 28.6% or 63 of them being unemployed.
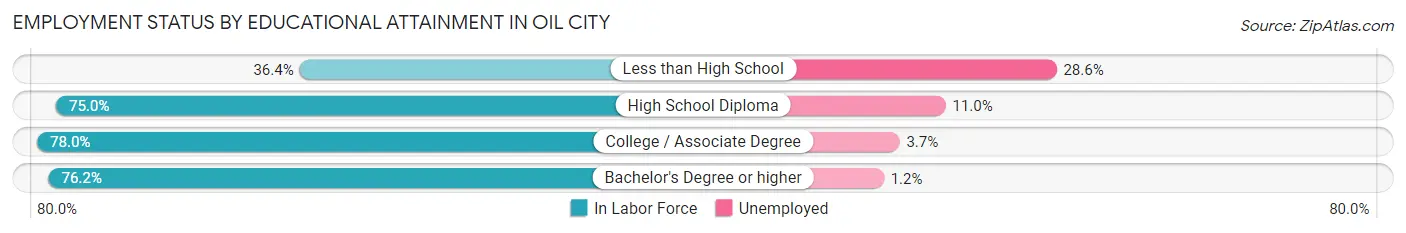
| Educational Attainment | In Labor Force | Unemployed |
| Less than High School | 220 (36.4%) | 173 (28.6%) |
| High School Diploma | 1,514 (75.0%) | 222 (11.0%) |
| College / Associate Degree | 1,063 (78.0%) | 50 (3.7%) |
| Bachelor's Degree or higher | 667 (76.2%) | 10 (1.2%) |
| Total | 3,462 (71.2%) | 389 (8.0%) |
Employment Occupations by Sex in Oil City
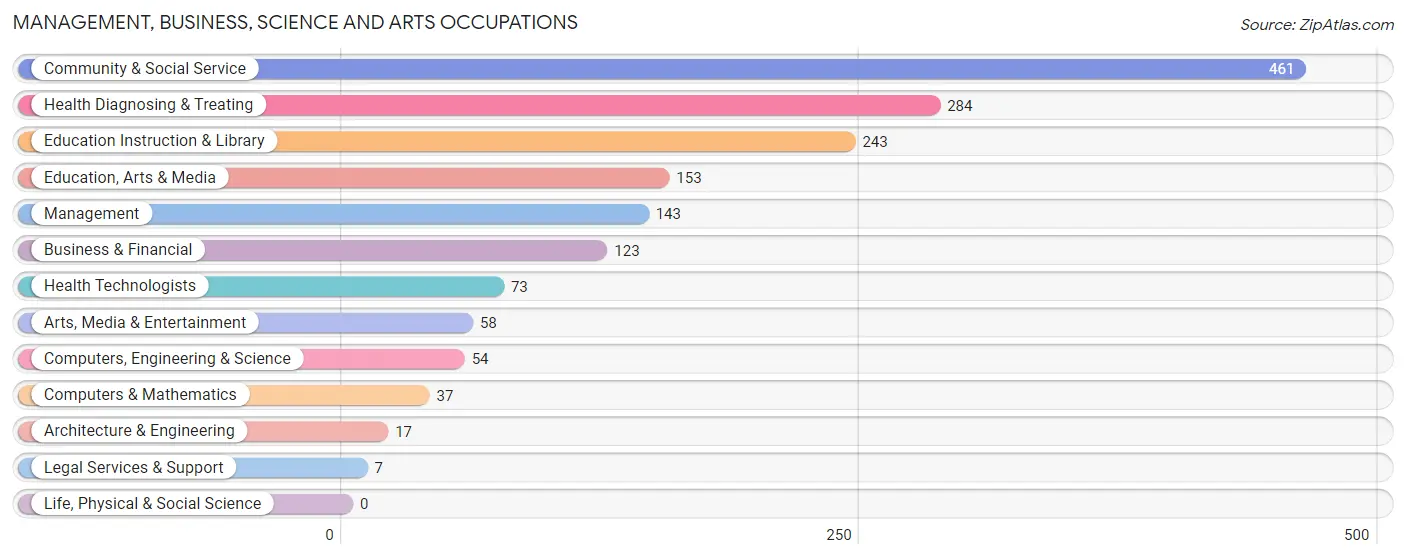
Management, Business, Science and Arts Occupations
The most common Management, Business, Science and Arts occupations in Oil City are Community & Social Service (461 | 11.0%), Health Diagnosing & Treating (284 | 6.8%), Education Instruction & Library (243 | 5.8%), Education, Arts & Media (153 | 3.6%), and Management (143 | 3.4%).
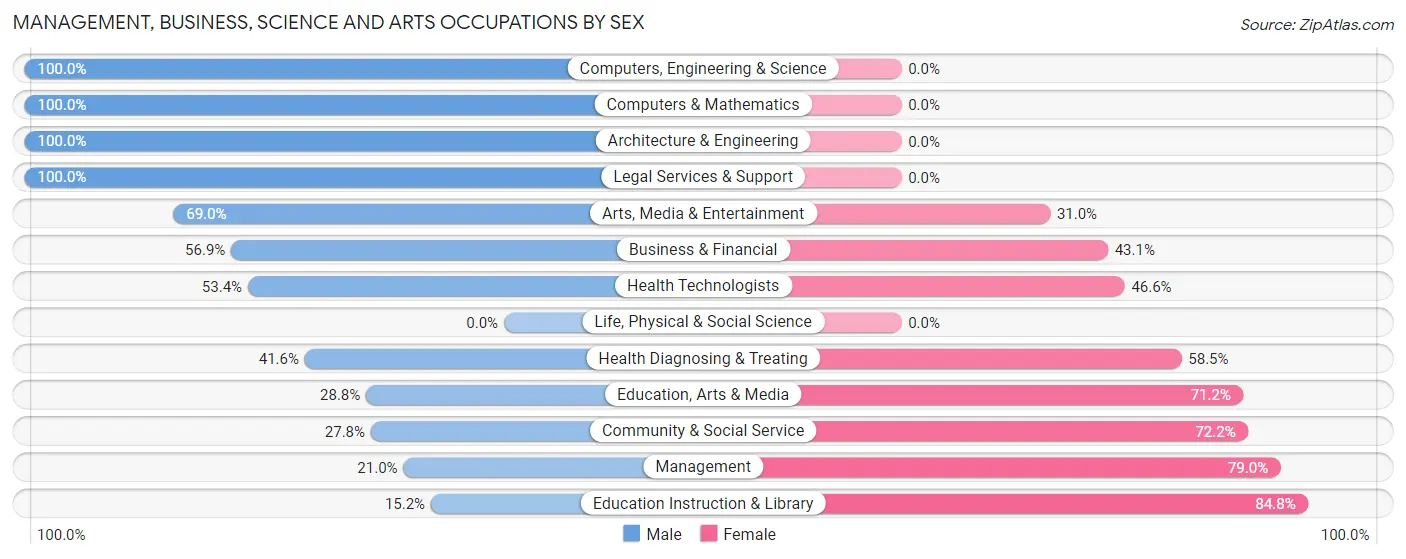
Management, Business, Science and Arts Occupations by Sex
Within the Management, Business, Science and Arts occupations in Oil City, the most male-oriented occupations are Computers, Engineering & Science (100.0%), Computers & Mathematics (100.0%), and Architecture & Engineering (100.0%), while the most female-oriented occupations are Education Instruction & Library (84.8%), Management (79.0%), and Community & Social Service (72.2%).
| Occupation | Male | Female |
| Management | 30 (21.0%) | 113 (79.0%) |
| Business & Financial | 70 (56.9%) | 53 (43.1%) |
| Computers, Engineering & Science | 54 (100.0%) | 0 (0.0%) |
| Computers & Mathematics | 37 (100.0%) | 0 (0.0%) |
| Architecture & Engineering | 17 (100.0%) | 0 (0.0%) |
| Life, Physical & Social Science | 0 (0.0%) | 0 (0.0%) |
| Community & Social Service | 128 (27.8%) | 333 (72.2%) |
| Education, Arts & Media | 44 (28.8%) | 109 (71.2%) |
| Legal Services & Support | 7 (100.0%) | 0 (0.0%) |
| Education Instruction & Library | 37 (15.2%) | 206 (84.8%) |
| Arts, Media & Entertainment | 40 (69.0%) | 18 (31.0%) |
| Health Diagnosing & Treating | 118 (41.5%) | 166 (58.5%) |
| Health Technologists | 39 (53.4%) | 34 (46.6%) |
| Total (Category) | 400 (37.6%) | 665 (62.4%) |
| Total (Overall) | 2,306 (55.0%) | 1,883 (45.0%) |
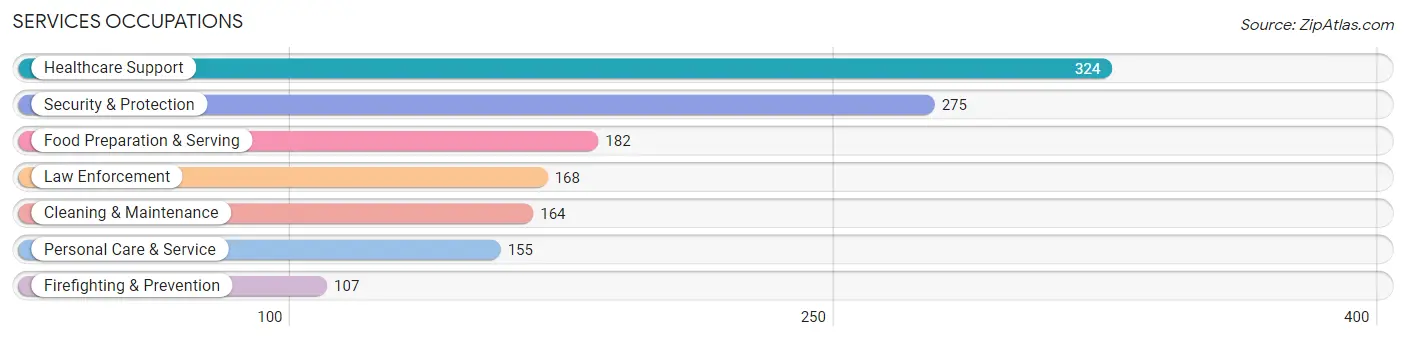
Services Occupations
The most common Services occupations in Oil City are Healthcare Support (324 | 7.7%), Security & Protection (275 | 6.6%), Food Preparation & Serving (182 | 4.3%), Law Enforcement (168 | 4.0%), and Cleaning & Maintenance (164 | 3.9%).
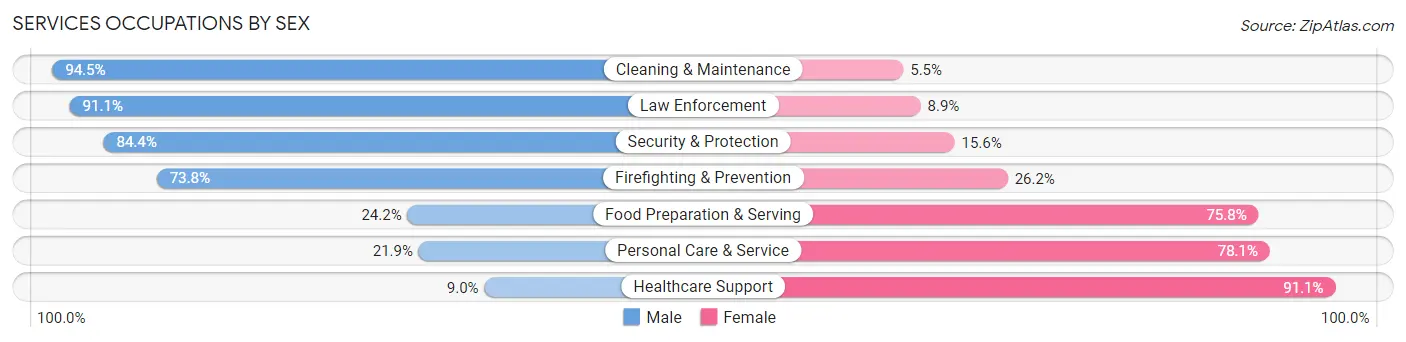
Services Occupations by Sex
Within the Services occupations in Oil City, the most male-oriented occupations are Cleaning & Maintenance (94.5%), Law Enforcement (91.1%), and Security & Protection (84.4%), while the most female-oriented occupations are Healthcare Support (91.0%), Personal Care & Service (78.1%), and Food Preparation & Serving (75.8%).
| Occupation | Male | Female |
| Healthcare Support | 29 (8.9%) | 295 (91.0%) |
| Security & Protection | 232 (84.4%) | 43 (15.6%) |
| Firefighting & Prevention | 79 (73.8%) | 28 (26.2%) |
| Law Enforcement | 153 (91.1%) | 15 (8.9%) |
| Food Preparation & Serving | 44 (24.2%) | 138 (75.8%) |
| Cleaning & Maintenance | 155 (94.5%) | 9 (5.5%) |
| Personal Care & Service | 34 (21.9%) | 121 (78.1%) |
| Total (Category) | 494 (44.9%) | 606 (55.1%) |
| Total (Overall) | 2,306 (55.0%) | 1,883 (45.0%) |
Sales and Office Occupations
The most common Sales and Office occupations in Oil City are Sales & Related (382 | 9.1%), and Office & Administration (272 | 6.5%).

Sales and Office Occupations by Sex

| Occupation | Male | Female |
| Sales & Related | 147 (38.5%) | 235 (61.5%) |
| Office & Administration | 50 (18.4%) | 222 (81.6%) |
| Total (Category) | 197 (30.1%) | 457 (69.9%) |
| Total (Overall) | 2,306 (55.0%) | 1,883 (45.0%) |
Natural Resources, Construction and Maintenance Occupations
The most common Natural Resources, Construction and Maintenance occupations in Oil City are Construction & Extraction (271 | 6.5%), and Installation, Maintenance & Repair (99 | 2.4%).
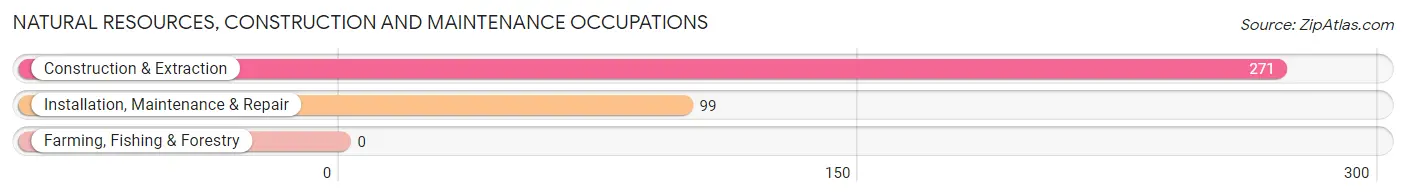
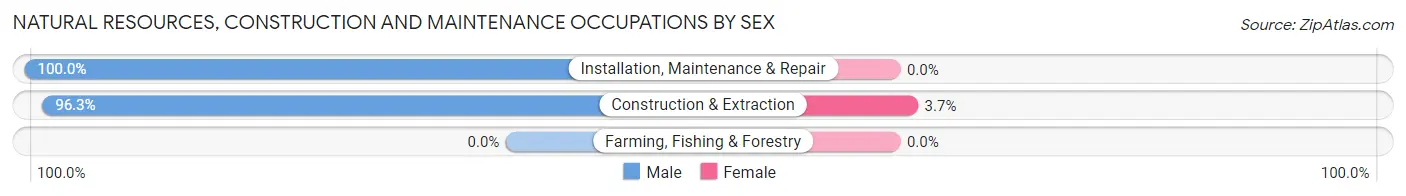
Natural Resources, Construction and Maintenance Occupations by Sex
| Occupation | Male | Female |
| Farming, Fishing & Forestry | 0 (0.0%) | 0 (0.0%) |
| Construction & Extraction | 261 (96.3%) | 10 (3.7%) |
| Installation, Maintenance & Repair | 99 (100.0%) | 0 (0.0%) |
| Total (Category) | 360 (97.3%) | 10 (2.7%) |
| Total (Overall) | 2,306 (55.0%) | 1,883 (45.0%) |
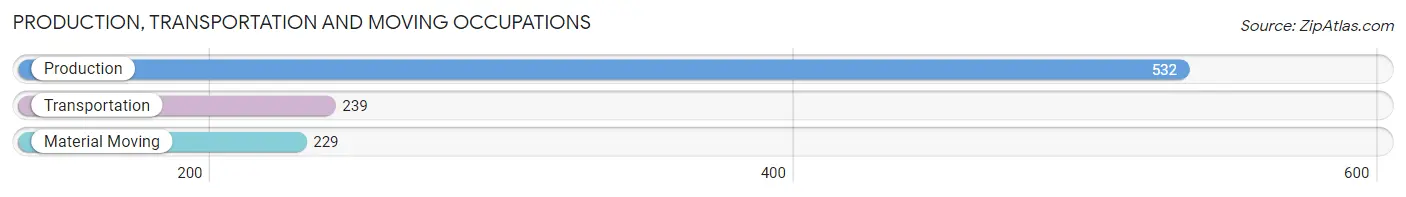
Production, Transportation and Moving Occupations
The most common Production, Transportation and Moving occupations in Oil City are Production (532 | 12.7%), Transportation (239 | 5.7%), and Material Moving (229 | 5.5%).
Production, Transportation and Moving Occupations by Sex
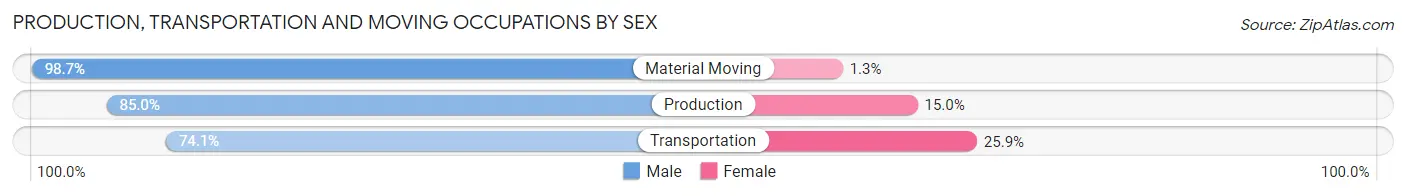
| Occupation | Male | Female |
| Production | 452 (85.0%) | 80 (15.0%) |
| Transportation | 177 (74.1%) | 62 (25.9%) |
| Material Moving | 226 (98.7%) | 3 (1.3%) |
| Total (Category) | 855 (85.5%) | 145 (14.5%) |
| Total (Overall) | 2,306 (55.0%) | 1,883 (45.0%) |
Employment Industries by Sex in Oil City
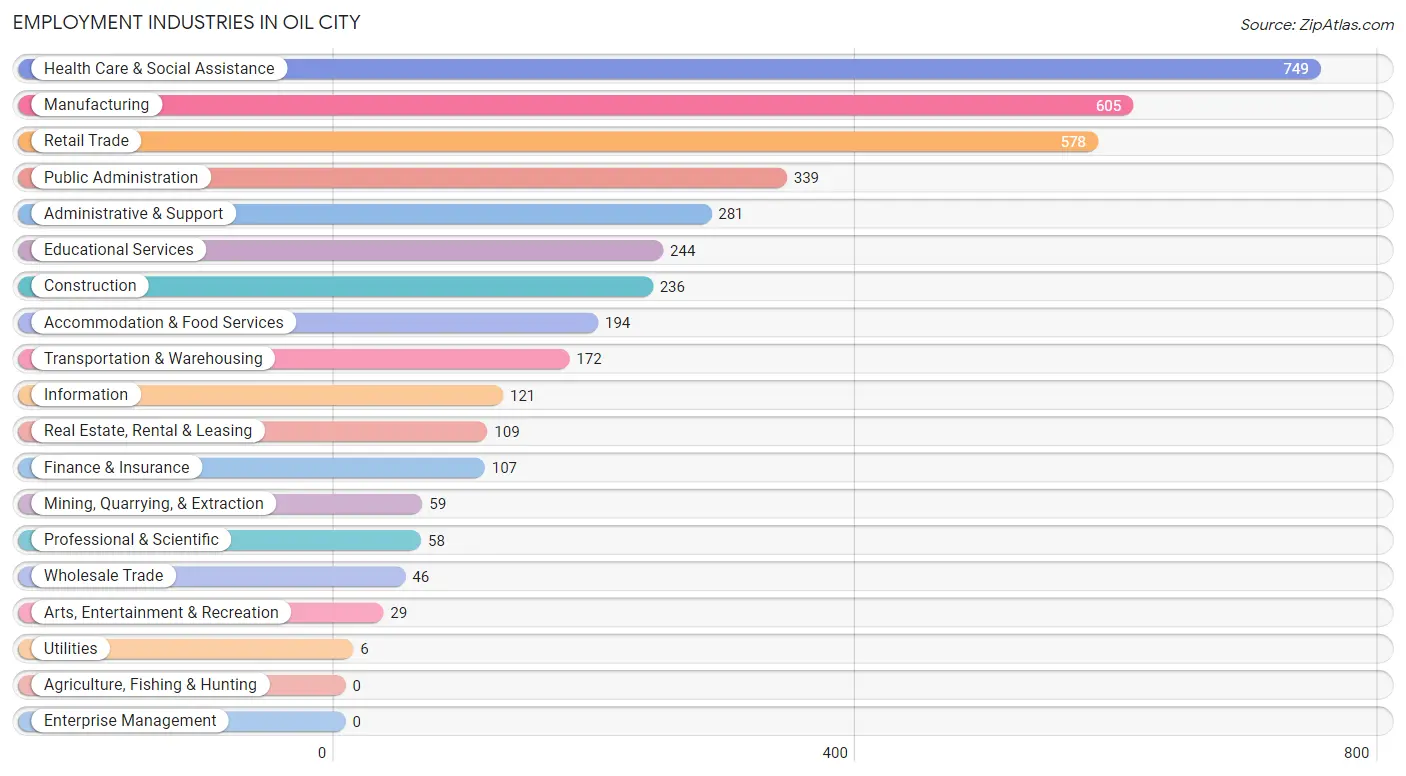
Employment Industries in Oil City
The major employment industries in Oil City include Health Care & Social Assistance (749 | 17.9%), Manufacturing (605 | 14.4%), Retail Trade (578 | 13.8%), Public Administration (339 | 8.1%), and Administrative & Support (281 | 6.7%).
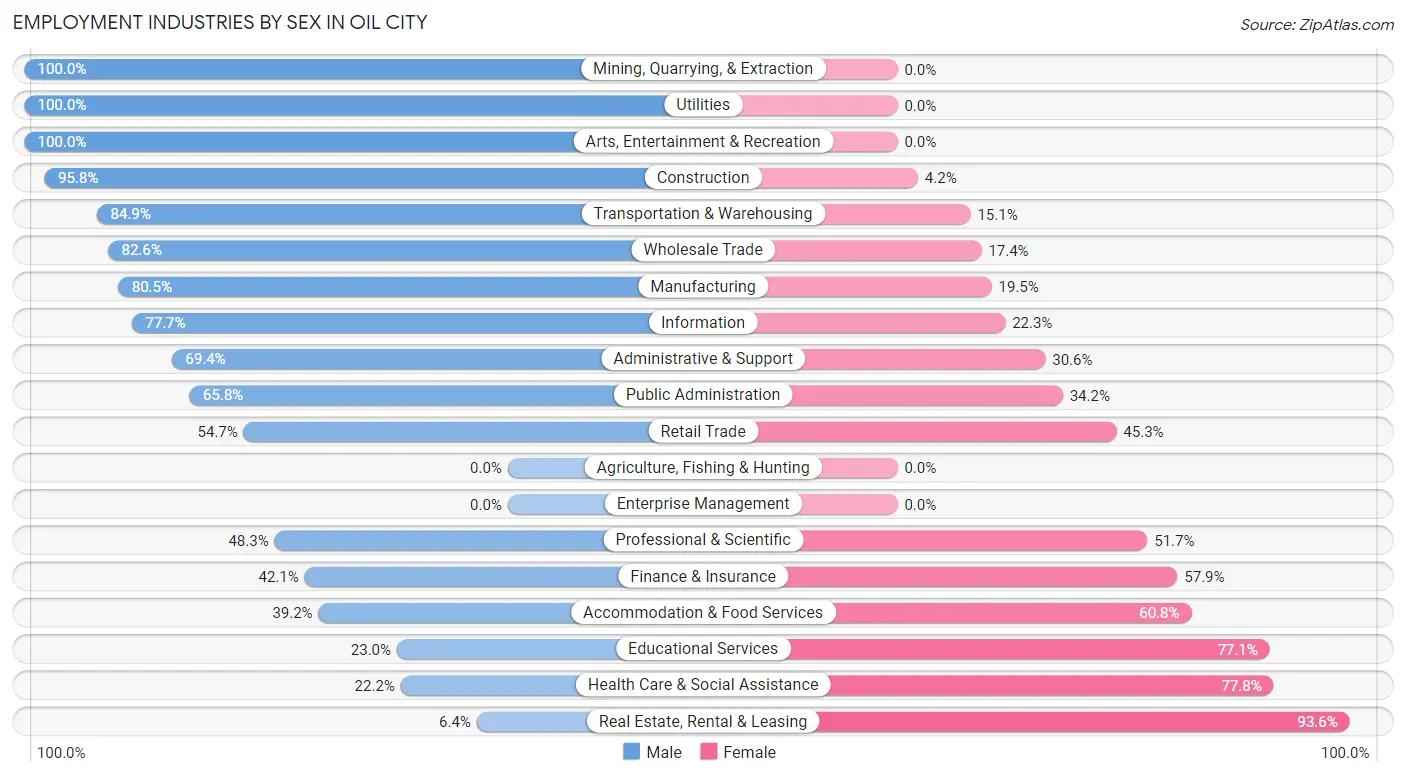
Employment Industries by Sex in Oil City
The Oil City industries that see more men than women are Mining, Quarrying, & Extraction (100.0%), Utilities (100.0%), and Arts, Entertainment & Recreation (100.0%), whereas the industries that tend to have a higher number of women are Real Estate, Rental & Leasing (93.6%), Health Care & Social Assistance (77.8%), and Educational Services (77.0%).
| Industry | Male | Female |
| Agriculture, Fishing & Hunting | 0 (0.0%) | 0 (0.0%) |
| Mining, Quarrying, & Extraction | 59 (100.0%) | 0 (0.0%) |
| Construction | 226 (95.8%) | 10 (4.2%) |
| Manufacturing | 487 (80.5%) | 118 (19.5%) |
| Wholesale Trade | 38 (82.6%) | 8 (17.4%) |
| Retail Trade | 316 (54.7%) | 262 (45.3%) |
| Transportation & Warehousing | 146 (84.9%) | 26 (15.1%) |
| Utilities | 6 (100.0%) | 0 (0.0%) |
| Information | 94 (77.7%) | 27 (22.3%) |
| Finance & Insurance | 45 (42.1%) | 62 (57.9%) |
| Real Estate, Rental & Leasing | 7 (6.4%) | 102 (93.6%) |
| Professional & Scientific | 28 (48.3%) | 30 (51.7%) |
| Enterprise Management | 0 (0.0%) | 0 (0.0%) |
| Administrative & Support | 195 (69.4%) | 86 (30.6%) |
| Educational Services | 56 (23.0%) | 188 (77.0%) |
| Health Care & Social Assistance | 166 (22.2%) | 583 (77.8%) |
| Arts, Entertainment & Recreation | 29 (100.0%) | 0 (0.0%) |
| Accommodation & Food Services | 76 (39.2%) | 118 (60.8%) |
| Public Administration | 223 (65.8%) | 116 (34.2%) |
| Total | 2,306 (55.0%) | 1,883 (45.0%) |
Education in Oil City
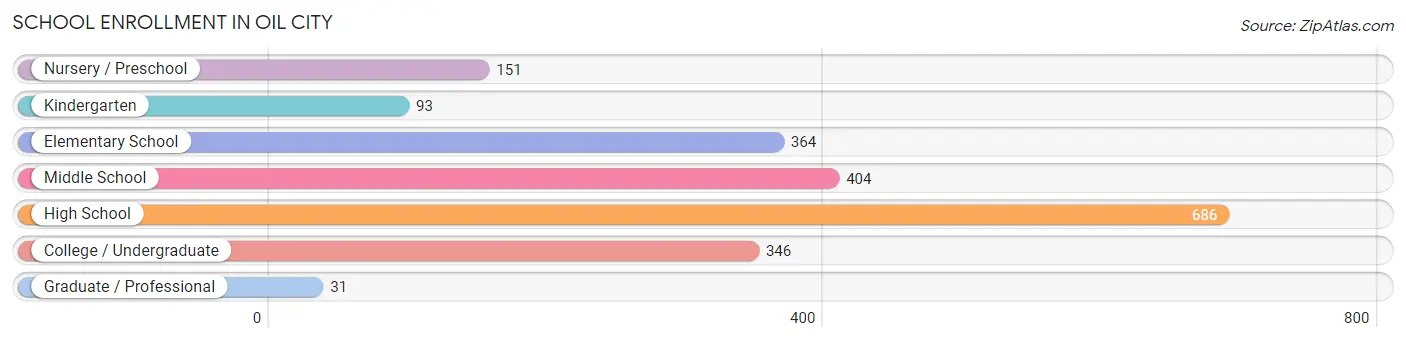
School Enrollment in Oil City
The most common levels of schooling among the 2,075 students in Oil City are high school (686 | 33.1%), middle school (404 | 19.5%), and elementary school (364 | 17.5%).
| School Level | # Students | % Students |
| Nursery / Preschool | 151 | 7.3% |
| Kindergarten | 93 | 4.5% |
| Elementary School | 364 | 17.5% |
| Middle School | 404 | 19.5% |
| High School | 686 | 33.1% |
| College / Undergraduate | 346 | 16.7% |
| Graduate / Professional | 31 | 1.5% |
| Total | 2,075 | 100.0% |
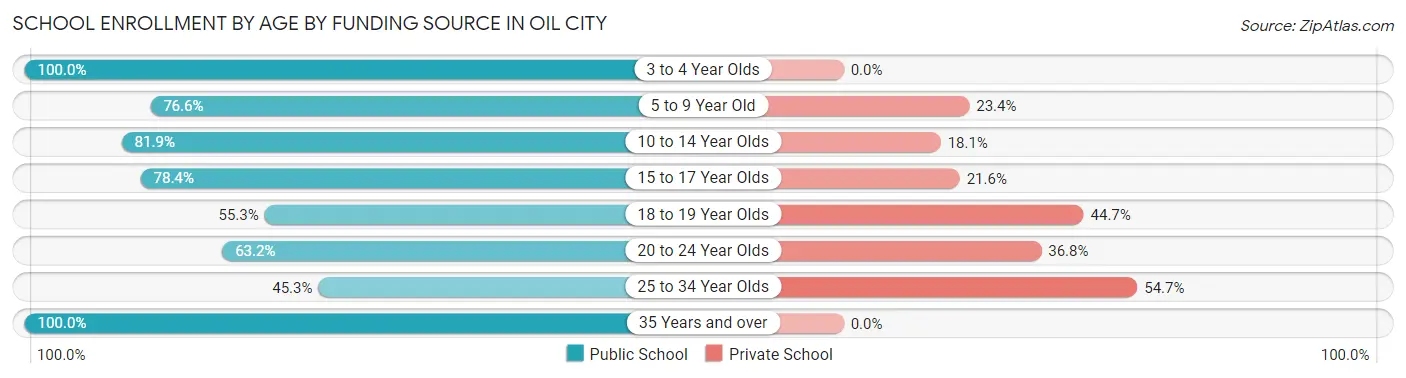
School Enrollment by Age by Funding Source in Oil City
Out of a total of 2,075 students who are enrolled in schools in Oil City, 510 (24.6%) attend a private institution, while the remaining 1,565 (75.4%) are enrolled in public schools. The age group of 25 to 34 year olds has the highest likelihood of being enrolled in private schools, with 64 (54.7% in the age bracket) enrolled. Conversely, the age group of 3 to 4 year olds has the lowest likelihood of being enrolled in a private school, with 80 (100.0% in the age bracket) attending a public institution.
| Age Bracket | Public School | Private School |
| 3 to 4 Year Olds | 80 (100.0%) | 0 (0.0%) |
| 5 to 9 Year Old | 360 (76.6%) | 110 (23.4%) |
| 10 to 14 Year Olds | 449 (81.9%) | 99 (18.1%) |
| 15 to 17 Year Olds | 377 (78.4%) | 104 (21.6%) |
| 18 to 19 Year Olds | 99 (55.3%) | 80 (44.7%) |
| 20 to 24 Year Olds | 91 (63.2%) | 53 (36.8%) |
| 25 to 34 Year Olds | 53 (45.3%) | 64 (54.7%) |
| 35 Years and over | 56 (100.0%) | 0 (0.0%) |
| Total | 1,565 (75.4%) | 510 (24.6%) |
Educational Attainment by Field of Study in Oil City
Education (416 | 28.9%), science & technology (135 | 9.4%), liberal arts & history (134 | 9.3%), business (126 | 8.7%), and psychology (108 | 7.5%) are the most common fields of study among 1,440 individuals in Oil City who have obtained a bachelor's degree or higher.
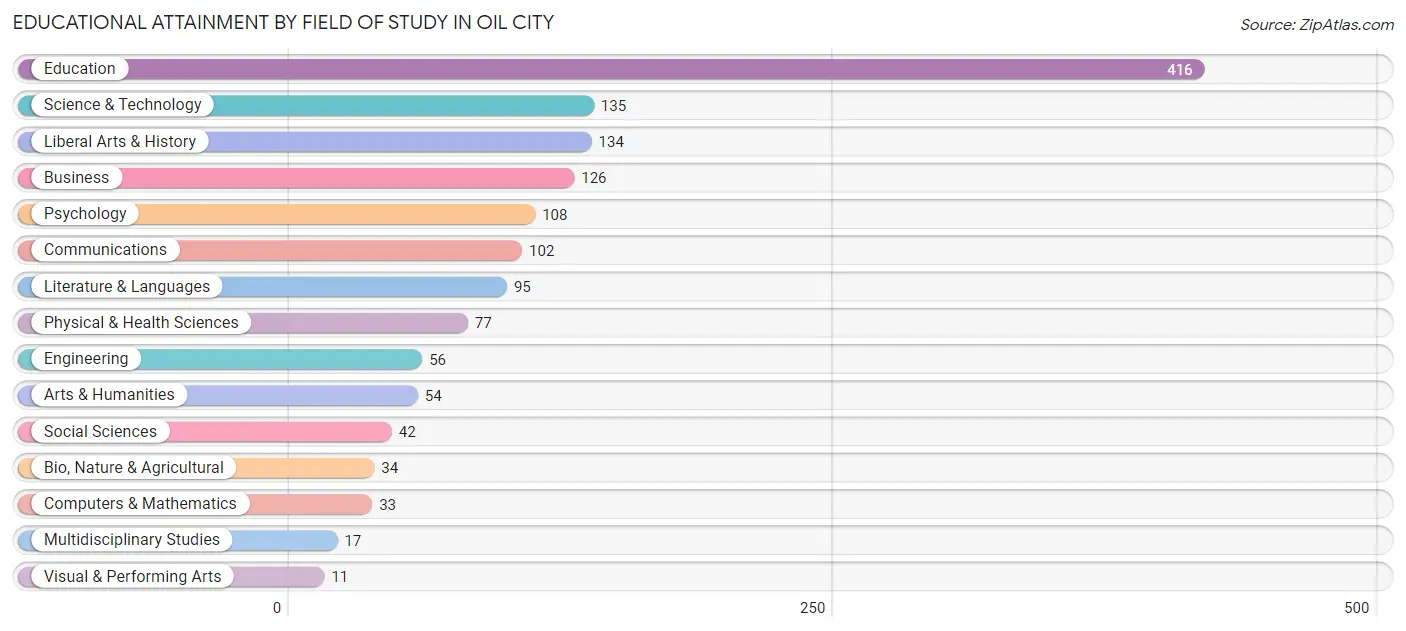
| Field of Study | # Graduates | % Graduates |
| Computers & Mathematics | 33 | 2.3% |
| Bio, Nature & Agricultural | 34 | 2.4% |
| Physical & Health Sciences | 77 | 5.3% |
| Psychology | 108 | 7.5% |
| Social Sciences | 42 | 2.9% |
| Engineering | 56 | 3.9% |
| Multidisciplinary Studies | 17 | 1.2% |
| Science & Technology | 135 | 9.4% |
| Business | 126 | 8.7% |
| Education | 416 | 28.9% |
| Literature & Languages | 95 | 6.6% |
| Liberal Arts & History | 134 | 9.3% |
| Visual & Performing Arts | 11 | 0.8% |
| Communications | 102 | 7.1% |
| Arts & Humanities | 54 | 3.7% |
| Total | 1,440 | 100.0% |
Transportation & Commute in Oil City
Vehicle Availability by Sex in Oil City
The most prevalent vehicle ownership categories in Oil City are males with 2 vehicles (1,046, accounting for 46.8%) and females with 2 vehicles (894, making up 57.6%).
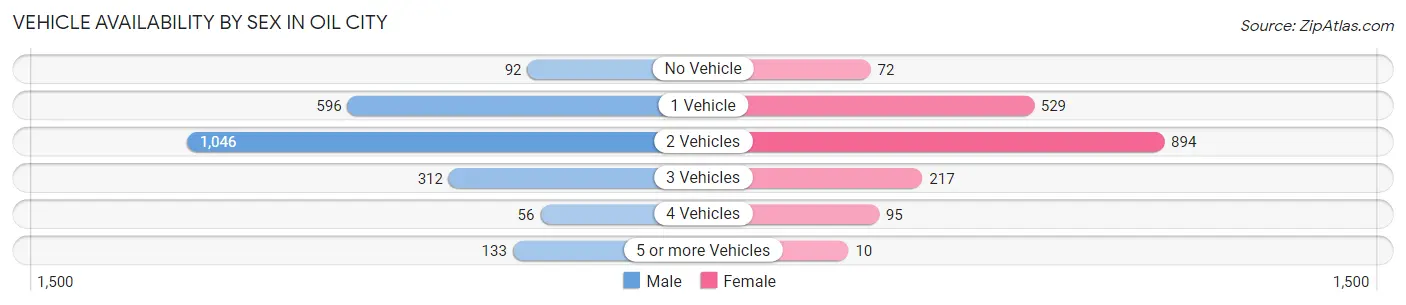
| Vehicles Available | Male | Female |
| No Vehicle | 92 (4.1%) | 72 (4.0%) |
| 1 Vehicle | 596 (26.7%) | 529 (29.1%) |
| 2 Vehicles | 1,046 (46.8%) | 894 (49.2%) |
| 3 Vehicles | 312 (14.0%) | 217 (11.9%) |
| 4 Vehicles | 56 (2.5%) | 95 (5.2%) |
| 5 or more Vehicles | 133 (5.9%) | 10 (0.5%) |
| Total | 2,235 (100.0%) | 1,817 (100.0%) |
Commute Time in Oil City
The most frequently occuring commute durations in Oil City are 10 to 14 minutes (897 commuters, 23.2%), 20 to 24 minutes (675 commuters, 17.4%), and 15 to 19 minutes (619 commuters, 16.0%).
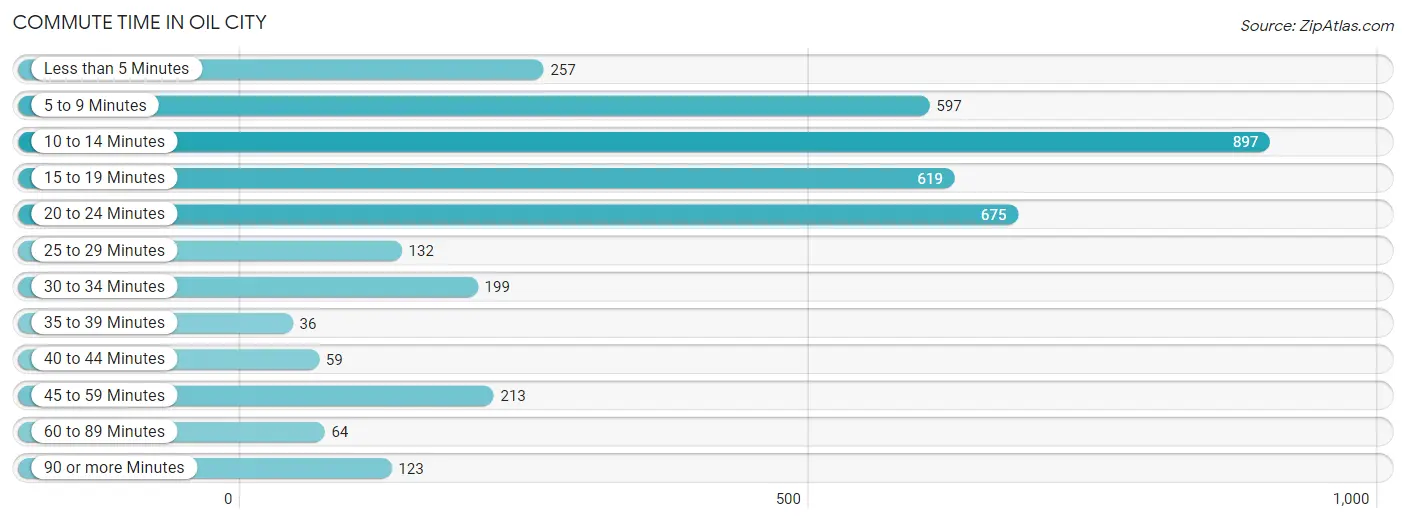
| Commute Time | # Commuters | % Commuters |
| Less than 5 Minutes | 257 | 6.6% |
| 5 to 9 Minutes | 597 | 15.4% |
| 10 to 14 Minutes | 897 | 23.2% |
| 15 to 19 Minutes | 619 | 16.0% |
| 20 to 24 Minutes | 675 | 17.4% |
| 25 to 29 Minutes | 132 | 3.4% |
| 30 to 34 Minutes | 199 | 5.1% |
| 35 to 39 Minutes | 36 | 0.9% |
| 40 to 44 Minutes | 59 | 1.5% |
| 45 to 59 Minutes | 213 | 5.5% |
| 60 to 89 Minutes | 64 | 1.7% |
| 90 or more Minutes | 123 | 3.2% |
Commute Time by Sex in Oil City
The most common commute times in Oil City are 10 to 14 minutes (395 commuters, 18.4%) for males and 10 to 14 minutes (502 commuters, 29.1%) for females.
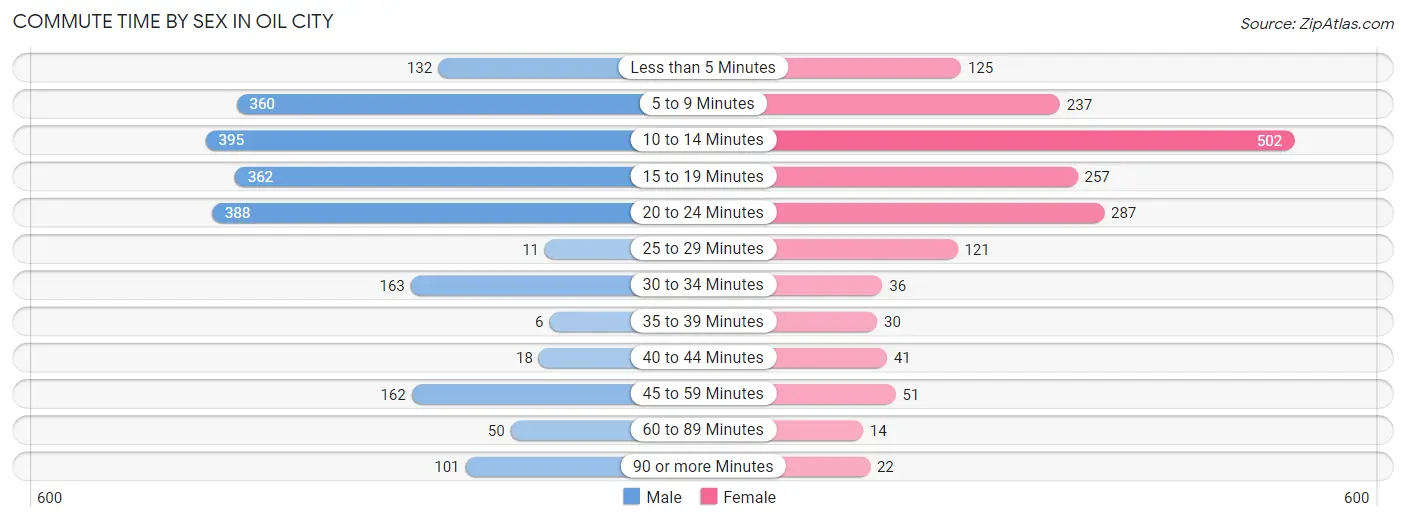
| Commute Time | Male | Female |
| Less than 5 Minutes | 132 (6.1%) | 125 (7.2%) |
| 5 to 9 Minutes | 360 (16.8%) | 237 (13.8%) |
| 10 to 14 Minutes | 395 (18.4%) | 502 (29.1%) |
| 15 to 19 Minutes | 362 (16.9%) | 257 (14.9%) |
| 20 to 24 Minutes | 388 (18.1%) | 287 (16.7%) |
| 25 to 29 Minutes | 11 (0.5%) | 121 (7.0%) |
| 30 to 34 Minutes | 163 (7.6%) | 36 (2.1%) |
| 35 to 39 Minutes | 6 (0.3%) | 30 (1.7%) |
| 40 to 44 Minutes | 18 (0.8%) | 41 (2.4%) |
| 45 to 59 Minutes | 162 (7.5%) | 51 (3.0%) |
| 60 to 89 Minutes | 50 (2.3%) | 14 (0.8%) |
| 90 or more Minutes | 101 (4.7%) | 22 (1.3%) |
Time of Departure to Work by Sex in Oil City
The most frequent times of departure to work in Oil City are 4:00 PM to 11:59 PM (383, 17.8%) for males and 6:00 AM to 6:29 AM (258, 15.0%) for females.
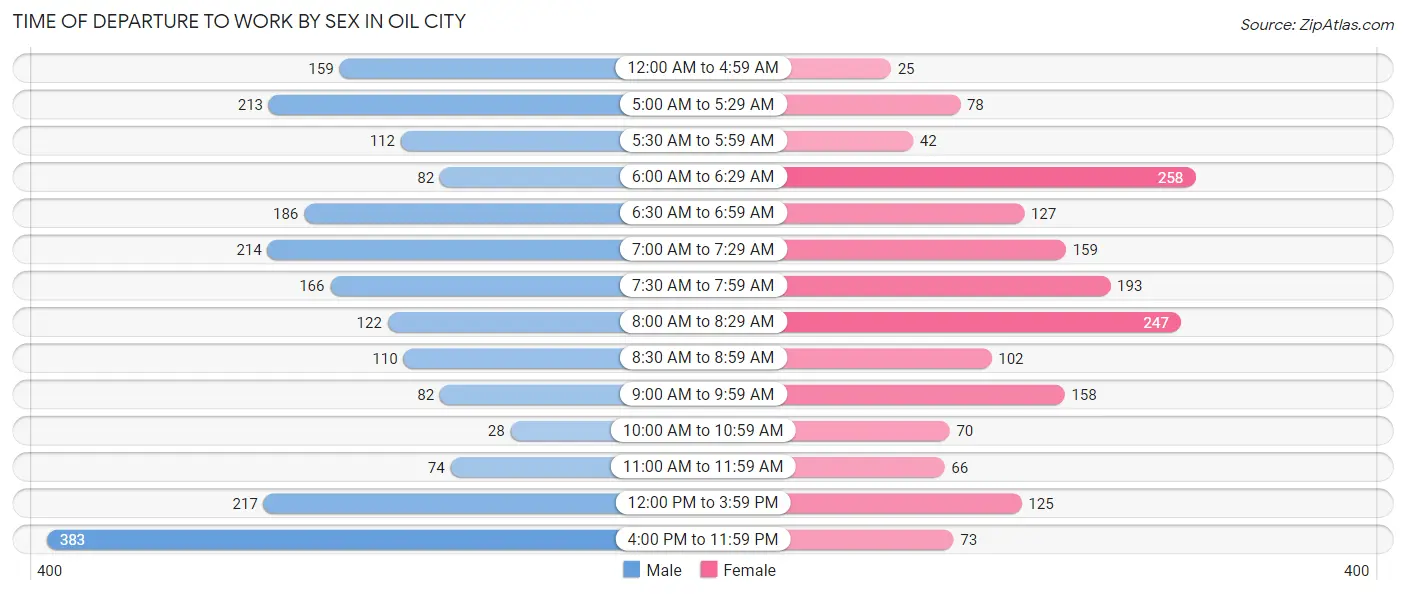
| Time of Departure | Male | Female |
| 12:00 AM to 4:59 AM | 159 (7.4%) | 25 (1.5%) |
| 5:00 AM to 5:29 AM | 213 (9.9%) | 78 (4.5%) |
| 5:30 AM to 5:59 AM | 112 (5.2%) | 42 (2.4%) |
| 6:00 AM to 6:29 AM | 82 (3.8%) | 258 (15.0%) |
| 6:30 AM to 6:59 AM | 186 (8.7%) | 127 (7.4%) |
| 7:00 AM to 7:29 AM | 214 (10.0%) | 159 (9.2%) |
| 7:30 AM to 7:59 AM | 166 (7.7%) | 193 (11.2%) |
| 8:00 AM to 8:29 AM | 122 (5.7%) | 247 (14.3%) |
| 8:30 AM to 8:59 AM | 110 (5.1%) | 102 (5.9%) |
| 9:00 AM to 9:59 AM | 82 (3.8%) | 158 (9.2%) |
| 10:00 AM to 10:59 AM | 28 (1.3%) | 70 (4.1%) |
| 11:00 AM to 11:59 AM | 74 (3.5%) | 66 (3.8%) |
| 12:00 PM to 3:59 PM | 217 (10.1%) | 125 (7.2%) |
| 4:00 PM to 11:59 PM | 383 (17.8%) | 73 (4.2%) |
| Total | 2,148 (100.0%) | 1,723 (100.0%) |
Housing Occupancy in Oil City
Occupancy by Ownership in Oil City
Of the total 4,054 dwellings in Oil City, owner-occupied units account for 2,498 (61.6%), while renter-occupied units make up 1,556 (38.4%).
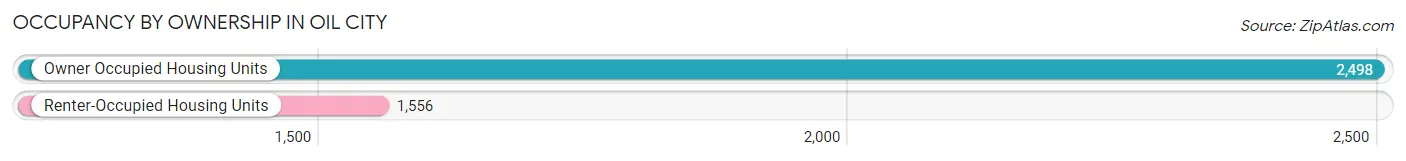
| Occupancy | # Housing Units | % Housing Units |
| Owner Occupied Housing Units | 2,498 | 61.6% |
| Renter-Occupied Housing Units | 1,556 | 38.4% |
| Total Occupied Housing Units | 4,054 | 100.0% |
Occupancy by Household Size in Oil City
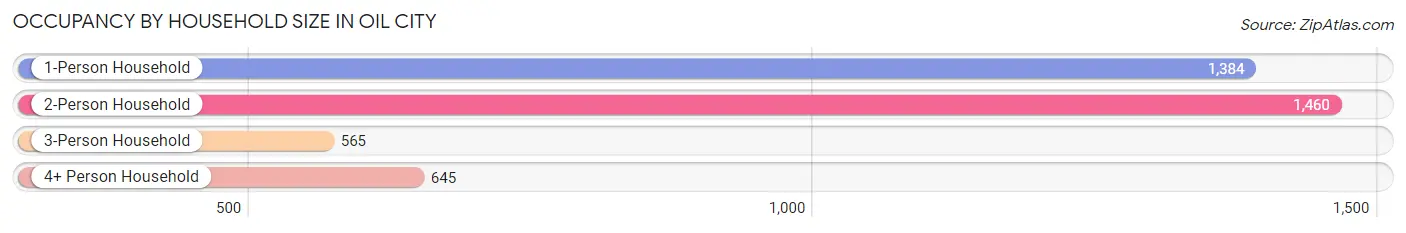
| Household Size | # Housing Units | % Housing Units |
| 1-Person Household | 1,384 | 34.1% |
| 2-Person Household | 1,460 | 36.0% |
| 3-Person Household | 565 | 13.9% |
| 4+ Person Household | 645 | 15.9% |
| Total Housing Units | 4,054 | 100.0% |
Occupancy by Ownership by Household Size in Oil City
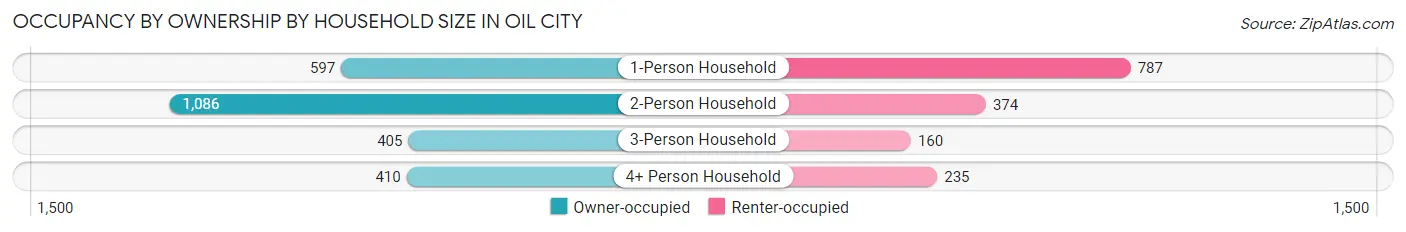
| Household Size | Owner-occupied | Renter-occupied |
| 1-Person Household | 597 (43.1%) | 787 (56.9%) |
| 2-Person Household | 1,086 (74.4%) | 374 (25.6%) |
| 3-Person Household | 405 (71.7%) | 160 (28.3%) |
| 4+ Person Household | 410 (63.6%) | 235 (36.4%) |
| Total Housing Units | 2,498 (61.6%) | 1,556 (38.4%) |
Occupancy by Educational Attainment in Oil City
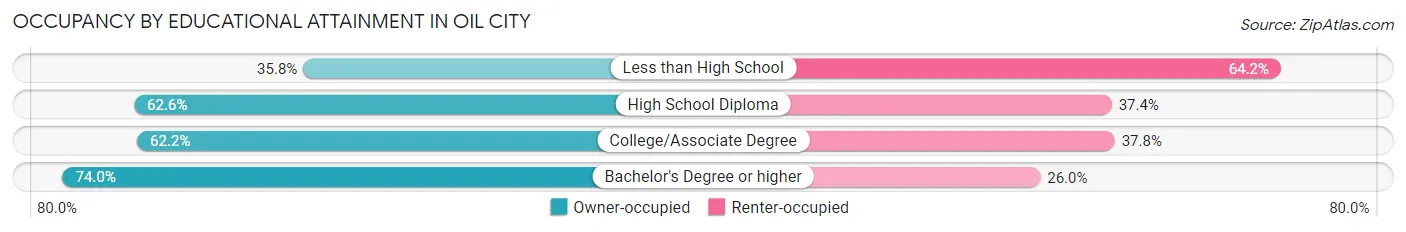
| Household Size | Owner-occupied | Renter-occupied |
| Less than High School | 173 (35.8%) | 310 (64.2%) |
| High School Diploma | 1,078 (62.6%) | 643 (37.4%) |
| College/Associate Degree | 639 (62.2%) | 389 (37.8%) |
| Bachelor's Degree or higher | 608 (74.0%) | 214 (26.0%) |
Occupancy by Age of Householder in Oil City
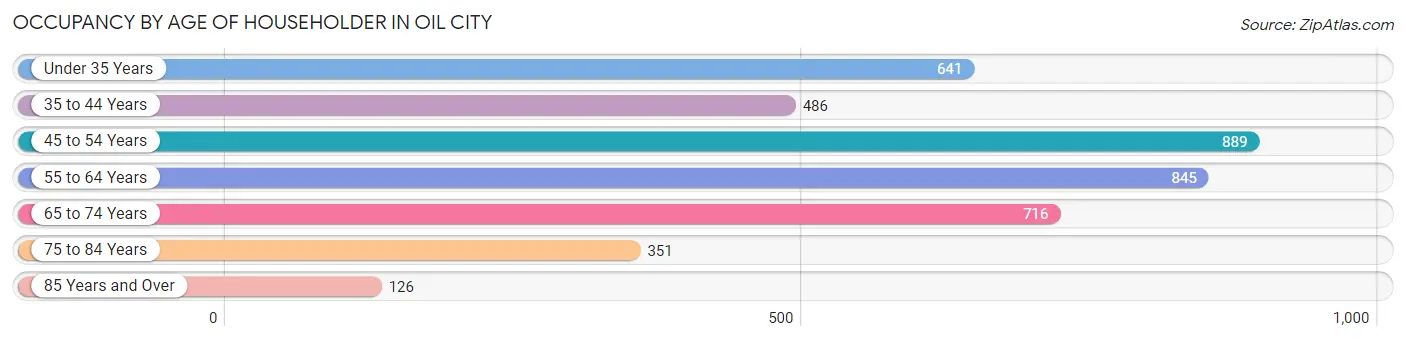
| Age Bracket | # Households | % Households |
| Under 35 Years | 641 | 15.8% |
| 35 to 44 Years | 486 | 12.0% |
| 45 to 54 Years | 889 | 21.9% |
| 55 to 64 Years | 845 | 20.8% |
| 65 to 74 Years | 716 | 17.7% |
| 75 to 84 Years | 351 | 8.7% |
| 85 Years and Over | 126 | 3.1% |
| Total | 4,054 | 100.0% |
Housing Finances in Oil City
Median Income by Occupancy in Oil City
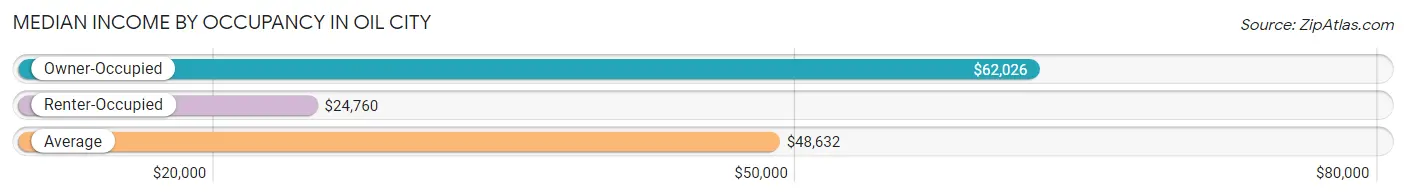
| Occupancy Type | # Households | Median Income |
| Owner-Occupied | 2,498 (61.6%) | $62,026 |
| Renter-Occupied | 1,556 (38.4%) | $24,760 |
| Average | 4,054 (100.0%) | $48,632 |
Occupancy by Householder Income Bracket in Oil City
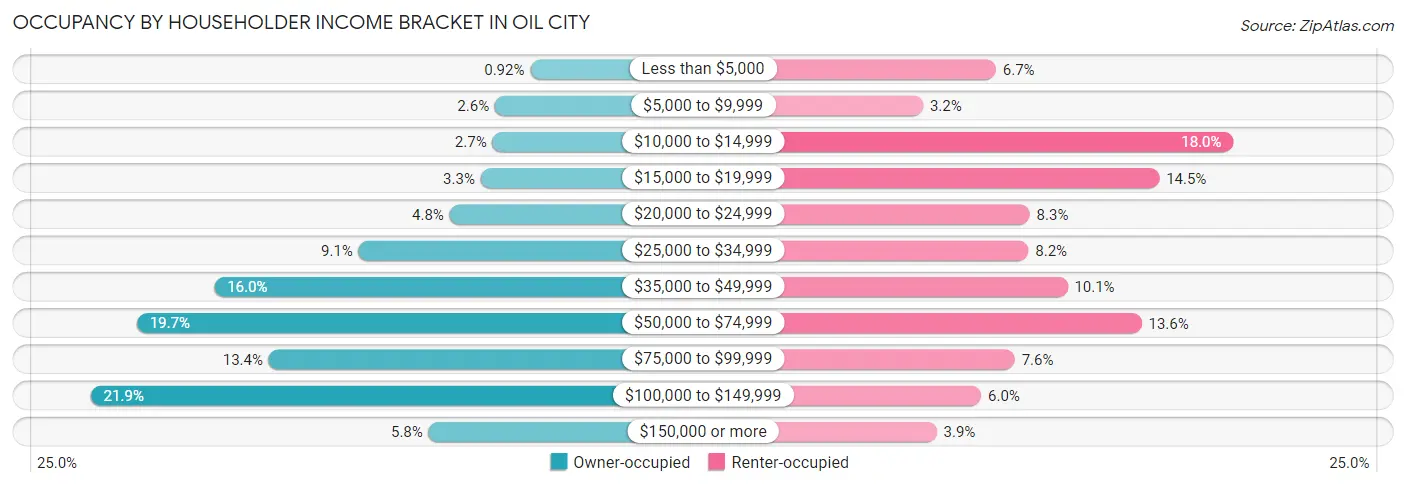
| Income Bracket | Owner-occupied | Renter-occupied |
| Less than $5,000 | 23 (0.9%) | 104 (6.7%) |
| $5,000 to $9,999 | 65 (2.6%) | 50 (3.2%) |
| $10,000 to $14,999 | 68 (2.7%) | 280 (18.0%) |
| $15,000 to $19,999 | 82 (3.3%) | 225 (14.5%) |
| $20,000 to $24,999 | 119 (4.8%) | 129 (8.3%) |
| $25,000 to $34,999 | 227 (9.1%) | 128 (8.2%) |
| $35,000 to $49,999 | 399 (16.0%) | 157 (10.1%) |
| $50,000 to $74,999 | 491 (19.7%) | 212 (13.6%) |
| $75,000 to $99,999 | 334 (13.4%) | 118 (7.6%) |
| $100,000 to $149,999 | 546 (21.9%) | 93 (6.0%) |
| $150,000 or more | 144 (5.8%) | 60 (3.9%) |
| Total | 2,498 (100.0%) | 1,556 (100.0%) |
Monthly Housing Cost Tiers in Oil City
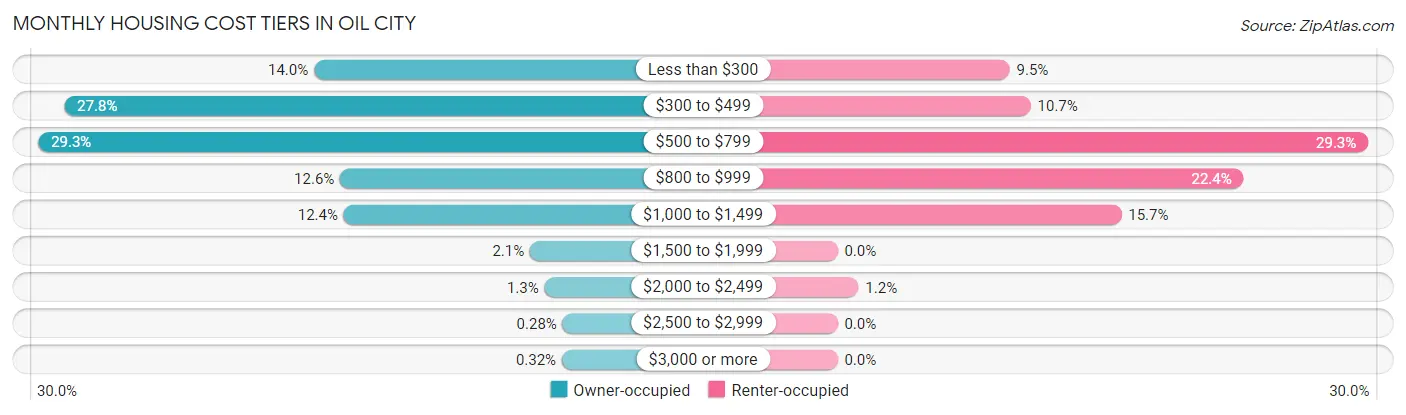
| Monthly Cost | Owner-occupied | Renter-occupied |
| Less than $300 | 350 (14.0%) | 148 (9.5%) |
| $300 to $499 | 695 (27.8%) | 166 (10.7%) |
| $500 to $799 | 731 (29.3%) | 456 (29.3%) |
| $800 to $999 | 314 (12.6%) | 349 (22.4%) |
| $1,000 to $1,499 | 309 (12.4%) | 244 (15.7%) |
| $1,500 to $1,999 | 52 (2.1%) | 0 (0.0%) |
| $2,000 to $2,499 | 32 (1.3%) | 18 (1.2%) |
| $2,500 to $2,999 | 7 (0.3%) | 0 (0.0%) |
| $3,000 or more | 8 (0.3%) | 0 (0.0%) |
| Total | 2,498 (100.0%) | 1,556 (100.0%) |
Physical Housing Characteristics in Oil City
Housing Structures in Oil City
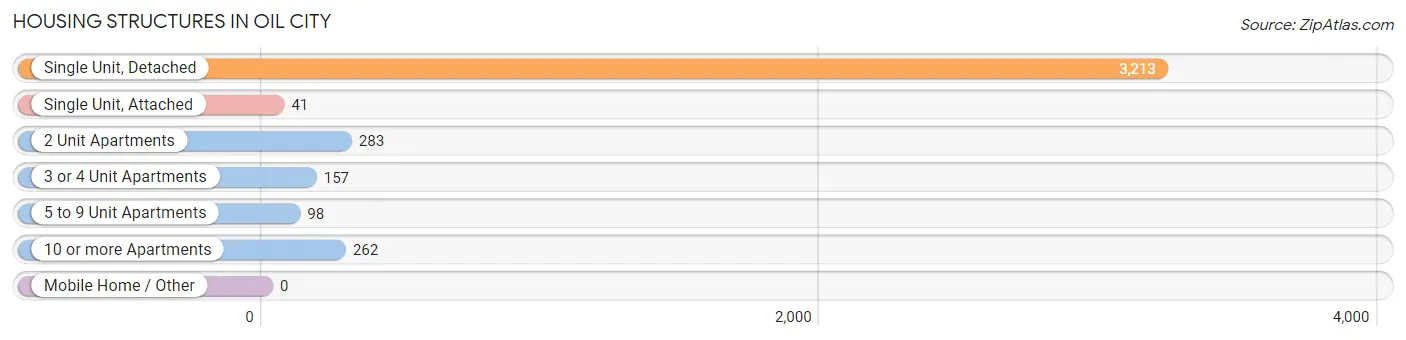
| Structure Type | # Housing Units | % Housing Units |
| Single Unit, Detached | 3,213 | 79.3% |
| Single Unit, Attached | 41 | 1.0% |
| 2 Unit Apartments | 283 | 7.0% |
| 3 or 4 Unit Apartments | 157 | 3.9% |
| 5 to 9 Unit Apartments | 98 | 2.4% |
| 10 or more Apartments | 262 | 6.5% |
| Mobile Home / Other | 0 | 0.0% |
| Total | 4,054 | 100.0% |
Housing Structures by Occupancy in Oil City
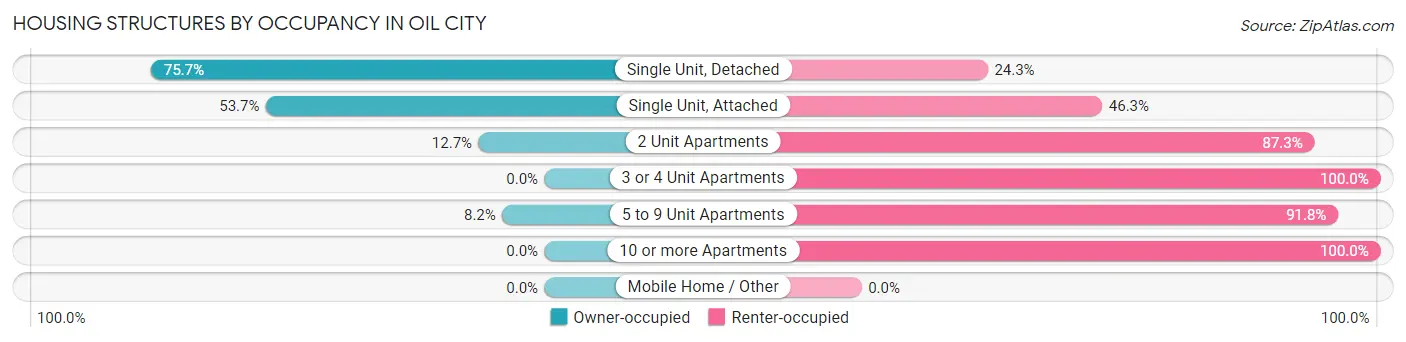
| Structure Type | Owner-occupied | Renter-occupied |
| Single Unit, Detached | 2,432 (75.7%) | 781 (24.3%) |
| Single Unit, Attached | 22 (53.7%) | 19 (46.3%) |
| 2 Unit Apartments | 36 (12.7%) | 247 (87.3%) |
| 3 or 4 Unit Apartments | 0 (0.0%) | 157 (100.0%) |
| 5 to 9 Unit Apartments | 8 (8.2%) | 90 (91.8%) |
| 10 or more Apartments | 0 (0.0%) | 262 (100.0%) |
| Mobile Home / Other | 0 (0.0%) | 0 (0.0%) |
| Total | 2,498 (61.6%) | 1,556 (38.4%) |
Housing Structures by Number of Rooms in Oil City
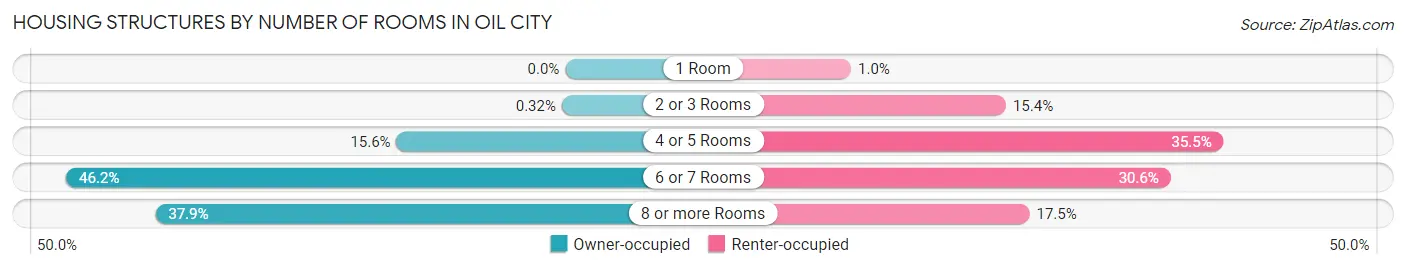
| Number of Rooms | Owner-occupied | Renter-occupied |
| 1 Room | 0 (0.0%) | 16 (1.0%) |
| 2 or 3 Rooms | 8 (0.3%) | 239 (15.4%) |
| 4 or 5 Rooms | 390 (15.6%) | 552 (35.5%) |
| 6 or 7 Rooms | 1,153 (46.2%) | 476 (30.6%) |
| 8 or more Rooms | 947 (37.9%) | 273 (17.5%) |
| Total | 2,498 (100.0%) | 1,556 (100.0%) |
Housing Structure by Heating Type in Oil City
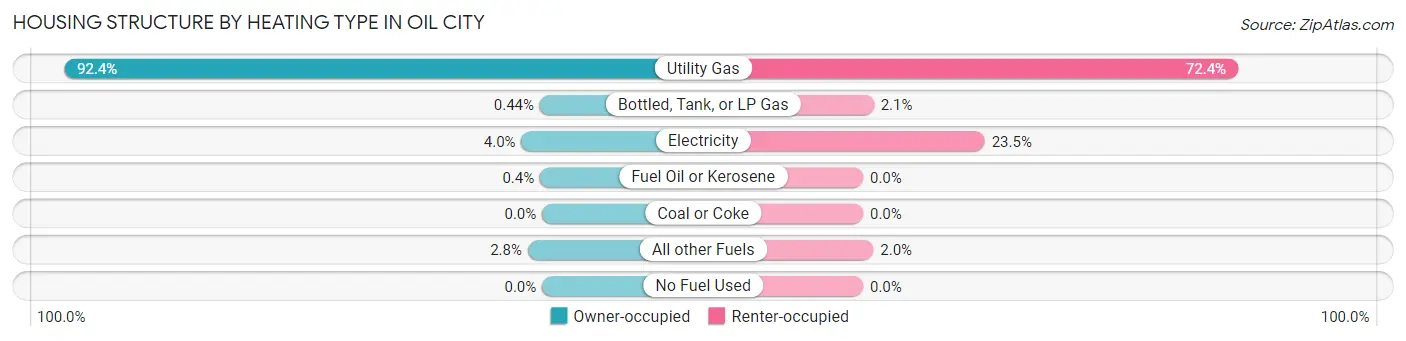
| Heating Type | Owner-occupied | Renter-occupied |
| Utility Gas | 2,308 (92.4%) | 1,127 (72.4%) |
| Bottled, Tank, or LP Gas | 11 (0.4%) | 32 (2.1%) |
| Electricity | 100 (4.0%) | 366 (23.5%) |
| Fuel Oil or Kerosene | 10 (0.4%) | 0 (0.0%) |
| Coal or Coke | 0 (0.0%) | 0 (0.0%) |
| All other Fuels | 69 (2.8%) | 31 (2.0%) |
| No Fuel Used | 0 (0.0%) | 0 (0.0%) |
| Total | 2,498 (100.0%) | 1,556 (100.0%) |
Household Vehicle Usage in Oil City
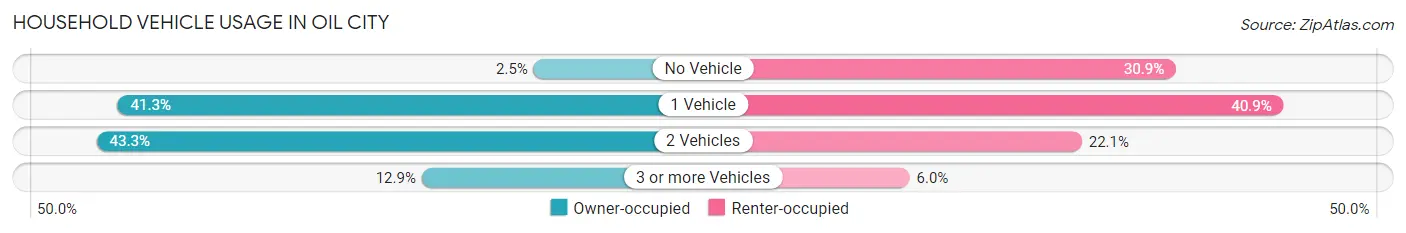
| Vehicles per Household | Owner-occupied | Renter-occupied |
| No Vehicle | 62 (2.5%) | 481 (30.9%) |
| 1 Vehicle | 1,032 (41.3%) | 637 (40.9%) |
| 2 Vehicles | 1,081 (43.3%) | 344 (22.1%) |
| 3 or more Vehicles | 323 (12.9%) | 94 (6.0%) |
| Total | 2,498 (100.0%) | 1,556 (100.0%) |
Real Estate & Mortgages in Oil City
Real Estate and Mortgage Overview in Oil City
| Characteristic | Without Mortgage | With Mortgage |
| Housing Units | 1,619 | 879 |
| Median Property Value | $56,000 | $72,000 |
| Median Household Income | $53,691 | $45 |
| Monthly Housing Costs | $438 | $8 |
| Real Estate Taxes | $985 | $36 |
Property Value by Mortgage Status in Oil City
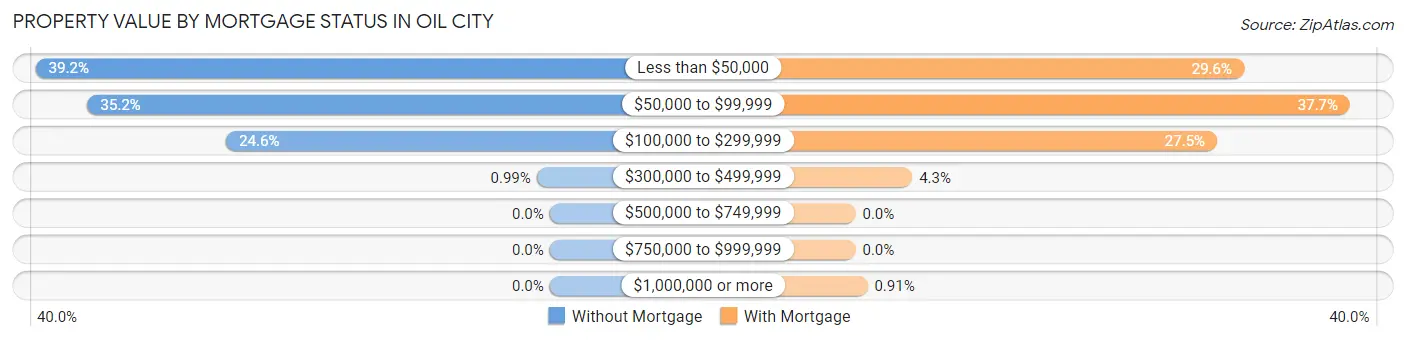
| Property Value | Without Mortgage | With Mortgage |
| Less than $50,000 | 634 (39.2%) | 260 (29.6%) |
| $50,000 to $99,999 | 570 (35.2%) | 331 (37.7%) |
| $100,000 to $299,999 | 399 (24.6%) | 242 (27.5%) |
| $300,000 to $499,999 | 16 (1.0%) | 38 (4.3%) |
| $500,000 to $749,999 | 0 (0.0%) | 0 (0.0%) |
| $750,000 to $999,999 | 0 (0.0%) | 0 (0.0%) |
| $1,000,000 or more | 0 (0.0%) | 8 (0.9%) |
| Total | 1,619 (100.0%) | 879 (100.0%) |
Household Income by Mortgage Status in Oil City
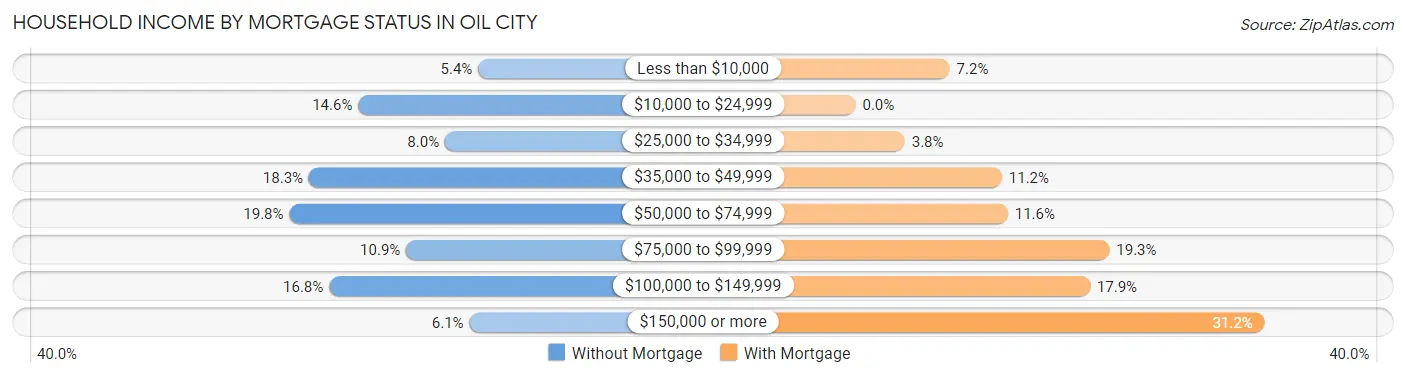
| Household Income | Without Mortgage | With Mortgage |
| Less than $10,000 | 88 (5.4%) | 63 (7.2%) |
| $10,000 to $24,999 | 236 (14.6%) | 0 (0.0%) |
| $25,000 to $34,999 | 129 (8.0%) | 33 (3.7%) |
| $35,000 to $49,999 | 297 (18.3%) | 98 (11.2%) |
| $50,000 to $74,999 | 321 (19.8%) | 102 (11.6%) |
| $75,000 to $99,999 | 177 (10.9%) | 170 (19.3%) |
| $100,000 to $149,999 | 272 (16.8%) | 157 (17.9%) |
| $150,000 or more | 99 (6.1%) | 274 (31.2%) |
| Total | 1,619 (100.0%) | 879 (100.0%) |
Property Value to Household Income Ratio in Oil City
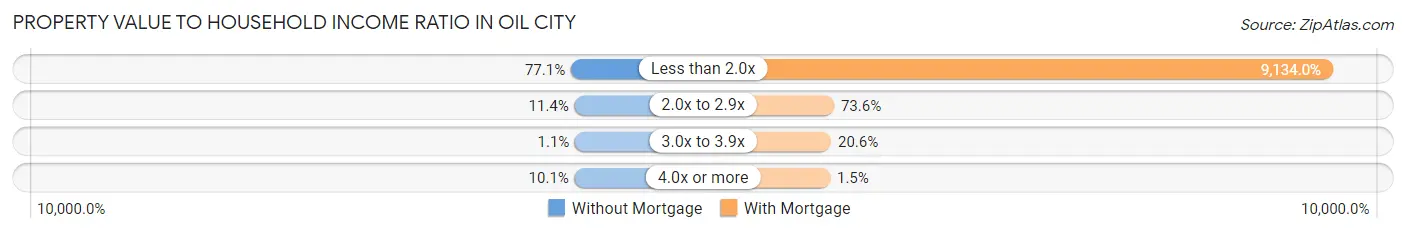
| Value-to-Income Ratio | Without Mortgage | With Mortgage |
| Less than 2.0x | 1,248 (77.1%) | 80,288 (9,134.0%) |
| 2.0x to 2.9x | 184 (11.4%) | 647 (73.6%) |
| 3.0x to 3.9x | 18 (1.1%) | 181 (20.6%) |
| 4.0x or more | 164 (10.1%) | 13 (1.5%) |
| Total | 1,619 (100.0%) | 879 (100.0%) |
Real Estate Taxes by Mortgage Status in Oil City
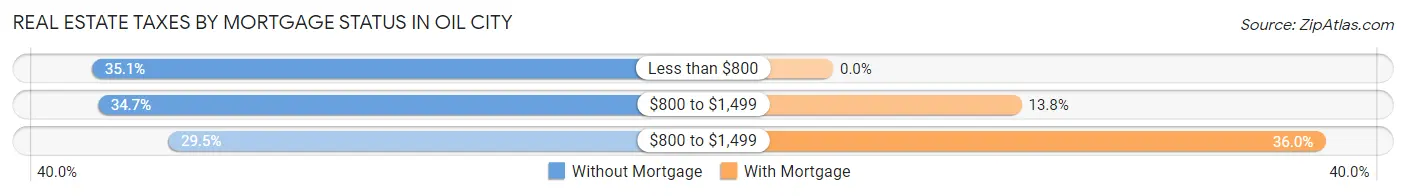
| Property Taxes | Without Mortgage | With Mortgage |
| Less than $800 | 568 (35.1%) | 0 (0.0%) |
| $800 to $1,499 | 561 (34.6%) | 121 (13.8%) |
| $800 to $1,499 | 478 (29.5%) | 316 (35.9%) |
| Total | 1,619 (100.0%) | 879 (100.0%) |
Health & Disability in Oil City
Health Insurance Coverage by Age in Oil City
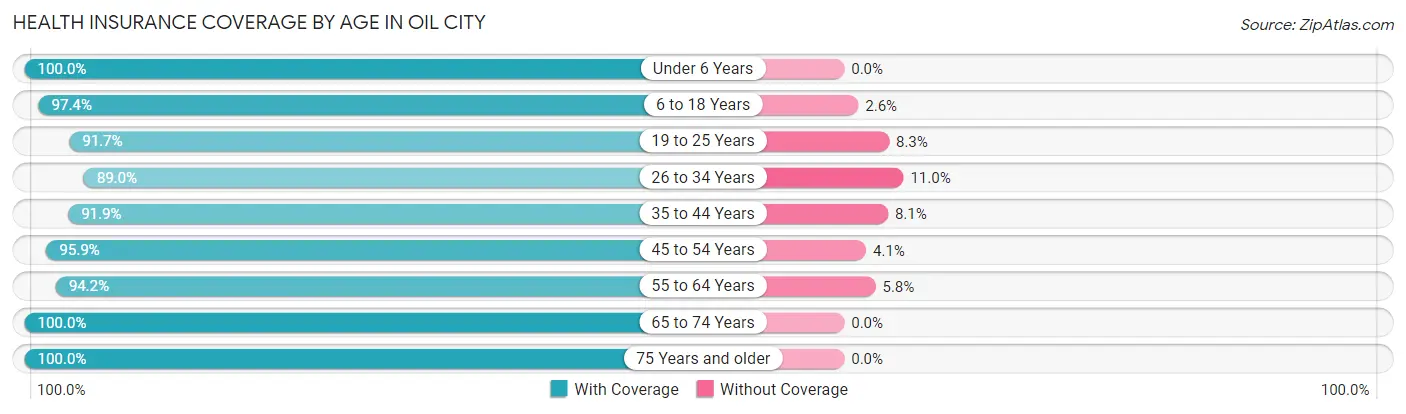
| Age Bracket | With Coverage | Without Coverage |
| Under 6 Years | 471 (100.0%) | 0 (0.0%) |
| 6 to 18 Years | 1,526 (97.4%) | 41 (2.6%) |
| 19 to 25 Years | 846 (91.7%) | 77 (8.3%) |
| 26 to 34 Years | 741 (89.0%) | 92 (11.0%) |
| 35 to 44 Years | 1,163 (91.9%) | 103 (8.1%) |
| 45 to 54 Years | 1,226 (95.9%) | 52 (4.1%) |
| 55 to 64 Years | 1,259 (94.2%) | 78 (5.8%) |
| 65 to 74 Years | 1,067 (100.0%) | 0 (0.0%) |
| 75 Years and older | 741 (100.0%) | 0 (0.0%) |
| Total | 9,040 (95.3%) | 443 (4.7%) |
Health Insurance Coverage by Citizenship Status in Oil City
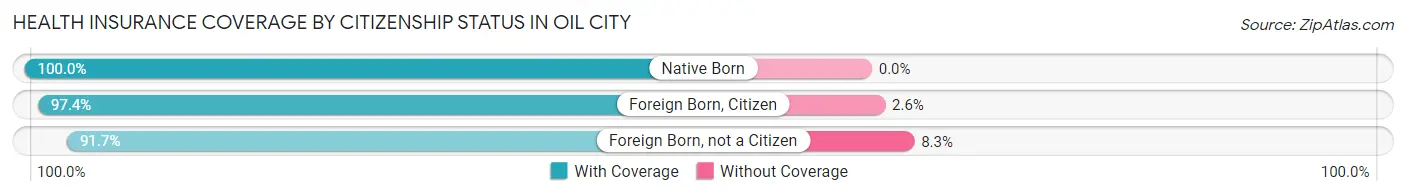
| Citizenship Status | With Coverage | Without Coverage |
| Native Born | 471 (100.0%) | 0 (0.0%) |
| Foreign Born, Citizen | 1,526 (97.4%) | 41 (2.6%) |
| Foreign Born, not a Citizen | 846 (91.7%) | 77 (8.3%) |
Health Insurance Coverage by Household Income in Oil City
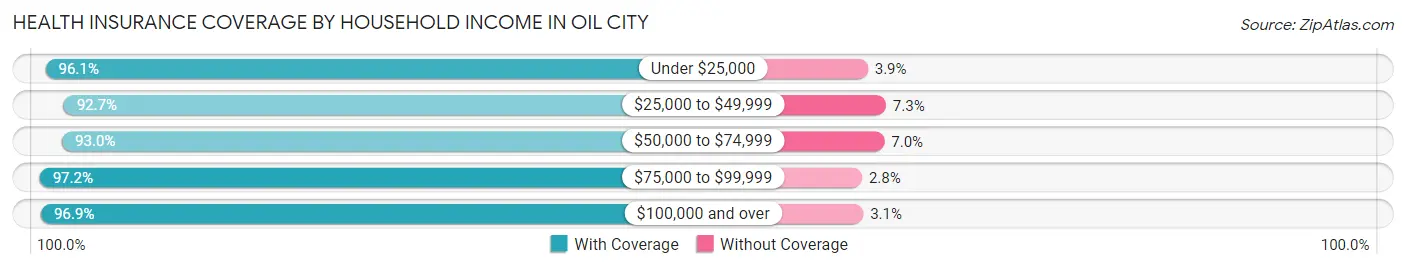
| Household Income | With Coverage | Without Coverage |
| Under $25,000 | 1,614 (96.1%) | 66 (3.9%) |
| $25,000 to $49,999 | 1,505 (92.7%) | 119 (7.3%) |
| $50,000 to $74,999 | 1,809 (93.0%) | 137 (7.0%) |
| $75,000 to $99,999 | 1,301 (97.2%) | 38 (2.8%) |
| $100,000 and over | 2,614 (96.9%) | 83 (3.1%) |
Public vs Private Health Insurance Coverage by Age in Oil City
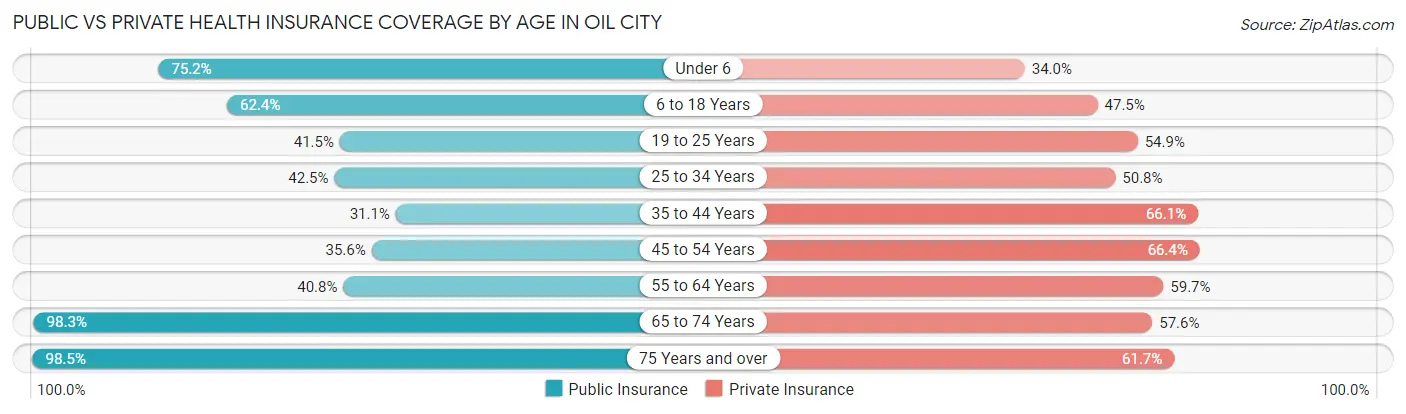
| Age Bracket | Public Insurance | Private Insurance |
| Under 6 | 354 (75.2%) | 160 (34.0%) |
| 6 to 18 Years | 978 (62.4%) | 744 (47.5%) |
| 19 to 25 Years | 383 (41.5%) | 507 (54.9%) |
| 25 to 34 Years | 354 (42.5%) | 423 (50.8%) |
| 35 to 44 Years | 394 (31.1%) | 837 (66.1%) |
| 45 to 54 Years | 455 (35.6%) | 849 (66.4%) |
| 55 to 64 Years | 546 (40.8%) | 798 (59.7%) |
| 65 to 74 Years | 1,049 (98.3%) | 615 (57.6%) |
| 75 Years and over | 730 (98.5%) | 457 (61.7%) |
| Total | 5,243 (55.3%) | 5,390 (56.8%) |
Disability Status by Sex by Age in Oil City
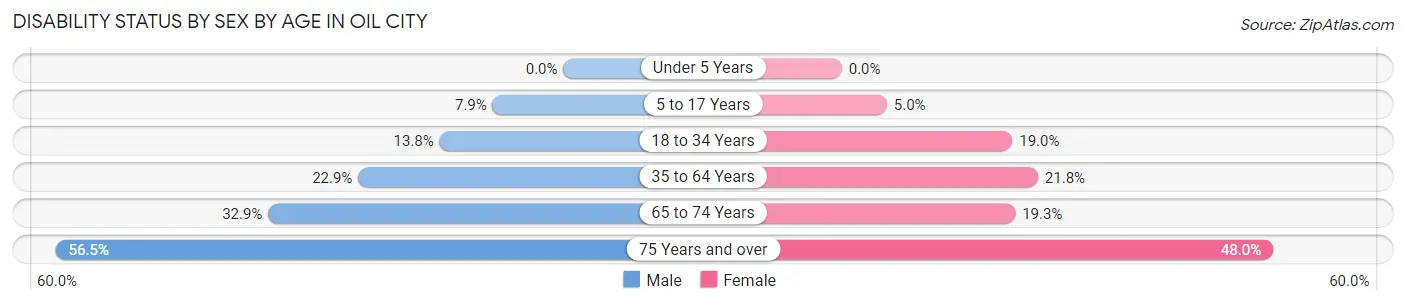
| Age Bracket | Male | Female |
| Under 5 Years | 0 (0.0%) | 0 (0.0%) |
| 5 to 17 Years | 63 (7.9%) | 35 (5.0%) |
| 18 to 34 Years | 152 (13.8%) | 151 (19.0%) |
| 35 to 64 Years | 417 (22.9%) | 449 (21.8%) |
| 65 to 74 Years | 189 (32.9%) | 95 (19.3%) |
| 75 Years and over | 160 (56.5%) | 220 (48.0%) |
Disability Class by Sex by Age in Oil City
Disability Class: Hearing Difficulty
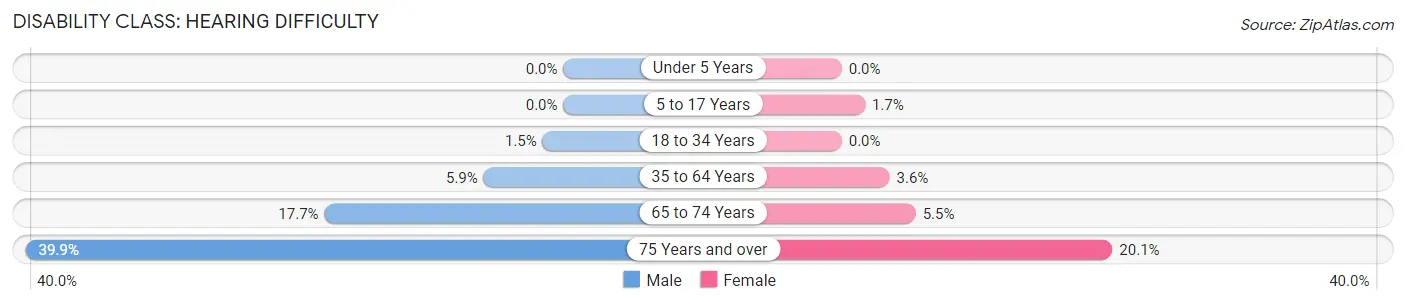
| Age Bracket | Male | Female |
| Under 5 Years | 0 (0.0%) | 0 (0.0%) |
| 5 to 17 Years | 0 (0.0%) | 12 (1.7%) |
| 18 to 34 Years | 17 (1.5%) | 0 (0.0%) |
| 35 to 64 Years | 108 (5.9%) | 73 (3.5%) |
| 65 to 74 Years | 102 (17.7%) | 27 (5.5%) |
| 75 Years and over | 113 (39.9%) | 92 (20.1%) |
Disability Class: Vision Difficulty
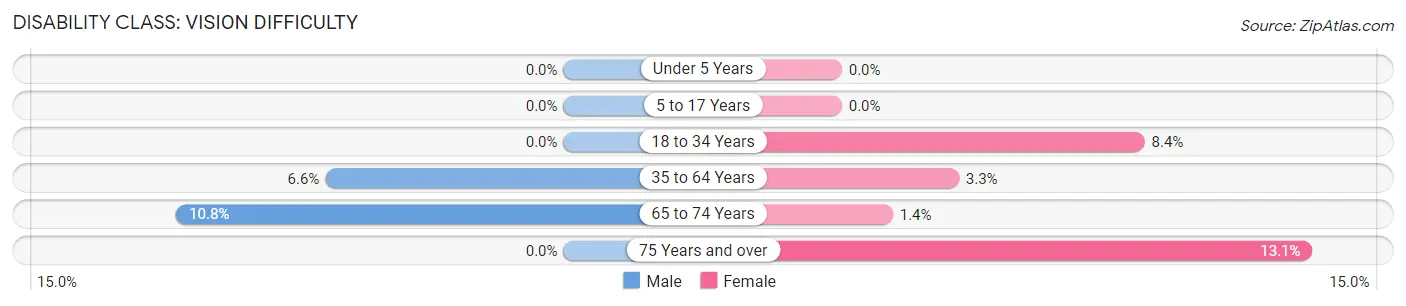
| Age Bracket | Male | Female |
| Under 5 Years | 0 (0.0%) | 0 (0.0%) |
| 5 to 17 Years | 0 (0.0%) | 0 (0.0%) |
| 18 to 34 Years | 0 (0.0%) | 67 (8.4%) |
| 35 to 64 Years | 121 (6.6%) | 67 (3.3%) |
| 65 to 74 Years | 62 (10.8%) | 7 (1.4%) |
| 75 Years and over | 0 (0.0%) | 60 (13.1%) |
Disability Class: Cognitive Difficulty
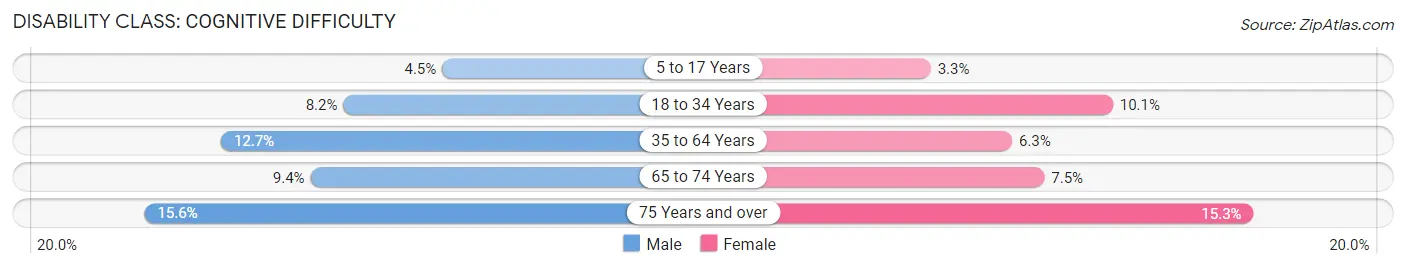
| Age Bracket | Male | Female |
| 5 to 17 Years | 36 (4.5%) | 23 (3.3%) |
| 18 to 34 Years | 90 (8.2%) | 80 (10.1%) |
| 35 to 64 Years | 232 (12.7%) | 130 (6.3%) |
| 65 to 74 Years | 54 (9.4%) | 37 (7.5%) |
| 75 Years and over | 44 (15.5%) | 70 (15.3%) |
Disability Class: Ambulatory Difficulty
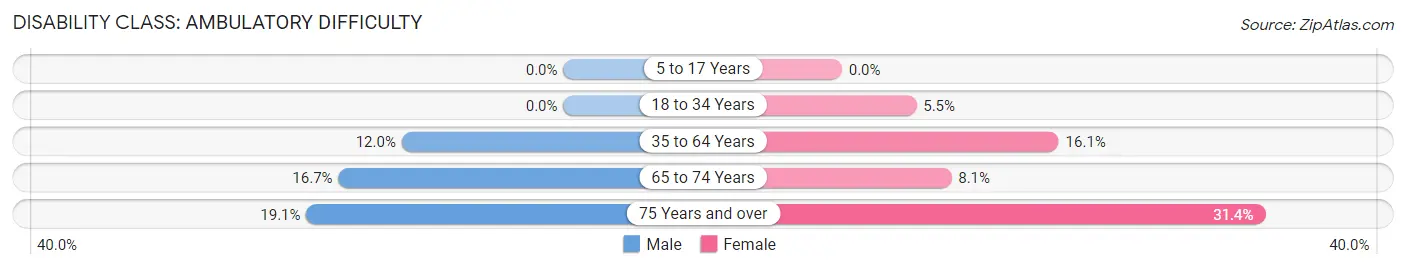
| Age Bracket | Male | Female |
| 5 to 17 Years | 0 (0.0%) | 0 (0.0%) |
| 18 to 34 Years | 0 (0.0%) | 44 (5.5%) |
| 35 to 64 Years | 219 (12.0%) | 331 (16.1%) |
| 65 to 74 Years | 96 (16.7%) | 40 (8.1%) |
| 75 Years and over | 54 (19.1%) | 144 (31.4%) |
Disability Class: Self-Care Difficulty
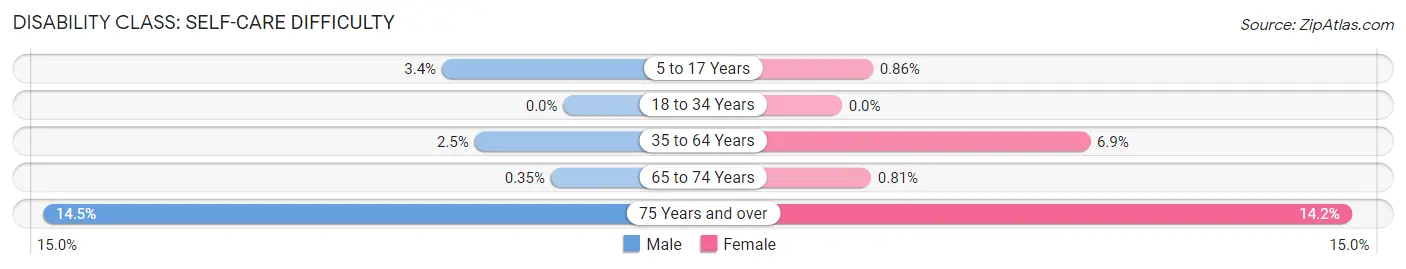
| Age Bracket | Male | Female |
| 5 to 17 Years | 27 (3.4%) | 6 (0.9%) |
| 18 to 34 Years | 0 (0.0%) | 0 (0.0%) |
| 35 to 64 Years | 45 (2.5%) | 142 (6.9%) |
| 65 to 74 Years | 2 (0.4%) | 4 (0.8%) |
| 75 Years and over | 41 (14.5%) | 65 (14.2%) |
Technology Access in Oil City
Computing Device Access in Oil City
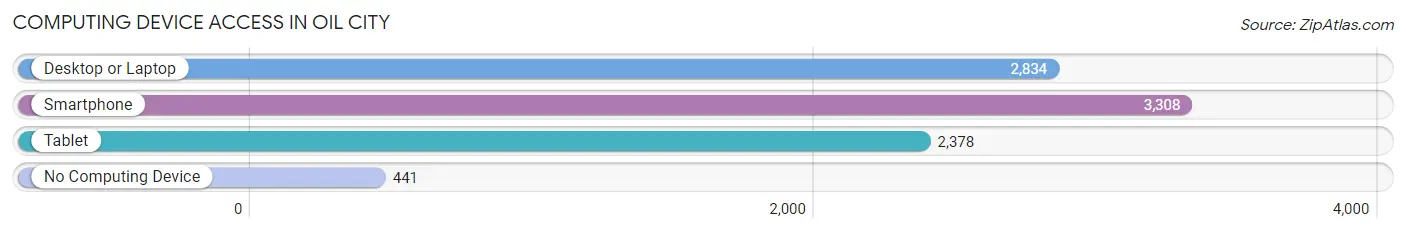
| Device Type | # Households | % Households |
| Desktop or Laptop | 2,834 | 69.9% |
| Smartphone | 3,308 | 81.6% |
| Tablet | 2,378 | 58.7% |
| No Computing Device | 441 | 10.9% |
| Total | 4,054 | 100.0% |
Internet Access in Oil City
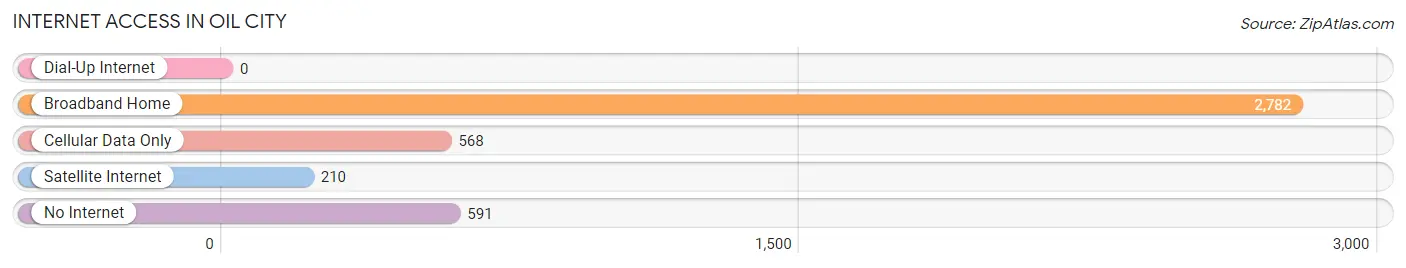
| Internet Type | # Households | % Households |
| Dial-Up Internet | 0 | 0.0% |
| Broadband Home | 2,782 | 68.6% |
| Cellular Data Only | 568 | 14.0% |
| Satellite Internet | 210 | 5.2% |
| No Internet | 591 | 14.6% |
| Total | 4,054 | 100.0% |
Oil City Summary
City of Oil City Pennsylvania
Oil City, Pennsylvania is a city located in Venango County, Pennsylvania. It is situated along the Allegheny River, approximately 80 miles north of Pittsburgh. The city is the county seat of Venango County and is the largest city in the county. As of the 2010 census, the population of Oil City was 10,557.
History
Oil City was founded in 1860 by Colonel Edwin L. Drake, who is credited with being the first person to successfully drill for oil in the United States. Drake's well, located near Oil City, was the first commercial oil well in the world. The discovery of oil in the area led to a boom in the local economy and the city quickly grew in size and population.
In the late 19th century, Oil City was a major center of the oil industry. The city was home to several large oil refineries and was the headquarters of several major oil companies, including Standard Oil and Sun Oil. The city was also home to several large manufacturing companies, including the Oil City Iron Works and the Oil City Machine Works.
Geography
Oil City is located in northwestern Pennsylvania, approximately 80 miles north of Pittsburgh. The city is situated along the Allegheny River and is surrounded by rolling hills and forests. The city has a total area of 4.2 square miles, all of which is land.
Climate
Oil City has a humid continental climate, with cold, snowy winters and warm, humid summers. The average annual temperature is 46°F, with an average high of 68°F in July and an average low of 24°F in January. The average annual precipitation is 39 inches.
Demographics
As of the 2010 census, the population of Oil City was 10,557. The racial makeup of the city was 94.3% White, 2.7% African American, 0.3% Native American, 0.5% Asian, 0.1% Pacific Islander, 0.7% from other races, and 1.4% from two or more races. Hispanic or Latino of any race were 2.2% of the population.
Economy
Oil City's economy is largely based on the oil and gas industry. The city is home to several oil and gas companies, including Chevron, ExxonMobil, and Shell. The city is also home to several manufacturing companies, including the Oil City Iron Works and the Oil City Machine Works. The city is also home to several retail stores, restaurants, and other businesses.
Education
Oil City is served by the Oil City Area School District, which includes two elementary schools, one middle school, and one high school. The city is also home to several private schools, including the Oil City Christian Academy and the Oil City Montessori School. The city is also home to the Venango Campus of Clarion University of Pennsylvania.
Conclusion
Oil City, Pennsylvania is a city located in Venango County, Pennsylvania. It is situated along the Allegheny River, approximately 80 miles north of Pittsburgh. The city is the county seat of Venango County and is the largest city in the county. Oil City was founded in 1860 by Colonel Edwin L. Drake, who is credited with being the first person to successfully drill for oil in the United States. The discovery of oil in the area led to a boom in the local economy and the city quickly grew in size and population. Oil City's economy is largely based on the oil and gas industry. The city is also home to several manufacturing companies, retail stores, restaurants, and other businesses. Oil City is served by the Oil City Area School District, which includes two elementary schools, one middle school, and one high school. The city is also home to several private schools and the Venango Campus of Clarion University of Pennsylvania.
Common Questions
What is Per Capita Income in Oil City?
Per Capita income in Oil City is $28,567.
What is the Median Family Income in Oil City?
Median Family Income in Oil City is $64,764.
What is the Median Household income in Oil City?
Median Household Income in Oil City is $48,632.
What is Income or Wage Gap in Oil City?
Income or Wage Gap in Oil City is 17.5%.
Women in Oil City earn 82.5 cents for every dollar earned by a man.
What is Inequality or Gini Index in Oil City?
Inequality or Gini Index in Oil City is 0.47.
What is the Total Population of Oil City?
Total Population of Oil City is 9,599.
What is the Total Male Population of Oil City?
Total Male Population of Oil City is 4,869.
What is the Total Female Population of Oil City?
Total Female Population of Oil City is 4,730.
What is the Ratio of Males per 100 Females in Oil City?
There are 102.94 Males per 100 Females in Oil City.
What is the Ratio of Females per 100 Males in Oil City?
There are 97.15 Females per 100 Males in Oil City.
What is the Median Population Age in Oil City?
Median Population Age in Oil City is 43.5 Years.
What is the Average Family Size in Oil City
Average Family Size in Oil City is 2.9 People.
What is the Average Household Size in Oil City
Average Household Size in Oil City is 2.3 People.
How Large is the Labor Force in Oil City?
There are 4,554 People in the Labor Forcein in Oil City.
What is the Percentage of People in the Labor Force in Oil City?
56.7% of People are in the Labor Force in Oil City.
What is the Unemployment Rate in Oil City?
Unemployment Rate in Oil City is 7.8%.