Nicholson borough, PA Map & Demographics
Nicholson borough Overview
$26,163
PER CAPITA INCOME
$74,250
AVG FAMILY INCOME
$66,964
AVG HOUSEHOLD INCOME
49.8%
WAGE / INCOME GAP [ % ]
50.2¢/ $1
WAGE / INCOME GAP [ $ ]
0.38
INEQUALITY / GINI INDEX
753
TOTAL POPULATION
361
MALE POPULATION
392
FEMALE POPULATION
92.09
MALES / 100 FEMALES
108.59
FEMALES / 100 MALES
32.6
MEDIAN AGE
3.4
AVG FAMILY SIZE
2.8
AVG HOUSEHOLD SIZE
371
LABOR FORCE [ PEOPLE ]
71.5%
PERCENT IN LABOR FORCE
1.4%
UNEMPLOYMENT RATE
Income in Nicholson borough
Income Overview in Nicholson borough
Per Capita Income in Nicholson borough is $26,163, while median incomes of families and households are $74,250 and $66,964 respectively.
| Characteristic | Number | Measure |
| Per Capita Income | 753 | $26,163 |
| Median Family Income | 178 | $74,250 |
| Mean Family Income | 178 | $84,664 |
| Median Household Income | 265 | $66,964 |
| Mean Household Income | 265 | $73,587 |
| Income Deficit | 178 | $0 |
| Wage / Income Gap (%) | 753 | 49.81% |
| Wage / Income Gap ($) | 753 | 50.19¢ per $1 |
| Gini / Inequality Index | 753 | 0.38 |
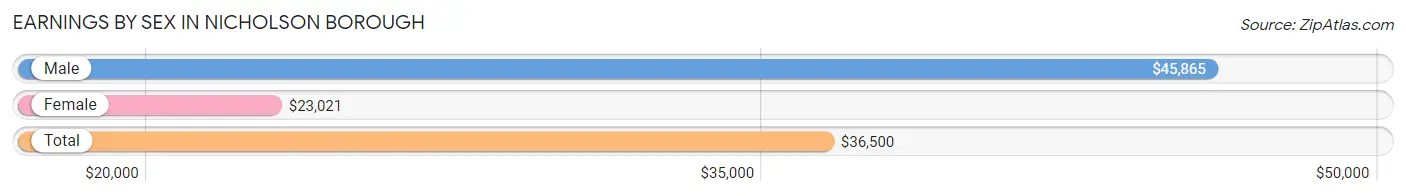
Earnings by Sex in Nicholson borough
Average Earnings in Nicholson borough are $36,500, $45,865 for men and $23,021 for women, a difference of 49.8%.
| Sex | Number | Average Earnings |
| Male | 195 (50.0%) | $45,865 |
| Female | 195 (50.0%) | $23,021 |
| Total | 390 (100.0%) | $36,500 |
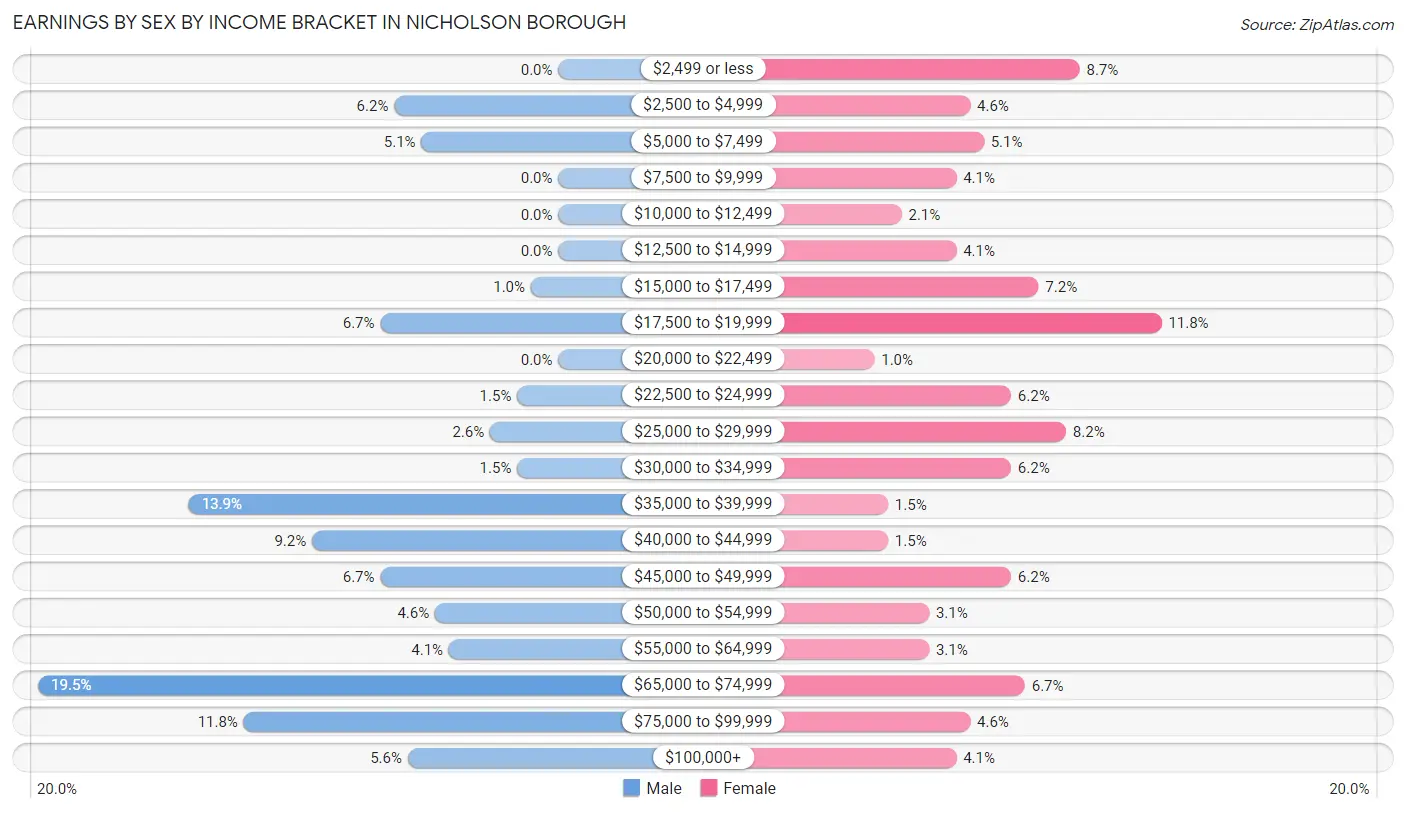
Earnings by Sex by Income Bracket in Nicholson borough
The most common earnings brackets in Nicholson borough are $65,000 to $74,999 for men (38 | 19.5%) and $17,500 to $19,999 for women (23 | 11.8%).
| Income | Male | Female |
| $2,499 or less | 0 (0.0%) | 17 (8.7%) |
| $2,500 to $4,999 | 12 (6.1%) | 9 (4.6%) |
| $5,000 to $7,499 | 10 (5.1%) | 10 (5.1%) |
| $7,500 to $9,999 | 0 (0.0%) | 8 (4.1%) |
| $10,000 to $12,499 | 0 (0.0%) | 4 (2.1%) |
| $12,500 to $14,999 | 0 (0.0%) | 8 (4.1%) |
| $15,000 to $17,499 | 2 (1.0%) | 14 (7.2%) |
| $17,500 to $19,999 | 13 (6.7%) | 23 (11.8%) |
| $20,000 to $22,499 | 0 (0.0%) | 2 (1.0%) |
| $22,500 to $24,999 | 3 (1.5%) | 12 (6.1%) |
| $25,000 to $29,999 | 5 (2.6%) | 16 (8.2%) |
| $30,000 to $34,999 | 3 (1.5%) | 12 (6.1%) |
| $35,000 to $39,999 | 27 (13.9%) | 3 (1.5%) |
| $40,000 to $44,999 | 18 (9.2%) | 3 (1.5%) |
| $45,000 to $49,999 | 13 (6.7%) | 12 (6.1%) |
| $50,000 to $54,999 | 9 (4.6%) | 6 (3.1%) |
| $55,000 to $64,999 | 8 (4.1%) | 6 (3.1%) |
| $65,000 to $74,999 | 38 (19.5%) | 13 (6.7%) |
| $75,000 to $99,999 | 23 (11.8%) | 9 (4.6%) |
| $100,000+ | 11 (5.6%) | 8 (4.1%) |
| Total | 195 (100.0%) | 195 (100.0%) |
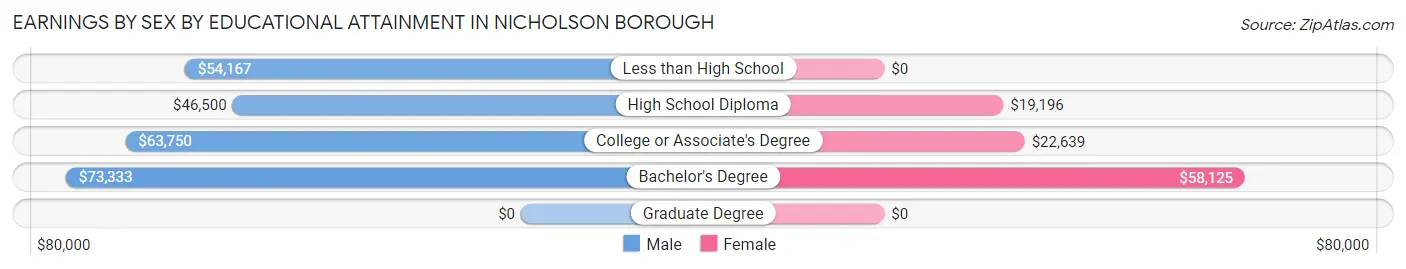
Earnings by Sex by Educational Attainment in Nicholson borough
Average earnings in Nicholson borough are $62,679 for men and $24,792 for women, a difference of 60.5%. Men with an educational attainment of bachelor's degree enjoy the highest average annual earnings of $73,333, while those with high school diploma education earn the least with $46,500. Women with an educational attainment of bachelor's degree earn the most with the average annual earnings of $58,125, while those with high school diploma education have the smallest earnings of $19,196.
| Educational Attainment | Male Income | Female Income |
| Less than High School | $54,167 | $0 |
| High School Diploma | $46,500 | $19,196 |
| College or Associate's Degree | $63,750 | $22,639 |
| Bachelor's Degree | $73,333 | $58,125 |
| Graduate Degree | - | - |
| Total | $62,679 | $24,792 |
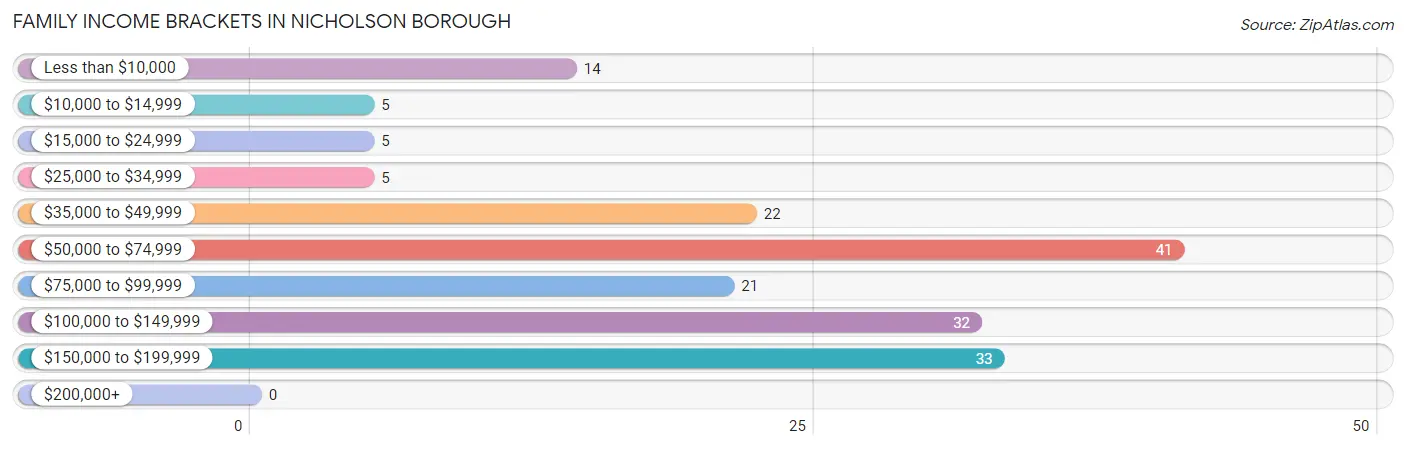
Family Income in Nicholson borough
Family Income Brackets in Nicholson borough
According to the Nicholson borough family income data, there are 41 families falling into the $50,000 to $74,999 income range, which is the most common income bracket and makes up 23.0% of all families.
| Income Bracket | # Families | % Families |
| Less than $10,000 | 14 | 7.9% |
| $10,000 to $14,999 | 5 | 2.8% |
| $15,000 to $24,999 | 5 | 2.8% |
| $25,000 to $34,999 | 5 | 2.8% |
| $35,000 to $49,999 | 22 | 12.4% |
| $50,000 to $74,999 | 41 | 23.0% |
| $75,000 to $99,999 | 21 | 11.8% |
| $100,000 to $149,999 | 32 | 18.0% |
| $150,000 to $199,999 | 33 | 18.5% |
| $200,000+ | 0 | 0.0% |
Family Income by Famaliy Size in Nicholson borough
4-person families (45 | 25.3%) account for the highest median family income in Nicholson borough with $133,750 per family, while 2-person families (65 | 36.5%) have the highest median income of $35,486 per family member.
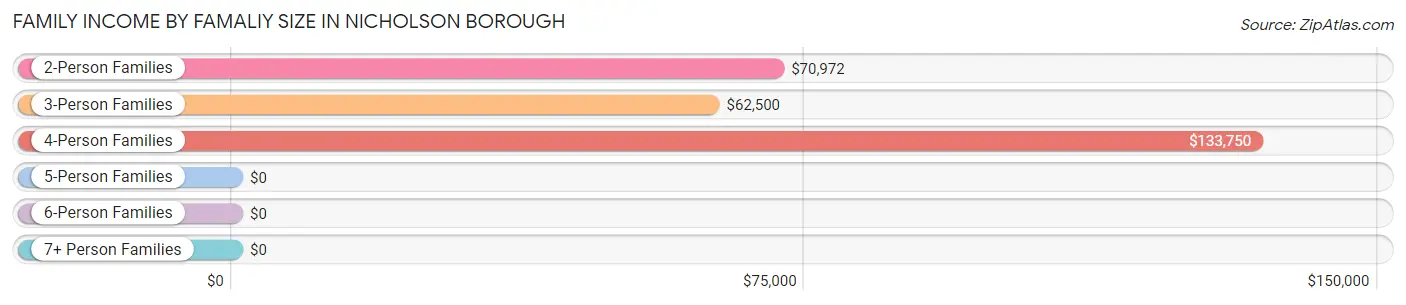
| Income Bracket | # Families | Median Income |
| 2-Person Families | 65 (36.5%) | $70,972 |
| 3-Person Families | 40 (22.5%) | $62,500 |
| 4-Person Families | 45 (25.3%) | $133,750 |
| 5-Person Families | 21 (11.8%) | $0 |
| 6-Person Families | 7 (3.9%) | $0 |
| 7+ Person Families | 0 (0.0%) | $0 |
| Total | 178 (100.0%) | $74,250 |
Family Income by Number of Earners in Nicholson borough
The median family income in Nicholson borough is $74,250, with families comprising 2 earners (76) having the highest median family income of $118,333, while families with no earners (10) have the lowest median family income of $46,250, accounting for 42.7% and 5.6% of families, respectively.
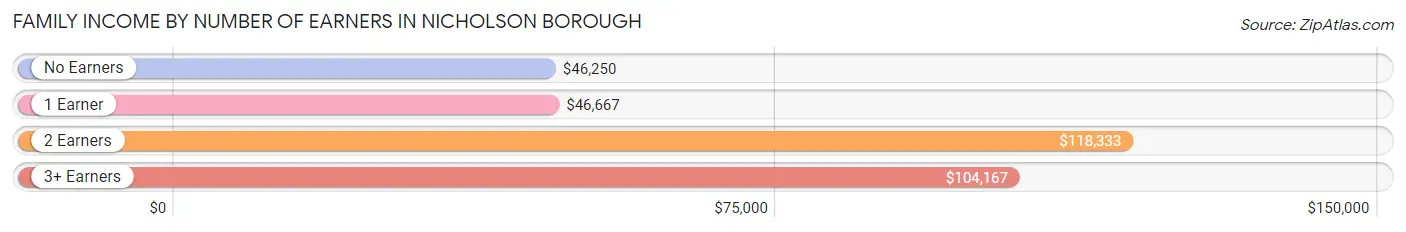
| Number of Earners | # Families | Median Income |
| No Earners | 10 (5.6%) | $46,250 |
| 1 Earner | 68 (38.2%) | $46,667 |
| 2 Earners | 76 (42.7%) | $118,333 |
| 3+ Earners | 24 (13.5%) | $104,167 |
| Total | 178 (100.0%) | $74,250 |
Household Income in Nicholson borough
Household Income Brackets in Nicholson borough
With 56 households falling in the category, the $50,000 to $74,999 income range is the most frequent in Nicholson borough, accounting for 21.1% of all households.
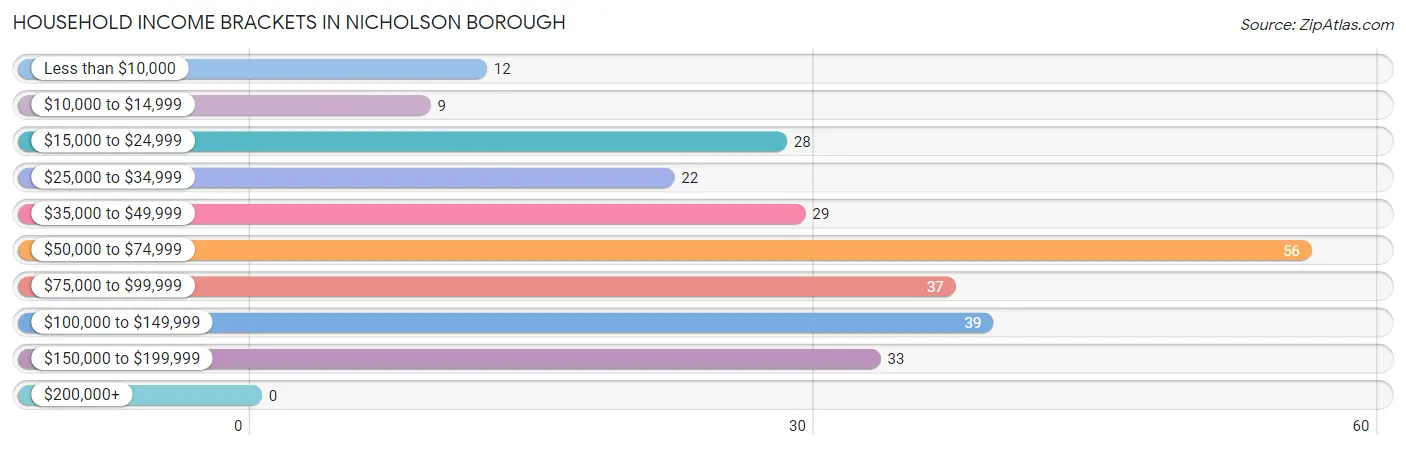
| Income Bracket | # Households | % Households |
| Less than $10,000 | 12 | 4.5% |
| $10,000 to $14,999 | 9 | 3.4% |
| $15,000 to $24,999 | 28 | 10.6% |
| $25,000 to $34,999 | 22 | 8.3% |
| $35,000 to $49,999 | 29 | 10.9% |
| $50,000 to $74,999 | 56 | 21.1% |
| $75,000 to $99,999 | 37 | 14.0% |
| $100,000 to $149,999 | 39 | 14.7% |
| $150,000 to $199,999 | 33 | 12.5% |
| $200,000+ | 0 | 0.0% |
Household Income by Householder Age in Nicholson borough
The median household income in Nicholson borough is $66,964, with the highest median household income of $73,875 found in the 45 to 64 years age bracket for the primary householder. A total of 77 households (29.1%) fall into this category. Meanwhile, the 15 to 24 years age bracket for the primary householder has the lowest median household income of $0, with 17 households (6.4%) in this group.
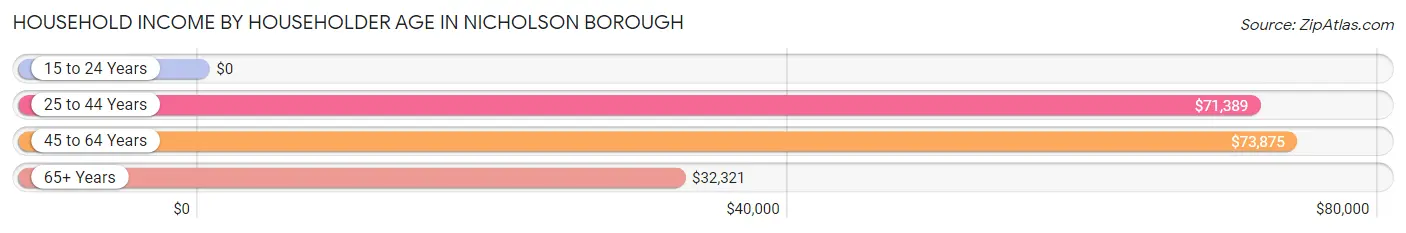
| Income Bracket | # Households | Median Income |
| 15 to 24 Years | 17 (6.4%) | $0 |
| 25 to 44 Years | 108 (40.7%) | $71,389 |
| 45 to 64 Years | 77 (29.1%) | $73,875 |
| 65+ Years | 63 (23.8%) | $32,321 |
| Total | 265 (100.0%) | $66,964 |
Poverty in Nicholson borough
Income Below Poverty by Sex and Age in Nicholson borough
With 11.4% poverty level for males and 22.7% for females among the residents of Nicholson borough, 12 to 14 year old males and 12 to 14 year old females are the most vulnerable to poverty, with 10 males (30.3%) and 12 females (85.7%) in their respective age groups living below the poverty level.
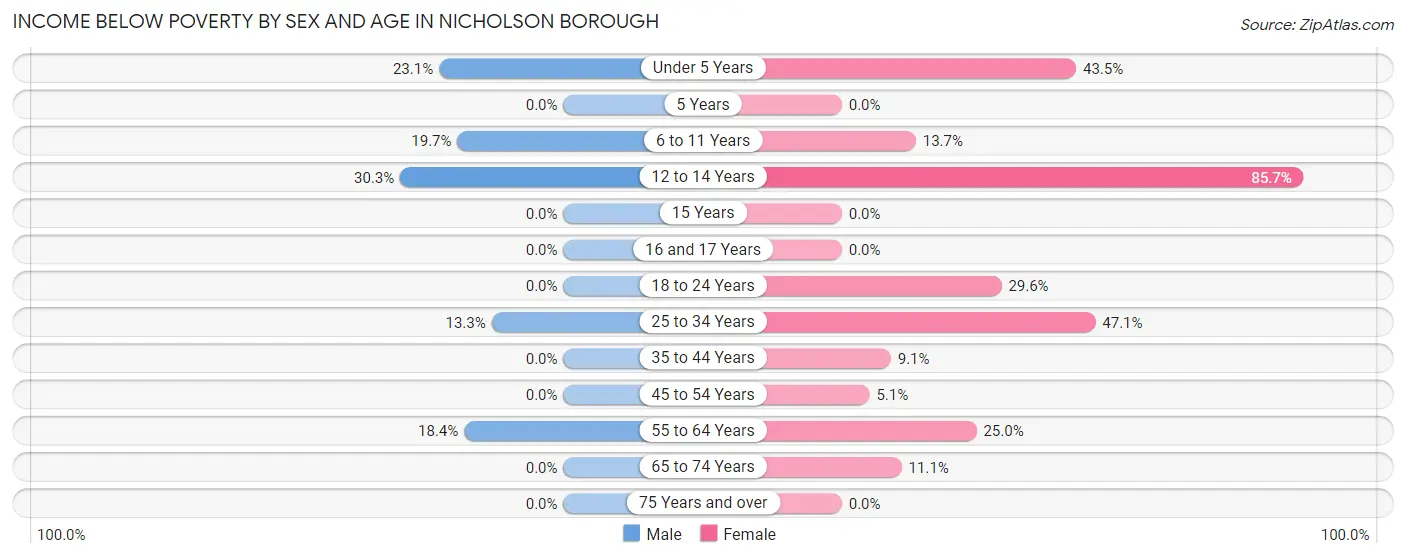
| Age Bracket | Male | Female |
| Under 5 Years | 6 (23.1%) | 10 (43.5%) |
| 5 Years | 0 (0.0%) | 0 (0.0%) |
| 6 to 11 Years | 12 (19.7%) | 7 (13.7%) |
| 12 to 14 Years | 10 (30.3%) | 12 (85.7%) |
| 15 Years | 0 (0.0%) | 0 (0.0%) |
| 16 and 17 Years | 0 (0.0%) | 0 (0.0%) |
| 18 to 24 Years | 0 (0.0%) | 8 (29.6%) |
| 25 to 34 Years | 6 (13.3%) | 32 (47.1%) |
| 35 to 44 Years | 0 (0.0%) | 6 (9.1%) |
| 45 to 54 Years | 0 (0.0%) | 2 (5.1%) |
| 55 to 64 Years | 7 (18.4%) | 7 (25.0%) |
| 65 to 74 Years | 0 (0.0%) | 5 (11.1%) |
| 75 Years and over | 0 (0.0%) | 0 (0.0%) |
| Total | 41 (11.4%) | 89 (22.7%) |
Income Above Poverty by Sex and Age in Nicholson borough
According to the poverty statistics in Nicholson borough, males aged 5 years and females aged 5 years are the age groups that are most secure financially, with 100.0% of males and 100.0% of females in these age groups living above the poverty line.
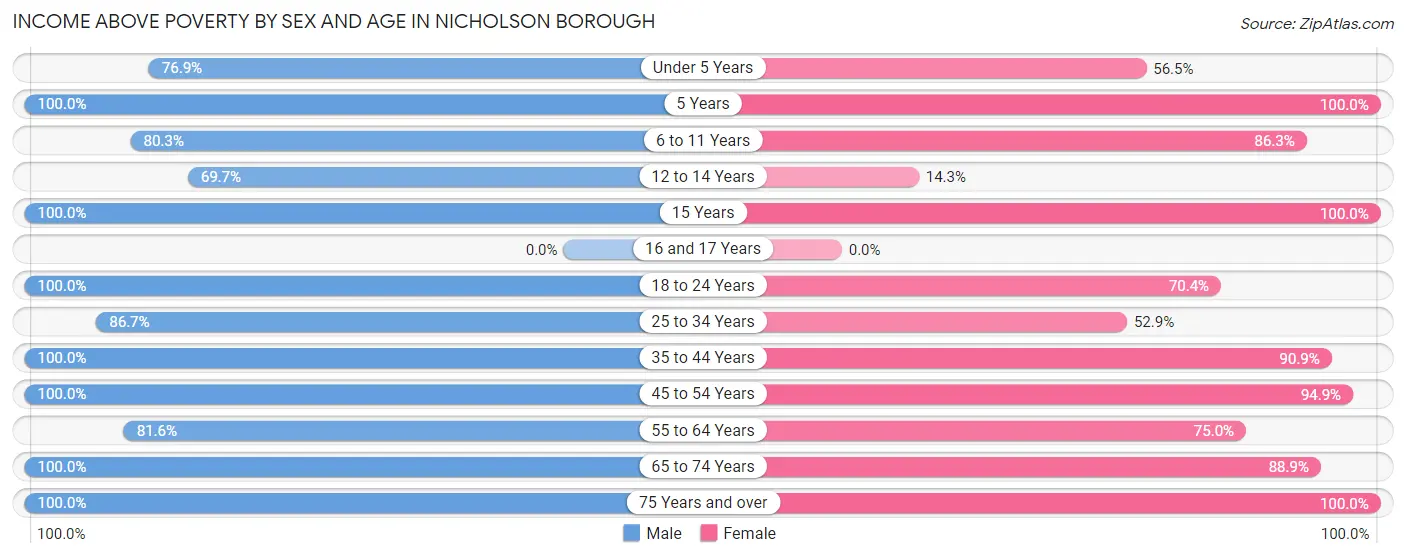
| Age Bracket | Male | Female |
| Under 5 Years | 20 (76.9%) | 13 (56.5%) |
| 5 Years | 3 (100.0%) | 7 (100.0%) |
| 6 to 11 Years | 49 (80.3%) | 44 (86.3%) |
| 12 to 14 Years | 23 (69.7%) | 2 (14.3%) |
| 15 Years | 10 (100.0%) | 6 (100.0%) |
| 16 and 17 Years | 0 (0.0%) | 0 (0.0%) |
| 18 to 24 Years | 38 (100.0%) | 19 (70.4%) |
| 25 to 34 Years | 39 (86.7%) | 36 (52.9%) |
| 35 to 44 Years | 39 (100.0%) | 60 (90.9%) |
| 45 to 54 Years | 42 (100.0%) | 37 (94.9%) |
| 55 to 64 Years | 31 (81.6%) | 21 (75.0%) |
| 65 to 74 Years | 21 (100.0%) | 40 (88.9%) |
| 75 Years and over | 5 (100.0%) | 18 (100.0%) |
| Total | 320 (88.6%) | 303 (77.3%) |
Income Below Poverty Among Married-Couple Families in Nicholson borough
The poverty statistics for married-couple families in Nicholson borough show that 4.9% or 6 of the total 122 families live below the poverty line. Families with 1 or 2 children have the highest poverty rate of 12.8%, comprising of 6 families. On the other hand, families with no children have the lowest poverty rate of 0.0%, which includes 0 families.
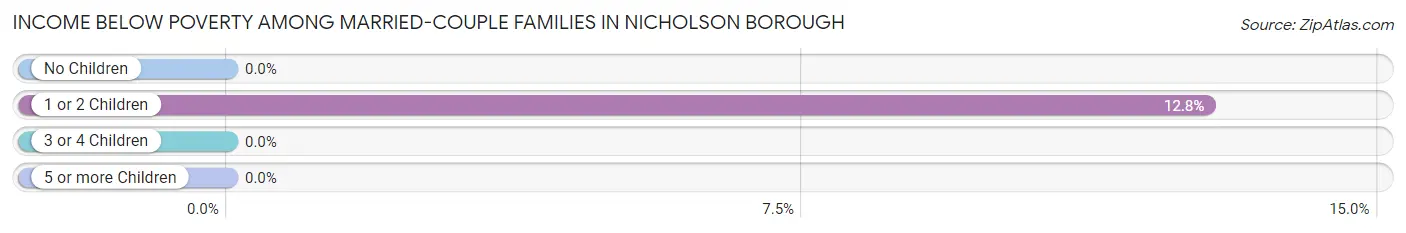
| Children | Above Poverty | Below Poverty |
| No Children | 61 (100.0%) | 0 (0.0%) |
| 1 or 2 Children | 41 (87.2%) | 6 (12.8%) |
| 3 or 4 Children | 14 (100.0%) | 0 (0.0%) |
| 5 or more Children | 0 (0.0%) | 0 (0.0%) |
| Total | 116 (95.1%) | 6 (4.9%) |
Income Below Poverty Among Single-Parent Households in Nicholson borough
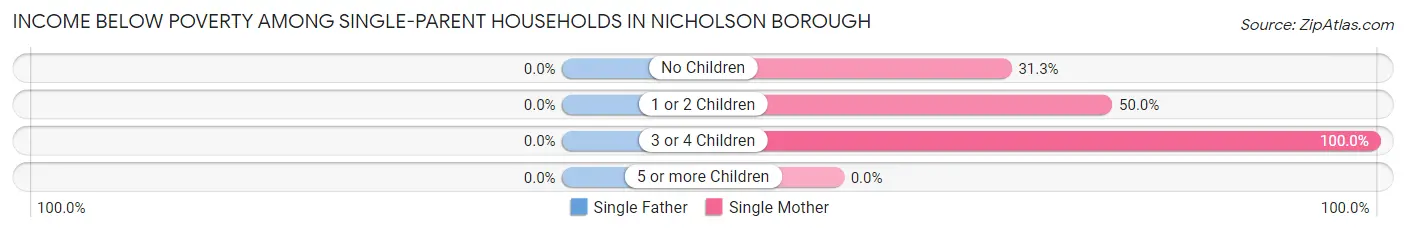
| Children | Single Father | Single Mother |
| No Children | 0 (0.0%) | 5 (31.2%) |
| 1 or 2 Children | 0 (0.0%) | 3 (50.0%) |
| 3 or 4 Children | 0 (0.0%) | 11 (100.0%) |
| 5 or more Children | 0 (0.0%) | 0 (0.0%) |
| Total | 0 (0.0%) | 19 (57.6%) |
Income Below Poverty Among Married-Couple vs Single-Parent Households in Nicholson borough
The poverty data for Nicholson borough shows that 6 of the married-couple family households (4.9%) and 19 of the single-parent households (33.9%) are living below the poverty level. Within the married-couple family households, those with 1 or 2 children have the highest poverty rate, with 6 households (12.8%) falling below the poverty line. Among the single-parent households, those with 3 or 4 children have the highest poverty rate, with 11 household (78.6%) living below poverty.
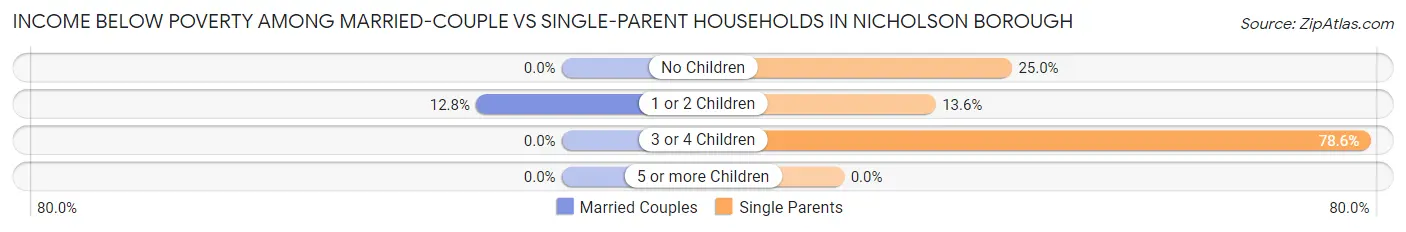
| Children | Married-Couple Families | Single-Parent Households |
| No Children | 0 (0.0%) | 5 (25.0%) |
| 1 or 2 Children | 6 (12.8%) | 3 (13.6%) |
| 3 or 4 Children | 0 (0.0%) | 11 (78.6%) |
| 5 or more Children | 0 (0.0%) | 0 (0.0%) |
| Total | 6 (4.9%) | 19 (33.9%) |
Race in Nicholson borough
The most populous races in Nicholson borough are White / Caucasian (739 | 98.1%), Two or more Races (9 | 1.2%), and Hispanic or Latino (8 | 1.1%).
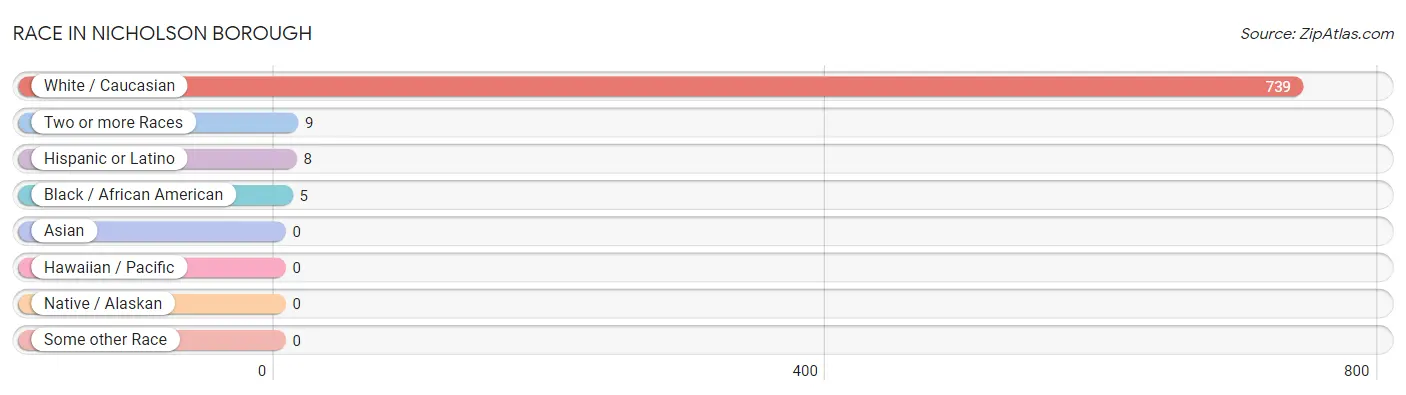
| Race | # Population | % Population |
| Asian | 0 | 0.0% |
| Black / African American | 5 | 0.7% |
| Hawaiian / Pacific | 0 | 0.0% |
| Hispanic or Latino | 8 | 1.1% |
| Native / Alaskan | 0 | 0.0% |
| White / Caucasian | 739 | 98.1% |
| Two or more Races | 9 | 1.2% |
| Some other Race | 0 | 0.0% |
| Total | 753 | 100.0% |
Ancestry in Nicholson borough
The most populous ancestries reported in Nicholson borough are German (155 | 20.6%), Italian (149 | 19.8%), Irish (138 | 18.3%), English (112 | 14.9%), and Welsh (52 | 6.9%), together accounting for 80.5% of all Nicholson borough residents.
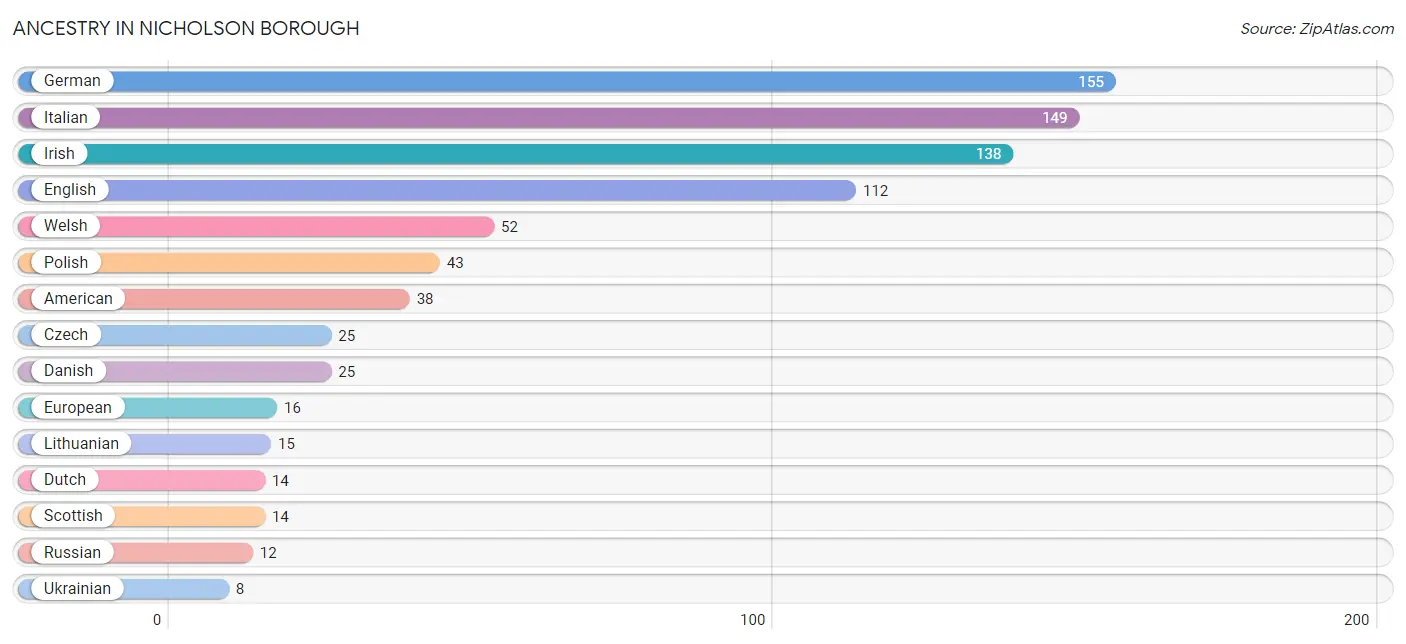
| Ancestry | # Population | % Population |
| American | 38 | 5.1% |
| British | 7 | 0.9% |
| Cherokee | 6 | 0.8% |
| Czech | 25 | 3.3% |
| Danish | 25 | 3.3% |
| Dutch | 14 | 1.9% |
| Eastern European | 2 | 0.3% |
| English | 112 | 14.9% |
| European | 16 | 2.1% |
| French | 3 | 0.4% |
| German | 155 | 20.6% |
| Irish | 138 | 18.3% |
| Italian | 149 | 19.8% |
| Lithuanian | 15 | 2.0% |
| Mexican | 2 | 0.3% |
| Norwegian | 3 | 0.4% |
| Polish | 43 | 5.7% |
| Puerto Rican | 6 | 0.8% |
| Russian | 12 | 1.6% |
| Scottish | 14 | 1.9% |
| Swedish | 3 | 0.4% |
| Ukrainian | 8 | 1.1% |
| Welsh | 52 | 6.9% | View All 23 Rows |
Immigrants in Nicholson borough
The most numerous immigrant groups reported in Nicholson borough came from Europe (3 | 0.4%), Germany (3 | 0.4%), and Western Europe (3 | 0.4%), together accounting for 1.2% of all Nicholson borough residents.
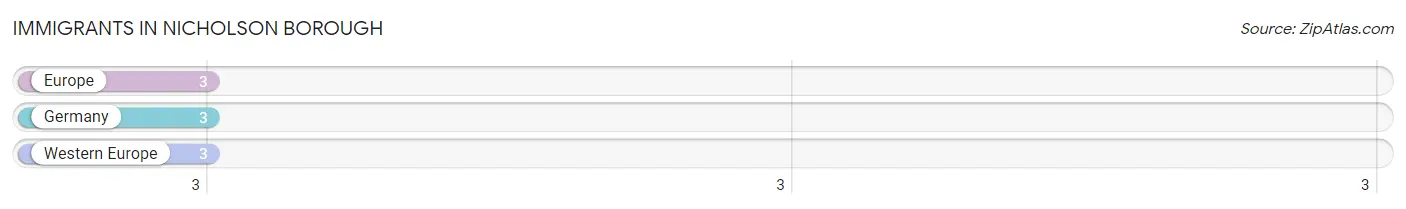
| Immigration Origin | # Population | % Population |
| Europe | 3 | 0.4% |
| Germany | 3 | 0.4% |
| Western Europe | 3 | 0.4% | View All 3 Rows |
Sex and Age in Nicholson borough
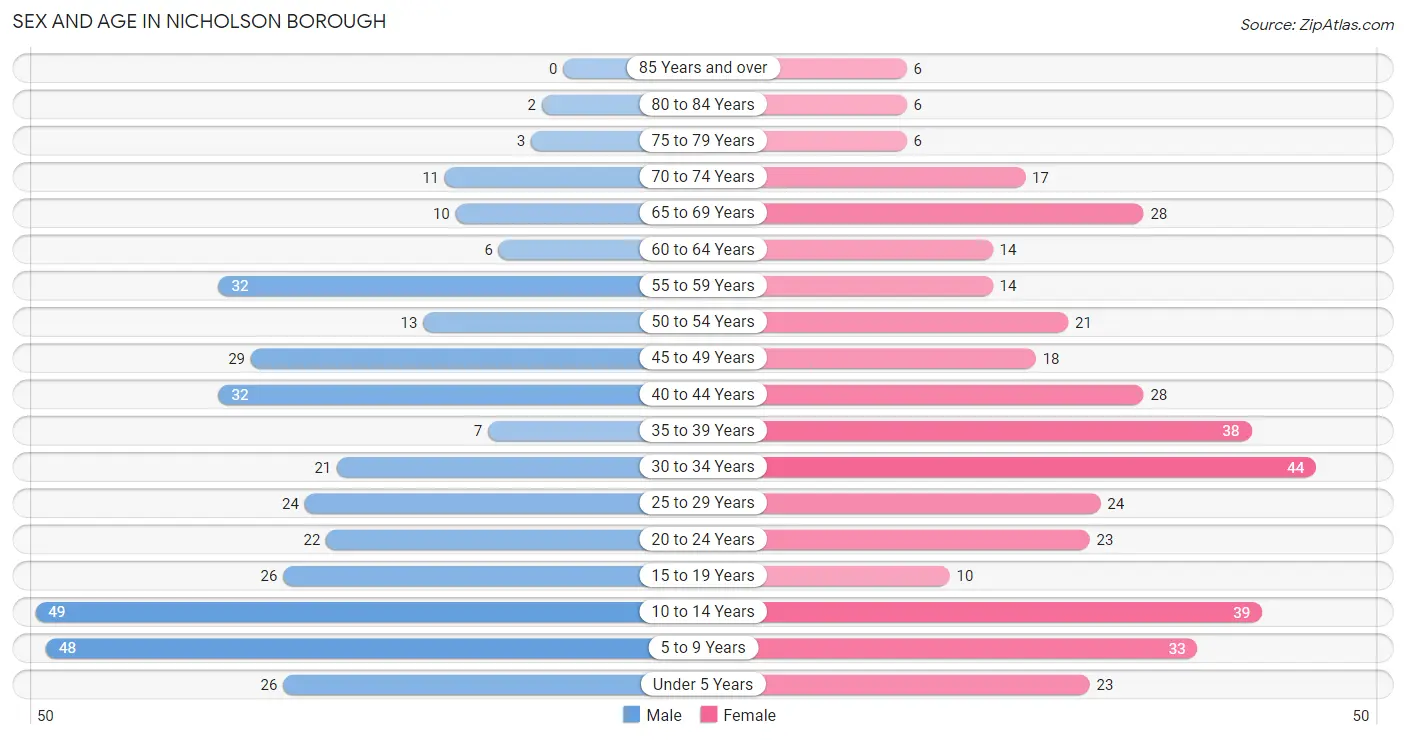
Sex and Age in Nicholson borough
The most populous age groups in Nicholson borough are 10 to 14 Years (49 | 13.6%) for men and 30 to 34 Years (44 | 11.2%) for women.
| Age Bracket | Male | Female |
| Under 5 Years | 26 (7.2%) | 23 (5.9%) |
| 5 to 9 Years | 48 (13.3%) | 33 (8.4%) |
| 10 to 14 Years | 49 (13.6%) | 39 (10.0%) |
| 15 to 19 Years | 26 (7.2%) | 10 (2.5%) |
| 20 to 24 Years | 22 (6.1%) | 23 (5.9%) |
| 25 to 29 Years | 24 (6.7%) | 24 (6.1%) |
| 30 to 34 Years | 21 (5.8%) | 44 (11.2%) |
| 35 to 39 Years | 7 (1.9%) | 38 (9.7%) |
| 40 to 44 Years | 32 (8.9%) | 28 (7.1%) |
| 45 to 49 Years | 29 (8.0%) | 18 (4.6%) |
| 50 to 54 Years | 13 (3.6%) | 21 (5.4%) |
| 55 to 59 Years | 32 (8.9%) | 14 (3.6%) |
| 60 to 64 Years | 6 (1.7%) | 14 (3.6%) |
| 65 to 69 Years | 10 (2.8%) | 28 (7.1%) |
| 70 to 74 Years | 11 (3.0%) | 17 (4.3%) |
| 75 to 79 Years | 3 (0.8%) | 6 (1.5%) |
| 80 to 84 Years | 2 (0.5%) | 6 (1.5%) |
| 85 Years and over | 0 (0.0%) | 6 (1.5%) |
| Total | 361 (100.0%) | 392 (100.0%) |
Families and Households in Nicholson borough
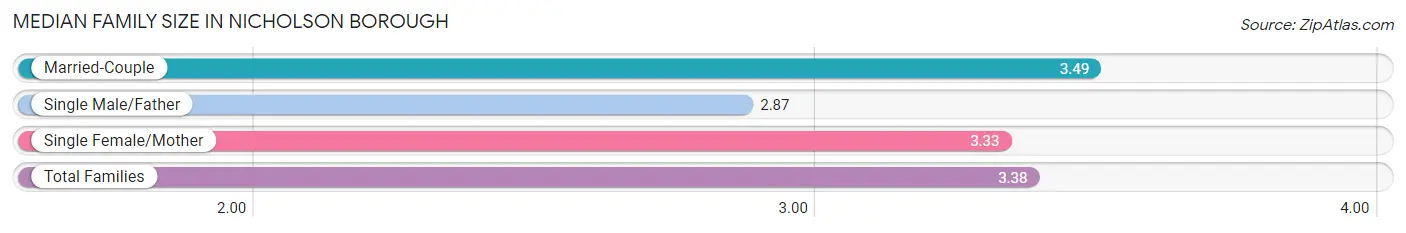
Median Family Size in Nicholson borough
The median family size in Nicholson borough is 3.38 persons per family, with married-couple families (122 | 68.5%) accounting for the largest median family size of 3.49 persons per family. On the other hand, single male/father families (23 | 12.9%) represent the smallest median family size with 2.87 persons per family.
| Family Type | # Families | Family Size |
| Married-Couple | 122 (68.5%) | 3.49 |
| Single Male/Father | 23 (12.9%) | 2.87 |
| Single Female/Mother | 33 (18.5%) | 3.33 |
| Total Families | 178 (100.0%) | 3.38 |
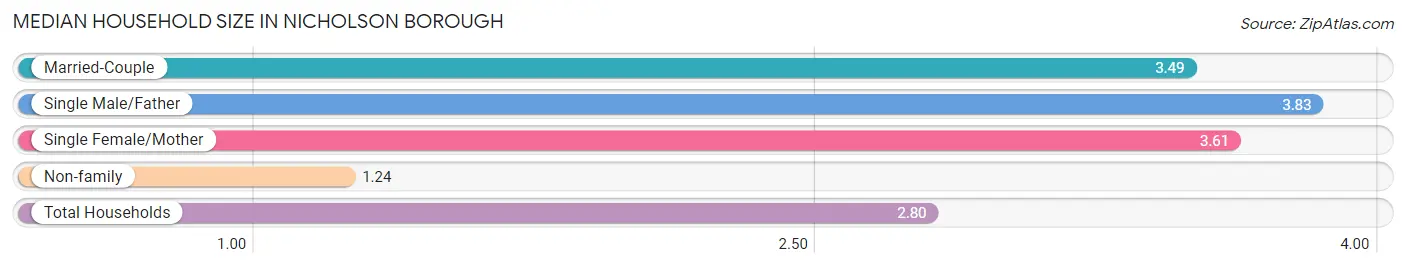
Median Household Size in Nicholson borough
The median household size in Nicholson borough is 2.80 persons per household, with single male/father households (23 | 8.7%) accounting for the largest median household size of 3.83 persons per household. non-family households (87 | 32.8%) represent the smallest median household size with 1.24 persons per household.
| Household Type | # Households | Household Size |
| Married-Couple | 122 (46.0%) | 3.49 |
| Single Male/Father | 23 (8.7%) | 3.83 |
| Single Female/Mother | 33 (12.4%) | 3.61 |
| Non-family | 87 (32.8%) | 1.24 |
| Total Households | 265 (100.0%) | 2.80 |
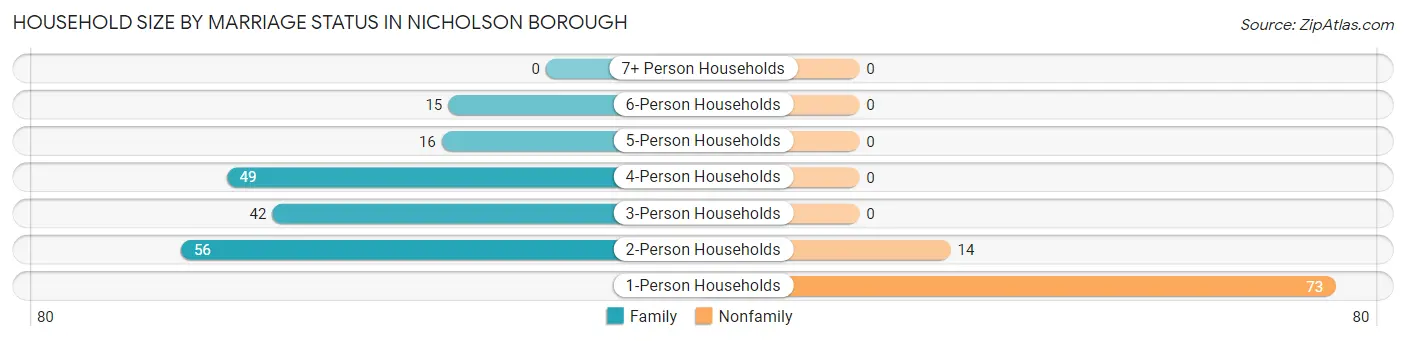
Household Size by Marriage Status in Nicholson borough
Out of a total of 265 households in Nicholson borough, 178 (67.2%) are family households, while 87 (32.8%) are nonfamily households. The most numerous type of family households are 2-person households, comprising 56, and the most common type of nonfamily households are 1-person households, comprising 73.
| Household Size | Family Households | Nonfamily Households |
| 1-Person Households | - | 73 (27.6%) |
| 2-Person Households | 56 (21.1%) | 14 (5.3%) |
| 3-Person Households | 42 (15.9%) | 0 (0.0%) |
| 4-Person Households | 49 (18.5%) | 0 (0.0%) |
| 5-Person Households | 16 (6.0%) | 0 (0.0%) |
| 6-Person Households | 15 (5.7%) | 0 (0.0%) |
| 7+ Person Households | 0 (0.0%) | 0 (0.0%) |
| Total | 178 (67.2%) | 87 (32.8%) |
Female Fertility in Nicholson borough
Fertility by Age in Nicholson borough
Average fertility rate in Nicholson borough is 225.0 births per 1,000 women. Women in the age bracket of 20 to 34 years have the highest fertility rate with 429.0 births per 1,000 women. Women in the age bracket of 20 to 34 years acount for 92.9% of all women with births.
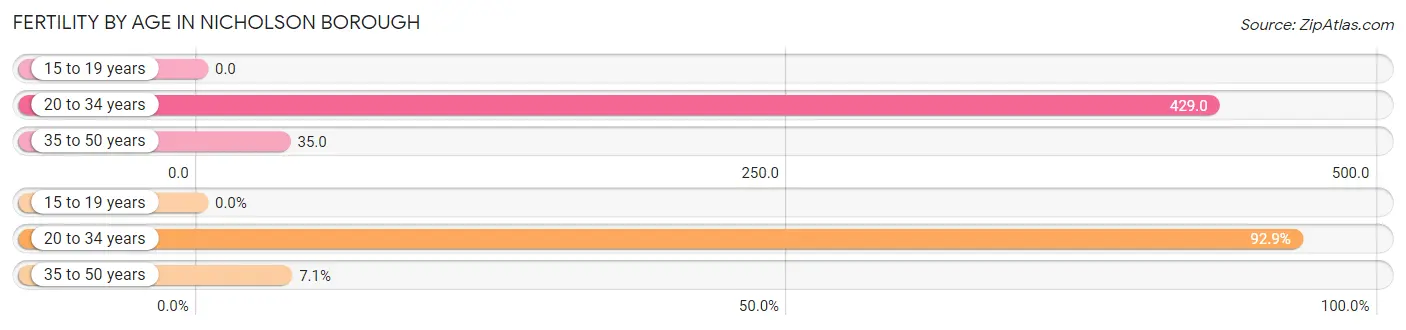
| Age Bracket | Women with Births | Births / 1,000 Women |
| 15 to 19 years | 0 (0.0%) | 0.0 |
| 20 to 34 years | 39 (92.9%) | 429.0 |
| 35 to 50 years | 3 (7.1%) | 35.0 |
| Total | 42 (100.0%) | 225.0 |
Fertility by Age by Marriage Status in Nicholson borough
52.4% of women with births (42) in Nicholson borough are married. The highest percentage of unmarried women with births falls into 20 to 34 years age bracket with 51.3% of them unmarried at the time of birth, while the lowest percentage of unmarried women with births belong to 35 to 50 years age bracket with 0.0% of them unmarried.
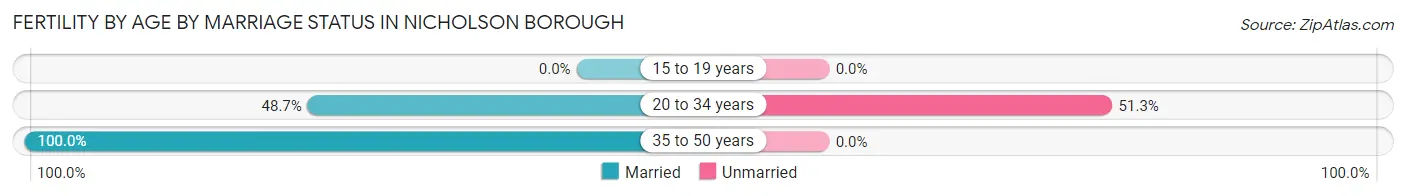
| Age Bracket | Married | Unmarried |
| 15 to 19 years | 0 (0.0%) | 0 (0.0%) |
| 20 to 34 years | 19 (48.7%) | 20 (51.3%) |
| 35 to 50 years | 3 (100.0%) | 0 (0.0%) |
| Total | 22 (52.4%) | 20 (47.6%) |
Fertility by Education in Nicholson borough
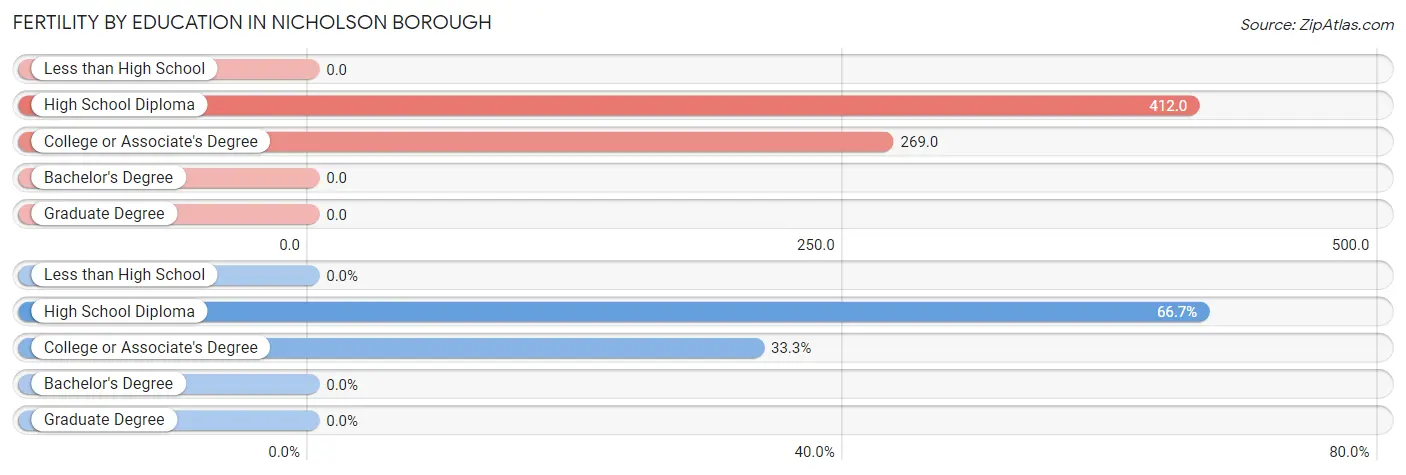
| Educational Attainment | Women with Births | Births / 1,000 Women |
| Less than High School | 0 (0.0%) | 0.0 |
| High School Diploma | 28 (66.7%) | 412.0 |
| College or Associate's Degree | 14 (33.3%) | 269.0 |
| Bachelor's Degree | 0 (0.0%) | 0.0 |
| Graduate Degree | 0 (0.0%) | 0.0 |
| Total | 42 (100.0%) | 225.0 |
Fertility by Education by Marriage Status in Nicholson borough
47.6% of women with births in Nicholson borough are unmarried. Women with the educational attainment of college or associate's degree are most likely to be married with 100.0% of them married at childbirth, while women with the educational attainment of high school diploma are least likely to be married with 71.4% of them unmarried at childbirth.
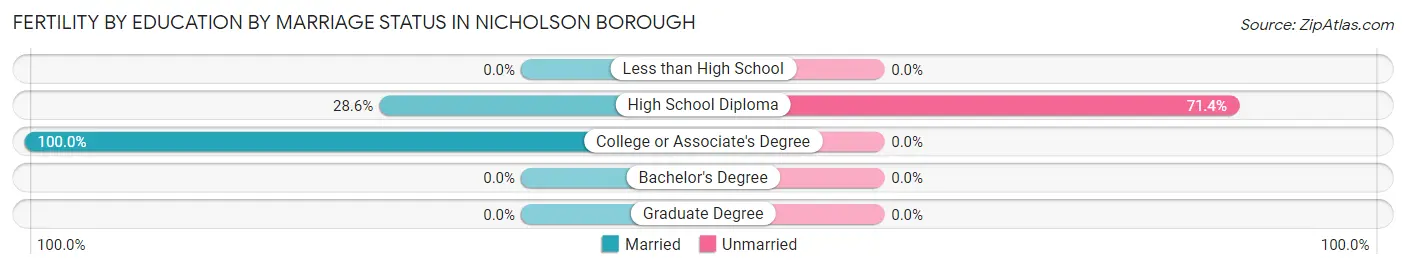
| Educational Attainment | Married | Unmarried |
| Less than High School | 0 (0.0%) | 0 (0.0%) |
| High School Diploma | 8 (28.6%) | 20 (71.4%) |
| College or Associate's Degree | 14 (100.0%) | 0 (0.0%) |
| Bachelor's Degree | 0 (0.0%) | 0 (0.0%) |
| Graduate Degree | 0 (0.0%) | 0 (0.0%) |
| Total | 22 (52.4%) | 20 (47.6%) |
Employment Characteristics in Nicholson borough
Employment by Class of Employer in Nicholson borough
Among the 364 employed individuals in Nicholson borough, private company employees (294 | 80.8%), self-employed (not incorporated) (22 | 6.0%), and local government employees (17 | 4.7%) make up the most common classes of employment.
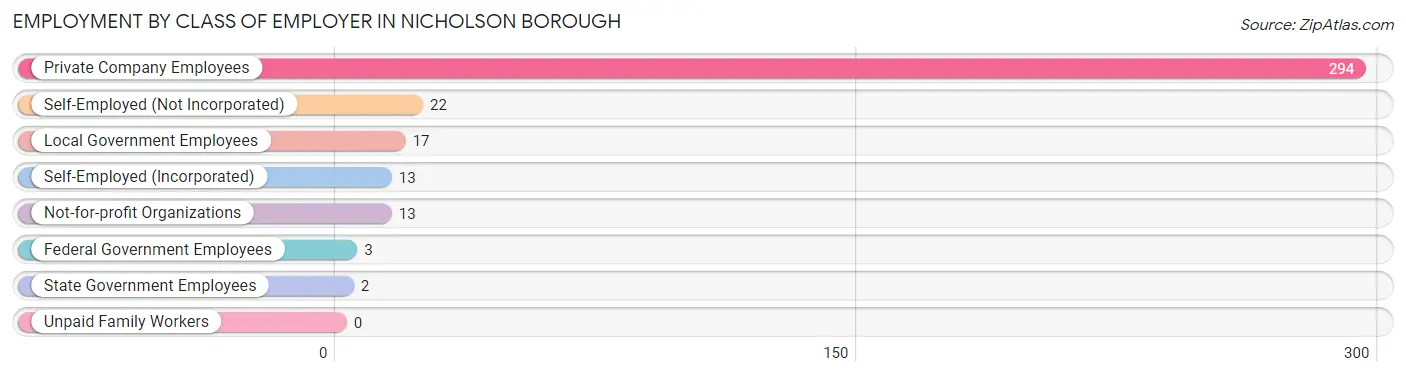
| Employer Class | # Employees | % Employees |
| Private Company Employees | 294 | 80.8% |
| Self-Employed (Incorporated) | 13 | 3.6% |
| Self-Employed (Not Incorporated) | 22 | 6.0% |
| Not-for-profit Organizations | 13 | 3.6% |
| Local Government Employees | 17 | 4.7% |
| State Government Employees | 2 | 0.5% |
| Federal Government Employees | 3 | 0.8% |
| Unpaid Family Workers | 0 | 0.0% |
| Total | 364 | 100.0% |
Employment Status by Age in Nicholson borough
According to the labor force statistics for Nicholson borough, out of the total population over 16 years of age (519), 71.5% or 371 individuals are in the labor force, with 1.4% or 5 of them unemployed. The age group with the highest labor force participation rate is 16 to 19 years, with 100.0% or 20 individuals in the labor force. Within the labor force, the 25 to 29 years age range has the highest percentage of unemployed individuals, with 8.3% or 3 of them being unemployed.
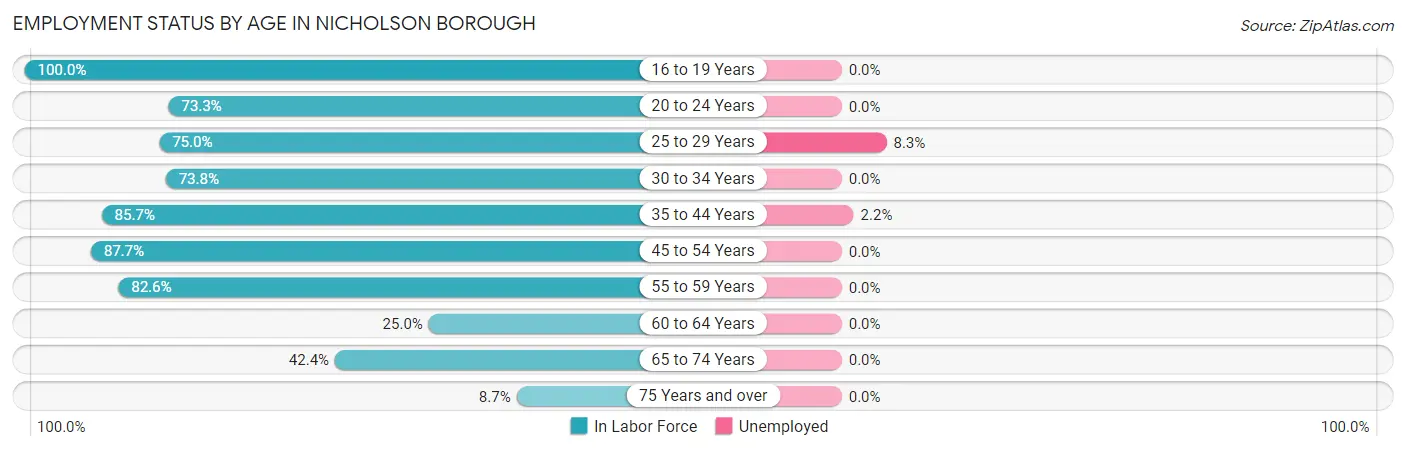
| Age Bracket | In Labor Force | Unemployed |
| 16 to 19 Years | 20 (100.0%) | 0 (0.0%) |
| 20 to 24 Years | 33 (73.3%) | 0 (0.0%) |
| 25 to 29 Years | 36 (75.0%) | 3 (8.3%) |
| 30 to 34 Years | 48 (73.8%) | 0 (0.0%) |
| 35 to 44 Years | 90 (85.7%) | 2 (2.2%) |
| 45 to 54 Years | 71 (87.7%) | 0 (0.0%) |
| 55 to 59 Years | 38 (82.6%) | 0 (0.0%) |
| 60 to 64 Years | 5 (25.0%) | 0 (0.0%) |
| 65 to 74 Years | 28 (42.4%) | 0 (0.0%) |
| 75 Years and over | 2 (8.7%) | 0 (0.0%) |
| Total | 371 (71.5%) | 5 (1.4%) |
Employment Status by Educational Attainment in Nicholson borough
According to labor force statistics for Nicholson borough, 78.9% of individuals (288) out of the total population between 25 and 64 years of age (365) are in the labor force, with 1.7% or 5 of them being unemployed. The group with the highest labor force participation rate are those with the educational attainment of bachelor's degree or higher, with 85.0% or 68 individuals in the labor force. Within the labor force, individuals with high school diploma education have the highest percentage of unemployment, with 2.7% or 3 of them being unemployed.
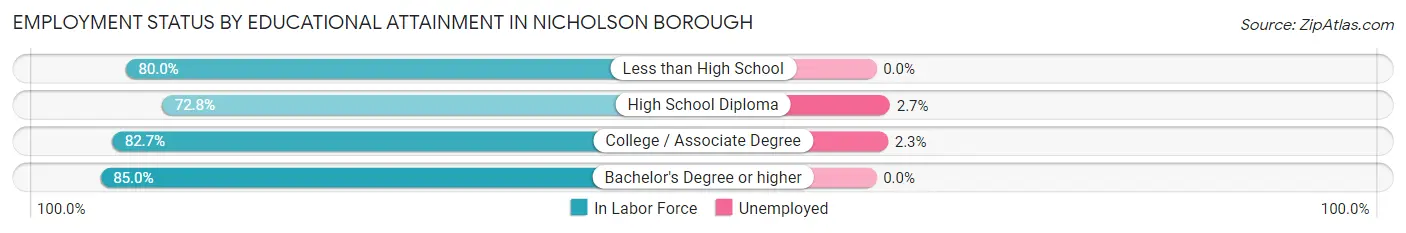
| Educational Attainment | In Labor Force | Unemployed |
| Less than High School | 24 (80.0%) | 0 (0.0%) |
| High School Diploma | 110 (72.8%) | 4 (2.7%) |
| College / Associate Degree | 86 (82.7%) | 2 (2.3%) |
| Bachelor's Degree or higher | 68 (85.0%) | 0 (0.0%) |
| Total | 288 (78.9%) | 6 (1.7%) |
Employment Occupations by Sex in Nicholson borough
Management, Business, Science and Arts Occupations
The most common Management, Business, Science and Arts occupations in Nicholson borough are Community & Social Service (37 | 10.2%), Management (34 | 9.4%), Computers, Engineering & Science (20 | 5.5%), Education Instruction & Library (19 | 5.2%), and Business & Financial (16 | 4.4%).
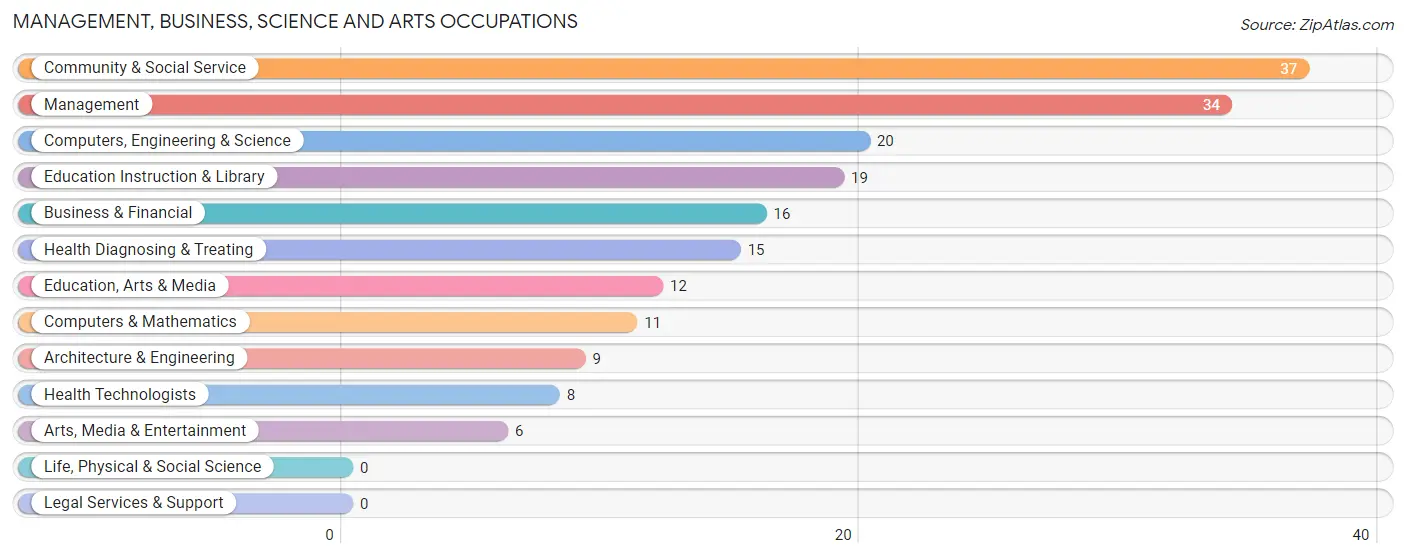
Management, Business, Science and Arts Occupations by Sex
Within the Management, Business, Science and Arts occupations in Nicholson borough, the most male-oriented occupations are Management (100.0%), Computers, Engineering & Science (100.0%), and Computers & Mathematics (100.0%), while the most female-oriented occupations are Community & Social Service (100.0%), Education, Arts & Media (100.0%), and Education Instruction & Library (100.0%).
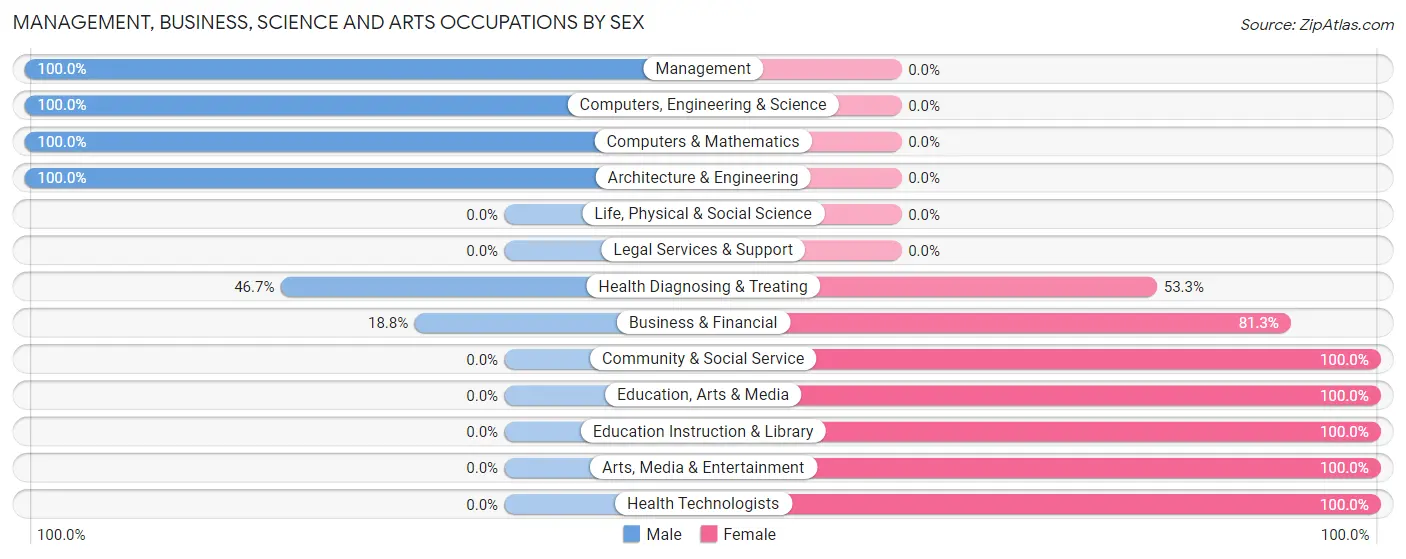
| Occupation | Male | Female |
| Management | 34 (100.0%) | 0 (0.0%) |
| Business & Financial | 3 (18.8%) | 13 (81.2%) |
| Computers, Engineering & Science | 20 (100.0%) | 0 (0.0%) |
| Computers & Mathematics | 11 (100.0%) | 0 (0.0%) |
| Architecture & Engineering | 9 (100.0%) | 0 (0.0%) |
| Life, Physical & Social Science | 0 (0.0%) | 0 (0.0%) |
| Community & Social Service | 0 (0.0%) | 37 (100.0%) |
| Education, Arts & Media | 0 (0.0%) | 12 (100.0%) |
| Legal Services & Support | 0 (0.0%) | 0 (0.0%) |
| Education Instruction & Library | 0 (0.0%) | 19 (100.0%) |
| Arts, Media & Entertainment | 0 (0.0%) | 6 (100.0%) |
| Health Diagnosing & Treating | 7 (46.7%) | 8 (53.3%) |
| Health Technologists | 0 (0.0%) | 8 (100.0%) |
| Total (Category) | 64 (52.5%) | 58 (47.5%) |
| Total (Overall) | 192 (52.9%) | 171 (47.1%) |
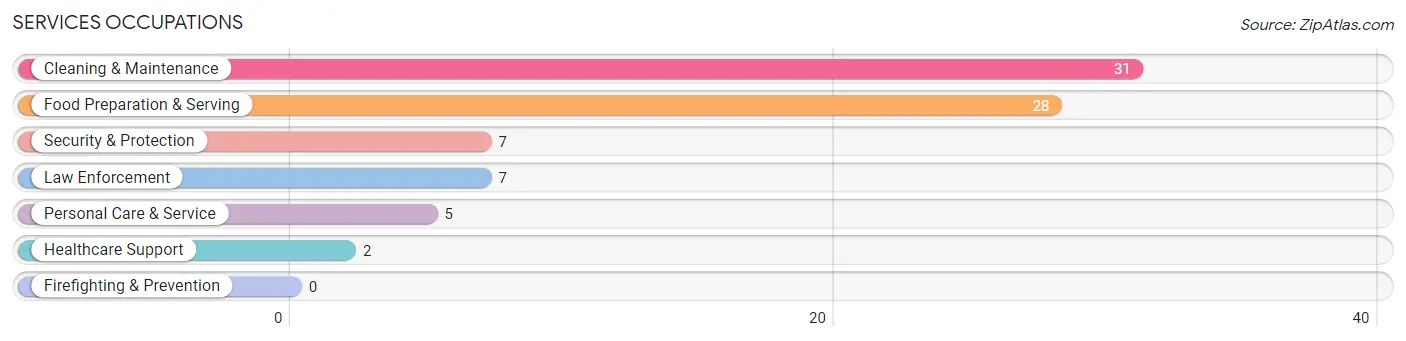
Services Occupations
The most common Services occupations in Nicholson borough are Cleaning & Maintenance (31 | 8.5%), Food Preparation & Serving (28 | 7.7%), Security & Protection (7 | 1.9%), Law Enforcement (7 | 1.9%), and Personal Care & Service (5 | 1.4%).
Services Occupations by Sex
Within the Services occupations in Nicholson borough, the most male-oriented occupations are Security & Protection (100.0%), Law Enforcement (100.0%), and Cleaning & Maintenance (51.6%), while the most female-oriented occupations are Healthcare Support (100.0%), Personal Care & Service (100.0%), and Food Preparation & Serving (75.0%).
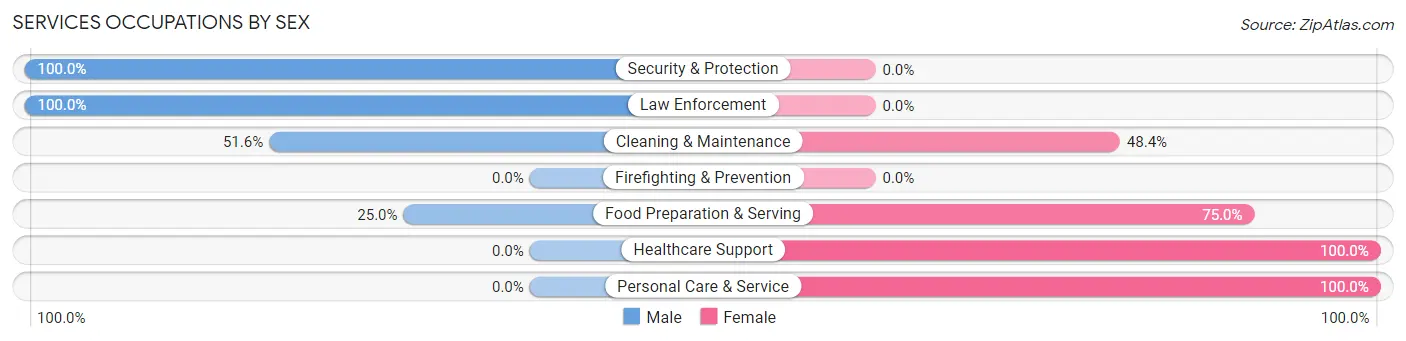
| Occupation | Male | Female |
| Healthcare Support | 0 (0.0%) | 2 (100.0%) |
| Security & Protection | 7 (100.0%) | 0 (0.0%) |
| Firefighting & Prevention | 0 (0.0%) | 0 (0.0%) |
| Law Enforcement | 7 (100.0%) | 0 (0.0%) |
| Food Preparation & Serving | 7 (25.0%) | 21 (75.0%) |
| Cleaning & Maintenance | 16 (51.6%) | 15 (48.4%) |
| Personal Care & Service | 0 (0.0%) | 5 (100.0%) |
| Total (Category) | 30 (41.1%) | 43 (58.9%) |
| Total (Overall) | 192 (52.9%) | 171 (47.1%) |
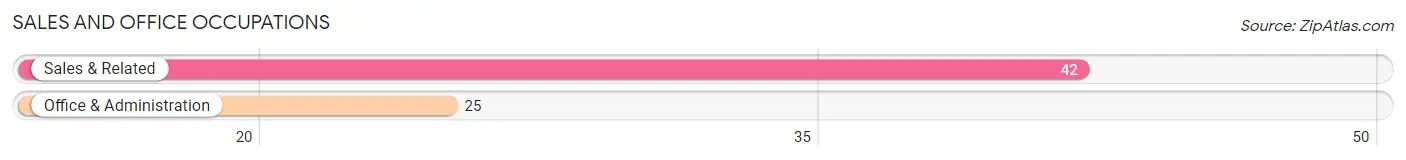
Sales and Office Occupations
The most common Sales and Office occupations in Nicholson borough are Sales & Related (42 | 11.6%), and Office & Administration (25 | 6.9%).
Sales and Office Occupations by Sex
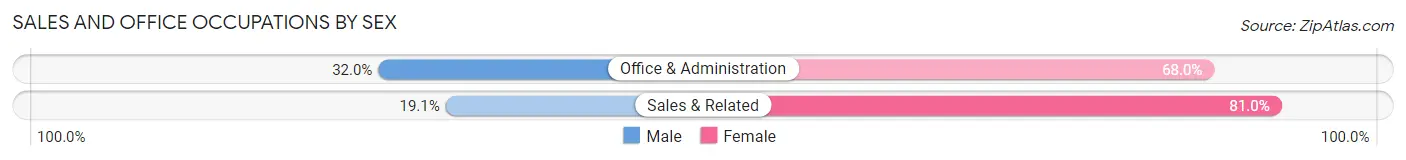
| Occupation | Male | Female |
| Sales & Related | 8 (19.1%) | 34 (80.9%) |
| Office & Administration | 8 (32.0%) | 17 (68.0%) |
| Total (Category) | 16 (23.9%) | 51 (76.1%) |
| Total (Overall) | 192 (52.9%) | 171 (47.1%) |
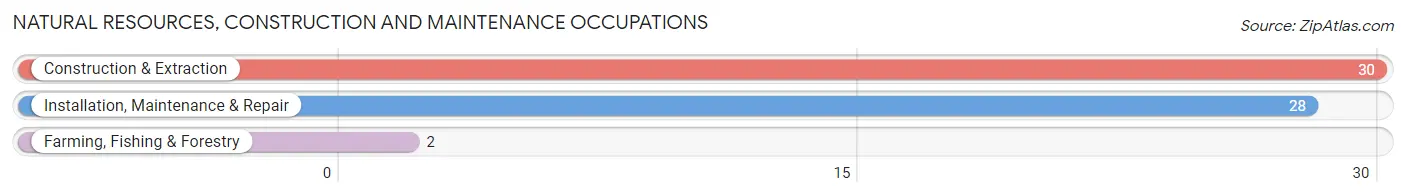
Natural Resources, Construction and Maintenance Occupations
The most common Natural Resources, Construction and Maintenance occupations in Nicholson borough are Construction & Extraction (30 | 8.3%), Installation, Maintenance & Repair (28 | 7.7%), and Farming, Fishing & Forestry (2 | 0.5%).
Natural Resources, Construction and Maintenance Occupations by Sex
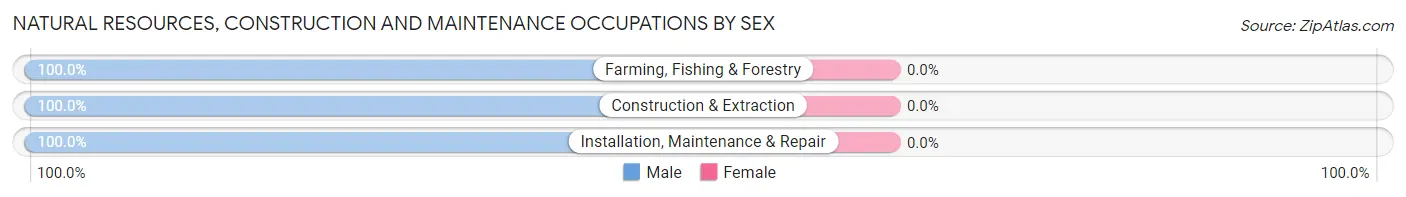
| Occupation | Male | Female |
| Farming, Fishing & Forestry | 2 (100.0%) | 0 (0.0%) |
| Construction & Extraction | 30 (100.0%) | 0 (0.0%) |
| Installation, Maintenance & Repair | 28 (100.0%) | 0 (0.0%) |
| Total (Category) | 60 (100.0%) | 0 (0.0%) |
| Total (Overall) | 192 (52.9%) | 171 (47.1%) |
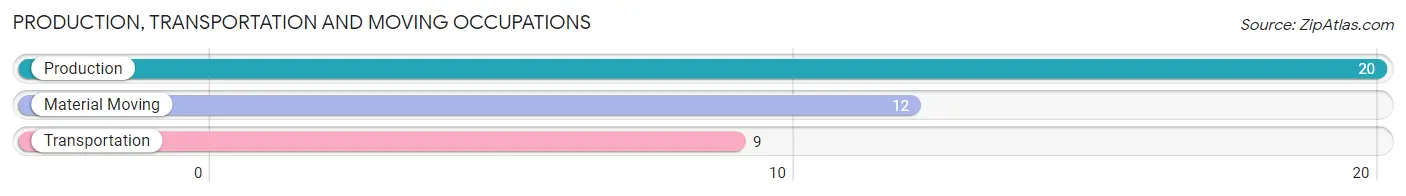
Production, Transportation and Moving Occupations
The most common Production, Transportation and Moving occupations in Nicholson borough are Production (20 | 5.5%), Material Moving (12 | 3.3%), and Transportation (9 | 2.5%).
Production, Transportation and Moving Occupations by Sex
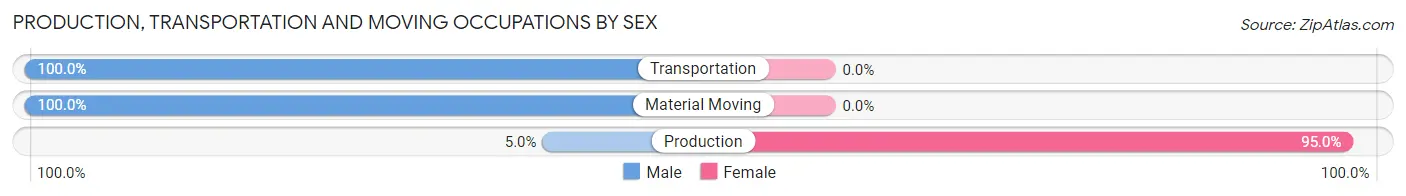
| Occupation | Male | Female |
| Production | 1 (5.0%) | 19 (95.0%) |
| Transportation | 9 (100.0%) | 0 (0.0%) |
| Material Moving | 12 (100.0%) | 0 (0.0%) |
| Total (Category) | 22 (53.7%) | 19 (46.3%) |
| Total (Overall) | 192 (52.9%) | 171 (47.1%) |
Employment Industries by Sex in Nicholson borough
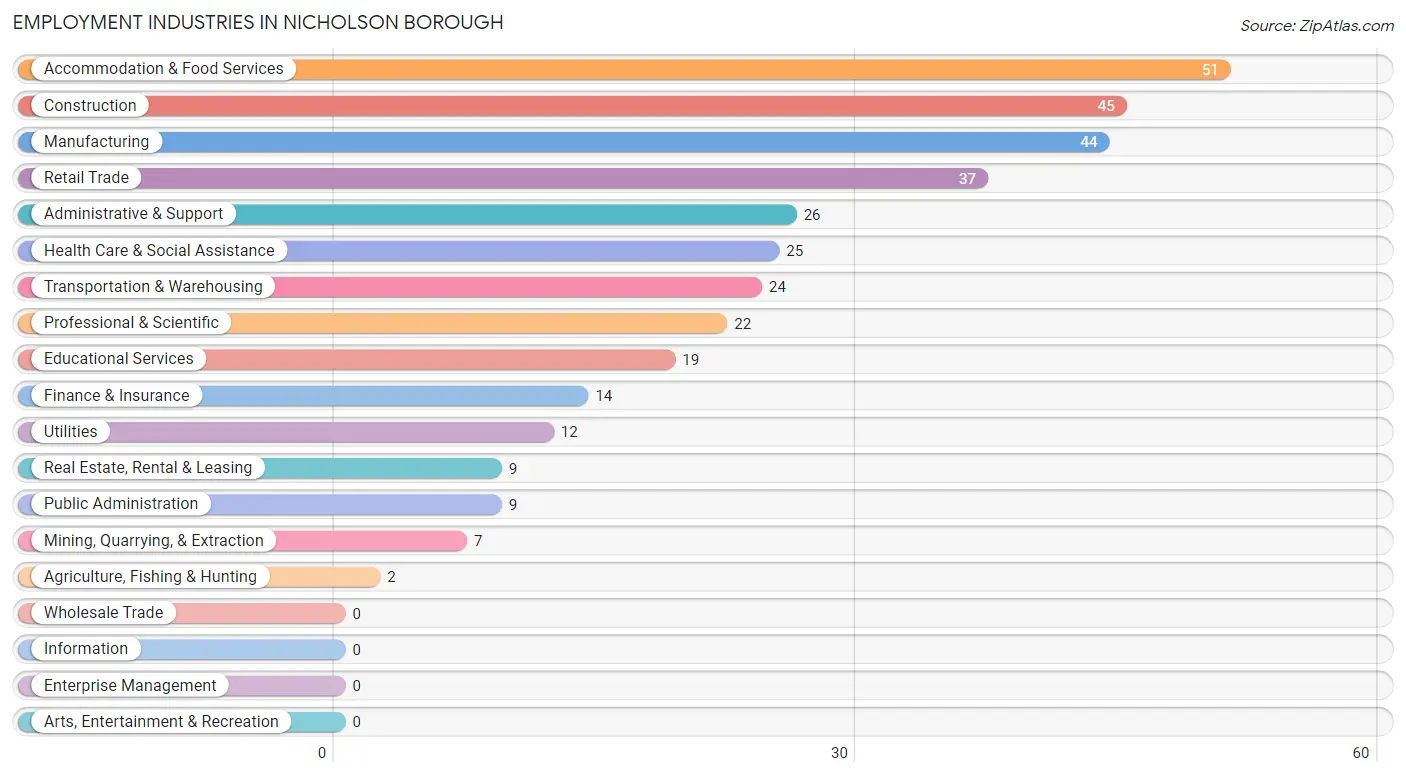
Employment Industries in Nicholson borough
The major employment industries in Nicholson borough include Accommodation & Food Services (51 | 14.1%), Construction (45 | 12.4%), Manufacturing (44 | 12.1%), Retail Trade (37 | 10.2%), and Administrative & Support (26 | 7.2%).
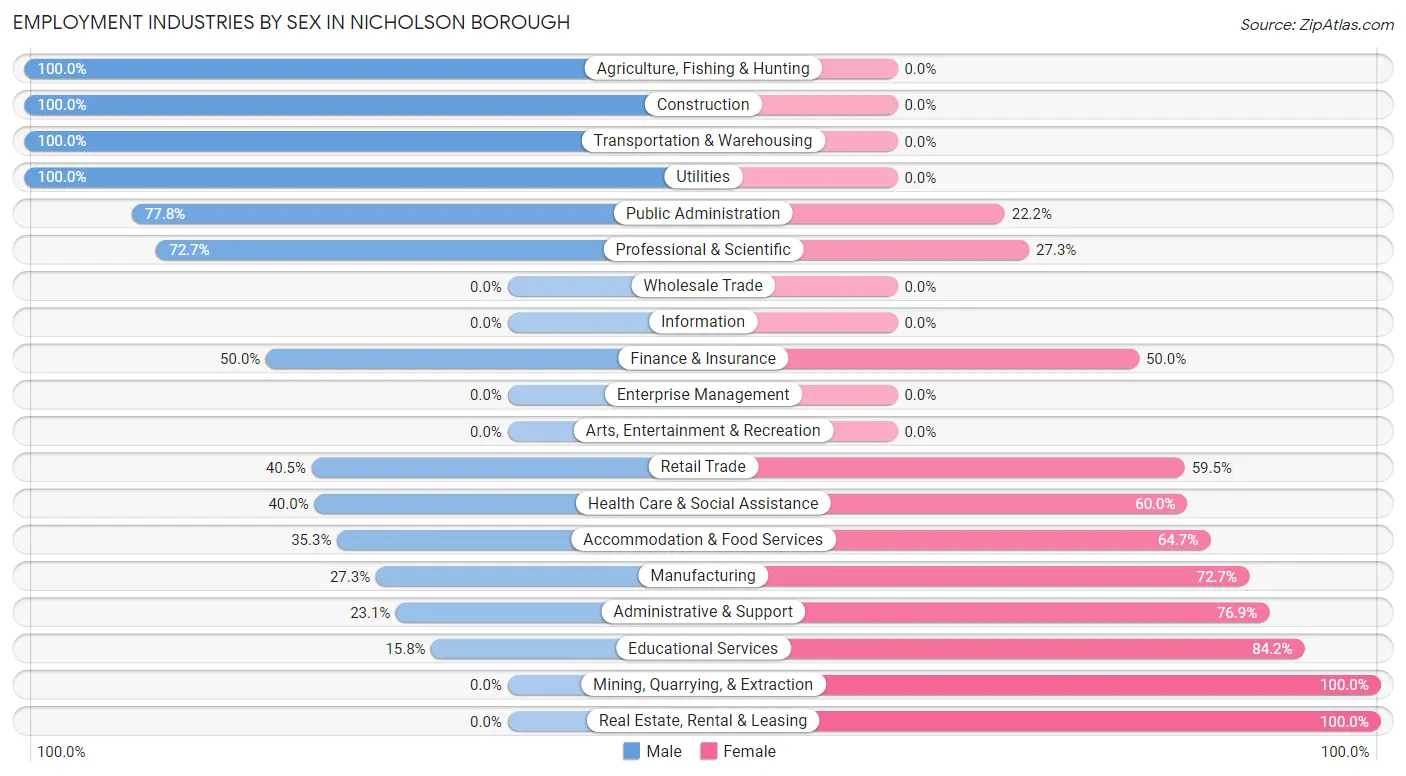
Employment Industries by Sex in Nicholson borough
The Nicholson borough industries that see more men than women are Agriculture, Fishing & Hunting (100.0%), Construction (100.0%), and Transportation & Warehousing (100.0%), whereas the industries that tend to have a higher number of women are Mining, Quarrying, & Extraction (100.0%), Real Estate, Rental & Leasing (100.0%), and Educational Services (84.2%).
| Industry | Male | Female |
| Agriculture, Fishing & Hunting | 2 (100.0%) | 0 (0.0%) |
| Mining, Quarrying, & Extraction | 0 (0.0%) | 7 (100.0%) |
| Construction | 45 (100.0%) | 0 (0.0%) |
| Manufacturing | 12 (27.3%) | 32 (72.7%) |
| Wholesale Trade | 0 (0.0%) | 0 (0.0%) |
| Retail Trade | 15 (40.5%) | 22 (59.5%) |
| Transportation & Warehousing | 24 (100.0%) | 0 (0.0%) |
| Utilities | 12 (100.0%) | 0 (0.0%) |
| Information | 0 (0.0%) | 0 (0.0%) |
| Finance & Insurance | 7 (50.0%) | 7 (50.0%) |
| Real Estate, Rental & Leasing | 0 (0.0%) | 9 (100.0%) |
| Professional & Scientific | 16 (72.7%) | 6 (27.3%) |
| Enterprise Management | 0 (0.0%) | 0 (0.0%) |
| Administrative & Support | 6 (23.1%) | 20 (76.9%) |
| Educational Services | 3 (15.8%) | 16 (84.2%) |
| Health Care & Social Assistance | 10 (40.0%) | 15 (60.0%) |
| Arts, Entertainment & Recreation | 0 (0.0%) | 0 (0.0%) |
| Accommodation & Food Services | 18 (35.3%) | 33 (64.7%) |
| Public Administration | 7 (77.8%) | 2 (22.2%) |
| Total | 192 (52.9%) | 171 (47.1%) |
Education in Nicholson borough
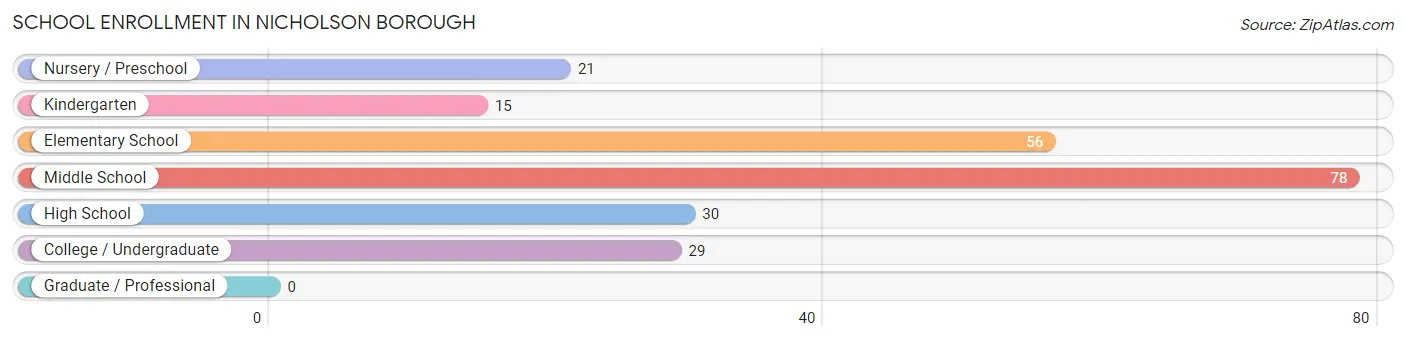
School Enrollment in Nicholson borough
The most common levels of schooling among the 229 students in Nicholson borough are middle school (78 | 34.1%), elementary school (56 | 24.4%), and high school (30 | 13.1%).
| School Level | # Students | % Students |
| Nursery / Preschool | 21 | 9.2% |
| Kindergarten | 15 | 6.6% |
| Elementary School | 56 | 24.4% |
| Middle School | 78 | 34.1% |
| High School | 30 | 13.1% |
| College / Undergraduate | 29 | 12.7% |
| Graduate / Professional | 0 | 0.0% |
| Total | 229 | 100.0% |
School Enrollment by Age by Funding Source in Nicholson borough
Out of a total of 229 students who are enrolled in schools in Nicholson borough, 27 (11.8%) attend a private institution, while the remaining 202 (88.2%) are enrolled in public schools. The age group of 25 to 34 year olds has the highest likelihood of being enrolled in private schools, with 8 (100.0% in the age bracket) enrolled. Conversely, the age group of 10 to 14 year olds has the lowest likelihood of being enrolled in a private school, with 88 (100.0% in the age bracket) attending a public institution.
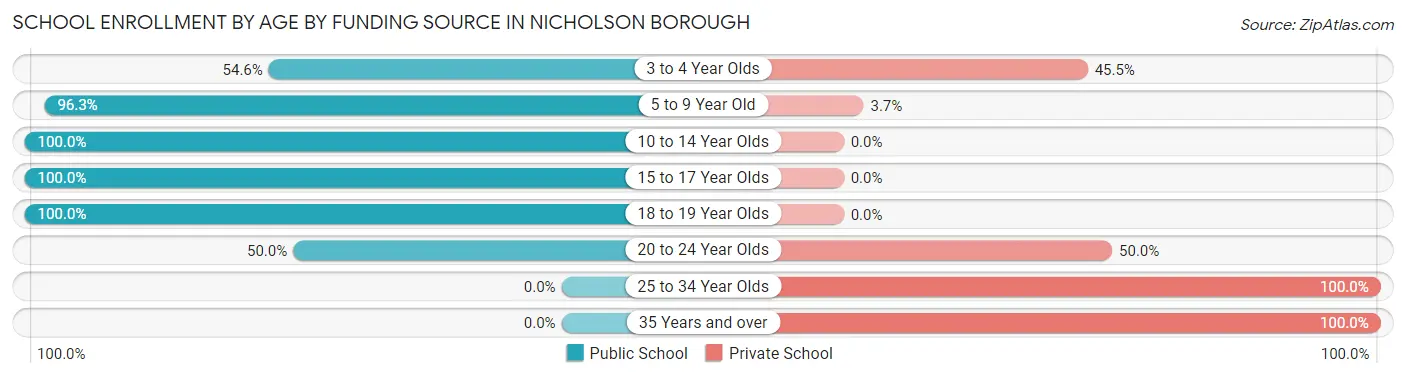
| Age Bracket | Public School | Private School |
| 3 to 4 Year Olds | 6 (54.5%) | 5 (45.5%) |
| 5 to 9 Year Old | 78 (96.3%) | 3 (3.7%) |
| 10 to 14 Year Olds | 88 (100.0%) | 0 (0.0%) |
| 15 to 17 Year Olds | 16 (100.0%) | 0 (0.0%) |
| 18 to 19 Year Olds | 10 (100.0%) | 0 (0.0%) |
| 20 to 24 Year Olds | 4 (50.0%) | 4 (50.0%) |
| 25 to 34 Year Olds | 0 (0.0%) | 8 (100.0%) |
| 35 Years and over | 0 (0.0%) | 7 (100.0%) |
| Total | 202 (88.2%) | 27 (11.8%) |
Educational Attainment by Field of Study in Nicholson borough
Education (29 | 27.9%), science & technology (21 | 20.2%), communications (12 | 11.5%), literature & languages (10 | 9.6%), and business (9 | 8.6%) are the most common fields of study among 104 individuals in Nicholson borough who have obtained a bachelor's degree or higher.
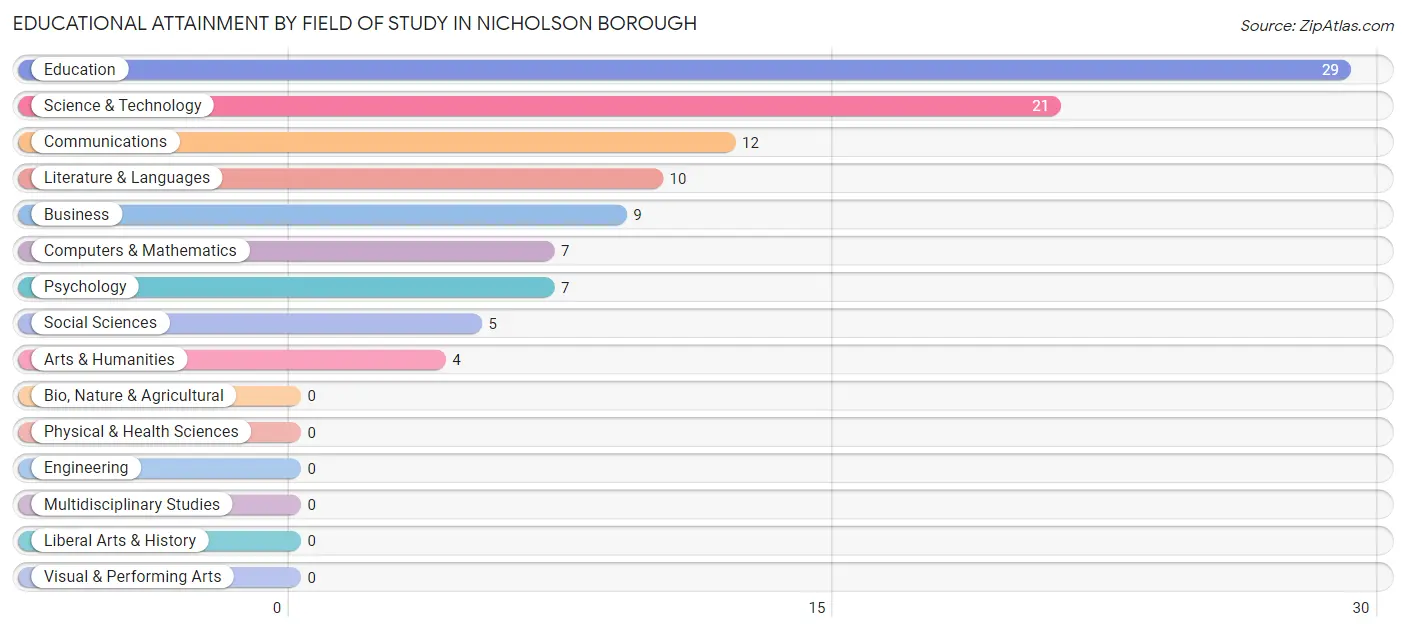
| Field of Study | # Graduates | % Graduates |
| Computers & Mathematics | 7 | 6.7% |
| Bio, Nature & Agricultural | 0 | 0.0% |
| Physical & Health Sciences | 0 | 0.0% |
| Psychology | 7 | 6.7% |
| Social Sciences | 5 | 4.8% |
| Engineering | 0 | 0.0% |
| Multidisciplinary Studies | 0 | 0.0% |
| Science & Technology | 21 | 20.2% |
| Business | 9 | 8.6% |
| Education | 29 | 27.9% |
| Literature & Languages | 10 | 9.6% |
| Liberal Arts & History | 0 | 0.0% |
| Visual & Performing Arts | 0 | 0.0% |
| Communications | 12 | 11.5% |
| Arts & Humanities | 4 | 3.8% |
| Total | 104 | 100.0% |
Transportation & Commute in Nicholson borough
Vehicle Availability by Sex in Nicholson borough
The most prevalent vehicle ownership categories in Nicholson borough are males with 2 vehicles (97, accounting for 49.7%) and females with 2 vehicles (73, making up 57.4%).
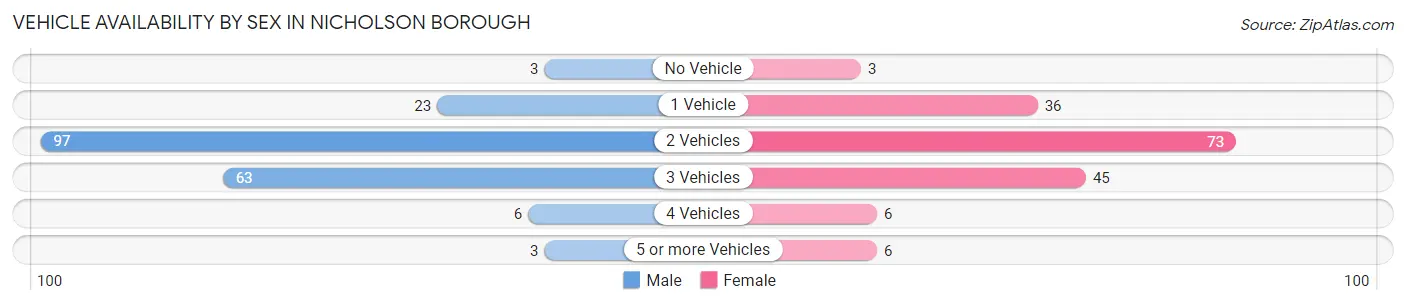
| Vehicles Available | Male | Female |
| No Vehicle | 3 (1.5%) | 3 (1.8%) |
| 1 Vehicle | 23 (11.8%) | 36 (21.3%) |
| 2 Vehicles | 97 (49.7%) | 73 (43.2%) |
| 3 Vehicles | 63 (32.3%) | 45 (26.6%) |
| 4 Vehicles | 6 (3.1%) | 6 (3.5%) |
| 5 or more Vehicles | 3 (1.5%) | 6 (3.5%) |
| Total | 195 (100.0%) | 169 (100.0%) |
Commute Time in Nicholson borough
The most frequently occuring commute durations in Nicholson borough are 30 to 34 minutes (81 commuters, 23.5%), 20 to 24 minutes (51 commuters, 14.8%), and 45 to 59 minutes (34 commuters, 9.9%).
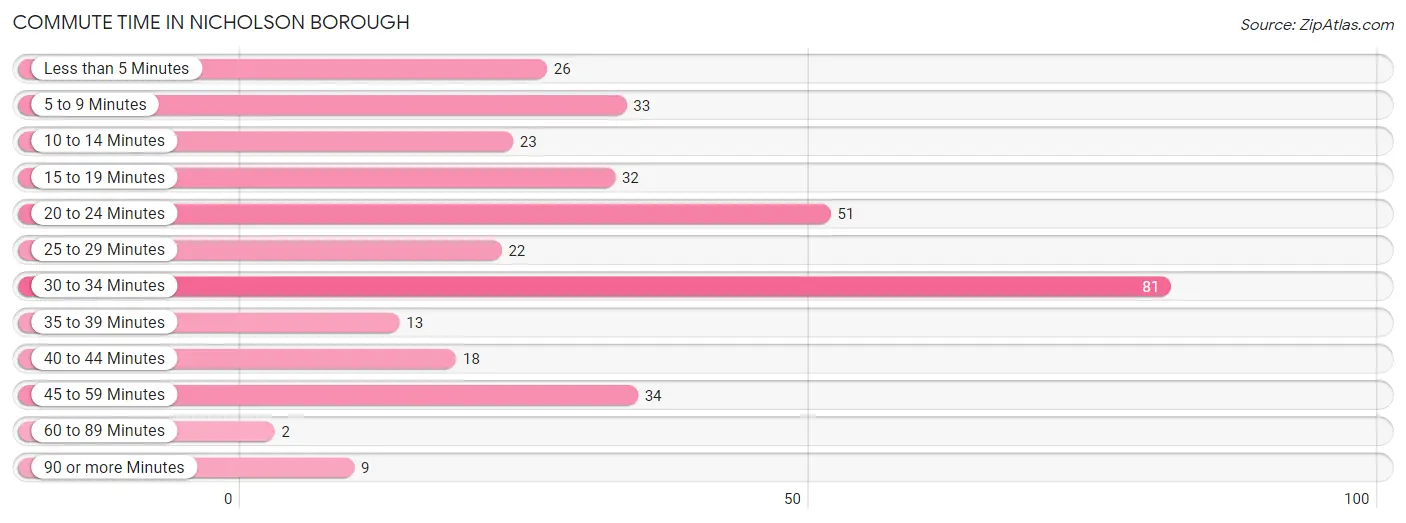
| Commute Time | # Commuters | % Commuters |
| Less than 5 Minutes | 26 | 7.6% |
| 5 to 9 Minutes | 33 | 9.6% |
| 10 to 14 Minutes | 23 | 6.7% |
| 15 to 19 Minutes | 32 | 9.3% |
| 20 to 24 Minutes | 51 | 14.8% |
| 25 to 29 Minutes | 22 | 6.4% |
| 30 to 34 Minutes | 81 | 23.5% |
| 35 to 39 Minutes | 13 | 3.8% |
| 40 to 44 Minutes | 18 | 5.2% |
| 45 to 59 Minutes | 34 | 9.9% |
| 60 to 89 Minutes | 2 | 0.6% |
| 90 or more Minutes | 9 | 2.6% |
Commute Time by Sex in Nicholson borough
The most common commute times in Nicholson borough are 30 to 34 minutes (41 commuters, 22.2%) for males and 30 to 34 minutes (40 commuters, 25.2%) for females.
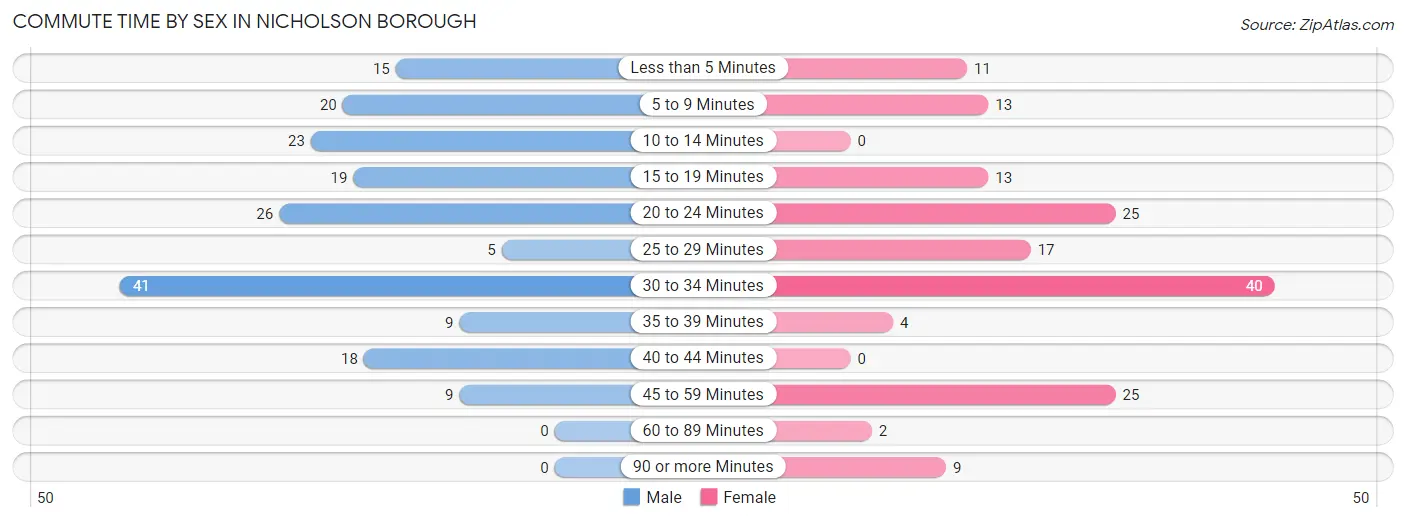
| Commute Time | Male | Female |
| Less than 5 Minutes | 15 (8.1%) | 11 (6.9%) |
| 5 to 9 Minutes | 20 (10.8%) | 13 (8.2%) |
| 10 to 14 Minutes | 23 (12.4%) | 0 (0.0%) |
| 15 to 19 Minutes | 19 (10.3%) | 13 (8.2%) |
| 20 to 24 Minutes | 26 (14.1%) | 25 (15.7%) |
| 25 to 29 Minutes | 5 (2.7%) | 17 (10.7%) |
| 30 to 34 Minutes | 41 (22.2%) | 40 (25.2%) |
| 35 to 39 Minutes | 9 (4.9%) | 4 (2.5%) |
| 40 to 44 Minutes | 18 (9.7%) | 0 (0.0%) |
| 45 to 59 Minutes | 9 (4.9%) | 25 (15.7%) |
| 60 to 89 Minutes | 0 (0.0%) | 2 (1.3%) |
| 90 or more Minutes | 0 (0.0%) | 9 (5.7%) |
Time of Departure to Work by Sex in Nicholson borough
The most frequent times of departure to work in Nicholson borough are 6:30 AM to 6:59 AM (49, 26.5%) for males and 7:00 AM to 7:29 AM (26, 16.4%) for females.
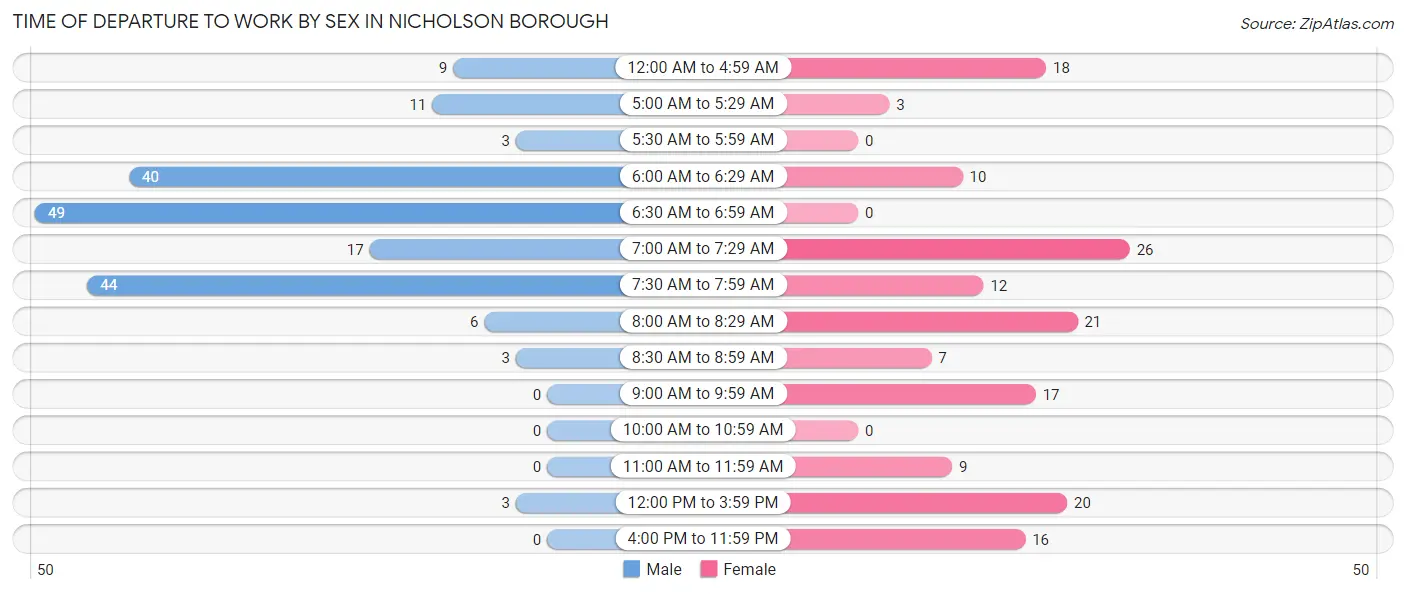
| Time of Departure | Male | Female |
| 12:00 AM to 4:59 AM | 9 (4.9%) | 18 (11.3%) |
| 5:00 AM to 5:29 AM | 11 (5.9%) | 3 (1.9%) |
| 5:30 AM to 5:59 AM | 3 (1.6%) | 0 (0.0%) |
| 6:00 AM to 6:29 AM | 40 (21.6%) | 10 (6.3%) |
| 6:30 AM to 6:59 AM | 49 (26.5%) | 0 (0.0%) |
| 7:00 AM to 7:29 AM | 17 (9.2%) | 26 (16.4%) |
| 7:30 AM to 7:59 AM | 44 (23.8%) | 12 (7.5%) |
| 8:00 AM to 8:29 AM | 6 (3.2%) | 21 (13.2%) |
| 8:30 AM to 8:59 AM | 3 (1.6%) | 7 (4.4%) |
| 9:00 AM to 9:59 AM | 0 (0.0%) | 17 (10.7%) |
| 10:00 AM to 10:59 AM | 0 (0.0%) | 0 (0.0%) |
| 11:00 AM to 11:59 AM | 0 (0.0%) | 9 (5.7%) |
| 12:00 PM to 3:59 PM | 3 (1.6%) | 20 (12.6%) |
| 4:00 PM to 11:59 PM | 0 (0.0%) | 16 (10.1%) |
| Total | 185 (100.0%) | 159 (100.0%) |
Housing Occupancy in Nicholson borough
Occupancy by Ownership in Nicholson borough
Of the total 265 dwellings in Nicholson borough, owner-occupied units account for 188 (70.9%), while renter-occupied units make up 77 (29.1%).
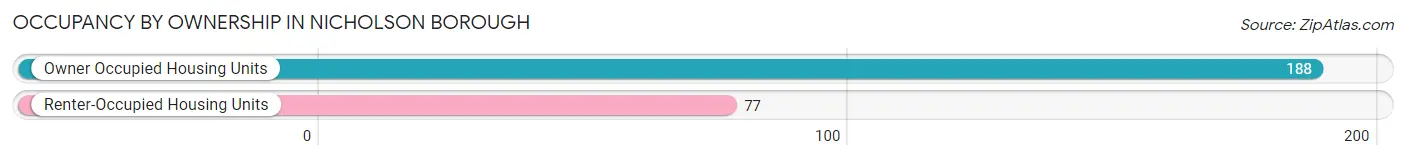
| Occupancy | # Housing Units | % Housing Units |
| Owner Occupied Housing Units | 188 | 70.9% |
| Renter-Occupied Housing Units | 77 | 29.1% |
| Total Occupied Housing Units | 265 | 100.0% |
Occupancy by Household Size in Nicholson borough
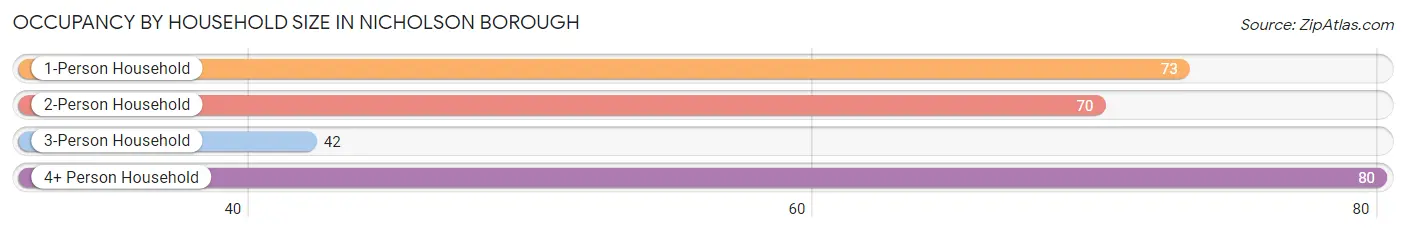
| Household Size | # Housing Units | % Housing Units |
| 1-Person Household | 73 | 27.6% |
| 2-Person Household | 70 | 26.4% |
| 3-Person Household | 42 | 15.9% |
| 4+ Person Household | 80 | 30.2% |
| Total Housing Units | 265 | 100.0% |
Occupancy by Ownership by Household Size in Nicholson borough
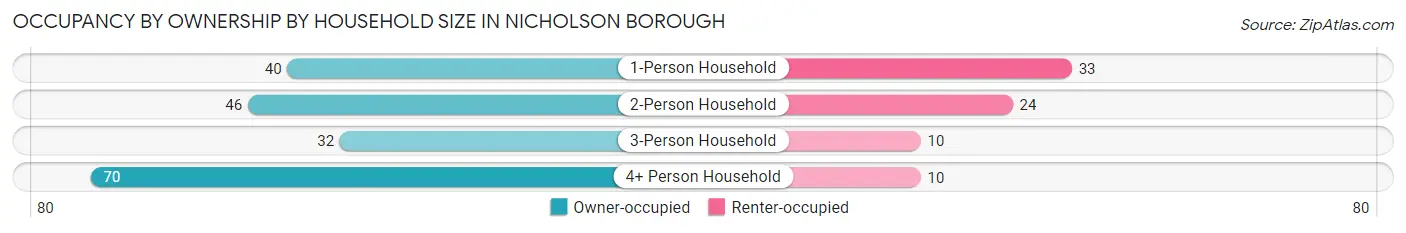
| Household Size | Owner-occupied | Renter-occupied |
| 1-Person Household | 40 (54.8%) | 33 (45.2%) |
| 2-Person Household | 46 (65.7%) | 24 (34.3%) |
| 3-Person Household | 32 (76.2%) | 10 (23.8%) |
| 4+ Person Household | 70 (87.5%) | 10 (12.5%) |
| Total Housing Units | 188 (70.9%) | 77 (29.1%) |
Occupancy by Educational Attainment in Nicholson borough
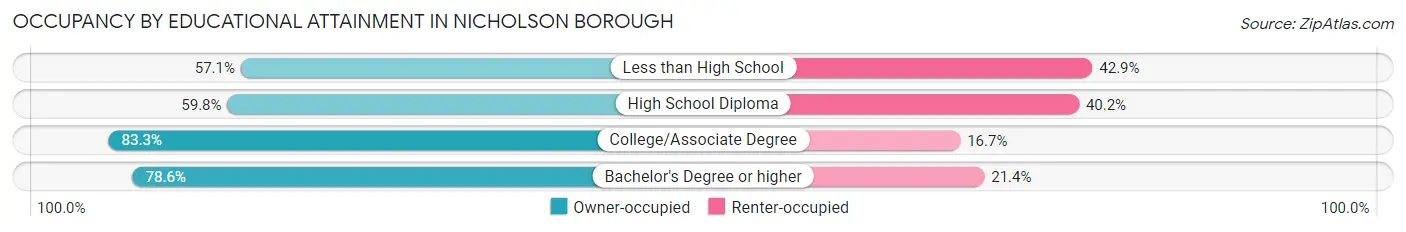
| Household Size | Owner-occupied | Renter-occupied |
| Less than High School | 12 (57.1%) | 9 (42.9%) |
| High School Diploma | 61 (59.8%) | 41 (40.2%) |
| College/Associate Degree | 60 (83.3%) | 12 (16.7%) |
| Bachelor's Degree or higher | 55 (78.6%) | 15 (21.4%) |
Occupancy by Age of Householder in Nicholson borough
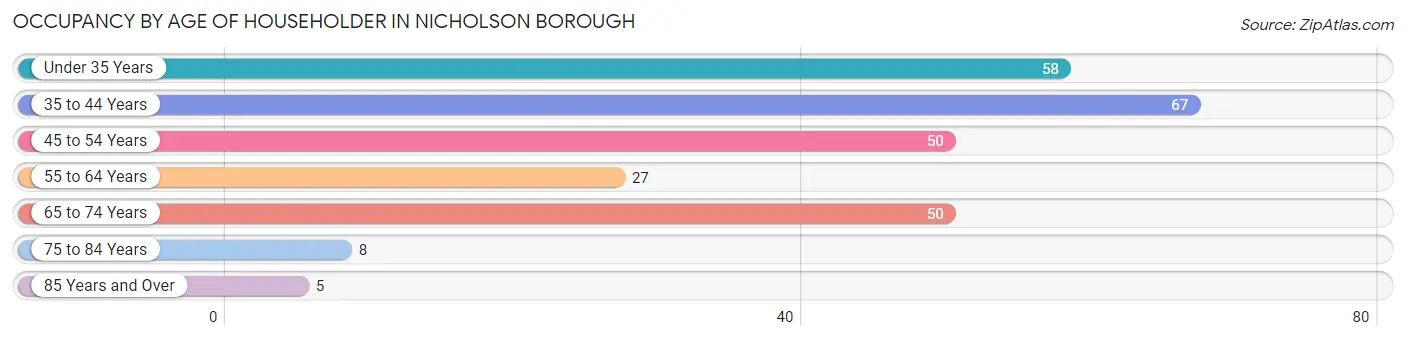
| Age Bracket | # Households | % Households |
| Under 35 Years | 58 | 21.9% |
| 35 to 44 Years | 67 | 25.3% |
| 45 to 54 Years | 50 | 18.9% |
| 55 to 64 Years | 27 | 10.2% |
| 65 to 74 Years | 50 | 18.9% |
| 75 to 84 Years | 8 | 3.0% |
| 85 Years and Over | 5 | 1.9% |
| Total | 265 | 100.0% |
Housing Finances in Nicholson borough
Median Income by Occupancy in Nicholson borough
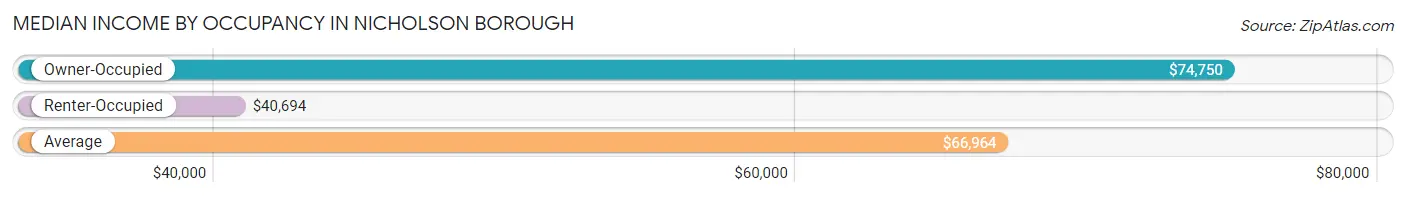
| Occupancy Type | # Households | Median Income |
| Owner-Occupied | 188 (70.9%) | $74,750 |
| Renter-Occupied | 77 (29.1%) | $40,694 |
| Average | 265 (100.0%) | $66,964 |
Occupancy by Householder Income Bracket in Nicholson borough
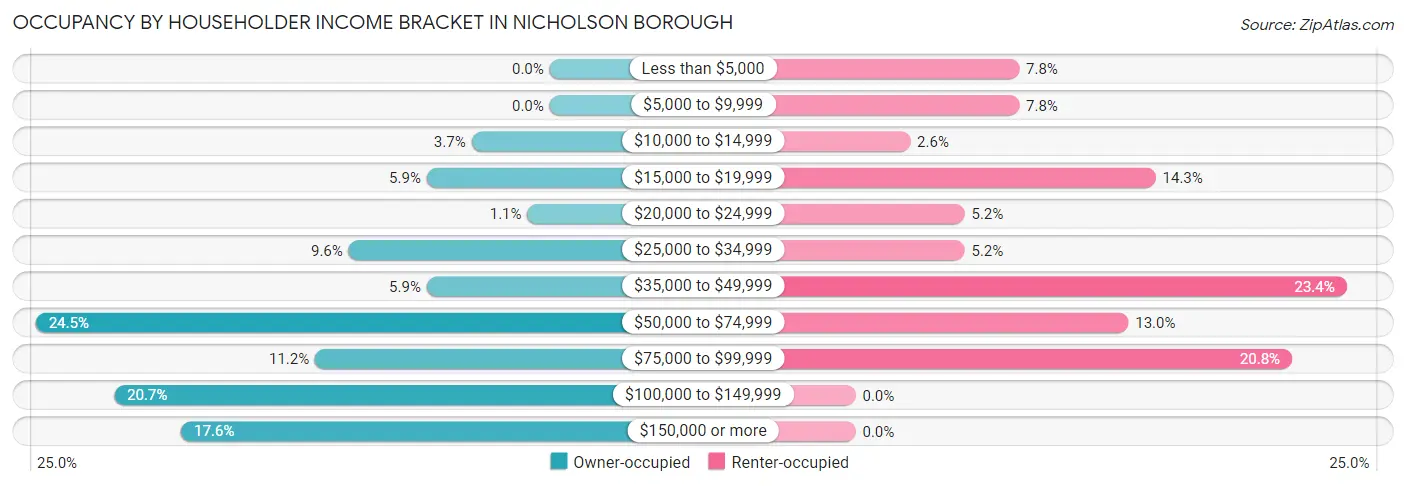
| Income Bracket | Owner-occupied | Renter-occupied |
| Less than $5,000 | 0 (0.0%) | 6 (7.8%) |
| $5,000 to $9,999 | 0 (0.0%) | 6 (7.8%) |
| $10,000 to $14,999 | 7 (3.7%) | 2 (2.6%) |
| $15,000 to $19,999 | 11 (5.9%) | 11 (14.3%) |
| $20,000 to $24,999 | 2 (1.1%) | 4 (5.2%) |
| $25,000 to $34,999 | 18 (9.6%) | 4 (5.2%) |
| $35,000 to $49,999 | 11 (5.9%) | 18 (23.4%) |
| $50,000 to $74,999 | 46 (24.5%) | 10 (13.0%) |
| $75,000 to $99,999 | 21 (11.2%) | 16 (20.8%) |
| $100,000 to $149,999 | 39 (20.7%) | 0 (0.0%) |
| $150,000 or more | 33 (17.5%) | 0 (0.0%) |
| Total | 188 (100.0%) | 77 (100.0%) |
Monthly Housing Cost Tiers in Nicholson borough
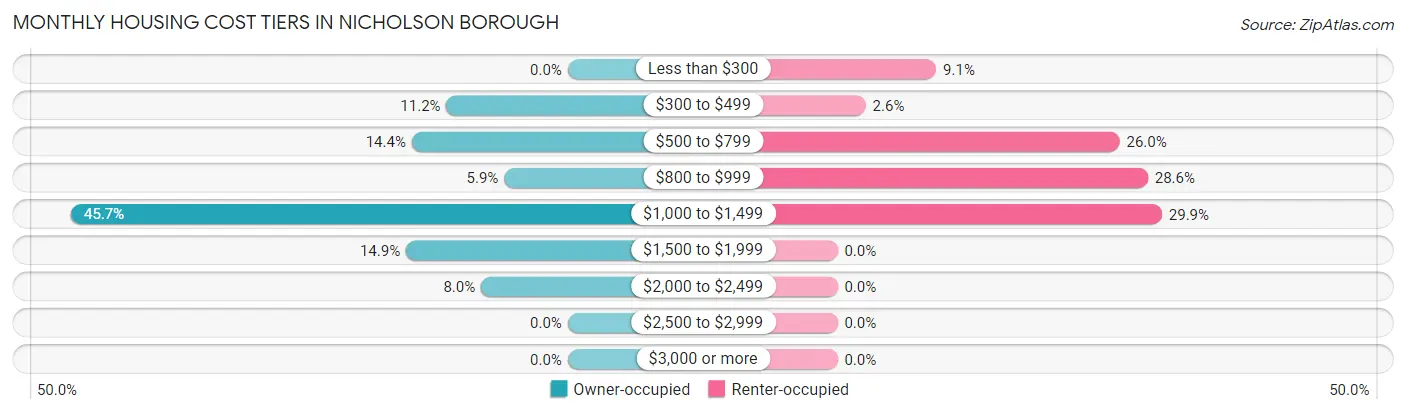
| Monthly Cost | Owner-occupied | Renter-occupied |
| Less than $300 | 0 (0.0%) | 7 (9.1%) |
| $300 to $499 | 21 (11.2%) | 2 (2.6%) |
| $500 to $799 | 27 (14.4%) | 20 (26.0%) |
| $800 to $999 | 11 (5.9%) | 22 (28.6%) |
| $1,000 to $1,499 | 86 (45.7%) | 23 (29.9%) |
| $1,500 to $1,999 | 28 (14.9%) | 0 (0.0%) |
| $2,000 to $2,499 | 15 (8.0%) | 0 (0.0%) |
| $2,500 to $2,999 | 0 (0.0%) | 0 (0.0%) |
| $3,000 or more | 0 (0.0%) | 0 (0.0%) |
| Total | 188 (100.0%) | 77 (100.0%) |
Physical Housing Characteristics in Nicholson borough
Housing Structures in Nicholson borough
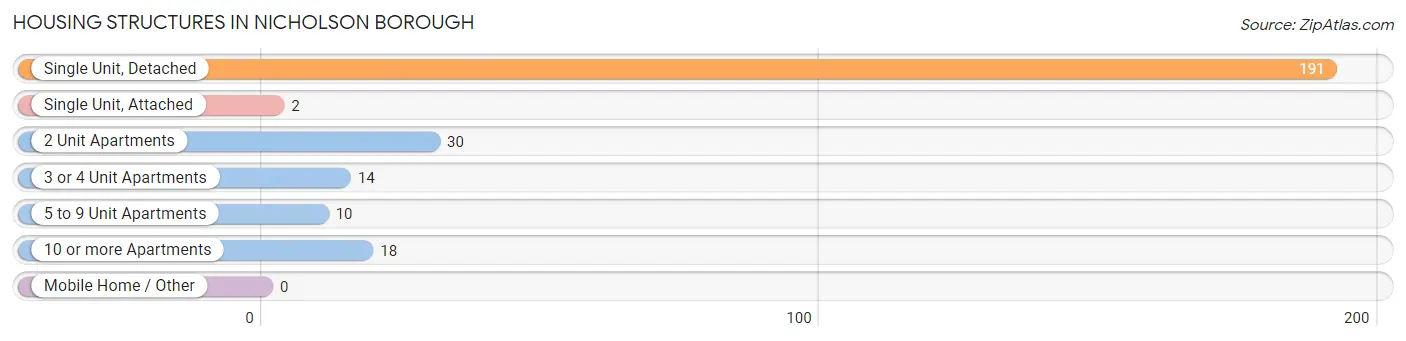
| Structure Type | # Housing Units | % Housing Units |
| Single Unit, Detached | 191 | 72.1% |
| Single Unit, Attached | 2 | 0.7% |
| 2 Unit Apartments | 30 | 11.3% |
| 3 or 4 Unit Apartments | 14 | 5.3% |
| 5 to 9 Unit Apartments | 10 | 3.8% |
| 10 or more Apartments | 18 | 6.8% |
| Mobile Home / Other | 0 | 0.0% |
| Total | 265 | 100.0% |
Housing Structures by Occupancy in Nicholson borough
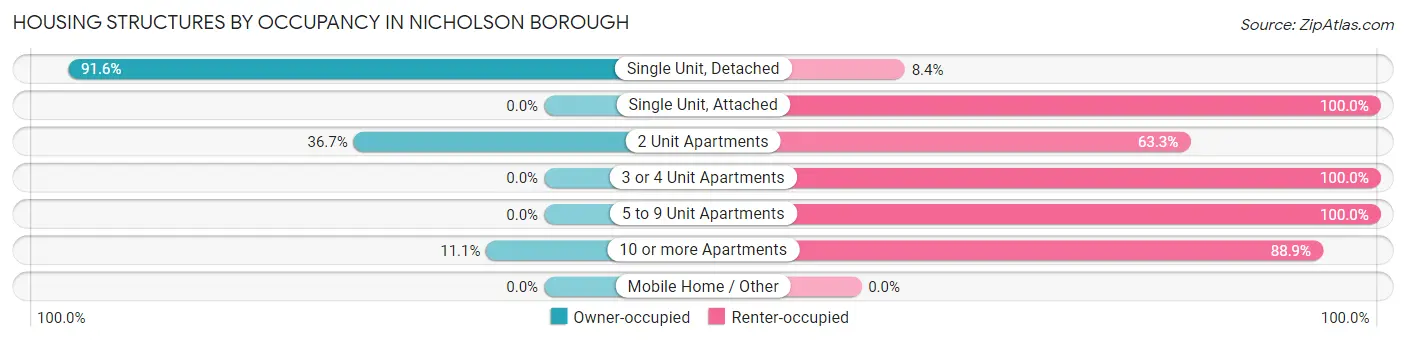
| Structure Type | Owner-occupied | Renter-occupied |
| Single Unit, Detached | 175 (91.6%) | 16 (8.4%) |
| Single Unit, Attached | 0 (0.0%) | 2 (100.0%) |
| 2 Unit Apartments | 11 (36.7%) | 19 (63.3%) |
| 3 or 4 Unit Apartments | 0 (0.0%) | 14 (100.0%) |
| 5 to 9 Unit Apartments | 0 (0.0%) | 10 (100.0%) |
| 10 or more Apartments | 2 (11.1%) | 16 (88.9%) |
| Mobile Home / Other | 0 (0.0%) | 0 (0.0%) |
| Total | 188 (70.9%) | 77 (29.1%) |
Housing Structures by Number of Rooms in Nicholson borough
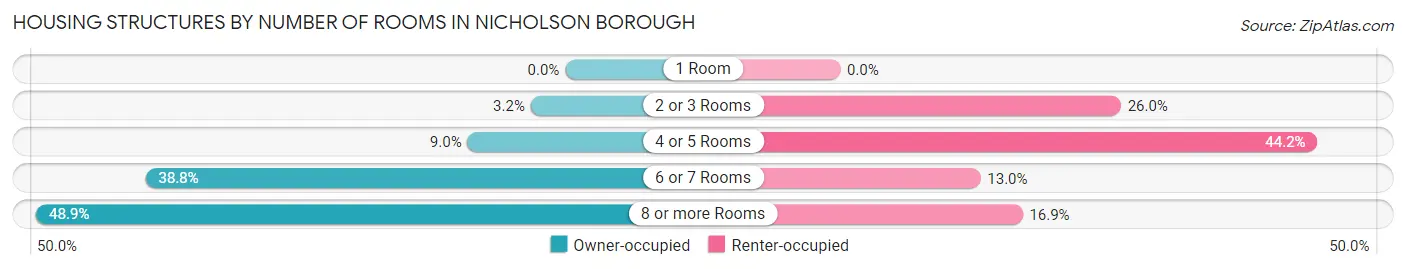
| Number of Rooms | Owner-occupied | Renter-occupied |
| 1 Room | 0 (0.0%) | 0 (0.0%) |
| 2 or 3 Rooms | 6 (3.2%) | 20 (26.0%) |
| 4 or 5 Rooms | 17 (9.0%) | 34 (44.2%) |
| 6 or 7 Rooms | 73 (38.8%) | 10 (13.0%) |
| 8 or more Rooms | 92 (48.9%) | 13 (16.9%) |
| Total | 188 (100.0%) | 77 (100.0%) |
Housing Structure by Heating Type in Nicholson borough
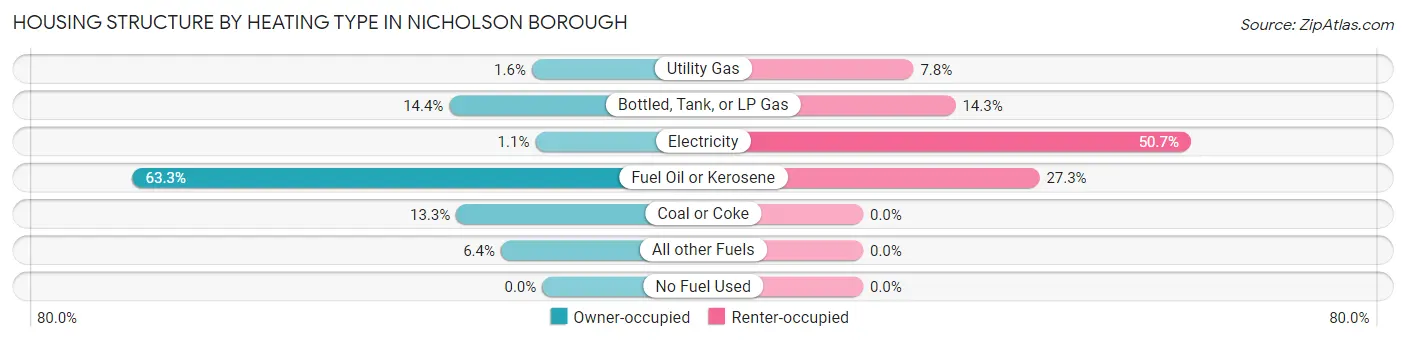
| Heating Type | Owner-occupied | Renter-occupied |
| Utility Gas | 3 (1.6%) | 6 (7.8%) |
| Bottled, Tank, or LP Gas | 27 (14.4%) | 11 (14.3%) |
| Electricity | 2 (1.1%) | 39 (50.6%) |
| Fuel Oil or Kerosene | 119 (63.3%) | 21 (27.3%) |
| Coal or Coke | 25 (13.3%) | 0 (0.0%) |
| All other Fuels | 12 (6.4%) | 0 (0.0%) |
| No Fuel Used | 0 (0.0%) | 0 (0.0%) |
| Total | 188 (100.0%) | 77 (100.0%) |
Household Vehicle Usage in Nicholson borough
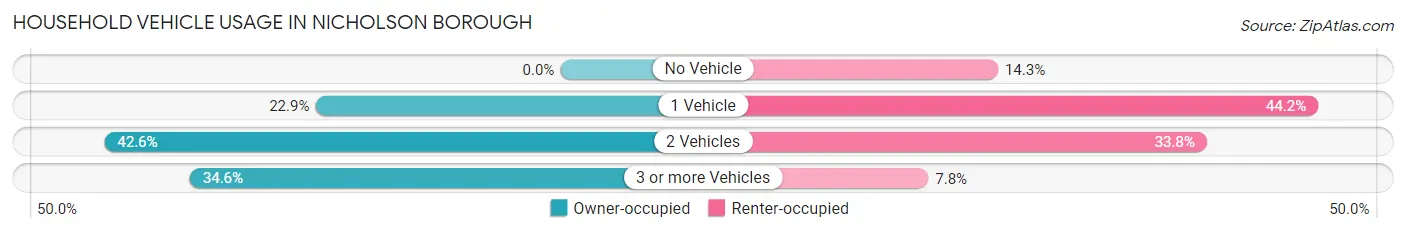
| Vehicles per Household | Owner-occupied | Renter-occupied |
| No Vehicle | 0 (0.0%) | 11 (14.3%) |
| 1 Vehicle | 43 (22.9%) | 34 (44.2%) |
| 2 Vehicles | 80 (42.5%) | 26 (33.8%) |
| 3 or more Vehicles | 65 (34.6%) | 6 (7.8%) |
| Total | 188 (100.0%) | 77 (100.0%) |
Real Estate & Mortgages in Nicholson borough
Real Estate and Mortgage Overview in Nicholson borough
| Characteristic | Without Mortgage | With Mortgage |
| Housing Units | 59 | 129 |
| Median Property Value | $144,500 | $159,700 |
| Median Household Income | $35,417 | $33 |
| Monthly Housing Costs | $638 | $0 |
| Real Estate Taxes | $2,608 | $0 |
Property Value by Mortgage Status in Nicholson borough
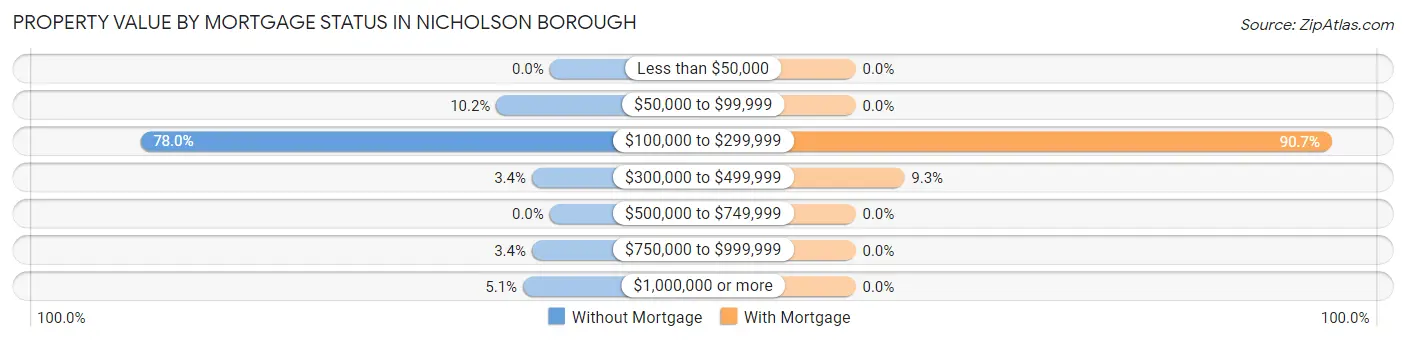
| Property Value | Without Mortgage | With Mortgage |
| Less than $50,000 | 0 (0.0%) | 0 (0.0%) |
| $50,000 to $99,999 | 6 (10.2%) | 0 (0.0%) |
| $100,000 to $299,999 | 46 (78.0%) | 117 (90.7%) |
| $300,000 to $499,999 | 2 (3.4%) | 12 (9.3%) |
| $500,000 to $749,999 | 0 (0.0%) | 0 (0.0%) |
| $750,000 to $999,999 | 2 (3.4%) | 0 (0.0%) |
| $1,000,000 or more | 3 (5.1%) | 0 (0.0%) |
| Total | 59 (100.0%) | 129 (100.0%) |
Household Income by Mortgage Status in Nicholson borough
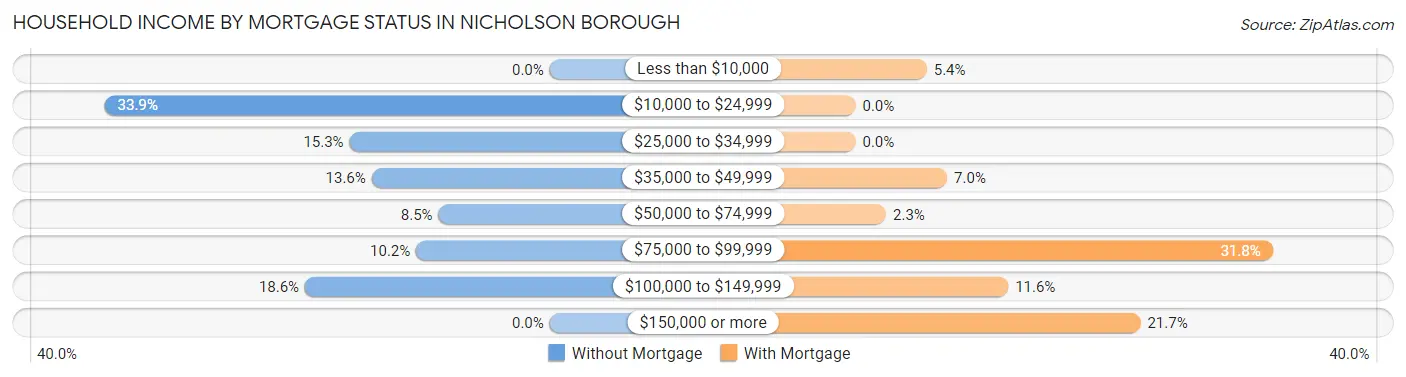
| Household Income | Without Mortgage | With Mortgage |
| Less than $10,000 | 0 (0.0%) | 7 (5.4%) |
| $10,000 to $24,999 | 20 (33.9%) | 0 (0.0%) |
| $25,000 to $34,999 | 9 (15.2%) | 0 (0.0%) |
| $35,000 to $49,999 | 8 (13.6%) | 9 (7.0%) |
| $50,000 to $74,999 | 5 (8.5%) | 3 (2.3%) |
| $75,000 to $99,999 | 6 (10.2%) | 41 (31.8%) |
| $100,000 to $149,999 | 11 (18.6%) | 15 (11.6%) |
| $150,000 or more | 0 (0.0%) | 28 (21.7%) |
| Total | 59 (100.0%) | 129 (100.0%) |
Property Value to Household Income Ratio in Nicholson borough
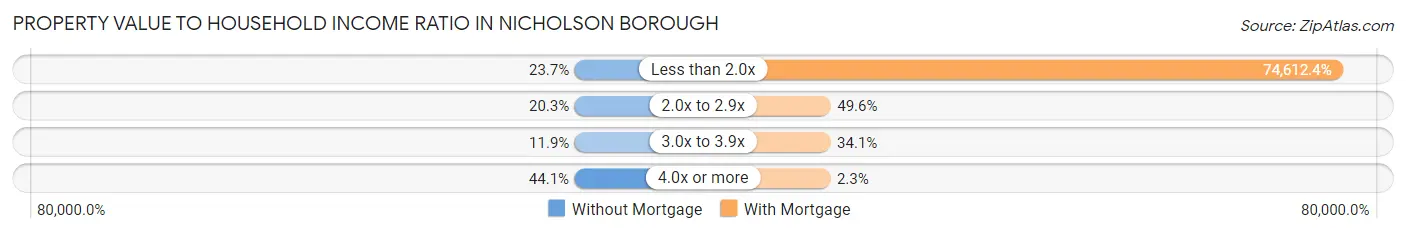
| Value-to-Income Ratio | Without Mortgage | With Mortgage |
| Less than 2.0x | 14 (23.7%) | 96,250 (74,612.4%) |
| 2.0x to 2.9x | 12 (20.3%) | 64 (49.6%) |
| 3.0x to 3.9x | 7 (11.9%) | 44 (34.1%) |
| 4.0x or more | 26 (44.1%) | 3 (2.3%) |
| Total | 59 (100.0%) | 129 (100.0%) |
Real Estate Taxes by Mortgage Status in Nicholson borough
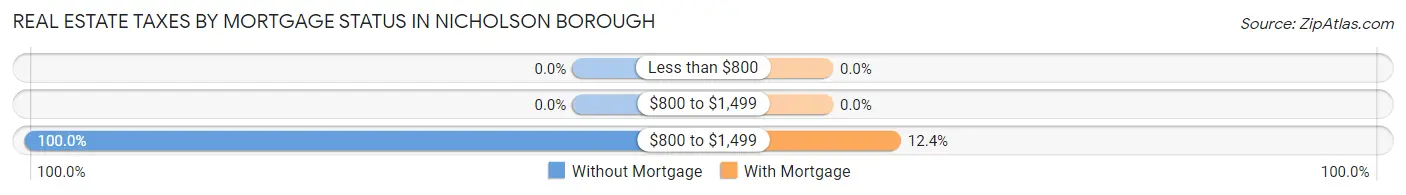
| Property Taxes | Without Mortgage | With Mortgage |
| Less than $800 | 0 (0.0%) | 0 (0.0%) |
| $800 to $1,499 | 0 (0.0%) | 0 (0.0%) |
| $800 to $1,499 | 59 (100.0%) | 16 (12.4%) |
| Total | 59 (100.0%) | 129 (100.0%) |
Health & Disability in Nicholson borough
Health Insurance Coverage by Age in Nicholson borough
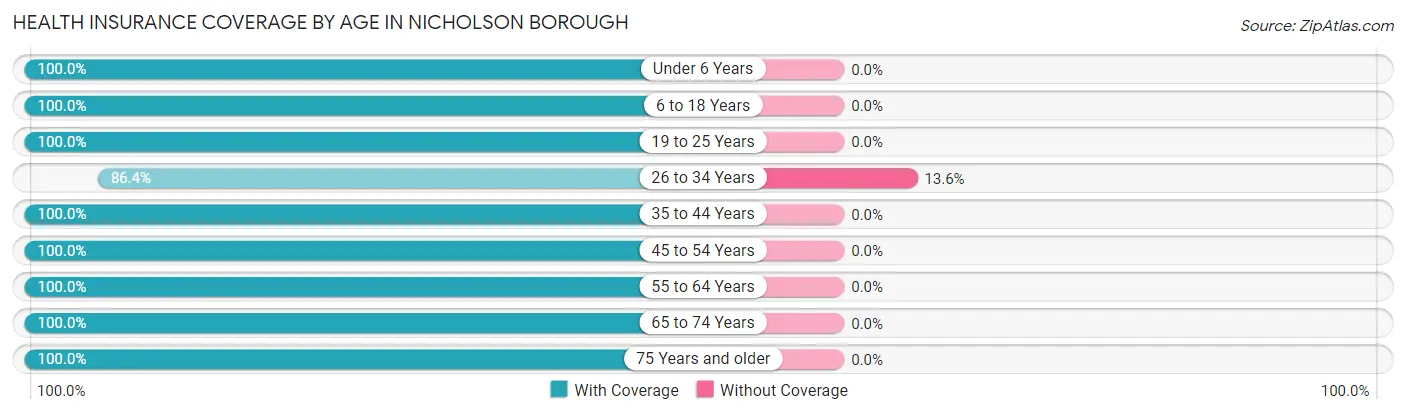
| Age Bracket | With Coverage | Without Coverage |
| Under 6 Years | 59 (100.0%) | 0 (0.0%) |
| 6 to 18 Years | 189 (100.0%) | 0 (0.0%) |
| 19 to 25 Years | 51 (100.0%) | 0 (0.0%) |
| 26 to 34 Years | 95 (86.4%) | 15 (13.6%) |
| 35 to 44 Years | 105 (100.0%) | 0 (0.0%) |
| 45 to 54 Years | 81 (100.0%) | 0 (0.0%) |
| 55 to 64 Years | 66 (100.0%) | 0 (0.0%) |
| 65 to 74 Years | 66 (100.0%) | 0 (0.0%) |
| 75 Years and older | 23 (100.0%) | 0 (0.0%) |
| Total | 735 (98.0%) | 15 (2.0%) |
Health Insurance Coverage by Citizenship Status in Nicholson borough
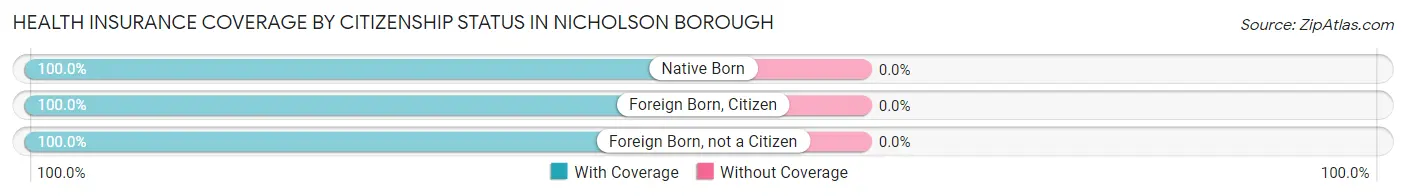
| Citizenship Status | With Coverage | Without Coverage |
| Native Born | 59 (100.0%) | 0 (0.0%) |
| Foreign Born, Citizen | 189 (100.0%) | 0 (0.0%) |
| Foreign Born, not a Citizen | 51 (100.0%) | 0 (0.0%) |
Health Insurance Coverage by Household Income in Nicholson borough
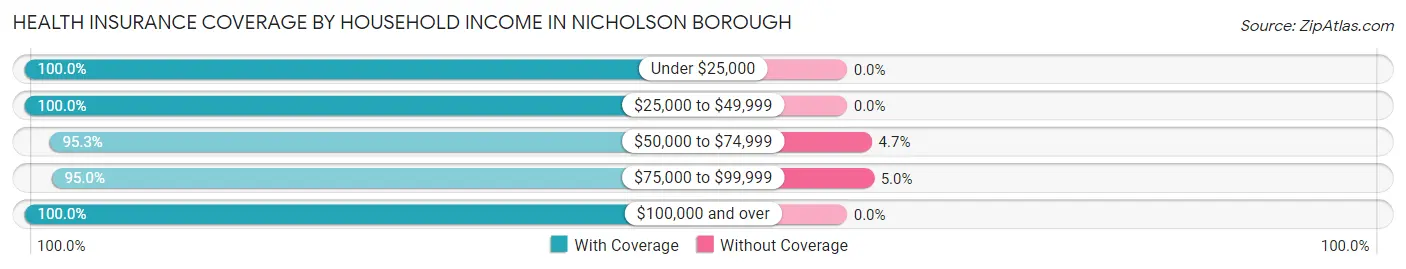
| Household Income | With Coverage | Without Coverage |
| Under $25,000 | 69 (100.0%) | 0 (0.0%) |
| $25,000 to $49,999 | 92 (100.0%) | 0 (0.0%) |
| $50,000 to $74,999 | 184 (95.3%) | 9 (4.7%) |
| $75,000 to $99,999 | 113 (95.0%) | 6 (5.0%) |
| $100,000 and over | 265 (100.0%) | 0 (0.0%) |
Public vs Private Health Insurance Coverage by Age in Nicholson borough
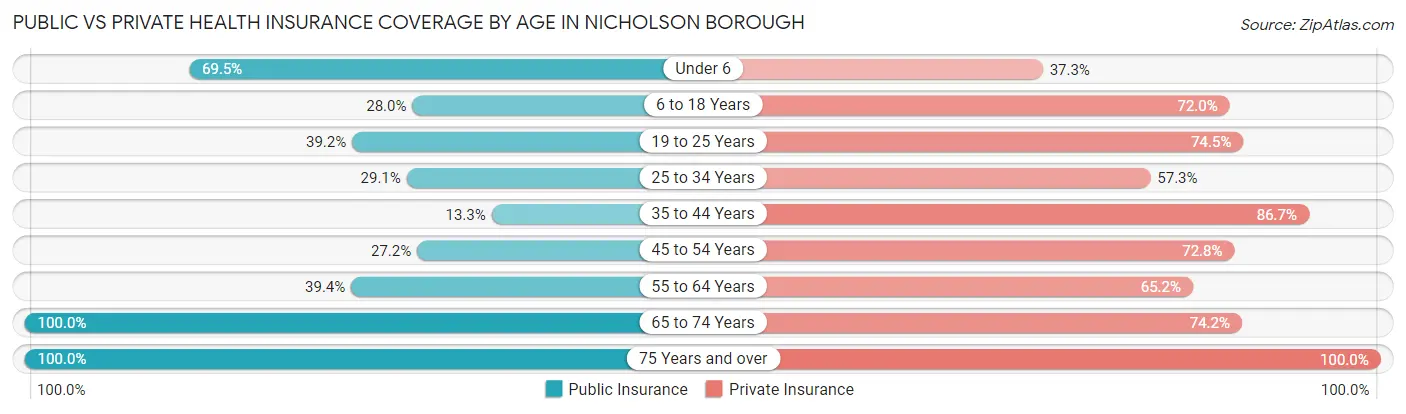
| Age Bracket | Public Insurance | Private Insurance |
| Under 6 | 41 (69.5%) | 22 (37.3%) |
| 6 to 18 Years | 53 (28.0%) | 136 (72.0%) |
| 19 to 25 Years | 20 (39.2%) | 38 (74.5%) |
| 25 to 34 Years | 32 (29.1%) | 63 (57.3%) |
| 35 to 44 Years | 14 (13.3%) | 91 (86.7%) |
| 45 to 54 Years | 22 (27.2%) | 59 (72.8%) |
| 55 to 64 Years | 26 (39.4%) | 43 (65.1%) |
| 65 to 74 Years | 66 (100.0%) | 49 (74.2%) |
| 75 Years and over | 23 (100.0%) | 23 (100.0%) |
| Total | 297 (39.6%) | 524 (69.9%) |
Disability Status by Sex by Age in Nicholson borough
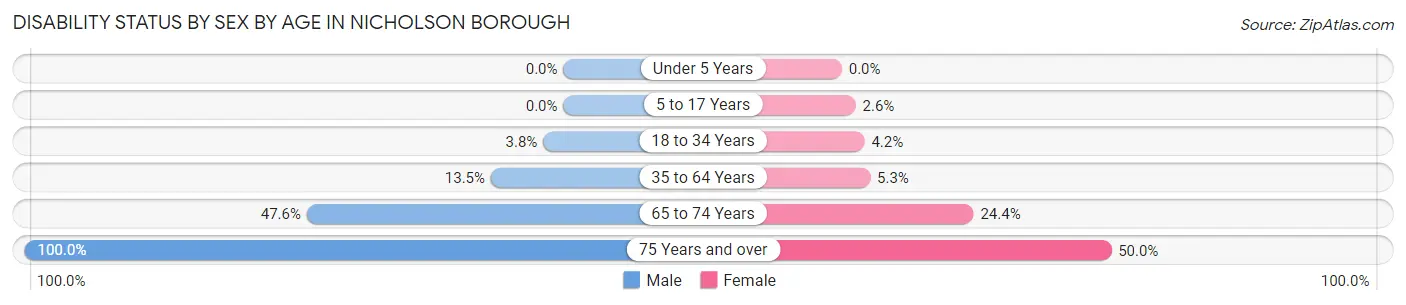
| Age Bracket | Male | Female |
| Under 5 Years | 0 (0.0%) | 0 (0.0%) |
| 5 to 17 Years | 0 (0.0%) | 2 (2.6%) |
| 18 to 34 Years | 3 (3.7%) | 4 (4.2%) |
| 35 to 64 Years | 16 (13.5%) | 7 (5.3%) |
| 65 to 74 Years | 10 (47.6%) | 11 (24.4%) |
| 75 Years and over | 5 (100.0%) | 9 (50.0%) |
Disability Class by Sex by Age in Nicholson borough
Disability Class: Hearing Difficulty
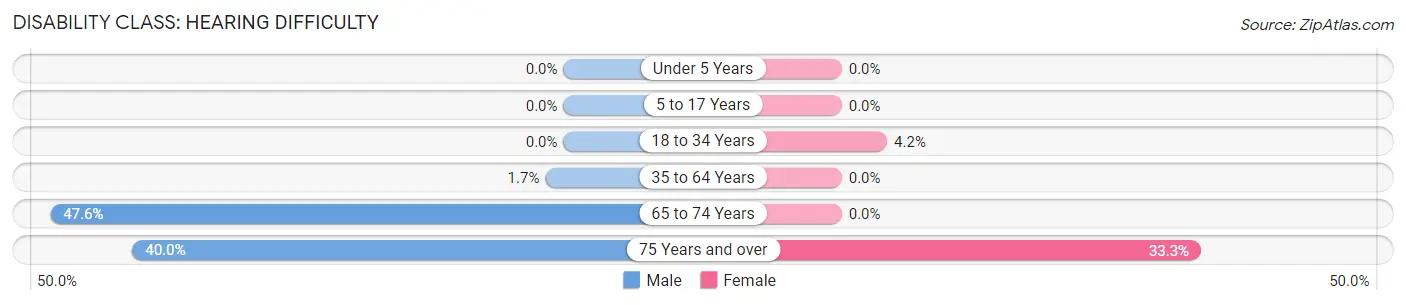
| Age Bracket | Male | Female |
| Under 5 Years | 0 (0.0%) | 0 (0.0%) |
| 5 to 17 Years | 0 (0.0%) | 0 (0.0%) |
| 18 to 34 Years | 0 (0.0%) | 4 (4.2%) |
| 35 to 64 Years | 2 (1.7%) | 0 (0.0%) |
| 65 to 74 Years | 10 (47.6%) | 0 (0.0%) |
| 75 Years and over | 2 (40.0%) | 6 (33.3%) |
Disability Class: Vision Difficulty
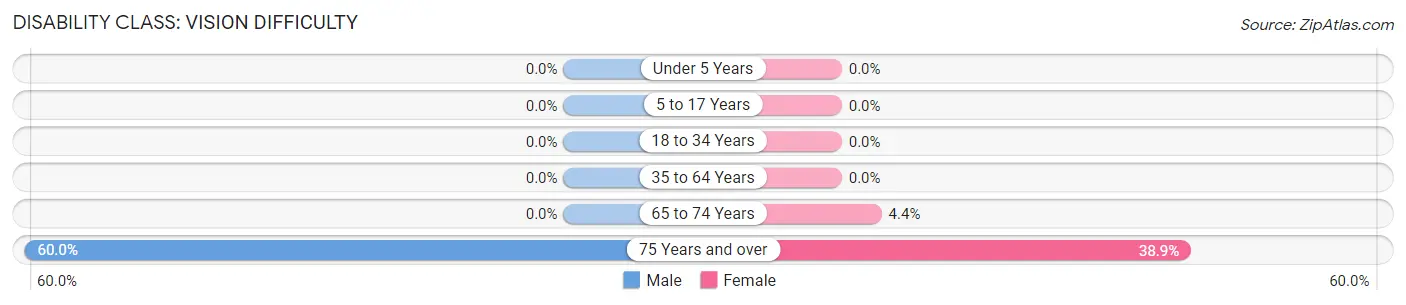
| Age Bracket | Male | Female |
| Under 5 Years | 0 (0.0%) | 0 (0.0%) |
| 5 to 17 Years | 0 (0.0%) | 0 (0.0%) |
| 18 to 34 Years | 0 (0.0%) | 0 (0.0%) |
| 35 to 64 Years | 0 (0.0%) | 0 (0.0%) |
| 65 to 74 Years | 0 (0.0%) | 2 (4.4%) |
| 75 Years and over | 3 (60.0%) | 7 (38.9%) |
Disability Class: Cognitive Difficulty
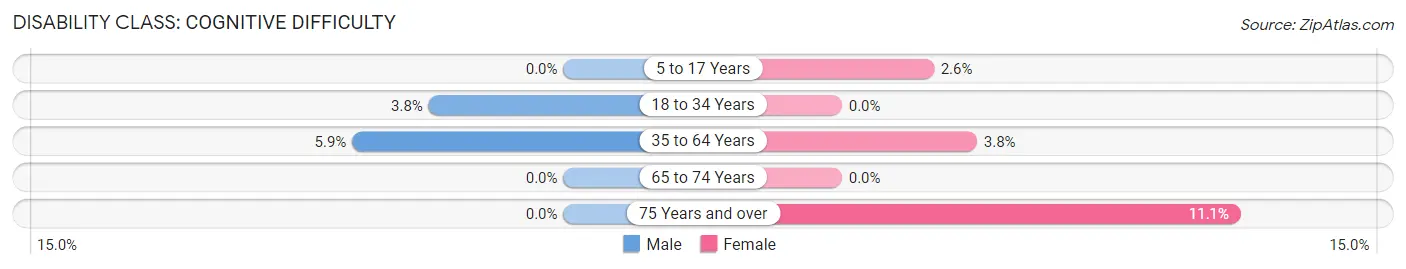
| Age Bracket | Male | Female |
| 5 to 17 Years | 0 (0.0%) | 2 (2.6%) |
| 18 to 34 Years | 3 (3.7%) | 0 (0.0%) |
| 35 to 64 Years | 7 (5.9%) | 5 (3.8%) |
| 65 to 74 Years | 0 (0.0%) | 0 (0.0%) |
| 75 Years and over | 0 (0.0%) | 2 (11.1%) |
Disability Class: Ambulatory Difficulty
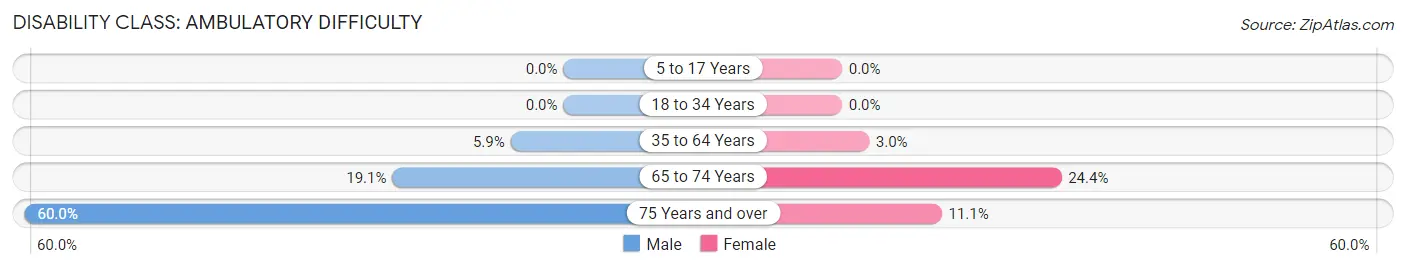
| Age Bracket | Male | Female |
| 5 to 17 Years | 0 (0.0%) | 0 (0.0%) |
| 18 to 34 Years | 0 (0.0%) | 0 (0.0%) |
| 35 to 64 Years | 7 (5.9%) | 4 (3.0%) |
| 65 to 74 Years | 4 (19.1%) | 11 (24.4%) |
| 75 Years and over | 3 (60.0%) | 2 (11.1%) |
Disability Class: Self-Care Difficulty
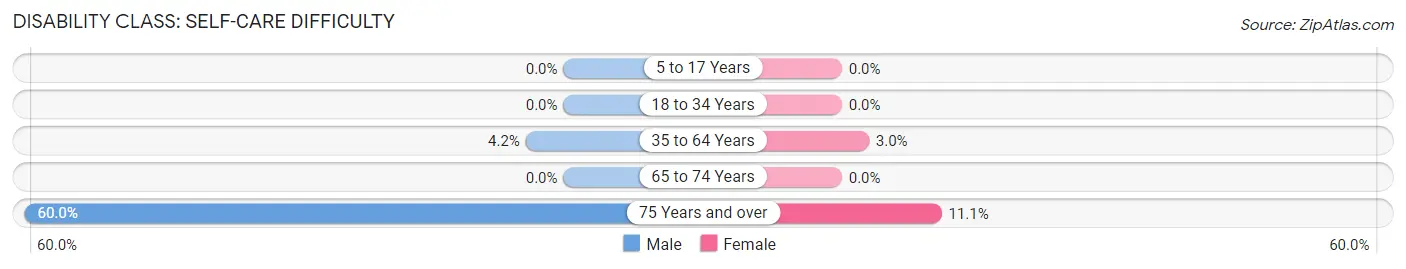
| Age Bracket | Male | Female |
| 5 to 17 Years | 0 (0.0%) | 0 (0.0%) |
| 18 to 34 Years | 0 (0.0%) | 0 (0.0%) |
| 35 to 64 Years | 5 (4.2%) | 4 (3.0%) |
| 65 to 74 Years | 0 (0.0%) | 0 (0.0%) |
| 75 Years and over | 3 (60.0%) | 2 (11.1%) |
Technology Access in Nicholson borough
Computing Device Access in Nicholson borough
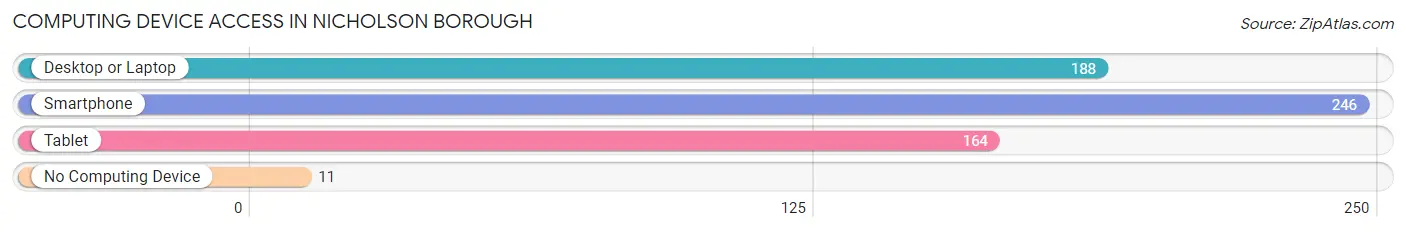
| Device Type | # Households | % Households |
| Desktop or Laptop | 188 | 70.9% |
| Smartphone | 246 | 92.8% |
| Tablet | 164 | 61.9% |
| No Computing Device | 11 | 4.2% |
| Total | 265 | 100.0% |
Internet Access in Nicholson borough
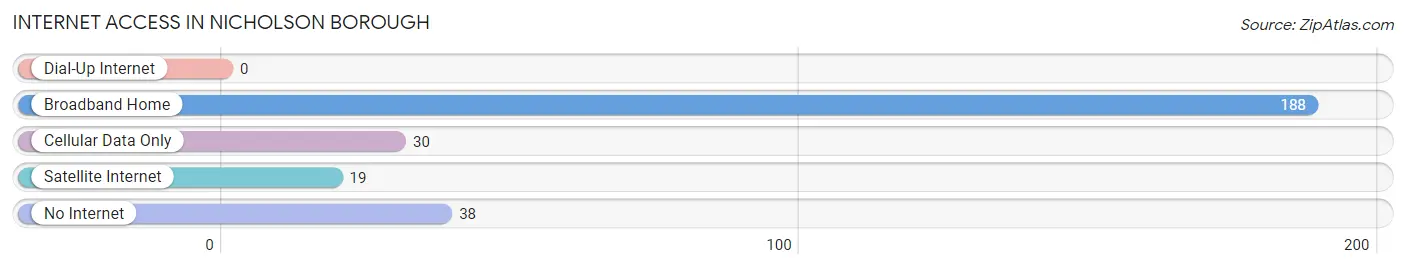
| Internet Type | # Households | % Households |
| Dial-Up Internet | 0 | 0.0% |
| Broadband Home | 188 | 70.9% |
| Cellular Data Only | 30 | 11.3% |
| Satellite Internet | 19 | 7.2% |
| No Internet | 38 | 14.3% |
| Total | 265 | 100.0% |
Nicholson borough Summary
Nicholson Borough is a small borough located in Wyoming County, Pennsylvania. It is situated in the Endless Mountains region of the state, and is part of the Scranton–Wilkes-Barre–Hazleton Metropolitan Statistical Area. The population of Nicholson Borough was 1,845 at the 2010 census.
Geography
Nicholson Borough is located at 41°33'25" North, 75°51'45" West (41.556944, -75.862500). According to the United States Census Bureau, the borough has a total area of 0.7 square miles (1.8 km2), all of it land.
The borough is located in the Endless Mountains region of Pennsylvania. It is situated in the Wyoming Valley, which is part of the larger Susquehanna River Valley. The borough is bordered by the townships of Northmoreland to the north, Tunkhannock to the east, and Clinton to the south.
History
Nicholson Borough was founded in 1845 by William Nicholson, a local landowner. The borough was incorporated in 1851.
The borough was originally a farming community, but in the late 19th century, it became a center for the coal mining industry. The coal industry was the main source of employment for the borough's residents until the mid-20th century, when the industry began to decline.
Economy
The economy of Nicholson Borough is largely based on tourism and retail. The borough is home to several small businesses, including restaurants, shops, and a local brewery.
The borough is also home to a number of small manufacturing companies, including a furniture manufacturer and a plastics manufacturer.
Demographics
As of the 2010 census, the population of Nicholson Borough was 1,845. The racial makeup of the borough was 97.3% White, 0.7% African American, 0.2% Native American, 0.3% Asian, 0.2% from other races, and 1.4% from two or more races. Hispanic or Latino of any race were 1.2% of the population.
The median income for a household in the borough was $37,917, and the median income for a family was $45,000. The per capita income for the borough was $19,945. About 11.2% of families and 13.2% of the population were below the poverty line, including 17.2% of those under age 18 and 8.2% of those age 65 or over.
Education
Nicholson Borough is served by the Tunkhannock Area School District. The borough is home to one elementary school, Nicholson Elementary School, which serves students in kindergarten through fifth grade. Students in grades six through twelve attend Tunkhannock Area Middle School and Tunkhannock Area High School.
The borough is also home to a branch of the Wyoming County Public Library
Conclusion
Nicholson Borough is a small borough located in Wyoming County, Pennsylvania. It is situated in the Endless Mountains region of the state, and is part of the Scranton–Wilkes-Barre–Hazleton Metropolitan Statistical Area. The population of Nicholson Borough was 1,845 at the 2010 census. The economy of Nicholson Borough is largely based on tourism and retail, and the borough is home to several small businesses. The racial makeup of the borough was 97.3% White, 0.7% African American, 0.2% Native American, 0.3% Asian, 0.2% from other races, and 1.4% from two or more races. The median income for a household in the borough was $37,917, and the median income for a family was $45,000. Nicholson Borough is served by the Tunkhannock Area School District, and is home to a branch of the Wyoming County Public Library.
Common Questions
What is Per Capita Income in Nicholson borough?
Per Capita income in Nicholson borough is $26,163.
What is the Median Family Income in Nicholson borough?
Median Family Income in Nicholson borough is $74,250.
What is the Median Household income in Nicholson borough?
Median Household Income in Nicholson borough is $66,964.
What is Income or Wage Gap in Nicholson borough?
Income or Wage Gap in Nicholson borough is 49.8%.
Women in Nicholson borough earn 50.2 cents for every dollar earned by a man.
What is Inequality or Gini Index in Nicholson borough?
Inequality or Gini Index in Nicholson borough is 0.38.
What is the Total Population of Nicholson borough?
Total Population of Nicholson borough is 753.
What is the Total Male Population of Nicholson borough?
Total Male Population of Nicholson borough is 361.
What is the Total Female Population of Nicholson borough?
Total Female Population of Nicholson borough is 392.
What is the Ratio of Males per 100 Females in Nicholson borough?
There are 92.09 Males per 100 Females in Nicholson borough.
What is the Ratio of Females per 100 Males in Nicholson borough?
There are 108.59 Females per 100 Males in Nicholson borough.
What is the Median Population Age in Nicholson borough?
Median Population Age in Nicholson borough is 32.6 Years.
What is the Average Family Size in Nicholson borough
Average Family Size in Nicholson borough is 3.4 People.
What is the Average Household Size in Nicholson borough
Average Household Size in Nicholson borough is 2.8 People.
How Large is the Labor Force in Nicholson borough?
There are 371 People in the Labor Forcein in Nicholson borough.
What is the Percentage of People in the Labor Force in Nicholson borough?
71.5% of People are in the Labor Force in Nicholson borough.
What is the Unemployment Rate in Nicholson borough?
Unemployment Rate in Nicholson borough is 1.4%.