New Freeport, PA Map & Demographics
New Freeport Map
New Freeport Overview
$25,054
PER CAPITA INCOME
$69,167
AVG FAMILY INCOME
$67,917
AVG HOUSEHOLD INCOME
41.1%
WAGE / INCOME GAP [ % ]
58.9¢/ $1
WAGE / INCOME GAP [ $ ]
0.34
INEQUALITY / GINI INDEX
80
TOTAL POPULATION
35
MALE POPULATION
45
FEMALE POPULATION
77.78
MALES / 100 FEMALES
128.57
FEMALES / 100 MALES
35.0
MEDIAN AGE
4.7
AVG FAMILY SIZE
3.0
AVG HOUSEHOLD SIZE
28
LABOR FORCE [ PEOPLE ]
48.3%
PERCENT IN LABOR FORCE
17.9%
UNEMPLOYMENT RATE
New Freeport Zip Codes
New Freeport Area Codes
Income in New Freeport
Income Overview in New Freeport
Per Capita Income in New Freeport is $25,054, while median incomes of families and households are $69,167 and $67,917 respectively.
| Characteristic | Number | Measure |
| Per Capita Income | 80 | $25,054 |
| Median Family Income | 12 | $69,167 |
| Mean Family Income | 12 | $94,267 |
| Median Household Income | 27 | $67,917 |
| Mean Household Income | 27 | $65,111 |
| Income Deficit | 12 | $0 |
| Wage / Income Gap (%) | 80 | 41.12% |
| Wage / Income Gap ($) | 80 | 58.88¢ per $1 |
| Gini / Inequality Index | 80 | 0.34 |
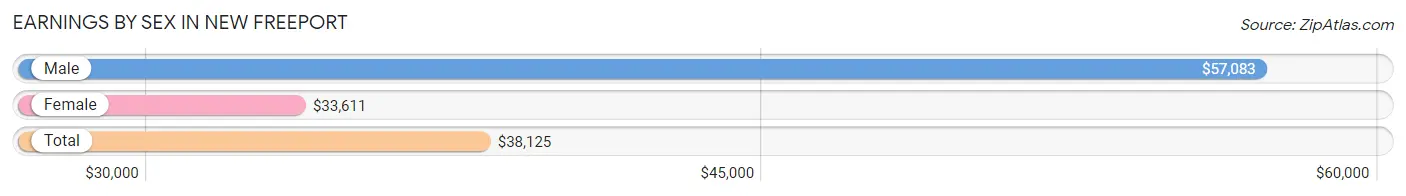
Earnings by Sex in New Freeport
Average Earnings in New Freeport are $38,125, $57,083 for men and $33,611 for women, a difference of 41.1%.
| Sex | Number | Average Earnings |
| Male | 13 (52.0%) | $57,083 |
| Female | 12 (48.0%) | $33,611 |
| Total | 25 (100.0%) | $38,125 |
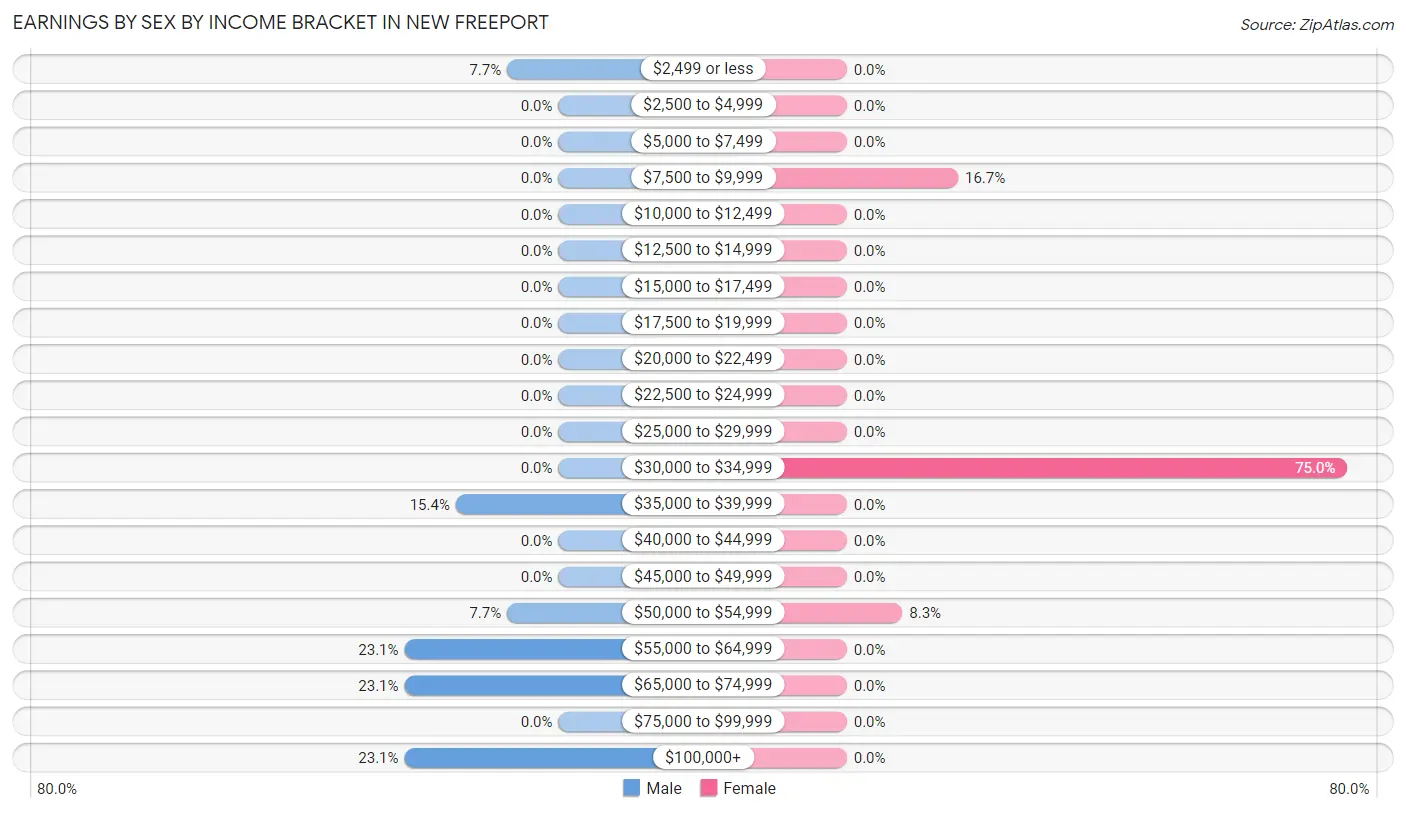
Earnings by Sex by Income Bracket in New Freeport
The most common earnings brackets in New Freeport are $55,000 to $64,999 for men (3 | 23.1%) and $30,000 to $34,999 for women (9 | 75.0%).
| Income | Male | Female |
| $2,499 or less | 1 (7.7%) | 0 (0.0%) |
| $2,500 to $4,999 | 0 (0.0%) | 0 (0.0%) |
| $5,000 to $7,499 | 0 (0.0%) | 0 (0.0%) |
| $7,500 to $9,999 | 0 (0.0%) | 2 (16.7%) |
| $10,000 to $12,499 | 0 (0.0%) | 0 (0.0%) |
| $12,500 to $14,999 | 0 (0.0%) | 0 (0.0%) |
| $15,000 to $17,499 | 0 (0.0%) | 0 (0.0%) |
| $17,500 to $19,999 | 0 (0.0%) | 0 (0.0%) |
| $20,000 to $22,499 | 0 (0.0%) | 0 (0.0%) |
| $22,500 to $24,999 | 0 (0.0%) | 0 (0.0%) |
| $25,000 to $29,999 | 0 (0.0%) | 0 (0.0%) |
| $30,000 to $34,999 | 0 (0.0%) | 9 (75.0%) |
| $35,000 to $39,999 | 2 (15.4%) | 0 (0.0%) |
| $40,000 to $44,999 | 0 (0.0%) | 0 (0.0%) |
| $45,000 to $49,999 | 0 (0.0%) | 0 (0.0%) |
| $50,000 to $54,999 | 1 (7.7%) | 1 (8.3%) |
| $55,000 to $64,999 | 3 (23.1%) | 0 (0.0%) |
| $65,000 to $74,999 | 3 (23.1%) | 0 (0.0%) |
| $75,000 to $99,999 | 0 (0.0%) | 0 (0.0%) |
| $100,000+ | 3 (23.1%) | 0 (0.0%) |
| Total | 13 (100.0%) | 12 (100.0%) |
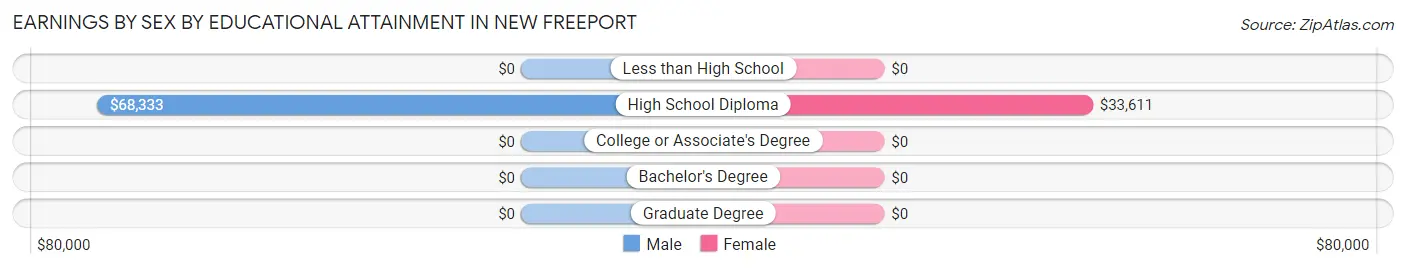
Earnings by Sex by Educational Attainment in New Freeport
Average earnings in New Freeport are $68,333 for men and $33,611 for women, a difference of 50.8%. Men with an educational attainment of high school diploma enjoy the highest average annual earnings of $68,333, while those with high school diploma education earn the least with $68,333. Women with an educational attainment of high school diploma earn the most with the average annual earnings of $33,611, while those with high school diploma education have the smallest earnings of $33,611.
| Educational Attainment | Male Income | Female Income |
| Less than High School | - | - |
| High School Diploma | $68,333 | $33,611 |
| College or Associate's Degree | - | - |
| Bachelor's Degree | - | - |
| Graduate Degree | - | - |
| Total | $68,333 | $33,611 |
Family Income in New Freeport
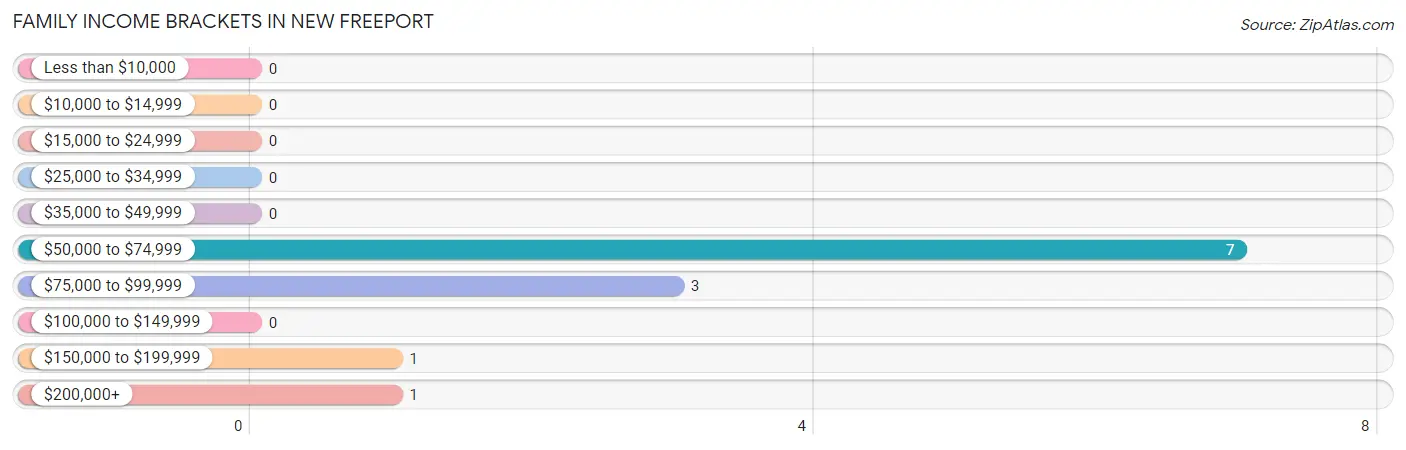
Family Income Brackets in New Freeport
According to the New Freeport family income data, there are 7 families falling into the $50,000 to $74,999 income range, which is the most common income bracket and makes up 58.3% of all families.
| Income Bracket | # Families | % Families |
| Less than $10,000 | 0 | 0.0% |
| $10,000 to $14,999 | 0 | 0.0% |
| $15,000 to $24,999 | 0 | 0.0% |
| $25,000 to $34,999 | 0 | 0.0% |
| $35,000 to $49,999 | 0 | 0.0% |
| $50,000 to $74,999 | 7 | 58.3% |
| $75,000 to $99,999 | 3 | 25.0% |
| $100,000 to $149,999 | 0 | 0.0% |
| $150,000 to $199,999 | 1 | 8.3% |
| $200,000+ | 1 | 8.3% |
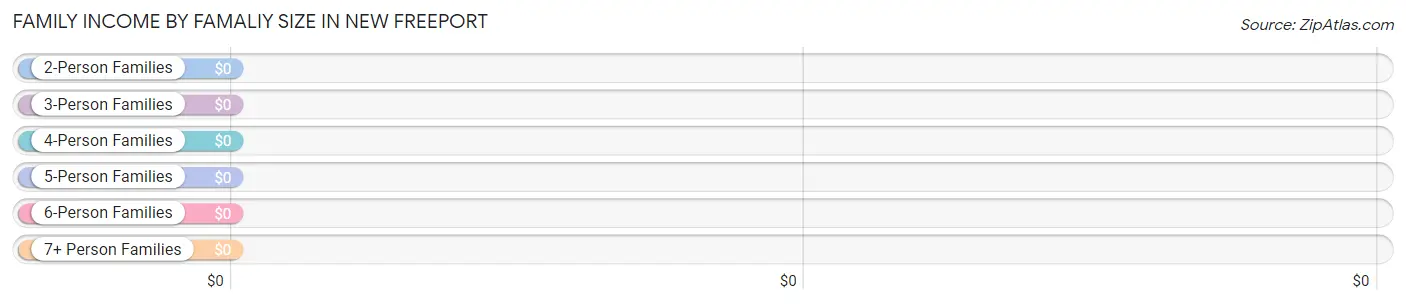
Family Income by Famaliy Size in New Freeport
| Income Bracket | # Families | Median Income |
| 2-Person Families | 1 (8.3%) | $0 |
| 3-Person Families | 2 (16.7%) | $0 |
| 4-Person Families | 4 (33.3%) | $0 |
| 5-Person Families | 3 (25.0%) | $0 |
| 6-Person Families | 2 (16.7%) | $0 |
| 7+ Person Families | 0 (0.0%) | $0 |
| Total | 12 (100.0%) | $69,167 |
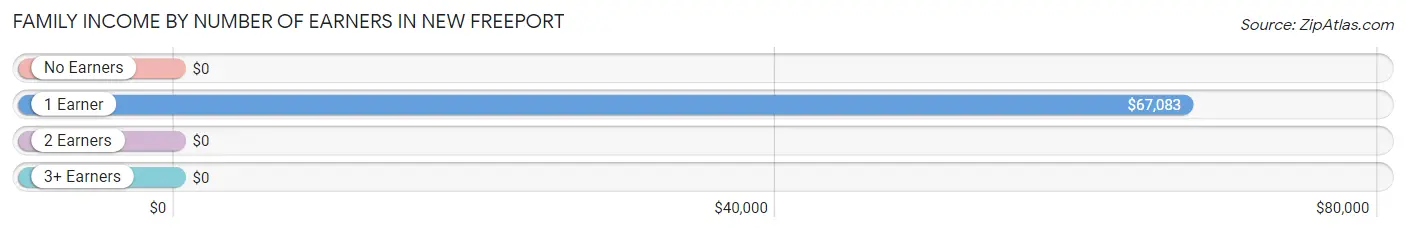
Family Income by Number of Earners in New Freeport
| Number of Earners | # Families | Median Income |
| No Earners | 2 (16.7%) | $0 |
| 1 Earner | 7 (58.3%) | $67,083 |
| 2 Earners | 2 (16.7%) | $0 |
| 3+ Earners | 1 (8.3%) | $0 |
| Total | 12 (100.0%) | $69,167 |
Household Income in New Freeport
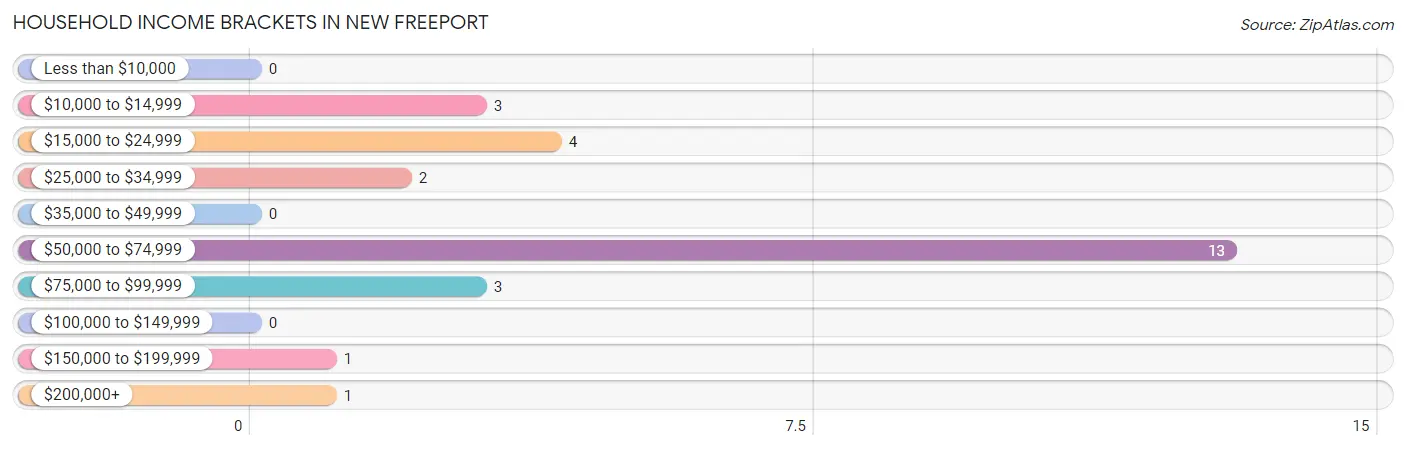
Household Income Brackets in New Freeport
With 13 households falling in the category, the $50,000 to $74,999 income range is the most frequent in New Freeport, accounting for 48.1% of all households.
| Income Bracket | # Households | % Households |
| Less than $10,000 | 0 | 0.0% |
| $10,000 to $14,999 | 3 | 11.1% |
| $15,000 to $24,999 | 4 | 14.8% |
| $25,000 to $34,999 | 2 | 7.4% |
| $35,000 to $49,999 | 0 | 0.0% |
| $50,000 to $74,999 | 13 | 48.1% |
| $75,000 to $99,999 | 3 | 11.1% |
| $100,000 to $149,999 | 0 | 0.0% |
| $150,000 to $199,999 | 1 | 3.7% |
| $200,000+ | 1 | 3.7% |
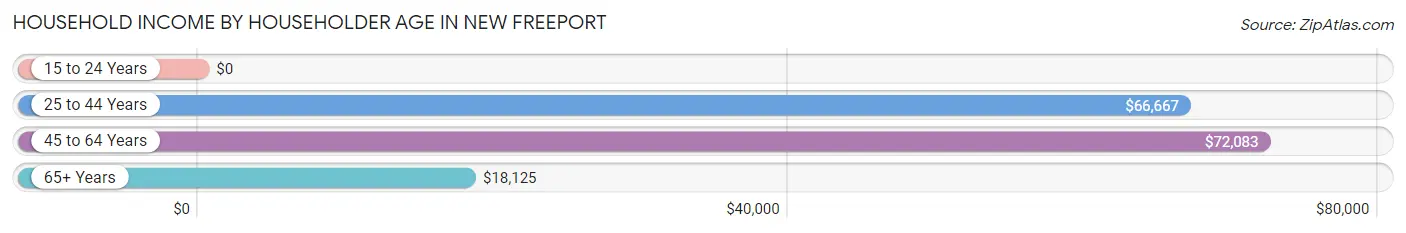
Household Income by Householder Age in New Freeport
The median household income in New Freeport is $67,917, with the highest median household income of $72,083 found in the 45 to 64 years age bracket for the primary householder. A total of 12 households (44.4%) fall into this category.
| Income Bracket | # Households | Median Income |
| 15 to 24 Years | 0 (0.0%) | $0 |
| 25 to 44 Years | 8 (29.6%) | $66,667 |
| 45 to 64 Years | 12 (44.4%) | $72,083 |
| 65+ Years | 7 (25.9%) | $18,125 |
| Total | 27 (100.0%) | $67,917 |
Poverty in New Freeport
Income Below Poverty by Sex and Age in New Freeport
With 5.7% poverty level for males and 4.4% for females among the residents of New Freeport, 65 to 74 year old males and 45 to 54 year old females are the most vulnerable to poverty, with 2 males (33.3%) and 2 females (15.4%) in their respective age groups living below the poverty level.
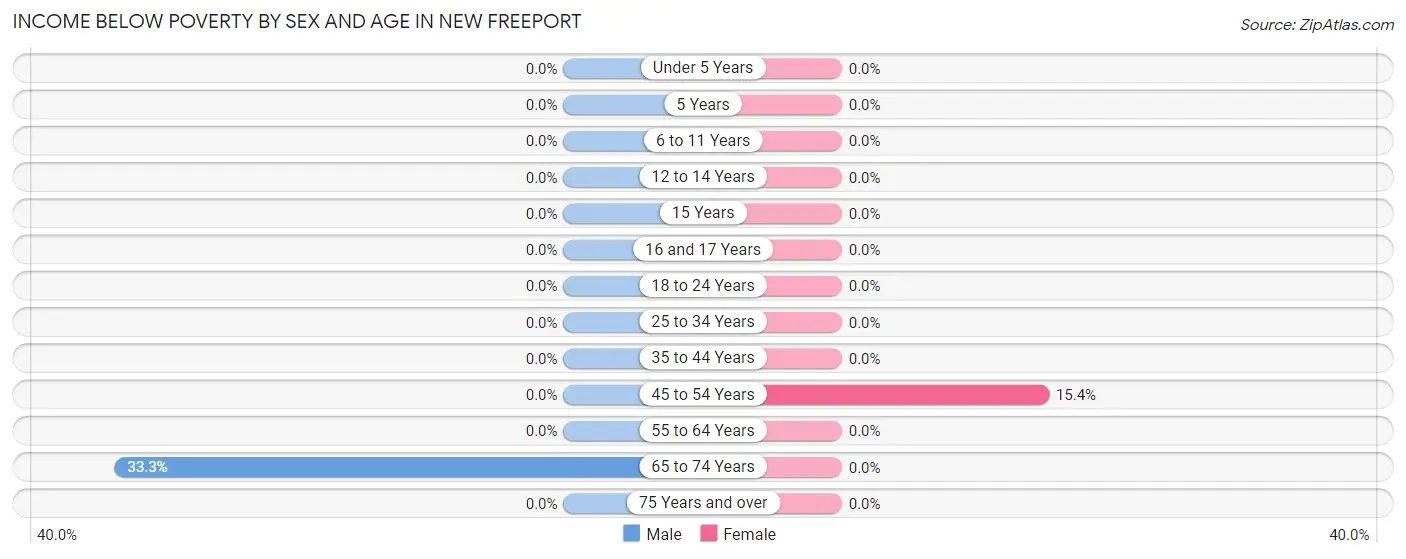
| Age Bracket | Male | Female |
| Under 5 Years | 0 (0.0%) | 0 (0.0%) |
| 5 Years | 0 (0.0%) | 0 (0.0%) |
| 6 to 11 Years | 0 (0.0%) | 0 (0.0%) |
| 12 to 14 Years | 0 (0.0%) | 0 (0.0%) |
| 15 Years | 0 (0.0%) | 0 (0.0%) |
| 16 and 17 Years | 0 (0.0%) | 0 (0.0%) |
| 18 to 24 Years | 0 (0.0%) | 0 (0.0%) |
| 25 to 34 Years | 0 (0.0%) | 0 (0.0%) |
| 35 to 44 Years | 0 (0.0%) | 0 (0.0%) |
| 45 to 54 Years | 0 (0.0%) | 2 (15.4%) |
| 55 to 64 Years | 0 (0.0%) | 0 (0.0%) |
| 65 to 74 Years | 2 (33.3%) | 0 (0.0%) |
| 75 Years and over | 0 (0.0%) | 0 (0.0%) |
| Total | 2 (5.7%) | 2 (4.4%) |
Income Above Poverty by Sex and Age in New Freeport
According to the poverty statistics in New Freeport, males aged 6 to 11 years and females aged under 5 years are the age groups that are most secure financially, with 100.0% of males and 100.0% of females in these age groups living above the poverty line.
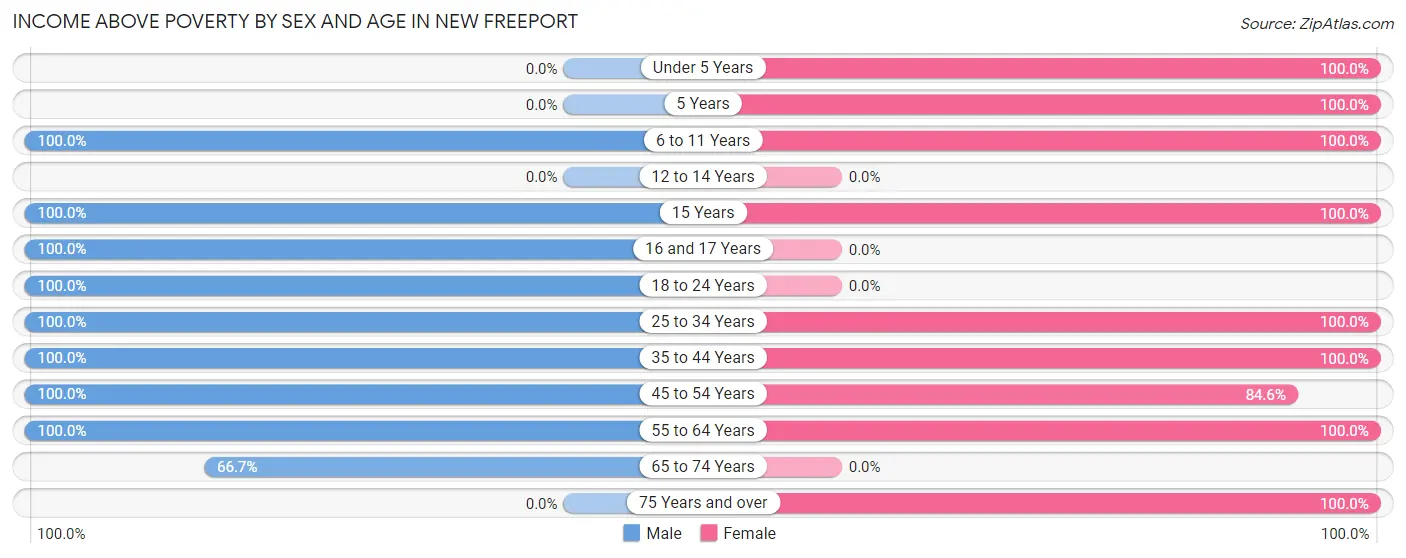
| Age Bracket | Male | Female |
| Under 5 Years | 0 (0.0%) | 2 (100.0%) |
| 5 Years | 0 (0.0%) | 4 (100.0%) |
| 6 to 11 Years | 2 (100.0%) | 9 (100.0%) |
| 12 to 14 Years | 0 (0.0%) | 0 (0.0%) |
| 15 Years | 2 (100.0%) | 3 (100.0%) |
| 16 and 17 Years | 2 (100.0%) | 0 (0.0%) |
| 18 to 24 Years | 6 (100.0%) | 0 (0.0%) |
| 25 to 34 Years | 3 (100.0%) | 7 (100.0%) |
| 35 to 44 Years | 3 (100.0%) | 2 (100.0%) |
| 45 to 54 Years | 1 (100.0%) | 11 (84.6%) |
| 55 to 64 Years | 10 (100.0%) | 2 (100.0%) |
| 65 to 74 Years | 4 (66.7%) | 0 (0.0%) |
| 75 Years and over | 0 (0.0%) | 3 (100.0%) |
| Total | 33 (94.3%) | 43 (95.6%) |
Income Below Poverty Among Married-Couple Families in New Freeport
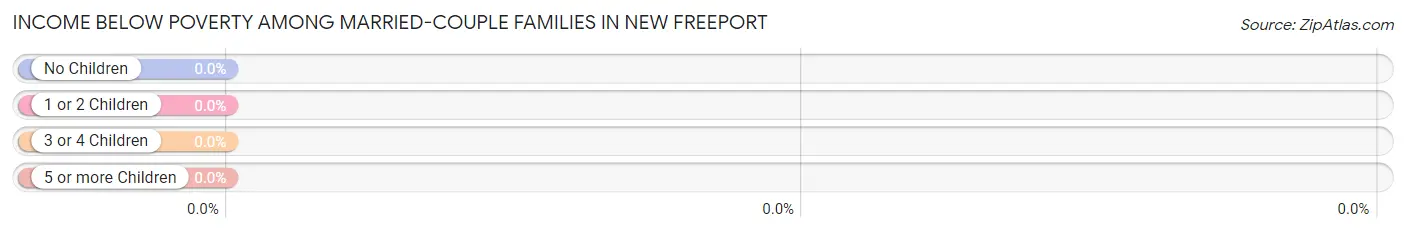
| Children | Above Poverty | Below Poverty |
| No Children | 3 (100.0%) | 0 (0.0%) |
| 1 or 2 Children | 4 (100.0%) | 0 (0.0%) |
| 3 or 4 Children | 5 (100.0%) | 0 (0.0%) |
| 5 or more Children | 0 (0.0%) | 0 (0.0%) |
| Total | 12 (100.0%) | 0 (0.0%) |
Income Below Poverty Among Single-Parent Households in New Freeport
| Children | Single Father | Single Mother |
| No Children | 0 (0.0%) | 0 (0.0%) |
| 1 or 2 Children | 0 (0.0%) | 0 (0.0%) |
| 3 or 4 Children | 0 (0.0%) | 0 (0.0%) |
| 5 or more Children | 0 (0.0%) | 0 (0.0%) |
| Total | 0 (0.0%) | 0 (0.0%) |
Income Below Poverty Among Married-Couple vs Single-Parent Households in New Freeport
| Children | Married-Couple Families | Single-Parent Households |
| No Children | 0 (0.0%) | 0 (0.0%) |
| 1 or 2 Children | 0 (0.0%) | 0 (0.0%) |
| 3 or 4 Children | 0 (0.0%) | 0 (0.0%) |
| 5 or more Children | 0 (0.0%) | 0 (0.0%) |
| Total | 0 (0.0%) | 0 (0.0%) |
Race in New Freeport
The most populous races in New Freeport are , and White / Caucasian (80 | 100.0%).
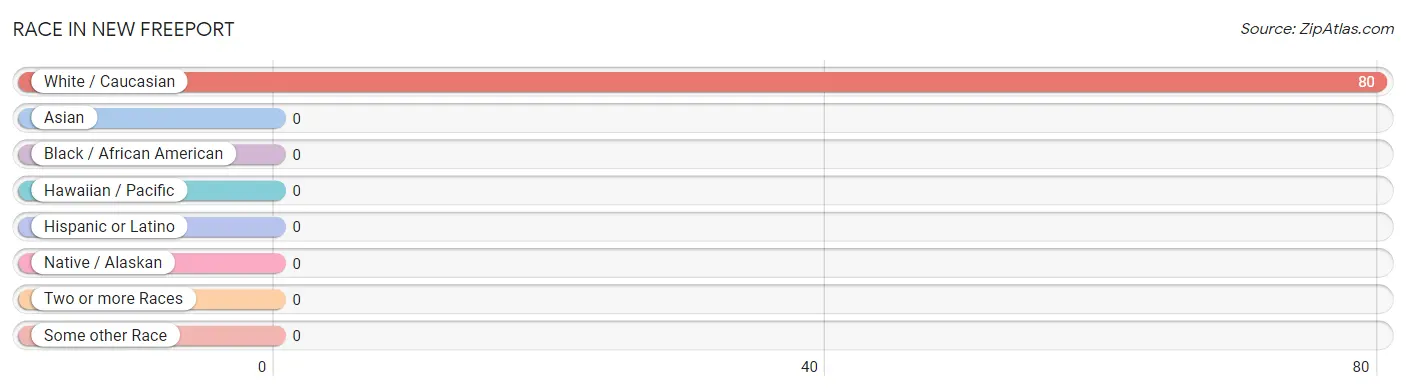
| Race | # Population | % Population |
| Asian | 0 | 0.0% |
| Black / African American | 0 | 0.0% |
| Hawaiian / Pacific | 0 | 0.0% |
| Hispanic or Latino | 0 | 0.0% |
| Native / Alaskan | 0 | 0.0% |
| White / Caucasian | 80 | 100.0% |
| Two or more Races | 0 | 0.0% |
| Some other Race | 0 | 0.0% |
| Total | 80 | 100.0% |
Ancestry in New Freeport
The most populous ancestries reported in New Freeport are German (27 | 33.8%), Irish (14 | 17.5%), English (5 | 6.2%), Polish (3 | 3.7%), and Scotch-Irish (3 | 3.7%), together accounting for 65.0% of all New Freeport residents.
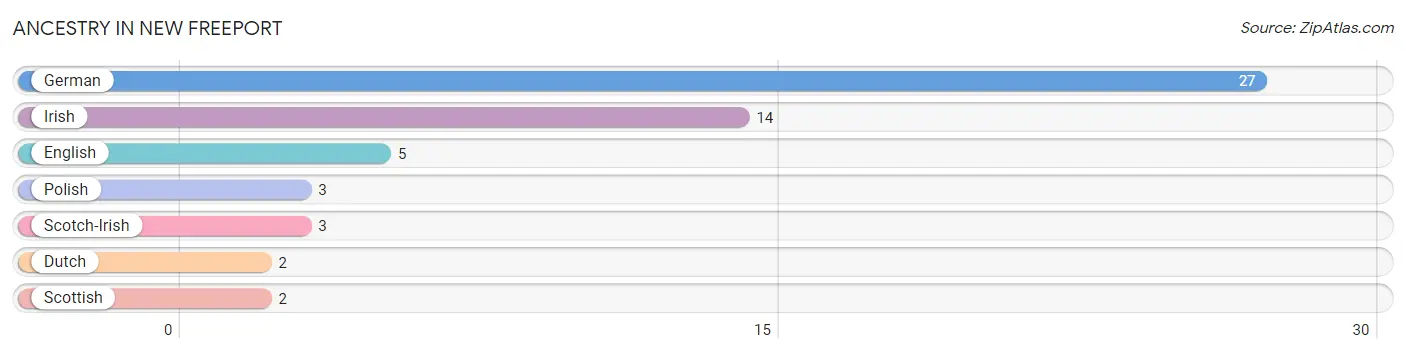
| Ancestry | # Population | % Population |
| Dutch | 2 | 2.5% |
| English | 5 | 6.2% |
| German | 27 | 33.8% |
| Irish | 14 | 17.5% |
| Polish | 3 | 3.7% |
| Scotch-Irish | 3 | 3.7% |
| Scottish | 2 | 2.5% | View All 7 Rows |
Immigrants in New Freeport

| Immigration Origin | # Population | % Population | View All 0 Rows |
Sex and Age in New Freeport
Sex and Age in New Freeport
The most populous age groups in New Freeport are 60 to 64 Years (7 | 20.0%) for men and 5 to 9 Years (13 | 28.9%) for women.
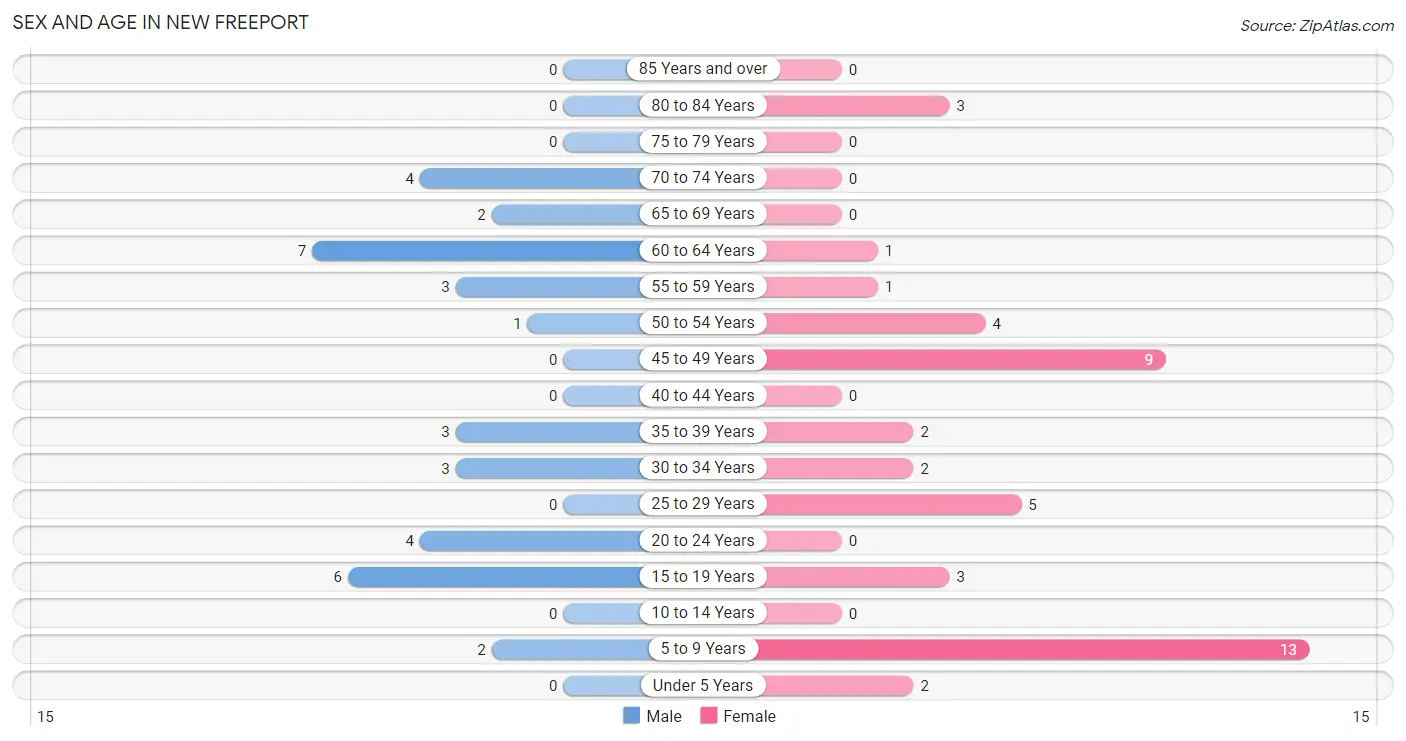
| Age Bracket | Male | Female |
| Under 5 Years | 0 (0.0%) | 2 (4.4%) |
| 5 to 9 Years | 2 (5.7%) | 13 (28.9%) |
| 10 to 14 Years | 0 (0.0%) | 0 (0.0%) |
| 15 to 19 Years | 6 (17.1%) | 3 (6.7%) |
| 20 to 24 Years | 4 (11.4%) | 0 (0.0%) |
| 25 to 29 Years | 0 (0.0%) | 5 (11.1%) |
| 30 to 34 Years | 3 (8.6%) | 2 (4.4%) |
| 35 to 39 Years | 3 (8.6%) | 2 (4.4%) |
| 40 to 44 Years | 0 (0.0%) | 0 (0.0%) |
| 45 to 49 Years | 0 (0.0%) | 9 (20.0%) |
| 50 to 54 Years | 1 (2.9%) | 4 (8.9%) |
| 55 to 59 Years | 3 (8.6%) | 1 (2.2%) |
| 60 to 64 Years | 7 (20.0%) | 1 (2.2%) |
| 65 to 69 Years | 2 (5.7%) | 0 (0.0%) |
| 70 to 74 Years | 4 (11.4%) | 0 (0.0%) |
| 75 to 79 Years | 0 (0.0%) | 0 (0.0%) |
| 80 to 84 Years | 0 (0.0%) | 3 (6.7%) |
| 85 Years and over | 0 (0.0%) | 0 (0.0%) |
| Total | 35 (100.0%) | 45 (100.0%) |
Families and Households in New Freeport
Median Family Size in New Freeport
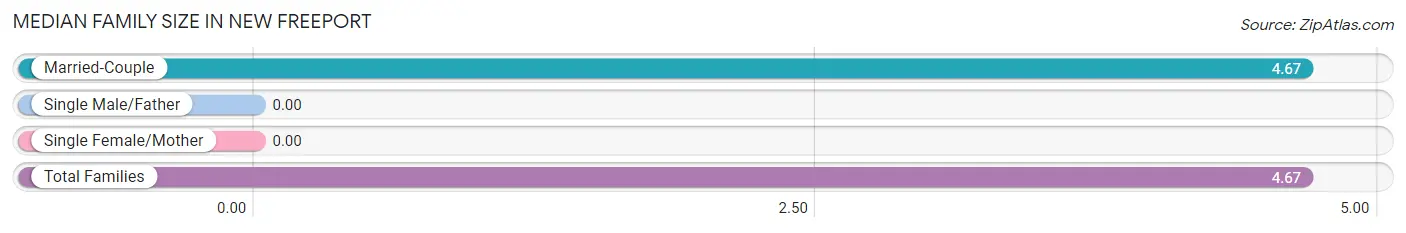
| Family Type | # Families | Family Size |
| Married-Couple | 12 (100.0%) | 4.67 |
| Single Male/Father | 0 (0.0%) | - |
| Single Female/Mother | 0 (0.0%) | - |
| Total Families | 12 (100.0%) | 4.67 |
Median Household Size in New Freeport
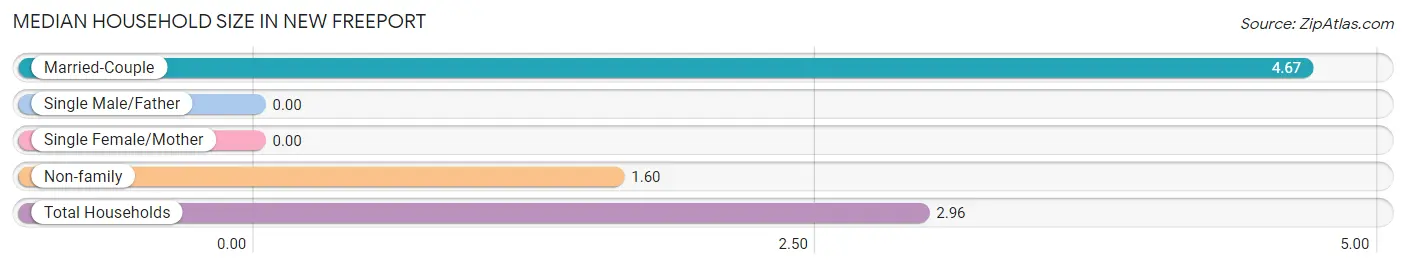
| Household Type | # Households | Household Size |
| Married-Couple | 12 (44.4%) | 4.67 |
| Single Male/Father | 0 (0.0%) | - |
| Single Female/Mother | 0 (0.0%) | - |
| Non-family | 15 (55.6%) | 1.60 |
| Total Households | 27 (100.0%) | 2.96 |
Household Size by Marriage Status in New Freeport
Out of a total of 27 households in New Freeport, 12 (44.4%) are family households, while 15 (55.6%) are nonfamily households. The most numerous type of family households are 4-person households, comprising 4, and the most common type of nonfamily households are 2-person households, comprising 8.
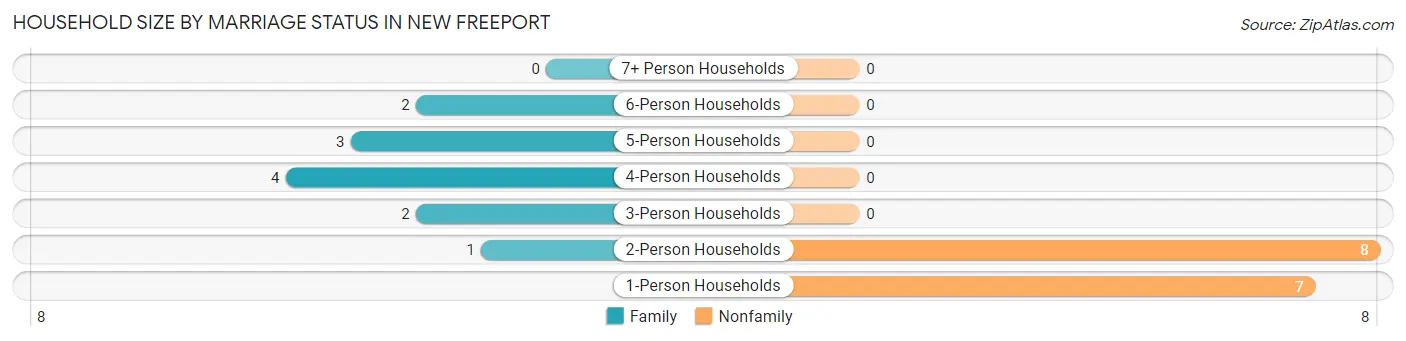
| Household Size | Family Households | Nonfamily Households |
| 1-Person Households | - | 7 (25.9%) |
| 2-Person Households | 1 (3.7%) | 8 (29.6%) |
| 3-Person Households | 2 (7.4%) | 0 (0.0%) |
| 4-Person Households | 4 (14.8%) | 0 (0.0%) |
| 5-Person Households | 3 (11.1%) | 0 (0.0%) |
| 6-Person Households | 2 (7.4%) | 0 (0.0%) |
| 7+ Person Households | 0 (0.0%) | 0 (0.0%) |
| Total | 12 (44.4%) | 15 (55.6%) |
Female Fertility in New Freeport
Fertility by Age in New Freeport
| Age Bracket | Women with Births | Births / 1,000 Women |
| 15 to 19 years | 0 (0.0%) | 0.0 |
| 20 to 34 years | 0 (0.0%) | 0.0 |
| 35 to 50 years | 0 (0.0%) | 0.0 |
| Total | 0 (0.0%) | 0.0 |
Fertility by Age by Marriage Status in New Freeport
| Age Bracket | Married | Unmarried |
| 15 to 19 years | 0 (0.0%) | 0 (0.0%) |
| 20 to 34 years | 0 (0.0%) | 0 (0.0%) |
| 35 to 50 years | 0 (0.0%) | 0 (0.0%) |
| Total | 0 (0.0%) | 0 (0.0%) |
Fertility by Education in New Freeport
| Educational Attainment | Women with Births | Births / 1,000 Women |
| Less than High School | 0 (0.0%) | 0.0 |
| High School Diploma | 0 (0.0%) | 0.0 |
| College or Associate's Degree | 0 (0.0%) | 0.0 |
| Bachelor's Degree | 0 (0.0%) | 0.0 |
| Graduate Degree | 0 (0.0%) | 0.0 |
| Total | 0 (0.0%) | 0.0 |
Fertility by Education by Marriage Status in New Freeport
| Educational Attainment | Married | Unmarried |
| Less than High School | 0 (0.0%) | 0 (0.0%) |
| High School Diploma | 0 (0.0%) | 0 (0.0%) |
| College or Associate's Degree | 0 (0.0%) | 0 (0.0%) |
| Bachelor's Degree | 0 (0.0%) | 0 (0.0%) |
| Graduate Degree | 0 (0.0%) | 0 (0.0%) |
| Total | 0 (0.0%) | 0 (0.0%) |
Employment Characteristics in New Freeport
Employment by Class of Employer in New Freeport
Among the 23 employed individuals in New Freeport, private company employees (22 | 95.7%), and state government employees (1 | 4.3%) make up the most common classes of employment.
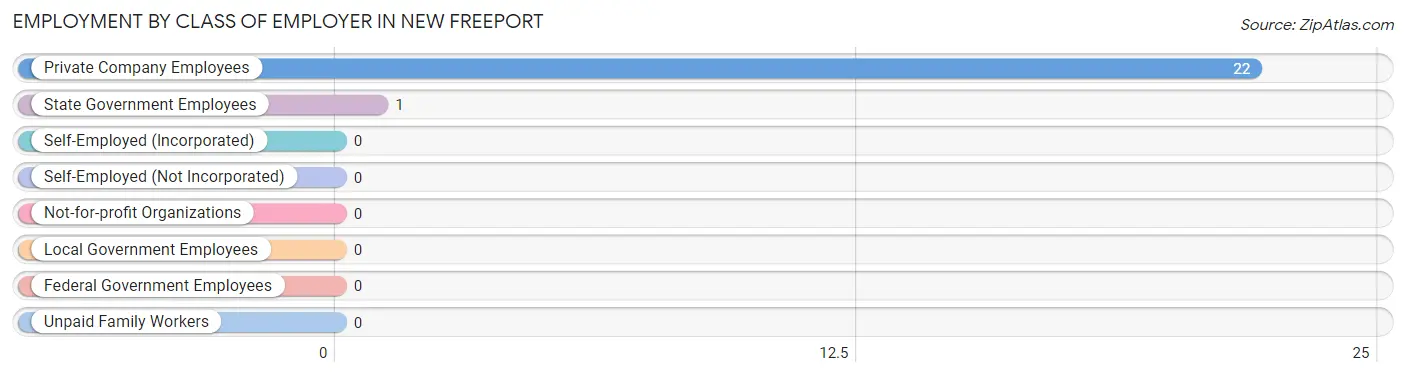
| Employer Class | # Employees | % Employees |
| Private Company Employees | 22 | 95.7% |
| Self-Employed (Incorporated) | 0 | 0.0% |
| Self-Employed (Not Incorporated) | 0 | 0.0% |
| Not-for-profit Organizations | 0 | 0.0% |
| Local Government Employees | 0 | 0.0% |
| State Government Employees | 1 | 4.3% |
| Federal Government Employees | 0 | 0.0% |
| Unpaid Family Workers | 0 | 0.0% |
| Total | 23 | 100.0% |
Employment Status by Age in New Freeport
According to the labor force statistics for New Freeport, out of the total population over 16 years of age (58), 48.3% or 28 individuals are in the labor force, with 17.9% or 5 of them unemployed. The age group with the highest labor force participation rate is 25 to 29 years, with 100.0% or 5 individuals in the labor force. Within the labor force, the 25 to 29 years age range has the highest percentage of unemployed individuals, with 100.0% or 5 of them being unemployed.
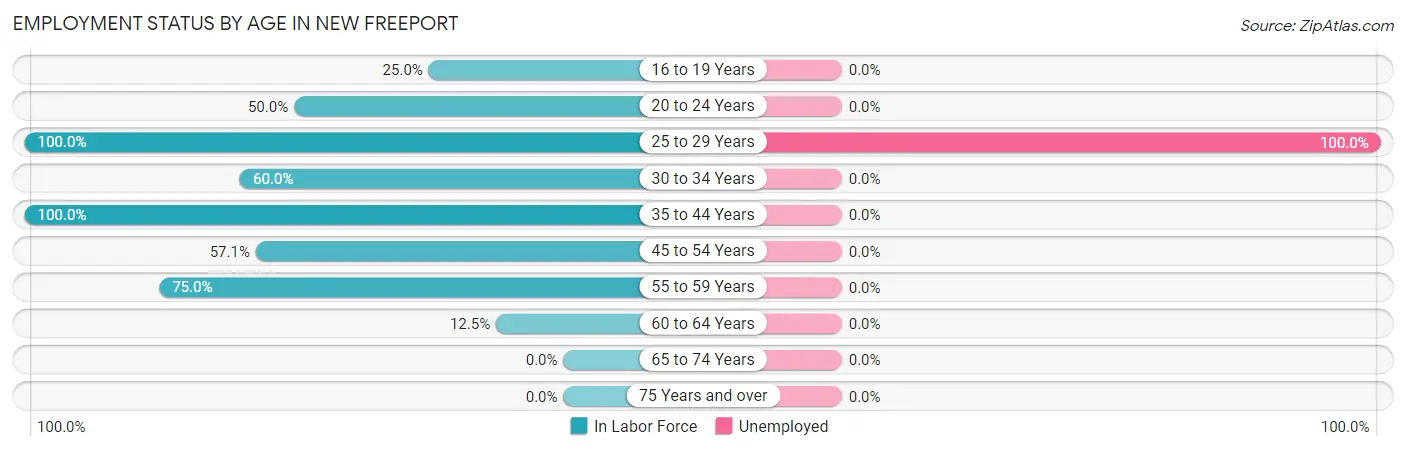
| Age Bracket | In Labor Force | Unemployed |
| 16 to 19 Years | 1 (25.0%) | 0 (0.0%) |
| 20 to 24 Years | 2 (50.0%) | 0 (0.0%) |
| 25 to 29 Years | 5 (100.0%) | 5 (100.0%) |
| 30 to 34 Years | 3 (60.0%) | 0 (0.0%) |
| 35 to 44 Years | 5 (100.0%) | 0 (0.0%) |
| 45 to 54 Years | 8 (57.1%) | 0 (0.0%) |
| 55 to 59 Years | 3 (75.0%) | 0 (0.0%) |
| 60 to 64 Years | 1 (12.5%) | 0 (0.0%) |
| 65 to 74 Years | 0 (0.0%) | 0 (0.0%) |
| 75 Years and over | 0 (0.0%) | 0 (0.0%) |
| Total | 28 (48.3%) | 5 (17.9%) |
Employment Status by Educational Attainment in New Freeport
According to labor force statistics for New Freeport, 61.0% of individuals (25) out of the total population between 25 and 64 years of age (41) are in the labor force, with 20.0% or 5 of them being unemployed. The group with the highest labor force participation rate are those with the educational attainment of high school diploma, with 63.2% or 24 individuals in the labor force. Within the labor force, individuals with high school diploma education have the highest percentage of unemployment, with 20.8% or 5 of them being unemployed.
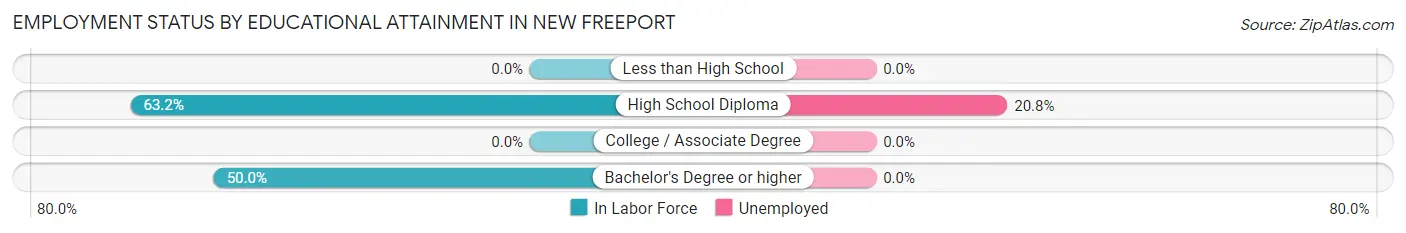
| Educational Attainment | In Labor Force | Unemployed |
| Less than High School | 0 (0.0%) | 0 (0.0%) |
| High School Diploma | 24 (63.2%) | 8 (20.8%) |
| College / Associate Degree | 0 (0.0%) | 0 (0.0%) |
| Bachelor's Degree or higher | 1 (50.0%) | 0 (0.0%) |
| Total | 25 (61.0%) | 8 (20.0%) |
Employment Occupations by Sex in New Freeport
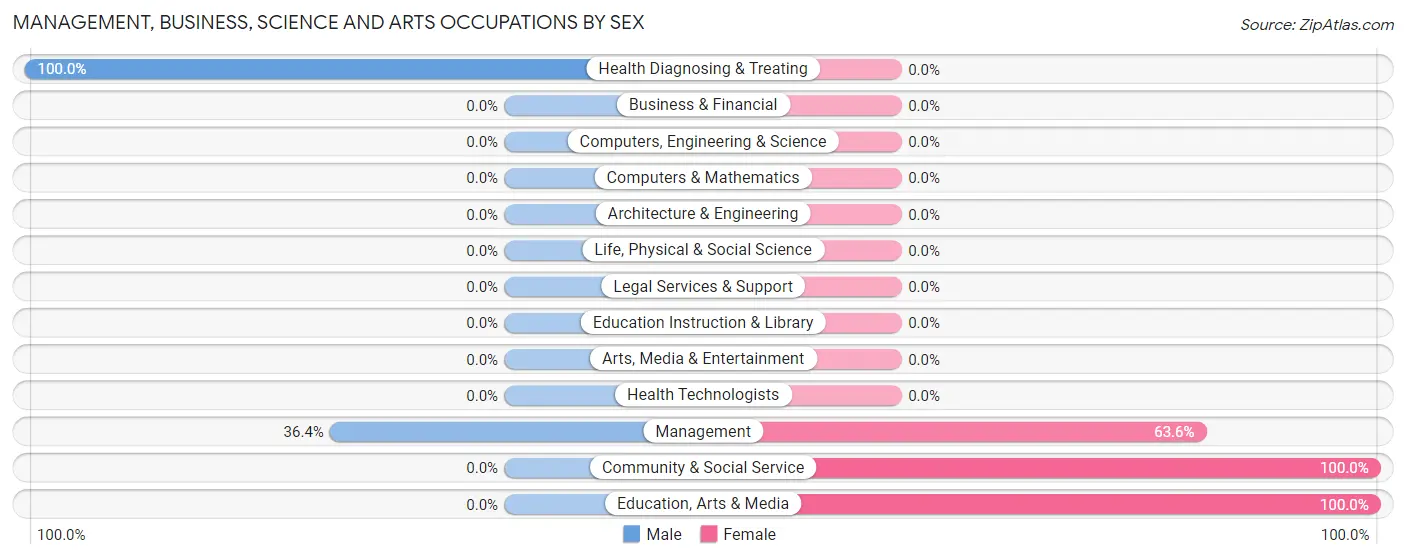
Management, Business, Science and Arts Occupations
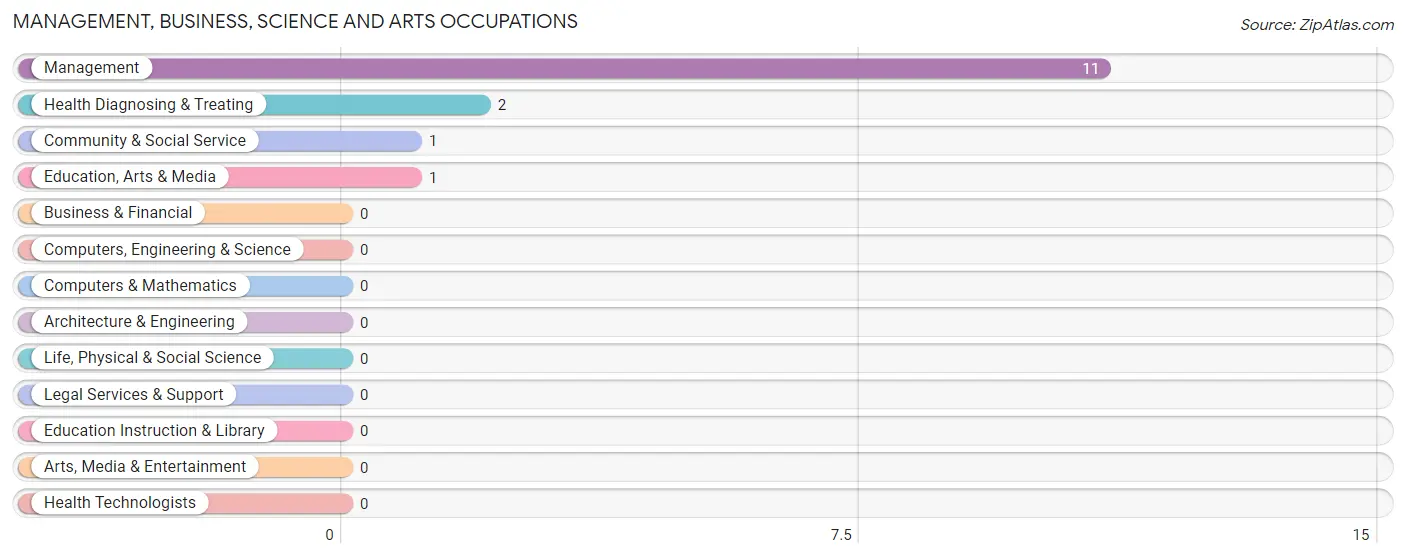
The most common Management, Business, Science and Arts occupations in New Freeport are Management (11 | 47.8%), Health Diagnosing & Treating (2 | 8.7%), Community & Social Service (1 | 4.3%), and Education, Arts & Media (1 | 4.3%).
Management, Business, Science and Arts Occupations by Sex
Within the Management, Business, Science and Arts occupations in New Freeport, the most male-oriented occupations are Health Diagnosing & Treating (100.0%), and Management (36.4%), while the most female-oriented occupations are Community & Social Service (100.0%), Education, Arts & Media (100.0%), and Management (63.6%).
| Occupation | Male | Female |
| Management | 4 (36.4%) | 7 (63.6%) |
| Business & Financial | 0 (0.0%) | 0 (0.0%) |
| Computers, Engineering & Science | 0 (0.0%) | 0 (0.0%) |
| Computers & Mathematics | 0 (0.0%) | 0 (0.0%) |
| Architecture & Engineering | 0 (0.0%) | 0 (0.0%) |
| Life, Physical & Social Science | 0 (0.0%) | 0 (0.0%) |
| Community & Social Service | 0 (0.0%) | 1 (100.0%) |
| Education, Arts & Media | 0 (0.0%) | 1 (100.0%) |
| Legal Services & Support | 0 (0.0%) | 0 (0.0%) |
| Education Instruction & Library | 0 (0.0%) | 0 (0.0%) |
| Arts, Media & Entertainment | 0 (0.0%) | 0 (0.0%) |
| Health Diagnosing & Treating | 2 (100.0%) | 0 (0.0%) |
| Health Technologists | 0 (0.0%) | 0 (0.0%) |
| Total (Category) | 6 (42.9%) | 8 (57.1%) |
| Total (Overall) | 13 (56.5%) | 10 (43.5%) |
Services Occupations
Services Occupations by Sex
| Occupation | Male | Female |
| Healthcare Support | 0 (0.0%) | 0 (0.0%) |
| Security & Protection | 0 (0.0%) | 0 (0.0%) |
| Firefighting & Prevention | 0 (0.0%) | 0 (0.0%) |
| Law Enforcement | 0 (0.0%) | 0 (0.0%) |
| Food Preparation & Serving | 0 (0.0%) | 0 (0.0%) |
| Cleaning & Maintenance | 0 (0.0%) | 0 (0.0%) |
| Personal Care & Service | 0 (0.0%) | 0 (0.0%) |
| Total (Category) | 0 (0.0%) | 0 (0.0%) |
| Total (Overall) | 13 (56.5%) | 10 (43.5%) |
Sales and Office Occupations
The most common Sales and Office occupations in New Freeport are , and Office & Administration (2 | 8.7%).
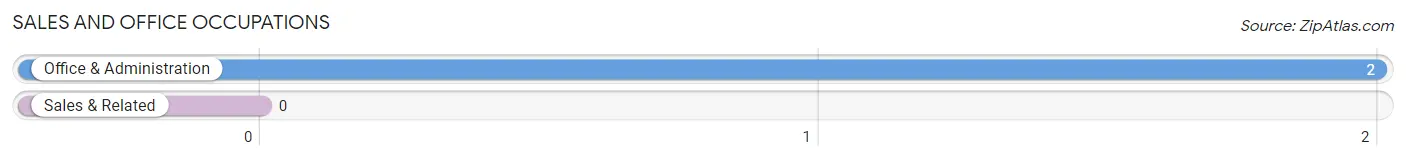
Sales and Office Occupations by Sex

| Occupation | Male | Female |
| Sales & Related | 0 (0.0%) | 0 (0.0%) |
| Office & Administration | 0 (0.0%) | 2 (100.0%) |
| Total (Category) | 0 (0.0%) | 2 (100.0%) |
| Total (Overall) | 13 (56.5%) | 10 (43.5%) |
Natural Resources, Construction and Maintenance Occupations
The most common Natural Resources, Construction and Maintenance occupations in New Freeport are , and Construction & Extraction (6 | 26.1%).
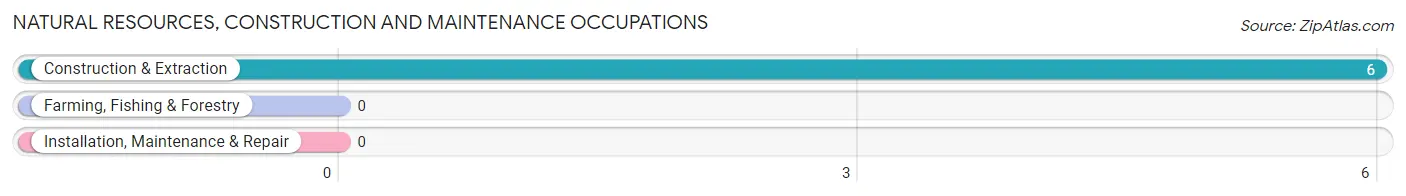
Natural Resources, Construction and Maintenance Occupations by Sex

| Occupation | Male | Female |
| Farming, Fishing & Forestry | 0 (0.0%) | 0 (0.0%) |
| Construction & Extraction | 6 (100.0%) | 0 (0.0%) |
| Installation, Maintenance & Repair | 0 (0.0%) | 0 (0.0%) |
| Total (Category) | 6 (100.0%) | 0 (0.0%) |
| Total (Overall) | 13 (56.5%) | 10 (43.5%) |
Production, Transportation and Moving Occupations
The most common Production, Transportation and Moving occupations in New Freeport are , and Material Moving (1 | 4.3%).
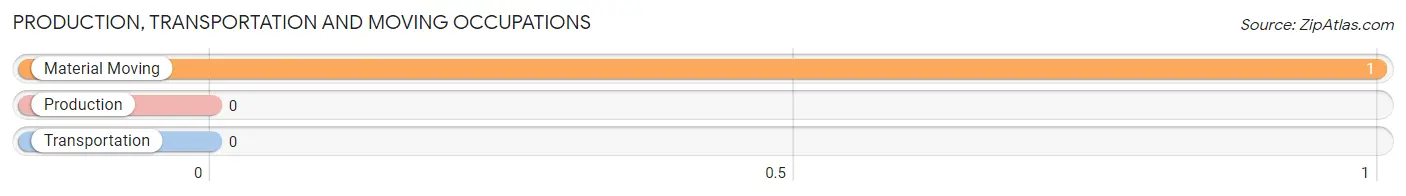
Production, Transportation and Moving Occupations by Sex
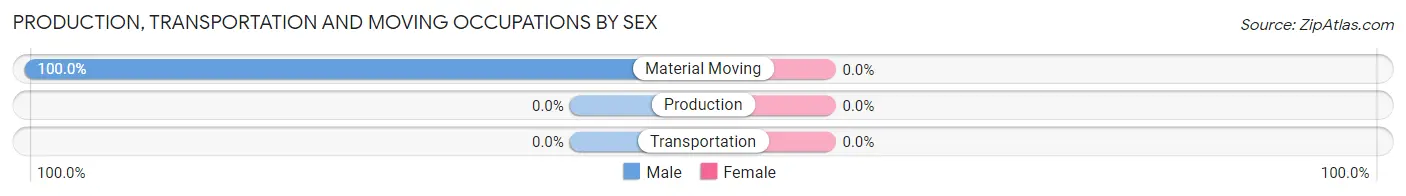
| Occupation | Male | Female |
| Production | 0 (0.0%) | 0 (0.0%) |
| Transportation | 0 (0.0%) | 0 (0.0%) |
| Material Moving | 1 (100.0%) | 0 (0.0%) |
| Total (Category) | 1 (100.0%) | 0 (0.0%) |
| Total (Overall) | 13 (56.5%) | 10 (43.5%) |
Employment Industries by Sex in New Freeport
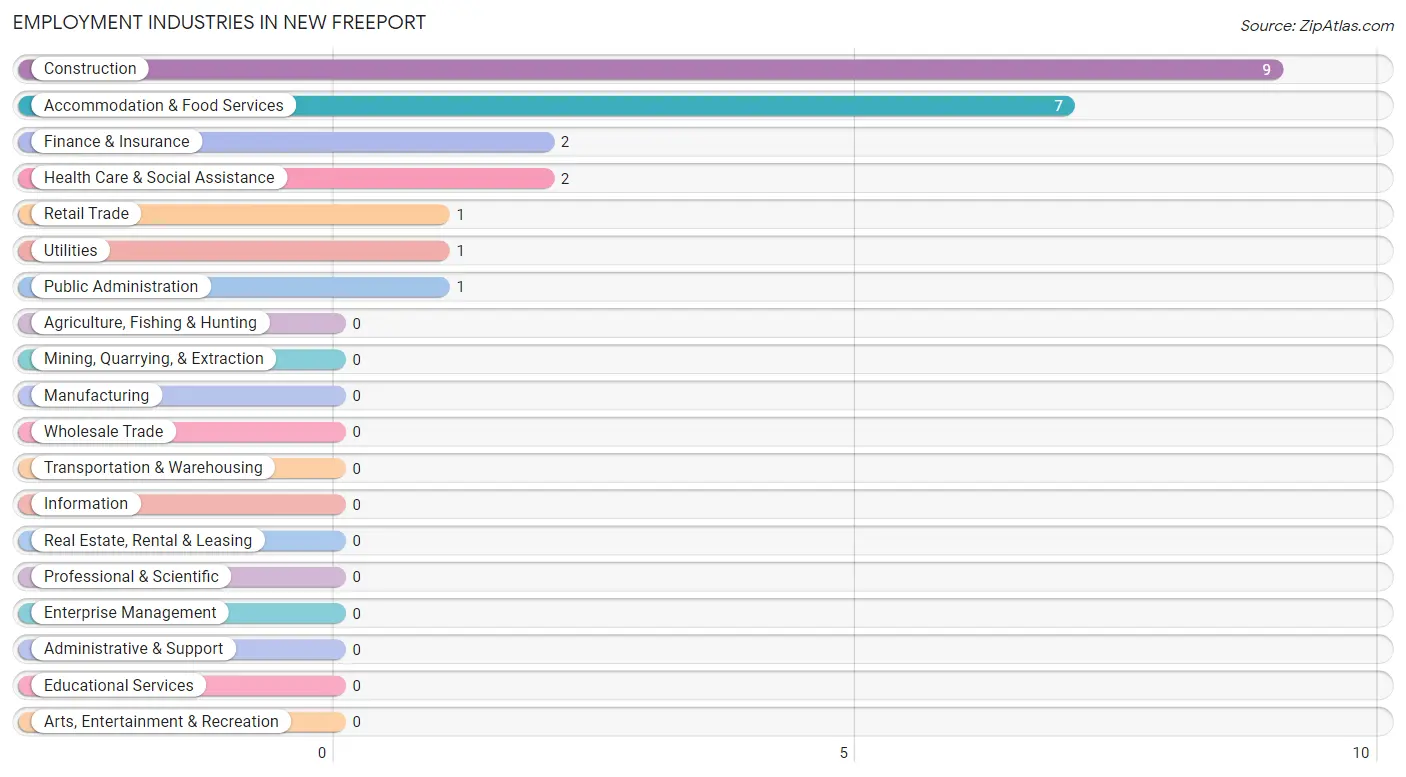
Employment Industries in New Freeport
The major employment industries in New Freeport include Construction (9 | 39.1%), Accommodation & Food Services (7 | 30.4%), Finance & Insurance (2 | 8.7%), Health Care & Social Assistance (2 | 8.7%), and Retail Trade (1 | 4.3%).
Employment Industries by Sex in New Freeport
The New Freeport industries that see more men than women are Construction (100.0%), Retail Trade (100.0%), and Utilities (100.0%), whereas the industries that tend to have a higher number of women are Finance & Insurance (100.0%), Accommodation & Food Services (100.0%), and Public Administration (100.0%).
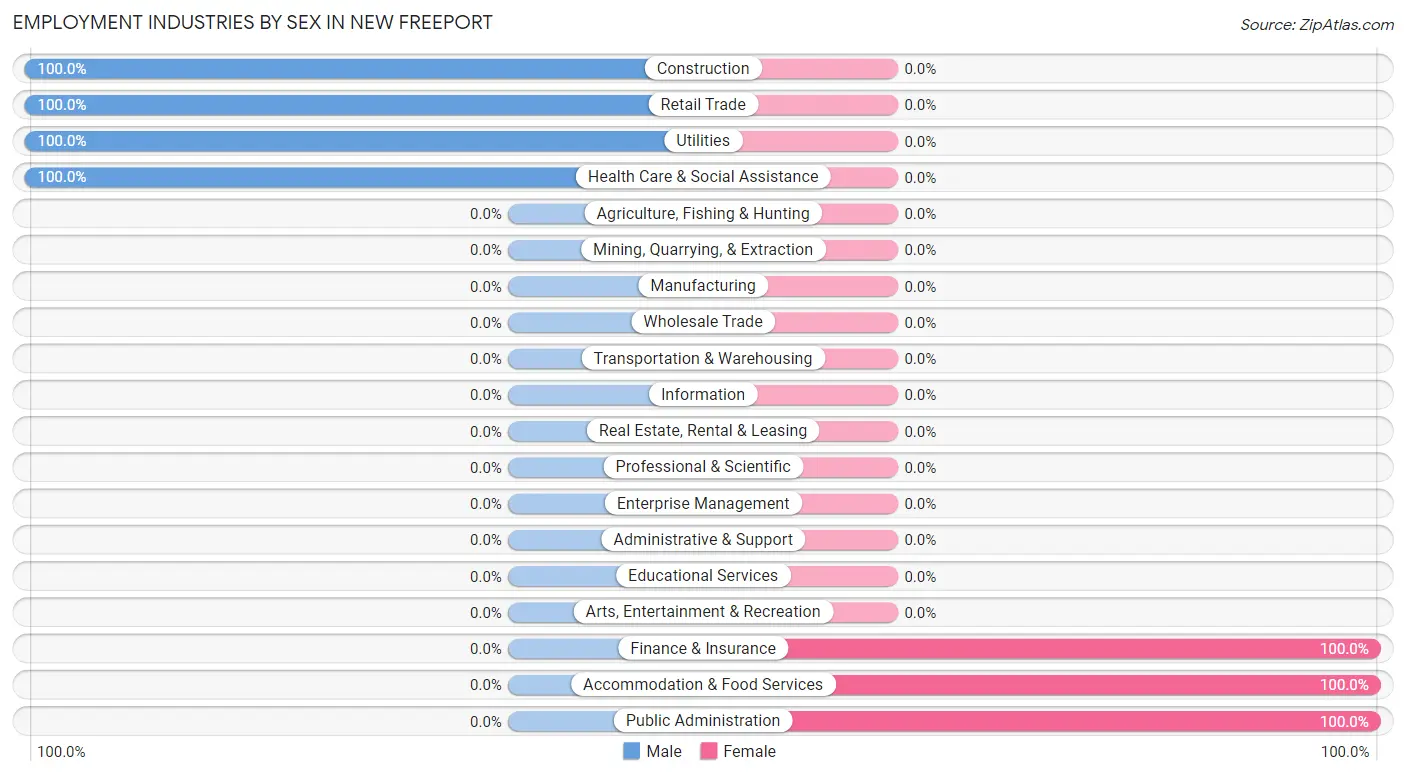
| Industry | Male | Female |
| Agriculture, Fishing & Hunting | 0 (0.0%) | 0 (0.0%) |
| Mining, Quarrying, & Extraction | 0 (0.0%) | 0 (0.0%) |
| Construction | 9 (100.0%) | 0 (0.0%) |
| Manufacturing | 0 (0.0%) | 0 (0.0%) |
| Wholesale Trade | 0 (0.0%) | 0 (0.0%) |
| Retail Trade | 1 (100.0%) | 0 (0.0%) |
| Transportation & Warehousing | 0 (0.0%) | 0 (0.0%) |
| Utilities | 1 (100.0%) | 0 (0.0%) |
| Information | 0 (0.0%) | 0 (0.0%) |
| Finance & Insurance | 0 (0.0%) | 2 (100.0%) |
| Real Estate, Rental & Leasing | 0 (0.0%) | 0 (0.0%) |
| Professional & Scientific | 0 (0.0%) | 0 (0.0%) |
| Enterprise Management | 0 (0.0%) | 0 (0.0%) |
| Administrative & Support | 0 (0.0%) | 0 (0.0%) |
| Educational Services | 0 (0.0%) | 0 (0.0%) |
| Health Care & Social Assistance | 2 (100.0%) | 0 (0.0%) |
| Arts, Entertainment & Recreation | 0 (0.0%) | 0 (0.0%) |
| Accommodation & Food Services | 0 (0.0%) | 7 (100.0%) |
| Public Administration | 0 (0.0%) | 1 (100.0%) |
| Total | 13 (56.5%) | 10 (43.5%) |
Education in New Freeport
School Enrollment in New Freeport
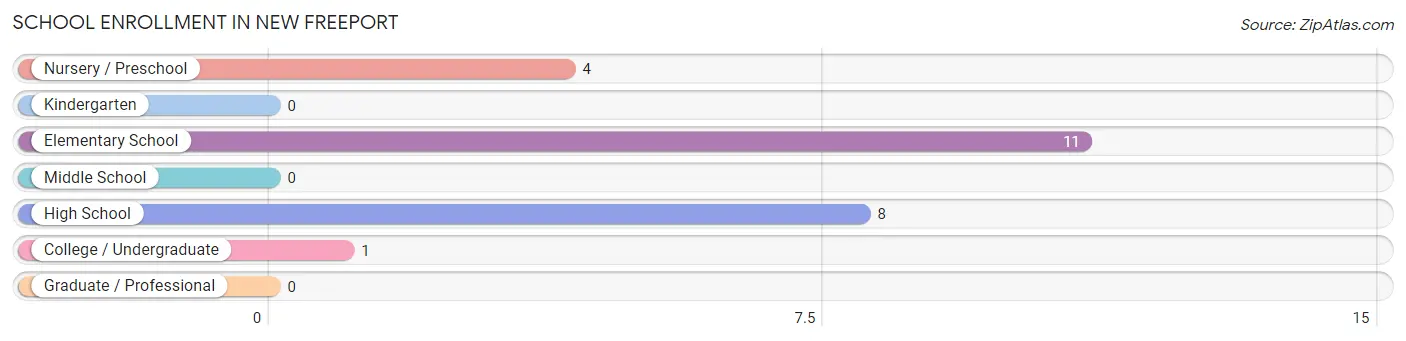
The most common levels of schooling among the 24 students in New Freeport are elementary school (11 | 45.8%), high school (8 | 33.3%), and nursery / preschool (4 | 16.7%).
| School Level | # Students | % Students |
| Nursery / Preschool | 4 | 16.7% |
| Kindergarten | 0 | 0.0% |
| Elementary School | 11 | 45.8% |
| Middle School | 0 | 0.0% |
| High School | 8 | 33.3% |
| College / Undergraduate | 1 | 4.2% |
| Graduate / Professional | 0 | 0.0% |
| Total | 24 | 100.0% |
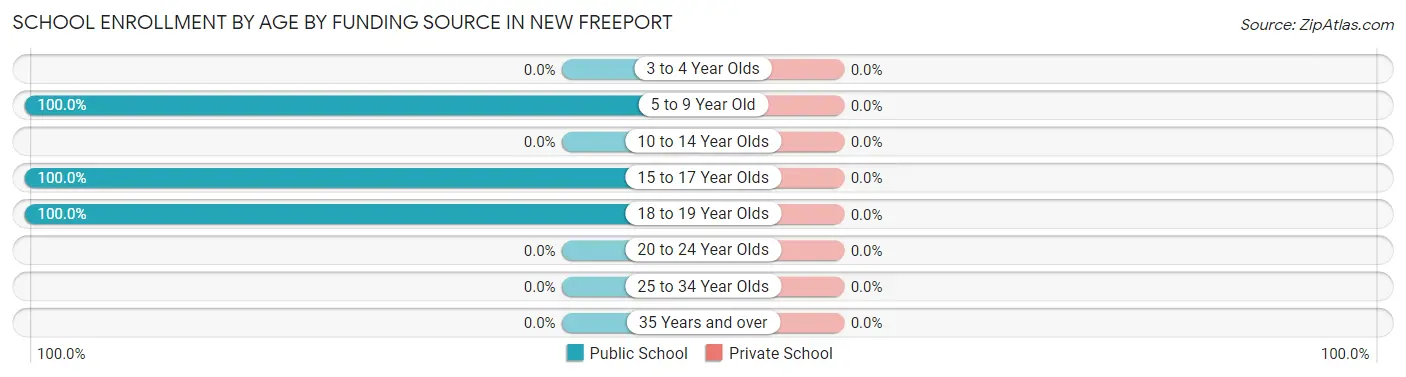
School Enrollment by Age by Funding Source in New Freeport
| Age Bracket | Public School | Private School |
| 3 to 4 Year Olds | 0 (0.0%) | 0 (0.0%) |
| 5 to 9 Year Old | 15 (100.0%) | 0 (0.0%) |
| 10 to 14 Year Olds | 0 (0.0%) | 0 (0.0%) |
| 15 to 17 Year Olds | 7 (100.0%) | 0 (0.0%) |
| 18 to 19 Year Olds | 2 (100.0%) | 0 (0.0%) |
| 20 to 24 Year Olds | 0 (0.0%) | 0 (0.0%) |
| 25 to 34 Year Olds | 0 (0.0%) | 0 (0.0%) |
| 35 Years and over | 0 (0.0%) | 0 (0.0%) |
| Total | 24 (100.0%) | 0 (0.0%) |
Educational Attainment by Field of Study in New Freeport
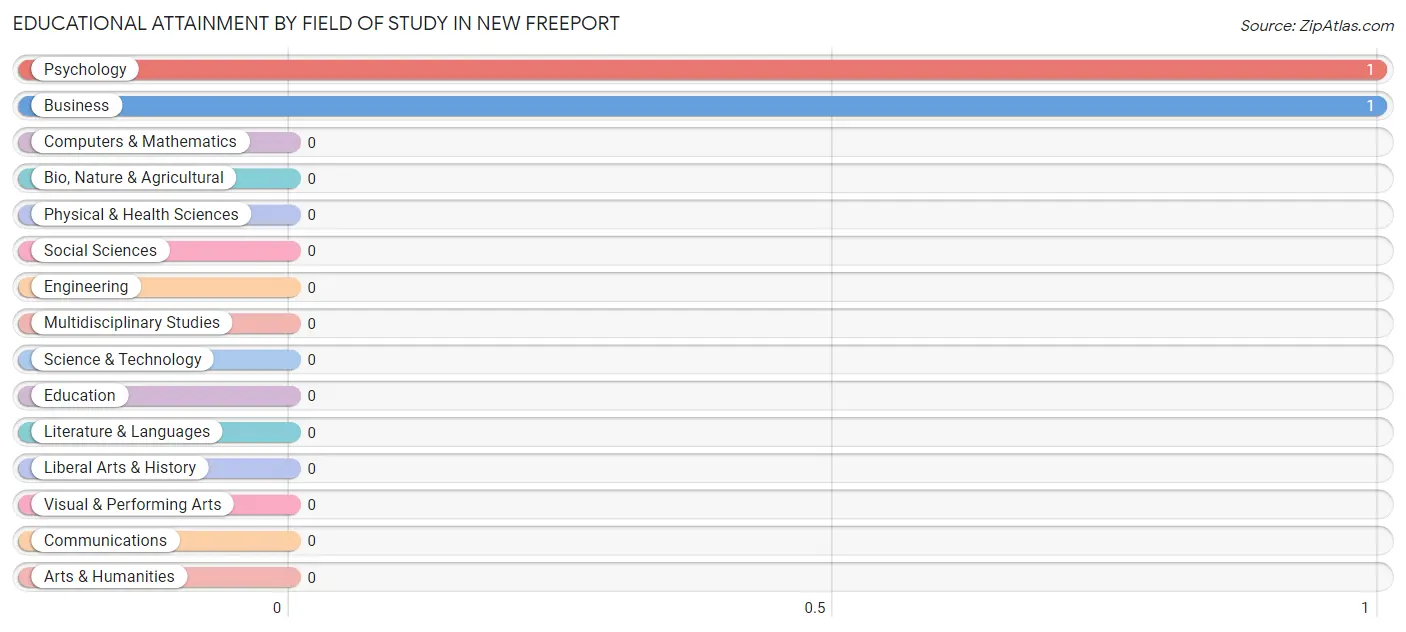
Psychology (1 | 50.0%), and business (1 | 50.0%) are the most common fields of study among 2 individuals in New Freeport who have obtained a bachelor's degree or higher.
| Field of Study | # Graduates | % Graduates |
| Computers & Mathematics | 0 | 0.0% |
| Bio, Nature & Agricultural | 0 | 0.0% |
| Physical & Health Sciences | 0 | 0.0% |
| Psychology | 1 | 50.0% |
| Social Sciences | 0 | 0.0% |
| Engineering | 0 | 0.0% |
| Multidisciplinary Studies | 0 | 0.0% |
| Science & Technology | 0 | 0.0% |
| Business | 1 | 50.0% |
| Education | 0 | 0.0% |
| Literature & Languages | 0 | 0.0% |
| Liberal Arts & History | 0 | 0.0% |
| Visual & Performing Arts | 0 | 0.0% |
| Communications | 0 | 0.0% |
| Arts & Humanities | 0 | 0.0% |
| Total | 2 | 100.0% |
Transportation & Commute in New Freeport
Vehicle Availability by Sex in New Freeport
The most prevalent vehicle ownership categories in New Freeport are males with 3 vehicles (6, accounting for 46.2%) and females with 3 vehicles (1, making up 60.0%).
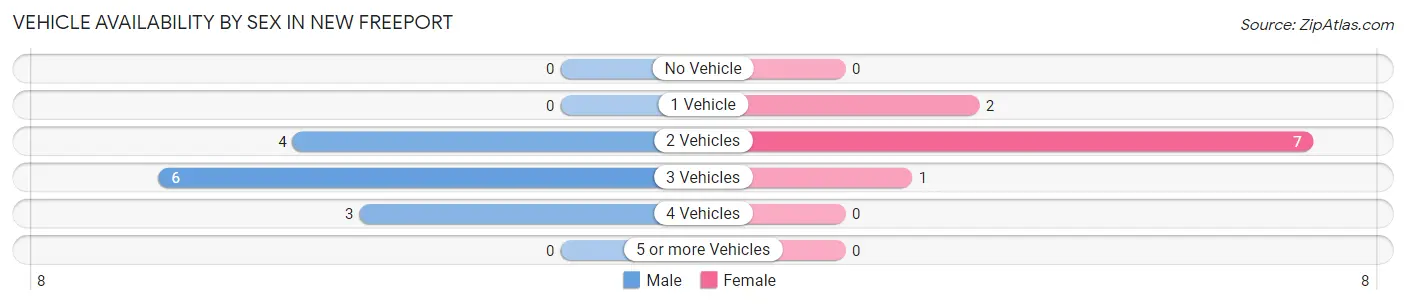
| Vehicles Available | Male | Female |
| No Vehicle | 0 (0.0%) | 0 (0.0%) |
| 1 Vehicle | 0 (0.0%) | 2 (20.0%) |
| 2 Vehicles | 4 (30.8%) | 7 (70.0%) |
| 3 Vehicles | 6 (46.2%) | 1 (10.0%) |
| 4 Vehicles | 3 (23.1%) | 0 (0.0%) |
| 5 or more Vehicles | 0 (0.0%) | 0 (0.0%) |
| Total | 13 (100.0%) | 10 (100.0%) |
Commute Time in New Freeport
The most frequently occuring commute durations in New Freeport are 45 to 59 minutes (10 commuters, 47.6%), 5 to 9 minutes (6 commuters, 28.6%), and 30 to 34 minutes (3 commuters, 14.3%).
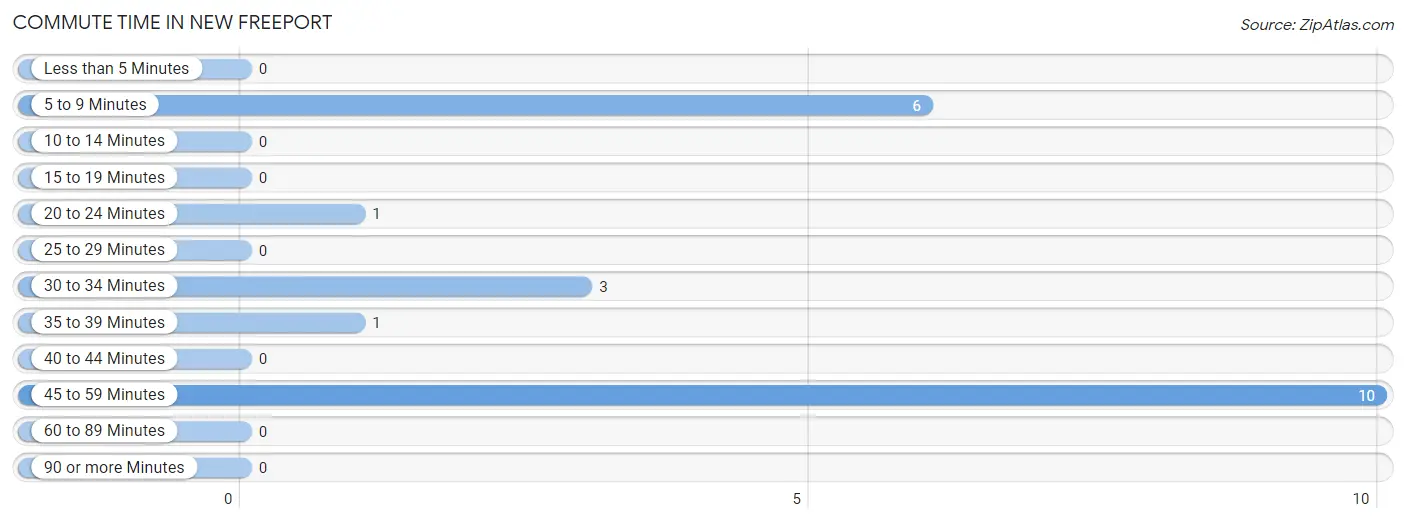
| Commute Time | # Commuters | % Commuters |
| Less than 5 Minutes | 0 | 0.0% |
| 5 to 9 Minutes | 6 | 28.6% |
| 10 to 14 Minutes | 0 | 0.0% |
| 15 to 19 Minutes | 0 | 0.0% |
| 20 to 24 Minutes | 1 | 4.8% |
| 25 to 29 Minutes | 0 | 0.0% |
| 30 to 34 Minutes | 3 | 14.3% |
| 35 to 39 Minutes | 1 | 4.8% |
| 40 to 44 Minutes | 0 | 0.0% |
| 45 to 59 Minutes | 10 | 47.6% |
| 60 to 89 Minutes | 0 | 0.0% |
| 90 or more Minutes | 0 | 0.0% |
Commute Time by Sex in New Freeport
The most common commute times in New Freeport are 5 to 9 minutes (6 commuters, 46.2%) for males and 45 to 59 minutes (7 commuters, 87.5%) for females.
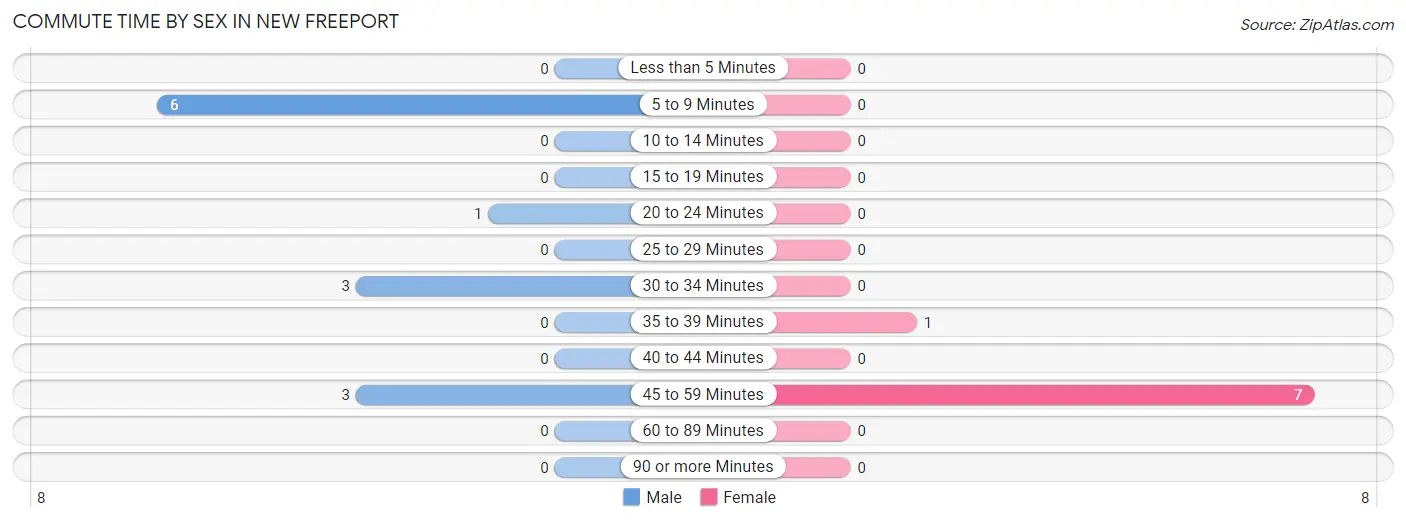
| Commute Time | Male | Female |
| Less than 5 Minutes | 0 (0.0%) | 0 (0.0%) |
| 5 to 9 Minutes | 6 (46.2%) | 0 (0.0%) |
| 10 to 14 Minutes | 0 (0.0%) | 0 (0.0%) |
| 15 to 19 Minutes | 0 (0.0%) | 0 (0.0%) |
| 20 to 24 Minutes | 1 (7.7%) | 0 (0.0%) |
| 25 to 29 Minutes | 0 (0.0%) | 0 (0.0%) |
| 30 to 34 Minutes | 3 (23.1%) | 0 (0.0%) |
| 35 to 39 Minutes | 0 (0.0%) | 1 (12.5%) |
| 40 to 44 Minutes | 0 (0.0%) | 0 (0.0%) |
| 45 to 59 Minutes | 3 (23.1%) | 7 (87.5%) |
| 60 to 89 Minutes | 0 (0.0%) | 0 (0.0%) |
| 90 or more Minutes | 0 (0.0%) | 0 (0.0%) |
Time of Departure to Work by Sex in New Freeport
The most frequent times of departure to work in New Freeport are 5:30 AM to 5:59 AM (9, 69.2%) for males and 12:00 PM to 3:59 PM (7, 87.5%) for females.
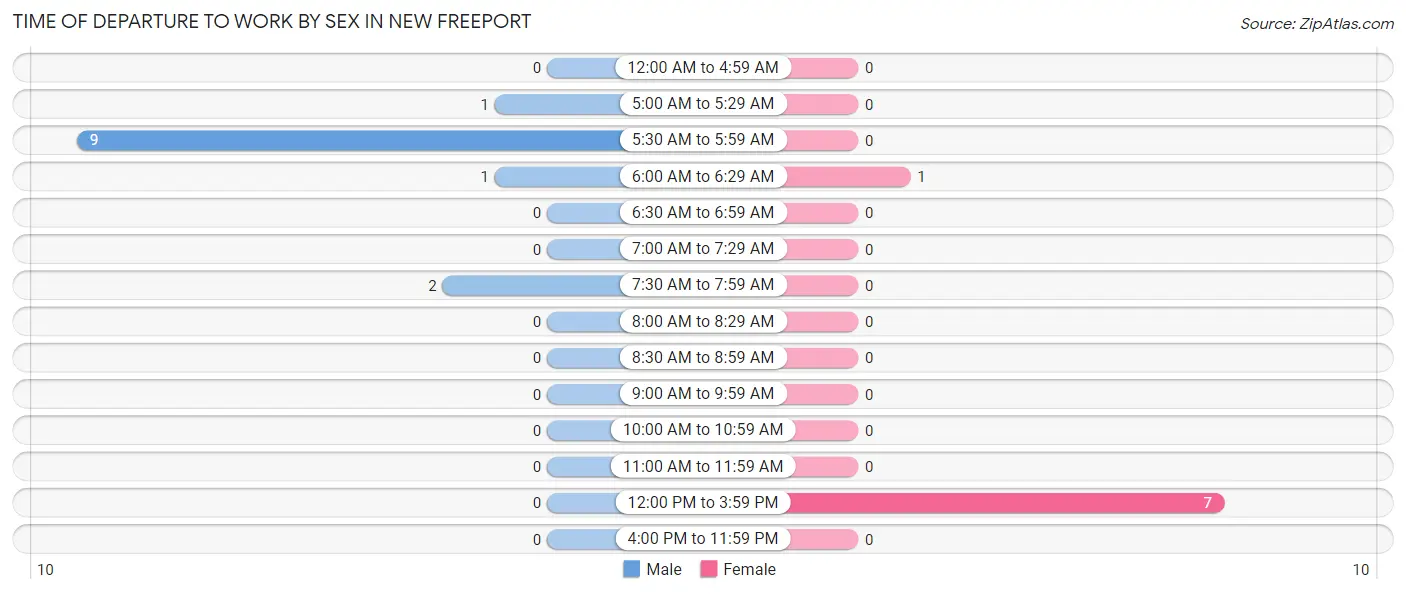
| Time of Departure | Male | Female |
| 12:00 AM to 4:59 AM | 0 (0.0%) | 0 (0.0%) |
| 5:00 AM to 5:29 AM | 1 (7.7%) | 0 (0.0%) |
| 5:30 AM to 5:59 AM | 9 (69.2%) | 0 (0.0%) |
| 6:00 AM to 6:29 AM | 1 (7.7%) | 1 (12.5%) |
| 6:30 AM to 6:59 AM | 0 (0.0%) | 0 (0.0%) |
| 7:00 AM to 7:29 AM | 0 (0.0%) | 0 (0.0%) |
| 7:30 AM to 7:59 AM | 2 (15.4%) | 0 (0.0%) |
| 8:00 AM to 8:29 AM | 0 (0.0%) | 0 (0.0%) |
| 8:30 AM to 8:59 AM | 0 (0.0%) | 0 (0.0%) |
| 9:00 AM to 9:59 AM | 0 (0.0%) | 0 (0.0%) |
| 10:00 AM to 10:59 AM | 0 (0.0%) | 0 (0.0%) |
| 11:00 AM to 11:59 AM | 0 (0.0%) | 0 (0.0%) |
| 12:00 PM to 3:59 PM | 0 (0.0%) | 7 (87.5%) |
| 4:00 PM to 11:59 PM | 0 (0.0%) | 0 (0.0%) |
| Total | 13 (100.0%) | 8 (100.0%) |
Housing Occupancy in New Freeport
Occupancy by Ownership in New Freeport
Of the total 27 dwellings in New Freeport, owner-occupied units account for 24 (88.9%), while renter-occupied units make up 3 (11.1%).
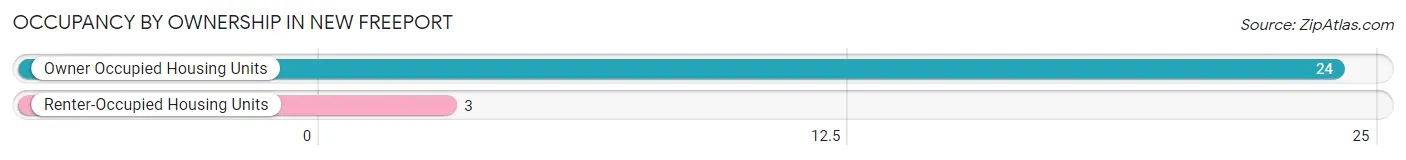
| Occupancy | # Housing Units | % Housing Units |
| Owner Occupied Housing Units | 24 | 88.9% |
| Renter-Occupied Housing Units | 3 | 11.1% |
| Total Occupied Housing Units | 27 | 100.0% |
Occupancy by Household Size in New Freeport
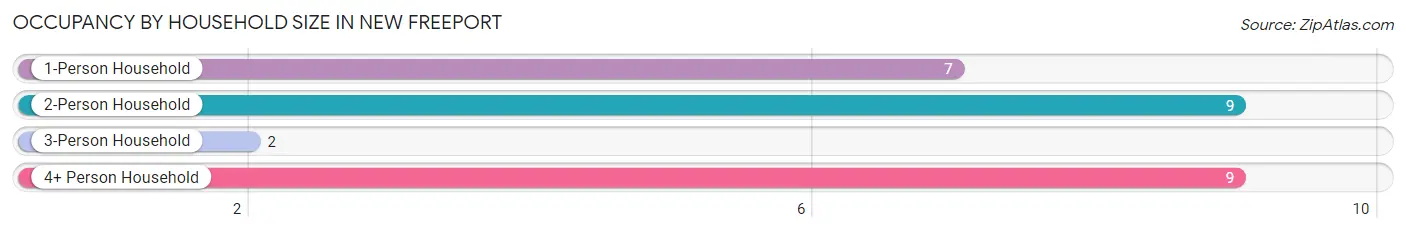
| Household Size | # Housing Units | % Housing Units |
| 1-Person Household | 7 | 25.9% |
| 2-Person Household | 9 | 33.3% |
| 3-Person Household | 2 | 7.4% |
| 4+ Person Household | 9 | 33.3% |
| Total Housing Units | 27 | 100.0% |
Occupancy by Ownership by Household Size in New Freeport
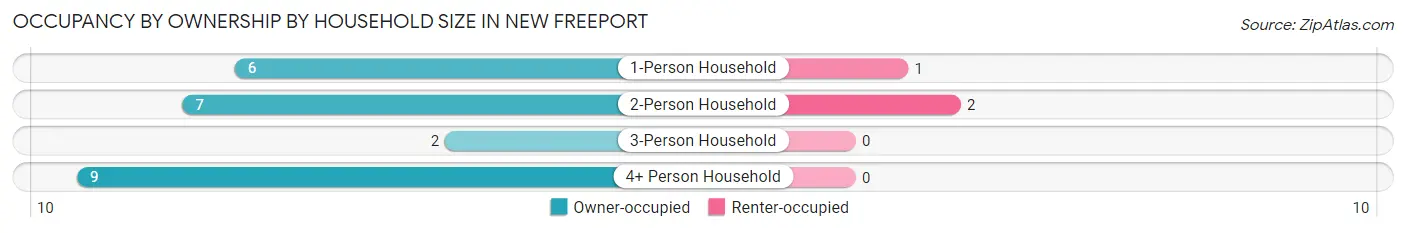
| Household Size | Owner-occupied | Renter-occupied |
| 1-Person Household | 6 (85.7%) | 1 (14.3%) |
| 2-Person Household | 7 (77.8%) | 2 (22.2%) |
| 3-Person Household | 2 (100.0%) | 0 (0.0%) |
| 4+ Person Household | 9 (100.0%) | 0 (0.0%) |
| Total Housing Units | 24 (88.9%) | 3 (11.1%) |
Occupancy by Educational Attainment in New Freeport
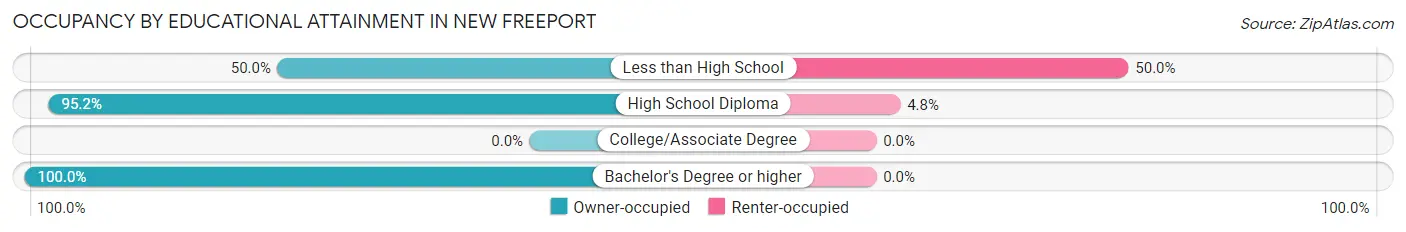
| Household Size | Owner-occupied | Renter-occupied |
| Less than High School | 2 (50.0%) | 2 (50.0%) |
| High School Diploma | 20 (95.2%) | 1 (4.8%) |
| College/Associate Degree | 0 (0.0%) | 0 (0.0%) |
| Bachelor's Degree or higher | 2 (100.0%) | 0 (0.0%) |
Occupancy by Age of Householder in New Freeport
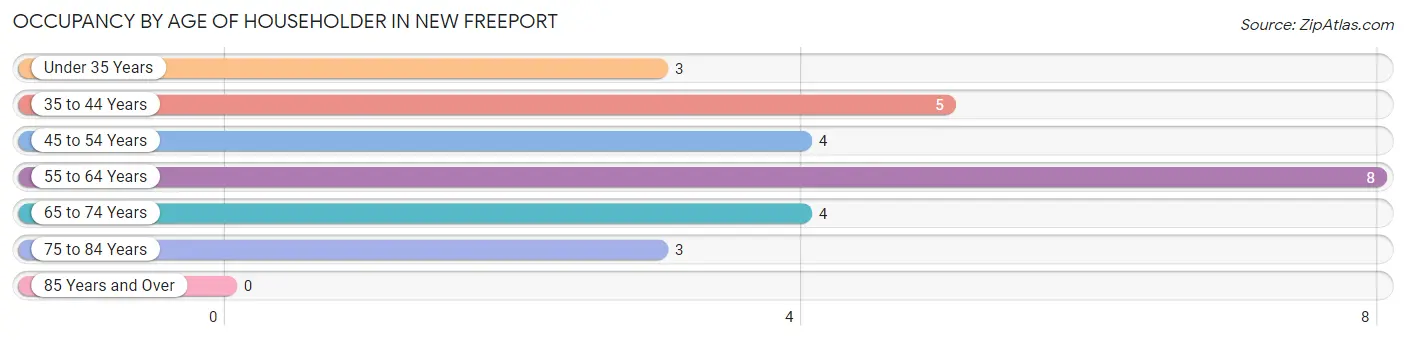
| Age Bracket | # Households | % Households |
| Under 35 Years | 3 | 11.1% |
| 35 to 44 Years | 5 | 18.5% |
| 45 to 54 Years | 4 | 14.8% |
| 55 to 64 Years | 8 | 29.6% |
| 65 to 74 Years | 4 | 14.8% |
| 75 to 84 Years | 3 | 11.1% |
| 85 Years and Over | 0 | 0.0% |
| Total | 27 | 100.0% |
Housing Finances in New Freeport
Median Income by Occupancy in New Freeport
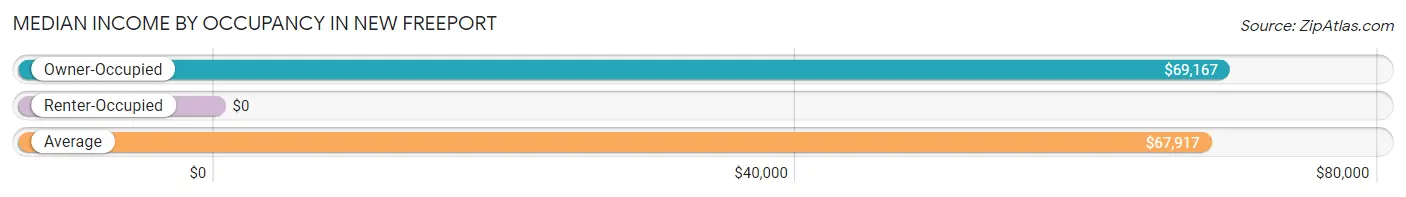
| Occupancy Type | # Households | Median Income |
| Owner-Occupied | 24 (88.9%) | $69,167 |
| Renter-Occupied | 3 (11.1%) | $0 |
| Average | 27 (100.0%) | $67,917 |
Occupancy by Householder Income Bracket in New Freeport
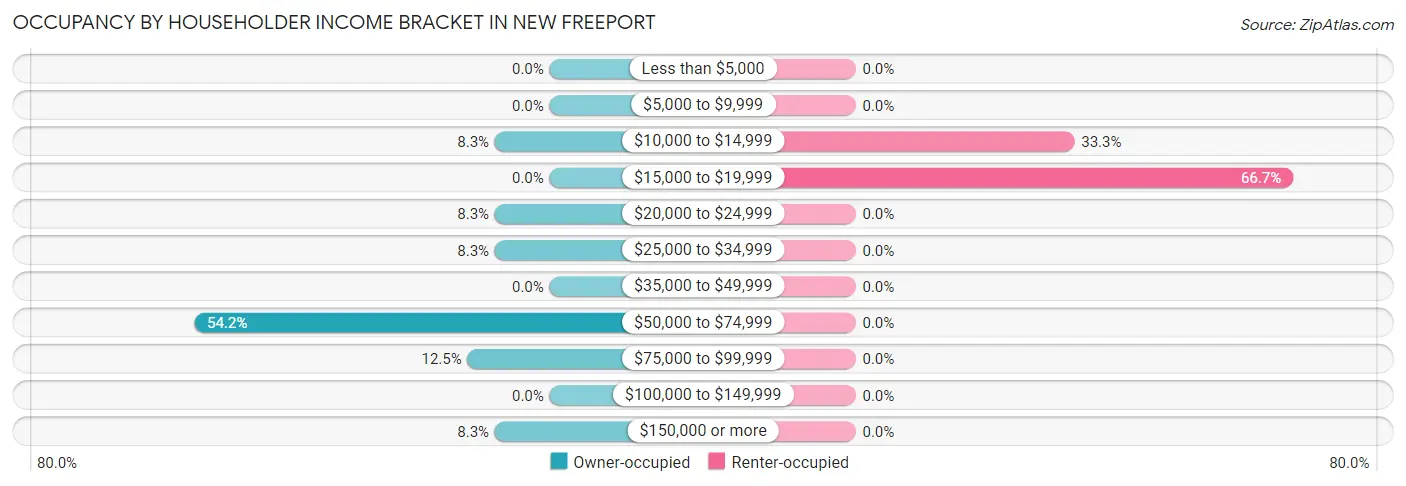
| Income Bracket | Owner-occupied | Renter-occupied |
| Less than $5,000 | 0 (0.0%) | 0 (0.0%) |
| $5,000 to $9,999 | 0 (0.0%) | 0 (0.0%) |
| $10,000 to $14,999 | 2 (8.3%) | 1 (33.3%) |
| $15,000 to $19,999 | 0 (0.0%) | 2 (66.7%) |
| $20,000 to $24,999 | 2 (8.3%) | 0 (0.0%) |
| $25,000 to $34,999 | 2 (8.3%) | 0 (0.0%) |
| $35,000 to $49,999 | 0 (0.0%) | 0 (0.0%) |
| $50,000 to $74,999 | 13 (54.2%) | 0 (0.0%) |
| $75,000 to $99,999 | 3 (12.5%) | 0 (0.0%) |
| $100,000 to $149,999 | 0 (0.0%) | 0 (0.0%) |
| $150,000 or more | 2 (8.3%) | 0 (0.0%) |
| Total | 24 (100.0%) | 3 (100.0%) |
Monthly Housing Cost Tiers in New Freeport
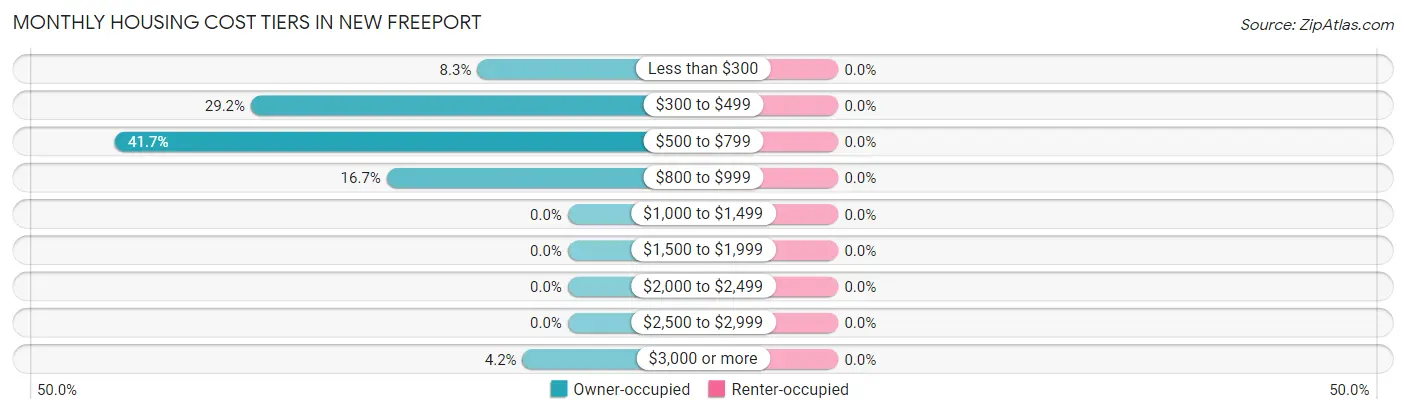
| Monthly Cost | Owner-occupied | Renter-occupied |
| Less than $300 | 2 (8.3%) | 0 (0.0%) |
| $300 to $499 | 7 (29.2%) | 0 (0.0%) |
| $500 to $799 | 10 (41.7%) | 0 (0.0%) |
| $800 to $999 | 4 (16.7%) | 0 (0.0%) |
| $1,000 to $1,499 | 0 (0.0%) | 0 (0.0%) |
| $1,500 to $1,999 | 0 (0.0%) | 0 (0.0%) |
| $2,000 to $2,499 | 0 (0.0%) | 0 (0.0%) |
| $2,500 to $2,999 | 0 (0.0%) | 0 (0.0%) |
| $3,000 or more | 1 (4.2%) | 0 (0.0%) |
| Total | 24 (100.0%) | 3 (100.0%) |
Physical Housing Characteristics in New Freeport
Housing Structures in New Freeport
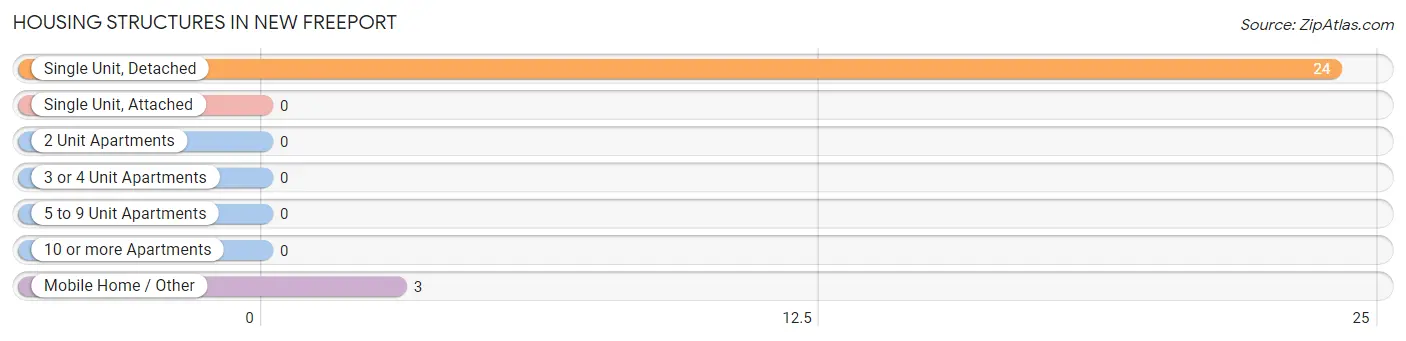
| Structure Type | # Housing Units | % Housing Units |
| Single Unit, Detached | 24 | 88.9% |
| Single Unit, Attached | 0 | 0.0% |
| 2 Unit Apartments | 0 | 0.0% |
| 3 or 4 Unit Apartments | 0 | 0.0% |
| 5 to 9 Unit Apartments | 0 | 0.0% |
| 10 or more Apartments | 0 | 0.0% |
| Mobile Home / Other | 3 | 11.1% |
| Total | 27 | 100.0% |
Housing Structures by Occupancy in New Freeport
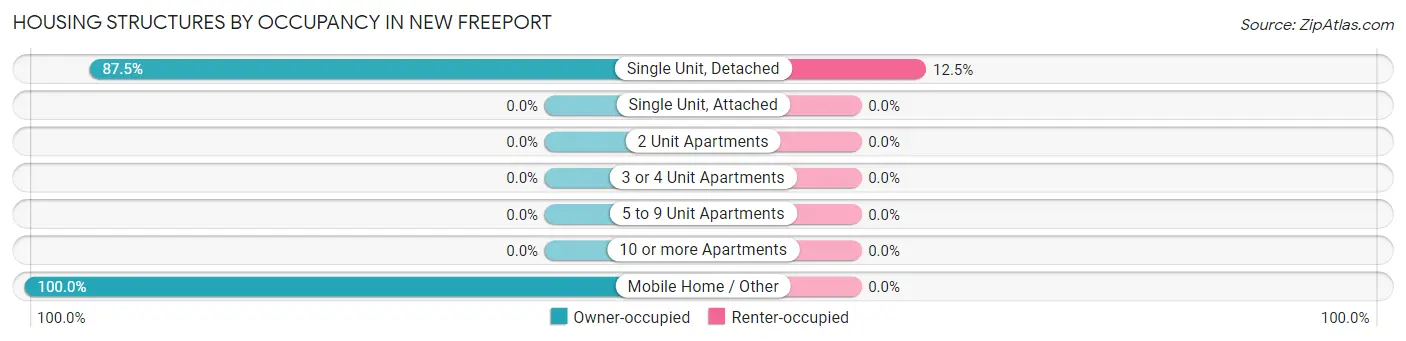
| Structure Type | Owner-occupied | Renter-occupied |
| Single Unit, Detached | 21 (87.5%) | 3 (12.5%) |
| Single Unit, Attached | 0 (0.0%) | 0 (0.0%) |
| 2 Unit Apartments | 0 (0.0%) | 0 (0.0%) |
| 3 or 4 Unit Apartments | 0 (0.0%) | 0 (0.0%) |
| 5 to 9 Unit Apartments | 0 (0.0%) | 0 (0.0%) |
| 10 or more Apartments | 0 (0.0%) | 0 (0.0%) |
| Mobile Home / Other | 3 (100.0%) | 0 (0.0%) |
| Total | 24 (88.9%) | 3 (11.1%) |
Housing Structures by Number of Rooms in New Freeport
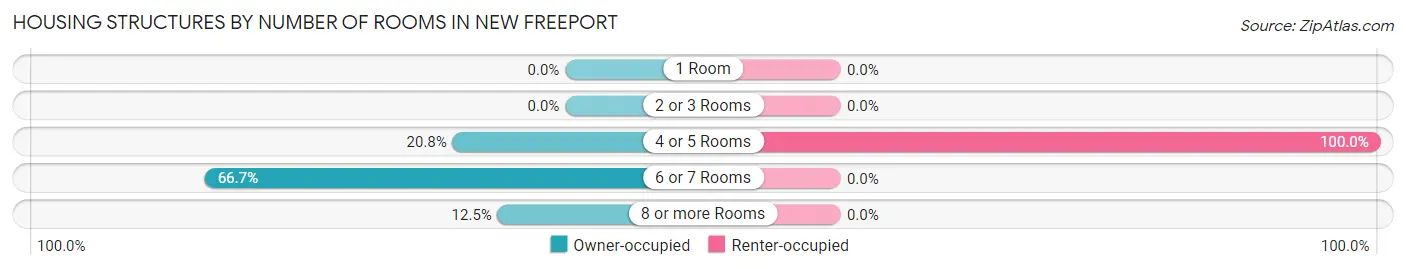
| Number of Rooms | Owner-occupied | Renter-occupied |
| 1 Room | 0 (0.0%) | 0 (0.0%) |
| 2 or 3 Rooms | 0 (0.0%) | 0 (0.0%) |
| 4 or 5 Rooms | 5 (20.8%) | 3 (100.0%) |
| 6 or 7 Rooms | 16 (66.7%) | 0 (0.0%) |
| 8 or more Rooms | 3 (12.5%) | 0 (0.0%) |
| Total | 24 (100.0%) | 3 (100.0%) |
Housing Structure by Heating Type in New Freeport
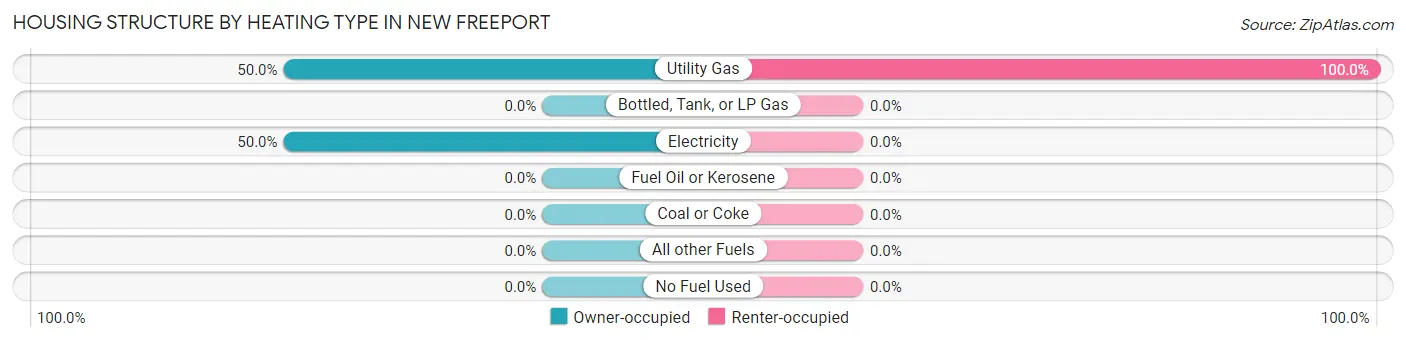
| Heating Type | Owner-occupied | Renter-occupied |
| Utility Gas | 12 (50.0%) | 3 (100.0%) |
| Bottled, Tank, or LP Gas | 0 (0.0%) | 0 (0.0%) |
| Electricity | 12 (50.0%) | 0 (0.0%) |
| Fuel Oil or Kerosene | 0 (0.0%) | 0 (0.0%) |
| Coal or Coke | 0 (0.0%) | 0 (0.0%) |
| All other Fuels | 0 (0.0%) | 0 (0.0%) |
| No Fuel Used | 0 (0.0%) | 0 (0.0%) |
| Total | 24 (100.0%) | 3 (100.0%) |
Household Vehicle Usage in New Freeport
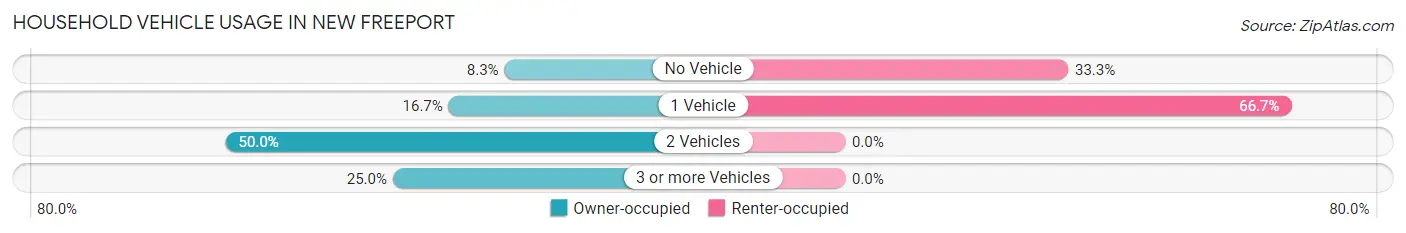
| Vehicles per Household | Owner-occupied | Renter-occupied |
| No Vehicle | 2 (8.3%) | 1 (33.3%) |
| 1 Vehicle | 4 (16.7%) | 2 (66.7%) |
| 2 Vehicles | 12 (50.0%) | 0 (0.0%) |
| 3 or more Vehicles | 6 (25.0%) | 0 (0.0%) |
| Total | 24 (100.0%) | 3 (100.0%) |
Real Estate & Mortgages in New Freeport
Real Estate and Mortgage Overview in New Freeport
| Characteristic | Without Mortgage | With Mortgage |
| Housing Units | 6 | 18 |
| Median Property Value | $55,000 | $0 |
| Median Household Income | - | - |
| Monthly Housing Costs | - | - |
| Real Estate Taxes | $900 | $0 |
Property Value by Mortgage Status in New Freeport
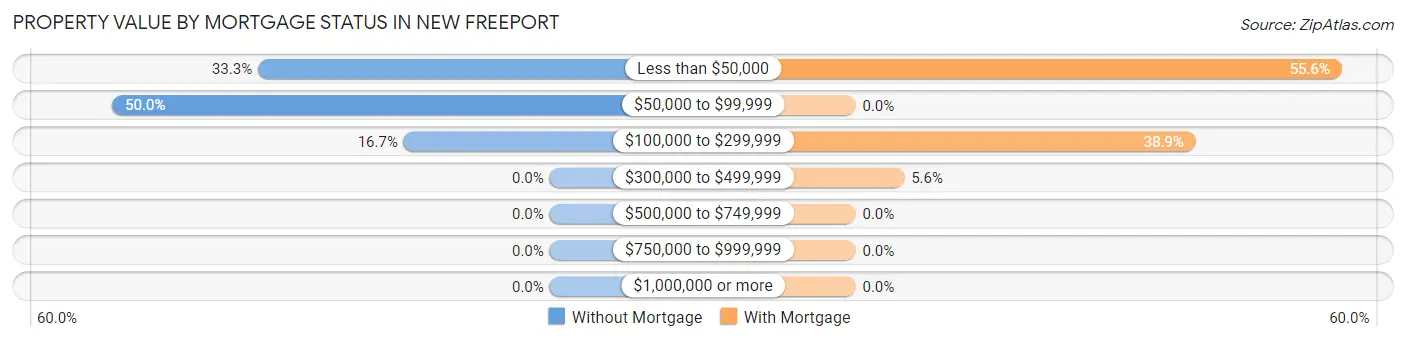
| Property Value | Without Mortgage | With Mortgage |
| Less than $50,000 | 2 (33.3%) | 10 (55.6%) |
| $50,000 to $99,999 | 3 (50.0%) | 0 (0.0%) |
| $100,000 to $299,999 | 1 (16.7%) | 7 (38.9%) |
| $300,000 to $499,999 | 0 (0.0%) | 1 (5.6%) |
| $500,000 to $749,999 | 0 (0.0%) | 0 (0.0%) |
| $750,000 to $999,999 | 0 (0.0%) | 0 (0.0%) |
| $1,000,000 or more | 0 (0.0%) | 0 (0.0%) |
| Total | 6 (100.0%) | 18 (100.0%) |
Household Income by Mortgage Status in New Freeport
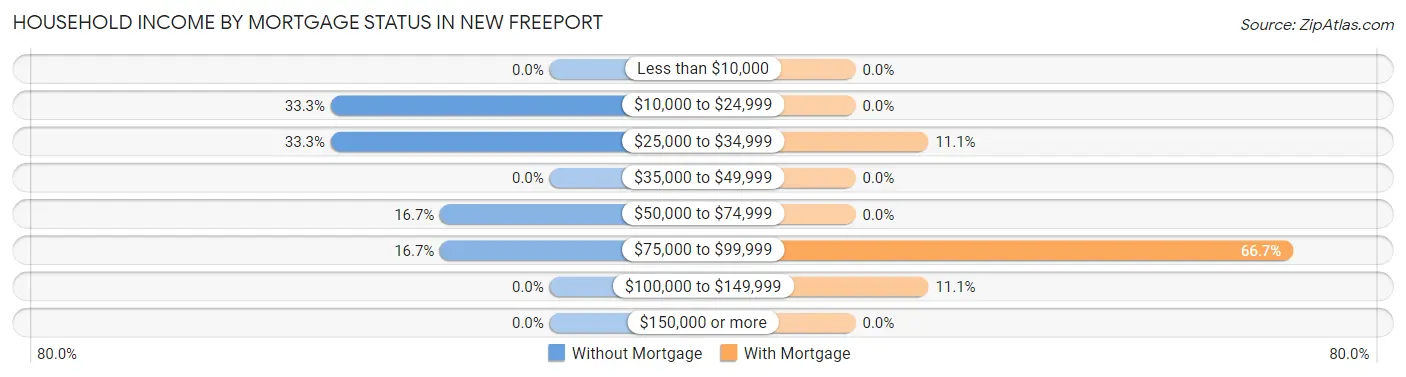
| Household Income | Without Mortgage | With Mortgage |
| Less than $10,000 | 0 (0.0%) | 0 (0.0%) |
| $10,000 to $24,999 | 2 (33.3%) | 0 (0.0%) |
| $25,000 to $34,999 | 2 (33.3%) | 2 (11.1%) |
| $35,000 to $49,999 | 0 (0.0%) | 0 (0.0%) |
| $50,000 to $74,999 | 1 (16.7%) | 0 (0.0%) |
| $75,000 to $99,999 | 1 (16.7%) | 12 (66.7%) |
| $100,000 to $149,999 | 0 (0.0%) | 2 (11.1%) |
| $150,000 or more | 0 (0.0%) | 0 (0.0%) |
| Total | 6 (100.0%) | 18 (100.0%) |
Property Value to Household Income Ratio in New Freeport
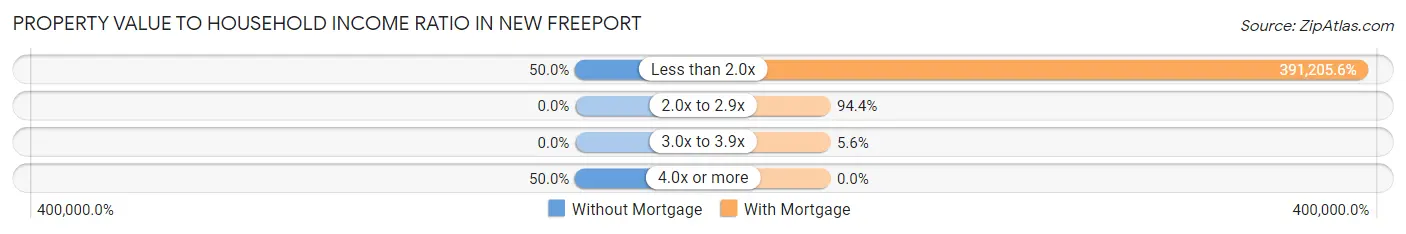
| Value-to-Income Ratio | Without Mortgage | With Mortgage |
| Less than 2.0x | 3 (50.0%) | 70,417 (391,205.6%) |
| 2.0x to 2.9x | 0 (0.0%) | 17 (94.4%) |
| 3.0x to 3.9x | 0 (0.0%) | 1 (5.6%) |
| 4.0x or more | 3 (50.0%) | 0 (0.0%) |
| Total | 6 (100.0%) | 18 (100.0%) |
Real Estate Taxes by Mortgage Status in New Freeport
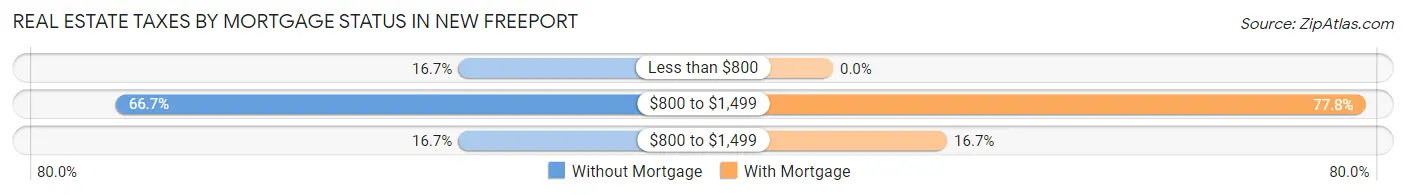
| Property Taxes | Without Mortgage | With Mortgage |
| Less than $800 | 1 (16.7%) | 0 (0.0%) |
| $800 to $1,499 | 4 (66.7%) | 14 (77.8%) |
| $800 to $1,499 | 1 (16.7%) | 3 (16.7%) |
| Total | 6 (100.0%) | 18 (100.0%) |
Health & Disability in New Freeport
Health Insurance Coverage by Age in New Freeport
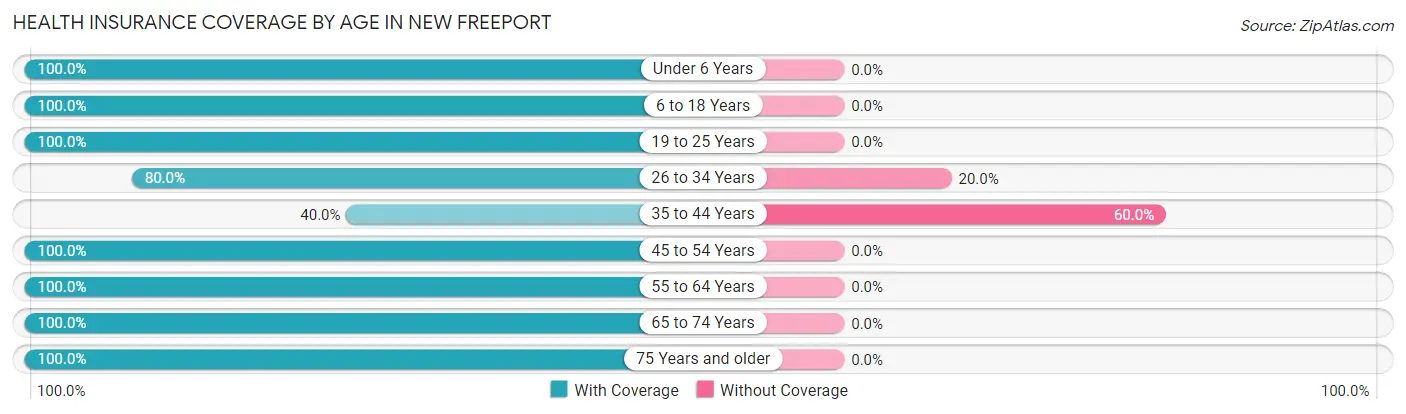
| Age Bracket | With Coverage | Without Coverage |
| Under 6 Years | 6 (100.0%) | 0 (0.0%) |
| 6 to 18 Years | 18 (100.0%) | 0 (0.0%) |
| 19 to 25 Years | 6 (100.0%) | 0 (0.0%) |
| 26 to 34 Years | 8 (80.0%) | 2 (20.0%) |
| 35 to 44 Years | 2 (40.0%) | 3 (60.0%) |
| 45 to 54 Years | 14 (100.0%) | 0 (0.0%) |
| 55 to 64 Years | 12 (100.0%) | 0 (0.0%) |
| 65 to 74 Years | 6 (100.0%) | 0 (0.0%) |
| 75 Years and older | 3 (100.0%) | 0 (0.0%) |
| Total | 75 (93.8%) | 5 (6.2%) |
Health Insurance Coverage by Citizenship Status in New Freeport
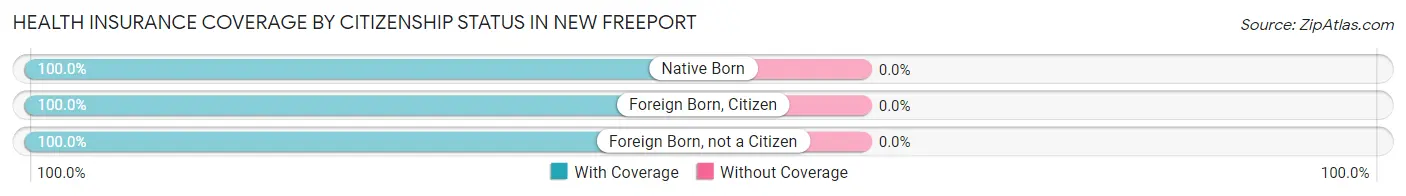
| Citizenship Status | With Coverage | Without Coverage |
| Native Born | 6 (100.0%) | 0 (0.0%) |
| Foreign Born, Citizen | 18 (100.0%) | 0 (0.0%) |
| Foreign Born, not a Citizen | 6 (100.0%) | 0 (0.0%) |
Health Insurance Coverage by Household Income in New Freeport
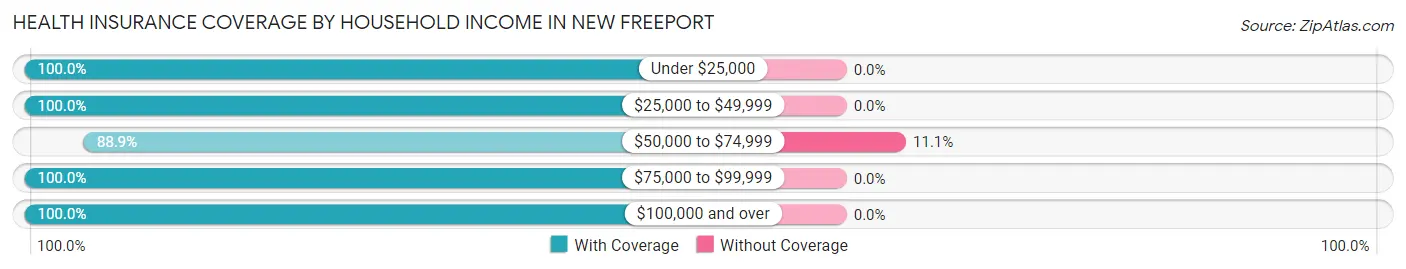
| Household Income | With Coverage | Without Coverage |
| Under $25,000 | 9 (100.0%) | 0 (0.0%) |
| $25,000 to $49,999 | 2 (100.0%) | 0 (0.0%) |
| $50,000 to $74,999 | 40 (88.9%) | 5 (11.1%) |
| $75,000 to $99,999 | 15 (100.0%) | 0 (0.0%) |
| $100,000 and over | 9 (100.0%) | 0 (0.0%) |
Public vs Private Health Insurance Coverage by Age in New Freeport
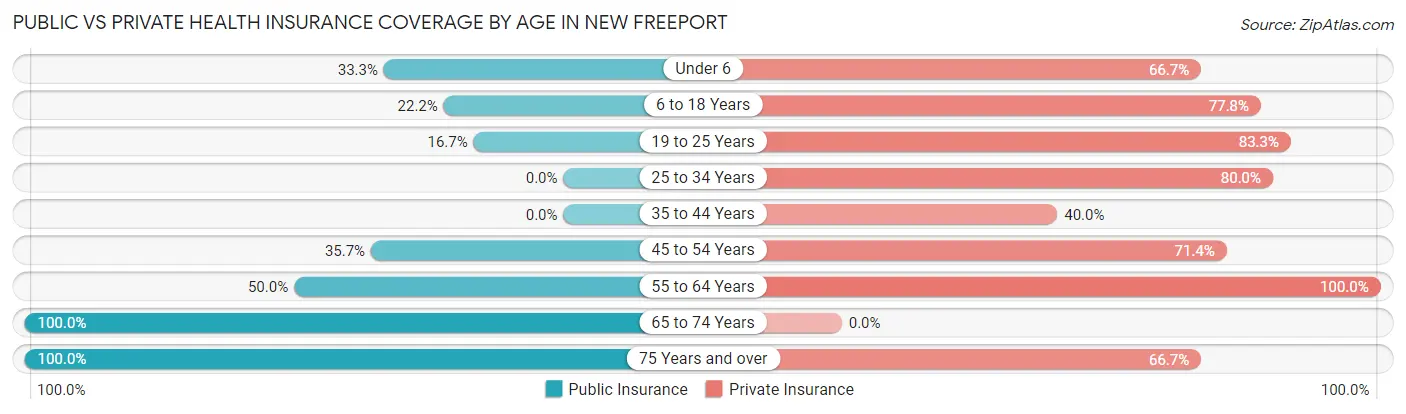
| Age Bracket | Public Insurance | Private Insurance |
| Under 6 | 2 (33.3%) | 4 (66.7%) |
| 6 to 18 Years | 4 (22.2%) | 14 (77.8%) |
| 19 to 25 Years | 1 (16.7%) | 5 (83.3%) |
| 25 to 34 Years | 0 (0.0%) | 8 (80.0%) |
| 35 to 44 Years | 0 (0.0%) | 2 (40.0%) |
| 45 to 54 Years | 5 (35.7%) | 10 (71.4%) |
| 55 to 64 Years | 6 (50.0%) | 12 (100.0%) |
| 65 to 74 Years | 6 (100.0%) | 0 (0.0%) |
| 75 Years and over | 3 (100.0%) | 2 (66.7%) |
| Total | 27 (33.8%) | 57 (71.3%) |
Disability Status by Sex by Age in New Freeport
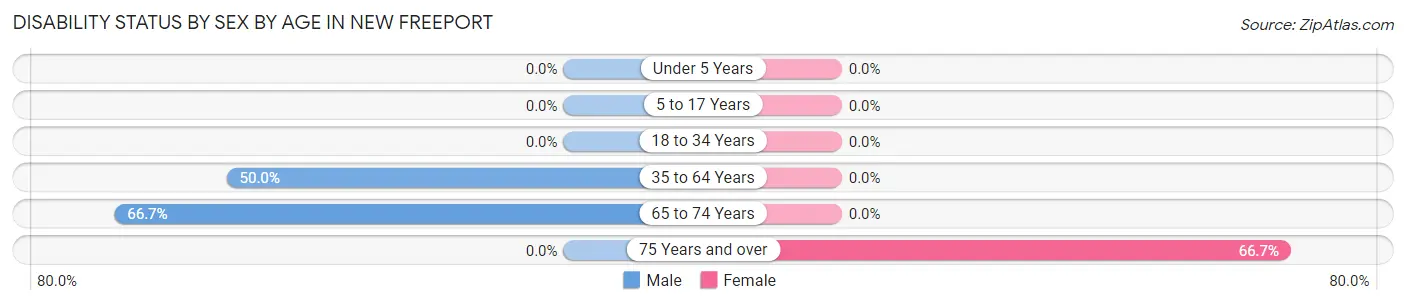
| Age Bracket | Male | Female |
| Under 5 Years | 0 (0.0%) | 0 (0.0%) |
| 5 to 17 Years | 0 (0.0%) | 0 (0.0%) |
| 18 to 34 Years | 0 (0.0%) | 0 (0.0%) |
| 35 to 64 Years | 7 (50.0%) | 0 (0.0%) |
| 65 to 74 Years | 4 (66.7%) | 0 (0.0%) |
| 75 Years and over | 0 (0.0%) | 2 (66.7%) |
Disability Class by Sex by Age in New Freeport
Disability Class: Hearing Difficulty
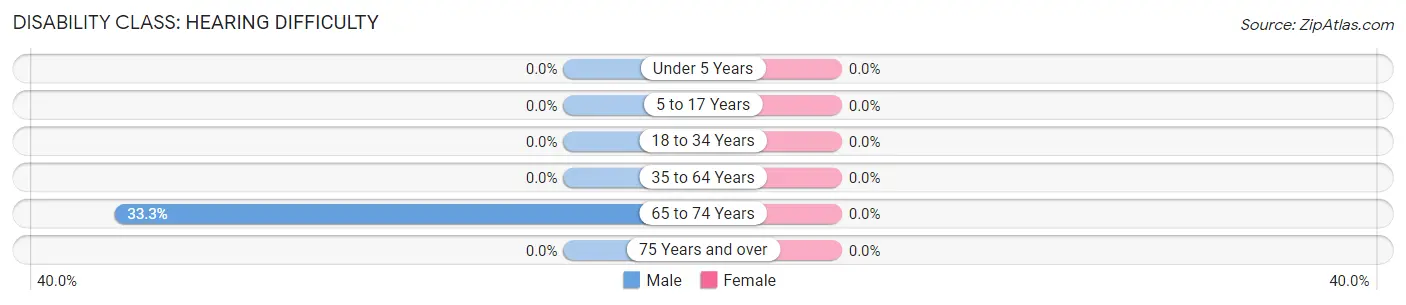
| Age Bracket | Male | Female |
| Under 5 Years | 0 (0.0%) | 0 (0.0%) |
| 5 to 17 Years | 0 (0.0%) | 0 (0.0%) |
| 18 to 34 Years | 0 (0.0%) | 0 (0.0%) |
| 35 to 64 Years | 0 (0.0%) | 0 (0.0%) |
| 65 to 74 Years | 2 (33.3%) | 0 (0.0%) |
| 75 Years and over | 0 (0.0%) | 0 (0.0%) |
Disability Class: Vision Difficulty
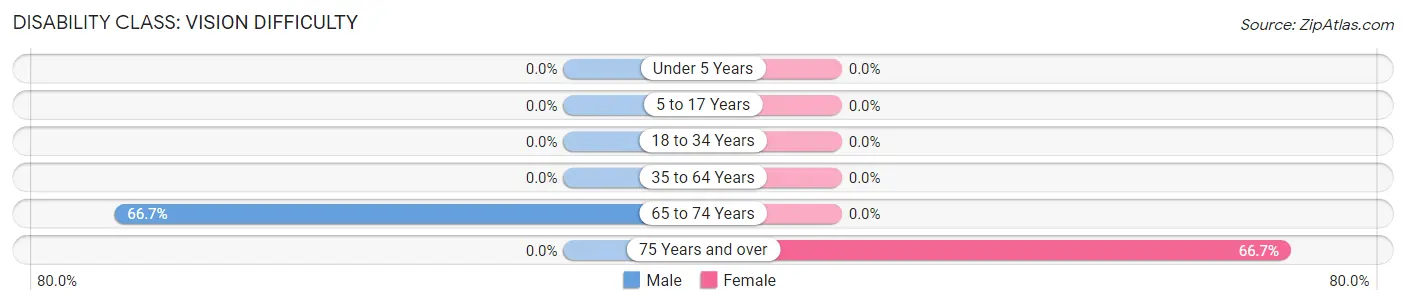
| Age Bracket | Male | Female |
| Under 5 Years | 0 (0.0%) | 0 (0.0%) |
| 5 to 17 Years | 0 (0.0%) | 0 (0.0%) |
| 18 to 34 Years | 0 (0.0%) | 0 (0.0%) |
| 35 to 64 Years | 0 (0.0%) | 0 (0.0%) |
| 65 to 74 Years | 4 (66.7%) | 0 (0.0%) |
| 75 Years and over | 0 (0.0%) | 2 (66.7%) |
Disability Class: Cognitive Difficulty
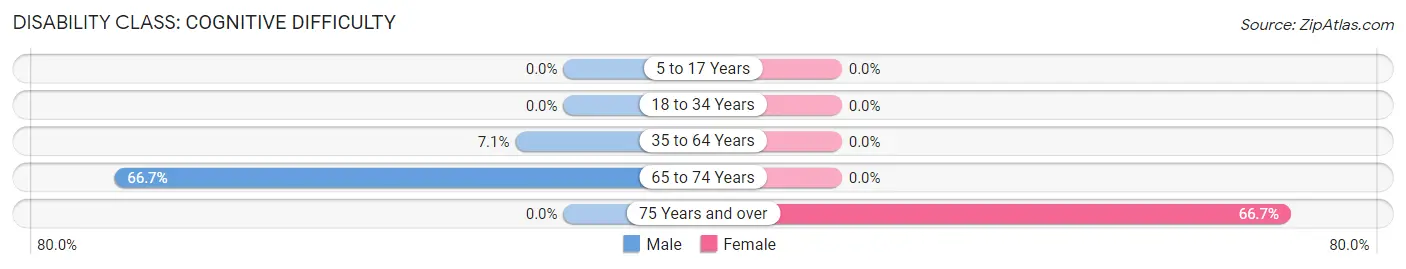
| Age Bracket | Male | Female |
| 5 to 17 Years | 0 (0.0%) | 0 (0.0%) |
| 18 to 34 Years | 0 (0.0%) | 0 (0.0%) |
| 35 to 64 Years | 1 (7.1%) | 0 (0.0%) |
| 65 to 74 Years | 4 (66.7%) | 0 (0.0%) |
| 75 Years and over | 0 (0.0%) | 2 (66.7%) |
Disability Class: Ambulatory Difficulty
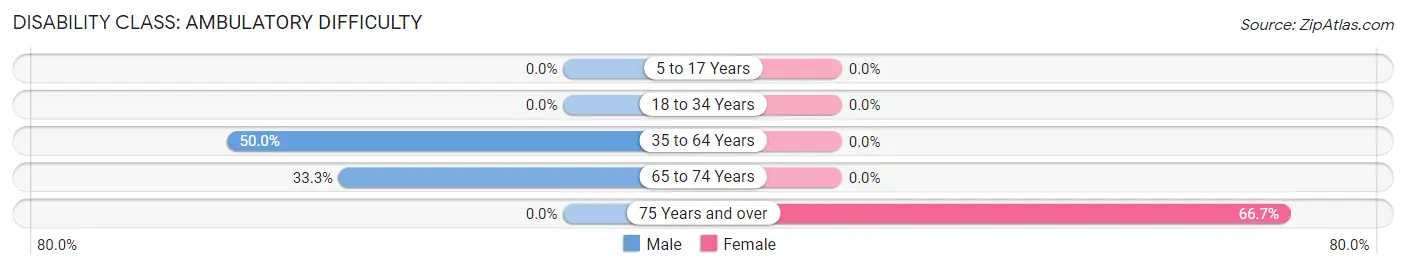
| Age Bracket | Male | Female |
| 5 to 17 Years | 0 (0.0%) | 0 (0.0%) |
| 18 to 34 Years | 0 (0.0%) | 0 (0.0%) |
| 35 to 64 Years | 7 (50.0%) | 0 (0.0%) |
| 65 to 74 Years | 2 (33.3%) | 0 (0.0%) |
| 75 Years and over | 0 (0.0%) | 2 (66.7%) |
Disability Class: Self-Care Difficulty
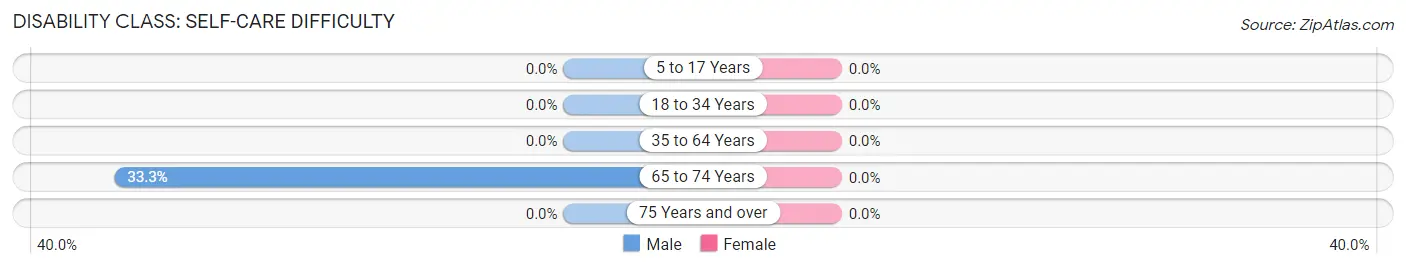
| Age Bracket | Male | Female |
| 5 to 17 Years | 0 (0.0%) | 0 (0.0%) |
| 18 to 34 Years | 0 (0.0%) | 0 (0.0%) |
| 35 to 64 Years | 0 (0.0%) | 0 (0.0%) |
| 65 to 74 Years | 2 (33.3%) | 0 (0.0%) |
| 75 Years and over | 0 (0.0%) | 0 (0.0%) |
Technology Access in New Freeport
Computing Device Access in New Freeport
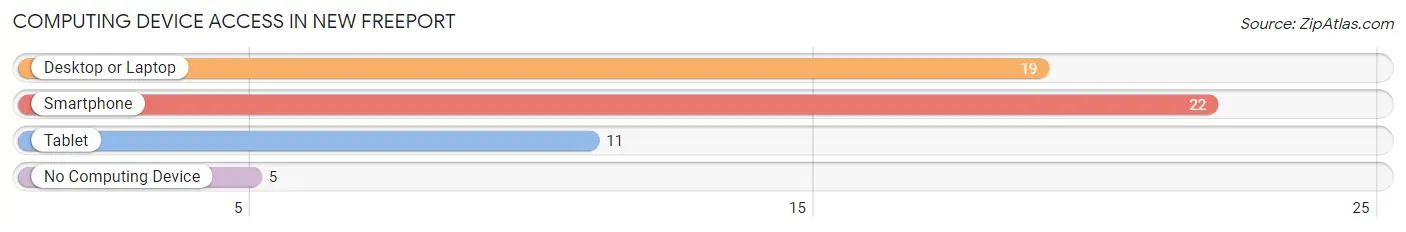
| Device Type | # Households | % Households |
| Desktop or Laptop | 19 | 70.4% |
| Smartphone | 22 | 81.5% |
| Tablet | 11 | 40.7% |
| No Computing Device | 5 | 18.5% |
| Total | 27 | 100.0% |
Internet Access in New Freeport
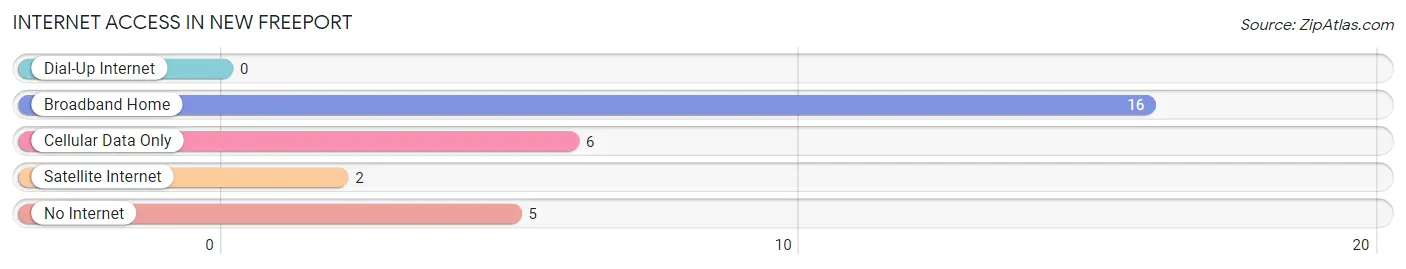
| Internet Type | # Households | % Households |
| Dial-Up Internet | 0 | 0.0% |
| Broadband Home | 16 | 59.3% |
| Cellular Data Only | 6 | 22.2% |
| Satellite Internet | 2 | 7.4% |
| No Internet | 5 | 18.5% |
| Total | 27 | 100.0% |
New Freeport Summary
Freeport, Pennsylvania is a small borough located in Armstrong County, Pennsylvania. It is situated along the Allegheny River, approximately 40 miles northeast of Pittsburgh. The population of Freeport was 1,845 as of the 2010 census.
History
The area that is now Freeport was first settled in the late 1700s by a group of German immigrants. The town was originally known as “Freeport”, after the nearby Freeport Ferry, which was established in 1802. The ferry was used to transport goods and people across the Allegheny River.
In 1832, the town was officially incorporated as a borough. The town was named after the nearby Freeport Ferry, which was named after the nearby Freeport Township.
The town grew steadily throughout the 19th century, and by the early 20th century, Freeport had become a bustling industrial center. The town was home to several factories, including a glass factory, a brickyard, and a tannery.
The town also had a thriving commercial district, with several stores, restaurants, and other businesses. The town also had a movie theater, a bowling alley, and a hotel.
Geography
Freeport is located in Armstrong County, Pennsylvania. It is situated along the Allegheny River, approximately 40 miles northeast of Pittsburgh. The borough is bordered by the townships of Freeport, South Buffalo, and East Franklin.
The borough has a total area of 0.8 square miles, all of which is land. The borough is located in a hilly region, with the highest point being located at an elevation of 1,068 feet.
Economy
The economy of Freeport is largely based on manufacturing and services. The town is home to several factories, including a glass factory, a brickyard, and a tannery. The town also has several stores, restaurants, and other businesses.
The town is also home to several small businesses, including a hardware store, a grocery store, and a pharmacy. The town also has a movie theater, a bowling alley, and a hotel.
Demographics
As of the 2010 census, the population of Freeport was 1,845. The racial makeup of the borough was 97.3% White, 0.7% African American, 0.2% Native American, 0.2% Asian, 0.2% from other races, and 1.6% from two or more races. Hispanic or Latino of any race were 0.7% of the population.
The median income for a household in the borough was $37,500, and the median income for a family was $45,000. The per capita income for the borough was $19,845. About 11.2% of families and 13.2% of the population were below the poverty line, including 17.2% of those under age 18 and 8.2% of those age 65 or over.
Common Questions
What is Per Capita Income in New Freeport?
Per Capita income in New Freeport is $25,054.
What is the Median Family Income in New Freeport?
Median Family Income in New Freeport is $69,167.
What is the Median Household income in New Freeport?
Median Household Income in New Freeport is $67,917.
What is Income or Wage Gap in New Freeport?
Income or Wage Gap in New Freeport is 41.1%.
Women in New Freeport earn 58.9 cents for every dollar earned by a man.
What is Inequality or Gini Index in New Freeport?
Inequality or Gini Index in New Freeport is 0.34.
What is the Total Population of New Freeport?
Total Population of New Freeport is 80.
What is the Total Male Population of New Freeport?
Total Male Population of New Freeport is 35.
What is the Total Female Population of New Freeport?
Total Female Population of New Freeport is 45.
What is the Ratio of Males per 100 Females in New Freeport?
There are 77.78 Males per 100 Females in New Freeport.
What is the Ratio of Females per 100 Males in New Freeport?
There are 128.57 Females per 100 Males in New Freeport.
What is the Median Population Age in New Freeport?
Median Population Age in New Freeport is 35.0 Years.
What is the Average Family Size in New Freeport
Average Family Size in New Freeport is 4.7 People.
What is the Average Household Size in New Freeport
Average Household Size in New Freeport is 3.0 People.
How Large is the Labor Force in New Freeport?
There are 28 People in the Labor Forcein in New Freeport.
What is the Percentage of People in the Labor Force in New Freeport?
48.3% of People are in the Labor Force in New Freeport.
What is the Unemployment Rate in New Freeport?
Unemployment Rate in New Freeport is 17.9%.