New Bethlehem borough, PA Map & Demographics
New Bethlehem borough Overview
$27,513
PER CAPITA INCOME
$61,125
AVG FAMILY INCOME
$36,103
AVG HOUSEHOLD INCOME
20.9%
WAGE / INCOME GAP [ % ]
79.1¢/ $1
WAGE / INCOME GAP [ $ ]
$12,767
FAMILY INCOME DEFICIT
0.48
INEQUALITY / GINI INDEX
845
TOTAL POPULATION
413
MALE POPULATION
432
FEMALE POPULATION
95.60
MALES / 100 FEMALES
104.60
FEMALES / 100 MALES
50.4
MEDIAN AGE
2.9
AVG FAMILY SIZE
2.1
AVG HOUSEHOLD SIZE
325
LABOR FORCE [ PEOPLE ]
46.0%
PERCENT IN LABOR FORCE
2.5%
UNEMPLOYMENT RATE
Income in New Bethlehem borough
Income Overview in New Bethlehem borough
Per Capita Income in New Bethlehem borough is $27,513, while median incomes of families and households are $61,125 and $36,103 respectively.
| Characteristic | Number | Measure |
| Per Capita Income | 845 | $27,513 |
| Median Family Income | 207 | $61,125 |
| Mean Family Income | 207 | $78,118 |
| Median Household Income | 403 | $36,103 |
| Mean Household Income | 403 | $56,445 |
| Income Deficit | 207 | $12,767 |
| Wage / Income Gap (%) | 845 | 20.89% |
| Wage / Income Gap ($) | 845 | 79.11¢ per $1 |
| Gini / Inequality Index | 845 | 0.48 |
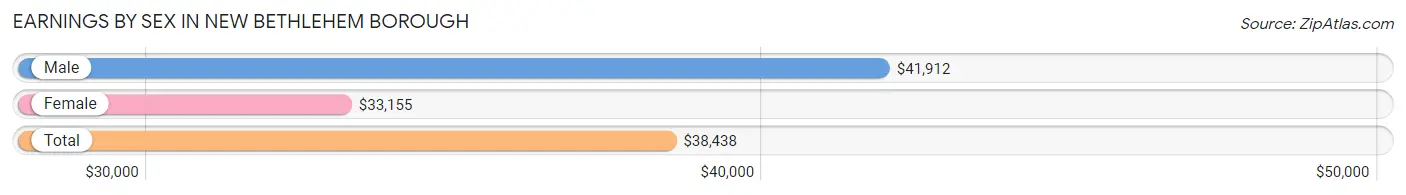
Earnings by Sex in New Bethlehem borough
Average Earnings in New Bethlehem borough are $38,438, $41,912 for men and $33,155 for women, a difference of 20.9%.
| Sex | Number | Average Earnings |
| Male | 206 (56.1%) | $41,912 |
| Female | 161 (43.9%) | $33,155 |
| Total | 367 (100.0%) | $38,438 |
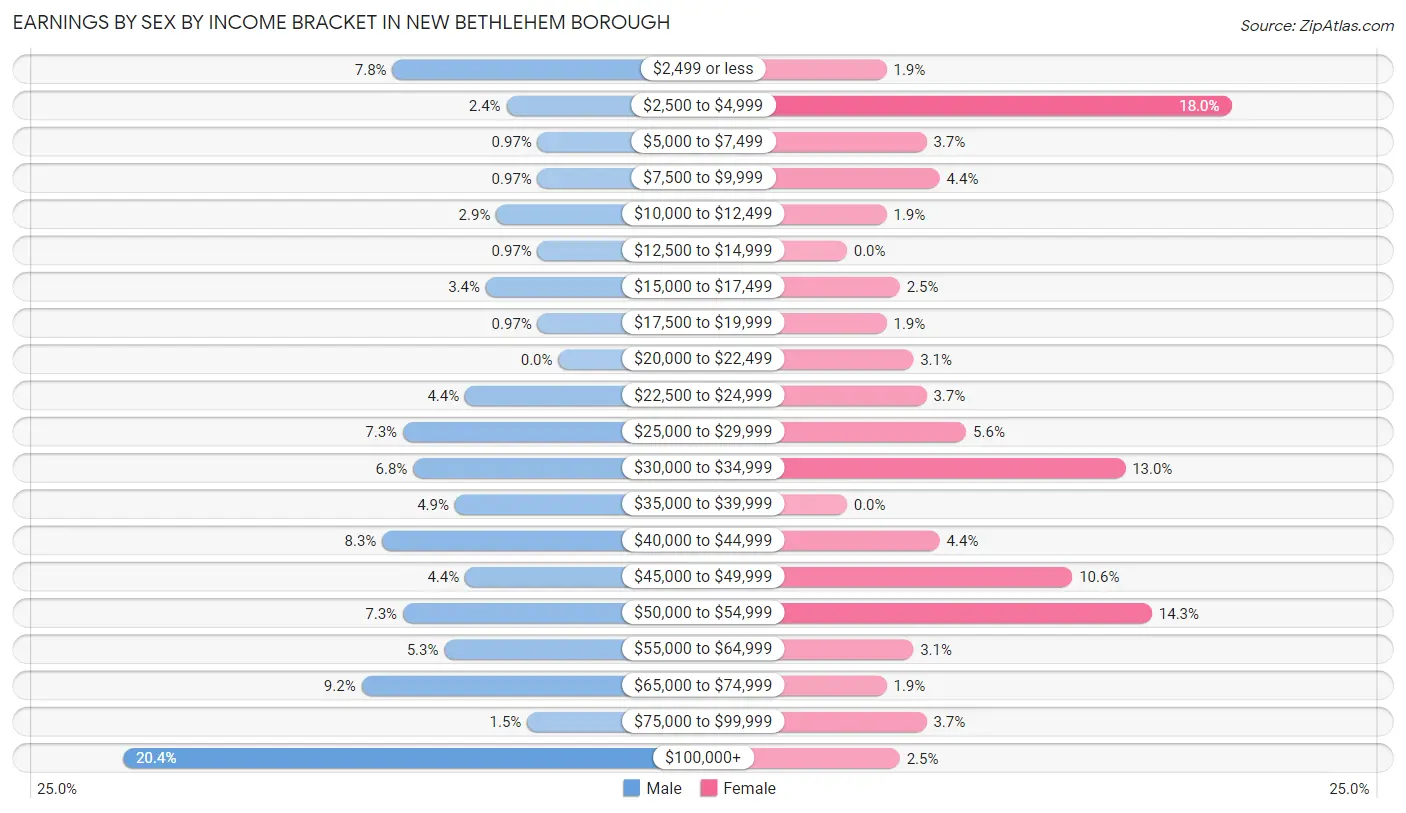
Earnings by Sex by Income Bracket in New Bethlehem borough
The most common earnings brackets in New Bethlehem borough are $100,000+ for men (42 | 20.4%) and $2,500 to $4,999 for women (29 | 18.0%).
| Income | Male | Female |
| $2,499 or less | 16 (7.8%) | 3 (1.9%) |
| $2,500 to $4,999 | 5 (2.4%) | 29 (18.0%) |
| $5,000 to $7,499 | 2 (1.0%) | 6 (3.7%) |
| $7,500 to $9,999 | 2 (1.0%) | 7 (4.3%) |
| $10,000 to $12,499 | 6 (2.9%) | 3 (1.9%) |
| $12,500 to $14,999 | 2 (1.0%) | 0 (0.0%) |
| $15,000 to $17,499 | 7 (3.4%) | 4 (2.5%) |
| $17,500 to $19,999 | 2 (1.0%) | 3 (1.9%) |
| $20,000 to $22,499 | 0 (0.0%) | 5 (3.1%) |
| $22,500 to $24,999 | 9 (4.4%) | 6 (3.7%) |
| $25,000 to $29,999 | 15 (7.3%) | 9 (5.6%) |
| $30,000 to $34,999 | 14 (6.8%) | 21 (13.0%) |
| $35,000 to $39,999 | 10 (4.9%) | 0 (0.0%) |
| $40,000 to $44,999 | 17 (8.3%) | 7 (4.3%) |
| $45,000 to $49,999 | 9 (4.4%) | 17 (10.6%) |
| $50,000 to $54,999 | 15 (7.3%) | 23 (14.3%) |
| $55,000 to $64,999 | 11 (5.3%) | 5 (3.1%) |
| $65,000 to $74,999 | 19 (9.2%) | 3 (1.9%) |
| $75,000 to $99,999 | 3 (1.5%) | 6 (3.7%) |
| $100,000+ | 42 (20.4%) | 4 (2.5%) |
| Total | 206 (100.0%) | 161 (100.0%) |
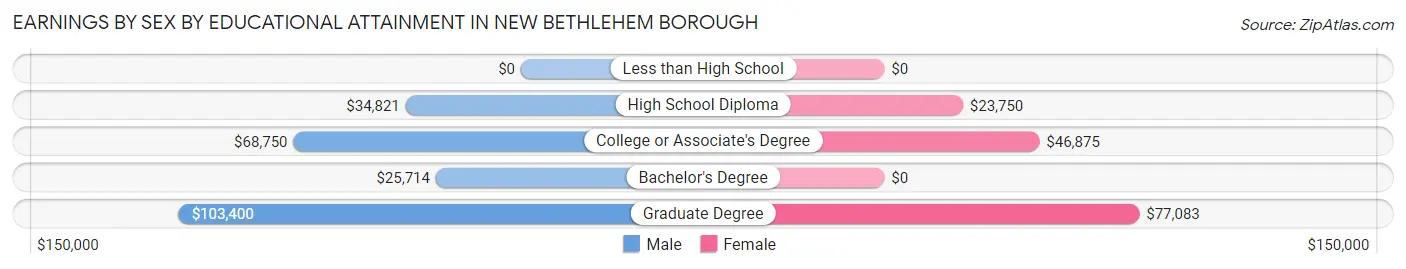
Earnings by Sex by Educational Attainment in New Bethlehem borough
Average earnings in New Bethlehem borough are $50,000 for men and $33,472 for women, a difference of 33.1%. Men with an educational attainment of graduate degree enjoy the highest average annual earnings of $103,400, while those with bachelor's degree education earn the least with $25,714. Women with an educational attainment of graduate degree earn the most with the average annual earnings of $77,083, while those with high school diploma education have the smallest earnings of $23,750.
| Educational Attainment | Male Income | Female Income |
| Less than High School | - | - |
| High School Diploma | $34,821 | $23,750 |
| College or Associate's Degree | $68,750 | $46,875 |
| Bachelor's Degree | $25,714 | $0 |
| Graduate Degree | $103,400 | $77,083 |
| Total | $50,000 | $33,472 |
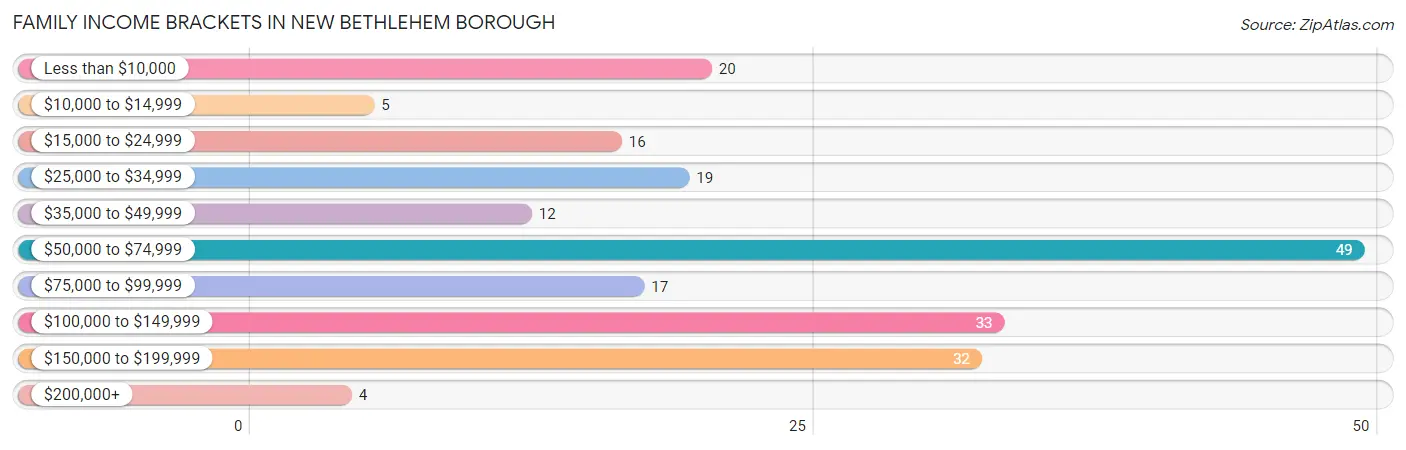
Family Income in New Bethlehem borough
Family Income Brackets in New Bethlehem borough
According to the New Bethlehem borough family income data, there are 49 families falling into the $50,000 to $74,999 income range, which is the most common income bracket and makes up 23.7% of all families. Conversely, the $200,000+ income bracket is the least frequent group with only 4 families (1.9%) belonging to this category.
| Income Bracket | # Families | % Families |
| Less than $10,000 | 20 | 9.7% |
| $10,000 to $14,999 | 5 | 2.4% |
| $15,000 to $24,999 | 16 | 7.7% |
| $25,000 to $34,999 | 19 | 9.2% |
| $35,000 to $49,999 | 12 | 5.8% |
| $50,000 to $74,999 | 49 | 23.7% |
| $75,000 to $99,999 | 17 | 8.2% |
| $100,000 to $149,999 | 33 | 15.9% |
| $150,000 to $199,999 | 32 | 15.5% |
| $200,000+ | 4 | 1.9% |
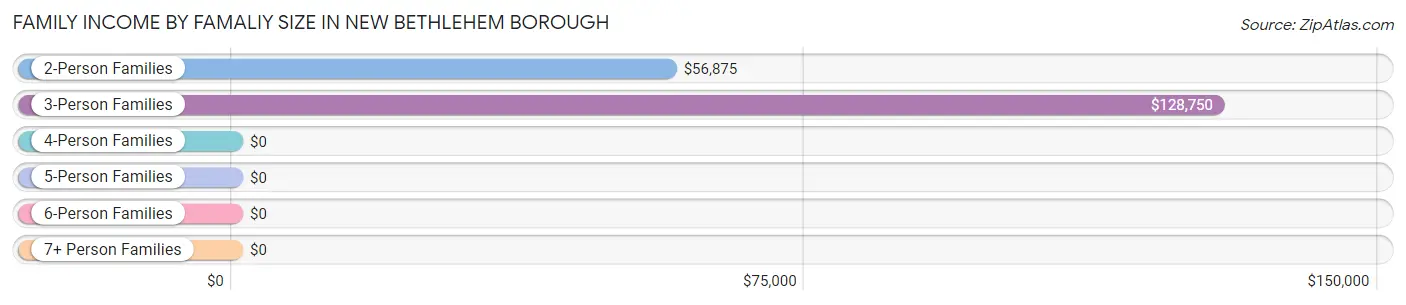
Family Income by Famaliy Size in New Bethlehem borough
3-person families (58 | 28.0%) account for the highest median family income in New Bethlehem borough with $128,750 per family, while 3-person families (58 | 28.0%) have the highest median income of $42,917 per family member.
| Income Bracket | # Families | Median Income |
| 2-Person Families | 103 (49.8%) | $56,875 |
| 3-Person Families | 58 (28.0%) | $128,750 |
| 4-Person Families | 24 (11.6%) | $0 |
| 5-Person Families | 22 (10.6%) | $0 |
| 6-Person Families | 0 (0.0%) | $0 |
| 7+ Person Families | 0 (0.0%) | $0 |
| Total | 207 (100.0%) | $61,125 |
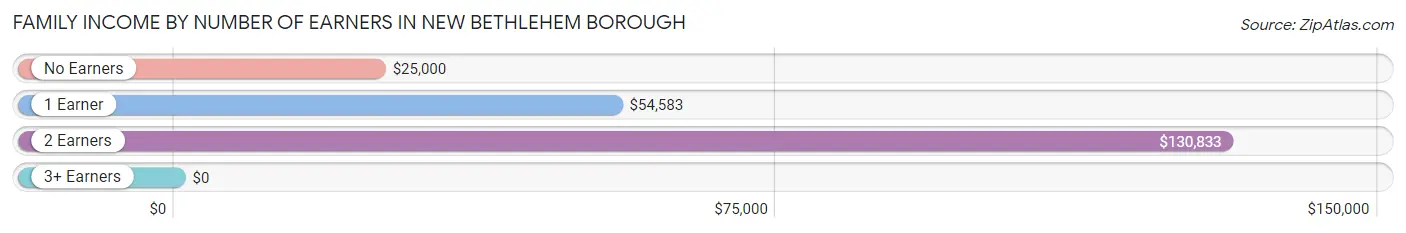
Family Income by Number of Earners in New Bethlehem borough
| Number of Earners | # Families | Median Income |
| No Earners | 46 (22.2%) | $25,000 |
| 1 Earner | 71 (34.3%) | $54,583 |
| 2 Earners | 78 (37.7%) | $130,833 |
| 3+ Earners | 12 (5.8%) | $0 |
| Total | 207 (100.0%) | $61,125 |
Household Income in New Bethlehem borough
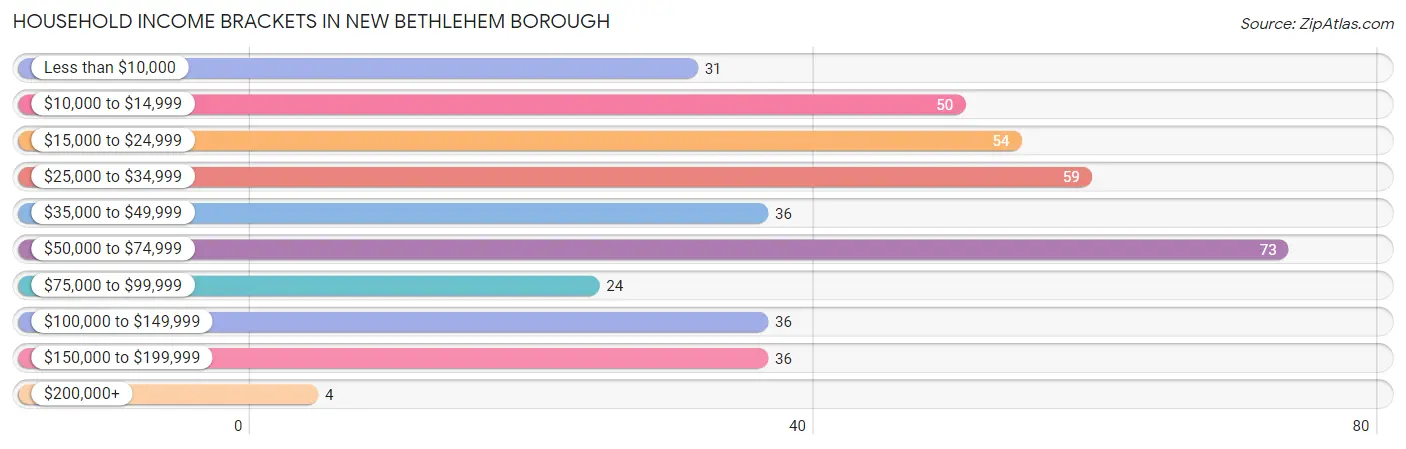
Household Income Brackets in New Bethlehem borough
With 73 households falling in the category, the $50,000 to $74,999 income range is the most frequent in New Bethlehem borough, accounting for 18.1% of all households. In contrast, only 4 households (1.0%) fall into the $200,000+ income bracket, making it the least populous group.
| Income Bracket | # Households | % Households |
| Less than $10,000 | 31 | 7.7% |
| $10,000 to $14,999 | 50 | 12.4% |
| $15,000 to $24,999 | 54 | 13.4% |
| $25,000 to $34,999 | 59 | 14.6% |
| $35,000 to $49,999 | 36 | 8.9% |
| $50,000 to $74,999 | 73 | 18.1% |
| $75,000 to $99,999 | 24 | 6.0% |
| $100,000 to $149,999 | 36 | 8.9% |
| $150,000 to $199,999 | 36 | 8.9% |
| $200,000+ | 4 | 1.0% |
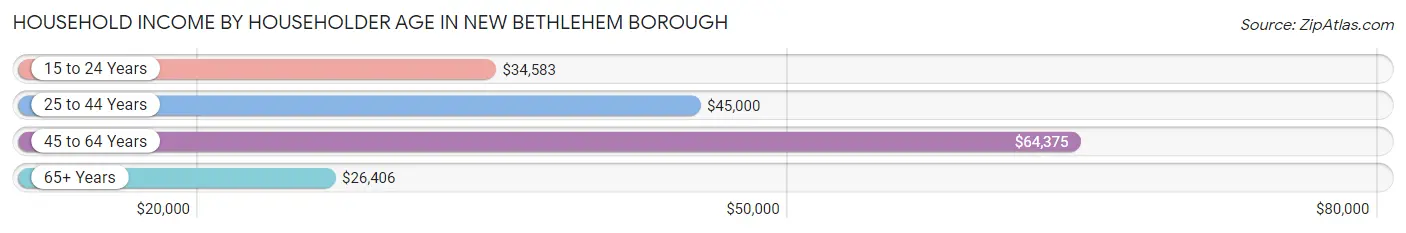
Household Income by Householder Age in New Bethlehem borough
The median household income in New Bethlehem borough is $36,103, with the highest median household income of $64,375 found in the 45 to 64 years age bracket for the primary householder. A total of 121 households (30.0%) fall into this category. Meanwhile, the 65+ years age bracket for the primary householder has the lowest median household income of $26,406, with 192 households (47.6%) in this group.
| Income Bracket | # Households | Median Income |
| 15 to 24 Years | 20 (5.0%) | $34,583 |
| 25 to 44 Years | 70 (17.4%) | $45,000 |
| 45 to 64 Years | 121 (30.0%) | $64,375 |
| 65+ Years | 192 (47.6%) | $26,406 |
| Total | 403 (100.0%) | $36,103 |
Poverty in New Bethlehem borough
Income Below Poverty by Sex and Age in New Bethlehem borough
With 20.1% poverty level for males and 35.2% for females among the residents of New Bethlehem borough, 55 to 64 year old males and 12 to 14 year old females are the most vulnerable to poverty, with 24 males (49.0%) and 17 females (100.0%) in their respective age groups living below the poverty level.
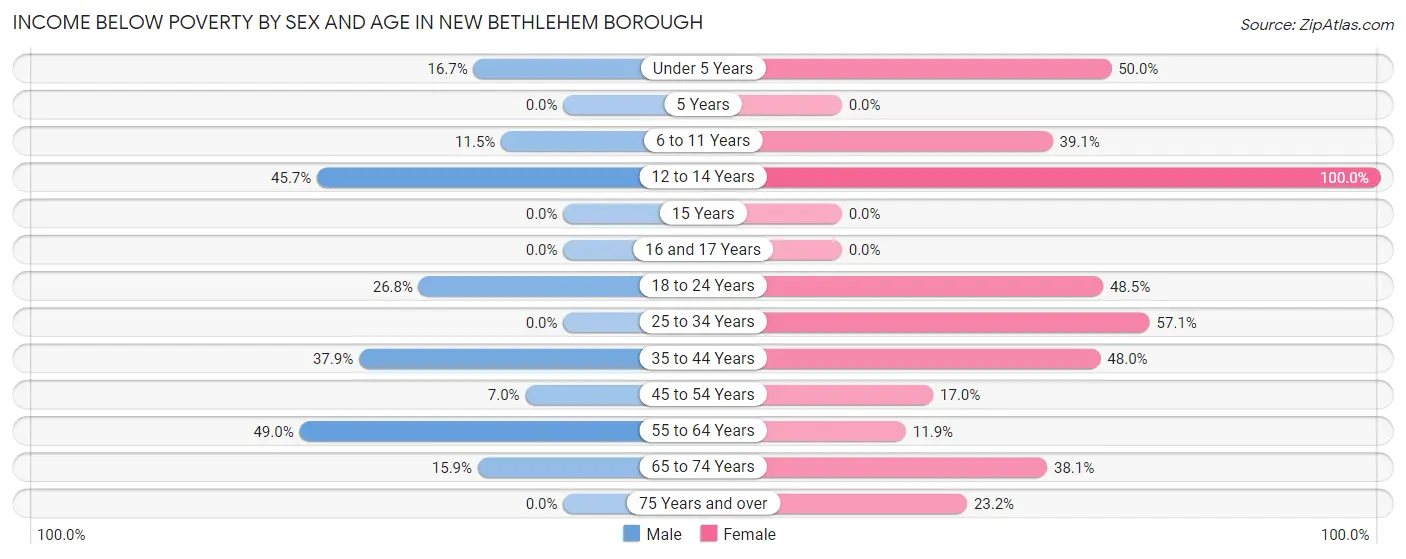
| Age Bracket | Male | Female |
| Under 5 Years | 2 (16.7%) | 8 (50.0%) |
| 5 Years | 0 (0.0%) | 0 (0.0%) |
| 6 to 11 Years | 3 (11.5%) | 9 (39.1%) |
| 12 to 14 Years | 16 (45.7%) | 17 (100.0%) |
| 15 Years | 0 (0.0%) | 0 (0.0%) |
| 16 and 17 Years | 0 (0.0%) | 0 (0.0%) |
| 18 to 24 Years | 11 (26.8%) | 16 (48.5%) |
| 25 to 34 Years | 0 (0.0%) | 28 (57.1%) |
| 35 to 44 Years | 11 (37.9%) | 12 (48.0%) |
| 45 to 54 Years | 5 (7.0%) | 10 (17.0%) |
| 55 to 64 Years | 24 (49.0%) | 5 (11.9%) |
| 65 to 74 Years | 10 (15.9%) | 24 (38.1%) |
| 75 Years and over | 0 (0.0%) | 23 (23.2%) |
| Total | 82 (20.1%) | 152 (35.2%) |
Income Above Poverty by Sex and Age in New Bethlehem borough
According to the poverty statistics in New Bethlehem borough, males aged 25 to 34 years and females aged 5 years are the age groups that are most secure financially, with 100.0% of males and 100.0% of females in these age groups living above the poverty line.
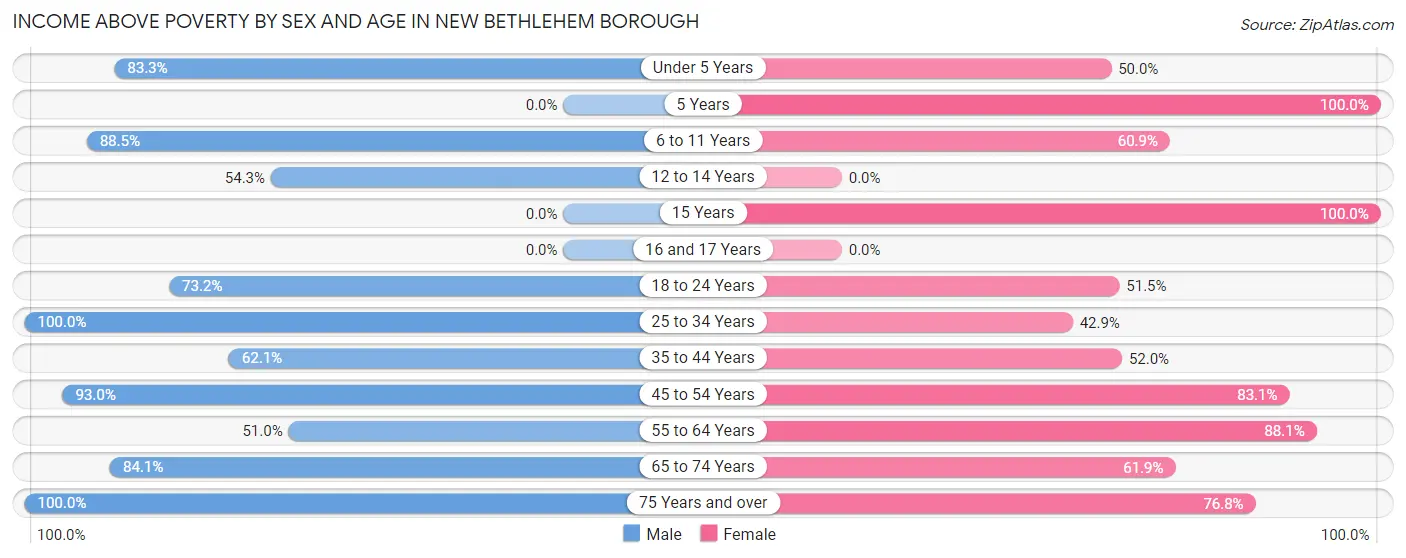
| Age Bracket | Male | Female |
| Under 5 Years | 10 (83.3%) | 8 (50.0%) |
| 5 Years | 0 (0.0%) | 4 (100.0%) |
| 6 to 11 Years | 23 (88.5%) | 14 (60.9%) |
| 12 to 14 Years | 19 (54.3%) | 0 (0.0%) |
| 15 Years | 0 (0.0%) | 2 (100.0%) |
| 16 and 17 Years | 0 (0.0%) | 0 (0.0%) |
| 18 to 24 Years | 30 (73.2%) | 17 (51.5%) |
| 25 to 34 Years | 43 (100.0%) | 21 (42.9%) |
| 35 to 44 Years | 18 (62.1%) | 13 (52.0%) |
| 45 to 54 Years | 66 (93.0%) | 49 (83.1%) |
| 55 to 64 Years | 25 (51.0%) | 37 (88.1%) |
| 65 to 74 Years | 53 (84.1%) | 39 (61.9%) |
| 75 Years and over | 40 (100.0%) | 76 (76.8%) |
| Total | 327 (79.9%) | 280 (64.8%) |
Income Below Poverty Among Married-Couple Families in New Bethlehem borough
The poverty statistics for married-couple families in New Bethlehem borough show that 14.6% or 22 of the total 151 families live below the poverty line. Families with 3 or 4 children have the highest poverty rate of 57.9%, comprising of 11 families. On the other hand, families with no children have the lowest poverty rate of 7.3%, which includes 6 families.
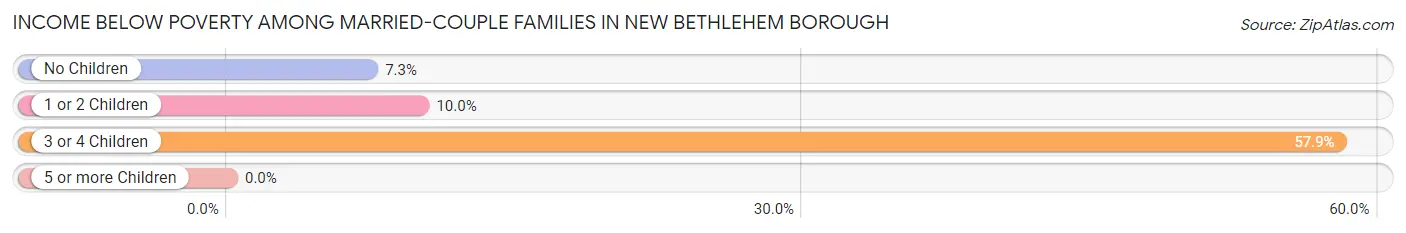
| Children | Above Poverty | Below Poverty |
| No Children | 76 (92.7%) | 6 (7.3%) |
| 1 or 2 Children | 45 (90.0%) | 5 (10.0%) |
| 3 or 4 Children | 8 (42.1%) | 11 (57.9%) |
| 5 or more Children | 0 (0.0%) | 0 (0.0%) |
| Total | 129 (85.4%) | 22 (14.6%) |
Income Below Poverty Among Single-Parent Households in New Bethlehem borough
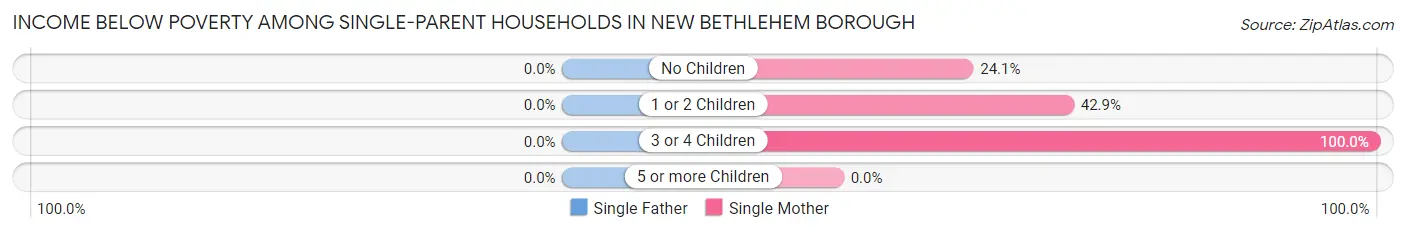
| Children | Single Father | Single Mother |
| No Children | 0 (0.0%) | 7 (24.1%) |
| 1 or 2 Children | 0 (0.0%) | 3 (42.9%) |
| 3 or 4 Children | 0 (0.0%) | 10 (100.0%) |
| 5 or more Children | 0 (0.0%) | 0 (0.0%) |
| Total | 0 (0.0%) | 20 (43.5%) |
Income Below Poverty Among Married-Couple vs Single-Parent Households in New Bethlehem borough
The poverty data for New Bethlehem borough shows that 22 of the married-couple family households (14.6%) and 20 of the single-parent households (35.7%) are living below the poverty level. Within the married-couple family households, those with 3 or 4 children have the highest poverty rate, with 11 households (57.9%) falling below the poverty line. Among the single-parent households, those with 3 or 4 children have the highest poverty rate, with 10 household (100.0%) living below poverty.
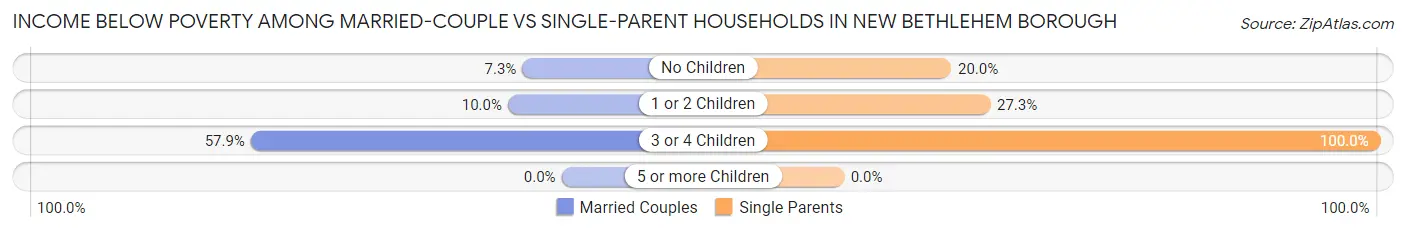
| Children | Married-Couple Families | Single-Parent Households |
| No Children | 6 (7.3%) | 7 (20.0%) |
| 1 or 2 Children | 5 (10.0%) | 3 (27.3%) |
| 3 or 4 Children | 11 (57.9%) | 10 (100.0%) |
| 5 or more Children | 0 (0.0%) | 0 (0.0%) |
| Total | 22 (14.6%) | 20 (35.7%) |
Race in New Bethlehem borough
The most populous races in New Bethlehem borough are White / Caucasian (800 | 94.7%), Asian (17 | 2.0%), and Two or more Races (17 | 2.0%).
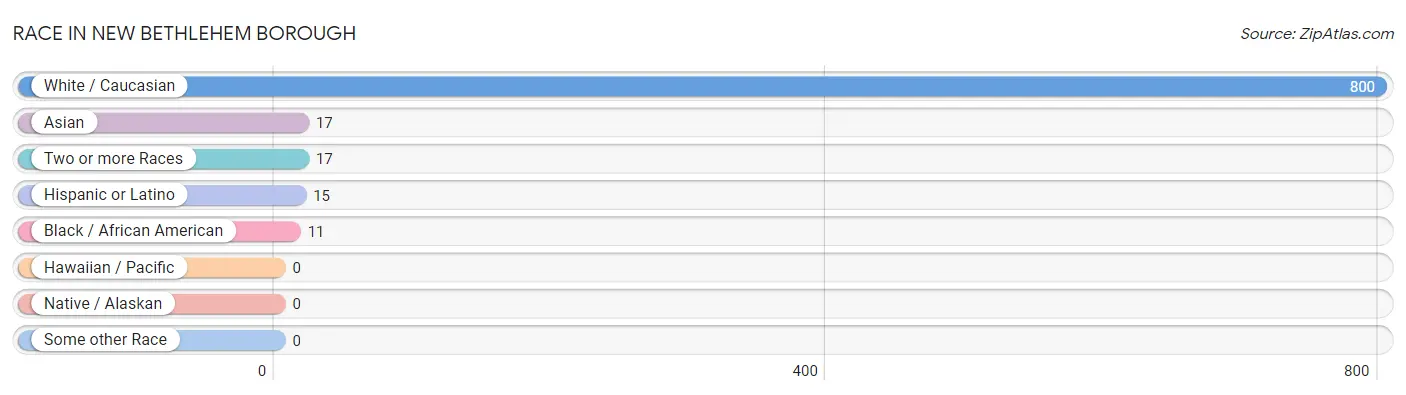
| Race | # Population | % Population |
| Asian | 17 | 2.0% |
| Black / African American | 11 | 1.3% |
| Hawaiian / Pacific | 0 | 0.0% |
| Hispanic or Latino | 15 | 1.8% |
| Native / Alaskan | 0 | 0.0% |
| White / Caucasian | 800 | 94.7% |
| Two or more Races | 17 | 2.0% |
| Some other Race | 0 | 0.0% |
| Total | 845 | 100.0% |
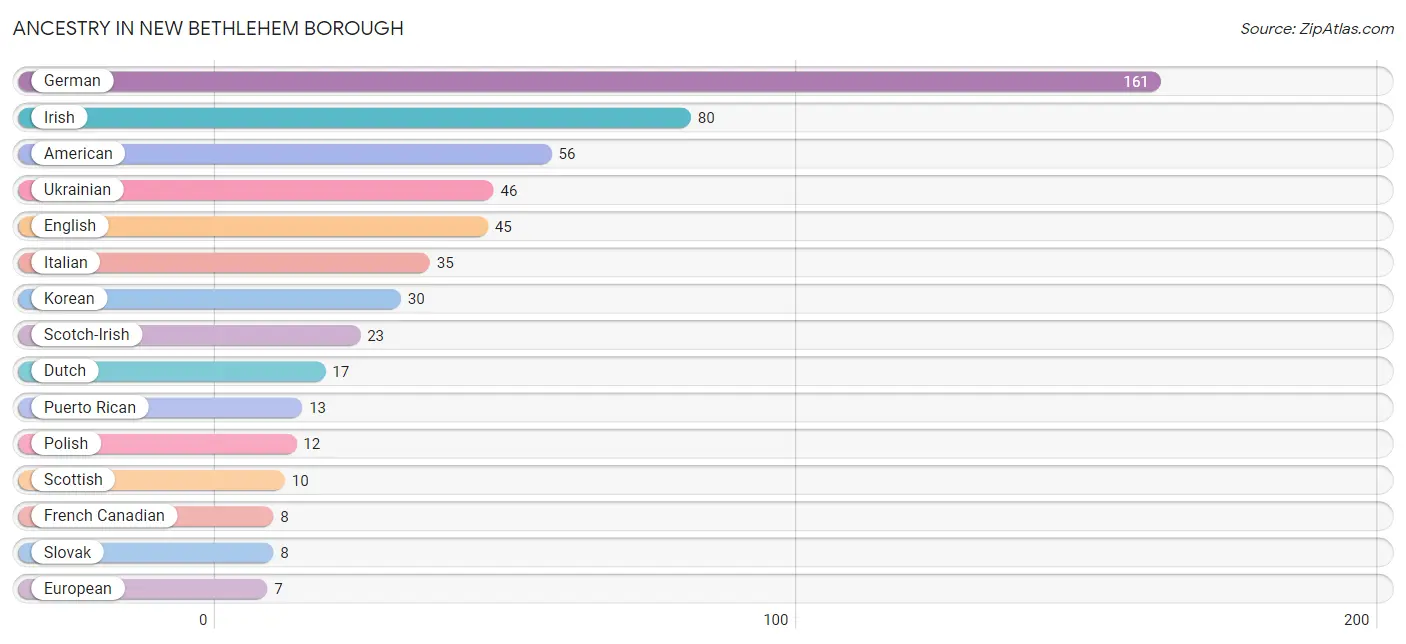
Ancestry in New Bethlehem borough
The most populous ancestries reported in New Bethlehem borough are German (161 | 19.1%), Irish (80 | 9.5%), American (56 | 6.6%), Ukrainian (46 | 5.4%), and English (45 | 5.3%), together accounting for 45.9% of all New Bethlehem borough residents.
| Ancestry | # Population | % Population |
| American | 56 | 6.6% |
| Austrian | 2 | 0.2% |
| British | 3 | 0.4% |
| Celtic | 3 | 0.4% |
| Central American | 2 | 0.2% |
| Croatian | 5 | 0.6% |
| Dutch | 17 | 2.0% |
| English | 45 | 5.3% |
| European | 7 | 0.8% |
| French | 5 | 0.6% |
| French Canadian | 8 | 0.9% |
| German | 161 | 19.1% |
| Guatemalan | 2 | 0.2% |
| Irish | 80 | 9.5% |
| Italian | 35 | 4.1% |
| Korean | 30 | 3.5% |
| Pennsylvania German | 2 | 0.2% |
| Polish | 12 | 1.4% |
| Puerto Rican | 13 | 1.5% |
| Russian | 2 | 0.2% |
| Scotch-Irish | 23 | 2.7% |
| Scottish | 10 | 1.2% |
| Slovak | 8 | 0.9% |
| Swedish | 3 | 0.4% |
| Ukrainian | 46 | 5.4% |
| Welsh | 6 | 0.7% | View All 26 Rows |
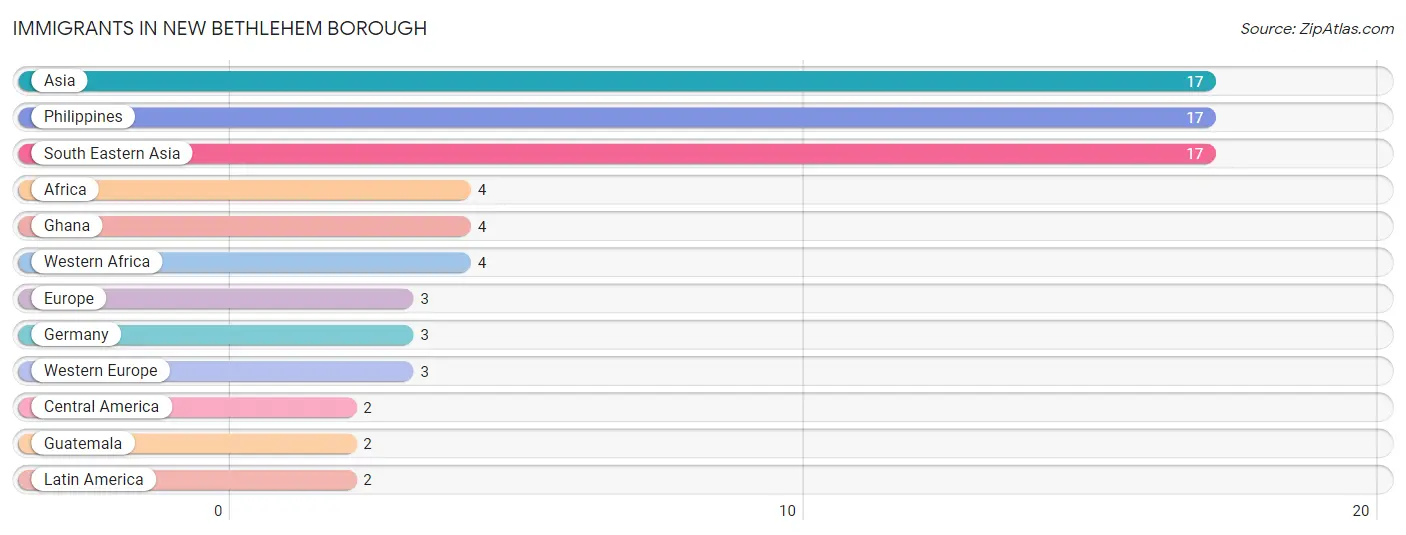
Immigrants in New Bethlehem borough
The most numerous immigrant groups reported in New Bethlehem borough came from Asia (17 | 2.0%), Philippines (17 | 2.0%), South Eastern Asia (17 | 2.0%), Africa (4 | 0.5%), and Ghana (4 | 0.5%), together accounting for 7.0% of all New Bethlehem borough residents.
| Immigration Origin | # Population | % Population |
| Africa | 4 | 0.5% |
| Asia | 17 | 2.0% |
| Central America | 2 | 0.2% |
| Europe | 3 | 0.4% |
| Germany | 3 | 0.4% |
| Ghana | 4 | 0.5% |
| Guatemala | 2 | 0.2% |
| Latin America | 2 | 0.2% |
| Philippines | 17 | 2.0% |
| South Eastern Asia | 17 | 2.0% |
| Western Africa | 4 | 0.5% |
| Western Europe | 3 | 0.4% | View All 12 Rows |
Sex and Age in New Bethlehem borough
Sex and Age in New Bethlehem borough
The most populous age groups in New Bethlehem borough are 10 to 14 Years (57 | 13.8%) for men and 50 to 54 Years (46 | 10.6%) for women.
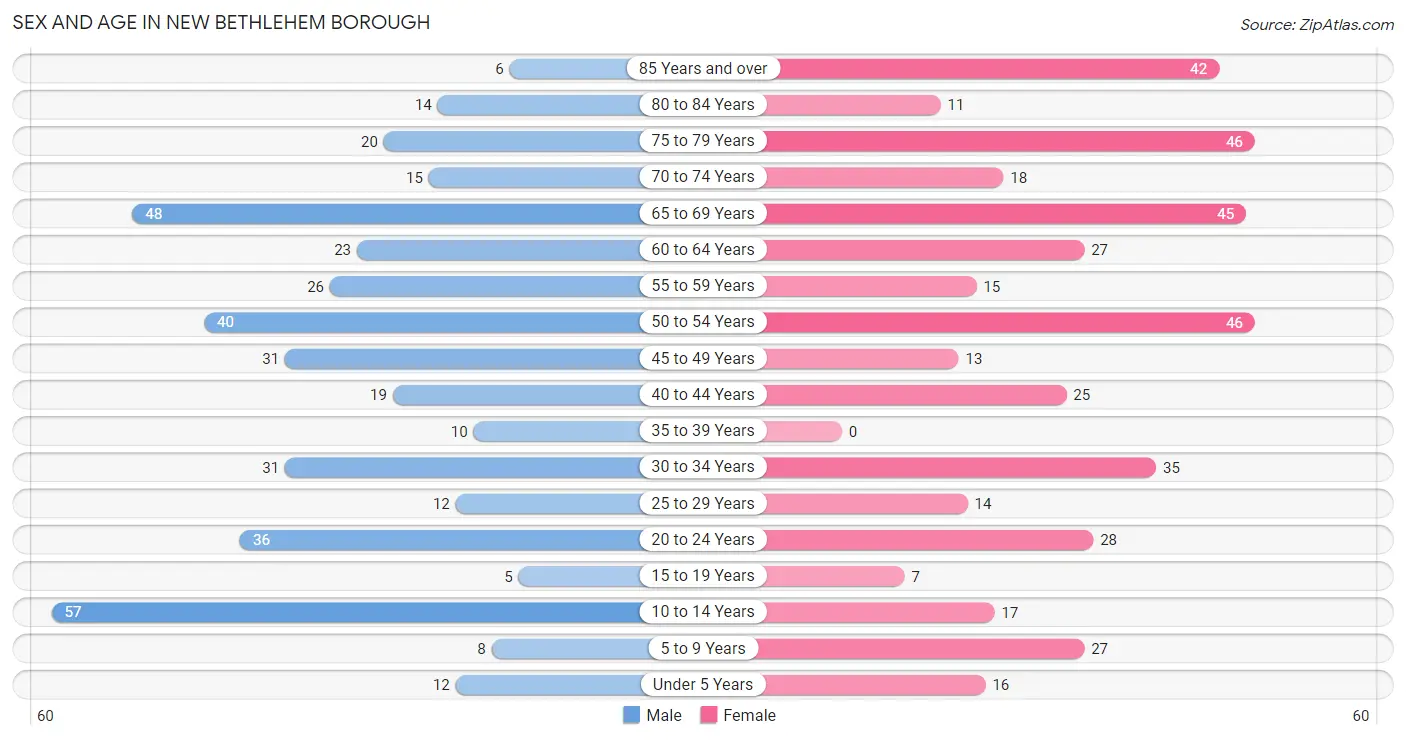
| Age Bracket | Male | Female |
| Under 5 Years | 12 (2.9%) | 16 (3.7%) |
| 5 to 9 Years | 8 (1.9%) | 27 (6.2%) |
| 10 to 14 Years | 57 (13.8%) | 17 (3.9%) |
| 15 to 19 Years | 5 (1.2%) | 7 (1.6%) |
| 20 to 24 Years | 36 (8.7%) | 28 (6.5%) |
| 25 to 29 Years | 12 (2.9%) | 14 (3.2%) |
| 30 to 34 Years | 31 (7.5%) | 35 (8.1%) |
| 35 to 39 Years | 10 (2.4%) | 0 (0.0%) |
| 40 to 44 Years | 19 (4.6%) | 25 (5.8%) |
| 45 to 49 Years | 31 (7.5%) | 13 (3.0%) |
| 50 to 54 Years | 40 (9.7%) | 46 (10.6%) |
| 55 to 59 Years | 26 (6.3%) | 15 (3.5%) |
| 60 to 64 Years | 23 (5.6%) | 27 (6.2%) |
| 65 to 69 Years | 48 (11.6%) | 45 (10.4%) |
| 70 to 74 Years | 15 (3.6%) | 18 (4.2%) |
| 75 to 79 Years | 20 (4.8%) | 46 (10.6%) |
| 80 to 84 Years | 14 (3.4%) | 11 (2.5%) |
| 85 Years and over | 6 (1.5%) | 42 (9.7%) |
| Total | 413 (100.0%) | 432 (100.0%) |
Families and Households in New Bethlehem borough
Median Family Size in New Bethlehem borough
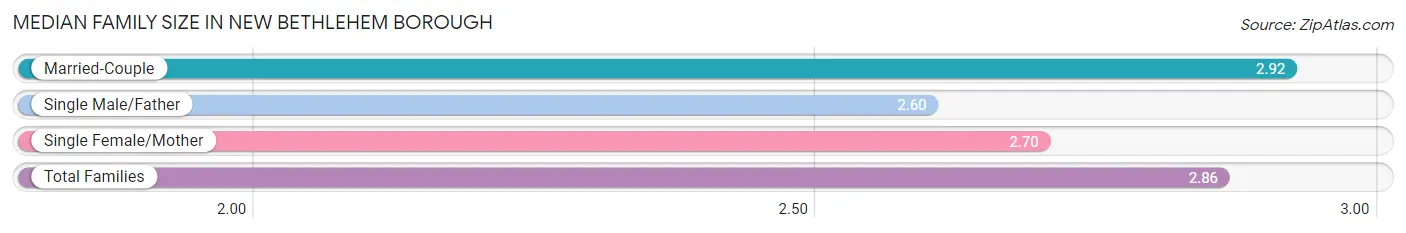
The median family size in New Bethlehem borough is 2.86 persons per family, with married-couple families (151 | 73.0%) accounting for the largest median family size of 2.92 persons per family. On the other hand, single male/father families (10 | 4.8%) represent the smallest median family size with 2.60 persons per family.
| Family Type | # Families | Family Size |
| Married-Couple | 151 (73.0%) | 2.92 |
| Single Male/Father | 10 (4.8%) | 2.60 |
| Single Female/Mother | 46 (22.2%) | 2.70 |
| Total Families | 207 (100.0%) | 2.86 |
Median Household Size in New Bethlehem borough
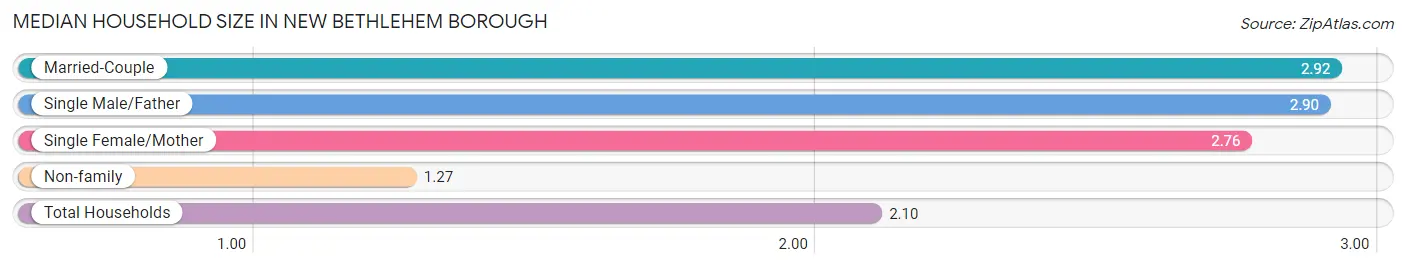
The median household size in New Bethlehem borough is 2.10 persons per household, with married-couple households (151 | 37.5%) accounting for the largest median household size of 2.92 persons per household. non-family households (196 | 48.6%) represent the smallest median household size with 1.27 persons per household.
| Household Type | # Households | Household Size |
| Married-Couple | 151 (37.5%) | 2.92 |
| Single Male/Father | 10 (2.5%) | 2.90 |
| Single Female/Mother | 46 (11.4%) | 2.76 |
| Non-family | 196 (48.6%) | 1.27 |
| Total Households | 403 (100.0%) | 2.10 |
Household Size by Marriage Status in New Bethlehem borough
Out of a total of 403 households in New Bethlehem borough, 207 (51.4%) are family households, while 196 (48.6%) are nonfamily households. The most numerous type of family households are 2-person households, comprising 96, and the most common type of nonfamily households are 1-person households, comprising 151.
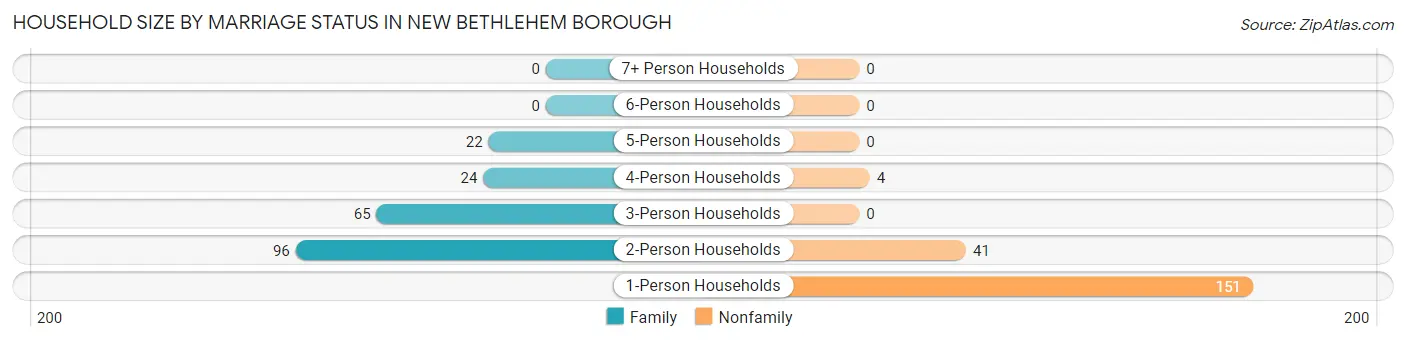
| Household Size | Family Households | Nonfamily Households |
| 1-Person Households | - | 151 (37.5%) |
| 2-Person Households | 96 (23.8%) | 41 (10.2%) |
| 3-Person Households | 65 (16.1%) | 0 (0.0%) |
| 4-Person Households | 24 (6.0%) | 4 (1.0%) |
| 5-Person Households | 22 (5.5%) | 0 (0.0%) |
| 6-Person Households | 0 (0.0%) | 0 (0.0%) |
| 7+ Person Households | 0 (0.0%) | 0 (0.0%) |
| Total | 207 (51.4%) | 196 (48.6%) |
Female Fertility in New Bethlehem borough
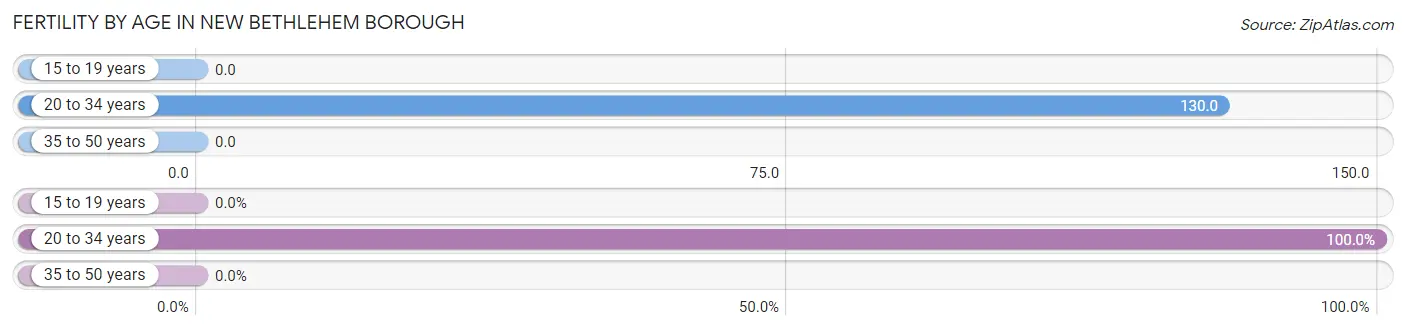
Fertility by Age in New Bethlehem borough
Average fertility rate in New Bethlehem borough is 68.0 births per 1,000 women. Women in the age bracket of 20 to 34 years have the highest fertility rate with 130.0 births per 1,000 women. Women in the age bracket of 20 to 34 years acount for 100.0% of all women with births.
| Age Bracket | Women with Births | Births / 1,000 Women |
| 15 to 19 years | 0 (0.0%) | 0.0 |
| 20 to 34 years | 10 (100.0%) | 130.0 |
| 35 to 50 years | 0 (0.0%) | 0.0 |
| Total | 10 (100.0%) | 68.0 |
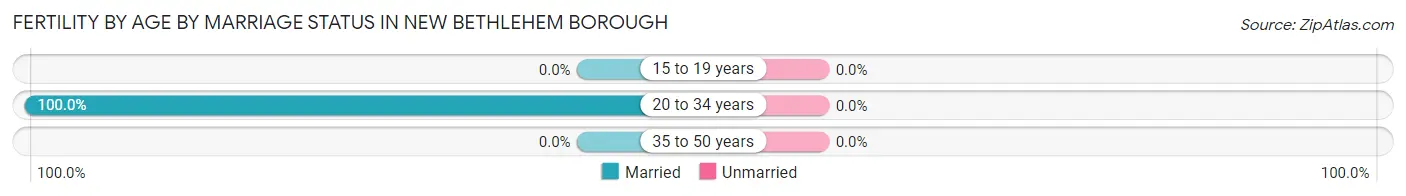
Fertility by Age by Marriage Status in New Bethlehem borough
| Age Bracket | Married | Unmarried |
| 15 to 19 years | 0 (0.0%) | 0 (0.0%) |
| 20 to 34 years | 10 (100.0%) | 0 (0.0%) |
| 35 to 50 years | 0 (0.0%) | 0 (0.0%) |
| Total | 10 (100.0%) | 0 (0.0%) |
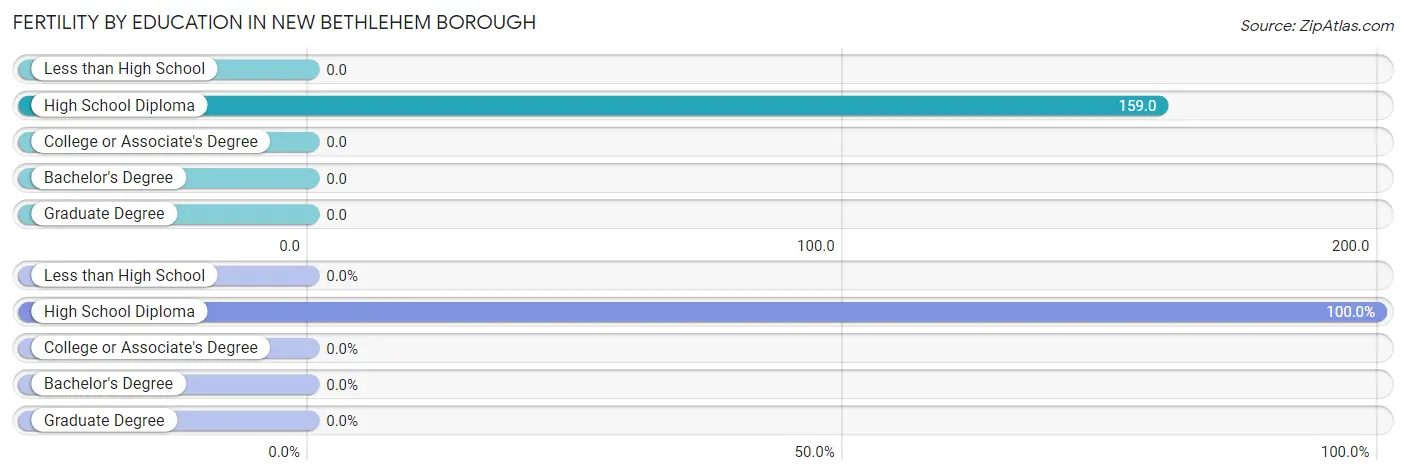
Fertility by Education in New Bethlehem borough
| Educational Attainment | Women with Births | Births / 1,000 Women |
| Less than High School | 0 (0.0%) | 0.0 |
| High School Diploma | 10 (100.0%) | 159.0 |
| College or Associate's Degree | 0 (0.0%) | 0.0 |
| Bachelor's Degree | 0 (0.0%) | 0.0 |
| Graduate Degree | 0 (0.0%) | 0.0 |
| Total | 10 (100.0%) | 68.0 |
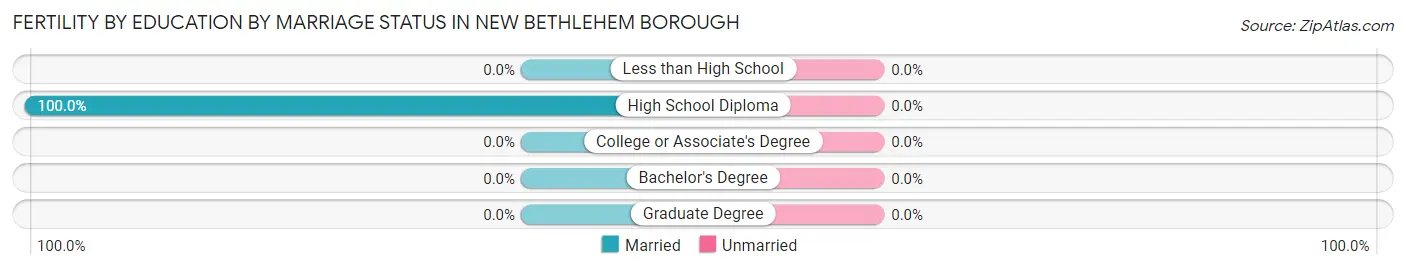
Fertility by Education by Marriage Status in New Bethlehem borough
| Educational Attainment | Married | Unmarried |
| Less than High School | 0 (0.0%) | 0 (0.0%) |
| High School Diploma | 10 (100.0%) | 0 (0.0%) |
| College or Associate's Degree | 0 (0.0%) | 0 (0.0%) |
| Bachelor's Degree | 0 (0.0%) | 0 (0.0%) |
| Graduate Degree | 0 (0.0%) | 0 (0.0%) |
| Total | 10 (100.0%) | 0 (0.0%) |
Employment Characteristics in New Bethlehem borough
Employment by Class of Employer in New Bethlehem borough
Among the 317 employed individuals in New Bethlehem borough, private company employees (273 | 86.1%), self-employed (not incorporated) (15 | 4.7%), and not-for-profit organizations (15 | 4.7%) make up the most common classes of employment.
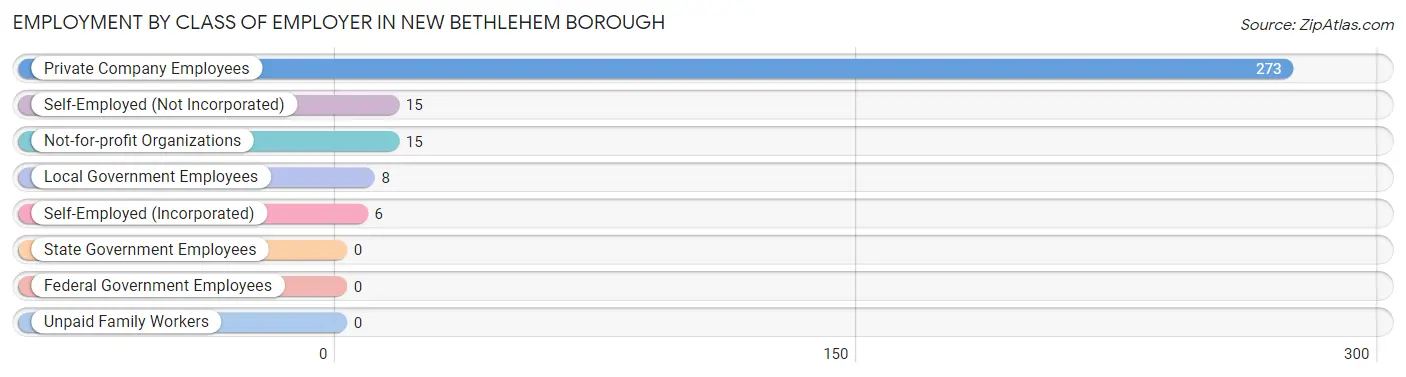
| Employer Class | # Employees | % Employees |
| Private Company Employees | 273 | 86.1% |
| Self-Employed (Incorporated) | 6 | 1.9% |
| Self-Employed (Not Incorporated) | 15 | 4.7% |
| Not-for-profit Organizations | 15 | 4.7% |
| Local Government Employees | 8 | 2.5% |
| State Government Employees | 0 | 0.0% |
| Federal Government Employees | 0 | 0.0% |
| Unpaid Family Workers | 0 | 0.0% |
| Total | 317 | 100.0% |
Employment Status by Age in New Bethlehem borough
According to the labor force statistics for New Bethlehem borough, out of the total population over 16 years of age (706), 46.0% or 325 individuals are in the labor force, with 2.5% or 8 of them unemployed. The age group with the highest labor force participation rate is 30 to 34 years, with 84.8% or 56 individuals in the labor force. Within the labor force, the 60 to 64 years age range has the highest percentage of unemployed individuals, with 10.0% or 2 of them being unemployed.
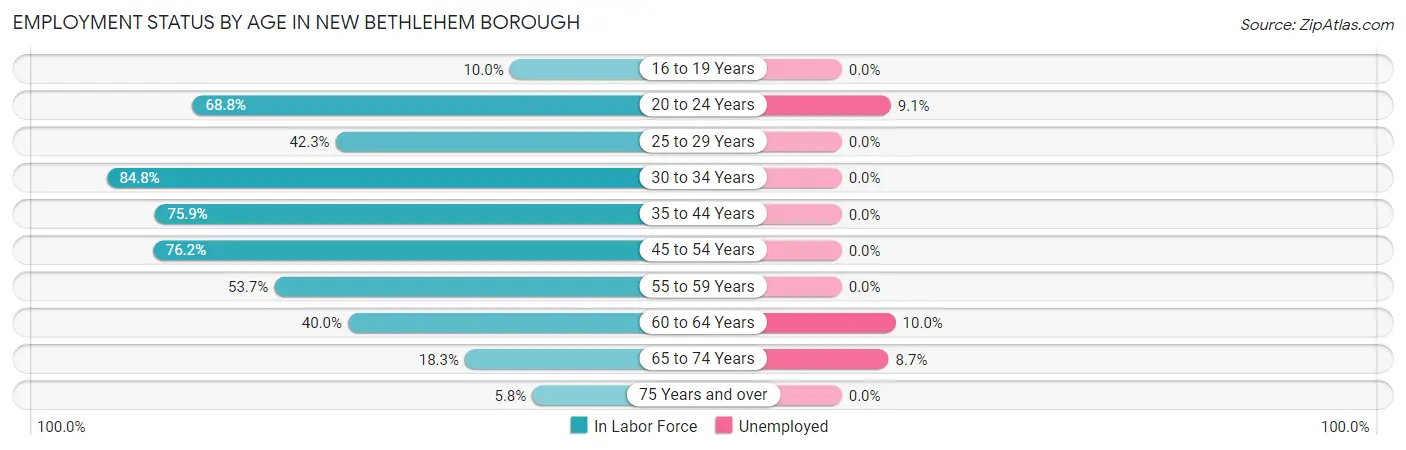
| Age Bracket | In Labor Force | Unemployed |
| 16 to 19 Years | 1 (10.0%) | 0 (0.0%) |
| 20 to 24 Years | 44 (68.8%) | 4 (9.1%) |
| 25 to 29 Years | 11 (42.3%) | 0 (0.0%) |
| 30 to 34 Years | 56 (84.8%) | 0 (0.0%) |
| 35 to 44 Years | 41 (75.9%) | 0 (0.0%) |
| 45 to 54 Years | 99 (76.2%) | 0 (0.0%) |
| 55 to 59 Years | 22 (53.7%) | 0 (0.0%) |
| 60 to 64 Years | 20 (40.0%) | 2 (10.0%) |
| 65 to 74 Years | 23 (18.3%) | 2 (8.7%) |
| 75 Years and over | 8 (5.8%) | 0 (0.0%) |
| Total | 325 (46.0%) | 8 (2.5%) |
Employment Status by Educational Attainment in New Bethlehem borough
According to labor force statistics for New Bethlehem borough, 67.8% of individuals (249) out of the total population between 25 and 64 years of age (367) are in the labor force, with 0.8% or 2 of them being unemployed. The group with the highest labor force participation rate are those with the educational attainment of college / associate degree, with 94.5% or 86 individuals in the labor force. Within the labor force, individuals with high school diploma education have the highest percentage of unemployment, with 1.6% or 2 of them being unemployed.
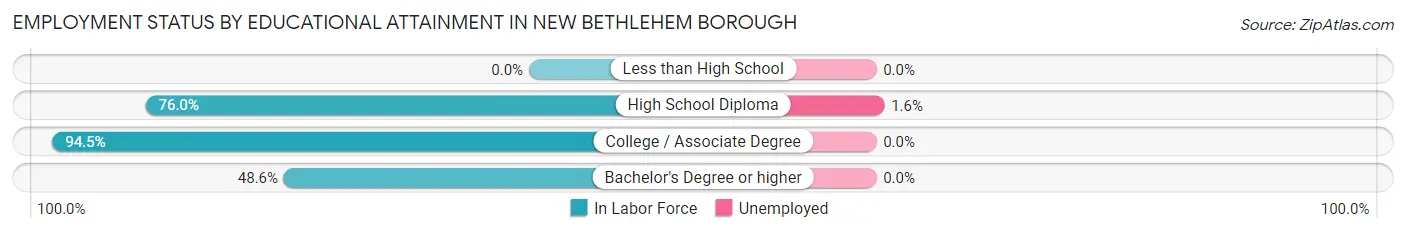
| Educational Attainment | In Labor Force | Unemployed |
| Less than High School | 0 (0.0%) | 0 (0.0%) |
| High School Diploma | 127 (76.0%) | 3 (1.6%) |
| College / Associate Degree | 86 (94.5%) | 0 (0.0%) |
| Bachelor's Degree or higher | 36 (48.6%) | 0 (0.0%) |
| Total | 249 (67.8%) | 3 (0.8%) |
Employment Occupations by Sex in New Bethlehem borough
Management, Business, Science and Arts Occupations
The most common Management, Business, Science and Arts occupations in New Bethlehem borough are Management (47 | 14.8%), Community & Social Service (25 | 7.9%), Education Instruction & Library (22 | 6.9%), Computers, Engineering & Science (11 | 3.5%), and Business & Financial (8 | 2.5%).
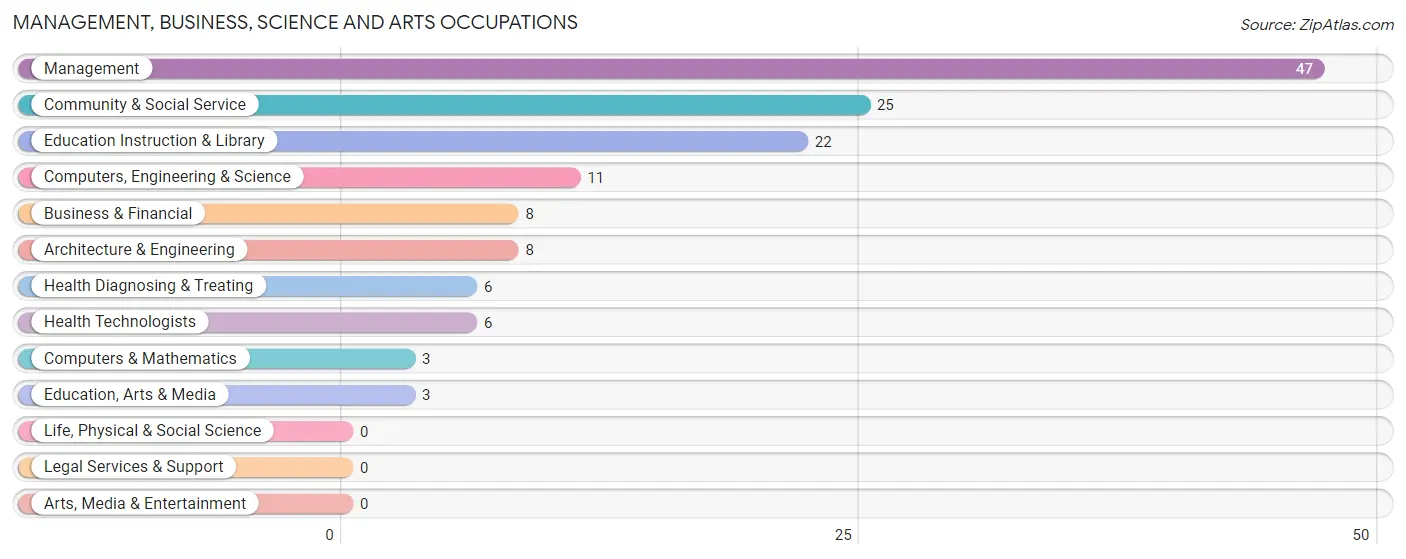
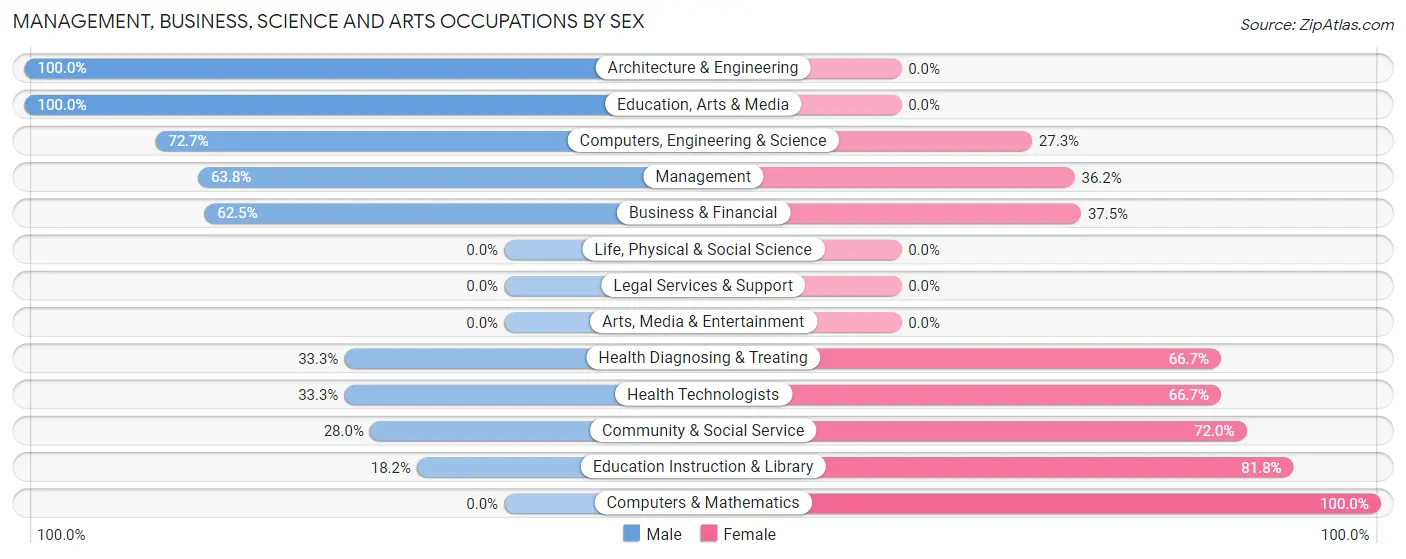
Management, Business, Science and Arts Occupations by Sex
Within the Management, Business, Science and Arts occupations in New Bethlehem borough, the most male-oriented occupations are Architecture & Engineering (100.0%), Education, Arts & Media (100.0%), and Computers, Engineering & Science (72.7%), while the most female-oriented occupations are Computers & Mathematics (100.0%), Education Instruction & Library (81.8%), and Community & Social Service (72.0%).
| Occupation | Male | Female |
| Management | 30 (63.8%) | 17 (36.2%) |
| Business & Financial | 5 (62.5%) | 3 (37.5%) |
| Computers, Engineering & Science | 8 (72.7%) | 3 (27.3%) |
| Computers & Mathematics | 0 (0.0%) | 3 (100.0%) |
| Architecture & Engineering | 8 (100.0%) | 0 (0.0%) |
| Life, Physical & Social Science | 0 (0.0%) | 0 (0.0%) |
| Community & Social Service | 7 (28.0%) | 18 (72.0%) |
| Education, Arts & Media | 3 (100.0%) | 0 (0.0%) |
| Legal Services & Support | 0 (0.0%) | 0 (0.0%) |
| Education Instruction & Library | 4 (18.2%) | 18 (81.8%) |
| Arts, Media & Entertainment | 0 (0.0%) | 0 (0.0%) |
| Health Diagnosing & Treating | 2 (33.3%) | 4 (66.7%) |
| Health Technologists | 2 (33.3%) | 4 (66.7%) |
| Total (Category) | 52 (53.6%) | 45 (46.4%) |
| Total (Overall) | 162 (51.1%) | 155 (48.9%) |
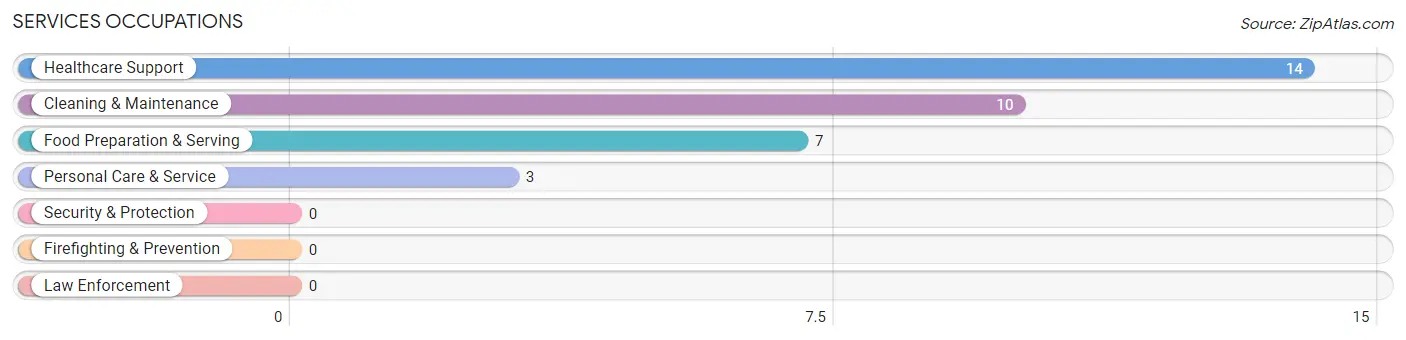
Services Occupations
The most common Services occupations in New Bethlehem borough are Healthcare Support (14 | 4.4%), Cleaning & Maintenance (10 | 3.2%), Food Preparation & Serving (7 | 2.2%), and Personal Care & Service (3 | 0.9%).
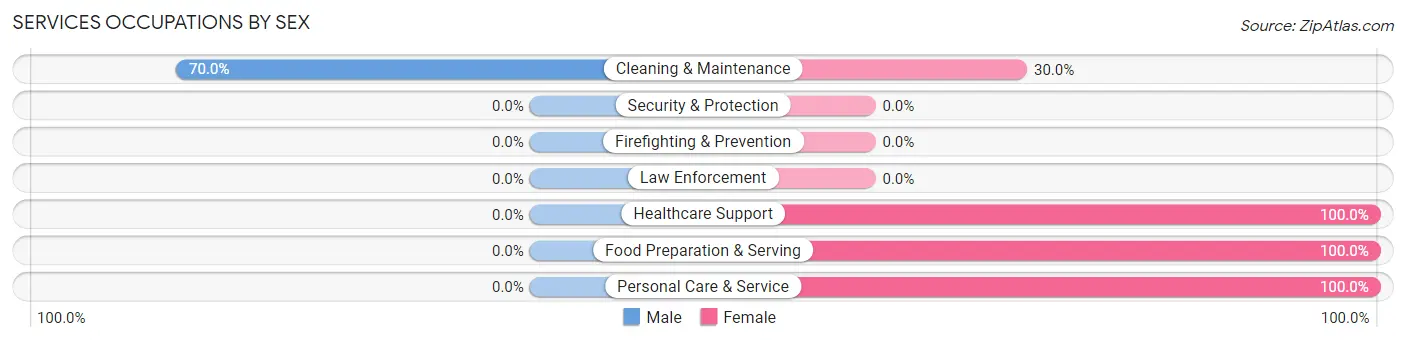
Services Occupations by Sex
| Occupation | Male | Female |
| Healthcare Support | 0 (0.0%) | 14 (100.0%) |
| Security & Protection | 0 (0.0%) | 0 (0.0%) |
| Firefighting & Prevention | 0 (0.0%) | 0 (0.0%) |
| Law Enforcement | 0 (0.0%) | 0 (0.0%) |
| Food Preparation & Serving | 0 (0.0%) | 7 (100.0%) |
| Cleaning & Maintenance | 7 (70.0%) | 3 (30.0%) |
| Personal Care & Service | 0 (0.0%) | 3 (100.0%) |
| Total (Category) | 7 (20.6%) | 27 (79.4%) |
| Total (Overall) | 162 (51.1%) | 155 (48.9%) |
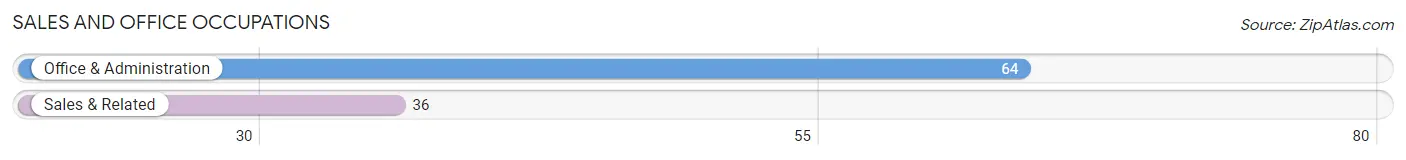
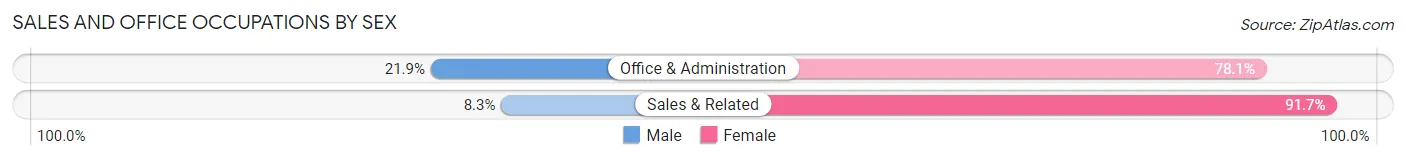
Sales and Office Occupations
The most common Sales and Office occupations in New Bethlehem borough are Office & Administration (64 | 20.2%), and Sales & Related (36 | 11.4%).
Sales and Office Occupations by Sex
| Occupation | Male | Female |
| Sales & Related | 3 (8.3%) | 33 (91.7%) |
| Office & Administration | 14 (21.9%) | 50 (78.1%) |
| Total (Category) | 17 (17.0%) | 83 (83.0%) |
| Total (Overall) | 162 (51.1%) | 155 (48.9%) |
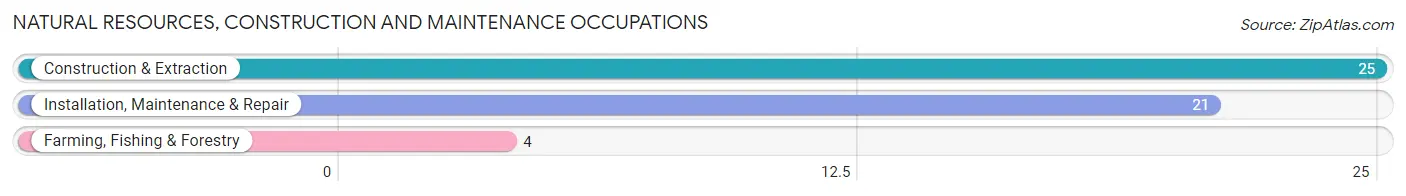
Natural Resources, Construction and Maintenance Occupations
The most common Natural Resources, Construction and Maintenance occupations in New Bethlehem borough are Construction & Extraction (25 | 7.9%), Installation, Maintenance & Repair (21 | 6.6%), and Farming, Fishing & Forestry (4 | 1.3%).
Natural Resources, Construction and Maintenance Occupations by Sex
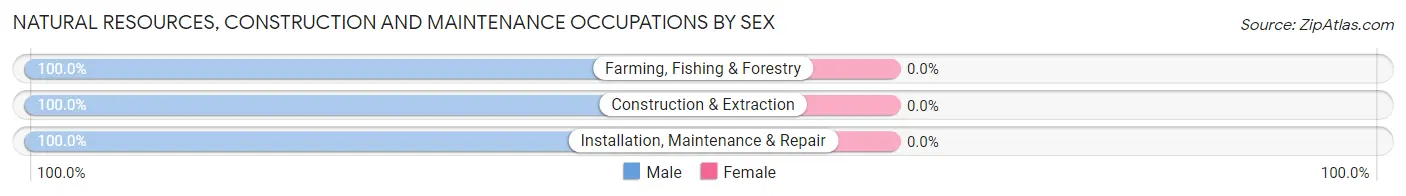
| Occupation | Male | Female |
| Farming, Fishing & Forestry | 4 (100.0%) | 0 (0.0%) |
| Construction & Extraction | 25 (100.0%) | 0 (0.0%) |
| Installation, Maintenance & Repair | 21 (100.0%) | 0 (0.0%) |
| Total (Category) | 50 (100.0%) | 0 (0.0%) |
| Total (Overall) | 162 (51.1%) | 155 (48.9%) |
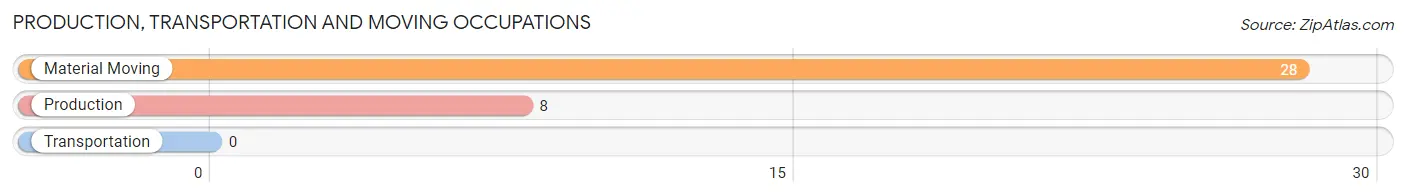
Production, Transportation and Moving Occupations
The most common Production, Transportation and Moving occupations in New Bethlehem borough are Material Moving (28 | 8.8%), and Production (8 | 2.5%).
Production, Transportation and Moving Occupations by Sex
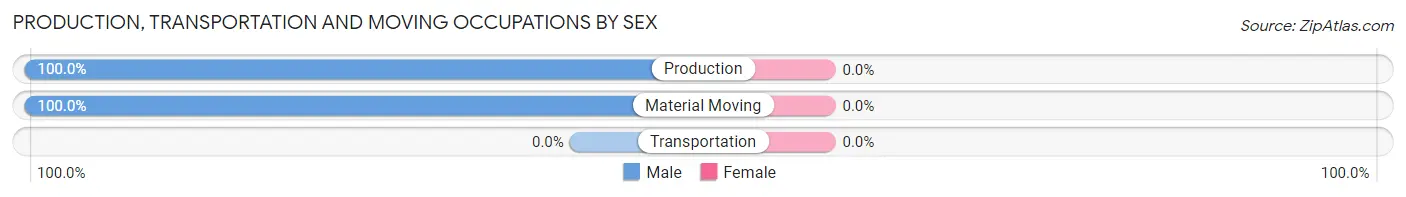
| Occupation | Male | Female |
| Production | 8 (100.0%) | 0 (0.0%) |
| Transportation | 0 (0.0%) | 0 (0.0%) |
| Material Moving | 28 (100.0%) | 0 (0.0%) |
| Total (Category) | 36 (100.0%) | 0 (0.0%) |
| Total (Overall) | 162 (51.1%) | 155 (48.9%) |
Employment Industries by Sex in New Bethlehem borough
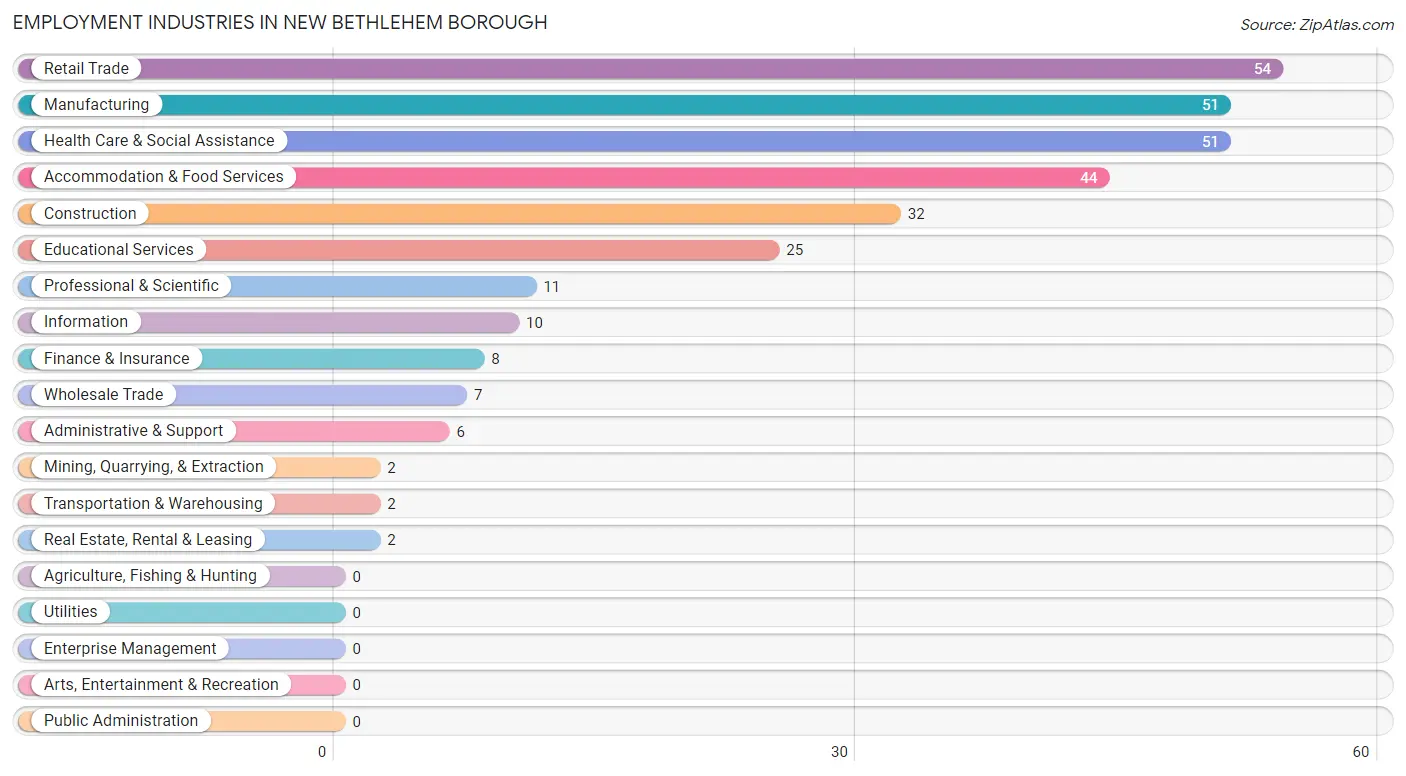
Employment Industries in New Bethlehem borough
The major employment industries in New Bethlehem borough include Retail Trade (54 | 17.0%), Manufacturing (51 | 16.1%), Health Care & Social Assistance (51 | 16.1%), Accommodation & Food Services (44 | 13.9%), and Construction (32 | 10.1%).
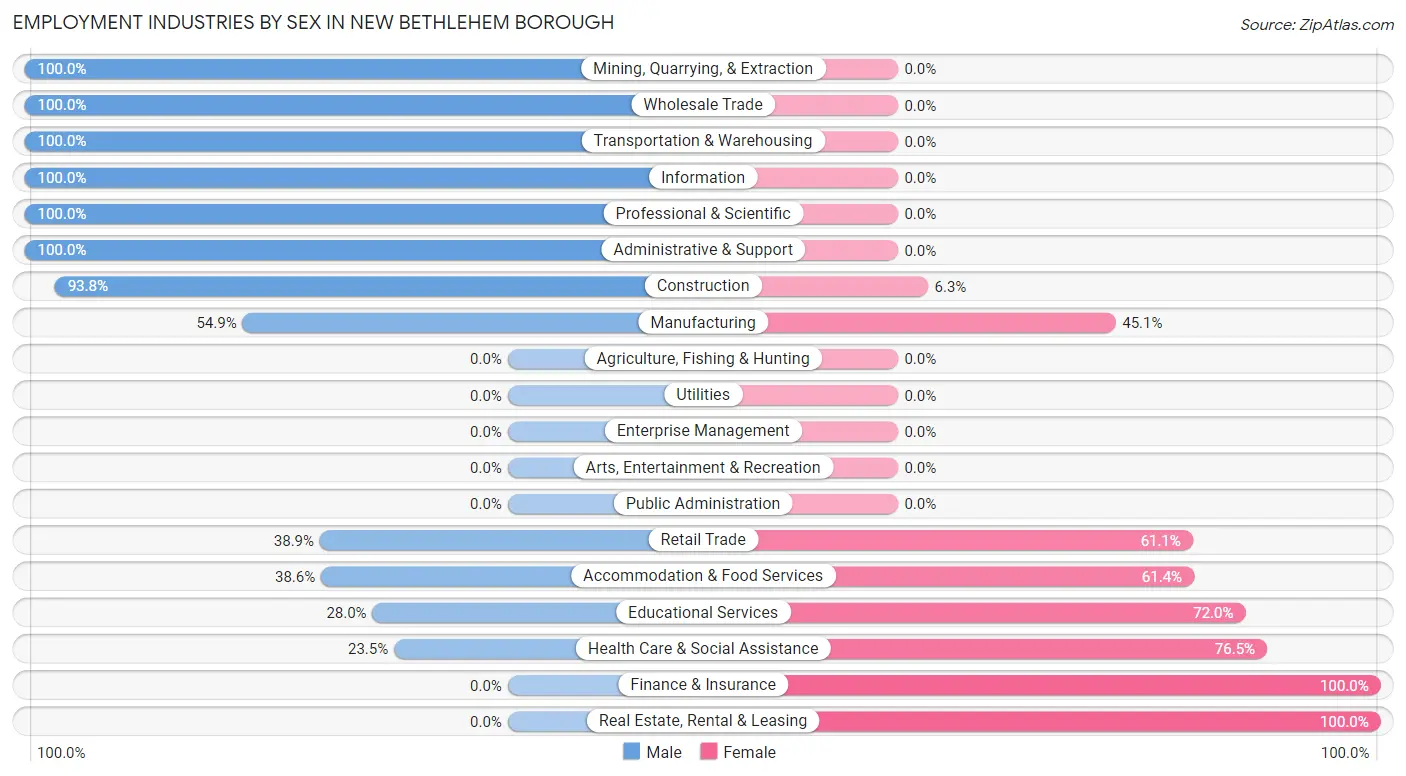
Employment Industries by Sex in New Bethlehem borough
The New Bethlehem borough industries that see more men than women are Mining, Quarrying, & Extraction (100.0%), Wholesale Trade (100.0%), and Transportation & Warehousing (100.0%), whereas the industries that tend to have a higher number of women are Finance & Insurance (100.0%), Real Estate, Rental & Leasing (100.0%), and Health Care & Social Assistance (76.5%).
| Industry | Male | Female |
| Agriculture, Fishing & Hunting | 0 (0.0%) | 0 (0.0%) |
| Mining, Quarrying, & Extraction | 2 (100.0%) | 0 (0.0%) |
| Construction | 30 (93.8%) | 2 (6.2%) |
| Manufacturing | 28 (54.9%) | 23 (45.1%) |
| Wholesale Trade | 7 (100.0%) | 0 (0.0%) |
| Retail Trade | 21 (38.9%) | 33 (61.1%) |
| Transportation & Warehousing | 2 (100.0%) | 0 (0.0%) |
| Utilities | 0 (0.0%) | 0 (0.0%) |
| Information | 10 (100.0%) | 0 (0.0%) |
| Finance & Insurance | 0 (0.0%) | 8 (100.0%) |
| Real Estate, Rental & Leasing | 0 (0.0%) | 2 (100.0%) |
| Professional & Scientific | 11 (100.0%) | 0 (0.0%) |
| Enterprise Management | 0 (0.0%) | 0 (0.0%) |
| Administrative & Support | 6 (100.0%) | 0 (0.0%) |
| Educational Services | 7 (28.0%) | 18 (72.0%) |
| Health Care & Social Assistance | 12 (23.5%) | 39 (76.5%) |
| Arts, Entertainment & Recreation | 0 (0.0%) | 0 (0.0%) |
| Accommodation & Food Services | 17 (38.6%) | 27 (61.4%) |
| Public Administration | 0 (0.0%) | 0 (0.0%) |
| Total | 162 (51.1%) | 155 (48.9%) |
Education in New Bethlehem borough
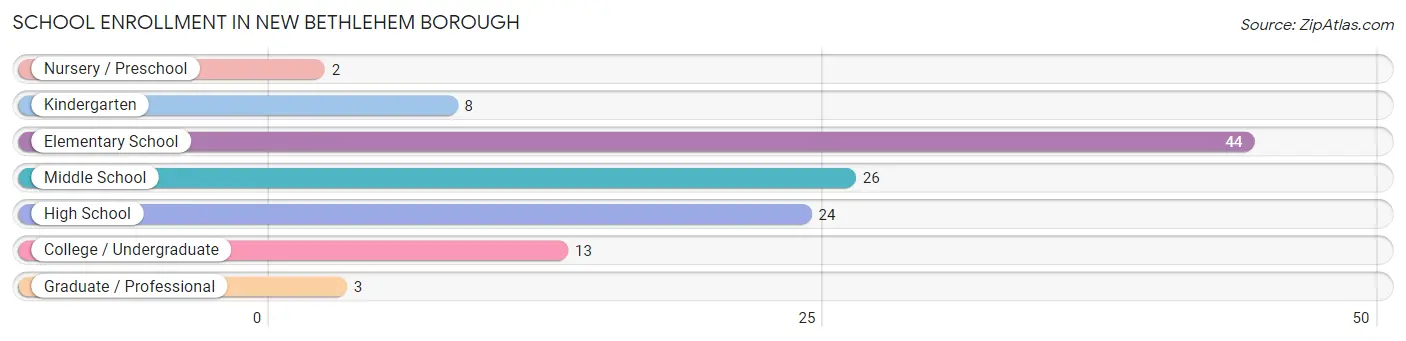
School Enrollment in New Bethlehem borough
The most common levels of schooling among the 120 students in New Bethlehem borough are elementary school (44 | 36.7%), middle school (26 | 21.7%), and high school (24 | 20.0%).
| School Level | # Students | % Students |
| Nursery / Preschool | 2 | 1.7% |
| Kindergarten | 8 | 6.7% |
| Elementary School | 44 | 36.7% |
| Middle School | 26 | 21.7% |
| High School | 24 | 20.0% |
| College / Undergraduate | 13 | 10.8% |
| Graduate / Professional | 3 | 2.5% |
| Total | 120 | 100.0% |
School Enrollment by Age by Funding Source in New Bethlehem borough
Out of a total of 120 students who are enrolled in schools in New Bethlehem borough, 10 (8.3%) attend a private institution, while the remaining 110 (91.7%) are enrolled in public schools. The age group of 35 years and over has the highest likelihood of being enrolled in private schools, with 2 (100.0% in the age bracket) enrolled. Conversely, the age group of 5 to 9 year old has the lowest likelihood of being enrolled in a private school, with 35 (100.0% in the age bracket) attending a public institution.
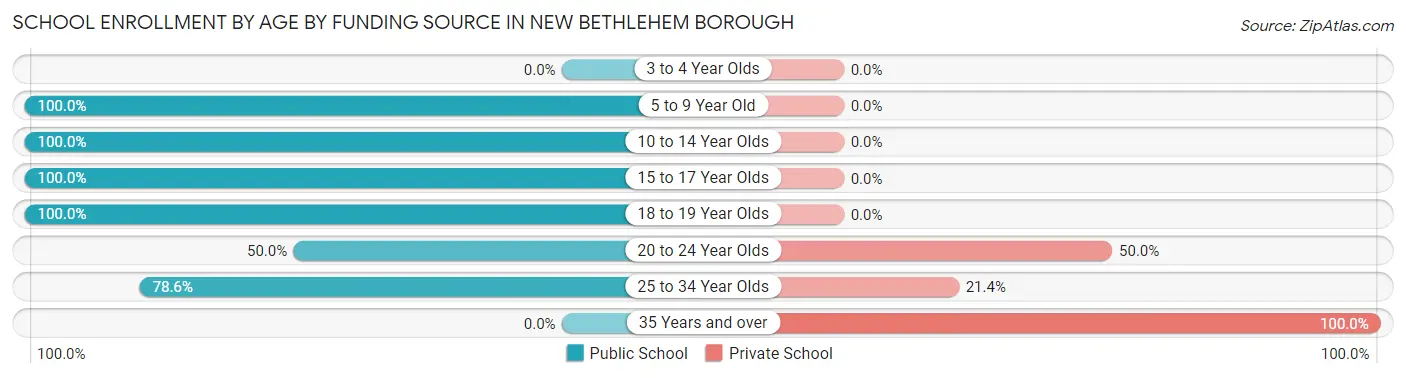
| Age Bracket | Public School | Private School |
| 3 to 4 Year Olds | 0 (0.0%) | 0 (0.0%) |
| 5 to 9 Year Old | 35 (100.0%) | 0 (0.0%) |
| 10 to 14 Year Olds | 47 (100.0%) | 0 (0.0%) |
| 15 to 17 Year Olds | 2 (100.0%) | 0 (0.0%) |
| 18 to 19 Year Olds | 10 (100.0%) | 0 (0.0%) |
| 20 to 24 Year Olds | 5 (50.0%) | 5 (50.0%) |
| 25 to 34 Year Olds | 11 (78.6%) | 3 (21.4%) |
| 35 Years and over | 0 (0.0%) | 2 (100.0%) |
| Total | 110 (91.7%) | 10 (8.3%) |
Educational Attainment by Field of Study in New Bethlehem borough
Communications (27 | 23.7%), education (24 | 21.0%), psychology (17 | 14.9%), business (13 | 11.4%), and social sciences (9 | 7.9%) are the most common fields of study among 114 individuals in New Bethlehem borough who have obtained a bachelor's degree or higher.
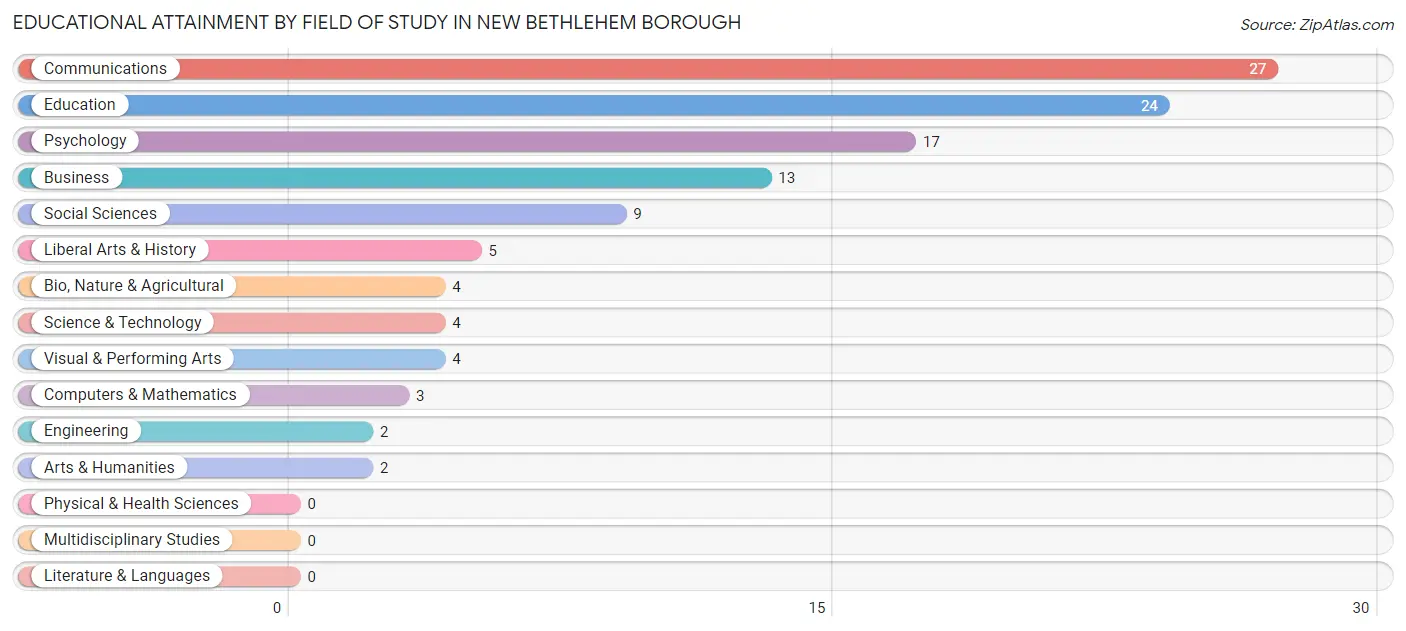
| Field of Study | # Graduates | % Graduates |
| Computers & Mathematics | 3 | 2.6% |
| Bio, Nature & Agricultural | 4 | 3.5% |
| Physical & Health Sciences | 0 | 0.0% |
| Psychology | 17 | 14.9% |
| Social Sciences | 9 | 7.9% |
| Engineering | 2 | 1.8% |
| Multidisciplinary Studies | 0 | 0.0% |
| Science & Technology | 4 | 3.5% |
| Business | 13 | 11.4% |
| Education | 24 | 21.0% |
| Literature & Languages | 0 | 0.0% |
| Liberal Arts & History | 5 | 4.4% |
| Visual & Performing Arts | 4 | 3.5% |
| Communications | 27 | 23.7% |
| Arts & Humanities | 2 | 1.8% |
| Total | 114 | 100.0% |
Transportation & Commute in New Bethlehem borough
Vehicle Availability by Sex in New Bethlehem borough
The most prevalent vehicle ownership categories in New Bethlehem borough are males with 2 vehicles (79, accounting for 48.8%) and females with 2 vehicles (74, making up 51.0%).
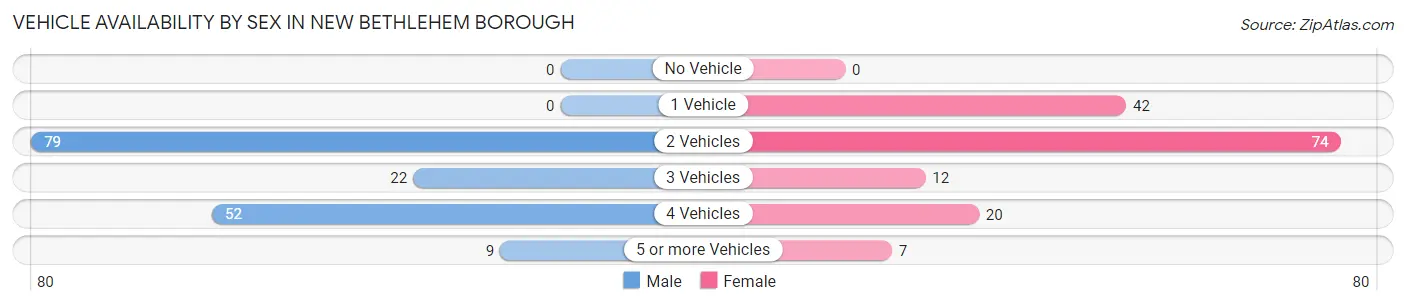
| Vehicles Available | Male | Female |
| No Vehicle | 0 (0.0%) | 0 (0.0%) |
| 1 Vehicle | 0 (0.0%) | 42 (27.1%) |
| 2 Vehicles | 79 (48.8%) | 74 (47.7%) |
| 3 Vehicles | 22 (13.6%) | 12 (7.7%) |
| 4 Vehicles | 52 (32.1%) | 20 (12.9%) |
| 5 or more Vehicles | 9 (5.6%) | 7 (4.5%) |
| Total | 162 (100.0%) | 155 (100.0%) |
Commute Time in New Bethlehem borough
The most frequently occuring commute durations in New Bethlehem borough are 5 to 9 minutes (54 commuters, 17.2%), 30 to 34 minutes (50 commuters, 15.9%), and 25 to 29 minutes (44 commuters, 14.0%).
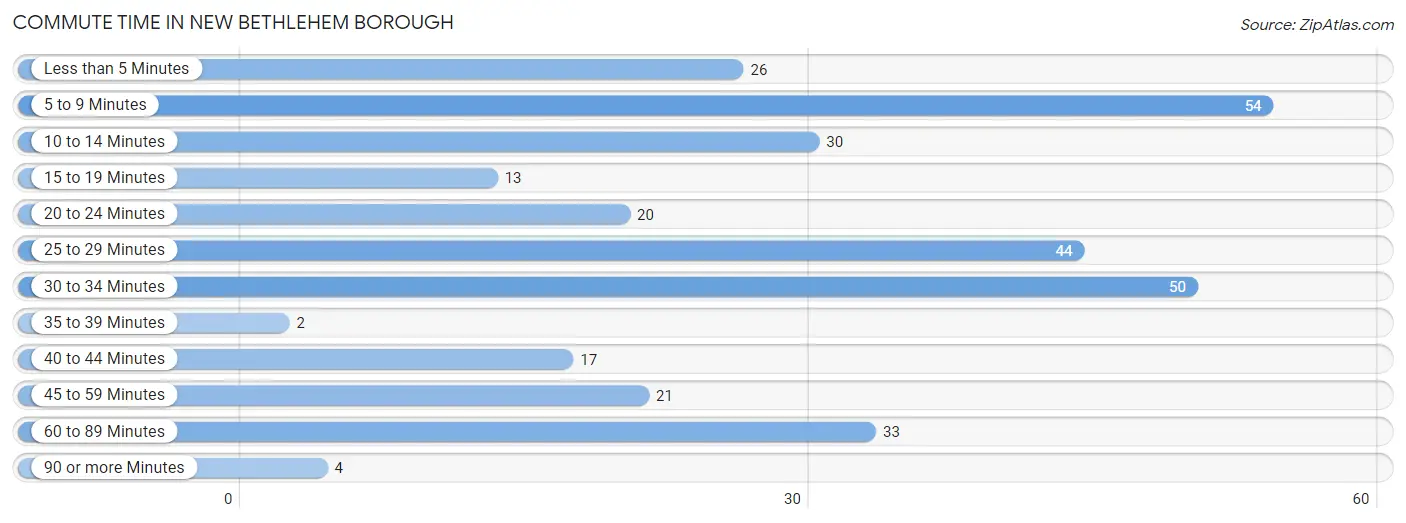
| Commute Time | # Commuters | % Commuters |
| Less than 5 Minutes | 26 | 8.3% |
| 5 to 9 Minutes | 54 | 17.2% |
| 10 to 14 Minutes | 30 | 9.6% |
| 15 to 19 Minutes | 13 | 4.1% |
| 20 to 24 Minutes | 20 | 6.4% |
| 25 to 29 Minutes | 44 | 14.0% |
| 30 to 34 Minutes | 50 | 15.9% |
| 35 to 39 Minutes | 2 | 0.6% |
| 40 to 44 Minutes | 17 | 5.4% |
| 45 to 59 Minutes | 21 | 6.7% |
| 60 to 89 Minutes | 33 | 10.5% |
| 90 or more Minutes | 4 | 1.3% |
Commute Time by Sex in New Bethlehem borough
The most common commute times in New Bethlehem borough are 25 to 29 minutes (27 commuters, 17.0%) for males and 30 to 34 minutes (36 commuters, 23.2%) for females.
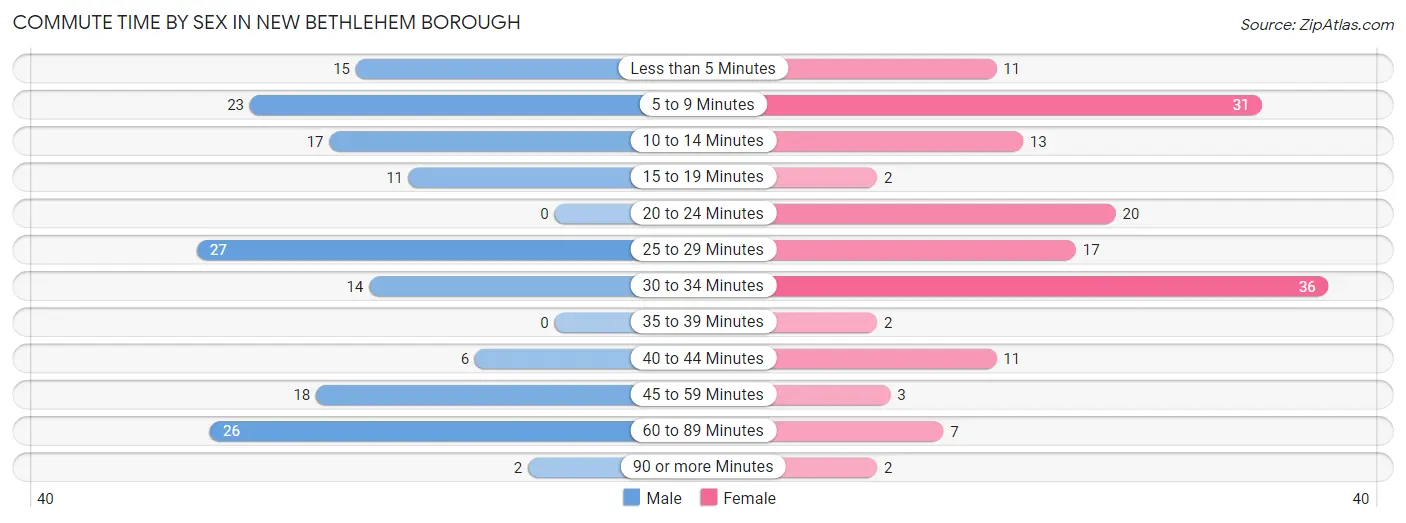
| Commute Time | Male | Female |
| Less than 5 Minutes | 15 (9.4%) | 11 (7.1%) |
| 5 to 9 Minutes | 23 (14.5%) | 31 (20.0%) |
| 10 to 14 Minutes | 17 (10.7%) | 13 (8.4%) |
| 15 to 19 Minutes | 11 (6.9%) | 2 (1.3%) |
| 20 to 24 Minutes | 0 (0.0%) | 20 (12.9%) |
| 25 to 29 Minutes | 27 (17.0%) | 17 (11.0%) |
| 30 to 34 Minutes | 14 (8.8%) | 36 (23.2%) |
| 35 to 39 Minutes | 0 (0.0%) | 2 (1.3%) |
| 40 to 44 Minutes | 6 (3.8%) | 11 (7.1%) |
| 45 to 59 Minutes | 18 (11.3%) | 3 (1.9%) |
| 60 to 89 Minutes | 26 (16.4%) | 7 (4.5%) |
| 90 or more Minutes | 2 (1.3%) | 2 (1.3%) |
Time of Departure to Work by Sex in New Bethlehem borough
The most frequent times of departure to work in New Bethlehem borough are 6:30 AM to 6:59 AM (37, 23.3%) for males and 6:00 AM to 6:29 AM (46, 29.7%) for females.
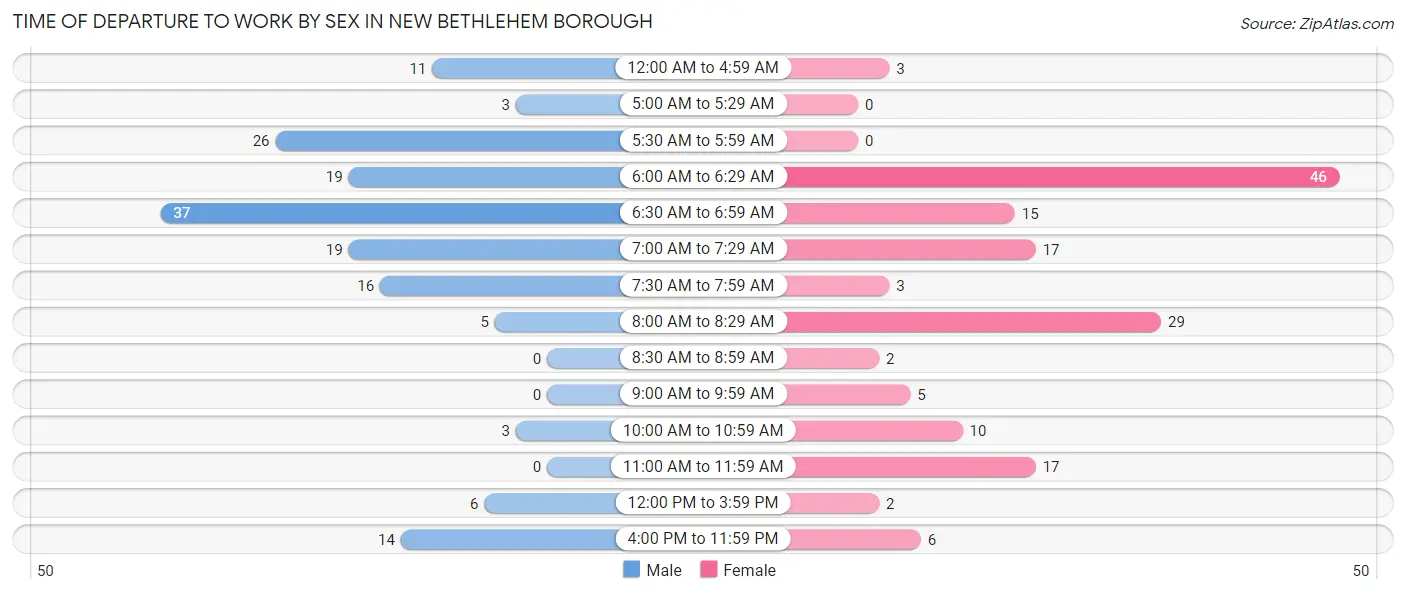
| Time of Departure | Male | Female |
| 12:00 AM to 4:59 AM | 11 (6.9%) | 3 (1.9%) |
| 5:00 AM to 5:29 AM | 3 (1.9%) | 0 (0.0%) |
| 5:30 AM to 5:59 AM | 26 (16.4%) | 0 (0.0%) |
| 6:00 AM to 6:29 AM | 19 (11.9%) | 46 (29.7%) |
| 6:30 AM to 6:59 AM | 37 (23.3%) | 15 (9.7%) |
| 7:00 AM to 7:29 AM | 19 (11.9%) | 17 (11.0%) |
| 7:30 AM to 7:59 AM | 16 (10.1%) | 3 (1.9%) |
| 8:00 AM to 8:29 AM | 5 (3.1%) | 29 (18.7%) |
| 8:30 AM to 8:59 AM | 0 (0.0%) | 2 (1.3%) |
| 9:00 AM to 9:59 AM | 0 (0.0%) | 5 (3.2%) |
| 10:00 AM to 10:59 AM | 3 (1.9%) | 10 (6.5%) |
| 11:00 AM to 11:59 AM | 0 (0.0%) | 17 (11.0%) |
| 12:00 PM to 3:59 PM | 6 (3.8%) | 2 (1.3%) |
| 4:00 PM to 11:59 PM | 14 (8.8%) | 6 (3.9%) |
| Total | 159 (100.0%) | 155 (100.0%) |
Housing Occupancy in New Bethlehem borough
Occupancy by Ownership in New Bethlehem borough
Of the total 403 dwellings in New Bethlehem borough, owner-occupied units account for 236 (58.6%), while renter-occupied units make up 167 (41.4%).
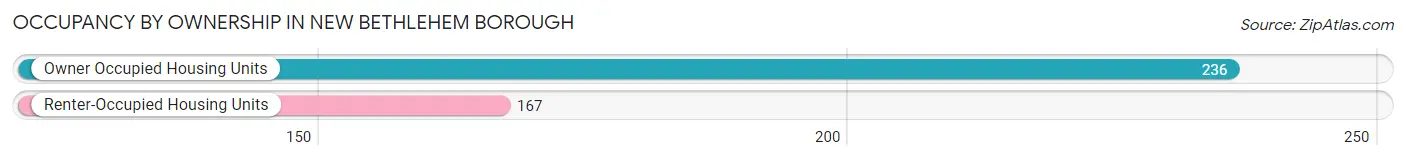
| Occupancy | # Housing Units | % Housing Units |
| Owner Occupied Housing Units | 236 | 58.6% |
| Renter-Occupied Housing Units | 167 | 41.4% |
| Total Occupied Housing Units | 403 | 100.0% |
Occupancy by Household Size in New Bethlehem borough
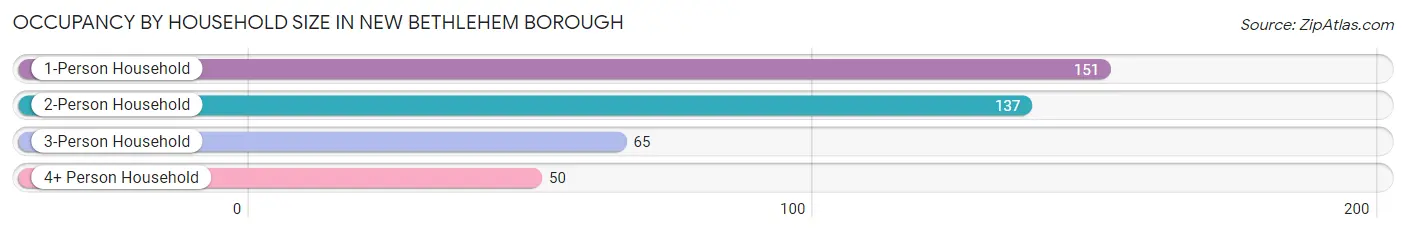
| Household Size | # Housing Units | % Housing Units |
| 1-Person Household | 151 | 37.5% |
| 2-Person Household | 137 | 34.0% |
| 3-Person Household | 65 | 16.1% |
| 4+ Person Household | 50 | 12.4% |
| Total Housing Units | 403 | 100.0% |
Occupancy by Ownership by Household Size in New Bethlehem borough
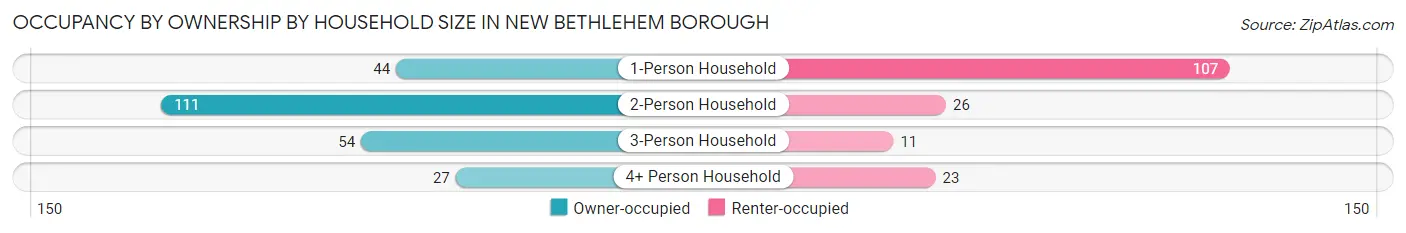
| Household Size | Owner-occupied | Renter-occupied |
| 1-Person Household | 44 (29.1%) | 107 (70.9%) |
| 2-Person Household | 111 (81.0%) | 26 (19.0%) |
| 3-Person Household | 54 (83.1%) | 11 (16.9%) |
| 4+ Person Household | 27 (54.0%) | 23 (46.0%) |
| Total Housing Units | 236 (58.6%) | 167 (41.4%) |
Occupancy by Educational Attainment in New Bethlehem borough
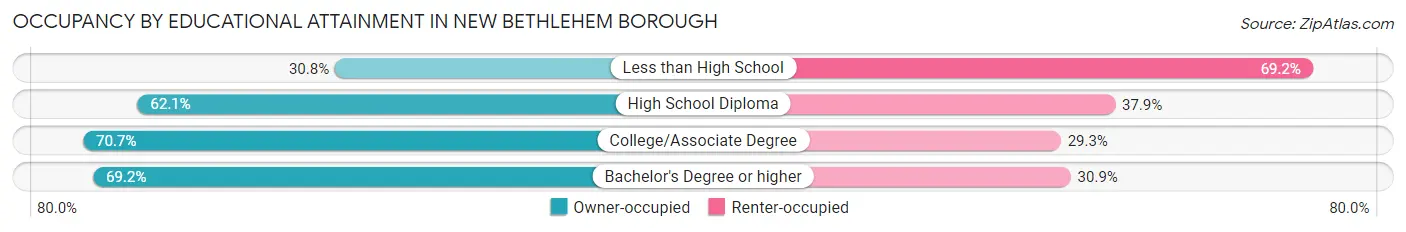
| Household Size | Owner-occupied | Renter-occupied |
| Less than High School | 24 (30.8%) | 54 (69.2%) |
| High School Diploma | 118 (62.1%) | 72 (37.9%) |
| College/Associate Degree | 29 (70.7%) | 12 (29.3%) |
| Bachelor's Degree or higher | 65 (69.2%) | 29 (30.8%) |
Occupancy by Age of Householder in New Bethlehem borough
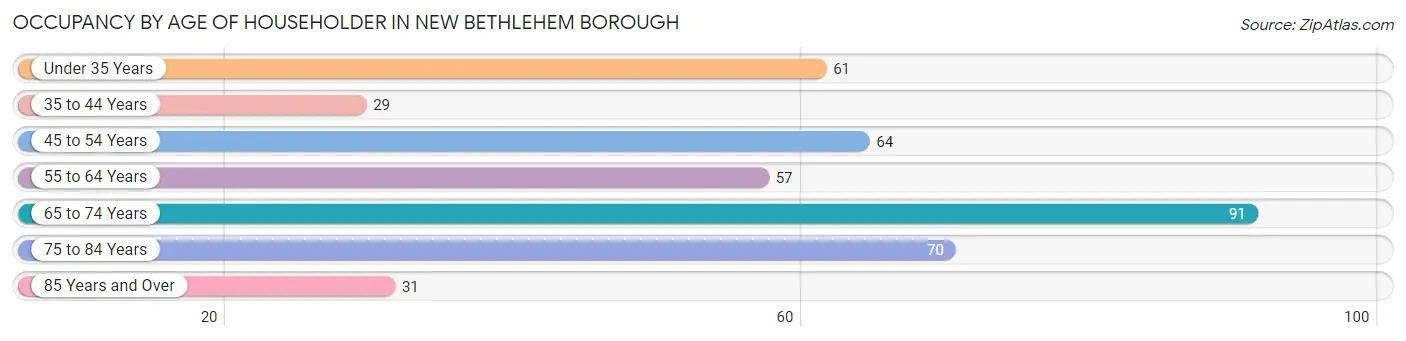
| Age Bracket | # Households | % Households |
| Under 35 Years | 61 | 15.1% |
| 35 to 44 Years | 29 | 7.2% |
| 45 to 54 Years | 64 | 15.9% |
| 55 to 64 Years | 57 | 14.1% |
| 65 to 74 Years | 91 | 22.6% |
| 75 to 84 Years | 70 | 17.4% |
| 85 Years and Over | 31 | 7.7% |
| Total | 403 | 100.0% |
Housing Finances in New Bethlehem borough
Median Income by Occupancy in New Bethlehem borough
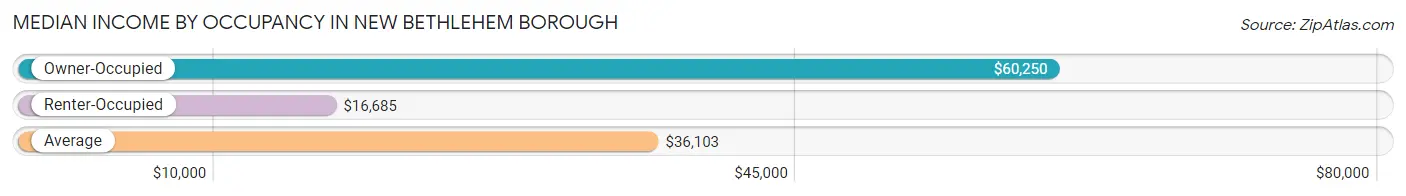
| Occupancy Type | # Households | Median Income |
| Owner-Occupied | 236 (58.6%) | $60,250 |
| Renter-Occupied | 167 (41.4%) | $16,685 |
| Average | 403 (100.0%) | $36,103 |
Occupancy by Householder Income Bracket in New Bethlehem borough
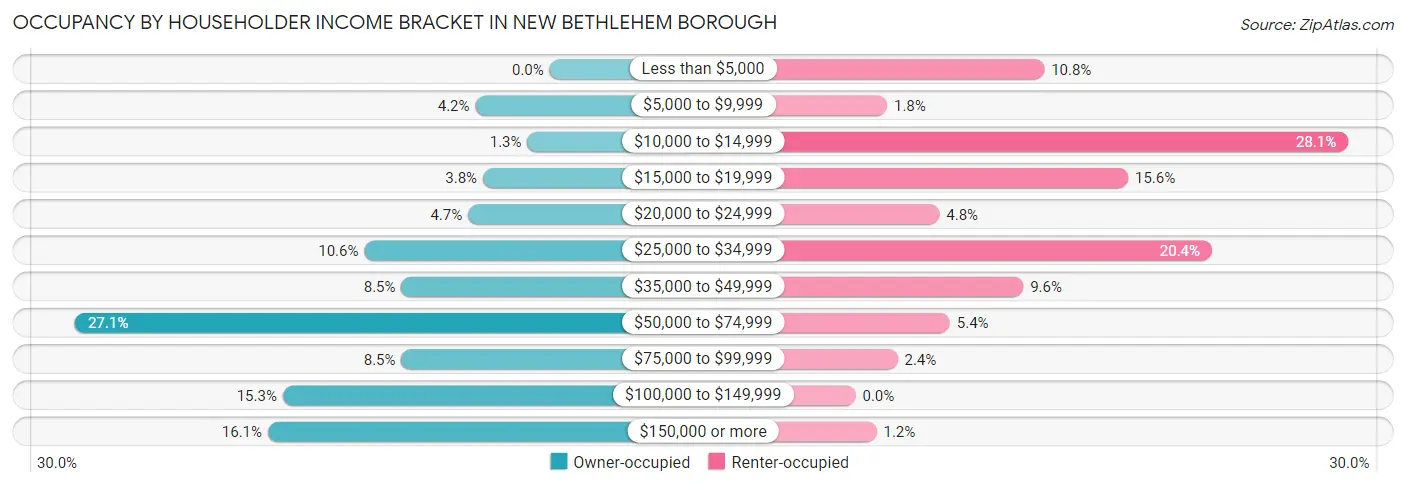
| Income Bracket | Owner-occupied | Renter-occupied |
| Less than $5,000 | 0 (0.0%) | 18 (10.8%) |
| $5,000 to $9,999 | 10 (4.2%) | 3 (1.8%) |
| $10,000 to $14,999 | 3 (1.3%) | 47 (28.1%) |
| $15,000 to $19,999 | 9 (3.8%) | 26 (15.6%) |
| $20,000 to $24,999 | 11 (4.7%) | 8 (4.8%) |
| $25,000 to $34,999 | 25 (10.6%) | 34 (20.4%) |
| $35,000 to $49,999 | 20 (8.5%) | 16 (9.6%) |
| $50,000 to $74,999 | 64 (27.1%) | 9 (5.4%) |
| $75,000 to $99,999 | 20 (8.5%) | 4 (2.4%) |
| $100,000 to $149,999 | 36 (15.2%) | 0 (0.0%) |
| $150,000 or more | 38 (16.1%) | 2 (1.2%) |
| Total | 236 (100.0%) | 167 (100.0%) |
Monthly Housing Cost Tiers in New Bethlehem borough
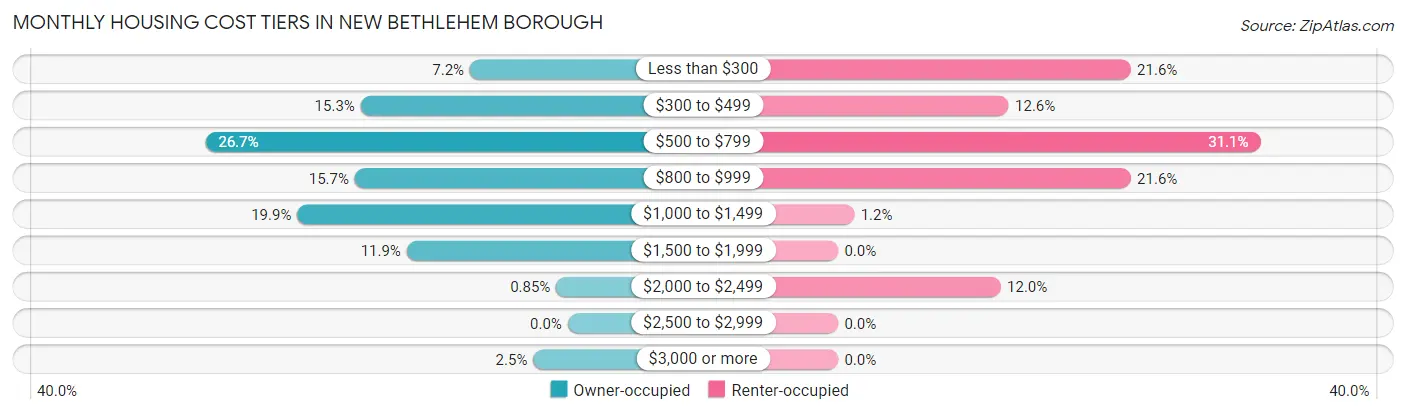
| Monthly Cost | Owner-occupied | Renter-occupied |
| Less than $300 | 17 (7.2%) | 36 (21.6%) |
| $300 to $499 | 36 (15.2%) | 21 (12.6%) |
| $500 to $799 | 63 (26.7%) | 52 (31.1%) |
| $800 to $999 | 37 (15.7%) | 36 (21.6%) |
| $1,000 to $1,499 | 47 (19.9%) | 2 (1.2%) |
| $1,500 to $1,999 | 28 (11.9%) | 0 (0.0%) |
| $2,000 to $2,499 | 2 (0.9%) | 20 (12.0%) |
| $2,500 to $2,999 | 0 (0.0%) | 0 (0.0%) |
| $3,000 or more | 6 (2.5%) | 0 (0.0%) |
| Total | 236 (100.0%) | 167 (100.0%) |
Physical Housing Characteristics in New Bethlehem borough
Housing Structures in New Bethlehem borough
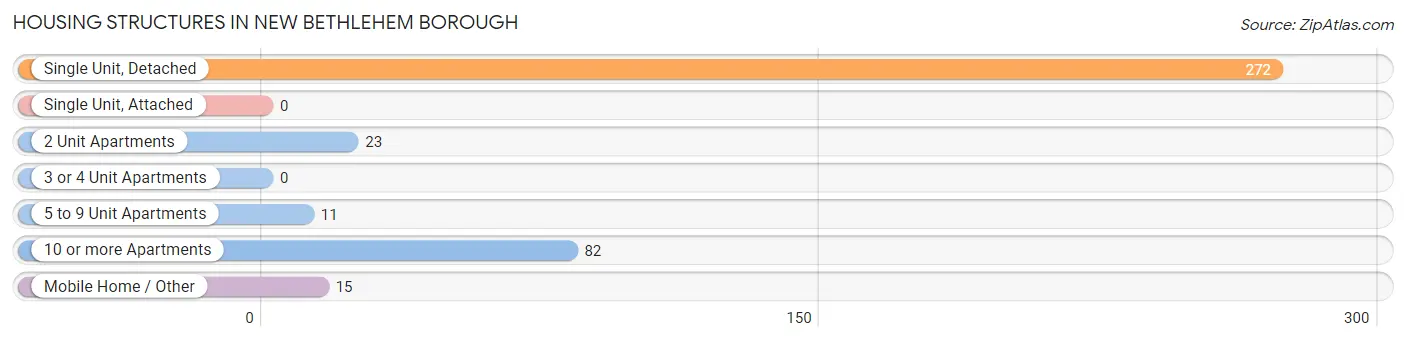
| Structure Type | # Housing Units | % Housing Units |
| Single Unit, Detached | 272 | 67.5% |
| Single Unit, Attached | 0 | 0.0% |
| 2 Unit Apartments | 23 | 5.7% |
| 3 or 4 Unit Apartments | 0 | 0.0% |
| 5 to 9 Unit Apartments | 11 | 2.7% |
| 10 or more Apartments | 82 | 20.3% |
| Mobile Home / Other | 15 | 3.7% |
| Total | 403 | 100.0% |
Housing Structures by Occupancy in New Bethlehem borough
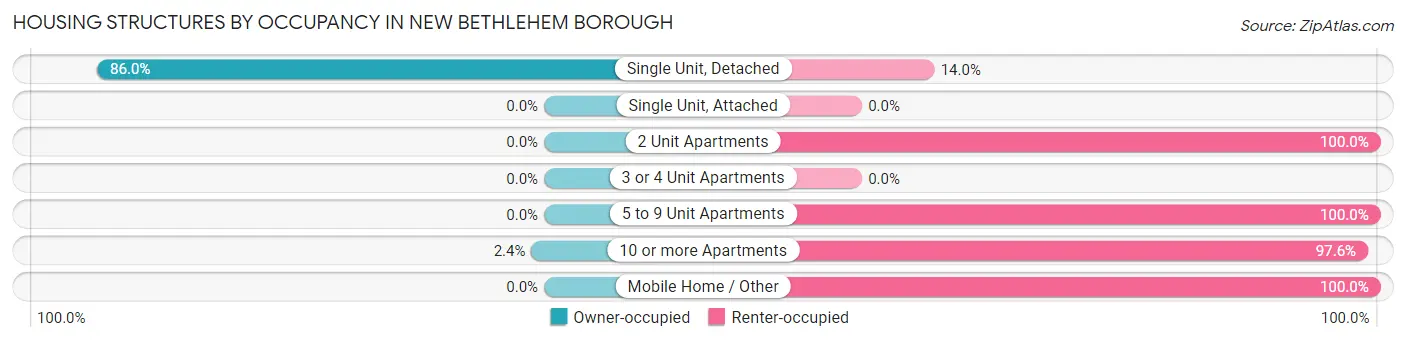
| Structure Type | Owner-occupied | Renter-occupied |
| Single Unit, Detached | 234 (86.0%) | 38 (14.0%) |
| Single Unit, Attached | 0 (0.0%) | 0 (0.0%) |
| 2 Unit Apartments | 0 (0.0%) | 23 (100.0%) |
| 3 or 4 Unit Apartments | 0 (0.0%) | 0 (0.0%) |
| 5 to 9 Unit Apartments | 0 (0.0%) | 11 (100.0%) |
| 10 or more Apartments | 2 (2.4%) | 80 (97.6%) |
| Mobile Home / Other | 0 (0.0%) | 15 (100.0%) |
| Total | 236 (58.6%) | 167 (41.4%) |
Housing Structures by Number of Rooms in New Bethlehem borough
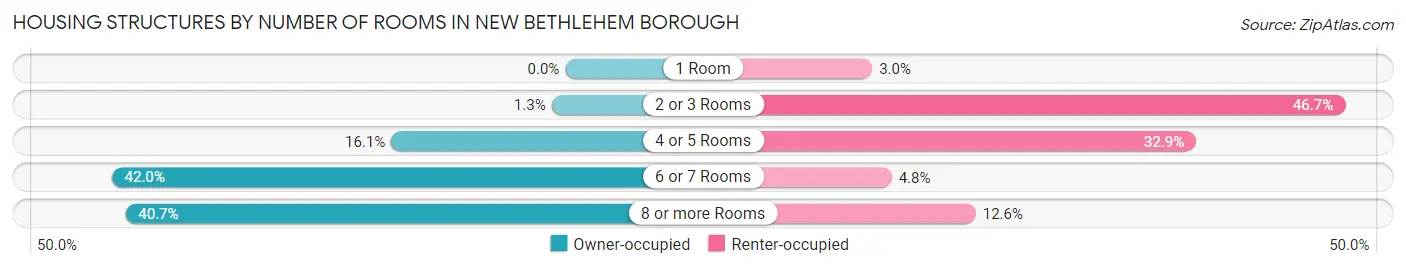
| Number of Rooms | Owner-occupied | Renter-occupied |
| 1 Room | 0 (0.0%) | 5 (3.0%) |
| 2 or 3 Rooms | 3 (1.3%) | 78 (46.7%) |
| 4 or 5 Rooms | 38 (16.1%) | 55 (32.9%) |
| 6 or 7 Rooms | 99 (41.9%) | 8 (4.8%) |
| 8 or more Rooms | 96 (40.7%) | 21 (12.6%) |
| Total | 236 (100.0%) | 167 (100.0%) |
Housing Structure by Heating Type in New Bethlehem borough
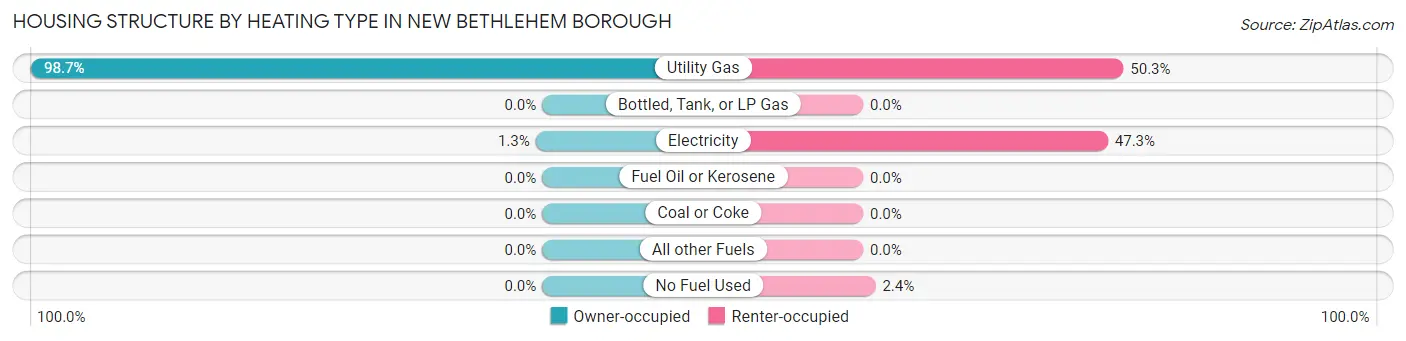
| Heating Type | Owner-occupied | Renter-occupied |
| Utility Gas | 233 (98.7%) | 84 (50.3%) |
| Bottled, Tank, or LP Gas | 0 (0.0%) | 0 (0.0%) |
| Electricity | 3 (1.3%) | 79 (47.3%) |
| Fuel Oil or Kerosene | 0 (0.0%) | 0 (0.0%) |
| Coal or Coke | 0 (0.0%) | 0 (0.0%) |
| All other Fuels | 0 (0.0%) | 0 (0.0%) |
| No Fuel Used | 0 (0.0%) | 4 (2.4%) |
| Total | 236 (100.0%) | 167 (100.0%) |
Household Vehicle Usage in New Bethlehem borough
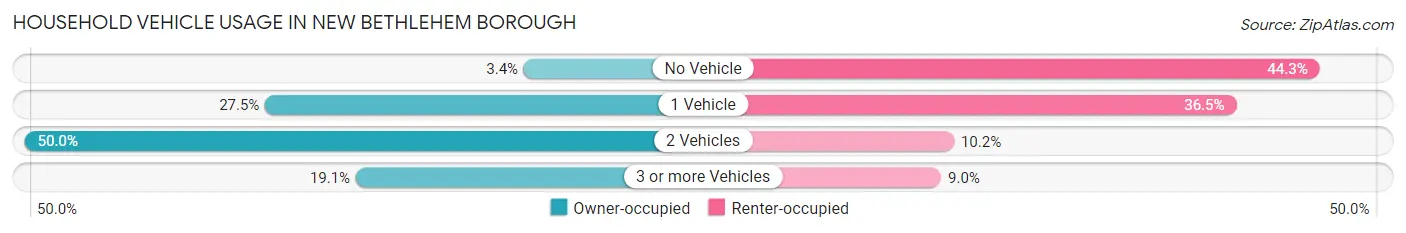
| Vehicles per Household | Owner-occupied | Renter-occupied |
| No Vehicle | 8 (3.4%) | 74 (44.3%) |
| 1 Vehicle | 65 (27.5%) | 61 (36.5%) |
| 2 Vehicles | 118 (50.0%) | 17 (10.2%) |
| 3 or more Vehicles | 45 (19.1%) | 15 (9.0%) |
| Total | 236 (100.0%) | 167 (100.0%) |
Real Estate & Mortgages in New Bethlehem borough
Real Estate and Mortgage Overview in New Bethlehem borough
| Characteristic | Without Mortgage | With Mortgage |
| Housing Units | 117 | 119 |
| Median Property Value | $120,800 | $123,000 |
| Median Household Income | $53,472 | $38 |
| Monthly Housing Costs | $539 | $3 |
| Real Estate Taxes | $1,286 | $0 |
Property Value by Mortgage Status in New Bethlehem borough
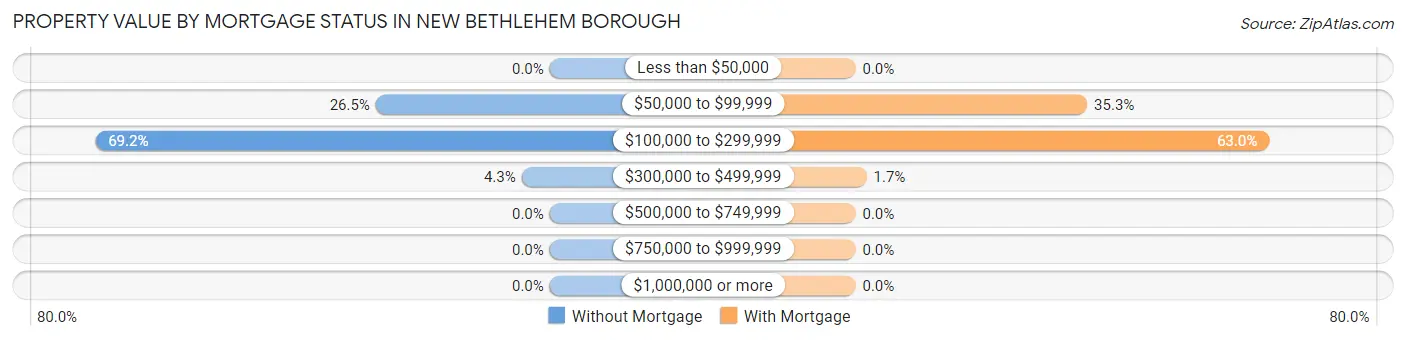
| Property Value | Without Mortgage | With Mortgage |
| Less than $50,000 | 0 (0.0%) | 0 (0.0%) |
| $50,000 to $99,999 | 31 (26.5%) | 42 (35.3%) |
| $100,000 to $299,999 | 81 (69.2%) | 75 (63.0%) |
| $300,000 to $499,999 | 5 (4.3%) | 2 (1.7%) |
| $500,000 to $749,999 | 0 (0.0%) | 0 (0.0%) |
| $750,000 to $999,999 | 0 (0.0%) | 0 (0.0%) |
| $1,000,000 or more | 0 (0.0%) | 0 (0.0%) |
| Total | 117 (100.0%) | 119 (100.0%) |
Household Income by Mortgage Status in New Bethlehem borough
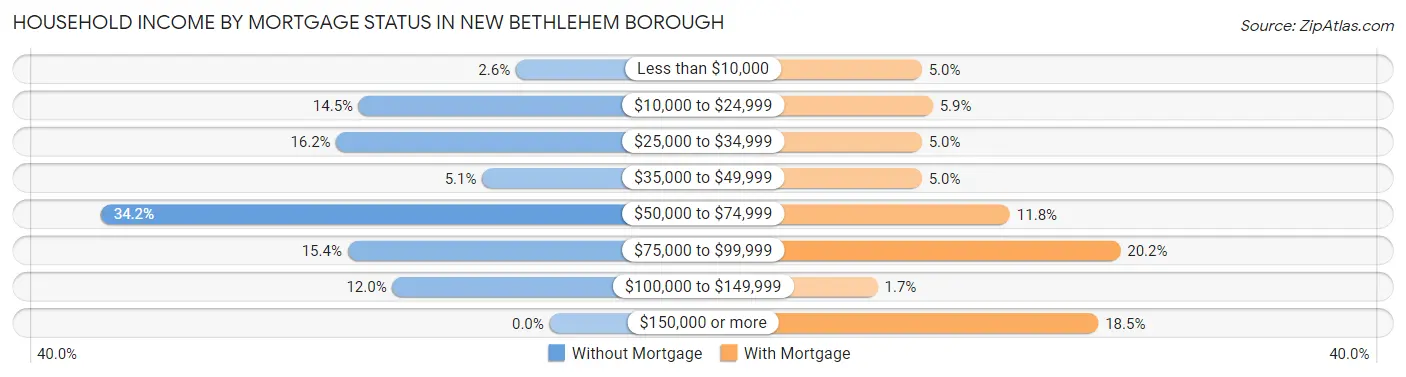
| Household Income | Without Mortgage | With Mortgage |
| Less than $10,000 | 3 (2.6%) | 6 (5.0%) |
| $10,000 to $24,999 | 17 (14.5%) | 7 (5.9%) |
| $25,000 to $34,999 | 19 (16.2%) | 6 (5.0%) |
| $35,000 to $49,999 | 6 (5.1%) | 6 (5.0%) |
| $50,000 to $74,999 | 40 (34.2%) | 14 (11.8%) |
| $75,000 to $99,999 | 18 (15.4%) | 24 (20.2%) |
| $100,000 to $149,999 | 14 (12.0%) | 2 (1.7%) |
| $150,000 or more | 0 (0.0%) | 22 (18.5%) |
| Total | 117 (100.0%) | 119 (100.0%) |
Property Value to Household Income Ratio in New Bethlehem borough
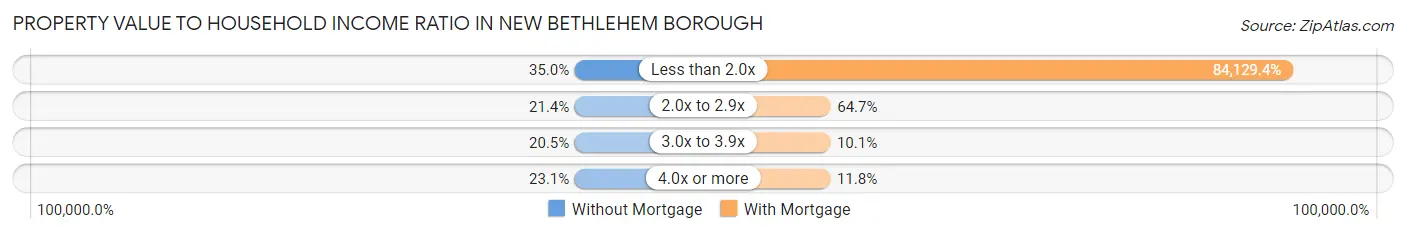
| Value-to-Income Ratio | Without Mortgage | With Mortgage |
| Less than 2.0x | 41 (35.0%) | 100,114 (84,129.4%) |
| 2.0x to 2.9x | 25 (21.4%) | 77 (64.7%) |
| 3.0x to 3.9x | 24 (20.5%) | 12 (10.1%) |
| 4.0x or more | 27 (23.1%) | 14 (11.8%) |
| Total | 117 (100.0%) | 119 (100.0%) |
Real Estate Taxes by Mortgage Status in New Bethlehem borough
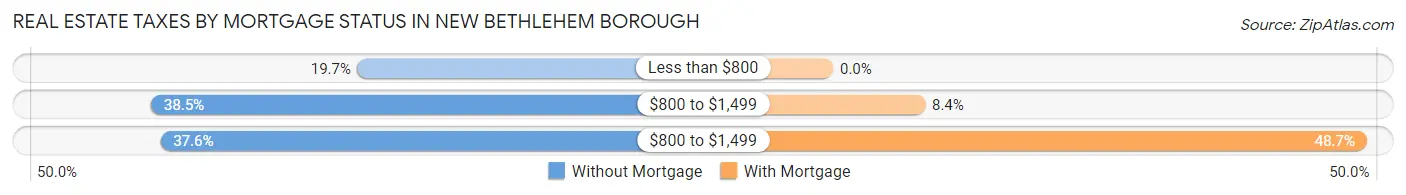
| Property Taxes | Without Mortgage | With Mortgage |
| Less than $800 | 23 (19.7%) | 0 (0.0%) |
| $800 to $1,499 | 45 (38.5%) | 10 (8.4%) |
| $800 to $1,499 | 44 (37.6%) | 58 (48.7%) |
| Total | 117 (100.0%) | 119 (100.0%) |
Health & Disability in New Bethlehem borough
Health Insurance Coverage by Age in New Bethlehem borough
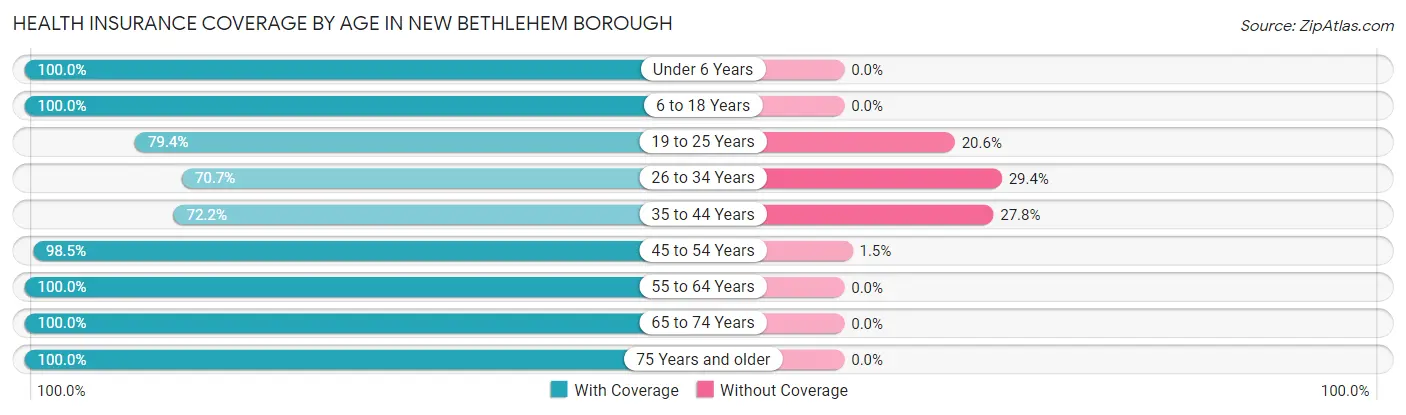
| Age Bracket | With Coverage | Without Coverage |
| Under 6 Years | 32 (100.0%) | 0 (0.0%) |
| 6 to 18 Years | 113 (100.0%) | 0 (0.0%) |
| 19 to 25 Years | 54 (79.4%) | 14 (20.6%) |
| 26 to 34 Years | 65 (70.7%) | 27 (29.3%) |
| 35 to 44 Years | 39 (72.2%) | 15 (27.8%) |
| 45 to 54 Years | 128 (98.5%) | 2 (1.5%) |
| 55 to 64 Years | 91 (100.0%) | 0 (0.0%) |
| 65 to 74 Years | 126 (100.0%) | 0 (0.0%) |
| 75 Years and older | 139 (100.0%) | 0 (0.0%) |
| Total | 787 (93.1%) | 58 (6.9%) |
Health Insurance Coverage by Citizenship Status in New Bethlehem borough
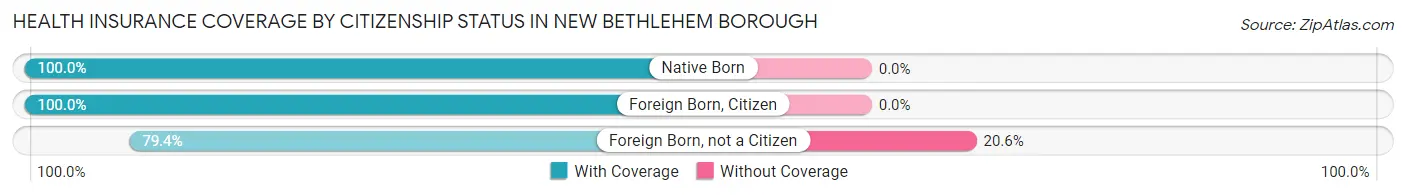
| Citizenship Status | With Coverage | Without Coverage |
| Native Born | 32 (100.0%) | 0 (0.0%) |
| Foreign Born, Citizen | 113 (100.0%) | 0 (0.0%) |
| Foreign Born, not a Citizen | 54 (79.4%) | 14 (20.6%) |
Health Insurance Coverage by Household Income in New Bethlehem borough
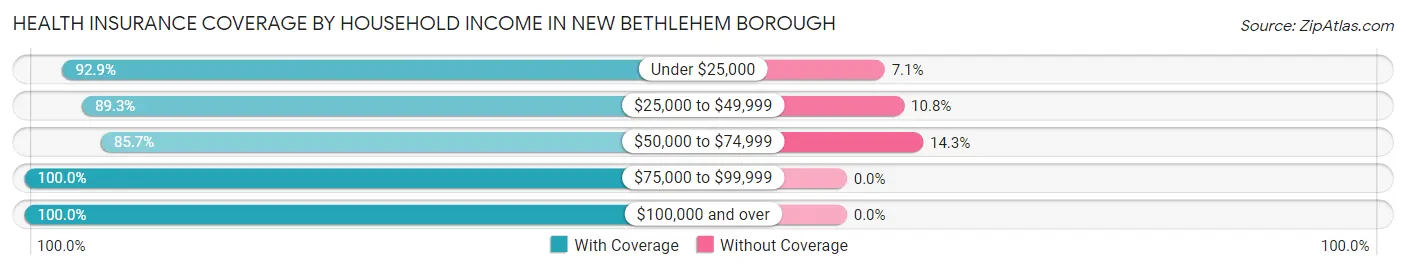
| Household Income | With Coverage | Without Coverage |
| Under $25,000 | 196 (92.9%) | 15 (7.1%) |
| $25,000 to $49,999 | 166 (89.2%) | 20 (10.7%) |
| $50,000 to $74,999 | 138 (85.7%) | 23 (14.3%) |
| $75,000 to $99,999 | 60 (100.0%) | 0 (0.0%) |
| $100,000 and over | 227 (100.0%) | 0 (0.0%) |
Public vs Private Health Insurance Coverage by Age in New Bethlehem borough
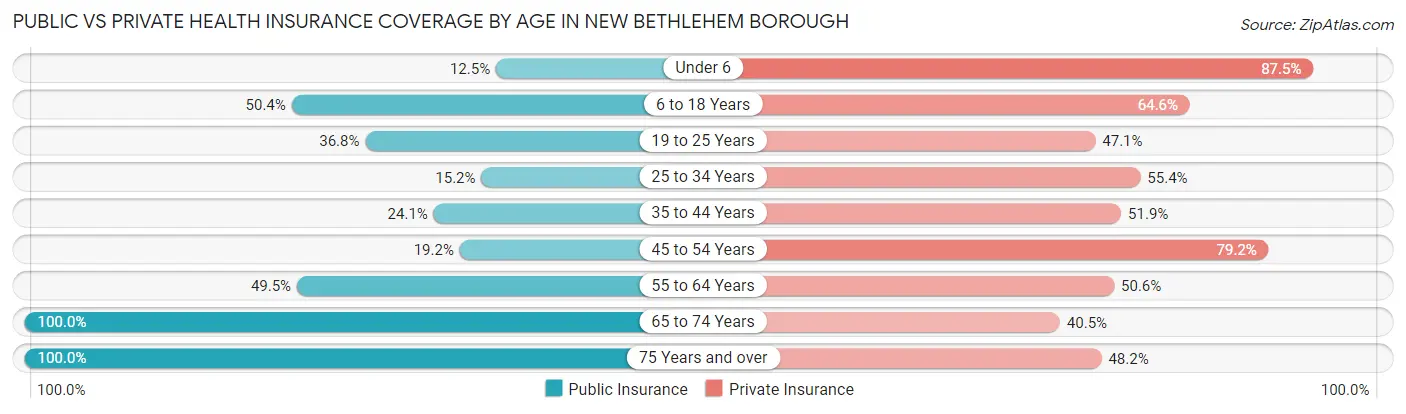
| Age Bracket | Public Insurance | Private Insurance |
| Under 6 | 4 (12.5%) | 28 (87.5%) |
| 6 to 18 Years | 57 (50.4%) | 73 (64.6%) |
| 19 to 25 Years | 25 (36.8%) | 32 (47.1%) |
| 25 to 34 Years | 14 (15.2%) | 51 (55.4%) |
| 35 to 44 Years | 13 (24.1%) | 28 (51.8%) |
| 45 to 54 Years | 25 (19.2%) | 103 (79.2%) |
| 55 to 64 Years | 45 (49.4%) | 46 (50.5%) |
| 65 to 74 Years | 126 (100.0%) | 51 (40.5%) |
| 75 Years and over | 139 (100.0%) | 67 (48.2%) |
| Total | 448 (53.0%) | 479 (56.7%) |
Disability Status by Sex by Age in New Bethlehem borough
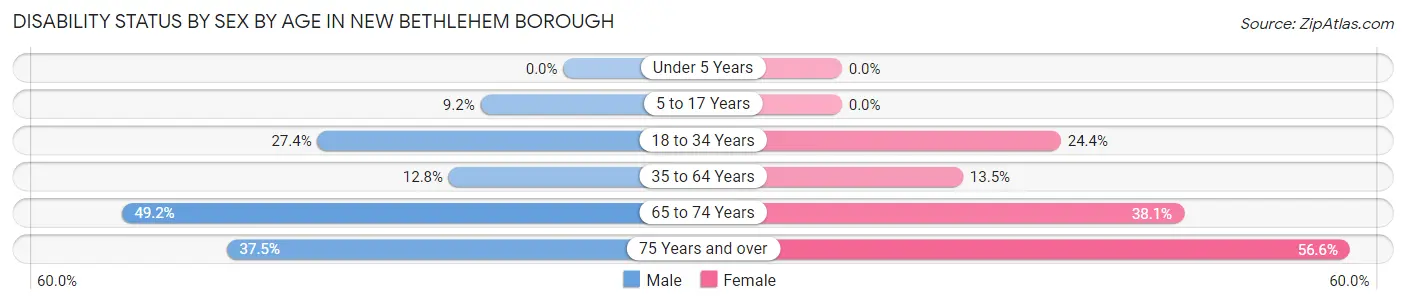
| Age Bracket | Male | Female |
| Under 5 Years | 0 (0.0%) | 0 (0.0%) |
| 5 to 17 Years | 6 (9.2%) | 0 (0.0%) |
| 18 to 34 Years | 23 (27.4%) | 20 (24.4%) |
| 35 to 64 Years | 19 (12.8%) | 17 (13.5%) |
| 65 to 74 Years | 31 (49.2%) | 24 (38.1%) |
| 75 Years and over | 15 (37.5%) | 56 (56.6%) |
Disability Class by Sex by Age in New Bethlehem borough
Disability Class: Hearing Difficulty
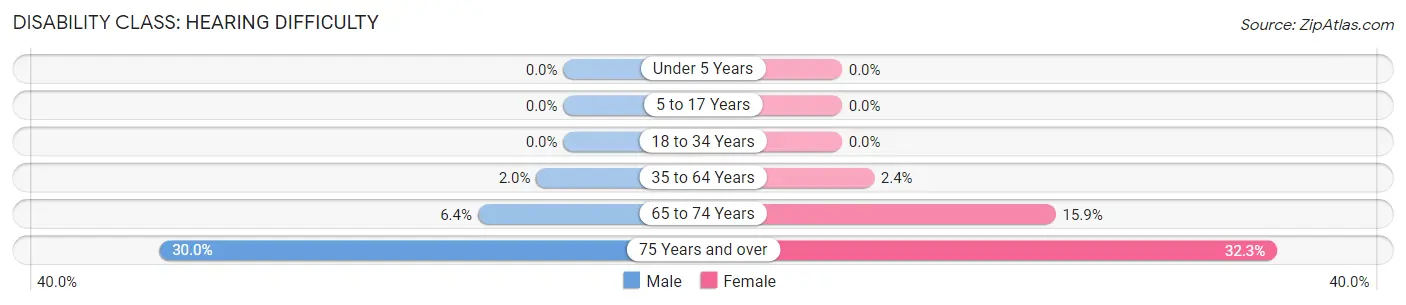
| Age Bracket | Male | Female |
| Under 5 Years | 0 (0.0%) | 0 (0.0%) |
| 5 to 17 Years | 0 (0.0%) | 0 (0.0%) |
| 18 to 34 Years | 0 (0.0%) | 0 (0.0%) |
| 35 to 64 Years | 3 (2.0%) | 3 (2.4%) |
| 65 to 74 Years | 4 (6.4%) | 10 (15.9%) |
| 75 Years and over | 12 (30.0%) | 32 (32.3%) |
Disability Class: Vision Difficulty
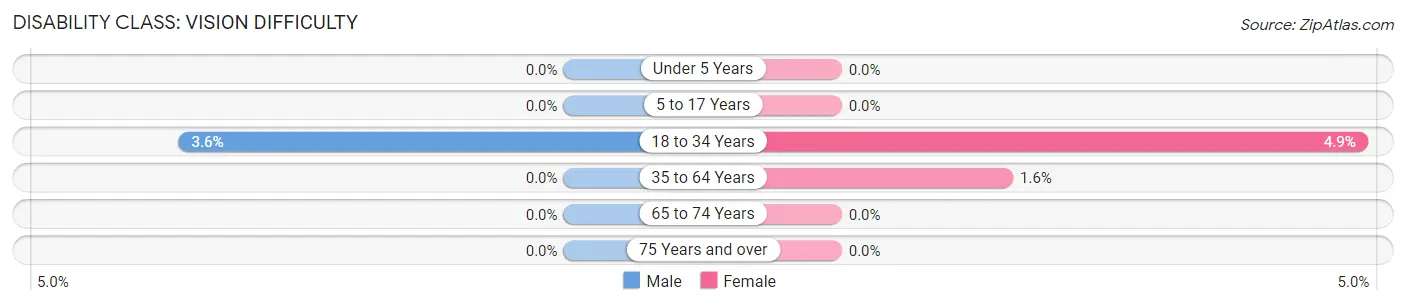
| Age Bracket | Male | Female |
| Under 5 Years | 0 (0.0%) | 0 (0.0%) |
| 5 to 17 Years | 0 (0.0%) | 0 (0.0%) |
| 18 to 34 Years | 3 (3.6%) | 4 (4.9%) |
| 35 to 64 Years | 0 (0.0%) | 2 (1.6%) |
| 65 to 74 Years | 0 (0.0%) | 0 (0.0%) |
| 75 Years and over | 0 (0.0%) | 0 (0.0%) |
Disability Class: Cognitive Difficulty
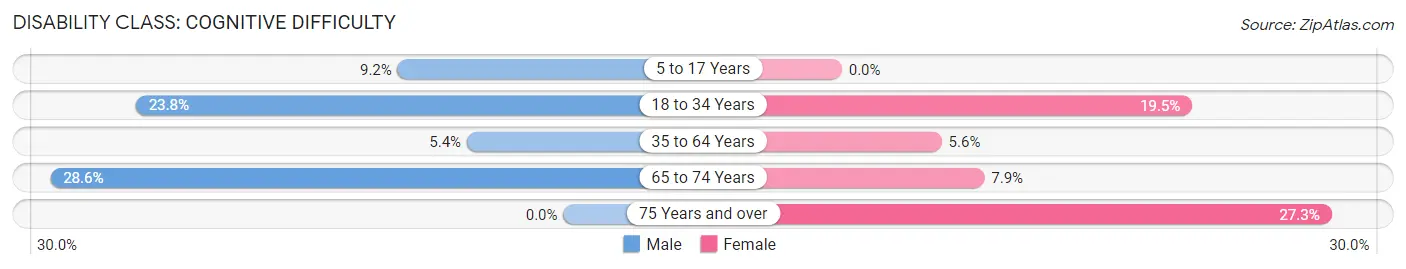
| Age Bracket | Male | Female |
| 5 to 17 Years | 6 (9.2%) | 0 (0.0%) |
| 18 to 34 Years | 20 (23.8%) | 16 (19.5%) |
| 35 to 64 Years | 8 (5.4%) | 7 (5.6%) |
| 65 to 74 Years | 18 (28.6%) | 5 (7.9%) |
| 75 Years and over | 0 (0.0%) | 27 (27.3%) |
Disability Class: Ambulatory Difficulty
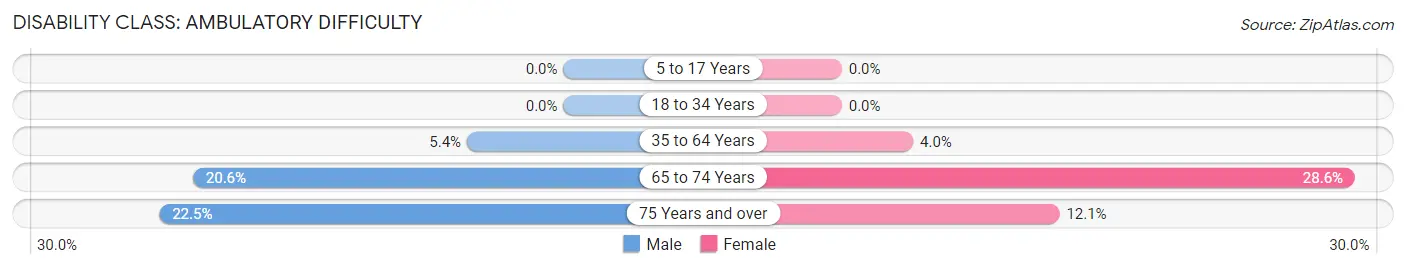
| Age Bracket | Male | Female |
| 5 to 17 Years | 0 (0.0%) | 0 (0.0%) |
| 18 to 34 Years | 0 (0.0%) | 0 (0.0%) |
| 35 to 64 Years | 8 (5.4%) | 5 (4.0%) |
| 65 to 74 Years | 13 (20.6%) | 18 (28.6%) |
| 75 Years and over | 9 (22.5%) | 12 (12.1%) |
Disability Class: Self-Care Difficulty
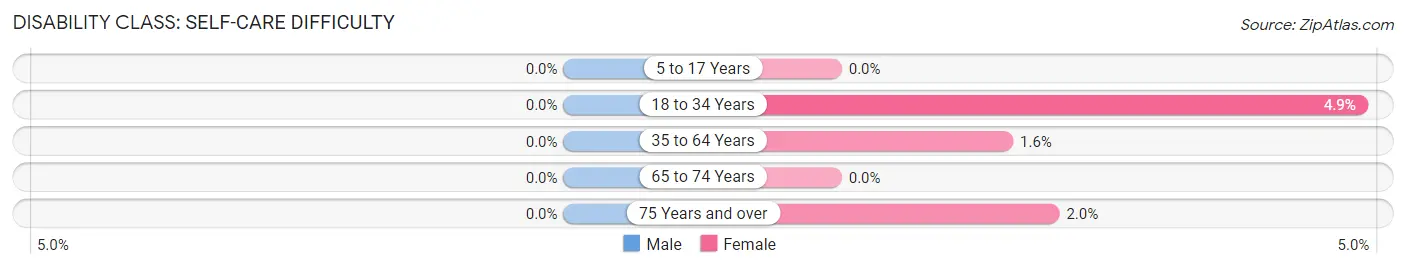
| Age Bracket | Male | Female |
| 5 to 17 Years | 0 (0.0%) | 0 (0.0%) |
| 18 to 34 Years | 0 (0.0%) | 4 (4.9%) |
| 35 to 64 Years | 0 (0.0%) | 2 (1.6%) |
| 65 to 74 Years | 0 (0.0%) | 0 (0.0%) |
| 75 Years and over | 0 (0.0%) | 2 (2.0%) |
Technology Access in New Bethlehem borough
Computing Device Access in New Bethlehem borough
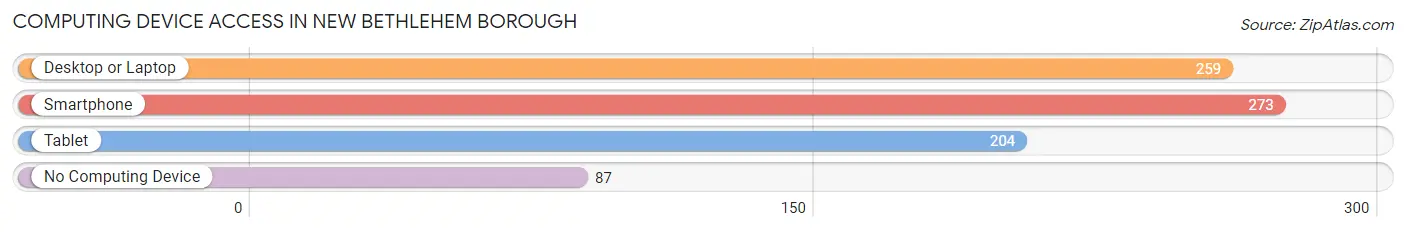
| Device Type | # Households | % Households |
| Desktop or Laptop | 259 | 64.3% |
| Smartphone | 273 | 67.7% |
| Tablet | 204 | 50.6% |
| No Computing Device | 87 | 21.6% |
| Total | 403 | 100.0% |
Internet Access in New Bethlehem borough
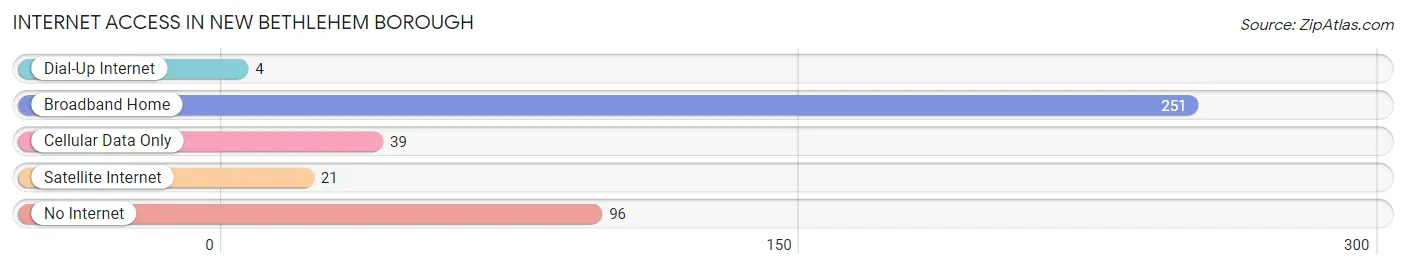
| Internet Type | # Households | % Households |
| Dial-Up Internet | 4 | 1.0% |
| Broadband Home | 251 | 62.3% |
| Cellular Data Only | 39 | 9.7% |
| Satellite Internet | 21 | 5.2% |
| No Internet | 96 | 23.8% |
| Total | 403 | 100.0% |
New Bethlehem borough Summary
New Bethlehem Borough is a small borough located in Clarion County, Pennsylvania. It is situated in the foothills of the Allegheny Mountains and is part of the Clarion-Forest-Venango tri-county area. The borough is located along the Clarion River and is home to a population of 1,845 people as of the 2010 census.
History
New Bethlehem was founded in 1832 by a group of settlers from New England. The town was originally known as “New England” and was later changed to “New Bethlehem” in 1836. The town was named after the biblical town of Bethlehem, which is located in the West Bank. The town was incorporated as a borough in 1854.
The town was an important stop on the Pennsylvania and Ohio Railroad, which ran through the town from 1871 to 1877. The railroad was a major factor in the growth of the town, as it allowed for the transportation of goods and people.
The town was also home to a number of industries, including a sawmill, a gristmill, a tannery, and a woolen mill. These industries provided employment for many of the town’s residents.
Geography
New Bethlehem is located in Clarion County, Pennsylvania. It is situated in the foothills of the Allegheny Mountains and is part of the Clarion-Forest-Venango tri-county area. The borough is located along the Clarion River and is home to a population of 1,845 people as of the 2010 census.
The borough has a total area of 1.2 square miles, all of which is land. The borough is located in a rural area and is surrounded by forests and farmland. The borough is located approximately 50 miles northeast of Pittsburgh and is accessible via U.S. Route 322.
Economy
The economy of New Bethlehem is largely based on agriculture and tourism. The town is home to a number of farms, which produce a variety of crops, including corn, soybeans, hay, and wheat. The town is also home to a number of tourist attractions, including the Clarion River, which is popular for fishing and canoeing.
The town is also home to a number of small businesses, including restaurants, retail stores, and service providers. The town is also home to a number of manufacturing companies, which produce a variety of products, including furniture, clothing, and automotive parts.
Demographics
As of the 2010 census, the population of New Bethlehem was 1,845. The racial makeup of the borough was 97.3% White, 0.7% African American, 0.2% Native American, 0.2% Asian, 0.1% from other races, and 1.5% from two or more races. Hispanic or Latino of any race were 0.7% of the population.
The median income for a household in the borough was $37,500, and the median income for a family was $45,000. The per capita income for the borough was $18,845. About 11.2% of families and 14.2% of the population were below the poverty line, including 18.2% of those under age 18 and 8.3% of those age 65 or over.
Conclusion
New Bethlehem Borough is a small borough located in Clarion County, Pennsylvania. It is situated in the foothills of the Allegheny Mountains and is part of the Clarion-Forest-Venango tri-county area. The borough is located along the Clarion River and is home to a population of 1,845 people as of the 2010 census. The town was founded in 1832 and was an important stop on the Pennsylvania and Ohio Railroad. The economy of the town is largely based on agriculture and tourism, and the town is home to a number of small businesses. The racial makeup of the borough is 97.3% White, 0.7% African American, 0.2% Native American, 0.2% Asian, 0.1% from other races, and 1.5% from two or more races. The median income for a household in the borough was $37,500, and the median income for a family was $45,000.
Common Questions
What is Per Capita Income in New Bethlehem borough?
Per Capita income in New Bethlehem borough is $27,513.
What is the Median Family Income in New Bethlehem borough?
Median Family Income in New Bethlehem borough is $61,125.
What is the Median Household income in New Bethlehem borough?
Median Household Income in New Bethlehem borough is $36,103.
What is Income or Wage Gap in New Bethlehem borough?
Income or Wage Gap in New Bethlehem borough is 20.9%.
Women in New Bethlehem borough earn 79.1 cents for every dollar earned by a man.
What is Family Income Deficit in New Bethlehem borough?
Family Income Deficit in New Bethlehem borough is $12,767.
Families that are below poverty line in New Bethlehem borough earn $12,767 less on average than the poverty threshold level.
What is Inequality or Gini Index in New Bethlehem borough?
Inequality or Gini Index in New Bethlehem borough is 0.48.
What is the Total Population of New Bethlehem borough?
Total Population of New Bethlehem borough is 845.
What is the Total Male Population of New Bethlehem borough?
Total Male Population of New Bethlehem borough is 413.
What is the Total Female Population of New Bethlehem borough?
Total Female Population of New Bethlehem borough is 432.
What is the Ratio of Males per 100 Females in New Bethlehem borough?
There are 95.60 Males per 100 Females in New Bethlehem borough.
What is the Ratio of Females per 100 Males in New Bethlehem borough?
There are 104.60 Females per 100 Males in New Bethlehem borough.
What is the Median Population Age in New Bethlehem borough?
Median Population Age in New Bethlehem borough is 50.4 Years.
What is the Average Family Size in New Bethlehem borough
Average Family Size in New Bethlehem borough is 2.9 People.
What is the Average Household Size in New Bethlehem borough
Average Household Size in New Bethlehem borough is 2.1 People.
How Large is the Labor Force in New Bethlehem borough?
There are 325 People in the Labor Forcein in New Bethlehem borough.
What is the Percentage of People in the Labor Force in New Bethlehem borough?
46.0% of People are in the Labor Force in New Bethlehem borough.
What is the Unemployment Rate in New Bethlehem borough?
Unemployment Rate in New Bethlehem borough is 2.5%.