Muncy borough, PA Map & Demographics
Muncy borough Overview
$32,408
PER CAPITA INCOME
$90,078
AVG FAMILY INCOME
$80,208
AVG HOUSEHOLD INCOME
31.8%
WAGE / INCOME GAP [ % ]
68.2¢/ $1
WAGE / INCOME GAP [ $ ]
0.38
INEQUALITY / GINI INDEX
2,570
TOTAL POPULATION
1,293
MALE POPULATION
1,277
FEMALE POPULATION
101.25
MALES / 100 FEMALES
98.76
FEMALES / 100 MALES
37.8
MEDIAN AGE
3.0
AVG FAMILY SIZE
2.5
AVG HOUSEHOLD SIZE
1,235
LABOR FORCE [ PEOPLE ]
64.3%
PERCENT IN LABOR FORCE
4.2%
UNEMPLOYMENT RATE
Income in Muncy borough
Income Overview in Muncy borough
Per Capita Income in Muncy borough is $32,408, while median incomes of families and households are $90,078 and $80,208 respectively.
| Characteristic | Number | Measure |
| Per Capita Income | 2,570 | $32,408 |
| Median Family Income | 741 | $90,078 |
| Mean Family Income | 741 | $90,643 |
| Median Household Income | 1,043 | $80,208 |
| Mean Household Income | 1,043 | $80,281 |
| Income Deficit | 741 | $0 |
| Wage / Income Gap (%) | 2,570 | 31.76% |
| Wage / Income Gap ($) | 2,570 | 68.24¢ per $1 |
| Gini / Inequality Index | 2,570 | 0.38 |
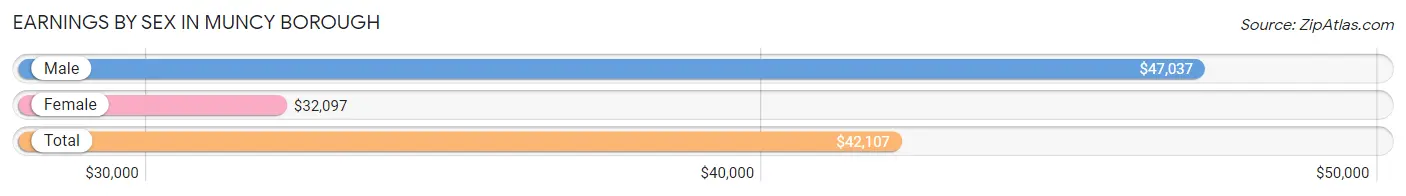
Earnings by Sex in Muncy borough
Average Earnings in Muncy borough are $42,107, $47,037 for men and $32,097 for women, a difference of 31.8%.
| Sex | Number | Average Earnings |
| Male | 687 (54.0%) | $47,037 |
| Female | 584 (46.0%) | $32,097 |
| Total | 1,271 (100.0%) | $42,107 |
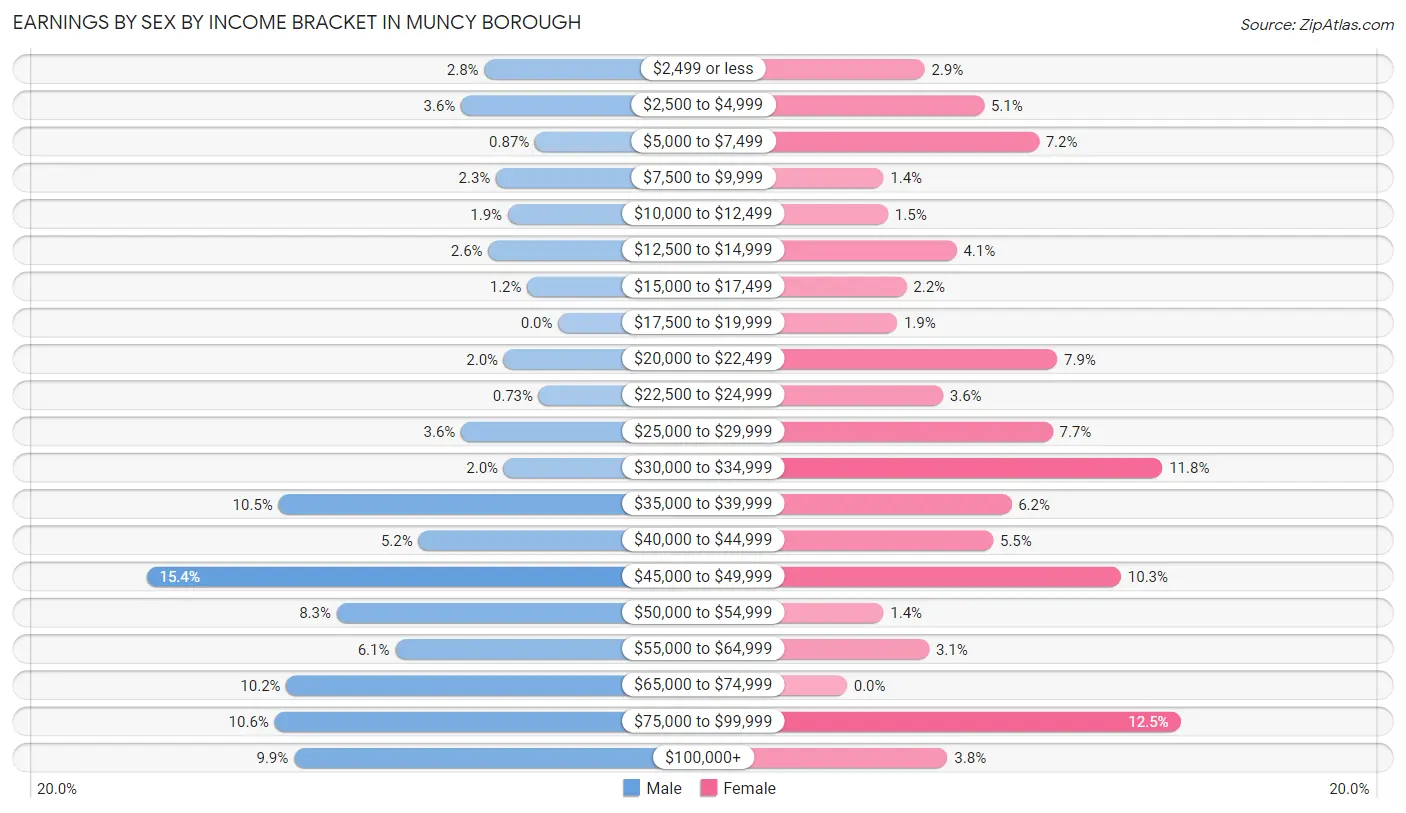
Earnings by Sex by Income Bracket in Muncy borough
The most common earnings brackets in Muncy borough are $45,000 to $49,999 for men (106 | 15.4%) and $75,000 to $99,999 for women (73 | 12.5%).
| Income | Male | Female |
| $2,499 or less | 19 (2.8%) | 17 (2.9%) |
| $2,500 to $4,999 | 25 (3.6%) | 30 (5.1%) |
| $5,000 to $7,499 | 6 (0.9%) | 42 (7.2%) |
| $7,500 to $9,999 | 16 (2.3%) | 8 (1.4%) |
| $10,000 to $12,499 | 13 (1.9%) | 9 (1.5%) |
| $12,500 to $14,999 | 18 (2.6%) | 24 (4.1%) |
| $15,000 to $17,499 | 8 (1.2%) | 13 (2.2%) |
| $17,500 to $19,999 | 0 (0.0%) | 11 (1.9%) |
| $20,000 to $22,499 | 14 (2.0%) | 46 (7.9%) |
| $22,500 to $24,999 | 5 (0.7%) | 21 (3.6%) |
| $25,000 to $29,999 | 25 (3.6%) | 45 (7.7%) |
| $30,000 to $34,999 | 14 (2.0%) | 69 (11.8%) |
| $35,000 to $39,999 | 72 (10.5%) | 36 (6.2%) |
| $40,000 to $44,999 | 36 (5.2%) | 32 (5.5%) |
| $45,000 to $49,999 | 106 (15.4%) | 60 (10.3%) |
| $50,000 to $54,999 | 57 (8.3%) | 8 (1.4%) |
| $55,000 to $64,999 | 42 (6.1%) | 18 (3.1%) |
| $65,000 to $74,999 | 70 (10.2%) | 0 (0.0%) |
| $75,000 to $99,999 | 73 (10.6%) | 73 (12.5%) |
| $100,000+ | 68 (9.9%) | 22 (3.8%) |
| Total | 687 (100.0%) | 584 (100.0%) |
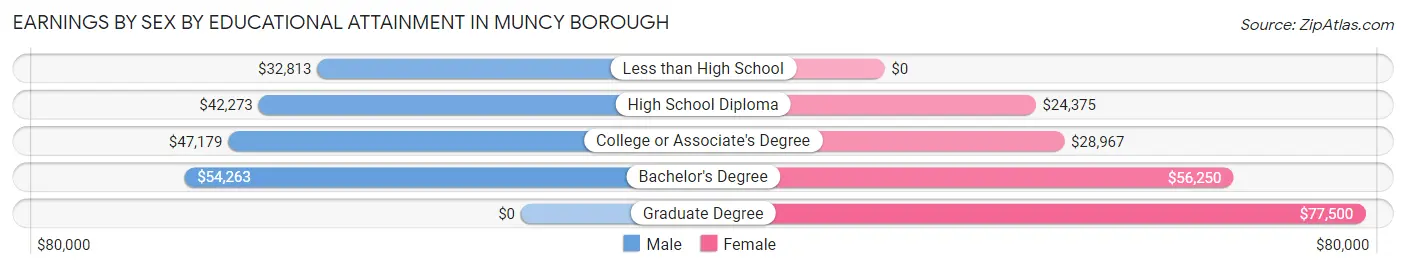
Earnings by Sex by Educational Attainment in Muncy borough
Average earnings in Muncy borough are $49,632 for men and $34,112 for women, a difference of 31.3%. Men with an educational attainment of bachelor's degree enjoy the highest average annual earnings of $54,263, while those with less than high school education earn the least with $32,813. Women with an educational attainment of graduate degree earn the most with the average annual earnings of $77,500, while those with high school diploma education have the smallest earnings of $24,375.
| Educational Attainment | Male Income | Female Income |
| Less than High School | $32,813 | $0 |
| High School Diploma | $42,273 | $24,375 |
| College or Associate's Degree | $47,179 | $28,967 |
| Bachelor's Degree | $54,263 | $56,250 |
| Graduate Degree | - | - |
| Total | $49,632 | $34,112 |
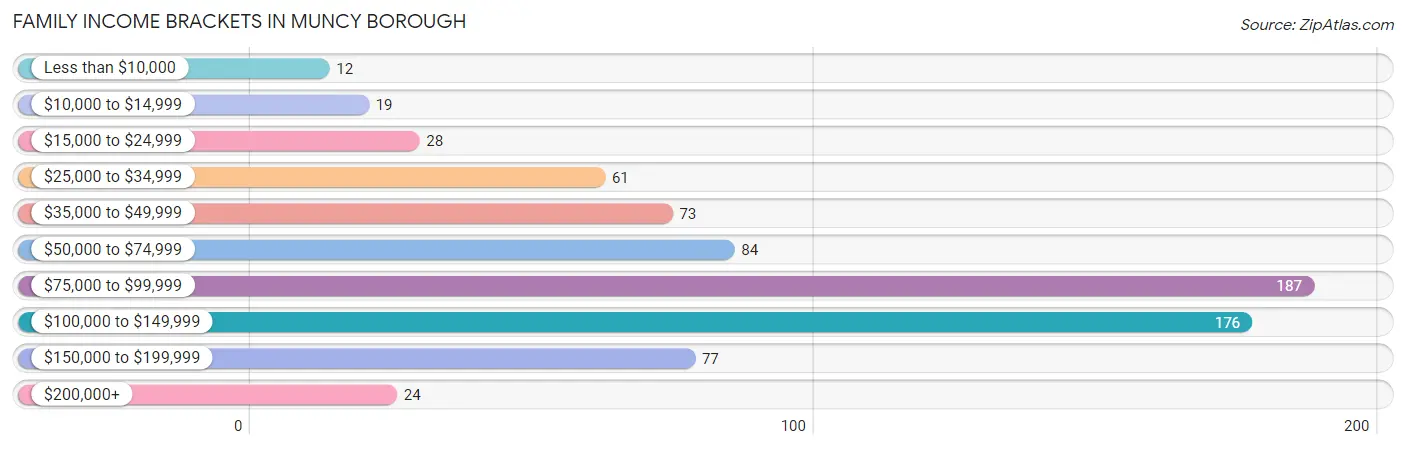
Family Income in Muncy borough
Family Income Brackets in Muncy borough
According to the Muncy borough family income data, there are 187 families falling into the $75,000 to $99,999 income range, which is the most common income bracket and makes up 25.2% of all families. Conversely, the less than $10,000 income bracket is the least frequent group with only 12 families (1.6%) belonging to this category.
| Income Bracket | # Families | % Families |
| Less than $10,000 | 12 | 1.6% |
| $10,000 to $14,999 | 19 | 2.6% |
| $15,000 to $24,999 | 28 | 3.8% |
| $25,000 to $34,999 | 61 | 8.2% |
| $35,000 to $49,999 | 73 | 9.9% |
| $50,000 to $74,999 | 84 | 11.3% |
| $75,000 to $99,999 | 187 | 25.2% |
| $100,000 to $149,999 | 176 | 23.8% |
| $150,000 to $199,999 | 77 | 10.4% |
| $200,000+ | 24 | 3.2% |
Family Income by Famaliy Size in Muncy borough
5-person families (37 | 5.0%) account for the highest median family income in Muncy borough with $167,750 per family, while 2-person families (426 | 57.5%) have the highest median income of $43,416 per family member.
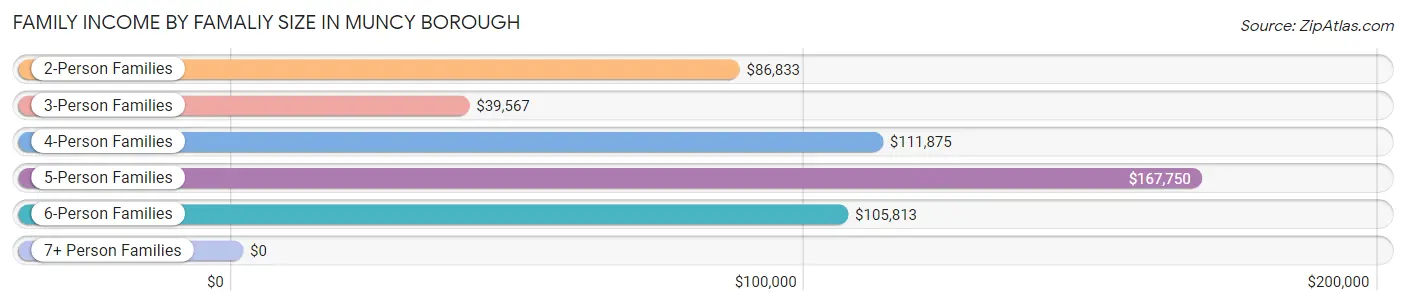
| Income Bracket | # Families | Median Income |
| 2-Person Families | 426 (57.5%) | $86,833 |
| 3-Person Families | 113 (15.2%) | $39,567 |
| 4-Person Families | 120 (16.2%) | $111,875 |
| 5-Person Families | 37 (5.0%) | $167,750 |
| 6-Person Families | 41 (5.5%) | $105,813 |
| 7+ Person Families | 4 (0.5%) | $0 |
| Total | 741 (100.0%) | $90,078 |
Family Income by Number of Earners in Muncy borough
The median family income in Muncy borough is $90,078, with families comprising 3+ earners (72) having the highest median family income of $164,000, while families with 1 earner (187) have the lowest median family income of $39,909, accounting for 9.7% and 25.2% of families, respectively.
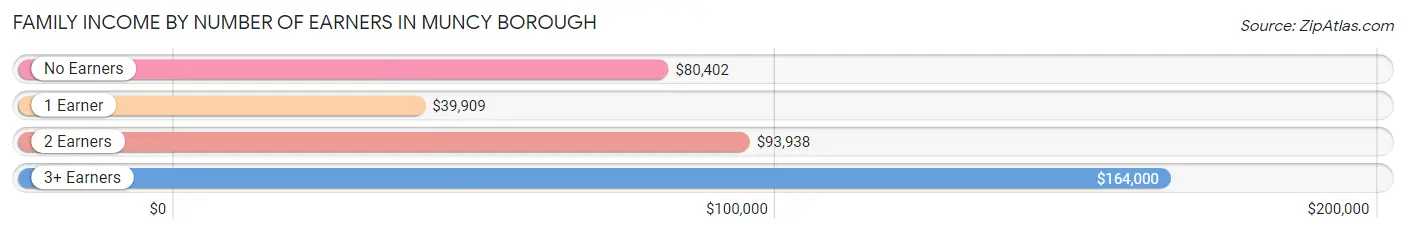
| Number of Earners | # Families | Median Income |
| No Earners | 155 (20.9%) | $80,402 |
| 1 Earner | 187 (25.2%) | $39,909 |
| 2 Earners | 327 (44.1%) | $93,938 |
| 3+ Earners | 72 (9.7%) | $164,000 |
| Total | 741 (100.0%) | $90,078 |
Household Income in Muncy borough
Household Income Brackets in Muncy borough
With 213 households falling in the category, the $75,000 to $99,999 income range is the most frequent in Muncy borough, accounting for 20.4% of all households. In contrast, only 30 households (2.9%) fall into the $200,000+ income bracket, making it the least populous group.
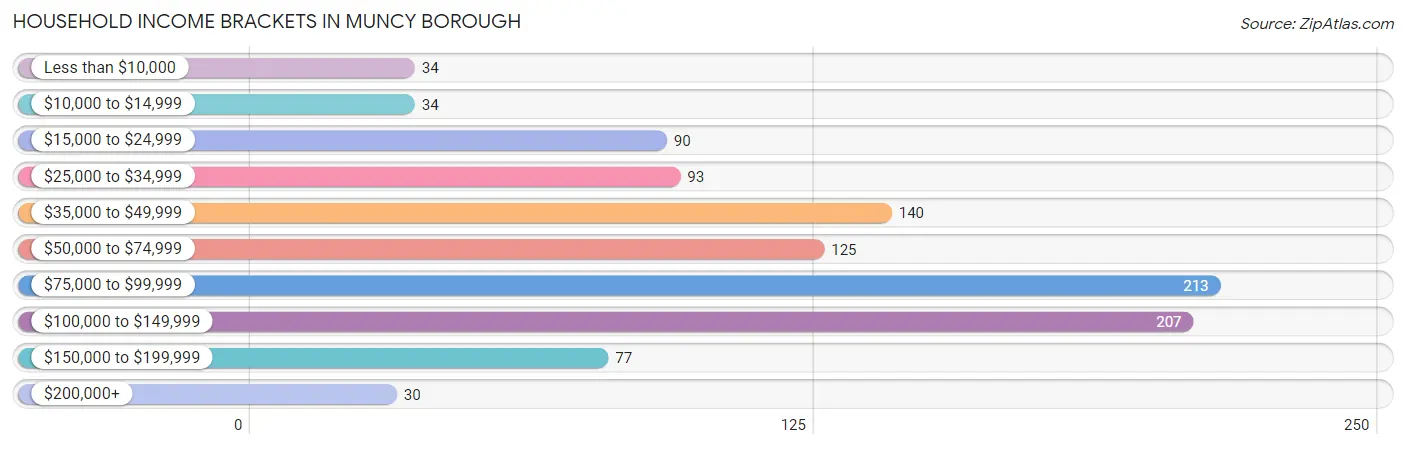
| Income Bracket | # Households | % Households |
| Less than $10,000 | 34 | 3.3% |
| $10,000 to $14,999 | 34 | 3.3% |
| $15,000 to $24,999 | 90 | 8.6% |
| $25,000 to $34,999 | 93 | 8.9% |
| $35,000 to $49,999 | 140 | 13.4% |
| $50,000 to $74,999 | 125 | 12.0% |
| $75,000 to $99,999 | 213 | 20.4% |
| $100,000 to $149,999 | 207 | 19.8% |
| $150,000 to $199,999 | 77 | 7.4% |
| $200,000+ | 30 | 2.9% |
Household Income by Householder Age in Muncy borough
The median household income in Muncy borough is $80,208, with the highest median household income of $91,500 found in the 45 to 64 years age bracket for the primary householder. A total of 348 households (33.4%) fall into this category. Meanwhile, the 65+ years age bracket for the primary householder has the lowest median household income of $43,438, with 327 households (31.4%) in this group.
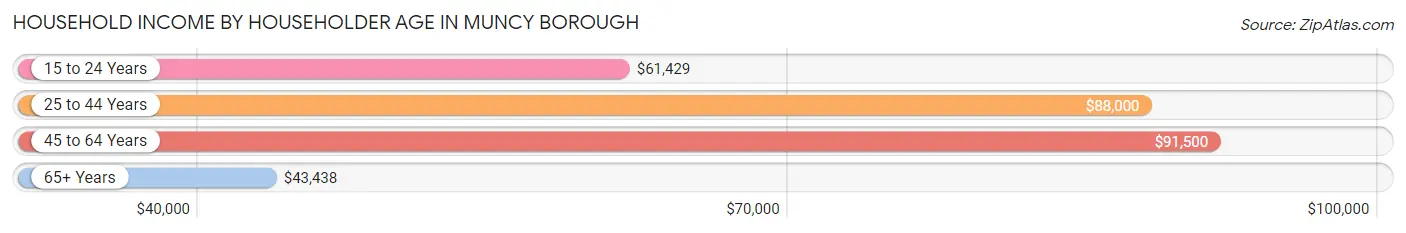
| Income Bracket | # Households | Median Income |
| 15 to 24 Years | 18 (1.7%) | $61,429 |
| 25 to 44 Years | 350 (33.6%) | $88,000 |
| 45 to 64 Years | 348 (33.4%) | $91,500 |
| 65+ Years | 327 (31.4%) | $43,438 |
| Total | 1,043 (100.0%) | $80,208 |
Poverty in Muncy borough
Income Below Poverty by Sex and Age in Muncy borough
With 12.9% poverty level for males and 9.9% for females among the residents of Muncy borough, 5 year old males and 25 to 34 year old females are the most vulnerable to poverty, with 17 males (63.0%) and 51 females (34.0%) in their respective age groups living below the poverty level.
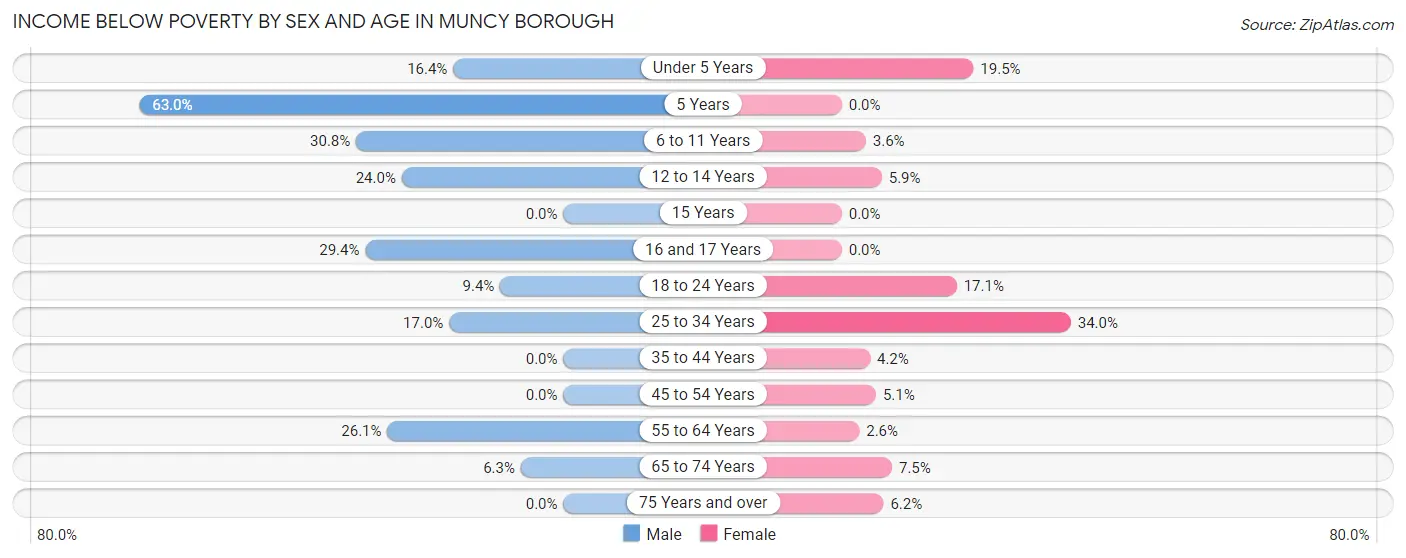
| Age Bracket | Male | Female |
| Under 5 Years | 18 (16.4%) | 17 (19.5%) |
| 5 Years | 17 (63.0%) | 0 (0.0%) |
| 6 to 11 Years | 36 (30.8%) | 5 (3.6%) |
| 12 to 14 Years | 6 (24.0%) | 6 (5.9%) |
| 15 Years | 0 (0.0%) | 0 (0.0%) |
| 16 and 17 Years | 15 (29.4%) | 0 (0.0%) |
| 18 to 24 Years | 6 (9.4%) | 14 (17.1%) |
| 25 to 34 Years | 29 (17.0%) | 51 (34.0%) |
| 35 to 44 Years | 0 (0.0%) | 7 (4.2%) |
| 45 to 54 Years | 0 (0.0%) | 6 (5.1%) |
| 55 to 64 Years | 29 (26.1%) | 4 (2.6%) |
| 65 to 74 Years | 11 (6.3%) | 10 (7.5%) |
| 75 Years and over | 0 (0.0%) | 6 (6.2%) |
| Total | 167 (12.9%) | 126 (9.9%) |
Income Above Poverty by Sex and Age in Muncy borough
According to the poverty statistics in Muncy borough, males aged 15 years and females aged 5 years are the age groups that are most secure financially, with 100.0% of males and 100.0% of females in these age groups living above the poverty line.
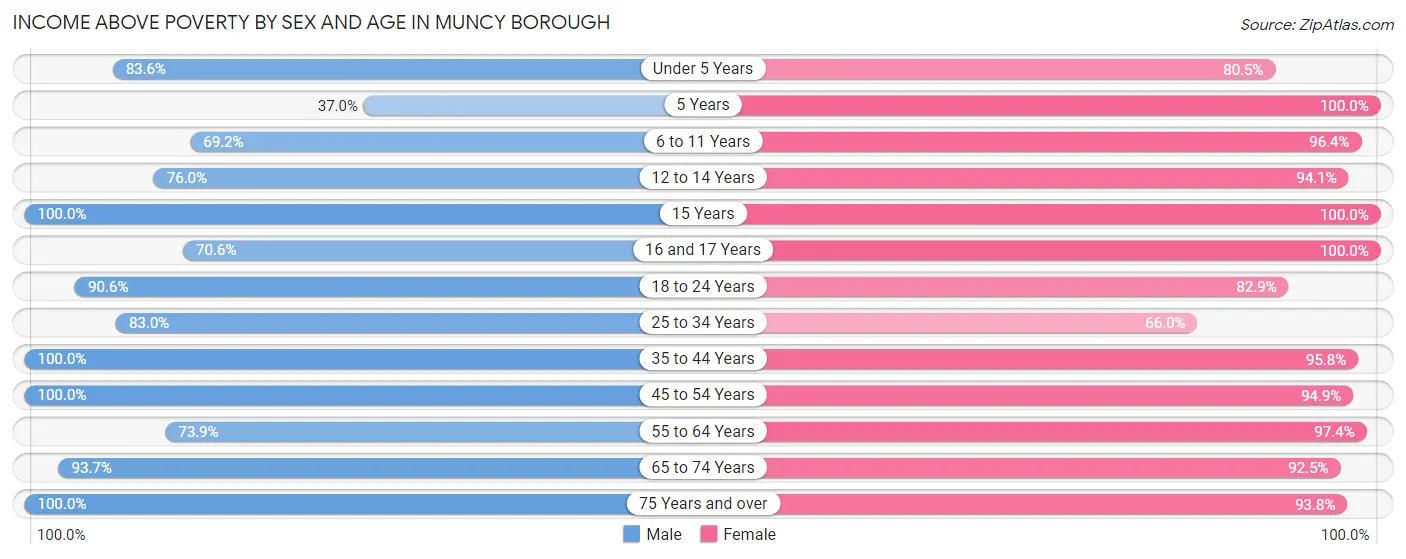
| Age Bracket | Male | Female |
| Under 5 Years | 92 (83.6%) | 70 (80.5%) |
| 5 Years | 10 (37.0%) | 19 (100.0%) |
| 6 to 11 Years | 81 (69.2%) | 135 (96.4%) |
| 12 to 14 Years | 19 (76.0%) | 95 (94.1%) |
| 15 Years | 19 (100.0%) | 5 (100.0%) |
| 16 and 17 Years | 36 (70.6%) | 23 (100.0%) |
| 18 to 24 Years | 58 (90.6%) | 68 (82.9%) |
| 25 to 34 Years | 142 (83.0%) | 99 (66.0%) |
| 35 to 44 Years | 169 (100.0%) | 160 (95.8%) |
| 45 to 54 Years | 182 (100.0%) | 112 (94.9%) |
| 55 to 64 Years | 82 (73.9%) | 150 (97.4%) |
| 65 to 74 Years | 163 (93.7%) | 124 (92.5%) |
| 75 Years and over | 73 (100.0%) | 91 (93.8%) |
| Total | 1,126 (87.1%) | 1,151 (90.1%) |
Income Below Poverty Among Married-Couple Families in Muncy borough
The poverty statistics for married-couple families in Muncy borough show that 5.0% or 31 of the total 617 families live below the poverty line. Families with 1 or 2 children have the highest poverty rate of 10.7%, comprising of 17 families. On the other hand, families with 3 or 4 children have the lowest poverty rate of 0.0%, which includes 0 families.
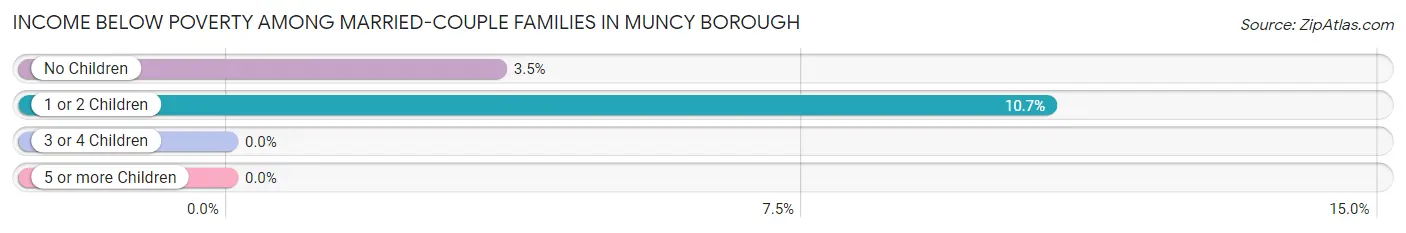
| Children | Above Poverty | Below Poverty |
| No Children | 385 (96.5%) | 14 (3.5%) |
| 1 or 2 Children | 142 (89.3%) | 17 (10.7%) |
| 3 or 4 Children | 59 (100.0%) | 0 (0.0%) |
| 5 or more Children | 0 (0.0%) | 0 (0.0%) |
| Total | 586 (95.0%) | 31 (5.0%) |
Income Below Poverty Among Single-Parent Households in Muncy borough
According to the poverty data in Muncy borough, 6.5% or 4 single-father households and 38.7% or 24 single-mother households are living below the poverty line. Among single-father households, those with 1 or 2 children have the highest poverty rate, with 4 households (7.1%) experiencing poverty. Likewise, among single-mother households, those with 3 or 4 children have the highest poverty rate, with 17 households (77.3%) falling below the poverty line.
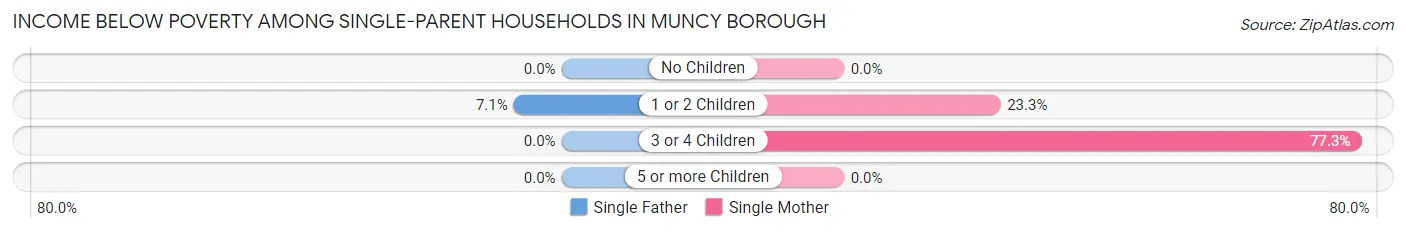
| Children | Single Father | Single Mother |
| No Children | 0 (0.0%) | 0 (0.0%) |
| 1 or 2 Children | 4 (7.1%) | 7 (23.3%) |
| 3 or 4 Children | 0 (0.0%) | 17 (77.3%) |
| 5 or more Children | 0 (0.0%) | 0 (0.0%) |
| Total | 4 (6.5%) | 24 (38.7%) |
Income Below Poverty Among Married-Couple vs Single-Parent Households in Muncy borough
The poverty data for Muncy borough shows that 31 of the married-couple family households (5.0%) and 28 of the single-parent households (22.6%) are living below the poverty level. Within the married-couple family households, those with 1 or 2 children have the highest poverty rate, with 17 households (10.7%) falling below the poverty line. Among the single-parent households, those with 3 or 4 children have the highest poverty rate, with 17 household (77.3%) living below poverty.
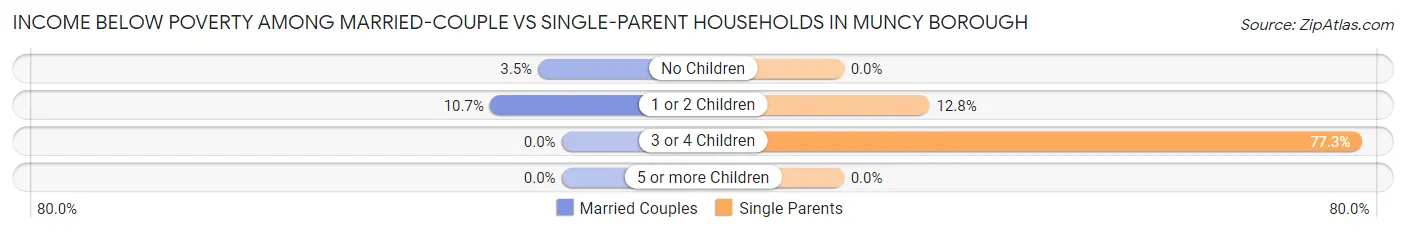
| Children | Married-Couple Families | Single-Parent Households |
| No Children | 14 (3.5%) | 0 (0.0%) |
| 1 or 2 Children | 17 (10.7%) | 11 (12.8%) |
| 3 or 4 Children | 0 (0.0%) | 17 (77.3%) |
| 5 or more Children | 0 (0.0%) | 0 (0.0%) |
| Total | 31 (5.0%) | 28 (22.6%) |
Race in Muncy borough
The most populous races in Muncy borough are White / Caucasian (2,421 | 94.2%), Hispanic or Latino (92 | 3.6%), and Two or more Races (79 | 3.1%).
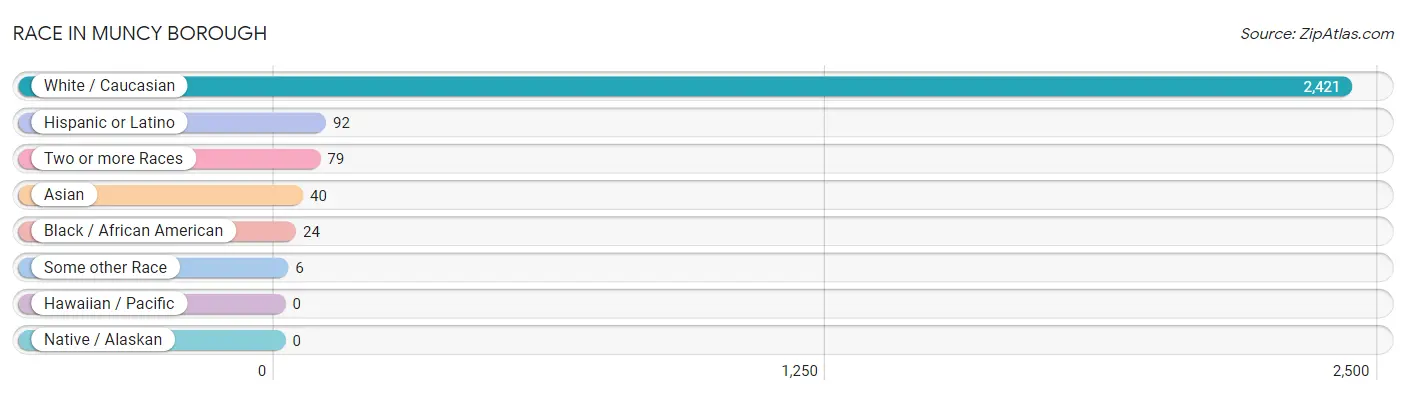
| Race | # Population | % Population |
| Asian | 40 | 1.6% |
| Black / African American | 24 | 0.9% |
| Hawaiian / Pacific | 0 | 0.0% |
| Hispanic or Latino | 92 | 3.6% |
| Native / Alaskan | 0 | 0.0% |
| White / Caucasian | 2,421 | 94.2% |
| Two or more Races | 79 | 3.1% |
| Some other Race | 6 | 0.2% |
| Total | 2,570 | 100.0% |
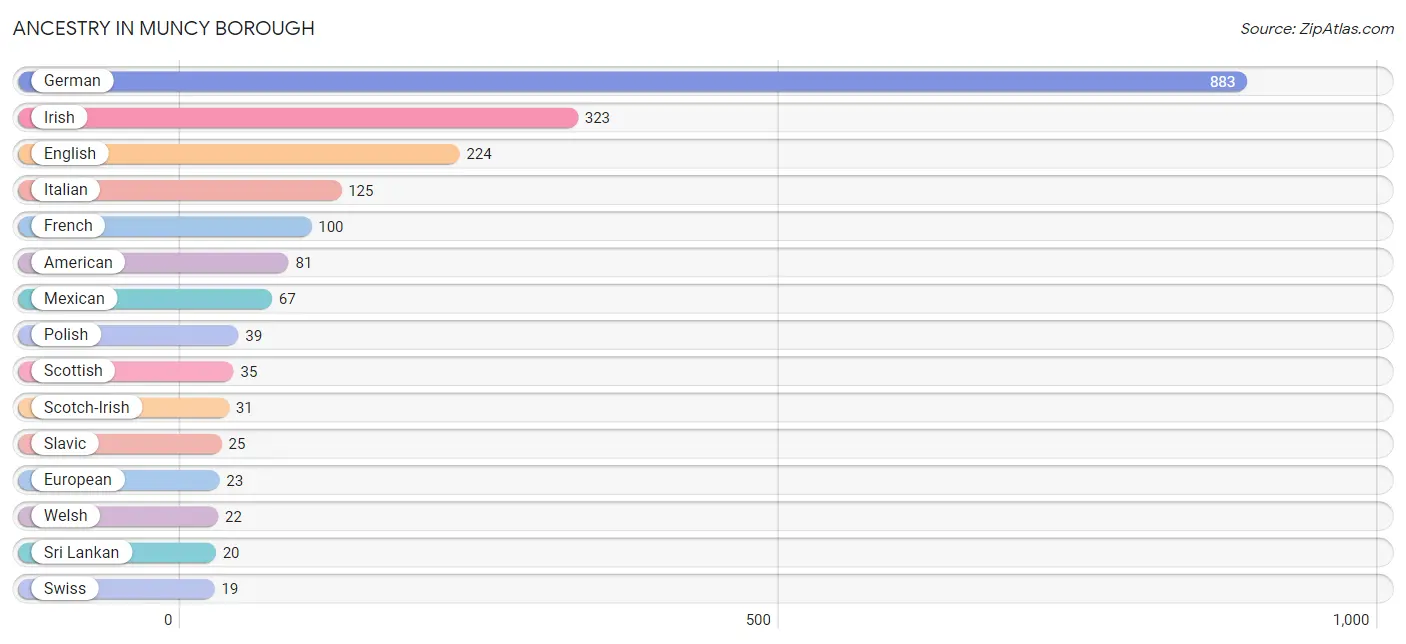
Ancestry in Muncy borough
The most populous ancestries reported in Muncy borough are German (883 | 34.4%), Irish (323 | 12.6%), English (224 | 8.7%), Italian (125 | 4.9%), and French (100 | 3.9%), together accounting for 64.4% of all Muncy borough residents.
| Ancestry | # Population | % Population |
| American | 81 | 3.2% |
| Austrian | 8 | 0.3% |
| British | 14 | 0.5% |
| Cherokee | 5 | 0.2% |
| Colombian | 13 | 0.5% |
| Dutch | 13 | 0.5% |
| Eastern European | 15 | 0.6% |
| English | 224 | 8.7% |
| European | 23 | 0.9% |
| French | 100 | 3.9% |
| German | 883 | 34.4% |
| Hungarian | 12 | 0.5% |
| Irish | 323 | 12.6% |
| Italian | 125 | 4.9% |
| Korean | 14 | 0.5% |
| Lithuanian | 9 | 0.4% |
| Mexican | 67 | 2.6% |
| Norwegian | 5 | 0.2% |
| Pennsylvania German | 8 | 0.3% |
| Polish | 39 | 1.5% |
| Puerto Rican | 9 | 0.4% |
| Scandinavian | 7 | 0.3% |
| Scotch-Irish | 31 | 1.2% |
| Scottish | 35 | 1.4% |
| Slavic | 25 | 1.0% |
| Slovak | 10 | 0.4% |
| South American | 13 | 0.5% |
| Spaniard | 3 | 0.1% |
| Sri Lankan | 20 | 0.8% |
| Swedish | 7 | 0.3% |
| Swiss | 19 | 0.7% |
| Ukrainian | 4 | 0.2% |
| Welsh | 22 | 0.9% | View All 33 Rows |
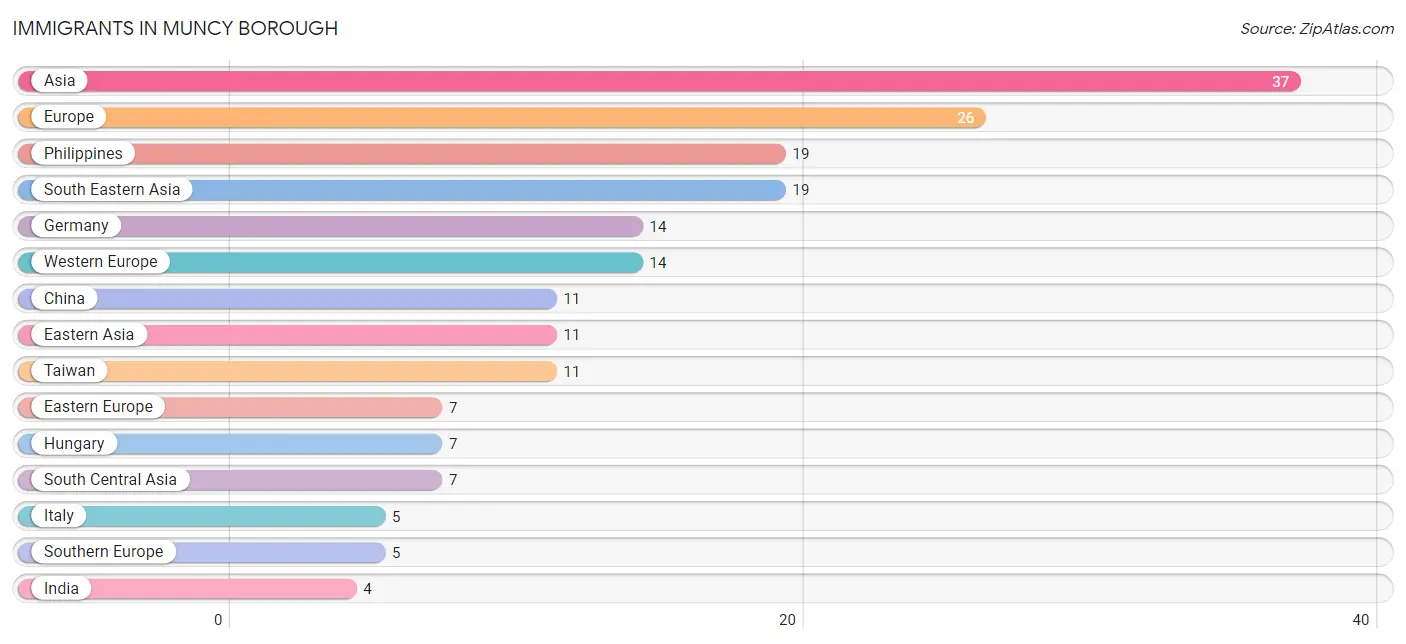
Immigrants in Muncy borough
The most numerous immigrant groups reported in Muncy borough came from Asia (37 | 1.4%), Europe (26 | 1.0%), Philippines (19 | 0.7%), South Eastern Asia (19 | 0.7%), and Germany (14 | 0.5%), together accounting for 4.5% of all Muncy borough residents.
| Immigration Origin | # Population | % Population |
| Asia | 37 | 1.4% |
| China | 11 | 0.4% |
| Eastern Asia | 11 | 0.4% |
| Eastern Europe | 7 | 0.3% |
| Europe | 26 | 1.0% |
| Germany | 14 | 0.5% |
| Hungary | 7 | 0.3% |
| India | 4 | 0.2% |
| Italy | 5 | 0.2% |
| Philippines | 19 | 0.7% |
| South Central Asia | 7 | 0.3% |
| South Eastern Asia | 19 | 0.7% |
| Southern Europe | 5 | 0.2% |
| Taiwan | 11 | 0.4% |
| Western Europe | 14 | 0.5% | View All 15 Rows |
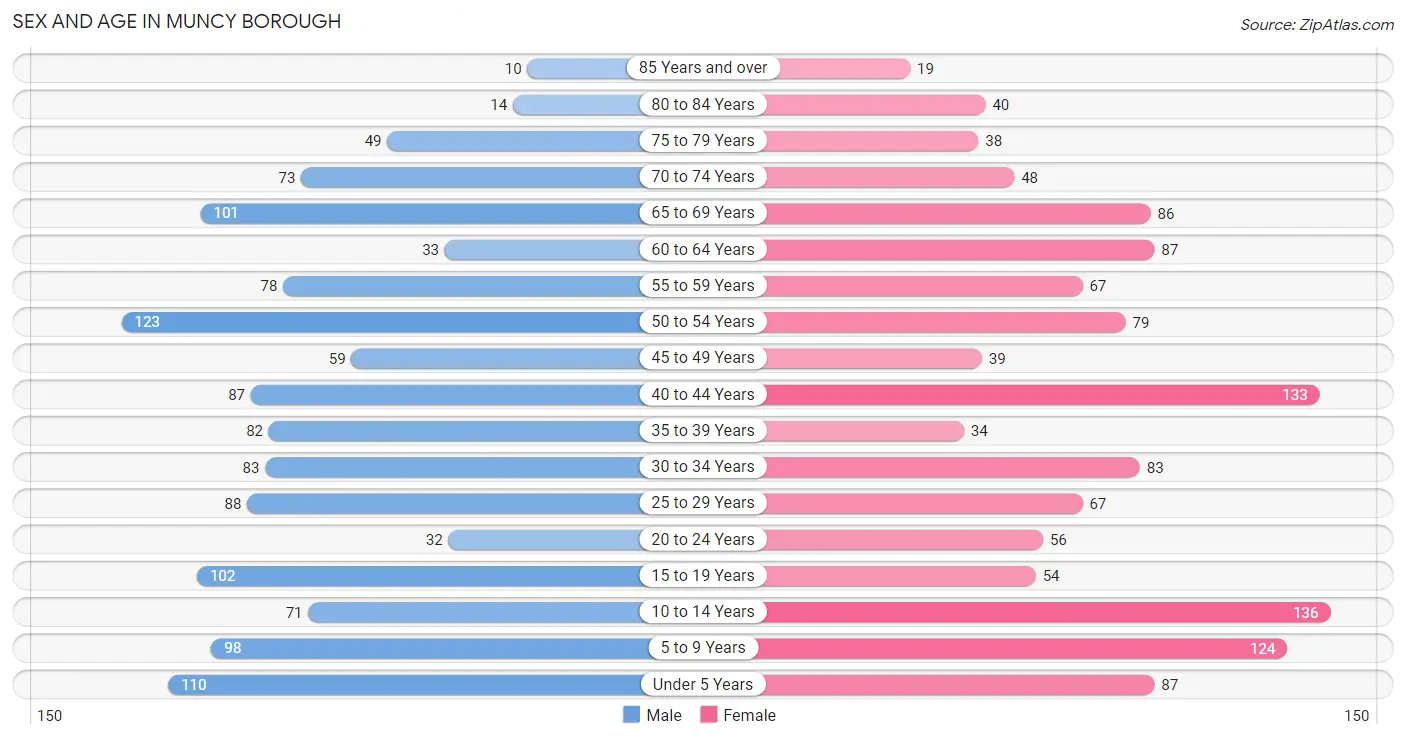
Sex and Age in Muncy borough
Sex and Age in Muncy borough
The most populous age groups in Muncy borough are 50 to 54 Years (123 | 9.5%) for men and 10 to 14 Years (136 | 10.6%) for women.
| Age Bracket | Male | Female |
| Under 5 Years | 110 (8.5%) | 87 (6.8%) |
| 5 to 9 Years | 98 (7.6%) | 124 (9.7%) |
| 10 to 14 Years | 71 (5.5%) | 136 (10.6%) |
| 15 to 19 Years | 102 (7.9%) | 54 (4.2%) |
| 20 to 24 Years | 32 (2.5%) | 56 (4.4%) |
| 25 to 29 Years | 88 (6.8%) | 67 (5.2%) |
| 30 to 34 Years | 83 (6.4%) | 83 (6.5%) |
| 35 to 39 Years | 82 (6.3%) | 34 (2.7%) |
| 40 to 44 Years | 87 (6.7%) | 133 (10.4%) |
| 45 to 49 Years | 59 (4.6%) | 39 (3.0%) |
| 50 to 54 Years | 123 (9.5%) | 79 (6.2%) |
| 55 to 59 Years | 78 (6.0%) | 67 (5.2%) |
| 60 to 64 Years | 33 (2.5%) | 87 (6.8%) |
| 65 to 69 Years | 101 (7.8%) | 86 (6.7%) |
| 70 to 74 Years | 73 (5.7%) | 48 (3.8%) |
| 75 to 79 Years | 49 (3.8%) | 38 (3.0%) |
| 80 to 84 Years | 14 (1.1%) | 40 (3.1%) |
| 85 Years and over | 10 (0.8%) | 19 (1.5%) |
| Total | 1,293 (100.0%) | 1,277 (100.0%) |
Families and Households in Muncy borough
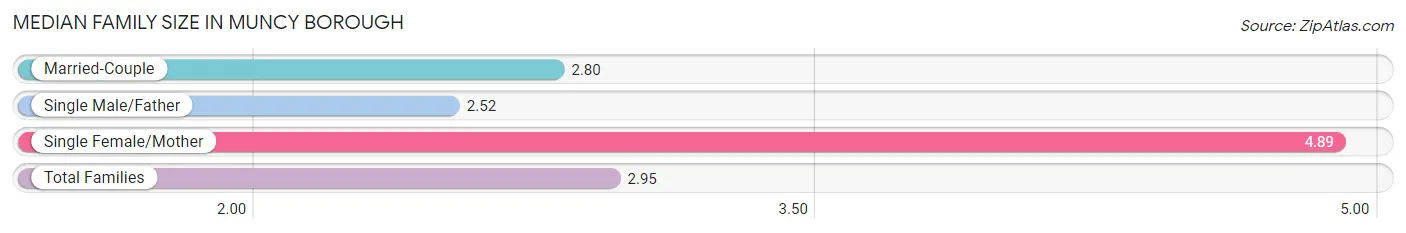
Median Family Size in Muncy borough
The median family size in Muncy borough is 2.95 persons per family, with single female/mother families (62 | 8.4%) accounting for the largest median family size of 4.89 persons per family. On the other hand, single male/father families (62 | 8.4%) represent the smallest median family size with 2.52 persons per family.
| Family Type | # Families | Family Size |
| Married-Couple | 617 (83.3%) | 2.80 |
| Single Male/Father | 62 (8.4%) | 2.52 |
| Single Female/Mother | 62 (8.4%) | 4.89 |
| Total Families | 741 (100.0%) | 2.95 |
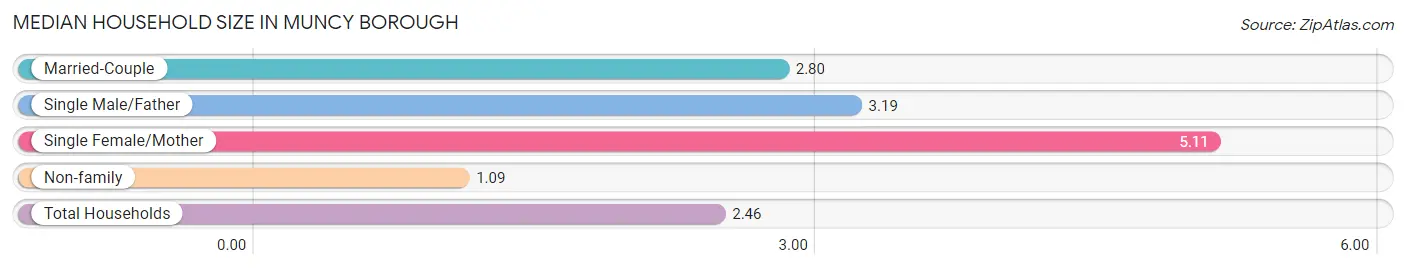
Median Household Size in Muncy borough
The median household size in Muncy borough is 2.46 persons per household, with single female/mother households (62 | 5.9%) accounting for the largest median household size of 5.11 persons per household. non-family households (302 | 28.9%) represent the smallest median household size with 1.09 persons per household.
| Household Type | # Households | Household Size |
| Married-Couple | 617 (59.2%) | 2.80 |
| Single Male/Father | 62 (5.9%) | 3.19 |
| Single Female/Mother | 62 (5.9%) | 5.11 |
| Non-family | 302 (28.9%) | 1.09 |
| Total Households | 1,043 (100.0%) | 2.46 |
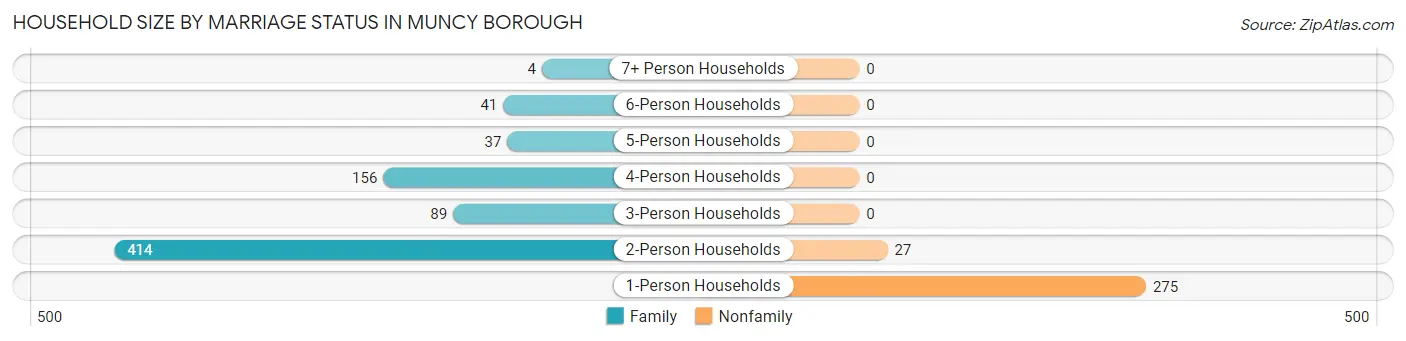
Household Size by Marriage Status in Muncy borough
Out of a total of 1,043 households in Muncy borough, 741 (71.1%) are family households, while 302 (28.9%) are nonfamily households. The most numerous type of family households are 2-person households, comprising 414, and the most common type of nonfamily households are 1-person households, comprising 275.
| Household Size | Family Households | Nonfamily Households |
| 1-Person Households | - | 275 (26.4%) |
| 2-Person Households | 414 (39.7%) | 27 (2.6%) |
| 3-Person Households | 89 (8.5%) | 0 (0.0%) |
| 4-Person Households | 156 (15.0%) | 0 (0.0%) |
| 5-Person Households | 37 (3.5%) | 0 (0.0%) |
| 6-Person Households | 41 (3.9%) | 0 (0.0%) |
| 7+ Person Households | 4 (0.4%) | 0 (0.0%) |
| Total | 741 (71.1%) | 302 (28.9%) |
Female Fertility in Muncy borough
Fertility by Age in Muncy borough
Average fertility rate in Muncy borough is 33.0 births per 1,000 women. Women in the age bracket of 20 to 34 years have the highest fertility rate with 78.0 births per 1,000 women. Women in the age bracket of 20 to 34 years acount for 100.0% of all women with births.
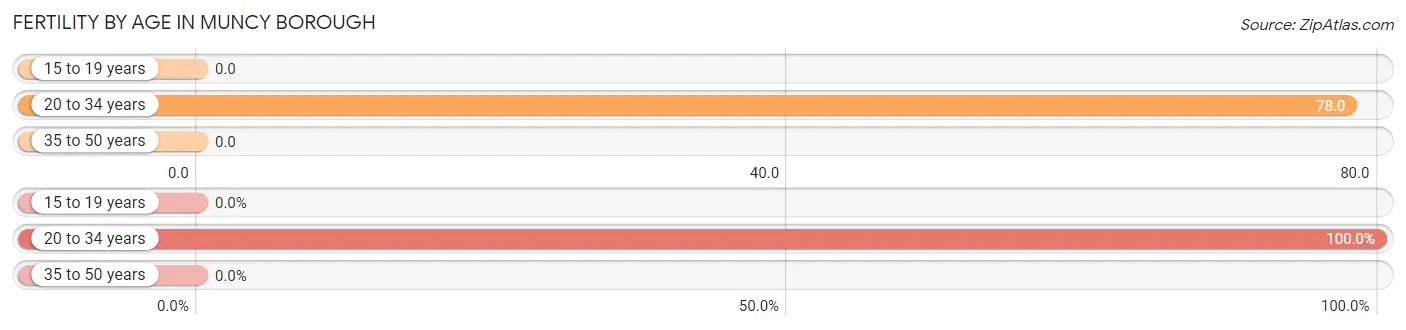
| Age Bracket | Women with Births | Births / 1,000 Women |
| 15 to 19 years | 0 (0.0%) | 0.0 |
| 20 to 34 years | 16 (100.0%) | 78.0 |
| 35 to 50 years | 0 (0.0%) | 0.0 |
| Total | 16 (100.0%) | 33.0 |
Fertility by Age by Marriage Status in Muncy borough
68.8% of women with births (16) in Muncy borough are married. The highest percentage of unmarried women with births falls into 20 to 34 years age bracket with 31.2% of them unmarried at the time of birth, while the lowest percentage of unmarried women with births belong to 20 to 34 years age bracket with 31.2% of them unmarried.
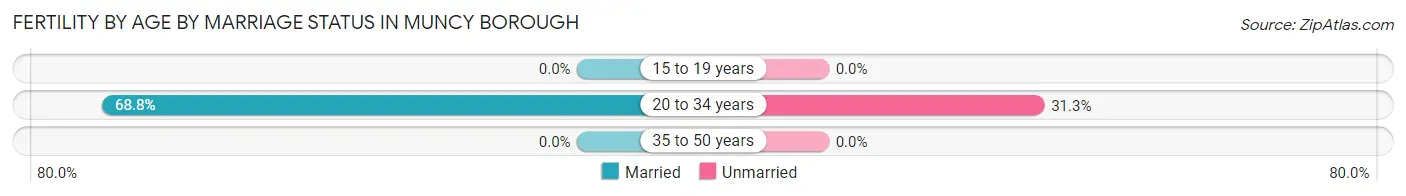
| Age Bracket | Married | Unmarried |
| 15 to 19 years | 0 (0.0%) | 0 (0.0%) |
| 20 to 34 years | 11 (68.8%) | 5 (31.2%) |
| 35 to 50 years | 0 (0.0%) | 0 (0.0%) |
| Total | 11 (68.8%) | 5 (31.2%) |
Fertility by Education in Muncy borough
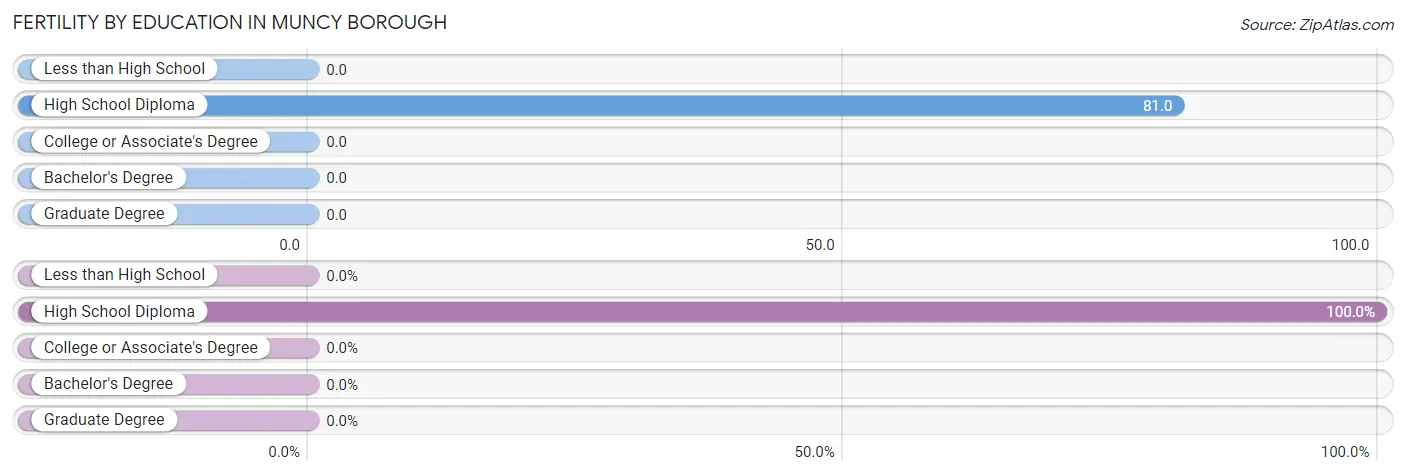
| Educational Attainment | Women with Births | Births / 1,000 Women |
| Less than High School | 0 (0.0%) | 0.0 |
| High School Diploma | 16 (100.0%) | 81.0 |
| College or Associate's Degree | 0 (0.0%) | 0.0 |
| Bachelor's Degree | 0 (0.0%) | 0.0 |
| Graduate Degree | 0 (0.0%) | 0.0 |
| Total | 16 (100.0%) | 33.0 |
Fertility by Education by Marriage Status in Muncy borough
31.2% of women with births in Muncy borough are unmarried. Women with the educational attainment of high school diploma are most likely to be married with 68.8% of them married at childbirth, while women with the educational attainment of high school diploma are least likely to be married with 31.2% of them unmarried at childbirth.
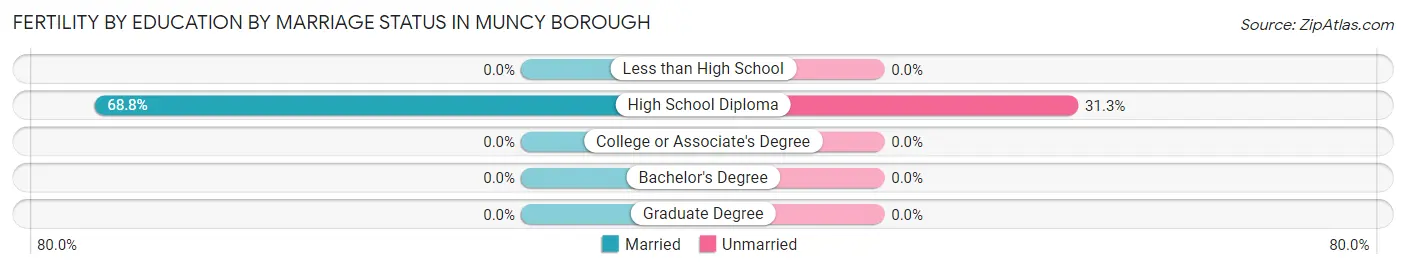
| Educational Attainment | Married | Unmarried |
| Less than High School | 0 (0.0%) | 0 (0.0%) |
| High School Diploma | 11 (68.8%) | 5 (31.2%) |
| College or Associate's Degree | 0 (0.0%) | 0 (0.0%) |
| Bachelor's Degree | 0 (0.0%) | 0 (0.0%) |
| Graduate Degree | 0 (0.0%) | 0 (0.0%) |
| Total | 11 (68.8%) | 5 (31.2%) |
Employment Characteristics in Muncy borough
Employment by Class of Employer in Muncy borough
Among the 1,172 employed individuals in Muncy borough, private company employees (855 | 73.0%), not-for-profit organizations (132 | 11.3%), and local government employees (65 | 5.6%) make up the most common classes of employment.
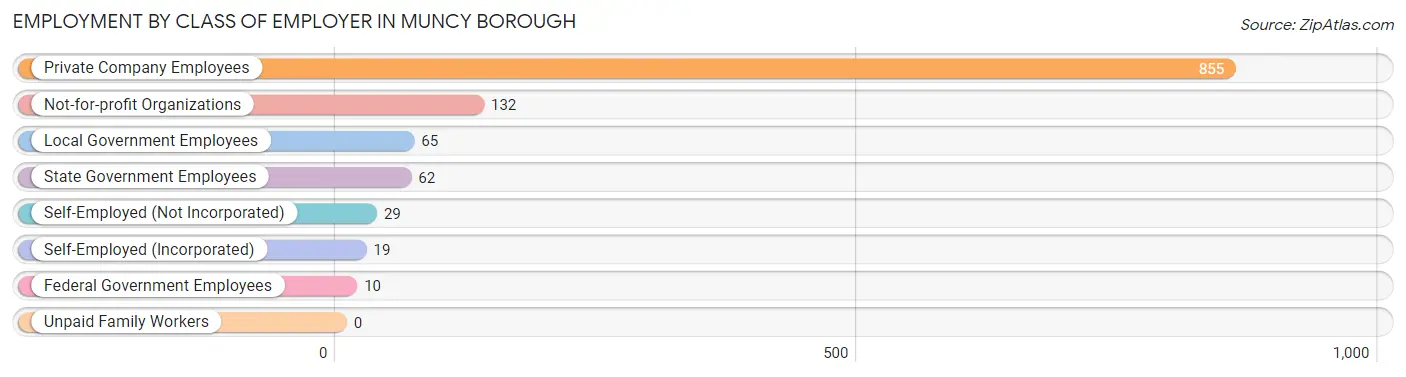
| Employer Class | # Employees | % Employees |
| Private Company Employees | 855 | 73.0% |
| Self-Employed (Incorporated) | 19 | 1.6% |
| Self-Employed (Not Incorporated) | 29 | 2.5% |
| Not-for-profit Organizations | 132 | 11.3% |
| Local Government Employees | 65 | 5.6% |
| State Government Employees | 62 | 5.3% |
| Federal Government Employees | 10 | 0.9% |
| Unpaid Family Workers | 0 | 0.0% |
| Total | 1,172 | 100.0% |
Employment Status by Age in Muncy borough
According to the labor force statistics for Muncy borough, out of the total population over 16 years of age (1,920), 64.3% or 1,235 individuals are in the labor force, with 4.2% or 52 of them unemployed. The age group with the highest labor force participation rate is 25 to 29 years, with 100.0% or 155 individuals in the labor force. Within the labor force, the 16 to 19 years age range has the highest percentage of unemployed individuals, with 19.5% or 15 of them being unemployed.
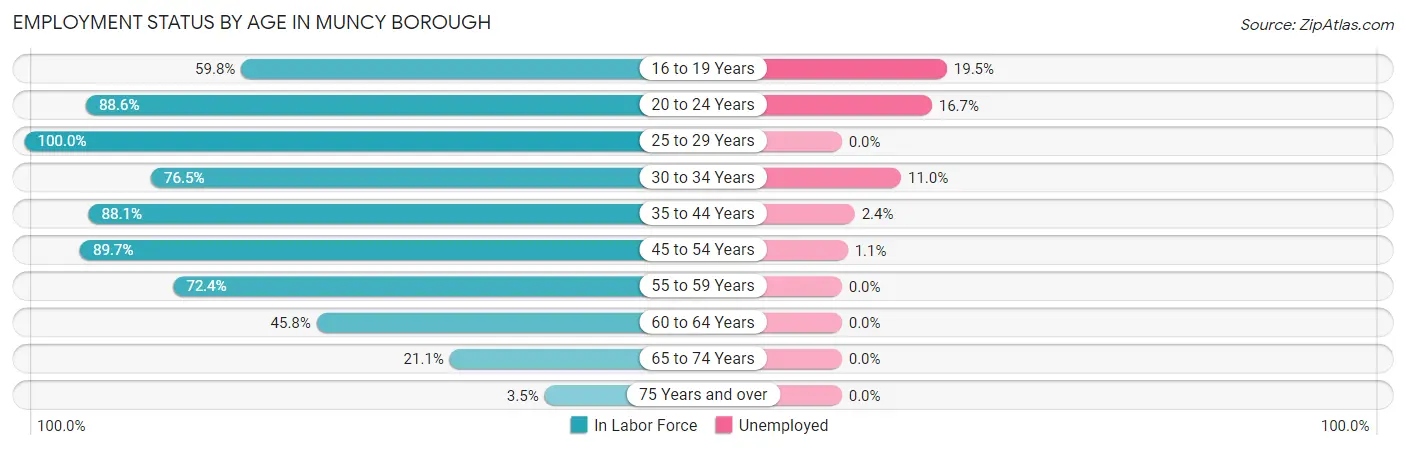
| Age Bracket | In Labor Force | Unemployed |
| 16 to 19 Years | 79 (59.8%) | 15 (19.5%) |
| 20 to 24 Years | 78 (88.6%) | 13 (16.7%) |
| 25 to 29 Years | 155 (100.0%) | 0 (0.0%) |
| 30 to 34 Years | 127 (76.5%) | 14 (11.0%) |
| 35 to 44 Years | 296 (88.1%) | 7 (2.4%) |
| 45 to 54 Years | 269 (89.7%) | 3 (1.1%) |
| 55 to 59 Years | 105 (72.4%) | 0 (0.0%) |
| 60 to 64 Years | 55 (45.8%) | 0 (0.0%) |
| 65 to 74 Years | 65 (21.1%) | 0 (0.0%) |
| 75 Years and over | 6 (3.5%) | 0 (0.0%) |
| Total | 1,235 (64.3%) | 52 (4.2%) |
Employment Status by Educational Attainment in Muncy borough
According to labor force statistics for Muncy borough, 82.4% of individuals (1,007) out of the total population between 25 and 64 years of age (1,222) are in the labor force, with 2.4% or 24 of them being unemployed. The group with the highest labor force participation rate are those with the educational attainment of bachelor's degree or higher, with 86.8% or 276 individuals in the labor force. Within the labor force, individuals with less than high school education have the highest percentage of unemployment, with 14.3% or 7 of them being unemployed.
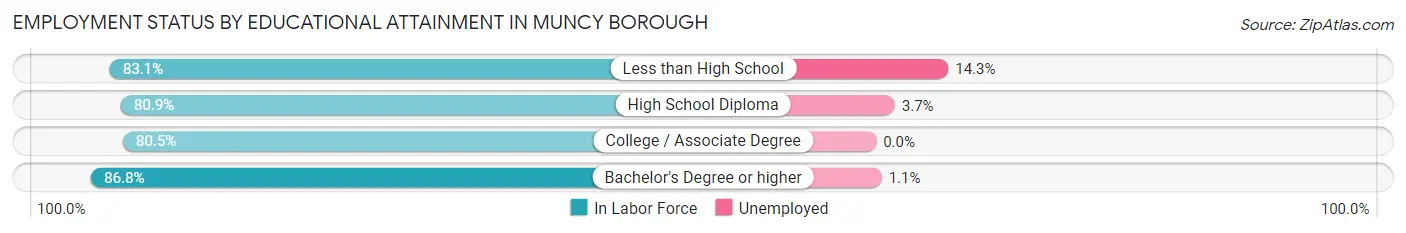
| Educational Attainment | In Labor Force | Unemployed |
| Less than High School | 49 (83.1%) | 8 (14.3%) |
| High School Diploma | 380 (80.9%) | 17 (3.7%) |
| College / Associate Degree | 302 (80.5%) | 0 (0.0%) |
| Bachelor's Degree or higher | 276 (86.8%) | 3 (1.1%) |
| Total | 1,007 (82.4%) | 29 (2.4%) |
Employment Occupations by Sex in Muncy borough
Management, Business, Science and Arts Occupations
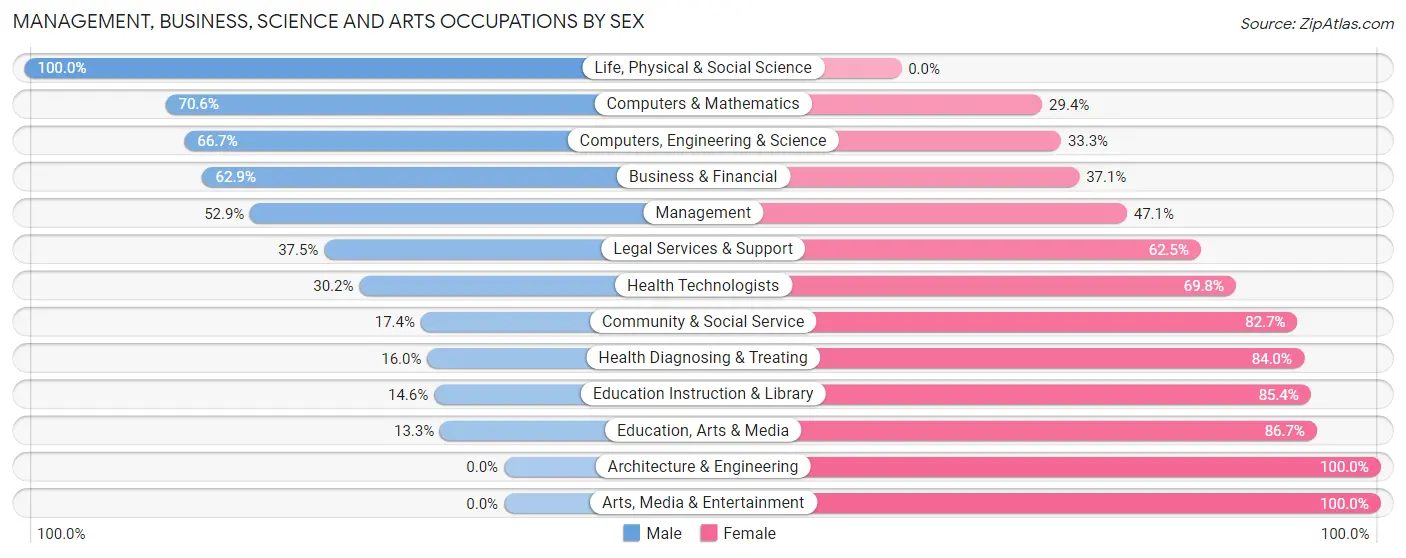
The most common Management, Business, Science and Arts occupations in Muncy borough are Health Diagnosing & Treating (100 | 8.5%), Community & Social Service (98 | 8.3%), Management (85 | 7.2%), Health Technologists (53 | 4.5%), and Education Instruction & Library (48 | 4.1%).
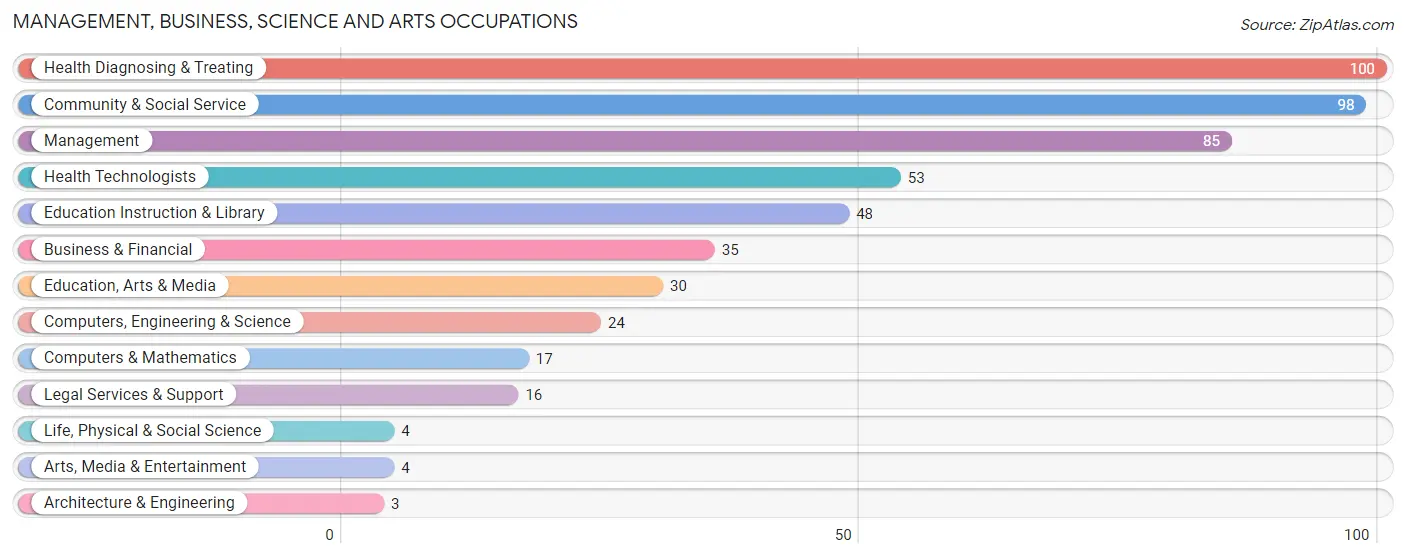
Management, Business, Science and Arts Occupations by Sex
Within the Management, Business, Science and Arts occupations in Muncy borough, the most male-oriented occupations are Life, Physical & Social Science (100.0%), Computers & Mathematics (70.6%), and Computers, Engineering & Science (66.7%), while the most female-oriented occupations are Architecture & Engineering (100.0%), Arts, Media & Entertainment (100.0%), and Education, Arts & Media (86.7%).
| Occupation | Male | Female |
| Management | 45 (52.9%) | 40 (47.1%) |
| Business & Financial | 22 (62.9%) | 13 (37.1%) |
| Computers, Engineering & Science | 16 (66.7%) | 8 (33.3%) |
| Computers & Mathematics | 12 (70.6%) | 5 (29.4%) |
| Architecture & Engineering | 0 (0.0%) | 3 (100.0%) |
| Life, Physical & Social Science | 4 (100.0%) | 0 (0.0%) |
| Community & Social Service | 17 (17.3%) | 81 (82.7%) |
| Education, Arts & Media | 4 (13.3%) | 26 (86.7%) |
| Legal Services & Support | 6 (37.5%) | 10 (62.5%) |
| Education Instruction & Library | 7 (14.6%) | 41 (85.4%) |
| Arts, Media & Entertainment | 0 (0.0%) | 4 (100.0%) |
| Health Diagnosing & Treating | 16 (16.0%) | 84 (84.0%) |
| Health Technologists | 16 (30.2%) | 37 (69.8%) |
| Total (Category) | 116 (33.9%) | 226 (66.1%) |
| Total (Overall) | 647 (54.8%) | 534 (45.2%) |
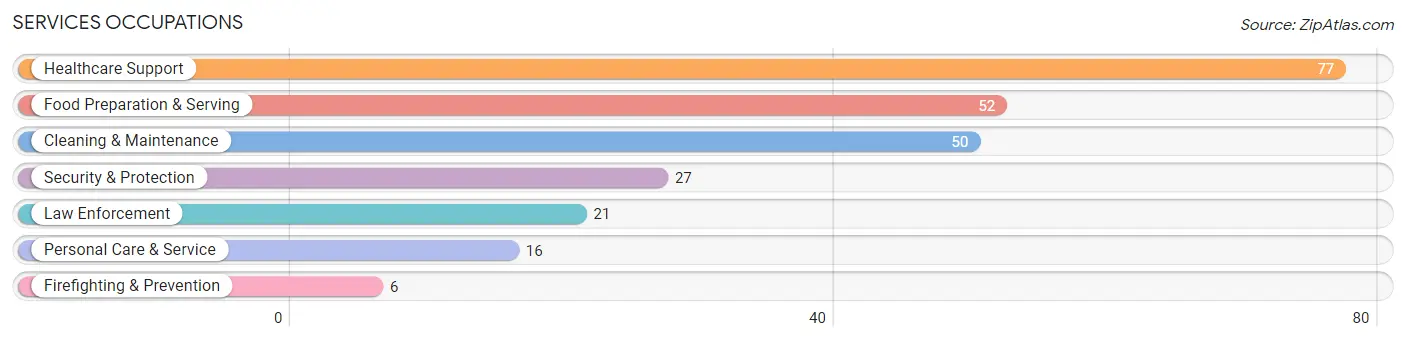
Services Occupations
The most common Services occupations in Muncy borough are Healthcare Support (77 | 6.5%), Food Preparation & Serving (52 | 4.4%), Cleaning & Maintenance (50 | 4.2%), Security & Protection (27 | 2.3%), and Law Enforcement (21 | 1.8%).
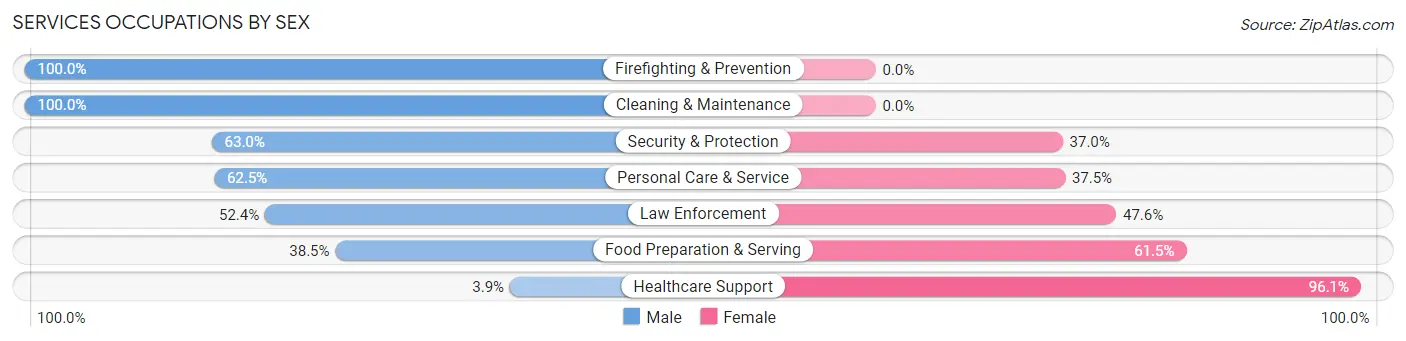
Services Occupations by Sex
Within the Services occupations in Muncy borough, the most male-oriented occupations are Firefighting & Prevention (100.0%), Cleaning & Maintenance (100.0%), and Security & Protection (63.0%), while the most female-oriented occupations are Healthcare Support (96.1%), Food Preparation & Serving (61.5%), and Law Enforcement (47.6%).
| Occupation | Male | Female |
| Healthcare Support | 3 (3.9%) | 74 (96.1%) |
| Security & Protection | 17 (63.0%) | 10 (37.0%) |
| Firefighting & Prevention | 6 (100.0%) | 0 (0.0%) |
| Law Enforcement | 11 (52.4%) | 10 (47.6%) |
| Food Preparation & Serving | 20 (38.5%) | 32 (61.5%) |
| Cleaning & Maintenance | 50 (100.0%) | 0 (0.0%) |
| Personal Care & Service | 10 (62.5%) | 6 (37.5%) |
| Total (Category) | 100 (45.1%) | 122 (54.9%) |
| Total (Overall) | 647 (54.8%) | 534 (45.2%) |
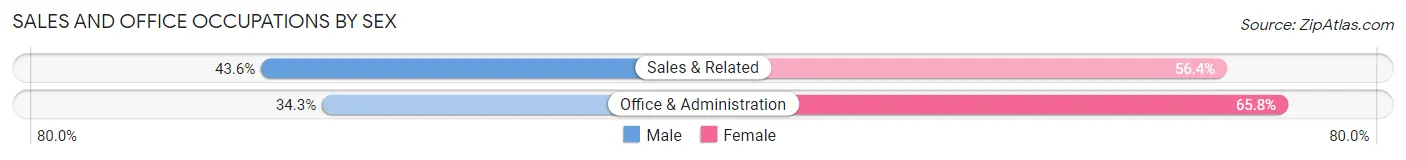
Sales and Office Occupations
The most common Sales and Office occupations in Muncy borough are Sales & Related (149 | 12.6%), and Office & Administration (146 | 12.4%).

Sales and Office Occupations by Sex
| Occupation | Male | Female |
| Sales & Related | 65 (43.6%) | 84 (56.4%) |
| Office & Administration | 50 (34.3%) | 96 (65.7%) |
| Total (Category) | 115 (39.0%) | 180 (61.0%) |
| Total (Overall) | 647 (54.8%) | 534 (45.2%) |
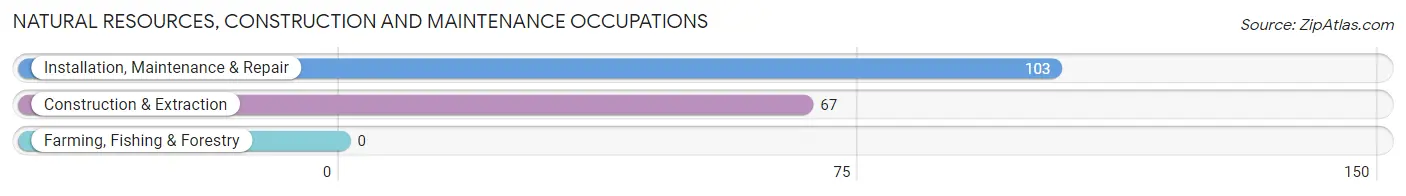
Natural Resources, Construction and Maintenance Occupations
The most common Natural Resources, Construction and Maintenance occupations in Muncy borough are Installation, Maintenance & Repair (103 | 8.7%), and Construction & Extraction (67 | 5.7%).
Natural Resources, Construction and Maintenance Occupations by Sex
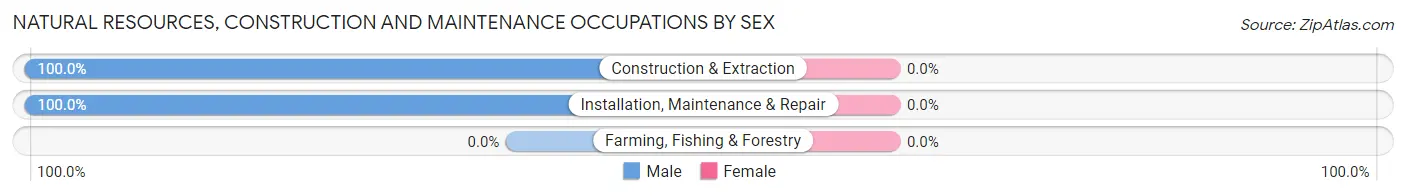
| Occupation | Male | Female |
| Farming, Fishing & Forestry | 0 (0.0%) | 0 (0.0%) |
| Construction & Extraction | 67 (100.0%) | 0 (0.0%) |
| Installation, Maintenance & Repair | 103 (100.0%) | 0 (0.0%) |
| Total (Category) | 170 (100.0%) | 0 (0.0%) |
| Total (Overall) | 647 (54.8%) | 534 (45.2%) |
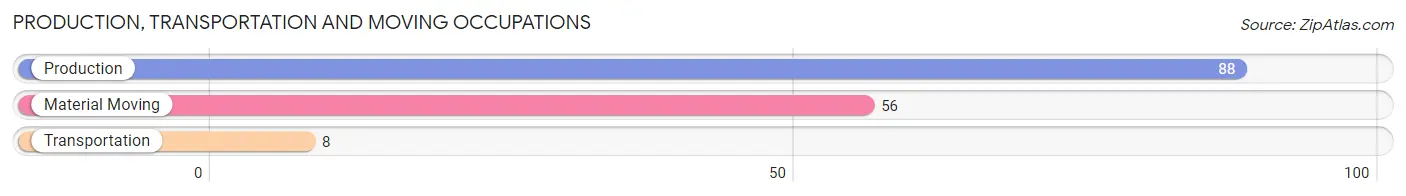
Production, Transportation and Moving Occupations
The most common Production, Transportation and Moving occupations in Muncy borough are Production (88 | 7.4%), Material Moving (56 | 4.7%), and Transportation (8 | 0.7%).
Production, Transportation and Moving Occupations by Sex
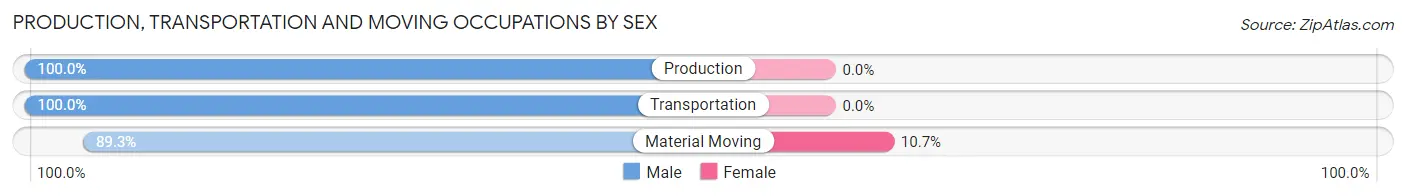
| Occupation | Male | Female |
| Production | 88 (100.0%) | 0 (0.0%) |
| Transportation | 8 (100.0%) | 0 (0.0%) |
| Material Moving | 50 (89.3%) | 6 (10.7%) |
| Total (Category) | 146 (96.1%) | 6 (4.0%) |
| Total (Overall) | 647 (54.8%) | 534 (45.2%) |
Employment Industries by Sex in Muncy borough
Employment Industries in Muncy borough
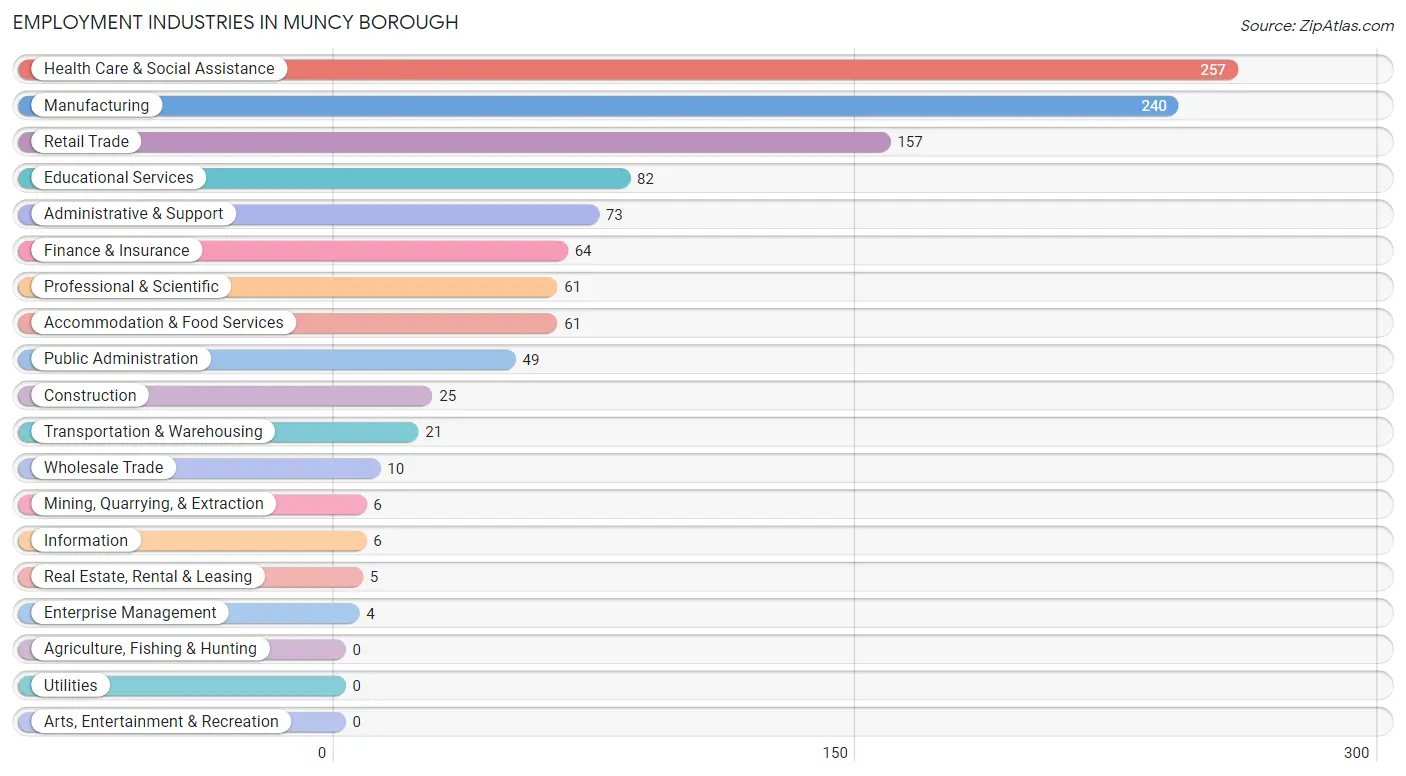
The major employment industries in Muncy borough include Health Care & Social Assistance (257 | 21.8%), Manufacturing (240 | 20.3%), Retail Trade (157 | 13.3%), Educational Services (82 | 6.9%), and Administrative & Support (73 | 6.2%).
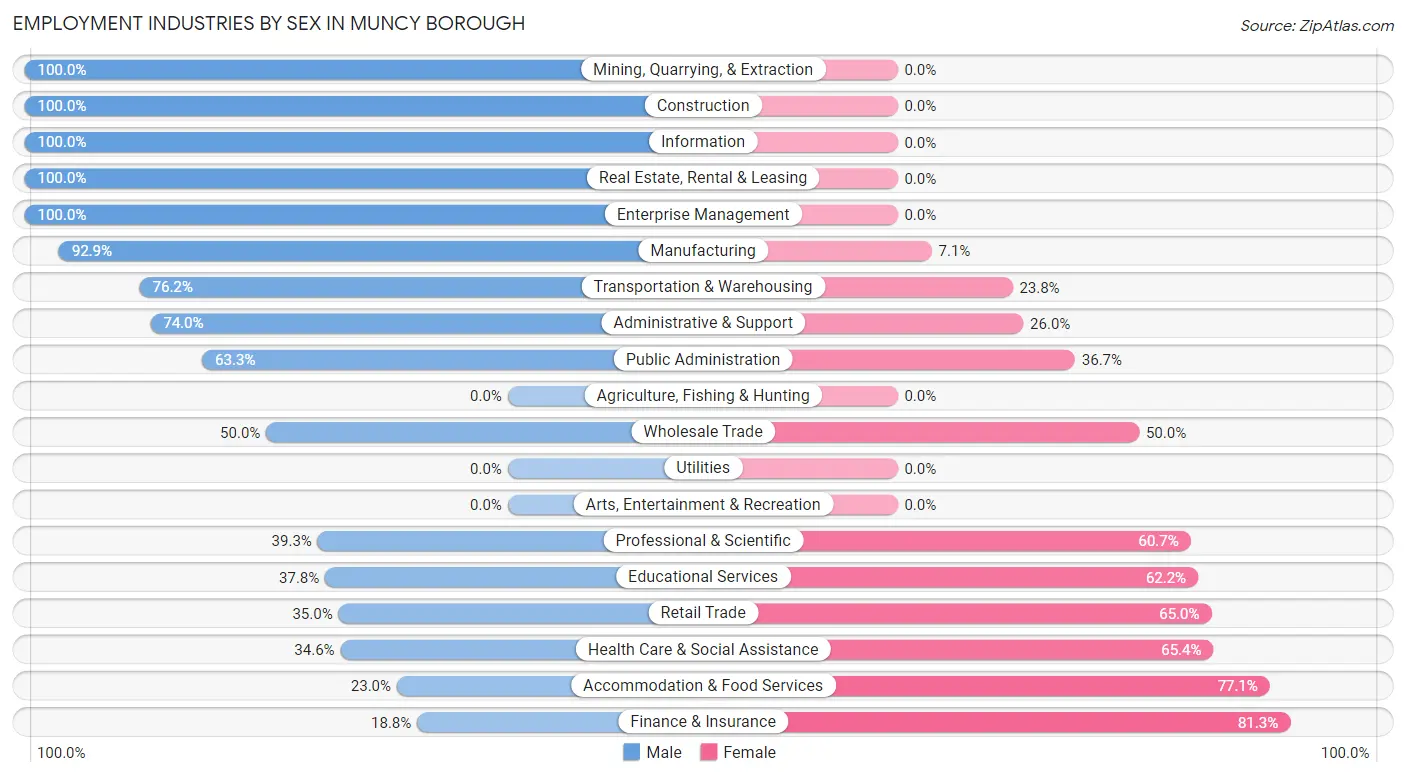
Employment Industries by Sex in Muncy borough
The Muncy borough industries that see more men than women are Mining, Quarrying, & Extraction (100.0%), Construction (100.0%), and Information (100.0%), whereas the industries that tend to have a higher number of women are Finance & Insurance (81.2%), Accommodation & Food Services (77.0%), and Health Care & Social Assistance (65.4%).
| Industry | Male | Female |
| Agriculture, Fishing & Hunting | 0 (0.0%) | 0 (0.0%) |
| Mining, Quarrying, & Extraction | 6 (100.0%) | 0 (0.0%) |
| Construction | 25 (100.0%) | 0 (0.0%) |
| Manufacturing | 223 (92.9%) | 17 (7.1%) |
| Wholesale Trade | 5 (50.0%) | 5 (50.0%) |
| Retail Trade | 55 (35.0%) | 102 (65.0%) |
| Transportation & Warehousing | 16 (76.2%) | 5 (23.8%) |
| Utilities | 0 (0.0%) | 0 (0.0%) |
| Information | 6 (100.0%) | 0 (0.0%) |
| Finance & Insurance | 12 (18.8%) | 52 (81.2%) |
| Real Estate, Rental & Leasing | 5 (100.0%) | 0 (0.0%) |
| Professional & Scientific | 24 (39.3%) | 37 (60.7%) |
| Enterprise Management | 4 (100.0%) | 0 (0.0%) |
| Administrative & Support | 54 (74.0%) | 19 (26.0%) |
| Educational Services | 31 (37.8%) | 51 (62.2%) |
| Health Care & Social Assistance | 89 (34.6%) | 168 (65.4%) |
| Arts, Entertainment & Recreation | 0 (0.0%) | 0 (0.0%) |
| Accommodation & Food Services | 14 (23.0%) | 47 (77.0%) |
| Public Administration | 31 (63.3%) | 18 (36.7%) |
| Total | 647 (54.8%) | 534 (45.2%) |
Education in Muncy borough
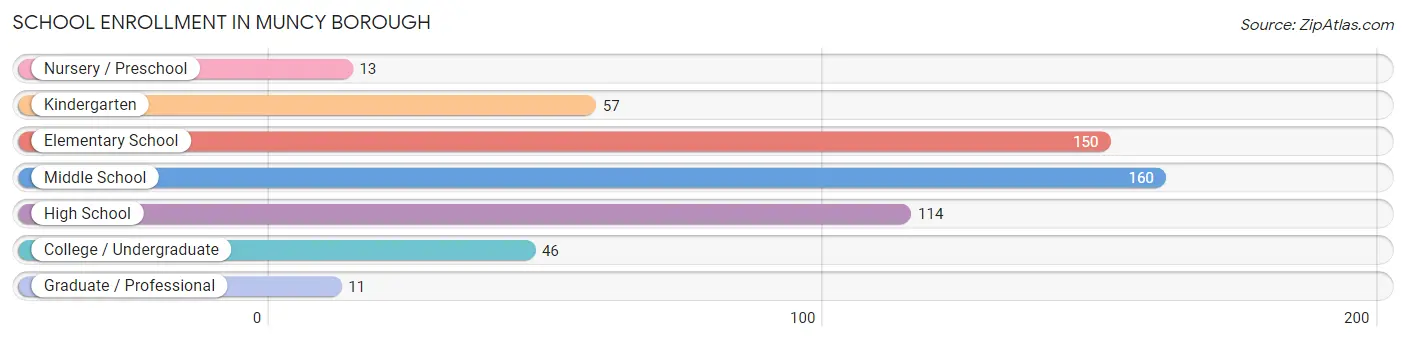
School Enrollment in Muncy borough
The most common levels of schooling among the 551 students in Muncy borough are middle school (160 | 29.0%), elementary school (150 | 27.2%), and high school (114 | 20.7%).
| School Level | # Students | % Students |
| Nursery / Preschool | 13 | 2.4% |
| Kindergarten | 57 | 10.3% |
| Elementary School | 150 | 27.2% |
| Middle School | 160 | 29.0% |
| High School | 114 | 20.7% |
| College / Undergraduate | 46 | 8.4% |
| Graduate / Professional | 11 | 2.0% |
| Total | 551 | 100.0% |
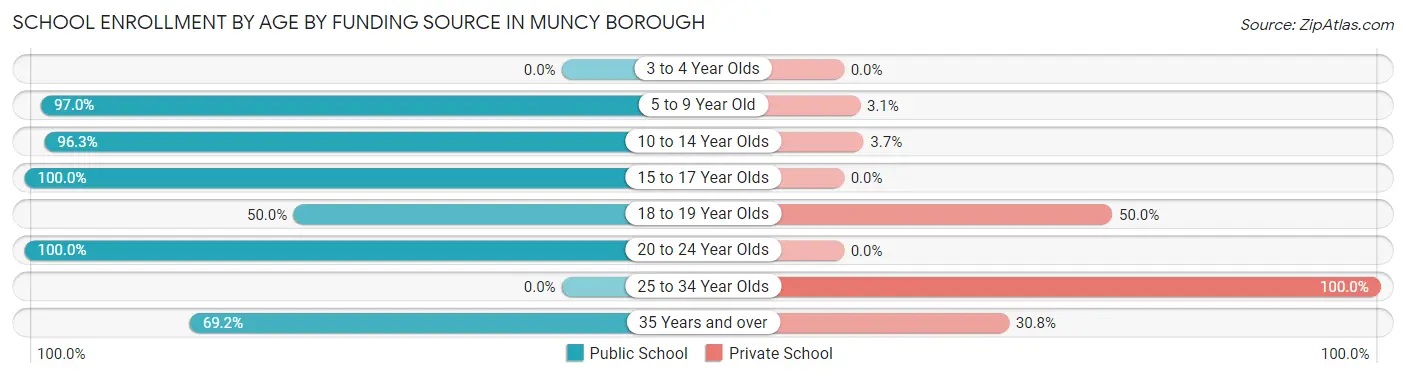
School Enrollment by Age by Funding Source in Muncy borough
Out of a total of 551 students who are enrolled in schools in Muncy borough, 31 (5.6%) attend a private institution, while the remaining 520 (94.4%) are enrolled in public schools. The age group of 25 to 34 year olds has the highest likelihood of being enrolled in private schools, with 7 (100.0% in the age bracket) enrolled. Conversely, the age group of 15 to 17 year olds has the lowest likelihood of being enrolled in a private school, with 98 (100.0% in the age bracket) attending a public institution.
| Age Bracket | Public School | Private School |
| 3 to 4 Year Olds | 0 (0.0%) | 0 (0.0%) |
| 5 to 9 Year Old | 191 (97.0%) | 6 (3.0%) |
| 10 to 14 Year Olds | 183 (96.3%) | 7 (3.7%) |
| 15 to 17 Year Olds | 98 (100.0%) | 0 (0.0%) |
| 18 to 19 Year Olds | 7 (50.0%) | 7 (50.0%) |
| 20 to 24 Year Olds | 32 (100.0%) | 0 (0.0%) |
| 25 to 34 Year Olds | 0 (0.0%) | 7 (100.0%) |
| 35 Years and over | 9 (69.2%) | 4 (30.8%) |
| Total | 520 (94.4%) | 31 (5.6%) |
Educational Attainment by Field of Study in Muncy borough
Education (84 | 14.6%), business (79 | 13.7%), visual & performing arts (68 | 11.8%), science & technology (65 | 11.3%), and social sciences (57 | 9.9%) are the most common fields of study among 576 individuals in Muncy borough who have obtained a bachelor's degree or higher.
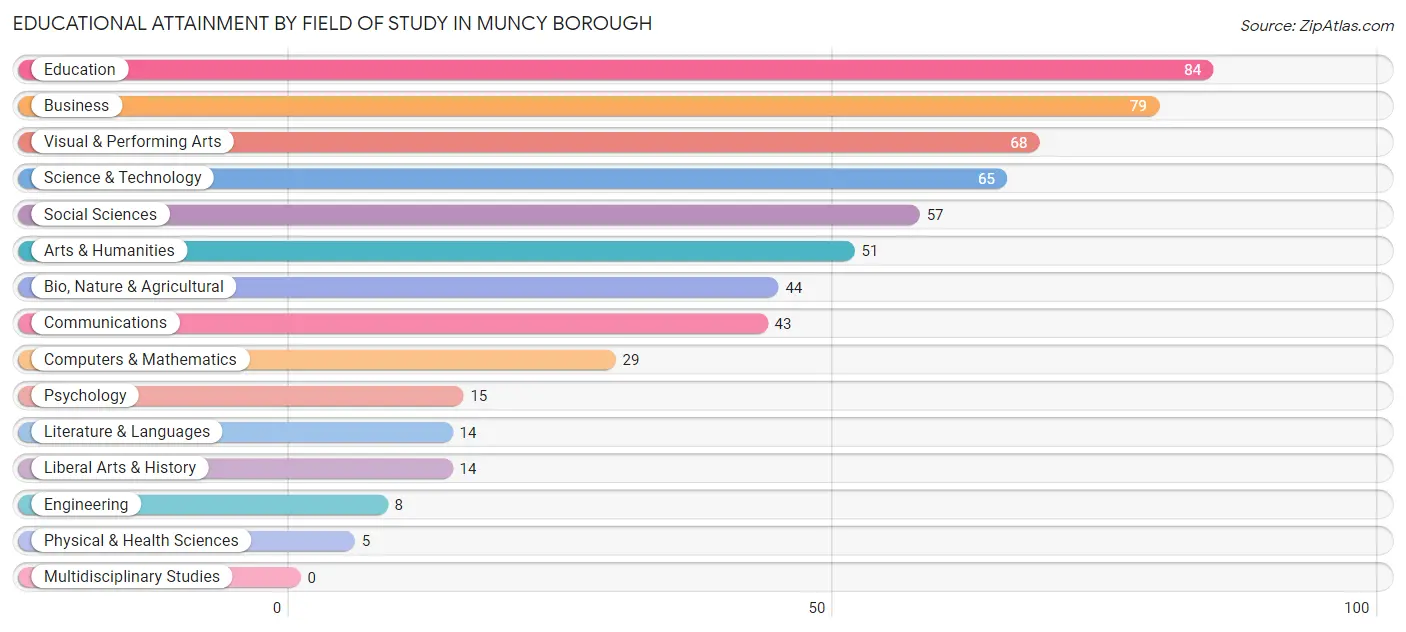
| Field of Study | # Graduates | % Graduates |
| Computers & Mathematics | 29 | 5.0% |
| Bio, Nature & Agricultural | 44 | 7.6% |
| Physical & Health Sciences | 5 | 0.9% |
| Psychology | 15 | 2.6% |
| Social Sciences | 57 | 9.9% |
| Engineering | 8 | 1.4% |
| Multidisciplinary Studies | 0 | 0.0% |
| Science & Technology | 65 | 11.3% |
| Business | 79 | 13.7% |
| Education | 84 | 14.6% |
| Literature & Languages | 14 | 2.4% |
| Liberal Arts & History | 14 | 2.4% |
| Visual & Performing Arts | 68 | 11.8% |
| Communications | 43 | 7.5% |
| Arts & Humanities | 51 | 8.8% |
| Total | 576 | 100.0% |
Transportation & Commute in Muncy borough
Vehicle Availability by Sex in Muncy borough
The most prevalent vehicle ownership categories in Muncy borough are males with 2 vehicles (317, accounting for 49.7%) and females with 2 vehicles (257, making up 59.4%).
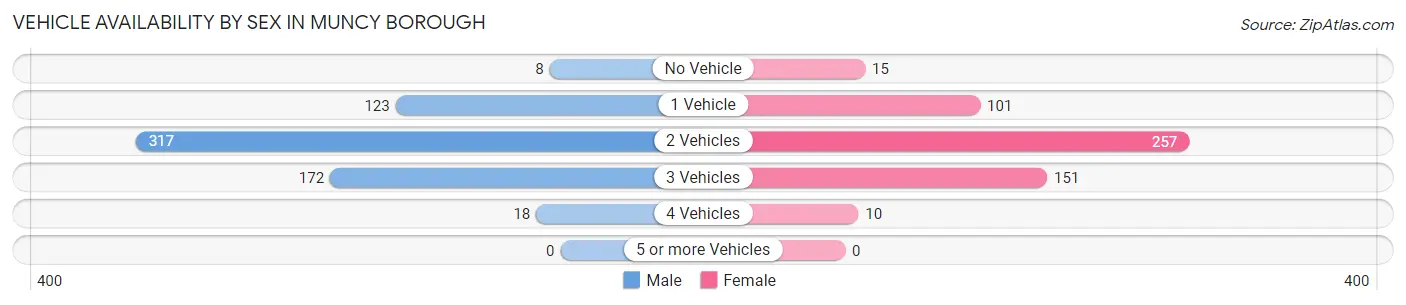
| Vehicles Available | Male | Female |
| No Vehicle | 8 (1.3%) | 15 (2.8%) |
| 1 Vehicle | 123 (19.3%) | 101 (18.9%) |
| 2 Vehicles | 317 (49.7%) | 257 (48.1%) |
| 3 Vehicles | 172 (27.0%) | 151 (28.3%) |
| 4 Vehicles | 18 (2.8%) | 10 (1.9%) |
| 5 or more Vehicles | 0 (0.0%) | 0 (0.0%) |
| Total | 638 (100.0%) | 534 (100.0%) |
Commute Time in Muncy borough
The most frequently occuring commute durations in Muncy borough are 15 to 19 minutes (190 commuters, 17.1%), 5 to 9 minutes (181 commuters, 16.3%), and 20 to 24 minutes (169 commuters, 15.2%).
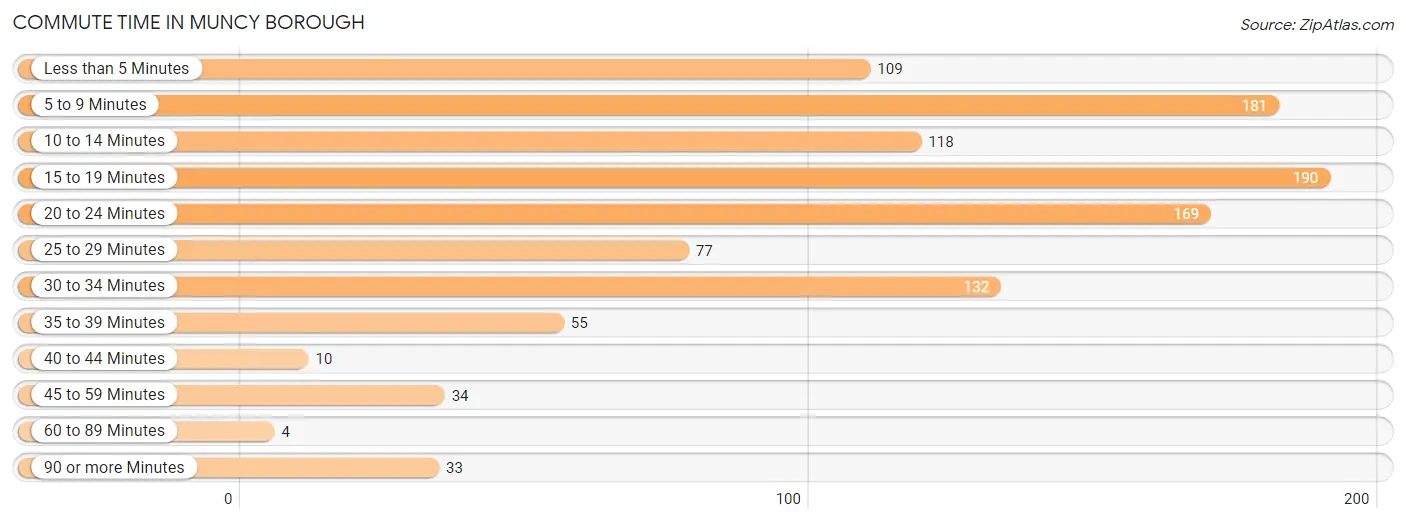
| Commute Time | # Commuters | % Commuters |
| Less than 5 Minutes | 109 | 9.8% |
| 5 to 9 Minutes | 181 | 16.3% |
| 10 to 14 Minutes | 118 | 10.6% |
| 15 to 19 Minutes | 190 | 17.1% |
| 20 to 24 Minutes | 169 | 15.2% |
| 25 to 29 Minutes | 77 | 6.9% |
| 30 to 34 Minutes | 132 | 11.9% |
| 35 to 39 Minutes | 55 | 5.0% |
| 40 to 44 Minutes | 10 | 0.9% |
| 45 to 59 Minutes | 34 | 3.1% |
| 60 to 89 Minutes | 4 | 0.4% |
| 90 or more Minutes | 33 | 3.0% |
Commute Time by Sex in Muncy borough
The most common commute times in Muncy borough are 5 to 9 minutes (96 commuters, 15.9%) for males and 15 to 19 minutes (98 commuters, 19.3%) for females.
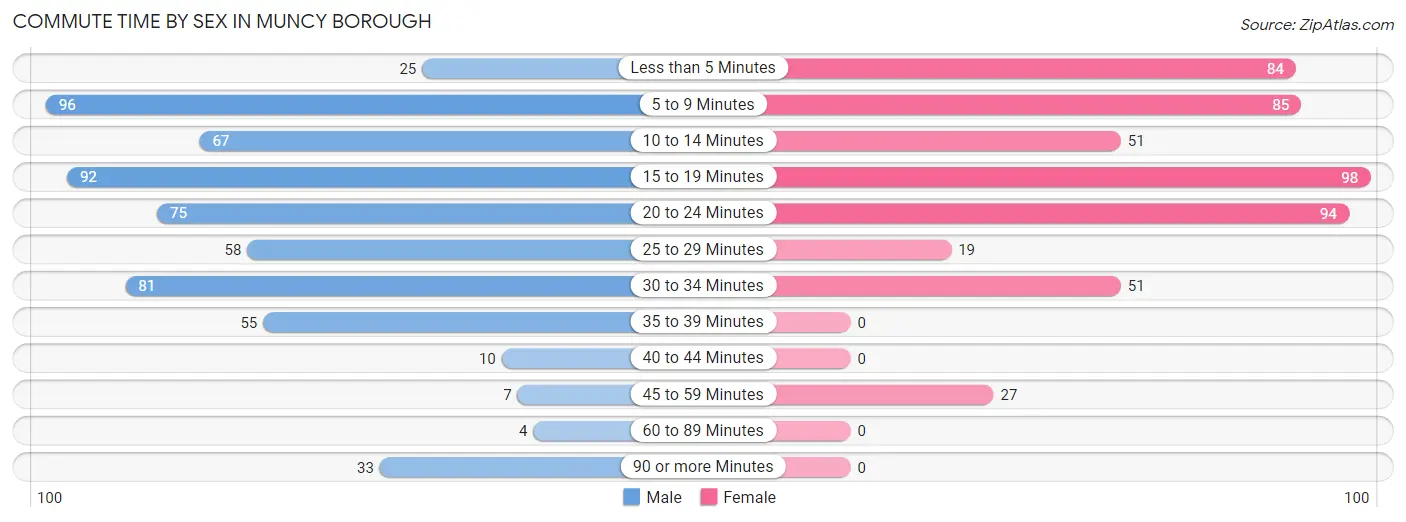
| Commute Time | Male | Female |
| Less than 5 Minutes | 25 (4.2%) | 84 (16.5%) |
| 5 to 9 Minutes | 96 (15.9%) | 85 (16.7%) |
| 10 to 14 Minutes | 67 (11.1%) | 51 (10.0%) |
| 15 to 19 Minutes | 92 (15.3%) | 98 (19.3%) |
| 20 to 24 Minutes | 75 (12.4%) | 94 (18.5%) |
| 25 to 29 Minutes | 58 (9.6%) | 19 (3.7%) |
| 30 to 34 Minutes | 81 (13.4%) | 51 (10.0%) |
| 35 to 39 Minutes | 55 (9.1%) | 0 (0.0%) |
| 40 to 44 Minutes | 10 (1.7%) | 0 (0.0%) |
| 45 to 59 Minutes | 7 (1.2%) | 27 (5.3%) |
| 60 to 89 Minutes | 4 (0.7%) | 0 (0.0%) |
| 90 or more Minutes | 33 (5.5%) | 0 (0.0%) |
Time of Departure to Work by Sex in Muncy borough
The most frequent times of departure to work in Muncy borough are 6:00 AM to 6:29 AM (148, 24.5%) for males and 7:30 AM to 7:59 AM (85, 16.7%) for females.
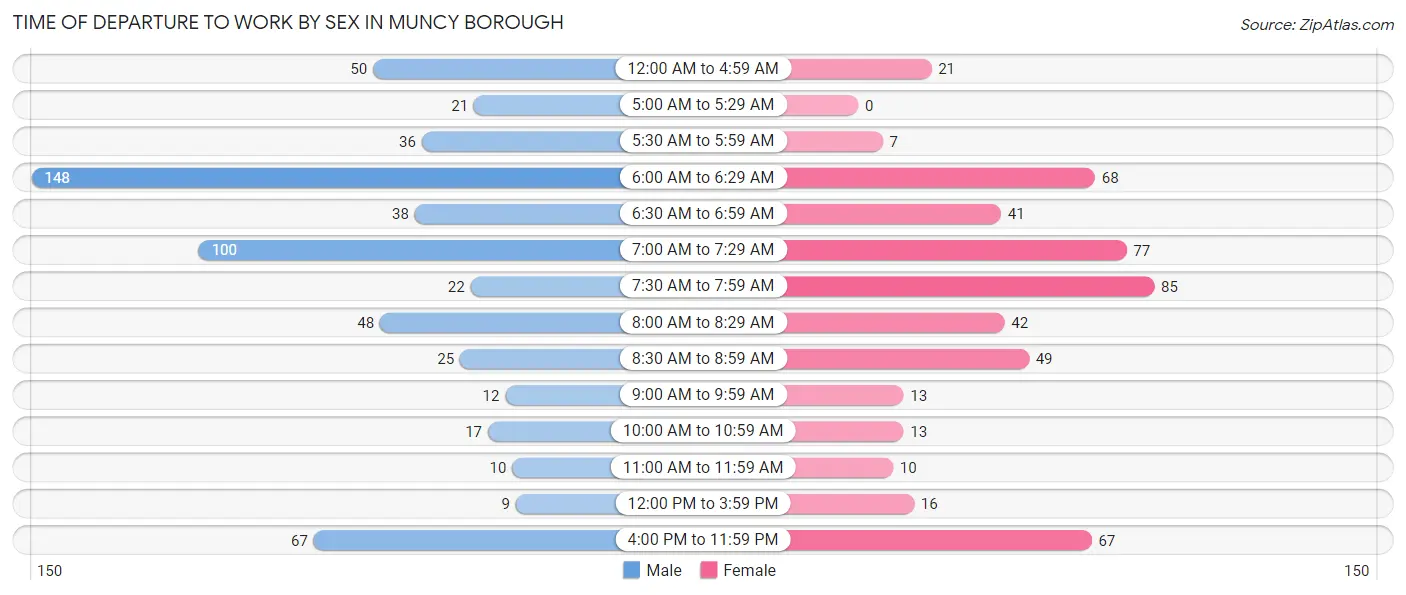
| Time of Departure | Male | Female |
| 12:00 AM to 4:59 AM | 50 (8.3%) | 21 (4.1%) |
| 5:00 AM to 5:29 AM | 21 (3.5%) | 0 (0.0%) |
| 5:30 AM to 5:59 AM | 36 (6.0%) | 7 (1.4%) |
| 6:00 AM to 6:29 AM | 148 (24.5%) | 68 (13.4%) |
| 6:30 AM to 6:59 AM | 38 (6.3%) | 41 (8.1%) |
| 7:00 AM to 7:29 AM | 100 (16.6%) | 77 (15.1%) |
| 7:30 AM to 7:59 AM | 22 (3.6%) | 85 (16.7%) |
| 8:00 AM to 8:29 AM | 48 (8.0%) | 42 (8.3%) |
| 8:30 AM to 8:59 AM | 25 (4.2%) | 49 (9.6%) |
| 9:00 AM to 9:59 AM | 12 (2.0%) | 13 (2.5%) |
| 10:00 AM to 10:59 AM | 17 (2.8%) | 13 (2.5%) |
| 11:00 AM to 11:59 AM | 10 (1.7%) | 10 (2.0%) |
| 12:00 PM to 3:59 PM | 9 (1.5%) | 16 (3.1%) |
| 4:00 PM to 11:59 PM | 67 (11.1%) | 67 (13.2%) |
| Total | 603 (100.0%) | 509 (100.0%) |
Housing Occupancy in Muncy borough
Occupancy by Ownership in Muncy borough
Of the total 1,043 dwellings in Muncy borough, owner-occupied units account for 748 (71.7%), while renter-occupied units make up 295 (28.3%).
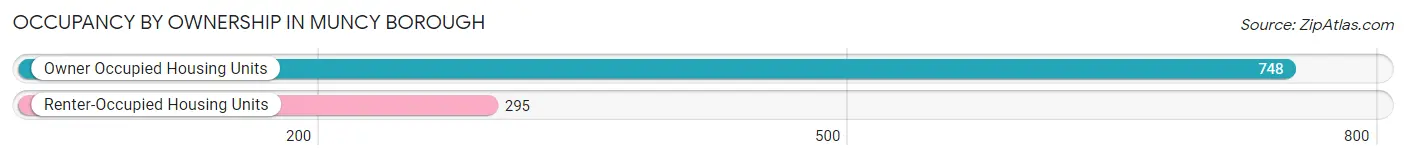
| Occupancy | # Housing Units | % Housing Units |
| Owner Occupied Housing Units | 748 | 71.7% |
| Renter-Occupied Housing Units | 295 | 28.3% |
| Total Occupied Housing Units | 1,043 | 100.0% |
Occupancy by Household Size in Muncy borough
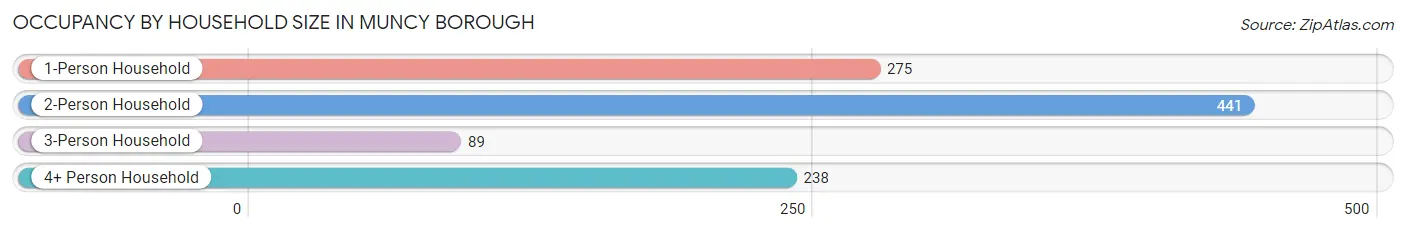
| Household Size | # Housing Units | % Housing Units |
| 1-Person Household | 275 | 26.4% |
| 2-Person Household | 441 | 42.3% |
| 3-Person Household | 89 | 8.5% |
| 4+ Person Household | 238 | 22.8% |
| Total Housing Units | 1,043 | 100.0% |
Occupancy by Ownership by Household Size in Muncy borough
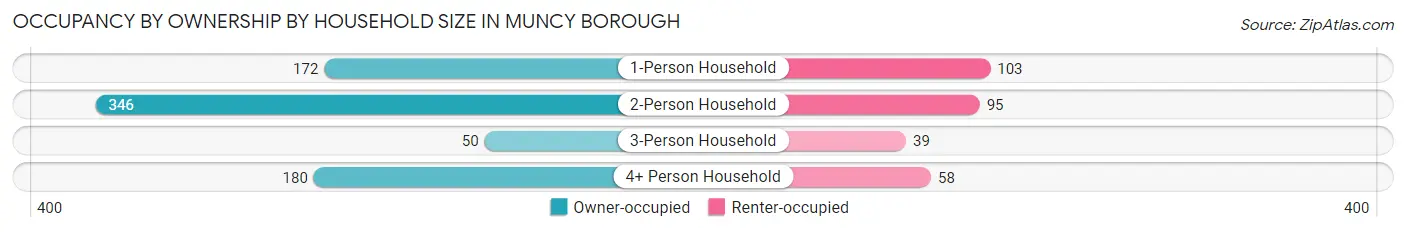
| Household Size | Owner-occupied | Renter-occupied |
| 1-Person Household | 172 (62.5%) | 103 (37.4%) |
| 2-Person Household | 346 (78.5%) | 95 (21.5%) |
| 3-Person Household | 50 (56.2%) | 39 (43.8%) |
| 4+ Person Household | 180 (75.6%) | 58 (24.4%) |
| Total Housing Units | 748 (71.7%) | 295 (28.3%) |
Occupancy by Educational Attainment in Muncy borough
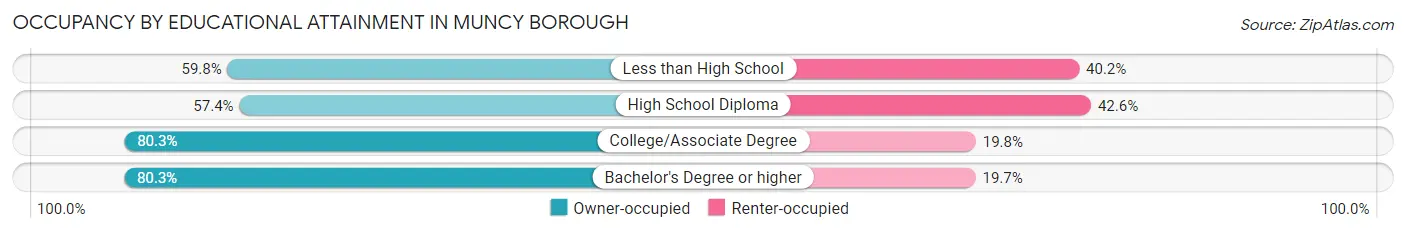
| Household Size | Owner-occupied | Renter-occupied |
| Less than High School | 49 (59.8%) | 33 (40.2%) |
| High School Diploma | 182 (57.4%) | 135 (42.6%) |
| College/Associate Degree | 252 (80.2%) | 62 (19.8%) |
| Bachelor's Degree or higher | 265 (80.3%) | 65 (19.7%) |
Occupancy by Age of Householder in Muncy borough
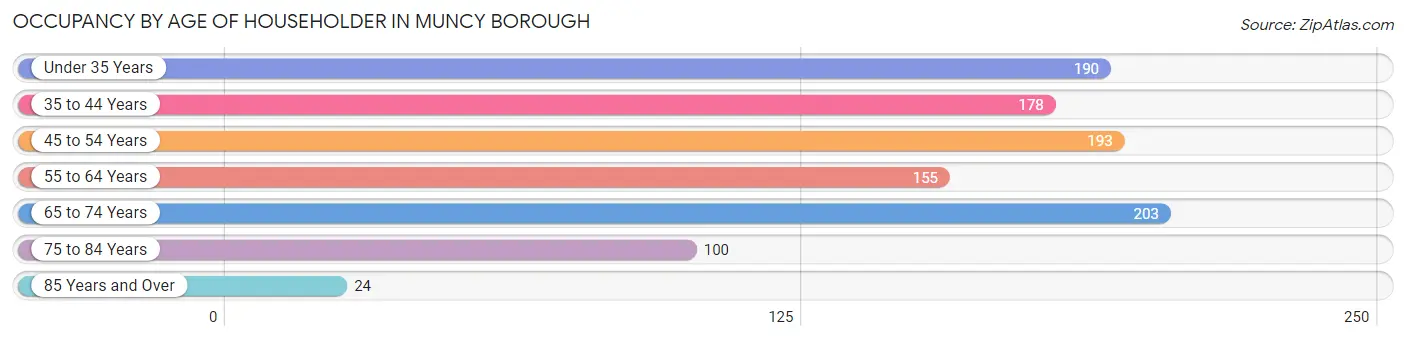
| Age Bracket | # Households | % Households |
| Under 35 Years | 190 | 18.2% |
| 35 to 44 Years | 178 | 17.1% |
| 45 to 54 Years | 193 | 18.5% |
| 55 to 64 Years | 155 | 14.9% |
| 65 to 74 Years | 203 | 19.5% |
| 75 to 84 Years | 100 | 9.6% |
| 85 Years and Over | 24 | 2.3% |
| Total | 1,043 | 100.0% |
Housing Finances in Muncy borough
Median Income by Occupancy in Muncy borough
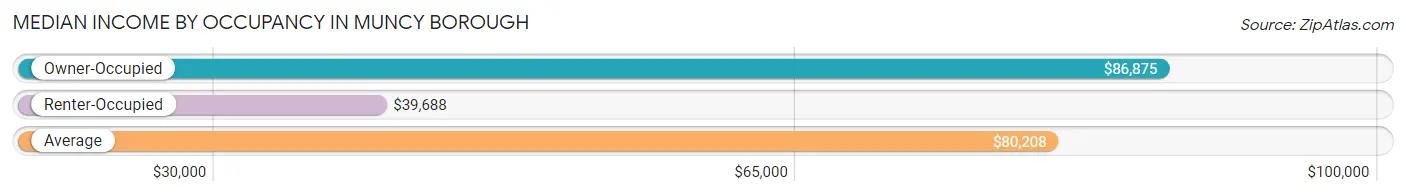
| Occupancy Type | # Households | Median Income |
| Owner-Occupied | 748 (71.7%) | $86,875 |
| Renter-Occupied | 295 (28.3%) | $39,688 |
| Average | 1,043 (100.0%) | $80,208 |
Occupancy by Householder Income Bracket in Muncy borough
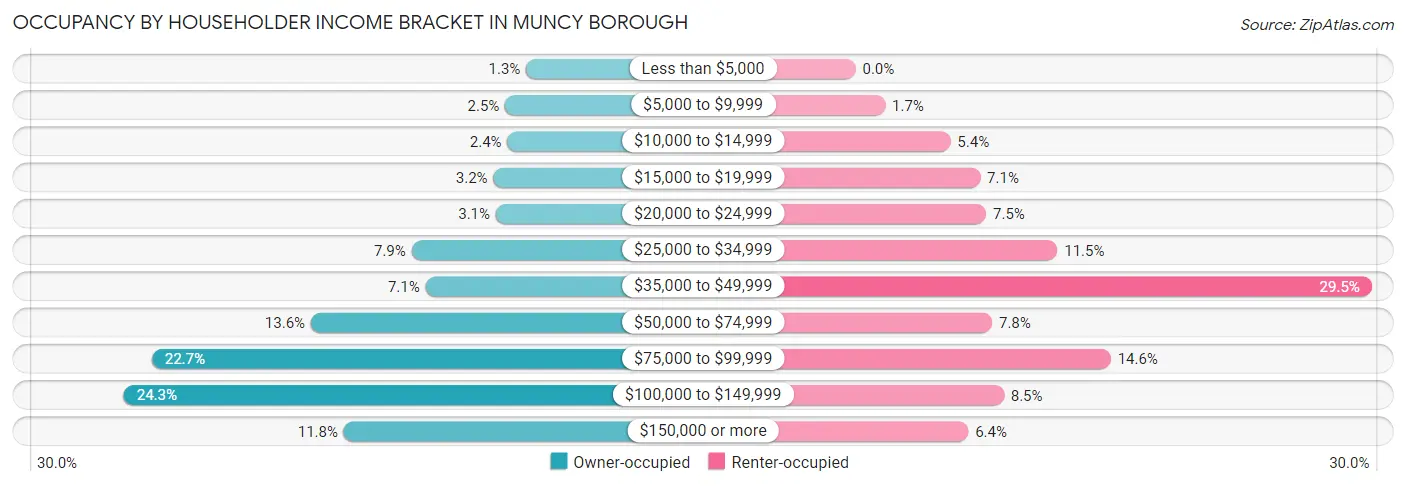
| Income Bracket | Owner-occupied | Renter-occupied |
| Less than $5,000 | 10 (1.3%) | 0 (0.0%) |
| $5,000 to $9,999 | 19 (2.5%) | 5 (1.7%) |
| $10,000 to $14,999 | 18 (2.4%) | 16 (5.4%) |
| $15,000 to $19,999 | 24 (3.2%) | 21 (7.1%) |
| $20,000 to $24,999 | 23 (3.1%) | 22 (7.5%) |
| $25,000 to $34,999 | 59 (7.9%) | 34 (11.5%) |
| $35,000 to $49,999 | 53 (7.1%) | 87 (29.5%) |
| $50,000 to $74,999 | 102 (13.6%) | 23 (7.8%) |
| $75,000 to $99,999 | 170 (22.7%) | 43 (14.6%) |
| $100,000 to $149,999 | 182 (24.3%) | 25 (8.5%) |
| $150,000 or more | 88 (11.8%) | 19 (6.4%) |
| Total | 748 (100.0%) | 295 (100.0%) |
Monthly Housing Cost Tiers in Muncy borough
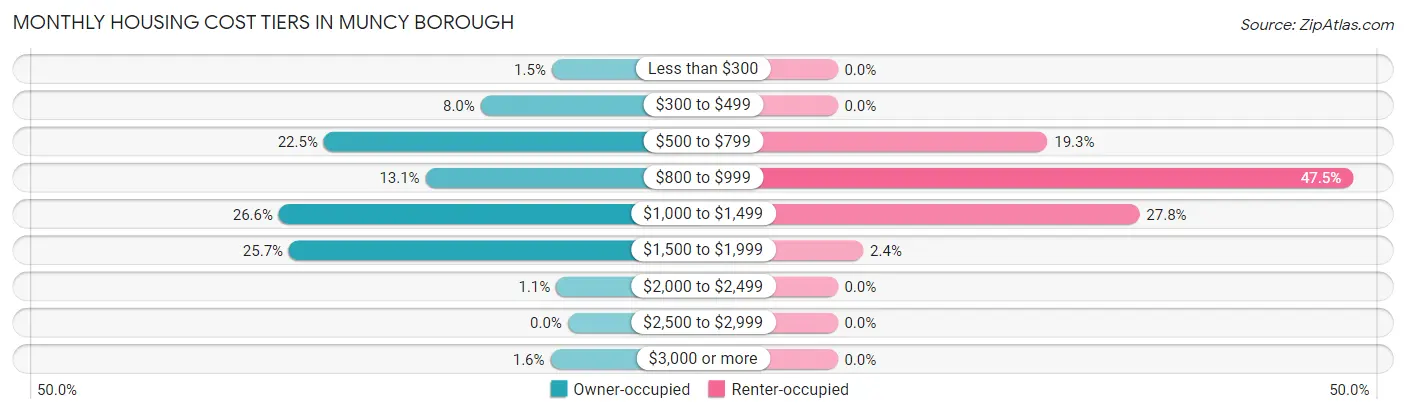
| Monthly Cost | Owner-occupied | Renter-occupied |
| Less than $300 | 11 (1.5%) | 0 (0.0%) |
| $300 to $499 | 60 (8.0%) | 0 (0.0%) |
| $500 to $799 | 168 (22.5%) | 57 (19.3%) |
| $800 to $999 | 98 (13.1%) | 140 (47.5%) |
| $1,000 to $1,499 | 199 (26.6%) | 82 (27.8%) |
| $1,500 to $1,999 | 192 (25.7%) | 7 (2.4%) |
| $2,000 to $2,499 | 8 (1.1%) | 0 (0.0%) |
| $2,500 to $2,999 | 0 (0.0%) | 0 (0.0%) |
| $3,000 or more | 12 (1.6%) | 0 (0.0%) |
| Total | 748 (100.0%) | 295 (100.0%) |
Physical Housing Characteristics in Muncy borough
Housing Structures in Muncy borough
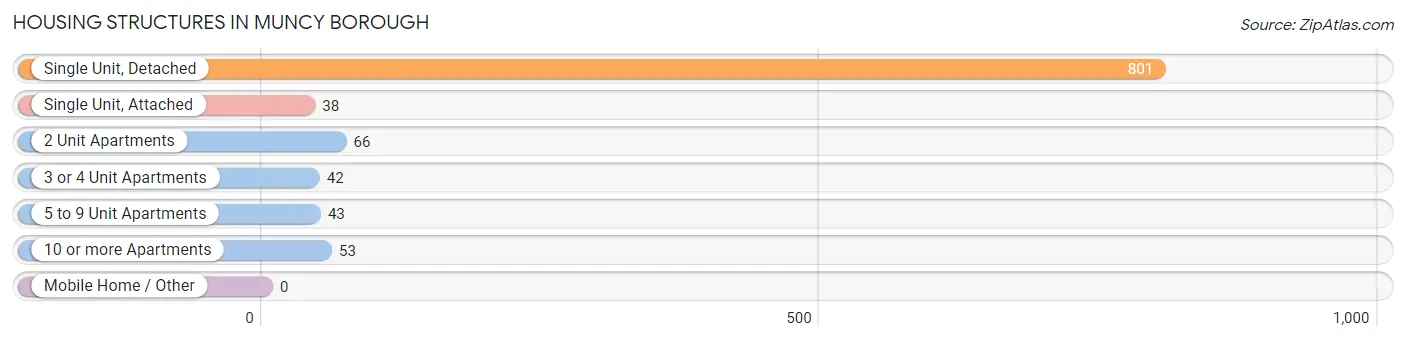
| Structure Type | # Housing Units | % Housing Units |
| Single Unit, Detached | 801 | 76.8% |
| Single Unit, Attached | 38 | 3.6% |
| 2 Unit Apartments | 66 | 6.3% |
| 3 or 4 Unit Apartments | 42 | 4.0% |
| 5 to 9 Unit Apartments | 43 | 4.1% |
| 10 or more Apartments | 53 | 5.1% |
| Mobile Home / Other | 0 | 0.0% |
| Total | 1,043 | 100.0% |
Housing Structures by Occupancy in Muncy borough
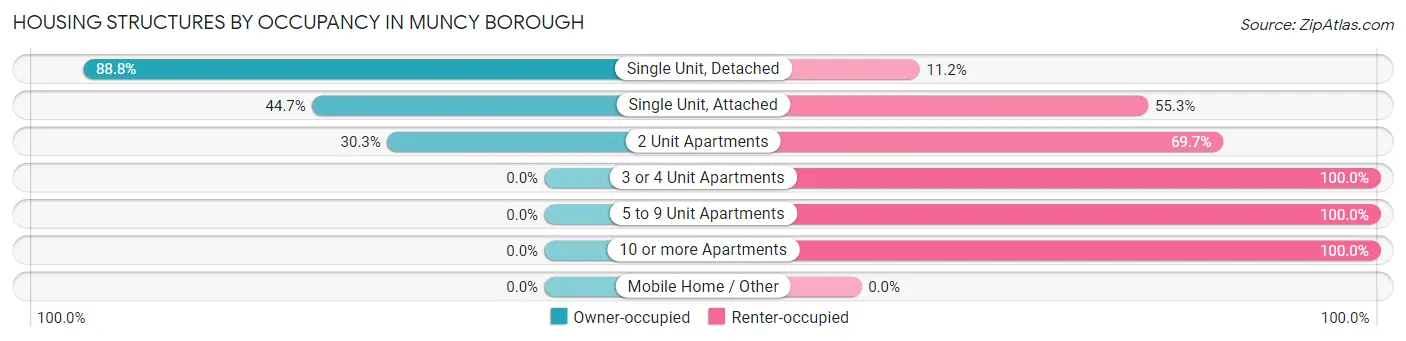
| Structure Type | Owner-occupied | Renter-occupied |
| Single Unit, Detached | 711 (88.8%) | 90 (11.2%) |
| Single Unit, Attached | 17 (44.7%) | 21 (55.3%) |
| 2 Unit Apartments | 20 (30.3%) | 46 (69.7%) |
| 3 or 4 Unit Apartments | 0 (0.0%) | 42 (100.0%) |
| 5 to 9 Unit Apartments | 0 (0.0%) | 43 (100.0%) |
| 10 or more Apartments | 0 (0.0%) | 53 (100.0%) |
| Mobile Home / Other | 0 (0.0%) | 0 (0.0%) |
| Total | 748 (71.7%) | 295 (28.3%) |
Housing Structures by Number of Rooms in Muncy borough
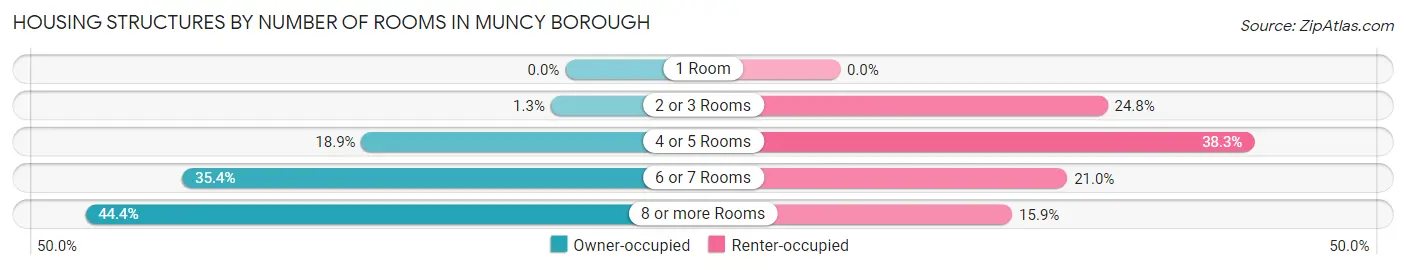
| Number of Rooms | Owner-occupied | Renter-occupied |
| 1 Room | 0 (0.0%) | 0 (0.0%) |
| 2 or 3 Rooms | 10 (1.3%) | 73 (24.7%) |
| 4 or 5 Rooms | 141 (18.9%) | 113 (38.3%) |
| 6 or 7 Rooms | 265 (35.4%) | 62 (21.0%) |
| 8 or more Rooms | 332 (44.4%) | 47 (15.9%) |
| Total | 748 (100.0%) | 295 (100.0%) |
Housing Structure by Heating Type in Muncy borough
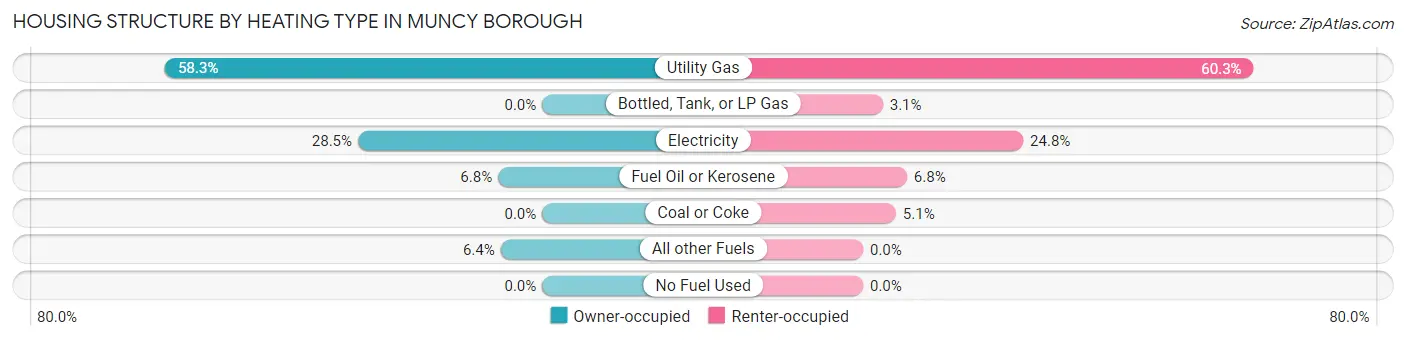
| Heating Type | Owner-occupied | Renter-occupied |
| Utility Gas | 436 (58.3%) | 178 (60.3%) |
| Bottled, Tank, or LP Gas | 0 (0.0%) | 9 (3.0%) |
| Electricity | 213 (28.5%) | 73 (24.7%) |
| Fuel Oil or Kerosene | 51 (6.8%) | 20 (6.8%) |
| Coal or Coke | 0 (0.0%) | 15 (5.1%) |
| All other Fuels | 48 (6.4%) | 0 (0.0%) |
| No Fuel Used | 0 (0.0%) | 0 (0.0%) |
| Total | 748 (100.0%) | 295 (100.0%) |
Household Vehicle Usage in Muncy borough
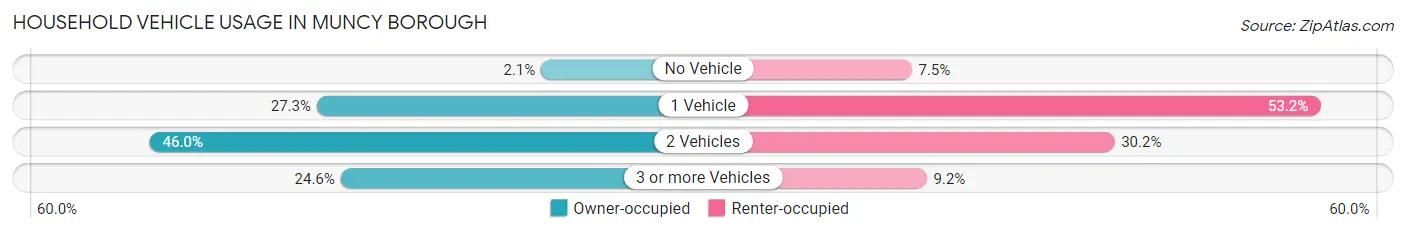
| Vehicles per Household | Owner-occupied | Renter-occupied |
| No Vehicle | 16 (2.1%) | 22 (7.5%) |
| 1 Vehicle | 204 (27.3%) | 157 (53.2%) |
| 2 Vehicles | 344 (46.0%) | 89 (30.2%) |
| 3 or more Vehicles | 184 (24.6%) | 27 (9.1%) |
| Total | 748 (100.0%) | 295 (100.0%) |
Real Estate & Mortgages in Muncy borough
Real Estate and Mortgage Overview in Muncy borough
| Characteristic | Without Mortgage | With Mortgage |
| Housing Units | 247 | 501 |
| Median Property Value | $180,100 | $178,300 |
| Median Household Income | $62,344 | $61 |
| Monthly Housing Costs | $617 | $12 |
| Real Estate Taxes | $2,688 | $0 |
Property Value by Mortgage Status in Muncy borough
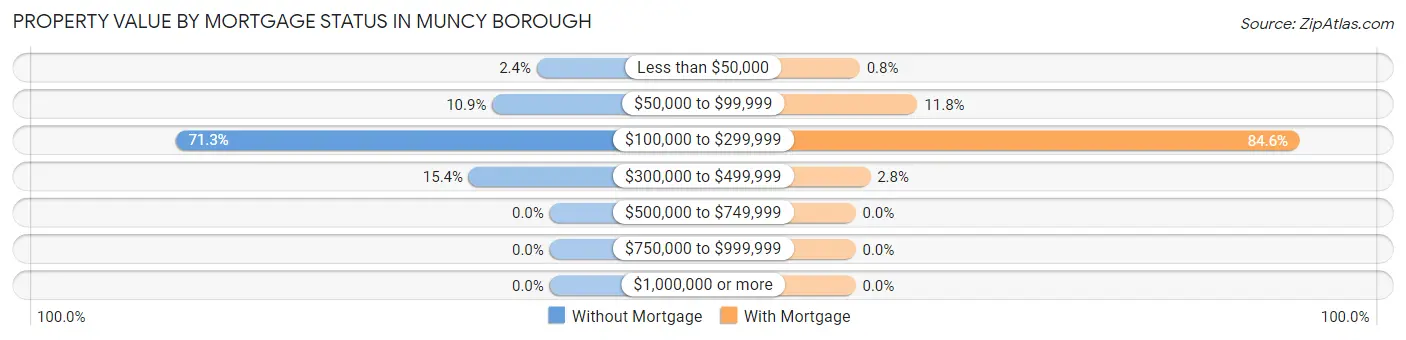
| Property Value | Without Mortgage | With Mortgage |
| Less than $50,000 | 6 (2.4%) | 4 (0.8%) |
| $50,000 to $99,999 | 27 (10.9%) | 59 (11.8%) |
| $100,000 to $299,999 | 176 (71.3%) | 424 (84.6%) |
| $300,000 to $499,999 | 38 (15.4%) | 14 (2.8%) |
| $500,000 to $749,999 | 0 (0.0%) | 0 (0.0%) |
| $750,000 to $999,999 | 0 (0.0%) | 0 (0.0%) |
| $1,000,000 or more | 0 (0.0%) | 0 (0.0%) |
| Total | 247 (100.0%) | 501 (100.0%) |
Household Income by Mortgage Status in Muncy borough
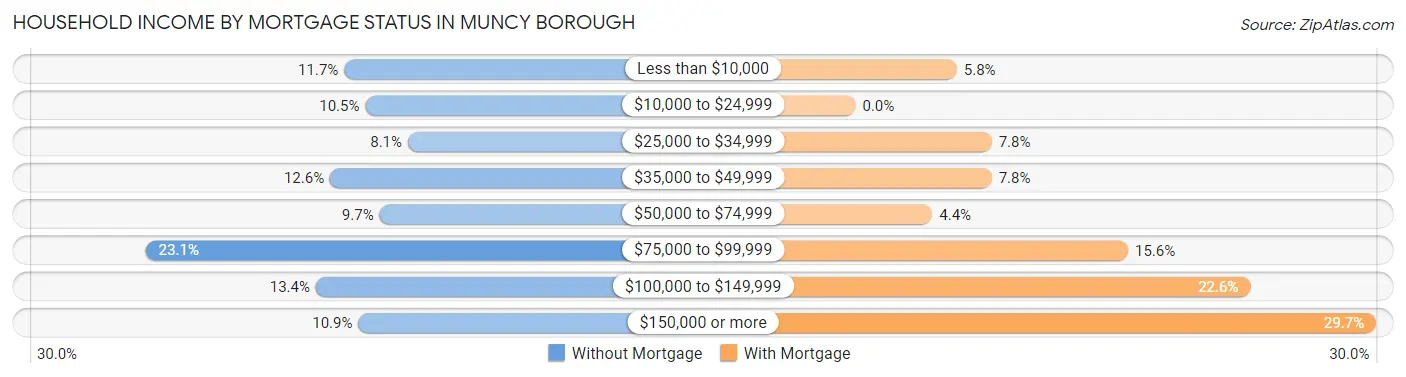
| Household Income | Without Mortgage | With Mortgage |
| Less than $10,000 | 29 (11.7%) | 29 (5.8%) |
| $10,000 to $24,999 | 26 (10.5%) | 0 (0.0%) |
| $25,000 to $34,999 | 20 (8.1%) | 39 (7.8%) |
| $35,000 to $49,999 | 31 (12.6%) | 39 (7.8%) |
| $50,000 to $74,999 | 24 (9.7%) | 22 (4.4%) |
| $75,000 to $99,999 | 57 (23.1%) | 78 (15.6%) |
| $100,000 to $149,999 | 33 (13.4%) | 113 (22.6%) |
| $150,000 or more | 27 (10.9%) | 149 (29.7%) |
| Total | 247 (100.0%) | 501 (100.0%) |
Property Value to Household Income Ratio in Muncy borough
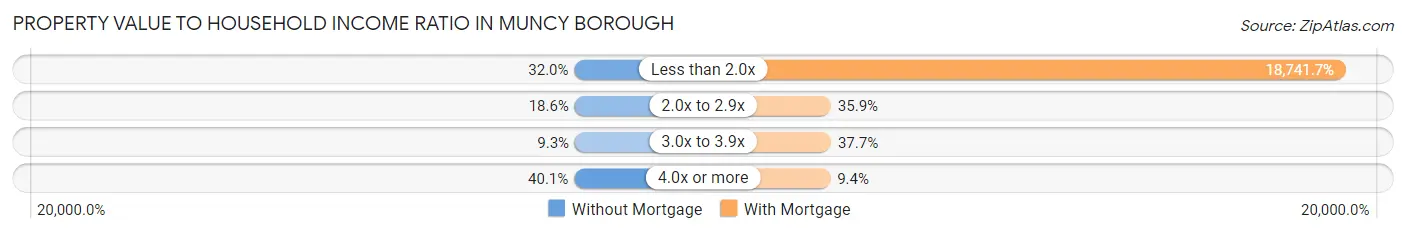
| Value-to-Income Ratio | Without Mortgage | With Mortgage |
| Less than 2.0x | 79 (32.0%) | 93,896 (18,741.7%) |
| 2.0x to 2.9x | 46 (18.6%) | 180 (35.9%) |
| 3.0x to 3.9x | 23 (9.3%) | 189 (37.7%) |
| 4.0x or more | 99 (40.1%) | 47 (9.4%) |
| Total | 247 (100.0%) | 501 (100.0%) |
Real Estate Taxes by Mortgage Status in Muncy borough
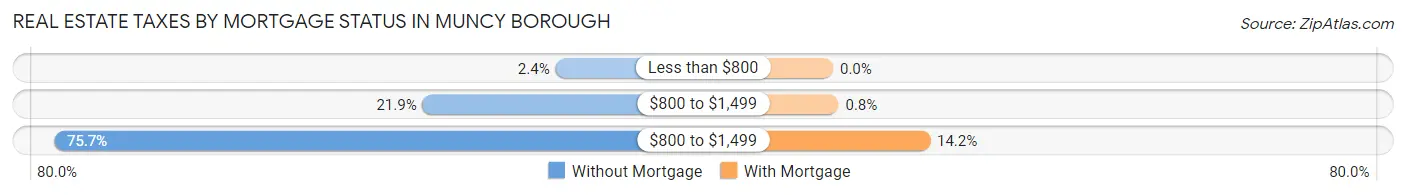
| Property Taxes | Without Mortgage | With Mortgage |
| Less than $800 | 6 (2.4%) | 0 (0.0%) |
| $800 to $1,499 | 54 (21.9%) | 4 (0.8%) |
| $800 to $1,499 | 187 (75.7%) | 71 (14.2%) |
| Total | 247 (100.0%) | 501 (100.0%) |
Health & Disability in Muncy borough
Health Insurance Coverage by Age in Muncy borough
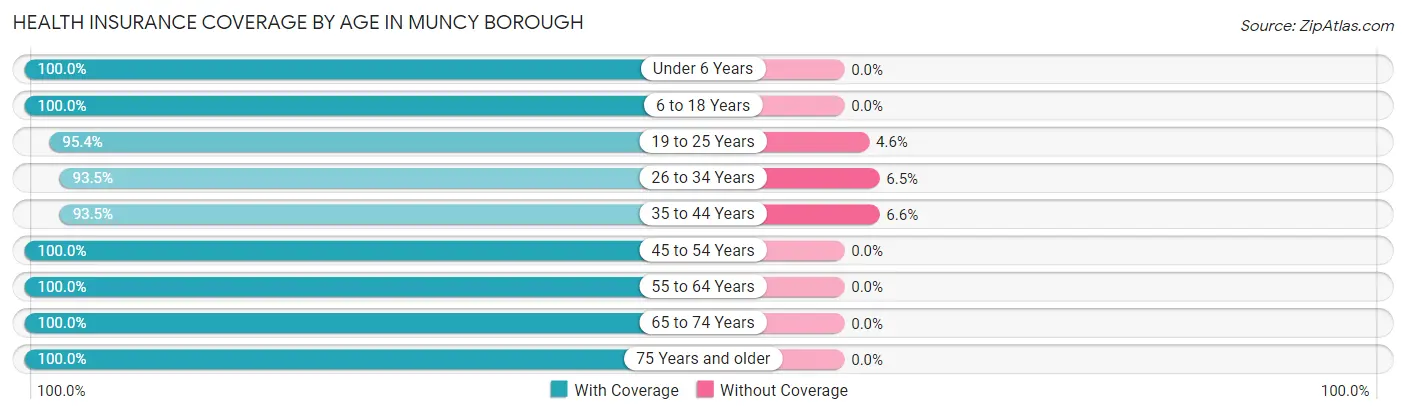
| Age Bracket | With Coverage | Without Coverage |
| Under 6 Years | 243 (100.0%) | 0 (0.0%) |
| 6 to 18 Years | 517 (100.0%) | 0 (0.0%) |
| 19 to 25 Years | 103 (95.4%) | 5 (4.6%) |
| 26 to 34 Years | 300 (93.5%) | 21 (6.5%) |
| 35 to 44 Years | 314 (93.4%) | 22 (6.6%) |
| 45 to 54 Years | 300 (100.0%) | 0 (0.0%) |
| 55 to 64 Years | 265 (100.0%) | 0 (0.0%) |
| 65 to 74 Years | 308 (100.0%) | 0 (0.0%) |
| 75 Years and older | 170 (100.0%) | 0 (0.0%) |
| Total | 2,520 (98.1%) | 48 (1.9%) |
Health Insurance Coverage by Citizenship Status in Muncy borough
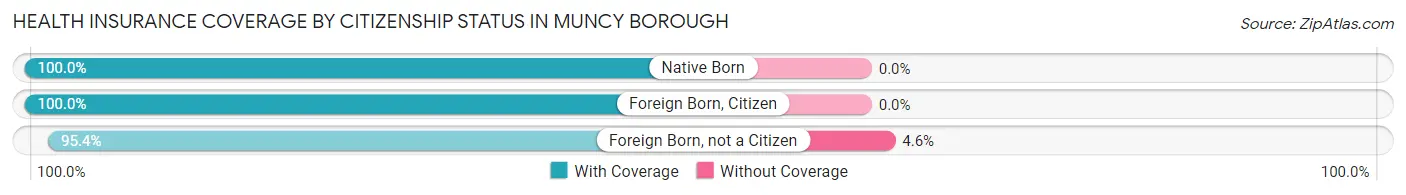
| Citizenship Status | With Coverage | Without Coverage |
| Native Born | 243 (100.0%) | 0 (0.0%) |
| Foreign Born, Citizen | 517 (100.0%) | 0 (0.0%) |
| Foreign Born, not a Citizen | 103 (95.4%) | 5 (4.6%) |
Health Insurance Coverage by Household Income in Muncy borough
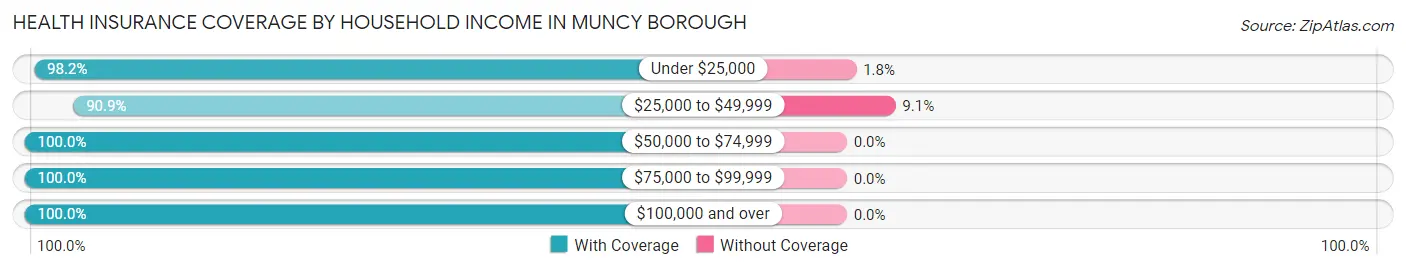
| Household Income | With Coverage | Without Coverage |
| Under $25,000 | 278 (98.2%) | 5 (1.8%) |
| $25,000 to $49,999 | 429 (90.9%) | 43 (9.1%) |
| $50,000 to $74,999 | 327 (100.0%) | 0 (0.0%) |
| $75,000 to $99,999 | 496 (100.0%) | 0 (0.0%) |
| $100,000 and over | 990 (100.0%) | 0 (0.0%) |
Public vs Private Health Insurance Coverage by Age in Muncy borough
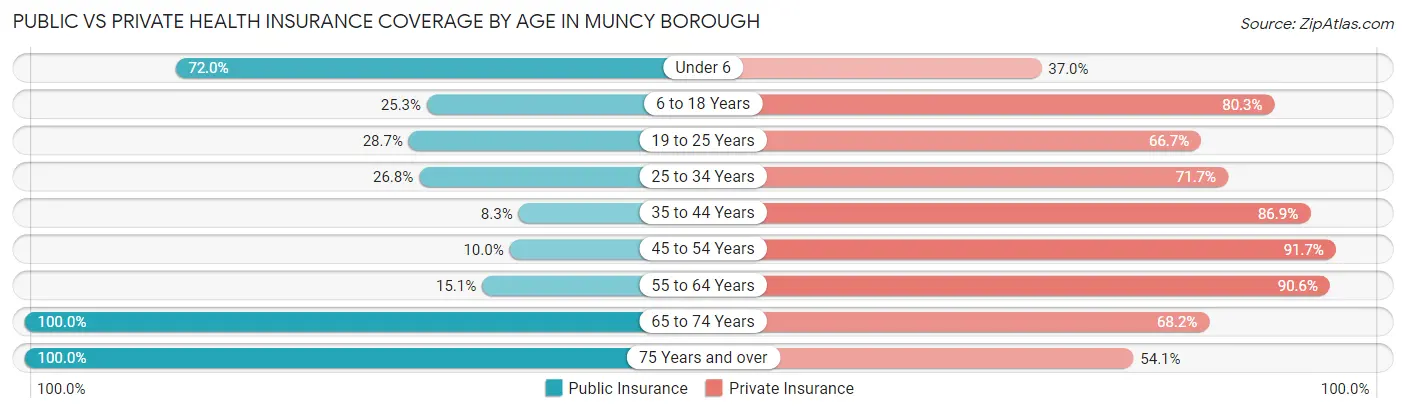
| Age Bracket | Public Insurance | Private Insurance |
| Under 6 | 175 (72.0%) | 90 (37.0%) |
| 6 to 18 Years | 131 (25.3%) | 415 (80.3%) |
| 19 to 25 Years | 31 (28.7%) | 72 (66.7%) |
| 25 to 34 Years | 86 (26.8%) | 230 (71.7%) |
| 35 to 44 Years | 28 (8.3%) | 292 (86.9%) |
| 45 to 54 Years | 30 (10.0%) | 275 (91.7%) |
| 55 to 64 Years | 40 (15.1%) | 240 (90.6%) |
| 65 to 74 Years | 308 (100.0%) | 210 (68.2%) |
| 75 Years and over | 170 (100.0%) | 92 (54.1%) |
| Total | 999 (38.9%) | 1,916 (74.6%) |
Disability Status by Sex by Age in Muncy borough
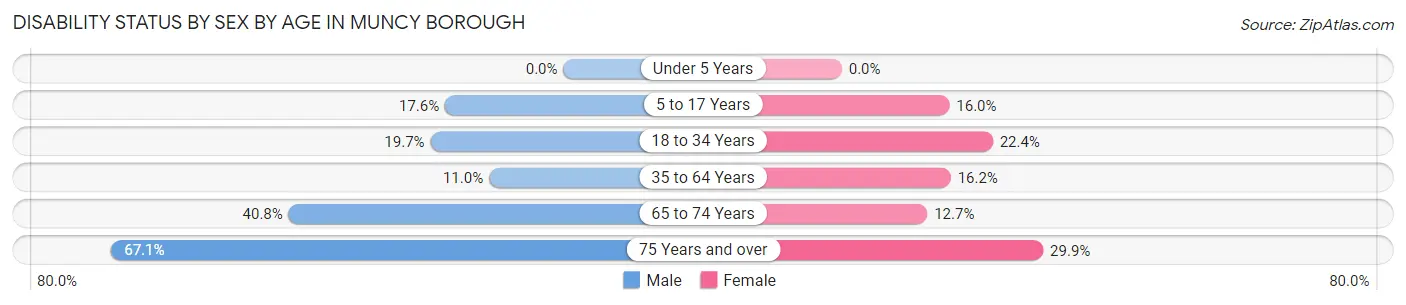
| Age Bracket | Male | Female |
| Under 5 Years | 0 (0.0%) | 0 (0.0%) |
| 5 to 17 Years | 42 (17.6%) | 46 (16.0%) |
| 18 to 34 Years | 46 (19.7%) | 52 (22.4%) |
| 35 to 64 Years | 51 (11.0%) | 71 (16.2%) |
| 65 to 74 Years | 71 (40.8%) | 17 (12.7%) |
| 75 Years and over | 49 (67.1%) | 29 (29.9%) |
Disability Class by Sex by Age in Muncy borough
Disability Class: Hearing Difficulty
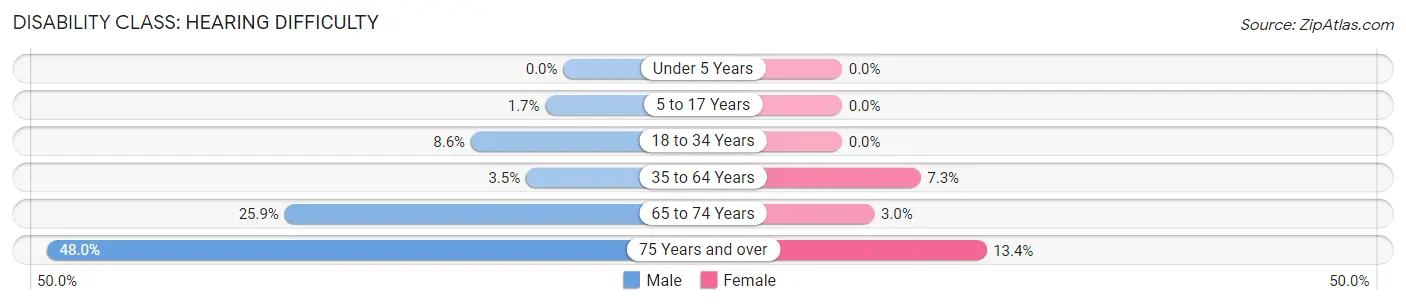
| Age Bracket | Male | Female |
| Under 5 Years | 0 (0.0%) | 0 (0.0%) |
| 5 to 17 Years | 4 (1.7%) | 0 (0.0%) |
| 18 to 34 Years | 20 (8.6%) | 0 (0.0%) |
| 35 to 64 Years | 16 (3.5%) | 32 (7.3%) |
| 65 to 74 Years | 45 (25.9%) | 4 (3.0%) |
| 75 Years and over | 35 (47.9%) | 13 (13.4%) |
Disability Class: Vision Difficulty
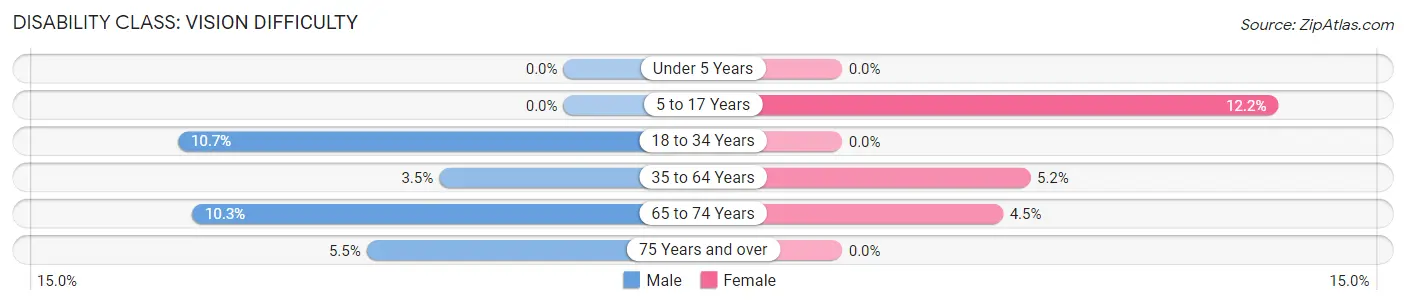
| Age Bracket | Male | Female |
| Under 5 Years | 0 (0.0%) | 0 (0.0%) |
| 5 to 17 Years | 0 (0.0%) | 35 (12.1%) |
| 18 to 34 Years | 25 (10.7%) | 0 (0.0%) |
| 35 to 64 Years | 16 (3.5%) | 23 (5.2%) |
| 65 to 74 Years | 18 (10.3%) | 6 (4.5%) |
| 75 Years and over | 4 (5.5%) | 0 (0.0%) |
Disability Class: Cognitive Difficulty
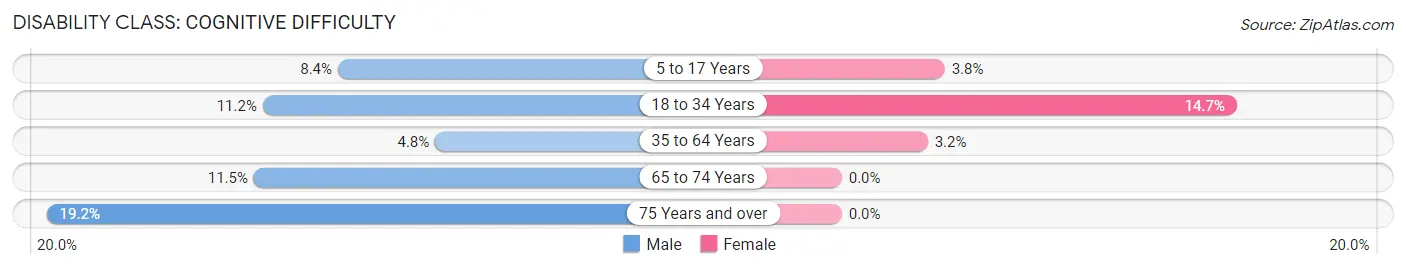
| Age Bracket | Male | Female |
| 5 to 17 Years | 20 (8.4%) | 11 (3.8%) |
| 18 to 34 Years | 26 (11.2%) | 34 (14.7%) |
| 35 to 64 Years | 22 (4.8%) | 14 (3.2%) |
| 65 to 74 Years | 20 (11.5%) | 0 (0.0%) |
| 75 Years and over | 14 (19.2%) | 0 (0.0%) |
Disability Class: Ambulatory Difficulty
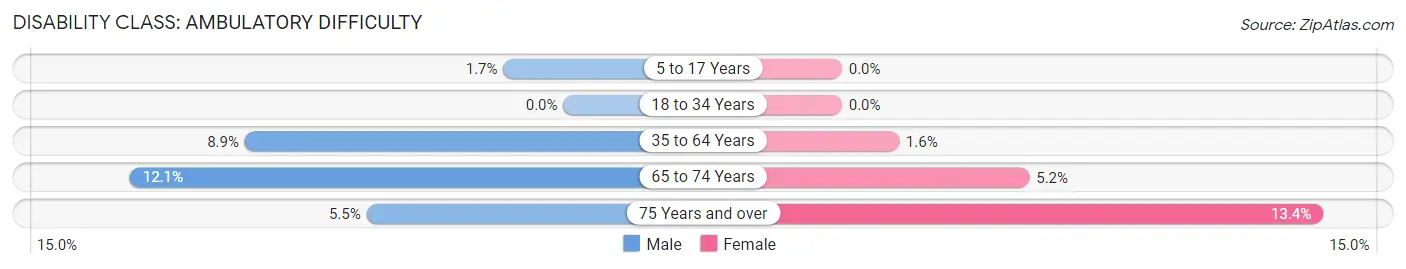
| Age Bracket | Male | Female |
| 5 to 17 Years | 4 (1.7%) | 0 (0.0%) |
| 18 to 34 Years | 0 (0.0%) | 0 (0.0%) |
| 35 to 64 Years | 41 (8.9%) | 7 (1.6%) |
| 65 to 74 Years | 21 (12.1%) | 7 (5.2%) |
| 75 Years and over | 4 (5.5%) | 13 (13.4%) |
Disability Class: Self-Care Difficulty
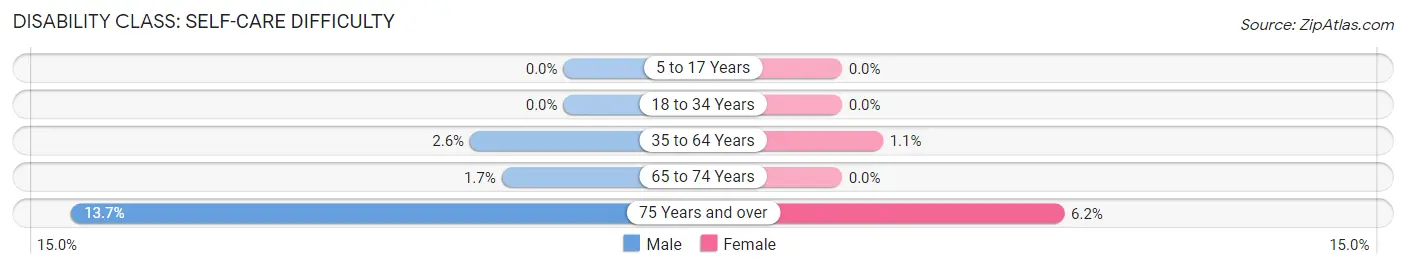
| Age Bracket | Male | Female |
| 5 to 17 Years | 0 (0.0%) | 0 (0.0%) |
| 18 to 34 Years | 0 (0.0%) | 0 (0.0%) |
| 35 to 64 Years | 12 (2.6%) | 5 (1.1%) |
| 65 to 74 Years | 3 (1.7%) | 0 (0.0%) |
| 75 Years and over | 10 (13.7%) | 6 (6.2%) |
Technology Access in Muncy borough
Computing Device Access in Muncy borough
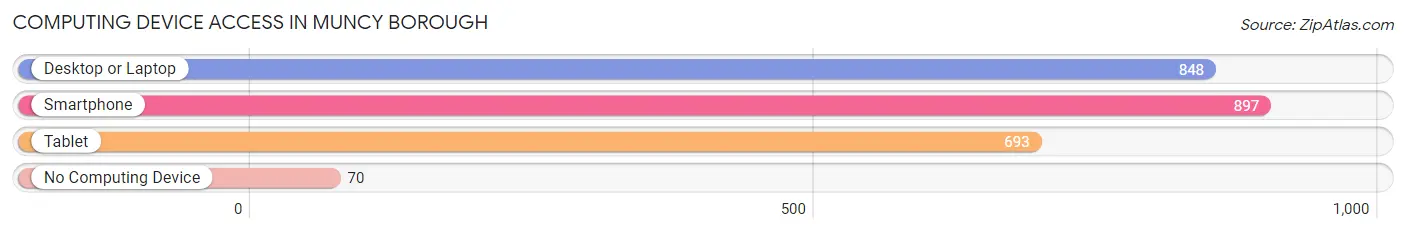
| Device Type | # Households | % Households |
| Desktop or Laptop | 848 | 81.3% |
| Smartphone | 897 | 86.0% |
| Tablet | 693 | 66.4% |
| No Computing Device | 70 | 6.7% |
| Total | 1,043 | 100.0% |
Internet Access in Muncy borough
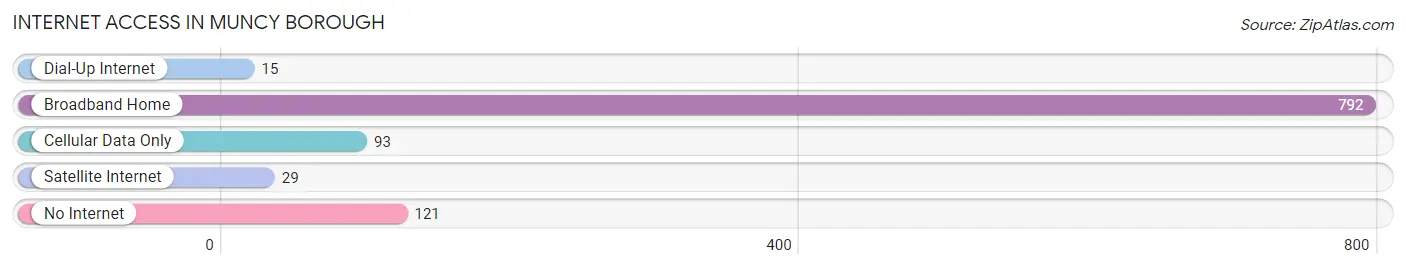
| Internet Type | # Households | % Households |
| Dial-Up Internet | 15 | 1.4% |
| Broadband Home | 792 | 75.9% |
| Cellular Data Only | 93 | 8.9% |
| Satellite Internet | 29 | 2.8% |
| No Internet | 121 | 11.6% |
| Total | 1,043 | 100.0% |
Muncy borough Summary
Muncy Borough is a small borough located in Lycoming County, Pennsylvania. It is situated along the West Branch of the Susquehanna River, approximately 10 miles north of Williamsport. The population of Muncy Borough was 2,663 at the 2010 census.
History
Muncy Borough was first settled in 1772 by John Alward, who built a log cabin near the present-day intersection of Main and Water Streets. The town was originally known as “Alward’s Town” and was later renamed “Muncy” after the Munsee Indians who lived in the area. The town was officially incorporated in 1827.
In the 19th century, Muncy was an important stop on the Susquehanna and Tidewater Canal, which connected the Susquehanna River to the Chesapeake Bay. The canal was an important transportation route for goods and passengers, and Muncy was a major port of call for canal boats. The canal was eventually replaced by the Pennsylvania Railroad in the late 19th century.
Muncy was also an important center for the lumber industry in the 19th century. The town was home to several sawmills and lumber yards, and the lumber industry was a major source of employment for the town’s residents.
Geography
Muncy Borough is located at 41°14'17" North, 76°45'45" West (41.238, -76.7625). According to the United States Census Bureau, the borough has a total area of 1.2 square miles (3.1 km2), all of it land.
The borough is located along the West Branch of the Susquehanna River. Muncy Creek, a tributary of the Susquehanna, flows through the borough. The borough is located in the Appalachian Mountains and is surrounded by rolling hills and forests.
Economy
Muncy Borough’s economy is largely based on manufacturing and services. The borough is home to several manufacturing companies, including a paper mill, a plastics manufacturer, and a metal fabrication plant. The borough is also home to several retail stores, restaurants, and other service-based businesses.
The borough is also home to several educational institutions, including Lycoming College, a private liberal arts college, and the Muncy School District, which serves the borough and surrounding areas.
Demographics
As of the 2010 census, there were 2,663 people, 1,093 households, and 690 families residing in the borough. The population density was 2,213.3 people per square mile (854.7/km2). There were 1,183 housing units at an average density of 976.7 per square mile (377.2/km2). The racial makeup of the borough was 97.2% White, 0.7% African American, 0.2% Native American, 0.4% Asian, 0.2% from other races, and 1.3% from two or more races. Hispanic or Latino of any race were 1.2% of the population.
There were 1,093 households, out of which 28.2% had children under the age of 18 living with them, 46.2% were married couples living together, 12.7% had a female householder with no husband present, and 36.2% were non-families. 30.7% of all households were made up of individuals, and 14.2% had someone living alone who was 65 years of age or older. The average household size was 2.41 and the average family size was 3.00.
In the borough, the population was spread out, with 24.2% under the age of 18, 8.2% from 18 to 24, 27.2% from 25 to 44, 22.7% from 45 to 64, and 17.7% who were 65 years of age or older. The median age was 38 years. For every 100 females, there were 91.2 males. For every 100 females age 18 and over, there were 87.2 males.
The median income for a household in the borough was $35,938, and the median income for a family was $45,000. Males had a median income of $31,250 versus $22,500 for females. The per capita income for the borough was $17,945. About 8.2% of families and 11.2% of the population were below the poverty line, including 15.2% of those under age 18 and 8.2% of those age 65 or over.
Common Questions
What is Per Capita Income in Muncy borough?
Per Capita income in Muncy borough is $32,408.
What is the Median Family Income in Muncy borough?
Median Family Income in Muncy borough is $90,078.
What is the Median Household income in Muncy borough?
Median Household Income in Muncy borough is $80,208.
What is Income or Wage Gap in Muncy borough?
Income or Wage Gap in Muncy borough is 31.8%.
Women in Muncy borough earn 68.2 cents for every dollar earned by a man.
What is Inequality or Gini Index in Muncy borough?
Inequality or Gini Index in Muncy borough is 0.38.
What is the Total Population of Muncy borough?
Total Population of Muncy borough is 2,570.
What is the Total Male Population of Muncy borough?
Total Male Population of Muncy borough is 1,293.
What is the Total Female Population of Muncy borough?
Total Female Population of Muncy borough is 1,277.
What is the Ratio of Males per 100 Females in Muncy borough?
There are 101.25 Males per 100 Females in Muncy borough.
What is the Ratio of Females per 100 Males in Muncy borough?
There are 98.76 Females per 100 Males in Muncy borough.
What is the Median Population Age in Muncy borough?
Median Population Age in Muncy borough is 37.8 Years.
What is the Average Family Size in Muncy borough
Average Family Size in Muncy borough is 3.0 People.
What is the Average Household Size in Muncy borough
Average Household Size in Muncy borough is 2.5 People.
How Large is the Labor Force in Muncy borough?
There are 1,235 People in the Labor Forcein in Muncy borough.
What is the Percentage of People in the Labor Force in Muncy borough?
64.3% of People are in the Labor Force in Muncy borough.
What is the Unemployment Rate in Muncy borough?
Unemployment Rate in Muncy borough is 4.2%.