Morrisville, PA Map & Demographics
Morrisville Map
Morrisville Overview
$43,207
PER CAPITA INCOME
$87,273
AVG FAMILY INCOME
$46,667
AVG HOUSEHOLD INCOME
49.7%
WAGE / INCOME GAP [ % ]
50.3¢/ $1
WAGE / INCOME GAP [ $ ]
0.46
INEQUALITY / GINI INDEX
951
TOTAL POPULATION
431
MALE POPULATION
520
FEMALE POPULATION
82.88
MALES / 100 FEMALES
120.65
FEMALES / 100 MALES
62.3
MEDIAN AGE
2.8
AVG FAMILY SIZE
1.7
AVG HOUSEHOLD SIZE
430
LABOR FORCE [ PEOPLE ]
53.9%
PERCENT IN LABOR FORCE
Morrisville Zip Codes
Income in Morrisville
Income Overview in Morrisville
Per Capita Income in Morrisville is $43,207, while median incomes of families and households are $87,273 and $46,667 respectively.
| Characteristic | Number | Measure |
| Per Capita Income | 951 | $43,207 |
| Median Family Income | 208 | $87,273 |
| Mean Family Income | 208 | $116,407 |
| Median Household Income | 554 | $46,667 |
| Mean Household Income | 554 | $70,538 |
| Income Deficit | 208 | $0 |
| Wage / Income Gap (%) | 951 | 49.69% |
| Wage / Income Gap ($) | 951 | 50.31¢ per $1 |
| Gini / Inequality Index | 951 | 0.46 |
Earnings by Sex in Morrisville
Average Earnings in Morrisville are $41,339, $67,695 for men and $34,054 for women, a difference of 49.7%.
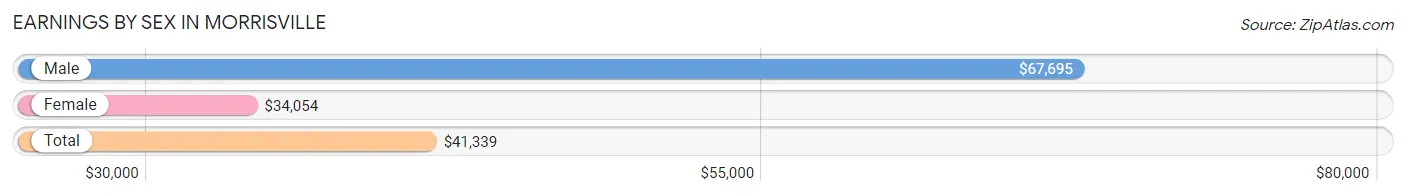
| Sex | Number | Average Earnings |
| Male | 169 (38.3%) | $67,695 |
| Female | 272 (61.7%) | $34,054 |
| Total | 441 (100.0%) | $41,339 |
Earnings by Sex by Income Bracket in Morrisville
The most common earnings brackets in Morrisville are $65,000 to $74,999 for men (43 | 25.4%) and $20,000 to $22,499 for women (70 | 25.7%).
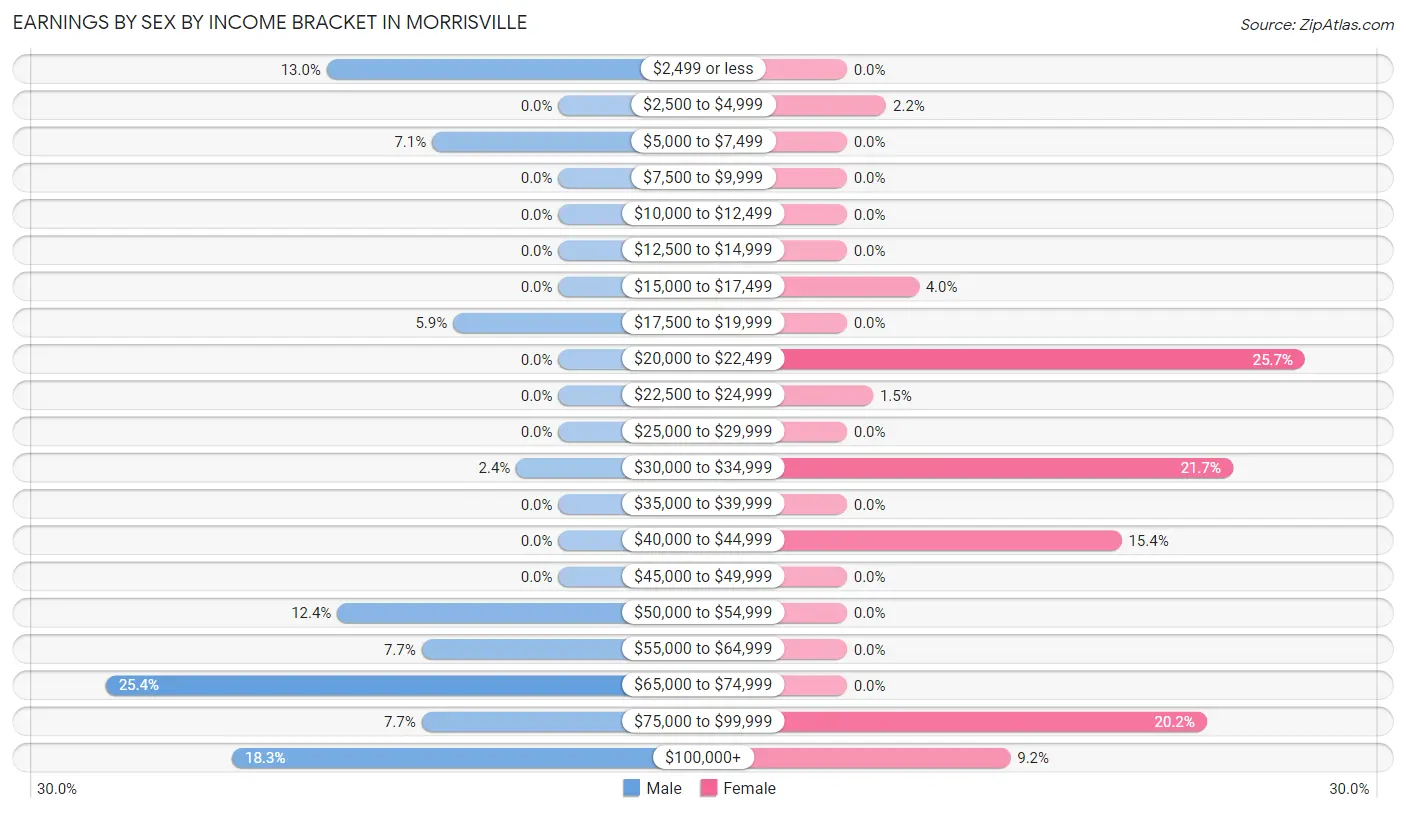
| Income | Male | Female |
| $2,499 or less | 22 (13.0%) | 0 (0.0%) |
| $2,500 to $4,999 | 0 (0.0%) | 6 (2.2%) |
| $5,000 to $7,499 | 12 (7.1%) | 0 (0.0%) |
| $7,500 to $9,999 | 0 (0.0%) | 0 (0.0%) |
| $10,000 to $12,499 | 0 (0.0%) | 0 (0.0%) |
| $12,500 to $14,999 | 0 (0.0%) | 0 (0.0%) |
| $15,000 to $17,499 | 0 (0.0%) | 11 (4.0%) |
| $17,500 to $19,999 | 10 (5.9%) | 0 (0.0%) |
| $20,000 to $22,499 | 0 (0.0%) | 70 (25.7%) |
| $22,500 to $24,999 | 0 (0.0%) | 4 (1.5%) |
| $25,000 to $29,999 | 0 (0.0%) | 0 (0.0%) |
| $30,000 to $34,999 | 4 (2.4%) | 59 (21.7%) |
| $35,000 to $39,999 | 0 (0.0%) | 0 (0.0%) |
| $40,000 to $44,999 | 0 (0.0%) | 42 (15.4%) |
| $45,000 to $49,999 | 0 (0.0%) | 0 (0.0%) |
| $50,000 to $54,999 | 21 (12.4%) | 0 (0.0%) |
| $55,000 to $64,999 | 13 (7.7%) | 0 (0.0%) |
| $65,000 to $74,999 | 43 (25.4%) | 0 (0.0%) |
| $75,000 to $99,999 | 13 (7.7%) | 55 (20.2%) |
| $100,000+ | 31 (18.3%) | 25 (9.2%) |
| Total | 169 (100.0%) | 272 (100.0%) |
Earnings by Sex by Educational Attainment in Morrisville
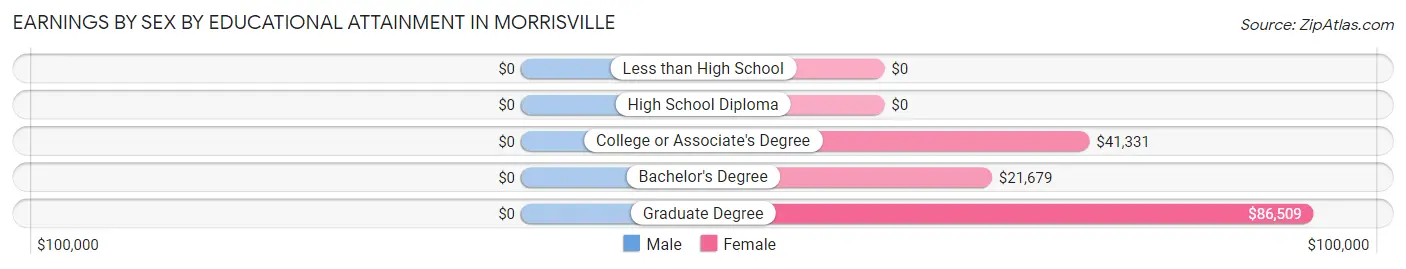
| Educational Attainment | Male Income | Female Income |
| Less than High School | - | - |
| High School Diploma | - | - |
| College or Associate's Degree | - | - |
| Bachelor's Degree | - | - |
| Graduate Degree | - | - |
| Total | $68,125 | $34,189 |
Family Income in Morrisville
Family Income Brackets in Morrisville
According to the Morrisville family income data, there are 49 families falling into the $100,000 to $149,999 income range, which is the most common income bracket and makes up 23.6% of all families.
| Income Bracket | # Families | % Families |
| Less than $10,000 | 0 | 0.0% |
| $10,000 to $14,999 | 0 | 0.0% |
| $15,000 to $24,999 | 0 | 0.0% |
| $25,000 to $34,999 | 37 | 17.8% |
| $35,000 to $49,999 | 10 | 4.8% |
| $50,000 to $74,999 | 37 | 17.8% |
| $75,000 to $99,999 | 22 | 10.6% |
| $100,000 to $149,999 | 49 | 23.6% |
| $150,000 to $199,999 | 10 | 4.8% |
| $200,000+ | 43 | 20.7% |
Family Income by Famaliy Size in Morrisville
2-person families (138 | 66.3%) account for the highest median family income in Morrisville with $129,615 per family, while 2-person families (138 | 66.3%) have the highest median income of $64,808 per family member.
| Income Bracket | # Families | Median Income |
| 2-Person Families | 138 (66.3%) | $129,615 |
| 3-Person Families | 70 (33.7%) | $0 |
| 4-Person Families | 0 (0.0%) | $0 |
| 5-Person Families | 0 (0.0%) | $0 |
| 6-Person Families | 0 (0.0%) | $0 |
| 7+ Person Families | 0 (0.0%) | $0 |
| Total | 208 (100.0%) | $87,273 |
Family Income by Number of Earners in Morrisville
| Number of Earners | # Families | Median Income |
| No Earners | 47 (22.6%) | $70,096 |
| 1 Earner | 51 (24.5%) | $0 |
| 2 Earners | 110 (52.9%) | $0 |
| 3+ Earners | 0 (0.0%) | $0 |
| Total | 208 (100.0%) | $87,273 |
Household Income in Morrisville
Household Income Brackets in Morrisville
With 98 households falling in the category, the $25,000 to $34,999 income range is the most frequent in Morrisville, accounting for 17.7% of all households. In contrast, only 10 households (1.8%) fall into the $150,000 to $199,999 income bracket, making it the least populous group.
| Income Bracket | # Households | % Households |
| Less than $10,000 | 39 | 7.0% |
| $10,000 to $14,999 | 36 | 6.5% |
| $15,000 to $24,999 | 42 | 7.6% |
| $25,000 to $34,999 | 98 | 17.7% |
| $35,000 to $49,999 | 67 | 12.1% |
| $50,000 to $74,999 | 68 | 12.3% |
| $75,000 to $99,999 | 65 | 11.7% |
| $100,000 to $149,999 | 86 | 15.5% |
| $150,000 to $199,999 | 10 | 1.8% |
| $200,000+ | 43 | 7.8% |
Household Income by Householder Age in Morrisville
The median household income in Morrisville is $46,667, with the highest median household income of $100,101 found in the 25 to 44 years age bracket for the primary householder. A total of 71 households (12.8%) fall into this category. Meanwhile, the 15 to 24 years age bracket for the primary householder has the lowest median household income of $0, with 4 households (0.7%) in this group.
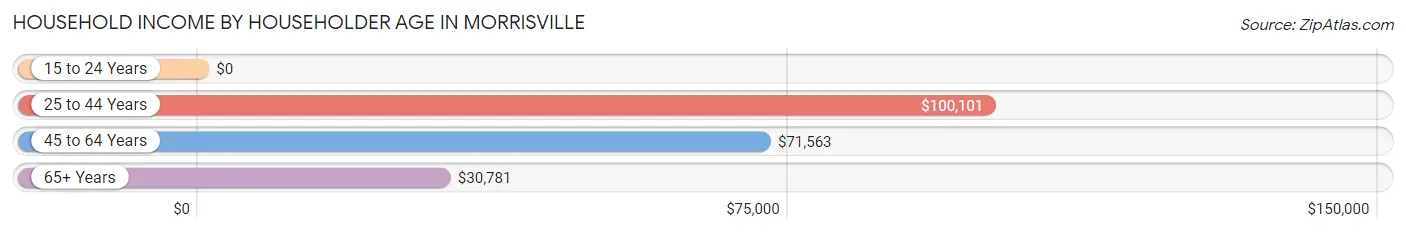
| Income Bracket | # Households | Median Income |
| 15 to 24 Years | 4 (0.7%) | $0 |
| 25 to 44 Years | 71 (12.8%) | $100,101 |
| 45 to 64 Years | 200 (36.1%) | $71,563 |
| 65+ Years | 279 (50.4%) | $30,781 |
| Total | 554 (100.0%) | $46,667 |
Poverty in Morrisville
Income Below Poverty by Sex and Age in Morrisville
With 5.8% poverty level for males and 2.7% for females among the residents of Morrisville, 35 to 44 year old males and 65 to 74 year old females are the most vulnerable to poverty, with 12 males (100.0%) and 5 females (6.4%) in their respective age groups living below the poverty level.
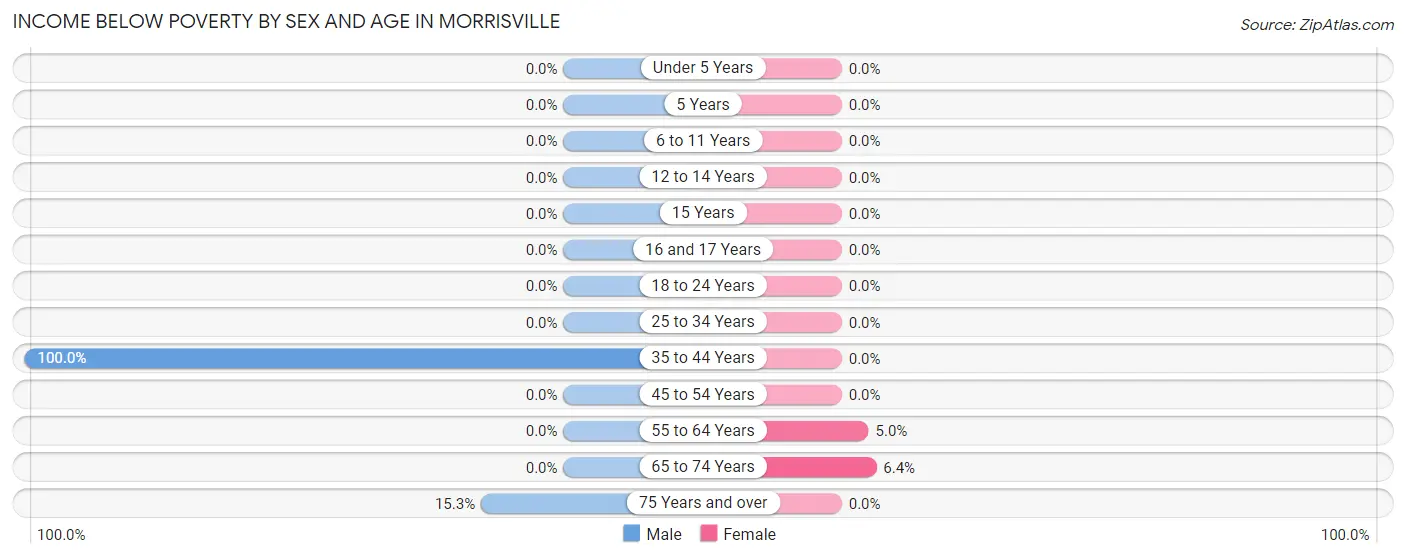
| Age Bracket | Male | Female |
| Under 5 Years | 0 (0.0%) | 0 (0.0%) |
| 5 Years | 0 (0.0%) | 0 (0.0%) |
| 6 to 11 Years | 0 (0.0%) | 0 (0.0%) |
| 12 to 14 Years | 0 (0.0%) | 0 (0.0%) |
| 15 Years | 0 (0.0%) | 0 (0.0%) |
| 16 and 17 Years | 0 (0.0%) | 0 (0.0%) |
| 18 to 24 Years | 0 (0.0%) | 0 (0.0%) |
| 25 to 34 Years | 0 (0.0%) | 0 (0.0%) |
| 35 to 44 Years | 12 (100.0%) | 0 (0.0%) |
| 45 to 54 Years | 0 (0.0%) | 0 (0.0%) |
| 55 to 64 Years | 0 (0.0%) | 9 (5.0%) |
| 65 to 74 Years | 0 (0.0%) | 5 (6.4%) |
| 75 Years and over | 13 (15.3%) | 0 (0.0%) |
| Total | 25 (5.8%) | 14 (2.7%) |
Income Above Poverty by Sex and Age in Morrisville
According to the poverty statistics in Morrisville, males aged under 5 years and females aged 6 to 11 years are the age groups that are most secure financially, with 100.0% of males and 100.0% of females in these age groups living above the poverty line.
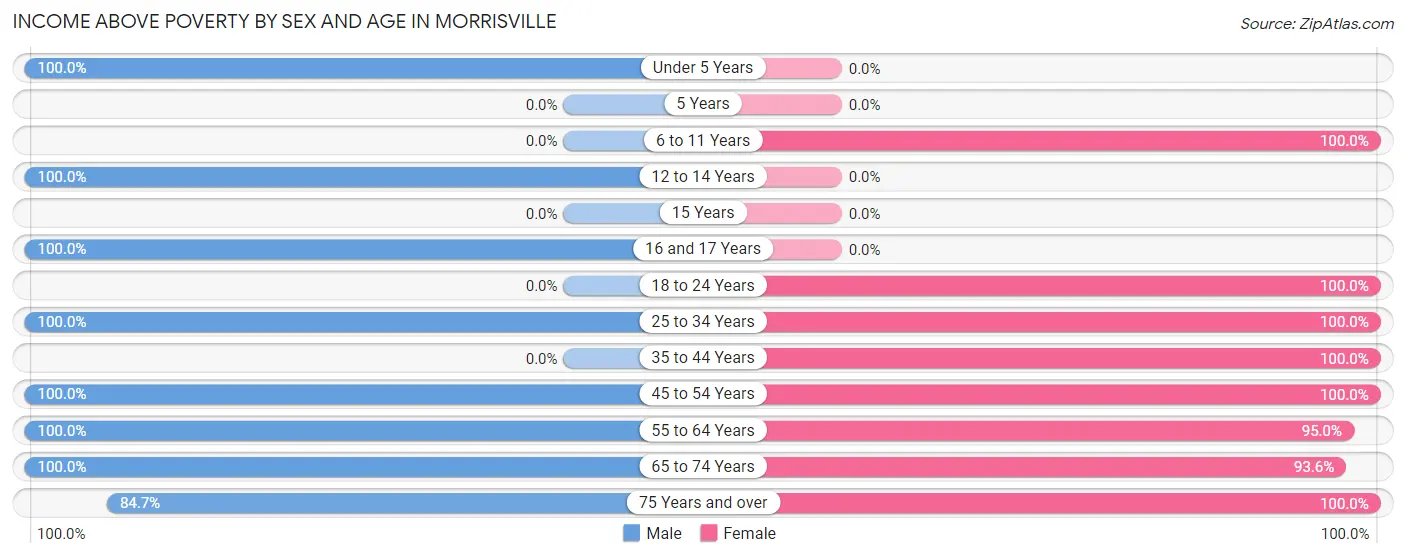
| Age Bracket | Male | Female |
| Under 5 Years | 23 (100.0%) | 0 (0.0%) |
| 5 Years | 0 (0.0%) | 0 (0.0%) |
| 6 to 11 Years | 0 (0.0%) | 48 (100.0%) |
| 12 to 14 Years | 82 (100.0%) | 0 (0.0%) |
| 15 Years | 0 (0.0%) | 0 (0.0%) |
| 16 and 17 Years | 11 (100.0%) | 0 (0.0%) |
| 18 to 24 Years | 0 (0.0%) | 4 (100.0%) |
| 25 to 34 Years | 53 (100.0%) | 59 (100.0%) |
| 35 to 44 Years | 0 (0.0%) | 4 (100.0%) |
| 45 to 54 Years | 56 (100.0%) | 12 (100.0%) |
| 55 to 64 Years | 62 (100.0%) | 172 (95.0%) |
| 65 to 74 Years | 47 (100.0%) | 73 (93.6%) |
| 75 Years and over | 72 (84.7%) | 134 (100.0%) |
| Total | 406 (94.2%) | 506 (97.3%) |
Income Below Poverty Among Married-Couple Families in Morrisville
| Children | Above Poverty | Below Poverty |
| No Children | 125 (100.0%) | 0 (0.0%) |
| 1 or 2 Children | 22 (100.0%) | 0 (0.0%) |
| 3 or 4 Children | 0 (0.0%) | 0 (0.0%) |
| 5 or more Children | 0 (0.0%) | 0 (0.0%) |
| Total | 147 (100.0%) | 0 (0.0%) |
Income Below Poverty Among Single-Parent Households in Morrisville
| Children | Single Father | Single Mother |
| No Children | 0 (0.0%) | 0 (0.0%) |
| 1 or 2 Children | 0 (0.0%) | 0 (0.0%) |
| 3 or 4 Children | 0 (0.0%) | 0 (0.0%) |
| 5 or more Children | 0 (0.0%) | 0 (0.0%) |
| Total | 0 (0.0%) | 0 (0.0%) |
Income Below Poverty Among Married-Couple vs Single-Parent Households in Morrisville
| Children | Married-Couple Families | Single-Parent Households |
| No Children | 0 (0.0%) | 0 (0.0%) |
| 1 or 2 Children | 0 (0.0%) | 0 (0.0%) |
| 3 or 4 Children | 0 (0.0%) | 0 (0.0%) |
| 5 or more Children | 0 (0.0%) | 0 (0.0%) |
| Total | 0 (0.0%) | 0 (0.0%) |
Race in Morrisville
The most populous races in Morrisville are White / Caucasian (701 | 73.7%), Two or more Races (246 | 25.9%), and Hispanic or Latino (26 | 2.7%).
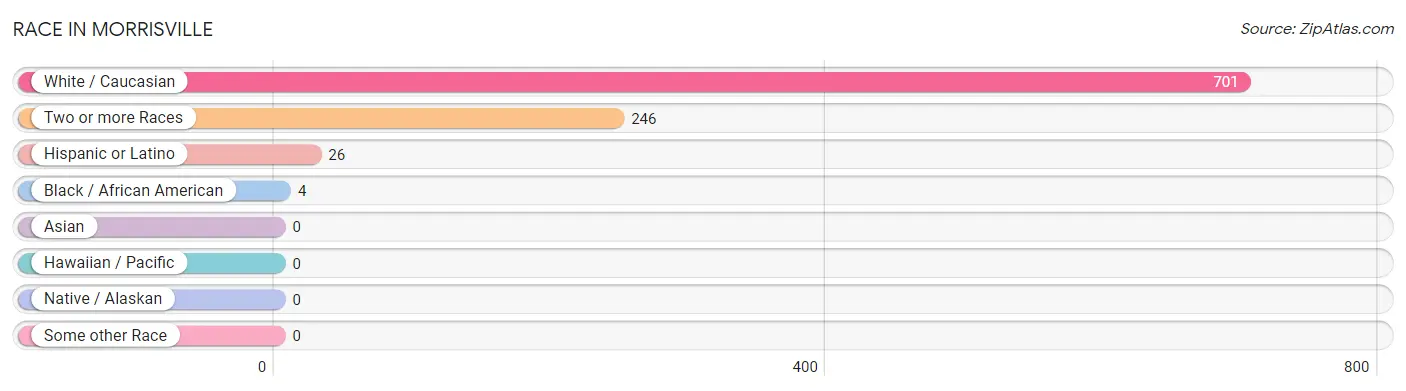
| Race | # Population | % Population |
| Asian | 0 | 0.0% |
| Black / African American | 4 | 0.4% |
| Hawaiian / Pacific | 0 | 0.0% |
| Hispanic or Latino | 26 | 2.7% |
| Native / Alaskan | 0 | 0.0% |
| White / Caucasian | 701 | 73.7% |
| Two or more Races | 246 | 25.9% |
| Some other Race | 0 | 0.0% |
| Total | 951 | 100.0% |
Ancestry in Morrisville
The most populous ancestries reported in Morrisville are German (460 | 48.4%), Irish (87 | 9.1%), English (84 | 8.8%), Bhutanese (70 | 7.4%), and American (46 | 4.8%), together accounting for 78.6% of all Morrisville residents.
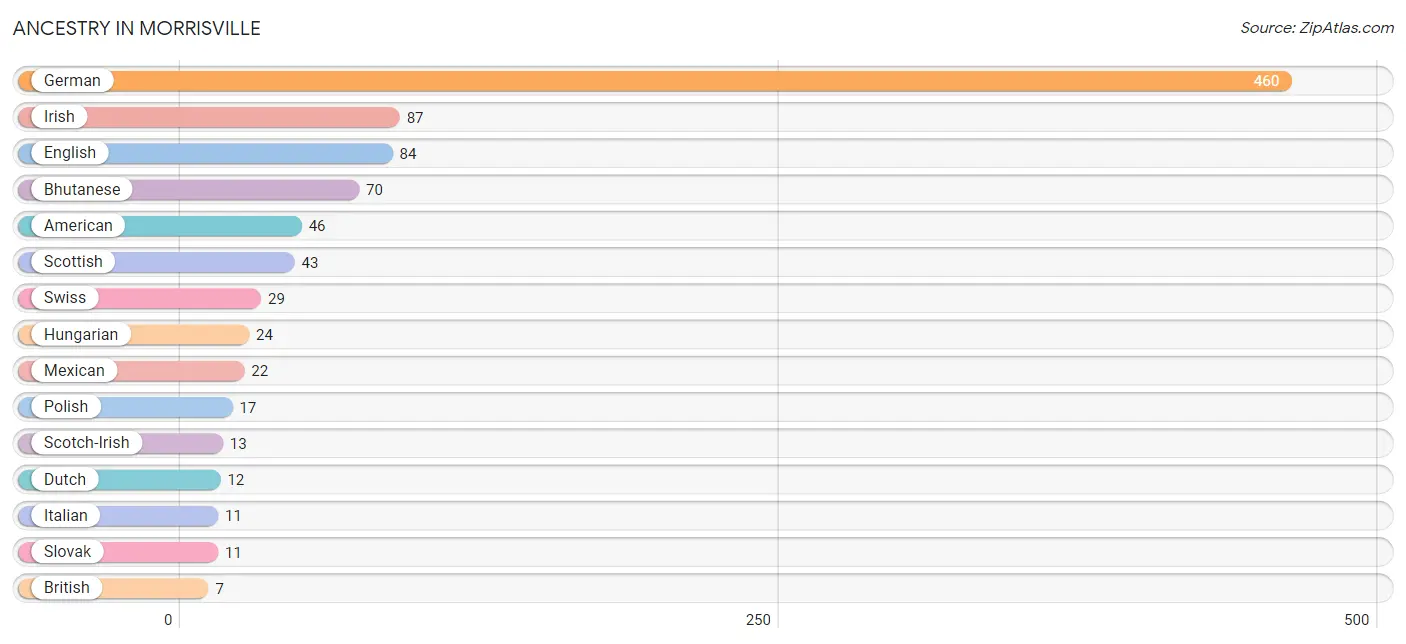
| Ancestry | # Population | % Population |
| American | 46 | 4.8% |
| Bhutanese | 70 | 7.4% |
| British | 7 | 0.7% |
| Cuban | 4 | 0.4% |
| Dutch | 12 | 1.3% |
| English | 84 | 8.8% |
| German | 460 | 48.4% |
| Hungarian | 24 | 2.5% |
| Irish | 87 | 9.1% |
| Italian | 11 | 1.2% |
| Mexican | 22 | 2.3% |
| Polish | 17 | 1.8% |
| Scotch-Irish | 13 | 1.4% |
| Scottish | 43 | 4.5% |
| Slovak | 11 | 1.2% |
| Swiss | 29 | 3.0% | View All 16 Rows |
Immigrants in Morrisville

| Immigration Origin | # Population | % Population | View All 0 Rows |
Sex and Age in Morrisville
Sex and Age in Morrisville
The most populous age groups in Morrisville are 10 to 14 Years (82 | 19.0%) for men and 60 to 64 Years (150 | 28.8%) for women.
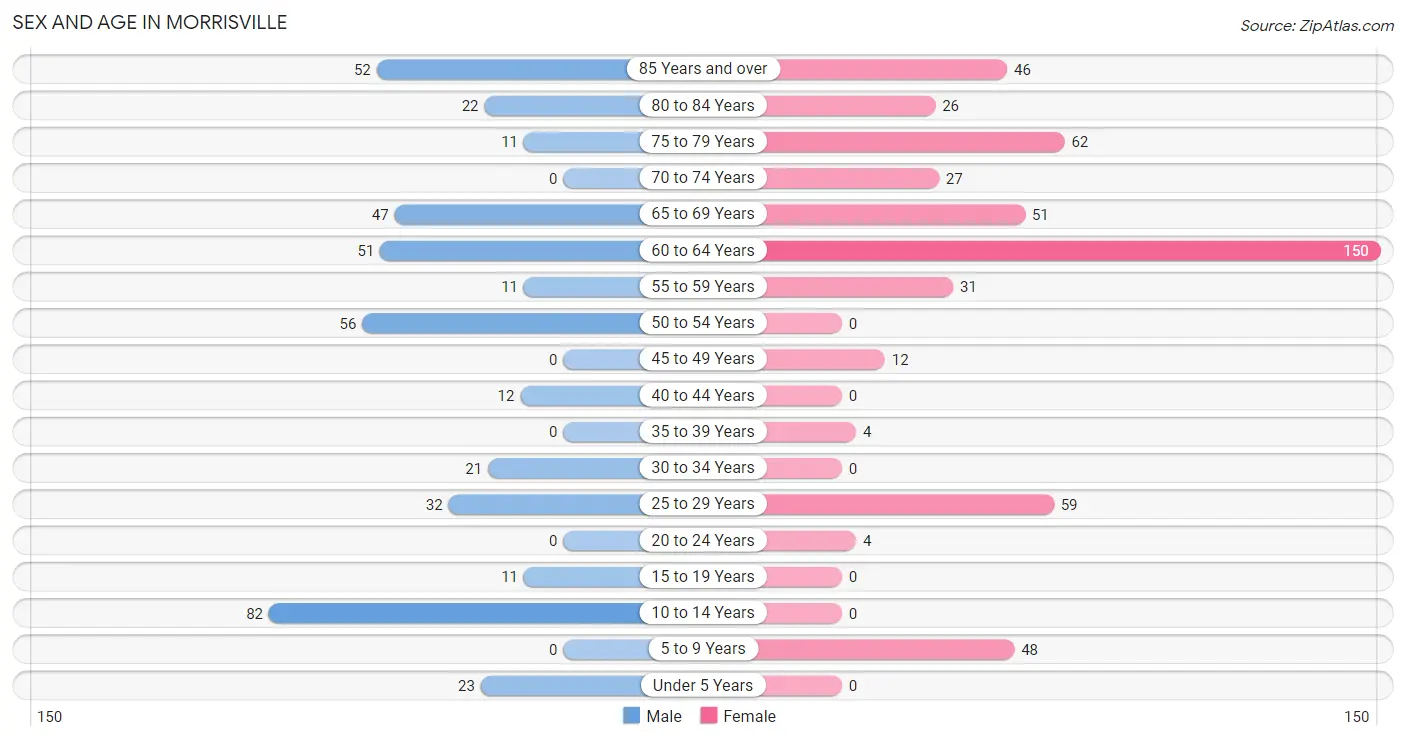
| Age Bracket | Male | Female |
| Under 5 Years | 23 (5.3%) | 0 (0.0%) |
| 5 to 9 Years | 0 (0.0%) | 48 (9.2%) |
| 10 to 14 Years | 82 (19.0%) | 0 (0.0%) |
| 15 to 19 Years | 11 (2.5%) | 0 (0.0%) |
| 20 to 24 Years | 0 (0.0%) | 4 (0.8%) |
| 25 to 29 Years | 32 (7.4%) | 59 (11.4%) |
| 30 to 34 Years | 21 (4.9%) | 0 (0.0%) |
| 35 to 39 Years | 0 (0.0%) | 4 (0.8%) |
| 40 to 44 Years | 12 (2.8%) | 0 (0.0%) |
| 45 to 49 Years | 0 (0.0%) | 12 (2.3%) |
| 50 to 54 Years | 56 (13.0%) | 0 (0.0%) |
| 55 to 59 Years | 11 (2.5%) | 31 (6.0%) |
| 60 to 64 Years | 51 (11.8%) | 150 (28.8%) |
| 65 to 69 Years | 47 (10.9%) | 51 (9.8%) |
| 70 to 74 Years | 0 (0.0%) | 27 (5.2%) |
| 75 to 79 Years | 11 (2.5%) | 62 (11.9%) |
| 80 to 84 Years | 22 (5.1%) | 26 (5.0%) |
| 85 Years and over | 52 (12.1%) | 46 (8.8%) |
| Total | 431 (100.0%) | 520 (100.0%) |
Families and Households in Morrisville
Median Family Size in Morrisville
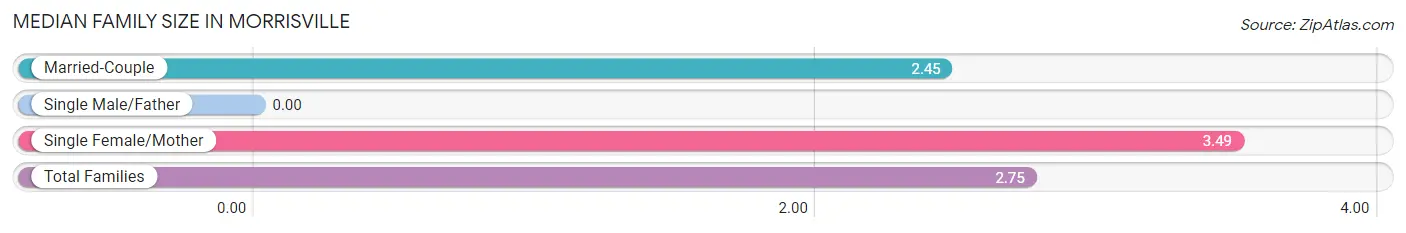
| Family Type | # Families | Family Size |
| Married-Couple | 147 (70.7%) | 2.45 |
| Single Male/Father | 0 (0.0%) | - |
| Single Female/Mother | 61 (29.3%) | 3.49 |
| Total Families | 208 (100.0%) | 2.75 |
Median Household Size in Morrisville
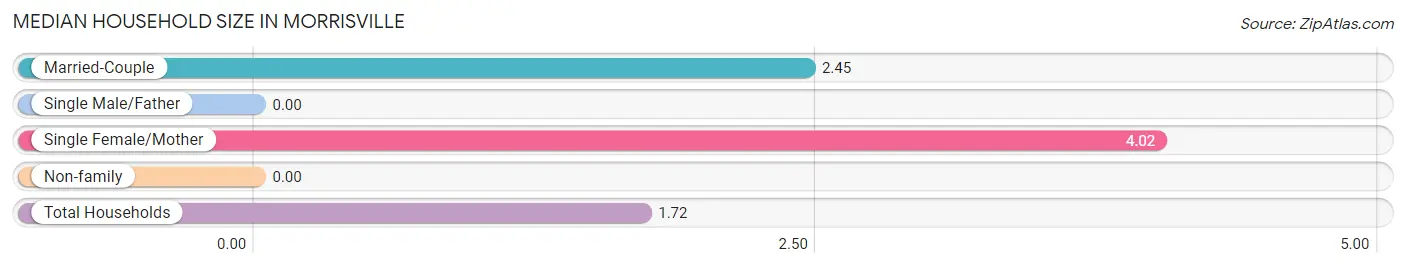
| Household Type | # Households | Household Size |
| Married-Couple | 147 (26.5%) | 2.45 |
| Single Male/Father | 0 (0.0%) | - |
| Single Female/Mother | 61 (11.0%) | 4.02 |
| Non-family | 346 (62.5%) | - |
| Total Households | 554 (100.0%) | 1.72 |
Household Size by Marriage Status in Morrisville
Out of a total of 554 households in Morrisville, 208 (37.6%) are family households, while 346 (62.5%) are nonfamily households. The most numerous type of family households are 2-person households, comprising 138, and the most common type of nonfamily households are 1-person households, comprising 346.
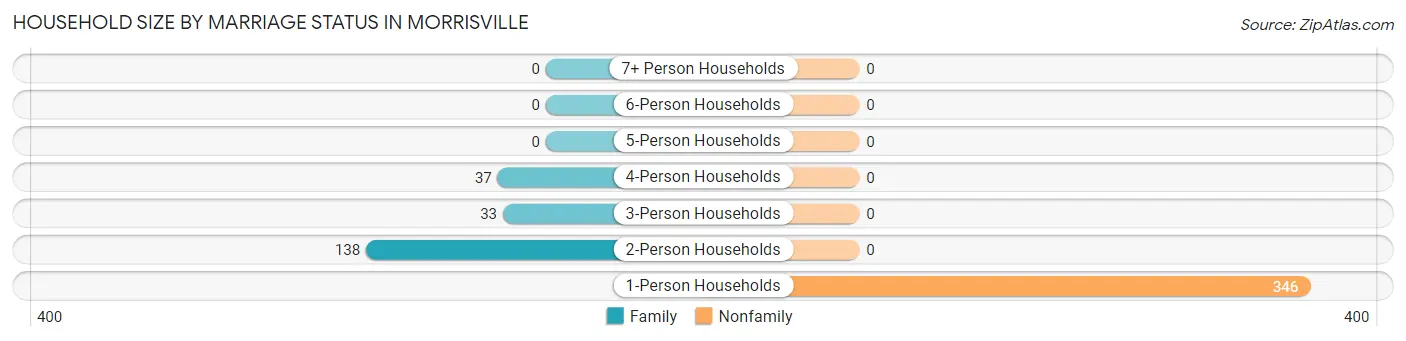
| Household Size | Family Households | Nonfamily Households |
| 1-Person Households | - | 346 (62.5%) |
| 2-Person Households | 138 (24.9%) | 0 (0.0%) |
| 3-Person Households | 33 (6.0%) | 0 (0.0%) |
| 4-Person Households | 37 (6.7%) | 0 (0.0%) |
| 5-Person Households | 0 (0.0%) | 0 (0.0%) |
| 6-Person Households | 0 (0.0%) | 0 (0.0%) |
| 7+ Person Households | 0 (0.0%) | 0 (0.0%) |
| Total | 208 (37.6%) | 346 (62.5%) |
Female Fertility in Morrisville
Fertility by Age in Morrisville
Average fertility rate in Morrisville is 278.0 births per 1,000 women. Women in the age bracket of 20 to 34 years have the highest fertility rate with 349.0 births per 1,000 women. Women in the age bracket of 20 to 34 years acount for 100.0% of all women with births.
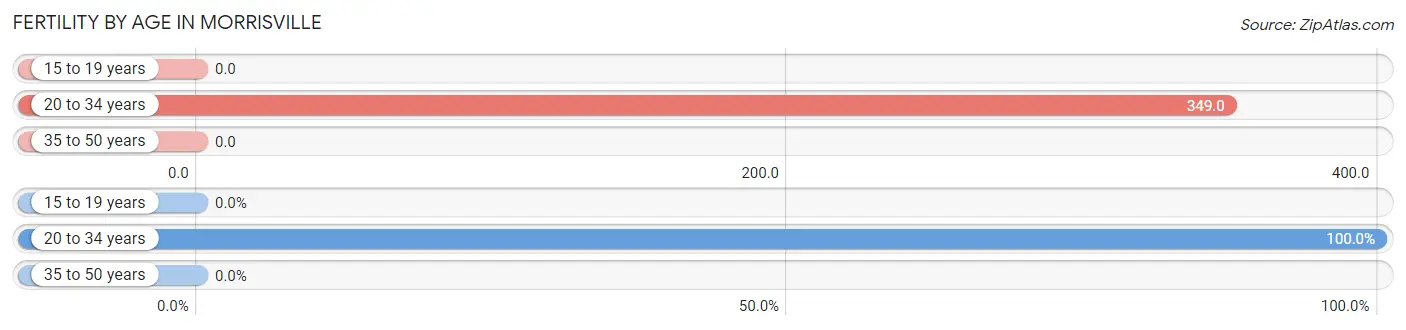
| Age Bracket | Women with Births | Births / 1,000 Women |
| 15 to 19 years | 0 (0.0%) | 0.0 |
| 20 to 34 years | 22 (100.0%) | 349.0 |
| 35 to 50 years | 0 (0.0%) | 0.0 |
| Total | 22 (100.0%) | 278.0 |
Fertility by Age by Marriage Status in Morrisville
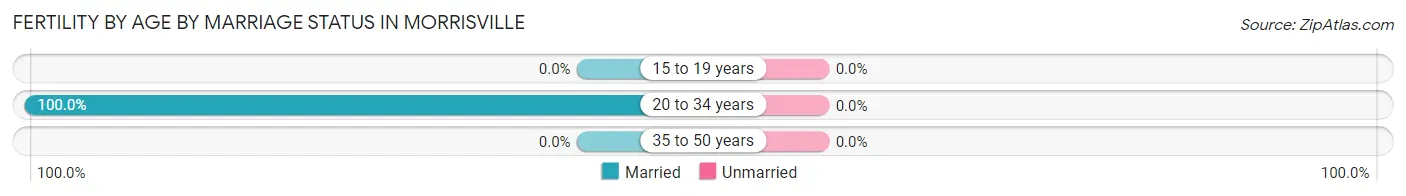
| Age Bracket | Married | Unmarried |
| 15 to 19 years | 0 (0.0%) | 0 (0.0%) |
| 20 to 34 years | 22 (100.0%) | 0 (0.0%) |
| 35 to 50 years | 0 (0.0%) | 0 (0.0%) |
| Total | 22 (100.0%) | 0 (0.0%) |
Fertility by Education in Morrisville
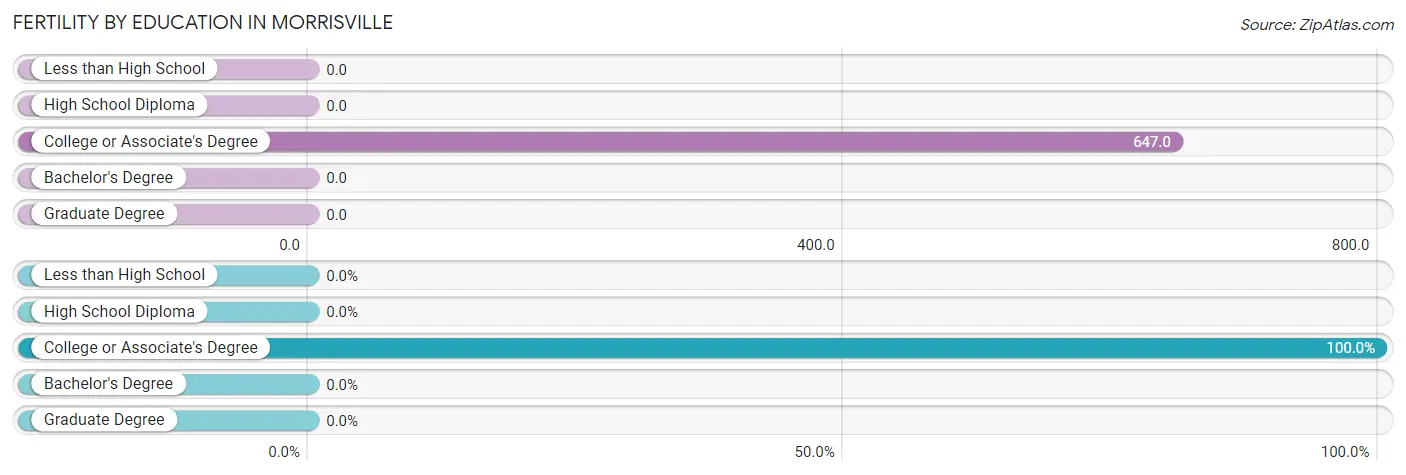
| Educational Attainment | Women with Births | Births / 1,000 Women |
| Less than High School | 0 (0.0%) | 0.0 |
| High School Diploma | 0 (0.0%) | 0.0 |
| College or Associate's Degree | 22 (100.0%) | 647.0 |
| Bachelor's Degree | 0 (0.0%) | 0.0 |
| Graduate Degree | 0 (0.0%) | 0.0 |
| Total | 22 (100.0%) | 278.0 |
Fertility by Education by Marriage Status in Morrisville
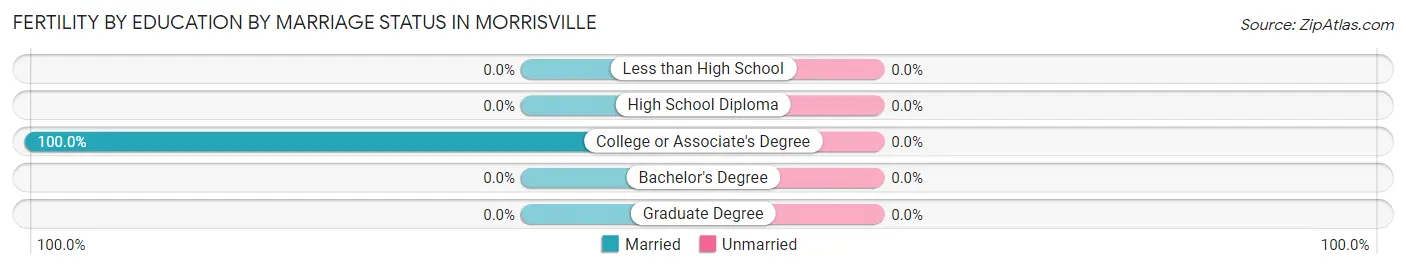
| Educational Attainment | Married | Unmarried |
| Less than High School | 0 (0.0%) | 0 (0.0%) |
| High School Diploma | 0 (0.0%) | 0 (0.0%) |
| College or Associate's Degree | 22 (100.0%) | 0 (0.0%) |
| Bachelor's Degree | 0 (0.0%) | 0 (0.0%) |
| Graduate Degree | 0 (0.0%) | 0 (0.0%) |
| Total | 22 (100.0%) | 0 (0.0%) |
Employment Characteristics in Morrisville
Employment by Class of Employer in Morrisville
Among the 397 employed individuals in Morrisville, private company employees (257 | 64.7%), local government employees (43 | 10.8%), and self-employed (incorporated) (31 | 7.8%) make up the most common classes of employment.
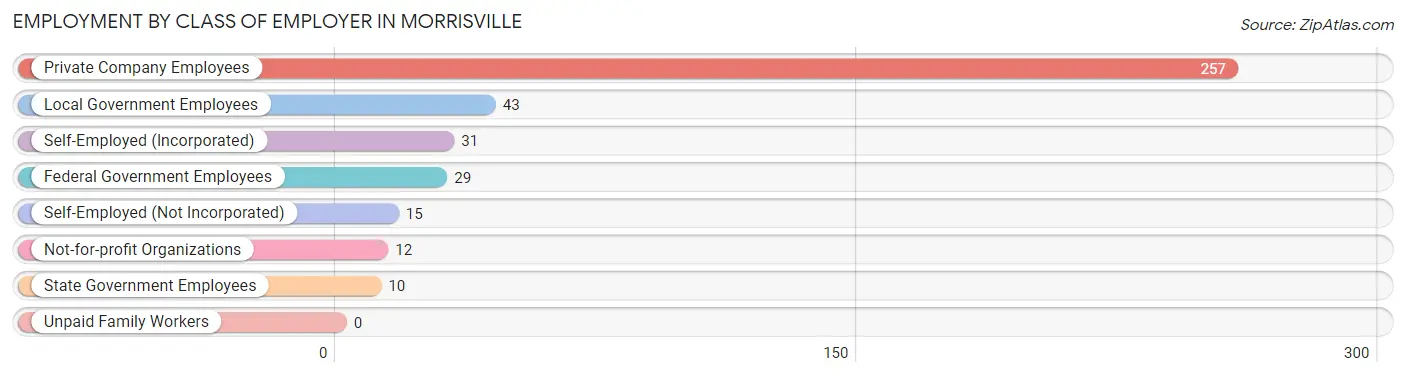
| Employer Class | # Employees | % Employees |
| Private Company Employees | 257 | 64.7% |
| Self-Employed (Incorporated) | 31 | 7.8% |
| Self-Employed (Not Incorporated) | 15 | 3.8% |
| Not-for-profit Organizations | 12 | 3.0% |
| Local Government Employees | 43 | 10.8% |
| State Government Employees | 10 | 2.5% |
| Federal Government Employees | 29 | 7.3% |
| Unpaid Family Workers | 0 | 0.0% |
| Total | 397 | 100.0% |
Employment Status by Age in Morrisville
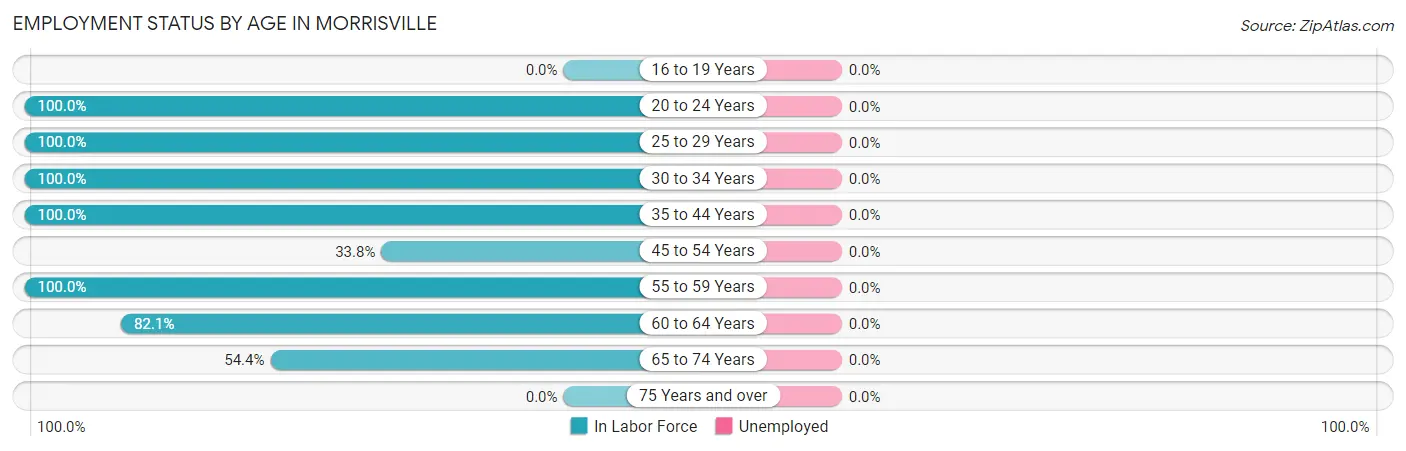
| Age Bracket | In Labor Force | Unemployed |
| 16 to 19 Years | 0 (0.0%) | 0 (0.0%) |
| 20 to 24 Years | 4 (100.0%) | 0 (0.0%) |
| 25 to 29 Years | 91 (100.0%) | 0 (0.0%) |
| 30 to 34 Years | 21 (100.0%) | 0 (0.0%) |
| 35 to 44 Years | 16 (100.0%) | 0 (0.0%) |
| 45 to 54 Years | 23 (33.8%) | 0 (0.0%) |
| 55 to 59 Years | 42 (100.0%) | 0 (0.0%) |
| 60 to 64 Years | 165 (82.1%) | 0 (0.0%) |
| 65 to 74 Years | 68 (54.4%) | 0 (0.0%) |
| 75 Years and over | 0 (0.0%) | 0 (0.0%) |
| Total | 430 (53.9%) | 0 (0.0%) |
Employment Status by Educational Attainment in Morrisville
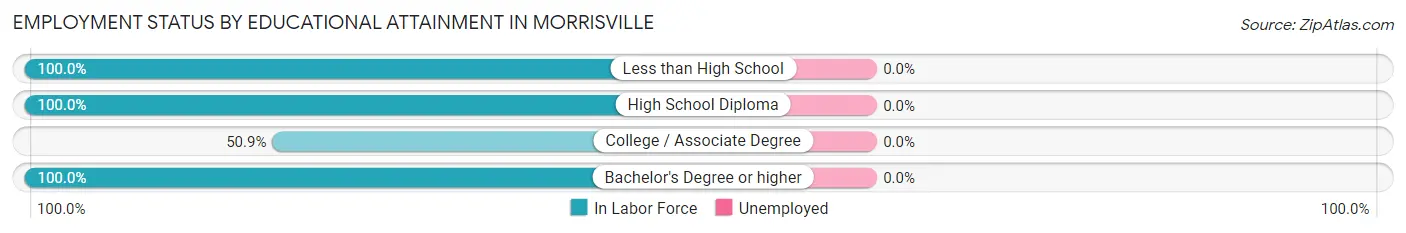
| Educational Attainment | In Labor Force | Unemployed |
| Less than High School | 69 (100.0%) | 0 (0.0%) |
| High School Diploma | 53 (100.0%) | 0 (0.0%) |
| College / Associate Degree | 84 (50.9%) | 0 (0.0%) |
| Bachelor's Degree or higher | 152 (100.0%) | 0 (0.0%) |
| Total | 358 (81.5%) | 0 (0.0%) |
Employment Occupations by Sex in Morrisville
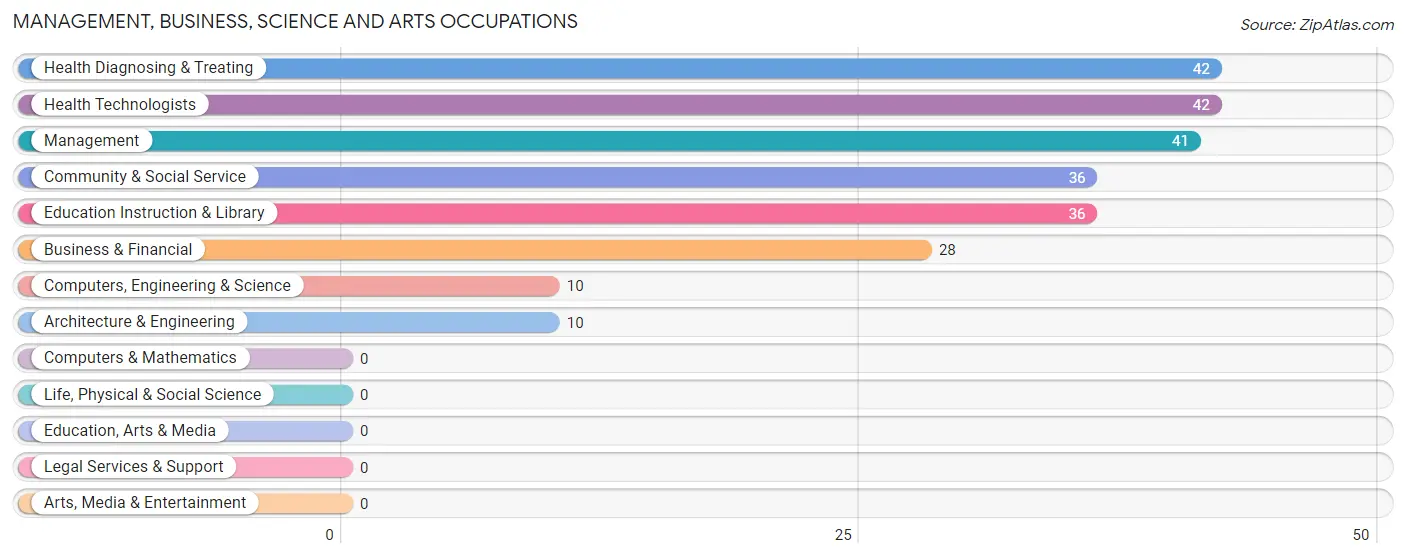
Management, Business, Science and Arts Occupations
The most common Management, Business, Science and Arts occupations in Morrisville are Health Diagnosing & Treating (42 | 9.8%), Health Technologists (42 | 9.8%), Management (41 | 9.5%), Community & Social Service (36 | 8.4%), and Education Instruction & Library (36 | 8.4%).
Management, Business, Science and Arts Occupations by Sex
Within the Management, Business, Science and Arts occupations in Morrisville, the most male-oriented occupations are Computers, Engineering & Science (100.0%), Architecture & Engineering (100.0%), and Community & Social Service (58.3%), while the most female-oriented occupations are Management (100.0%), Business & Financial (100.0%), and Health Diagnosing & Treating (100.0%).
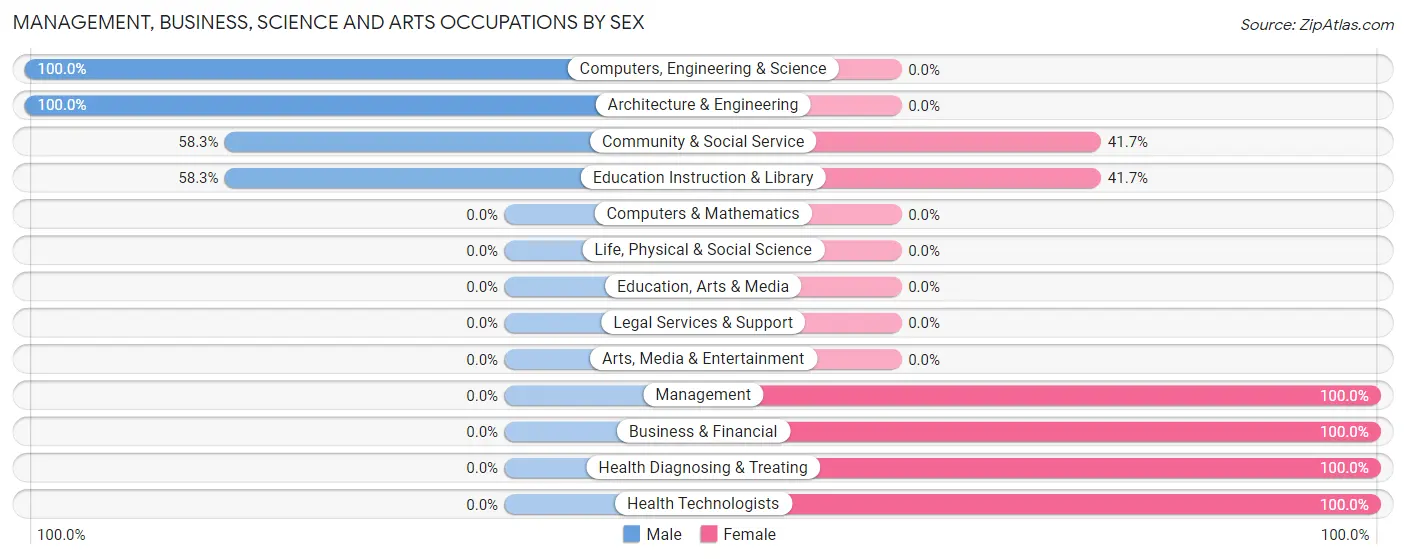
| Occupation | Male | Female |
| Management | 0 (0.0%) | 41 (100.0%) |
| Business & Financial | 0 (0.0%) | 28 (100.0%) |
| Computers, Engineering & Science | 10 (100.0%) | 0 (0.0%) |
| Computers & Mathematics | 0 (0.0%) | 0 (0.0%) |
| Architecture & Engineering | 10 (100.0%) | 0 (0.0%) |
| Life, Physical & Social Science | 0 (0.0%) | 0 (0.0%) |
| Community & Social Service | 21 (58.3%) | 15 (41.7%) |
| Education, Arts & Media | 0 (0.0%) | 0 (0.0%) |
| Legal Services & Support | 0 (0.0%) | 0 (0.0%) |
| Education Instruction & Library | 21 (58.3%) | 15 (41.7%) |
| Arts, Media & Entertainment | 0 (0.0%) | 0 (0.0%) |
| Health Diagnosing & Treating | 0 (0.0%) | 42 (100.0%) |
| Health Technologists | 0 (0.0%) | 42 (100.0%) |
| Total (Category) | 31 (19.8%) | 126 (80.2%) |
| Total (Overall) | 158 (36.7%) | 272 (63.3%) |
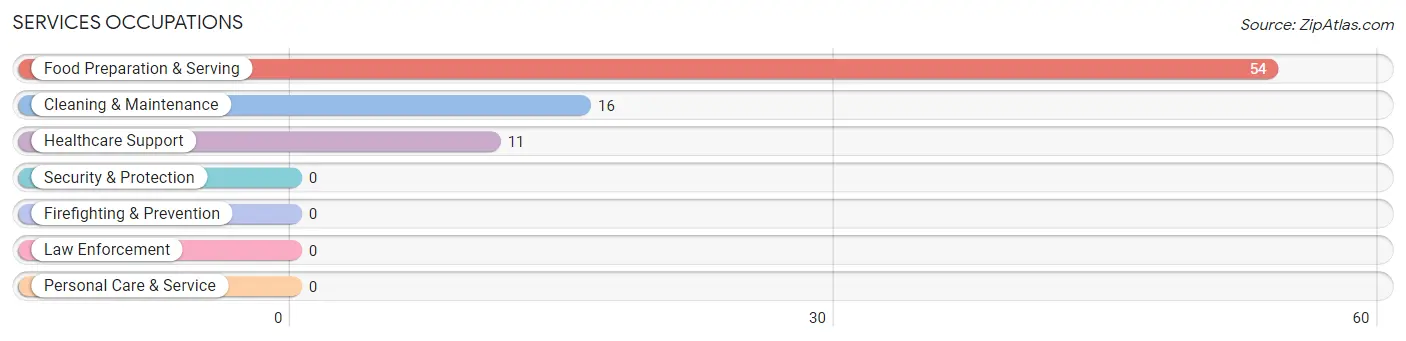
Services Occupations
The most common Services occupations in Morrisville are Food Preparation & Serving (54 | 12.6%), Cleaning & Maintenance (16 | 3.7%), and Healthcare Support (11 | 2.6%).
Services Occupations by Sex
Within the Services occupations in Morrisville, the most male-oriented occupations are Cleaning & Maintenance (100.0%), and Food Preparation & Serving (20.4%), while the most female-oriented occupations are Healthcare Support (100.0%), and Food Preparation & Serving (79.6%).
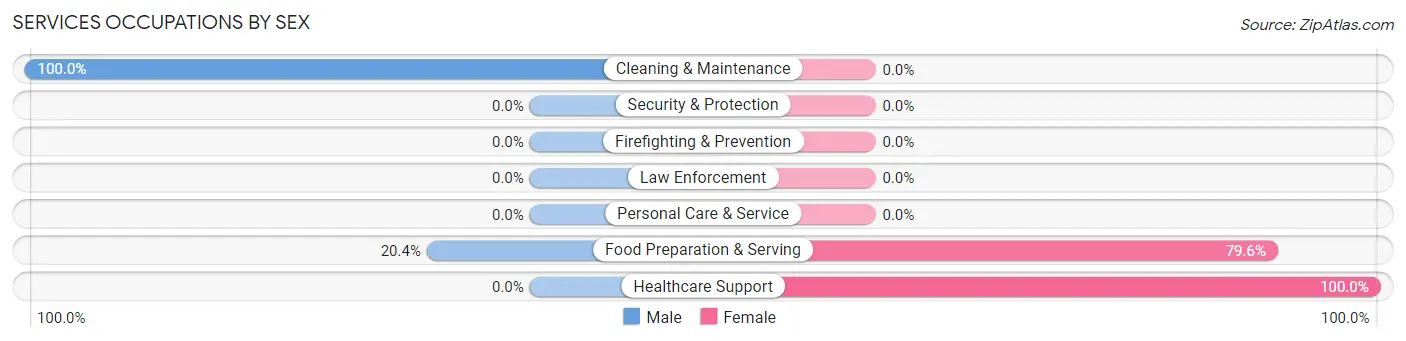
| Occupation | Male | Female |
| Healthcare Support | 0 (0.0%) | 11 (100.0%) |
| Security & Protection | 0 (0.0%) | 0 (0.0%) |
| Firefighting & Prevention | 0 (0.0%) | 0 (0.0%) |
| Law Enforcement | 0 (0.0%) | 0 (0.0%) |
| Food Preparation & Serving | 11 (20.4%) | 43 (79.6%) |
| Cleaning & Maintenance | 16 (100.0%) | 0 (0.0%) |
| Personal Care & Service | 0 (0.0%) | 0 (0.0%) |
| Total (Category) | 27 (33.3%) | 54 (66.7%) |
| Total (Overall) | 158 (36.7%) | 272 (63.3%) |
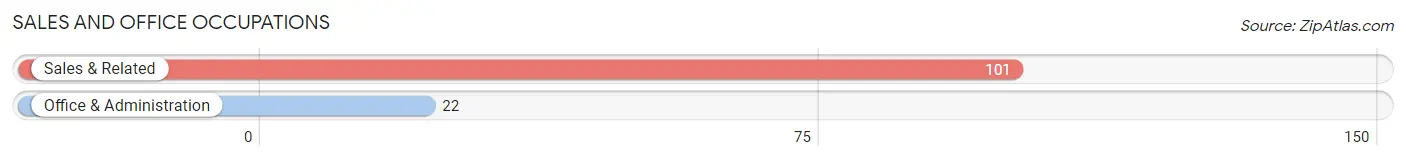
Sales and Office Occupations
The most common Sales and Office occupations in Morrisville are Sales & Related (101 | 23.5%), and Office & Administration (22 | 5.1%).
Sales and Office Occupations by Sex
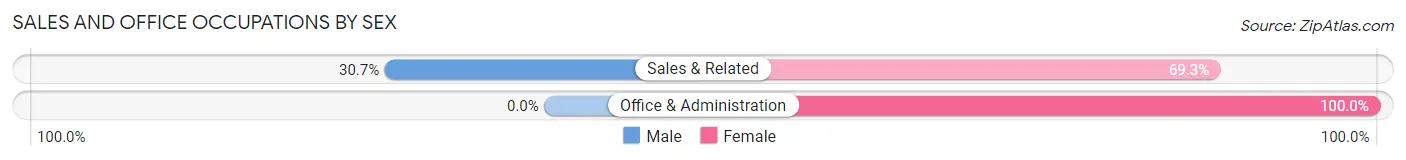
| Occupation | Male | Female |
| Sales & Related | 31 (30.7%) | 70 (69.3%) |
| Office & Administration | 0 (0.0%) | 22 (100.0%) |
| Total (Category) | 31 (25.2%) | 92 (74.8%) |
| Total (Overall) | 158 (36.7%) | 272 (63.3%) |
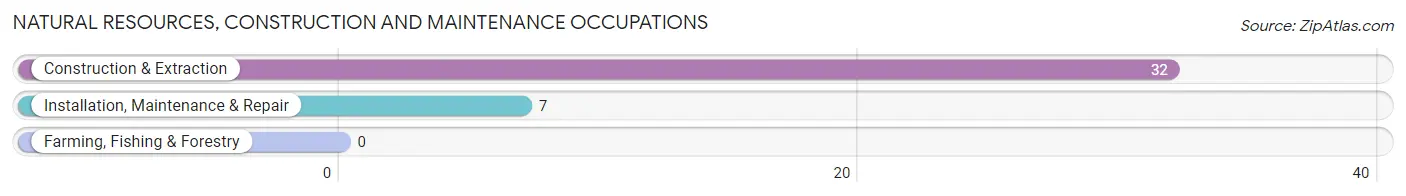
Natural Resources, Construction and Maintenance Occupations
The most common Natural Resources, Construction and Maintenance occupations in Morrisville are Construction & Extraction (32 | 7.4%), and Installation, Maintenance & Repair (7 | 1.6%).
Natural Resources, Construction and Maintenance Occupations by Sex
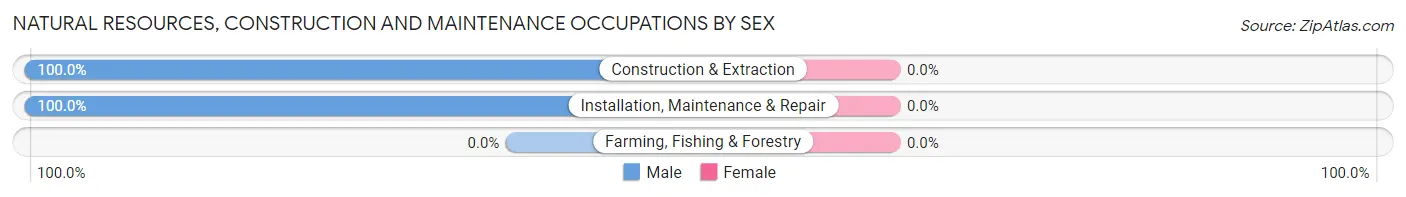
| Occupation | Male | Female |
| Farming, Fishing & Forestry | 0 (0.0%) | 0 (0.0%) |
| Construction & Extraction | 32 (100.0%) | 0 (0.0%) |
| Installation, Maintenance & Repair | 7 (100.0%) | 0 (0.0%) |
| Total (Category) | 39 (100.0%) | 0 (0.0%) |
| Total (Overall) | 158 (36.7%) | 272 (63.3%) |
Production, Transportation and Moving Occupations
The most common Production, Transportation and Moving occupations in Morrisville are Material Moving (13 | 3.0%), Transportation (11 | 2.6%), and Production (6 | 1.4%).
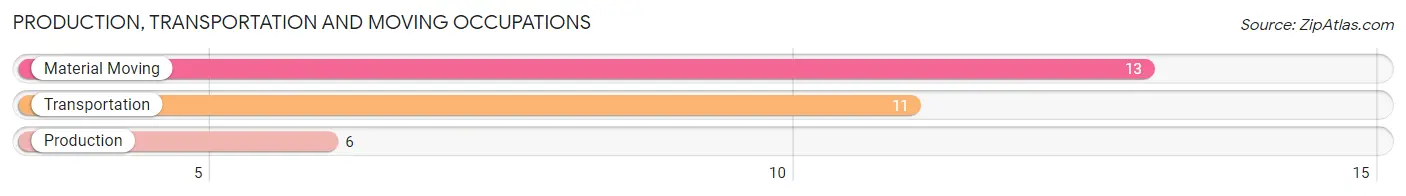
Production, Transportation and Moving Occupations by Sex
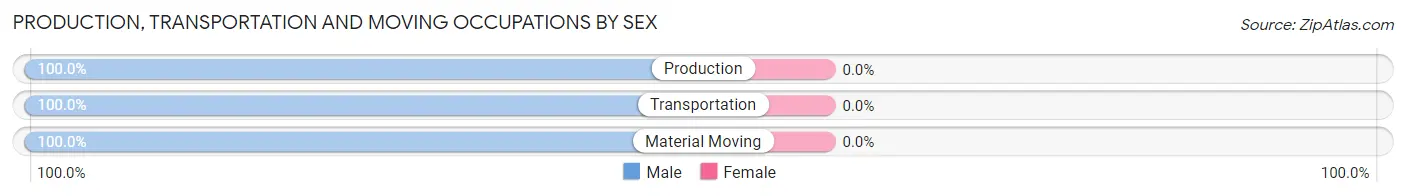
| Occupation | Male | Female |
| Production | 6 (100.0%) | 0 (0.0%) |
| Transportation | 11 (100.0%) | 0 (0.0%) |
| Material Moving | 13 (100.0%) | 0 (0.0%) |
| Total (Category) | 30 (100.0%) | 0 (0.0%) |
| Total (Overall) | 158 (36.7%) | 272 (63.3%) |
Employment Industries by Sex in Morrisville
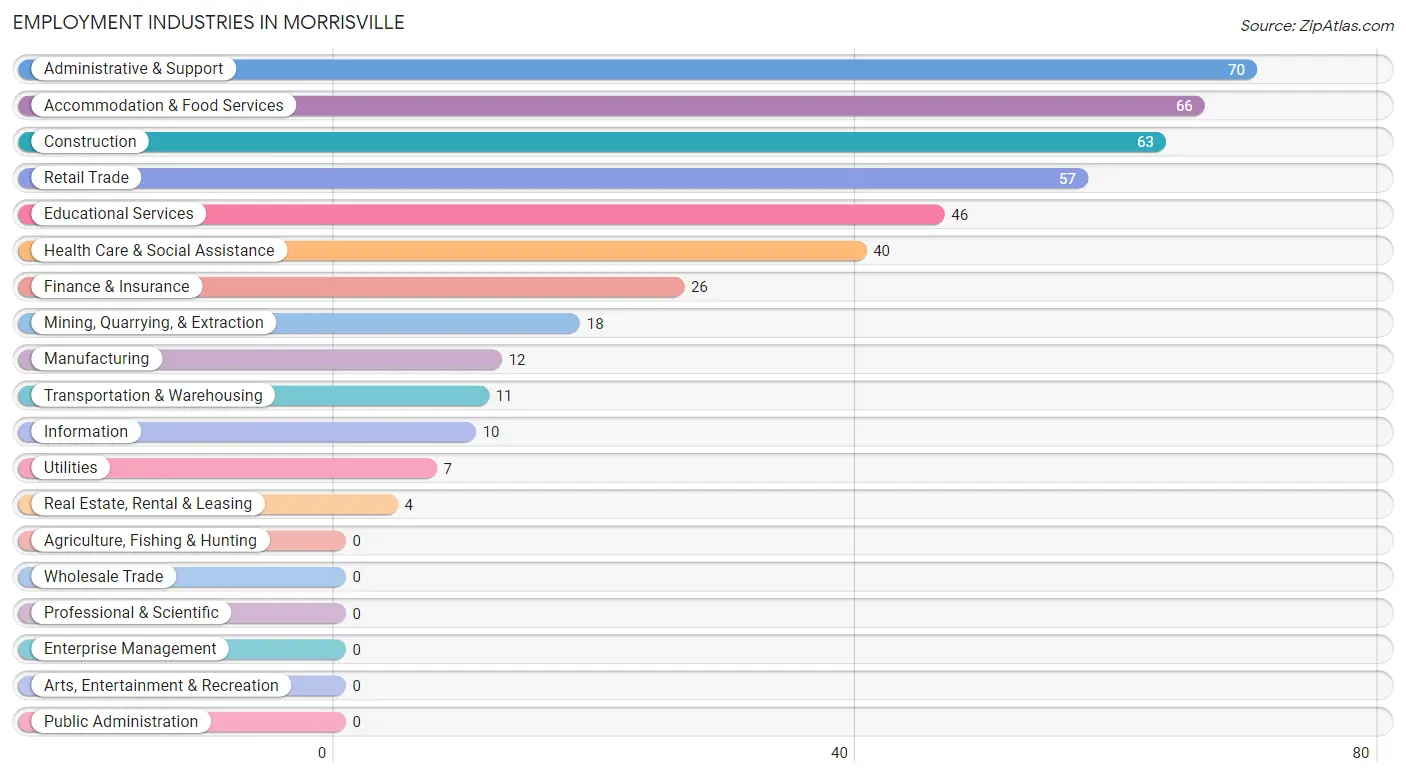
Employment Industries in Morrisville
The major employment industries in Morrisville include Administrative & Support (70 | 16.3%), Accommodation & Food Services (66 | 15.3%), Construction (63 | 14.6%), Retail Trade (57 | 13.3%), and Educational Services (46 | 10.7%).
Employment Industries by Sex in Morrisville
The Morrisville industries that see more men than women are Transportation & Warehousing (100.0%), Utilities (100.0%), and Information (100.0%), whereas the industries that tend to have a higher number of women are Manufacturing (100.0%), Finance & Insurance (100.0%), and Administrative & Support (100.0%).
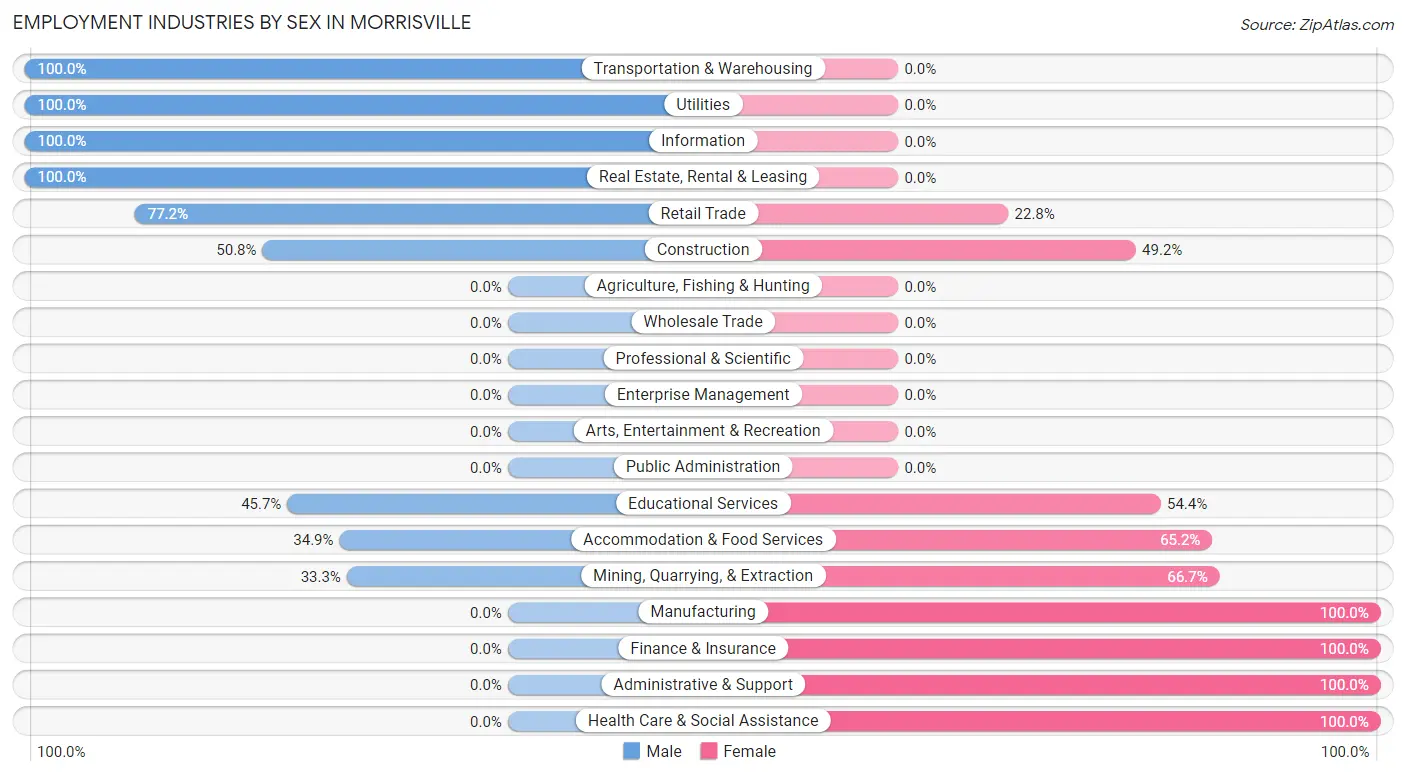
| Industry | Male | Female |
| Agriculture, Fishing & Hunting | 0 (0.0%) | 0 (0.0%) |
| Mining, Quarrying, & Extraction | 6 (33.3%) | 12 (66.7%) |
| Construction | 32 (50.8%) | 31 (49.2%) |
| Manufacturing | 0 (0.0%) | 12 (100.0%) |
| Wholesale Trade | 0 (0.0%) | 0 (0.0%) |
| Retail Trade | 44 (77.2%) | 13 (22.8%) |
| Transportation & Warehousing | 11 (100.0%) | 0 (0.0%) |
| Utilities | 7 (100.0%) | 0 (0.0%) |
| Information | 10 (100.0%) | 0 (0.0%) |
| Finance & Insurance | 0 (0.0%) | 26 (100.0%) |
| Real Estate, Rental & Leasing | 4 (100.0%) | 0 (0.0%) |
| Professional & Scientific | 0 (0.0%) | 0 (0.0%) |
| Enterprise Management | 0 (0.0%) | 0 (0.0%) |
| Administrative & Support | 0 (0.0%) | 70 (100.0%) |
| Educational Services | 21 (45.7%) | 25 (54.3%) |
| Health Care & Social Assistance | 0 (0.0%) | 40 (100.0%) |
| Arts, Entertainment & Recreation | 0 (0.0%) | 0 (0.0%) |
| Accommodation & Food Services | 23 (34.8%) | 43 (65.1%) |
| Public Administration | 0 (0.0%) | 0 (0.0%) |
| Total | 158 (36.7%) | 272 (63.3%) |
Education in Morrisville
School Enrollment in Morrisville
The most common levels of schooling among the 141 students in Morrisville are middle school (82 | 58.2%), kindergarten (48 | 34.0%), and high school (11 | 7.8%).
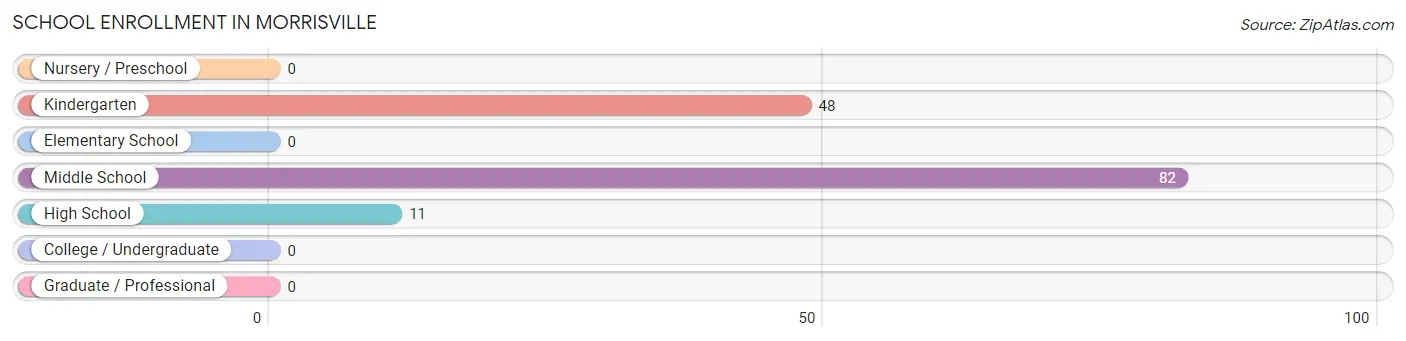
| School Level | # Students | % Students |
| Nursery / Preschool | 0 | 0.0% |
| Kindergarten | 48 | 34.0% |
| Elementary School | 0 | 0.0% |
| Middle School | 82 | 58.2% |
| High School | 11 | 7.8% |
| College / Undergraduate | 0 | 0.0% |
| Graduate / Professional | 0 | 0.0% |
| Total | 141 | 100.0% |
School Enrollment by Age by Funding Source in Morrisville
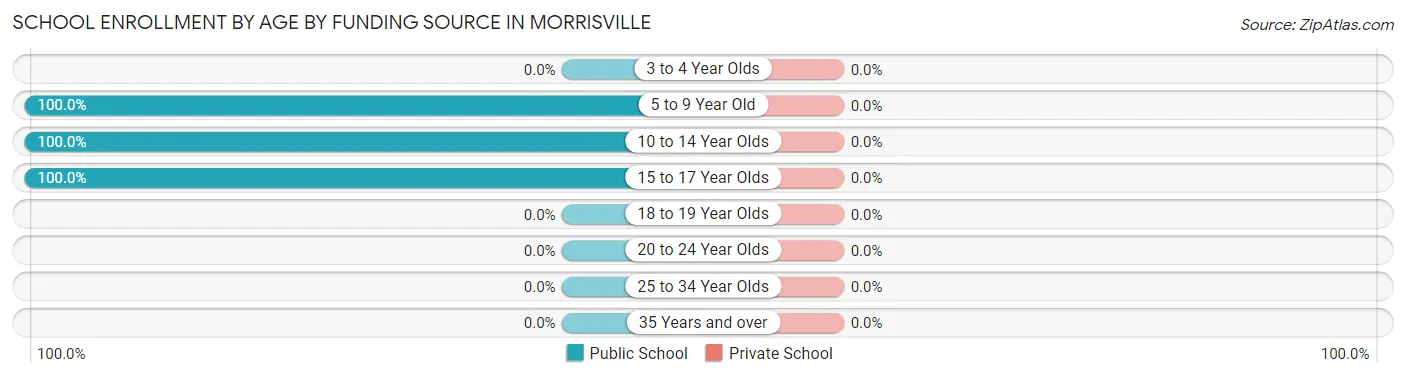
| Age Bracket | Public School | Private School |
| 3 to 4 Year Olds | 0 (0.0%) | 0 (0.0%) |
| 5 to 9 Year Old | 48 (100.0%) | 0 (0.0%) |
| 10 to 14 Year Olds | 82 (100.0%) | 0 (0.0%) |
| 15 to 17 Year Olds | 11 (100.0%) | 0 (0.0%) |
| 18 to 19 Year Olds | 0 (0.0%) | 0 (0.0%) |
| 20 to 24 Year Olds | 0 (0.0%) | 0 (0.0%) |
| 25 to 34 Year Olds | 0 (0.0%) | 0 (0.0%) |
| 35 Years and over | 0 (0.0%) | 0 (0.0%) |
| Total | 141 (100.0%) | 0 (0.0%) |
Educational Attainment by Field of Study in Morrisville
Education (132 | 58.9%), liberal arts & history (29 | 13.0%), bio, nature & agricultural (21 | 9.4%), science & technology (13 | 5.8%), and psychology (11 | 4.9%) are the most common fields of study among 224 individuals in Morrisville who have obtained a bachelor's degree or higher.
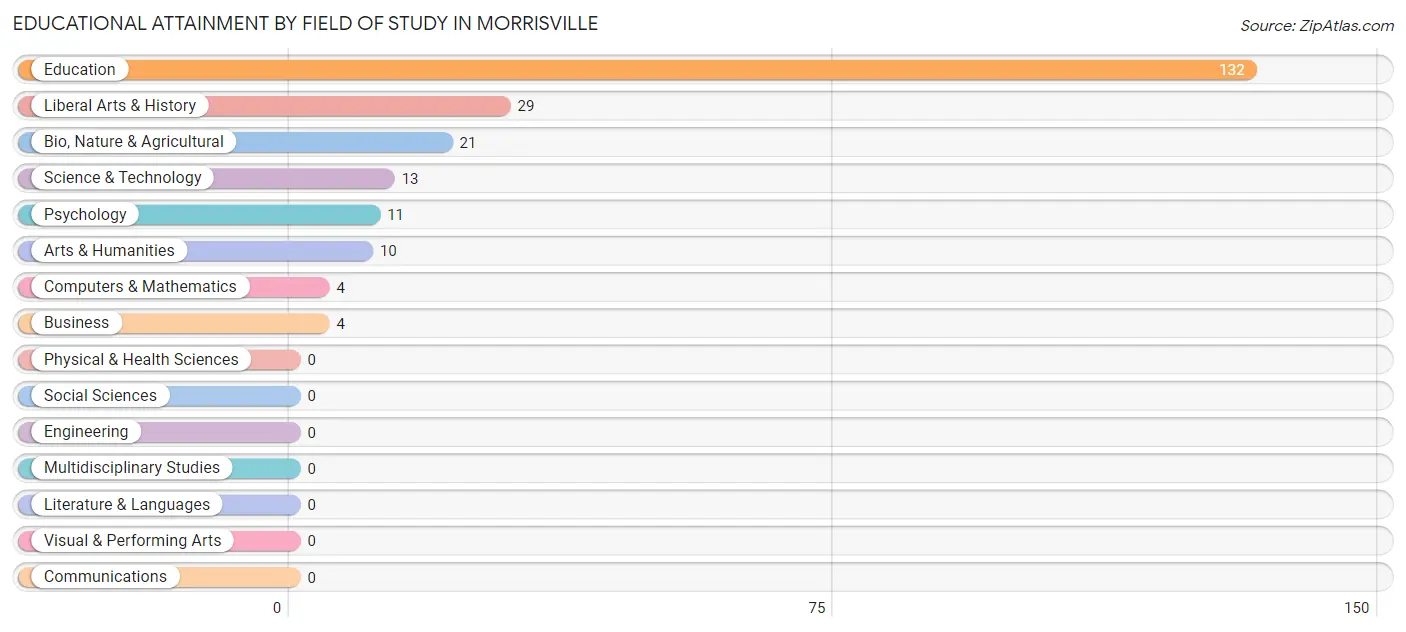
| Field of Study | # Graduates | % Graduates |
| Computers & Mathematics | 4 | 1.8% |
| Bio, Nature & Agricultural | 21 | 9.4% |
| Physical & Health Sciences | 0 | 0.0% |
| Psychology | 11 | 4.9% |
| Social Sciences | 0 | 0.0% |
| Engineering | 0 | 0.0% |
| Multidisciplinary Studies | 0 | 0.0% |
| Science & Technology | 13 | 5.8% |
| Business | 4 | 1.8% |
| Education | 132 | 58.9% |
| Literature & Languages | 0 | 0.0% |
| Liberal Arts & History | 29 | 13.0% |
| Visual & Performing Arts | 0 | 0.0% |
| Communications | 0 | 0.0% |
| Arts & Humanities | 10 | 4.5% |
| Total | 224 | 100.0% |
Transportation & Commute in Morrisville
Vehicle Availability by Sex in Morrisville
The most prevalent vehicle ownership categories in Morrisville are males with 2 vehicles (82, accounting for 55.8%) and females with 2 vehicles (104, making up 32.8%).
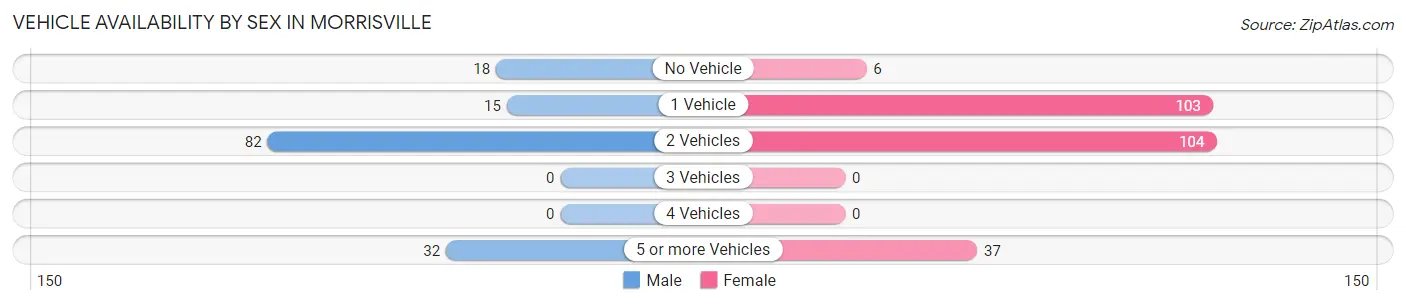
| Vehicles Available | Male | Female |
| No Vehicle | 18 (12.2%) | 6 (2.4%) |
| 1 Vehicle | 15 (10.2%) | 103 (41.2%) |
| 2 Vehicles | 82 (55.8%) | 104 (41.6%) |
| 3 Vehicles | 0 (0.0%) | 0 (0.0%) |
| 4 Vehicles | 0 (0.0%) | 0 (0.0%) |
| 5 or more Vehicles | 32 (21.8%) | 37 (14.8%) |
| Total | 147 (100.0%) | 250 (100.0%) |
Commute Time in Morrisville
The most frequently occuring commute durations in Morrisville are 5 to 9 minutes (148 commuters, 49.7%), 15 to 19 minutes (51 commuters, 17.1%), and 20 to 24 minutes (38 commuters, 12.8%).
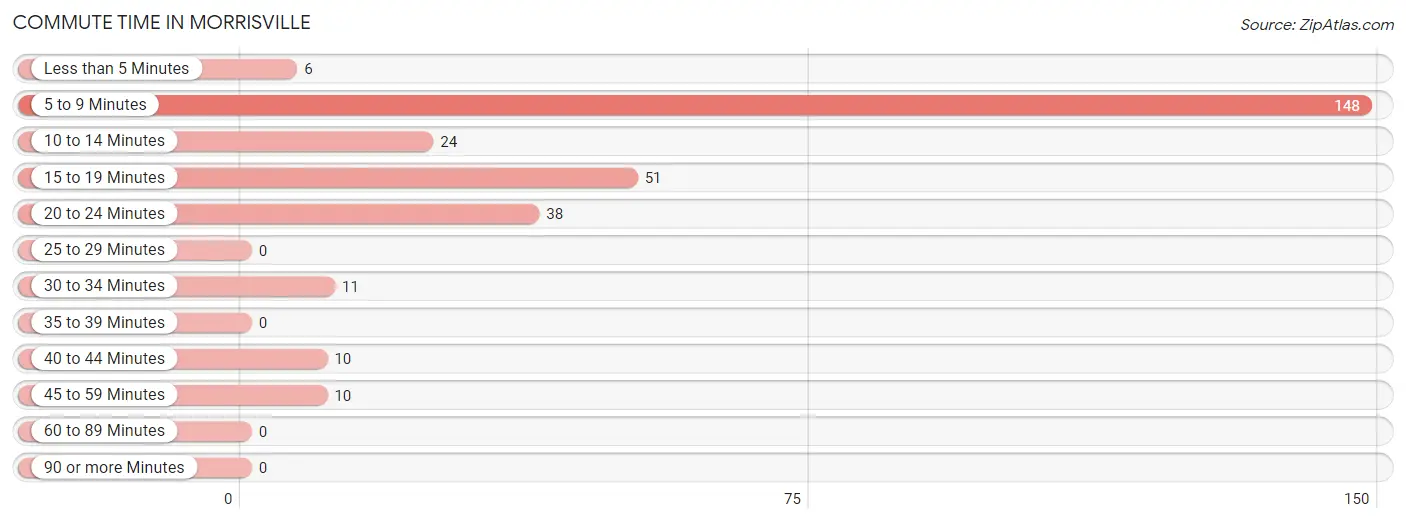
| Commute Time | # Commuters | % Commuters |
| Less than 5 Minutes | 6 | 2.0% |
| 5 to 9 Minutes | 148 | 49.7% |
| 10 to 14 Minutes | 24 | 8.1% |
| 15 to 19 Minutes | 51 | 17.1% |
| 20 to 24 Minutes | 38 | 12.8% |
| 25 to 29 Minutes | 0 | 0.0% |
| 30 to 34 Minutes | 11 | 3.7% |
| 35 to 39 Minutes | 0 | 0.0% |
| 40 to 44 Minutes | 10 | 3.4% |
| 45 to 59 Minutes | 10 | 3.4% |
| 60 to 89 Minutes | 0 | 0.0% |
| 90 or more Minutes | 0 | 0.0% |
Commute Time by Sex in Morrisville
The most common commute times in Morrisville are 5 to 9 minutes (64 commuters, 43.5%) for males and 5 to 9 minutes (84 commuters, 55.6%) for females.
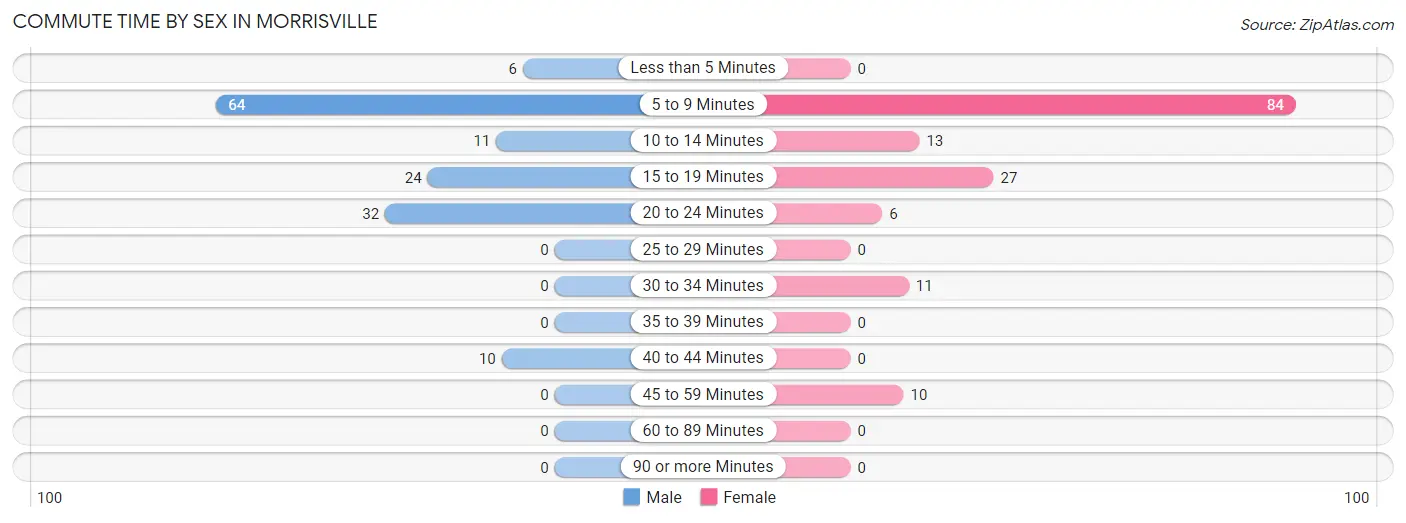
| Commute Time | Male | Female |
| Less than 5 Minutes | 6 (4.1%) | 0 (0.0%) |
| 5 to 9 Minutes | 64 (43.5%) | 84 (55.6%) |
| 10 to 14 Minutes | 11 (7.5%) | 13 (8.6%) |
| 15 to 19 Minutes | 24 (16.3%) | 27 (17.9%) |
| 20 to 24 Minutes | 32 (21.8%) | 6 (4.0%) |
| 25 to 29 Minutes | 0 (0.0%) | 0 (0.0%) |
| 30 to 34 Minutes | 0 (0.0%) | 11 (7.3%) |
| 35 to 39 Minutes | 0 (0.0%) | 0 (0.0%) |
| 40 to 44 Minutes | 10 (6.8%) | 0 (0.0%) |
| 45 to 59 Minutes | 0 (0.0%) | 10 (6.6%) |
| 60 to 89 Minutes | 0 (0.0%) | 0 (0.0%) |
| 90 or more Minutes | 0 (0.0%) | 0 (0.0%) |
Time of Departure to Work by Sex in Morrisville
The most frequent times of departure to work in Morrisville are 12:00 AM to 4:59 AM (32, 21.8%) for males and 8:30 AM to 8:59 AM (42, 27.8%) for females.
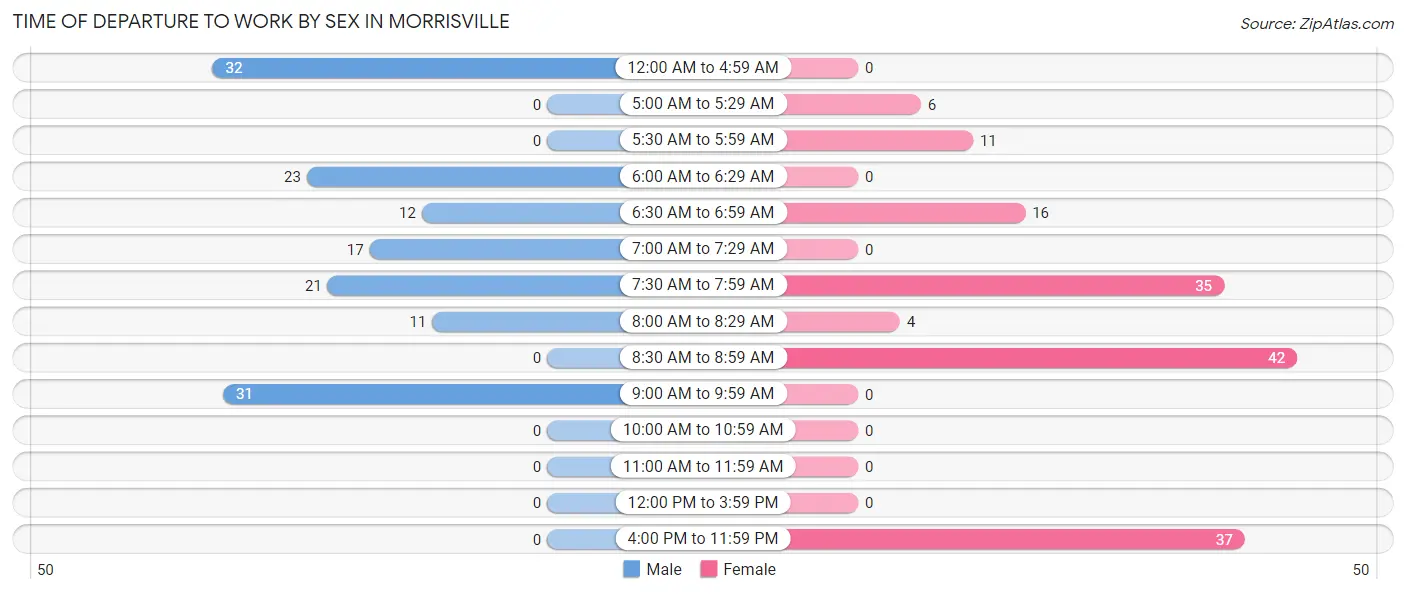
| Time of Departure | Male | Female |
| 12:00 AM to 4:59 AM | 32 (21.8%) | 0 (0.0%) |
| 5:00 AM to 5:29 AM | 0 (0.0%) | 6 (4.0%) |
| 5:30 AM to 5:59 AM | 0 (0.0%) | 11 (7.3%) |
| 6:00 AM to 6:29 AM | 23 (15.7%) | 0 (0.0%) |
| 6:30 AM to 6:59 AM | 12 (8.2%) | 16 (10.6%) |
| 7:00 AM to 7:29 AM | 17 (11.6%) | 0 (0.0%) |
| 7:30 AM to 7:59 AM | 21 (14.3%) | 35 (23.2%) |
| 8:00 AM to 8:29 AM | 11 (7.5%) | 4 (2.6%) |
| 8:30 AM to 8:59 AM | 0 (0.0%) | 42 (27.8%) |
| 9:00 AM to 9:59 AM | 31 (21.1%) | 0 (0.0%) |
| 10:00 AM to 10:59 AM | 0 (0.0%) | 0 (0.0%) |
| 11:00 AM to 11:59 AM | 0 (0.0%) | 0 (0.0%) |
| 12:00 PM to 3:59 PM | 0 (0.0%) | 0 (0.0%) |
| 4:00 PM to 11:59 PM | 0 (0.0%) | 37 (24.5%) |
| Total | 147 (100.0%) | 151 (100.0%) |
Housing Occupancy in Morrisville
Occupancy by Ownership in Morrisville
Of the total 554 dwellings in Morrisville, owner-occupied units account for 325 (58.7%), while renter-occupied units make up 229 (41.3%).
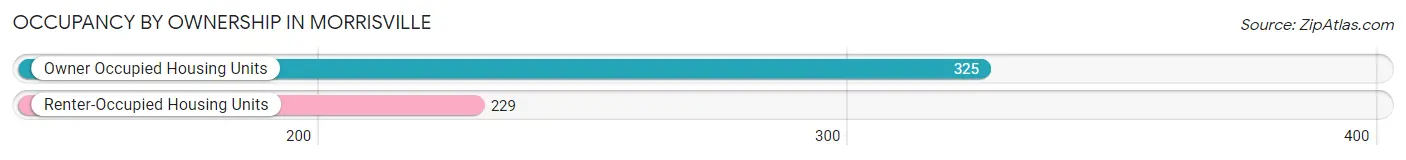
| Occupancy | # Housing Units | % Housing Units |
| Owner Occupied Housing Units | 325 | 58.7% |
| Renter-Occupied Housing Units | 229 | 41.3% |
| Total Occupied Housing Units | 554 | 100.0% |
Occupancy by Household Size in Morrisville
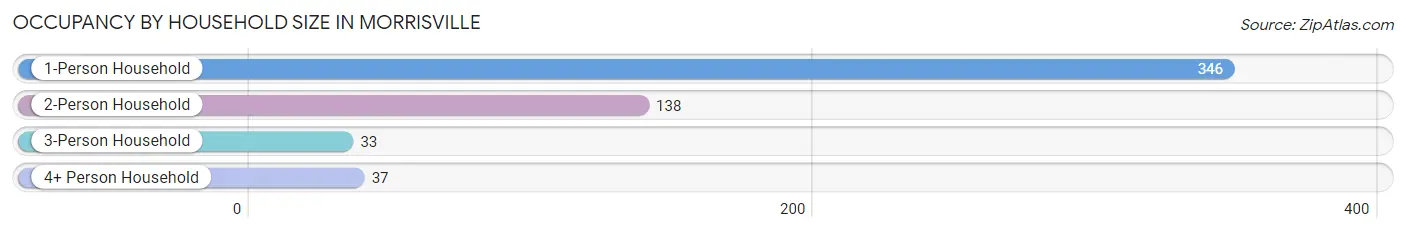
| Household Size | # Housing Units | % Housing Units |
| 1-Person Household | 346 | 62.5% |
| 2-Person Household | 138 | 24.9% |
| 3-Person Household | 33 | 6.0% |
| 4+ Person Household | 37 | 6.7% |
| Total Housing Units | 554 | 100.0% |
Occupancy by Ownership by Household Size in Morrisville
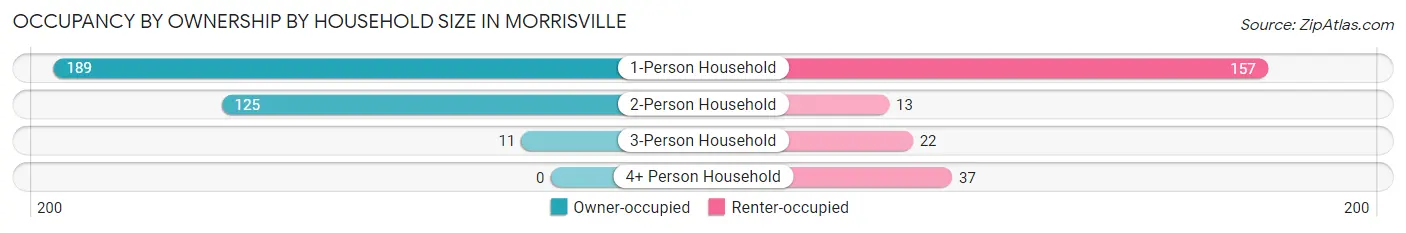
| Household Size | Owner-occupied | Renter-occupied |
| 1-Person Household | 189 (54.6%) | 157 (45.4%) |
| 2-Person Household | 125 (90.6%) | 13 (9.4%) |
| 3-Person Household | 11 (33.3%) | 22 (66.7%) |
| 4+ Person Household | 0 (0.0%) | 37 (100.0%) |
| Total Housing Units | 325 (58.7%) | 229 (41.3%) |
Occupancy by Educational Attainment in Morrisville
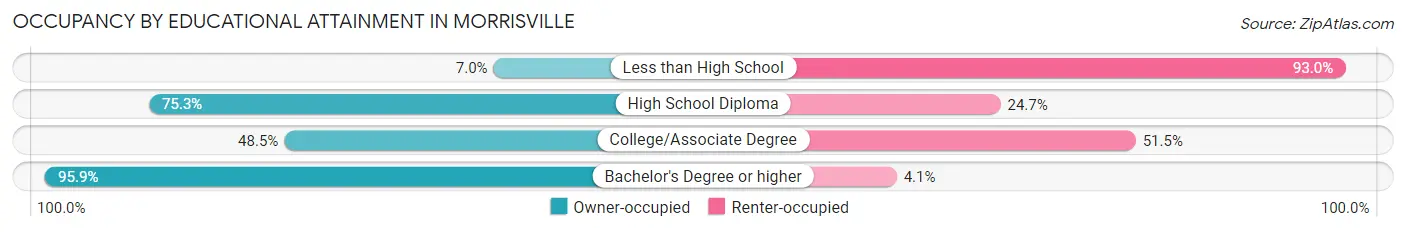
| Household Size | Owner-occupied | Renter-occupied |
| Less than High School | 5 (7.0%) | 66 (93.0%) |
| High School Diploma | 110 (75.3%) | 36 (24.7%) |
| College/Associate Degree | 116 (48.5%) | 123 (51.5%) |
| Bachelor's Degree or higher | 94 (95.9%) | 4 (4.1%) |
Occupancy by Age of Householder in Morrisville
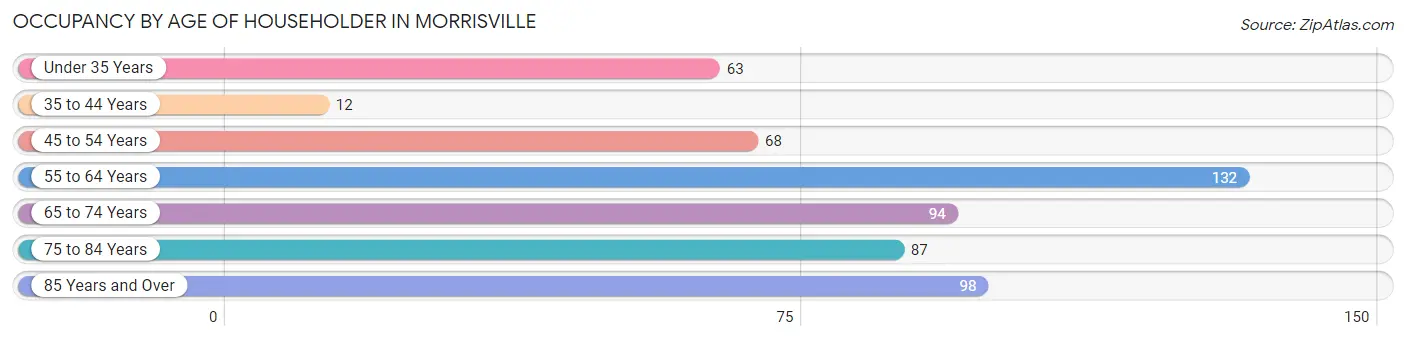
| Age Bracket | # Households | % Households |
| Under 35 Years | 63 | 11.4% |
| 35 to 44 Years | 12 | 2.2% |
| 45 to 54 Years | 68 | 12.3% |
| 55 to 64 Years | 132 | 23.8% |
| 65 to 74 Years | 94 | 17.0% |
| 75 to 84 Years | 87 | 15.7% |
| 85 Years and Over | 98 | 17.7% |
| Total | 554 | 100.0% |
Housing Finances in Morrisville
Median Income by Occupancy in Morrisville
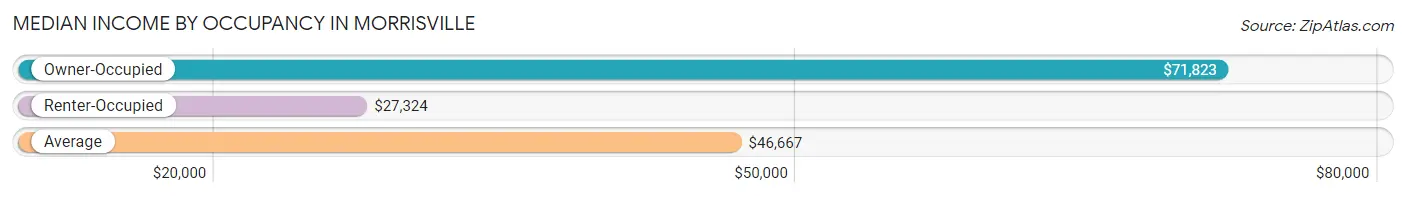
| Occupancy Type | # Households | Median Income |
| Owner-Occupied | 325 (58.7%) | $71,823 |
| Renter-Occupied | 229 (41.3%) | $27,324 |
| Average | 554 (100.0%) | $46,667 |
Occupancy by Householder Income Bracket in Morrisville
| Income Bracket | Owner-occupied | Renter-occupied |
| Less than $5,000 | 0 (0.0%) | 13 (5.7%) |
| $5,000 to $9,999 | 17 (5.2%) | 9 (3.9%) |
| $10,000 to $14,999 | 24 (7.4%) | 12 (5.2%) |
| $15,000 to $19,999 | 11 (3.4%) | 17 (7.4%) |
| $20,000 to $24,999 | 10 (3.1%) | 4 (1.8%) |
| $25,000 to $34,999 | 11 (3.4%) | 87 (38.0%) |
| $35,000 to $49,999 | 52 (16.0%) | 15 (6.6%) |
| $50,000 to $74,999 | 55 (16.9%) | 13 (5.7%) |
| $75,000 to $99,999 | 43 (13.2%) | 22 (9.6%) |
| $100,000 to $149,999 | 49 (15.1%) | 37 (16.2%) |
| $150,000 or more | 53 (16.3%) | 0 (0.0%) |
| Total | 325 (100.0%) | 229 (100.0%) |
Monthly Housing Cost Tiers in Morrisville
| Monthly Cost | Owner-occupied | Renter-occupied |
| Less than $300 | 45 (13.9%) | 21 (9.2%) |
| $300 to $499 | 72 (22.2%) | 0 (0.0%) |
| $500 to $799 | 58 (17.8%) | 89 (38.9%) |
| $800 to $999 | 61 (18.8%) | 56 (24.4%) |
| $1,000 to $1,499 | 78 (24.0%) | 0 (0.0%) |
| $1,500 to $1,999 | 11 (3.4%) | 37 (16.2%) |
| $2,000 to $2,499 | 0 (0.0%) | 0 (0.0%) |
| $2,500 to $2,999 | 0 (0.0%) | 0 (0.0%) |
| $3,000 or more | 0 (0.0%) | 0 (0.0%) |
| Total | 325 (100.0%) | 229 (100.0%) |
Physical Housing Characteristics in Morrisville
Housing Structures in Morrisville
| Structure Type | # Housing Units | % Housing Units |
| Single Unit, Detached | 311 | 56.1% |
| Single Unit, Attached | 0 | 0.0% |
| 2 Unit Apartments | 0 | 0.0% |
| 3 or 4 Unit Apartments | 31 | 5.6% |
| 5 to 9 Unit Apartments | 104 | 18.8% |
| 10 or more Apartments | 15 | 2.7% |
| Mobile Home / Other | 93 | 16.8% |
| Total | 554 | 100.0% |
Housing Structures by Occupancy in Morrisville
| Structure Type | Owner-occupied | Renter-occupied |
| Single Unit, Detached | 244 (78.5%) | 67 (21.5%) |
| Single Unit, Attached | 0 (0.0%) | 0 (0.0%) |
| 2 Unit Apartments | 0 (0.0%) | 0 (0.0%) |
| 3 or 4 Unit Apartments | 0 (0.0%) | 31 (100.0%) |
| 5 to 9 Unit Apartments | 0 (0.0%) | 104 (100.0%) |
| 10 or more Apartments | 0 (0.0%) | 15 (100.0%) |
| Mobile Home / Other | 81 (87.1%) | 12 (12.9%) |
| Total | 325 (58.7%) | 229 (41.3%) |
Housing Structures by Number of Rooms in Morrisville
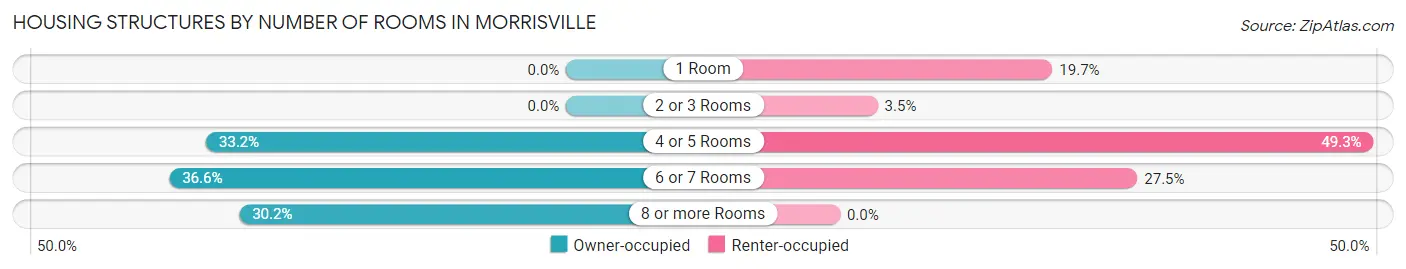
| Number of Rooms | Owner-occupied | Renter-occupied |
| 1 Room | 0 (0.0%) | 45 (19.7%) |
| 2 or 3 Rooms | 0 (0.0%) | 8 (3.5%) |
| 4 or 5 Rooms | 108 (33.2%) | 113 (49.3%) |
| 6 or 7 Rooms | 119 (36.6%) | 63 (27.5%) |
| 8 or more Rooms | 98 (30.1%) | 0 (0.0%) |
| Total | 325 (100.0%) | 229 (100.0%) |
Housing Structure by Heating Type in Morrisville
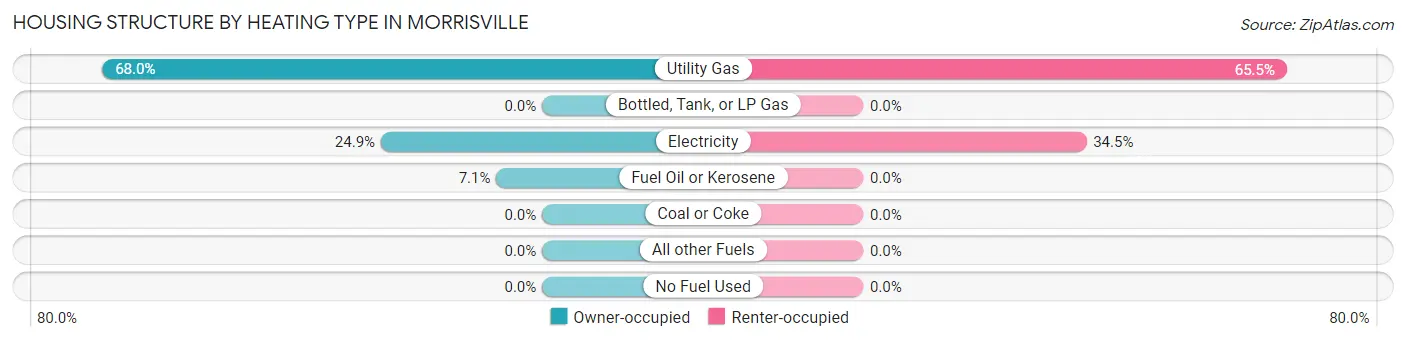
| Heating Type | Owner-occupied | Renter-occupied |
| Utility Gas | 221 (68.0%) | 150 (65.5%) |
| Bottled, Tank, or LP Gas | 0 (0.0%) | 0 (0.0%) |
| Electricity | 81 (24.9%) | 79 (34.5%) |
| Fuel Oil or Kerosene | 23 (7.1%) | 0 (0.0%) |
| Coal or Coke | 0 (0.0%) | 0 (0.0%) |
| All other Fuels | 0 (0.0%) | 0 (0.0%) |
| No Fuel Used | 0 (0.0%) | 0 (0.0%) |
| Total | 325 (100.0%) | 229 (100.0%) |
Household Vehicle Usage in Morrisville
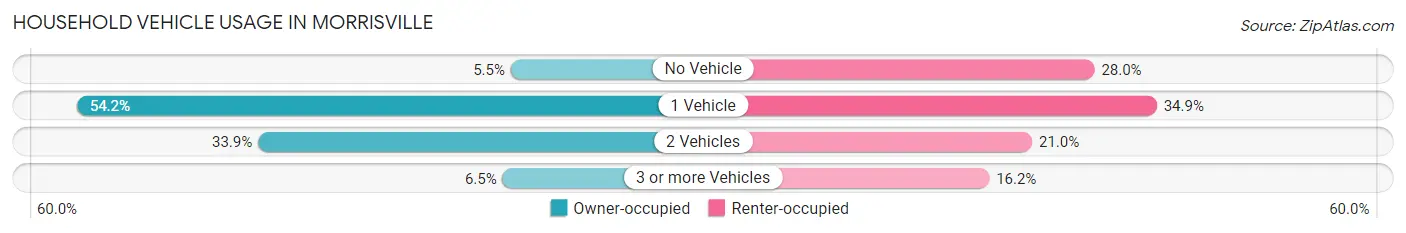
| Vehicles per Household | Owner-occupied | Renter-occupied |
| No Vehicle | 18 (5.5%) | 64 (28.0%) |
| 1 Vehicle | 176 (54.1%) | 80 (34.9%) |
| 2 Vehicles | 110 (33.9%) | 48 (21.0%) |
| 3 or more Vehicles | 21 (6.5%) | 37 (16.2%) |
| Total | 325 (100.0%) | 229 (100.0%) |
Real Estate & Mortgages in Morrisville
Real Estate and Mortgage Overview in Morrisville
| Characteristic | Without Mortgage | With Mortgage |
| Housing Units | 183 | 142 |
| Median Property Value | $177,800 | $170,400 |
| Median Household Income | - | - |
| Monthly Housing Costs | $390 | $0 |
| Real Estate Taxes | $1,308 | $0 |
Property Value by Mortgage Status in Morrisville
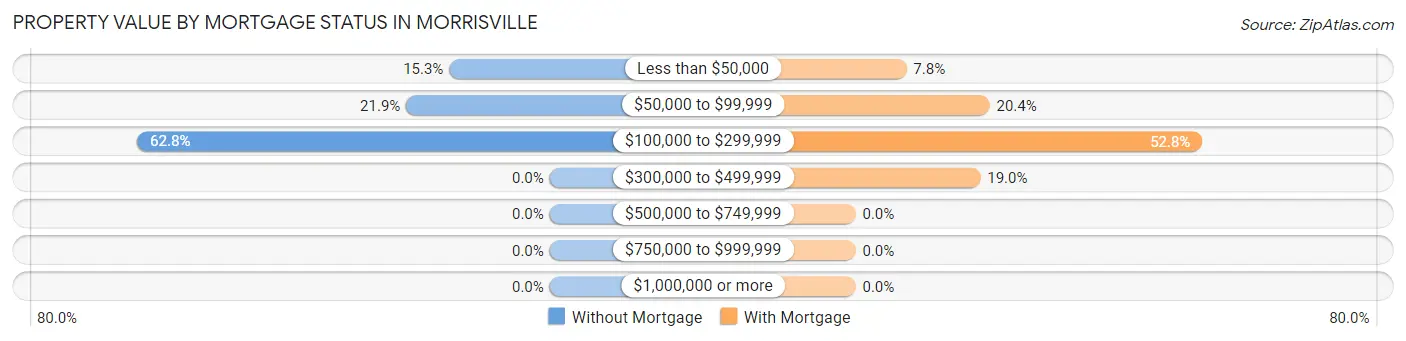
| Property Value | Without Mortgage | With Mortgage |
| Less than $50,000 | 28 (15.3%) | 11 (7.7%) |
| $50,000 to $99,999 | 40 (21.9%) | 29 (20.4%) |
| $100,000 to $299,999 | 115 (62.8%) | 75 (52.8%) |
| $300,000 to $499,999 | 0 (0.0%) | 27 (19.0%) |
| $500,000 to $749,999 | 0 (0.0%) | 0 (0.0%) |
| $750,000 to $999,999 | 0 (0.0%) | 0 (0.0%) |
| $1,000,000 or more | 0 (0.0%) | 0 (0.0%) |
| Total | 183 (100.0%) | 142 (100.0%) |
Household Income by Mortgage Status in Morrisville
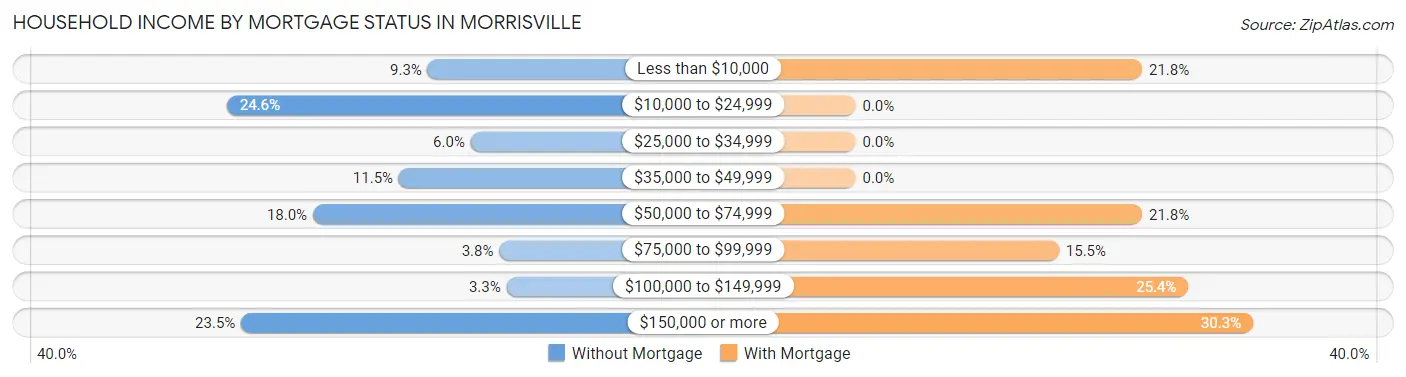
| Household Income | Without Mortgage | With Mortgage |
| Less than $10,000 | 17 (9.3%) | 31 (21.8%) |
| $10,000 to $24,999 | 45 (24.6%) | 0 (0.0%) |
| $25,000 to $34,999 | 11 (6.0%) | 0 (0.0%) |
| $35,000 to $49,999 | 21 (11.5%) | 0 (0.0%) |
| $50,000 to $74,999 | 33 (18.0%) | 31 (21.8%) |
| $75,000 to $99,999 | 7 (3.8%) | 22 (15.5%) |
| $100,000 to $149,999 | 6 (3.3%) | 36 (25.4%) |
| $150,000 or more | 43 (23.5%) | 43 (30.3%) |
| Total | 183 (100.0%) | 142 (100.0%) |
Property Value to Household Income Ratio in Morrisville
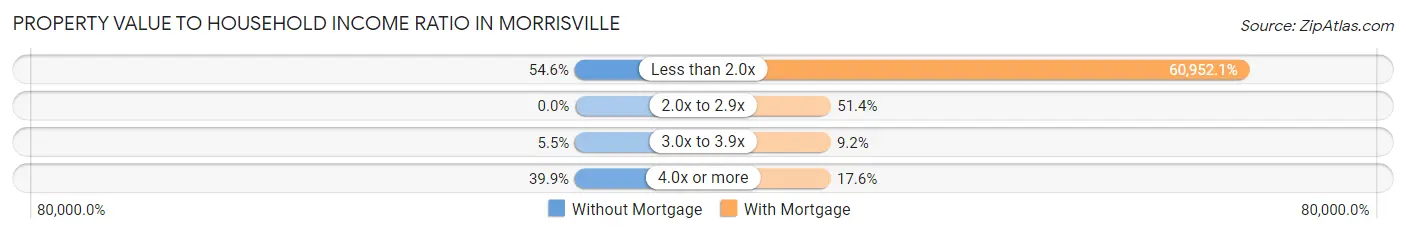
| Value-to-Income Ratio | Without Mortgage | With Mortgage |
| Less than 2.0x | 100 (54.6%) | 86,552 (60,952.1%) |
| 2.0x to 2.9x | 0 (0.0%) | 73 (51.4%) |
| 3.0x to 3.9x | 10 (5.5%) | 13 (9.1%) |
| 4.0x or more | 73 (39.9%) | 25 (17.6%) |
| Total | 183 (100.0%) | 142 (100.0%) |
Real Estate Taxes by Mortgage Status in Morrisville
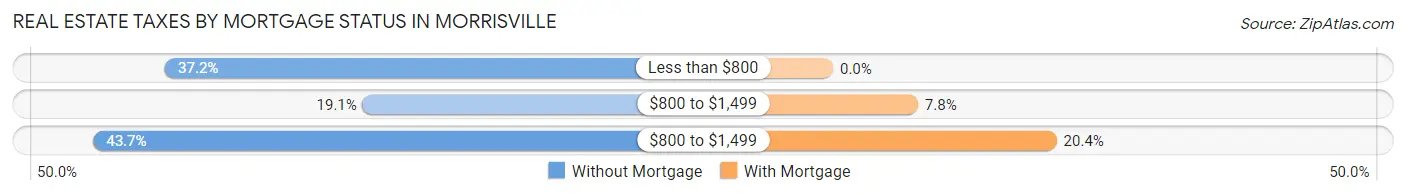
| Property Taxes | Without Mortgage | With Mortgage |
| Less than $800 | 68 (37.2%) | 0 (0.0%) |
| $800 to $1,499 | 35 (19.1%) | 11 (7.7%) |
| $800 to $1,499 | 80 (43.7%) | 29 (20.4%) |
| Total | 183 (100.0%) | 142 (100.0%) |
Health & Disability in Morrisville
Health Insurance Coverage by Age in Morrisville
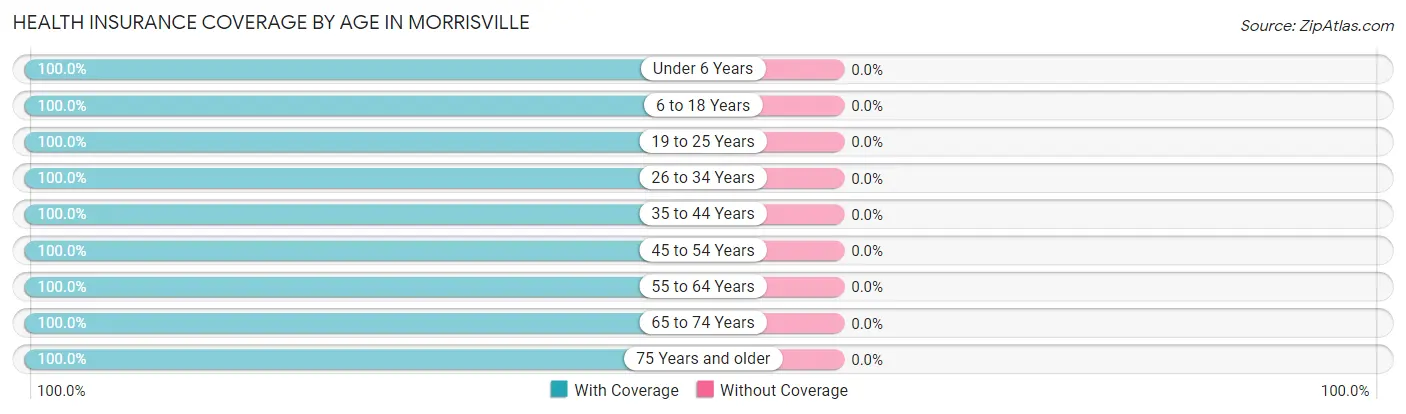
| Age Bracket | With Coverage | Without Coverage |
| Under 6 Years | 23 (100.0%) | 0 (0.0%) |
| 6 to 18 Years | 141 (100.0%) | 0 (0.0%) |
| 19 to 25 Years | 4 (100.0%) | 0 (0.0%) |
| 26 to 34 Years | 112 (100.0%) | 0 (0.0%) |
| 35 to 44 Years | 16 (100.0%) | 0 (0.0%) |
| 45 to 54 Years | 68 (100.0%) | 0 (0.0%) |
| 55 to 64 Years | 243 (100.0%) | 0 (0.0%) |
| 65 to 74 Years | 125 (100.0%) | 0 (0.0%) |
| 75 Years and older | 219 (100.0%) | 0 (0.0%) |
| Total | 951 (100.0%) | 0 (0.0%) |
Health Insurance Coverage by Citizenship Status in Morrisville
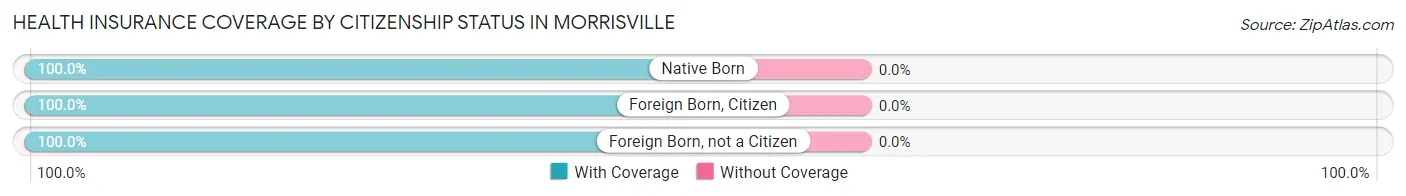
| Citizenship Status | With Coverage | Without Coverage |
| Native Born | 23 (100.0%) | 0 (0.0%) |
| Foreign Born, Citizen | 141 (100.0%) | 0 (0.0%) |
| Foreign Born, not a Citizen | 4 (100.0%) | 0 (0.0%) |
Health Insurance Coverage by Household Income in Morrisville
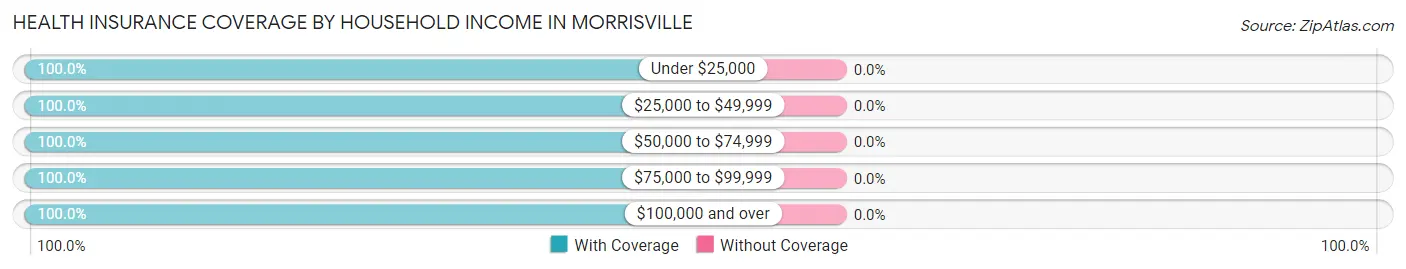
| Household Income | With Coverage | Without Coverage |
| Under $25,000 | 117 (100.0%) | 0 (0.0%) |
| $25,000 to $49,999 | 176 (100.0%) | 0 (0.0%) |
| $50,000 to $74,999 | 112 (100.0%) | 0 (0.0%) |
| $75,000 to $99,999 | 109 (100.0%) | 0 (0.0%) |
| $100,000 and over | 437 (100.0%) | 0 (0.0%) |
Public vs Private Health Insurance Coverage by Age in Morrisville
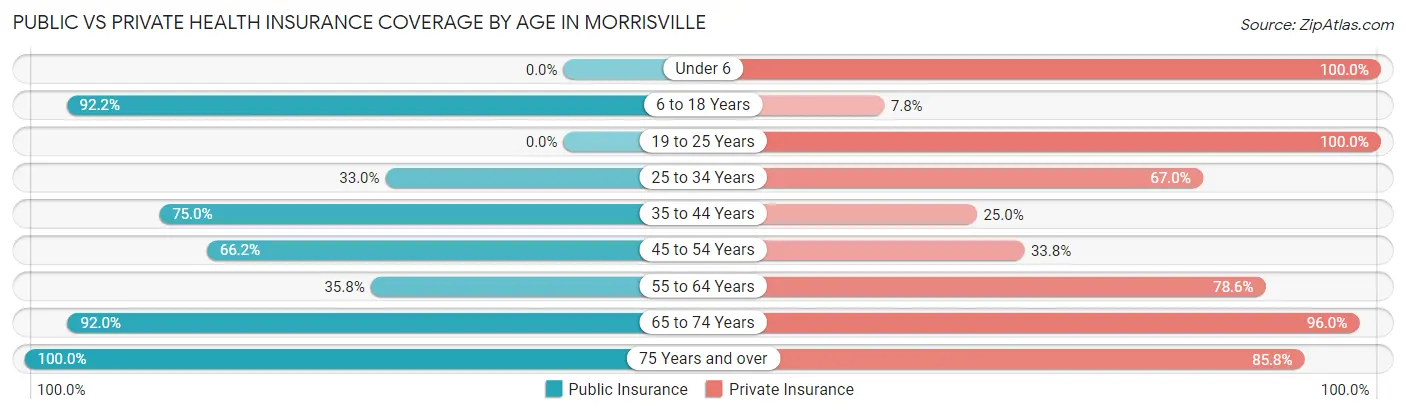
| Age Bracket | Public Insurance | Private Insurance |
| Under 6 | 0 (0.0%) | 23 (100.0%) |
| 6 to 18 Years | 130 (92.2%) | 11 (7.8%) |
| 19 to 25 Years | 0 (0.0%) | 4 (100.0%) |
| 25 to 34 Years | 37 (33.0%) | 75 (67.0%) |
| 35 to 44 Years | 12 (75.0%) | 4 (25.0%) |
| 45 to 54 Years | 45 (66.2%) | 23 (33.8%) |
| 55 to 64 Years | 87 (35.8%) | 191 (78.6%) |
| 65 to 74 Years | 115 (92.0%) | 120 (96.0%) |
| 75 Years and over | 219 (100.0%) | 188 (85.8%) |
| Total | 645 (67.8%) | 639 (67.2%) |
Disability Status by Sex by Age in Morrisville
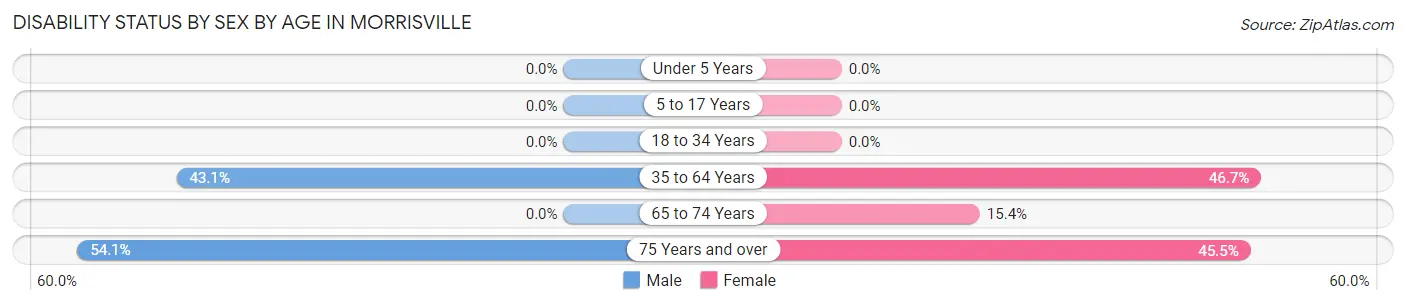
| Age Bracket | Male | Female |
| Under 5 Years | 0 (0.0%) | 0 (0.0%) |
| 5 to 17 Years | 0 (0.0%) | 0 (0.0%) |
| 18 to 34 Years | 0 (0.0%) | 0 (0.0%) |
| 35 to 64 Years | 56 (43.1%) | 92 (46.7%) |
| 65 to 74 Years | 0 (0.0%) | 12 (15.4%) |
| 75 Years and over | 46 (54.1%) | 61 (45.5%) |
Disability Class by Sex by Age in Morrisville
Disability Class: Hearing Difficulty
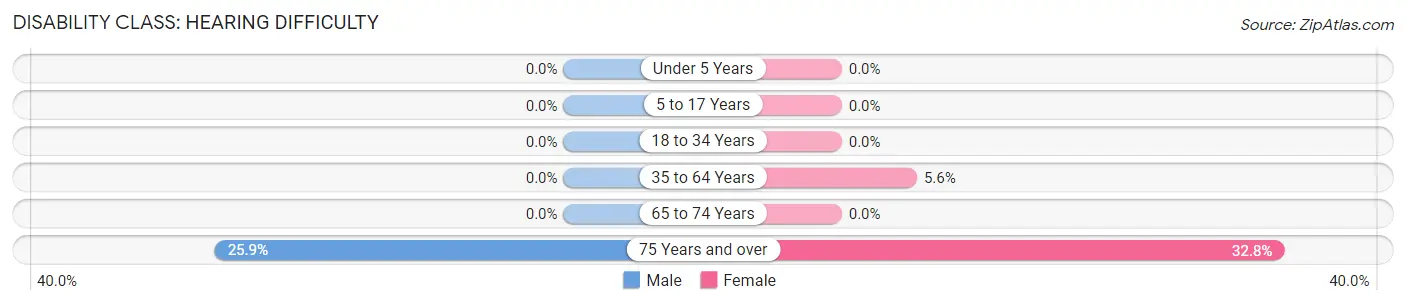
| Age Bracket | Male | Female |
| Under 5 Years | 0 (0.0%) | 0 (0.0%) |
| 5 to 17 Years | 0 (0.0%) | 0 (0.0%) |
| 18 to 34 Years | 0 (0.0%) | 0 (0.0%) |
| 35 to 64 Years | 0 (0.0%) | 11 (5.6%) |
| 65 to 74 Years | 0 (0.0%) | 0 (0.0%) |
| 75 Years and over | 22 (25.9%) | 44 (32.8%) |
Disability Class: Vision Difficulty
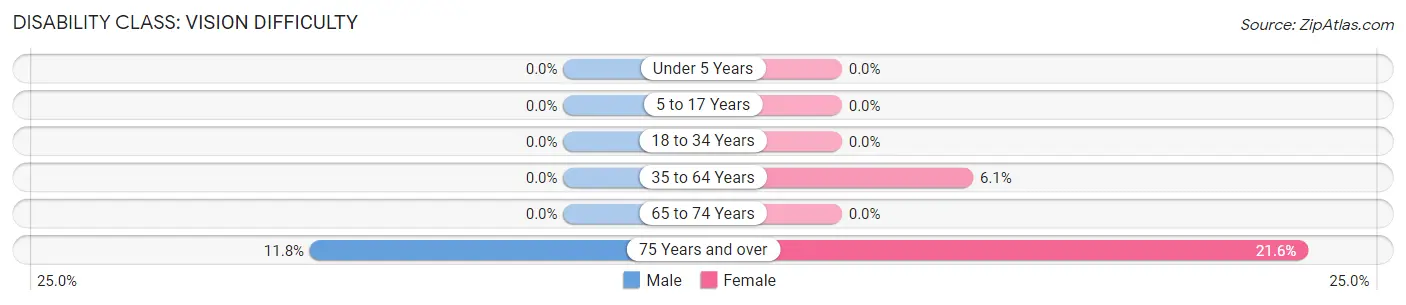
| Age Bracket | Male | Female |
| Under 5 Years | 0 (0.0%) | 0 (0.0%) |
| 5 to 17 Years | 0 (0.0%) | 0 (0.0%) |
| 18 to 34 Years | 0 (0.0%) | 0 (0.0%) |
| 35 to 64 Years | 0 (0.0%) | 12 (6.1%) |
| 65 to 74 Years | 0 (0.0%) | 0 (0.0%) |
| 75 Years and over | 10 (11.8%) | 29 (21.6%) |
Disability Class: Cognitive Difficulty
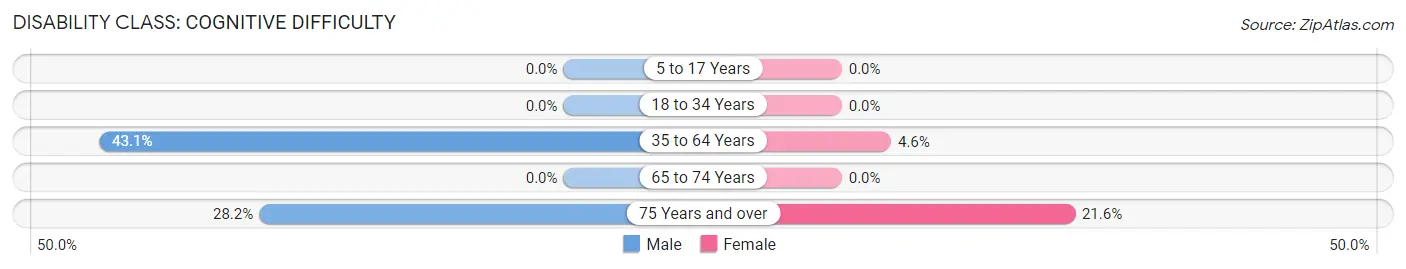
| Age Bracket | Male | Female |
| 5 to 17 Years | 0 (0.0%) | 0 (0.0%) |
| 18 to 34 Years | 0 (0.0%) | 0 (0.0%) |
| 35 to 64 Years | 56 (43.1%) | 9 (4.6%) |
| 65 to 74 Years | 0 (0.0%) | 0 (0.0%) |
| 75 Years and over | 24 (28.2%) | 29 (21.6%) |
Disability Class: Ambulatory Difficulty
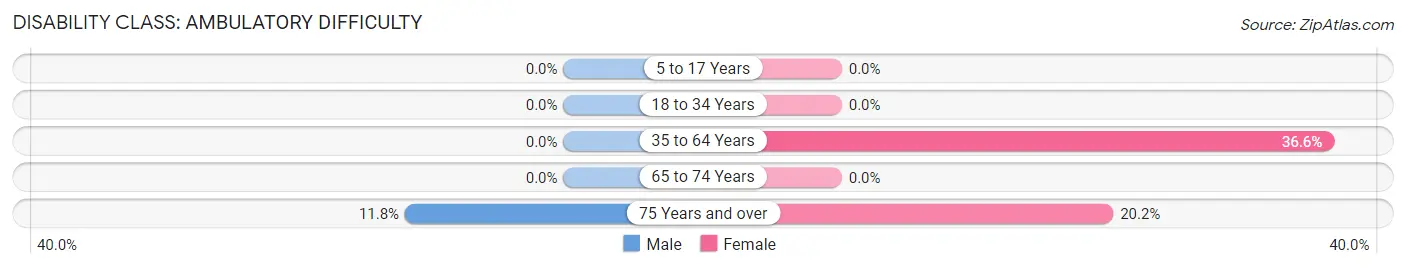
| Age Bracket | Male | Female |
| 5 to 17 Years | 0 (0.0%) | 0 (0.0%) |
| 18 to 34 Years | 0 (0.0%) | 0 (0.0%) |
| 35 to 64 Years | 0 (0.0%) | 72 (36.5%) |
| 65 to 74 Years | 0 (0.0%) | 0 (0.0%) |
| 75 Years and over | 10 (11.8%) | 27 (20.2%) |
Disability Class: Self-Care Difficulty
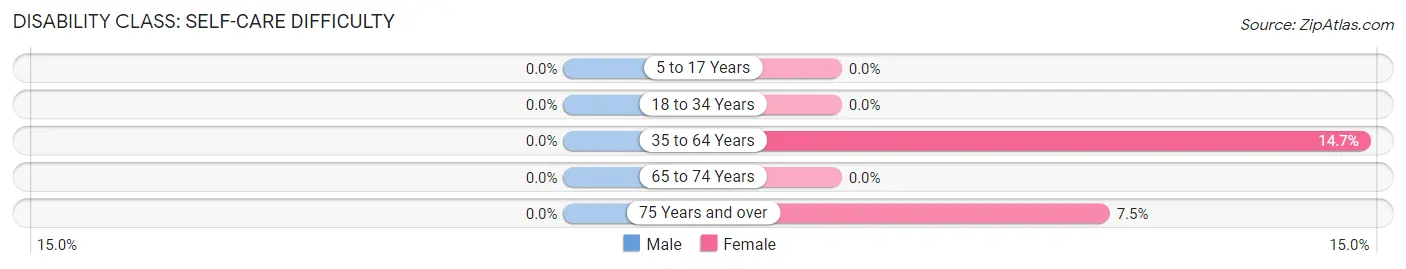
| Age Bracket | Male | Female |
| 5 to 17 Years | 0 (0.0%) | 0 (0.0%) |
| 18 to 34 Years | 0 (0.0%) | 0 (0.0%) |
| 35 to 64 Years | 0 (0.0%) | 29 (14.7%) |
| 65 to 74 Years | 0 (0.0%) | 0 (0.0%) |
| 75 Years and over | 0 (0.0%) | 10 (7.5%) |
Technology Access in Morrisville
Computing Device Access in Morrisville
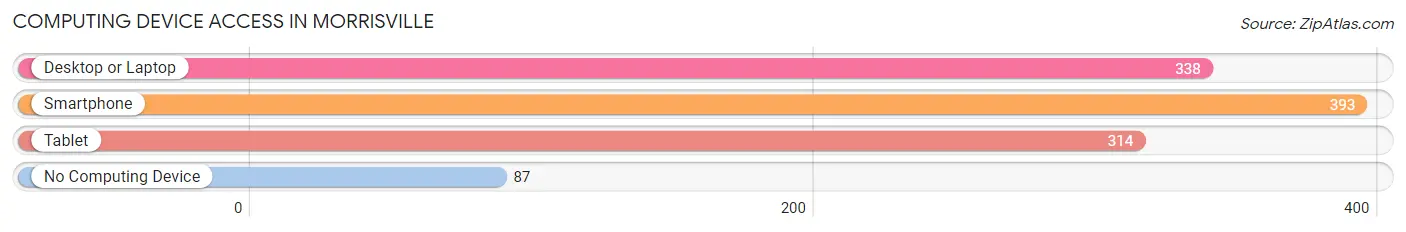
| Device Type | # Households | % Households |
| Desktop or Laptop | 338 | 61.0% |
| Smartphone | 393 | 70.9% |
| Tablet | 314 | 56.7% |
| No Computing Device | 87 | 15.7% |
| Total | 554 | 100.0% |
Internet Access in Morrisville
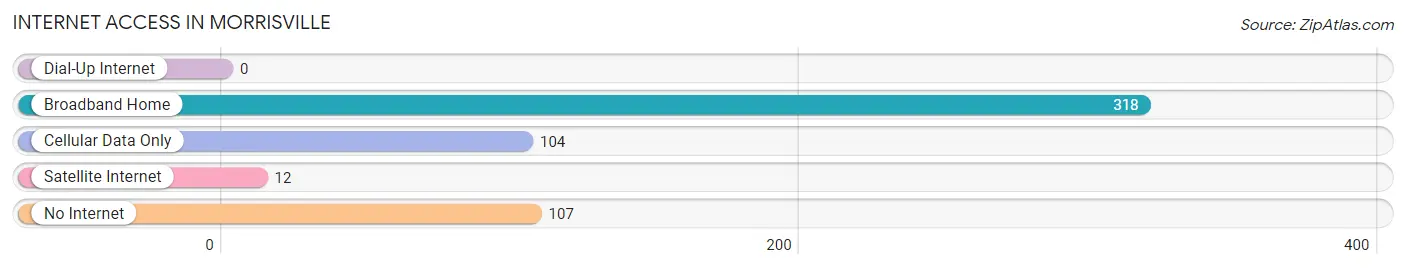
| Internet Type | # Households | % Households |
| Dial-Up Internet | 0 | 0.0% |
| Broadband Home | 318 | 57.4% |
| Cellular Data Only | 104 | 18.8% |
| Satellite Internet | 12 | 2.2% |
| No Internet | 107 | 19.3% |
| Total | 554 | 100.0% |
Morrisville Summary
Morrisville, Pennsylvania is a borough located in Bucks County, Pennsylvania, United States. It is located along the Delaware River, just north of Philadelphia. The population was 8,728 at the 2010 census.
History
Morrisville was founded in 1684 by English Quaker William Morris, who purchased 500 acres of land from William Penn. The area was originally known as "Morris' Ferry" and was a major crossing point on the Delaware River. In 1790, the area was incorporated as a borough and was named after its founder.
In the 19th century, Morrisville was a major industrial center, with several mills and factories located along the Delaware River. The Morrisville Iron Works was one of the largest employers in the area, producing iron products for the U.S. Navy during the Civil War. The iron works closed in 1876, but the area continued to be an important industrial center, with several factories producing textiles, paper, and other products.
Geography
Morrisville is located at 40°11'17" North, 74°51'45" West (40.1879, -74.8625). According to the United States Census Bureau, the borough has a total area of 1.3 square miles (3.4 km2), all of it land.
Economy
Morrisville's economy is largely based on its proximity to Philadelphia. The borough is home to several small businesses, including restaurants, retail stores, and professional services. The borough is also home to several industrial and manufacturing companies, including a paper mill, a plastics manufacturer, and a metal fabrication plant.
Demographics
As of the 2010 census, there were 8,728 people, 3,717 households, and 2,092 families residing in the borough. The population density was 6,717.3 people per square mile (2,597.2/km2). There were 3,945 housing units at an average density of 3,039.2 per square mile (1,174.3/km2). The racial makeup of the borough was 79.2% White, 11.7% African American, 0.3% Native American, 1.2% Asian, 0.1% Pacific Islander, 5.2% from other races, and 2.5% from two or more races. Hispanic or Latino of any race were 11.7% of the population.
There were 3,717 households, out of which 28.2% had children under the age of 18 living with them, 37.2% were married couples living together, 16.2% had a female householder with no husband present, and 40.7% were non-families. 33.2% of all households were made up of individuals, and 11.7% had someone living alone who was 65 years of age or older. The average household size was 2.35 and the average family size was 3.00.
In the borough, the population was spread out, with 24.2% under the age of 18, 8.2% from 18 to 24, 32.2% from 25 to 44, 21.2% from 45 to 64, and 14.2% who were 65 years of age or older. The median age was 36 years. For every 100 females, there were 95.2 males. For every 100 females age 18 and over, there were 92.2 males.
The median income for a household in the borough was $37,917, and the median income for a family was $45,938. Males had a median income of $35,938 versus $27,917 for females. The per capita income for the borough was $19,945. About 8.2% of families and 10.2% of the population were below the poverty line, including 14.2% of those under age 18 and 8.2% of those age 65 or over.
Common Questions
What is Per Capita Income in Morrisville?
Per Capita income in Morrisville is $43,207.
What is the Median Family Income in Morrisville?
Median Family Income in Morrisville is $87,273.
What is the Median Household income in Morrisville?
Median Household Income in Morrisville is $46,667.
What is Income or Wage Gap in Morrisville?
Income or Wage Gap in Morrisville is 49.7%.
Women in Morrisville earn 50.3 cents for every dollar earned by a man.
What is Inequality or Gini Index in Morrisville?
Inequality or Gini Index in Morrisville is 0.46.
What is the Total Population of Morrisville?
Total Population of Morrisville is 951.
What is the Total Male Population of Morrisville?
Total Male Population of Morrisville is 431.
What is the Total Female Population of Morrisville?
Total Female Population of Morrisville is 520.
What is the Ratio of Males per 100 Females in Morrisville?
There are 82.88 Males per 100 Females in Morrisville.
What is the Ratio of Females per 100 Males in Morrisville?
There are 120.65 Females per 100 Males in Morrisville.
What is the Median Population Age in Morrisville?
Median Population Age in Morrisville is 62.3 Years.
What is the Average Family Size in Morrisville
Average Family Size in Morrisville is 2.8 People.
What is the Average Household Size in Morrisville
Average Household Size in Morrisville is 1.7 People.
How Large is the Labor Force in Morrisville?
There are 430 People in the Labor Forcein in Morrisville.
What is the Percentage of People in the Labor Force in Morrisville?
53.9% of People are in the Labor Force in Morrisville.