Morrisville borough, PA Map & Demographics
Morrisville borough Overview
$43,441
PER CAPITA INCOME
$106,039
AVG FAMILY INCOME
$89,985
AVG HOUSEHOLD INCOME
20.2%
WAGE / INCOME GAP [ % ]
79.8¢/ $1
WAGE / INCOME GAP [ $ ]
0.37
INEQUALITY / GINI INDEX
9,721
TOTAL POPULATION
5,282
MALE POPULATION
4,439
FEMALE POPULATION
118.99
MALES / 100 FEMALES
84.04
FEMALES / 100 MALES
39.8
MEDIAN AGE
2.8
AVG FAMILY SIZE
2.4
AVG HOUSEHOLD SIZE
5,917
LABOR FORCE [ PEOPLE ]
74.1%
PERCENT IN LABOR FORCE
6.9%
UNEMPLOYMENT RATE
Income in Morrisville borough
Income Overview in Morrisville borough
Per Capita Income in Morrisville borough is $43,441, while median incomes of families and households are $106,039 and $89,985 respectively.
| Characteristic | Number | Measure |
| Per Capita Income | 9,721 | $43,441 |
| Median Family Income | 2,676 | $106,039 |
| Mean Family Income | 2,676 | $115,375 |
| Median Household Income | 3,978 | $89,985 |
| Mean Household Income | 3,978 | $105,261 |
| Income Deficit | 2,676 | $0 |
| Wage / Income Gap (%) | 9,721 | 20.18% |
| Wage / Income Gap ($) | 9,721 | 79.82¢ per $1 |
| Gini / Inequality Index | 9,721 | 0.37 |
Earnings by Sex in Morrisville borough
Average Earnings in Morrisville borough are $48,327, $56,974 for men and $45,474 for women, a difference of 20.2%.
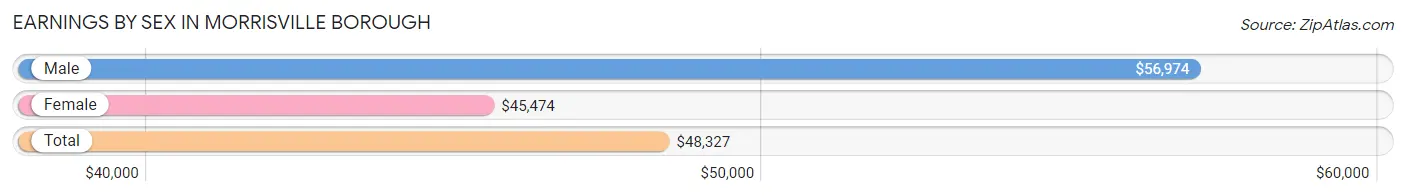
| Sex | Number | Average Earnings |
| Male | 3,212 (53.5%) | $56,974 |
| Female | 2,787 (46.5%) | $45,474 |
| Total | 5,999 (100.0%) | $48,327 |
Earnings by Sex by Income Bracket in Morrisville borough
The most common earnings brackets in Morrisville borough are $100,000+ for men (857 | 26.7%) and $100,000+ for women (419 | 15.0%).
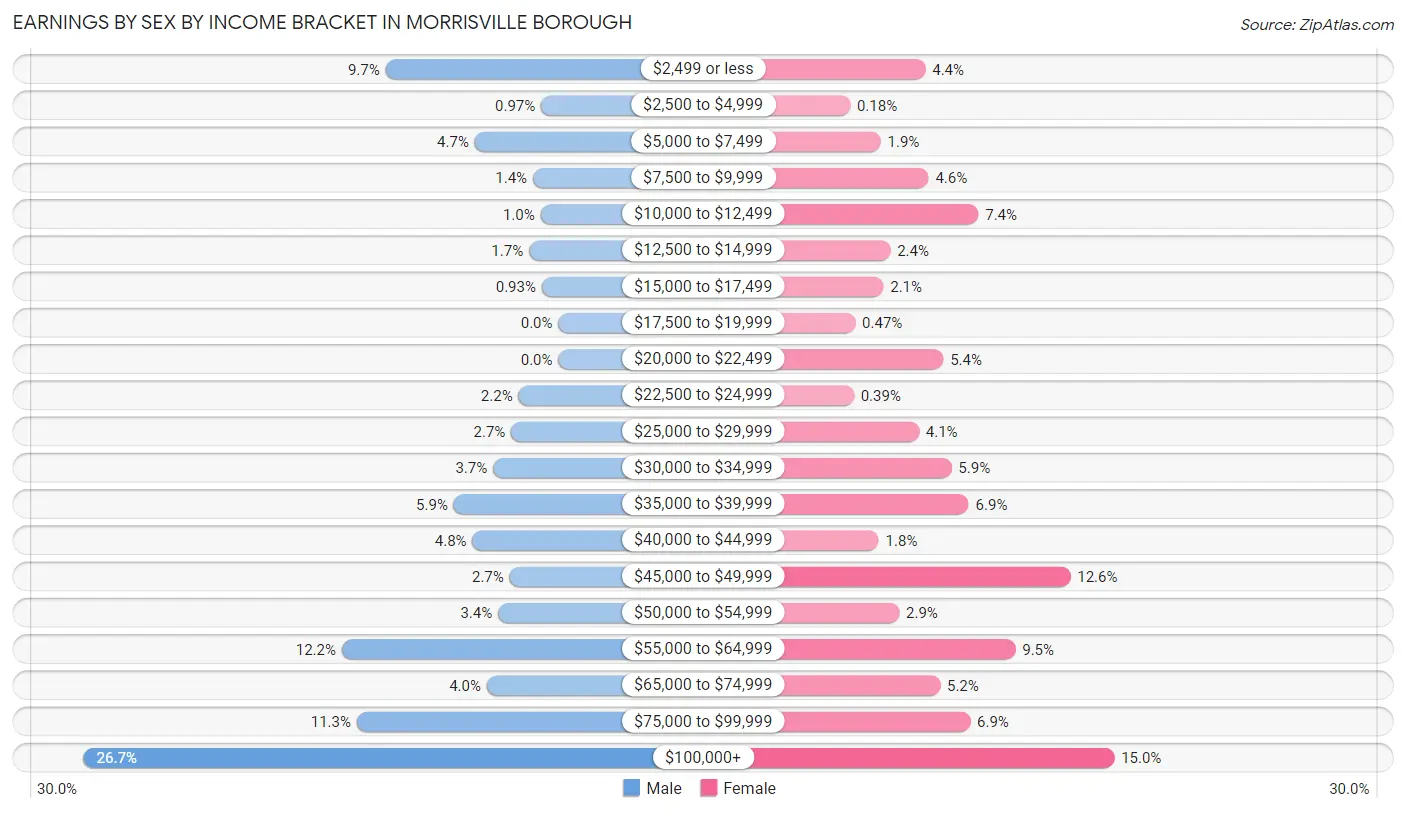
| Income | Male | Female |
| $2,499 or less | 312 (9.7%) | 123 (4.4%) |
| $2,500 to $4,999 | 31 (1.0%) | 5 (0.2%) |
| $5,000 to $7,499 | 151 (4.7%) | 53 (1.9%) |
| $7,500 to $9,999 | 46 (1.4%) | 128 (4.6%) |
| $10,000 to $12,499 | 32 (1.0%) | 206 (7.4%) |
| $12,500 to $14,999 | 53 (1.7%) | 68 (2.4%) |
| $15,000 to $17,499 | 30 (0.9%) | 57 (2.1%) |
| $17,500 to $19,999 | 0 (0.0%) | 13 (0.5%) |
| $20,000 to $22,499 | 0 (0.0%) | 151 (5.4%) |
| $22,500 to $24,999 | 72 (2.2%) | 11 (0.4%) |
| $25,000 to $29,999 | 85 (2.6%) | 113 (4.1%) |
| $30,000 to $34,999 | 118 (3.7%) | 164 (5.9%) |
| $35,000 to $39,999 | 189 (5.9%) | 191 (6.9%) |
| $40,000 to $44,999 | 155 (4.8%) | 50 (1.8%) |
| $45,000 to $49,999 | 88 (2.7%) | 350 (12.6%) |
| $50,000 to $54,999 | 109 (3.4%) | 82 (2.9%) |
| $55,000 to $64,999 | 391 (12.2%) | 264 (9.5%) |
| $65,000 to $74,999 | 129 (4.0%) | 146 (5.2%) |
| $75,000 to $99,999 | 364 (11.3%) | 193 (6.9%) |
| $100,000+ | 857 (26.7%) | 419 (15.0%) |
| Total | 3,212 (100.0%) | 2,787 (100.0%) |
Earnings by Sex by Educational Attainment in Morrisville borough
Average earnings in Morrisville borough are $65,599 for men and $45,886 for women, a difference of 30.0%. Men with an educational attainment of graduate degree enjoy the highest average annual earnings of $137,872, while those with college or associate's degree education earn the least with $56,184. Women with an educational attainment of graduate degree earn the most with the average annual earnings of $109,362, while those with less than high school education have the smallest earnings of $20,707.
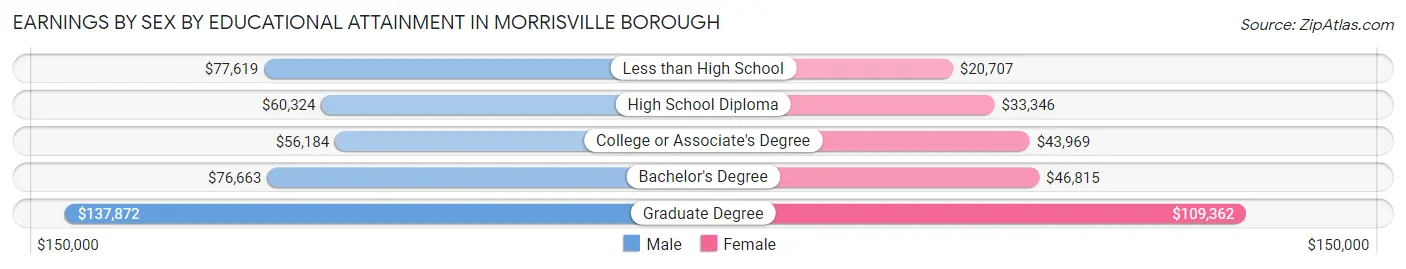
| Educational Attainment | Male Income | Female Income |
| Less than High School | $77,619 | $20,707 |
| High School Diploma | $60,324 | $33,346 |
| College or Associate's Degree | $56,184 | $43,969 |
| Bachelor's Degree | $76,663 | $46,815 |
| Graduate Degree | $137,872 | $109,362 |
| Total | $65,599 | $45,886 |
Family Income in Morrisville borough
Family Income Brackets in Morrisville borough
According to the Morrisville borough family income data, there are 624 families falling into the $100,000 to $149,999 income range, which is the most common income bracket and makes up 23.3% of all families. Conversely, the $15,000 to $24,999 income bracket is the least frequent group with only 35 families (1.3%) belonging to this category.
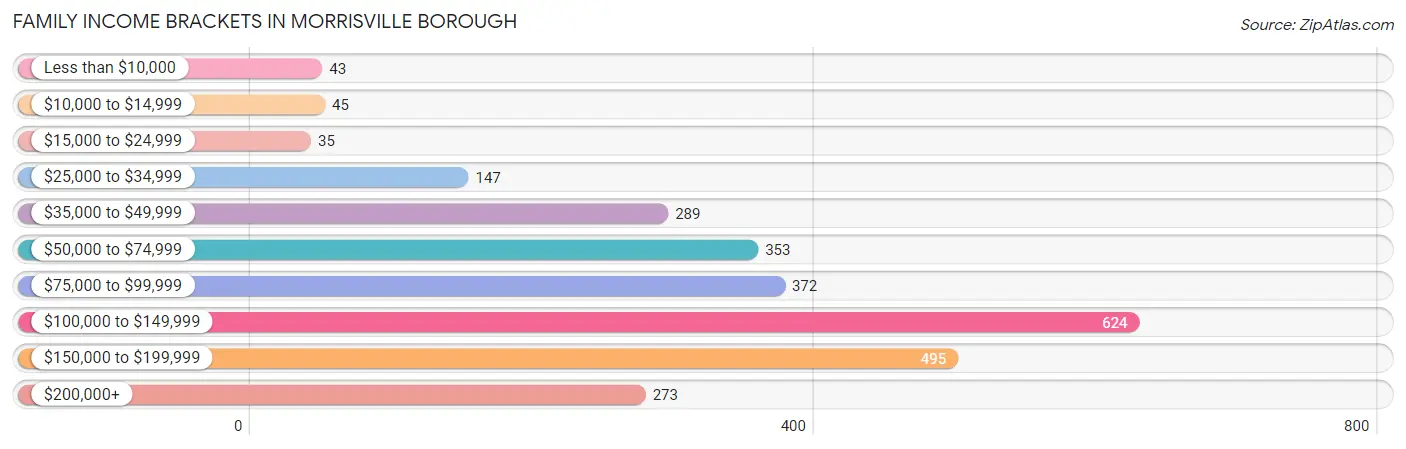
| Income Bracket | # Families | % Families |
| Less than $10,000 | 43 | 1.6% |
| $10,000 to $14,999 | 45 | 1.7% |
| $15,000 to $24,999 | 35 | 1.3% |
| $25,000 to $34,999 | 147 | 5.5% |
| $35,000 to $49,999 | 289 | 10.8% |
| $50,000 to $74,999 | 353 | 13.2% |
| $75,000 to $99,999 | 372 | 13.9% |
| $100,000 to $149,999 | 624 | 23.3% |
| $150,000 to $199,999 | 495 | 18.5% |
| $200,000+ | 273 | 10.2% |
Family Income by Famaliy Size in Morrisville borough
4-person families (399 | 14.9%) account for the highest median family income in Morrisville borough with $131,514 per family, while 2-person families (1,349 | 50.4%) have the highest median income of $50,664 per family member.
| Income Bracket | # Families | Median Income |
| 2-Person Families | 1,349 (50.4%) | $101,328 |
| 3-Person Families | 788 (29.4%) | $59,211 |
| 4-Person Families | 399 (14.9%) | $131,514 |
| 5-Person Families | 25 (0.9%) | $0 |
| 6-Person Families | 101 (3.8%) | $0 |
| 7+ Person Families | 14 (0.5%) | $0 |
| Total | 2,676 (100.0%) | $106,039 |
Family Income by Number of Earners in Morrisville borough
The median family income in Morrisville borough is $106,039, with families comprising 3+ earners (229) having the highest median family income of $250,001, while families with no earners (230) have the lowest median family income of $44,337, accounting for 8.6% and 8.6% of families, respectively.
| Number of Earners | # Families | Median Income |
| No Earners | 230 (8.6%) | $44,337 |
| 1 Earner | 784 (29.3%) | $59,488 |
| 2 Earners | 1,433 (53.5%) | $130,609 |
| 3+ Earners | 229 (8.6%) | $250,001 |
| Total | 2,676 (100.0%) | $106,039 |
Household Income in Morrisville borough
Household Income Brackets in Morrisville borough
With 879 households falling in the category, the $100,000 to $149,999 income range is the most frequent in Morrisville borough, accounting for 22.1% of all households. In contrast, only 68 households (1.7%) fall into the $10,000 to $14,999 income bracket, making it the least populous group.
| Income Bracket | # Households | % Households |
| Less than $10,000 | 163 | 4.1% |
| $10,000 to $14,999 | 68 | 1.7% |
| $15,000 to $24,999 | 151 | 3.8% |
| $25,000 to $34,999 | 235 | 5.9% |
| $35,000 to $49,999 | 390 | 9.8% |
| $50,000 to $74,999 | 378 | 9.5% |
| $75,000 to $99,999 | 772 | 19.4% |
| $100,000 to $149,999 | 879 | 22.1% |
| $150,000 to $199,999 | 633 | 15.9% |
| $200,000+ | 314 | 7.9% |
Household Income by Householder Age in Morrisville borough
The median household income in Morrisville borough is $89,985, with the highest median household income of $104,988 found in the 45 to 64 years age bracket for the primary householder. A total of 1,777 households (44.7%) fall into this category. Meanwhile, the 15 to 24 years age bracket for the primary householder has the lowest median household income of $0, with 63 households (1.6%) in this group.
| Income Bracket | # Households | Median Income |
| 15 to 24 Years | 63 (1.6%) | $0 |
| 25 to 44 Years | 1,236 (31.1%) | $85,882 |
| 45 to 64 Years | 1,777 (44.7%) | $104,988 |
| 65+ Years | 902 (22.7%) | $79,875 |
| Total | 3,978 (100.0%) | $89,985 |
Poverty in Morrisville borough
Income Below Poverty by Sex and Age in Morrisville borough
With 4.5% poverty level for males and 6.6% for females among the residents of Morrisville borough, under 5 year old males and 15 year old females are the most vulnerable to poverty, with 46 males (16.7%) and 16 females (19.3%) in their respective age groups living below the poverty level.
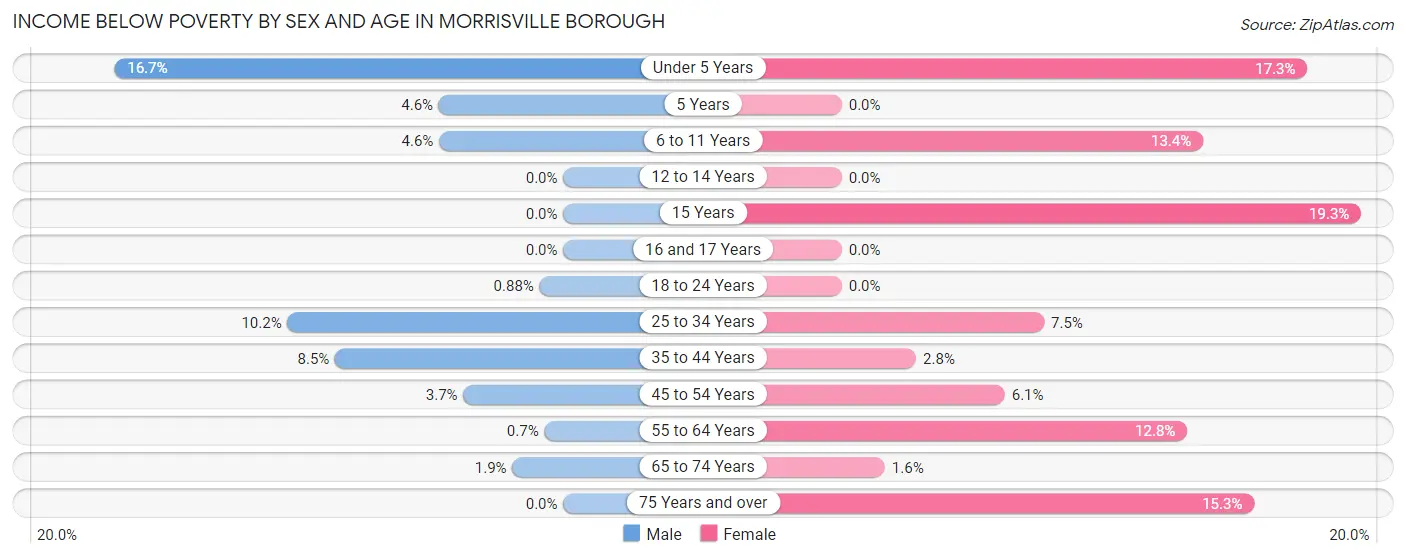
| Age Bracket | Male | Female |
| Under 5 Years | 46 (16.7%) | 28 (17.3%) |
| 5 Years | 9 (4.6%) | 0 (0.0%) |
| 6 to 11 Years | 16 (4.6%) | 11 (13.4%) |
| 12 to 14 Years | 0 (0.0%) | 0 (0.0%) |
| 15 Years | 0 (0.0%) | 16 (19.3%) |
| 16 and 17 Years | 0 (0.0%) | 0 (0.0%) |
| 18 to 24 Years | 4 (0.9%) | 0 (0.0%) |
| 25 to 34 Years | 78 (10.2%) | 58 (7.5%) |
| 35 to 44 Years | 45 (8.5%) | 21 (2.8%) |
| 45 to 54 Years | 20 (3.7%) | 48 (6.0%) |
| 55 to 64 Years | 6 (0.7%) | 70 (12.8%) |
| 65 to 74 Years | 11 (1.9%) | 9 (1.6%) |
| 75 Years and over | 0 (0.0%) | 30 (15.3%) |
| Total | 235 (4.5%) | 291 (6.6%) |
Income Above Poverty by Sex and Age in Morrisville borough
According to the poverty statistics in Morrisville borough, males aged 12 to 14 years and females aged 5 years are the age groups that are most secure financially, with 100.0% of males and 100.0% of females in these age groups living above the poverty line.
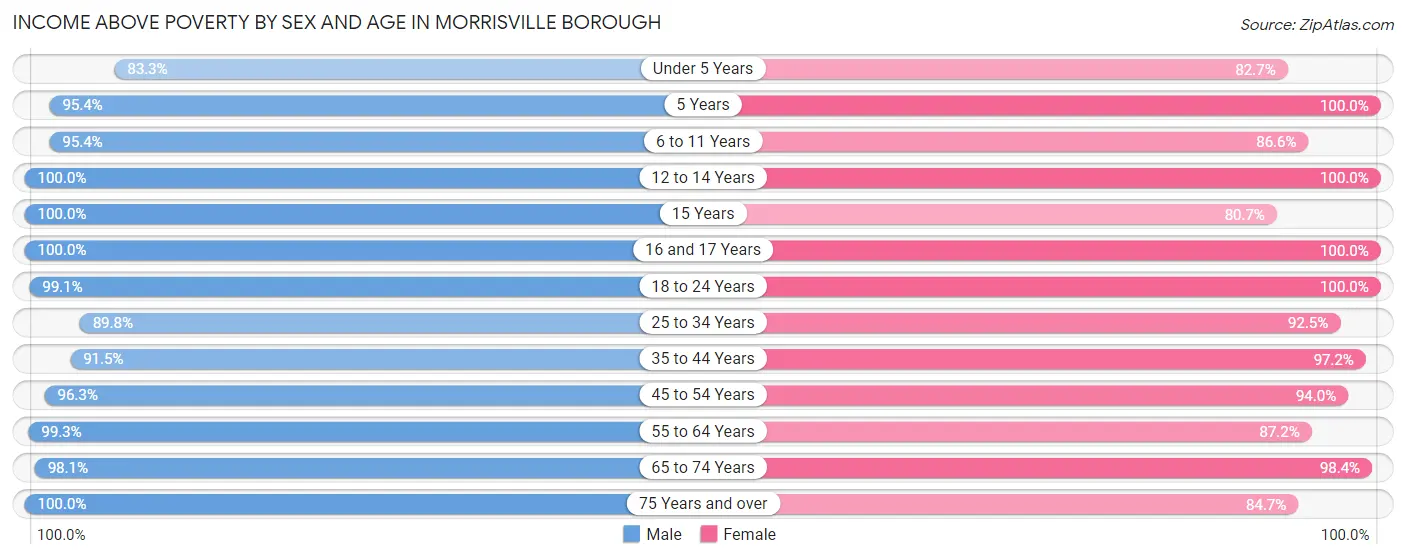
| Age Bracket | Male | Female |
| Under 5 Years | 230 (83.3%) | 134 (82.7%) |
| 5 Years | 186 (95.4%) | 24 (100.0%) |
| 6 to 11 Years | 331 (95.4%) | 71 (86.6%) |
| 12 to 14 Years | 252 (100.0%) | 180 (100.0%) |
| 15 Years | 35 (100.0%) | 67 (80.7%) |
| 16 and 17 Years | 140 (100.0%) | 74 (100.0%) |
| 18 to 24 Years | 449 (99.1%) | 200 (100.0%) |
| 25 to 34 Years | 684 (89.8%) | 714 (92.5%) |
| 35 to 44 Years | 486 (91.5%) | 741 (97.2%) |
| 45 to 54 Years | 519 (96.3%) | 746 (94.0%) |
| 55 to 64 Years | 848 (99.3%) | 476 (87.2%) |
| 65 to 74 Years | 572 (98.1%) | 555 (98.4%) |
| 75 Years and over | 215 (100.0%) | 166 (84.7%) |
| Total | 4,947 (95.5%) | 4,148 (93.4%) |
Income Below Poverty Among Married-Couple Families in Morrisville borough
The poverty statistics for married-couple families in Morrisville borough show that 1.9% or 33 of the total 1,774 families live below the poverty line. Families with 1 or 2 children have the highest poverty rate of 3.6%, comprising of 21 families. On the other hand, families with 3 or 4 children have the lowest poverty rate of 0.0%, which includes 0 families.
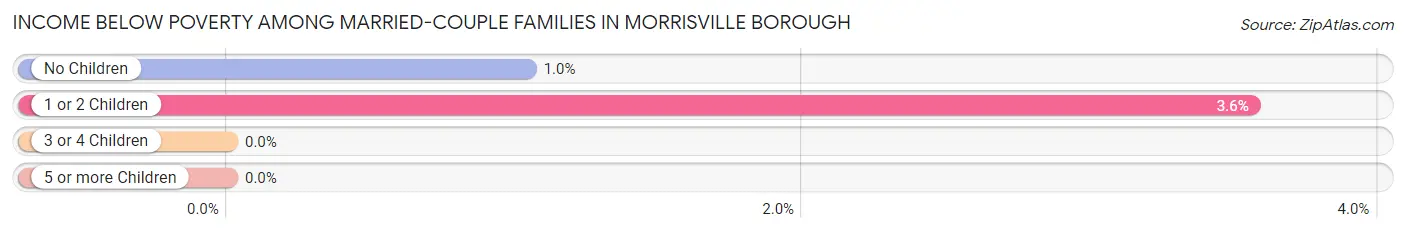
| Children | Above Poverty | Below Poverty |
| No Children | 1,147 (99.0%) | 12 (1.0%) |
| 1 or 2 Children | 569 (96.4%) | 21 (3.6%) |
| 3 or 4 Children | 25 (100.0%) | 0 (0.0%) |
| 5 or more Children | 0 (0.0%) | 0 (0.0%) |
| Total | 1,741 (98.1%) | 33 (1.9%) |
Income Below Poverty Among Single-Parent Households in Morrisville borough
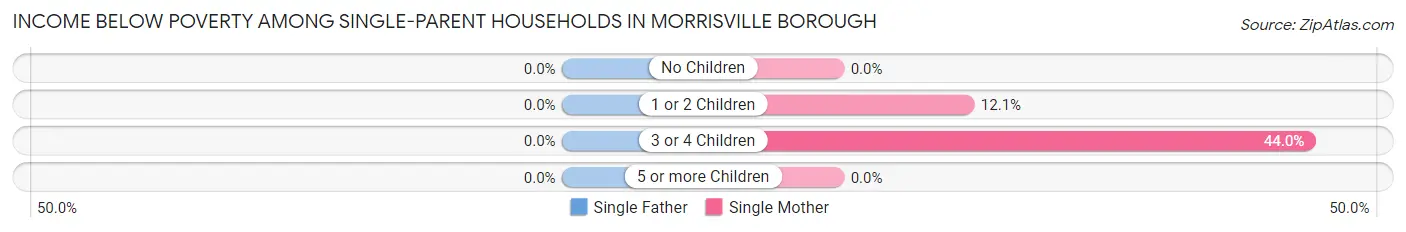
| Children | Single Father | Single Mother |
| No Children | 0 (0.0%) | 0 (0.0%) |
| 1 or 2 Children | 0 (0.0%) | 45 (12.1%) |
| 3 or 4 Children | 0 (0.0%) | 11 (44.0%) |
| 5 or more Children | 0 (0.0%) | 0 (0.0%) |
| Total | 0 (0.0%) | 56 (9.1%) |
Income Below Poverty Among Married-Couple vs Single-Parent Households in Morrisville borough
The poverty data for Morrisville borough shows that 33 of the married-couple family households (1.9%) and 56 of the single-parent households (6.2%) are living below the poverty level. Within the married-couple family households, those with 1 or 2 children have the highest poverty rate, with 21 households (3.6%) falling below the poverty line. Among the single-parent households, those with 3 or 4 children have the highest poverty rate, with 11 household (44.0%) living below poverty.
| Children | Married-Couple Families | Single-Parent Households |
| No Children | 12 (1.0%) | 0 (0.0%) |
| 1 or 2 Children | 21 (3.6%) | 45 (7.5%) |
| 3 or 4 Children | 0 (0.0%) | 11 (44.0%) |
| 5 or more Children | 0 (0.0%) | 0 (0.0%) |
| Total | 33 (1.9%) | 56 (6.2%) |
Race in Morrisville borough
The most populous races in Morrisville borough are White / Caucasian (7,487 | 77.0%), Black / African American (1,462 | 15.0%), and Hispanic or Latino (676 | 7.0%).
| Race | # Population | % Population |
| Asian | 56 | 0.6% |
| Black / African American | 1,462 | 15.0% |
| Hawaiian / Pacific | 0 | 0.0% |
| Hispanic or Latino | 676 | 7.0% |
| Native / Alaskan | 34 | 0.4% |
| White / Caucasian | 7,487 | 77.0% |
| Two or more Races | 623 | 6.4% |
| Some other Race | 59 | 0.6% |
| Total | 9,721 | 100.0% |
Ancestry in Morrisville borough
The most populous ancestries reported in Morrisville borough are Irish (2,234 | 23.0%), Italian (1,969 | 20.3%), English (1,418 | 14.6%), Polish (1,270 | 13.1%), and German (1,083 | 11.1%), together accounting for 82.0% of all Morrisville borough residents.
| Ancestry | # Population | % Population |
| African | 88 | 0.9% |
| American | 171 | 1.8% |
| Austrian | 28 | 0.3% |
| Brazilian | 21 | 0.2% |
| British | 18 | 0.2% |
| Bulgarian | 52 | 0.5% |
| Burmese | 36 | 0.4% |
| Central American | 86 | 0.9% |
| Central American Indian | 13 | 0.1% |
| Colombian | 5 | 0.1% |
| Costa Rican | 12 | 0.1% |
| Czech | 50 | 0.5% |
| Danish | 21 | 0.2% |
| Dutch | 46 | 0.5% |
| Eastern European | 114 | 1.2% |
| English | 1,418 | 14.6% |
| European | 218 | 2.2% |
| French | 125 | 1.3% |
| French Canadian | 64 | 0.7% |
| German | 1,083 | 11.1% |
| Greek | 18 | 0.2% |
| Guatemalan | 44 | 0.4% |
| Honduran | 30 | 0.3% |
| Hungarian | 65 | 0.7% |
| Irish | 2,234 | 23.0% |
| Italian | 1,969 | 20.3% |
| Jamaican | 241 | 2.5% |
| Lithuanian | 78 | 0.8% |
| Mexican | 160 | 1.7% |
| Northern European | 18 | 0.2% |
| Norwegian | 34 | 0.4% |
| Pennsylvania German | 16 | 0.2% |
| Polish | 1,270 | 13.1% |
| Portuguese | 24 | 0.3% |
| Puerto Rican | 343 | 3.5% |
| Romanian | 13 | 0.1% |
| Russian | 107 | 1.1% |
| Scotch-Irish | 51 | 0.5% |
| Scottish | 97 | 1.0% |
| Slavic | 19 | 0.2% |
| Slovak | 74 | 0.8% |
| Slovene | 44 | 0.4% |
| South American | 5 | 0.1% |
| Spaniard | 66 | 0.7% |
| Spanish | 9 | 0.1% |
| Subsaharan African | 88 | 0.9% |
| Swedish | 19 | 0.2% |
| Thai | 39 | 0.4% |
| Ukrainian | 188 | 1.9% |
| Welsh | 85 | 0.9% | View All 50 Rows |
Immigrants in Morrisville borough
The most numerous immigrant groups reported in Morrisville borough came from Europe (491 | 5.1%), Eastern Europe (404 | 4.2%), Latin America (213 | 2.2%), Belarus (153 | 1.6%), and Caribbean (126 | 1.3%), together accounting for 14.3% of all Morrisville borough residents.
| Immigration Origin | # Population | % Population |
| Africa | 39 | 0.4% |
| Asia | 73 | 0.7% |
| Austria | 19 | 0.2% |
| Belarus | 153 | 1.6% |
| Brazil | 9 | 0.1% |
| Bulgaria | 17 | 0.2% |
| Caribbean | 126 | 1.3% |
| Central America | 56 | 0.6% |
| Colombia | 5 | 0.1% |
| Costa Rica | 12 | 0.1% |
| Cuba | 12 | 0.1% |
| Czechoslovakia | 30 | 0.3% |
| Eastern Asia | 17 | 0.2% |
| Eastern Europe | 404 | 4.2% |
| Ecuador | 17 | 0.2% |
| Europe | 491 | 5.1% |
| Germany | 21 | 0.2% |
| Guatemala | 44 | 0.4% |
| Hungary | 5 | 0.1% |
| Italy | 15 | 0.2% |
| Jamaica | 114 | 1.2% |
| Korea | 17 | 0.2% |
| Latin America | 213 | 2.2% |
| Nigeria | 39 | 0.4% |
| Northern Europe | 32 | 0.3% |
| Pakistan | 21 | 0.2% |
| Poland | 82 | 0.8% |
| Russia | 21 | 0.2% |
| South America | 31 | 0.3% |
| South Central Asia | 56 | 0.6% |
| Southern Europe | 15 | 0.2% |
| Ukraine | 96 | 1.0% |
| Uzbekistan | 17 | 0.2% |
| Western Africa | 39 | 0.4% |
| Western Europe | 40 | 0.4% | View All 35 Rows |
Sex and Age in Morrisville borough
Sex and Age in Morrisville borough
The most populous age groups in Morrisville borough are 55 to 59 Years (645 | 12.2%) for men and 50 to 54 Years (555 | 12.5%) for women.
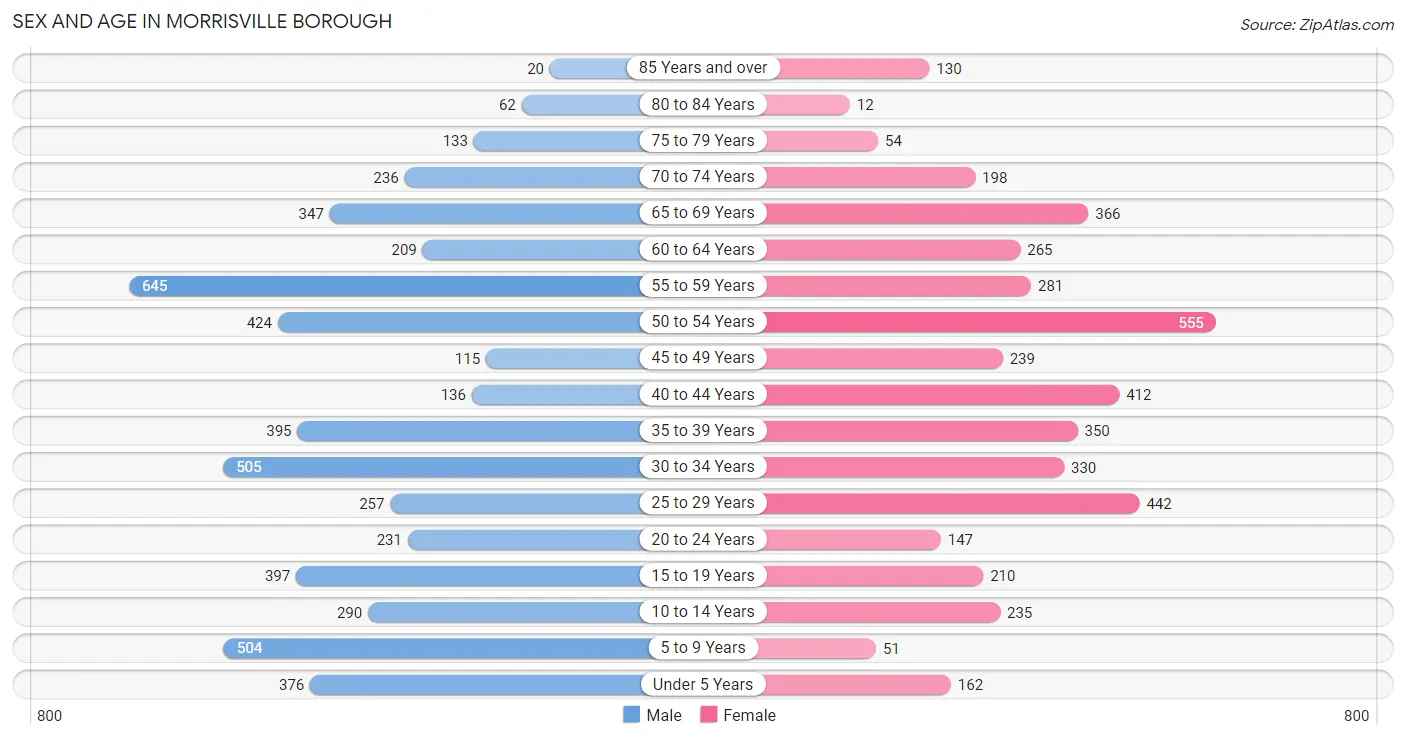
| Age Bracket | Male | Female |
| Under 5 Years | 376 (7.1%) | 162 (3.6%) |
| 5 to 9 Years | 504 (9.5%) | 51 (1.1%) |
| 10 to 14 Years | 290 (5.5%) | 235 (5.3%) |
| 15 to 19 Years | 397 (7.5%) | 210 (4.7%) |
| 20 to 24 Years | 231 (4.4%) | 147 (3.3%) |
| 25 to 29 Years | 257 (4.9%) | 442 (10.0%) |
| 30 to 34 Years | 505 (9.6%) | 330 (7.4%) |
| 35 to 39 Years | 395 (7.5%) | 350 (7.9%) |
| 40 to 44 Years | 136 (2.6%) | 412 (9.3%) |
| 45 to 49 Years | 115 (2.2%) | 239 (5.4%) |
| 50 to 54 Years | 424 (8.0%) | 555 (12.5%) |
| 55 to 59 Years | 645 (12.2%) | 281 (6.3%) |
| 60 to 64 Years | 209 (4.0%) | 265 (6.0%) |
| 65 to 69 Years | 347 (6.6%) | 366 (8.3%) |
| 70 to 74 Years | 236 (4.5%) | 198 (4.5%) |
| 75 to 79 Years | 133 (2.5%) | 54 (1.2%) |
| 80 to 84 Years | 62 (1.2%) | 12 (0.3%) |
| 85 Years and over | 20 (0.4%) | 130 (2.9%) |
| Total | 5,282 (100.0%) | 4,439 (100.0%) |
Families and Households in Morrisville borough
Median Family Size in Morrisville borough
The median family size in Morrisville borough is 2.82 persons per family, with single female/mother families (614 | 22.9%) accounting for the largest median family size of 3.03 persons per family. On the other hand, single male/father families (288 | 10.8%) represent the smallest median family size with 2.48 persons per family.
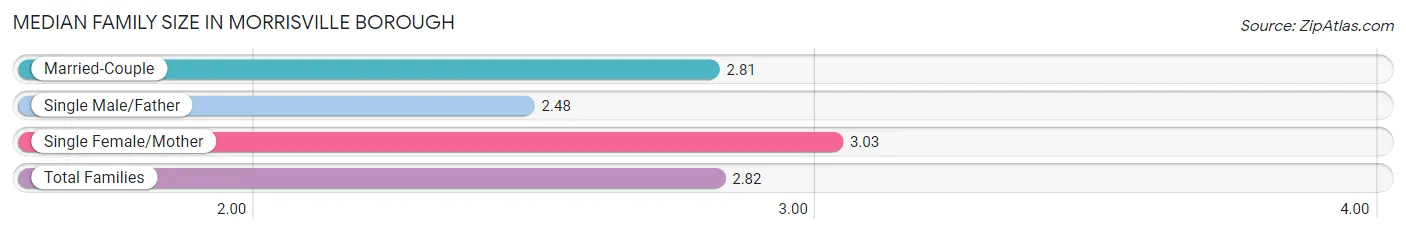
| Family Type | # Families | Family Size |
| Married-Couple | 1,774 (66.3%) | 2.81 |
| Single Male/Father | 288 (10.8%) | 2.48 |
| Single Female/Mother | 614 (22.9%) | 3.03 |
| Total Families | 2,676 (100.0%) | 2.82 |
Median Household Size in Morrisville borough
The median household size in Morrisville borough is 2.44 persons per household, with single female/mother households (614 | 15.4%) accounting for the largest median household size of 3.51 persons per household. non-family households (1,302 | 32.7%) represent the smallest median household size with 1.33 persons per household.
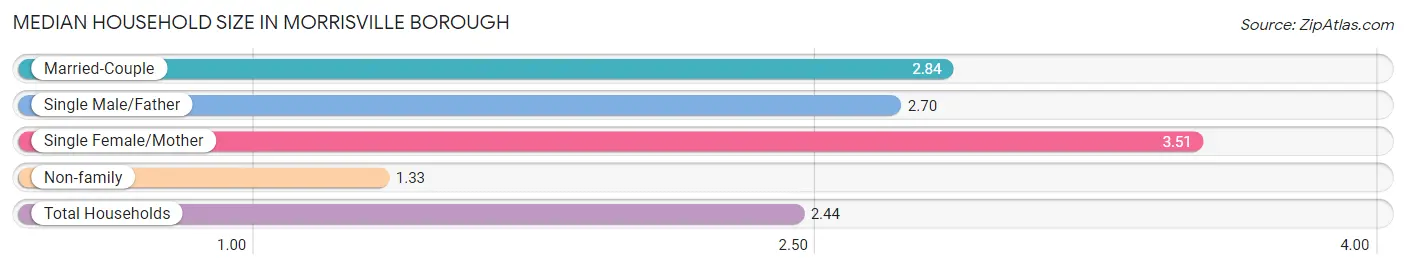
| Household Type | # Households | Household Size |
| Married-Couple | 1,774 (44.6%) | 2.84 |
| Single Male/Father | 288 (7.2%) | 2.70 |
| Single Female/Mother | 614 (15.4%) | 3.51 |
| Non-family | 1,302 (32.7%) | 1.33 |
| Total Households | 3,978 (100.0%) | 2.44 |
Household Size by Marriage Status in Morrisville borough
Out of a total of 3,978 households in Morrisville borough, 2,676 (67.3%) are family households, while 1,302 (32.7%) are nonfamily households. The most numerous type of family households are 2-person households, comprising 1,156, and the most common type of nonfamily households are 1-person households, comprising 990.
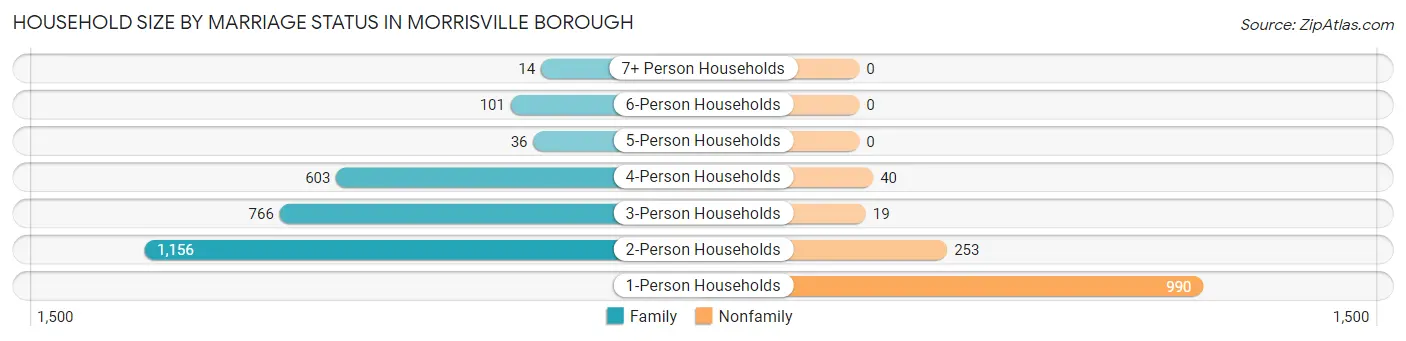
| Household Size | Family Households | Nonfamily Households |
| 1-Person Households | - | 990 (24.9%) |
| 2-Person Households | 1,156 (29.1%) | 253 (6.4%) |
| 3-Person Households | 766 (19.3%) | 19 (0.5%) |
| 4-Person Households | 603 (15.2%) | 40 (1.0%) |
| 5-Person Households | 36 (0.9%) | 0 (0.0%) |
| 6-Person Households | 101 (2.5%) | 0 (0.0%) |
| 7+ Person Households | 14 (0.4%) | 0 (0.0%) |
| Total | 2,676 (67.3%) | 1,302 (32.7%) |
Female Fertility in Morrisville borough
Fertility by Age in Morrisville borough
Average fertility rate in Morrisville borough is 19.0 births per 1,000 women. Women in the age bracket of 35 to 50 years have the highest fertility rate with 22.0 births per 1,000 women. Women in the age bracket of 35 to 50 years acount for 56.1% of all women with births.
| Age Bracket | Women with Births | Births / 1,000 Women |
| 15 to 19 years | 0 (0.0%) | 0.0 |
| 20 to 34 years | 18 (43.9%) | 20.0 |
| 35 to 50 years | 23 (56.1%) | 22.0 |
| Total | 41 (100.0%) | 19.0 |
Fertility by Age by Marriage Status in Morrisville borough
| Age Bracket | Married | Unmarried |
| 15 to 19 years | 0 (0.0%) | 0 (0.0%) |
| 20 to 34 years | 18 (100.0%) | 0 (0.0%) |
| 35 to 50 years | 23 (100.0%) | 0 (0.0%) |
| Total | 41 (100.0%) | 0 (0.0%) |
Fertility by Education in Morrisville borough
| Educational Attainment | Women with Births | Births / 1,000 Women |
| Less than High School | 0 (0.0%) | 0.0 |
| High School Diploma | 18 (43.9%) | 39.0 |
| College or Associate's Degree | 0 (0.0%) | 0.0 |
| Bachelor's Degree | 0 (0.0%) | 0.0 |
| Graduate Degree | 23 (56.1%) | 138.0 |
| Total | 41 (100.0%) | 19.0 |
Fertility by Education by Marriage Status in Morrisville borough
| Educational Attainment | Married | Unmarried |
| Less than High School | 0 (0.0%) | 0 (0.0%) |
| High School Diploma | 18 (100.0%) | 0 (0.0%) |
| College or Associate's Degree | 0 (0.0%) | 0 (0.0%) |
| Bachelor's Degree | 0 (0.0%) | 0 (0.0%) |
| Graduate Degree | 23 (100.0%) | 0 (0.0%) |
| Total | 41 (100.0%) | 0 (0.0%) |
Employment Characteristics in Morrisville borough
Employment by Class of Employer in Morrisville borough
Among the 5,327 employed individuals in Morrisville borough, private company employees (3,804 | 71.4%), not-for-profit organizations (470 | 8.8%), and state government employees (352 | 6.6%) make up the most common classes of employment.
| Employer Class | # Employees | % Employees |
| Private Company Employees | 3,804 | 71.4% |
| Self-Employed (Incorporated) | 118 | 2.2% |
| Self-Employed (Not Incorporated) | 344 | 6.5% |
| Not-for-profit Organizations | 470 | 8.8% |
| Local Government Employees | 187 | 3.5% |
| State Government Employees | 352 | 6.6% |
| Federal Government Employees | 47 | 0.9% |
| Unpaid Family Workers | 5 | 0.1% |
| Total | 5,327 | 100.0% |
Employment Status by Age in Morrisville borough
According to the labor force statistics for Morrisville borough, out of the total population over 16 years of age (7,985), 74.1% or 5,917 individuals are in the labor force, with 6.9% or 408 of them unemployed. The age group with the highest labor force participation rate is 30 to 34 years, with 94.0% or 785 individuals in the labor force. Within the labor force, the 16 to 19 years age range has the highest percentage of unemployed individuals, with 40.9% or 148 of them being unemployed.
| Age Bracket | In Labor Force | Unemployed |
| 16 to 19 Years | 362 (74.0%) | 148 (40.9%) |
| 20 to 24 Years | 290 (76.7%) | 7 (2.4%) |
| 25 to 29 Years | 475 (68.0%) | 49 (10.3%) |
| 30 to 34 Years | 785 (94.0%) | 72 (9.2%) |
| 35 to 44 Years | 1,147 (88.7%) | 23 (2.0%) |
| 45 to 54 Years | 1,232 (92.4%) | 39 (3.2%) |
| 55 to 59 Years | 733 (79.2%) | 0 (0.0%) |
| 60 to 64 Years | 227 (47.9%) | 28 (12.3%) |
| 65 to 74 Years | 662 (57.7%) | 44 (6.6%) |
| 75 Years and over | 7 (1.7%) | 0 (0.0%) |
| Total | 5,917 (74.1%) | 408 (6.9%) |
Employment Status by Educational Attainment in Morrisville borough
According to labor force statistics for Morrisville borough, 82.7% of individuals (4,598) out of the total population between 25 and 64 years of age (5,560) are in the labor force, with 4.6% or 212 of them being unemployed. The group with the highest labor force participation rate are those with the educational attainment of bachelor's degree or higher, with 90.7% or 2,004 individuals in the labor force. Within the labor force, individuals with high school diploma education have the highest percentage of unemployment, with 8.3% or 108 of them being unemployed.
| Educational Attainment | In Labor Force | Unemployed |
| Less than High School | 167 (50.9%) | 0 (0.0%) |
| High School Diploma | 1,304 (79.9%) | 135 (8.3%) |
| College / Associate Degree | 1,123 (80.8%) | 28 (2.0%) |
| Bachelor's Degree or higher | 2,004 (90.7%) | 88 (4.0%) |
| Total | 4,598 (82.7%) | 256 (4.6%) |
Employment Occupations by Sex in Morrisville borough
Management, Business, Science and Arts Occupations
The most common Management, Business, Science and Arts occupations in Morrisville borough are Computers, Engineering & Science (524 | 9.5%), Community & Social Service (466 | 8.5%), Business & Financial (452 | 8.2%), Management (311 | 5.7%), and Computers & Mathematics (265 | 4.8%).
Management, Business, Science and Arts Occupations by Sex
Within the Management, Business, Science and Arts occupations in Morrisville borough, the most male-oriented occupations are Architecture & Engineering (100.0%), Legal Services & Support (79.4%), and Computers, Engineering & Science (74.1%), while the most female-oriented occupations are Arts, Media & Entertainment (100.0%), Education Instruction & Library (87.4%), and Health Technologists (86.4%).
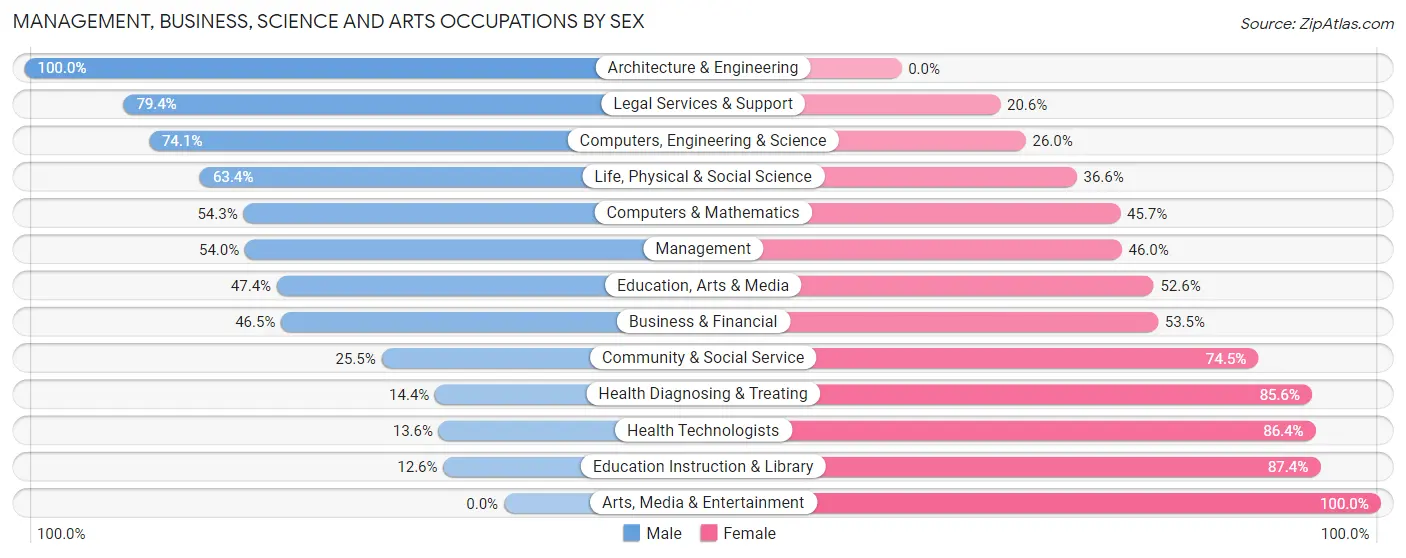
| Occupation | Male | Female |
| Management | 168 (54.0%) | 143 (46.0%) |
| Business & Financial | 210 (46.5%) | 242 (53.5%) |
| Computers, Engineering & Science | 388 (74.1%) | 136 (26.0%) |
| Computers & Mathematics | 144 (54.3%) | 121 (45.7%) |
| Architecture & Engineering | 218 (100.0%) | 0 (0.0%) |
| Life, Physical & Social Science | 26 (63.4%) | 15 (36.6%) |
| Community & Social Service | 119 (25.5%) | 347 (74.5%) |
| Education, Arts & Media | 36 (47.4%) | 40 (52.6%) |
| Legal Services & Support | 50 (79.4%) | 13 (20.6%) |
| Education Instruction & Library | 33 (12.6%) | 228 (87.4%) |
| Arts, Media & Entertainment | 0 (0.0%) | 66 (100.0%) |
| Health Diagnosing & Treating | 29 (14.4%) | 173 (85.6%) |
| Health Technologists | 14 (13.6%) | 89 (86.4%) |
| Total (Category) | 914 (46.8%) | 1,041 (53.2%) |
| Total (Overall) | 2,926 (53.1%) | 2,583 (46.9%) |
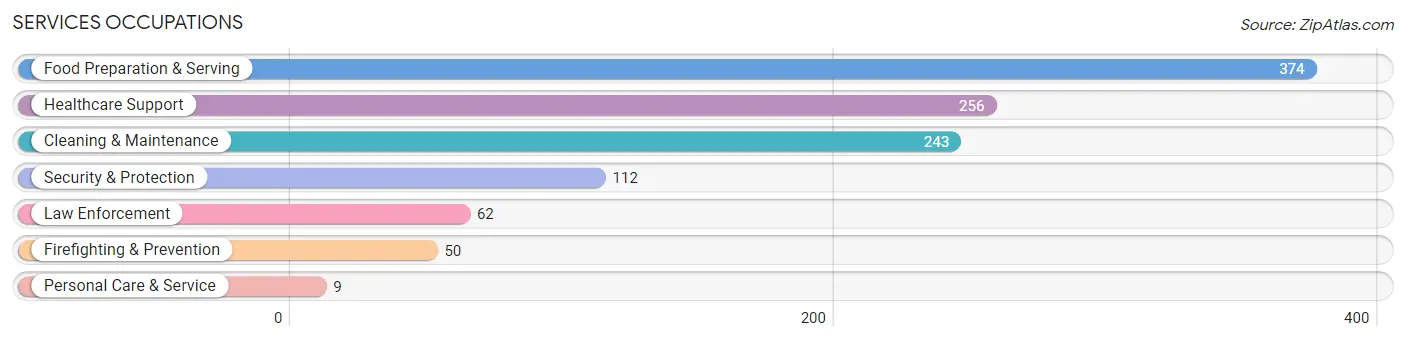
Services Occupations
The most common Services occupations in Morrisville borough are Food Preparation & Serving (374 | 6.8%), Healthcare Support (256 | 4.6%), Cleaning & Maintenance (243 | 4.4%), Security & Protection (112 | 2.0%), and Law Enforcement (62 | 1.1%).
Services Occupations by Sex
Within the Services occupations in Morrisville borough, the most male-oriented occupations are Personal Care & Service (100.0%), Cleaning & Maintenance (76.1%), and Firefighting & Prevention (66.0%), while the most female-oriented occupations are Law Enforcement (72.6%), Healthcare Support (66.4%), and Security & Protection (55.4%).
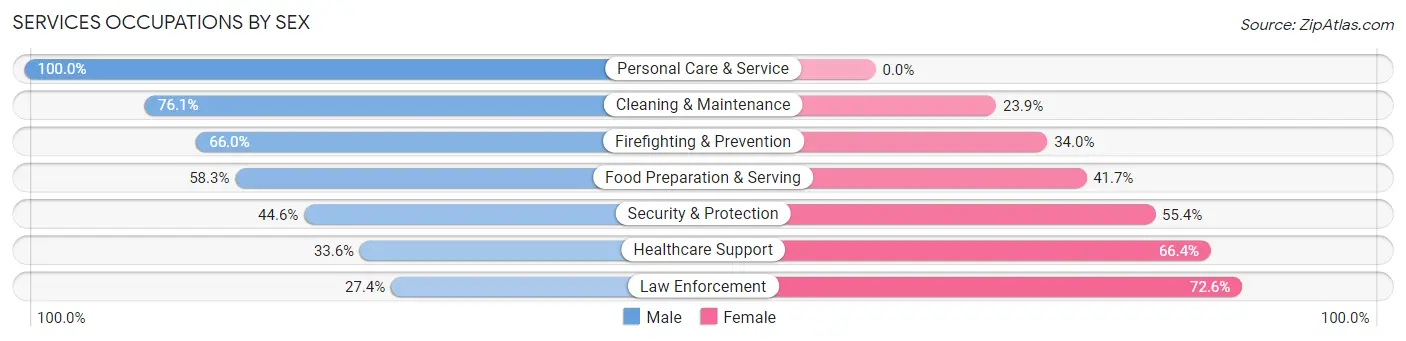
| Occupation | Male | Female |
| Healthcare Support | 86 (33.6%) | 170 (66.4%) |
| Security & Protection | 50 (44.6%) | 62 (55.4%) |
| Firefighting & Prevention | 33 (66.0%) | 17 (34.0%) |
| Law Enforcement | 17 (27.4%) | 45 (72.6%) |
| Food Preparation & Serving | 218 (58.3%) | 156 (41.7%) |
| Cleaning & Maintenance | 185 (76.1%) | 58 (23.9%) |
| Personal Care & Service | 9 (100.0%) | 0 (0.0%) |
| Total (Category) | 548 (55.1%) | 446 (44.9%) |
| Total (Overall) | 2,926 (53.1%) | 2,583 (46.9%) |
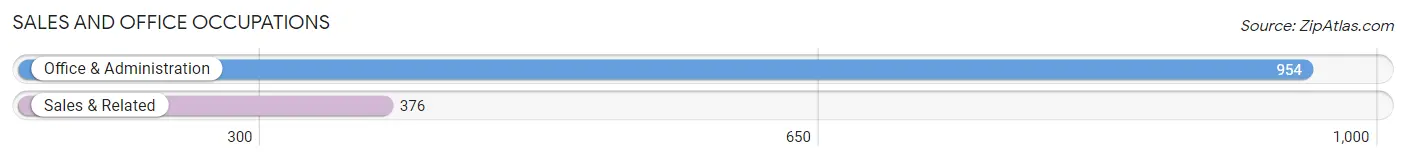
Sales and Office Occupations
The most common Sales and Office occupations in Morrisville borough are Office & Administration (954 | 17.3%), and Sales & Related (376 | 6.8%).
Sales and Office Occupations by Sex
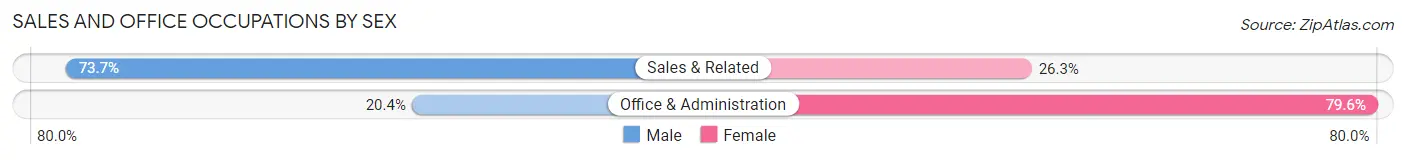
| Occupation | Male | Female |
| Sales & Related | 277 (73.7%) | 99 (26.3%) |
| Office & Administration | 195 (20.4%) | 759 (79.6%) |
| Total (Category) | 472 (35.5%) | 858 (64.5%) |
| Total (Overall) | 2,926 (53.1%) | 2,583 (46.9%) |
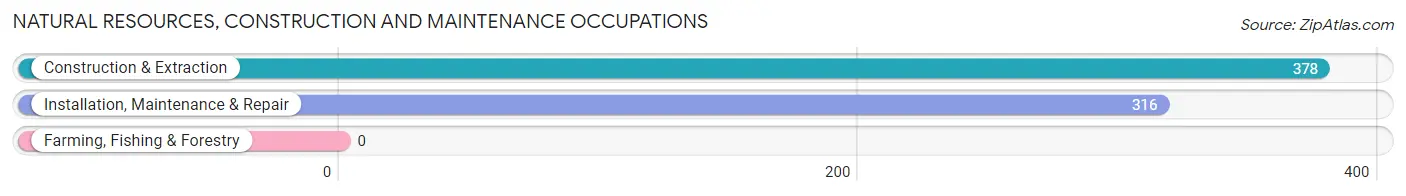
Natural Resources, Construction and Maintenance Occupations
The most common Natural Resources, Construction and Maintenance occupations in Morrisville borough are Construction & Extraction (378 | 6.9%), and Installation, Maintenance & Repair (316 | 5.7%).
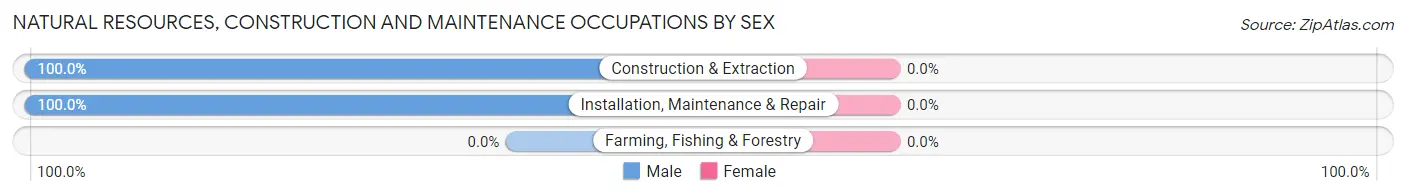
Natural Resources, Construction and Maintenance Occupations by Sex
| Occupation | Male | Female |
| Farming, Fishing & Forestry | 0 (0.0%) | 0 (0.0%) |
| Construction & Extraction | 378 (100.0%) | 0 (0.0%) |
| Installation, Maintenance & Repair | 316 (100.0%) | 0 (0.0%) |
| Total (Category) | 694 (100.0%) | 0 (0.0%) |
| Total (Overall) | 2,926 (53.1%) | 2,583 (46.9%) |
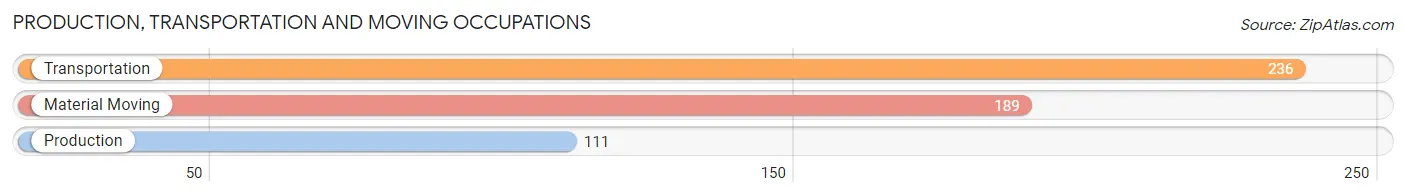
Production, Transportation and Moving Occupations
The most common Production, Transportation and Moving occupations in Morrisville borough are Transportation (236 | 4.3%), Material Moving (189 | 3.4%), and Production (111 | 2.0%).
Production, Transportation and Moving Occupations by Sex
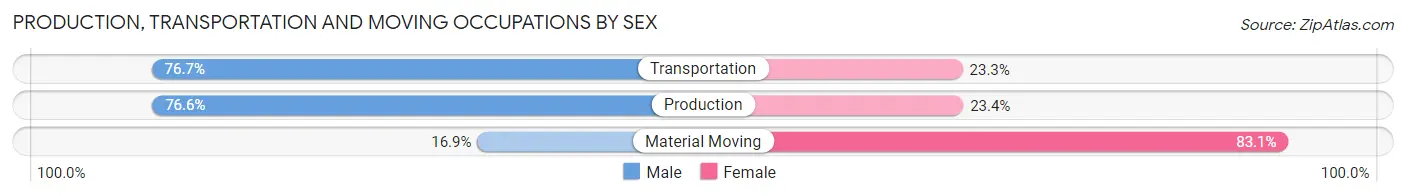
| Occupation | Male | Female |
| Production | 85 (76.6%) | 26 (23.4%) |
| Transportation | 181 (76.7%) | 55 (23.3%) |
| Material Moving | 32 (16.9%) | 157 (83.1%) |
| Total (Category) | 298 (55.6%) | 238 (44.4%) |
| Total (Overall) | 2,926 (53.1%) | 2,583 (46.9%) |
Employment Industries by Sex in Morrisville borough
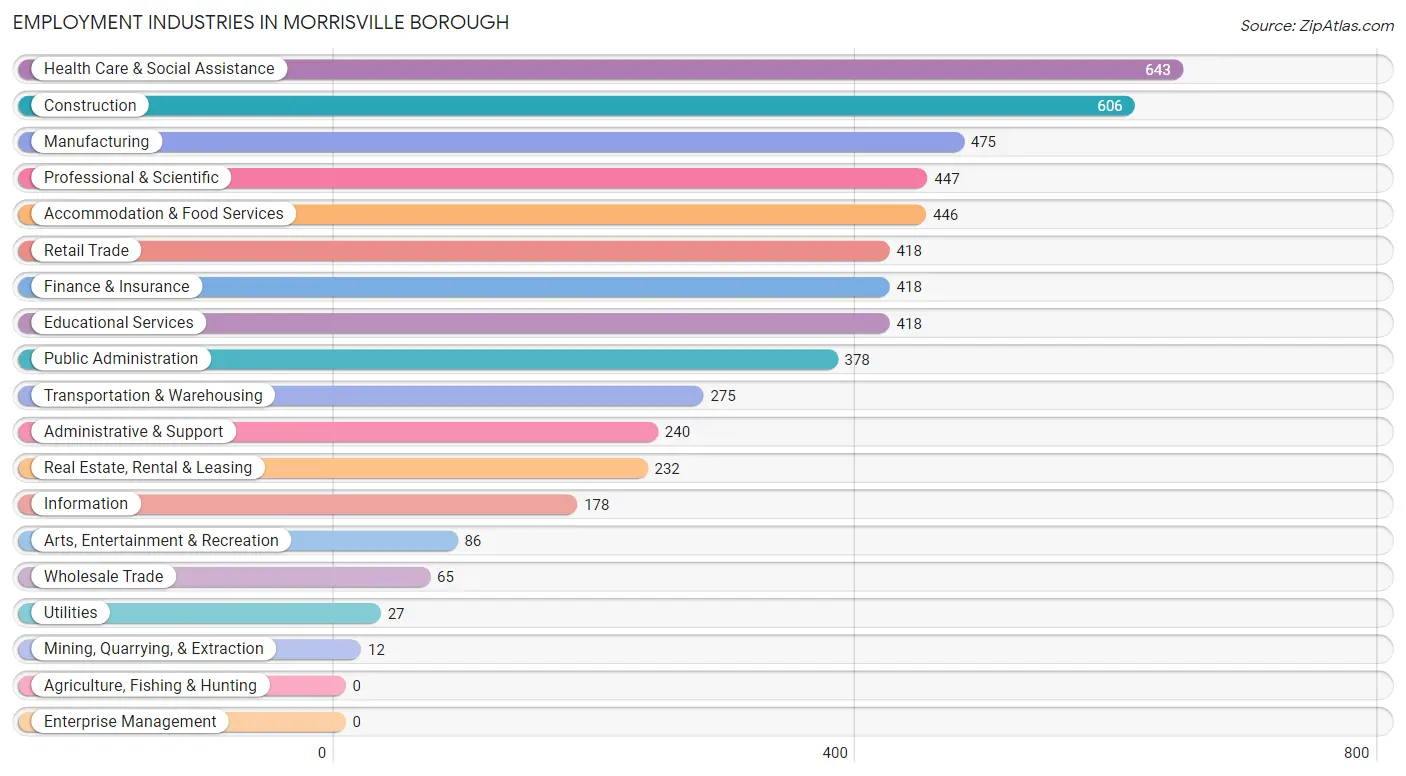
Employment Industries in Morrisville borough
The major employment industries in Morrisville borough include Health Care & Social Assistance (643 | 11.7%), Construction (606 | 11.0%), Manufacturing (475 | 8.6%), Professional & Scientific (447 | 8.1%), and Accommodation & Food Services (446 | 8.1%).
Employment Industries by Sex in Morrisville borough
The Morrisville borough industries that see more men than women are Mining, Quarrying, & Extraction (100.0%), Utilities (100.0%), and Real Estate, Rental & Leasing (100.0%), whereas the industries that tend to have a higher number of women are Finance & Insurance (82.1%), Health Care & Social Assistance (75.6%), and Retail Trade (73.7%).
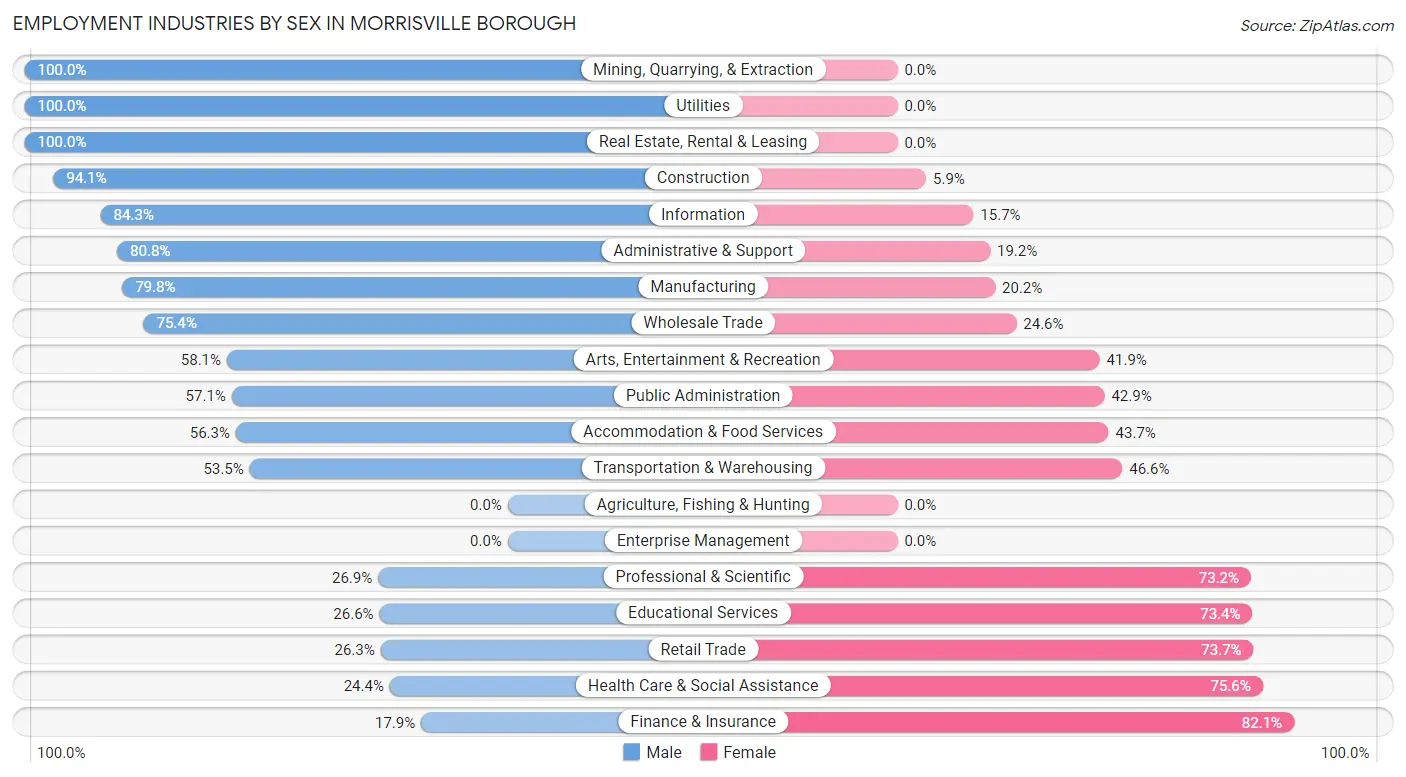
| Industry | Male | Female |
| Agriculture, Fishing & Hunting | 0 (0.0%) | 0 (0.0%) |
| Mining, Quarrying, & Extraction | 12 (100.0%) | 0 (0.0%) |
| Construction | 570 (94.1%) | 36 (5.9%) |
| Manufacturing | 379 (79.8%) | 96 (20.2%) |
| Wholesale Trade | 49 (75.4%) | 16 (24.6%) |
| Retail Trade | 110 (26.3%) | 308 (73.7%) |
| Transportation & Warehousing | 147 (53.4%) | 128 (46.6%) |
| Utilities | 27 (100.0%) | 0 (0.0%) |
| Information | 150 (84.3%) | 28 (15.7%) |
| Finance & Insurance | 75 (17.9%) | 343 (82.1%) |
| Real Estate, Rental & Leasing | 232 (100.0%) | 0 (0.0%) |
| Professional & Scientific | 120 (26.9%) | 327 (73.2%) |
| Enterprise Management | 0 (0.0%) | 0 (0.0%) |
| Administrative & Support | 194 (80.8%) | 46 (19.2%) |
| Educational Services | 111 (26.6%) | 307 (73.4%) |
| Health Care & Social Assistance | 157 (24.4%) | 486 (75.6%) |
| Arts, Entertainment & Recreation | 50 (58.1%) | 36 (41.9%) |
| Accommodation & Food Services | 251 (56.3%) | 195 (43.7%) |
| Public Administration | 216 (57.1%) | 162 (42.9%) |
| Total | 2,926 (53.1%) | 2,583 (46.9%) |
Education in Morrisville borough
School Enrollment in Morrisville borough
The most common levels of schooling among the 1,786 students in Morrisville borough are middle school (428 | 24.0%), high school (412 | 23.1%), and elementary school (403 | 22.6%).
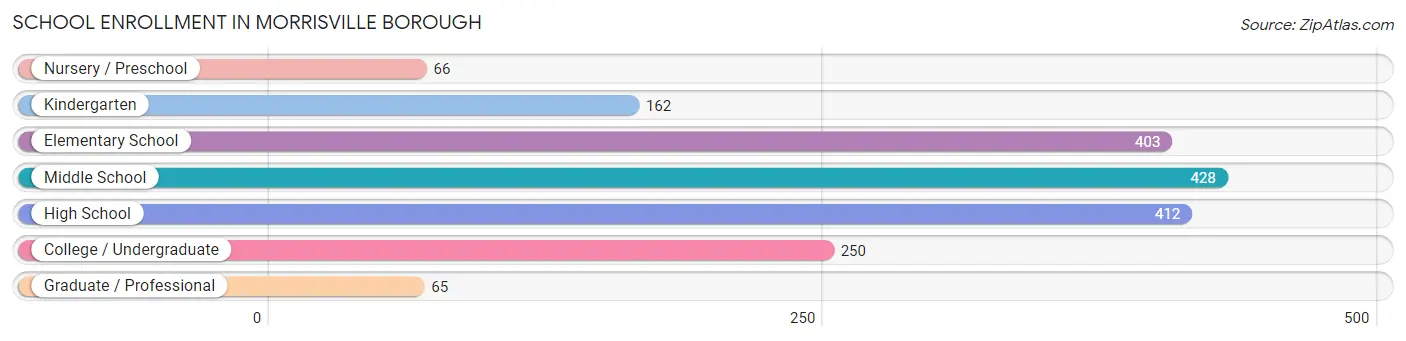
| School Level | # Students | % Students |
| Nursery / Preschool | 66 | 3.7% |
| Kindergarten | 162 | 9.1% |
| Elementary School | 403 | 22.6% |
| Middle School | 428 | 24.0% |
| High School | 412 | 23.1% |
| College / Undergraduate | 250 | 14.0% |
| Graduate / Professional | 65 | 3.6% |
| Total | 1,786 | 100.0% |
School Enrollment by Age by Funding Source in Morrisville borough
Out of a total of 1,786 students who are enrolled in schools in Morrisville borough, 411 (23.0%) attend a private institution, while the remaining 1,375 (77.0%) are enrolled in public schools. The age group of 3 to 4 year olds has the highest likelihood of being enrolled in private schools, with 40 (70.2% in the age bracket) enrolled. Conversely, the age group of 18 to 19 year olds has the lowest likelihood of being enrolled in a private school, with 101 (100.0% in the age bracket) attending a public institution.
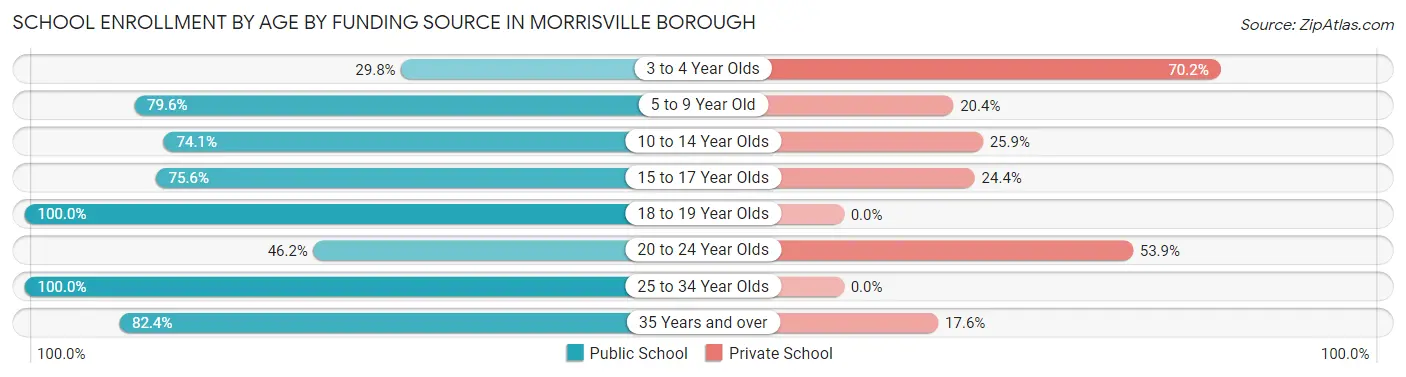
| Age Bracket | Public School | Private School |
| 3 to 4 Year Olds | 17 (29.8%) | 40 (70.2%) |
| 5 to 9 Year Old | 429 (79.6%) | 110 (20.4%) |
| 10 to 14 Year Olds | 389 (74.1%) | 136 (25.9%) |
| 15 to 17 Year Olds | 251 (75.6%) | 81 (24.4%) |
| 18 to 19 Year Olds | 101 (100.0%) | 0 (0.0%) |
| 20 to 24 Year Olds | 18 (46.2%) | 21 (53.8%) |
| 25 to 34 Year Olds | 68 (100.0%) | 0 (0.0%) |
| 35 Years and over | 103 (82.4%) | 22 (17.6%) |
| Total | 1,375 (77.0%) | 411 (23.0%) |
Educational Attainment by Field of Study in Morrisville borough
Business (543 | 20.6%), social sciences (478 | 18.1%), education (287 | 10.9%), computers & mathematics (208 | 7.9%), and engineering (192 | 7.3%) are the most common fields of study among 2,634 individuals in Morrisville borough who have obtained a bachelor's degree or higher.
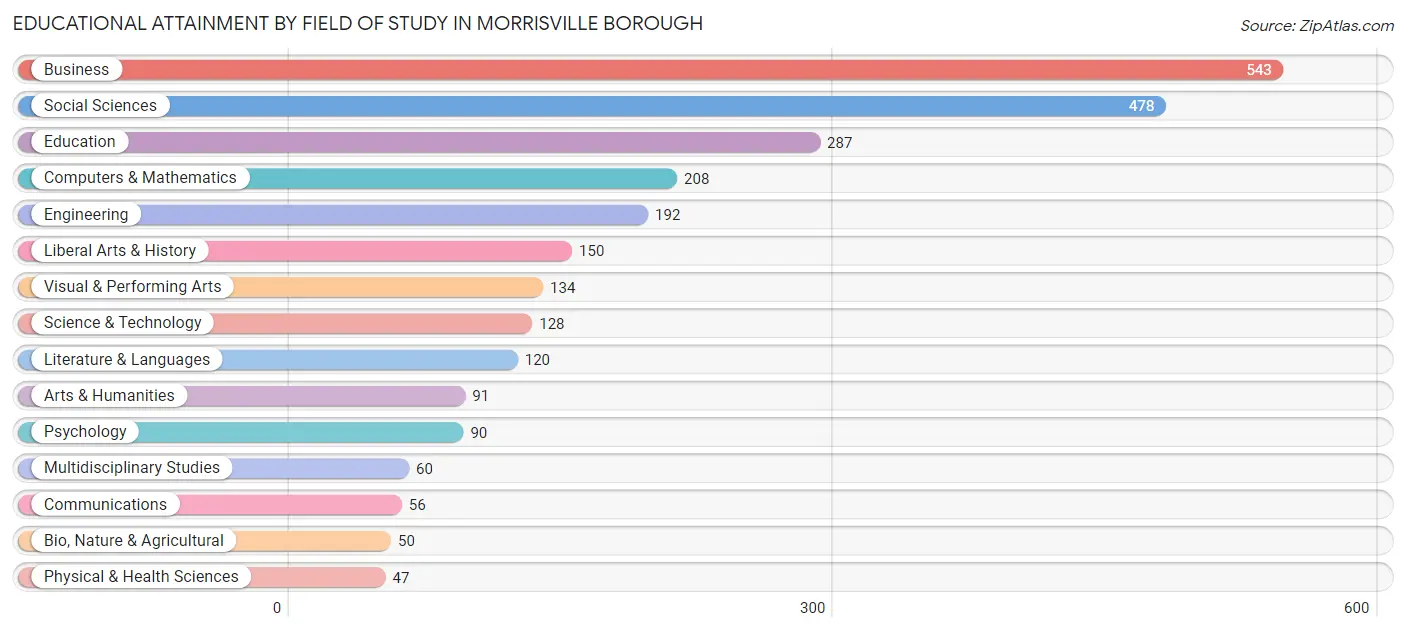
| Field of Study | # Graduates | % Graduates |
| Computers & Mathematics | 208 | 7.9% |
| Bio, Nature & Agricultural | 50 | 1.9% |
| Physical & Health Sciences | 47 | 1.8% |
| Psychology | 90 | 3.4% |
| Social Sciences | 478 | 18.1% |
| Engineering | 192 | 7.3% |
| Multidisciplinary Studies | 60 | 2.3% |
| Science & Technology | 128 | 4.9% |
| Business | 543 | 20.6% |
| Education | 287 | 10.9% |
| Literature & Languages | 120 | 4.6% |
| Liberal Arts & History | 150 | 5.7% |
| Visual & Performing Arts | 134 | 5.1% |
| Communications | 56 | 2.1% |
| Arts & Humanities | 91 | 3.5% |
| Total | 2,634 | 100.0% |
Transportation & Commute in Morrisville borough
Vehicle Availability by Sex in Morrisville borough
The most prevalent vehicle ownership categories in Morrisville borough are males with 2 vehicles (1,044, accounting for 36.3%) and females with 2 vehicles (1,092, making up 42.7%).
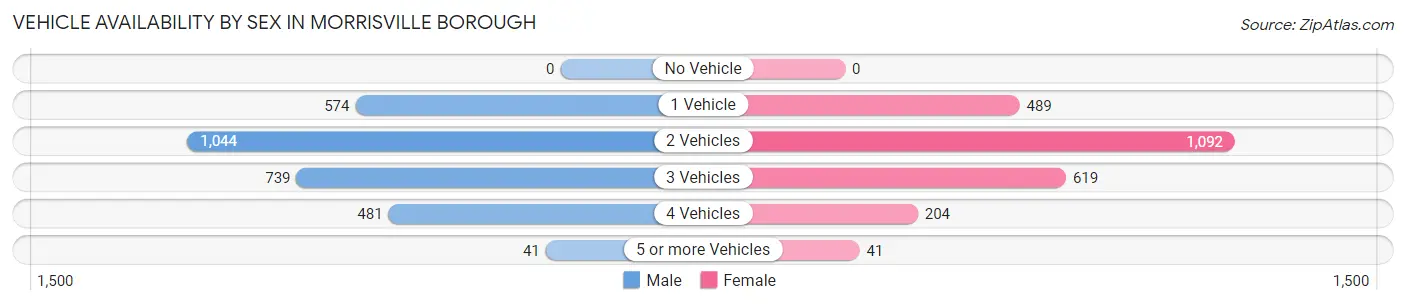
| Vehicles Available | Male | Female |
| No Vehicle | 0 (0.0%) | 0 (0.0%) |
| 1 Vehicle | 574 (19.9%) | 489 (20.0%) |
| 2 Vehicles | 1,044 (36.3%) | 1,092 (44.7%) |
| 3 Vehicles | 739 (25.7%) | 619 (25.3%) |
| 4 Vehicles | 481 (16.7%) | 204 (8.3%) |
| 5 or more Vehicles | 41 (1.4%) | 41 (1.7%) |
| Total | 2,879 (100.0%) | 2,445 (100.0%) |
Commute Time in Morrisville borough
The most frequently occuring commute durations in Morrisville borough are 10 to 14 minutes (963 commuters, 20.2%), 20 to 24 minutes (896 commuters, 18.8%), and 15 to 19 minutes (808 commuters, 16.9%).
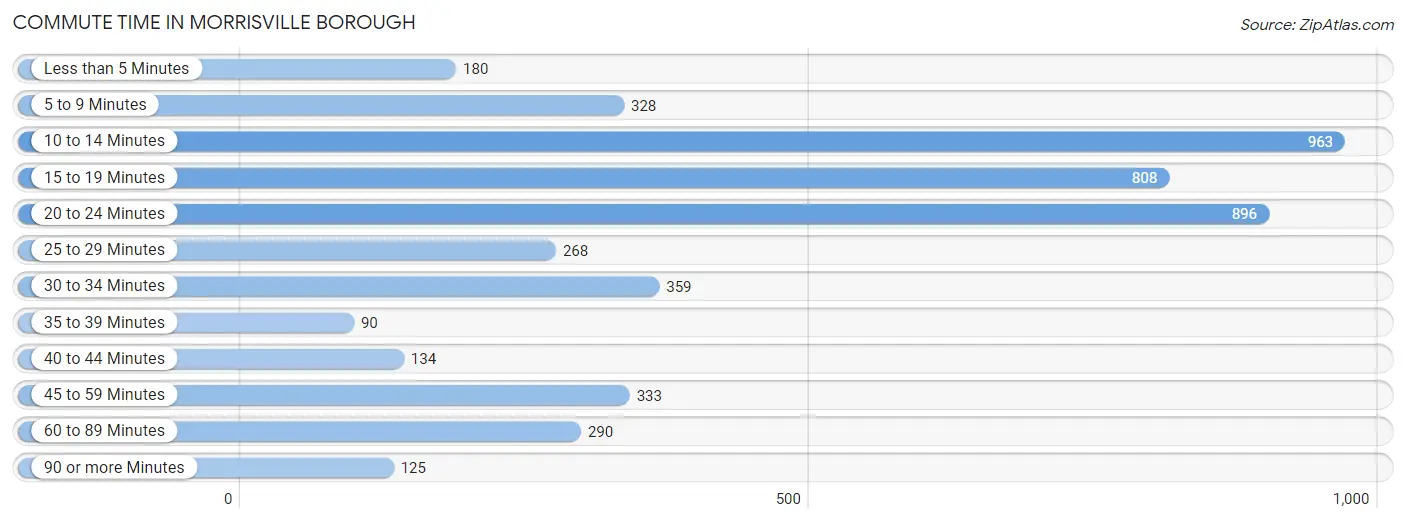
| Commute Time | # Commuters | % Commuters |
| Less than 5 Minutes | 180 | 3.8% |
| 5 to 9 Minutes | 328 | 6.9% |
| 10 to 14 Minutes | 963 | 20.2% |
| 15 to 19 Minutes | 808 | 16.9% |
| 20 to 24 Minutes | 896 | 18.8% |
| 25 to 29 Minutes | 268 | 5.6% |
| 30 to 34 Minutes | 359 | 7.5% |
| 35 to 39 Minutes | 90 | 1.9% |
| 40 to 44 Minutes | 134 | 2.8% |
| 45 to 59 Minutes | 333 | 7.0% |
| 60 to 89 Minutes | 290 | 6.1% |
| 90 or more Minutes | 125 | 2.6% |
Commute Time by Sex in Morrisville borough
The most common commute times in Morrisville borough are 10 to 14 minutes (703 commuters, 26.3%) for males and 20 to 24 minutes (494 commuters, 23.6%) for females.
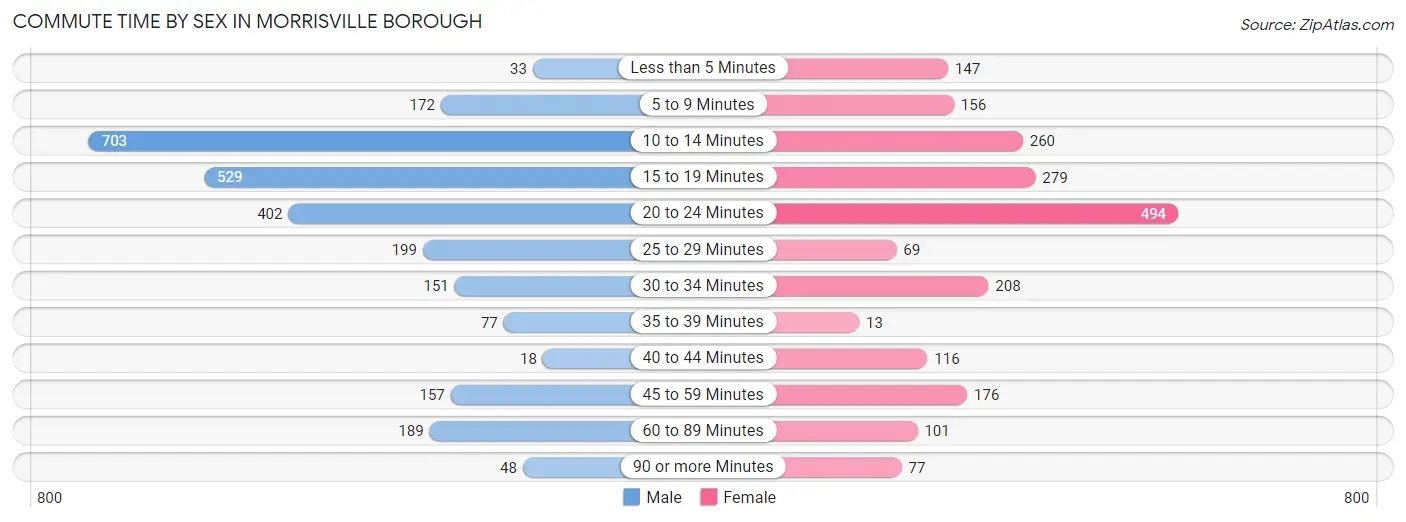
| Commute Time | Male | Female |
| Less than 5 Minutes | 33 (1.2%) | 147 (7.0%) |
| 5 to 9 Minutes | 172 (6.4%) | 156 (7.4%) |
| 10 to 14 Minutes | 703 (26.3%) | 260 (12.4%) |
| 15 to 19 Minutes | 529 (19.8%) | 279 (13.3%) |
| 20 to 24 Minutes | 402 (15.0%) | 494 (23.6%) |
| 25 to 29 Minutes | 199 (7.4%) | 69 (3.3%) |
| 30 to 34 Minutes | 151 (5.6%) | 208 (9.9%) |
| 35 to 39 Minutes | 77 (2.9%) | 13 (0.6%) |
| 40 to 44 Minutes | 18 (0.7%) | 116 (5.5%) |
| 45 to 59 Minutes | 157 (5.9%) | 176 (8.4%) |
| 60 to 89 Minutes | 189 (7.1%) | 101 (4.8%) |
| 90 or more Minutes | 48 (1.8%) | 77 (3.7%) |
Time of Departure to Work by Sex in Morrisville borough
The most frequent times of departure to work in Morrisville borough are 9:00 AM to 9:59 AM (488, 18.2%) for males and 8:00 AM to 8:29 AM (490, 23.4%) for females.
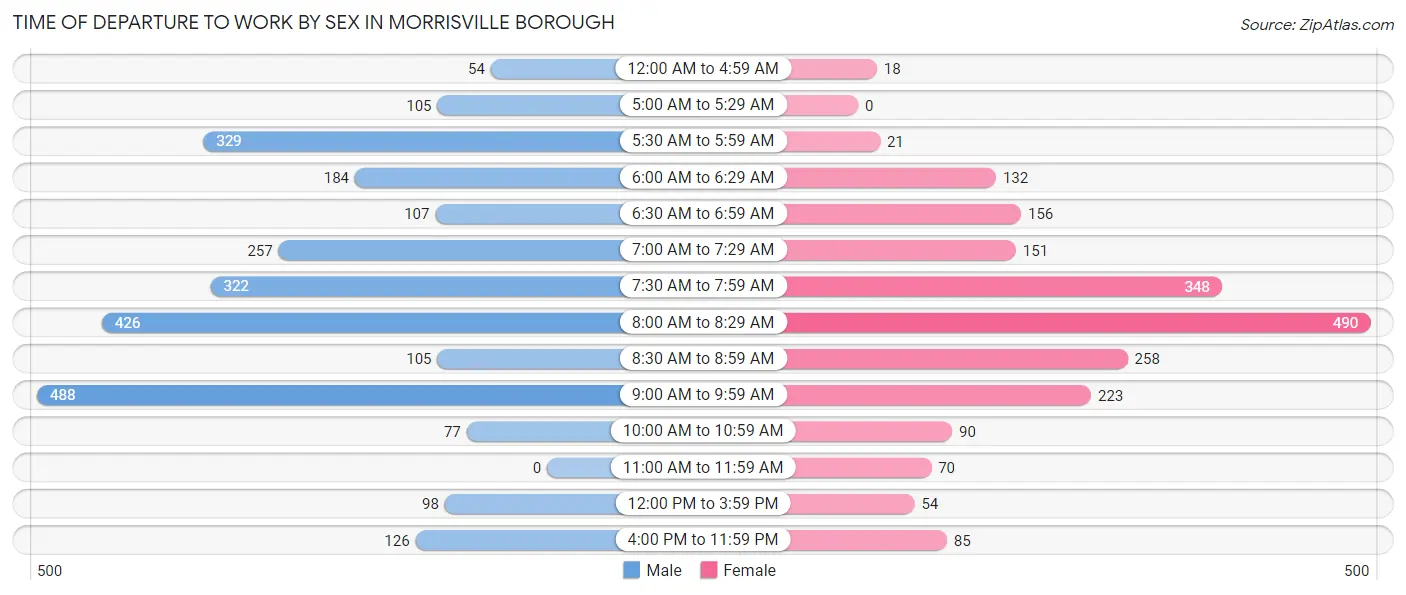
| Time of Departure | Male | Female |
| 12:00 AM to 4:59 AM | 54 (2.0%) | 18 (0.9%) |
| 5:00 AM to 5:29 AM | 105 (3.9%) | 0 (0.0%) |
| 5:30 AM to 5:59 AM | 329 (12.3%) | 21 (1.0%) |
| 6:00 AM to 6:29 AM | 184 (6.9%) | 132 (6.3%) |
| 6:30 AM to 6:59 AM | 107 (4.0%) | 156 (7.4%) |
| 7:00 AM to 7:29 AM | 257 (9.6%) | 151 (7.2%) |
| 7:30 AM to 7:59 AM | 322 (12.0%) | 348 (16.6%) |
| 8:00 AM to 8:29 AM | 426 (15.9%) | 490 (23.4%) |
| 8:30 AM to 8:59 AM | 105 (3.9%) | 258 (12.3%) |
| 9:00 AM to 9:59 AM | 488 (18.2%) | 223 (10.6%) |
| 10:00 AM to 10:59 AM | 77 (2.9%) | 90 (4.3%) |
| 11:00 AM to 11:59 AM | 0 (0.0%) | 70 (3.3%) |
| 12:00 PM to 3:59 PM | 98 (3.7%) | 54 (2.6%) |
| 4:00 PM to 11:59 PM | 126 (4.7%) | 85 (4.1%) |
| Total | 2,678 (100.0%) | 2,096 (100.0%) |
Housing Occupancy in Morrisville borough
Occupancy by Ownership in Morrisville borough
Of the total 3,978 dwellings in Morrisville borough, owner-occupied units account for 2,726 (68.5%), while renter-occupied units make up 1,252 (31.5%).
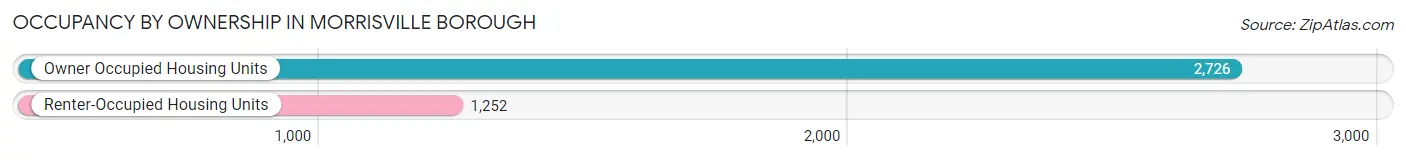
| Occupancy | # Housing Units | % Housing Units |
| Owner Occupied Housing Units | 2,726 | 68.5% |
| Renter-Occupied Housing Units | 1,252 | 31.5% |
| Total Occupied Housing Units | 3,978 | 100.0% |
Occupancy by Household Size in Morrisville borough
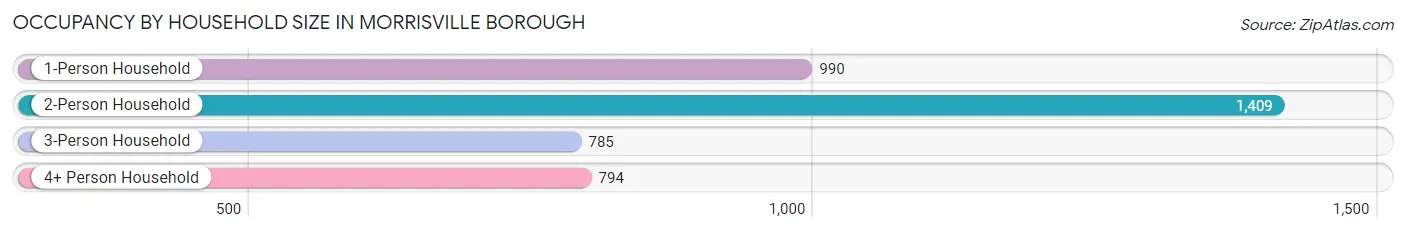
| Household Size | # Housing Units | % Housing Units |
| 1-Person Household | 990 | 24.9% |
| 2-Person Household | 1,409 | 35.4% |
| 3-Person Household | 785 | 19.7% |
| 4+ Person Household | 794 | 20.0% |
| Total Housing Units | 3,978 | 100.0% |
Occupancy by Ownership by Household Size in Morrisville borough
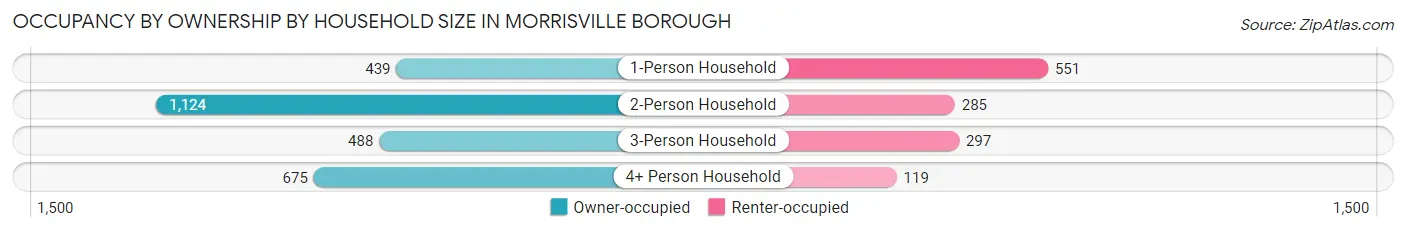
| Household Size | Owner-occupied | Renter-occupied |
| 1-Person Household | 439 (44.3%) | 551 (55.7%) |
| 2-Person Household | 1,124 (79.8%) | 285 (20.2%) |
| 3-Person Household | 488 (62.2%) | 297 (37.8%) |
| 4+ Person Household | 675 (85.0%) | 119 (15.0%) |
| Total Housing Units | 2,726 (68.5%) | 1,252 (31.5%) |
Occupancy by Educational Attainment in Morrisville borough
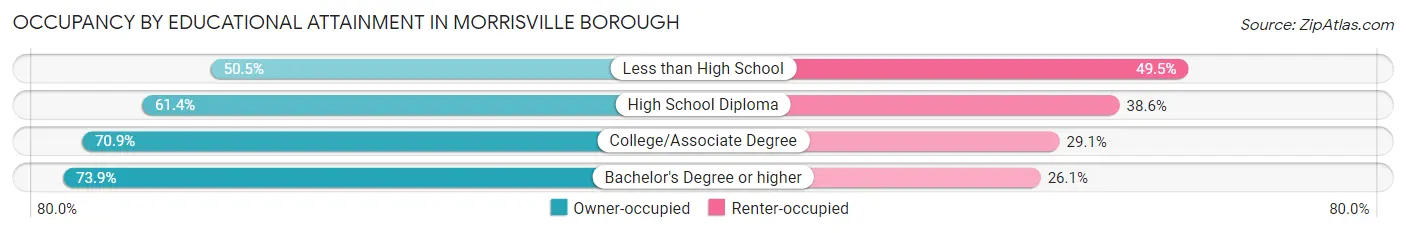
| Household Size | Owner-occupied | Renter-occupied |
| Less than High School | 51 (50.5%) | 50 (49.5%) |
| High School Diploma | 774 (61.4%) | 487 (38.6%) |
| College/Associate Degree | 760 (70.9%) | 312 (29.1%) |
| Bachelor's Degree or higher | 1,141 (73.9%) | 403 (26.1%) |
Occupancy by Age of Householder in Morrisville borough
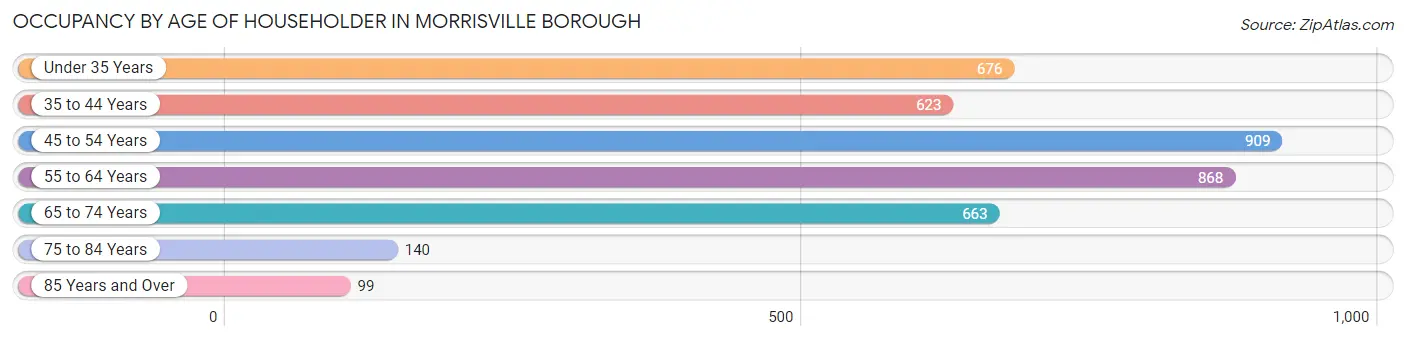
| Age Bracket | # Households | % Households |
| Under 35 Years | 676 | 17.0% |
| 35 to 44 Years | 623 | 15.7% |
| 45 to 54 Years | 909 | 22.9% |
| 55 to 64 Years | 868 | 21.8% |
| 65 to 74 Years | 663 | 16.7% |
| 75 to 84 Years | 140 | 3.5% |
| 85 Years and Over | 99 | 2.5% |
| Total | 3,978 | 100.0% |
Housing Finances in Morrisville borough
Median Income by Occupancy in Morrisville borough
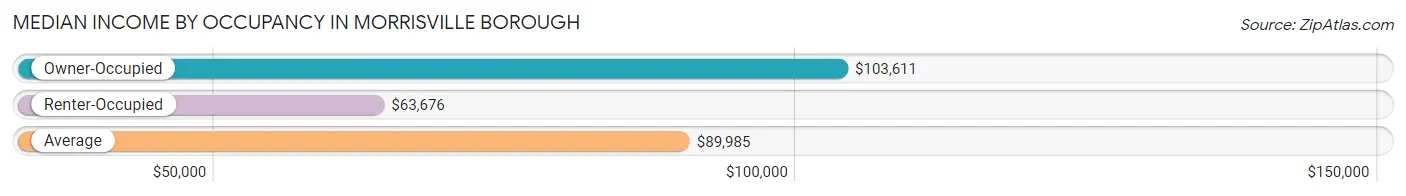
| Occupancy Type | # Households | Median Income |
| Owner-Occupied | 2,726 (68.5%) | $103,611 |
| Renter-Occupied | 1,252 (31.5%) | $63,676 |
| Average | 3,978 (100.0%) | $89,985 |
Occupancy by Householder Income Bracket in Morrisville borough
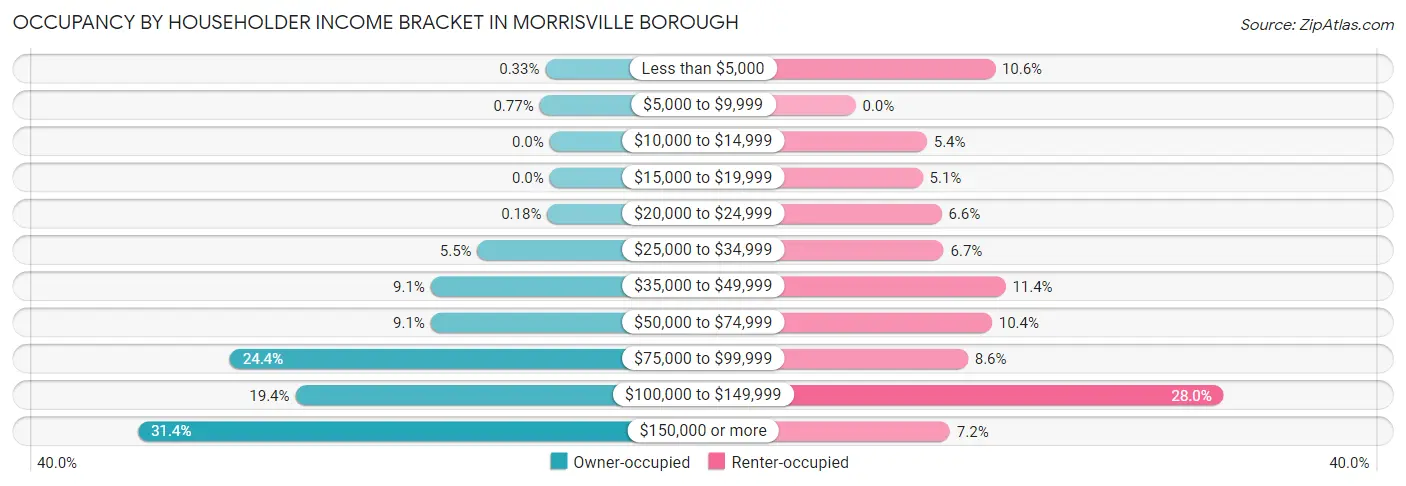
| Income Bracket | Owner-occupied | Renter-occupied |
| Less than $5,000 | 9 (0.3%) | 133 (10.6%) |
| $5,000 to $9,999 | 21 (0.8%) | 0 (0.0%) |
| $10,000 to $14,999 | 0 (0.0%) | 68 (5.4%) |
| $15,000 to $19,999 | 0 (0.0%) | 64 (5.1%) |
| $20,000 to $24,999 | 5 (0.2%) | 82 (6.6%) |
| $25,000 to $34,999 | 150 (5.5%) | 84 (6.7%) |
| $35,000 to $49,999 | 247 (9.1%) | 143 (11.4%) |
| $50,000 to $74,999 | 247 (9.1%) | 130 (10.4%) |
| $75,000 to $99,999 | 664 (24.4%) | 107 (8.6%) |
| $100,000 to $149,999 | 528 (19.4%) | 351 (28.0%) |
| $150,000 or more | 855 (31.4%) | 90 (7.2%) |
| Total | 2,726 (100.0%) | 1,252 (100.0%) |
Monthly Housing Cost Tiers in Morrisville borough
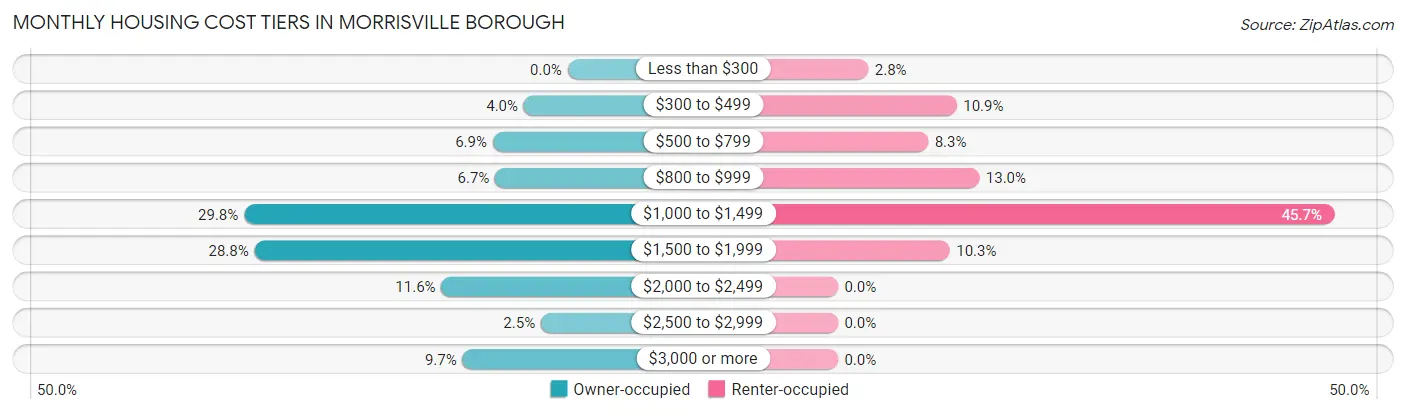
| Monthly Cost | Owner-occupied | Renter-occupied |
| Less than $300 | 0 (0.0%) | 35 (2.8%) |
| $300 to $499 | 110 (4.0%) | 137 (10.9%) |
| $500 to $799 | 188 (6.9%) | 104 (8.3%) |
| $800 to $999 | 182 (6.7%) | 163 (13.0%) |
| $1,000 to $1,499 | 812 (29.8%) | 572 (45.7%) |
| $1,500 to $1,999 | 786 (28.8%) | 129 (10.3%) |
| $2,000 to $2,499 | 317 (11.6%) | 0 (0.0%) |
| $2,500 to $2,999 | 67 (2.5%) | 0 (0.0%) |
| $3,000 or more | 264 (9.7%) | 0 (0.0%) |
| Total | 2,726 (100.0%) | 1,252 (100.0%) |
Physical Housing Characteristics in Morrisville borough
Housing Structures in Morrisville borough
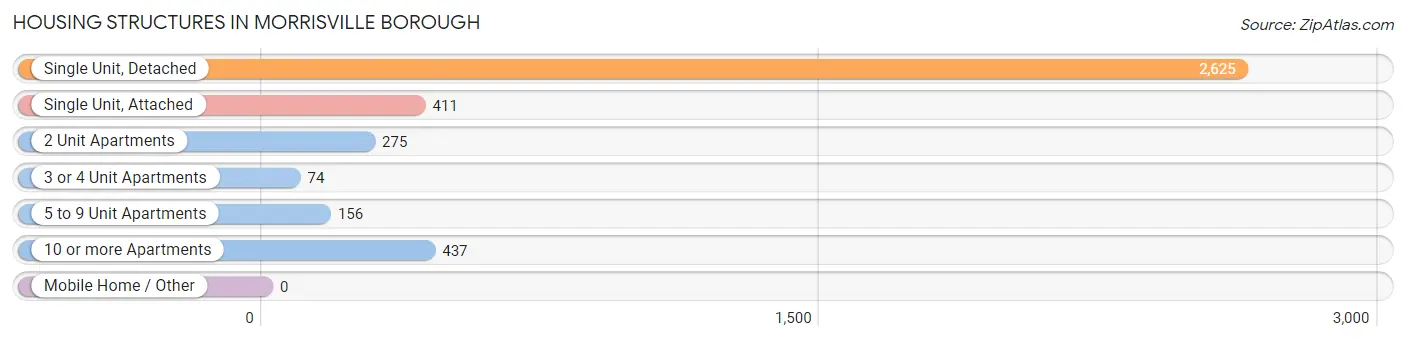
| Structure Type | # Housing Units | % Housing Units |
| Single Unit, Detached | 2,625 | 66.0% |
| Single Unit, Attached | 411 | 10.3% |
| 2 Unit Apartments | 275 | 6.9% |
| 3 or 4 Unit Apartments | 74 | 1.9% |
| 5 to 9 Unit Apartments | 156 | 3.9% |
| 10 or more Apartments | 437 | 11.0% |
| Mobile Home / Other | 0 | 0.0% |
| Total | 3,978 | 100.0% |
Housing Structures by Occupancy in Morrisville borough
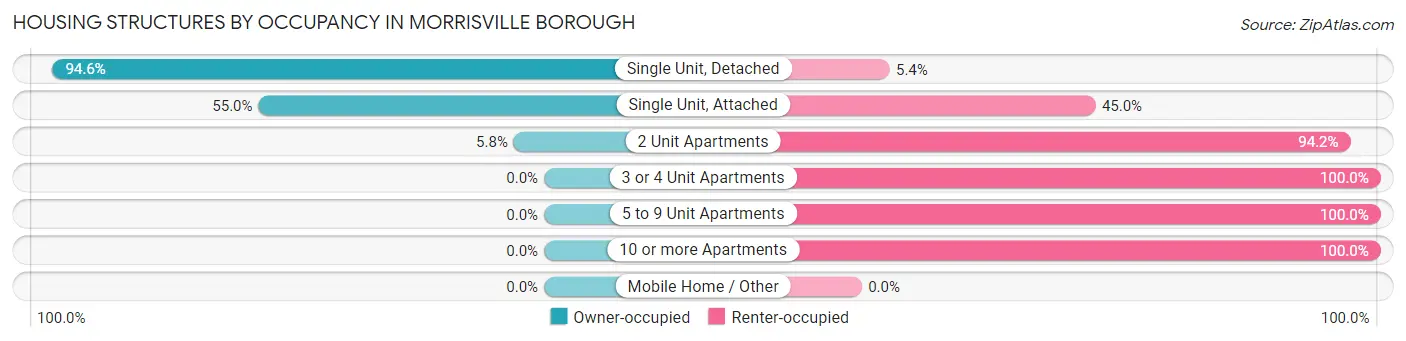
| Structure Type | Owner-occupied | Renter-occupied |
| Single Unit, Detached | 2,484 (94.6%) | 141 (5.4%) |
| Single Unit, Attached | 226 (55.0%) | 185 (45.0%) |
| 2 Unit Apartments | 16 (5.8%) | 259 (94.2%) |
| 3 or 4 Unit Apartments | 0 (0.0%) | 74 (100.0%) |
| 5 to 9 Unit Apartments | 0 (0.0%) | 156 (100.0%) |
| 10 or more Apartments | 0 (0.0%) | 437 (100.0%) |
| Mobile Home / Other | 0 (0.0%) | 0 (0.0%) |
| Total | 2,726 (68.5%) | 1,252 (31.5%) |
Housing Structures by Number of Rooms in Morrisville borough
| Number of Rooms | Owner-occupied | Renter-occupied |
| 1 Room | 0 (0.0%) | 53 (4.2%) |
| 2 or 3 Rooms | 74 (2.7%) | 362 (28.9%) |
| 4 or 5 Rooms | 589 (21.6%) | 674 (53.8%) |
| 6 or 7 Rooms | 1,078 (39.6%) | 108 (8.6%) |
| 8 or more Rooms | 985 (36.1%) | 55 (4.4%) |
| Total | 2,726 (100.0%) | 1,252 (100.0%) |
Housing Structure by Heating Type in Morrisville borough
| Heating Type | Owner-occupied | Renter-occupied |
| Utility Gas | 1,016 (37.3%) | 451 (36.0%) |
| Bottled, Tank, or LP Gas | 110 (4.0%) | 0 (0.0%) |
| Electricity | 537 (19.7%) | 617 (49.3%) |
| Fuel Oil or Kerosene | 1,033 (37.9%) | 163 (13.0%) |
| Coal or Coke | 13 (0.5%) | 0 (0.0%) |
| All other Fuels | 17 (0.6%) | 0 (0.0%) |
| No Fuel Used | 0 (0.0%) | 21 (1.7%) |
| Total | 2,726 (100.0%) | 1,252 (100.0%) |
Household Vehicle Usage in Morrisville borough
| Vehicles per Household | Owner-occupied | Renter-occupied |
| No Vehicle | 36 (1.3%) | 205 (16.4%) |
| 1 Vehicle | 697 (25.6%) | 662 (52.9%) |
| 2 Vehicles | 965 (35.4%) | 369 (29.5%) |
| 3 or more Vehicles | 1,028 (37.7%) | 16 (1.3%) |
| Total | 2,726 (100.0%) | 1,252 (100.0%) |
Real Estate & Mortgages in Morrisville borough
Real Estate and Mortgage Overview in Morrisville borough
| Characteristic | Without Mortgage | With Mortgage |
| Housing Units | 859 | 1,867 |
| Median Property Value | $298,000 | $237,100 |
| Median Household Income | $140,508 | $485 |
| Monthly Housing Costs | $928 | $264 |
| Real Estate Taxes | $6,498 | $0 |
Property Value by Mortgage Status in Morrisville borough
| Property Value | Without Mortgage | With Mortgage |
| Less than $50,000 | 28 (3.3%) | 14 (0.7%) |
| $50,000 to $99,999 | 0 (0.0%) | 0 (0.0%) |
| $100,000 to $299,999 | 409 (47.6%) | 1,613 (86.4%) |
| $300,000 to $499,999 | 413 (48.1%) | 199 (10.7%) |
| $500,000 to $749,999 | 0 (0.0%) | 41 (2.2%) |
| $750,000 to $999,999 | 0 (0.0%) | 0 (0.0%) |
| $1,000,000 or more | 9 (1.1%) | 0 (0.0%) |
| Total | 859 (100.0%) | 1,867 (100.0%) |
Household Income by Mortgage Status in Morrisville borough
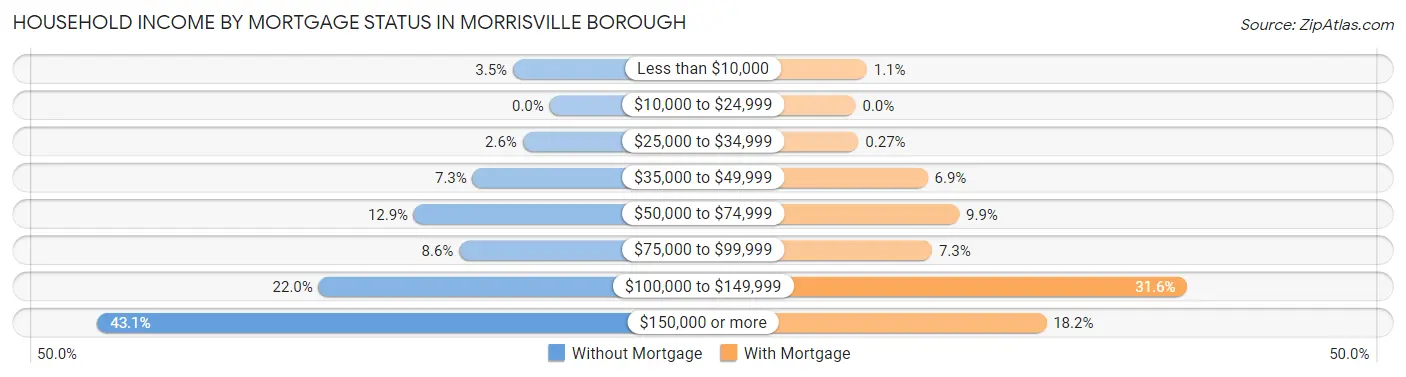
| Household Income | Without Mortgage | With Mortgage |
| Less than $10,000 | 30 (3.5%) | 20 (1.1%) |
| $10,000 to $24,999 | 0 (0.0%) | 0 (0.0%) |
| $25,000 to $34,999 | 22 (2.6%) | 5 (0.3%) |
| $35,000 to $49,999 | 63 (7.3%) | 128 (6.9%) |
| $50,000 to $74,999 | 111 (12.9%) | 184 (9.9%) |
| $75,000 to $99,999 | 74 (8.6%) | 136 (7.3%) |
| $100,000 to $149,999 | 189 (22.0%) | 590 (31.6%) |
| $150,000 or more | 370 (43.1%) | 339 (18.2%) |
| Total | 859 (100.0%) | 1,867 (100.0%) |
Property Value to Household Income Ratio in Morrisville borough
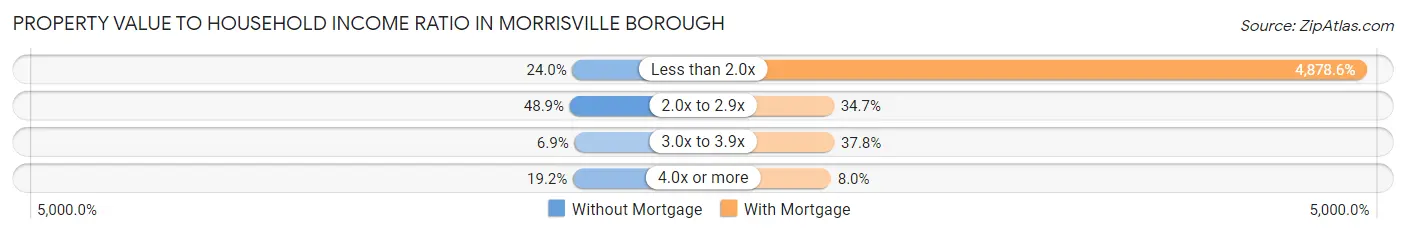
| Value-to-Income Ratio | Without Mortgage | With Mortgage |
| Less than 2.0x | 206 (24.0%) | 91,083 (4,878.6%) |
| 2.0x to 2.9x | 420 (48.9%) | 647 (34.6%) |
| 3.0x to 3.9x | 59 (6.9%) | 706 (37.8%) |
| 4.0x or more | 165 (19.2%) | 150 (8.0%) |
| Total | 859 (100.0%) | 1,867 (100.0%) |
Real Estate Taxes by Mortgage Status in Morrisville borough
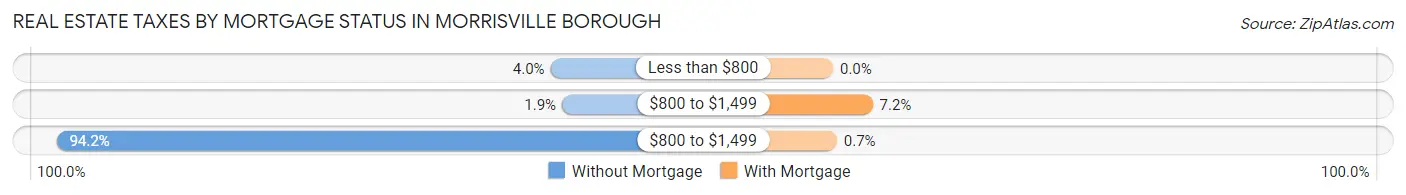
| Property Taxes | Without Mortgage | With Mortgage |
| Less than $800 | 34 (4.0%) | 0 (0.0%) |
| $800 to $1,499 | 16 (1.9%) | 135 (7.2%) |
| $800 to $1,499 | 809 (94.2%) | 13 (0.7%) |
| Total | 859 (100.0%) | 1,867 (100.0%) |
Health & Disability in Morrisville borough
Health Insurance Coverage by Age in Morrisville borough
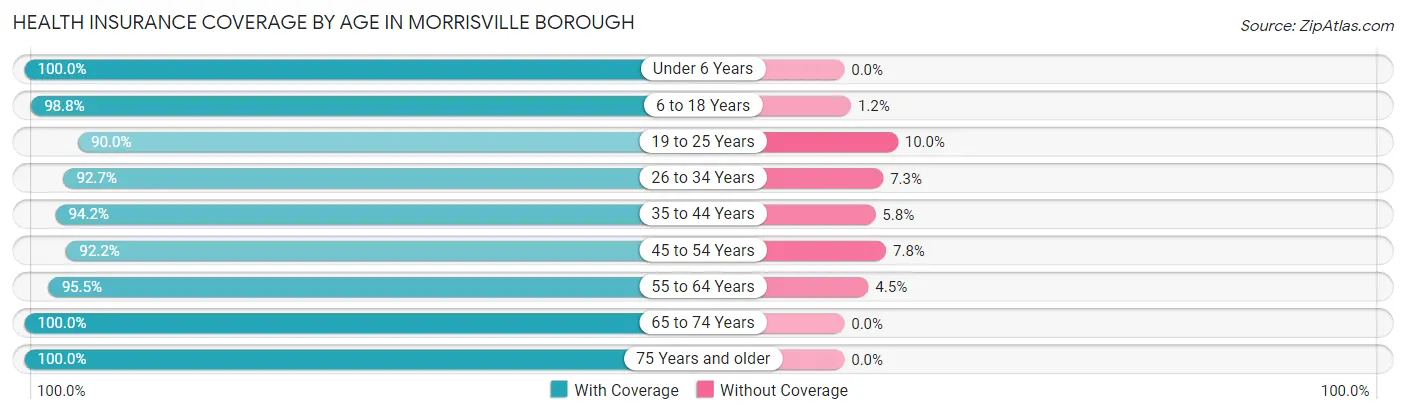
| Age Bracket | With Coverage | Without Coverage |
| Under 6 Years | 757 (100.0%) | 0 (0.0%) |
| 6 to 18 Years | 1,350 (98.8%) | 17 (1.2%) |
| 19 to 25 Years | 559 (90.0%) | 62 (10.0%) |
| 26 to 34 Years | 1,291 (92.7%) | 101 (7.3%) |
| 35 to 44 Years | 1,218 (94.2%) | 75 (5.8%) |
| 45 to 54 Years | 1,229 (92.2%) | 104 (7.8%) |
| 55 to 64 Years | 1,337 (95.5%) | 63 (4.5%) |
| 65 to 74 Years | 1,147 (100.0%) | 0 (0.0%) |
| 75 Years and older | 411 (100.0%) | 0 (0.0%) |
| Total | 9,299 (95.7%) | 422 (4.3%) |
Health Insurance Coverage by Citizenship Status in Morrisville borough
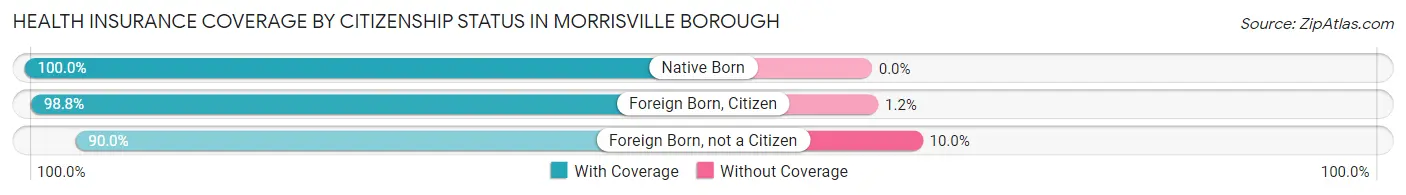
| Citizenship Status | With Coverage | Without Coverage |
| Native Born | 757 (100.0%) | 0 (0.0%) |
| Foreign Born, Citizen | 1,350 (98.8%) | 17 (1.2%) |
| Foreign Born, not a Citizen | 559 (90.0%) | 62 (10.0%) |
Health Insurance Coverage by Household Income in Morrisville borough
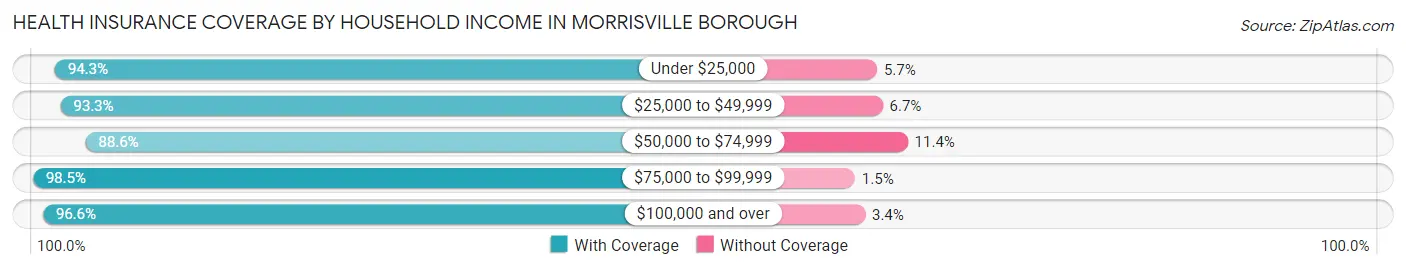
| Household Income | With Coverage | Without Coverage |
| Under $25,000 | 583 (94.3%) | 35 (5.7%) |
| $25,000 to $49,999 | 1,306 (93.3%) | 94 (6.7%) |
| $50,000 to $74,999 | 715 (88.6%) | 92 (11.4%) |
| $75,000 to $99,999 | 1,754 (98.5%) | 27 (1.5%) |
| $100,000 and over | 4,912 (96.6%) | 174 (3.4%) |
Public vs Private Health Insurance Coverage by Age in Morrisville borough
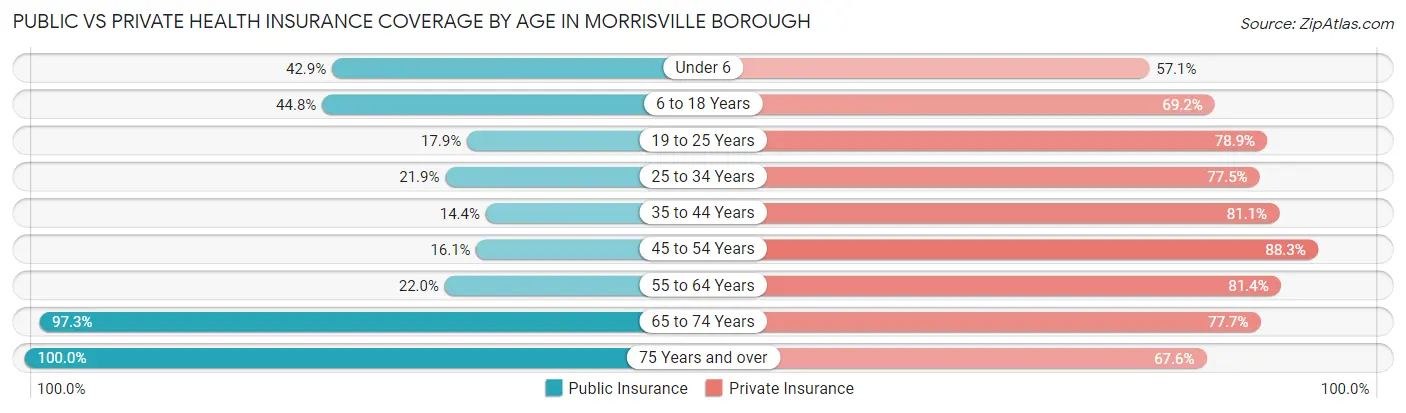
| Age Bracket | Public Insurance | Private Insurance |
| Under 6 | 325 (42.9%) | 432 (57.1%) |
| 6 to 18 Years | 612 (44.8%) | 946 (69.2%) |
| 19 to 25 Years | 111 (17.9%) | 490 (78.9%) |
| 25 to 34 Years | 305 (21.9%) | 1,079 (77.5%) |
| 35 to 44 Years | 186 (14.4%) | 1,049 (81.1%) |
| 45 to 54 Years | 215 (16.1%) | 1,177 (88.3%) |
| 55 to 64 Years | 308 (22.0%) | 1,140 (81.4%) |
| 65 to 74 Years | 1,116 (97.3%) | 891 (77.7%) |
| 75 Years and over | 411 (100.0%) | 278 (67.6%) |
| Total | 3,589 (36.9%) | 7,482 (77.0%) |
Disability Status by Sex by Age in Morrisville borough
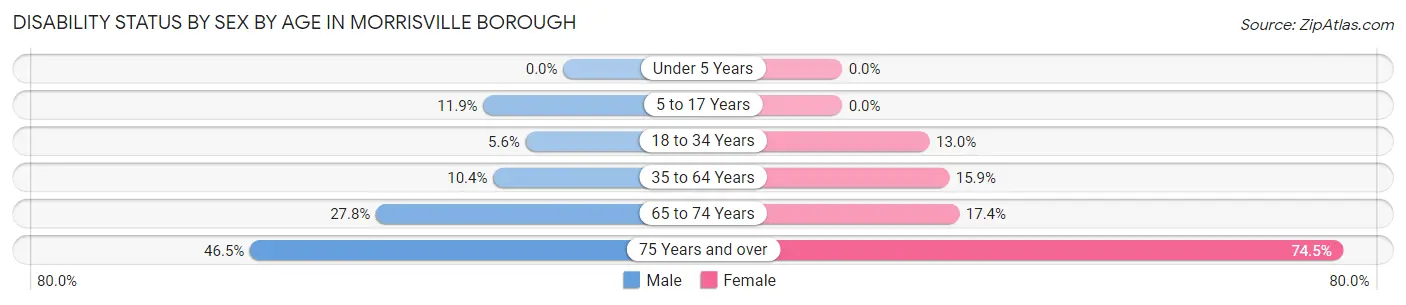
| Age Bracket | Male | Female |
| Under 5 Years | 0 (0.0%) | 0 (0.0%) |
| 5 to 17 Years | 115 (11.9%) | 0 (0.0%) |
| 18 to 34 Years | 68 (5.6%) | 126 (13.0%) |
| 35 to 64 Years | 200 (10.4%) | 334 (15.9%) |
| 65 to 74 Years | 162 (27.8%) | 98 (17.4%) |
| 75 Years and over | 100 (46.5%) | 146 (74.5%) |
Disability Class by Sex by Age in Morrisville borough
Disability Class: Hearing Difficulty
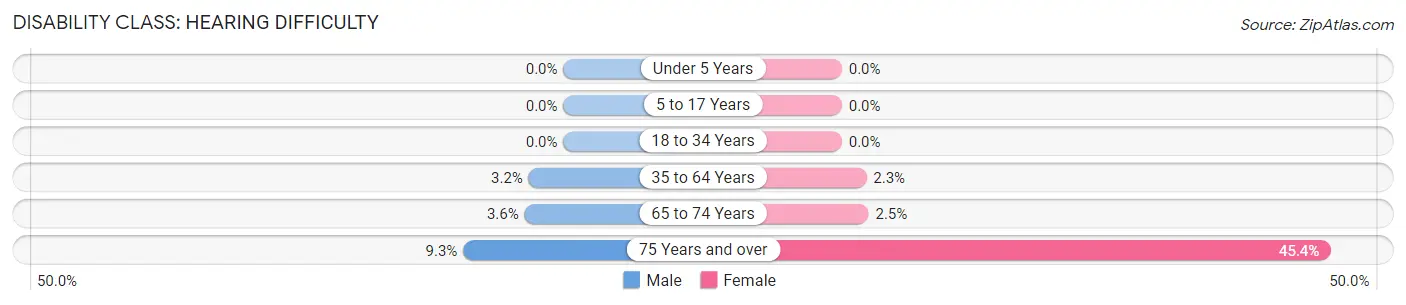
| Age Bracket | Male | Female |
| Under 5 Years | 0 (0.0%) | 0 (0.0%) |
| 5 to 17 Years | 0 (0.0%) | 0 (0.0%) |
| 18 to 34 Years | 0 (0.0%) | 0 (0.0%) |
| 35 to 64 Years | 62 (3.2%) | 48 (2.3%) |
| 65 to 74 Years | 21 (3.6%) | 14 (2.5%) |
| 75 Years and over | 20 (9.3%) | 89 (45.4%) |
Disability Class: Vision Difficulty
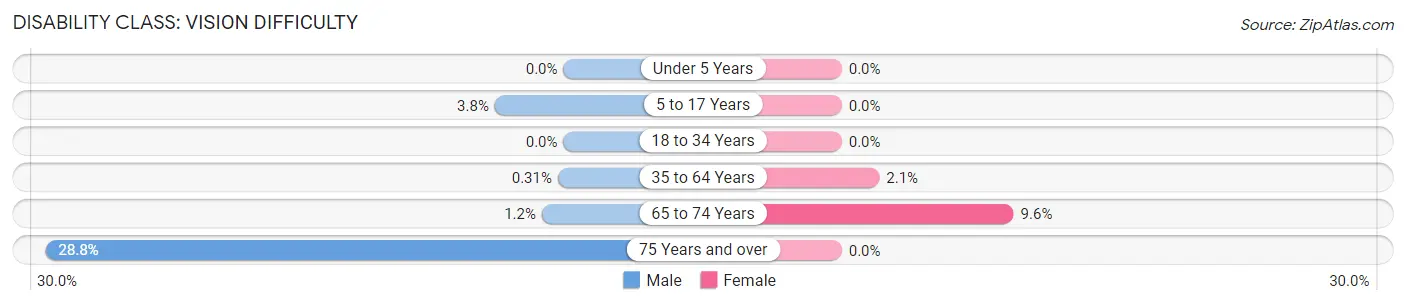
| Age Bracket | Male | Female |
| Under 5 Years | 0 (0.0%) | 0 (0.0%) |
| 5 to 17 Years | 37 (3.8%) | 0 (0.0%) |
| 18 to 34 Years | 0 (0.0%) | 0 (0.0%) |
| 35 to 64 Years | 6 (0.3%) | 44 (2.1%) |
| 65 to 74 Years | 7 (1.2%) | 54 (9.6%) |
| 75 Years and over | 62 (28.8%) | 0 (0.0%) |
Disability Class: Cognitive Difficulty
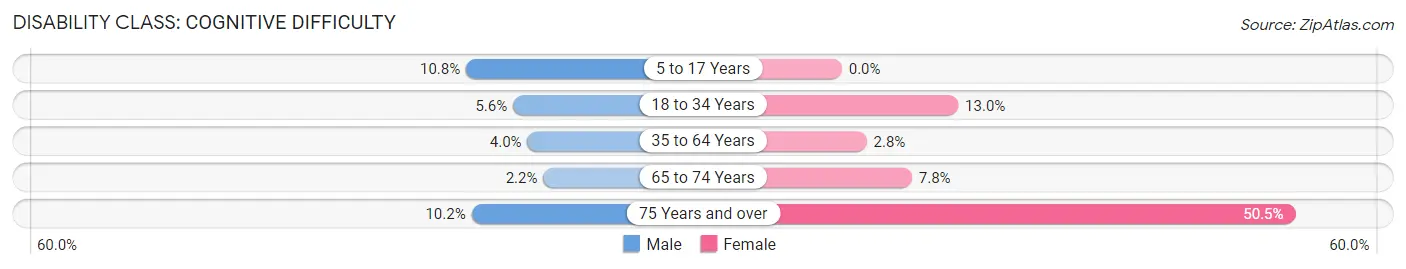
| Age Bracket | Male | Female |
| 5 to 17 Years | 105 (10.8%) | 0 (0.0%) |
| 18 to 34 Years | 68 (5.6%) | 126 (13.0%) |
| 35 to 64 Years | 77 (4.0%) | 58 (2.8%) |
| 65 to 74 Years | 13 (2.2%) | 44 (7.8%) |
| 75 Years and over | 22 (10.2%) | 99 (50.5%) |
Disability Class: Ambulatory Difficulty
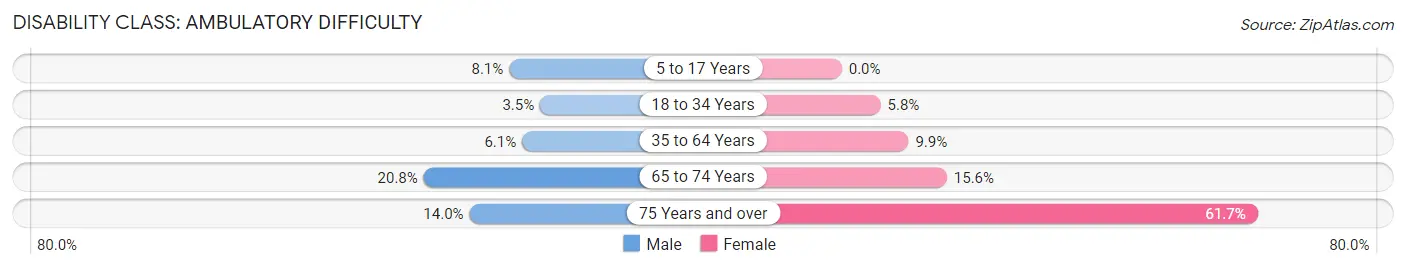
| Age Bracket | Male | Female |
| 5 to 17 Years | 78 (8.1%) | 0 (0.0%) |
| 18 to 34 Years | 42 (3.5%) | 56 (5.8%) |
| 35 to 64 Years | 118 (6.1%) | 208 (9.9%) |
| 65 to 74 Years | 121 (20.7%) | 88 (15.6%) |
| 75 Years and over | 30 (14.0%) | 121 (61.7%) |
Disability Class: Self-Care Difficulty
| Age Bracket | Male | Female |
| 5 to 17 Years | 20 (2.1%) | 0 (0.0%) |
| 18 to 34 Years | 46 (3.8%) | 0 (0.0%) |
| 35 to 64 Years | 97 (5.0%) | 16 (0.8%) |
| 65 to 74 Years | 0 (0.0%) | 23 (4.1%) |
| 75 Years and over | 12 (5.6%) | 49 (25.0%) |
Technology Access in Morrisville borough
Computing Device Access in Morrisville borough
| Device Type | # Households | % Households |
| Desktop or Laptop | 3,253 | 81.8% |
| Smartphone | 3,655 | 91.9% |
| Tablet | 2,652 | 66.7% |
| No Computing Device | 127 | 3.2% |
| Total | 3,978 | 100.0% |
Internet Access in Morrisville borough
| Internet Type | # Households | % Households |
| Dial-Up Internet | 5 | 0.1% |
| Broadband Home | 3,215 | 80.8% |
| Cellular Data Only | 306 | 7.7% |
| Satellite Internet | 37 | 0.9% |
| No Internet | 437 | 11.0% |
| Total | 3,978 | 100.0% |
Morrisville borough Summary
Morrisville Borough is a small borough located in Bucks County, Pennsylvania. It is situated along the Delaware River, just north of Trenton, New Jersey. The borough is part of the larger Philadelphia metropolitan area and is home to a population of 8,527 people as of the 2010 census.
History
Morrisville Borough was founded in 1804 by John Morris, a Quaker from Philadelphia. Morris purchased the land from the Lenape Indians and named the area after himself. The area was originally part of Falls Township, but was incorporated as a borough in 1876.
The borough was an important stop on the Delaware Canal, which connected Philadelphia to Easton, Pennsylvania. The canal was used to transport coal, lumber, and other goods. The canal was also used to transport passengers, and the Morrisville station was a popular stop for travelers.
The borough was also an important stop on the Pennsylvania Railroad, which ran through the area from 1876 to 1952. The railroad was used to transport passengers and freight, and the Morrisville station was a popular stop for travelers.
The borough was also home to several industries, including a paper mill, a brickyard, and a tannery. The paper mill was the largest employer in the borough, and it closed in the late 1970s.
Geography
Morrisville Borough is located in Bucks County, Pennsylvania. It is situated along the Delaware River, just north of Trenton, New Jersey. The borough is part of the larger Philadelphia metropolitan area.
The borough has a total area of 1.2 square miles, all of which is land. The borough is bordered by Falls Township to the north, Lower Makefield Township to the east, and Trenton, New Jersey to the south.
Economy
The economy of Morrisville Borough is largely based on retail and services. The borough is home to several small businesses, including restaurants, shops, and professional services. The borough is also home to a number of industrial businesses, including a paper mill, a brickyard, and a tannery.
The borough is also home to a number of government offices, including the Bucks County Courthouse, the Bucks County Prison, and the Morrisville Police Department.
Demographics
As of the 2010 census, the population of Morrisville Borough was 8,527. The racial makeup of the borough was 79.3% White, 11.2% African American, 0.3% Native American, 1.2% Asian, 0.1% Pacific Islander, 5.2% from other races, and 2.9% from two or more races. Hispanic or Latino of any race were 11.2% of the population.
The median household income in the borough was $45,945, and the median family income was $54,945. The per capita income in the borough was $22,945. About 8.3% of families and 10.2% of the population were below the poverty line, including 14.2% of those under age 18 and 6.2% of those age 65 or over.
Common Questions
What is Per Capita Income in Morrisville borough?
Per Capita income in Morrisville borough is $43,441.
What is the Median Family Income in Morrisville borough?
Median Family Income in Morrisville borough is $106,039.
What is the Median Household income in Morrisville borough?
Median Household Income in Morrisville borough is $89,985.
What is Income or Wage Gap in Morrisville borough?
Income or Wage Gap in Morrisville borough is 20.2%.
Women in Morrisville borough earn 79.8 cents for every dollar earned by a man.
What is Inequality or Gini Index in Morrisville borough?
Inequality or Gini Index in Morrisville borough is 0.37.
What is the Total Population of Morrisville borough?
Total Population of Morrisville borough is 9,721.
What is the Total Male Population of Morrisville borough?
Total Male Population of Morrisville borough is 5,282.
What is the Total Female Population of Morrisville borough?
Total Female Population of Morrisville borough is 4,439.
What is the Ratio of Males per 100 Females in Morrisville borough?
There are 118.99 Males per 100 Females in Morrisville borough.
What is the Ratio of Females per 100 Males in Morrisville borough?
There are 84.04 Females per 100 Males in Morrisville borough.
What is the Median Population Age in Morrisville borough?
Median Population Age in Morrisville borough is 39.8 Years.
What is the Average Family Size in Morrisville borough
Average Family Size in Morrisville borough is 2.8 People.
What is the Average Household Size in Morrisville borough
Average Household Size in Morrisville borough is 2.4 People.
How Large is the Labor Force in Morrisville borough?
There are 5,917 People in the Labor Forcein in Morrisville borough.
What is the Percentage of People in the Labor Force in Morrisville borough?
74.1% of People are in the Labor Force in Morrisville borough.
What is the Unemployment Rate in Morrisville borough?
Unemployment Rate in Morrisville borough is 6.9%.