Monessen, PA Map & Demographics
Monessen Map
Monessen Overview
$30,202
PER CAPITA INCOME
$81,940
AVG FAMILY INCOME
$51,364
AVG HOUSEHOLD INCOME
44.8%
WAGE / INCOME GAP [ % ]
55.2¢/ $1
WAGE / INCOME GAP [ $ ]
$16,449
FAMILY INCOME DEFICIT
0.43
INEQUALITY / GINI INDEX
6,876
TOTAL POPULATION
3,274
MALE POPULATION
3,602
FEMALE POPULATION
90.89
MALES / 100 FEMALES
110.02
FEMALES / 100 MALES
46.9
MEDIAN AGE
2.8
AVG FAMILY SIZE
2.1
AVG HOUSEHOLD SIZE
3,243
LABOR FORCE [ PEOPLE ]
56.6%
PERCENT IN LABOR FORCE
6.5%
UNEMPLOYMENT RATE
Monessen Zip Codes
Monessen Area Codes
Income in Monessen
Income Overview in Monessen
Per Capita Income in Monessen is $30,202, while median incomes of families and households are $81,940 and $51,364 respectively.
| Characteristic | Number | Measure |
| Per Capita Income | 6,876 | $30,202 |
| Median Family Income | 1,795 | $81,940 |
| Mean Family Income | 1,795 | $83,580 |
| Median Household Income | 3,236 | $51,364 |
| Mean Household Income | 3,236 | $64,045 |
| Income Deficit | 1,795 | $16,449 |
| Wage / Income Gap (%) | 6,876 | 44.84% |
| Wage / Income Gap ($) | 6,876 | 55.16¢ per $1 |
| Gini / Inequality Index | 6,876 | 0.43 |
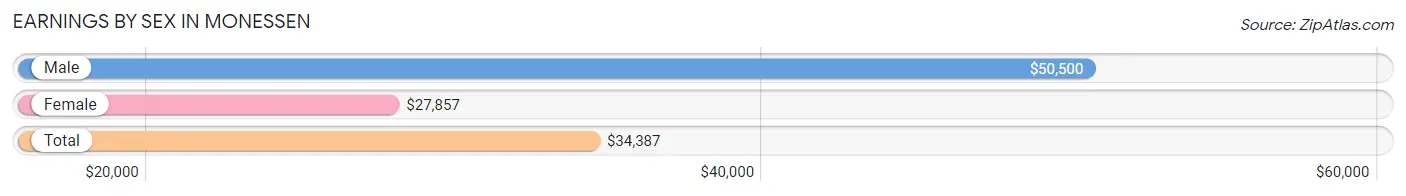
Earnings by Sex in Monessen
Average Earnings in Monessen are $34,387, $50,500 for men and $27,857 for women, a difference of 44.8%.
| Sex | Number | Average Earnings |
| Male | 1,628 (48.6%) | $50,500 |
| Female | 1,722 (51.4%) | $27,857 |
| Total | 3,350 (100.0%) | $34,387 |
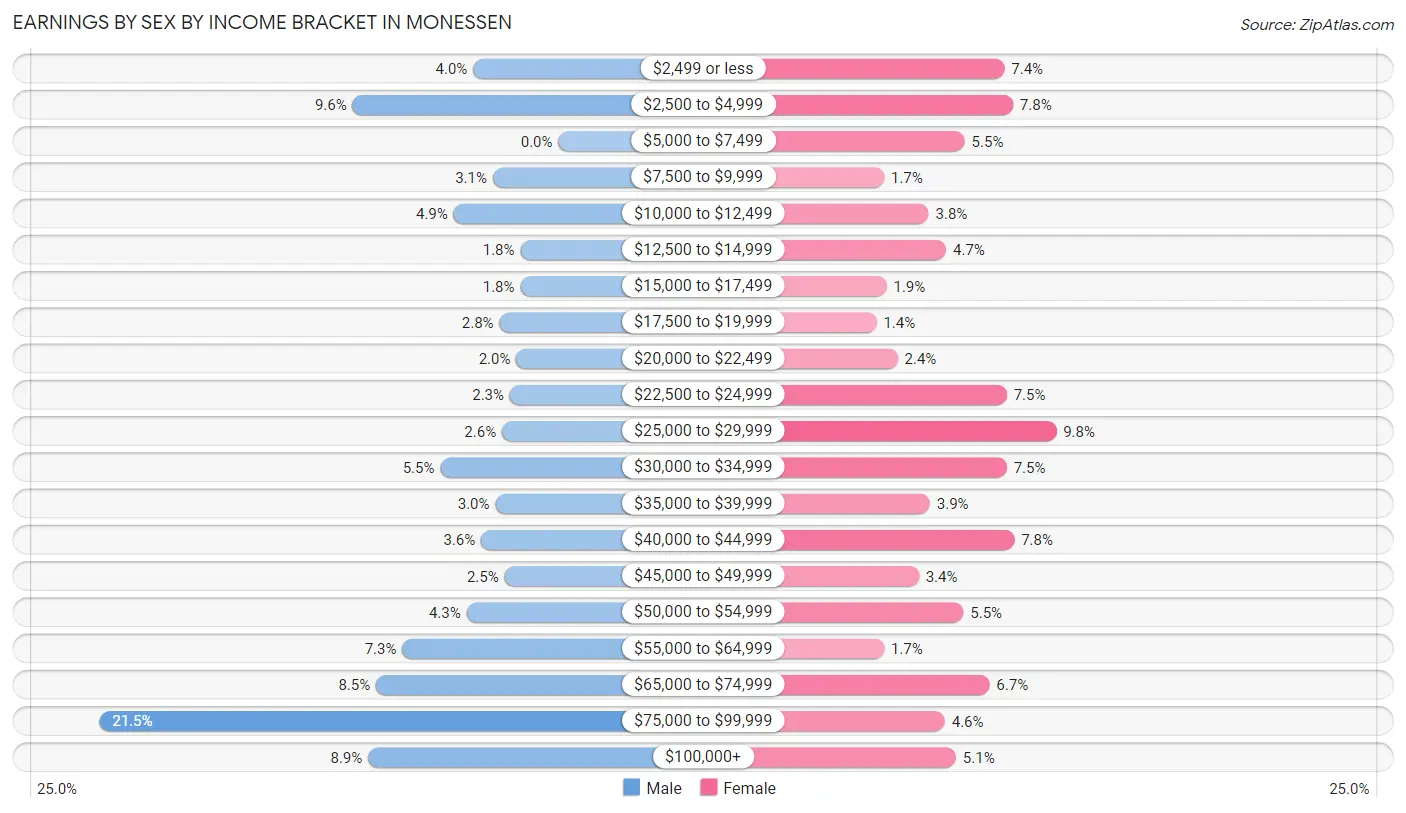
Earnings by Sex by Income Bracket in Monessen
The most common earnings brackets in Monessen are $75,000 to $99,999 for men (350 | 21.5%) and $25,000 to $29,999 for women (169 | 9.8%).
| Income | Male | Female |
| $2,499 or less | 65 (4.0%) | 127 (7.4%) |
| $2,500 to $4,999 | 157 (9.6%) | 134 (7.8%) |
| $5,000 to $7,499 | 0 (0.0%) | 95 (5.5%) |
| $7,500 to $9,999 | 50 (3.1%) | 30 (1.7%) |
| $10,000 to $12,499 | 80 (4.9%) | 66 (3.8%) |
| $12,500 to $14,999 | 29 (1.8%) | 80 (4.6%) |
| $15,000 to $17,499 | 29 (1.8%) | 32 (1.9%) |
| $17,500 to $19,999 | 45 (2.8%) | 24 (1.4%) |
| $20,000 to $22,499 | 32 (2.0%) | 41 (2.4%) |
| $22,500 to $24,999 | 37 (2.3%) | 129 (7.5%) |
| $25,000 to $29,999 | 43 (2.6%) | 169 (9.8%) |
| $30,000 to $34,999 | 90 (5.5%) | 129 (7.5%) |
| $35,000 to $39,999 | 48 (2.9%) | 67 (3.9%) |
| $40,000 to $44,999 | 59 (3.6%) | 135 (7.8%) |
| $45,000 to $49,999 | 41 (2.5%) | 58 (3.4%) |
| $50,000 to $54,999 | 70 (4.3%) | 94 (5.5%) |
| $55,000 to $64,999 | 119 (7.3%) | 30 (1.7%) |
| $65,000 to $74,999 | 139 (8.5%) | 115 (6.7%) |
| $75,000 to $99,999 | 350 (21.5%) | 79 (4.6%) |
| $100,000+ | 145 (8.9%) | 88 (5.1%) |
| Total | 1,628 (100.0%) | 1,722 (100.0%) |
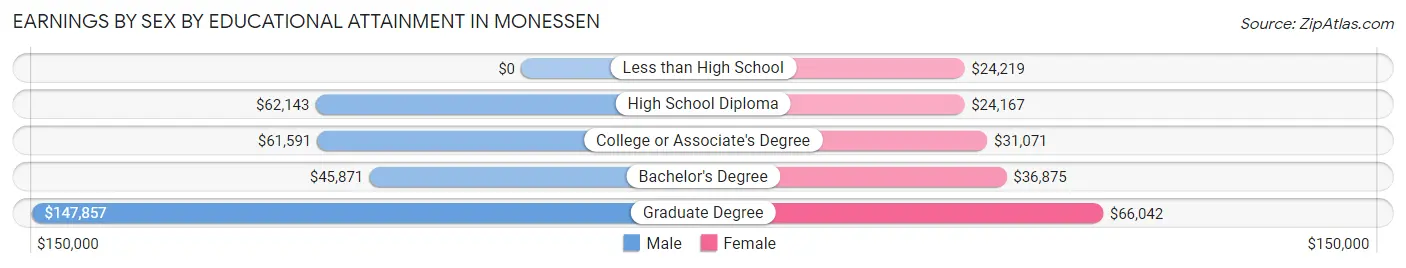
Earnings by Sex by Educational Attainment in Monessen
Average earnings in Monessen are $59,659 for men and $33,402 for women, a difference of 44.0%. Men with an educational attainment of graduate degree enjoy the highest average annual earnings of $147,857, while those with bachelor's degree education earn the least with $45,871. Women with an educational attainment of graduate degree earn the most with the average annual earnings of $66,042, while those with high school diploma education have the smallest earnings of $24,167.
| Educational Attainment | Male Income | Female Income |
| Less than High School | - | - |
| High School Diploma | $62,143 | $24,167 |
| College or Associate's Degree | $61,591 | $31,071 |
| Bachelor's Degree | $45,871 | $36,875 |
| Graduate Degree | $147,857 | $66,042 |
| Total | $59,659 | $33,402 |
Family Income in Monessen
Family Income Brackets in Monessen
According to the Monessen family income data, there are 415 families falling into the $100,000 to $149,999 income range, which is the most common income bracket and makes up 23.1% of all families. Conversely, the $10,000 to $14,999 income bracket is the least frequent group with only 31 families (1.7%) belonging to this category.
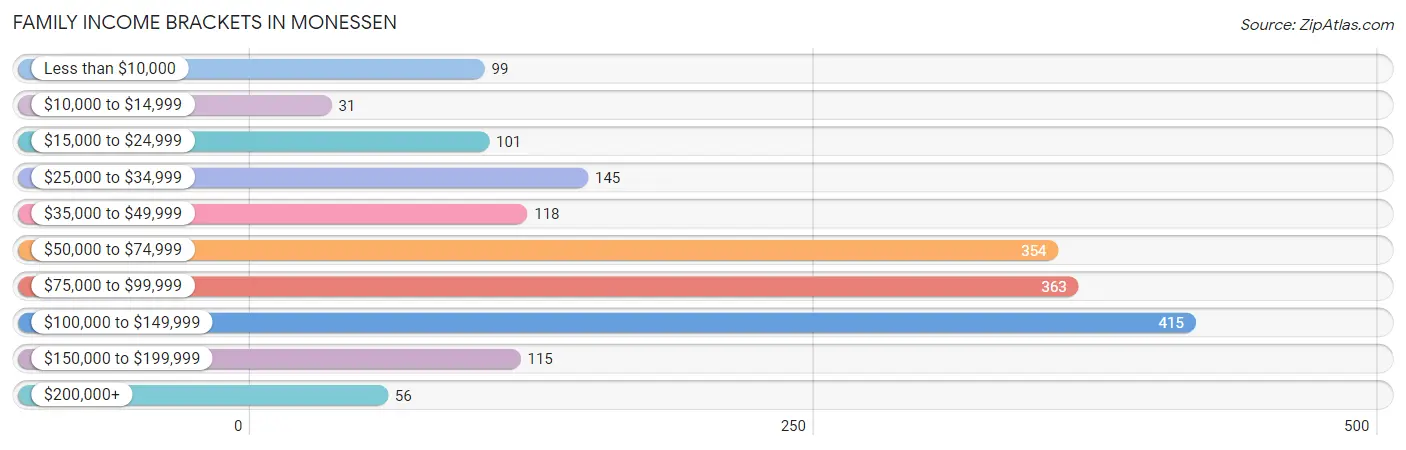
| Income Bracket | # Families | % Families |
| Less than $10,000 | 99 | 5.5% |
| $10,000 to $14,999 | 31 | 1.7% |
| $15,000 to $24,999 | 101 | 5.6% |
| $25,000 to $34,999 | 145 | 8.1% |
| $35,000 to $49,999 | 118 | 6.6% |
| $50,000 to $74,999 | 354 | 19.7% |
| $75,000 to $99,999 | 363 | 20.2% |
| $100,000 to $149,999 | 415 | 23.1% |
| $150,000 to $199,999 | 115 | 6.4% |
| $200,000+ | 56 | 3.1% |
Family Income by Famaliy Size in Monessen
4-person families (192 | 10.7%) account for the highest median family income in Monessen with $111,333 per family, while 2-person families (1,000 | 55.7%) have the highest median income of $38,125 per family member.
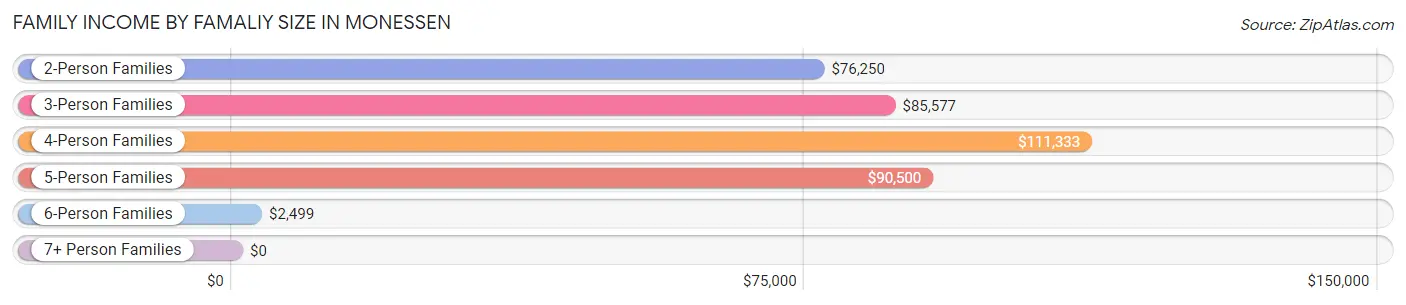
| Income Bracket | # Families | Median Income |
| 2-Person Families | 1,000 (55.7%) | $76,250 |
| 3-Person Families | 376 (20.9%) | $85,577 |
| 4-Person Families | 192 (10.7%) | $111,333 |
| 5-Person Families | 80 (4.5%) | $90,500 |
| 6-Person Families | 119 (6.6%) | $2,499 |
| 7+ Person Families | 28 (1.6%) | $0 |
| Total | 1,795 (100.0%) | $81,940 |
Family Income by Number of Earners in Monessen
The median family income in Monessen is $81,940, with families comprising 3+ earners (186) having the highest median family income of $148,175, while families with no earners (359) have the lowest median family income of $33,438, accounting for 10.4% and 20.0% of families, respectively.
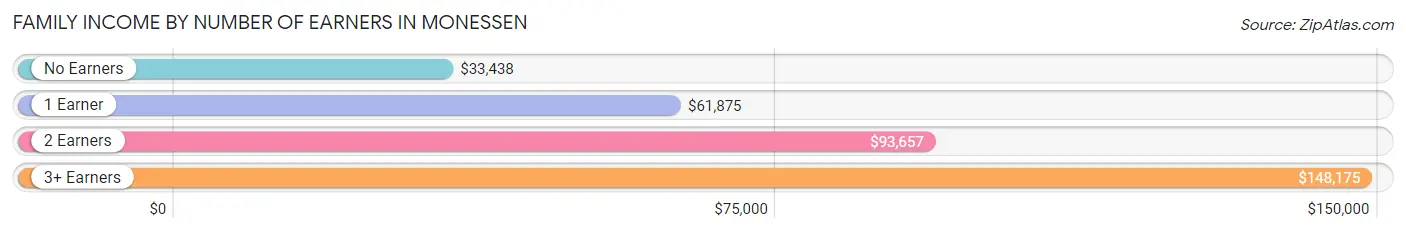
| Number of Earners | # Families | Median Income |
| No Earners | 359 (20.0%) | $33,438 |
| 1 Earner | 581 (32.4%) | $61,875 |
| 2 Earners | 669 (37.3%) | $93,657 |
| 3+ Earners | 186 (10.4%) | $148,175 |
| Total | 1,795 (100.0%) | $81,940 |
Household Income in Monessen
Household Income Brackets in Monessen
With 508 households falling in the category, the $50,000 to $74,999 income range is the most frequent in Monessen, accounting for 15.7% of all households. In contrast, only 74 households (2.3%) fall into the $200,000+ income bracket, making it the least populous group.
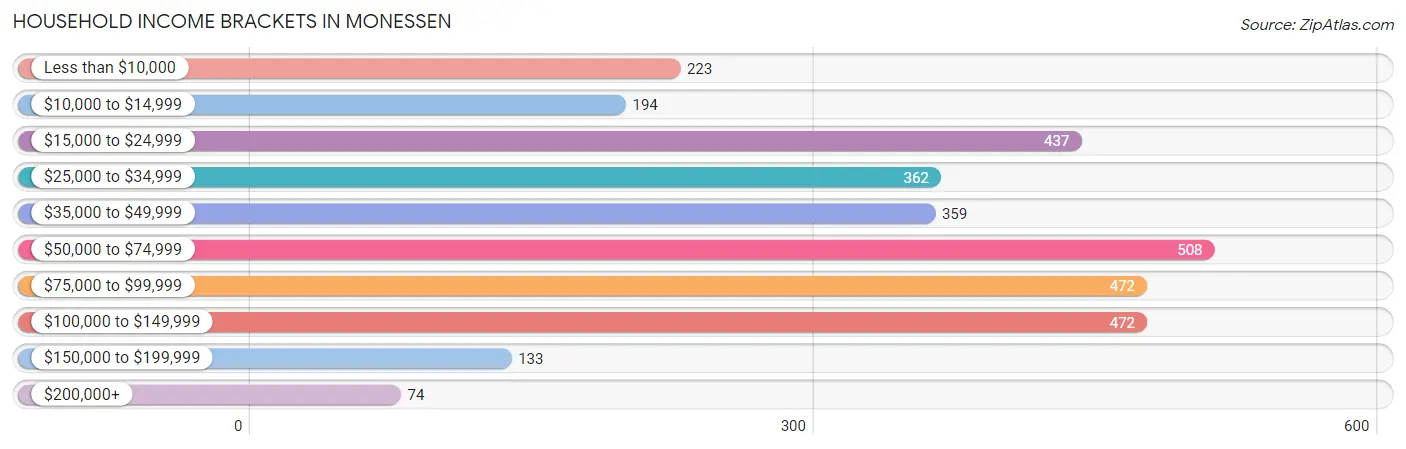
| Income Bracket | # Households | % Households |
| Less than $10,000 | 223 | 6.9% |
| $10,000 to $14,999 | 194 | 6.0% |
| $15,000 to $24,999 | 437 | 13.5% |
| $25,000 to $34,999 | 362 | 11.2% |
| $35,000 to $49,999 | 359 | 11.1% |
| $50,000 to $74,999 | 508 | 15.7% |
| $75,000 to $99,999 | 472 | 14.6% |
| $100,000 to $149,999 | 472 | 14.6% |
| $150,000 to $199,999 | 133 | 4.1% |
| $200,000+ | 74 | 2.3% |
Household Income by Householder Age in Monessen
The median household income in Monessen is $51,364, with the highest median household income of $66,310 found in the 45 to 64 years age bracket for the primary householder. A total of 1,350 households (41.7%) fall into this category. Meanwhile, the 15 to 24 years age bracket for the primary householder has the lowest median household income of $23,485, with 70 households (2.2%) in this group.
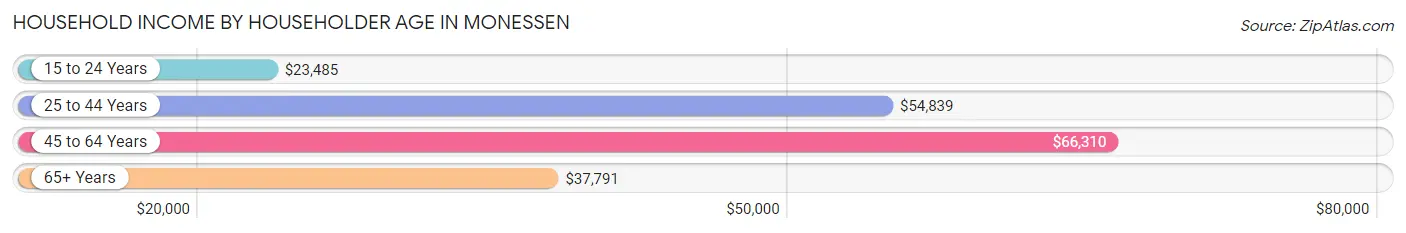
| Income Bracket | # Households | Median Income |
| 15 to 24 Years | 70 (2.2%) | $23,485 |
| 25 to 44 Years | 714 (22.1%) | $54,839 |
| 45 to 64 Years | 1,350 (41.7%) | $66,310 |
| 65+ Years | 1,102 (34.1%) | $37,791 |
| Total | 3,236 (100.0%) | $51,364 |
Poverty in Monessen
Income Below Poverty by Sex and Age in Monessen
With 14.5% poverty level for males and 18.2% for females among the residents of Monessen, 16 and 17 year old males and 5 year old females are the most vulnerable to poverty, with 56 males (57.7%) and 28 females (100.0%) in their respective age groups living below the poverty level.
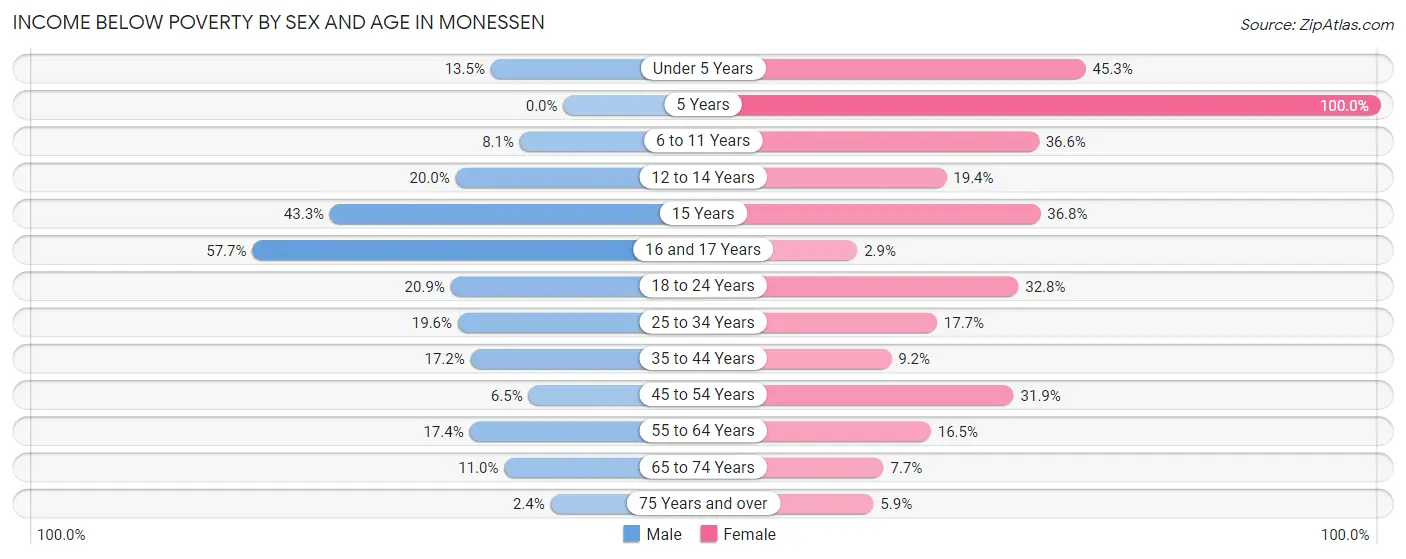
| Age Bracket | Male | Female |
| Under 5 Years | 31 (13.5%) | 62 (45.3%) |
| 5 Years | 0 (0.0%) | 28 (100.0%) |
| 6 to 11 Years | 16 (8.1%) | 53 (36.5%) |
| 12 to 14 Years | 18 (20.0%) | 33 (19.4%) |
| 15 Years | 13 (43.3%) | 7 (36.8%) |
| 16 and 17 Years | 56 (57.7%) | 2 (2.9%) |
| 18 to 24 Years | 41 (20.9%) | 57 (32.8%) |
| 25 to 34 Years | 56 (19.6%) | 66 (17.6%) |
| 35 to 44 Years | 69 (17.2%) | 37 (9.2%) |
| 45 to 54 Years | 27 (6.5%) | 103 (31.9%) |
| 55 to 64 Years | 85 (17.4%) | 128 (16.5%) |
| 65 to 74 Years | 49 (11.0%) | 38 (7.7%) |
| 75 Years and over | 6 (2.4%) | 22 (5.9%) |
| Total | 467 (14.5%) | 636 (18.2%) |
Income Above Poverty by Sex and Age in Monessen
According to the poverty statistics in Monessen, males aged 5 years and females aged 16 and 17 years are the age groups that are most secure financially, with 100.0% of males and 97.1% of females in these age groups living above the poverty line.
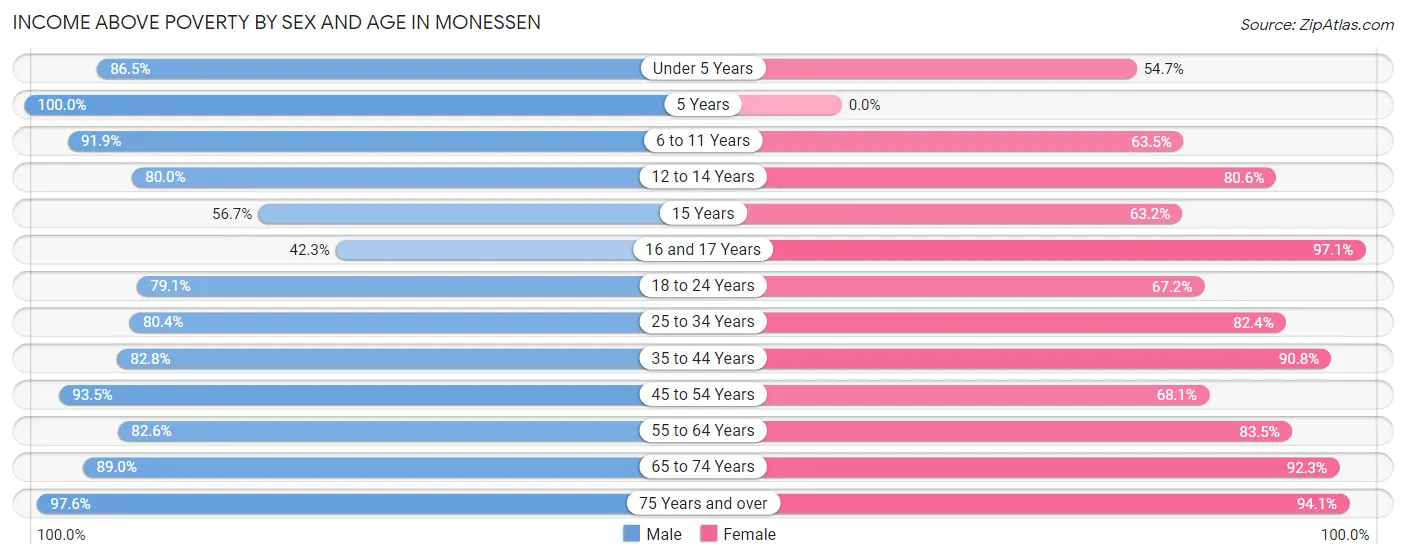
| Age Bracket | Male | Female |
| Under 5 Years | 199 (86.5%) | 75 (54.7%) |
| 5 Years | 77 (100.0%) | 0 (0.0%) |
| 6 to 11 Years | 182 (91.9%) | 92 (63.4%) |
| 12 to 14 Years | 72 (80.0%) | 137 (80.6%) |
| 15 Years | 17 (56.7%) | 12 (63.2%) |
| 16 and 17 Years | 41 (42.3%) | 68 (97.1%) |
| 18 to 24 Years | 155 (79.1%) | 117 (67.2%) |
| 25 to 34 Years | 230 (80.4%) | 308 (82.4%) |
| 35 to 44 Years | 332 (82.8%) | 366 (90.8%) |
| 45 to 54 Years | 390 (93.5%) | 220 (68.1%) |
| 55 to 64 Years | 403 (82.6%) | 647 (83.5%) |
| 65 to 74 Years | 398 (89.0%) | 453 (92.3%) |
| 75 Years and over | 246 (97.6%) | 353 (94.1%) |
| Total | 2,742 (85.5%) | 2,848 (81.8%) |
Income Below Poverty Among Married-Couple Families in Monessen
The poverty statistics for married-couple families in Monessen show that 7.7% or 92 of the total 1,195 families live below the poverty line. Families with 3 or 4 children have the highest poverty rate of 39.2%, comprising of 69 families. On the other hand, families with no children have the lowest poverty rate of 2.1%, which includes 16 families.
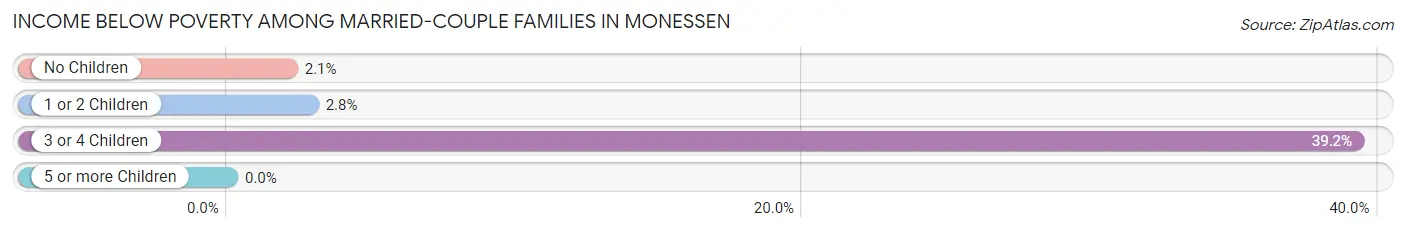
| Children | Above Poverty | Below Poverty |
| No Children | 754 (97.9%) | 16 (2.1%) |
| 1 or 2 Children | 242 (97.2%) | 7 (2.8%) |
| 3 or 4 Children | 107 (60.8%) | 69 (39.2%) |
| 5 or more Children | 0 (0.0%) | 0 (0.0%) |
| Total | 1,103 (92.3%) | 92 (7.7%) |
Income Below Poverty Among Single-Parent Households in Monessen
According to the poverty data in Monessen, 29.6% or 60 single-father households and 15.4% or 61 single-mother households are living below the poverty line. Among single-father households, those with 1 or 2 children have the highest poverty rate, with 60 households (100.0%) experiencing poverty. Likewise, among single-mother households, those with 1 or 2 children have the highest poverty rate, with 61 households (37.7%) falling below the poverty line.
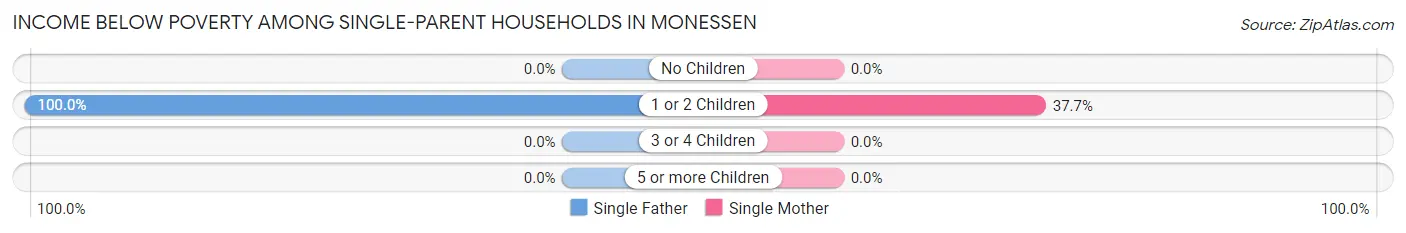
| Children | Single Father | Single Mother |
| No Children | 0 (0.0%) | 0 (0.0%) |
| 1 or 2 Children | 60 (100.0%) | 61 (37.7%) |
| 3 or 4 Children | 0 (0.0%) | 0 (0.0%) |
| 5 or more Children | 0 (0.0%) | 0 (0.0%) |
| Total | 60 (29.6%) | 61 (15.4%) |
Income Below Poverty Among Married-Couple vs Single-Parent Households in Monessen
The poverty data for Monessen shows that 92 of the married-couple family households (7.7%) and 121 of the single-parent households (20.2%) are living below the poverty level. Within the married-couple family households, those with 3 or 4 children have the highest poverty rate, with 69 households (39.2%) falling below the poverty line. Among the single-parent households, those with 1 or 2 children have the highest poverty rate, with 121 household (54.5%) living below poverty.
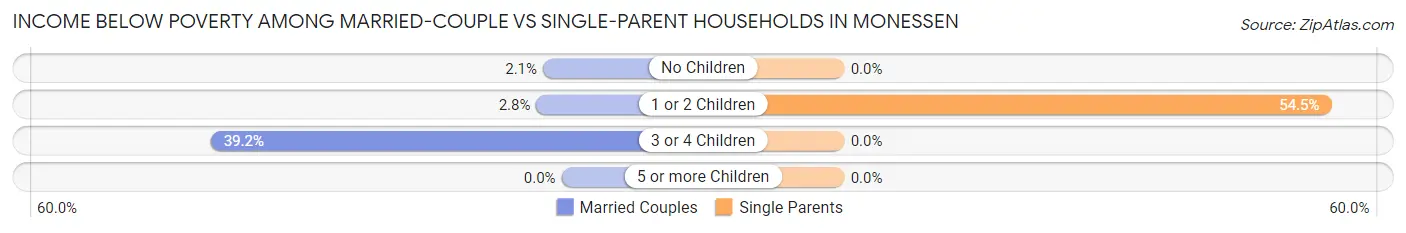
| Children | Married-Couple Families | Single-Parent Households |
| No Children | 16 (2.1%) | 0 (0.0%) |
| 1 or 2 Children | 7 (2.8%) | 121 (54.5%) |
| 3 or 4 Children | 69 (39.2%) | 0 (0.0%) |
| 5 or more Children | 0 (0.0%) | 0 (0.0%) |
| Total | 92 (7.7%) | 121 (20.2%) |
Race in Monessen
The most populous races in Monessen are White / Caucasian (5,104 | 74.2%), Black / African American (1,117 | 16.2%), and Two or more Races (415 | 6.0%).
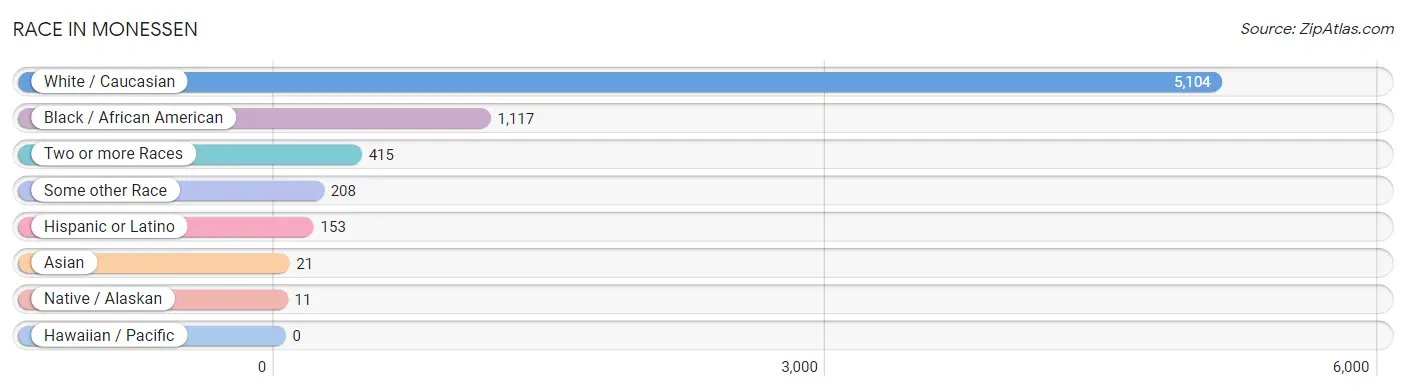
| Race | # Population | % Population |
| Asian | 21 | 0.3% |
| Black / African American | 1,117 | 16.2% |
| Hawaiian / Pacific | 0 | 0.0% |
| Hispanic or Latino | 153 | 2.2% |
| Native / Alaskan | 11 | 0.2% |
| White / Caucasian | 5,104 | 74.2% |
| Two or more Races | 415 | 6.0% |
| Some other Race | 208 | 3.0% |
| Total | 6,876 | 100.0% |
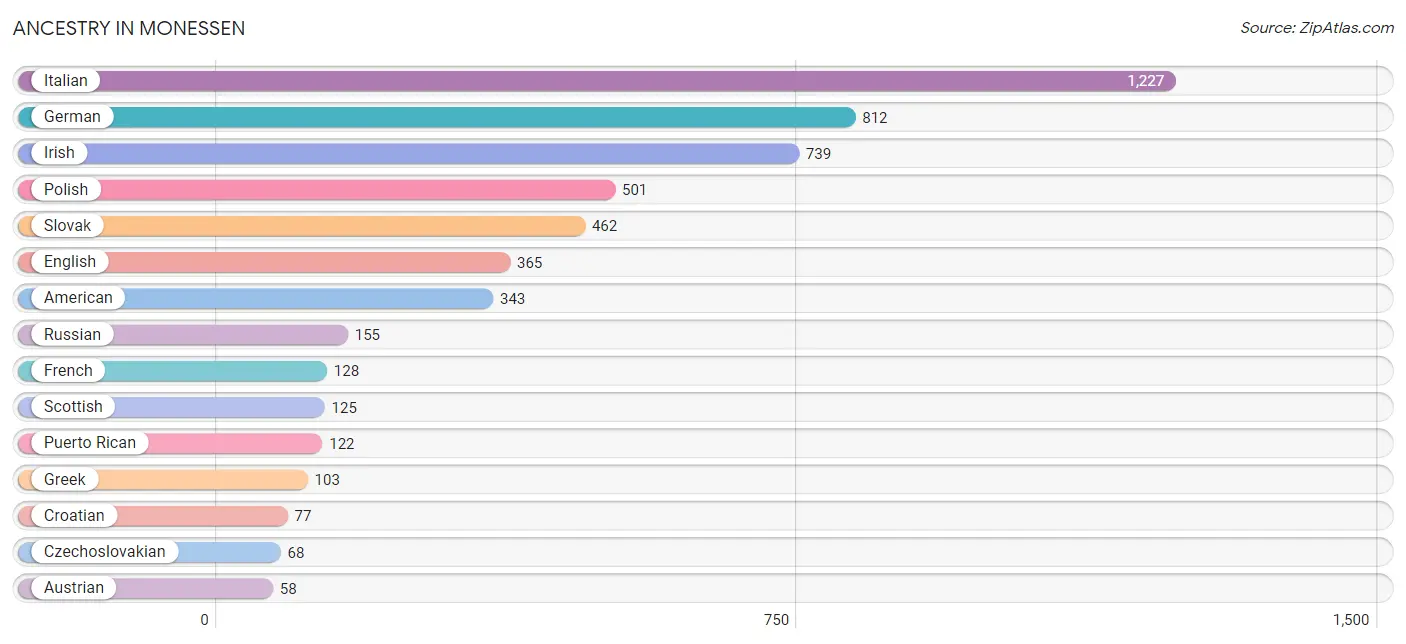
Ancestry in Monessen
The most populous ancestries reported in Monessen are Italian (1,227 | 17.8%), German (812 | 11.8%), Irish (739 | 10.7%), Polish (501 | 7.3%), and Slovak (462 | 6.7%), together accounting for 54.4% of all Monessen residents.
| Ancestry | # Population | % Population |
| American | 343 | 5.0% |
| Apache | 11 | 0.2% |
| Arab | 6 | 0.1% |
| Austrian | 58 | 0.8% |
| Blackfeet | 12 | 0.2% |
| Brazilian | 5 | 0.1% |
| Canadian | 8 | 0.1% |
| Cherokee | 7 | 0.1% |
| Croatian | 77 | 1.1% |
| Cuban | 10 | 0.2% |
| Czech | 3 | 0.0% |
| Czechoslovakian | 68 | 1.0% |
| Dominican | 10 | 0.2% |
| Dutch | 9 | 0.1% |
| Eastern European | 22 | 0.3% |
| English | 365 | 5.3% |
| European | 48 | 0.7% |
| French | 128 | 1.9% |
| German | 812 | 11.8% |
| Greek | 103 | 1.5% |
| Hungarian | 57 | 0.8% |
| Irish | 739 | 10.7% |
| Italian | 1,227 | 17.8% |
| Korean | 21 | 0.3% |
| Lebanese | 6 | 0.1% |
| Lithuanian | 10 | 0.2% |
| Mexican | 11 | 0.2% |
| Polish | 501 | 7.3% |
| Puerto Rican | 122 | 1.8% |
| Russian | 155 | 2.2% |
| Scotch-Irish | 25 | 0.4% |
| Scottish | 125 | 1.8% |
| Serbian | 57 | 0.8% |
| Slavic | 28 | 0.4% |
| Slovak | 462 | 6.7% |
| Swedish | 7 | 0.1% |
| Ukrainian | 31 | 0.4% |
| Welsh | 50 | 0.7% | View All 38 Rows |
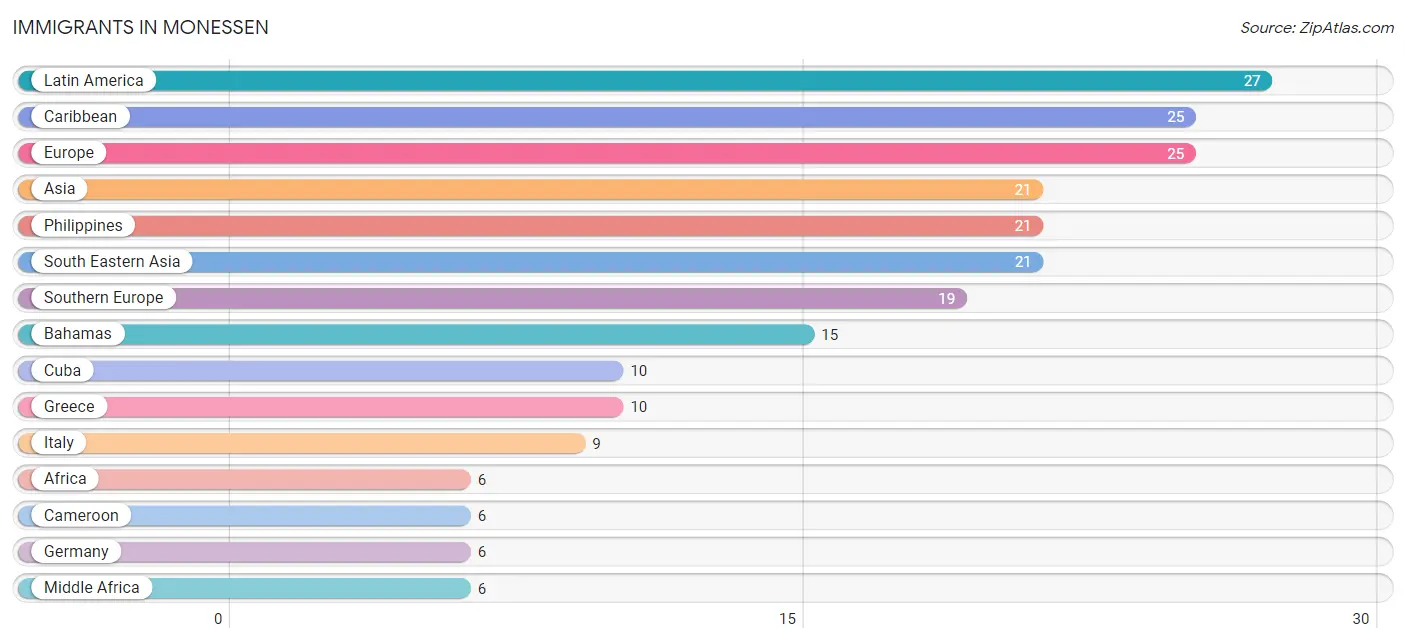
Immigrants in Monessen
The most numerous immigrant groups reported in Monessen came from Latin America (27 | 0.4%), Caribbean (25 | 0.4%), Europe (25 | 0.4%), Asia (21 | 0.3%), and Philippines (21 | 0.3%), together accounting for 1.7% of all Monessen residents.
| Immigration Origin | # Population | % Population |
| Africa | 6 | 0.1% |
| Asia | 21 | 0.3% |
| Bahamas | 15 | 0.2% |
| Cameroon | 6 | 0.1% |
| Caribbean | 25 | 0.4% |
| Central America | 2 | 0.0% |
| Cuba | 10 | 0.2% |
| Europe | 25 | 0.4% |
| Germany | 6 | 0.1% |
| Greece | 10 | 0.2% |
| Italy | 9 | 0.1% |
| Latin America | 27 | 0.4% |
| Mexico | 2 | 0.0% |
| Middle Africa | 6 | 0.1% |
| Philippines | 21 | 0.3% |
| South Eastern Asia | 21 | 0.3% |
| Southern Europe | 19 | 0.3% |
| Western Europe | 6 | 0.1% | View All 18 Rows |
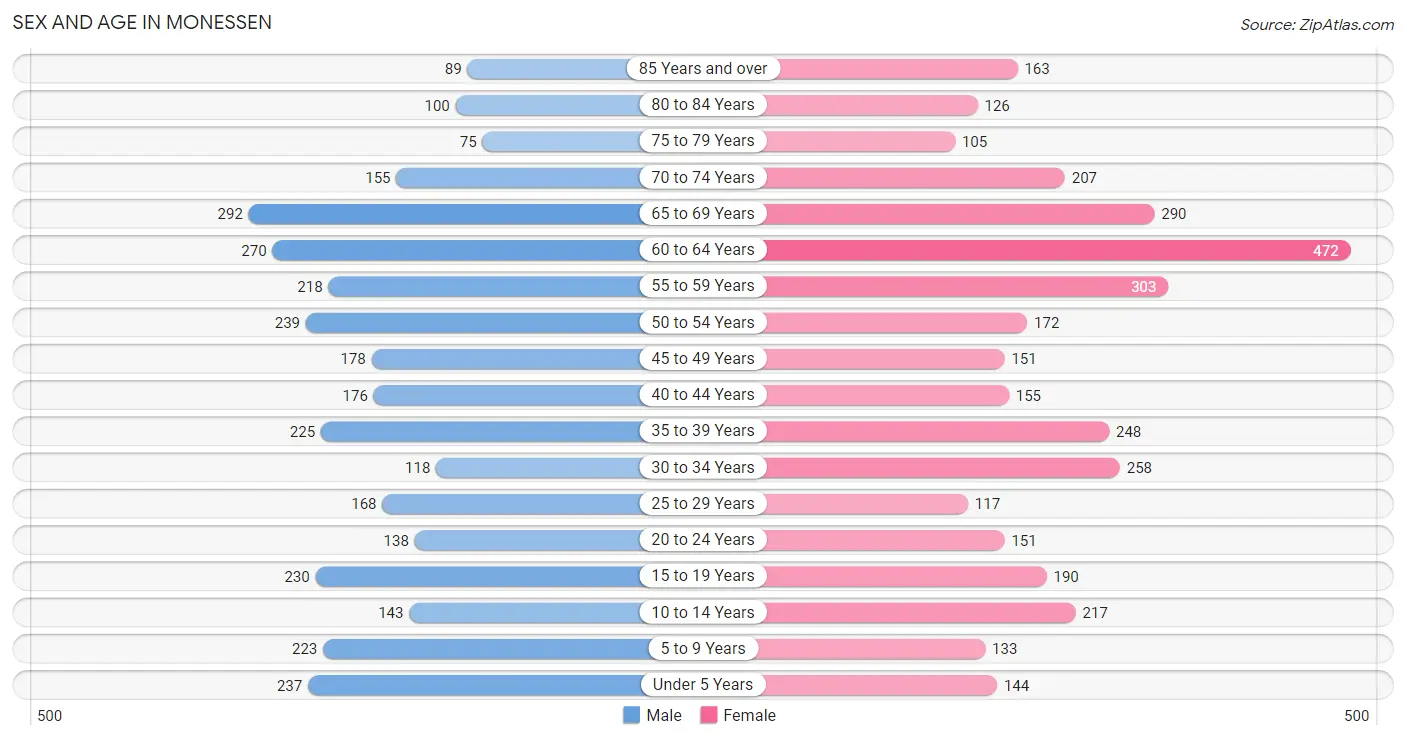
Sex and Age in Monessen
Sex and Age in Monessen
The most populous age groups in Monessen are 65 to 69 Years (292 | 8.9%) for men and 60 to 64 Years (472 | 13.1%) for women.
| Age Bracket | Male | Female |
| Under 5 Years | 237 (7.2%) | 144 (4.0%) |
| 5 to 9 Years | 223 (6.8%) | 133 (3.7%) |
| 10 to 14 Years | 143 (4.4%) | 217 (6.0%) |
| 15 to 19 Years | 230 (7.0%) | 190 (5.3%) |
| 20 to 24 Years | 138 (4.2%) | 151 (4.2%) |
| 25 to 29 Years | 168 (5.1%) | 117 (3.3%) |
| 30 to 34 Years | 118 (3.6%) | 258 (7.2%) |
| 35 to 39 Years | 225 (6.9%) | 248 (6.9%) |
| 40 to 44 Years | 176 (5.4%) | 155 (4.3%) |
| 45 to 49 Years | 178 (5.4%) | 151 (4.2%) |
| 50 to 54 Years | 239 (7.3%) | 172 (4.8%) |
| 55 to 59 Years | 218 (6.7%) | 303 (8.4%) |
| 60 to 64 Years | 270 (8.3%) | 472 (13.1%) |
| 65 to 69 Years | 292 (8.9%) | 290 (8.1%) |
| 70 to 74 Years | 155 (4.7%) | 207 (5.8%) |
| 75 to 79 Years | 75 (2.3%) | 105 (2.9%) |
| 80 to 84 Years | 100 (3.0%) | 126 (3.5%) |
| 85 Years and over | 89 (2.7%) | 163 (4.5%) |
| Total | 3,274 (100.0%) | 3,602 (100.0%) |
Families and Households in Monessen
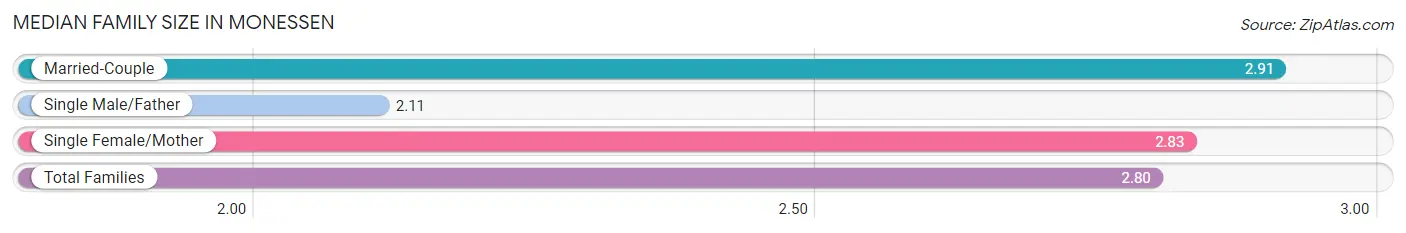
Median Family Size in Monessen
The median family size in Monessen is 2.80 persons per family, with married-couple families (1,195 | 66.6%) accounting for the largest median family size of 2.91 persons per family. On the other hand, single male/father families (203 | 11.3%) represent the smallest median family size with 2.11 persons per family.
| Family Type | # Families | Family Size |
| Married-Couple | 1,195 (66.6%) | 2.91 |
| Single Male/Father | 203 (11.3%) | 2.11 |
| Single Female/Mother | 397 (22.1%) | 2.83 |
| Total Families | 1,795 (100.0%) | 2.80 |
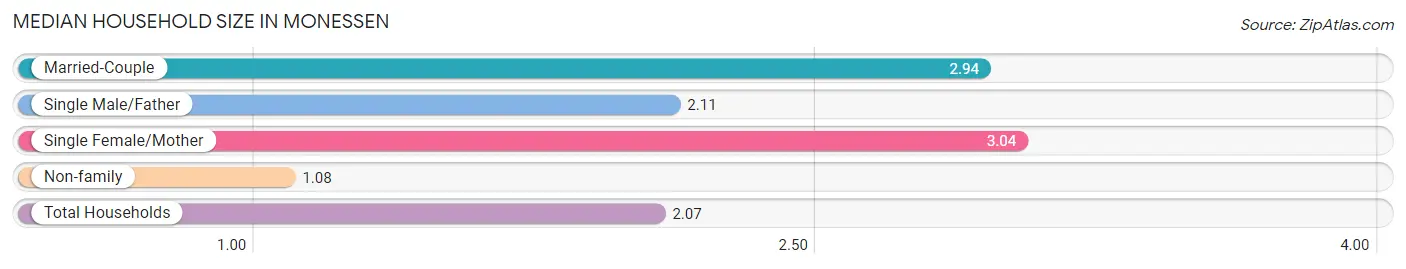
Median Household Size in Monessen
The median household size in Monessen is 2.07 persons per household, with single female/mother households (397 | 12.3%) accounting for the largest median household size of 3.04 persons per household. non-family households (1,441 | 44.5%) represent the smallest median household size with 1.08 persons per household.
| Household Type | # Households | Household Size |
| Married-Couple | 1,195 (36.9%) | 2.94 |
| Single Male/Father | 203 (6.3%) | 2.11 |
| Single Female/Mother | 397 (12.3%) | 3.04 |
| Non-family | 1,441 (44.5%) | 1.08 |
| Total Households | 3,236 (100.0%) | 2.07 |
Household Size by Marriage Status in Monessen
Out of a total of 3,236 households in Monessen, 1,795 (55.5%) are family households, while 1,441 (44.5%) are nonfamily households. The most numerous type of family households are 2-person households, comprising 966, and the most common type of nonfamily households are 1-person households, comprising 1,362.
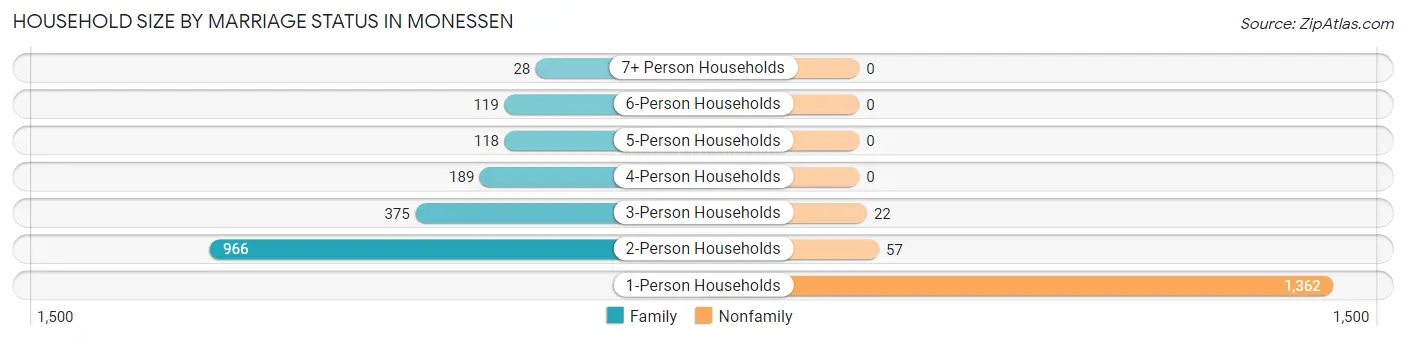
| Household Size | Family Households | Nonfamily Households |
| 1-Person Households | - | 1,362 (42.1%) |
| 2-Person Households | 966 (29.8%) | 57 (1.8%) |
| 3-Person Households | 375 (11.6%) | 22 (0.7%) |
| 4-Person Households | 189 (5.8%) | 0 (0.0%) |
| 5-Person Households | 118 (3.6%) | 0 (0.0%) |
| 6-Person Households | 119 (3.7%) | 0 (0.0%) |
| 7+ Person Households | 28 (0.9%) | 0 (0.0%) |
| Total | 1,795 (55.5%) | 1,441 (44.5%) |
Female Fertility in Monessen
Fertility by Age in Monessen
Average fertility rate in Monessen is 60.0 births per 1,000 women. Women in the age bracket of 20 to 34 years have the highest fertility rate with 154.0 births per 1,000 women. Women in the age bracket of 20 to 34 years acount for 100.0% of all women with births.
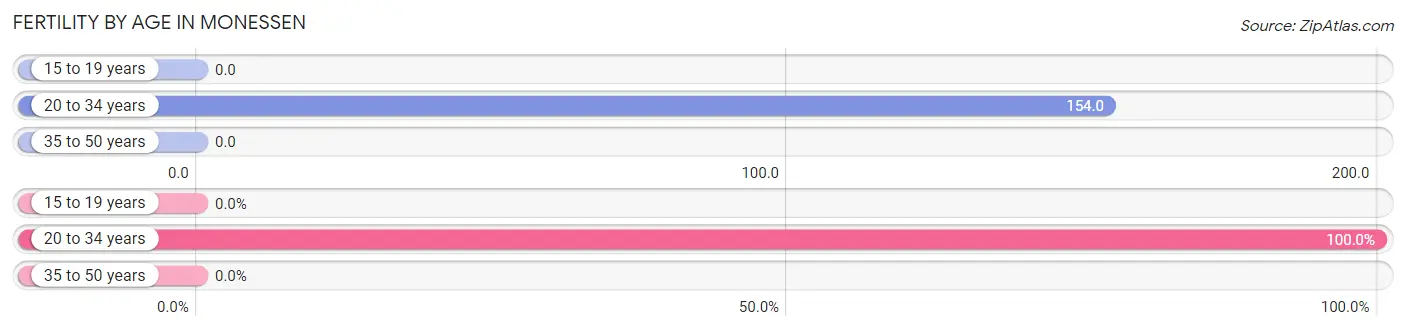
| Age Bracket | Women with Births | Births / 1,000 Women |
| 15 to 19 years | 0 (0.0%) | 0.0 |
| 20 to 34 years | 81 (100.0%) | 154.0 |
| 35 to 50 years | 0 (0.0%) | 0.0 |
| Total | 81 (100.0%) | 60.0 |
Fertility by Age by Marriage Status in Monessen
87.7% of women with births (81) in Monessen are married. The highest percentage of unmarried women with births falls into 20 to 34 years age bracket with 12.3% of them unmarried at the time of birth, while the lowest percentage of unmarried women with births belong to 20 to 34 years age bracket with 12.4% of them unmarried.
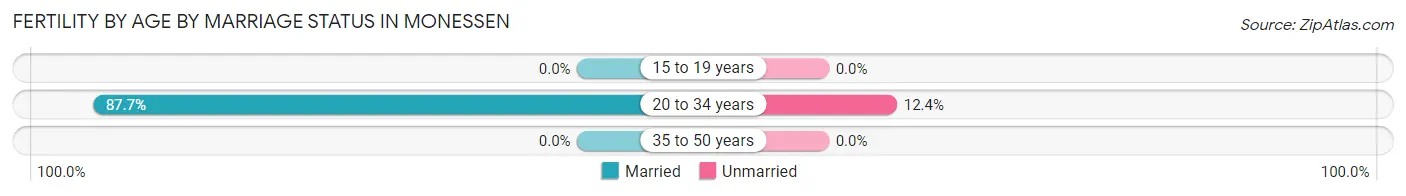
| Age Bracket | Married | Unmarried |
| 15 to 19 years | 0 (0.0%) | 0 (0.0%) |
| 20 to 34 years | 71 (87.6%) | 10 (12.3%) |
| 35 to 50 years | 0 (0.0%) | 0 (0.0%) |
| Total | 71 (87.6%) | 10 (12.3%) |
Fertility by Education in Monessen
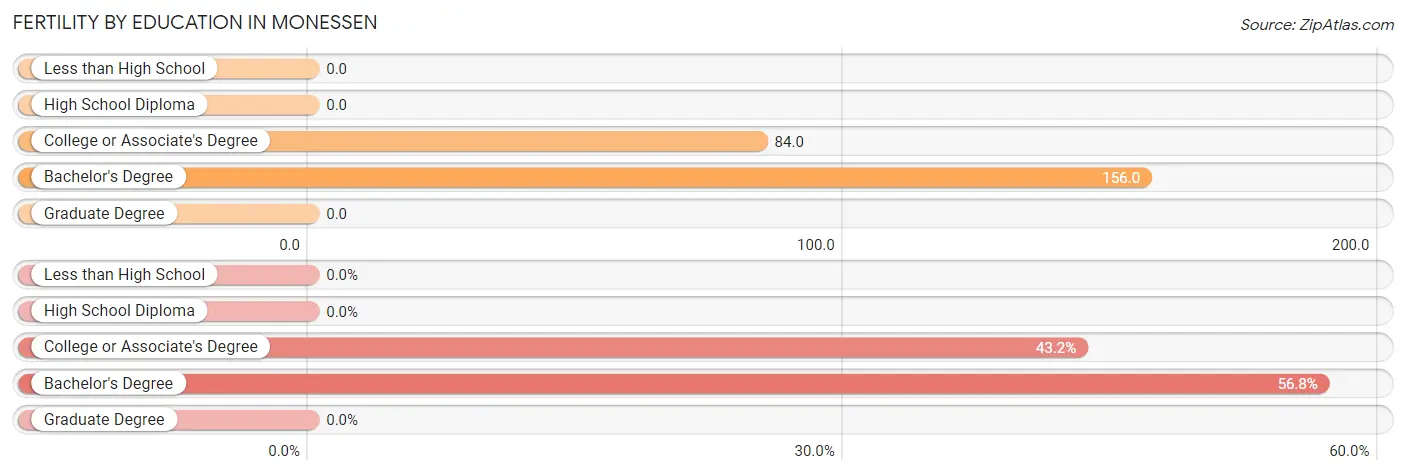
| Educational Attainment | Women with Births | Births / 1,000 Women |
| Less than High School | 0 (0.0%) | 0.0 |
| High School Diploma | 0 (0.0%) | 0.0 |
| College or Associate's Degree | 35 (43.2%) | 84.0 |
| Bachelor's Degree | 46 (56.8%) | 156.0 |
| Graduate Degree | 0 (0.0%) | 0.0 |
| Total | 81 (100.0%) | 60.0 |
Fertility by Education by Marriage Status in Monessen
12.3% of women with births in Monessen are unmarried. Women with the educational attainment of bachelor's degree are most likely to be married with 100.0% of them married at childbirth, while women with the educational attainment of college or associate's degree are least likely to be married with 28.6% of them unmarried at childbirth.
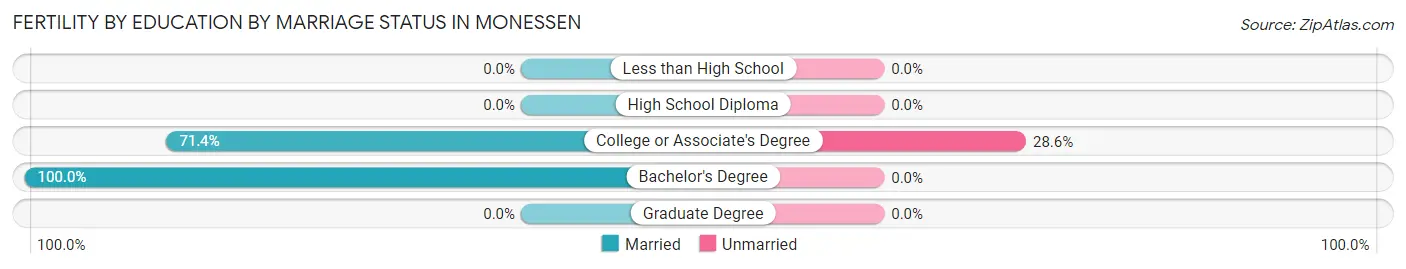
| Educational Attainment | Married | Unmarried |
| Less than High School | 0 (0.0%) | 0 (0.0%) |
| High School Diploma | 0 (0.0%) | 0 (0.0%) |
| College or Associate's Degree | 25 (71.4%) | 10 (28.6%) |
| Bachelor's Degree | 46 (100.0%) | 0 (0.0%) |
| Graduate Degree | 0 (0.0%) | 0 (0.0%) |
| Total | 71 (87.6%) | 10 (12.3%) |
Employment Characteristics in Monessen
Employment by Class of Employer in Monessen
Among the 2,990 employed individuals in Monessen, private company employees (2,209 | 73.9%), not-for-profit organizations (352 | 11.8%), and state government employees (142 | 4.8%) make up the most common classes of employment.
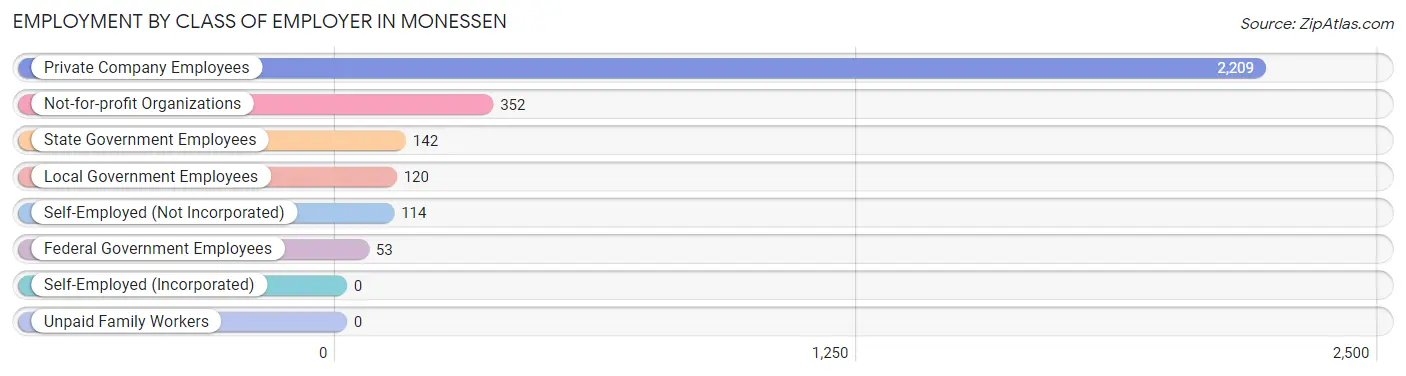
| Employer Class | # Employees | % Employees |
| Private Company Employees | 2,209 | 73.9% |
| Self-Employed (Incorporated) | 0 | 0.0% |
| Self-Employed (Not Incorporated) | 114 | 3.8% |
| Not-for-profit Organizations | 352 | 11.8% |
| Local Government Employees | 120 | 4.0% |
| State Government Employees | 142 | 4.8% |
| Federal Government Employees | 53 | 1.8% |
| Unpaid Family Workers | 0 | 0.0% |
| Total | 2,990 | 100.0% |
Employment Status by Age in Monessen
According to the labor force statistics for Monessen, out of the total population over 16 years of age (5,730), 56.6% or 3,243 individuals are in the labor force, with 6.5% or 211 of them unemployed. The age group with the highest labor force participation rate is 30 to 34 years, with 90.7% or 341 individuals in the labor force. Within the labor force, the 16 to 19 years age range has the highest percentage of unemployed individuals, with 25.9% or 51 of them being unemployed.
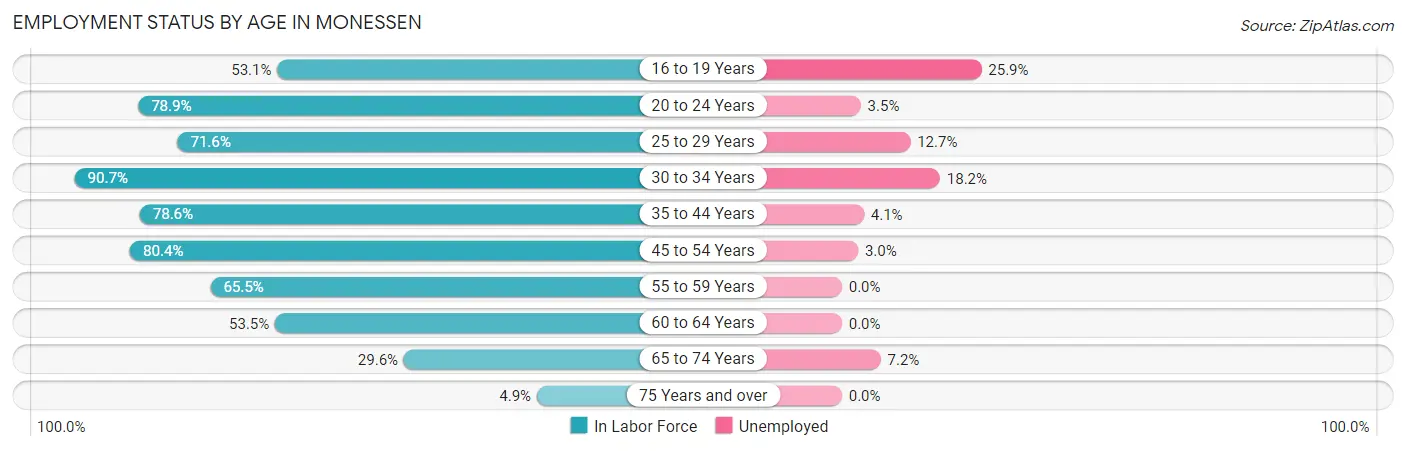
| Age Bracket | In Labor Force | Unemployed |
| 16 to 19 Years | 197 (53.1%) | 51 (25.9%) |
| 20 to 24 Years | 228 (78.9%) | 8 (3.5%) |
| 25 to 29 Years | 204 (71.6%) | 26 (12.7%) |
| 30 to 34 Years | 341 (90.7%) | 62 (18.2%) |
| 35 to 44 Years | 632 (78.6%) | 26 (4.1%) |
| 45 to 54 Years | 595 (80.4%) | 18 (3.0%) |
| 55 to 59 Years | 341 (65.5%) | 0 (0.0%) |
| 60 to 64 Years | 397 (53.5%) | 0 (0.0%) |
| 65 to 74 Years | 279 (29.6%) | 20 (7.2%) |
| 75 Years and over | 32 (4.9%) | 0 (0.0%) |
| Total | 3,243 (56.6%) | 211 (6.5%) |
Employment Status by Educational Attainment in Monessen
According to labor force statistics for Monessen, 72.4% of individuals (2,511) out of the total population between 25 and 64 years of age (3,468) are in the labor force, with 5.3% or 133 of them being unemployed. The group with the highest labor force participation rate are those with the educational attainment of college / associate degree, with 86.3% or 731 individuals in the labor force. Within the labor force, individuals with less than high school education have the highest percentage of unemployment, with 24.4% or 20 of them being unemployed.
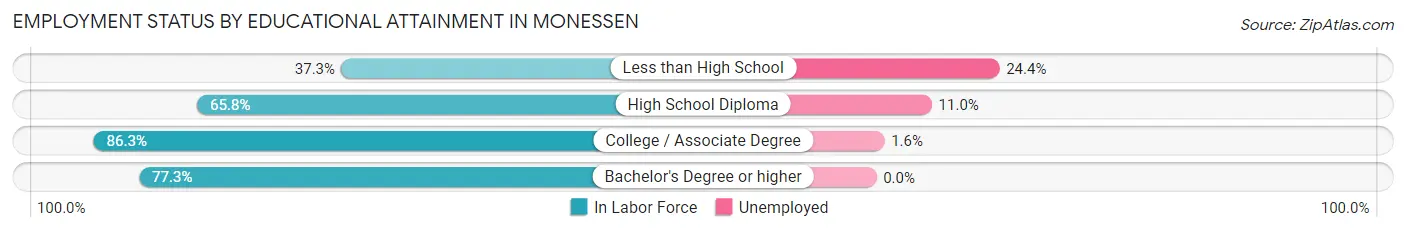
| Educational Attainment | In Labor Force | Unemployed |
| Less than High School | 82 (37.3%) | 54 (24.4%) |
| High School Diploma | 912 (65.8%) | 152 (11.0%) |
| College / Associate Degree | 731 (86.3%) | 14 (1.6%) |
| Bachelor's Degree or higher | 785 (77.3%) | 0 (0.0%) |
| Total | 2,511 (72.4%) | 184 (5.3%) |
Employment Occupations by Sex in Monessen
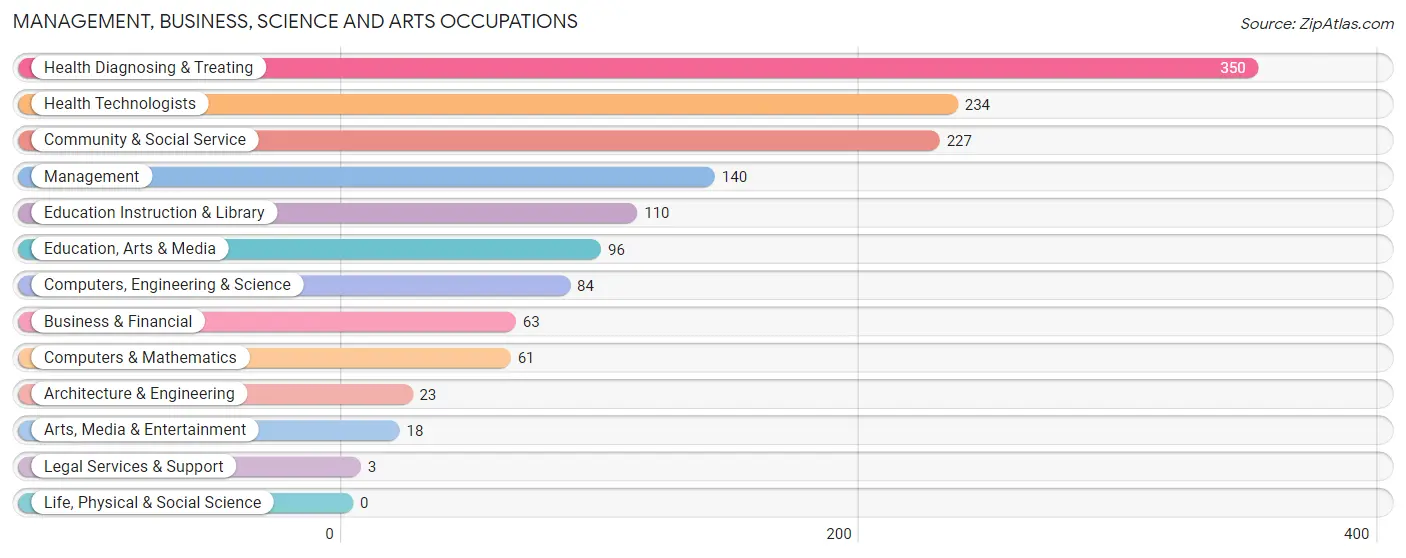
Management, Business, Science and Arts Occupations
The most common Management, Business, Science and Arts occupations in Monessen are Health Diagnosing & Treating (350 | 11.5%), Health Technologists (234 | 7.7%), Community & Social Service (227 | 7.5%), Management (140 | 4.6%), and Education Instruction & Library (110 | 3.6%).
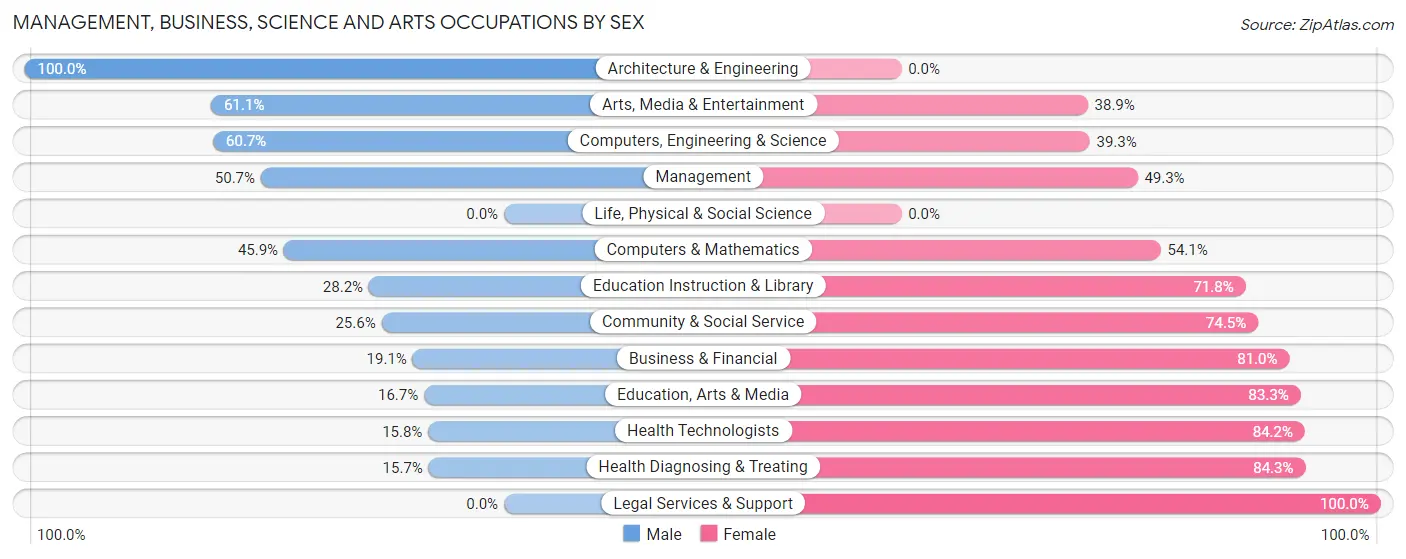
Management, Business, Science and Arts Occupations by Sex
Within the Management, Business, Science and Arts occupations in Monessen, the most male-oriented occupations are Architecture & Engineering (100.0%), Arts, Media & Entertainment (61.1%), and Computers, Engineering & Science (60.7%), while the most female-oriented occupations are Legal Services & Support (100.0%), Health Diagnosing & Treating (84.3%), and Health Technologists (84.2%).
| Occupation | Male | Female |
| Management | 71 (50.7%) | 69 (49.3%) |
| Business & Financial | 12 (19.1%) | 51 (80.9%) |
| Computers, Engineering & Science | 51 (60.7%) | 33 (39.3%) |
| Computers & Mathematics | 28 (45.9%) | 33 (54.1%) |
| Architecture & Engineering | 23 (100.0%) | 0 (0.0%) |
| Life, Physical & Social Science | 0 (0.0%) | 0 (0.0%) |
| Community & Social Service | 58 (25.6%) | 169 (74.5%) |
| Education, Arts & Media | 16 (16.7%) | 80 (83.3%) |
| Legal Services & Support | 0 (0.0%) | 3 (100.0%) |
| Education Instruction & Library | 31 (28.2%) | 79 (71.8%) |
| Arts, Media & Entertainment | 11 (61.1%) | 7 (38.9%) |
| Health Diagnosing & Treating | 55 (15.7%) | 295 (84.3%) |
| Health Technologists | 37 (15.8%) | 197 (84.2%) |
| Total (Category) | 247 (28.6%) | 617 (71.4%) |
| Total (Overall) | 1,431 (47.1%) | 1,604 (52.8%) |
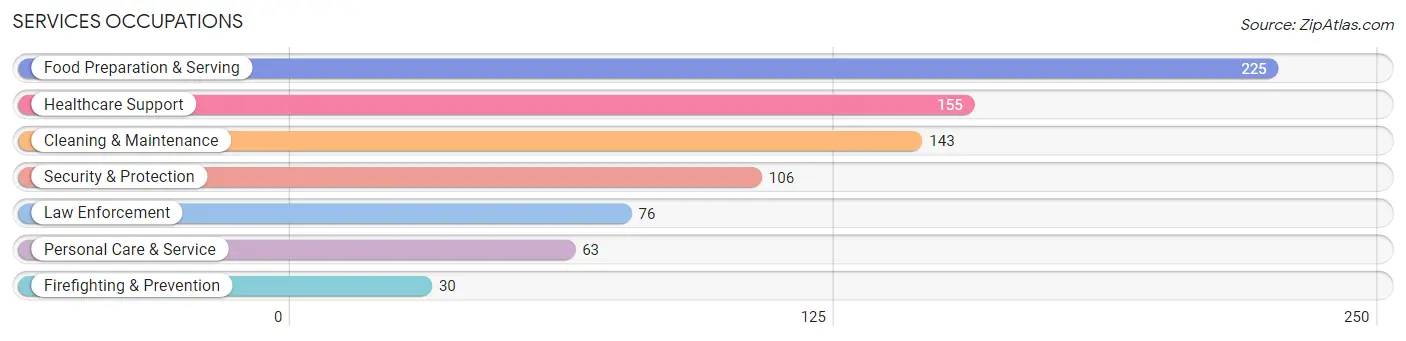
Services Occupations
The most common Services occupations in Monessen are Food Preparation & Serving (225 | 7.4%), Healthcare Support (155 | 5.1%), Cleaning & Maintenance (143 | 4.7%), Security & Protection (106 | 3.5%), and Law Enforcement (76 | 2.5%).
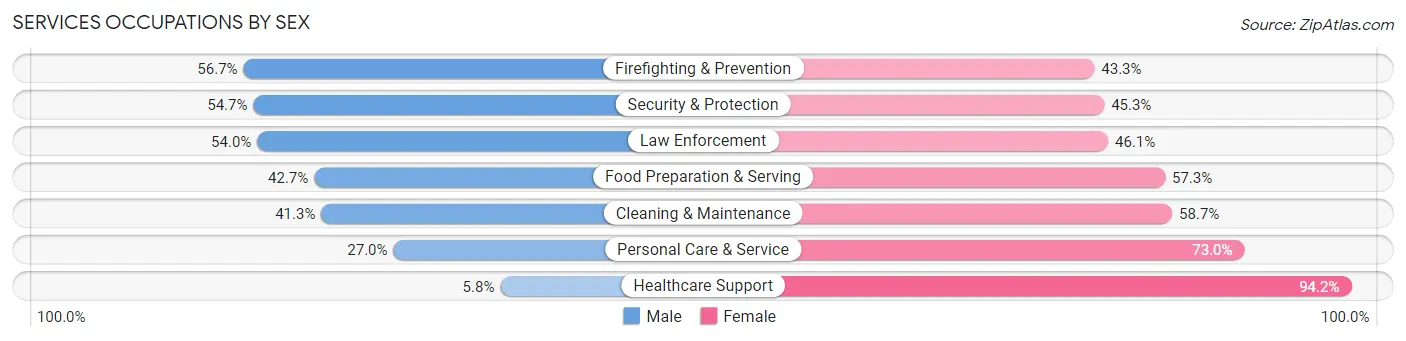
Services Occupations by Sex
Within the Services occupations in Monessen, the most male-oriented occupations are Firefighting & Prevention (56.7%), Security & Protection (54.7%), and Law Enforcement (53.9%), while the most female-oriented occupations are Healthcare Support (94.2%), Personal Care & Service (73.0%), and Cleaning & Maintenance (58.7%).
| Occupation | Male | Female |
| Healthcare Support | 9 (5.8%) | 146 (94.2%) |
| Security & Protection | 58 (54.7%) | 48 (45.3%) |
| Firefighting & Prevention | 17 (56.7%) | 13 (43.3%) |
| Law Enforcement | 41 (53.9%) | 35 (46.1%) |
| Food Preparation & Serving | 96 (42.7%) | 129 (57.3%) |
| Cleaning & Maintenance | 59 (41.3%) | 84 (58.7%) |
| Personal Care & Service | 17 (27.0%) | 46 (73.0%) |
| Total (Category) | 239 (34.5%) | 453 (65.5%) |
| Total (Overall) | 1,431 (47.1%) | 1,604 (52.8%) |
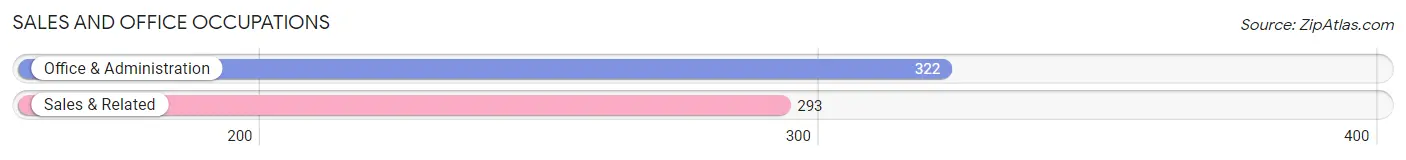
Sales and Office Occupations
The most common Sales and Office occupations in Monessen are Office & Administration (322 | 10.6%), and Sales & Related (293 | 9.7%).
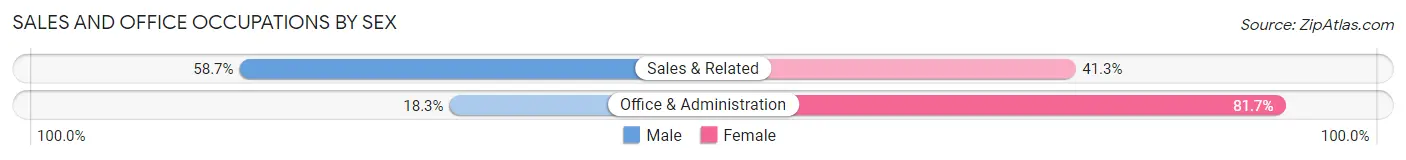
Sales and Office Occupations by Sex
| Occupation | Male | Female |
| Sales & Related | 172 (58.7%) | 121 (41.3%) |
| Office & Administration | 59 (18.3%) | 263 (81.7%) |
| Total (Category) | 231 (37.6%) | 384 (62.4%) |
| Total (Overall) | 1,431 (47.1%) | 1,604 (52.8%) |
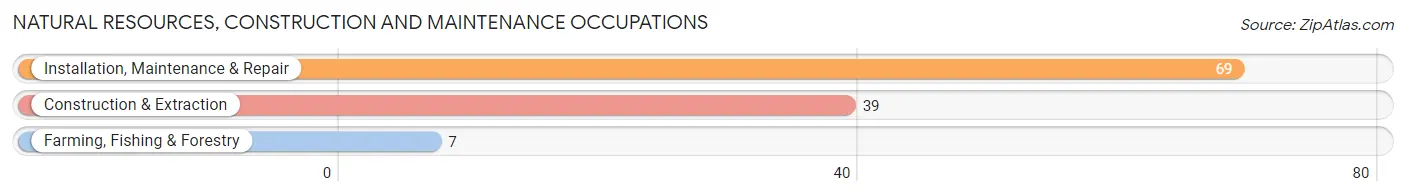
Natural Resources, Construction and Maintenance Occupations
The most common Natural Resources, Construction and Maintenance occupations in Monessen are Installation, Maintenance & Repair (69 | 2.3%), Construction & Extraction (39 | 1.3%), and Farming, Fishing & Forestry (7 | 0.2%).
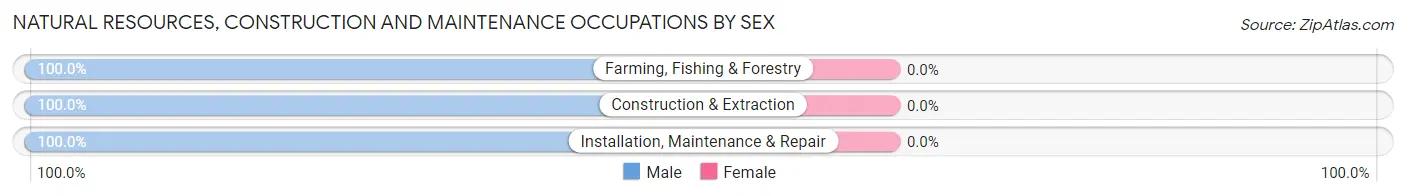
Natural Resources, Construction and Maintenance Occupations by Sex
| Occupation | Male | Female |
| Farming, Fishing & Forestry | 7 (100.0%) | 0 (0.0%) |
| Construction & Extraction | 39 (100.0%) | 0 (0.0%) |
| Installation, Maintenance & Repair | 69 (100.0%) | 0 (0.0%) |
| Total (Category) | 115 (100.0%) | 0 (0.0%) |
| Total (Overall) | 1,431 (47.1%) | 1,604 (52.8%) |
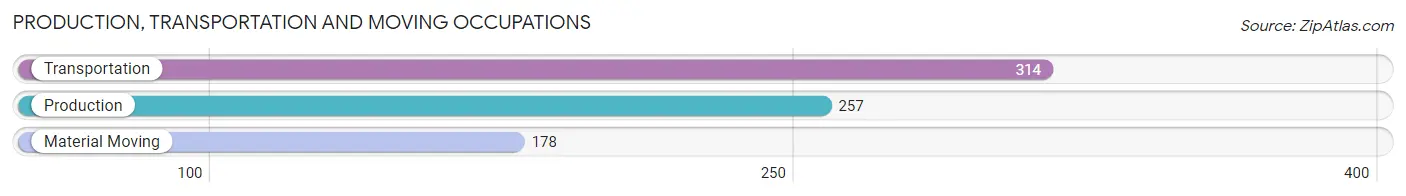
Production, Transportation and Moving Occupations
The most common Production, Transportation and Moving occupations in Monessen are Transportation (314 | 10.3%), Production (257 | 8.5%), and Material Moving (178 | 5.9%).
Production, Transportation and Moving Occupations by Sex
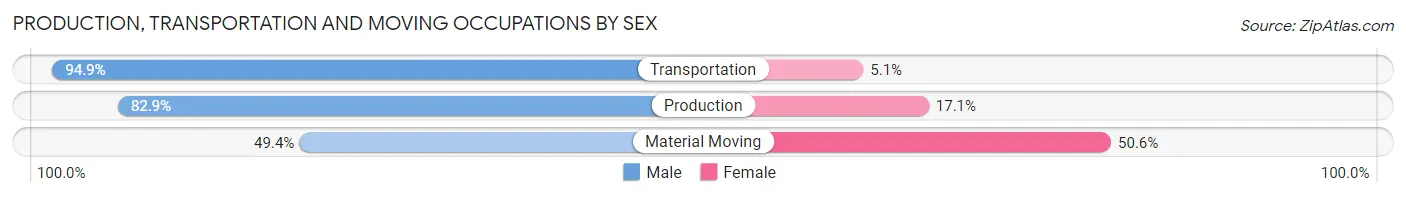
| Occupation | Male | Female |
| Production | 213 (82.9%) | 44 (17.1%) |
| Transportation | 298 (94.9%) | 16 (5.1%) |
| Material Moving | 88 (49.4%) | 90 (50.6%) |
| Total (Category) | 599 (80.0%) | 150 (20.0%) |
| Total (Overall) | 1,431 (47.1%) | 1,604 (52.8%) |
Employment Industries by Sex in Monessen
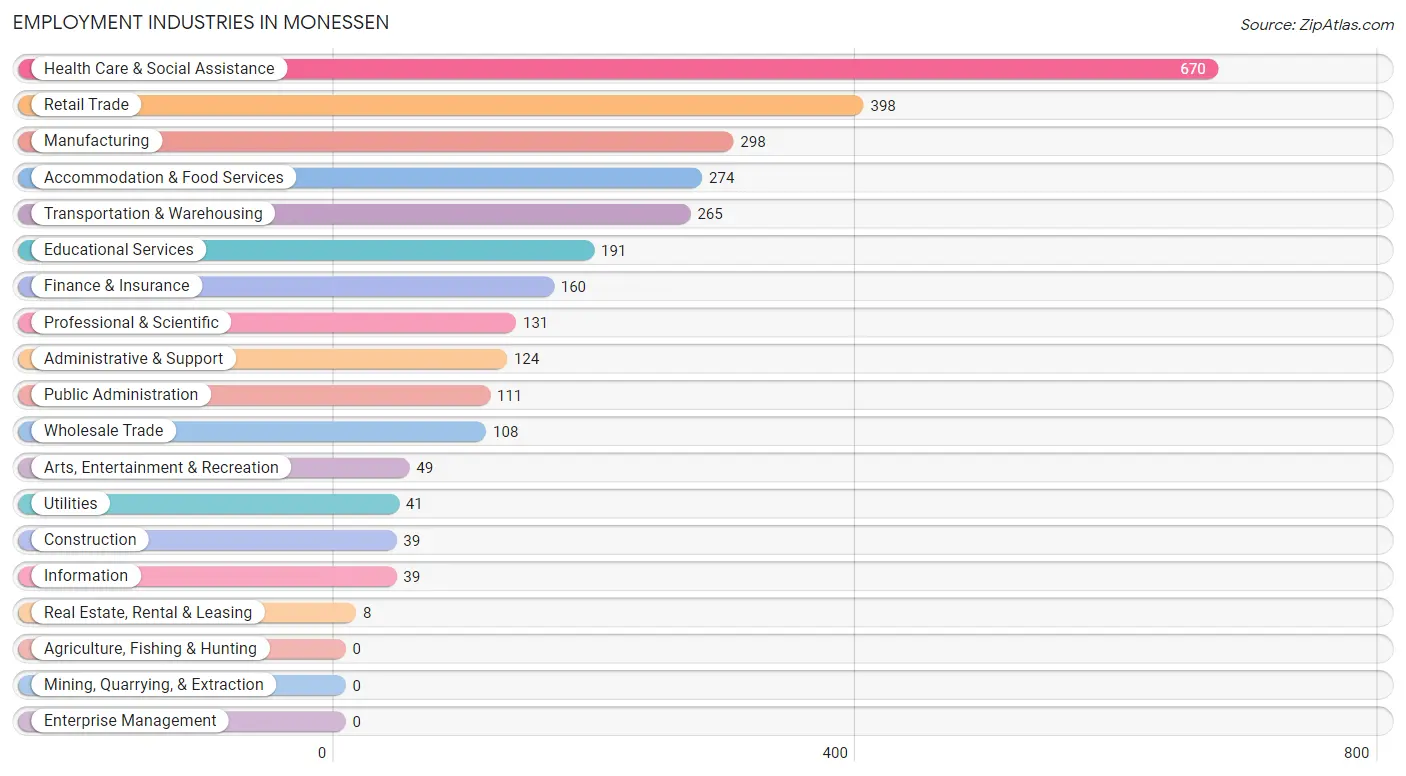
Employment Industries in Monessen
The major employment industries in Monessen include Health Care & Social Assistance (670 | 22.1%), Retail Trade (398 | 13.1%), Manufacturing (298 | 9.8%), Accommodation & Food Services (274 | 9.0%), and Transportation & Warehousing (265 | 8.7%).
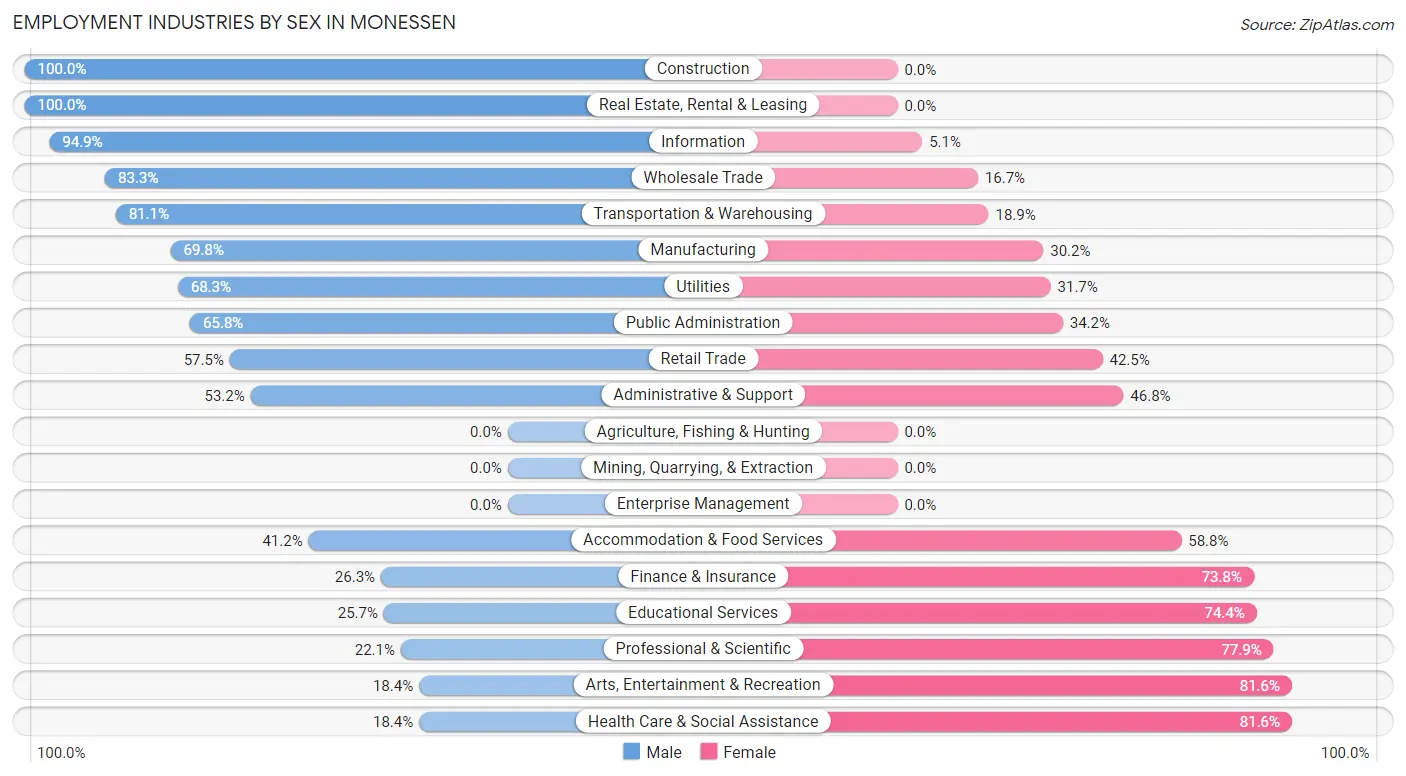
Employment Industries by Sex in Monessen
The Monessen industries that see more men than women are Construction (100.0%), Real Estate, Rental & Leasing (100.0%), and Information (94.9%), whereas the industries that tend to have a higher number of women are Health Care & Social Assistance (81.6%), Arts, Entertainment & Recreation (81.6%), and Professional & Scientific (77.9%).
| Industry | Male | Female |
| Agriculture, Fishing & Hunting | 0 (0.0%) | 0 (0.0%) |
| Mining, Quarrying, & Extraction | 0 (0.0%) | 0 (0.0%) |
| Construction | 39 (100.0%) | 0 (0.0%) |
| Manufacturing | 208 (69.8%) | 90 (30.2%) |
| Wholesale Trade | 90 (83.3%) | 18 (16.7%) |
| Retail Trade | 229 (57.5%) | 169 (42.5%) |
| Transportation & Warehousing | 215 (81.1%) | 50 (18.9%) |
| Utilities | 28 (68.3%) | 13 (31.7%) |
| Information | 37 (94.9%) | 2 (5.1%) |
| Finance & Insurance | 42 (26.3%) | 118 (73.8%) |
| Real Estate, Rental & Leasing | 8 (100.0%) | 0 (0.0%) |
| Professional & Scientific | 29 (22.1%) | 102 (77.9%) |
| Enterprise Management | 0 (0.0%) | 0 (0.0%) |
| Administrative & Support | 66 (53.2%) | 58 (46.8%) |
| Educational Services | 49 (25.7%) | 142 (74.4%) |
| Health Care & Social Assistance | 123 (18.4%) | 547 (81.6%) |
| Arts, Entertainment & Recreation | 9 (18.4%) | 40 (81.6%) |
| Accommodation & Food Services | 113 (41.2%) | 161 (58.8%) |
| Public Administration | 73 (65.8%) | 38 (34.2%) |
| Total | 1,431 (47.1%) | 1,604 (52.8%) |
Education in Monessen
School Enrollment in Monessen
The most common levels of schooling among the 1,307 students in Monessen are elementary school (293 | 22.4%), high school (292 | 22.3%), and college / undergraduate (273 | 20.9%).
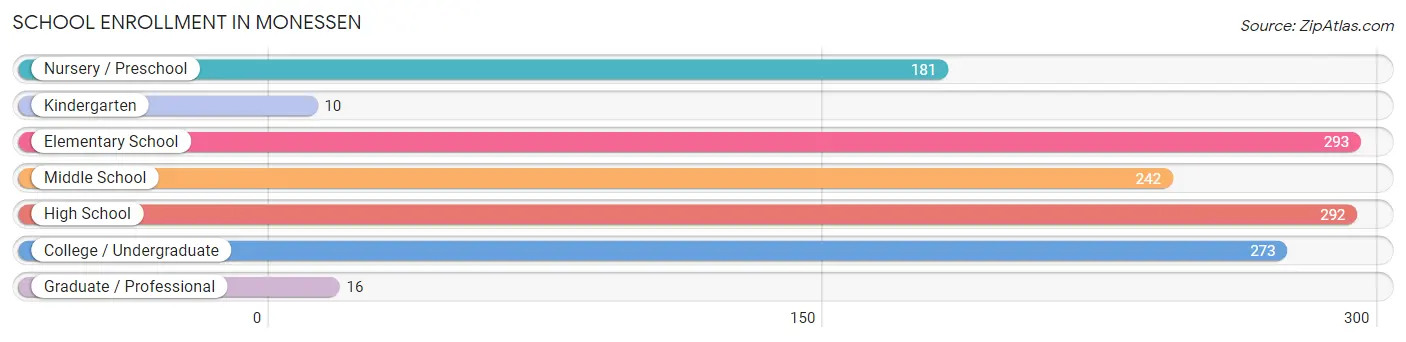
| School Level | # Students | % Students |
| Nursery / Preschool | 181 | 13.9% |
| Kindergarten | 10 | 0.8% |
| Elementary School | 293 | 22.4% |
| Middle School | 242 | 18.5% |
| High School | 292 | 22.3% |
| College / Undergraduate | 273 | 20.9% |
| Graduate / Professional | 16 | 1.2% |
| Total | 1,307 | 100.0% |
School Enrollment by Age by Funding Source in Monessen
Out of a total of 1,307 students who are enrolled in schools in Monessen, 324 (24.8%) attend a private institution, while the remaining 983 (75.2%) are enrolled in public schools. The age group of 3 to 4 year olds has the highest likelihood of being enrolled in private schools, with 53 (61.6% in the age bracket) enrolled. Conversely, the age group of 25 to 34 year olds has the lowest likelihood of being enrolled in a private school, with 7 (100.0% in the age bracket) attending a public institution.
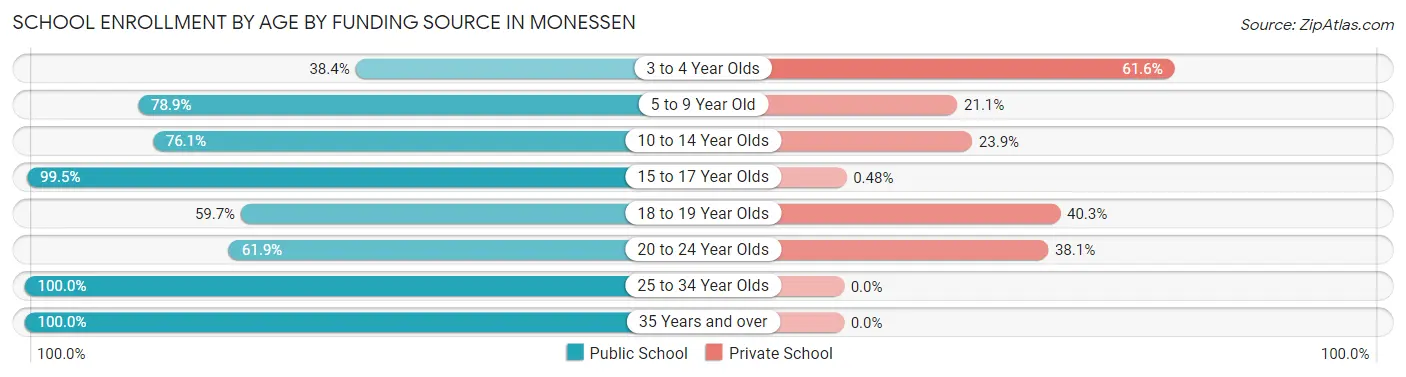
| Age Bracket | Public School | Private School |
| 3 to 4 Year Olds | 33 (38.4%) | 53 (61.6%) |
| 5 to 9 Year Old | 265 (78.9%) | 71 (21.1%) |
| 10 to 14 Year Olds | 274 (76.1%) | 86 (23.9%) |
| 15 to 17 Year Olds | 208 (99.5%) | 1 (0.5%) |
| 18 to 19 Year Olds | 80 (59.7%) | 54 (40.3%) |
| 20 to 24 Year Olds | 96 (61.9%) | 59 (38.1%) |
| 25 to 34 Year Olds | 7 (100.0%) | 0 (0.0%) |
| 35 Years and over | 20 (100.0%) | 0 (0.0%) |
| Total | 983 (75.2%) | 324 (24.8%) |
Educational Attainment by Field of Study in Monessen
Education (349 | 24.1%), business (295 | 20.4%), science & technology (181 | 12.5%), arts & humanities (126 | 8.7%), and physical & health sciences (104 | 7.2%) are the most common fields of study among 1,446 individuals in Monessen who have obtained a bachelor's degree or higher.
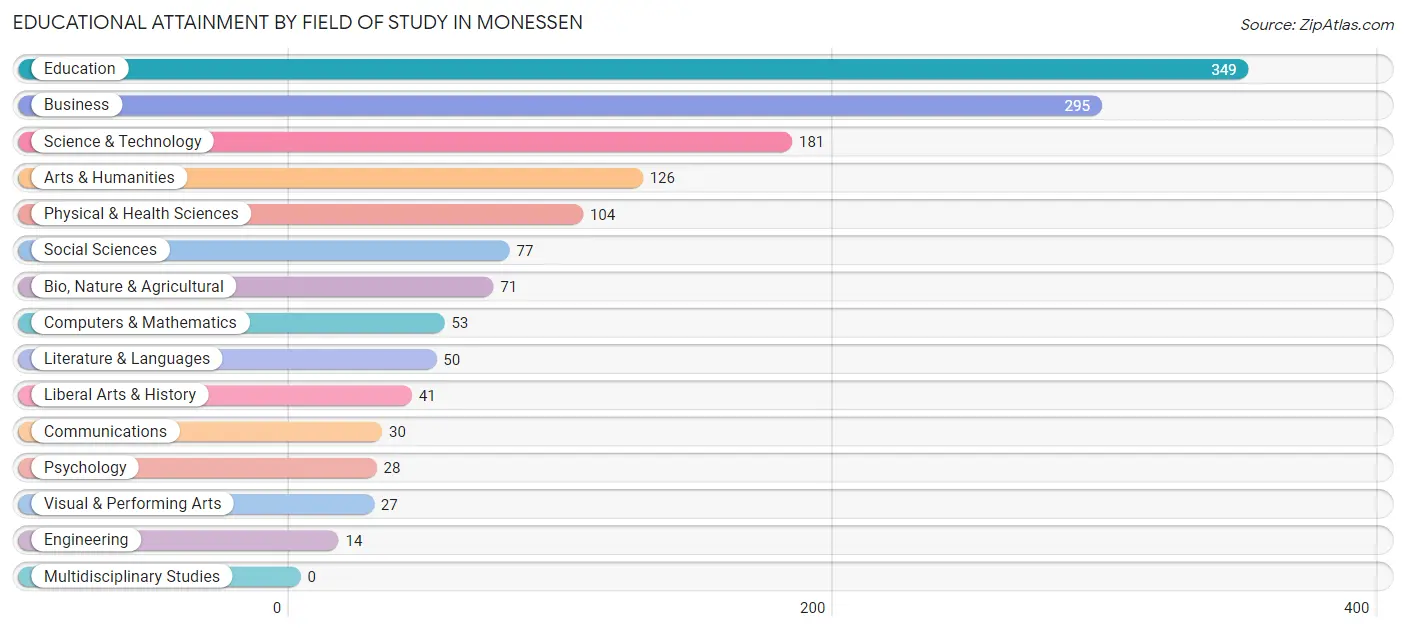
| Field of Study | # Graduates | % Graduates |
| Computers & Mathematics | 53 | 3.7% |
| Bio, Nature & Agricultural | 71 | 4.9% |
| Physical & Health Sciences | 104 | 7.2% |
| Psychology | 28 | 1.9% |
| Social Sciences | 77 | 5.3% |
| Engineering | 14 | 1.0% |
| Multidisciplinary Studies | 0 | 0.0% |
| Science & Technology | 181 | 12.5% |
| Business | 295 | 20.4% |
| Education | 349 | 24.1% |
| Literature & Languages | 50 | 3.5% |
| Liberal Arts & History | 41 | 2.8% |
| Visual & Performing Arts | 27 | 1.9% |
| Communications | 30 | 2.1% |
| Arts & Humanities | 126 | 8.7% |
| Total | 1,446 | 100.0% |
Transportation & Commute in Monessen
Vehicle Availability by Sex in Monessen
The most prevalent vehicle ownership categories in Monessen are males with 2 vehicles (578, accounting for 40.7%) and females with 2 vehicles (449, making up 38.7%).
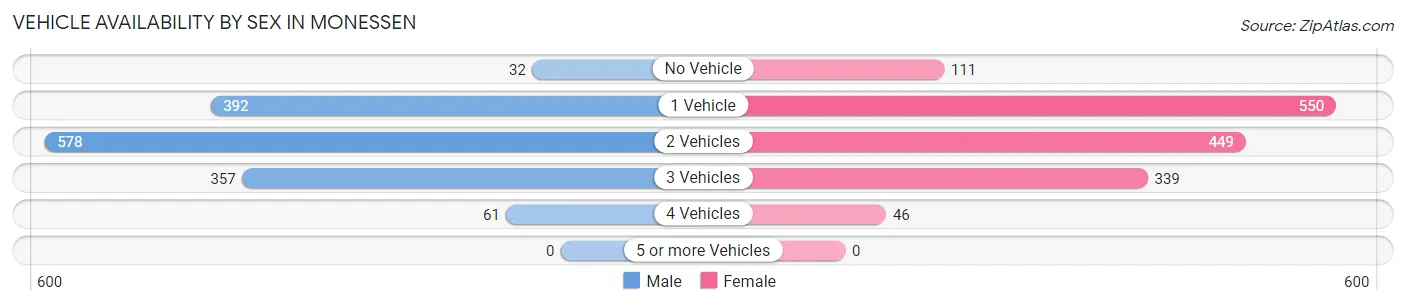
| Vehicles Available | Male | Female |
| No Vehicle | 32 (2.2%) | 111 (7.4%) |
| 1 Vehicle | 392 (27.6%) | 550 (36.8%) |
| 2 Vehicles | 578 (40.7%) | 449 (30.0%) |
| 3 Vehicles | 357 (25.1%) | 339 (22.7%) |
| 4 Vehicles | 61 (4.3%) | 46 (3.1%) |
| 5 or more Vehicles | 0 (0.0%) | 0 (0.0%) |
| Total | 1,420 (100.0%) | 1,495 (100.0%) |
Commute Time in Monessen
The most frequently occuring commute durations in Monessen are 10 to 14 minutes (407 commuters, 14.8%), 15 to 19 minutes (357 commuters, 13.0%), and 5 to 9 minutes (349 commuters, 12.7%).
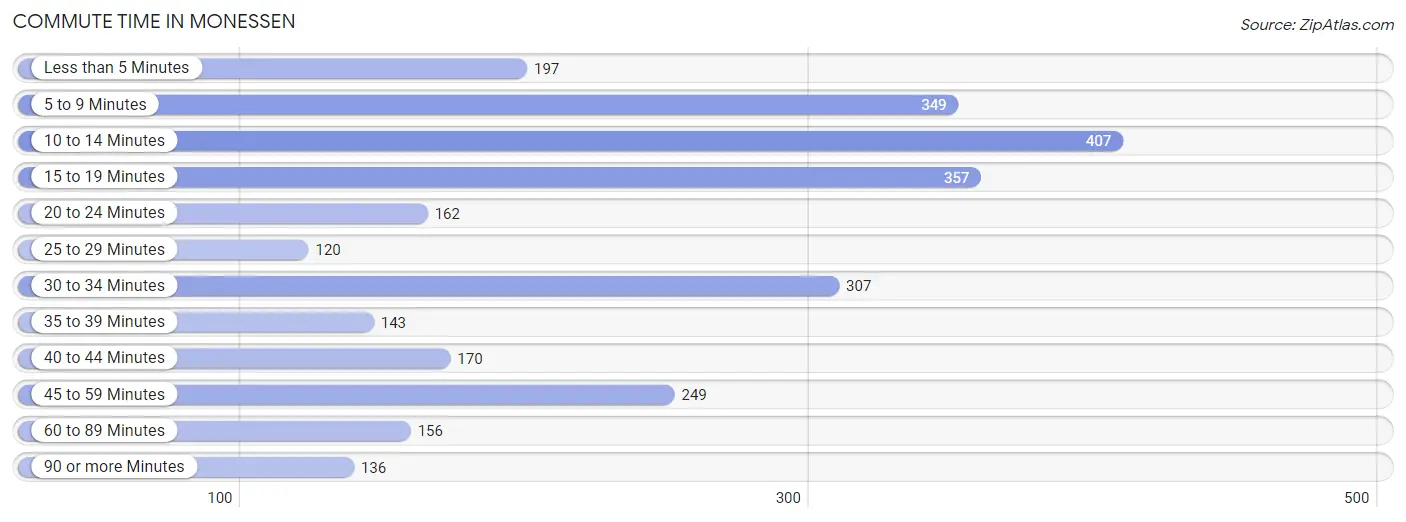
| Commute Time | # Commuters | % Commuters |
| Less than 5 Minutes | 197 | 7.2% |
| 5 to 9 Minutes | 349 | 12.7% |
| 10 to 14 Minutes | 407 | 14.8% |
| 15 to 19 Minutes | 357 | 13.0% |
| 20 to 24 Minutes | 162 | 5.9% |
| 25 to 29 Minutes | 120 | 4.4% |
| 30 to 34 Minutes | 307 | 11.2% |
| 35 to 39 Minutes | 143 | 5.2% |
| 40 to 44 Minutes | 170 | 6.2% |
| 45 to 59 Minutes | 249 | 9.0% |
| 60 to 89 Minutes | 156 | 5.7% |
| 90 or more Minutes | 136 | 4.9% |
Commute Time by Sex in Monessen
The most common commute times in Monessen are 15 to 19 minutes (204 commuters, 15.7%) for males and 10 to 14 minutes (255 commuters, 17.6%) for females.
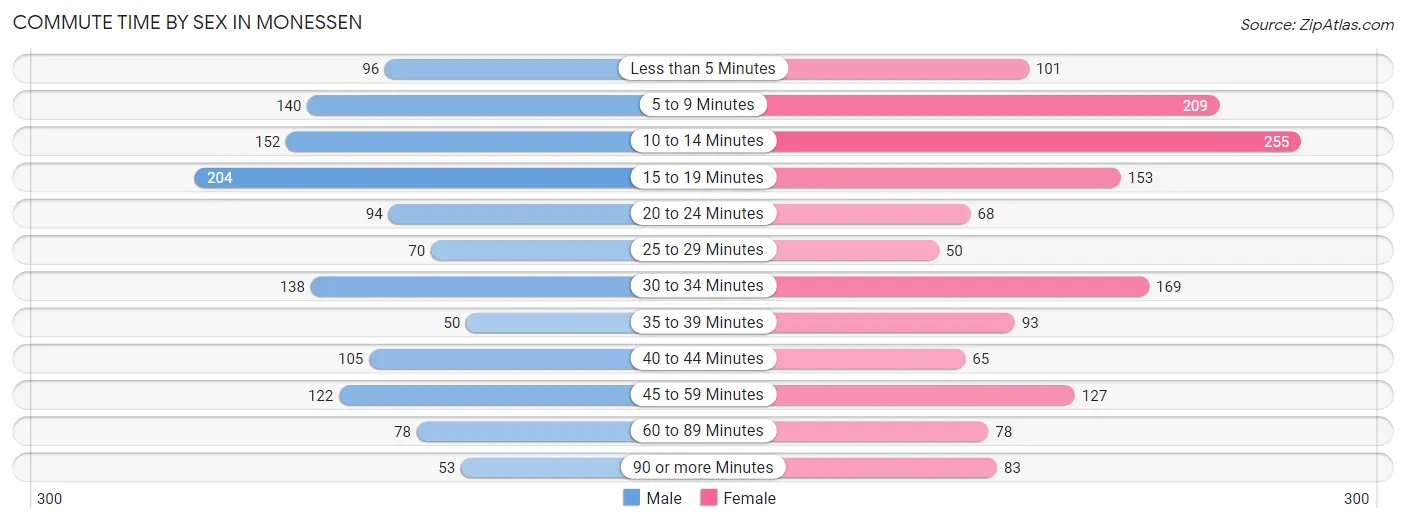
| Commute Time | Male | Female |
| Less than 5 Minutes | 96 (7.4%) | 101 (7.0%) |
| 5 to 9 Minutes | 140 (10.7%) | 209 (14.4%) |
| 10 to 14 Minutes | 152 (11.7%) | 255 (17.6%) |
| 15 to 19 Minutes | 204 (15.7%) | 153 (10.5%) |
| 20 to 24 Minutes | 94 (7.2%) | 68 (4.7%) |
| 25 to 29 Minutes | 70 (5.4%) | 50 (3.5%) |
| 30 to 34 Minutes | 138 (10.6%) | 169 (11.7%) |
| 35 to 39 Minutes | 50 (3.8%) | 93 (6.4%) |
| 40 to 44 Minutes | 105 (8.1%) | 65 (4.5%) |
| 45 to 59 Minutes | 122 (9.4%) | 127 (8.7%) |
| 60 to 89 Minutes | 78 (6.0%) | 78 (5.4%) |
| 90 or more Minutes | 53 (4.1%) | 83 (5.7%) |
Time of Departure to Work by Sex in Monessen
The most frequent times of departure to work in Monessen are 7:00 AM to 7:29 AM (236, 18.1%) for males and 7:00 AM to 7:29 AM (290, 20.0%) for females.
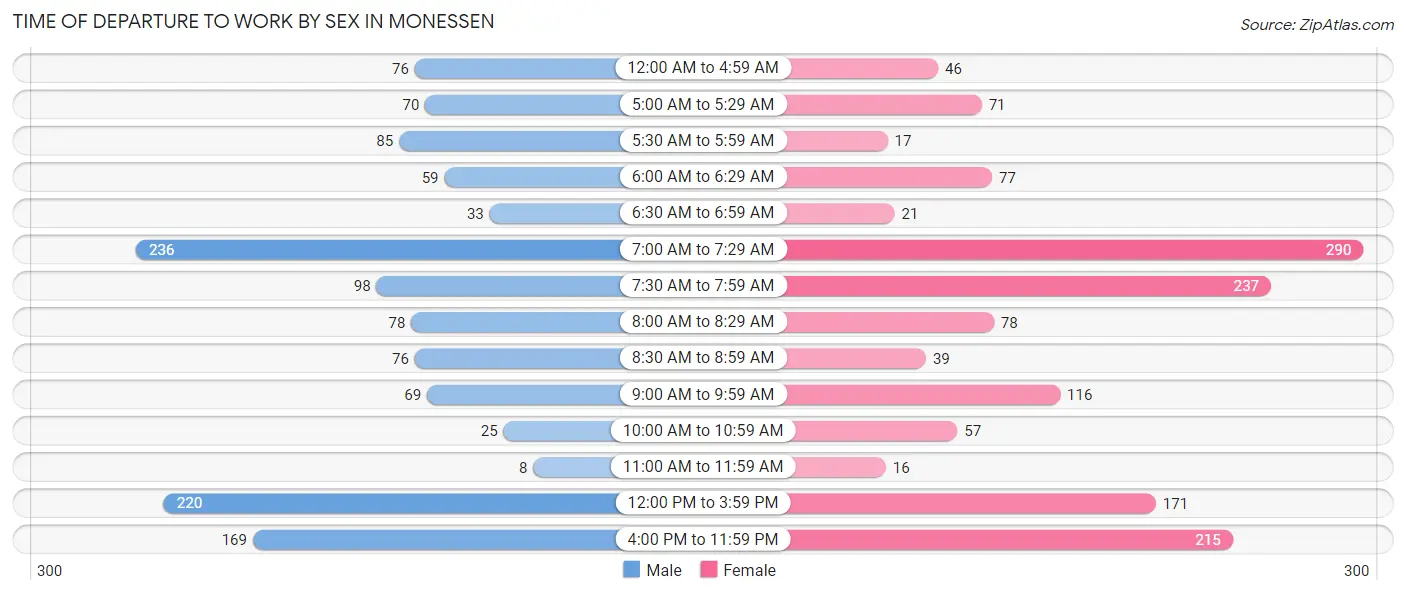
| Time of Departure | Male | Female |
| 12:00 AM to 4:59 AM | 76 (5.8%) | 46 (3.2%) |
| 5:00 AM to 5:29 AM | 70 (5.4%) | 71 (4.9%) |
| 5:30 AM to 5:59 AM | 85 (6.5%) | 17 (1.2%) |
| 6:00 AM to 6:29 AM | 59 (4.5%) | 77 (5.3%) |
| 6:30 AM to 6:59 AM | 33 (2.5%) | 21 (1.5%) |
| 7:00 AM to 7:29 AM | 236 (18.1%) | 290 (20.0%) |
| 7:30 AM to 7:59 AM | 98 (7.5%) | 237 (16.3%) |
| 8:00 AM to 8:29 AM | 78 (6.0%) | 78 (5.4%) |
| 8:30 AM to 8:59 AM | 76 (5.8%) | 39 (2.7%) |
| 9:00 AM to 9:59 AM | 69 (5.3%) | 116 (8.0%) |
| 10:00 AM to 10:59 AM | 25 (1.9%) | 57 (3.9%) |
| 11:00 AM to 11:59 AM | 8 (0.6%) | 16 (1.1%) |
| 12:00 PM to 3:59 PM | 220 (16.9%) | 171 (11.8%) |
| 4:00 PM to 11:59 PM | 169 (13.0%) | 215 (14.8%) |
| Total | 1,302 (100.0%) | 1,451 (100.0%) |
Housing Occupancy in Monessen
Occupancy by Ownership in Monessen
Of the total 3,236 dwellings in Monessen, owner-occupied units account for 2,486 (76.8%), while renter-occupied units make up 750 (23.2%).
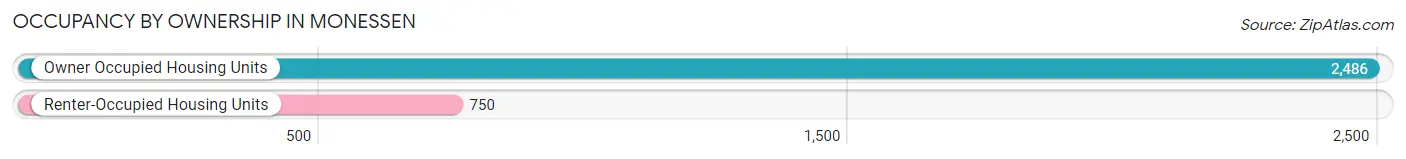
| Occupancy | # Housing Units | % Housing Units |
| Owner Occupied Housing Units | 2,486 | 76.8% |
| Renter-Occupied Housing Units | 750 | 23.2% |
| Total Occupied Housing Units | 3,236 | 100.0% |
Occupancy by Household Size in Monessen
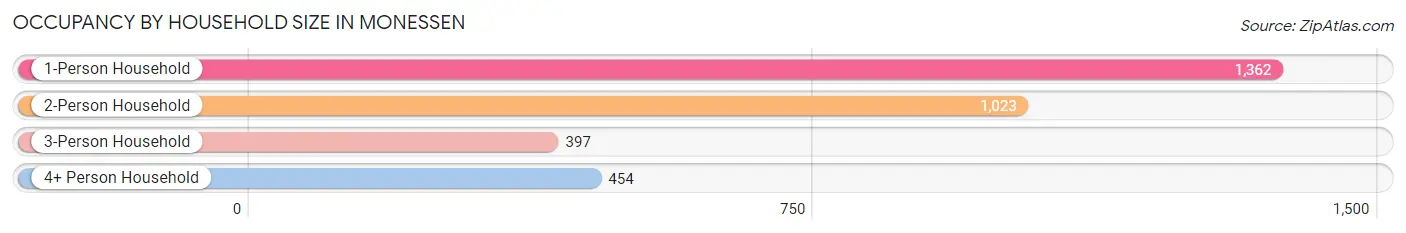
| Household Size | # Housing Units | % Housing Units |
| 1-Person Household | 1,362 | 42.1% |
| 2-Person Household | 1,023 | 31.6% |
| 3-Person Household | 397 | 12.3% |
| 4+ Person Household | 454 | 14.0% |
| Total Housing Units | 3,236 | 100.0% |
Occupancy by Ownership by Household Size in Monessen
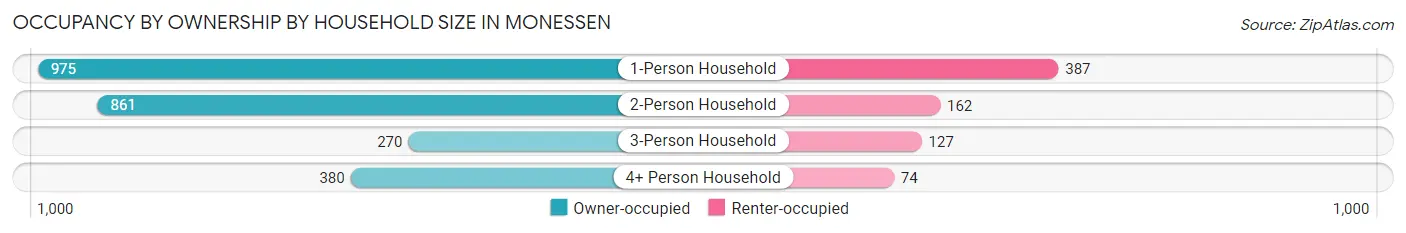
| Household Size | Owner-occupied | Renter-occupied |
| 1-Person Household | 975 (71.6%) | 387 (28.4%) |
| 2-Person Household | 861 (84.2%) | 162 (15.8%) |
| 3-Person Household | 270 (68.0%) | 127 (32.0%) |
| 4+ Person Household | 380 (83.7%) | 74 (16.3%) |
| Total Housing Units | 2,486 (76.8%) | 750 (23.2%) |
Occupancy by Educational Attainment in Monessen
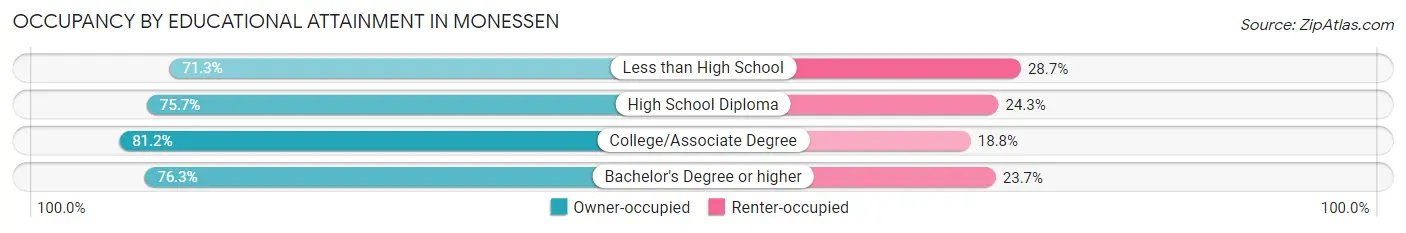
| Household Size | Owner-occupied | Renter-occupied |
| Less than High School | 144 (71.3%) | 58 (28.7%) |
| High School Diploma | 1,071 (75.7%) | 343 (24.3%) |
| College/Associate Degree | 580 (81.2%) | 134 (18.8%) |
| Bachelor's Degree or higher | 691 (76.3%) | 215 (23.7%) |
Occupancy by Age of Householder in Monessen
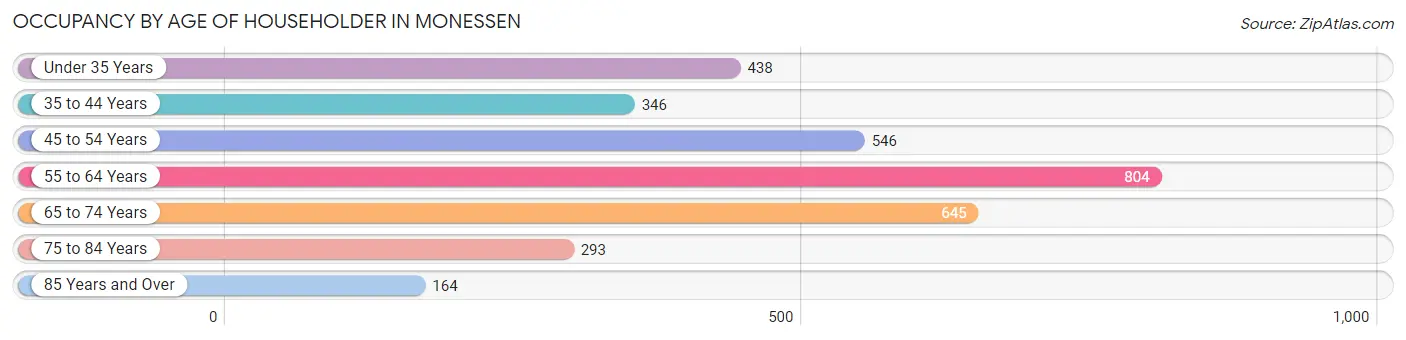
| Age Bracket | # Households | % Households |
| Under 35 Years | 438 | 13.5% |
| 35 to 44 Years | 346 | 10.7% |
| 45 to 54 Years | 546 | 16.9% |
| 55 to 64 Years | 804 | 24.8% |
| 65 to 74 Years | 645 | 19.9% |
| 75 to 84 Years | 293 | 9.0% |
| 85 Years and Over | 164 | 5.1% |
| Total | 3,236 | 100.0% |
Housing Finances in Monessen
Median Income by Occupancy in Monessen
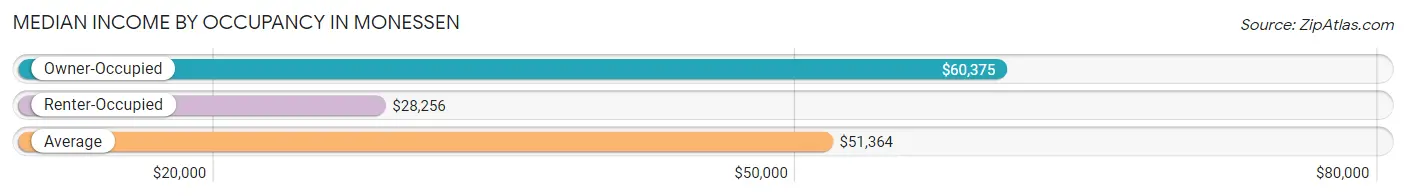
| Occupancy Type | # Households | Median Income |
| Owner-Occupied | 2,486 (76.8%) | $60,375 |
| Renter-Occupied | 750 (23.2%) | $28,256 |
| Average | 3,236 (100.0%) | $51,364 |
Occupancy by Householder Income Bracket in Monessen
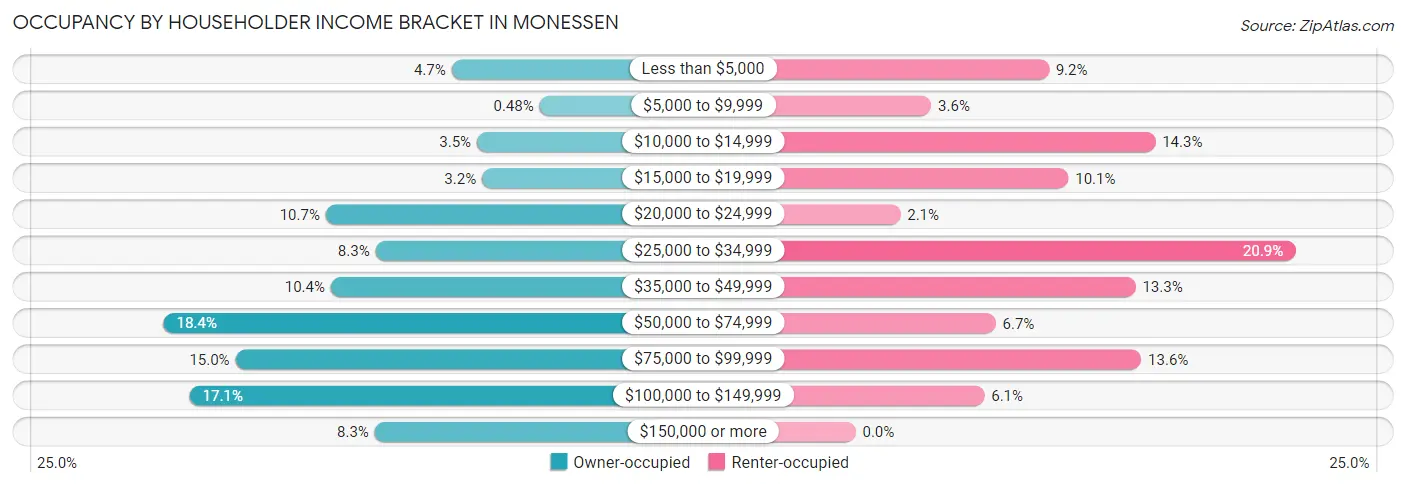
| Income Bracket | Owner-occupied | Renter-occupied |
| Less than $5,000 | 116 (4.7%) | 69 (9.2%) |
| $5,000 to $9,999 | 12 (0.5%) | 27 (3.6%) |
| $10,000 to $14,999 | 86 (3.5%) | 107 (14.3%) |
| $15,000 to $19,999 | 80 (3.2%) | 76 (10.1%) |
| $20,000 to $24,999 | 265 (10.7%) | 16 (2.1%) |
| $25,000 to $34,999 | 206 (8.3%) | 157 (20.9%) |
| $35,000 to $49,999 | 259 (10.4%) | 100 (13.3%) |
| $50,000 to $74,999 | 457 (18.4%) | 50 (6.7%) |
| $75,000 to $99,999 | 372 (15.0%) | 102 (13.6%) |
| $100,000 to $149,999 | 426 (17.1%) | 46 (6.1%) |
| $150,000 or more | 207 (8.3%) | 0 (0.0%) |
| Total | 2,486 (100.0%) | 750 (100.0%) |
Monthly Housing Cost Tiers in Monessen
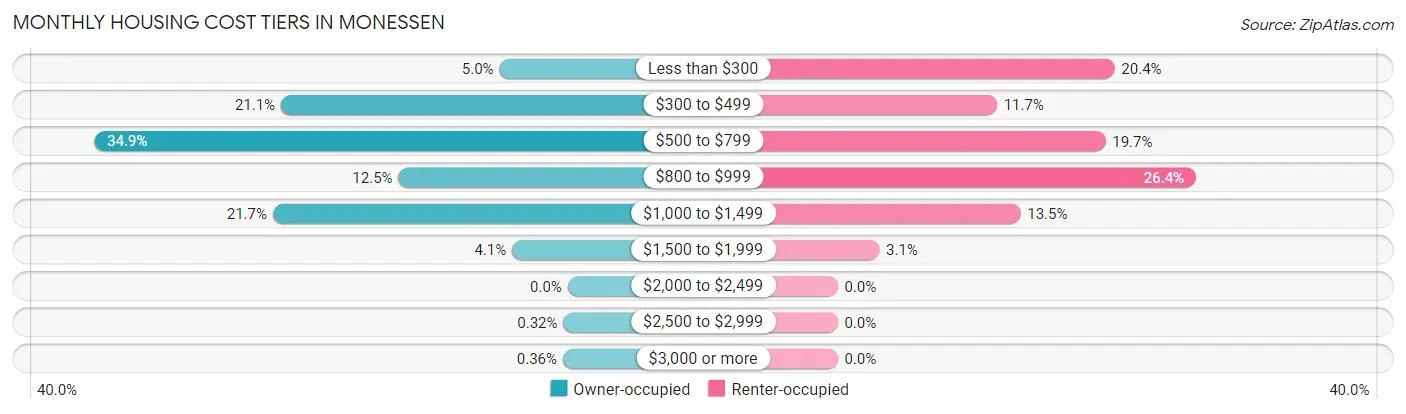
| Monthly Cost | Owner-occupied | Renter-occupied |
| Less than $300 | 125 (5.0%) | 153 (20.4%) |
| $300 to $499 | 525 (21.1%) | 88 (11.7%) |
| $500 to $799 | 867 (34.9%) | 148 (19.7%) |
| $800 to $999 | 310 (12.5%) | 198 (26.4%) |
| $1,000 to $1,499 | 540 (21.7%) | 101 (13.5%) |
| $1,500 to $1,999 | 102 (4.1%) | 23 (3.1%) |
| $2,000 to $2,499 | 0 (0.0%) | 0 (0.0%) |
| $2,500 to $2,999 | 8 (0.3%) | 0 (0.0%) |
| $3,000 or more | 9 (0.4%) | 0 (0.0%) |
| Total | 2,486 (100.0%) | 750 (100.0%) |
Physical Housing Characteristics in Monessen
Housing Structures in Monessen
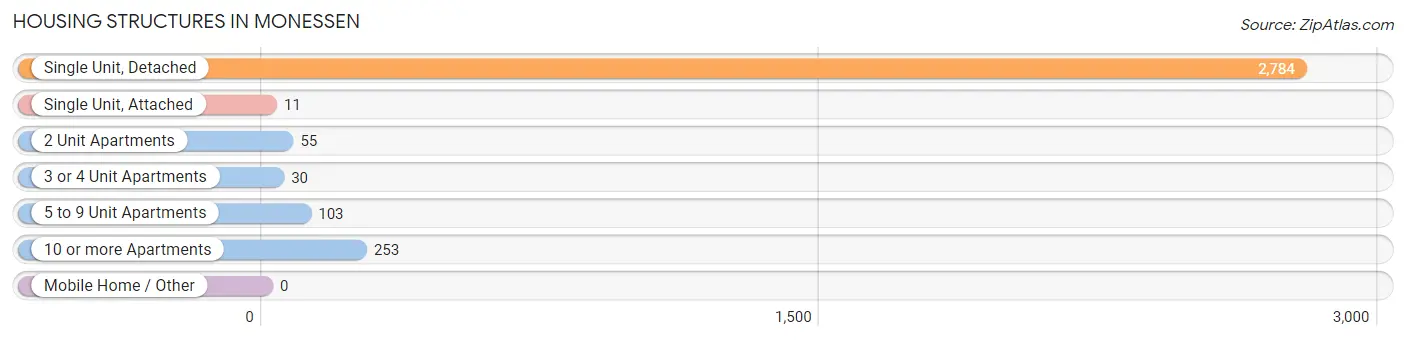
| Structure Type | # Housing Units | % Housing Units |
| Single Unit, Detached | 2,784 | 86.0% |
| Single Unit, Attached | 11 | 0.3% |
| 2 Unit Apartments | 55 | 1.7% |
| 3 or 4 Unit Apartments | 30 | 0.9% |
| 5 to 9 Unit Apartments | 103 | 3.2% |
| 10 or more Apartments | 253 | 7.8% |
| Mobile Home / Other | 0 | 0.0% |
| Total | 3,236 | 100.0% |
Housing Structures by Occupancy in Monessen
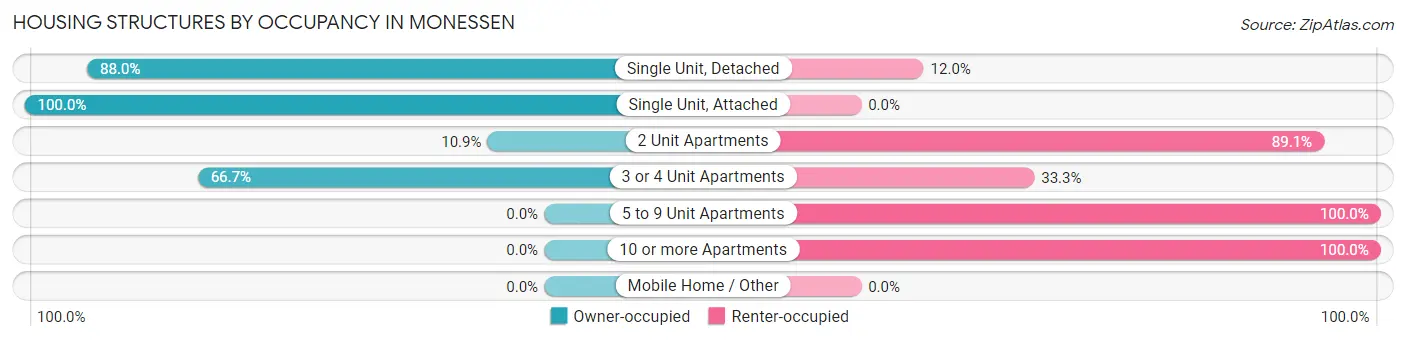
| Structure Type | Owner-occupied | Renter-occupied |
| Single Unit, Detached | 2,449 (88.0%) | 335 (12.0%) |
| Single Unit, Attached | 11 (100.0%) | 0 (0.0%) |
| 2 Unit Apartments | 6 (10.9%) | 49 (89.1%) |
| 3 or 4 Unit Apartments | 20 (66.7%) | 10 (33.3%) |
| 5 to 9 Unit Apartments | 0 (0.0%) | 103 (100.0%) |
| 10 or more Apartments | 0 (0.0%) | 253 (100.0%) |
| Mobile Home / Other | 0 (0.0%) | 0 (0.0%) |
| Total | 2,486 (76.8%) | 750 (23.2%) |
Housing Structures by Number of Rooms in Monessen
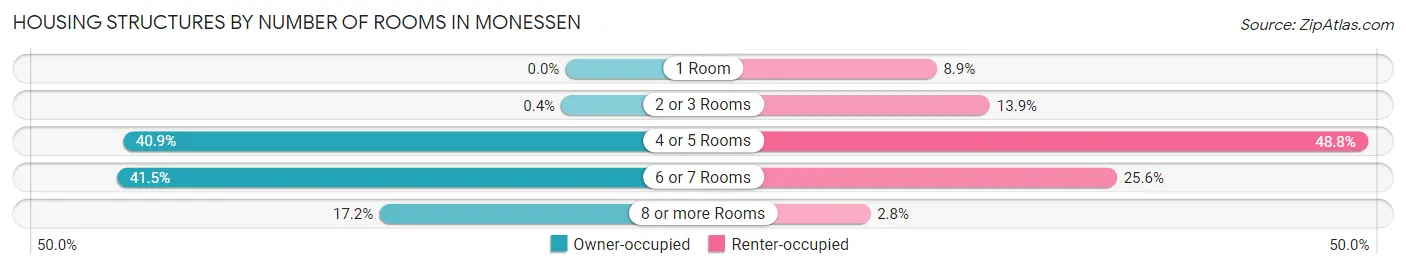
| Number of Rooms | Owner-occupied | Renter-occupied |
| 1 Room | 0 (0.0%) | 67 (8.9%) |
| 2 or 3 Rooms | 10 (0.4%) | 104 (13.9%) |
| 4 or 5 Rooms | 1,017 (40.9%) | 366 (48.8%) |
| 6 or 7 Rooms | 1,031 (41.5%) | 192 (25.6%) |
| 8 or more Rooms | 428 (17.2%) | 21 (2.8%) |
| Total | 2,486 (100.0%) | 750 (100.0%) |
Housing Structure by Heating Type in Monessen
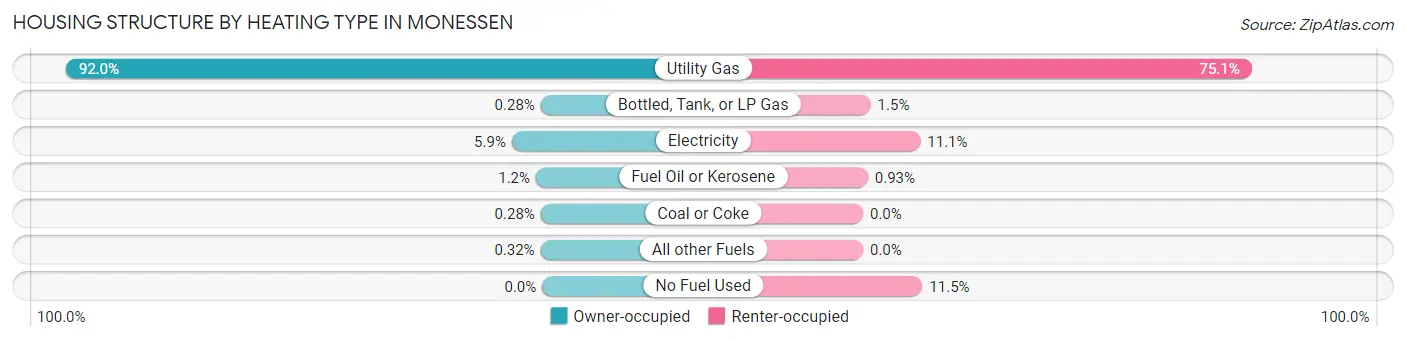
| Heating Type | Owner-occupied | Renter-occupied |
| Utility Gas | 2,288 (92.0%) | 563 (75.1%) |
| Bottled, Tank, or LP Gas | 7 (0.3%) | 11 (1.5%) |
| Electricity | 146 (5.9%) | 83 (11.1%) |
| Fuel Oil or Kerosene | 30 (1.2%) | 7 (0.9%) |
| Coal or Coke | 7 (0.3%) | 0 (0.0%) |
| All other Fuels | 8 (0.3%) | 0 (0.0%) |
| No Fuel Used | 0 (0.0%) | 86 (11.5%) |
| Total | 2,486 (100.0%) | 750 (100.0%) |
Household Vehicle Usage in Monessen
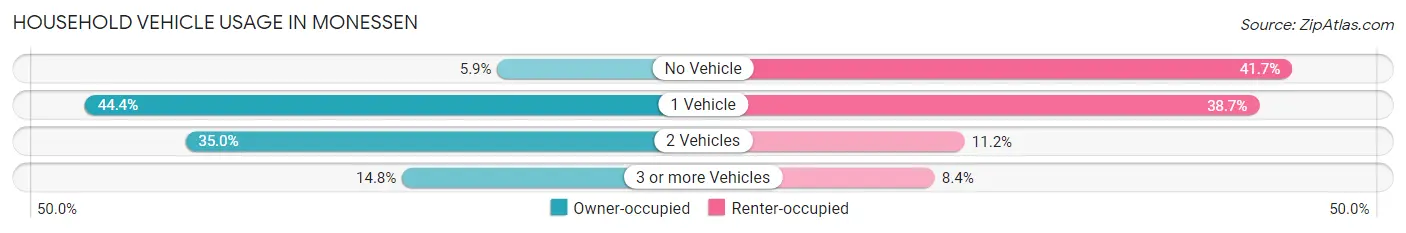
| Vehicles per Household | Owner-occupied | Renter-occupied |
| No Vehicle | 146 (5.9%) | 313 (41.7%) |
| 1 Vehicle | 1,103 (44.4%) | 290 (38.7%) |
| 2 Vehicles | 870 (35.0%) | 84 (11.2%) |
| 3 or more Vehicles | 367 (14.8%) | 63 (8.4%) |
| Total | 2,486 (100.0%) | 750 (100.0%) |
Real Estate & Mortgages in Monessen
Real Estate and Mortgage Overview in Monessen
| Characteristic | Without Mortgage | With Mortgage |
| Housing Units | 1,337 | 1,149 |
| Median Property Value | $71,600 | $93,100 |
| Median Household Income | $41,402 | $91 |
| Monthly Housing Costs | $507 | $0 |
| Real Estate Taxes | $1,443 | $0 |
Property Value by Mortgage Status in Monessen
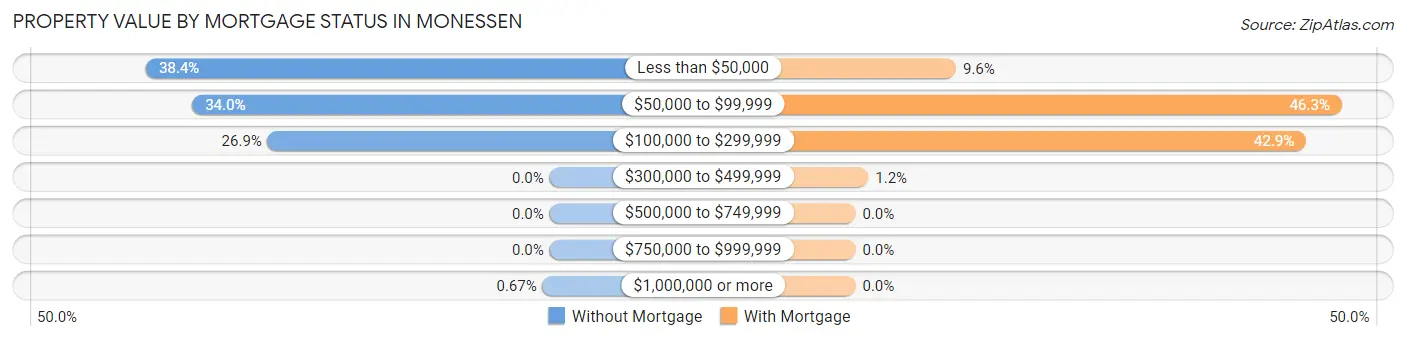
| Property Value | Without Mortgage | With Mortgage |
| Less than $50,000 | 514 (38.4%) | 110 (9.6%) |
| $50,000 to $99,999 | 455 (34.0%) | 532 (46.3%) |
| $100,000 to $299,999 | 359 (26.9%) | 493 (42.9%) |
| $300,000 to $499,999 | 0 (0.0%) | 14 (1.2%) |
| $500,000 to $749,999 | 0 (0.0%) | 0 (0.0%) |
| $750,000 to $999,999 | 0 (0.0%) | 0 (0.0%) |
| $1,000,000 or more | 9 (0.7%) | 0 (0.0%) |
| Total | 1,337 (100.0%) | 1,149 (100.0%) |
Household Income by Mortgage Status in Monessen
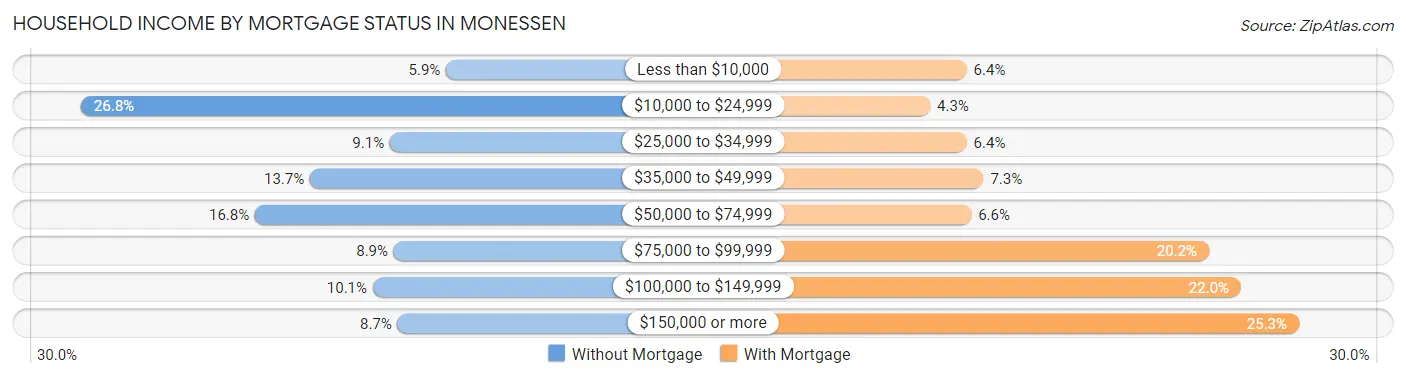
| Household Income | Without Mortgage | With Mortgage |
| Less than $10,000 | 79 (5.9%) | 73 (6.4%) |
| $10,000 to $24,999 | 358 (26.8%) | 49 (4.3%) |
| $25,000 to $34,999 | 122 (9.1%) | 73 (6.4%) |
| $35,000 to $49,999 | 183 (13.7%) | 84 (7.3%) |
| $50,000 to $74,999 | 225 (16.8%) | 76 (6.6%) |
| $75,000 to $99,999 | 119 (8.9%) | 232 (20.2%) |
| $100,000 to $149,999 | 135 (10.1%) | 253 (22.0%) |
| $150,000 or more | 116 (8.7%) | 291 (25.3%) |
| Total | 1,337 (100.0%) | 1,149 (100.0%) |
Property Value to Household Income Ratio in Monessen
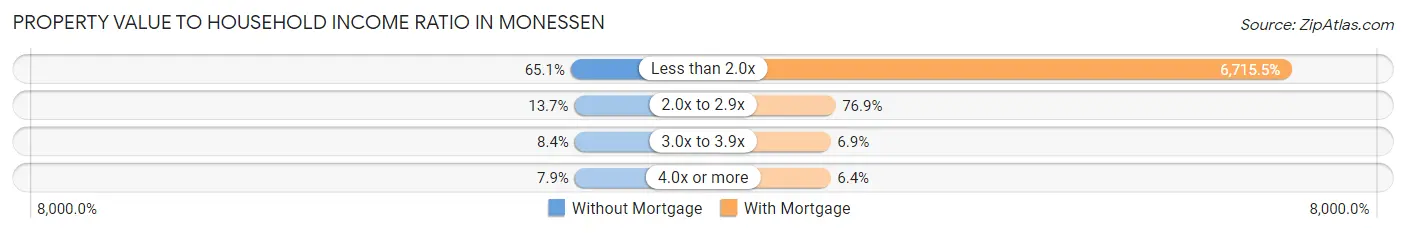
| Value-to-Income Ratio | Without Mortgage | With Mortgage |
| Less than 2.0x | 870 (65.1%) | 77,161 (6,715.5%) |
| 2.0x to 2.9x | 183 (13.7%) | 884 (76.9%) |
| 3.0x to 3.9x | 112 (8.4%) | 79 (6.9%) |
| 4.0x or more | 105 (7.9%) | 73 (6.4%) |
| Total | 1,337 (100.0%) | 1,149 (100.0%) |
Real Estate Taxes by Mortgage Status in Monessen
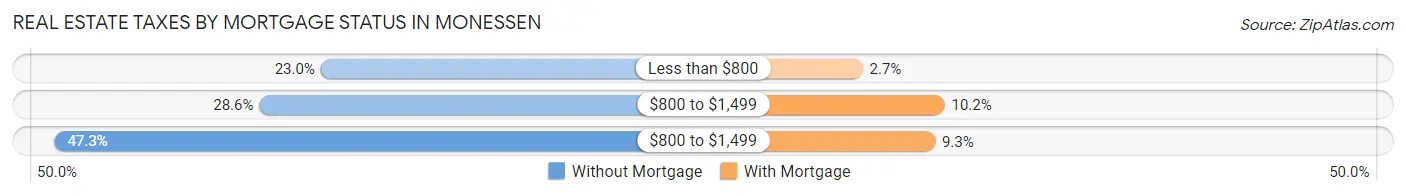
| Property Taxes | Without Mortgage | With Mortgage |
| Less than $800 | 307 (23.0%) | 31 (2.7%) |
| $800 to $1,499 | 382 (28.6%) | 117 (10.2%) |
| $800 to $1,499 | 632 (47.3%) | 107 (9.3%) |
| Total | 1,337 (100.0%) | 1,149 (100.0%) |
Health & Disability in Monessen
Health Insurance Coverage by Age in Monessen
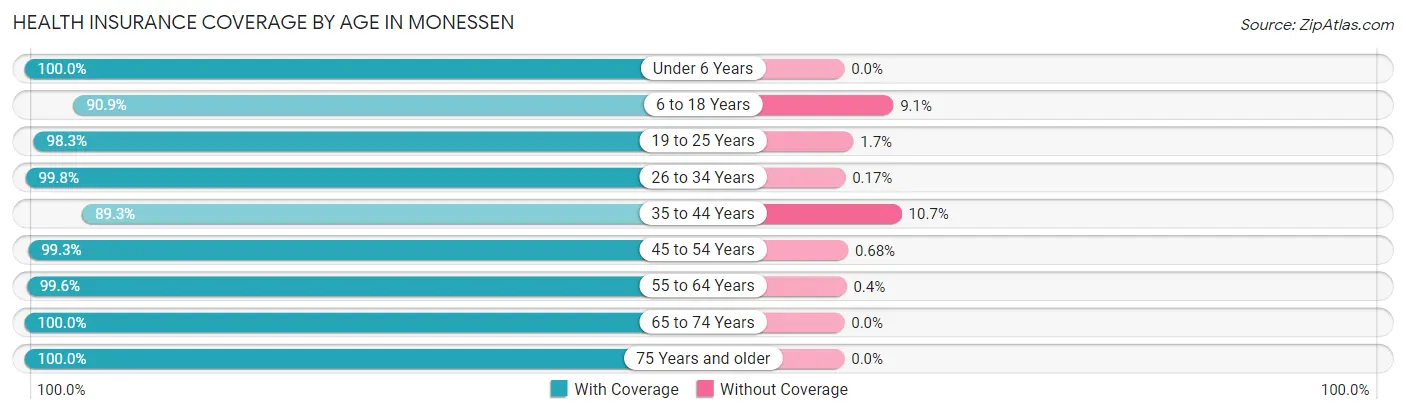
| Age Bracket | With Coverage | Without Coverage |
| Under 6 Years | 486 (100.0%) | 0 (0.0%) |
| 6 to 18 Years | 817 (90.9%) | 82 (9.1%) |
| 19 to 25 Years | 466 (98.3%) | 8 (1.7%) |
| 26 to 34 Years | 605 (99.8%) | 1 (0.2%) |
| 35 to 44 Years | 718 (89.3%) | 86 (10.7%) |
| 45 to 54 Years | 735 (99.3%) | 5 (0.7%) |
| 55 to 64 Years | 1,258 (99.6%) | 5 (0.4%) |
| 65 to 74 Years | 938 (100.0%) | 0 (0.0%) |
| 75 Years and older | 627 (100.0%) | 0 (0.0%) |
| Total | 6,650 (97.3%) | 187 (2.7%) |
Health Insurance Coverage by Citizenship Status in Monessen
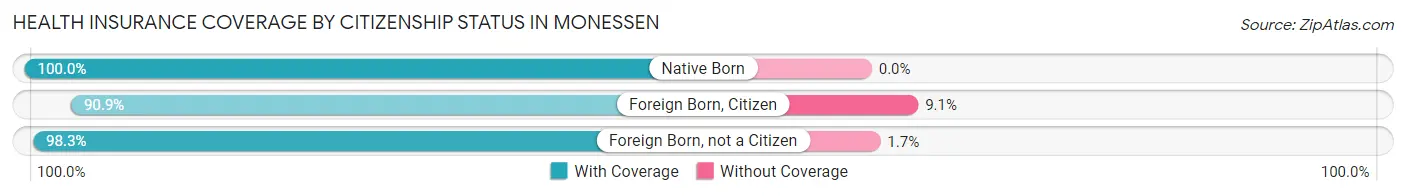
| Citizenship Status | With Coverage | Without Coverage |
| Native Born | 486 (100.0%) | 0 (0.0%) |
| Foreign Born, Citizen | 817 (90.9%) | 82 (9.1%) |
| Foreign Born, not a Citizen | 466 (98.3%) | 8 (1.7%) |
Health Insurance Coverage by Household Income in Monessen
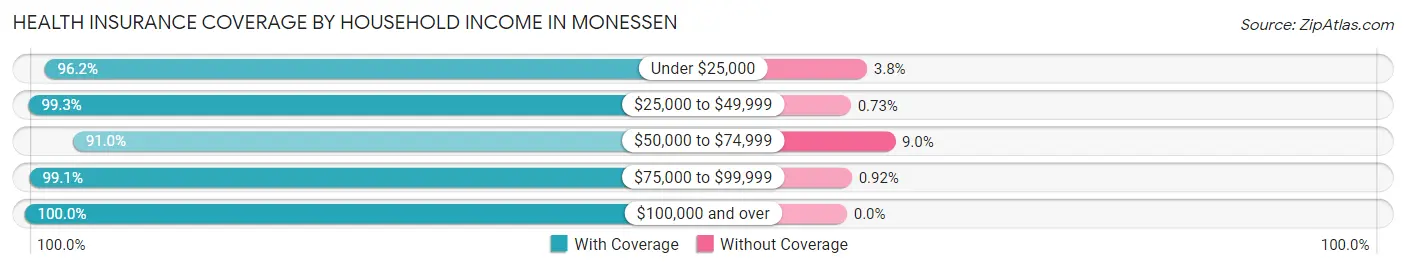
| Household Income | With Coverage | Without Coverage |
| Under $25,000 | 1,330 (96.2%) | 52 (3.8%) |
| $25,000 to $49,999 | 1,095 (99.3%) | 8 (0.7%) |
| $50,000 to $74,999 | 1,128 (91.0%) | 112 (9.0%) |
| $75,000 to $99,999 | 1,191 (99.1%) | 11 (0.9%) |
| $100,000 and over | 1,775 (100.0%) | 0 (0.0%) |
Public vs Private Health Insurance Coverage by Age in Monessen
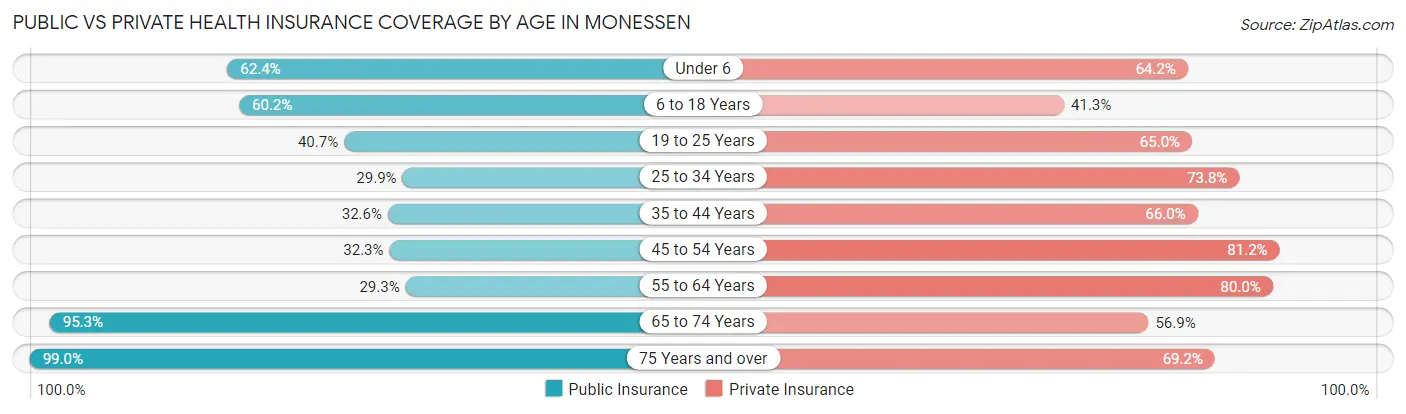
| Age Bracket | Public Insurance | Private Insurance |
| Under 6 | 303 (62.4%) | 312 (64.2%) |
| 6 to 18 Years | 541 (60.2%) | 371 (41.3%) |
| 19 to 25 Years | 193 (40.7%) | 308 (65.0%) |
| 25 to 34 Years | 181 (29.9%) | 447 (73.8%) |
| 35 to 44 Years | 262 (32.6%) | 531 (66.0%) |
| 45 to 54 Years | 239 (32.3%) | 601 (81.2%) |
| 55 to 64 Years | 370 (29.3%) | 1,010 (80.0%) |
| 65 to 74 Years | 894 (95.3%) | 534 (56.9%) |
| 75 Years and over | 621 (99.0%) | 434 (69.2%) |
| Total | 3,604 (52.7%) | 4,548 (66.5%) |
Disability Status by Sex by Age in Monessen
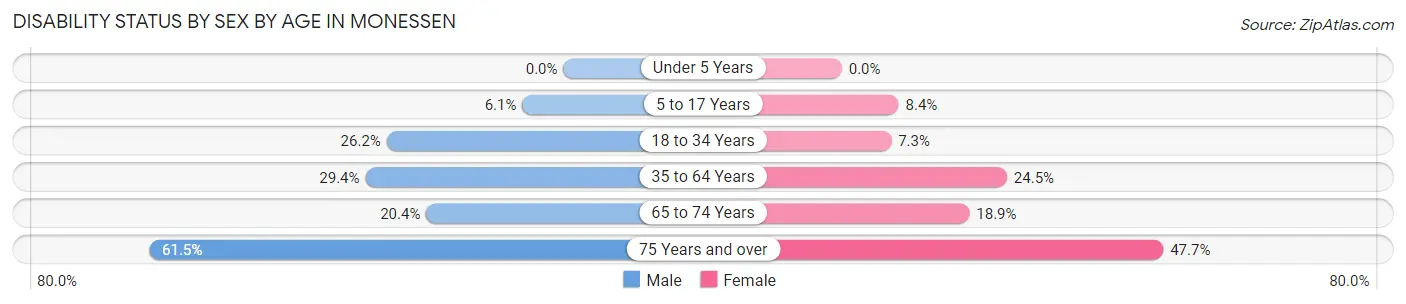
| Age Bracket | Male | Female |
| Under 5 Years | 0 (0.0%) | 0 (0.0%) |
| 5 to 17 Years | 30 (6.1%) | 37 (8.4%) |
| 18 to 34 Years | 138 (26.2%) | 46 (7.3%) |
| 35 to 64 Years | 384 (29.4%) | 368 (24.5%) |
| 65 to 74 Years | 91 (20.4%) | 93 (18.9%) |
| 75 Years and over | 155 (61.5%) | 179 (47.7%) |
Disability Class by Sex by Age in Monessen
Disability Class: Hearing Difficulty
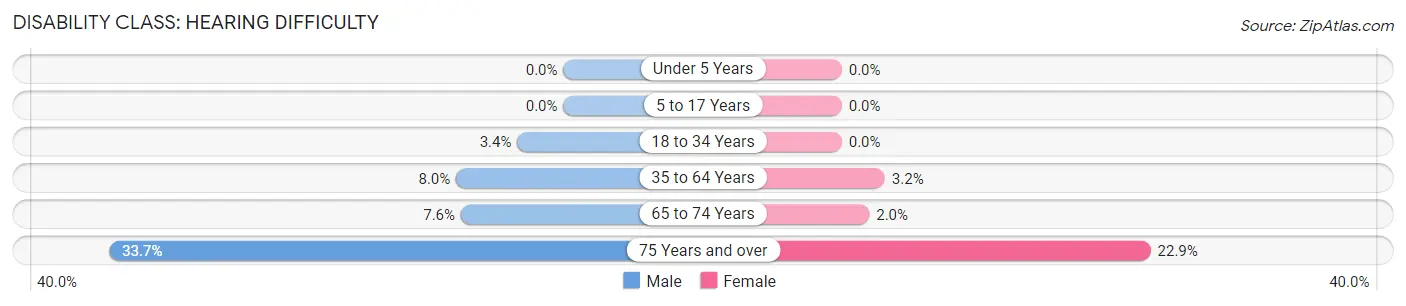
| Age Bracket | Male | Female |
| Under 5 Years | 0 (0.0%) | 0 (0.0%) |
| 5 to 17 Years | 0 (0.0%) | 0 (0.0%) |
| 18 to 34 Years | 18 (3.4%) | 0 (0.0%) |
| 35 to 64 Years | 104 (8.0%) | 48 (3.2%) |
| 65 to 74 Years | 34 (7.6%) | 10 (2.0%) |
| 75 Years and over | 85 (33.7%) | 86 (22.9%) |
Disability Class: Vision Difficulty
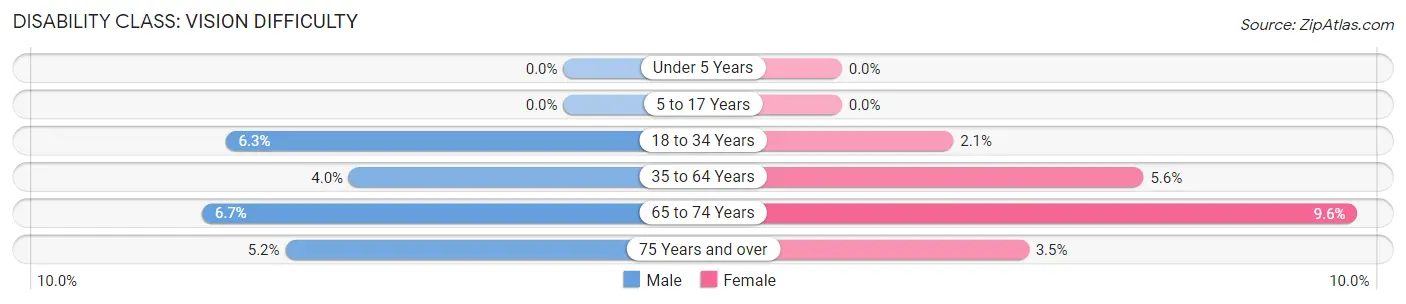
| Age Bracket | Male | Female |
| Under 5 Years | 0 (0.0%) | 0 (0.0%) |
| 5 to 17 Years | 0 (0.0%) | 0 (0.0%) |
| 18 to 34 Years | 33 (6.3%) | 13 (2.1%) |
| 35 to 64 Years | 52 (4.0%) | 84 (5.6%) |
| 65 to 74 Years | 30 (6.7%) | 47 (9.6%) |
| 75 Years and over | 13 (5.2%) | 13 (3.5%) |
Disability Class: Cognitive Difficulty
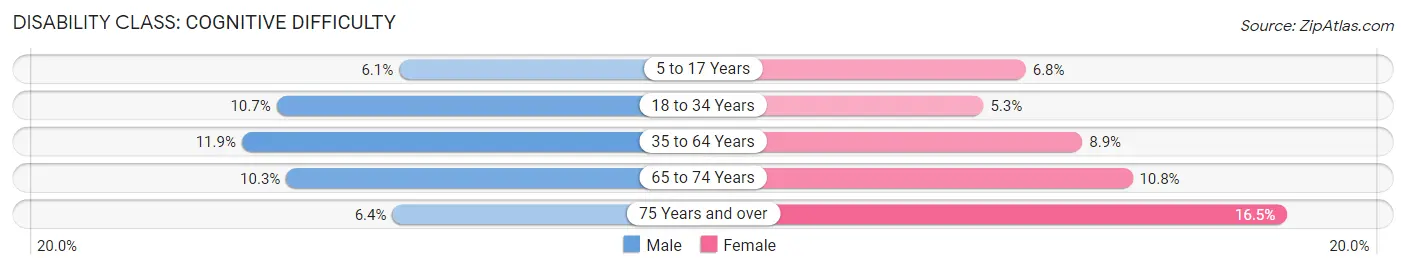
| Age Bracket | Male | Female |
| 5 to 17 Years | 30 (6.1%) | 30 (6.8%) |
| 18 to 34 Years | 56 (10.6%) | 33 (5.3%) |
| 35 to 64 Years | 156 (11.9%) | 134 (8.9%) |
| 65 to 74 Years | 46 (10.3%) | 53 (10.8%) |
| 75 Years and over | 16 (6.4%) | 62 (16.5%) |
Disability Class: Ambulatory Difficulty
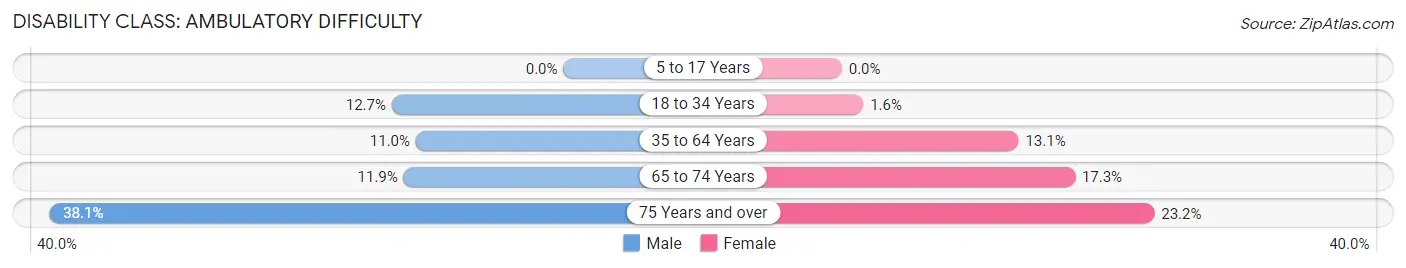
| Age Bracket | Male | Female |
| 5 to 17 Years | 0 (0.0%) | 0 (0.0%) |
| 18 to 34 Years | 67 (12.7%) | 10 (1.6%) |
| 35 to 64 Years | 143 (11.0%) | 197 (13.1%) |
| 65 to 74 Years | 53 (11.9%) | 85 (17.3%) |
| 75 Years and over | 96 (38.1%) | 87 (23.2%) |
Disability Class: Self-Care Difficulty
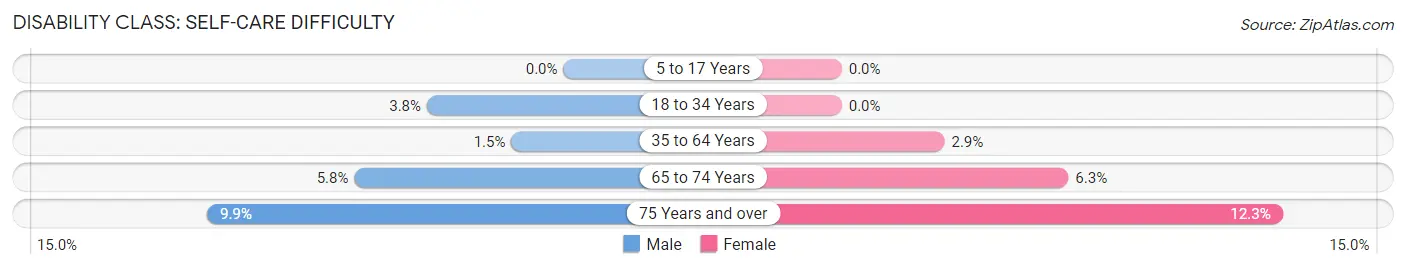
| Age Bracket | Male | Female |
| 5 to 17 Years | 0 (0.0%) | 0 (0.0%) |
| 18 to 34 Years | 20 (3.8%) | 0 (0.0%) |
| 35 to 64 Years | 19 (1.5%) | 43 (2.9%) |
| 65 to 74 Years | 26 (5.8%) | 31 (6.3%) |
| 75 Years and over | 25 (9.9%) | 46 (12.3%) |
Technology Access in Monessen
Computing Device Access in Monessen
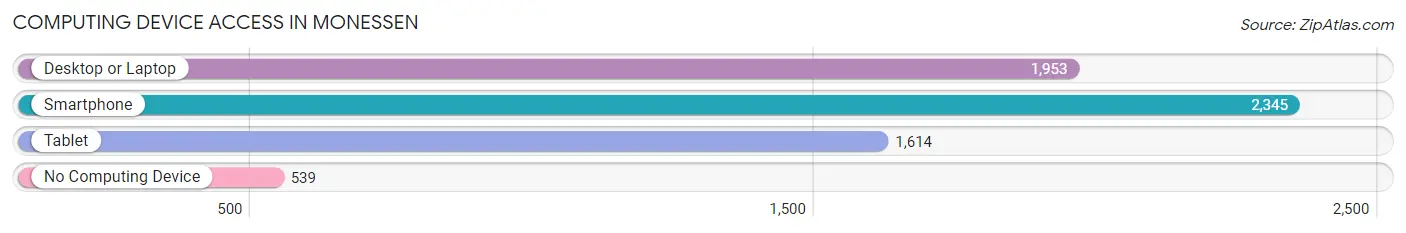
| Device Type | # Households | % Households |
| Desktop or Laptop | 1,953 | 60.4% |
| Smartphone | 2,345 | 72.5% |
| Tablet | 1,614 | 49.9% |
| No Computing Device | 539 | 16.7% |
| Total | 3,236 | 100.0% |
Internet Access in Monessen
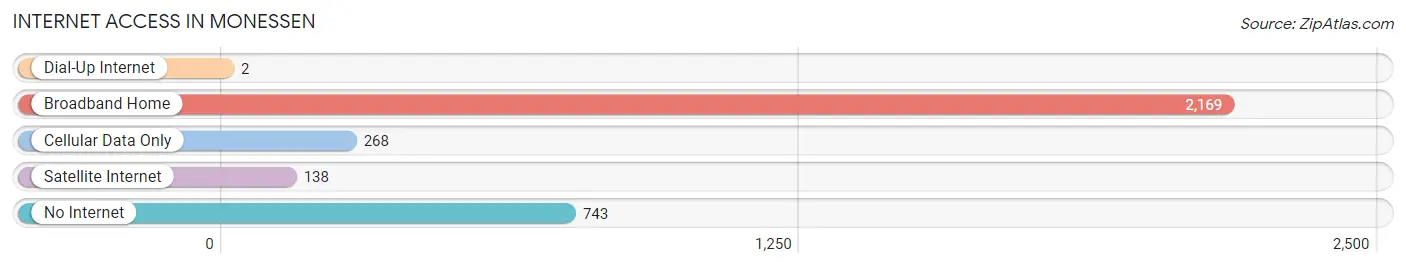
| Internet Type | # Households | % Households |
| Dial-Up Internet | 2 | 0.1% |
| Broadband Home | 2,169 | 67.0% |
| Cellular Data Only | 268 | 8.3% |
| Satellite Internet | 138 | 4.3% |
| No Internet | 743 | 23.0% |
| Total | 3,236 | 100.0% |
Monessen Summary
Monessen, Pennsylvania is a small city located in the southwestern corner of the state, in Westmoreland County. It is situated along the Monongahela River, about 25 miles south of Pittsburgh. The city has a population of approximately 7,500 people, and is part of the Pittsburgh metropolitan area.
History
Monessen was founded in 1898 by industrialist George J. McMurtry, who named the city after the Monongahela River. The city was originally intended to be a steel-producing center, and the first steel mill was built in 1901. The city quickly grew, and by 1910, the population had reached over 10,000.
The city experienced a period of growth and prosperity in the early 20th century, with the steel industry providing jobs and economic stability. However, the steel industry began to decline in the 1950s, and the city’s population began to decline as well. By the 1970s, the city had lost nearly half of its population.
In recent years, the city has experienced a resurgence, with new businesses and industries moving into the area. The city has also become a popular destination for tourists, with its historic downtown and riverfront attractions.
Geography
Monessen is located in the southwestern corner of Pennsylvania, in Westmoreland County. It is situated along the Monongahela River, about 25 miles south of Pittsburgh. The city has a total area of 2.2 square miles, all of which is land.
The city is located in a hilly region, with the highest point being the summit of Monessen Hill, which is 845 feet above sea level. The city is also located near the Youghiogheny River, which is a popular destination for fishing and boating.
Economy
Monessen’s economy is largely based on manufacturing and industry. The city is home to several steel mills, as well as other manufacturing plants. The city is also home to several retail stores, restaurants, and other businesses.
The city is also home to several educational institutions, including the Monessen City School District, Westmoreland County Community College, and the University of Pittsburgh at Greensburg.
Demographics
As of the 2010 census, Monessen had a population of 7,500 people. The racial makeup of the city was 94.3% White, 2.7% African American, 0.3% Native American, 0.3% Asian, 0.1% Pacific Islander, 0.7% from other races, and 1.6% from two or more races. Hispanic or Latino of any race were 2.2% of the population.
The median household income in Monessen was $30,938, and the median family income was $37,813. The per capita income for the city was $17,845. About 17.3% of families and 20.2% of the population were below the poverty line, including 28.3% of those under age 18 and 11.2% of those age 65 or over.
Common Questions
What is Per Capita Income in Monessen?
Per Capita income in Monessen is $30,202.
What is the Median Family Income in Monessen?
Median Family Income in Monessen is $81,940.
What is the Median Household income in Monessen?
Median Household Income in Monessen is $51,364.
What is Income or Wage Gap in Monessen?
Income or Wage Gap in Monessen is 44.8%.
Women in Monessen earn 55.2 cents for every dollar earned by a man.
What is Family Income Deficit in Monessen?
Family Income Deficit in Monessen is $16,449.
Families that are below poverty line in Monessen earn $16,449 less on average than the poverty threshold level.
What is Inequality or Gini Index in Monessen?
Inequality or Gini Index in Monessen is 0.43.
What is the Total Population of Monessen?
Total Population of Monessen is 6,876.
What is the Total Male Population of Monessen?
Total Male Population of Monessen is 3,274.
What is the Total Female Population of Monessen?
Total Female Population of Monessen is 3,602.
What is the Ratio of Males per 100 Females in Monessen?
There are 90.89 Males per 100 Females in Monessen.
What is the Ratio of Females per 100 Males in Monessen?
There are 110.02 Females per 100 Males in Monessen.
What is the Median Population Age in Monessen?
Median Population Age in Monessen is 46.9 Years.
What is the Average Family Size in Monessen
Average Family Size in Monessen is 2.8 People.
What is the Average Household Size in Monessen
Average Household Size in Monessen is 2.1 People.
How Large is the Labor Force in Monessen?
There are 3,243 People in the Labor Forcein in Monessen.
What is the Percentage of People in the Labor Force in Monessen?
56.6% of People are in the Labor Force in Monessen.
What is the Unemployment Rate in Monessen?
Unemployment Rate in Monessen is 6.5%.