Millerstown borough, PA Map & Demographics
Millerstown borough Overview
$36,790
PER CAPITA INCOME
$111,000
AVG FAMILY INCOME
$88,125
AVG HOUSEHOLD INCOME
55.2%
WAGE / INCOME GAP [ % ]
44.8¢/ $1
WAGE / INCOME GAP [ $ ]
0.33
INEQUALITY / GINI INDEX
732
TOTAL POPULATION
341
MALE POPULATION
391
FEMALE POPULATION
87.21
MALES / 100 FEMALES
114.66
FEMALES / 100 MALES
41.0
MEDIAN AGE
3.0
AVG FAMILY SIZE
2.6
AVG HOUSEHOLD SIZE
351
LABOR FORCE [ PEOPLE ]
60.9%
PERCENT IN LABOR FORCE
2.3%
UNEMPLOYMENT RATE
Income in Millerstown borough
Income Overview in Millerstown borough
Per Capita Income in Millerstown borough is $36,790, while median incomes of families and households are $111,000 and $88,125 respectively.
| Characteristic | Number | Measure |
| Per Capita Income | 732 | $36,790 |
| Median Family Income | 206 | $111,000 |
| Mean Family Income | 206 | $108,524 |
| Median Household Income | 279 | $88,125 |
| Mean Household Income | 279 | $93,619 |
| Income Deficit | 206 | $0 |
| Wage / Income Gap (%) | 732 | 55.19% |
| Wage / Income Gap ($) | 732 | 44.81¢ per $1 |
| Gini / Inequality Index | 732 | 0.33 |
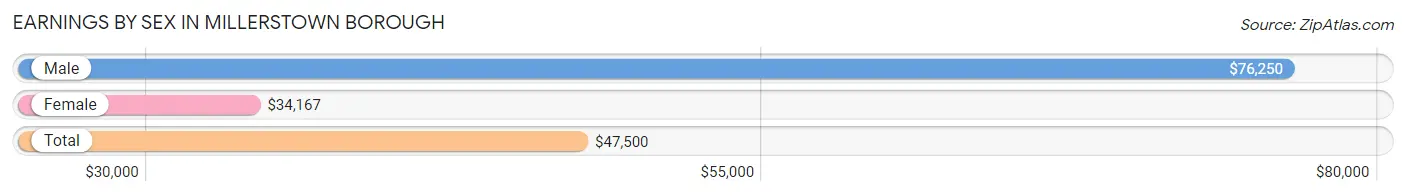
Earnings by Sex in Millerstown borough
Average Earnings in Millerstown borough are $47,500, $76,250 for men and $34,167 for women, a difference of 55.2%.
| Sex | Number | Average Earnings |
| Male | 218 (57.1%) | $76,250 |
| Female | 164 (42.9%) | $34,167 |
| Total | 382 (100.0%) | $47,500 |
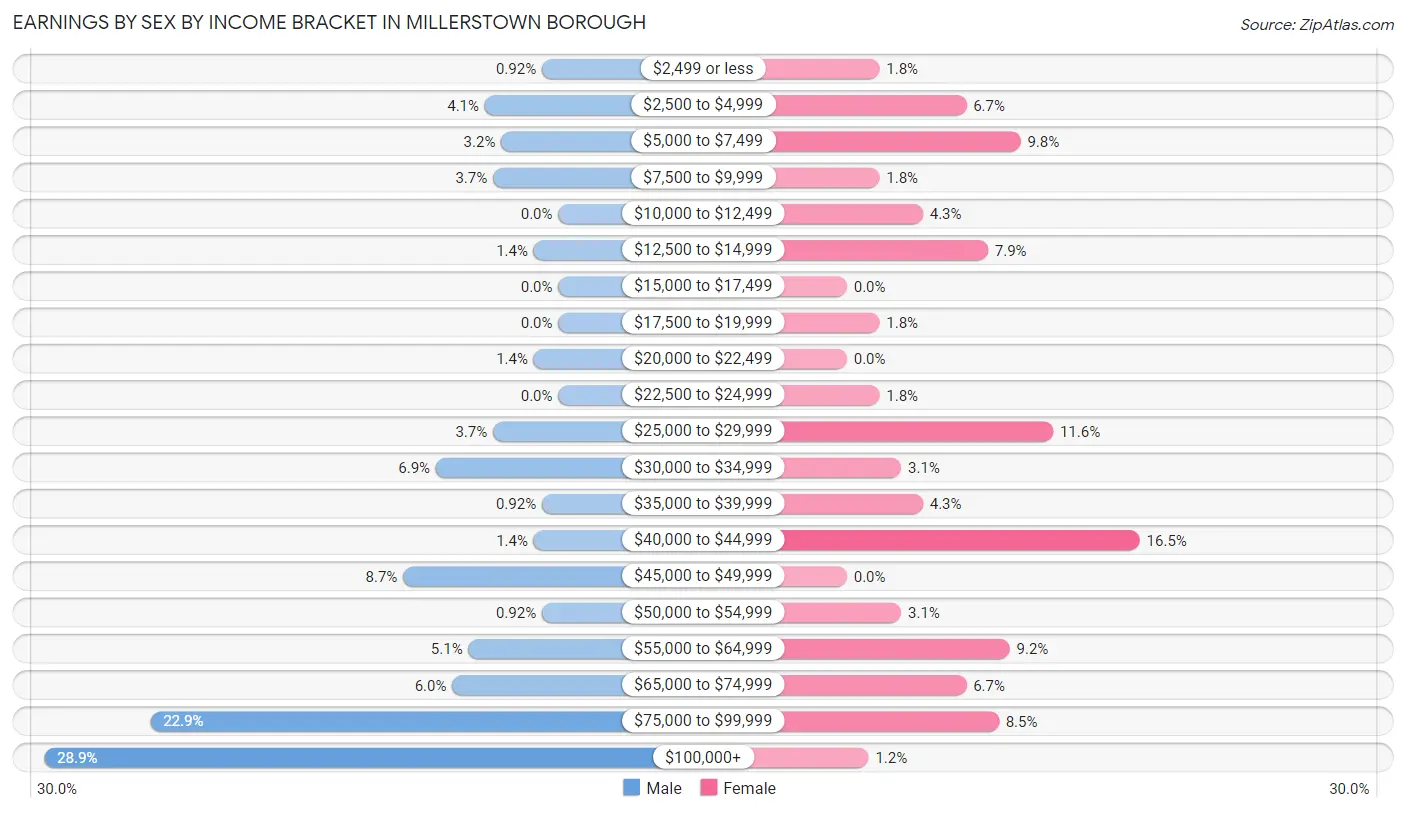
Earnings by Sex by Income Bracket in Millerstown borough
The most common earnings brackets in Millerstown borough are $100,000+ for men (63 | 28.9%) and $40,000 to $44,999 for women (27 | 16.5%).
| Income | Male | Female |
| $2,499 or less | 2 (0.9%) | 3 (1.8%) |
| $2,500 to $4,999 | 9 (4.1%) | 11 (6.7%) |
| $5,000 to $7,499 | 7 (3.2%) | 16 (9.8%) |
| $7,500 to $9,999 | 8 (3.7%) | 3 (1.8%) |
| $10,000 to $12,499 | 0 (0.0%) | 7 (4.3%) |
| $12,500 to $14,999 | 3 (1.4%) | 13 (7.9%) |
| $15,000 to $17,499 | 0 (0.0%) | 0 (0.0%) |
| $17,500 to $19,999 | 0 (0.0%) | 3 (1.8%) |
| $20,000 to $22,499 | 3 (1.4%) | 0 (0.0%) |
| $22,500 to $24,999 | 0 (0.0%) | 3 (1.8%) |
| $25,000 to $29,999 | 8 (3.7%) | 19 (11.6%) |
| $30,000 to $34,999 | 15 (6.9%) | 5 (3.0%) |
| $35,000 to $39,999 | 2 (0.9%) | 7 (4.3%) |
| $40,000 to $44,999 | 3 (1.4%) | 27 (16.5%) |
| $45,000 to $49,999 | 19 (8.7%) | 0 (0.0%) |
| $50,000 to $54,999 | 2 (0.9%) | 5 (3.0%) |
| $55,000 to $64,999 | 11 (5.1%) | 15 (9.1%) |
| $65,000 to $74,999 | 13 (6.0%) | 11 (6.7%) |
| $75,000 to $99,999 | 50 (22.9%) | 14 (8.5%) |
| $100,000+ | 63 (28.9%) | 2 (1.2%) |
| Total | 218 (100.0%) | 164 (100.0%) |
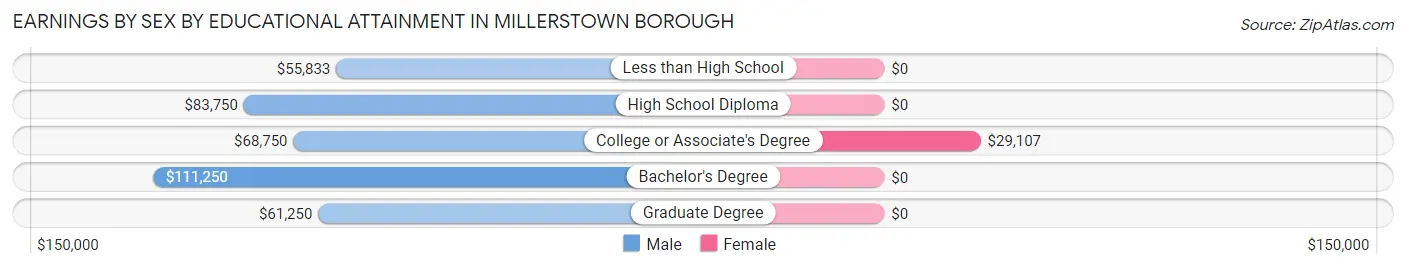
Earnings by Sex by Educational Attainment in Millerstown borough
Average earnings in Millerstown borough are $84,844 for men and $40,682 for women, a difference of 52.0%. Men with an educational attainment of bachelor's degree enjoy the highest average annual earnings of $111,250, while those with less than high school education earn the least with $55,833. Women with an educational attainment of college or associate's degree earn the most with the average annual earnings of $29,107, while those with college or associate's degree education have the smallest earnings of $29,107.
| Educational Attainment | Male Income | Female Income |
| Less than High School | $55,833 | $0 |
| High School Diploma | $83,750 | $0 |
| College or Associate's Degree | $68,750 | $29,107 |
| Bachelor's Degree | $111,250 | $0 |
| Graduate Degree | $61,250 | $0 |
| Total | $84,844 | $40,682 |
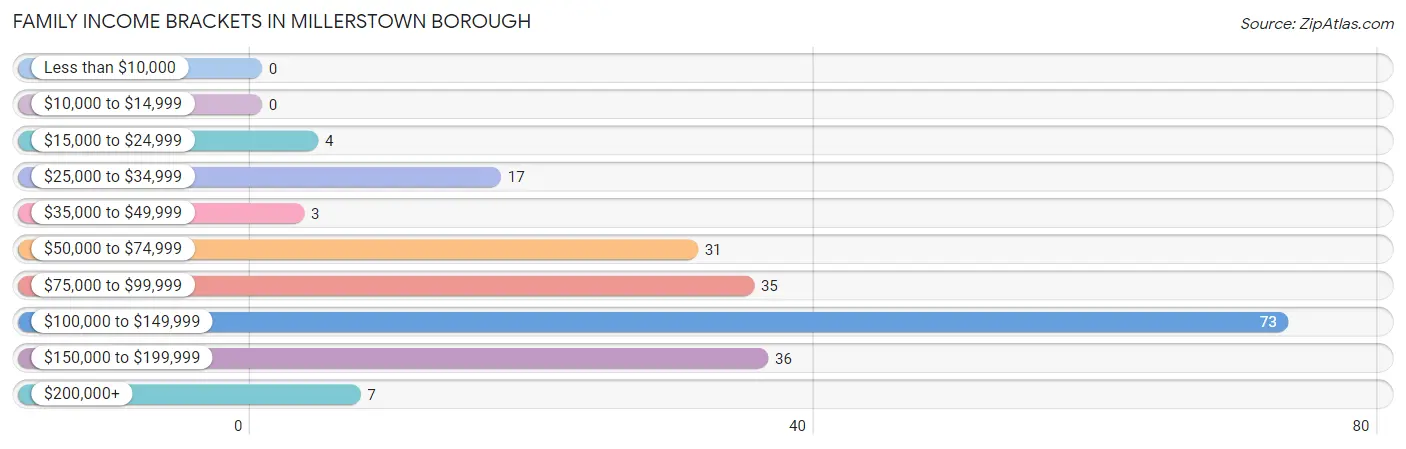
Family Income in Millerstown borough
Family Income Brackets in Millerstown borough
According to the Millerstown borough family income data, there are 73 families falling into the $100,000 to $149,999 income range, which is the most common income bracket and makes up 35.4% of all families.
| Income Bracket | # Families | % Families |
| Less than $10,000 | 0 | 0.0% |
| $10,000 to $14,999 | 0 | 0.0% |
| $15,000 to $24,999 | 4 | 1.9% |
| $25,000 to $34,999 | 17 | 8.3% |
| $35,000 to $49,999 | 3 | 1.5% |
| $50,000 to $74,999 | 31 | 15.0% |
| $75,000 to $99,999 | 35 | 17.0% |
| $100,000 to $149,999 | 73 | 35.4% |
| $150,000 to $199,999 | 36 | 17.5% |
| $200,000+ | 7 | 3.4% |
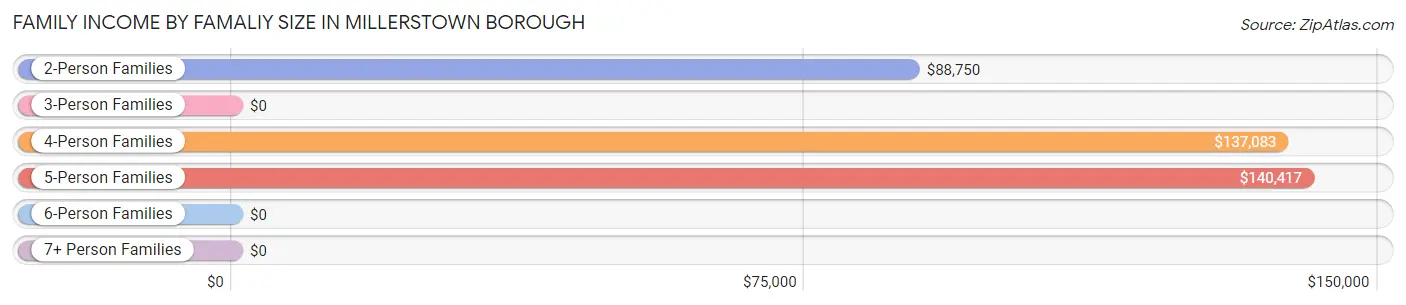
Family Income by Famaliy Size in Millerstown borough
5-person families (18 | 8.7%) account for the highest median family income in Millerstown borough with $140,417 per family, while 2-person families (103 | 50.0%) have the highest median income of $44,375 per family member.
| Income Bracket | # Families | Median Income |
| 2-Person Families | 103 (50.0%) | $88,750 |
| 3-Person Families | 12 (5.8%) | $0 |
| 4-Person Families | 61 (29.6%) | $137,083 |
| 5-Person Families | 18 (8.7%) | $140,417 |
| 6-Person Families | 8 (3.9%) | $0 |
| 7+ Person Families | 4 (1.9%) | $0 |
| Total | 206 (100.0%) | $111,000 |
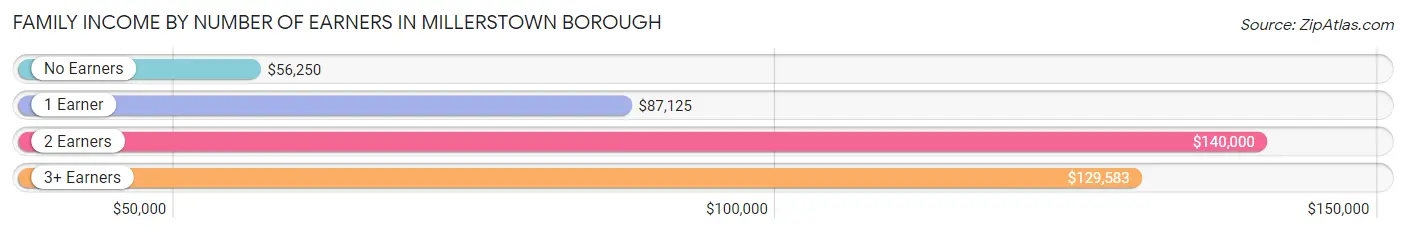
Family Income by Number of Earners in Millerstown borough
The median family income in Millerstown borough is $111,000, with families comprising 2 earners (74) having the highest median family income of $140,000, while families with no earners (22) have the lowest median family income of $56,250, accounting for 35.9% and 10.7% of families, respectively.
| Number of Earners | # Families | Median Income |
| No Earners | 22 (10.7%) | $56,250 |
| 1 Earner | 87 (42.2%) | $87,125 |
| 2 Earners | 74 (35.9%) | $140,000 |
| 3+ Earners | 23 (11.2%) | $129,583 |
| Total | 206 (100.0%) | $111,000 |
Household Income in Millerstown borough
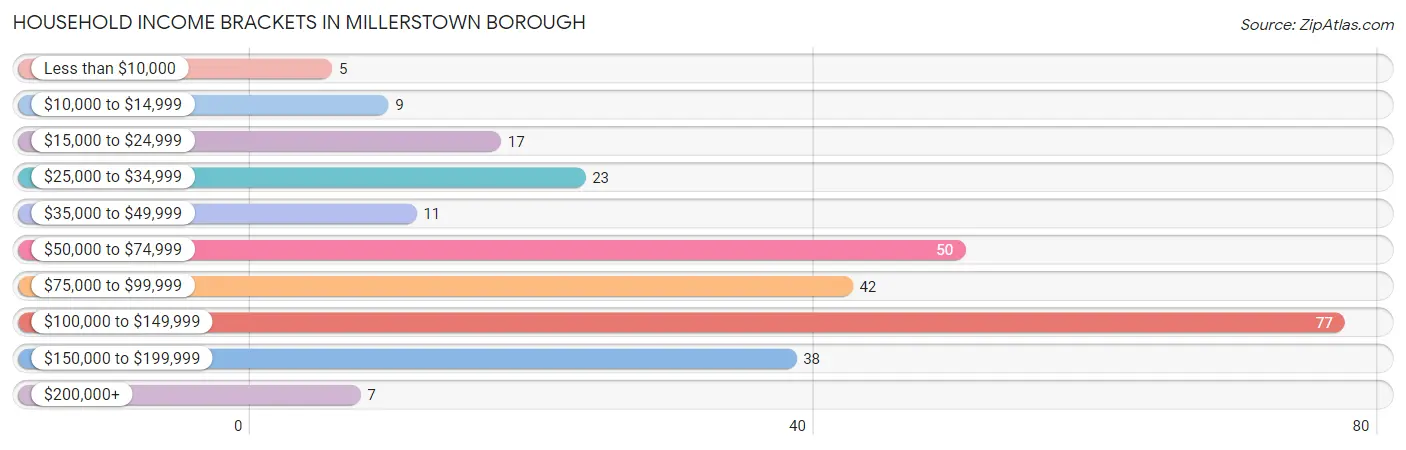
Household Income Brackets in Millerstown borough
With 77 households falling in the category, the $100,000 to $149,999 income range is the most frequent in Millerstown borough, accounting for 27.6% of all households. In contrast, only 5 households (1.8%) fall into the less than $10,000 income bracket, making it the least populous group.
| Income Bracket | # Households | % Households |
| Less than $10,000 | 5 | 1.8% |
| $10,000 to $14,999 | 9 | 3.2% |
| $15,000 to $24,999 | 17 | 6.1% |
| $25,000 to $34,999 | 23 | 8.2% |
| $35,000 to $49,999 | 11 | 3.9% |
| $50,000 to $74,999 | 50 | 17.9% |
| $75,000 to $99,999 | 42 | 15.1% |
| $100,000 to $149,999 | 77 | 27.6% |
| $150,000 to $199,999 | 38 | 13.6% |
| $200,000+ | 7 | 2.5% |
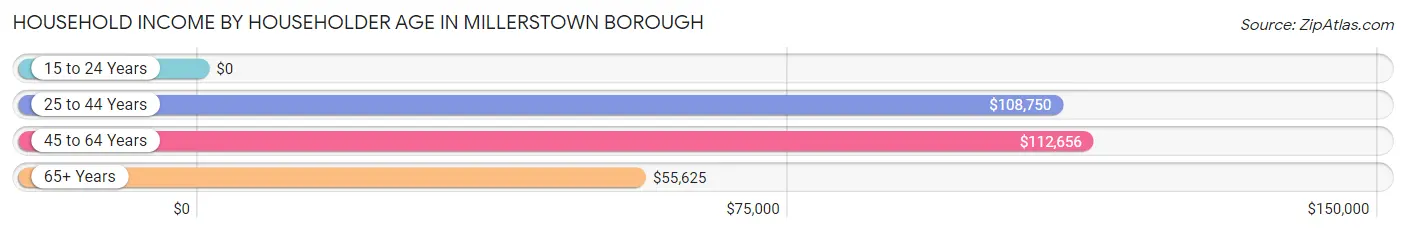
Household Income by Householder Age in Millerstown borough
The median household income in Millerstown borough is $88,125, with the highest median household income of $112,656 found in the 45 to 64 years age bracket for the primary householder. A total of 107 households (38.4%) fall into this category.
| Income Bracket | # Households | Median Income |
| 15 to 24 Years | 0 (0.0%) | $0 |
| 25 to 44 Years | 82 (29.4%) | $108,750 |
| 45 to 64 Years | 107 (38.4%) | $112,656 |
| 65+ Years | 90 (32.3%) | $55,625 |
| Total | 279 (100.0%) | $88,125 |
Poverty in Millerstown borough
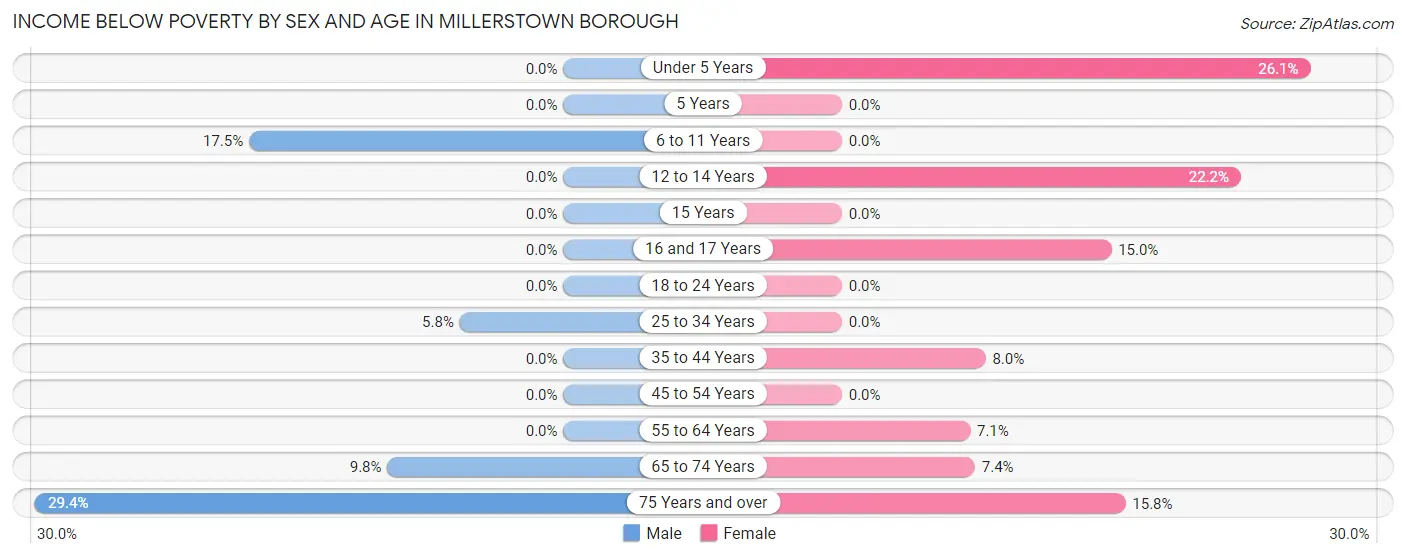
Income Below Poverty by Sex and Age in Millerstown borough
With 5.9% poverty level for males and 6.9% for females among the residents of Millerstown borough, 75 year old and over males and under 5 year old females are the most vulnerable to poverty, with 5 males (29.4%) and 6 females (26.1%) in their respective age groups living below the poverty level.
| Age Bracket | Male | Female |
| Under 5 Years | 0 (0.0%) | 6 (26.1%) |
| 5 Years | 0 (0.0%) | 0 (0.0%) |
| 6 to 11 Years | 7 (17.5%) | 0 (0.0%) |
| 12 to 14 Years | 0 (0.0%) | 4 (22.2%) |
| 15 Years | 0 (0.0%) | 0 (0.0%) |
| 16 and 17 Years | 0 (0.0%) | 3 (15.0%) |
| 18 to 24 Years | 0 (0.0%) | 0 (0.0%) |
| 25 to 34 Years | 3 (5.8%) | 0 (0.0%) |
| 35 to 44 Years | 0 (0.0%) | 4 (8.0%) |
| 45 to 54 Years | 0 (0.0%) | 0 (0.0%) |
| 55 to 64 Years | 0 (0.0%) | 2 (7.1%) |
| 65 to 74 Years | 5 (9.8%) | 4 (7.4%) |
| 75 Years and over | 5 (29.4%) | 3 (15.8%) |
| Total | 20 (5.9%) | 26 (6.9%) |
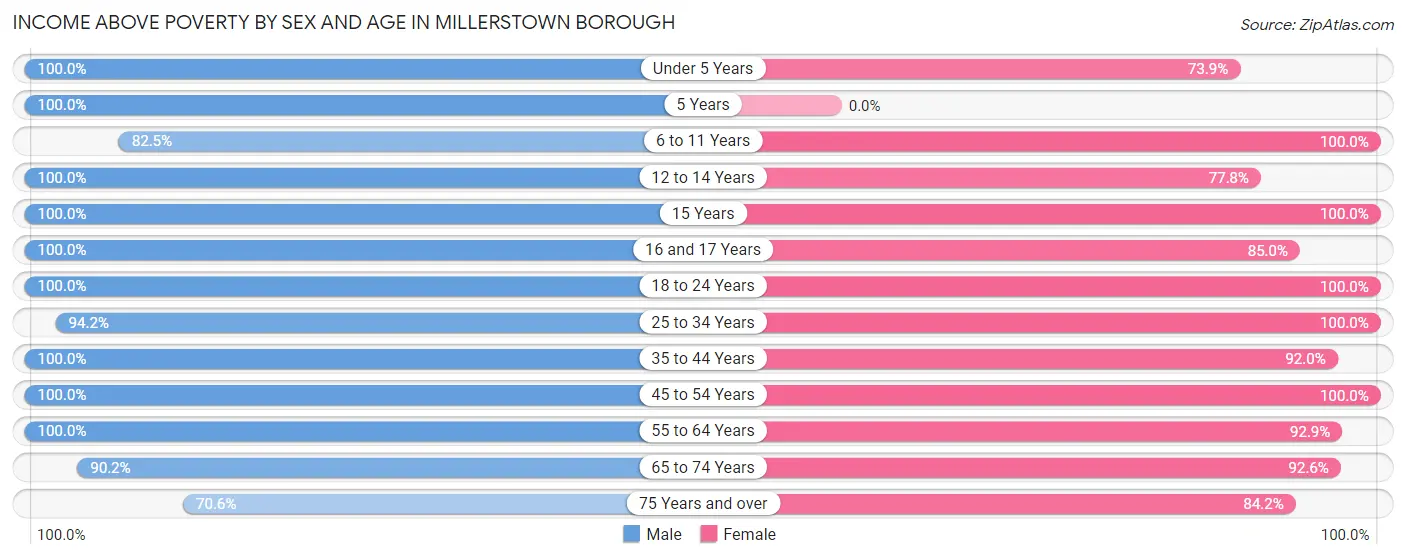
Income Above Poverty by Sex and Age in Millerstown borough
According to the poverty statistics in Millerstown borough, males aged under 5 years and females aged 6 to 11 years are the age groups that are most secure financially, with 100.0% of males and 100.0% of females in these age groups living above the poverty line.
| Age Bracket | Male | Female |
| Under 5 Years | 14 (100.0%) | 17 (73.9%) |
| 5 Years | 2 (100.0%) | 0 (0.0%) |
| 6 to 11 Years | 33 (82.5%) | 21 (100.0%) |
| 12 to 14 Years | 10 (100.0%) | 14 (77.8%) |
| 15 Years | 2 (100.0%) | 10 (100.0%) |
| 16 and 17 Years | 7 (100.0%) | 17 (85.0%) |
| 18 to 24 Years | 26 (100.0%) | 24 (100.0%) |
| 25 to 34 Years | 49 (94.2%) | 35 (100.0%) |
| 35 to 44 Years | 25 (100.0%) | 46 (92.0%) |
| 45 to 54 Years | 42 (100.0%) | 73 (100.0%) |
| 55 to 64 Years | 53 (100.0%) | 26 (92.9%) |
| 65 to 74 Years | 46 (90.2%) | 50 (92.6%) |
| 75 Years and over | 12 (70.6%) | 16 (84.2%) |
| Total | 321 (94.1%) | 349 (93.1%) |
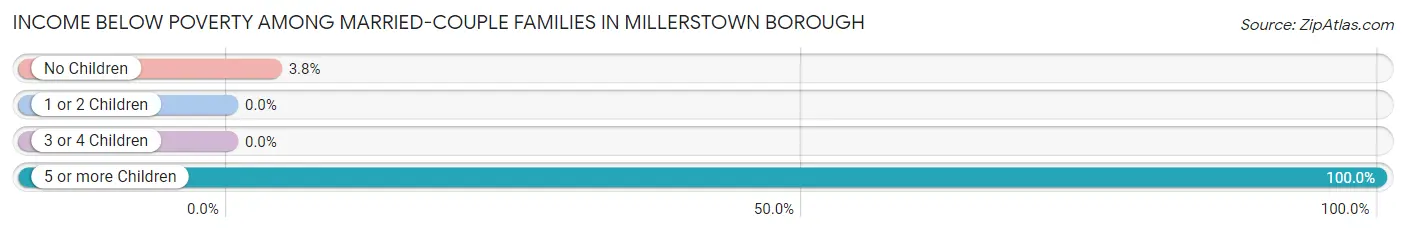
Income Below Poverty Among Married-Couple Families in Millerstown borough
The poverty statistics for married-couple families in Millerstown borough show that 4.3% or 7 of the total 163 families live below the poverty line. Families with 5 or more children have the highest poverty rate of 100.0%, comprising of 4 families. On the other hand, families with 1 or 2 children have the lowest poverty rate of 0.0%, which includes 0 families.
| Children | Above Poverty | Below Poverty |
| No Children | 76 (96.2%) | 3 (3.8%) |
| 1 or 2 Children | 67 (100.0%) | 0 (0.0%) |
| 3 or 4 Children | 13 (100.0%) | 0 (0.0%) |
| 5 or more Children | 0 (0.0%) | 4 (100.0%) |
| Total | 156 (95.7%) | 7 (4.3%) |
Income Below Poverty Among Single-Parent Households in Millerstown borough
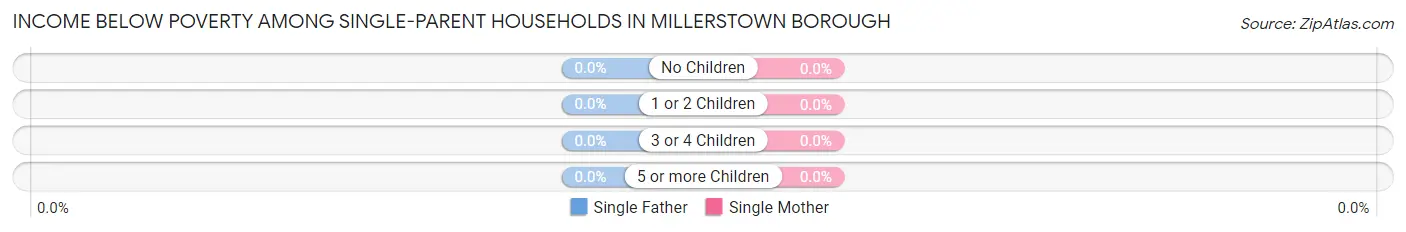
| Children | Single Father | Single Mother |
| No Children | 0 (0.0%) | 0 (0.0%) |
| 1 or 2 Children | 0 (0.0%) | 0 (0.0%) |
| 3 or 4 Children | 0 (0.0%) | 0 (0.0%) |
| 5 or more Children | 0 (0.0%) | 0 (0.0%) |
| Total | 0 (0.0%) | 0 (0.0%) |
Income Below Poverty Among Married-Couple vs Single-Parent Households in Millerstown borough
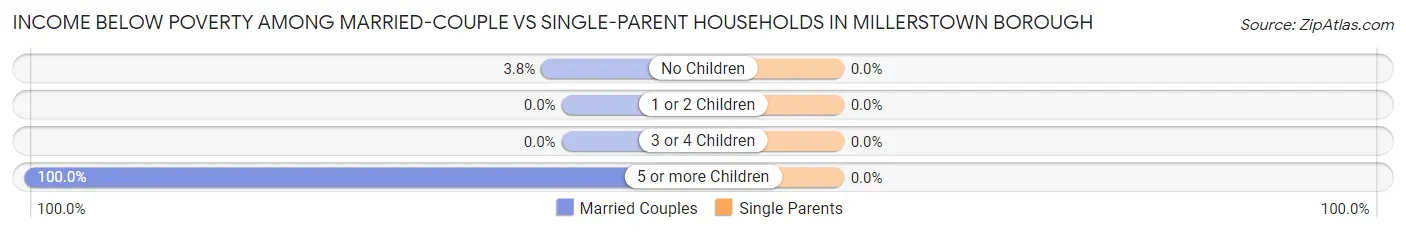
| Children | Married-Couple Families | Single-Parent Households |
| No Children | 3 (3.8%) | 0 (0.0%) |
| 1 or 2 Children | 0 (0.0%) | 0 (0.0%) |
| 3 or 4 Children | 0 (0.0%) | 0 (0.0%) |
| 5 or more Children | 4 (100.0%) | 0 (0.0%) |
| Total | 7 (4.3%) | 0 (0.0%) |
Race in Millerstown borough
The most populous races in Millerstown borough are White / Caucasian (700 | 95.6%), Hispanic or Latino (37 | 5.1%), and Two or more Races (23 | 3.1%).
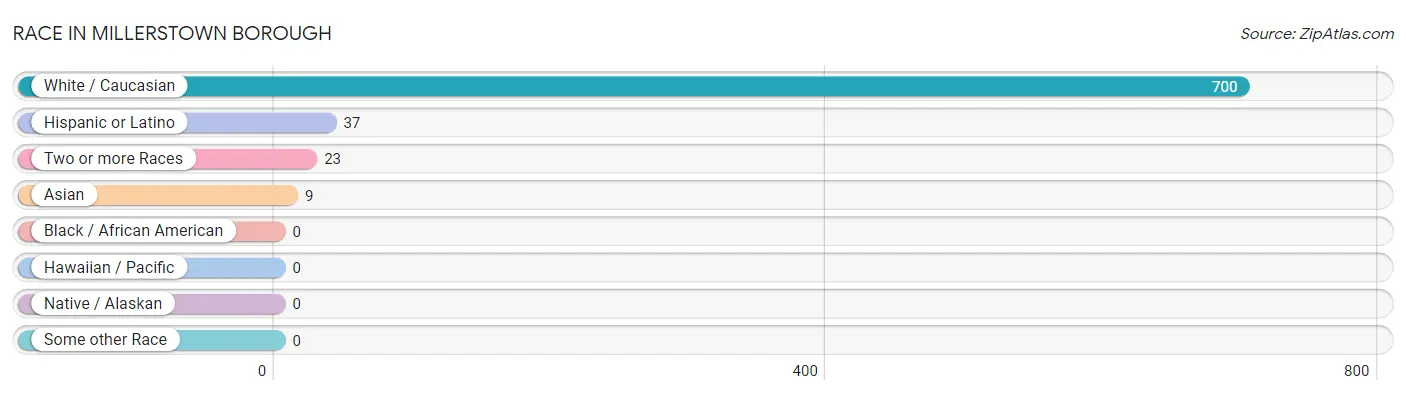
| Race | # Population | % Population |
| Asian | 9 | 1.2% |
| Black / African American | 0 | 0.0% |
| Hawaiian / Pacific | 0 | 0.0% |
| Hispanic or Latino | 37 | 5.1% |
| Native / Alaskan | 0 | 0.0% |
| White / Caucasian | 700 | 95.6% |
| Two or more Races | 23 | 3.1% |
| Some other Race | 0 | 0.0% |
| Total | 732 | 100.0% |
Ancestry in Millerstown borough
The most populous ancestries reported in Millerstown borough are German (331 | 45.2%), English (112 | 15.3%), Irish (96 | 13.1%), American (44 | 6.0%), and Pennsylvania German (30 | 4.1%), together accounting for 83.7% of all Millerstown borough residents.
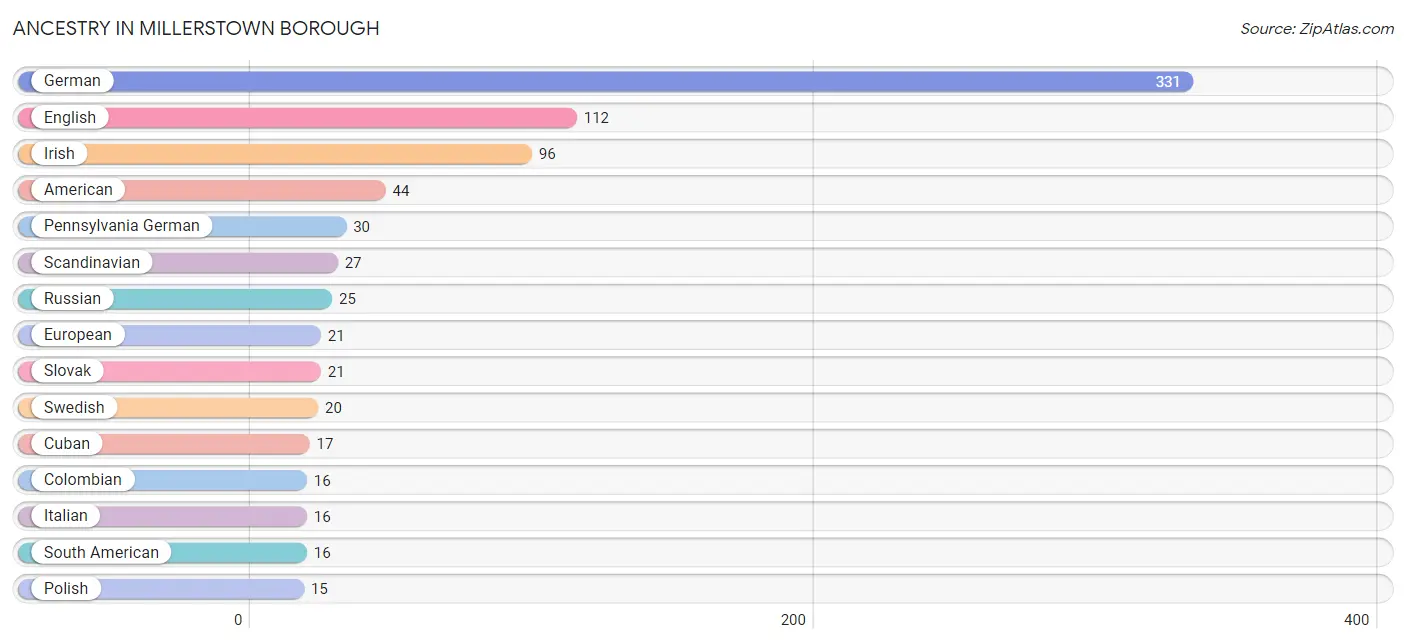
| Ancestry | # Population | % Population |
| American | 44 | 6.0% |
| British | 2 | 0.3% |
| Colombian | 16 | 2.2% |
| Cuban | 17 | 2.3% |
| Dutch | 9 | 1.2% |
| Eastern European | 4 | 0.5% |
| English | 112 | 15.3% |
| European | 21 | 2.9% |
| French | 10 | 1.4% |
| German | 331 | 45.2% |
| Hungarian | 3 | 0.4% |
| Indian (Asian) | 9 | 1.2% |
| Irish | 96 | 13.1% |
| Italian | 16 | 2.2% |
| Korean | 1 | 0.1% |
| Lithuanian | 2 | 0.3% |
| Pennsylvania German | 30 | 4.1% |
| Polish | 15 | 2.1% |
| Puerto Rican | 1 | 0.1% |
| Russian | 25 | 3.4% |
| Scandinavian | 27 | 3.7% |
| Scotch-Irish | 7 | 1.0% |
| Scottish | 1 | 0.1% |
| Slovak | 21 | 2.9% |
| South American | 16 | 2.2% |
| Swedish | 20 | 2.7% |
| Swiss | 8 | 1.1% |
| Ukrainian | 3 | 0.4% |
| Welsh | 3 | 0.4% | View All 29 Rows |
Immigrants in Millerstown borough
The most numerous immigrant groups reported in Millerstown borough came from Asia (9 | 1.2%), China (9 | 1.2%), Eastern Asia (9 | 1.2%), Europe (3 | 0.4%), and Germany (3 | 0.4%), together accounting for 4.5% of all Millerstown borough residents.
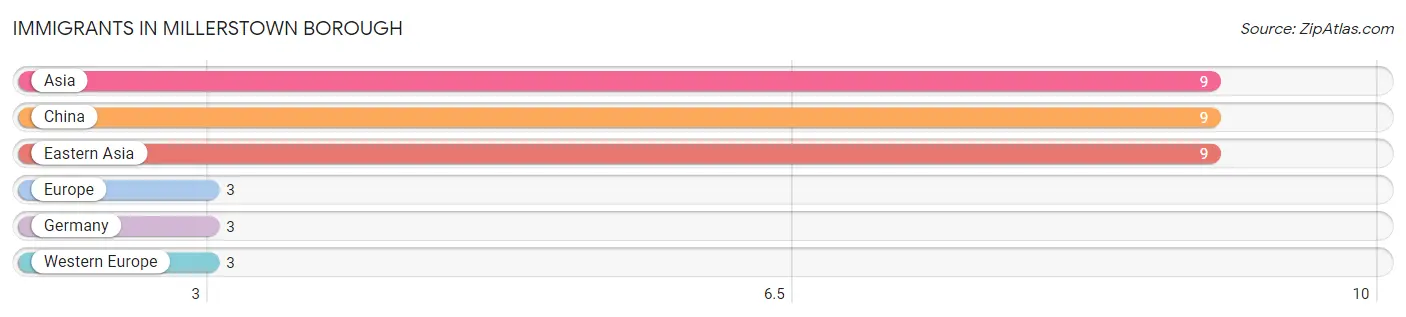
| Immigration Origin | # Population | % Population |
| Asia | 9 | 1.2% |
| China | 9 | 1.2% |
| Eastern Asia | 9 | 1.2% |
| Europe | 3 | 0.4% |
| Germany | 3 | 0.4% |
| Western Europe | 3 | 0.4% | View All 6 Rows |
Sex and Age in Millerstown borough
Sex and Age in Millerstown borough
The most populous age groups in Millerstown borough are 30 to 34 Years (39 | 11.4%) for men and 50 to 54 Years (60 | 15.3%) for women.
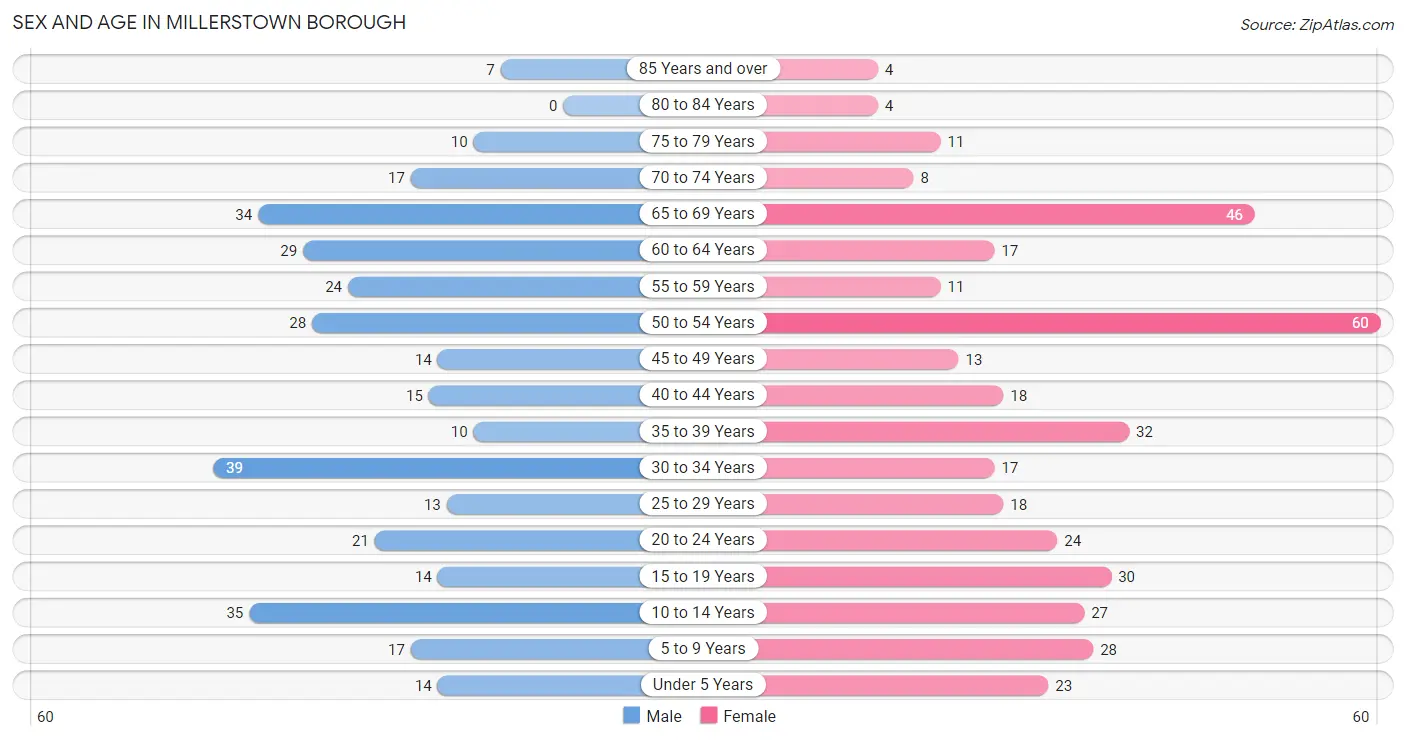
| Age Bracket | Male | Female |
| Under 5 Years | 14 (4.1%) | 23 (5.9%) |
| 5 to 9 Years | 17 (5.0%) | 28 (7.2%) |
| 10 to 14 Years | 35 (10.3%) | 27 (6.9%) |
| 15 to 19 Years | 14 (4.1%) | 30 (7.7%) |
| 20 to 24 Years | 21 (6.2%) | 24 (6.1%) |
| 25 to 29 Years | 13 (3.8%) | 18 (4.6%) |
| 30 to 34 Years | 39 (11.4%) | 17 (4.3%) |
| 35 to 39 Years | 10 (2.9%) | 32 (8.2%) |
| 40 to 44 Years | 15 (4.4%) | 18 (4.6%) |
| 45 to 49 Years | 14 (4.1%) | 13 (3.3%) |
| 50 to 54 Years | 28 (8.2%) | 60 (15.3%) |
| 55 to 59 Years | 24 (7.0%) | 11 (2.8%) |
| 60 to 64 Years | 29 (8.5%) | 17 (4.3%) |
| 65 to 69 Years | 34 (10.0%) | 46 (11.8%) |
| 70 to 74 Years | 17 (5.0%) | 8 (2.1%) |
| 75 to 79 Years | 10 (2.9%) | 11 (2.8%) |
| 80 to 84 Years | 0 (0.0%) | 4 (1.0%) |
| 85 Years and over | 7 (2.1%) | 4 (1.0%) |
| Total | 341 (100.0%) | 391 (100.0%) |
Families and Households in Millerstown borough
Median Family Size in Millerstown borough
The median family size in Millerstown borough is 3.00 persons per family, with married-couple families (163 | 79.1%) accounting for the largest median family size of 3.14 persons per family. On the other hand, single male/father families (18 | 8.7%) represent the smallest median family size with 2.17 persons per family.
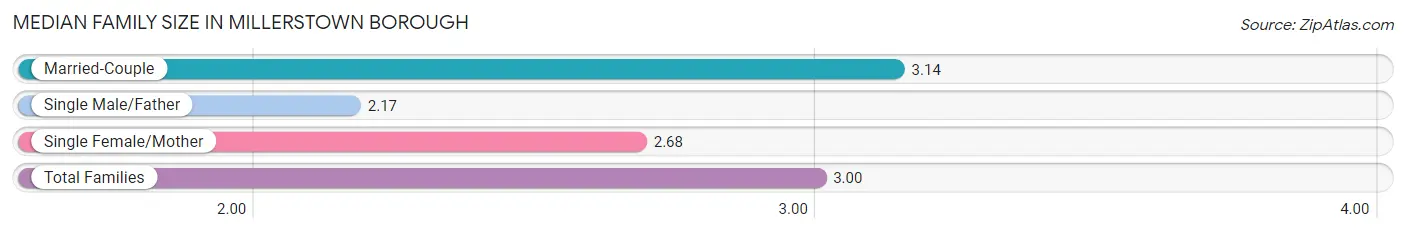
| Family Type | # Families | Family Size |
| Married-Couple | 163 (79.1%) | 3.14 |
| Single Male/Father | 18 (8.7%) | 2.17 |
| Single Female/Mother | 25 (12.1%) | 2.68 |
| Total Families | 206 (100.0%) | 3.00 |
Median Household Size in Millerstown borough
The median household size in Millerstown borough is 2.62 persons per household, with single female/mother households (25 | 9.0%) accounting for the largest median household size of 3.32 persons per household. non-family households (73 | 26.2%) represent the smallest median household size with 1.30 persons per household.
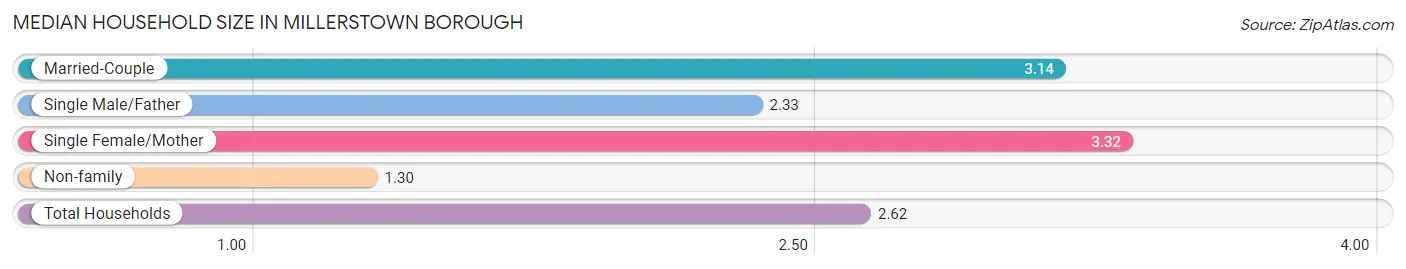
| Household Type | # Households | Household Size |
| Married-Couple | 163 (58.4%) | 3.14 |
| Single Male/Father | 18 (6.5%) | 2.33 |
| Single Female/Mother | 25 (9.0%) | 3.32 |
| Non-family | 73 (26.2%) | 1.30 |
| Total Households | 279 (100.0%) | 2.62 |
Household Size by Marriage Status in Millerstown borough
Out of a total of 279 households in Millerstown borough, 206 (73.8%) are family households, while 73 (26.2%) are nonfamily households. The most numerous type of family households are 2-person households, comprising 98, and the most common type of nonfamily households are 1-person households, comprising 66.
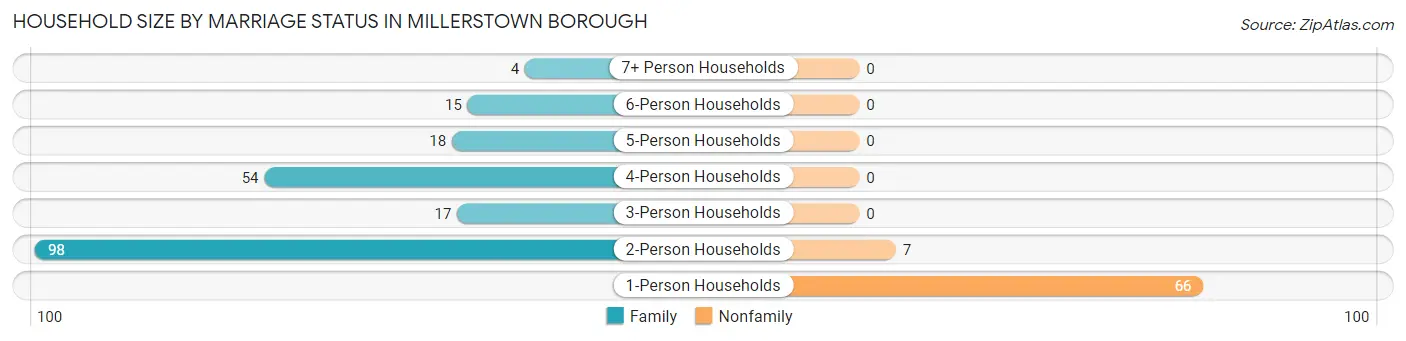
| Household Size | Family Households | Nonfamily Households |
| 1-Person Households | - | 66 (23.7%) |
| 2-Person Households | 98 (35.1%) | 7 (2.5%) |
| 3-Person Households | 17 (6.1%) | 0 (0.0%) |
| 4-Person Households | 54 (19.4%) | 0 (0.0%) |
| 5-Person Households | 18 (6.5%) | 0 (0.0%) |
| 6-Person Households | 15 (5.4%) | 0 (0.0%) |
| 7+ Person Households | 4 (1.4%) | 0 (0.0%) |
| Total | 206 (73.8%) | 73 (26.2%) |
Female Fertility in Millerstown borough
Fertility by Age in Millerstown borough
Average fertility rate in Millerstown borough is 35.0 births per 1,000 women. Women in the age bracket of 35 to 50 years have the highest fertility rate with 71.0 births per 1,000 women. Women in the age bracket of 35 to 50 years acount for 100.0% of all women with births.
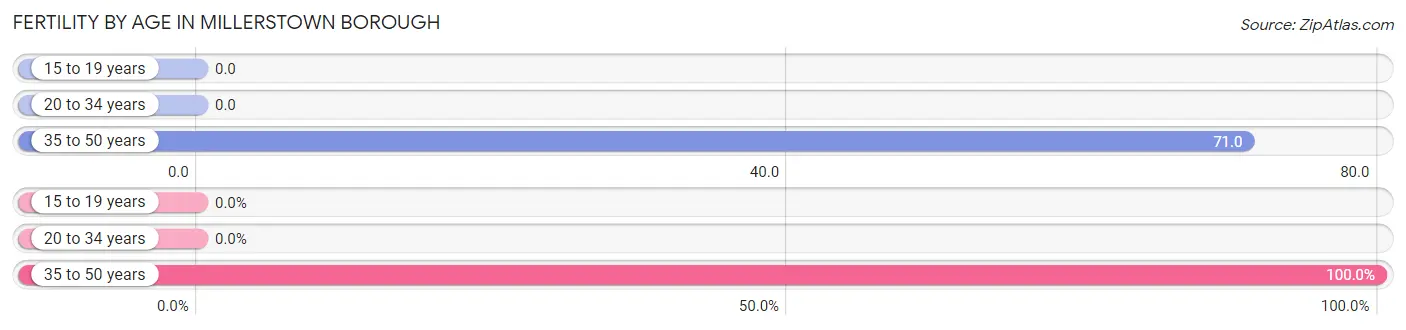
| Age Bracket | Women with Births | Births / 1,000 Women |
| 15 to 19 years | 0 (0.0%) | 0.0 |
| 20 to 34 years | 0 (0.0%) | 0.0 |
| 35 to 50 years | 6 (100.0%) | 71.0 |
| Total | 6 (100.0%) | 35.0 |
Fertility by Age by Marriage Status in Millerstown borough
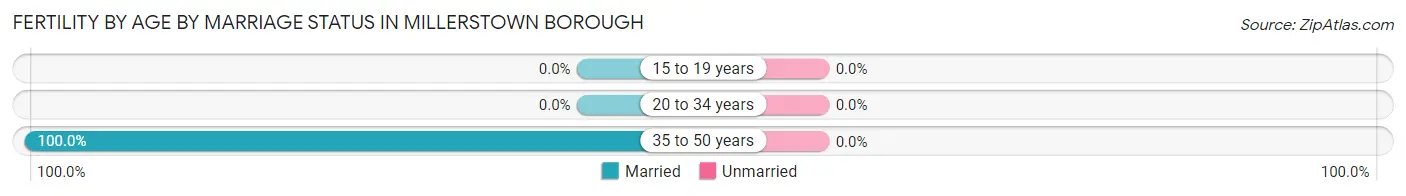
| Age Bracket | Married | Unmarried |
| 15 to 19 years | 0 (0.0%) | 0 (0.0%) |
| 20 to 34 years | 0 (0.0%) | 0 (0.0%) |
| 35 to 50 years | 6 (100.0%) | 0 (0.0%) |
| Total | 6 (100.0%) | 0 (0.0%) |
Fertility by Education in Millerstown borough
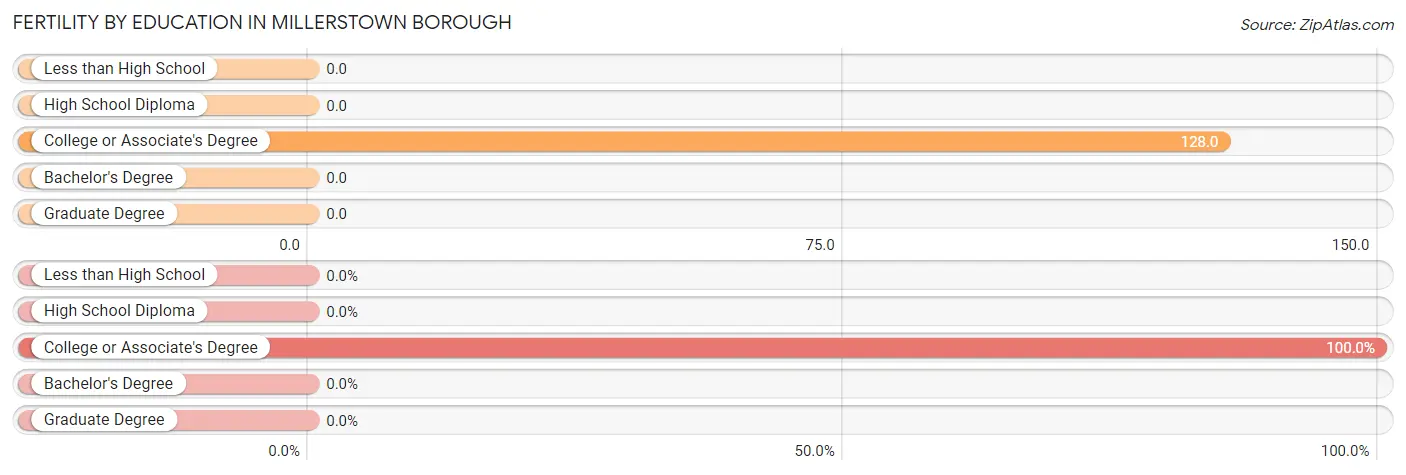
| Educational Attainment | Women with Births | Births / 1,000 Women |
| Less than High School | 0 (0.0%) | 0.0 |
| High School Diploma | 0 (0.0%) | 0.0 |
| College or Associate's Degree | 6 (100.0%) | 128.0 |
| Bachelor's Degree | 0 (0.0%) | 0.0 |
| Graduate Degree | 0 (0.0%) | 0.0 |
| Total | 6 (100.0%) | 35.0 |
Fertility by Education by Marriage Status in Millerstown borough
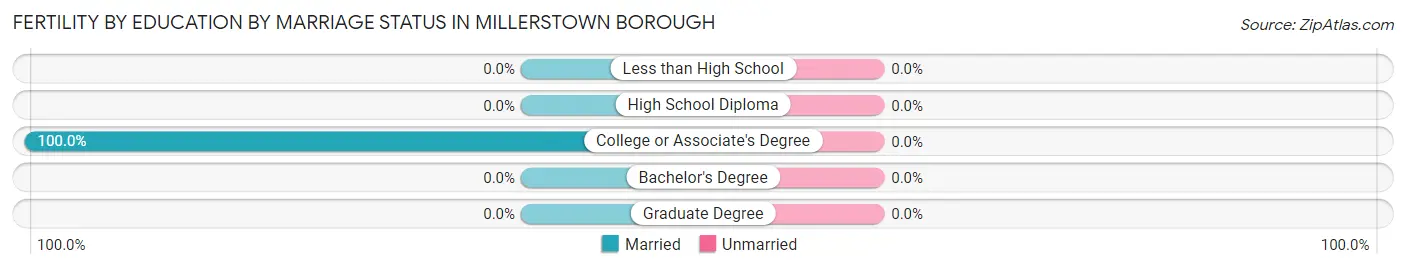
| Educational Attainment | Married | Unmarried |
| Less than High School | 0 (0.0%) | 0 (0.0%) |
| High School Diploma | 0 (0.0%) | 0 (0.0%) |
| College or Associate's Degree | 6 (100.0%) | 0 (0.0%) |
| Bachelor's Degree | 0 (0.0%) | 0 (0.0%) |
| Graduate Degree | 0 (0.0%) | 0 (0.0%) |
| Total | 6 (100.0%) | 0 (0.0%) |
Employment Characteristics in Millerstown borough
Employment by Class of Employer in Millerstown borough
Among the 343 employed individuals in Millerstown borough, private company employees (205 | 59.8%), state government employees (46 | 13.4%), and not-for-profit organizations (38 | 11.1%) make up the most common classes of employment.
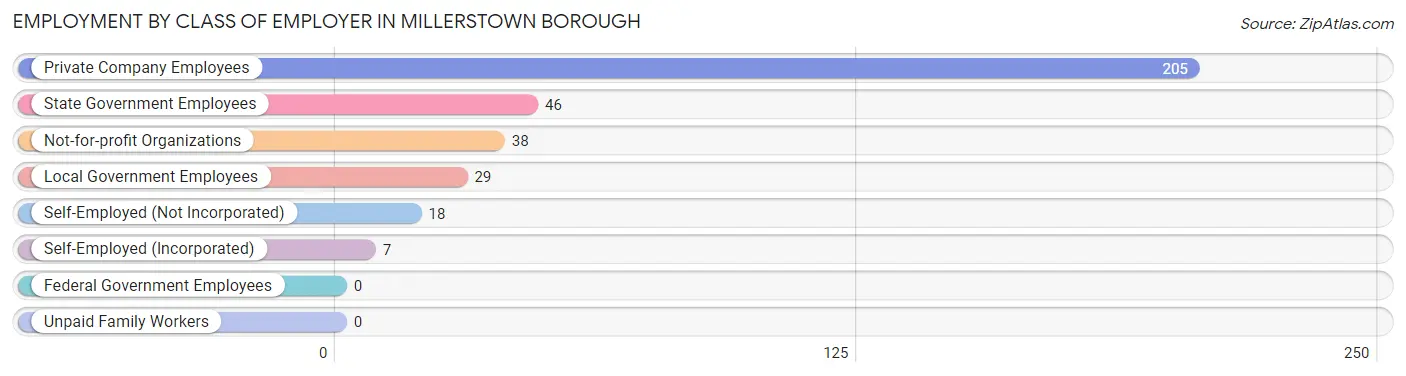
| Employer Class | # Employees | % Employees |
| Private Company Employees | 205 | 59.8% |
| Self-Employed (Incorporated) | 7 | 2.0% |
| Self-Employed (Not Incorporated) | 18 | 5.2% |
| Not-for-profit Organizations | 38 | 11.1% |
| Local Government Employees | 29 | 8.5% |
| State Government Employees | 46 | 13.4% |
| Federal Government Employees | 0 | 0.0% |
| Unpaid Family Workers | 0 | 0.0% |
| Total | 343 | 100.0% |
Employment Status by Age in Millerstown borough
According to the labor force statistics for Millerstown borough, out of the total population over 16 years of age (576), 60.9% or 351 individuals are in the labor force, with 2.3% or 8 of them unemployed. The age group with the highest labor force participation rate is 35 to 44 years, with 85.3% or 64 individuals in the labor force. Within the labor force, the 16 to 19 years age range has the highest percentage of unemployed individuals, with 20.0% or 2 of them being unemployed.
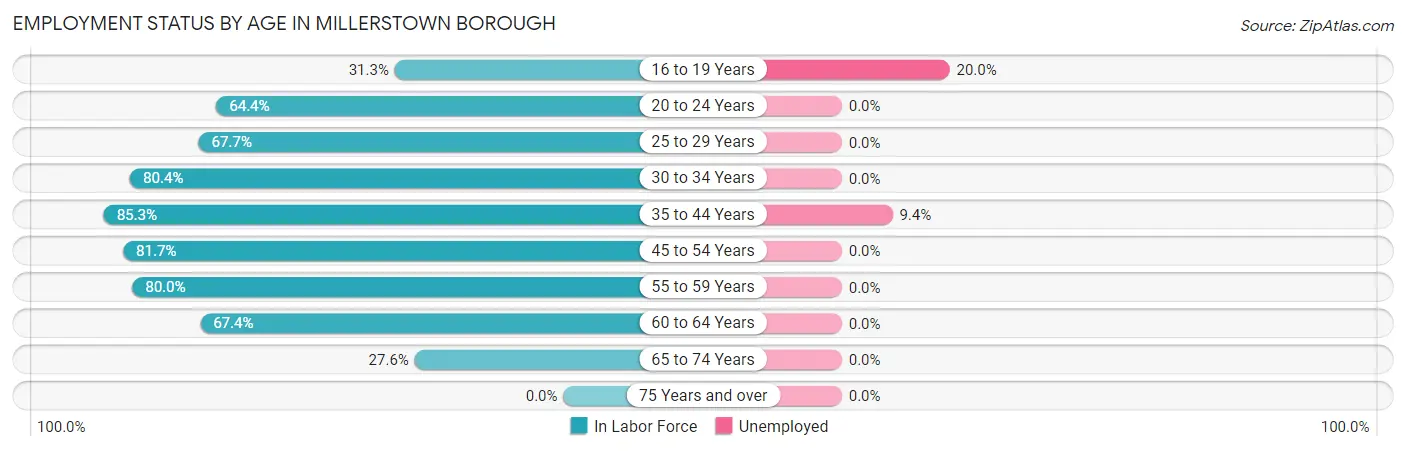
| Age Bracket | In Labor Force | Unemployed |
| 16 to 19 Years | 10 (31.3%) | 2 (20.0%) |
| 20 to 24 Years | 29 (64.4%) | 0 (0.0%) |
| 25 to 29 Years | 21 (67.7%) | 0 (0.0%) |
| 30 to 34 Years | 45 (80.4%) | 0 (0.0%) |
| 35 to 44 Years | 64 (85.3%) | 6 (9.4%) |
| 45 to 54 Years | 94 (81.7%) | 0 (0.0%) |
| 55 to 59 Years | 28 (80.0%) | 0 (0.0%) |
| 60 to 64 Years | 31 (67.4%) | 0 (0.0%) |
| 65 to 74 Years | 29 (27.6%) | 0 (0.0%) |
| 75 Years and over | 0 (0.0%) | 0 (0.0%) |
| Total | 351 (60.9%) | 8 (2.3%) |
Employment Status by Educational Attainment in Millerstown borough
According to labor force statistics for Millerstown borough, 79.1% of individuals (283) out of the total population between 25 and 64 years of age (358) are in the labor force, with 2.1% or 6 of them being unemployed. The group with the highest labor force participation rate are those with the educational attainment of college / associate degree, with 91.0% or 101 individuals in the labor force. Within the labor force, individuals with high school diploma education have the highest percentage of unemployment, with 18.2% or 6 of them being unemployed.
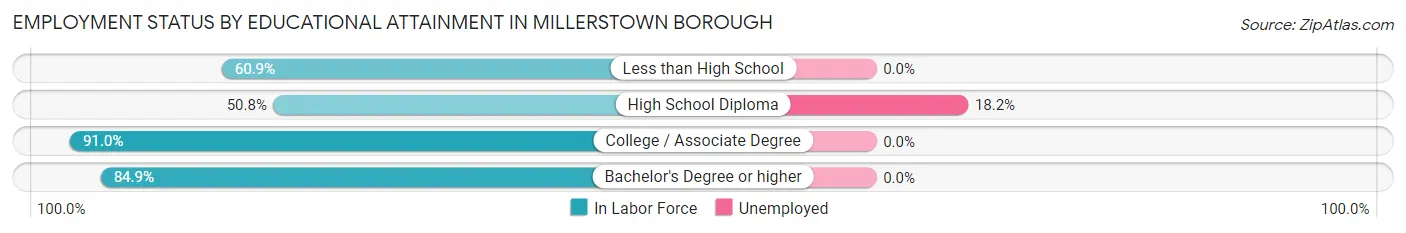
| Educational Attainment | In Labor Force | Unemployed |
| Less than High School | 14 (60.9%) | 0 (0.0%) |
| High School Diploma | 33 (50.8%) | 12 (18.2%) |
| College / Associate Degree | 101 (91.0%) | 0 (0.0%) |
| Bachelor's Degree or higher | 135 (84.9%) | 0 (0.0%) |
| Total | 283 (79.1%) | 8 (2.1%) |
Employment Occupations by Sex in Millerstown borough
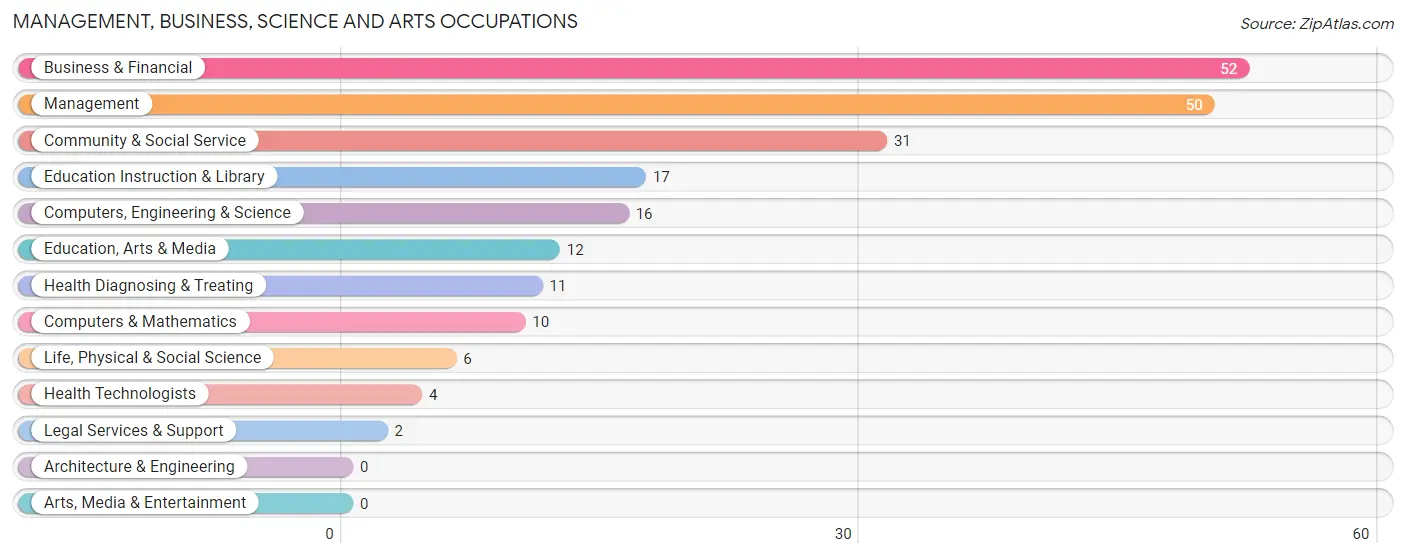
Management, Business, Science and Arts Occupations
The most common Management, Business, Science and Arts occupations in Millerstown borough are Business & Financial (52 | 15.2%), Management (50 | 14.6%), Community & Social Service (31 | 9.0%), Education Instruction & Library (17 | 5.0%), and Computers, Engineering & Science (16 | 4.7%).
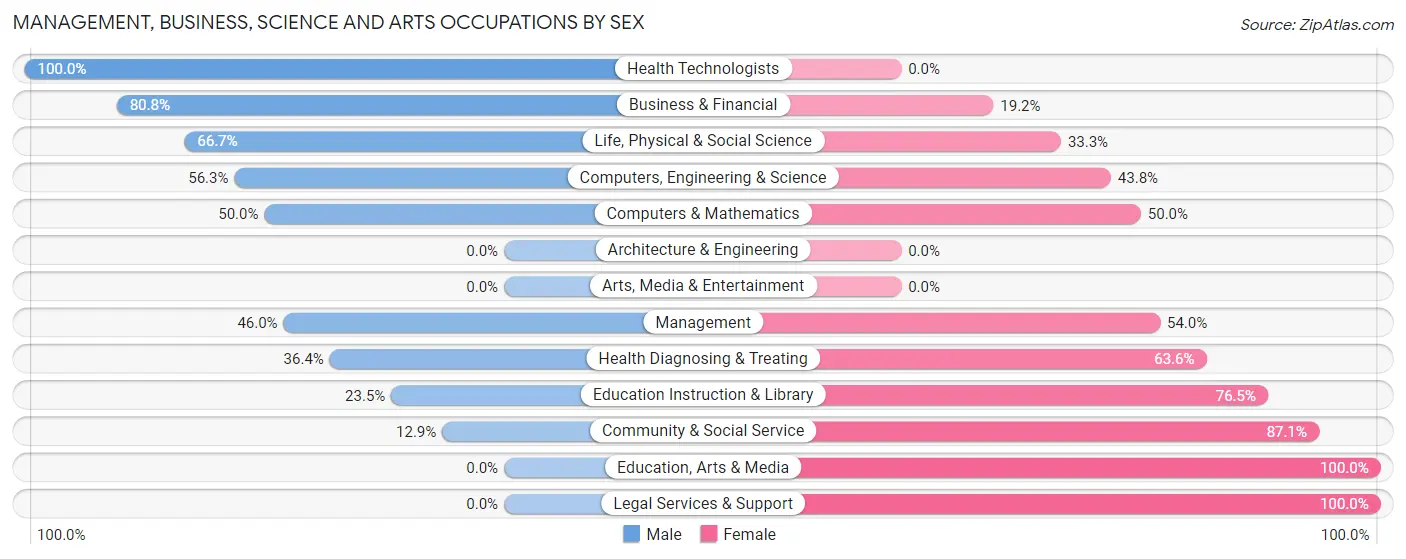
Management, Business, Science and Arts Occupations by Sex
Within the Management, Business, Science and Arts occupations in Millerstown borough, the most male-oriented occupations are Health Technologists (100.0%), Business & Financial (80.8%), and Life, Physical & Social Science (66.7%), while the most female-oriented occupations are Education, Arts & Media (100.0%), Legal Services & Support (100.0%), and Community & Social Service (87.1%).
| Occupation | Male | Female |
| Management | 23 (46.0%) | 27 (54.0%) |
| Business & Financial | 42 (80.8%) | 10 (19.2%) |
| Computers, Engineering & Science | 9 (56.2%) | 7 (43.8%) |
| Computers & Mathematics | 5 (50.0%) | 5 (50.0%) |
| Architecture & Engineering | 0 (0.0%) | 0 (0.0%) |
| Life, Physical & Social Science | 4 (66.7%) | 2 (33.3%) |
| Community & Social Service | 4 (12.9%) | 27 (87.1%) |
| Education, Arts & Media | 0 (0.0%) | 12 (100.0%) |
| Legal Services & Support | 0 (0.0%) | 2 (100.0%) |
| Education Instruction & Library | 4 (23.5%) | 13 (76.5%) |
| Arts, Media & Entertainment | 0 (0.0%) | 0 (0.0%) |
| Health Diagnosing & Treating | 4 (36.4%) | 7 (63.6%) |
| Health Technologists | 4 (100.0%) | 0 (0.0%) |
| Total (Category) | 82 (51.2%) | 78 (48.7%) |
| Total (Overall) | 204 (59.5%) | 139 (40.5%) |
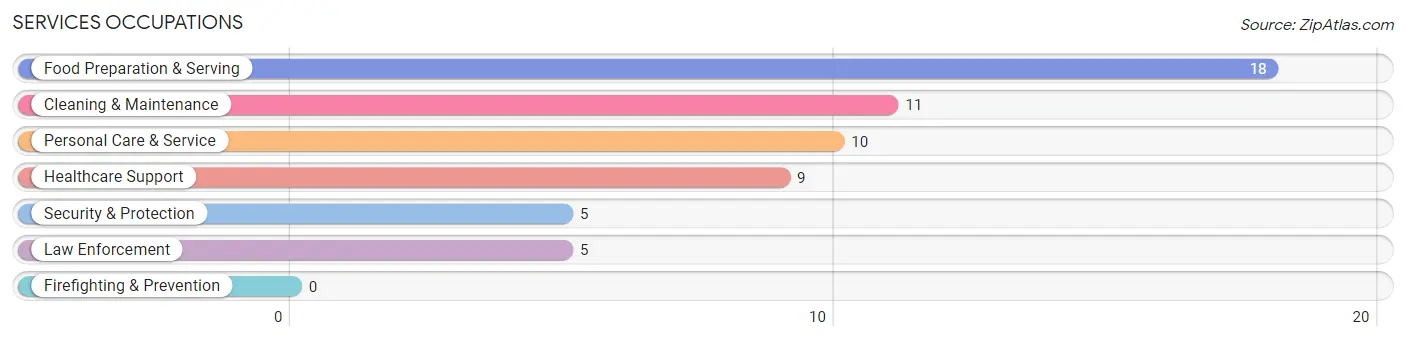
Services Occupations
The most common Services occupations in Millerstown borough are Food Preparation & Serving (18 | 5.2%), Cleaning & Maintenance (11 | 3.2%), Personal Care & Service (10 | 2.9%), Healthcare Support (9 | 2.6%), and Security & Protection (5 | 1.5%).
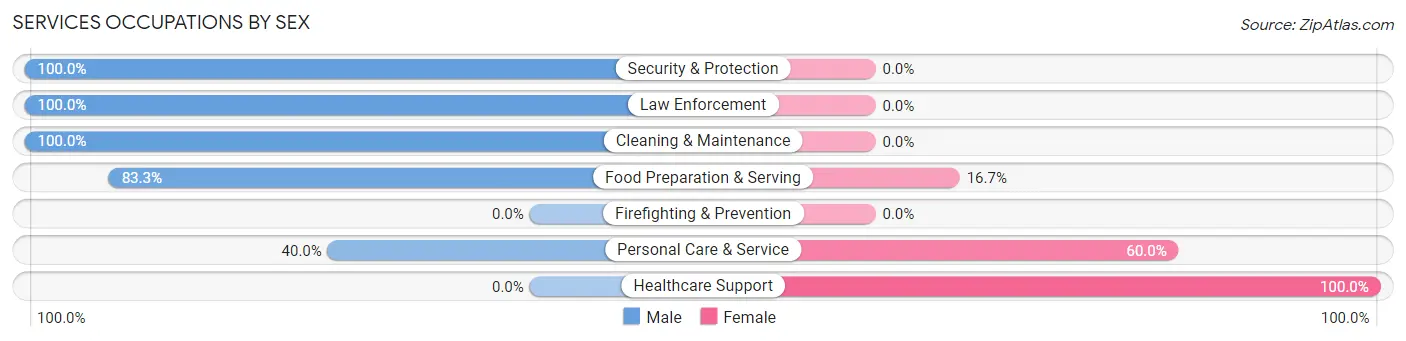
Services Occupations by Sex
Within the Services occupations in Millerstown borough, the most male-oriented occupations are Security & Protection (100.0%), Law Enforcement (100.0%), and Cleaning & Maintenance (100.0%), while the most female-oriented occupations are Healthcare Support (100.0%), Personal Care & Service (60.0%), and Food Preparation & Serving (16.7%).
| Occupation | Male | Female |
| Healthcare Support | 0 (0.0%) | 9 (100.0%) |
| Security & Protection | 5 (100.0%) | 0 (0.0%) |
| Firefighting & Prevention | 0 (0.0%) | 0 (0.0%) |
| Law Enforcement | 5 (100.0%) | 0 (0.0%) |
| Food Preparation & Serving | 15 (83.3%) | 3 (16.7%) |
| Cleaning & Maintenance | 11 (100.0%) | 0 (0.0%) |
| Personal Care & Service | 4 (40.0%) | 6 (60.0%) |
| Total (Category) | 35 (66.0%) | 18 (34.0%) |
| Total (Overall) | 204 (59.5%) | 139 (40.5%) |
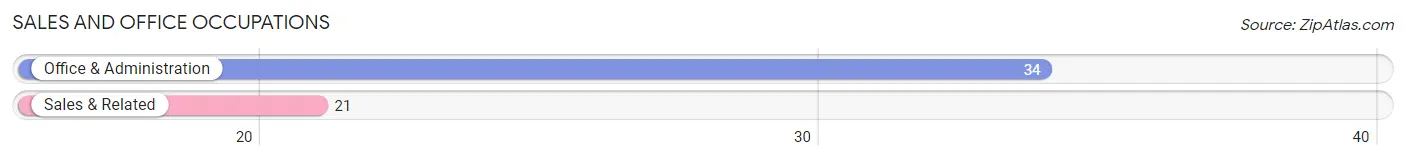
Sales and Office Occupations
The most common Sales and Office occupations in Millerstown borough are Office & Administration (34 | 9.9%), and Sales & Related (21 | 6.1%).
Sales and Office Occupations by Sex
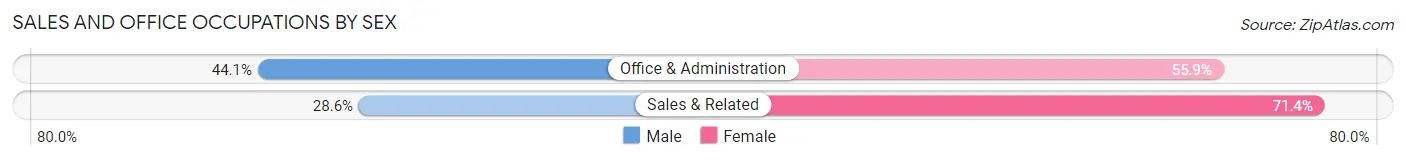
| Occupation | Male | Female |
| Sales & Related | 6 (28.6%) | 15 (71.4%) |
| Office & Administration | 15 (44.1%) | 19 (55.9%) |
| Total (Category) | 21 (38.2%) | 34 (61.8%) |
| Total (Overall) | 204 (59.5%) | 139 (40.5%) |
Natural Resources, Construction and Maintenance Occupations
The most common Natural Resources, Construction and Maintenance occupations in Millerstown borough are Construction & Extraction (19 | 5.5%), and Installation, Maintenance & Repair (7 | 2.0%).
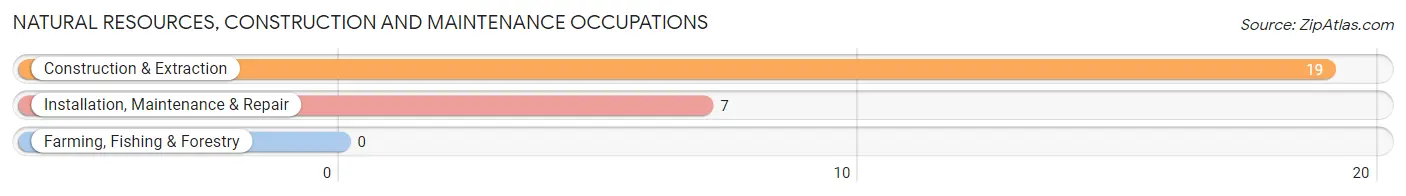
Natural Resources, Construction and Maintenance Occupations by Sex

| Occupation | Male | Female |
| Farming, Fishing & Forestry | 0 (0.0%) | 0 (0.0%) |
| Construction & Extraction | 19 (100.0%) | 0 (0.0%) |
| Installation, Maintenance & Repair | 7 (100.0%) | 0 (0.0%) |
| Total (Category) | 26 (100.0%) | 0 (0.0%) |
| Total (Overall) | 204 (59.5%) | 139 (40.5%) |
Production, Transportation and Moving Occupations
The most common Production, Transportation and Moving occupations in Millerstown borough are Transportation (24 | 7.0%), Material Moving (20 | 5.8%), and Production (5 | 1.5%).
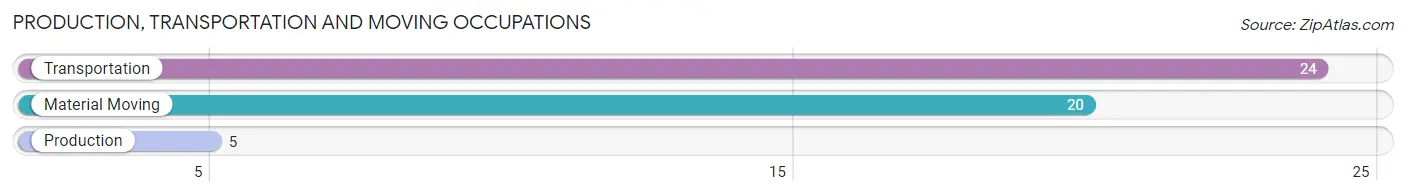
Production, Transportation and Moving Occupations by Sex
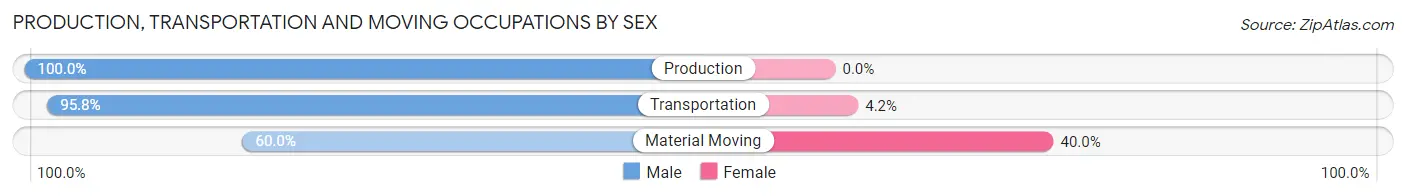
| Occupation | Male | Female |
| Production | 5 (100.0%) | 0 (0.0%) |
| Transportation | 23 (95.8%) | 1 (4.2%) |
| Material Moving | 12 (60.0%) | 8 (40.0%) |
| Total (Category) | 40 (81.6%) | 9 (18.4%) |
| Total (Overall) | 204 (59.5%) | 139 (40.5%) |
Employment Industries by Sex in Millerstown borough
Employment Industries in Millerstown borough
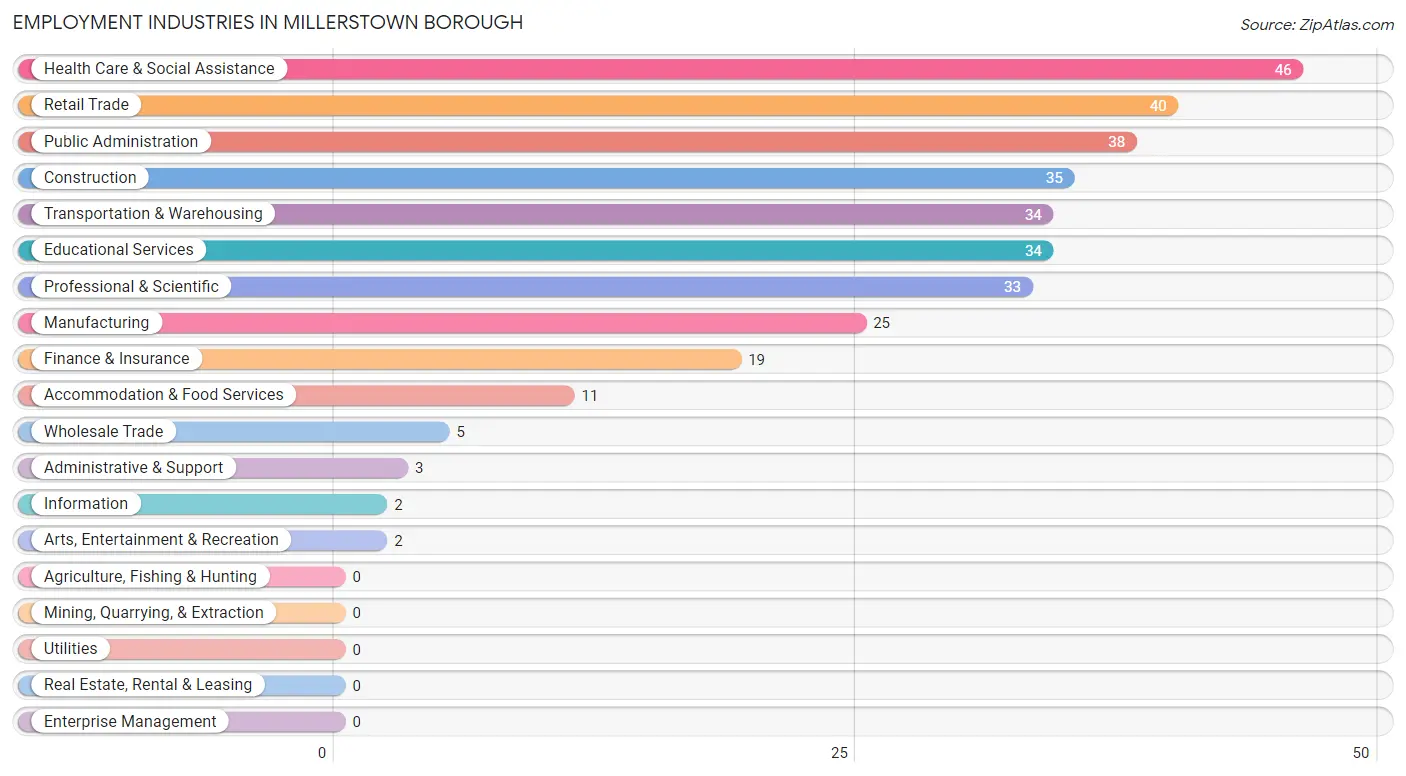
The major employment industries in Millerstown borough include Health Care & Social Assistance (46 | 13.4%), Retail Trade (40 | 11.7%), Public Administration (38 | 11.1%), Construction (35 | 10.2%), and Transportation & Warehousing (34 | 9.9%).
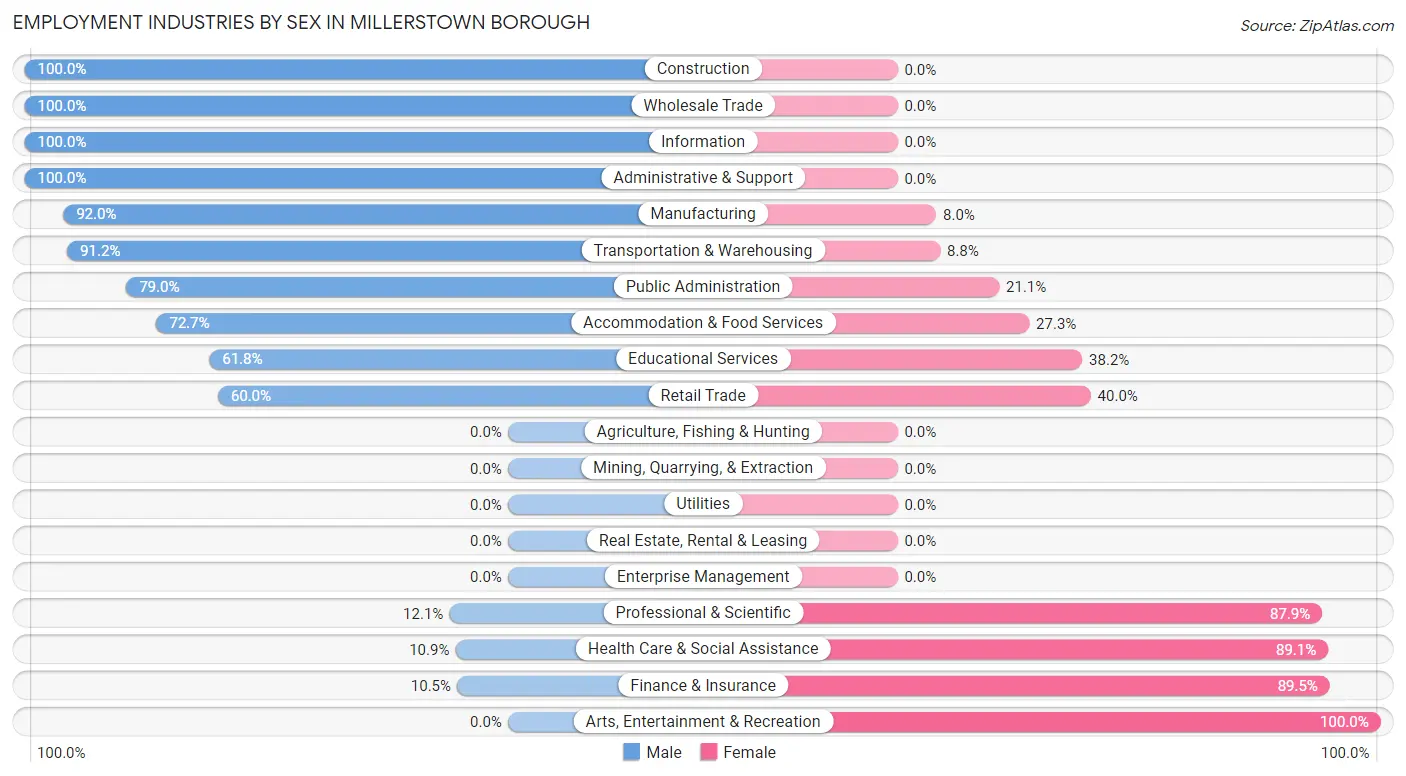
Employment Industries by Sex in Millerstown borough
The Millerstown borough industries that see more men than women are Construction (100.0%), Wholesale Trade (100.0%), and Information (100.0%), whereas the industries that tend to have a higher number of women are Arts, Entertainment & Recreation (100.0%), Finance & Insurance (89.5%), and Health Care & Social Assistance (89.1%).
| Industry | Male | Female |
| Agriculture, Fishing & Hunting | 0 (0.0%) | 0 (0.0%) |
| Mining, Quarrying, & Extraction | 0 (0.0%) | 0 (0.0%) |
| Construction | 35 (100.0%) | 0 (0.0%) |
| Manufacturing | 23 (92.0%) | 2 (8.0%) |
| Wholesale Trade | 5 (100.0%) | 0 (0.0%) |
| Retail Trade | 24 (60.0%) | 16 (40.0%) |
| Transportation & Warehousing | 31 (91.2%) | 3 (8.8%) |
| Utilities | 0 (0.0%) | 0 (0.0%) |
| Information | 2 (100.0%) | 0 (0.0%) |
| Finance & Insurance | 2 (10.5%) | 17 (89.5%) |
| Real Estate, Rental & Leasing | 0 (0.0%) | 0 (0.0%) |
| Professional & Scientific | 4 (12.1%) | 29 (87.9%) |
| Enterprise Management | 0 (0.0%) | 0 (0.0%) |
| Administrative & Support | 3 (100.0%) | 0 (0.0%) |
| Educational Services | 21 (61.8%) | 13 (38.2%) |
| Health Care & Social Assistance | 5 (10.9%) | 41 (89.1%) |
| Arts, Entertainment & Recreation | 0 (0.0%) | 2 (100.0%) |
| Accommodation & Food Services | 8 (72.7%) | 3 (27.3%) |
| Public Administration | 30 (78.9%) | 8 (21.0%) |
| Total | 204 (59.5%) | 139 (40.5%) |
Education in Millerstown borough
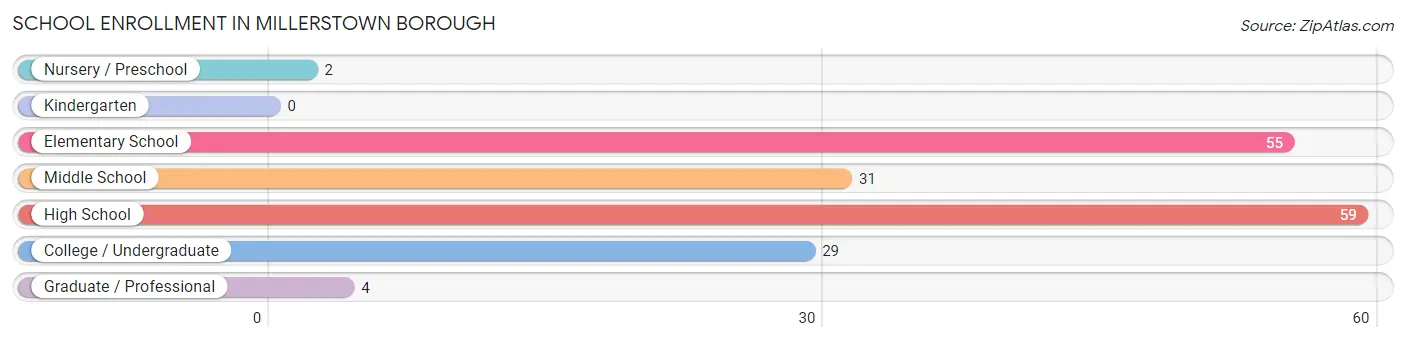
School Enrollment in Millerstown borough
The most common levels of schooling among the 180 students in Millerstown borough are high school (59 | 32.8%), elementary school (55 | 30.6%), and middle school (31 | 17.2%).
| School Level | # Students | % Students |
| Nursery / Preschool | 2 | 1.1% |
| Kindergarten | 0 | 0.0% |
| Elementary School | 55 | 30.6% |
| Middle School | 31 | 17.2% |
| High School | 59 | 32.8% |
| College / Undergraduate | 29 | 16.1% |
| Graduate / Professional | 4 | 2.2% |
| Total | 180 | 100.0% |
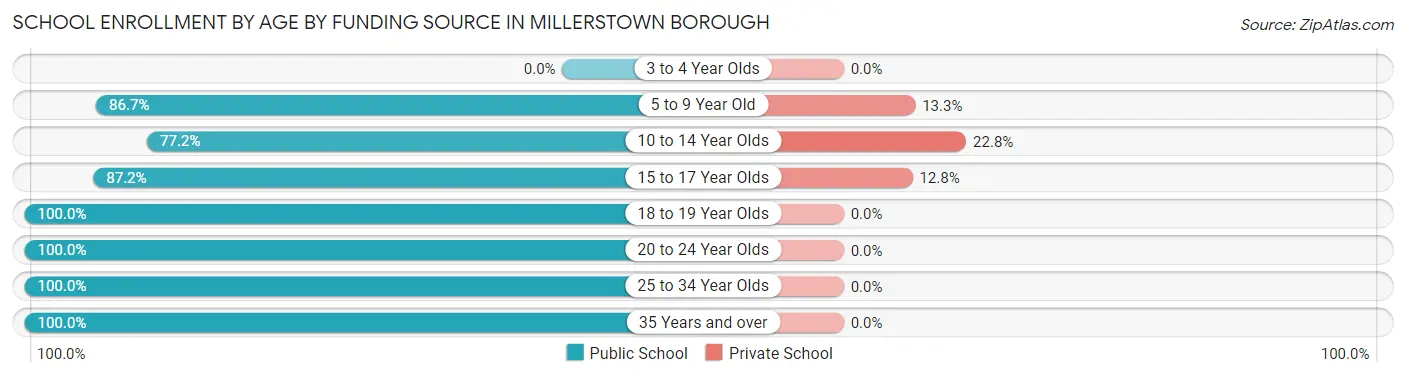
School Enrollment by Age by Funding Source in Millerstown borough
Out of a total of 180 students who are enrolled in schools in Millerstown borough, 24 (13.3%) attend a private institution, while the remaining 156 (86.7%) are enrolled in public schools. The age group of 10 to 14 year olds has the highest likelihood of being enrolled in private schools, with 13 (22.8% in the age bracket) enrolled. Conversely, the age group of 18 to 19 year olds has the lowest likelihood of being enrolled in a private school, with 5 (100.0% in the age bracket) attending a public institution.
| Age Bracket | Public School | Private School |
| 3 to 4 Year Olds | 0 (0.0%) | 0 (0.0%) |
| 5 to 9 Year Old | 39 (86.7%) | 6 (13.3%) |
| 10 to 14 Year Olds | 44 (77.2%) | 13 (22.8%) |
| 15 to 17 Year Olds | 34 (87.2%) | 5 (12.8%) |
| 18 to 19 Year Olds | 5 (100.0%) | 0 (0.0%) |
| 20 to 24 Year Olds | 22 (100.0%) | 0 (0.0%) |
| 25 to 34 Year Olds | 2 (100.0%) | 0 (0.0%) |
| 35 Years and over | 10 (100.0%) | 0 (0.0%) |
| Total | 156 (86.7%) | 24 (13.3%) |
Educational Attainment by Field of Study in Millerstown borough
Education (56 | 25.9%), engineering (28 | 13.0%), business (27 | 12.5%), arts & humanities (25 | 11.6%), and social sciences (18 | 8.3%) are the most common fields of study among 216 individuals in Millerstown borough who have obtained a bachelor's degree or higher.
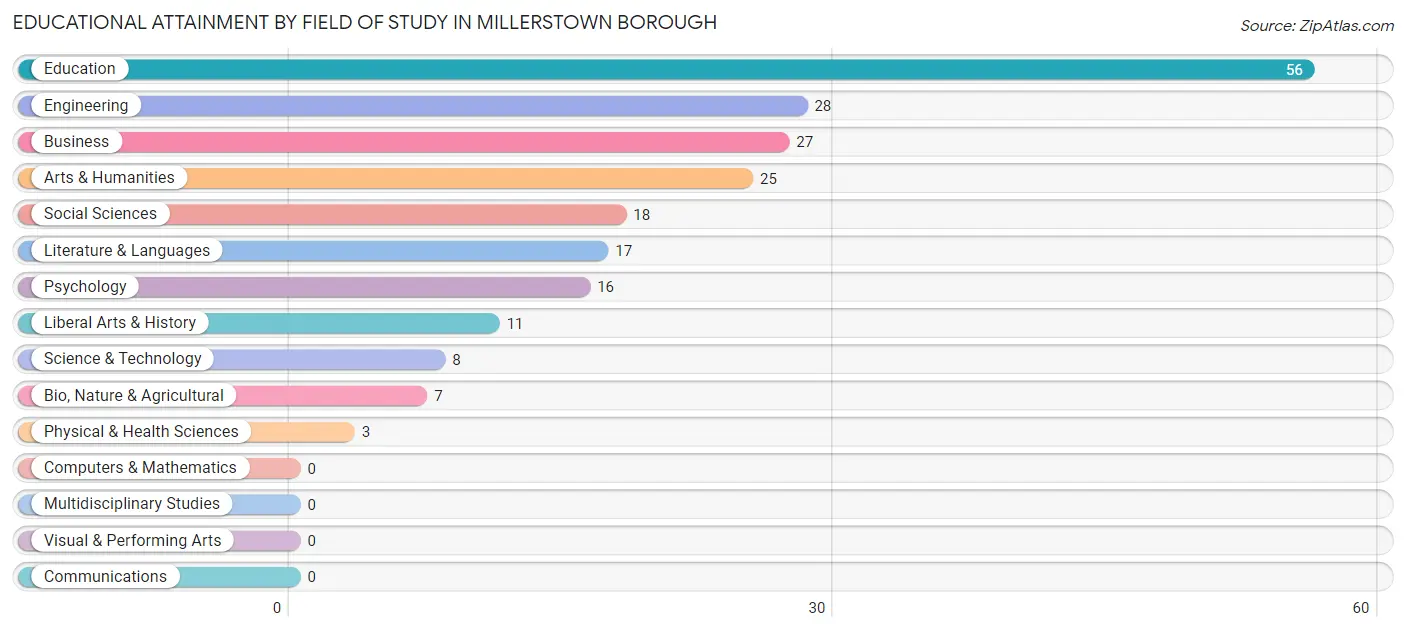
| Field of Study | # Graduates | % Graduates |
| Computers & Mathematics | 0 | 0.0% |
| Bio, Nature & Agricultural | 7 | 3.2% |
| Physical & Health Sciences | 3 | 1.4% |
| Psychology | 16 | 7.4% |
| Social Sciences | 18 | 8.3% |
| Engineering | 28 | 13.0% |
| Multidisciplinary Studies | 0 | 0.0% |
| Science & Technology | 8 | 3.7% |
| Business | 27 | 12.5% |
| Education | 56 | 25.9% |
| Literature & Languages | 17 | 7.9% |
| Liberal Arts & History | 11 | 5.1% |
| Visual & Performing Arts | 0 | 0.0% |
| Communications | 0 | 0.0% |
| Arts & Humanities | 25 | 11.6% |
| Total | 216 | 100.0% |
Transportation & Commute in Millerstown borough
Vehicle Availability by Sex in Millerstown borough
The most prevalent vehicle ownership categories in Millerstown borough are males with 2 vehicles (77, accounting for 37.8%) and females with 2 vehicles (42, making up 55.4%).
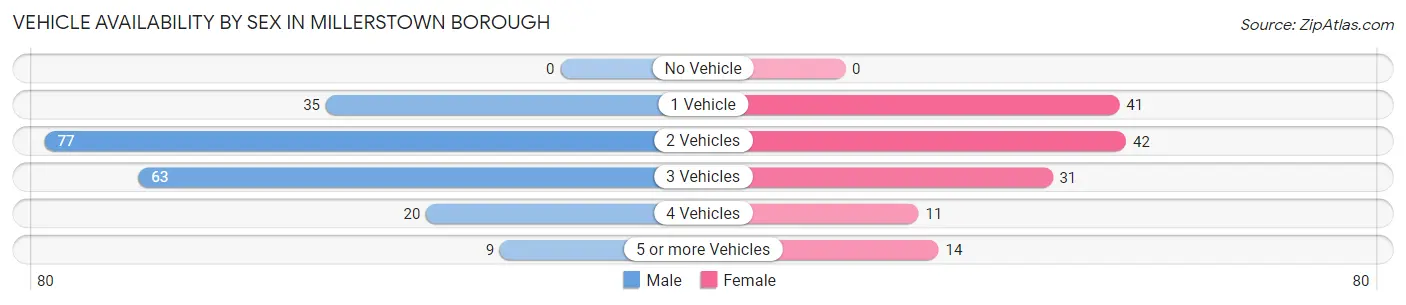
| Vehicles Available | Male | Female |
| No Vehicle | 0 (0.0%) | 0 (0.0%) |
| 1 Vehicle | 35 (17.2%) | 41 (29.5%) |
| 2 Vehicles | 77 (37.8%) | 42 (30.2%) |
| 3 Vehicles | 63 (30.9%) | 31 (22.3%) |
| 4 Vehicles | 20 (9.8%) | 11 (7.9%) |
| 5 or more Vehicles | 9 (4.4%) | 14 (10.1%) |
| Total | 204 (100.0%) | 139 (100.0%) |
Commute Time in Millerstown borough
The most frequently occuring commute durations in Millerstown borough are 45 to 59 minutes (60 commuters, 18.8%), 60 to 89 minutes (54 commuters, 16.9%), and 40 to 44 minutes (44 commuters, 13.8%).
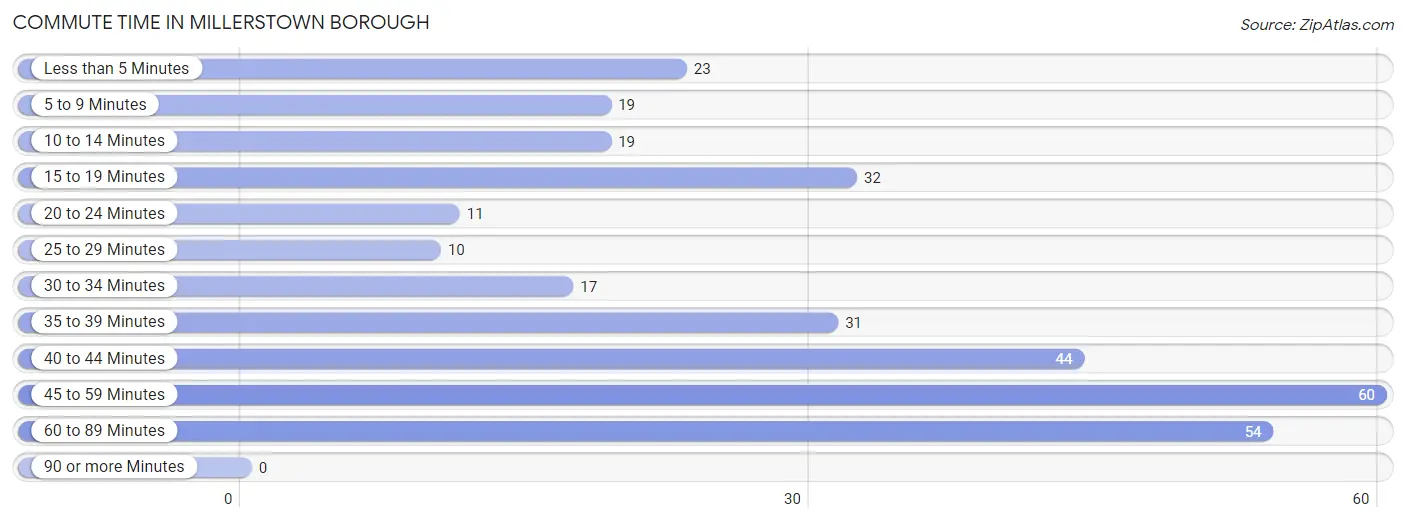
| Commute Time | # Commuters | % Commuters |
| Less than 5 Minutes | 23 | 7.2% |
| 5 to 9 Minutes | 19 | 5.9% |
| 10 to 14 Minutes | 19 | 5.9% |
| 15 to 19 Minutes | 32 | 10.0% |
| 20 to 24 Minutes | 11 | 3.4% |
| 25 to 29 Minutes | 10 | 3.1% |
| 30 to 34 Minutes | 17 | 5.3% |
| 35 to 39 Minutes | 31 | 9.7% |
| 40 to 44 Minutes | 44 | 13.8% |
| 45 to 59 Minutes | 60 | 18.8% |
| 60 to 89 Minutes | 54 | 16.9% |
| 90 or more Minutes | 0 | 0.0% |
Commute Time by Sex in Millerstown borough
The most common commute times in Millerstown borough are 60 to 89 minutes (50 commuters, 26.2%) for males and 45 to 59 minutes (38 commuters, 29.5%) for females.
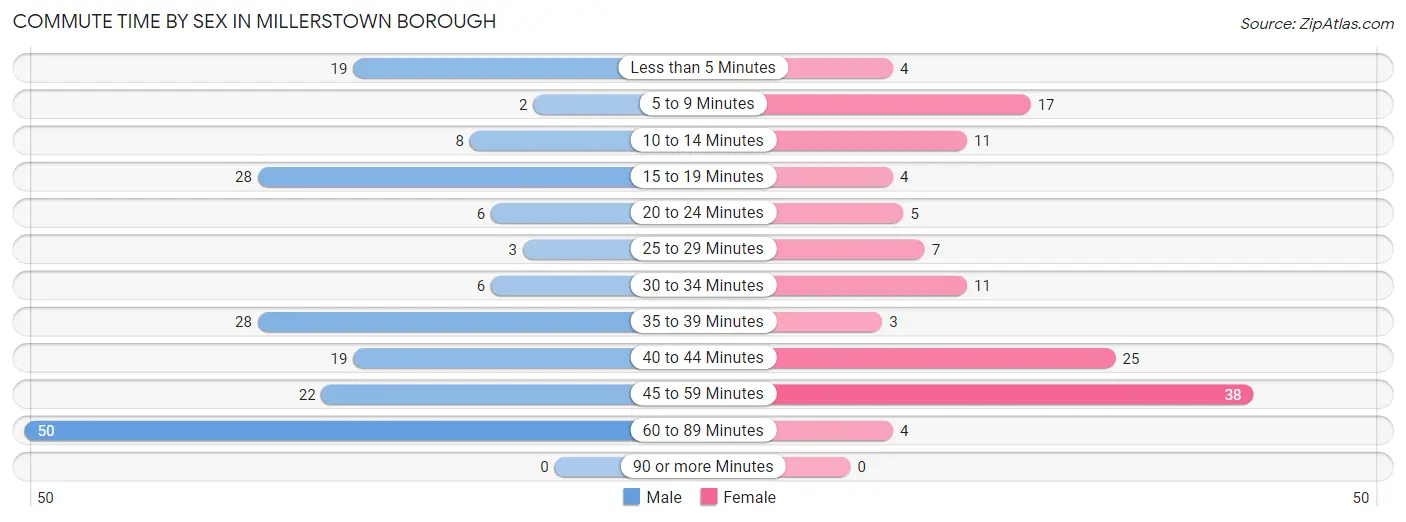
| Commute Time | Male | Female |
| Less than 5 Minutes | 19 (10.0%) | 4 (3.1%) |
| 5 to 9 Minutes | 2 (1.1%) | 17 (13.2%) |
| 10 to 14 Minutes | 8 (4.2%) | 11 (8.5%) |
| 15 to 19 Minutes | 28 (14.7%) | 4 (3.1%) |
| 20 to 24 Minutes | 6 (3.1%) | 5 (3.9%) |
| 25 to 29 Minutes | 3 (1.6%) | 7 (5.4%) |
| 30 to 34 Minutes | 6 (3.1%) | 11 (8.5%) |
| 35 to 39 Minutes | 28 (14.7%) | 3 (2.3%) |
| 40 to 44 Minutes | 19 (10.0%) | 25 (19.4%) |
| 45 to 59 Minutes | 22 (11.5%) | 38 (29.5%) |
| 60 to 89 Minutes | 50 (26.2%) | 4 (3.1%) |
| 90 or more Minutes | 0 (0.0%) | 0 (0.0%) |
Time of Departure to Work by Sex in Millerstown borough
The most frequent times of departure to work in Millerstown borough are 4:00 PM to 11:59 PM (32, 16.8%) for males and 6:30 AM to 6:59 AM (36, 27.9%) for females.
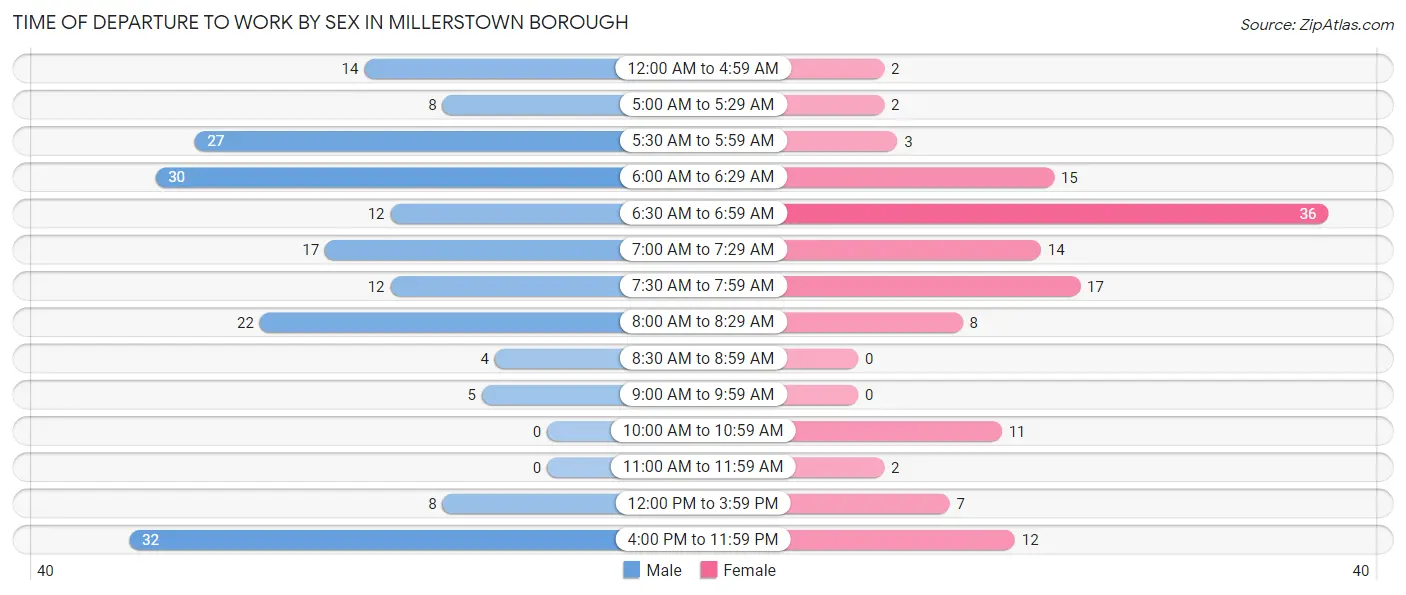
| Time of Departure | Male | Female |
| 12:00 AM to 4:59 AM | 14 (7.3%) | 2 (1.5%) |
| 5:00 AM to 5:29 AM | 8 (4.2%) | 2 (1.5%) |
| 5:30 AM to 5:59 AM | 27 (14.1%) | 3 (2.3%) |
| 6:00 AM to 6:29 AM | 30 (15.7%) | 15 (11.6%) |
| 6:30 AM to 6:59 AM | 12 (6.3%) | 36 (27.9%) |
| 7:00 AM to 7:29 AM | 17 (8.9%) | 14 (10.8%) |
| 7:30 AM to 7:59 AM | 12 (6.3%) | 17 (13.2%) |
| 8:00 AM to 8:29 AM | 22 (11.5%) | 8 (6.2%) |
| 8:30 AM to 8:59 AM | 4 (2.1%) | 0 (0.0%) |
| 9:00 AM to 9:59 AM | 5 (2.6%) | 0 (0.0%) |
| 10:00 AM to 10:59 AM | 0 (0.0%) | 11 (8.5%) |
| 11:00 AM to 11:59 AM | 0 (0.0%) | 2 (1.5%) |
| 12:00 PM to 3:59 PM | 8 (4.2%) | 7 (5.4%) |
| 4:00 PM to 11:59 PM | 32 (16.8%) | 12 (9.3%) |
| Total | 191 (100.0%) | 129 (100.0%) |
Housing Occupancy in Millerstown borough
Occupancy by Ownership in Millerstown borough
Of the total 279 dwellings in Millerstown borough, owner-occupied units account for 232 (83.2%), while renter-occupied units make up 47 (16.9%).
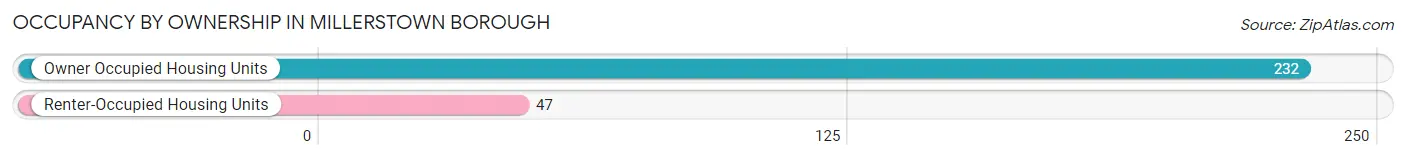
| Occupancy | # Housing Units | % Housing Units |
| Owner Occupied Housing Units | 232 | 83.2% |
| Renter-Occupied Housing Units | 47 | 16.9% |
| Total Occupied Housing Units | 279 | 100.0% |
Occupancy by Household Size in Millerstown borough
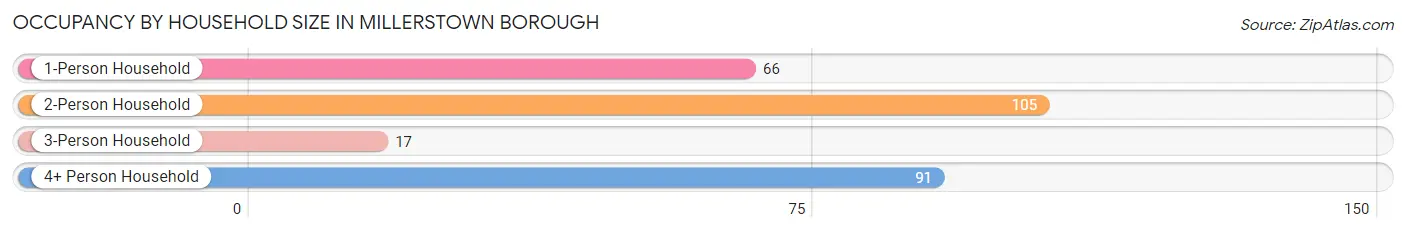
| Household Size | # Housing Units | % Housing Units |
| 1-Person Household | 66 | 23.7% |
| 2-Person Household | 105 | 37.6% |
| 3-Person Household | 17 | 6.1% |
| 4+ Person Household | 91 | 32.6% |
| Total Housing Units | 279 | 100.0% |
Occupancy by Ownership by Household Size in Millerstown borough
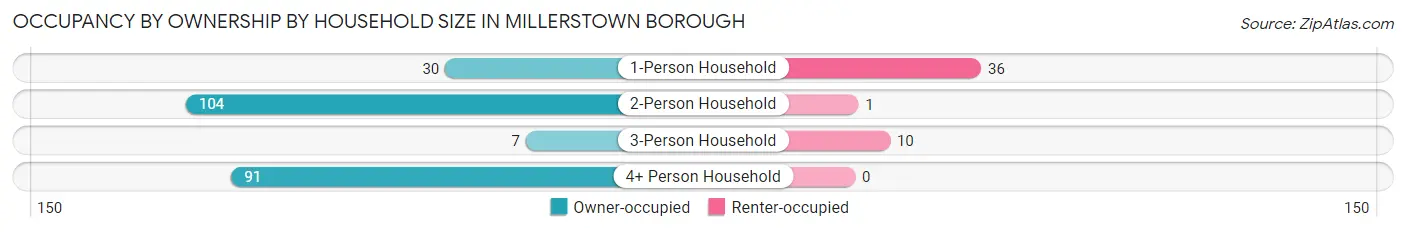
| Household Size | Owner-occupied | Renter-occupied |
| 1-Person Household | 30 (45.5%) | 36 (54.5%) |
| 2-Person Household | 104 (99.1%) | 1 (0.9%) |
| 3-Person Household | 7 (41.2%) | 10 (58.8%) |
| 4+ Person Household | 91 (100.0%) | 0 (0.0%) |
| Total Housing Units | 232 (83.2%) | 47 (16.9%) |
Occupancy by Educational Attainment in Millerstown borough
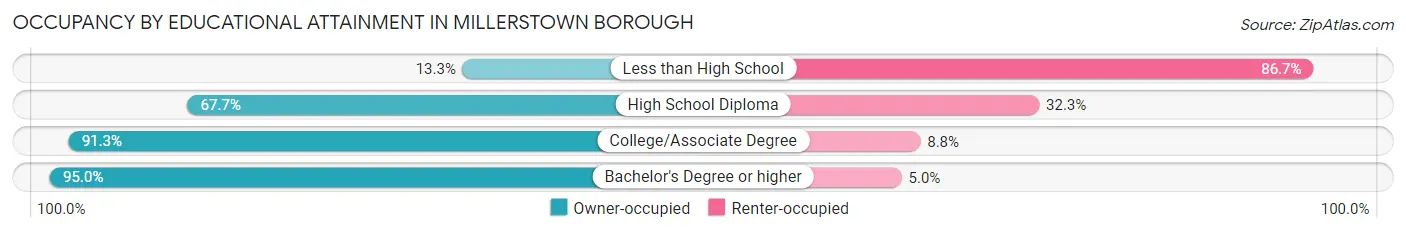
| Household Size | Owner-occupied | Renter-occupied |
| Less than High School | 2 (13.3%) | 13 (86.7%) |
| High School Diploma | 44 (67.7%) | 21 (32.3%) |
| College/Associate Degree | 73 (91.2%) | 7 (8.7%) |
| Bachelor's Degree or higher | 113 (95.0%) | 6 (5.0%) |
Occupancy by Age of Householder in Millerstown borough
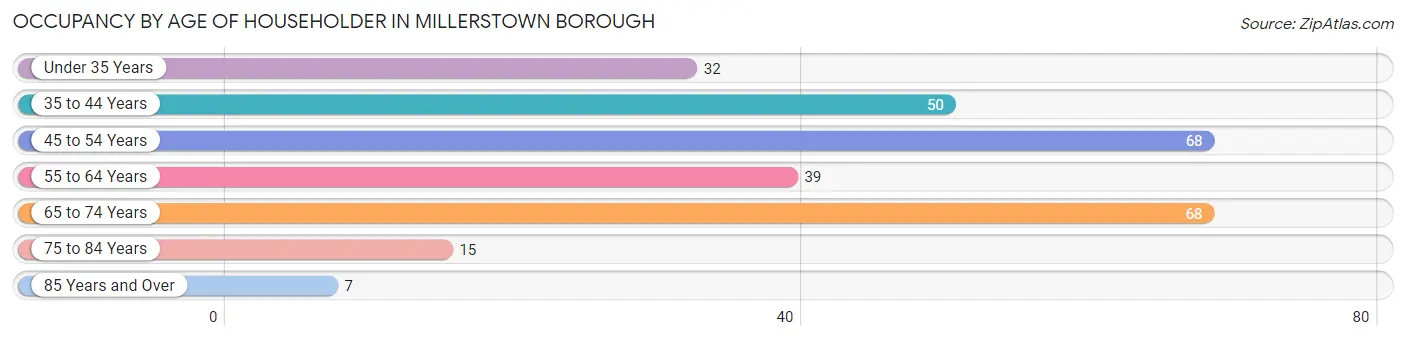
| Age Bracket | # Households | % Households |
| Under 35 Years | 32 | 11.5% |
| 35 to 44 Years | 50 | 17.9% |
| 45 to 54 Years | 68 | 24.4% |
| 55 to 64 Years | 39 | 14.0% |
| 65 to 74 Years | 68 | 24.4% |
| 75 to 84 Years | 15 | 5.4% |
| 85 Years and Over | 7 | 2.5% |
| Total | 279 | 100.0% |
Housing Finances in Millerstown borough
Median Income by Occupancy in Millerstown borough
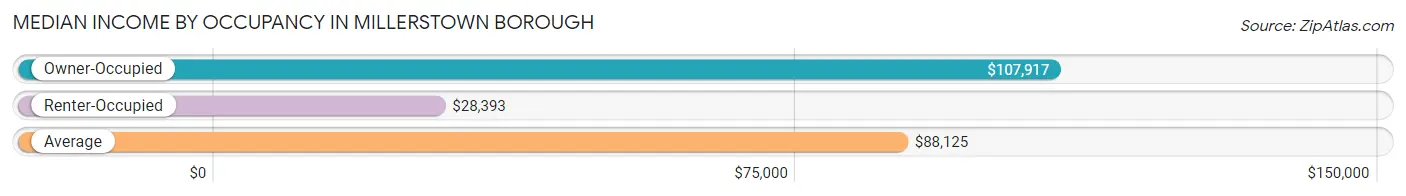
| Occupancy Type | # Households | Median Income |
| Owner-Occupied | 232 (83.2%) | $107,917 |
| Renter-Occupied | 47 (16.9%) | $28,393 |
| Average | 279 (100.0%) | $88,125 |
Occupancy by Householder Income Bracket in Millerstown borough
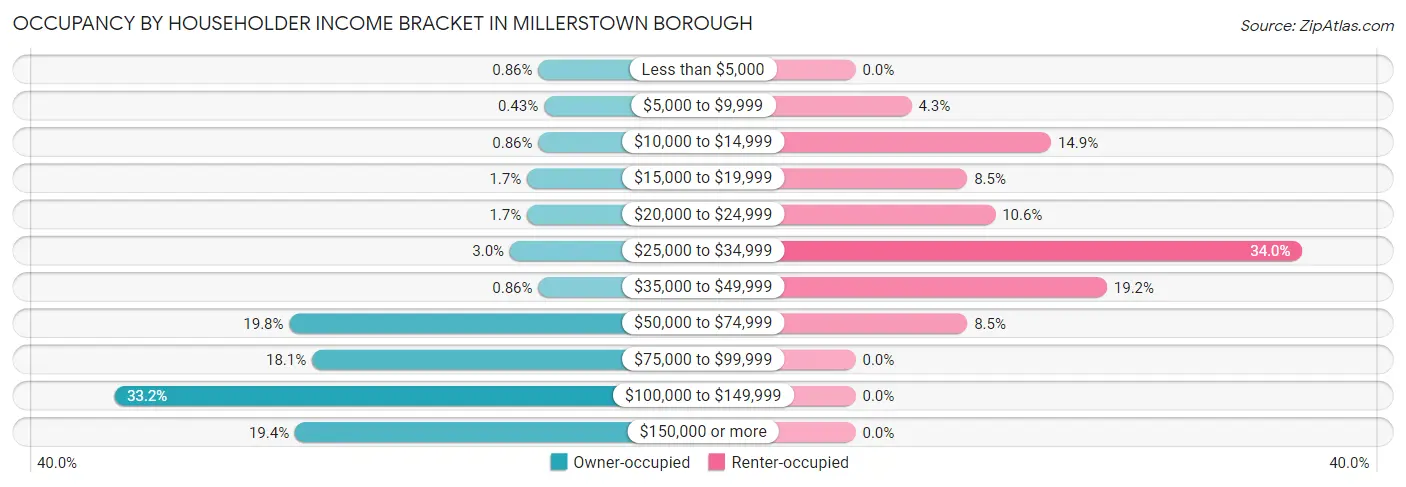
| Income Bracket | Owner-occupied | Renter-occupied |
| Less than $5,000 | 2 (0.9%) | 0 (0.0%) |
| $5,000 to $9,999 | 1 (0.4%) | 2 (4.3%) |
| $10,000 to $14,999 | 2 (0.9%) | 7 (14.9%) |
| $15,000 to $19,999 | 4 (1.7%) | 4 (8.5%) |
| $20,000 to $24,999 | 4 (1.7%) | 5 (10.6%) |
| $25,000 to $34,999 | 7 (3.0%) | 16 (34.0%) |
| $35,000 to $49,999 | 2 (0.9%) | 9 (19.2%) |
| $50,000 to $74,999 | 46 (19.8%) | 4 (8.5%) |
| $75,000 to $99,999 | 42 (18.1%) | 0 (0.0%) |
| $100,000 to $149,999 | 77 (33.2%) | 0 (0.0%) |
| $150,000 or more | 45 (19.4%) | 0 (0.0%) |
| Total | 232 (100.0%) | 47 (100.0%) |
Monthly Housing Cost Tiers in Millerstown borough
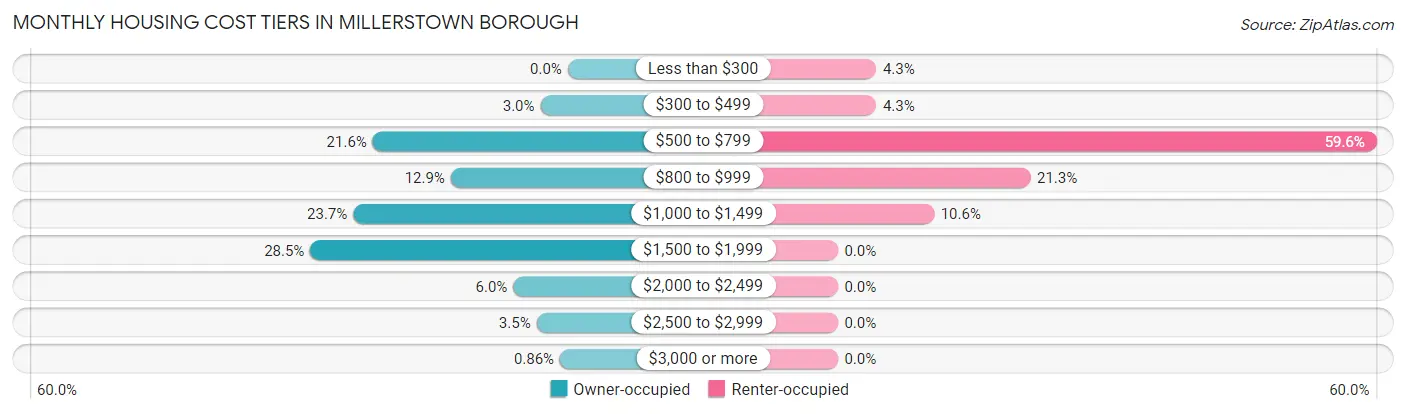
| Monthly Cost | Owner-occupied | Renter-occupied |
| Less than $300 | 0 (0.0%) | 2 (4.3%) |
| $300 to $499 | 7 (3.0%) | 2 (4.3%) |
| $500 to $799 | 50 (21.5%) | 28 (59.6%) |
| $800 to $999 | 30 (12.9%) | 10 (21.3%) |
| $1,000 to $1,499 | 55 (23.7%) | 5 (10.6%) |
| $1,500 to $1,999 | 66 (28.4%) | 0 (0.0%) |
| $2,000 to $2,499 | 14 (6.0%) | 0 (0.0%) |
| $2,500 to $2,999 | 8 (3.5%) | 0 (0.0%) |
| $3,000 or more | 2 (0.9%) | 0 (0.0%) |
| Total | 232 (100.0%) | 47 (100.0%) |
Physical Housing Characteristics in Millerstown borough
Housing Structures in Millerstown borough
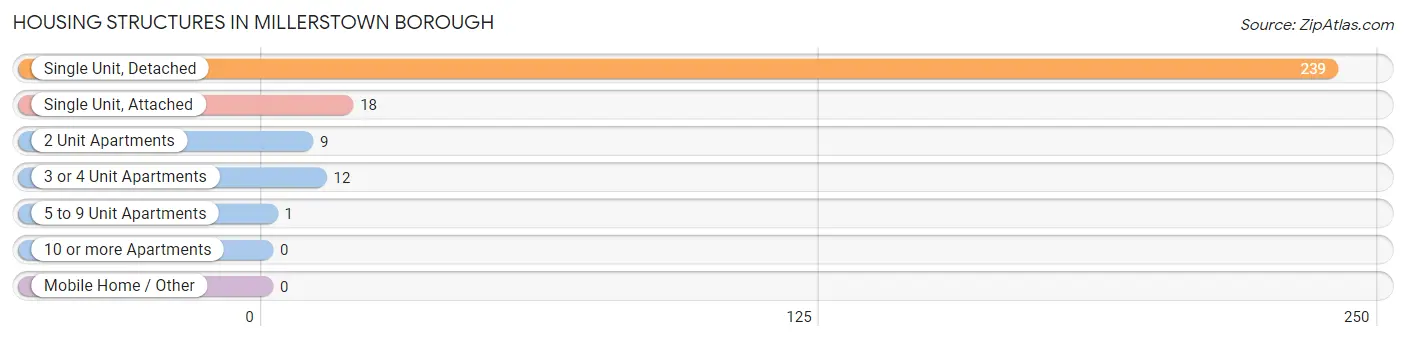
| Structure Type | # Housing Units | % Housing Units |
| Single Unit, Detached | 239 | 85.7% |
| Single Unit, Attached | 18 | 6.5% |
| 2 Unit Apartments | 9 | 3.2% |
| 3 or 4 Unit Apartments | 12 | 4.3% |
| 5 to 9 Unit Apartments | 1 | 0.4% |
| 10 or more Apartments | 0 | 0.0% |
| Mobile Home / Other | 0 | 0.0% |
| Total | 279 | 100.0% |
Housing Structures by Occupancy in Millerstown borough
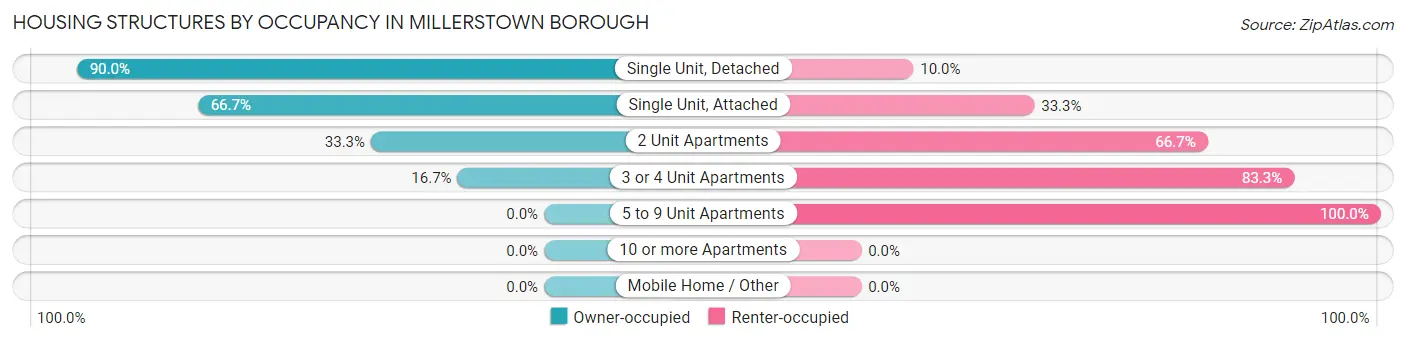
| Structure Type | Owner-occupied | Renter-occupied |
| Single Unit, Detached | 215 (90.0%) | 24 (10.0%) |
| Single Unit, Attached | 12 (66.7%) | 6 (33.3%) |
| 2 Unit Apartments | 3 (33.3%) | 6 (66.7%) |
| 3 or 4 Unit Apartments | 2 (16.7%) | 10 (83.3%) |
| 5 to 9 Unit Apartments | 0 (0.0%) | 1 (100.0%) |
| 10 or more Apartments | 0 (0.0%) | 0 (0.0%) |
| Mobile Home / Other | 0 (0.0%) | 0 (0.0%) |
| Total | 232 (83.2%) | 47 (16.9%) |
Housing Structures by Number of Rooms in Millerstown borough
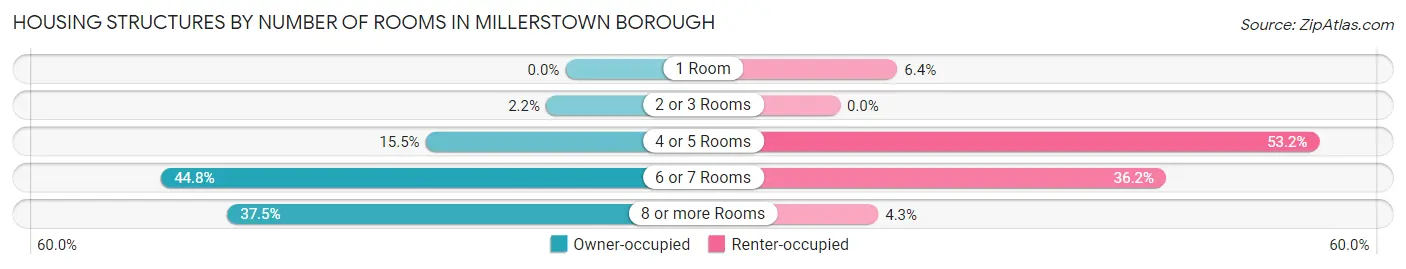
| Number of Rooms | Owner-occupied | Renter-occupied |
| 1 Room | 0 (0.0%) | 3 (6.4%) |
| 2 or 3 Rooms | 5 (2.2%) | 0 (0.0%) |
| 4 or 5 Rooms | 36 (15.5%) | 25 (53.2%) |
| 6 or 7 Rooms | 104 (44.8%) | 17 (36.2%) |
| 8 or more Rooms | 87 (37.5%) | 2 (4.3%) |
| Total | 232 (100.0%) | 47 (100.0%) |
Housing Structure by Heating Type in Millerstown borough
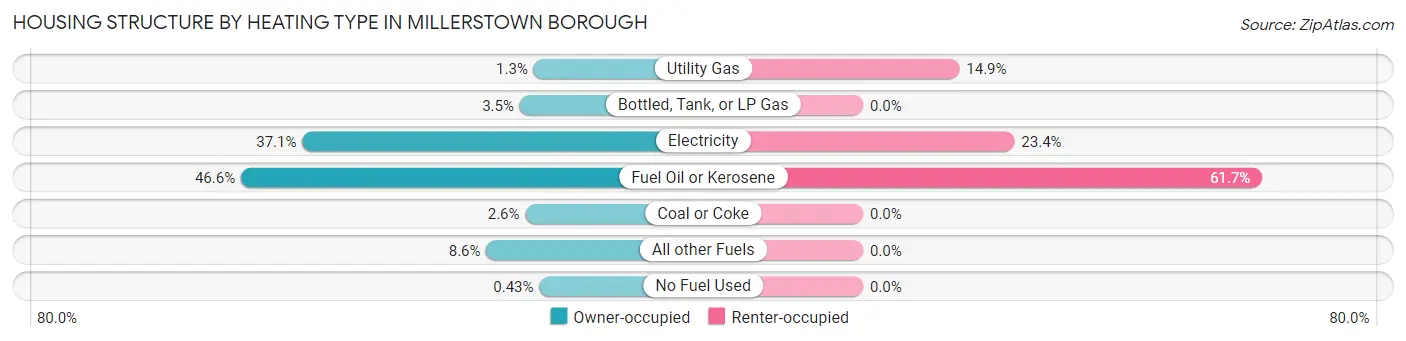
| Heating Type | Owner-occupied | Renter-occupied |
| Utility Gas | 3 (1.3%) | 7 (14.9%) |
| Bottled, Tank, or LP Gas | 8 (3.5%) | 0 (0.0%) |
| Electricity | 86 (37.1%) | 11 (23.4%) |
| Fuel Oil or Kerosene | 108 (46.6%) | 29 (61.7%) |
| Coal or Coke | 6 (2.6%) | 0 (0.0%) |
| All other Fuels | 20 (8.6%) | 0 (0.0%) |
| No Fuel Used | 1 (0.4%) | 0 (0.0%) |
| Total | 232 (100.0%) | 47 (100.0%) |
Household Vehicle Usage in Millerstown borough
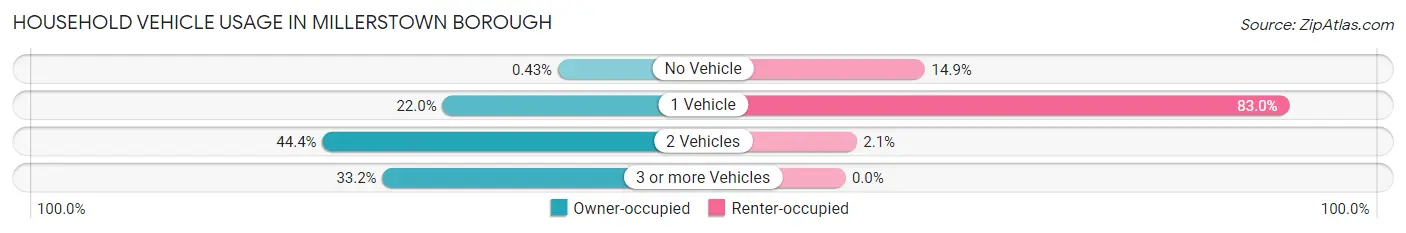
| Vehicles per Household | Owner-occupied | Renter-occupied |
| No Vehicle | 1 (0.4%) | 7 (14.9%) |
| 1 Vehicle | 51 (22.0%) | 39 (83.0%) |
| 2 Vehicles | 103 (44.4%) | 1 (2.1%) |
| 3 or more Vehicles | 77 (33.2%) | 0 (0.0%) |
| Total | 232 (100.0%) | 47 (100.0%) |
Real Estate & Mortgages in Millerstown borough
Real Estate and Mortgage Overview in Millerstown borough
| Characteristic | Without Mortgage | With Mortgage |
| Housing Units | 60 | 172 |
| Median Property Value | $185,000 | $178,300 |
| Median Household Income | $96,250 | $32 |
| Monthly Housing Costs | $711 | $2 |
| Real Estate Taxes | $2,952 | $0 |
Property Value by Mortgage Status in Millerstown borough
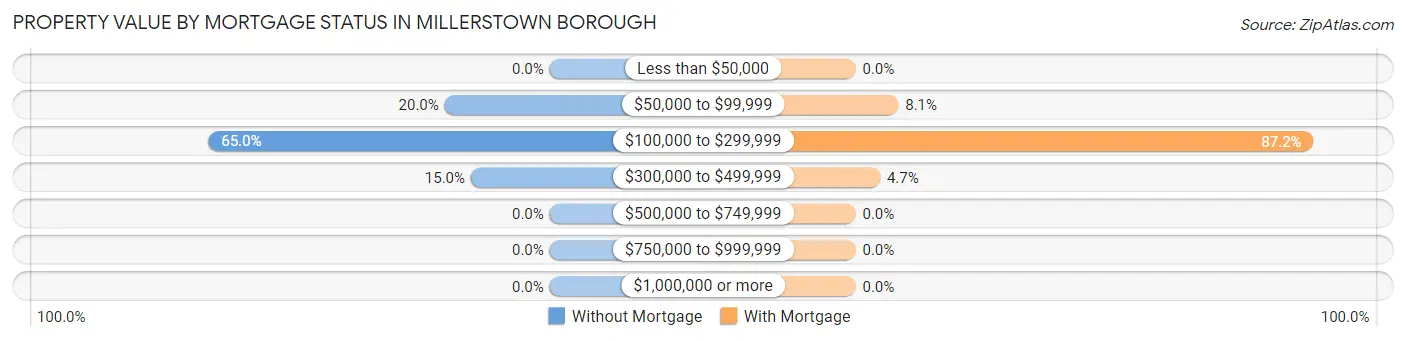
| Property Value | Without Mortgage | With Mortgage |
| Less than $50,000 | 0 (0.0%) | 0 (0.0%) |
| $50,000 to $99,999 | 12 (20.0%) | 14 (8.1%) |
| $100,000 to $299,999 | 39 (65.0%) | 150 (87.2%) |
| $300,000 to $499,999 | 9 (15.0%) | 8 (4.6%) |
| $500,000 to $749,999 | 0 (0.0%) | 0 (0.0%) |
| $750,000 to $999,999 | 0 (0.0%) | 0 (0.0%) |
| $1,000,000 or more | 0 (0.0%) | 0 (0.0%) |
| Total | 60 (100.0%) | 172 (100.0%) |
Household Income by Mortgage Status in Millerstown borough
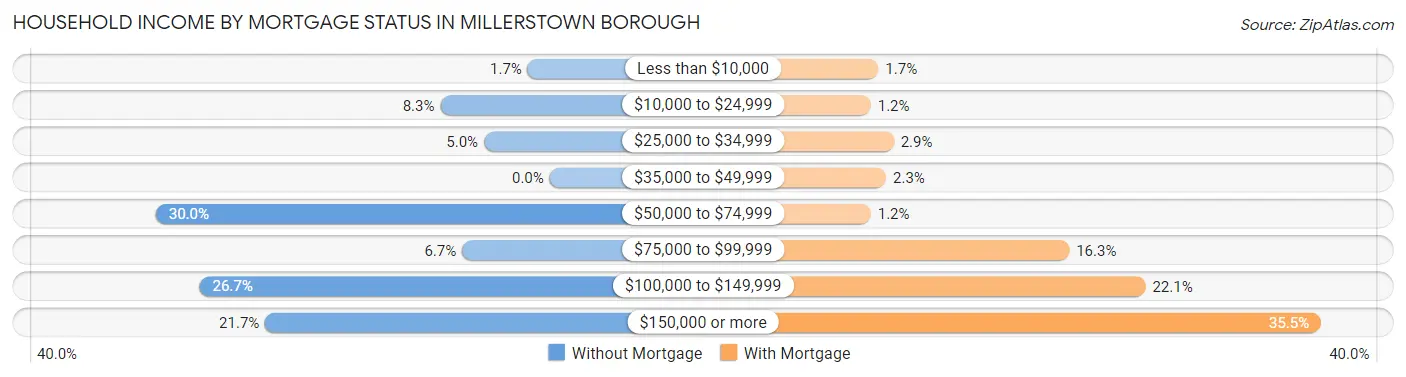
| Household Income | Without Mortgage | With Mortgage |
| Less than $10,000 | 1 (1.7%) | 3 (1.7%) |
| $10,000 to $24,999 | 5 (8.3%) | 2 (1.2%) |
| $25,000 to $34,999 | 3 (5.0%) | 5 (2.9%) |
| $35,000 to $49,999 | 0 (0.0%) | 4 (2.3%) |
| $50,000 to $74,999 | 18 (30.0%) | 2 (1.2%) |
| $75,000 to $99,999 | 4 (6.7%) | 28 (16.3%) |
| $100,000 to $149,999 | 16 (26.7%) | 38 (22.1%) |
| $150,000 or more | 13 (21.7%) | 61 (35.5%) |
| Total | 60 (100.0%) | 172 (100.0%) |
Property Value to Household Income Ratio in Millerstown borough
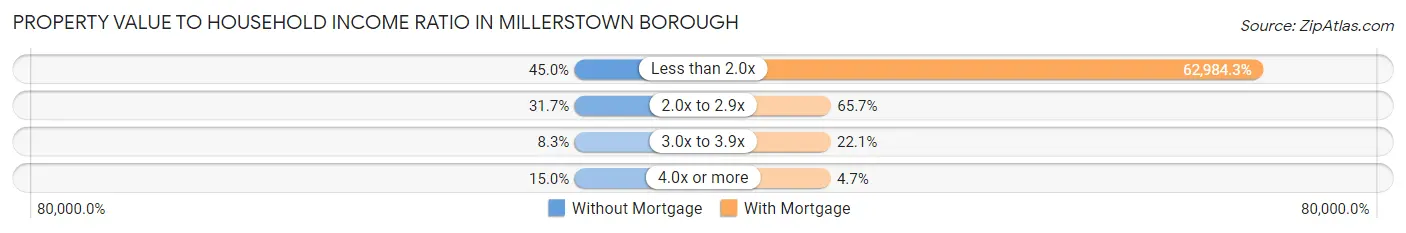
| Value-to-Income Ratio | Without Mortgage | With Mortgage |
| Less than 2.0x | 27 (45.0%) | 108,333 (62,984.3%) |
| 2.0x to 2.9x | 19 (31.7%) | 113 (65.7%) |
| 3.0x to 3.9x | 5 (8.3%) | 38 (22.1%) |
| 4.0x or more | 9 (15.0%) | 8 (4.6%) |
| Total | 60 (100.0%) | 172 (100.0%) |
Real Estate Taxes by Mortgage Status in Millerstown borough
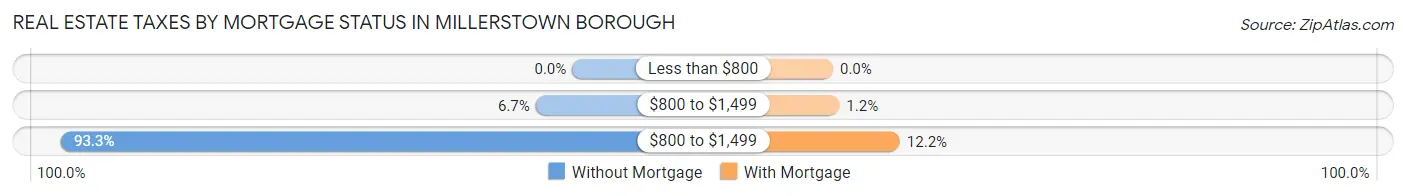
| Property Taxes | Without Mortgage | With Mortgage |
| Less than $800 | 0 (0.0%) | 0 (0.0%) |
| $800 to $1,499 | 4 (6.7%) | 2 (1.2%) |
| $800 to $1,499 | 56 (93.3%) | 21 (12.2%) |
| Total | 60 (100.0%) | 172 (100.0%) |
Health & Disability in Millerstown borough
Health Insurance Coverage by Age in Millerstown borough
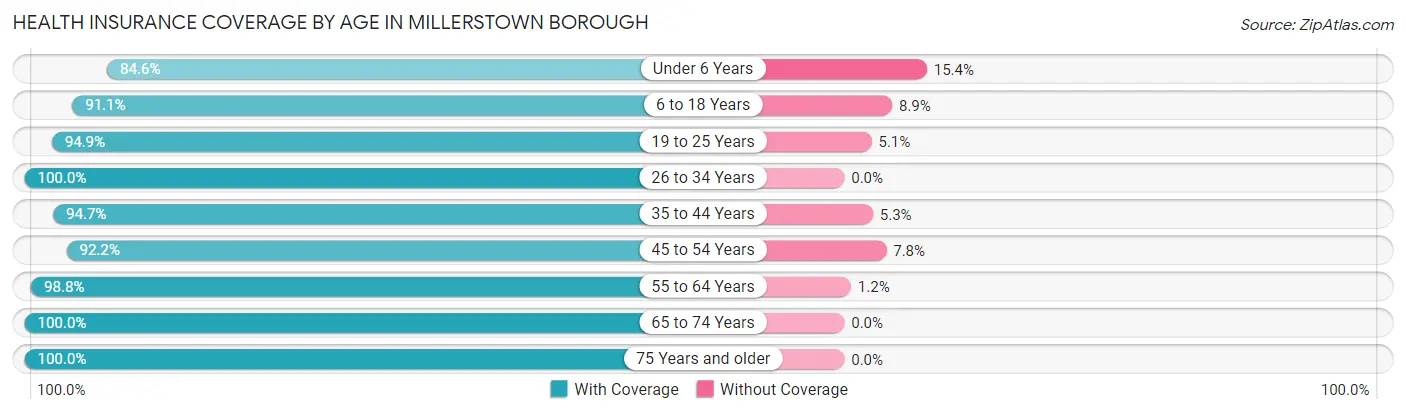
| Age Bracket | With Coverage | Without Coverage |
| Under 6 Years | 33 (84.6%) | 6 (15.4%) |
| 6 to 18 Years | 133 (91.1%) | 13 (8.9%) |
| 19 to 25 Years | 56 (94.9%) | 3 (5.1%) |
| 26 to 34 Years | 76 (100.0%) | 0 (0.0%) |
| 35 to 44 Years | 71 (94.7%) | 4 (5.3%) |
| 45 to 54 Years | 106 (92.2%) | 9 (7.8%) |
| 55 to 64 Years | 80 (98.8%) | 1 (1.2%) |
| 65 to 74 Years | 105 (100.0%) | 0 (0.0%) |
| 75 Years and older | 36 (100.0%) | 0 (0.0%) |
| Total | 696 (95.1%) | 36 (4.9%) |
Health Insurance Coverage by Citizenship Status in Millerstown borough
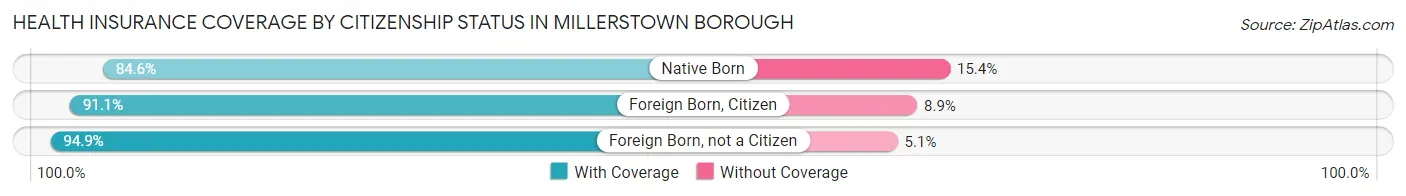
| Citizenship Status | With Coverage | Without Coverage |
| Native Born | 33 (84.6%) | 6 (15.4%) |
| Foreign Born, Citizen | 133 (91.1%) | 13 (8.9%) |
| Foreign Born, not a Citizen | 56 (94.9%) | 3 (5.1%) |
Health Insurance Coverage by Household Income in Millerstown borough
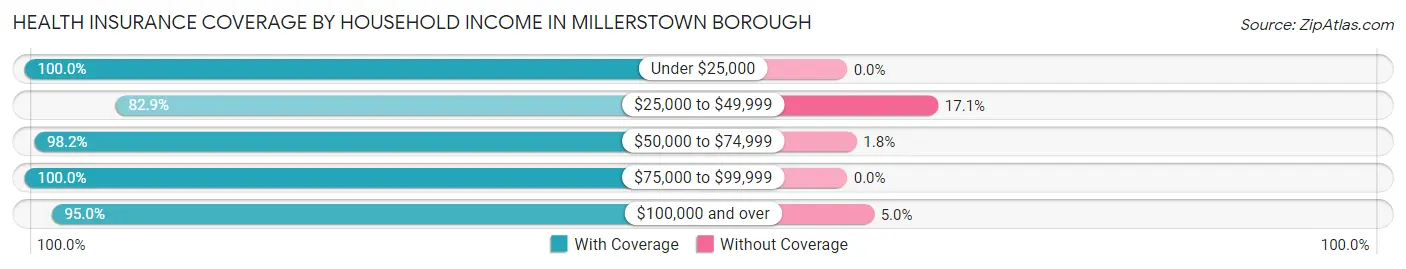
| Household Income | With Coverage | Without Coverage |
| Under $25,000 | 35 (100.0%) | 0 (0.0%) |
| $25,000 to $49,999 | 68 (82.9%) | 14 (17.1%) |
| $50,000 to $74,999 | 109 (98.2%) | 2 (1.8%) |
| $75,000 to $99,999 | 107 (100.0%) | 0 (0.0%) |
| $100,000 and over | 377 (95.0%) | 20 (5.0%) |
Public vs Private Health Insurance Coverage by Age in Millerstown borough
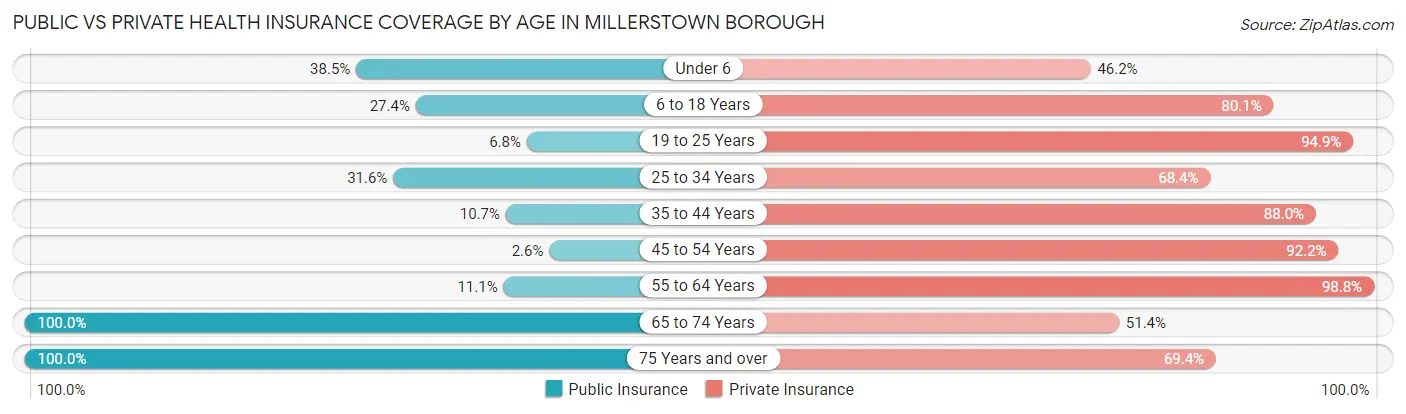
| Age Bracket | Public Insurance | Private Insurance |
| Under 6 | 15 (38.5%) | 18 (46.2%) |
| 6 to 18 Years | 40 (27.4%) | 117 (80.1%) |
| 19 to 25 Years | 4 (6.8%) | 56 (94.9%) |
| 25 to 34 Years | 24 (31.6%) | 52 (68.4%) |
| 35 to 44 Years | 8 (10.7%) | 66 (88.0%) |
| 45 to 54 Years | 3 (2.6%) | 106 (92.2%) |
| 55 to 64 Years | 9 (11.1%) | 80 (98.8%) |
| 65 to 74 Years | 105 (100.0%) | 54 (51.4%) |
| 75 Years and over | 36 (100.0%) | 25 (69.4%) |
| Total | 244 (33.3%) | 574 (78.4%) |
Disability Status by Sex by Age in Millerstown borough
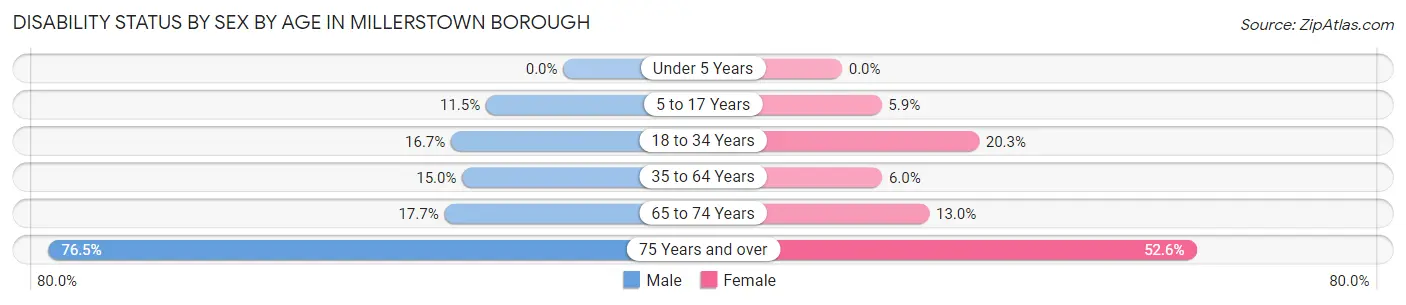
| Age Bracket | Male | Female |
| Under 5 Years | 0 (0.0%) | 0 (0.0%) |
| 5 to 17 Years | 7 (11.5%) | 5 (5.9%) |
| 18 to 34 Years | 13 (16.7%) | 12 (20.3%) |
| 35 to 64 Years | 18 (15.0%) | 9 (6.0%) |
| 65 to 74 Years | 9 (17.6%) | 7 (13.0%) |
| 75 Years and over | 13 (76.5%) | 10 (52.6%) |
Disability Class by Sex by Age in Millerstown borough
Disability Class: Hearing Difficulty
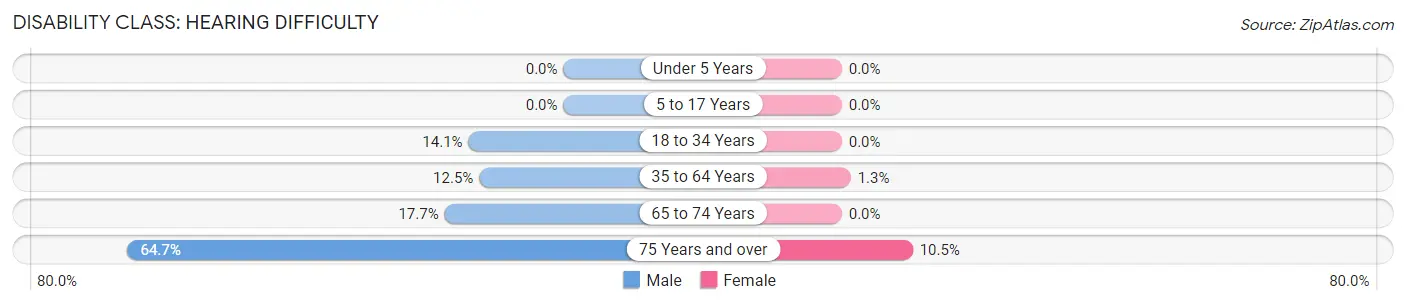
| Age Bracket | Male | Female |
| Under 5 Years | 0 (0.0%) | 0 (0.0%) |
| 5 to 17 Years | 0 (0.0%) | 0 (0.0%) |
| 18 to 34 Years | 11 (14.1%) | 0 (0.0%) |
| 35 to 64 Years | 15 (12.5%) | 2 (1.3%) |
| 65 to 74 Years | 9 (17.6%) | 0 (0.0%) |
| 75 Years and over | 11 (64.7%) | 2 (10.5%) |
Disability Class: Vision Difficulty
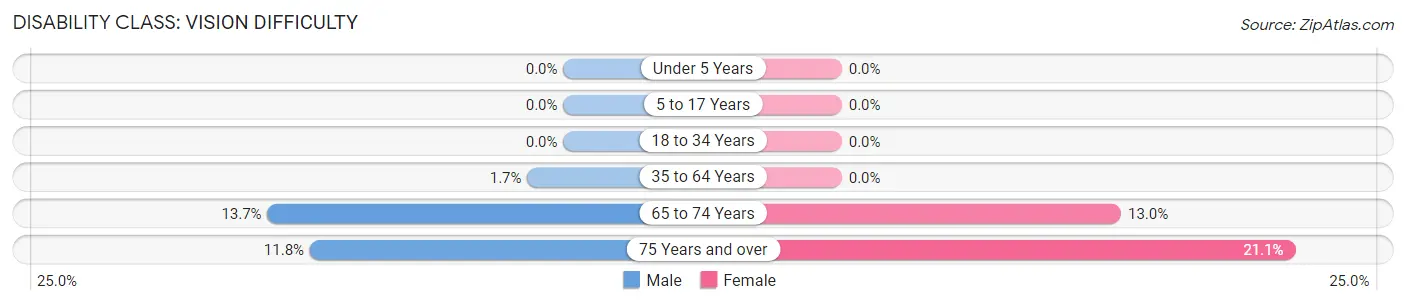
| Age Bracket | Male | Female |
| Under 5 Years | 0 (0.0%) | 0 (0.0%) |
| 5 to 17 Years | 0 (0.0%) | 0 (0.0%) |
| 18 to 34 Years | 0 (0.0%) | 0 (0.0%) |
| 35 to 64 Years | 2 (1.7%) | 0 (0.0%) |
| 65 to 74 Years | 7 (13.7%) | 7 (13.0%) |
| 75 Years and over | 2 (11.8%) | 4 (21.0%) |
Disability Class: Cognitive Difficulty
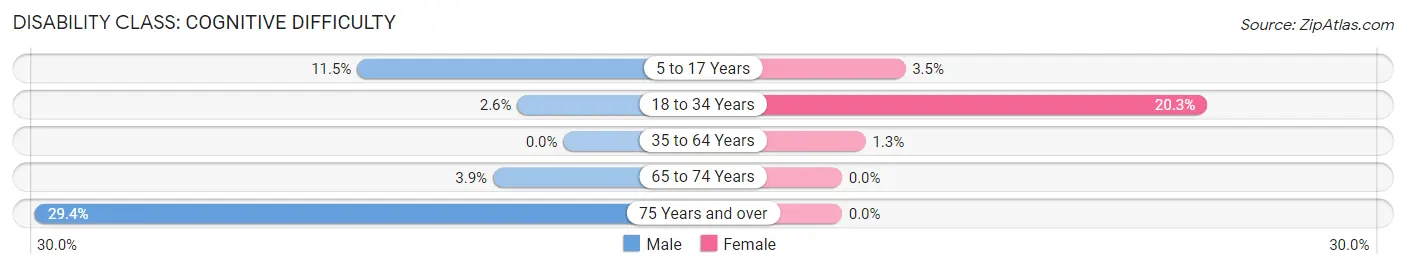
| Age Bracket | Male | Female |
| 5 to 17 Years | 7 (11.5%) | 3 (3.5%) |
| 18 to 34 Years | 2 (2.6%) | 12 (20.3%) |
| 35 to 64 Years | 0 (0.0%) | 2 (1.3%) |
| 65 to 74 Years | 2 (3.9%) | 0 (0.0%) |
| 75 Years and over | 5 (29.4%) | 0 (0.0%) |
Disability Class: Ambulatory Difficulty
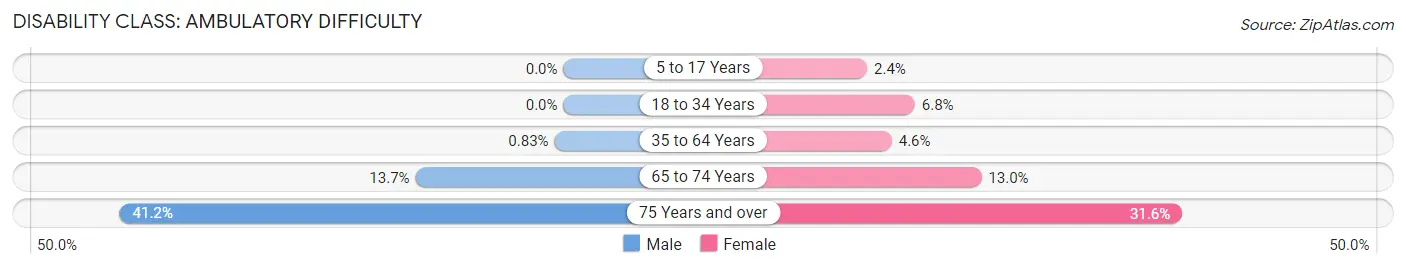
| Age Bracket | Male | Female |
| 5 to 17 Years | 0 (0.0%) | 2 (2.4%) |
| 18 to 34 Years | 0 (0.0%) | 4 (6.8%) |
| 35 to 64 Years | 1 (0.8%) | 7 (4.6%) |
| 65 to 74 Years | 7 (13.7%) | 7 (13.0%) |
| 75 Years and over | 7 (41.2%) | 6 (31.6%) |
Disability Class: Self-Care Difficulty
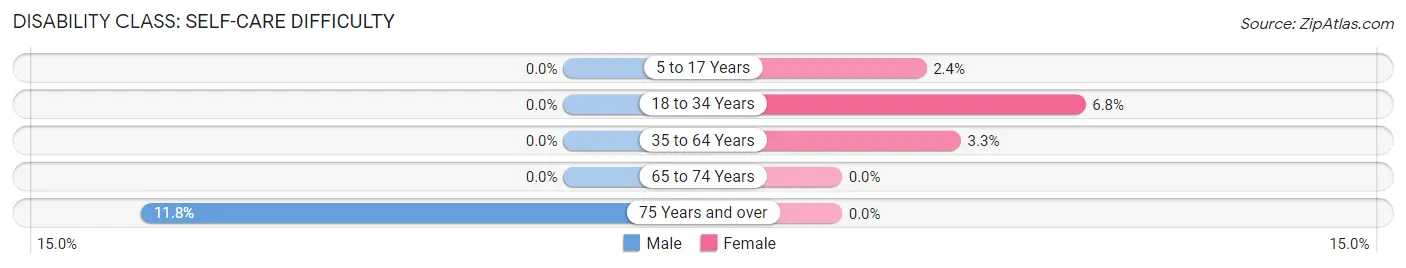
| Age Bracket | Male | Female |
| 5 to 17 Years | 0 (0.0%) | 2 (2.4%) |
| 18 to 34 Years | 0 (0.0%) | 4 (6.8%) |
| 35 to 64 Years | 0 (0.0%) | 5 (3.3%) |
| 65 to 74 Years | 0 (0.0%) | 0 (0.0%) |
| 75 Years and over | 2 (11.8%) | 0 (0.0%) |
Technology Access in Millerstown borough
Computing Device Access in Millerstown borough
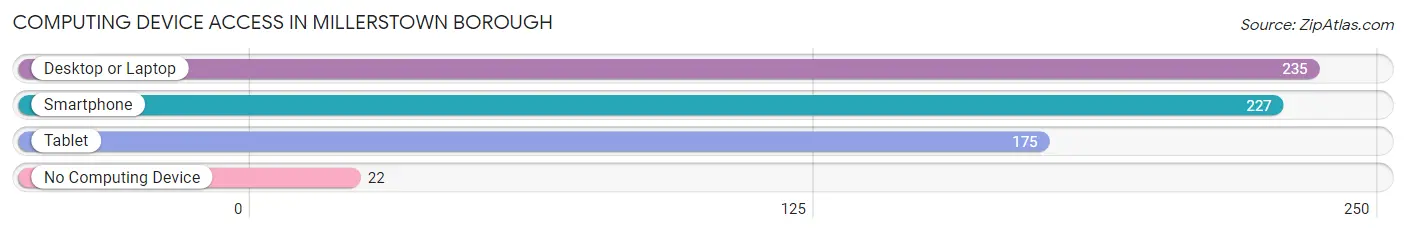
| Device Type | # Households | % Households |
| Desktop or Laptop | 235 | 84.2% |
| Smartphone | 227 | 81.4% |
| Tablet | 175 | 62.7% |
| No Computing Device | 22 | 7.9% |
| Total | 279 | 100.0% |
Internet Access in Millerstown borough
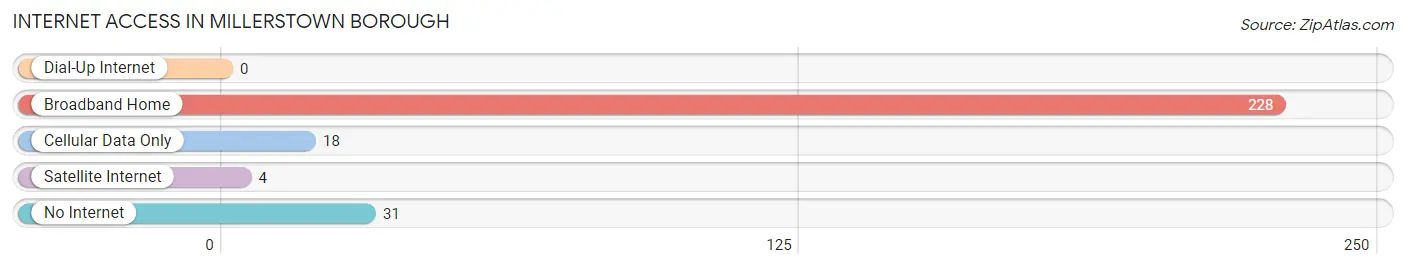
| Internet Type | # Households | % Households |
| Dial-Up Internet | 0 | 0.0% |
| Broadband Home | 228 | 81.7% |
| Cellular Data Only | 18 | 6.5% |
| Satellite Internet | 4 | 1.4% |
| No Internet | 31 | 11.1% |
| Total | 279 | 100.0% |
Millerstown borough Summary
Mosserstown Borough is a small borough located in Perry County, Pennsylvania. It is situated in the Susquehanna Valley, approximately 10 miles south of Harrisburg, the state capital. The borough was incorporated in 1864 and has a population of approximately 1,000 people.
History
Mosserstown Borough was founded in 1864 by John Mosser, a German immigrant who had settled in the area in the early 1800s. Mosser purchased a large tract of land in the area and began to develop it into a small village. He built a sawmill, a gristmill, and a store, and the village quickly grew. By the late 1800s, Mosserstown had become a thriving community with a post office, a school, and several churches.
In the early 1900s, the borough experienced a period of growth and prosperity. The population increased, and new businesses opened. The borough also became a popular tourist destination, with visitors coming to enjoy the scenic beauty of the Susquehanna Valley.
In the mid-1900s, the borough began to decline. The population decreased, and many businesses closed. In the late 1970s, the borough was declared a “distressed municipality” by the state of Pennsylvania. This designation allowed the borough to receive state and federal funds to help revitalize the area.
In the late 1990s, the borough began to experience a resurgence. New businesses opened, and the population began to increase. Today, Mosserstown is a vibrant community with a strong sense of community pride.
Geography
Mosserstown Borough is located in the Susquehanna Valley, approximately 10 miles south of Harrisburg, the state capital. The borough is situated on the east bank of the Susquehanna River, and is bordered by the townships of Rye, Liverpool, and Rye. The borough covers an area of 0.6 square miles, and has a population of approximately 1,000 people.
The borough is located in a rural area, and is surrounded by rolling hills and farmland. The climate is temperate, with hot summers and cold winters. The average annual temperature is 54 degrees Fahrenheit, and the average annual precipitation is 40 inches.
Economy
Mosserstown Borough has a diverse economy. The largest employers in the borough are the local school district, the county government, and the local hospital. Other major employers include manufacturing companies, retail stores, and restaurants.
The borough also has a thriving tourism industry. Visitors come to the area to enjoy the scenic beauty of the Susquehanna Valley, as well as to visit the many historical sites in the area.
Demographics
As of the 2010 census, the population of Mosserstown Borough was 1,000 people. The racial makeup of the borough was 97.2% White, 0.7% African American, 0.3% Native American, 0.3% Asian, and 1.5% from other races. The median household income was $41,250, and the median family income was $50,000.
The borough is served by the Susquenita School District. The district has one elementary school, one middle school, and one high school. The district also has a vocational-technical school.
Conclusion
Mosserstown Borough is a small borough located in Perry County, Pennsylvania. It was founded in 1864 by John Mosser, and has a population of approximately 1,000 people. The borough has a diverse economy, and is a popular tourist destination. The population is predominantly White, and the median household income is $41,250. The borough is served by the Susquenita School District, and has a strong sense of community pride.
Common Questions
What is Per Capita Income in Millerstown borough?
Per Capita income in Millerstown borough is $36,790.
What is the Median Family Income in Millerstown borough?
Median Family Income in Millerstown borough is $111,000.
What is the Median Household income in Millerstown borough?
Median Household Income in Millerstown borough is $88,125.
What is Income or Wage Gap in Millerstown borough?
Income or Wage Gap in Millerstown borough is 55.2%.
Women in Millerstown borough earn 44.8 cents for every dollar earned by a man.
What is Inequality or Gini Index in Millerstown borough?
Inequality or Gini Index in Millerstown borough is 0.33.
What is the Total Population of Millerstown borough?
Total Population of Millerstown borough is 732.
What is the Total Male Population of Millerstown borough?
Total Male Population of Millerstown borough is 341.
What is the Total Female Population of Millerstown borough?
Total Female Population of Millerstown borough is 391.
What is the Ratio of Males per 100 Females in Millerstown borough?
There are 87.21 Males per 100 Females in Millerstown borough.
What is the Ratio of Females per 100 Males in Millerstown borough?
There are 114.66 Females per 100 Males in Millerstown borough.
What is the Median Population Age in Millerstown borough?
Median Population Age in Millerstown borough is 41.0 Years.
What is the Average Family Size in Millerstown borough
Average Family Size in Millerstown borough is 3.0 People.
What is the Average Household Size in Millerstown borough
Average Household Size in Millerstown borough is 2.6 People.
How Large is the Labor Force in Millerstown borough?
There are 351 People in the Labor Forcein in Millerstown borough.
What is the Percentage of People in the Labor Force in Millerstown borough?
60.9% of People are in the Labor Force in Millerstown borough.
What is the Unemployment Rate in Millerstown borough?
Unemployment Rate in Millerstown borough is 2.3%.