Millersburg borough, PA Map & Demographics
Millersburg borough Overview
$29,369
PER CAPITA INCOME
$71,953
AVG FAMILY INCOME
$63,220
AVG HOUSEHOLD INCOME
40.9%
WAGE / INCOME GAP [ % ]
59.1¢/ $1
WAGE / INCOME GAP [ $ ]
$16,520
FAMILY INCOME DEFICIT
0.34
INEQUALITY / GINI INDEX
2,546
TOTAL POPULATION
1,271
MALE POPULATION
1,275
FEMALE POPULATION
99.69
MALES / 100 FEMALES
100.31
FEMALES / 100 MALES
35.3
MEDIAN AGE
3.1
AVG FAMILY SIZE
2.3
AVG HOUSEHOLD SIZE
1,301
LABOR FORCE [ PEOPLE ]
66.9%
PERCENT IN LABOR FORCE
0.8%
UNEMPLOYMENT RATE
Income in Millersburg borough
Income Overview in Millersburg borough
Per Capita Income in Millersburg borough is $29,369, while median incomes of families and households are $71,953 and $63,220 respectively.
| Characteristic | Number | Measure |
| Per Capita Income | 2,546 | $29,369 |
| Median Family Income | 617 | $71,953 |
| Mean Family Income | 617 | $72,292 |
| Median Household Income | 1,124 | $63,220 |
| Mean Household Income | 1,124 | $67,603 |
| Income Deficit | 617 | $16,520 |
| Wage / Income Gap (%) | 2,546 | 40.92% |
| Wage / Income Gap ($) | 2,546 | 59.08¢ per $1 |
| Gini / Inequality Index | 2,546 | 0.34 |
Earnings by Sex in Millersburg borough
Average Earnings in Millersburg borough are $39,055, $44,345 for men and $26,198 for women, a difference of 40.9%.
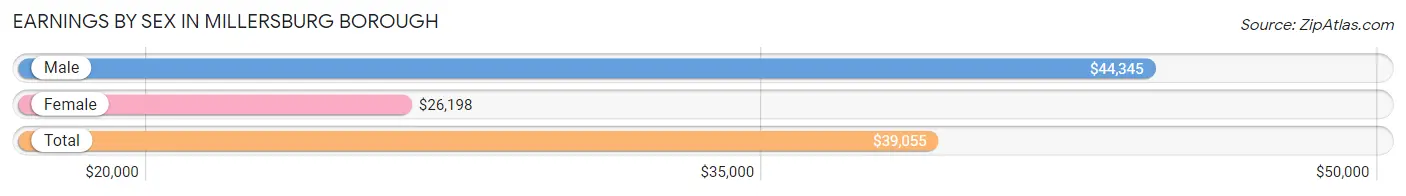
| Sex | Number | Average Earnings |
| Male | 765 (56.8%) | $44,345 |
| Female | 581 (43.2%) | $26,198 |
| Total | 1,346 (100.0%) | $39,055 |
Earnings by Sex by Income Bracket in Millersburg borough
The most common earnings brackets in Millersburg borough are $55,000 to $64,999 for men (140 | 18.3%) and $2,500 to $4,999 for women (73 | 12.6%).
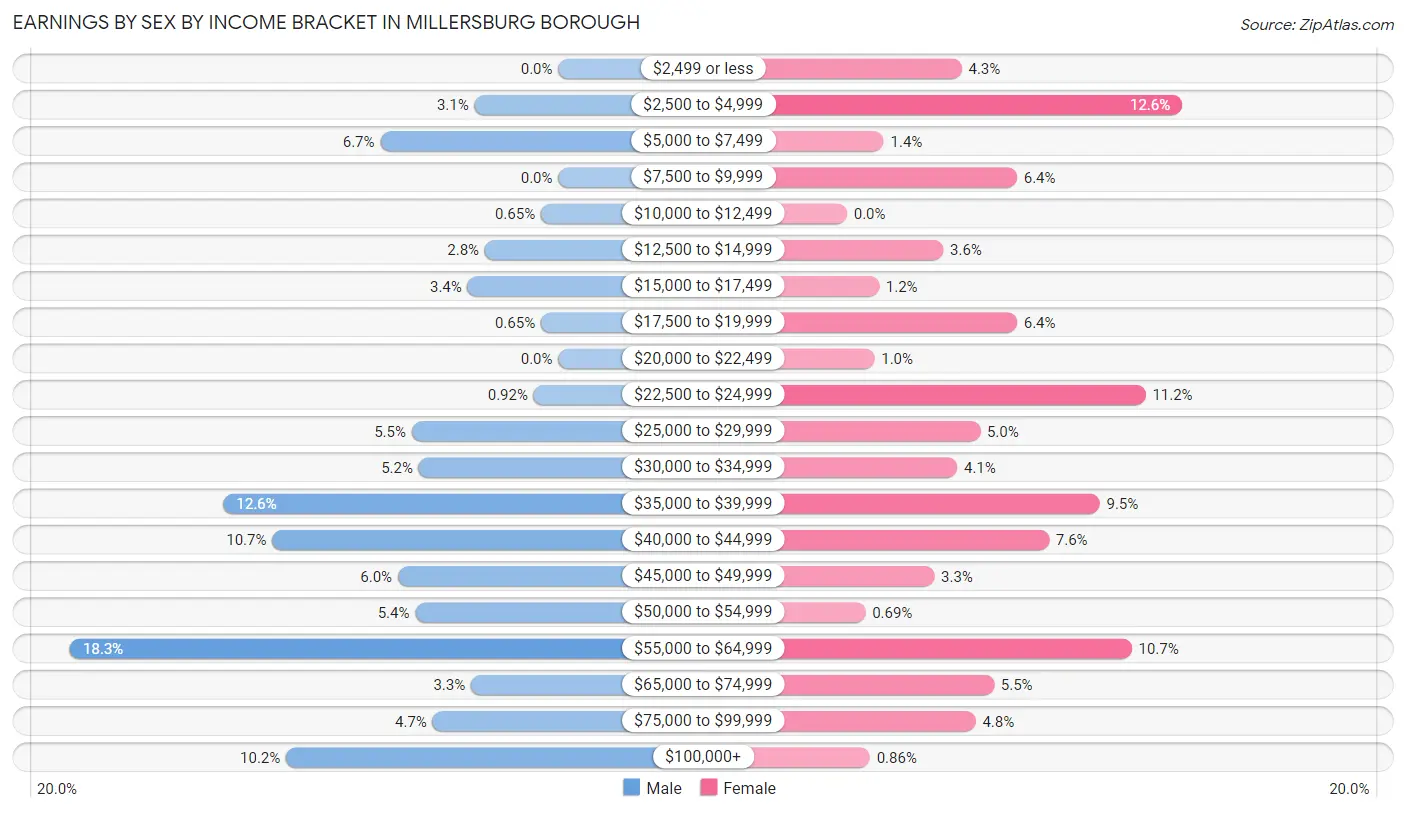
| Income | Male | Female |
| $2,499 or less | 0 (0.0%) | 25 (4.3%) |
| $2,500 to $4,999 | 24 (3.1%) | 73 (12.6%) |
| $5,000 to $7,499 | 51 (6.7%) | 8 (1.4%) |
| $7,500 to $9,999 | 0 (0.0%) | 37 (6.4%) |
| $10,000 to $12,499 | 5 (0.6%) | 0 (0.0%) |
| $12,500 to $14,999 | 21 (2.8%) | 21 (3.6%) |
| $15,000 to $17,499 | 26 (3.4%) | 7 (1.2%) |
| $17,500 to $19,999 | 5 (0.6%) | 37 (6.4%) |
| $20,000 to $22,499 | 0 (0.0%) | 6 (1.0%) |
| $22,500 to $24,999 | 7 (0.9%) | 65 (11.2%) |
| $25,000 to $29,999 | 42 (5.5%) | 29 (5.0%) |
| $30,000 to $34,999 | 40 (5.2%) | 24 (4.1%) |
| $35,000 to $39,999 | 96 (12.6%) | 55 (9.5%) |
| $40,000 to $44,999 | 82 (10.7%) | 44 (7.6%) |
| $45,000 to $49,999 | 46 (6.0%) | 19 (3.3%) |
| $50,000 to $54,999 | 41 (5.4%) | 4 (0.7%) |
| $55,000 to $64,999 | 140 (18.3%) | 62 (10.7%) |
| $65,000 to $74,999 | 25 (3.3%) | 32 (5.5%) |
| $75,000 to $99,999 | 36 (4.7%) | 28 (4.8%) |
| $100,000+ | 78 (10.2%) | 5 (0.9%) |
| Total | 765 (100.0%) | 581 (100.0%) |
Earnings by Sex by Educational Attainment in Millersburg borough
Average earnings in Millersburg borough are $48,261 for men and $35,111 for women, a difference of 27.3%. Men with an educational attainment of bachelor's degree enjoy the highest average annual earnings of $54,432, while those with high school diploma education earn the least with $39,289. Women with an educational attainment of graduate degree earn the most with the average annual earnings of $68,750, while those with high school diploma education have the smallest earnings of $23,875.
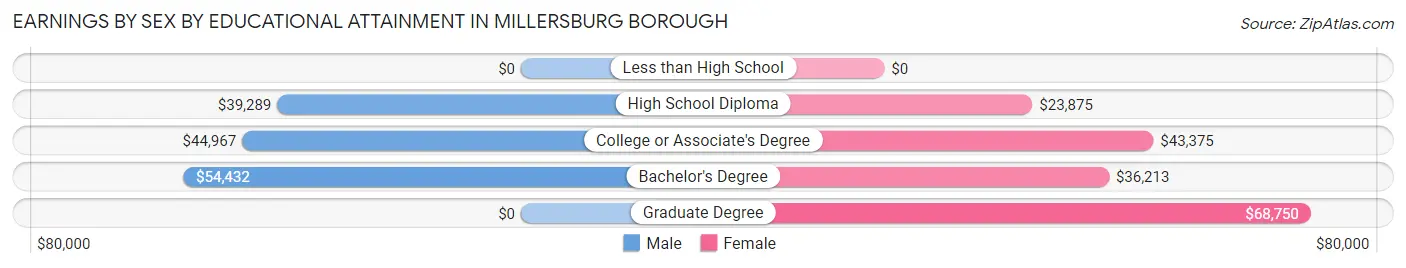
| Educational Attainment | Male Income | Female Income |
| Less than High School | - | - |
| High School Diploma | $39,289 | $23,875 |
| College or Associate's Degree | $44,967 | $43,375 |
| Bachelor's Degree | $54,432 | $36,213 |
| Graduate Degree | - | - |
| Total | $48,261 | $35,111 |
Family Income in Millersburg borough
Family Income Brackets in Millersburg borough
According to the Millersburg borough family income data, there are 168 families falling into the $75,000 to $99,999 income range, which is the most common income bracket and makes up 27.2% of all families.
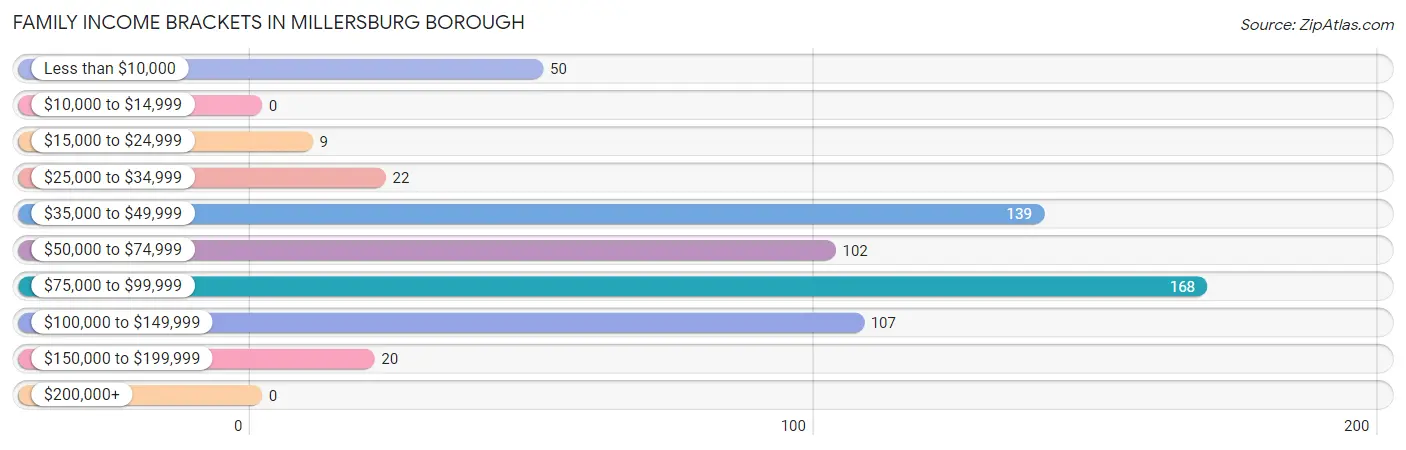
| Income Bracket | # Families | % Families |
| Less than $10,000 | 50 | 8.1% |
| $10,000 to $14,999 | 0 | 0.0% |
| $15,000 to $24,999 | 9 | 1.5% |
| $25,000 to $34,999 | 22 | 3.6% |
| $35,000 to $49,999 | 139 | 22.5% |
| $50,000 to $74,999 | 102 | 16.5% |
| $75,000 to $99,999 | 168 | 27.2% |
| $100,000 to $149,999 | 107 | 17.3% |
| $150,000 to $199,999 | 20 | 3.2% |
| $200,000+ | 0 | 0.0% |
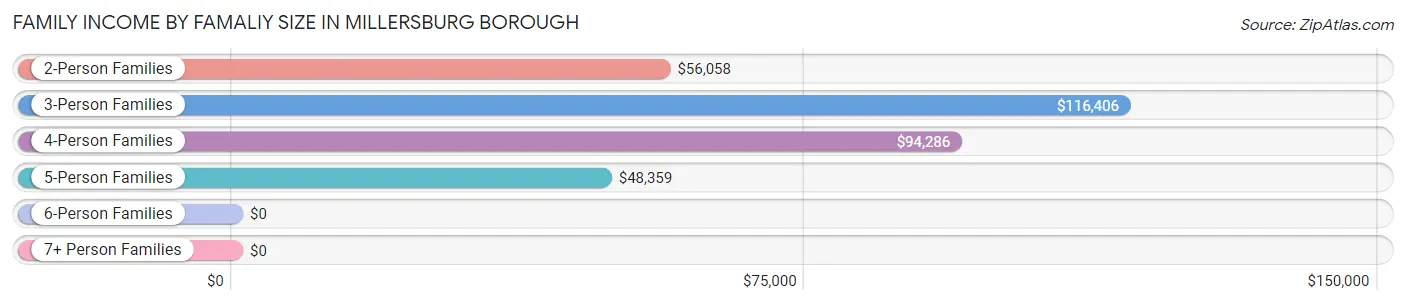
Family Income by Famaliy Size in Millersburg borough
3-person families (39 | 6.3%) account for the highest median family income in Millersburg borough with $116,406 per family, while 3-person families (39 | 6.3%) have the highest median income of $38,802 per family member.
| Income Bracket | # Families | Median Income |
| 2-Person Families | 310 (50.2%) | $56,058 |
| 3-Person Families | 39 (6.3%) | $116,406 |
| 4-Person Families | 162 (26.3%) | $94,286 |
| 5-Person Families | 71 (11.5%) | $48,359 |
| 6-Person Families | 19 (3.1%) | $0 |
| 7+ Person Families | 16 (2.6%) | $0 |
| Total | 617 (100.0%) | $71,953 |
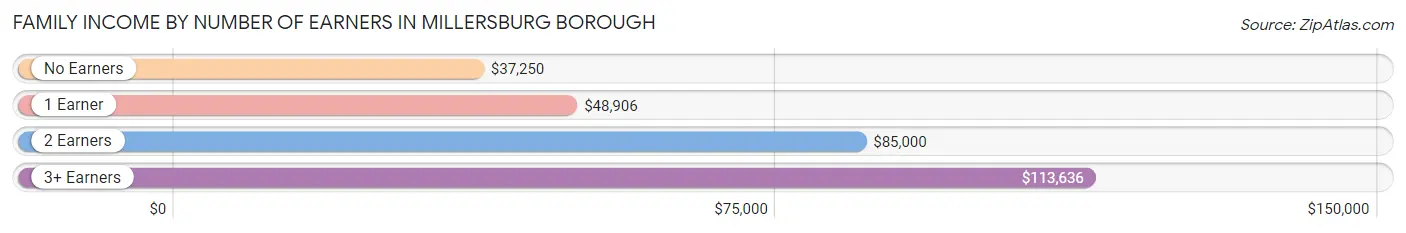
Family Income by Number of Earners in Millersburg borough
The median family income in Millersburg borough is $71,953, with families comprising 3+ earners (80) having the highest median family income of $113,636, while families with no earners (95) have the lowest median family income of $37,250, accounting for 13.0% and 15.4% of families, respectively.
| Number of Earners | # Families | Median Income |
| No Earners | 95 (15.4%) | $37,250 |
| 1 Earner | 126 (20.4%) | $48,906 |
| 2 Earners | 316 (51.2%) | $85,000 |
| 3+ Earners | 80 (13.0%) | $113,636 |
| Total | 617 (100.0%) | $71,953 |
Household Income in Millersburg borough
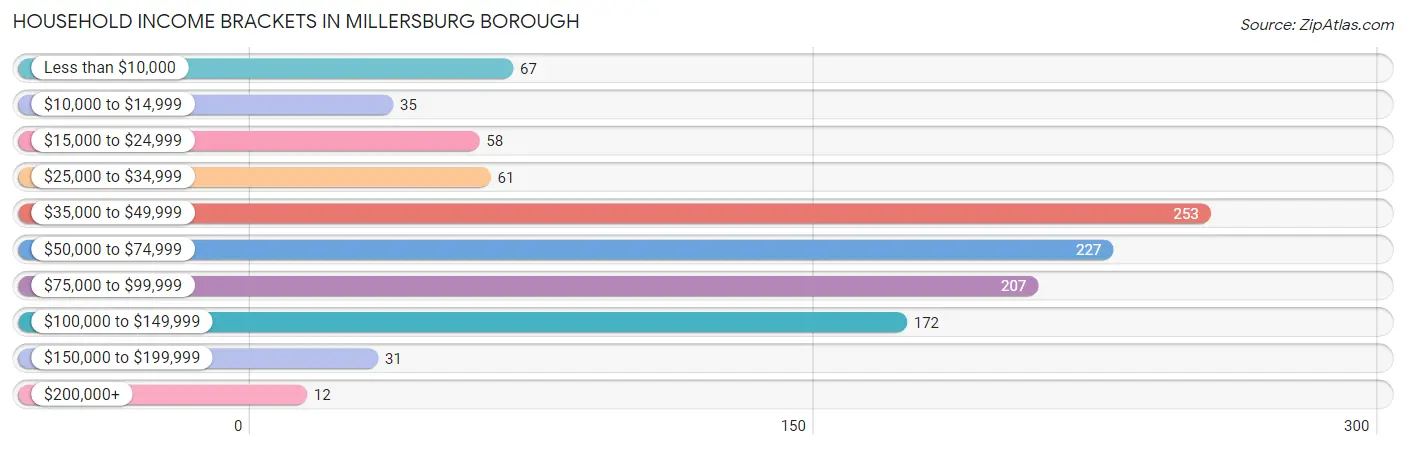
Household Income Brackets in Millersburg borough
With 253 households falling in the category, the $35,000 to $49,999 income range is the most frequent in Millersburg borough, accounting for 22.5% of all households. In contrast, only 12 households (1.1%) fall into the $200,000+ income bracket, making it the least populous group.
| Income Bracket | # Households | % Households |
| Less than $10,000 | 67 | 6.0% |
| $10,000 to $14,999 | 35 | 3.1% |
| $15,000 to $24,999 | 58 | 5.2% |
| $25,000 to $34,999 | 61 | 5.4% |
| $35,000 to $49,999 | 253 | 22.5% |
| $50,000 to $74,999 | 227 | 20.2% |
| $75,000 to $99,999 | 207 | 18.4% |
| $100,000 to $149,999 | 172 | 15.3% |
| $150,000 to $199,999 | 31 | 2.8% |
| $200,000+ | 12 | 1.1% |
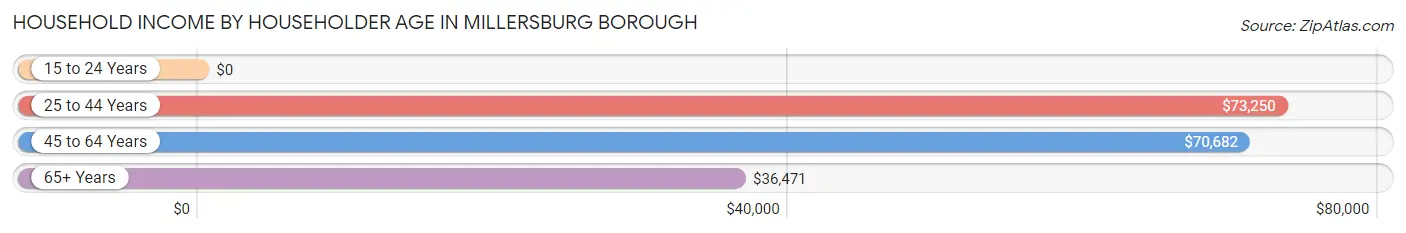
Household Income by Householder Age in Millersburg borough
The median household income in Millersburg borough is $63,220, with the highest median household income of $73,250 found in the 25 to 44 years age bracket for the primary householder. A total of 379 households (33.7%) fall into this category. Meanwhile, the 15 to 24 years age bracket for the primary householder has the lowest median household income of $0, with 41 households (3.6%) in this group.
| Income Bracket | # Households | Median Income |
| 15 to 24 Years | 41 (3.6%) | $0 |
| 25 to 44 Years | 379 (33.7%) | $73,250 |
| 45 to 64 Years | 378 (33.6%) | $70,682 |
| 65+ Years | 326 (29.0%) | $36,471 |
| Total | 1,124 (100.0%) | $63,220 |
Poverty in Millersburg borough
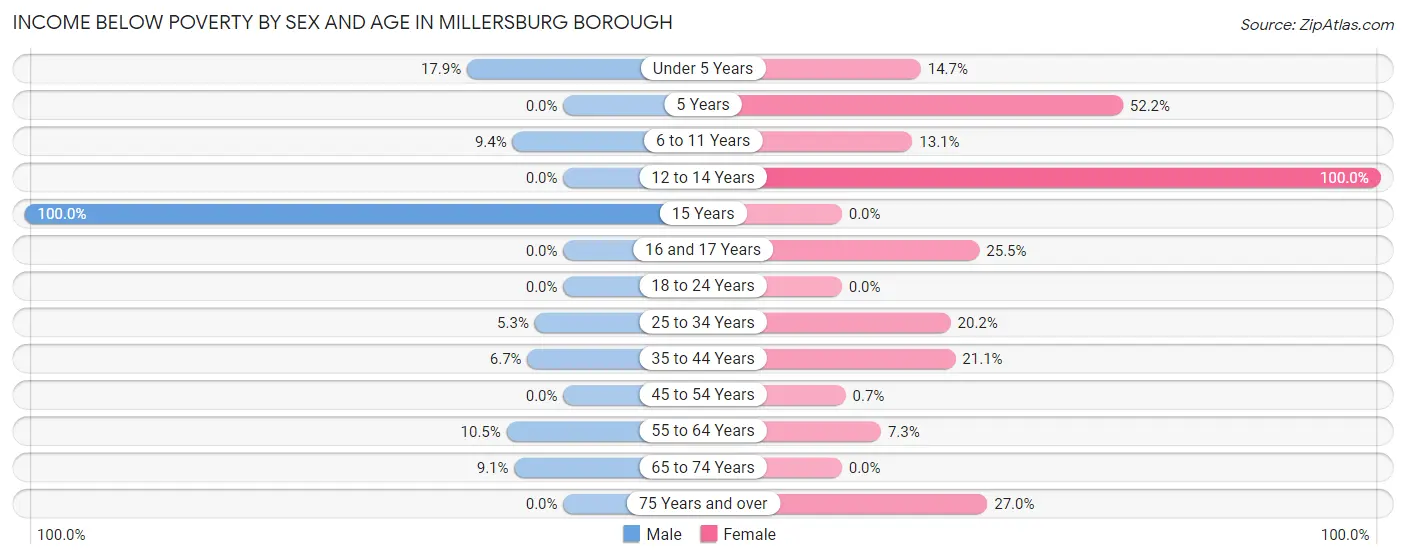
Income Below Poverty by Sex and Age in Millersburg borough
With 6.0% poverty level for males and 17.6% for females among the residents of Millersburg borough, 15 year old males and 12 to 14 year old females are the most vulnerable to poverty, with 5 males (100.0%) and 29 females (100.0%) in their respective age groups living below the poverty level.
| Age Bracket | Male | Female |
| Under 5 Years | 17 (17.9%) | 17 (14.7%) |
| 5 Years | 0 (0.0%) | 24 (52.2%) |
| 6 to 11 Years | 10 (9.4%) | 19 (13.1%) |
| 12 to 14 Years | 0 (0.0%) | 29 (100.0%) |
| 15 Years | 5 (100.0%) | 0 (0.0%) |
| 16 and 17 Years | 0 (0.0%) | 12 (25.5%) |
| 18 to 24 Years | 0 (0.0%) | 0 (0.0%) |
| 25 to 34 Years | 11 (5.3%) | 41 (20.2%) |
| 35 to 44 Years | 12 (6.7%) | 31 (21.1%) |
| 45 to 54 Years | 0 (0.0%) | 1 (0.7%) |
| 55 to 64 Years | 16 (10.5%) | 4 (7.3%) |
| 65 to 74 Years | 5 (9.1%) | 0 (0.0%) |
| 75 Years and over | 0 (0.0%) | 47 (27.0%) |
| Total | 76 (6.0%) | 225 (17.6%) |
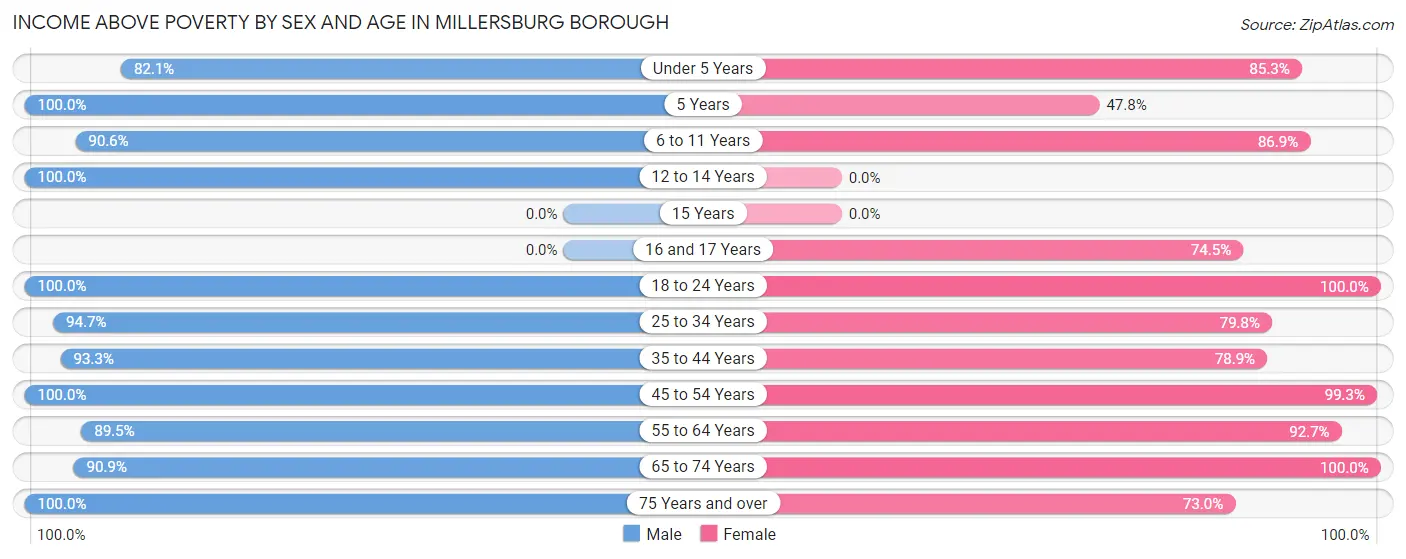
Income Above Poverty by Sex and Age in Millersburg borough
According to the poverty statistics in Millersburg borough, males aged 5 years and females aged 18 to 24 years are the age groups that are most secure financially, with 100.0% of males and 100.0% of females in these age groups living above the poverty line.
| Age Bracket | Male | Female |
| Under 5 Years | 78 (82.1%) | 99 (85.3%) |
| 5 Years | 29 (100.0%) | 22 (47.8%) |
| 6 to 11 Years | 96 (90.6%) | 126 (86.9%) |
| 12 to 14 Years | 30 (100.0%) | 0 (0.0%) |
| 15 Years | 0 (0.0%) | 0 (0.0%) |
| 16 and 17 Years | 0 (0.0%) | 35 (74.5%) |
| 18 to 24 Years | 97 (100.0%) | 102 (100.0%) |
| 25 to 34 Years | 196 (94.7%) | 162 (79.8%) |
| 35 to 44 Years | 168 (93.3%) | 116 (78.9%) |
| 45 to 54 Years | 185 (100.0%) | 142 (99.3%) |
| 55 to 64 Years | 136 (89.5%) | 51 (92.7%) |
| 65 to 74 Years | 50 (90.9%) | 68 (100.0%) |
| 75 Years and over | 130 (100.0%) | 127 (73.0%) |
| Total | 1,195 (94.0%) | 1,050 (82.4%) |
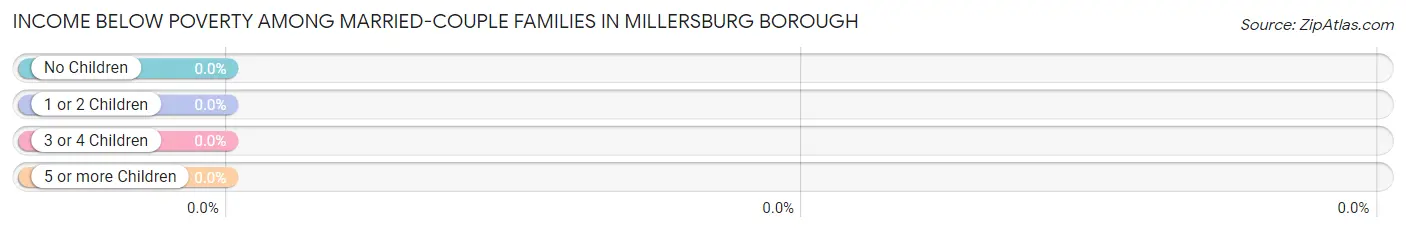
Income Below Poverty Among Married-Couple Families in Millersburg borough
| Children | Above Poverty | Below Poverty |
| No Children | 200 (100.0%) | 0 (0.0%) |
| 1 or 2 Children | 142 (100.0%) | 0 (0.0%) |
| 3 or 4 Children | 72 (100.0%) | 0 (0.0%) |
| 5 or more Children | 0 (0.0%) | 0 (0.0%) |
| Total | 414 (100.0%) | 0 (0.0%) |
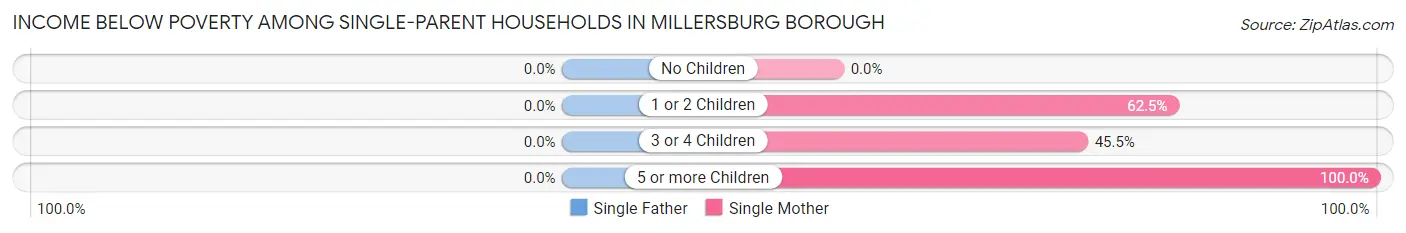
Income Below Poverty Among Single-Parent Households in Millersburg borough
| Children | Single Father | Single Mother |
| No Children | 0 (0.0%) | 0 (0.0%) |
| 1 or 2 Children | 0 (0.0%) | 40 (62.5%) |
| 3 or 4 Children | 0 (0.0%) | 10 (45.5%) |
| 5 or more Children | 0 (0.0%) | 10 (100.0%) |
| Total | 0 (0.0%) | 60 (37.0%) |
Income Below Poverty Among Married-Couple vs Single-Parent Households in Millersburg borough
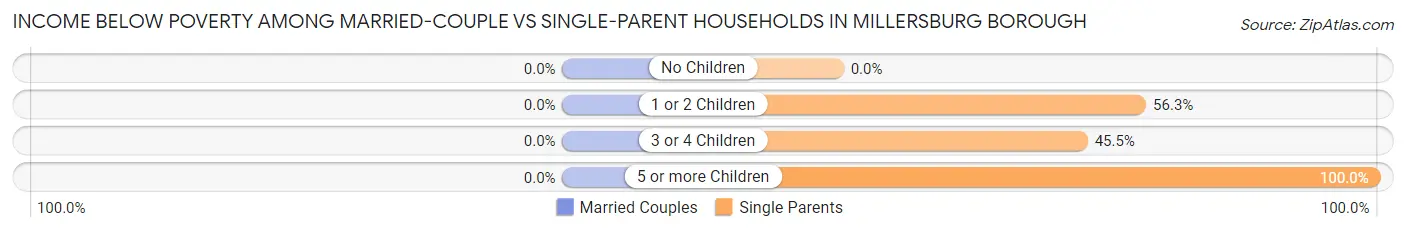
| Children | Married-Couple Families | Single-Parent Households |
| No Children | 0 (0.0%) | 0 (0.0%) |
| 1 or 2 Children | 0 (0.0%) | 40 (56.3%) |
| 3 or 4 Children | 0 (0.0%) | 10 (45.5%) |
| 5 or more Children | 0 (0.0%) | 10 (100.0%) |
| Total | 0 (0.0%) | 60 (29.6%) |
Race in Millersburg borough
The most populous races in Millersburg borough are White / Caucasian (2,336 | 91.7%), Two or more Races (140 | 5.5%), and Hispanic or Latino (93 | 3.6%).
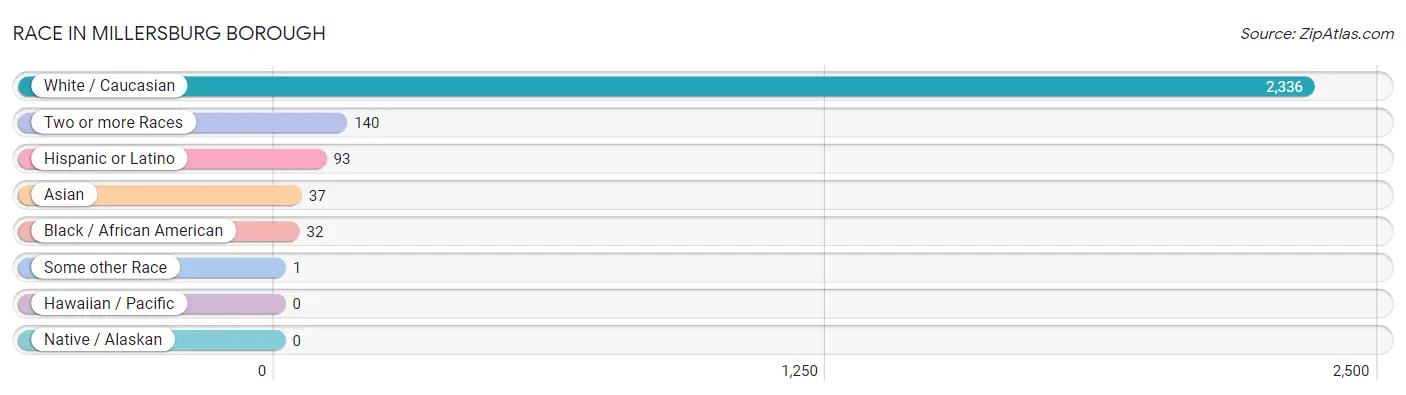
| Race | # Population | % Population |
| Asian | 37 | 1.5% |
| Black / African American | 32 | 1.3% |
| Hawaiian / Pacific | 0 | 0.0% |
| Hispanic or Latino | 93 | 3.6% |
| Native / Alaskan | 0 | 0.0% |
| White / Caucasian | 2,336 | 91.7% |
| Two or more Races | 140 | 5.5% |
| Some other Race | 1 | 0.0% |
| Total | 2,546 | 100.0% |
Ancestry in Millersburg borough
The most populous ancestries reported in Millersburg borough are German (1,238 | 48.6%), Irish (373 | 14.6%), Italian (275 | 10.8%), English (128 | 5.0%), and American (73 | 2.9%), together accounting for 82.0% of all Millersburg borough residents.
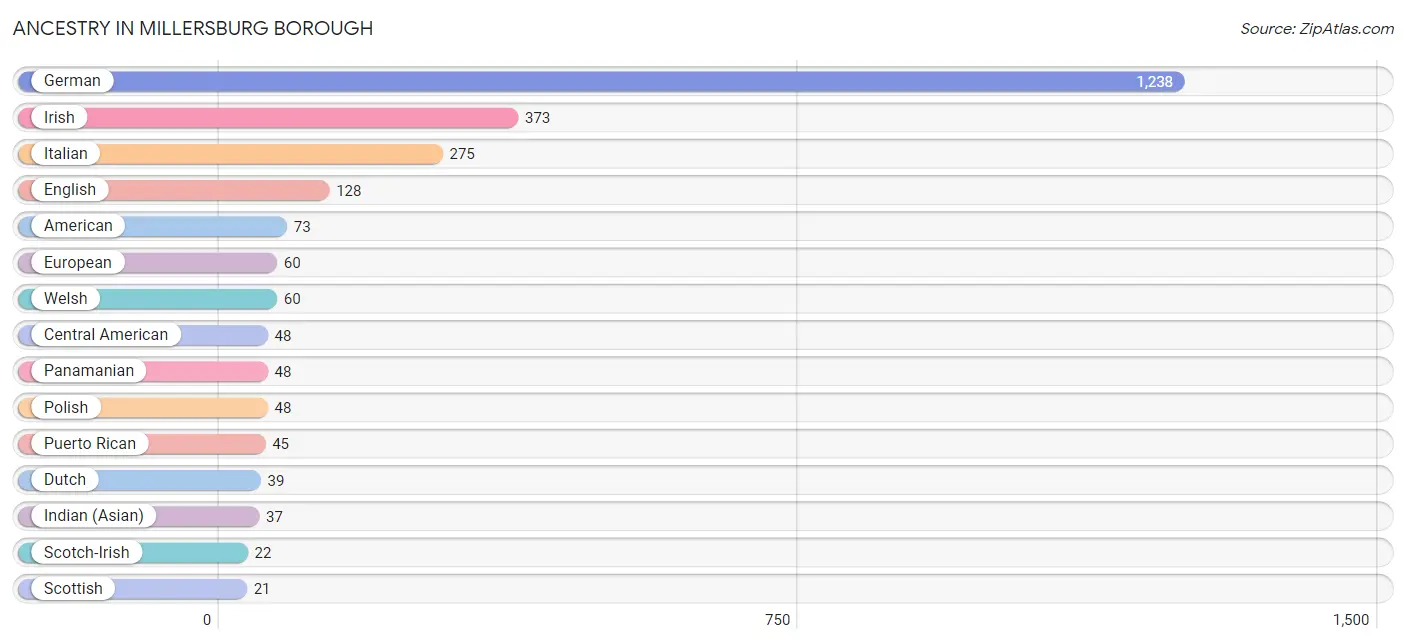
| Ancestry | # Population | % Population |
| American | 73 | 2.9% |
| Central American | 48 | 1.9% |
| Dutch | 39 | 1.5% |
| English | 128 | 5.0% |
| European | 60 | 2.4% |
| French | 15 | 0.6% |
| French Canadian | 5 | 0.2% |
| German | 1,238 | 48.6% |
| Hungarian | 10 | 0.4% |
| Indian (Asian) | 37 | 1.5% |
| Irish | 373 | 14.6% |
| Italian | 275 | 10.8% |
| Navajo | 8 | 0.3% |
| Panamanian | 48 | 1.9% |
| Polish | 48 | 1.9% |
| Puerto Rican | 45 | 1.8% |
| Scotch-Irish | 22 | 0.9% |
| Scottish | 21 | 0.8% |
| Slovak | 4 | 0.2% |
| Swedish | 5 | 0.2% |
| Swiss | 15 | 0.6% |
| Welsh | 60 | 2.4% | View All 22 Rows |
Immigrants in Millersburg borough
The most numerous immigrant groups reported in Millersburg borough came from Asia (30 | 1.2%), China (20 | 0.8%), Eastern Asia (20 | 0.8%), Europe (15 | 0.6%), and Western Europe (15 | 0.6%), together accounting for 3.9% of all Millersburg borough residents.
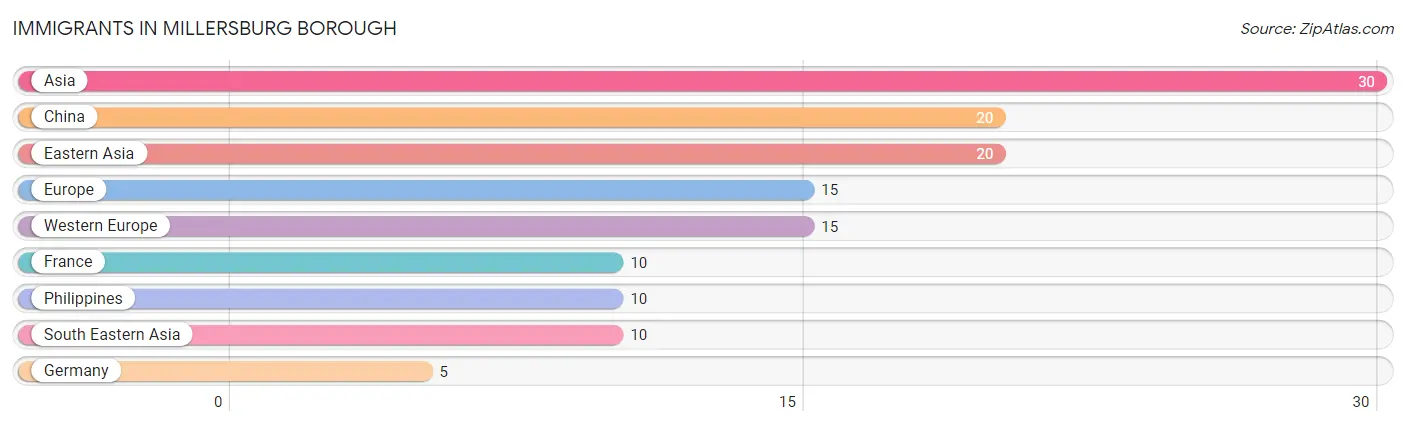
| Immigration Origin | # Population | % Population |
| Asia | 30 | 1.2% |
| China | 20 | 0.8% |
| Eastern Asia | 20 | 0.8% |
| Europe | 15 | 0.6% |
| France | 10 | 0.4% |
| Germany | 5 | 0.2% |
| Philippines | 10 | 0.4% |
| South Eastern Asia | 10 | 0.4% |
| Western Europe | 15 | 0.6% | View All 9 Rows |
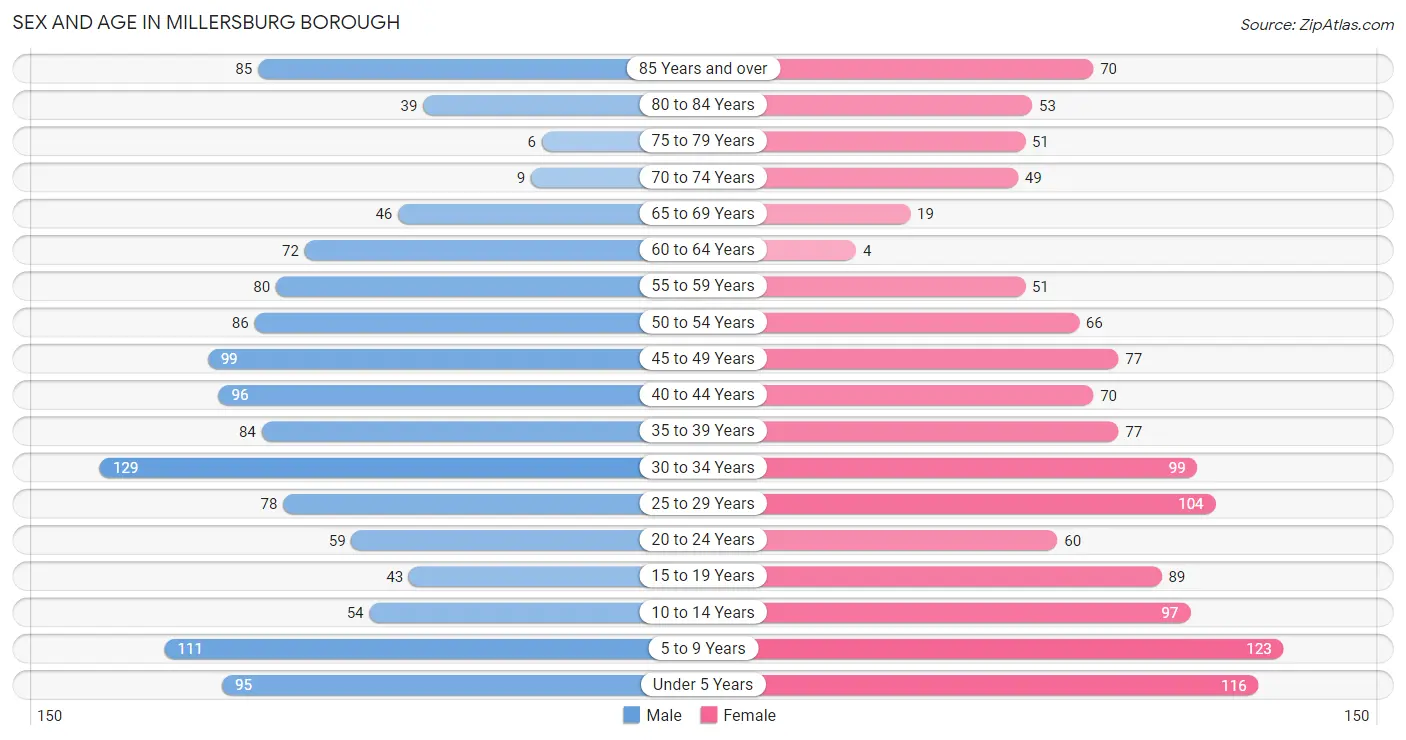
Sex and Age in Millersburg borough
Sex and Age in Millersburg borough
The most populous age groups in Millersburg borough are 30 to 34 Years (129 | 10.2%) for men and 5 to 9 Years (123 | 9.7%) for women.
| Age Bracket | Male | Female |
| Under 5 Years | 95 (7.5%) | 116 (9.1%) |
| 5 to 9 Years | 111 (8.7%) | 123 (9.7%) |
| 10 to 14 Years | 54 (4.3%) | 97 (7.6%) |
| 15 to 19 Years | 43 (3.4%) | 89 (7.0%) |
| 20 to 24 Years | 59 (4.6%) | 60 (4.7%) |
| 25 to 29 Years | 78 (6.1%) | 104 (8.2%) |
| 30 to 34 Years | 129 (10.2%) | 99 (7.8%) |
| 35 to 39 Years | 84 (6.6%) | 77 (6.0%) |
| 40 to 44 Years | 96 (7.5%) | 70 (5.5%) |
| 45 to 49 Years | 99 (7.8%) | 77 (6.0%) |
| 50 to 54 Years | 86 (6.8%) | 66 (5.2%) |
| 55 to 59 Years | 80 (6.3%) | 51 (4.0%) |
| 60 to 64 Years | 72 (5.7%) | 4 (0.3%) |
| 65 to 69 Years | 46 (3.6%) | 19 (1.5%) |
| 70 to 74 Years | 9 (0.7%) | 49 (3.8%) |
| 75 to 79 Years | 6 (0.5%) | 51 (4.0%) |
| 80 to 84 Years | 39 (3.1%) | 53 (4.2%) |
| 85 Years and over | 85 (6.7%) | 70 (5.5%) |
| Total | 1,271 (100.0%) | 1,275 (100.0%) |
Families and Households in Millersburg borough
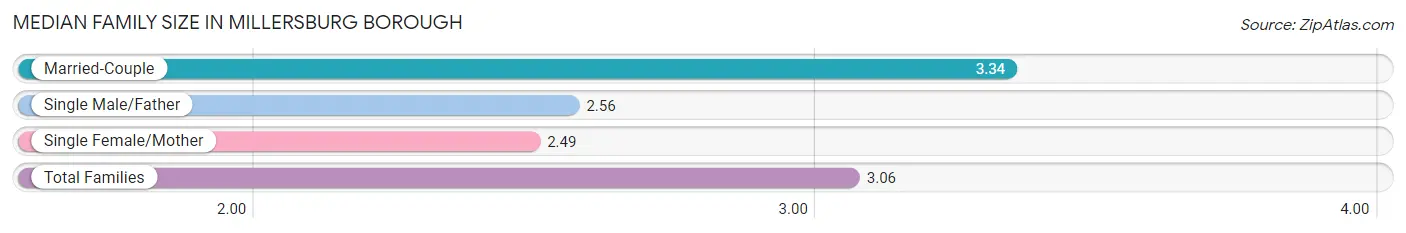
Median Family Size in Millersburg borough
The median family size in Millersburg borough is 3.06 persons per family, with married-couple families (414 | 67.1%) accounting for the largest median family size of 3.34 persons per family. On the other hand, single female/mother families (162 | 26.3%) represent the smallest median family size with 2.49 persons per family.
| Family Type | # Families | Family Size |
| Married-Couple | 414 (67.1%) | 3.34 |
| Single Male/Father | 41 (6.7%) | 2.56 |
| Single Female/Mother | 162 (26.3%) | 2.49 |
| Total Families | 617 (100.0%) | 3.06 |
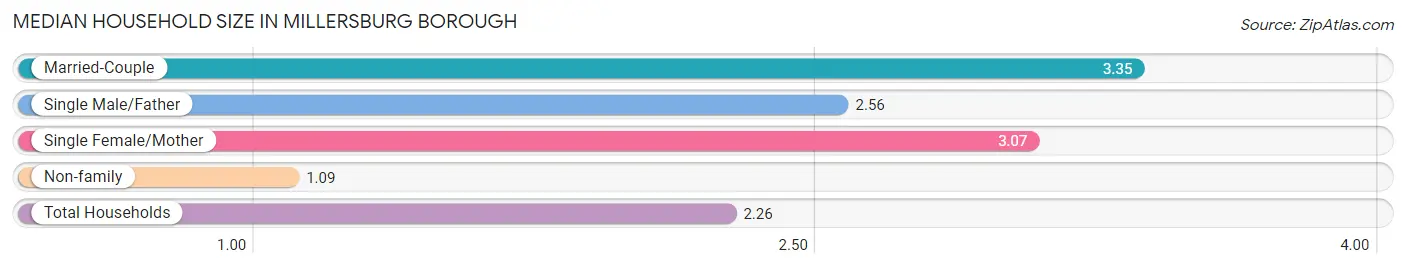
Median Household Size in Millersburg borough
The median household size in Millersburg borough is 2.26 persons per household, with married-couple households (414 | 36.8%) accounting for the largest median household size of 3.35 persons per household. non-family households (507 | 45.1%) represent the smallest median household size with 1.09 persons per household.
| Household Type | # Households | Household Size |
| Married-Couple | 414 (36.8%) | 3.35 |
| Single Male/Father | 41 (3.6%) | 2.56 |
| Single Female/Mother | 162 (14.4%) | 3.07 |
| Non-family | 507 (45.1%) | 1.09 |
| Total Households | 1,124 (100.0%) | 2.26 |
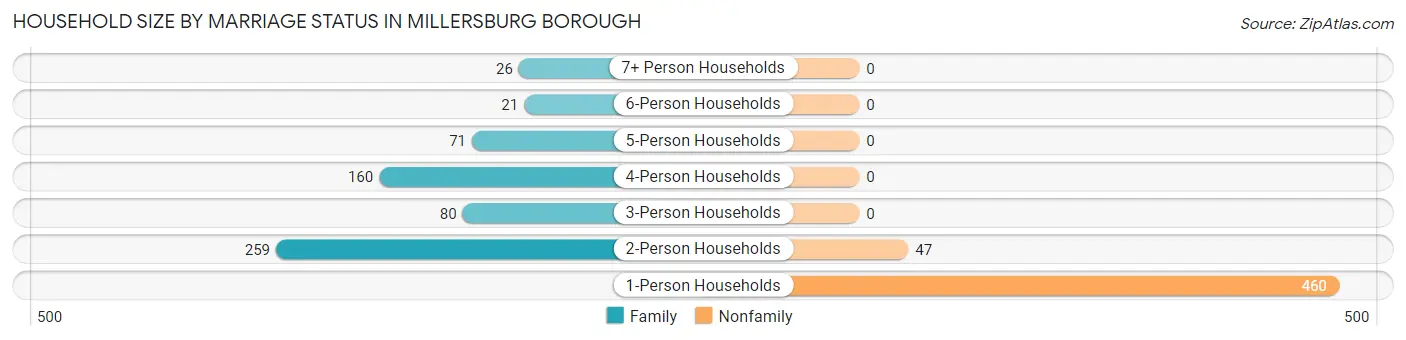
Household Size by Marriage Status in Millersburg borough
Out of a total of 1,124 households in Millersburg borough, 617 (54.9%) are family households, while 507 (45.1%) are nonfamily households. The most numerous type of family households are 2-person households, comprising 259, and the most common type of nonfamily households are 1-person households, comprising 460.
| Household Size | Family Households | Nonfamily Households |
| 1-Person Households | - | 460 (40.9%) |
| 2-Person Households | 259 (23.0%) | 47 (4.2%) |
| 3-Person Households | 80 (7.1%) | 0 (0.0%) |
| 4-Person Households | 160 (14.2%) | 0 (0.0%) |
| 5-Person Households | 71 (6.3%) | 0 (0.0%) |
| 6-Person Households | 21 (1.9%) | 0 (0.0%) |
| 7+ Person Households | 26 (2.3%) | 0 (0.0%) |
| Total | 617 (54.9%) | 507 (45.1%) |
Female Fertility in Millersburg borough
Fertility by Age in Millersburg borough
Average fertility rate in Millersburg borough is 137.0 births per 1,000 women. Women in the age bracket of 20 to 34 years have the highest fertility rate with 266.0 births per 1,000 women. Women in the age bracket of 20 to 34 years acount for 87.5% of all women with births.
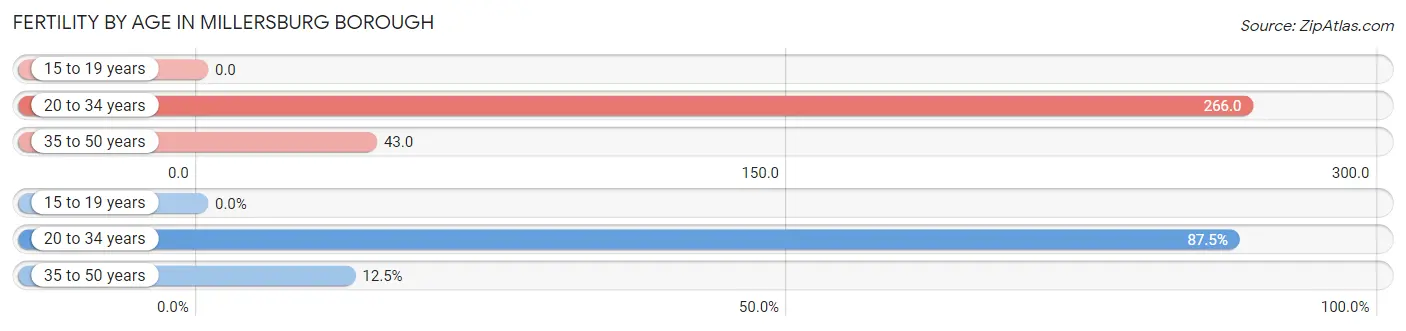
| Age Bracket | Women with Births | Births / 1,000 Women |
| 15 to 19 years | 0 (0.0%) | 0.0 |
| 20 to 34 years | 70 (87.5%) | 266.0 |
| 35 to 50 years | 10 (12.5%) | 43.0 |
| Total | 80 (100.0%) | 137.0 |
Fertility by Age by Marriage Status in Millersburg borough
76.2% of women with births (80) in Millersburg borough are married. The highest percentage of unmarried women with births falls into 35 to 50 years age bracket with 100.0% of them unmarried at the time of birth, while the lowest percentage of unmarried women with births belong to 20 to 34 years age bracket with 12.9% of them unmarried.
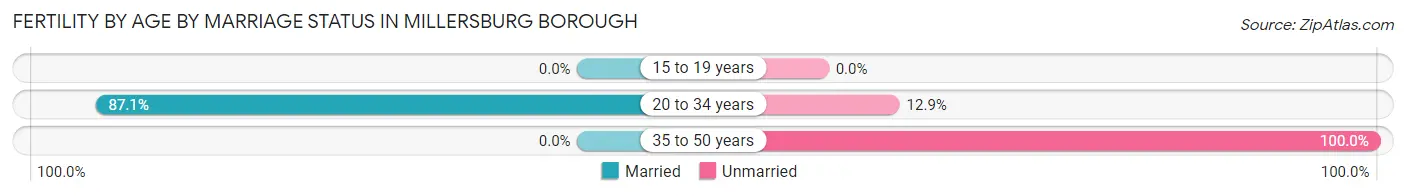
| Age Bracket | Married | Unmarried |
| 15 to 19 years | 0 (0.0%) | 0 (0.0%) |
| 20 to 34 years | 61 (87.1%) | 9 (12.9%) |
| 35 to 50 years | 0 (0.0%) | 10 (100.0%) |
| Total | 61 (76.2%) | 19 (23.7%) |
Fertility by Education in Millersburg borough
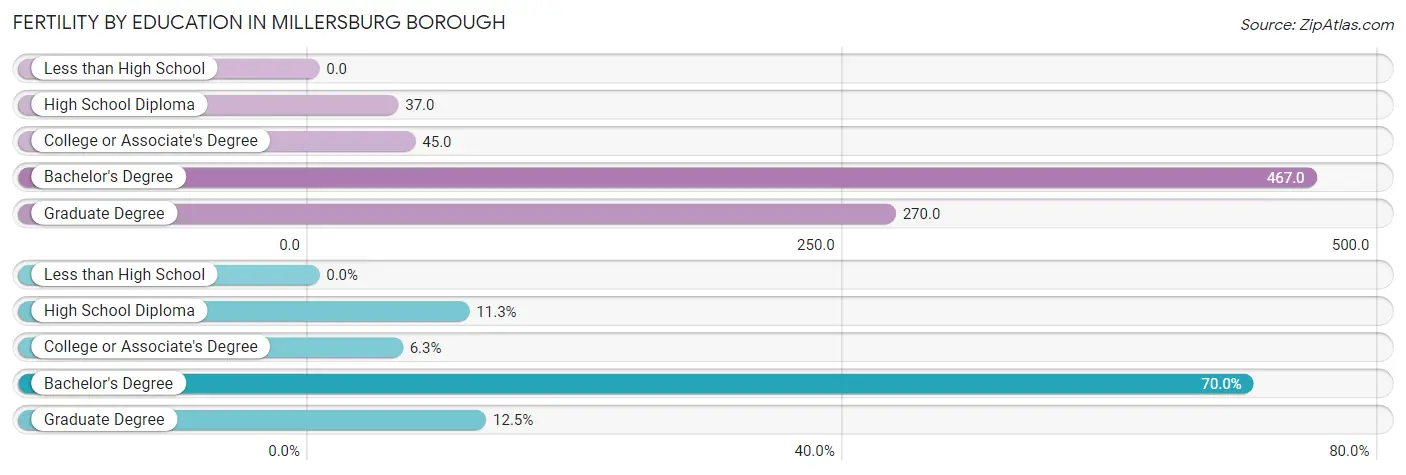
| Educational Attainment | Women with Births | Births / 1,000 Women |
| Less than High School | 0 (0.0%) | 0.0 |
| High School Diploma | 9 (11.3%) | 37.0 |
| College or Associate's Degree | 5 (6.2%) | 45.0 |
| Bachelor's Degree | 56 (70.0%) | 467.0 |
| Graduate Degree | 10 (12.5%) | 270.0 |
| Total | 80 (100.0%) | 137.0 |
Fertility by Education by Marriage Status in Millersburg borough
23.7% of women with births in Millersburg borough are unmarried. Women with the educational attainment of college or associate's degree are most likely to be married with 100.0% of them married at childbirth, while women with the educational attainment of high school diploma are least likely to be married with 100.0% of them unmarried at childbirth.
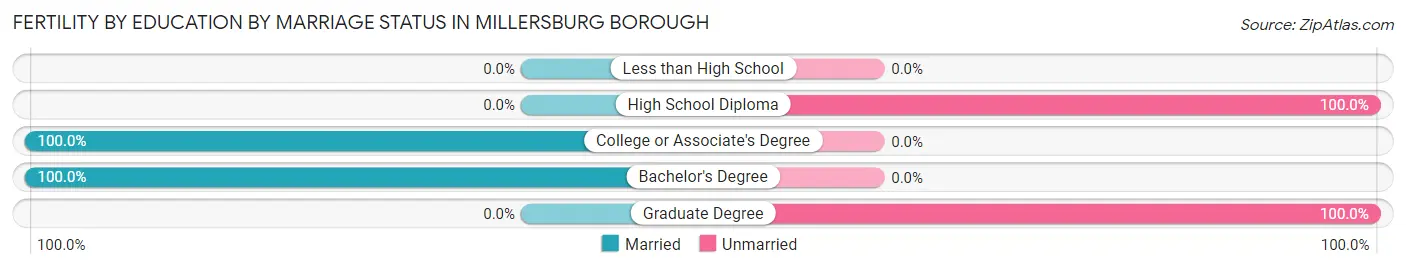
| Educational Attainment | Married | Unmarried |
| Less than High School | 0 (0.0%) | 0 (0.0%) |
| High School Diploma | 0 (0.0%) | 9 (100.0%) |
| College or Associate's Degree | 5 (100.0%) | 0 (0.0%) |
| Bachelor's Degree | 56 (100.0%) | 0 (0.0%) |
| Graduate Degree | 0 (0.0%) | 10 (100.0%) |
| Total | 61 (76.2%) | 19 (23.7%) |
Employment Characteristics in Millersburg borough
Employment by Class of Employer in Millersburg borough
Among the 1,291 employed individuals in Millersburg borough, private company employees (869 | 67.3%), not-for-profit organizations (136 | 10.5%), and state government employees (85 | 6.6%) make up the most common classes of employment.
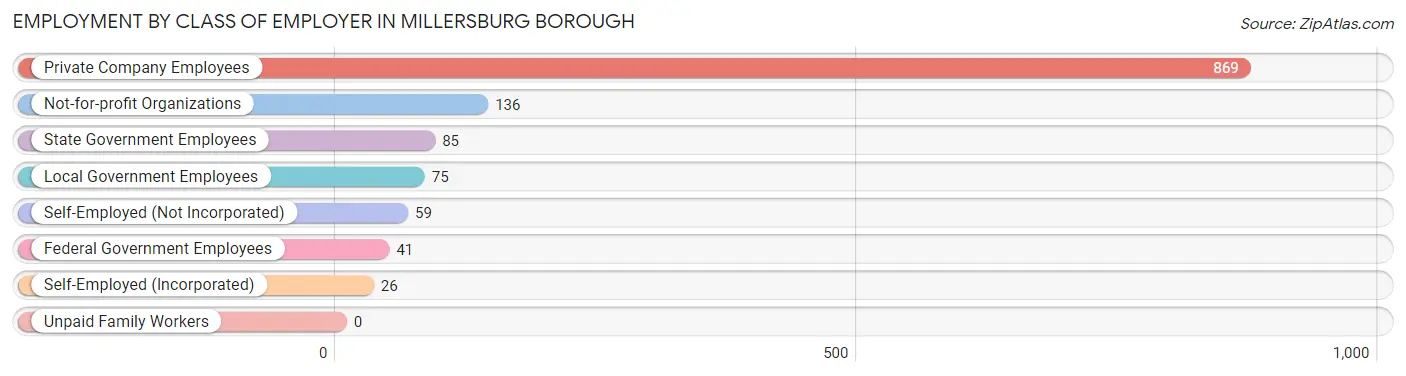
| Employer Class | # Employees | % Employees |
| Private Company Employees | 869 | 67.3% |
| Self-Employed (Incorporated) | 26 | 2.0% |
| Self-Employed (Not Incorporated) | 59 | 4.6% |
| Not-for-profit Organizations | 136 | 10.5% |
| Local Government Employees | 75 | 5.8% |
| State Government Employees | 85 | 6.6% |
| Federal Government Employees | 41 | 3.2% |
| Unpaid Family Workers | 0 | 0.0% |
| Total | 1,291 | 100.0% |
Employment Status by Age in Millersburg borough
According to the labor force statistics for Millersburg borough, out of the total population over 16 years of age (1,945), 66.9% or 1,301 individuals are in the labor force, with 0.8% or 10 of them unemployed. The age group with the highest labor force participation rate is 20 to 24 years, with 100.0% or 119 individuals in the labor force. Within the labor force, the 35 to 44 years age range has the highest percentage of unemployed individuals, with 4.1% or 10 of them being unemployed.
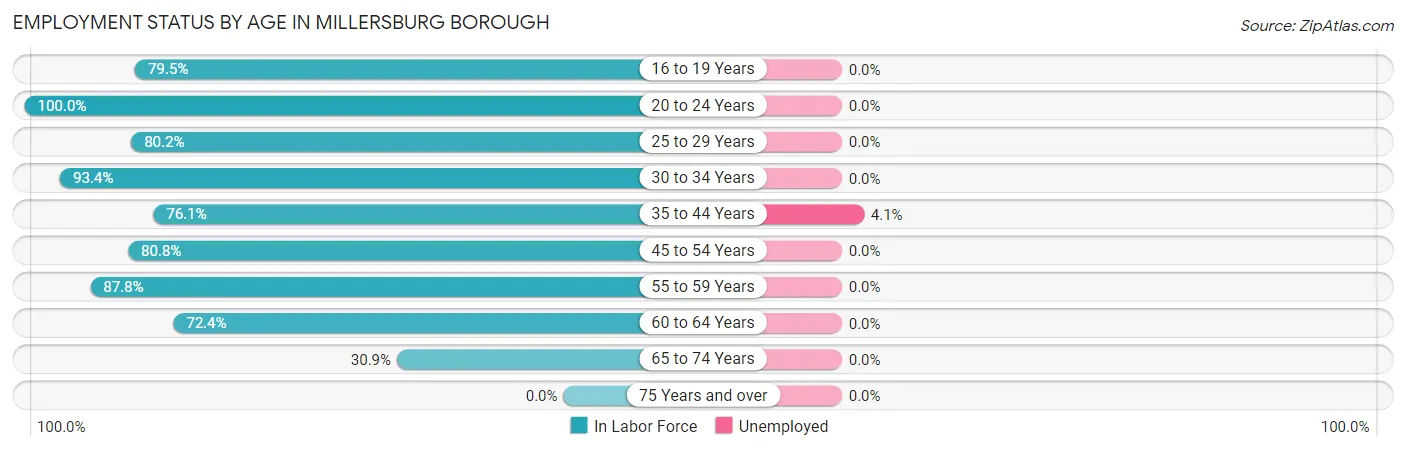
| Age Bracket | In Labor Force | Unemployed |
| 16 to 19 Years | 101 (79.5%) | 0 (0.0%) |
| 20 to 24 Years | 119 (100.0%) | 0 (0.0%) |
| 25 to 29 Years | 146 (80.2%) | 0 (0.0%) |
| 30 to 34 Years | 213 (93.4%) | 0 (0.0%) |
| 35 to 44 Years | 249 (76.1%) | 10 (4.1%) |
| 45 to 54 Years | 265 (80.8%) | 0 (0.0%) |
| 55 to 59 Years | 115 (87.8%) | 0 (0.0%) |
| 60 to 64 Years | 55 (72.4%) | 0 (0.0%) |
| 65 to 74 Years | 38 (30.9%) | 0 (0.0%) |
| 75 Years and over | 0 (0.0%) | 0 (0.0%) |
| Total | 1,301 (66.9%) | 10 (0.8%) |
Employment Status by Educational Attainment in Millersburg borough
According to labor force statistics for Millersburg borough, 82.0% of individuals (1,043) out of the total population between 25 and 64 years of age (1,272) are in the labor force, with 1.0% or 10 of them being unemployed. The group with the highest labor force participation rate are those with the educational attainment of bachelor's degree or higher, with 84.3% or 284 individuals in the labor force. Within the labor force, individuals with bachelor's degree or higher education have the highest percentage of unemployment, with 3.5% or 10 of them being unemployed.
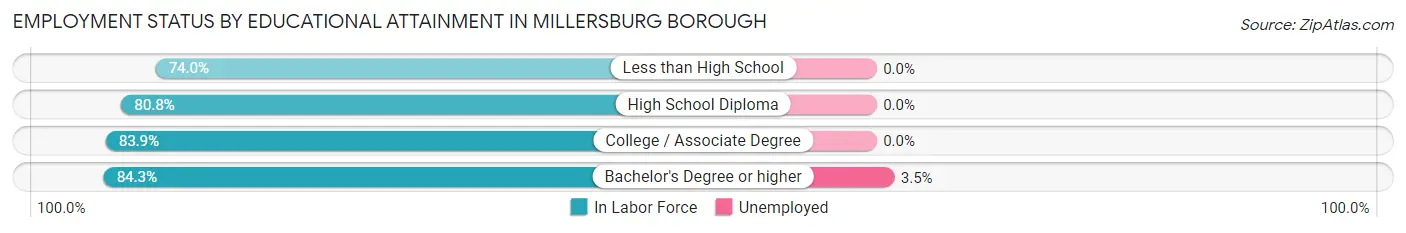
| Educational Attainment | In Labor Force | Unemployed |
| Less than High School | 57 (74.0%) | 0 (0.0%) |
| High School Diploma | 463 (80.8%) | 0 (0.0%) |
| College / Associate Degree | 239 (83.9%) | 0 (0.0%) |
| Bachelor's Degree or higher | 284 (84.3%) | 12 (3.5%) |
| Total | 1,043 (82.0%) | 13 (1.0%) |
Employment Occupations by Sex in Millersburg borough
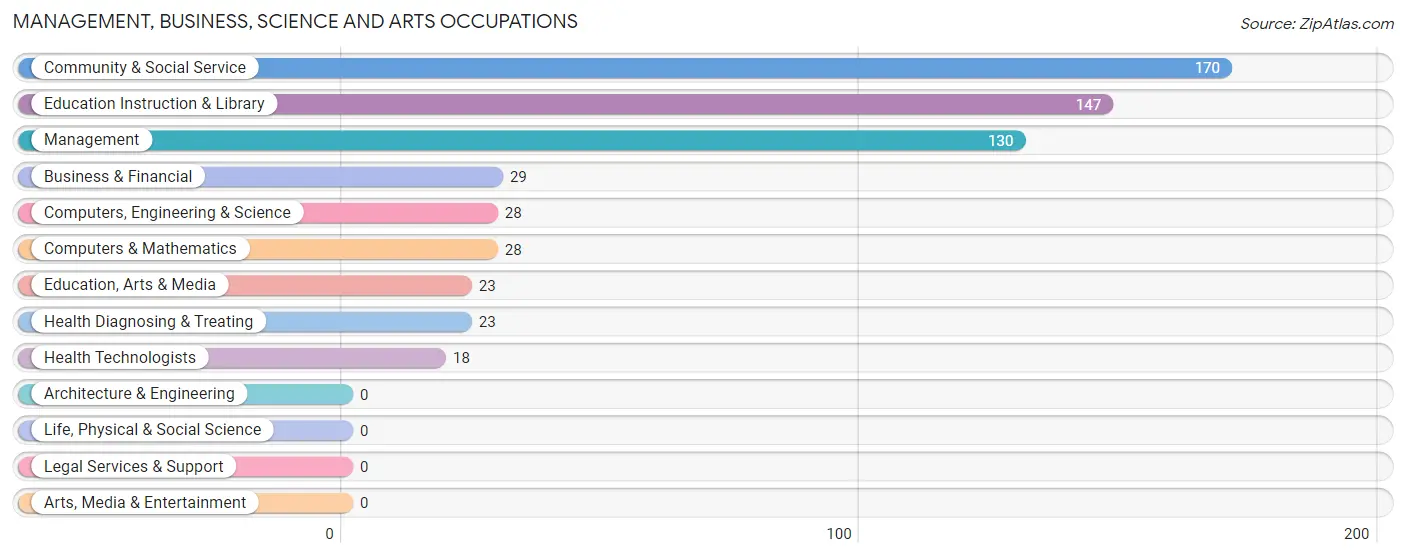
Management, Business, Science and Arts Occupations
The most common Management, Business, Science and Arts occupations in Millersburg borough are Community & Social Service (170 | 13.2%), Education Instruction & Library (147 | 11.4%), Management (130 | 10.1%), Business & Financial (29 | 2.3%), and Computers, Engineering & Science (28 | 2.2%).
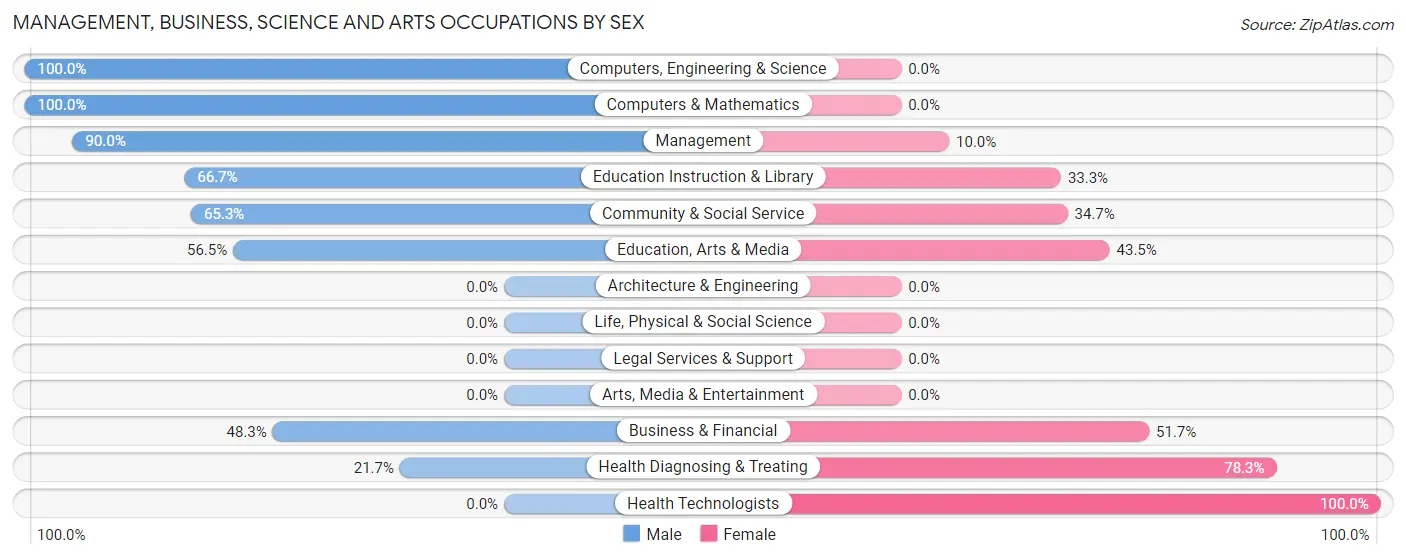
Management, Business, Science and Arts Occupations by Sex
Within the Management, Business, Science and Arts occupations in Millersburg borough, the most male-oriented occupations are Computers, Engineering & Science (100.0%), Computers & Mathematics (100.0%), and Management (90.0%), while the most female-oriented occupations are Health Technologists (100.0%), Health Diagnosing & Treating (78.3%), and Business & Financial (51.7%).
| Occupation | Male | Female |
| Management | 117 (90.0%) | 13 (10.0%) |
| Business & Financial | 14 (48.3%) | 15 (51.7%) |
| Computers, Engineering & Science | 28 (100.0%) | 0 (0.0%) |
| Computers & Mathematics | 28 (100.0%) | 0 (0.0%) |
| Architecture & Engineering | 0 (0.0%) | 0 (0.0%) |
| Life, Physical & Social Science | 0 (0.0%) | 0 (0.0%) |
| Community & Social Service | 111 (65.3%) | 59 (34.7%) |
| Education, Arts & Media | 13 (56.5%) | 10 (43.5%) |
| Legal Services & Support | 0 (0.0%) | 0 (0.0%) |
| Education Instruction & Library | 98 (66.7%) | 49 (33.3%) |
| Arts, Media & Entertainment | 0 (0.0%) | 0 (0.0%) |
| Health Diagnosing & Treating | 5 (21.7%) | 18 (78.3%) |
| Health Technologists | 0 (0.0%) | 18 (100.0%) |
| Total (Category) | 275 (72.4%) | 105 (27.6%) |
| Total (Overall) | 745 (58.0%) | 540 (42.0%) |
Services Occupations
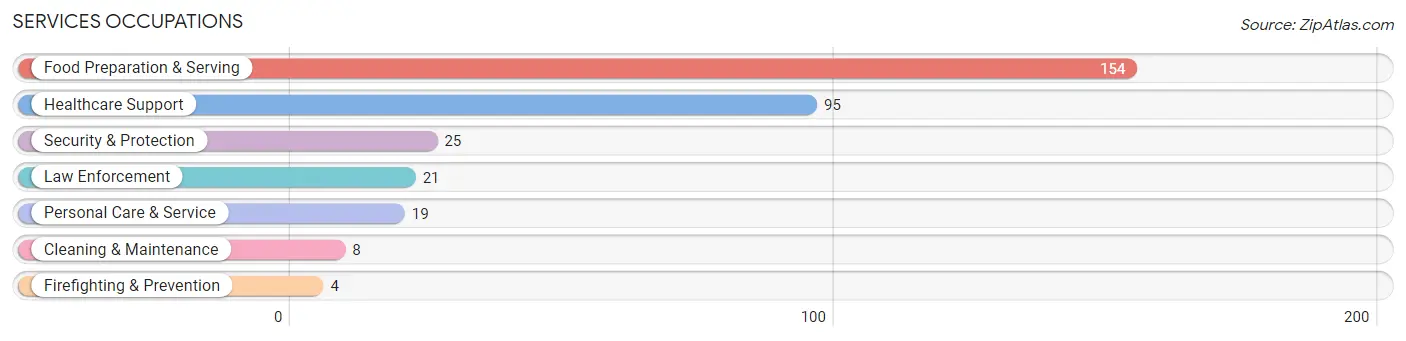
The most common Services occupations in Millersburg borough are Food Preparation & Serving (154 | 12.0%), Healthcare Support (95 | 7.4%), Security & Protection (25 | 1.9%), Law Enforcement (21 | 1.6%), and Personal Care & Service (19 | 1.5%).
Services Occupations by Sex
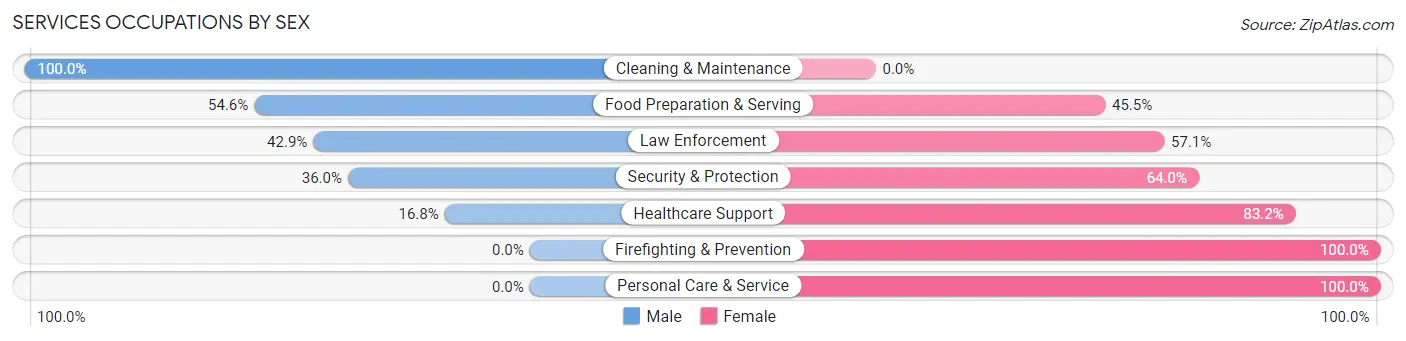
Within the Services occupations in Millersburg borough, the most male-oriented occupations are Cleaning & Maintenance (100.0%), Food Preparation & Serving (54.5%), and Law Enforcement (42.9%), while the most female-oriented occupations are Firefighting & Prevention (100.0%), Personal Care & Service (100.0%), and Healthcare Support (83.2%).
| Occupation | Male | Female |
| Healthcare Support | 16 (16.8%) | 79 (83.2%) |
| Security & Protection | 9 (36.0%) | 16 (64.0%) |
| Firefighting & Prevention | 0 (0.0%) | 4 (100.0%) |
| Law Enforcement | 9 (42.9%) | 12 (57.1%) |
| Food Preparation & Serving | 84 (54.5%) | 70 (45.5%) |
| Cleaning & Maintenance | 8 (100.0%) | 0 (0.0%) |
| Personal Care & Service | 0 (0.0%) | 19 (100.0%) |
| Total (Category) | 117 (38.9%) | 184 (61.1%) |
| Total (Overall) | 745 (58.0%) | 540 (42.0%) |
Sales and Office Occupations
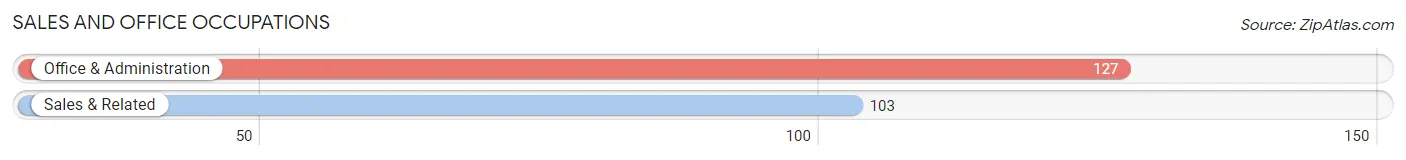
The most common Sales and Office occupations in Millersburg borough are Office & Administration (127 | 9.9%), and Sales & Related (103 | 8.0%).
Sales and Office Occupations by Sex
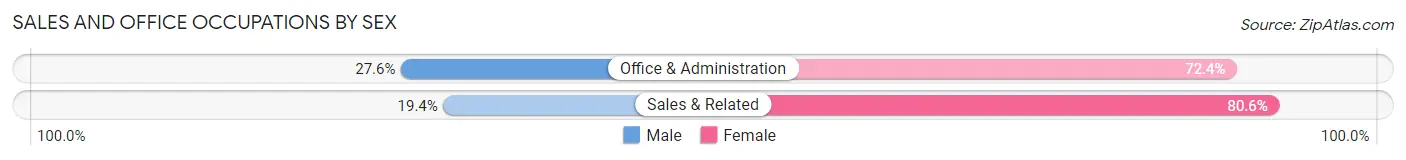
| Occupation | Male | Female |
| Sales & Related | 20 (19.4%) | 83 (80.6%) |
| Office & Administration | 35 (27.6%) | 92 (72.4%) |
| Total (Category) | 55 (23.9%) | 175 (76.1%) |
| Total (Overall) | 745 (58.0%) | 540 (42.0%) |
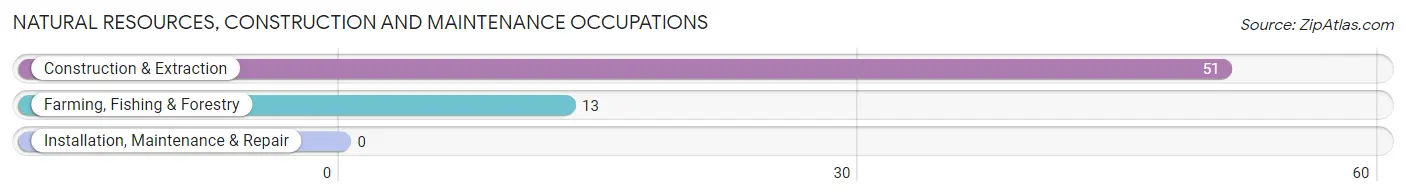
Natural Resources, Construction and Maintenance Occupations
The most common Natural Resources, Construction and Maintenance occupations in Millersburg borough are Construction & Extraction (51 | 4.0%), and Farming, Fishing & Forestry (13 | 1.0%).
Natural Resources, Construction and Maintenance Occupations by Sex
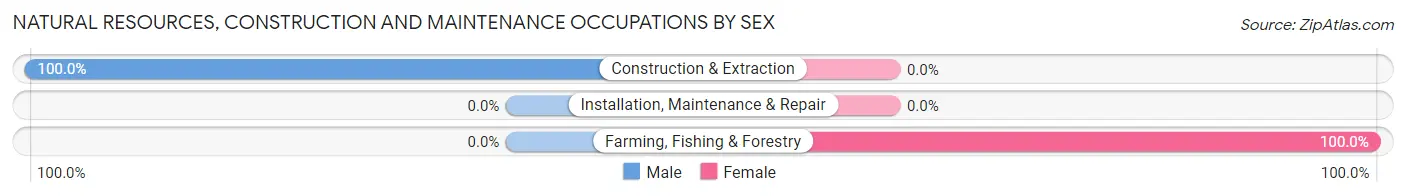
| Occupation | Male | Female |
| Farming, Fishing & Forestry | 0 (0.0%) | 13 (100.0%) |
| Construction & Extraction | 51 (100.0%) | 0 (0.0%) |
| Installation, Maintenance & Repair | 0 (0.0%) | 0 (0.0%) |
| Total (Category) | 51 (79.7%) | 13 (20.3%) |
| Total (Overall) | 745 (58.0%) | 540 (42.0%) |
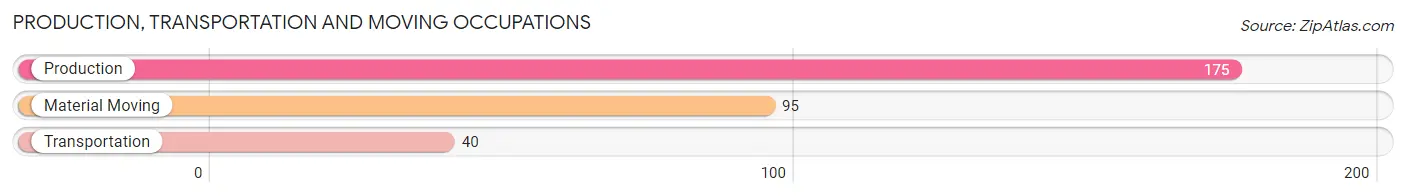
Production, Transportation and Moving Occupations
The most common Production, Transportation and Moving occupations in Millersburg borough are Production (175 | 13.6%), Material Moving (95 | 7.4%), and Transportation (40 | 3.1%).
Production, Transportation and Moving Occupations by Sex
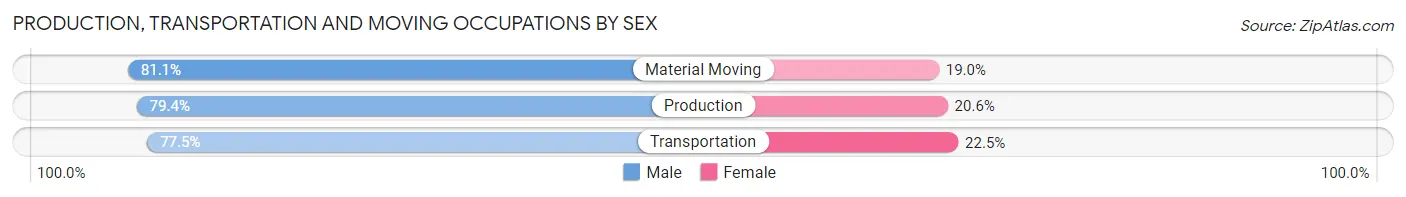
| Occupation | Male | Female |
| Production | 139 (79.4%) | 36 (20.6%) |
| Transportation | 31 (77.5%) | 9 (22.5%) |
| Material Moving | 77 (81.0%) | 18 (19.0%) |
| Total (Category) | 247 (79.7%) | 63 (20.3%) |
| Total (Overall) | 745 (58.0%) | 540 (42.0%) |
Employment Industries by Sex in Millersburg borough
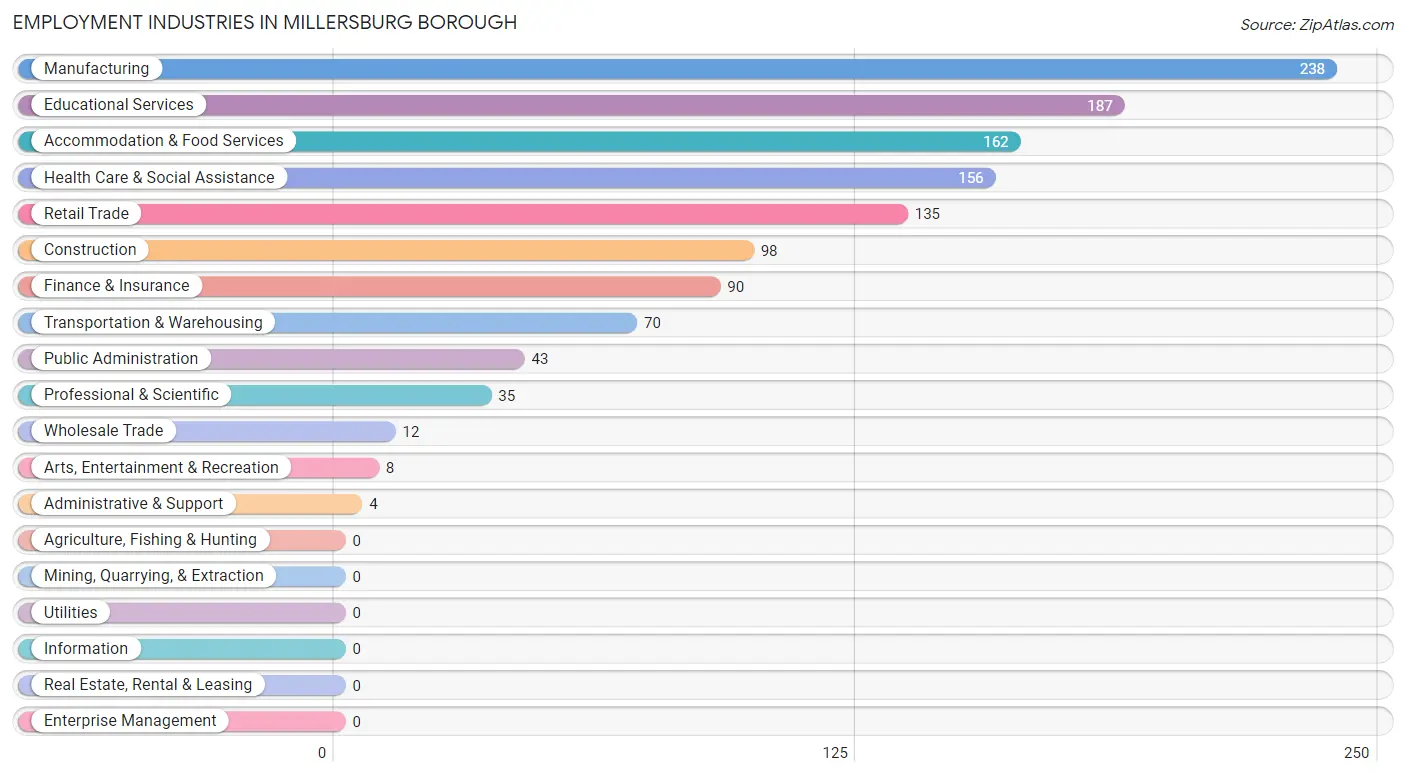
Employment Industries in Millersburg borough
The major employment industries in Millersburg borough include Manufacturing (238 | 18.5%), Educational Services (187 | 14.5%), Accommodation & Food Services (162 | 12.6%), Health Care & Social Assistance (156 | 12.1%), and Retail Trade (135 | 10.5%).
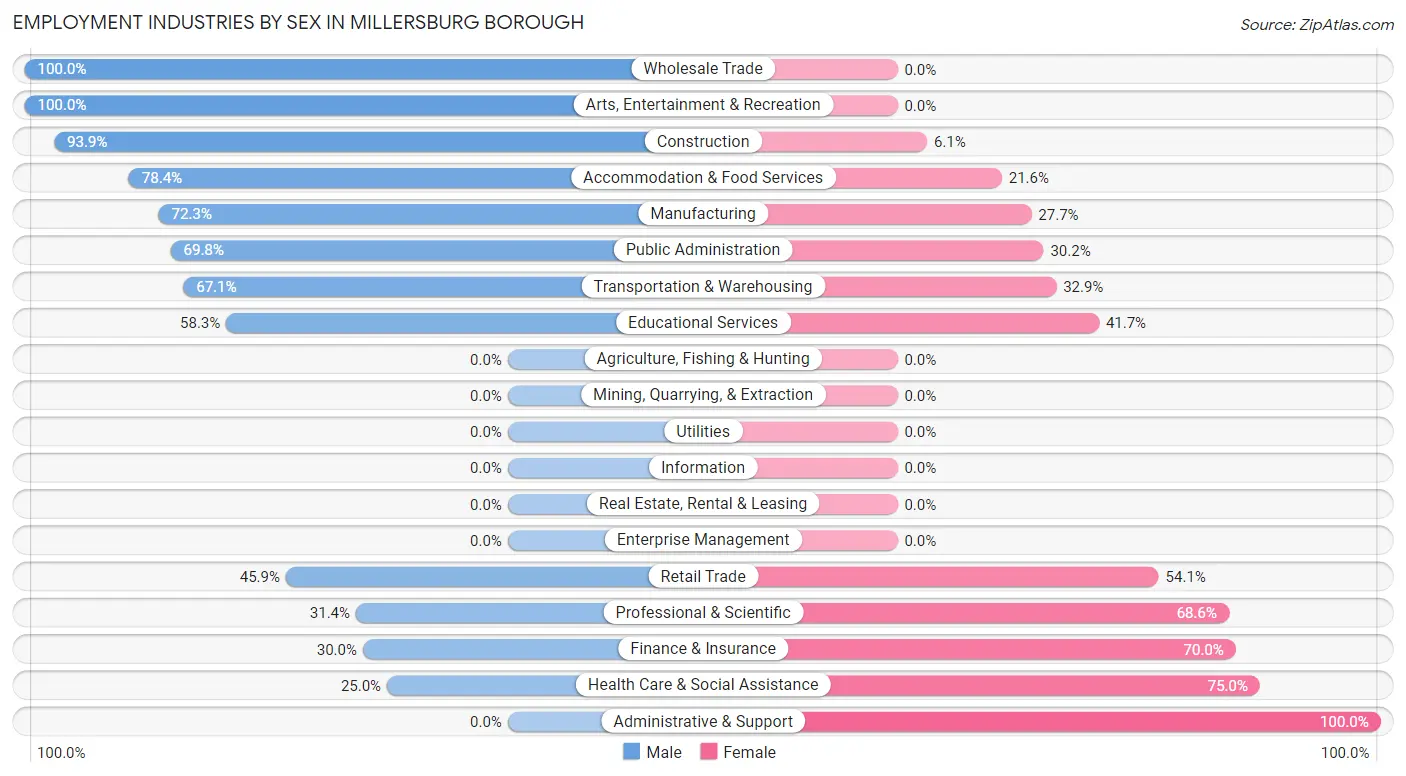
Employment Industries by Sex in Millersburg borough
The Millersburg borough industries that see more men than women are Wholesale Trade (100.0%), Arts, Entertainment & Recreation (100.0%), and Construction (93.9%), whereas the industries that tend to have a higher number of women are Administrative & Support (100.0%), Health Care & Social Assistance (75.0%), and Finance & Insurance (70.0%).
| Industry | Male | Female |
| Agriculture, Fishing & Hunting | 0 (0.0%) | 0 (0.0%) |
| Mining, Quarrying, & Extraction | 0 (0.0%) | 0 (0.0%) |
| Construction | 92 (93.9%) | 6 (6.1%) |
| Manufacturing | 172 (72.3%) | 66 (27.7%) |
| Wholesale Trade | 12 (100.0%) | 0 (0.0%) |
| Retail Trade | 62 (45.9%) | 73 (54.1%) |
| Transportation & Warehousing | 47 (67.1%) | 23 (32.9%) |
| Utilities | 0 (0.0%) | 0 (0.0%) |
| Information | 0 (0.0%) | 0 (0.0%) |
| Finance & Insurance | 27 (30.0%) | 63 (70.0%) |
| Real Estate, Rental & Leasing | 0 (0.0%) | 0 (0.0%) |
| Professional & Scientific | 11 (31.4%) | 24 (68.6%) |
| Enterprise Management | 0 (0.0%) | 0 (0.0%) |
| Administrative & Support | 0 (0.0%) | 4 (100.0%) |
| Educational Services | 109 (58.3%) | 78 (41.7%) |
| Health Care & Social Assistance | 39 (25.0%) | 117 (75.0%) |
| Arts, Entertainment & Recreation | 8 (100.0%) | 0 (0.0%) |
| Accommodation & Food Services | 127 (78.4%) | 35 (21.6%) |
| Public Administration | 30 (69.8%) | 13 (30.2%) |
| Total | 745 (58.0%) | 540 (42.0%) |
Education in Millersburg borough
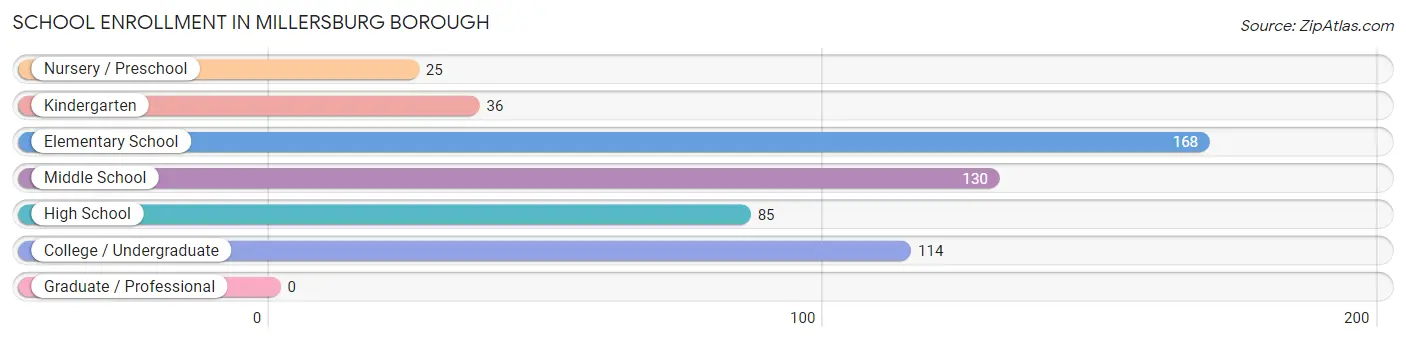
School Enrollment in Millersburg borough
The most common levels of schooling among the 558 students in Millersburg borough are elementary school (168 | 30.1%), middle school (130 | 23.3%), and college / undergraduate (114 | 20.4%).
| School Level | # Students | % Students |
| Nursery / Preschool | 25 | 4.5% |
| Kindergarten | 36 | 6.5% |
| Elementary School | 168 | 30.1% |
| Middle School | 130 | 23.3% |
| High School | 85 | 15.2% |
| College / Undergraduate | 114 | 20.4% |
| Graduate / Professional | 0 | 0.0% |
| Total | 558 | 100.0% |
School Enrollment by Age by Funding Source in Millersburg borough
Out of a total of 558 students who are enrolled in schools in Millersburg borough, 167 (29.9%) attend a private institution, while the remaining 391 (70.1%) are enrolled in public schools. The age group of 20 to 24 year olds has the highest likelihood of being enrolled in private schools, with 22 (100.0% in the age bracket) enrolled. Conversely, the age group of 15 to 17 year olds has the lowest likelihood of being enrolled in a private school, with 52 (100.0% in the age bracket) attending a public institution.
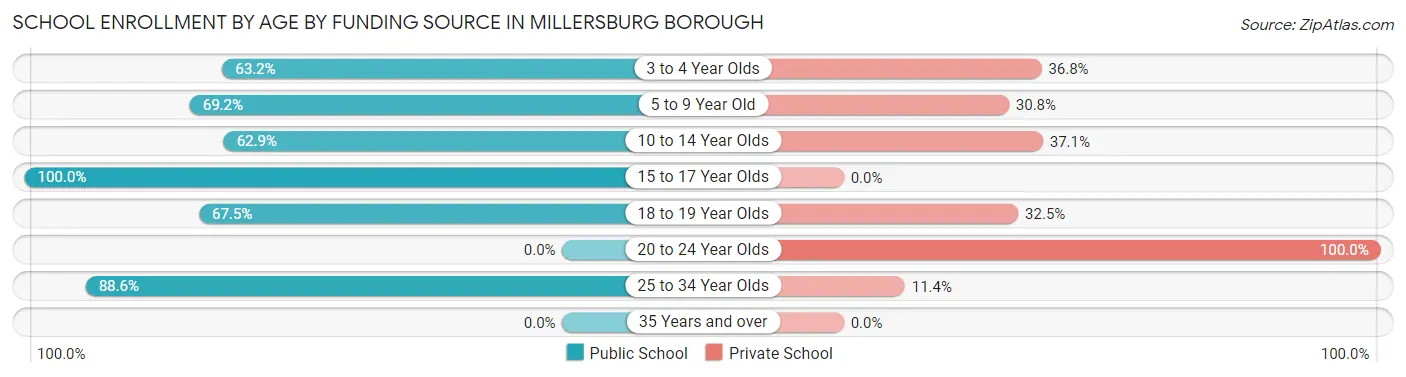
| Age Bracket | Public School | Private School |
| 3 to 4 Year Olds | 12 (63.2%) | 7 (36.8%) |
| 5 to 9 Year Old | 135 (69.2%) | 60 (30.8%) |
| 10 to 14 Year Olds | 95 (62.9%) | 56 (37.1%) |
| 15 to 17 Year Olds | 52 (100.0%) | 0 (0.0%) |
| 18 to 19 Year Olds | 27 (67.5%) | 13 (32.5%) |
| 20 to 24 Year Olds | 0 (0.0%) | 22 (100.0%) |
| 25 to 34 Year Olds | 70 (88.6%) | 9 (11.4%) |
| 35 Years and over | 0 (0.0%) | 0 (0.0%) |
| Total | 391 (70.1%) | 167 (29.9%) |
Educational Attainment by Field of Study in Millersburg borough
Education (91 | 25.2%), liberal arts & history (91 | 25.2%), business (63 | 17.4%), science & technology (24 | 6.7%), and bio, nature & agricultural (23 | 6.4%) are the most common fields of study among 361 individuals in Millersburg borough who have obtained a bachelor's degree or higher.
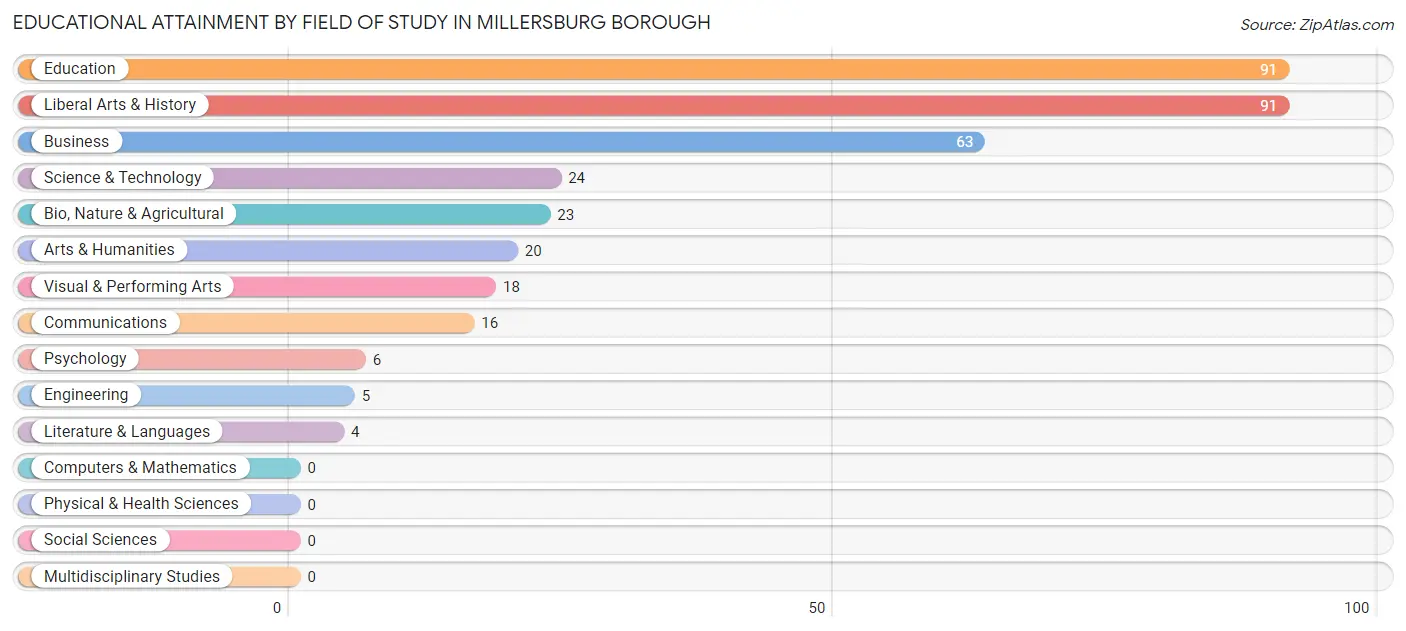
| Field of Study | # Graduates | % Graduates |
| Computers & Mathematics | 0 | 0.0% |
| Bio, Nature & Agricultural | 23 | 6.4% |
| Physical & Health Sciences | 0 | 0.0% |
| Psychology | 6 | 1.7% |
| Social Sciences | 0 | 0.0% |
| Engineering | 5 | 1.4% |
| Multidisciplinary Studies | 0 | 0.0% |
| Science & Technology | 24 | 6.7% |
| Business | 63 | 17.4% |
| Education | 91 | 25.2% |
| Literature & Languages | 4 | 1.1% |
| Liberal Arts & History | 91 | 25.2% |
| Visual & Performing Arts | 18 | 5.0% |
| Communications | 16 | 4.4% |
| Arts & Humanities | 20 | 5.5% |
| Total | 361 | 100.0% |
Transportation & Commute in Millersburg borough
Vehicle Availability by Sex in Millersburg borough
The most prevalent vehicle ownership categories in Millersburg borough are males with 2 vehicles (351, accounting for 46.7%) and females with 2 vehicles (312, making up 65.0%).
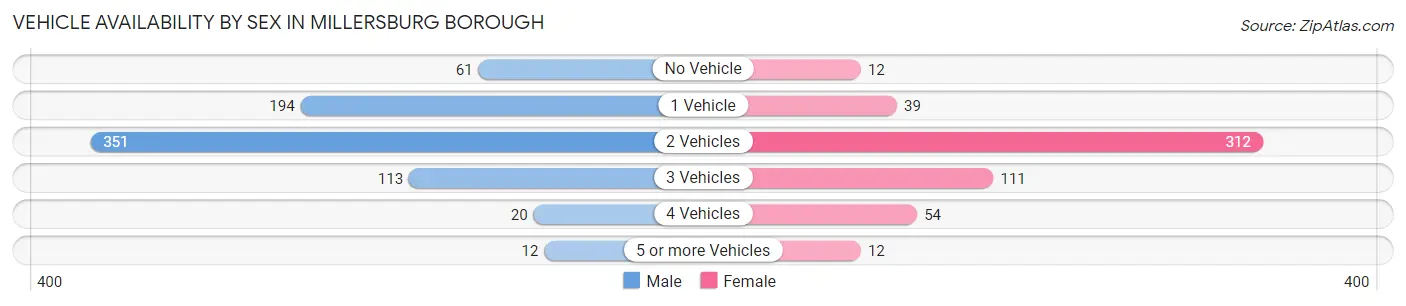
| Vehicles Available | Male | Female |
| No Vehicle | 61 (8.1%) | 12 (2.2%) |
| 1 Vehicle | 194 (25.8%) | 39 (7.2%) |
| 2 Vehicles | 351 (46.7%) | 312 (57.8%) |
| 3 Vehicles | 113 (15.0%) | 111 (20.6%) |
| 4 Vehicles | 20 (2.7%) | 54 (10.0%) |
| 5 or more Vehicles | 12 (1.6%) | 12 (2.2%) |
| Total | 751 (100.0%) | 540 (100.0%) |
Commute Time in Millersburg borough
The most frequently occuring commute durations in Millersburg borough are 5 to 9 minutes (351 commuters, 28.2%), 10 to 14 minutes (211 commuters, 17.0%), and 45 to 59 minutes (169 commuters, 13.6%).
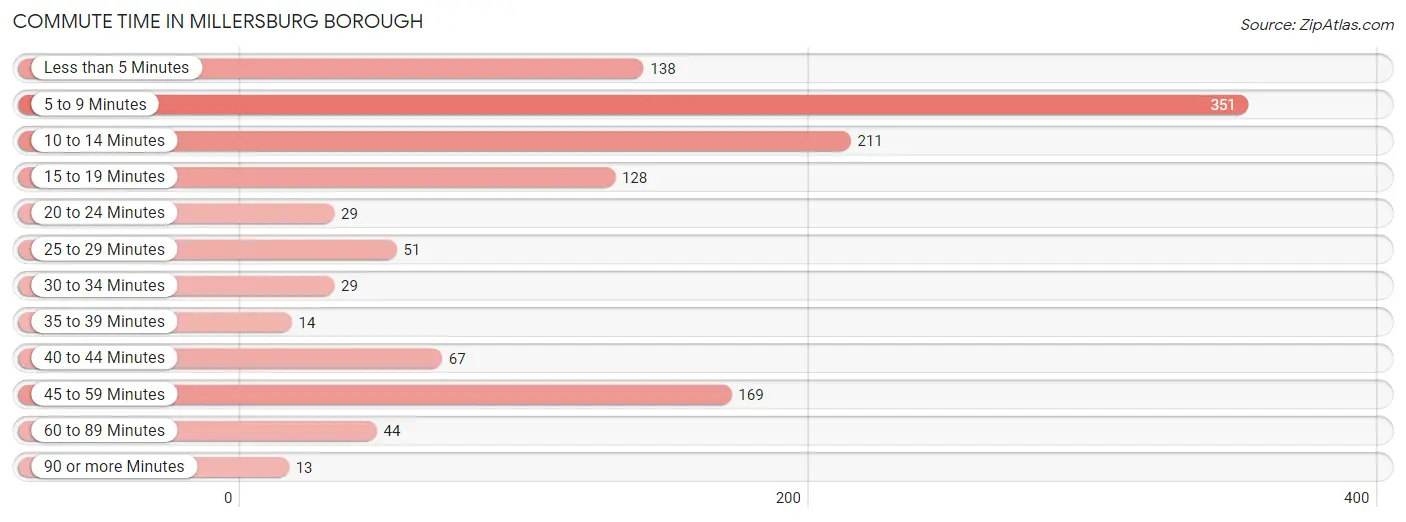
| Commute Time | # Commuters | % Commuters |
| Less than 5 Minutes | 138 | 11.1% |
| 5 to 9 Minutes | 351 | 28.2% |
| 10 to 14 Minutes | 211 | 17.0% |
| 15 to 19 Minutes | 128 | 10.3% |
| 20 to 24 Minutes | 29 | 2.3% |
| 25 to 29 Minutes | 51 | 4.1% |
| 30 to 34 Minutes | 29 | 2.3% |
| 35 to 39 Minutes | 14 | 1.1% |
| 40 to 44 Minutes | 67 | 5.4% |
| 45 to 59 Minutes | 169 | 13.6% |
| 60 to 89 Minutes | 44 | 3.5% |
| 90 or more Minutes | 13 | 1.1% |
Commute Time by Sex in Millersburg borough
The most common commute times in Millersburg borough are 5 to 9 minutes (235 commuters, 31.5%) for males and 5 to 9 minutes (116 commuters, 23.3%) for females.
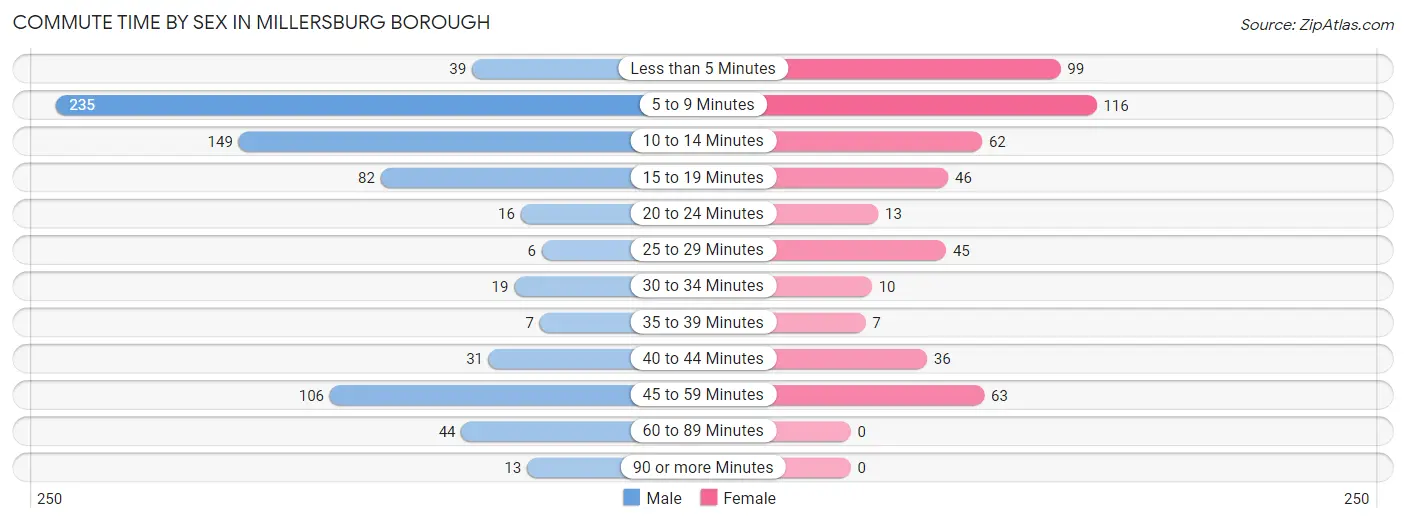
| Commute Time | Male | Female |
| Less than 5 Minutes | 39 (5.2%) | 99 (19.9%) |
| 5 to 9 Minutes | 235 (31.5%) | 116 (23.3%) |
| 10 to 14 Minutes | 149 (20.0%) | 62 (12.5%) |
| 15 to 19 Minutes | 82 (11.0%) | 46 (9.3%) |
| 20 to 24 Minutes | 16 (2.1%) | 13 (2.6%) |
| 25 to 29 Minutes | 6 (0.8%) | 45 (9.0%) |
| 30 to 34 Minutes | 19 (2.5%) | 10 (2.0%) |
| 35 to 39 Minutes | 7 (0.9%) | 7 (1.4%) |
| 40 to 44 Minutes | 31 (4.2%) | 36 (7.2%) |
| 45 to 59 Minutes | 106 (14.2%) | 63 (12.7%) |
| 60 to 89 Minutes | 44 (5.9%) | 0 (0.0%) |
| 90 or more Minutes | 13 (1.7%) | 0 (0.0%) |
Time of Departure to Work by Sex in Millersburg borough
The most frequent times of departure to work in Millersburg borough are 6:00 AM to 6:29 AM (129, 17.3%) for males and 7:30 AM to 7:59 AM (73, 14.7%) for females.
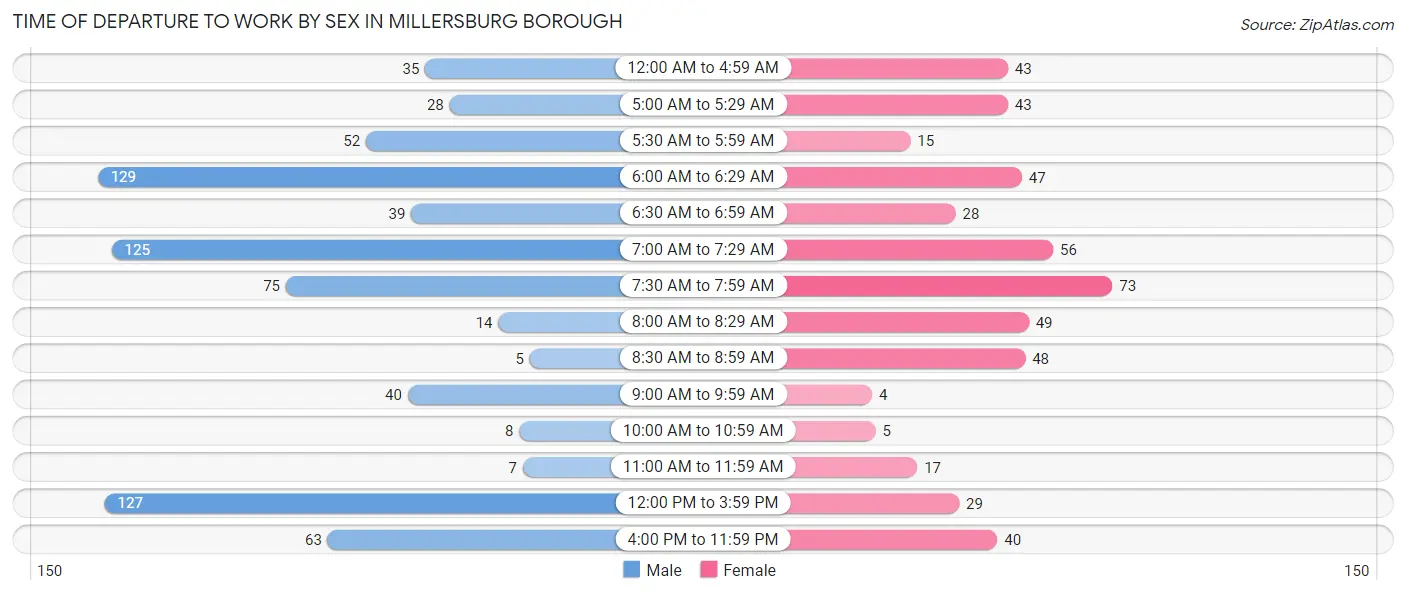
| Time of Departure | Male | Female |
| 12:00 AM to 4:59 AM | 35 (4.7%) | 43 (8.6%) |
| 5:00 AM to 5:29 AM | 28 (3.7%) | 43 (8.6%) |
| 5:30 AM to 5:59 AM | 52 (7.0%) | 15 (3.0%) |
| 6:00 AM to 6:29 AM | 129 (17.3%) | 47 (9.5%) |
| 6:30 AM to 6:59 AM | 39 (5.2%) | 28 (5.6%) |
| 7:00 AM to 7:29 AM | 125 (16.7%) | 56 (11.3%) |
| 7:30 AM to 7:59 AM | 75 (10.0%) | 73 (14.7%) |
| 8:00 AM to 8:29 AM | 14 (1.9%) | 49 (9.9%) |
| 8:30 AM to 8:59 AM | 5 (0.7%) | 48 (9.7%) |
| 9:00 AM to 9:59 AM | 40 (5.3%) | 4 (0.8%) |
| 10:00 AM to 10:59 AM | 8 (1.1%) | 5 (1.0%) |
| 11:00 AM to 11:59 AM | 7 (0.9%) | 17 (3.4%) |
| 12:00 PM to 3:59 PM | 127 (17.0%) | 29 (5.8%) |
| 4:00 PM to 11:59 PM | 63 (8.4%) | 40 (8.1%) |
| Total | 747 (100.0%) | 497 (100.0%) |
Housing Occupancy in Millersburg borough
Occupancy by Ownership in Millersburg borough
Of the total 1,124 dwellings in Millersburg borough, owner-occupied units account for 600 (53.4%), while renter-occupied units make up 524 (46.6%).
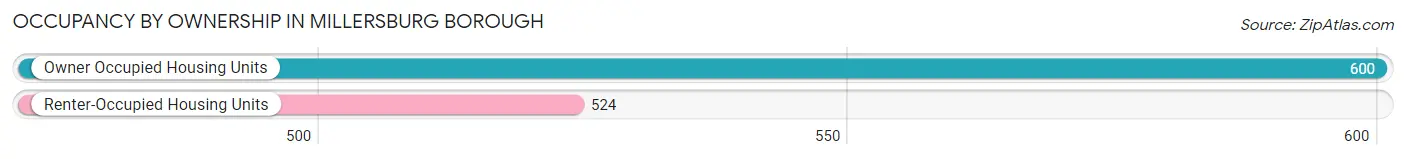
| Occupancy | # Housing Units | % Housing Units |
| Owner Occupied Housing Units | 600 | 53.4% |
| Renter-Occupied Housing Units | 524 | 46.6% |
| Total Occupied Housing Units | 1,124 | 100.0% |
Occupancy by Household Size in Millersburg borough
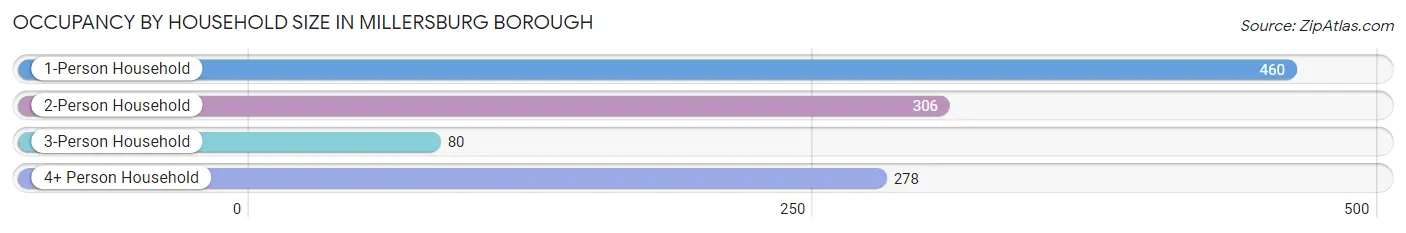
| Household Size | # Housing Units | % Housing Units |
| 1-Person Household | 460 | 40.9% |
| 2-Person Household | 306 | 27.2% |
| 3-Person Household | 80 | 7.1% |
| 4+ Person Household | 278 | 24.7% |
| Total Housing Units | 1,124 | 100.0% |
Occupancy by Ownership by Household Size in Millersburg borough
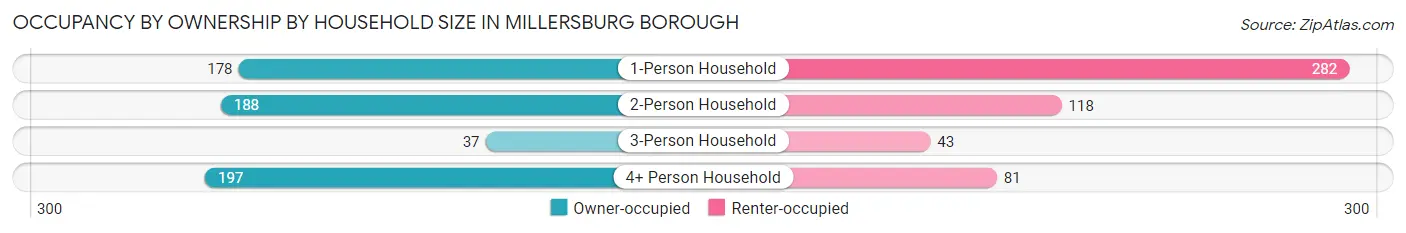
| Household Size | Owner-occupied | Renter-occupied |
| 1-Person Household | 178 (38.7%) | 282 (61.3%) |
| 2-Person Household | 188 (61.4%) | 118 (38.6%) |
| 3-Person Household | 37 (46.3%) | 43 (53.7%) |
| 4+ Person Household | 197 (70.9%) | 81 (29.1%) |
| Total Housing Units | 600 (53.4%) | 524 (46.6%) |
Occupancy by Educational Attainment in Millersburg borough
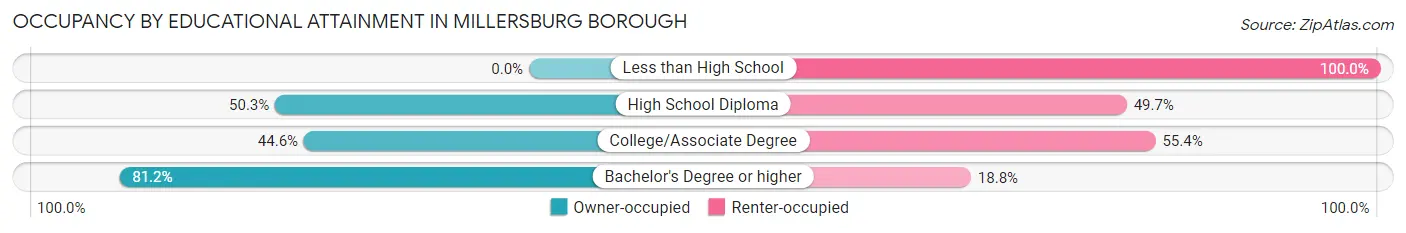
| Household Size | Owner-occupied | Renter-occupied |
| Less than High School | 0 (0.0%) | 44 (100.0%) |
| High School Diploma | 302 (50.3%) | 298 (49.7%) |
| College/Associate Degree | 112 (44.6%) | 139 (55.4%) |
| Bachelor's Degree or higher | 186 (81.2%) | 43 (18.8%) |
Occupancy by Age of Householder in Millersburg borough
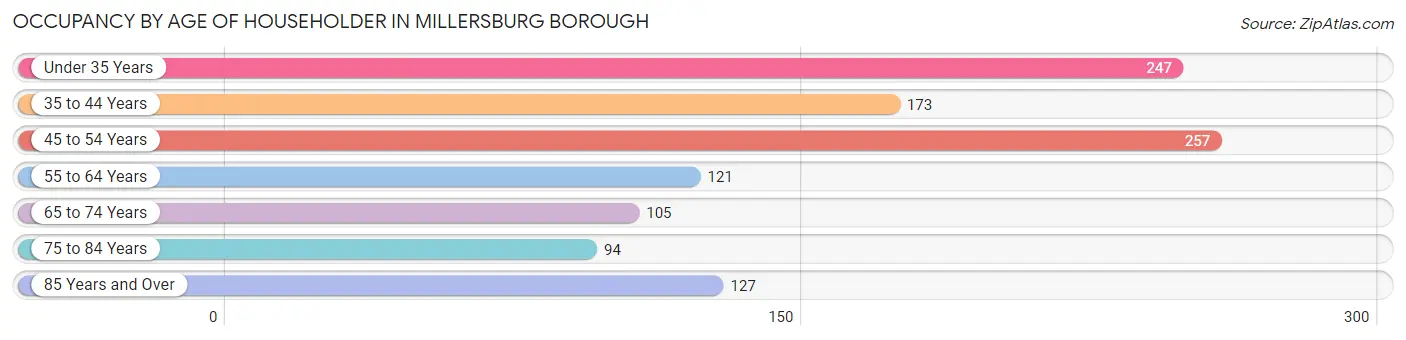
| Age Bracket | # Households | % Households |
| Under 35 Years | 247 | 22.0% |
| 35 to 44 Years | 173 | 15.4% |
| 45 to 54 Years | 257 | 22.9% |
| 55 to 64 Years | 121 | 10.8% |
| 65 to 74 Years | 105 | 9.3% |
| 75 to 84 Years | 94 | 8.4% |
| 85 Years and Over | 127 | 11.3% |
| Total | 1,124 | 100.0% |
Housing Finances in Millersburg borough
Median Income by Occupancy in Millersburg borough
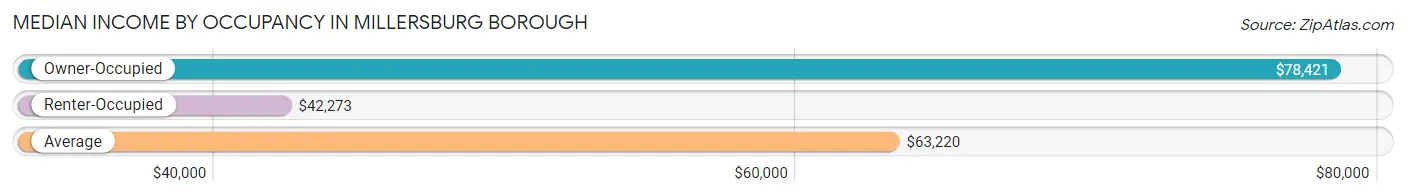
| Occupancy Type | # Households | Median Income |
| Owner-Occupied | 600 (53.4%) | $78,421 |
| Renter-Occupied | 524 (46.6%) | $42,273 |
| Average | 1,124 (100.0%) | $63,220 |
Occupancy by Householder Income Bracket in Millersburg borough
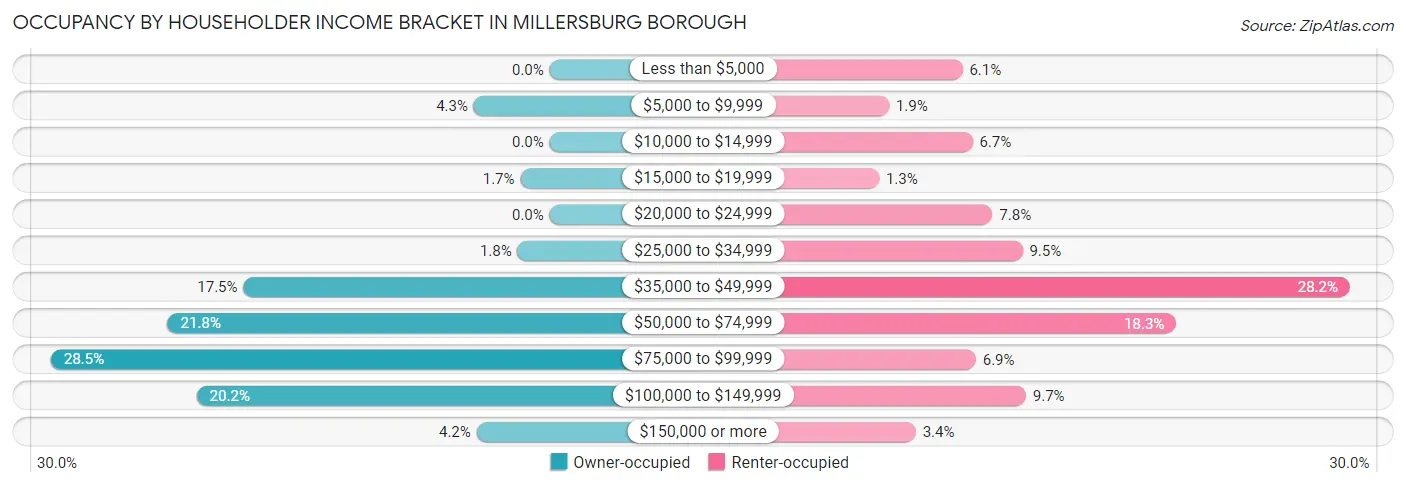
| Income Bracket | Owner-occupied | Renter-occupied |
| Less than $5,000 | 0 (0.0%) | 32 (6.1%) |
| $5,000 to $9,999 | 26 (4.3%) | 10 (1.9%) |
| $10,000 to $14,999 | 0 (0.0%) | 35 (6.7%) |
| $15,000 to $19,999 | 10 (1.7%) | 7 (1.3%) |
| $20,000 to $24,999 | 0 (0.0%) | 41 (7.8%) |
| $25,000 to $34,999 | 11 (1.8%) | 50 (9.5%) |
| $35,000 to $49,999 | 105 (17.5%) | 148 (28.2%) |
| $50,000 to $74,999 | 131 (21.8%) | 96 (18.3%) |
| $75,000 to $99,999 | 171 (28.5%) | 36 (6.9%) |
| $100,000 to $149,999 | 121 (20.2%) | 51 (9.7%) |
| $150,000 or more | 25 (4.2%) | 18 (3.4%) |
| Total | 600 (100.0%) | 524 (100.0%) |
Monthly Housing Cost Tiers in Millersburg borough
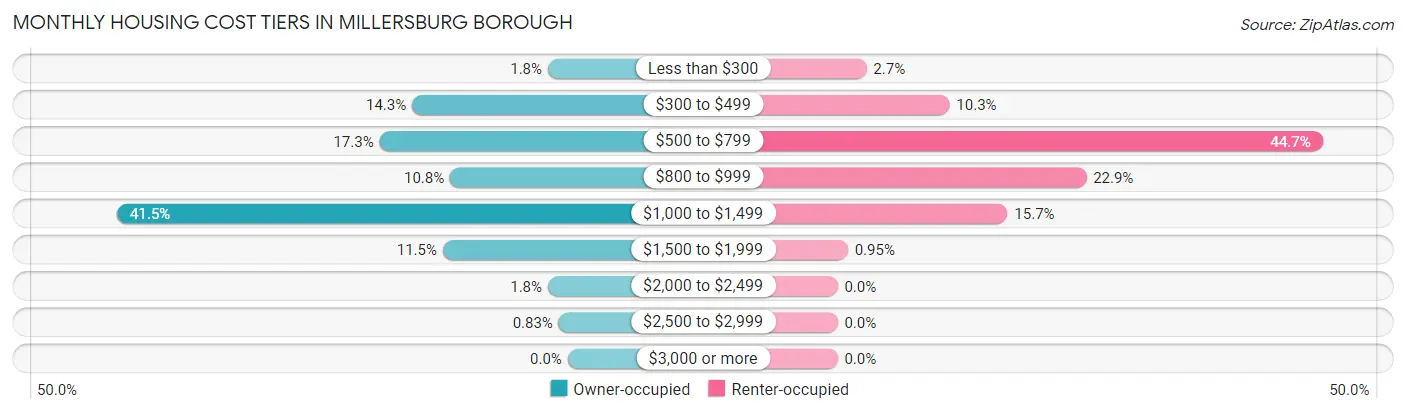
| Monthly Cost | Owner-occupied | Renter-occupied |
| Less than $300 | 11 (1.8%) | 14 (2.7%) |
| $300 to $499 | 86 (14.3%) | 54 (10.3%) |
| $500 to $799 | 104 (17.3%) | 234 (44.7%) |
| $800 to $999 | 65 (10.8%) | 120 (22.9%) |
| $1,000 to $1,499 | 249 (41.5%) | 82 (15.7%) |
| $1,500 to $1,999 | 69 (11.5%) | 5 (0.9%) |
| $2,000 to $2,499 | 11 (1.8%) | 0 (0.0%) |
| $2,500 to $2,999 | 5 (0.8%) | 0 (0.0%) |
| $3,000 or more | 0 (0.0%) | 0 (0.0%) |
| Total | 600 (100.0%) | 524 (100.0%) |
Physical Housing Characteristics in Millersburg borough
Housing Structures in Millersburg borough
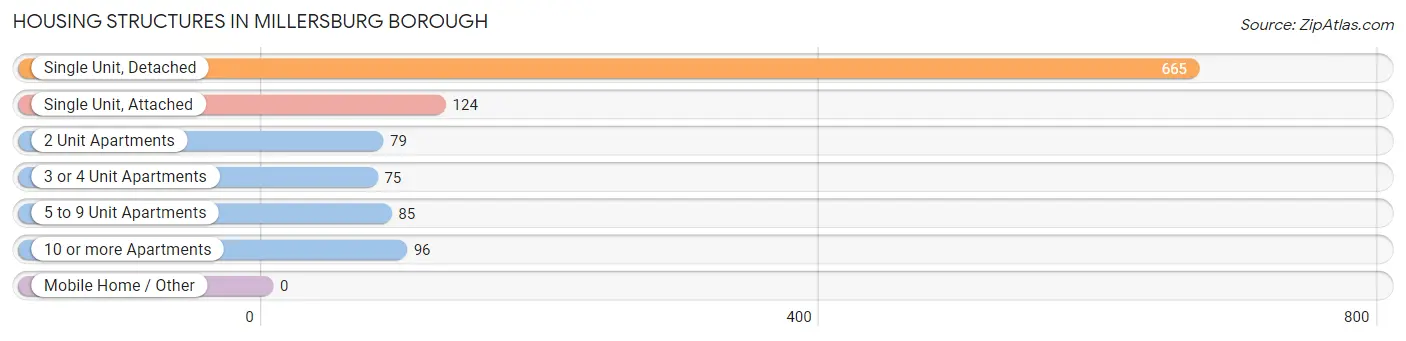
| Structure Type | # Housing Units | % Housing Units |
| Single Unit, Detached | 665 | 59.2% |
| Single Unit, Attached | 124 | 11.0% |
| 2 Unit Apartments | 79 | 7.0% |
| 3 or 4 Unit Apartments | 75 | 6.7% |
| 5 to 9 Unit Apartments | 85 | 7.6% |
| 10 or more Apartments | 96 | 8.5% |
| Mobile Home / Other | 0 | 0.0% |
| Total | 1,124 | 100.0% |
Housing Structures by Occupancy in Millersburg borough
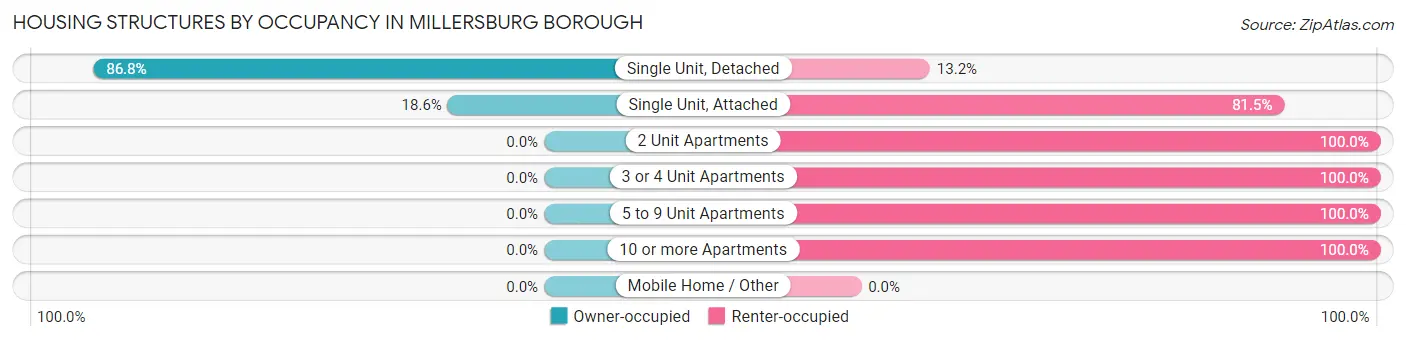
| Structure Type | Owner-occupied | Renter-occupied |
| Single Unit, Detached | 577 (86.8%) | 88 (13.2%) |
| Single Unit, Attached | 23 (18.5%) | 101 (81.5%) |
| 2 Unit Apartments | 0 (0.0%) | 79 (100.0%) |
| 3 or 4 Unit Apartments | 0 (0.0%) | 75 (100.0%) |
| 5 to 9 Unit Apartments | 0 (0.0%) | 85 (100.0%) |
| 10 or more Apartments | 0 (0.0%) | 96 (100.0%) |
| Mobile Home / Other | 0 (0.0%) | 0 (0.0%) |
| Total | 600 (53.4%) | 524 (46.6%) |
Housing Structures by Number of Rooms in Millersburg borough
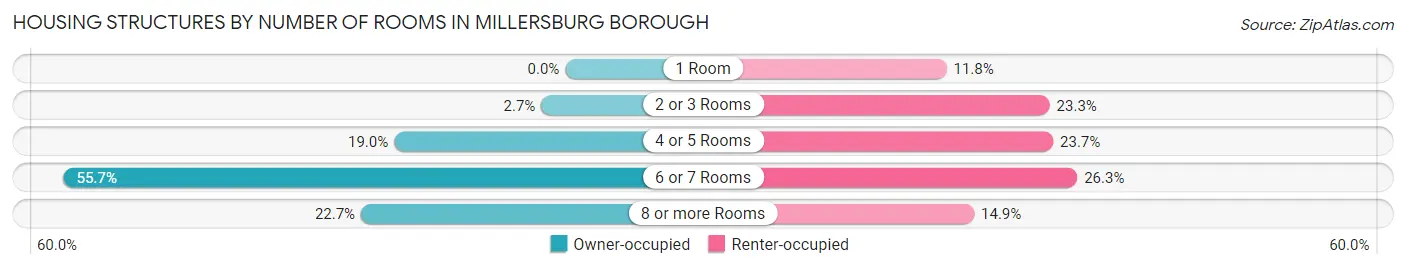
| Number of Rooms | Owner-occupied | Renter-occupied |
| 1 Room | 0 (0.0%) | 62 (11.8%) |
| 2 or 3 Rooms | 16 (2.7%) | 122 (23.3%) |
| 4 or 5 Rooms | 114 (19.0%) | 124 (23.7%) |
| 6 or 7 Rooms | 334 (55.7%) | 138 (26.3%) |
| 8 or more Rooms | 136 (22.7%) | 78 (14.9%) |
| Total | 600 (100.0%) | 524 (100.0%) |
Housing Structure by Heating Type in Millersburg borough
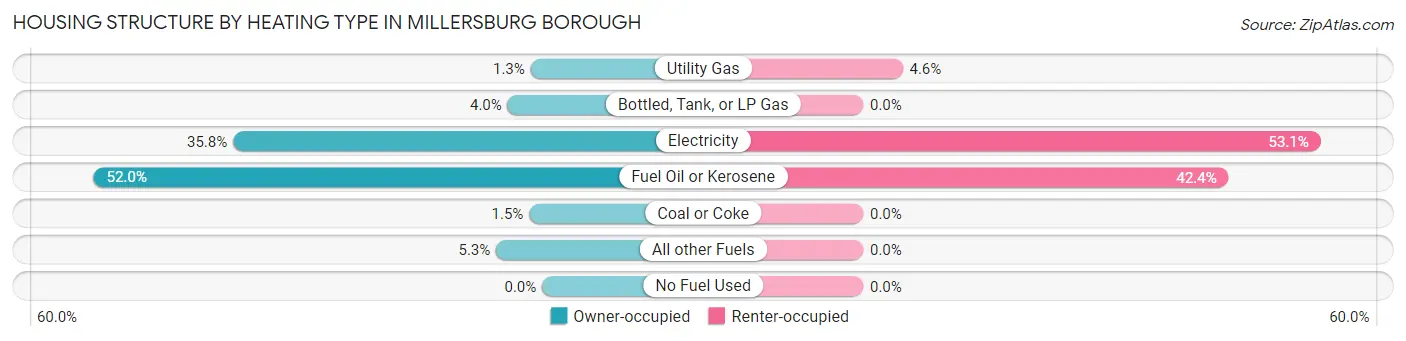
| Heating Type | Owner-occupied | Renter-occupied |
| Utility Gas | 8 (1.3%) | 24 (4.6%) |
| Bottled, Tank, or LP Gas | 24 (4.0%) | 0 (0.0%) |
| Electricity | 215 (35.8%) | 278 (53.0%) |
| Fuel Oil or Kerosene | 312 (52.0%) | 222 (42.4%) |
| Coal or Coke | 9 (1.5%) | 0 (0.0%) |
| All other Fuels | 32 (5.3%) | 0 (0.0%) |
| No Fuel Used | 0 (0.0%) | 0 (0.0%) |
| Total | 600 (100.0%) | 524 (100.0%) |
Household Vehicle Usage in Millersburg borough
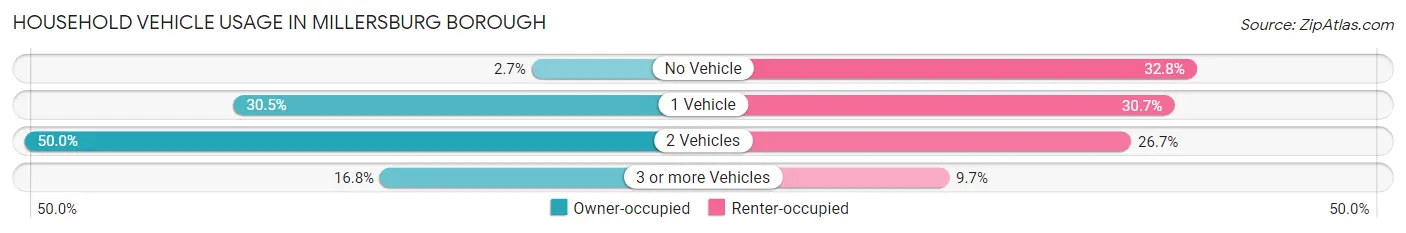
| Vehicles per Household | Owner-occupied | Renter-occupied |
| No Vehicle | 16 (2.7%) | 172 (32.8%) |
| 1 Vehicle | 183 (30.5%) | 161 (30.7%) |
| 2 Vehicles | 300 (50.0%) | 140 (26.7%) |
| 3 or more Vehicles | 101 (16.8%) | 51 (9.7%) |
| Total | 600 (100.0%) | 524 (100.0%) |
Real Estate & Mortgages in Millersburg borough
Real Estate and Mortgage Overview in Millersburg borough
| Characteristic | Without Mortgage | With Mortgage |
| Housing Units | 198 | 402 |
| Median Property Value | $120,800 | $145,700 |
| Median Household Income | $51,071 | $25 |
| Monthly Housing Costs | $524 | $0 |
| Real Estate Taxes | $2,379 | $5 |
Property Value by Mortgage Status in Millersburg borough
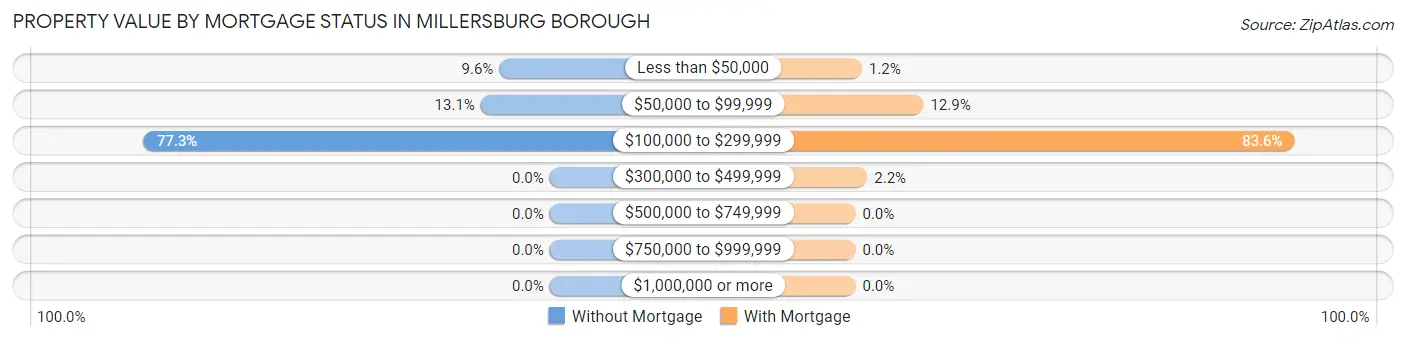
| Property Value | Without Mortgage | With Mortgage |
| Less than $50,000 | 19 (9.6%) | 5 (1.2%) |
| $50,000 to $99,999 | 26 (13.1%) | 52 (12.9%) |
| $100,000 to $299,999 | 153 (77.3%) | 336 (83.6%) |
| $300,000 to $499,999 | 0 (0.0%) | 9 (2.2%) |
| $500,000 to $749,999 | 0 (0.0%) | 0 (0.0%) |
| $750,000 to $999,999 | 0 (0.0%) | 0 (0.0%) |
| $1,000,000 or more | 0 (0.0%) | 0 (0.0%) |
| Total | 198 (100.0%) | 402 (100.0%) |
Household Income by Mortgage Status in Millersburg borough
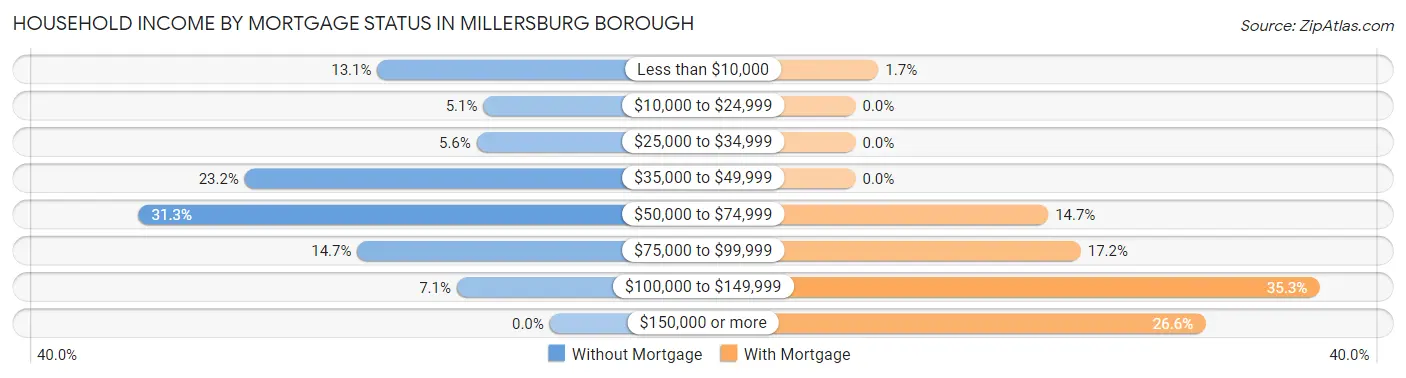
| Household Income | Without Mortgage | With Mortgage |
| Less than $10,000 | 26 (13.1%) | 7 (1.7%) |
| $10,000 to $24,999 | 10 (5.1%) | 0 (0.0%) |
| $25,000 to $34,999 | 11 (5.6%) | 0 (0.0%) |
| $35,000 to $49,999 | 46 (23.2%) | 0 (0.0%) |
| $50,000 to $74,999 | 62 (31.3%) | 59 (14.7%) |
| $75,000 to $99,999 | 29 (14.6%) | 69 (17.2%) |
| $100,000 to $149,999 | 14 (7.1%) | 142 (35.3%) |
| $150,000 or more | 0 (0.0%) | 107 (26.6%) |
| Total | 198 (100.0%) | 402 (100.0%) |
Property Value to Household Income Ratio in Millersburg borough
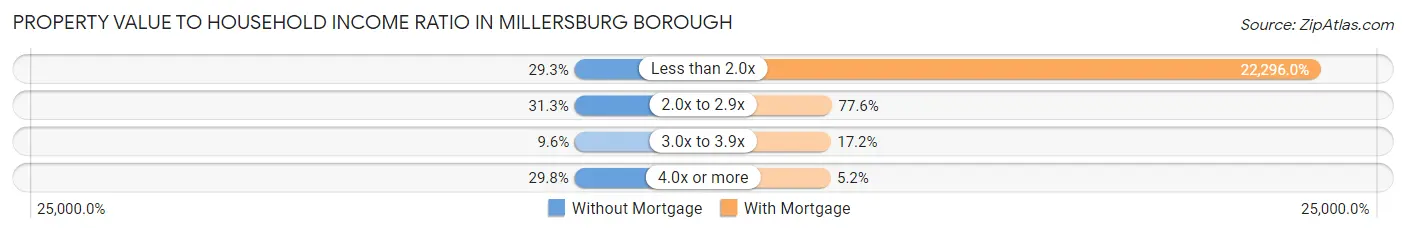
| Value-to-Income Ratio | Without Mortgage | With Mortgage |
| Less than 2.0x | 58 (29.3%) | 89,630 (22,296.0%) |
| 2.0x to 2.9x | 62 (31.3%) | 312 (77.6%) |
| 3.0x to 3.9x | 19 (9.6%) | 69 (17.2%) |
| 4.0x or more | 59 (29.8%) | 21 (5.2%) |
| Total | 198 (100.0%) | 402 (100.0%) |
Real Estate Taxes by Mortgage Status in Millersburg borough
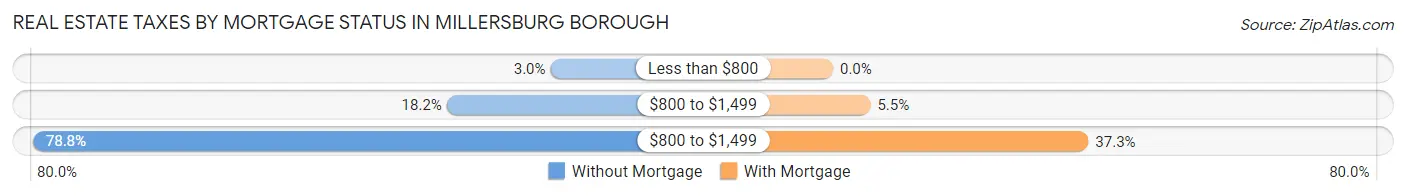
| Property Taxes | Without Mortgage | With Mortgage |
| Less than $800 | 6 (3.0%) | 0 (0.0%) |
| $800 to $1,499 | 36 (18.2%) | 22 (5.5%) |
| $800 to $1,499 | 156 (78.8%) | 150 (37.3%) |
| Total | 198 (100.0%) | 402 (100.0%) |
Health & Disability in Millersburg borough
Health Insurance Coverage by Age in Millersburg borough
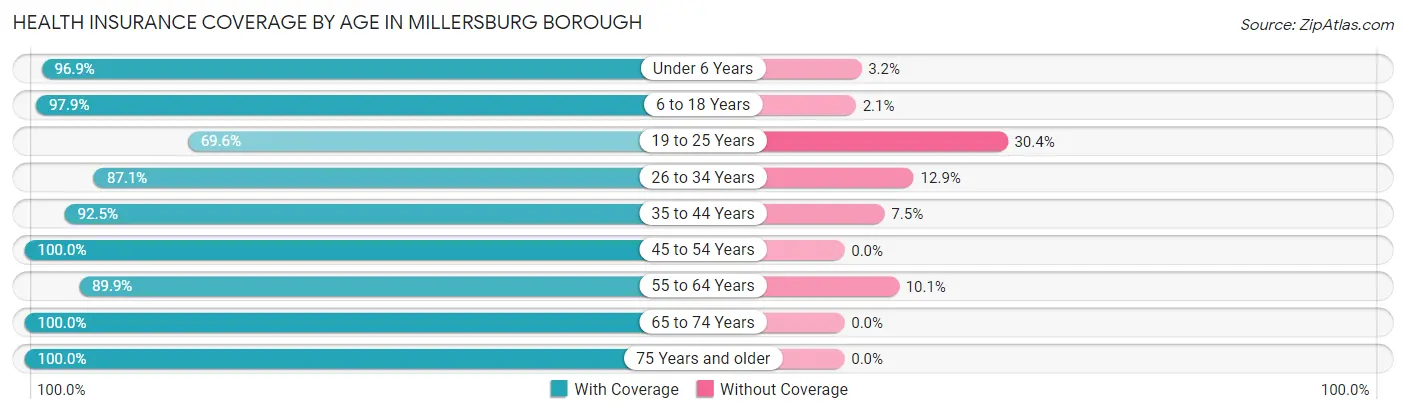
| Age Bracket | With Coverage | Without Coverage |
| Under 6 Years | 277 (96.9%) | 9 (3.2%) |
| 6 to 18 Years | 414 (97.9%) | 9 (2.1%) |
| 19 to 25 Years | 96 (69.6%) | 42 (30.4%) |
| 26 to 34 Years | 357 (87.1%) | 53 (12.9%) |
| 35 to 44 Years | 297 (92.5%) | 24 (7.5%) |
| 45 to 54 Years | 328 (100.0%) | 0 (0.0%) |
| 55 to 64 Years | 186 (89.9%) | 21 (10.1%) |
| 65 to 74 Years | 123 (100.0%) | 0 (0.0%) |
| 75 Years and older | 304 (100.0%) | 0 (0.0%) |
| Total | 2,382 (93.8%) | 158 (6.2%) |
Health Insurance Coverage by Citizenship Status in Millersburg borough
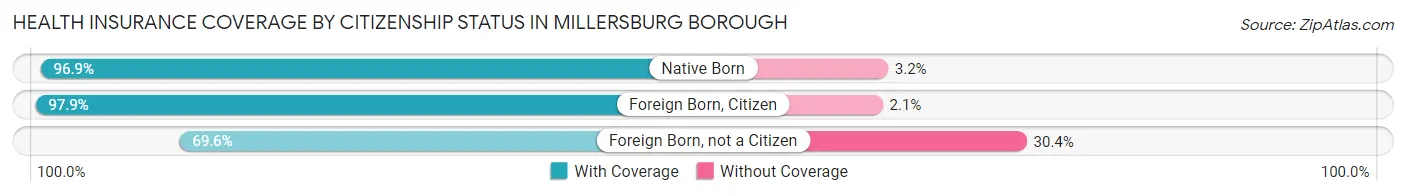
| Citizenship Status | With Coverage | Without Coverage |
| Native Born | 277 (96.9%) | 9 (3.2%) |
| Foreign Born, Citizen | 414 (97.9%) | 9 (2.1%) |
| Foreign Born, not a Citizen | 96 (69.6%) | 42 (30.4%) |
Health Insurance Coverage by Household Income in Millersburg borough
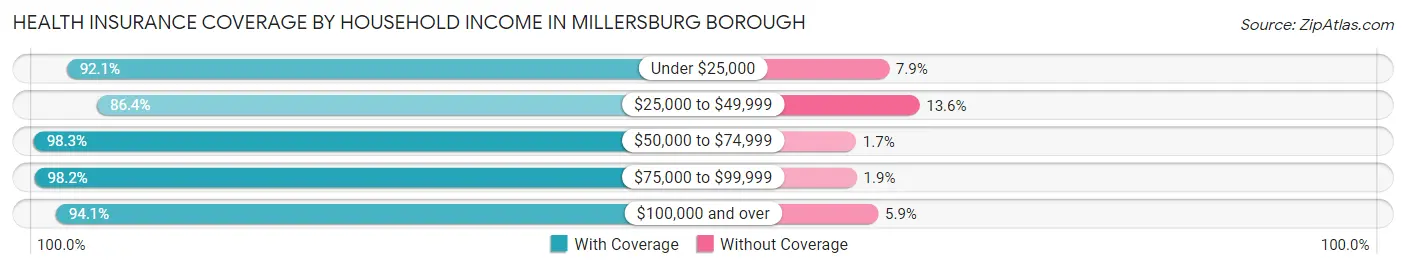
| Household Income | With Coverage | Without Coverage |
| Under $25,000 | 210 (92.1%) | 18 (7.9%) |
| $25,000 to $49,999 | 566 (86.4%) | 89 (13.6%) |
| $50,000 to $74,999 | 518 (98.3%) | 9 (1.7%) |
| $75,000 to $99,999 | 585 (98.2%) | 11 (1.8%) |
| $100,000 and over | 498 (94.1%) | 31 (5.9%) |
Public vs Private Health Insurance Coverage by Age in Millersburg borough
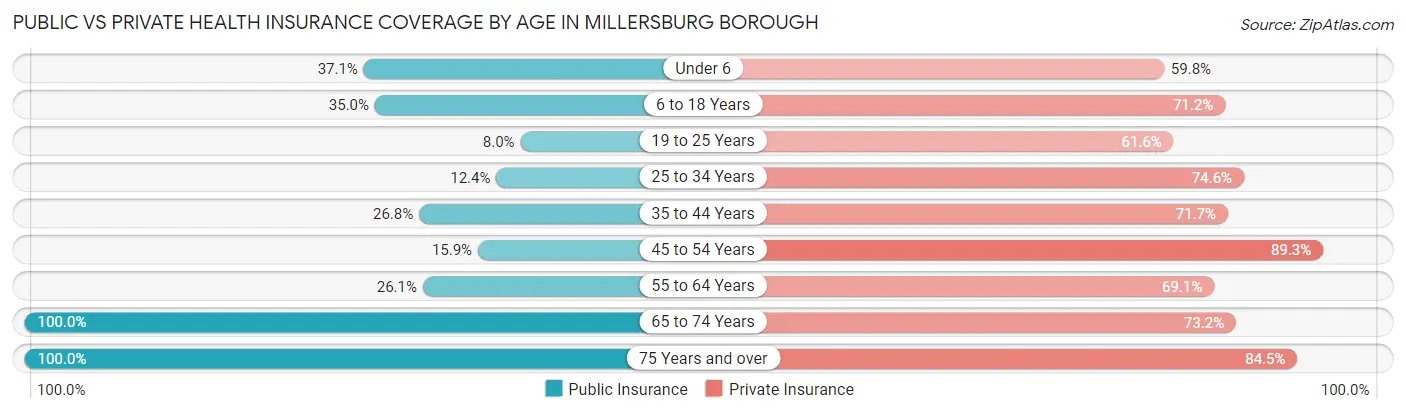
| Age Bracket | Public Insurance | Private Insurance |
| Under 6 | 106 (37.1%) | 171 (59.8%) |
| 6 to 18 Years | 148 (35.0%) | 301 (71.2%) |
| 19 to 25 Years | 11 (8.0%) | 85 (61.6%) |
| 25 to 34 Years | 51 (12.4%) | 306 (74.6%) |
| 35 to 44 Years | 86 (26.8%) | 230 (71.7%) |
| 45 to 54 Years | 52 (15.9%) | 293 (89.3%) |
| 55 to 64 Years | 54 (26.1%) | 143 (69.1%) |
| 65 to 74 Years | 123 (100.0%) | 90 (73.2%) |
| 75 Years and over | 304 (100.0%) | 257 (84.5%) |
| Total | 935 (36.8%) | 1,876 (73.9%) |
Disability Status by Sex by Age in Millersburg borough
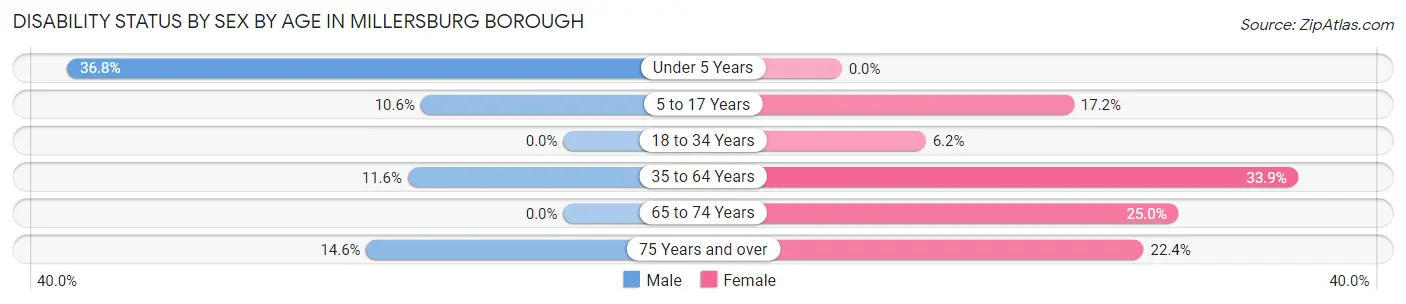
| Age Bracket | Male | Female |
| Under 5 Years | 35 (36.8%) | 0 (0.0%) |
| 5 to 17 Years | 18 (10.6%) | 46 (17.2%) |
| 18 to 34 Years | 0 (0.0%) | 19 (6.2%) |
| 35 to 64 Years | 59 (11.6%) | 117 (33.9%) |
| 65 to 74 Years | 0 (0.0%) | 17 (25.0%) |
| 75 Years and over | 19 (14.6%) | 39 (22.4%) |
Disability Class by Sex by Age in Millersburg borough
Disability Class: Hearing Difficulty
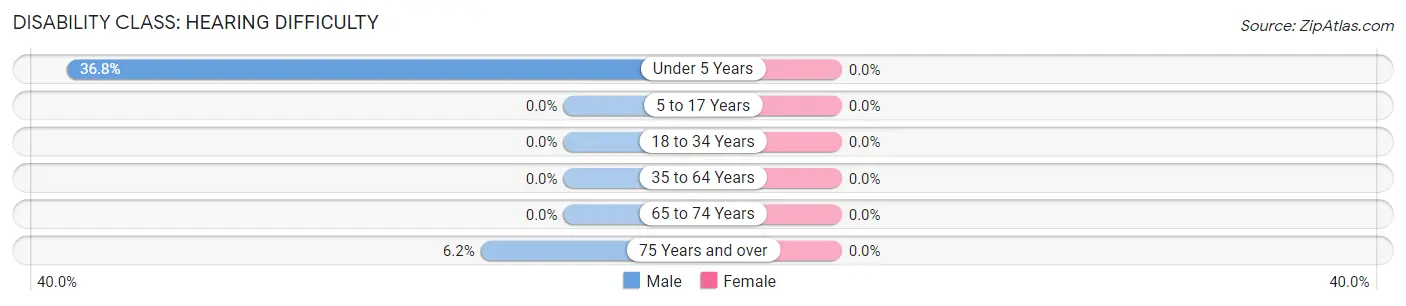
| Age Bracket | Male | Female |
| Under 5 Years | 35 (36.8%) | 0 (0.0%) |
| 5 to 17 Years | 0 (0.0%) | 0 (0.0%) |
| 18 to 34 Years | 0 (0.0%) | 0 (0.0%) |
| 35 to 64 Years | 0 (0.0%) | 0 (0.0%) |
| 65 to 74 Years | 0 (0.0%) | 0 (0.0%) |
| 75 Years and over | 8 (6.1%) | 0 (0.0%) |
Disability Class: Vision Difficulty
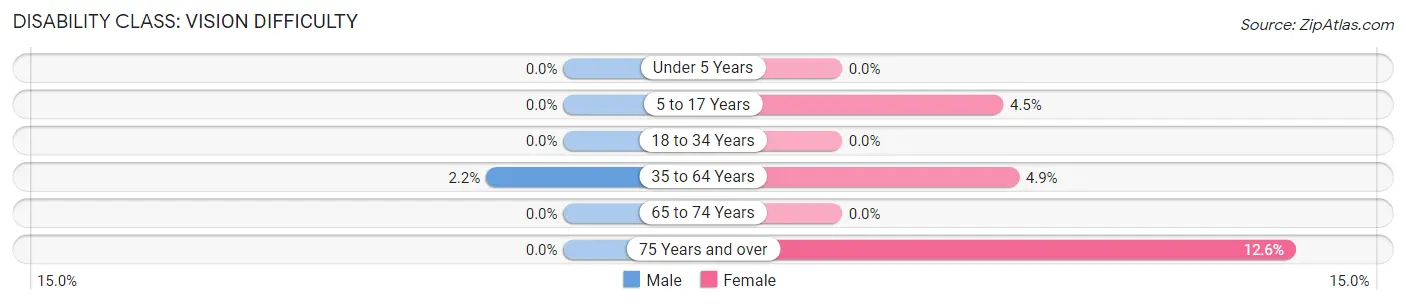
| Age Bracket | Male | Female |
| Under 5 Years | 0 (0.0%) | 0 (0.0%) |
| 5 to 17 Years | 0 (0.0%) | 12 (4.5%) |
| 18 to 34 Years | 0 (0.0%) | 0 (0.0%) |
| 35 to 64 Years | 11 (2.1%) | 17 (4.9%) |
| 65 to 74 Years | 0 (0.0%) | 0 (0.0%) |
| 75 Years and over | 0 (0.0%) | 22 (12.6%) |
Disability Class: Cognitive Difficulty
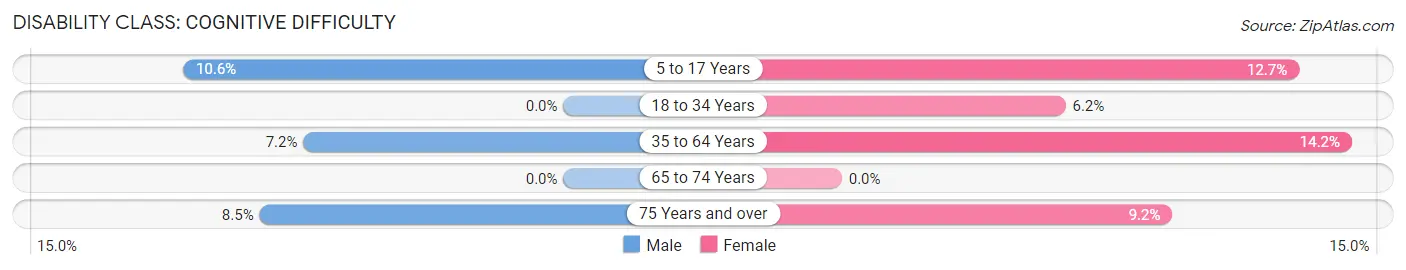
| Age Bracket | Male | Female |
| 5 to 17 Years | 18 (10.6%) | 34 (12.7%) |
| 18 to 34 Years | 0 (0.0%) | 19 (6.2%) |
| 35 to 64 Years | 37 (7.2%) | 49 (14.2%) |
| 65 to 74 Years | 0 (0.0%) | 0 (0.0%) |
| 75 Years and over | 11 (8.5%) | 16 (9.2%) |
Disability Class: Ambulatory Difficulty
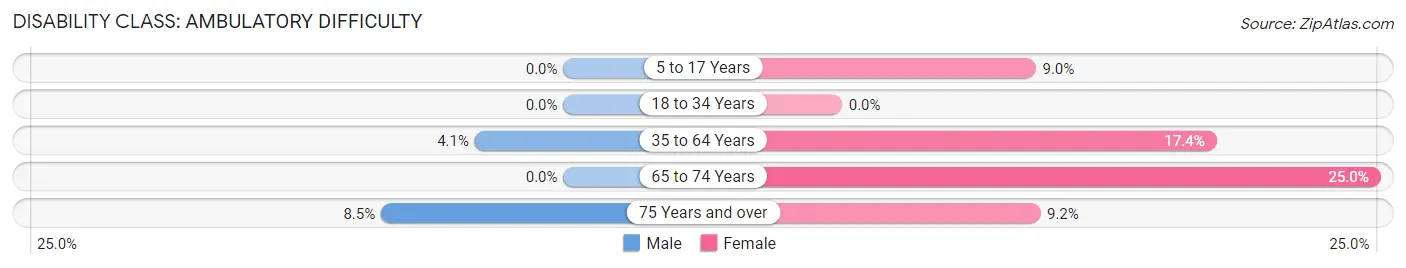
| Age Bracket | Male | Female |
| 5 to 17 Years | 0 (0.0%) | 24 (9.0%) |
| 18 to 34 Years | 0 (0.0%) | 0 (0.0%) |
| 35 to 64 Years | 21 (4.1%) | 60 (17.4%) |
| 65 to 74 Years | 0 (0.0%) | 17 (25.0%) |
| 75 Years and over | 11 (8.5%) | 16 (9.2%) |
Disability Class: Self-Care Difficulty
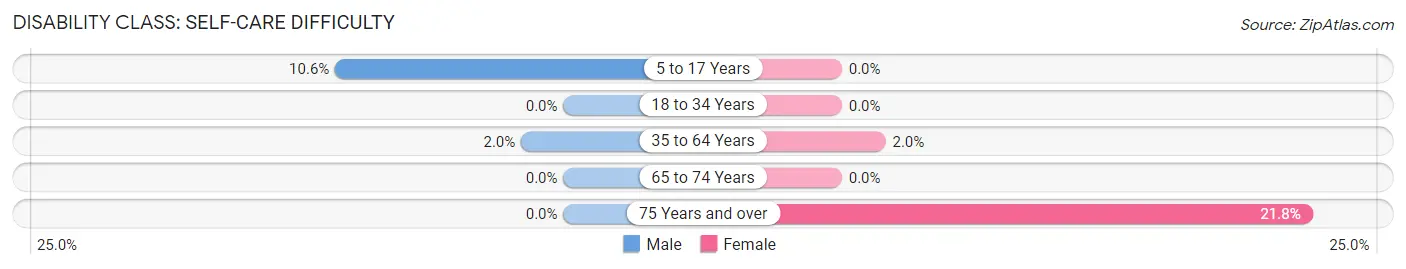
| Age Bracket | Male | Female |
| 5 to 17 Years | 18 (10.6%) | 0 (0.0%) |
| 18 to 34 Years | 0 (0.0%) | 0 (0.0%) |
| 35 to 64 Years | 10 (2.0%) | 7 (2.0%) |
| 65 to 74 Years | 0 (0.0%) | 0 (0.0%) |
| 75 Years and over | 0 (0.0%) | 38 (21.8%) |
Technology Access in Millersburg borough
Computing Device Access in Millersburg borough
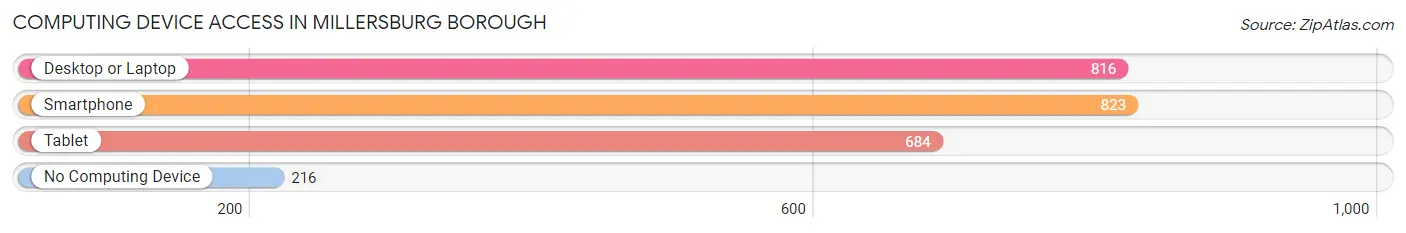
| Device Type | # Households | % Households |
| Desktop or Laptop | 816 | 72.6% |
| Smartphone | 823 | 73.2% |
| Tablet | 684 | 60.9% |
| No Computing Device | 216 | 19.2% |
| Total | 1,124 | 100.0% |
Internet Access in Millersburg borough
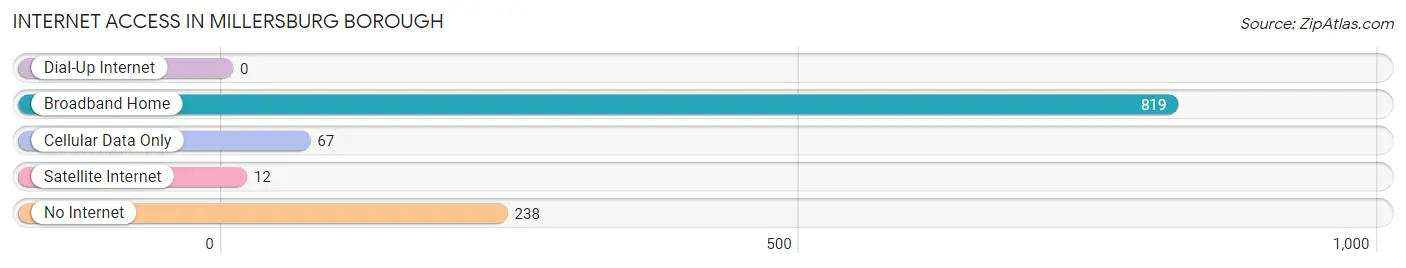
| Internet Type | # Households | % Households |
| Dial-Up Internet | 0 | 0.0% |
| Broadband Home | 819 | 72.9% |
| Cellular Data Only | 67 | 6.0% |
| Satellite Internet | 12 | 1.1% |
| No Internet | 238 | 21.2% |
| Total | 1,124 | 100.0% |
Millersburg borough Summary
Millerburg Borough is a small borough located in Dauphin County, Pennsylvania. It is situated in the Susquehanna Valley, approximately 10 miles north of Harrisburg, the state capital. The borough is part of the Harrisburg-Carlisle Metropolitan Statistical Area. As of the 2010 census, the population of Millerburg Borough was 1,845.
History
Millerburg Borough was founded in 1845 by a group of German immigrants. The town was named after the Miller family, who were among the first settlers. The town was originally a farming community, but it soon developed into a small industrial center. The first industry in the area was a sawmill, which was built in 1848. This was followed by a gristmill, a tannery, and a woolen mill.
In the late 19th century, Millerburg Borough became a popular tourist destination. The town was known for its scenic beauty and its many attractions, including a hotel, a theater, and a park. The town also had a thriving business district, with several stores and restaurants.
Geography
Millerburg Borough is located in the Susquehanna Valley, approximately 10 miles north of Harrisburg. The borough is situated on the east bank of the Susquehanna River, and is bordered by the towns of Millersburg, Elizabethville, and Halifax. The borough covers an area of 1.2 square miles, and has a population density of 1,541 people per square mile.
The terrain of Millerburg Borough is mostly flat, with some rolling hills. The borough is located in a temperate climate zone, with hot summers and cold winters. The average annual temperature is 52 degrees Fahrenheit, and the average annual precipitation is 41 inches.
Economy
The economy of Millerburg Borough is largely based on tourism and retail. The town is home to several small businesses, including restaurants, shops, and galleries. The town also has a thriving arts and culture scene, with several festivals and events held throughout the year.
Millerburg Borough is also home to several manufacturing companies, including a paper mill, a plastics factory, and a metal fabrication plant. The borough is also home to a large trucking company, which provides transportation services to the surrounding area.
Demographics
As of the 2010 census, the population of Millerburg Borough was 1,845. The racial makeup of the borough was 95.3% White, 1.2% African American, 0.3% Native American, 0.7% Asian, 0.1% Pacific Islander, and 2.4% from other races. Hispanic or Latino of any race were 2.7% of the population.
The median household income in Millerburg Borough was $41,944, and the median family income was $50,938. The per capita income was $20,945. About 8.3% of families and 10.2% of the population were below the poverty line, including 14.2% of those under age 18 and 6.2% of those age 65 or over.
Common Questions
What is Per Capita Income in Millersburg borough?
Per Capita income in Millersburg borough is $29,369.
What is the Median Family Income in Millersburg borough?
Median Family Income in Millersburg borough is $71,953.
What is the Median Household income in Millersburg borough?
Median Household Income in Millersburg borough is $63,220.
What is Income or Wage Gap in Millersburg borough?
Income or Wage Gap in Millersburg borough is 40.9%.
Women in Millersburg borough earn 59.1 cents for every dollar earned by a man.
What is Family Income Deficit in Millersburg borough?
Family Income Deficit in Millersburg borough is $16,520.
Families that are below poverty line in Millersburg borough earn $16,520 less on average than the poverty threshold level.
What is Inequality or Gini Index in Millersburg borough?
Inequality or Gini Index in Millersburg borough is 0.34.
What is the Total Population of Millersburg borough?
Total Population of Millersburg borough is 2,546.
What is the Total Male Population of Millersburg borough?
Total Male Population of Millersburg borough is 1,271.
What is the Total Female Population of Millersburg borough?
Total Female Population of Millersburg borough is 1,275.
What is the Ratio of Males per 100 Females in Millersburg borough?
There are 99.69 Males per 100 Females in Millersburg borough.
What is the Ratio of Females per 100 Males in Millersburg borough?
There are 100.31 Females per 100 Males in Millersburg borough.
What is the Median Population Age in Millersburg borough?
Median Population Age in Millersburg borough is 35.3 Years.
What is the Average Family Size in Millersburg borough
Average Family Size in Millersburg borough is 3.1 People.
What is the Average Household Size in Millersburg borough
Average Household Size in Millersburg borough is 2.3 People.
How Large is the Labor Force in Millersburg borough?
There are 1,301 People in the Labor Forcein in Millersburg borough.
What is the Percentage of People in the Labor Force in Millersburg borough?
66.9% of People are in the Labor Force in Millersburg borough.
What is the Unemployment Rate in Millersburg borough?
Unemployment Rate in Millersburg borough is 0.8%.