Midway, PA Map & Demographics
Midway Map
Midway Overview
$23,933
PER CAPITA INCOME
$39,932
AVG FAMILY INCOME
$40,813
AVG HOUSEHOLD INCOME
0.32
INEQUALITY / GINI INDEX
814
TOTAL POPULATION
379
MALE POPULATION
435
FEMALE POPULATION
87.13
MALES / 100 FEMALES
114.78
FEMALES / 100 MALES
64.5
MEDIAN AGE
2.2
AVG FAMILY SIZE
2.0
AVG HOUSEHOLD SIZE
383
LABOR FORCE [ PEOPLE ]
48.2%
PERCENT IN LABOR FORCE
2.3%
UNEMPLOYMENT RATE
Midway Zip Codes
Midway Area Codes
Income in Midway
Income Overview in Midway
Per Capita Income in Midway is $23,933, while median incomes of families and households are $39,932 and $40,813 respectively.
| Characteristic | Number | Measure |
| Per Capita Income | 814 | $23,933 |
| Median Family Income | 214 | $39,932 |
| Mean Family Income | 214 | $50,387 |
| Median Household Income | 403 | $40,813 |
| Mean Household Income | 403 | $48,370 |
| Income Deficit | 214 | $0 |
| Wage / Income Gap (%) | 814 | 0.00% |
| Wage / Income Gap ($) | 814 | 100.00¢ per $1 |
| Gini / Inequality Index | 814 | 0.32 |
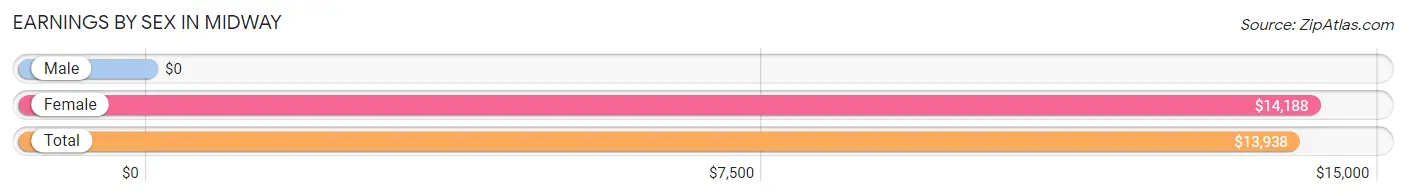
Earnings by Sex in Midway
| Sex | Number | Average Earnings |
| Male | 174 (35.0%) | $0 |
| Female | 323 (65.0%) | $14,188 |
| Total | 497 (100.0%) | $13,938 |
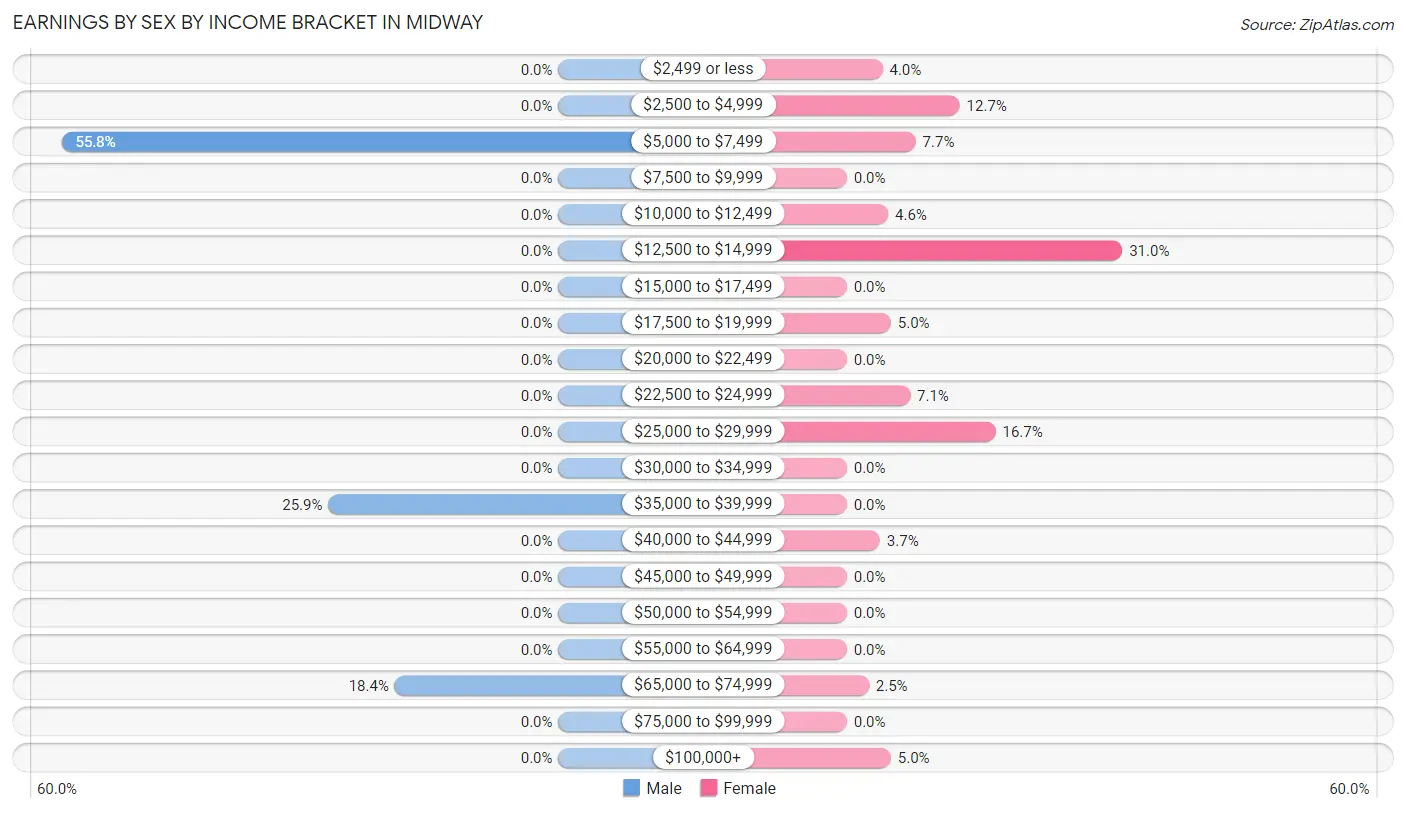
Earnings by Sex by Income Bracket in Midway
The most common earnings brackets in Midway are $5,000 to $7,499 for men (97 | 55.7%) and $12,500 to $14,999 for women (100 | 31.0%).
| Income | Male | Female |
| $2,499 or less | 0 (0.0%) | 13 (4.0%) |
| $2,500 to $4,999 | 0 (0.0%) | 41 (12.7%) |
| $5,000 to $7,499 | 97 (55.7%) | 25 (7.7%) |
| $7,500 to $9,999 | 0 (0.0%) | 0 (0.0%) |
| $10,000 to $12,499 | 0 (0.0%) | 15 (4.6%) |
| $12,500 to $14,999 | 0 (0.0%) | 100 (31.0%) |
| $15,000 to $17,499 | 0 (0.0%) | 0 (0.0%) |
| $17,500 to $19,999 | 0 (0.0%) | 16 (5.0%) |
| $20,000 to $22,499 | 0 (0.0%) | 0 (0.0%) |
| $22,500 to $24,999 | 0 (0.0%) | 23 (7.1%) |
| $25,000 to $29,999 | 0 (0.0%) | 54 (16.7%) |
| $30,000 to $34,999 | 0 (0.0%) | 0 (0.0%) |
| $35,000 to $39,999 | 45 (25.9%) | 0 (0.0%) |
| $40,000 to $44,999 | 0 (0.0%) | 12 (3.7%) |
| $45,000 to $49,999 | 0 (0.0%) | 0 (0.0%) |
| $50,000 to $54,999 | 0 (0.0%) | 0 (0.0%) |
| $55,000 to $64,999 | 0 (0.0%) | 0 (0.0%) |
| $65,000 to $74,999 | 32 (18.4%) | 8 (2.5%) |
| $75,000 to $99,999 | 0 (0.0%) | 0 (0.0%) |
| $100,000+ | 0 (0.0%) | 16 (5.0%) |
| Total | 174 (100.0%) | 323 (100.0%) |
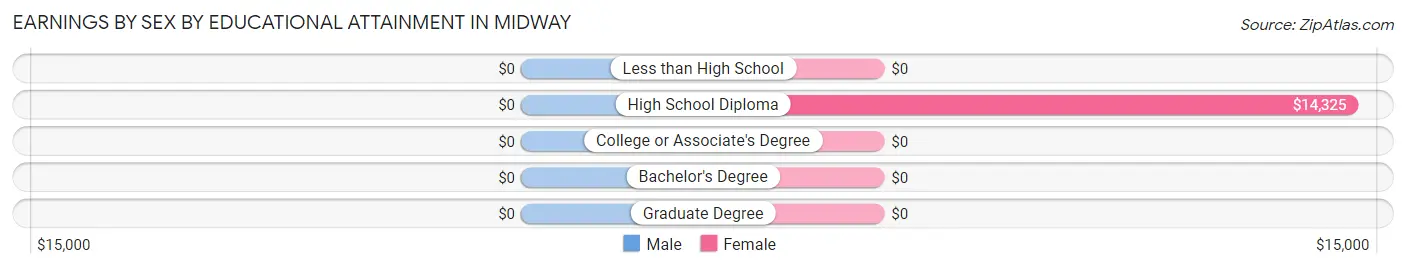
Earnings by Sex by Educational Attainment in Midway
| Educational Attainment | Male Income | Female Income |
| Less than High School | - | - |
| High School Diploma | - | - |
| College or Associate's Degree | - | - |
| Bachelor's Degree | - | - |
| Graduate Degree | - | - |
| Total | - | - |
Family Income in Midway
Family Income Brackets in Midway
According to the Midway family income data, there are 136 families falling into the $35,000 to $49,999 income range, which is the most common income bracket and makes up 63.5% of all families.
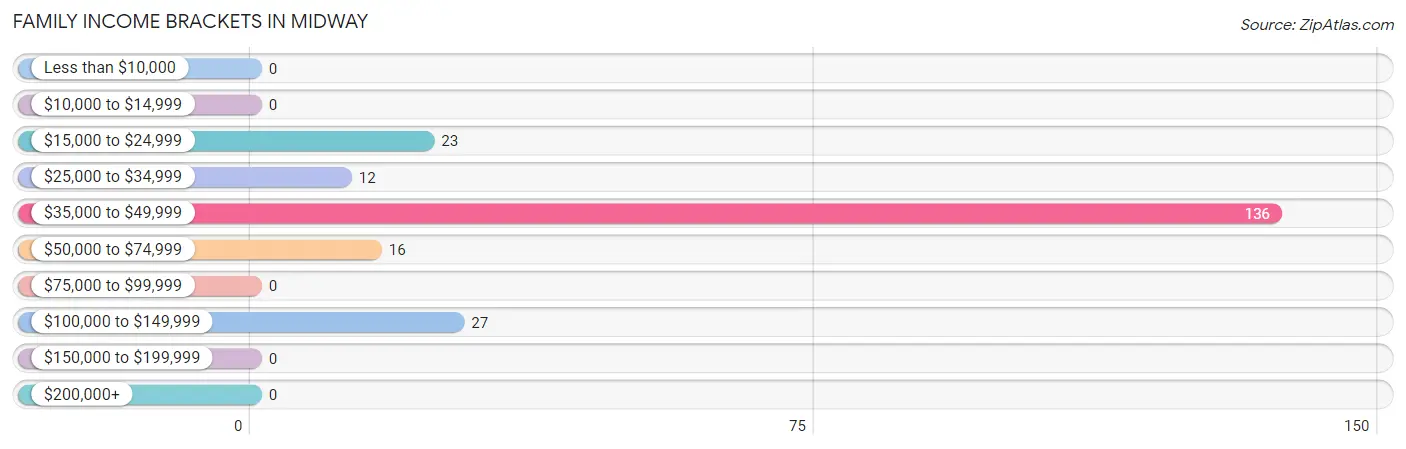
| Income Bracket | # Families | % Families |
| Less than $10,000 | 0 | 0.0% |
| $10,000 to $14,999 | 0 | 0.0% |
| $15,000 to $24,999 | 23 | 10.7% |
| $25,000 to $34,999 | 12 | 5.6% |
| $35,000 to $49,999 | 136 | 63.6% |
| $50,000 to $74,999 | 16 | 7.5% |
| $75,000 to $99,999 | 0 | 0.0% |
| $100,000 to $149,999 | 27 | 12.6% |
| $150,000 to $199,999 | 0 | 0.0% |
| $200,000+ | 0 | 0.0% |
Family Income by Famaliy Size in Midway
2-person families (206 | 96.3%) account for the highest median family income in Midway with $39,797 per family, while 2-person families (206 | 96.3%) have the highest median income of $19,898 per family member.
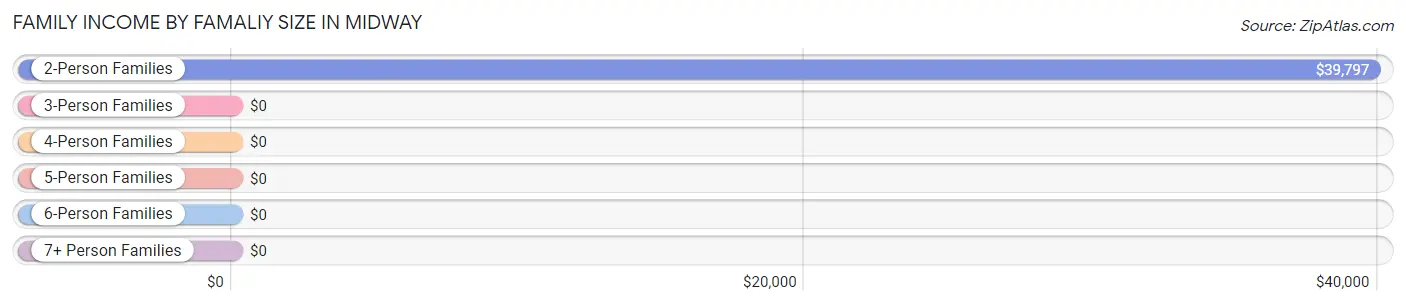
| Income Bracket | # Families | Median Income |
| 2-Person Families | 206 (96.3%) | $39,797 |
| 3-Person Families | 0 (0.0%) | $0 |
| 4-Person Families | 0 (0.0%) | $0 |
| 5-Person Families | 8 (3.7%) | $0 |
| 6-Person Families | 0 (0.0%) | $0 |
| 7+ Person Families | 0 (0.0%) | $0 |
| Total | 214 (100.0%) | $39,932 |
Family Income by Number of Earners in Midway
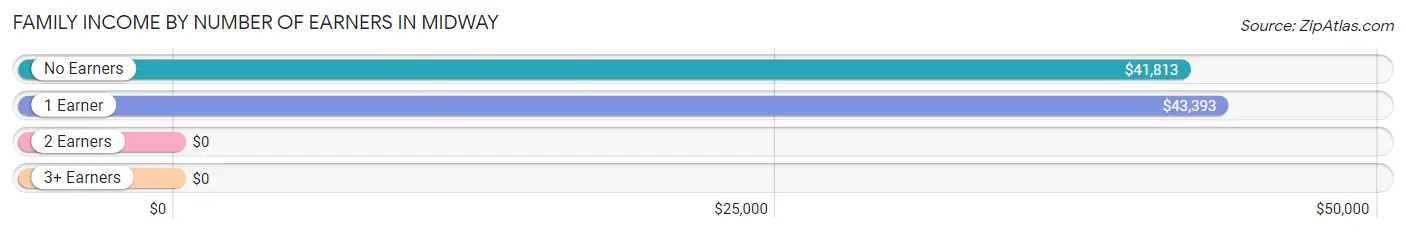
| Number of Earners | # Families | Median Income |
| No Earners | 53 (24.8%) | $41,813 |
| 1 Earner | 71 (33.2%) | $43,393 |
| 2 Earners | 82 (38.3%) | $0 |
| 3+ Earners | 8 (3.7%) | $0 |
| Total | 214 (100.0%) | $39,932 |
Household Income in Midway
Household Income Brackets in Midway
With 181 households falling in the category, the $35,000 to $49,999 income range is the most frequent in Midway, accounting for 44.9% of all households.
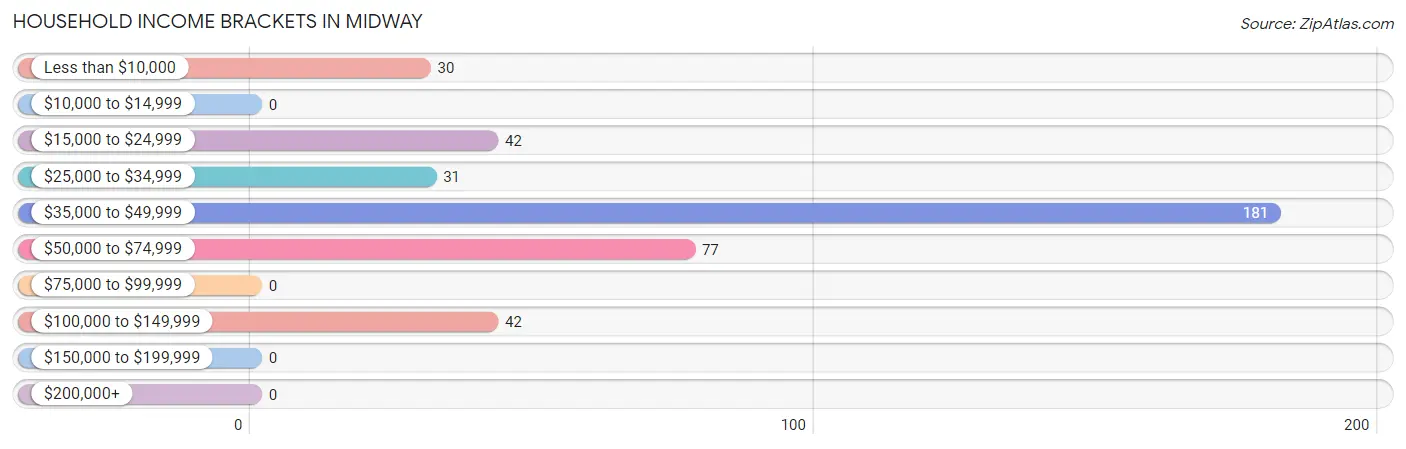
| Income Bracket | # Households | % Households |
| Less than $10,000 | 30 | 7.4% |
| $10,000 to $14,999 | 0 | 0.0% |
| $15,000 to $24,999 | 42 | 10.4% |
| $25,000 to $34,999 | 31 | 7.7% |
| $35,000 to $49,999 | 181 | 44.9% |
| $50,000 to $74,999 | 77 | 19.1% |
| $75,000 to $99,999 | 0 | 0.0% |
| $100,000 to $149,999 | 42 | 10.4% |
| $150,000 to $199,999 | 0 | 0.0% |
| $200,000+ | 0 | 0.0% |
Household Income by Householder Age in Midway
The median household income in Midway is $40,813, with the highest median household income of $43,333 found in the 45 to 64 years age bracket for the primary householder. A total of 142 households (35.2%) fall into this category.
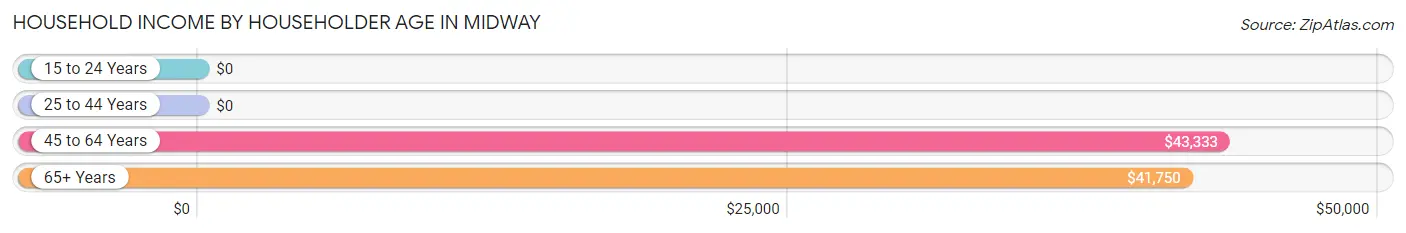
| Income Bracket | # Households | Median Income |
| 15 to 24 Years | 0 (0.0%) | $0 |
| 25 to 44 Years | 23 (5.7%) | $0 |
| 45 to 64 Years | 142 (35.2%) | $43,333 |
| 65+ Years | 238 (59.1%) | $41,750 |
| Total | 403 (100.0%) | $40,813 |
Poverty in Midway
Income Below Poverty by Sex and Age in Midway
With 10.8% poverty level for males and 18.6% for females among the residents of Midway, 45 to 54 year old males and 45 to 54 year old females are the most vulnerable to poverty, with 27 males (27.0%) and 25 females (75.8%) in their respective age groups living below the poverty level.
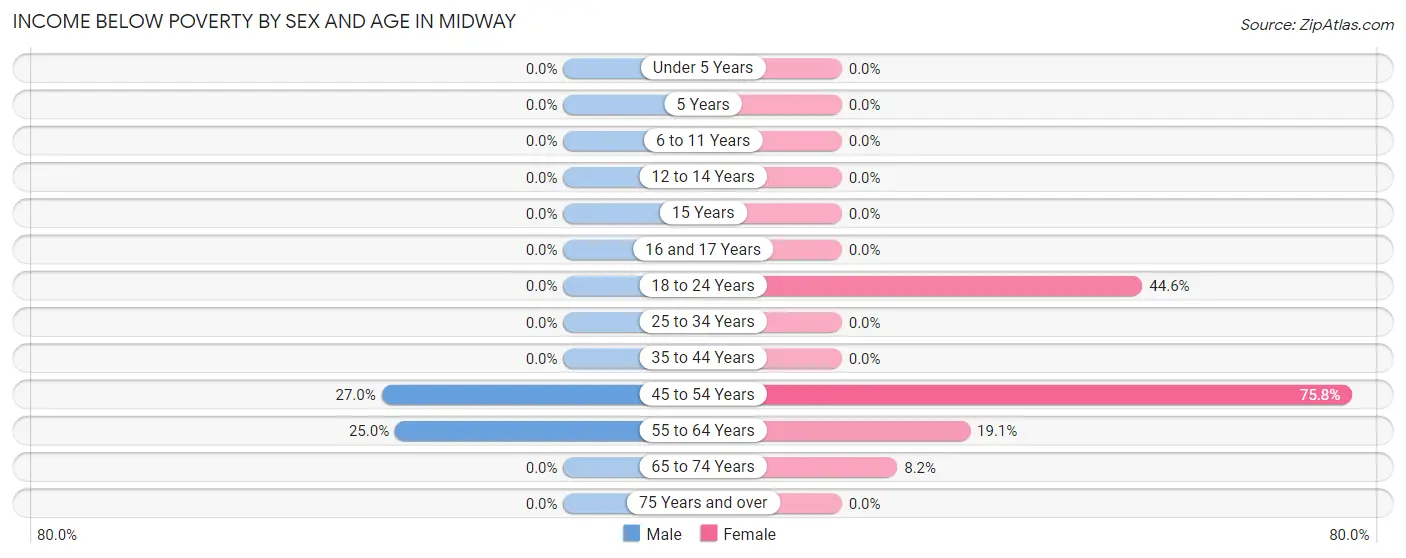
| Age Bracket | Male | Female |
| Under 5 Years | 0 (0.0%) | 0 (0.0%) |
| 5 Years | 0 (0.0%) | 0 (0.0%) |
| 6 to 11 Years | 0 (0.0%) | 0 (0.0%) |
| 12 to 14 Years | 0 (0.0%) | 0 (0.0%) |
| 15 Years | 0 (0.0%) | 0 (0.0%) |
| 16 and 17 Years | 0 (0.0%) | 0 (0.0%) |
| 18 to 24 Years | 0 (0.0%) | 25 (44.6%) |
| 25 to 34 Years | 0 (0.0%) | 0 (0.0%) |
| 35 to 44 Years | 0 (0.0%) | 0 (0.0%) |
| 45 to 54 Years | 27 (27.0%) | 25 (75.8%) |
| 55 to 64 Years | 14 (25.0%) | 16 (19.1%) |
| 65 to 74 Years | 0 (0.0%) | 15 (8.2%) |
| 75 Years and over | 0 (0.0%) | 0 (0.0%) |
| Total | 41 (10.8%) | 81 (18.6%) |
Income Above Poverty by Sex and Age in Midway
According to the poverty statistics in Midway, males aged under 5 years and females aged 25 to 34 years are the age groups that are most secure financially, with 100.0% of males and 100.0% of females in these age groups living above the poverty line.
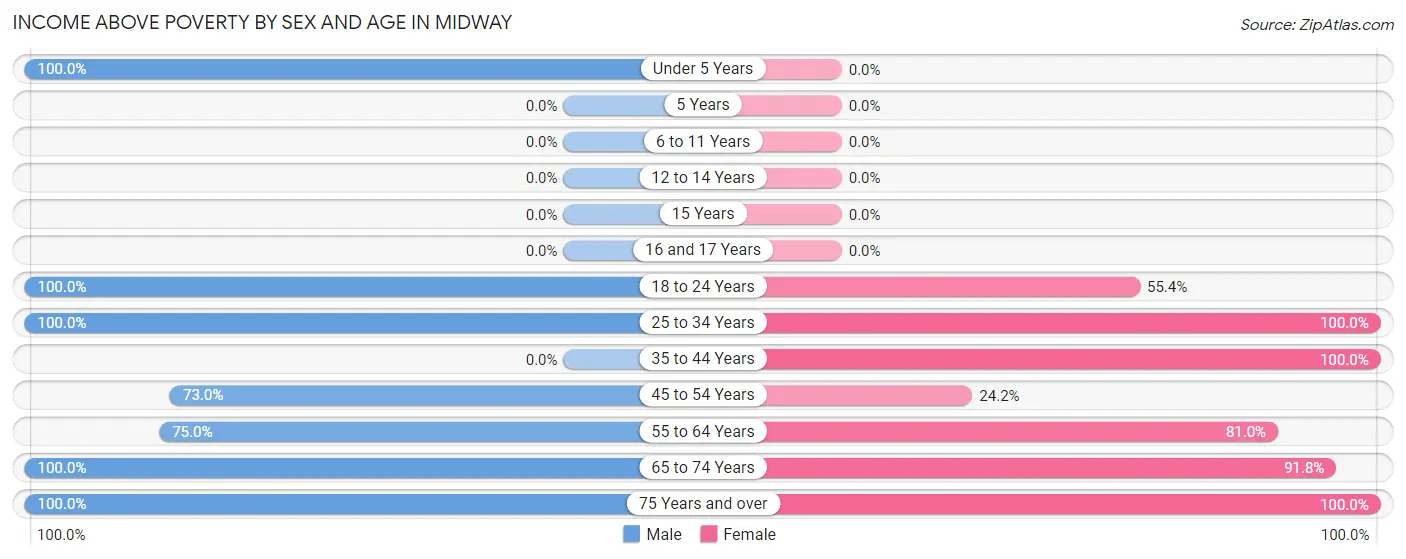
| Age Bracket | Male | Female |
| Under 5 Years | 20 (100.0%) | 0 (0.0%) |
| 5 Years | 0 (0.0%) | 0 (0.0%) |
| 6 to 11 Years | 0 (0.0%) | 0 (0.0%) |
| 12 to 14 Years | 0 (0.0%) | 0 (0.0%) |
| 15 Years | 0 (0.0%) | 0 (0.0%) |
| 16 and 17 Years | 0 (0.0%) | 0 (0.0%) |
| 18 to 24 Years | 12 (100.0%) | 31 (55.4%) |
| 25 to 34 Years | 9 (100.0%) | 23 (100.0%) |
| 35 to 44 Years | 0 (0.0%) | 27 (100.0%) |
| 45 to 54 Years | 73 (73.0%) | 8 (24.2%) |
| 55 to 64 Years | 42 (75.0%) | 68 (80.9%) |
| 65 to 74 Years | 144 (100.0%) | 167 (91.8%) |
| 75 Years and over | 38 (100.0%) | 30 (100.0%) |
| Total | 338 (89.2%) | 354 (81.4%) |
Income Below Poverty Among Married-Couple Families in Midway
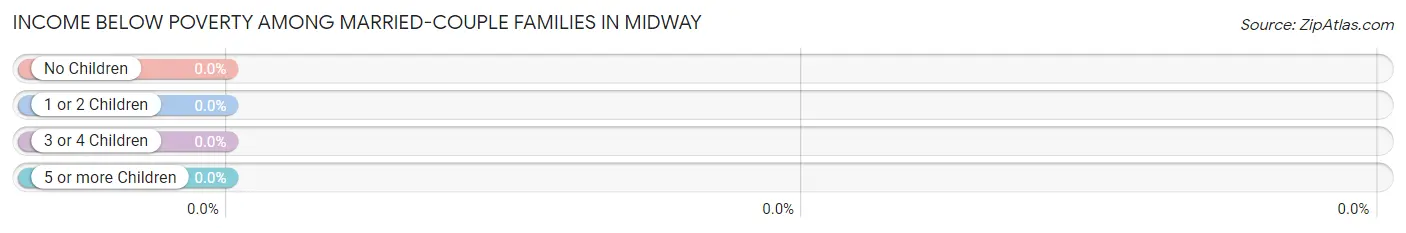
| Children | Above Poverty | Below Poverty |
| No Children | 160 (100.0%) | 0 (0.0%) |
| 1 or 2 Children | 0 (0.0%) | 0 (0.0%) |
| 3 or 4 Children | 0 (0.0%) | 0 (0.0%) |
| 5 or more Children | 0 (0.0%) | 0 (0.0%) |
| Total | 160 (100.0%) | 0 (0.0%) |
Income Below Poverty Among Single-Parent Households in Midway
| Children | Single Father | Single Mother |
| No Children | 0 (0.0%) | 0 (0.0%) |
| 1 or 2 Children | 0 (0.0%) | 0 (0.0%) |
| 3 or 4 Children | 0 (0.0%) | 0 (0.0%) |
| 5 or more Children | 0 (0.0%) | 0 (0.0%) |
| Total | 0 (0.0%) | 0 (0.0%) |
Income Below Poverty Among Married-Couple vs Single-Parent Households in Midway
| Children | Married-Couple Families | Single-Parent Households |
| No Children | 0 (0.0%) | 0 (0.0%) |
| 1 or 2 Children | 0 (0.0%) | 0 (0.0%) |
| 3 or 4 Children | 0 (0.0%) | 0 (0.0%) |
| 5 or more Children | 0 (0.0%) | 0 (0.0%) |
| Total | 0 (0.0%) | 0 (0.0%) |
Race in Midway
The most populous races in Midway are White / Caucasian (814 | 100.0%), and Hispanic or Latino (68 | 8.4%).
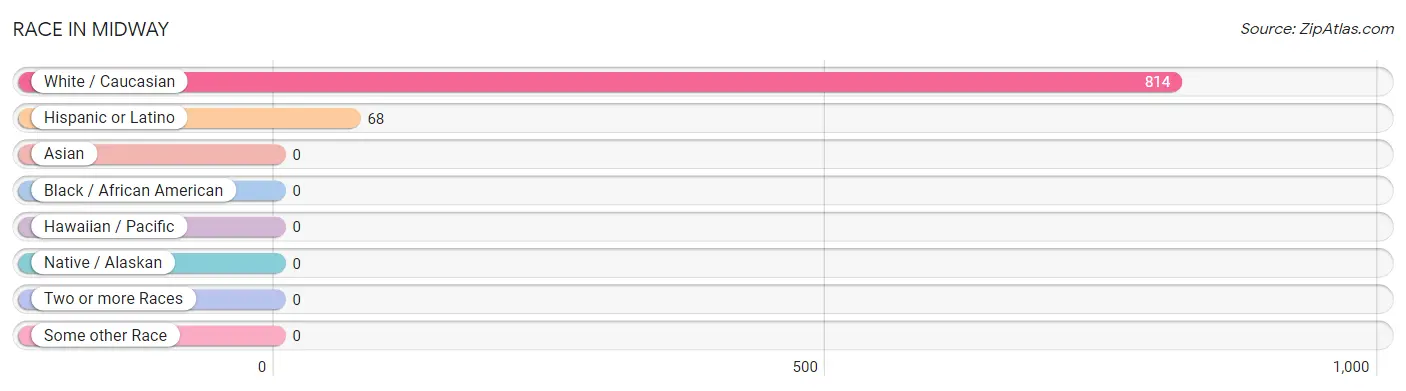
| Race | # Population | % Population |
| Asian | 0 | 0.0% |
| Black / African American | 0 | 0.0% |
| Hawaiian / Pacific | 0 | 0.0% |
| Hispanic or Latino | 68 | 8.4% |
| Native / Alaskan | 0 | 0.0% |
| White / Caucasian | 814 | 100.0% |
| Two or more Races | 0 | 0.0% |
| Some other Race | 0 | 0.0% |
| Total | 814 | 100.0% |
Ancestry in Midway
The most populous ancestries reported in Midway are German (341 | 41.9%), English (163 | 20.0%), Irish (75 | 9.2%), American (65 | 8.0%), and Cuban (41 | 5.0%), together accounting for 84.1% of all Midway residents.
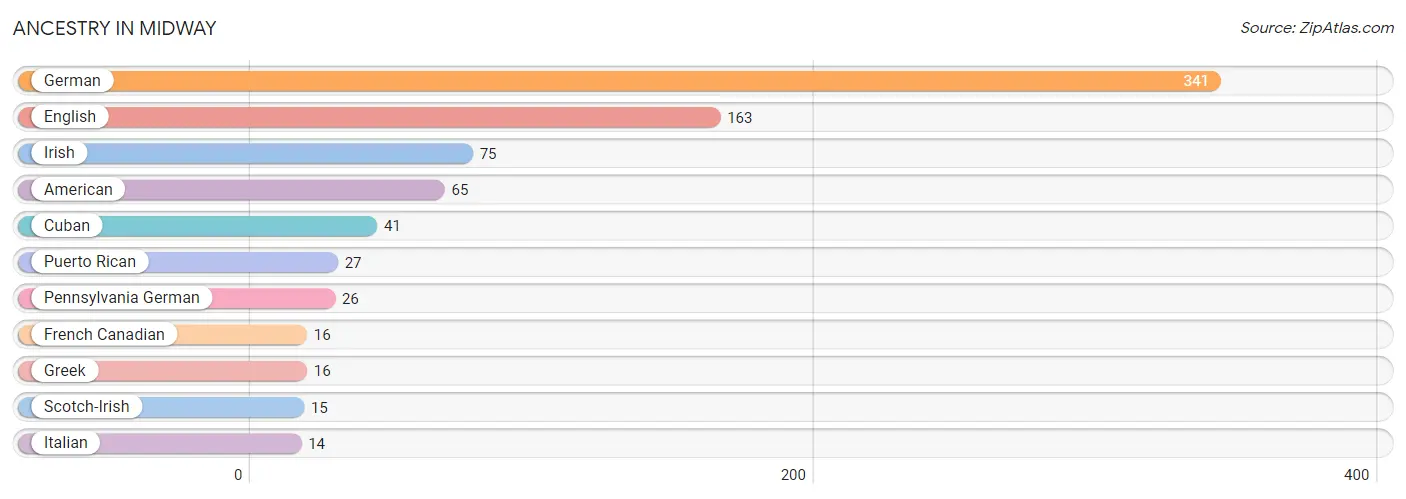
| Ancestry | # Population | % Population |
| American | 65 | 8.0% |
| Cuban | 41 | 5.0% |
| English | 163 | 20.0% |
| French Canadian | 16 | 2.0% |
| German | 341 | 41.9% |
| Greek | 16 | 2.0% |
| Irish | 75 | 9.2% |
| Italian | 14 | 1.7% |
| Pennsylvania German | 26 | 3.2% |
| Puerto Rican | 27 | 3.3% |
| Scotch-Irish | 15 | 1.8% | View All 11 Rows |
Immigrants in Midway
The most numerous immigrant groups reported in Midway came from , and Canada (16 | 2.0%), together accounting for 2.0% of all Midway residents.

| Immigration Origin | # Population | % Population |
| Canada | 16 | 2.0% | View All 1 Rows |
Sex and Age in Midway
Sex and Age in Midway
The most populous age groups in Midway are 65 to 69 Years (117 | 30.9%) for men and 65 to 69 Years (111 | 25.5%) for women.
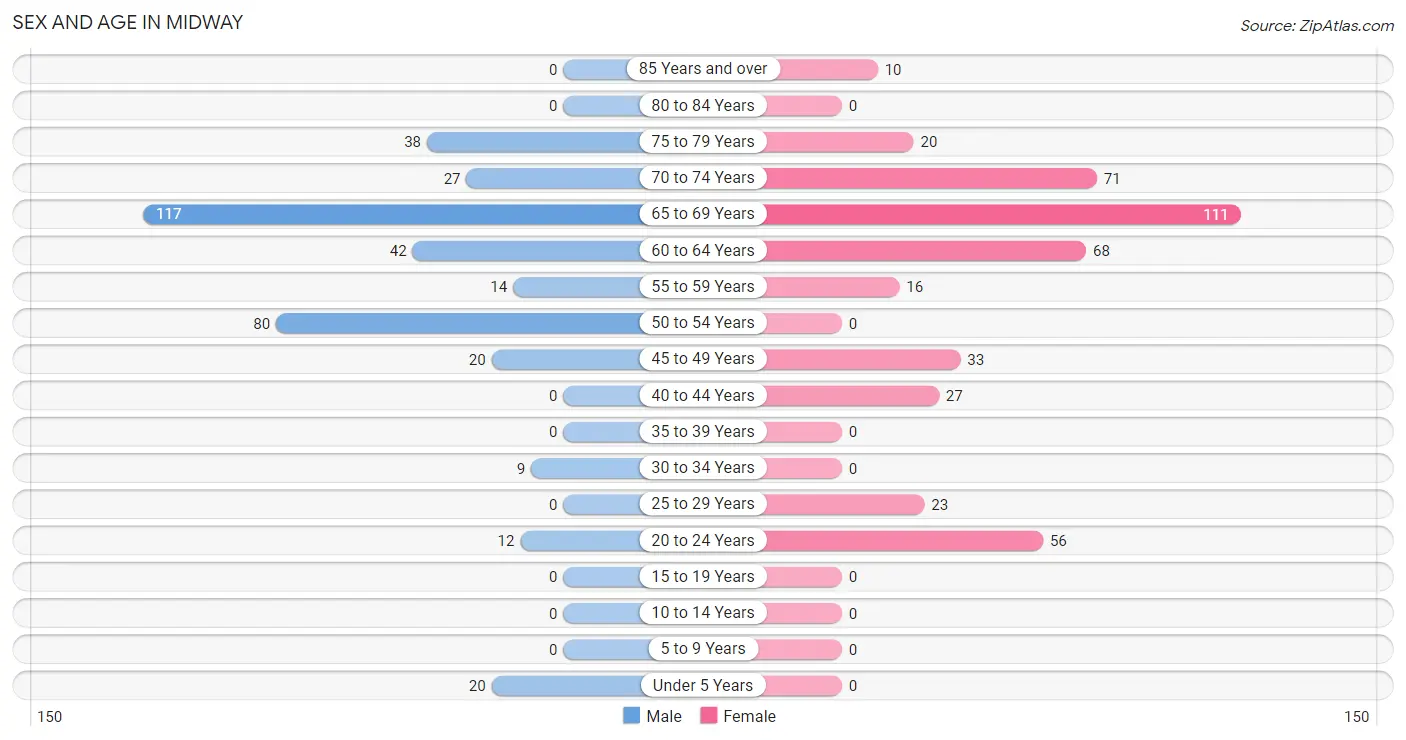
| Age Bracket | Male | Female |
| Under 5 Years | 20 (5.3%) | 0 (0.0%) |
| 5 to 9 Years | 0 (0.0%) | 0 (0.0%) |
| 10 to 14 Years | 0 (0.0%) | 0 (0.0%) |
| 15 to 19 Years | 0 (0.0%) | 0 (0.0%) |
| 20 to 24 Years | 12 (3.2%) | 56 (12.9%) |
| 25 to 29 Years | 0 (0.0%) | 23 (5.3%) |
| 30 to 34 Years | 9 (2.4%) | 0 (0.0%) |
| 35 to 39 Years | 0 (0.0%) | 0 (0.0%) |
| 40 to 44 Years | 0 (0.0%) | 27 (6.2%) |
| 45 to 49 Years | 20 (5.3%) | 33 (7.6%) |
| 50 to 54 Years | 80 (21.1%) | 0 (0.0%) |
| 55 to 59 Years | 14 (3.7%) | 16 (3.7%) |
| 60 to 64 Years | 42 (11.1%) | 68 (15.6%) |
| 65 to 69 Years | 117 (30.9%) | 111 (25.5%) |
| 70 to 74 Years | 27 (7.1%) | 71 (16.3%) |
| 75 to 79 Years | 38 (10.0%) | 20 (4.6%) |
| 80 to 84 Years | 0 (0.0%) | 0 (0.0%) |
| 85 Years and over | 0 (0.0%) | 10 (2.3%) |
| Total | 379 (100.0%) | 435 (100.0%) |
Families and Households in Midway
Median Family Size in Midway
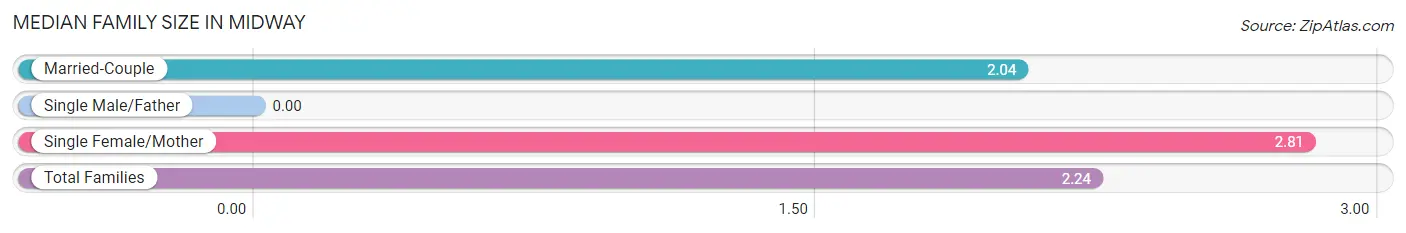
| Family Type | # Families | Family Size |
| Married-Couple | 160 (74.8%) | 2.04 |
| Single Male/Father | 0 (0.0%) | - |
| Single Female/Mother | 54 (25.2%) | 2.81 |
| Total Families | 214 (100.0%) | 2.24 |
Median Household Size in Midway
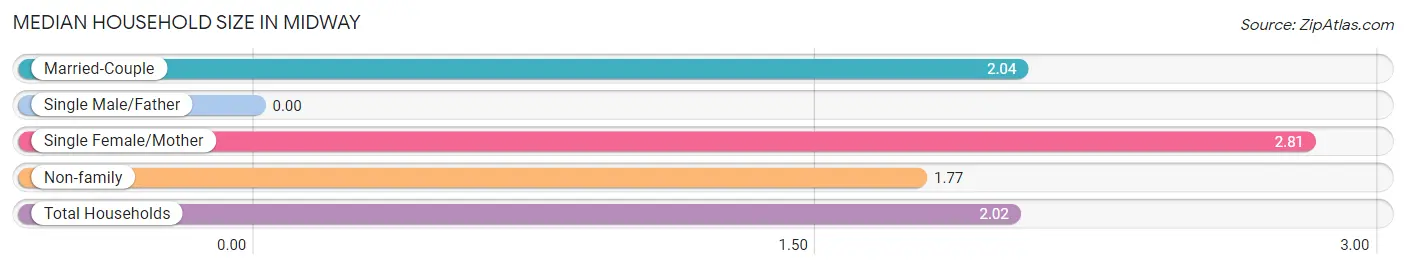
| Household Type | # Households | Household Size |
| Married-Couple | 160 (39.7%) | 2.04 |
| Single Male/Father | 0 (0.0%) | - |
| Single Female/Mother | 54 (13.4%) | 2.81 |
| Non-family | 189 (46.9%) | 1.77 |
| Total Households | 403 (100.0%) | 2.02 |
Household Size by Marriage Status in Midway
Out of a total of 403 households in Midway, 214 (53.1%) are family households, while 189 (46.9%) are nonfamily households. The most numerous type of family households are 2-person households, comprising 206, and the most common type of nonfamily households are 1-person households, comprising 106.
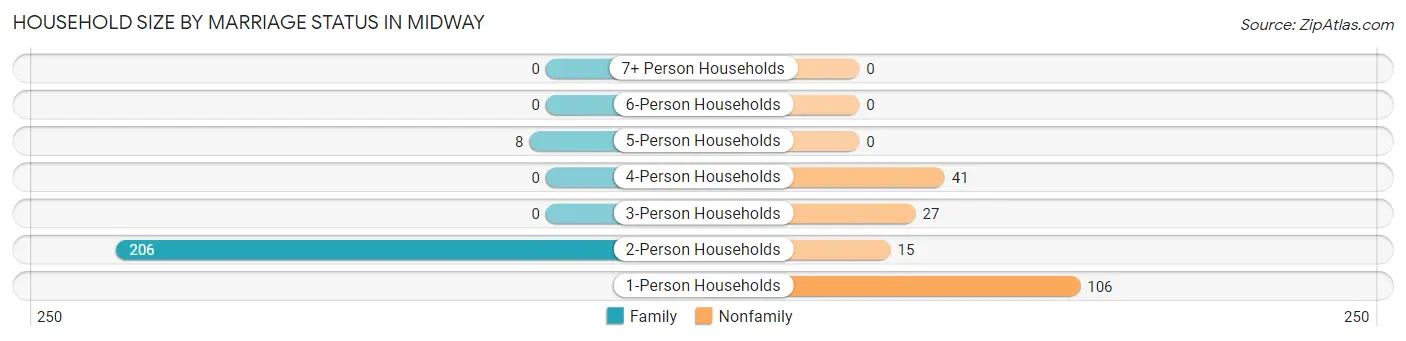
| Household Size | Family Households | Nonfamily Households |
| 1-Person Households | - | 106 (26.3%) |
| 2-Person Households | 206 (51.1%) | 15 (3.7%) |
| 3-Person Households | 0 (0.0%) | 27 (6.7%) |
| 4-Person Households | 0 (0.0%) | 41 (10.2%) |
| 5-Person Households | 8 (2.0%) | 0 (0.0%) |
| 6-Person Households | 0 (0.0%) | 0 (0.0%) |
| 7+ Person Households | 0 (0.0%) | 0 (0.0%) |
| Total | 214 (53.1%) | 189 (46.9%) |
Female Fertility in Midway
Fertility by Age in Midway
| Age Bracket | Women with Births | Births / 1,000 Women |
| 15 to 19 years | 0 (0.0%) | 0.0 |
| 20 to 34 years | 0 (0.0%) | 0.0 |
| 35 to 50 years | 0 (0.0%) | 0.0 |
| Total | 0 (0.0%) | 0.0 |
Fertility by Age by Marriage Status in Midway
| Age Bracket | Married | Unmarried |
| 15 to 19 years | 0 (0.0%) | 0 (0.0%) |
| 20 to 34 years | 0 (0.0%) | 0 (0.0%) |
| 35 to 50 years | 0 (0.0%) | 0 (0.0%) |
| Total | 0 (0.0%) | 0 (0.0%) |
Fertility by Education in Midway
| Educational Attainment | Women with Births | Births / 1,000 Women |
| Less than High School | 0 (0.0%) | 0.0 |
| High School Diploma | 0 (0.0%) | 0.0 |
| College or Associate's Degree | 0 (0.0%) | 0.0 |
| Bachelor's Degree | 0 (0.0%) | 0.0 |
| Graduate Degree | 0 (0.0%) | 0.0 |
| Total | 0 (0.0%) | 0.0 |
Fertility by Education by Marriage Status in Midway
| Educational Attainment | Married | Unmarried |
| Less than High School | 0 (0.0%) | 0 (0.0%) |
| High School Diploma | 0 (0.0%) | 0 (0.0%) |
| College or Associate's Degree | 0 (0.0%) | 0 (0.0%) |
| Bachelor's Degree | 0 (0.0%) | 0 (0.0%) |
| Graduate Degree | 0 (0.0%) | 0 (0.0%) |
| Total | 0 (0.0%) | 0 (0.0%) |
Employment Characteristics in Midway
Employment by Class of Employer in Midway
Among the 374 employed individuals in Midway, private company employees (349 | 93.3%), and self-employed (not incorporated) (25 | 6.7%) make up the most common classes of employment.
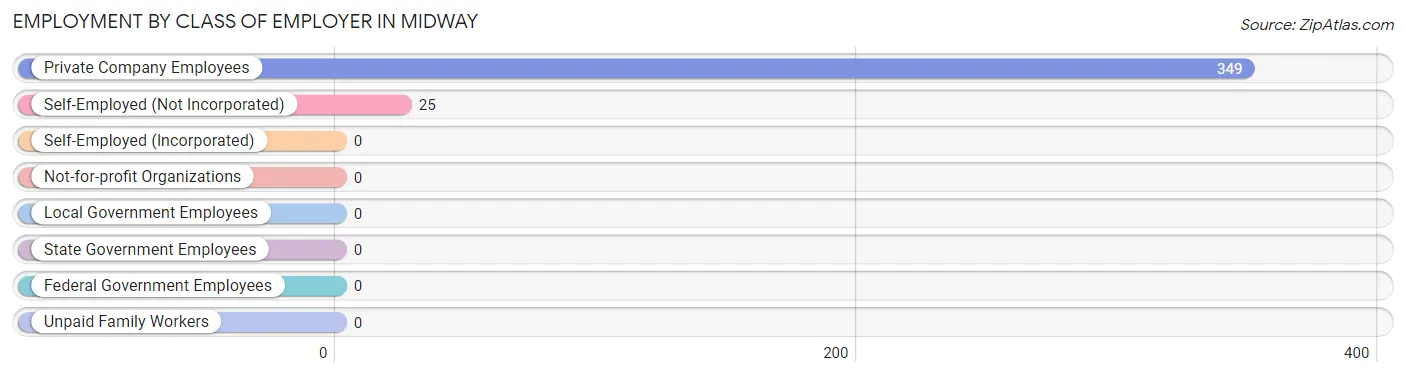
| Employer Class | # Employees | % Employees |
| Private Company Employees | 349 | 93.3% |
| Self-Employed (Incorporated) | 0 | 0.0% |
| Self-Employed (Not Incorporated) | 25 | 6.7% |
| Not-for-profit Organizations | 0 | 0.0% |
| Local Government Employees | 0 | 0.0% |
| State Government Employees | 0 | 0.0% |
| Federal Government Employees | 0 | 0.0% |
| Unpaid Family Workers | 0 | 0.0% |
| Total | 374 | 100.0% |
Employment Status by Age in Midway
According to the labor force statistics for Midway, out of the total population over 16 years of age (794), 48.2% or 383 individuals are in the labor force, with 2.3% or 9 of them unemployed. The age group with the highest labor force participation rate is 25 to 29 years, with 100.0% or 23 individuals in the labor force. Within the labor force, the 30 to 34 years age range has the highest percentage of unemployed individuals, with 100.0% or 9 of them being unemployed.
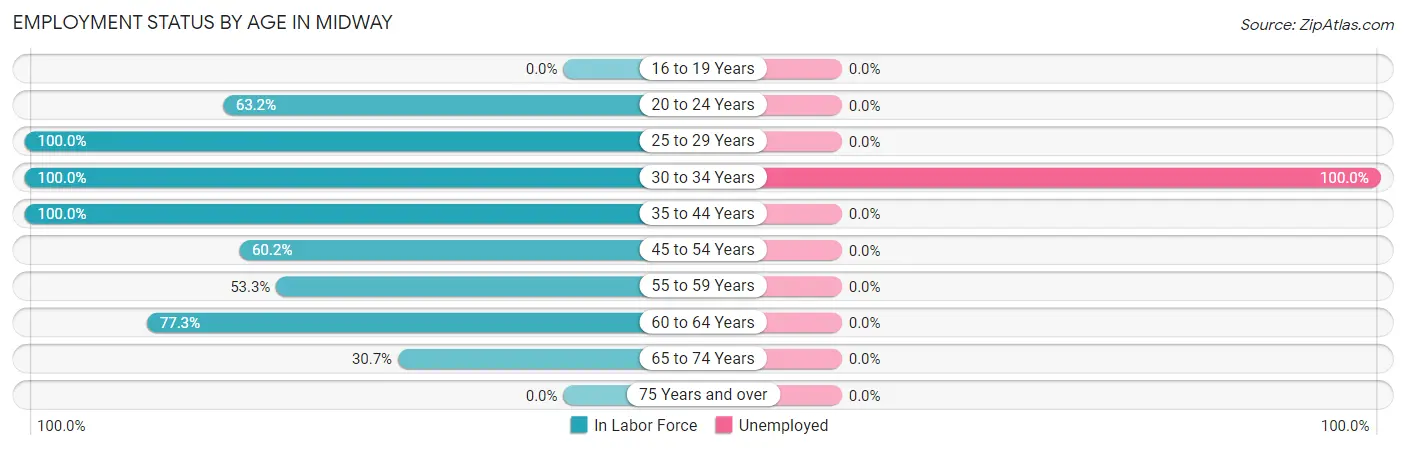
| Age Bracket | In Labor Force | Unemployed |
| 16 to 19 Years | 0 (0.0%) | 0 (0.0%) |
| 20 to 24 Years | 43 (63.2%) | 0 (0.0%) |
| 25 to 29 Years | 23 (100.0%) | 0 (0.0%) |
| 30 to 34 Years | 9 (100.0%) | 9 (100.0%) |
| 35 to 44 Years | 27 (100.0%) | 0 (0.0%) |
| 45 to 54 Years | 80 (60.2%) | 0 (0.0%) |
| 55 to 59 Years | 16 (53.3%) | 0 (0.0%) |
| 60 to 64 Years | 85 (77.3%) | 0 (0.0%) |
| 65 to 74 Years | 100 (30.7%) | 0 (0.0%) |
| 75 Years and over | 0 (0.0%) | 0 (0.0%) |
| Total | 383 (48.2%) | 9 (2.3%) |
Employment Status by Educational Attainment in Midway
According to labor force statistics for Midway, 72.3% of individuals (240) out of the total population between 25 and 64 years of age (332) are in the labor force, with 3.8% or 9 of them being unemployed. The group with the highest labor force participation rate are those with the educational attainment of bachelor's degree or higher, with 100.0% or 39 individuals in the labor force. Within the labor force, individuals with high school diploma education have the highest percentage of unemployment, with 12.3% or 9 of them being unemployed.
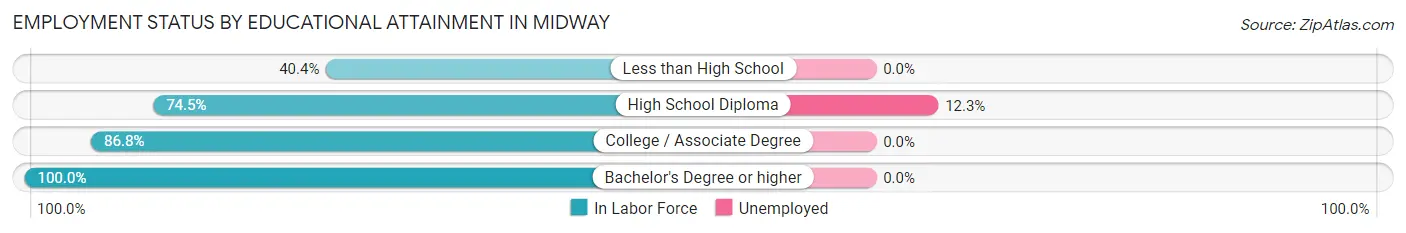
| Educational Attainment | In Labor Force | Unemployed |
| Less than High School | 36 (40.4%) | 0 (0.0%) |
| High School Diploma | 73 (74.5%) | 12 (12.3%) |
| College / Associate Degree | 92 (86.8%) | 0 (0.0%) |
| Bachelor's Degree or higher | 39 (100.0%) | 0 (0.0%) |
| Total | 240 (72.3%) | 13 (3.8%) |
Employment Occupations by Sex in Midway
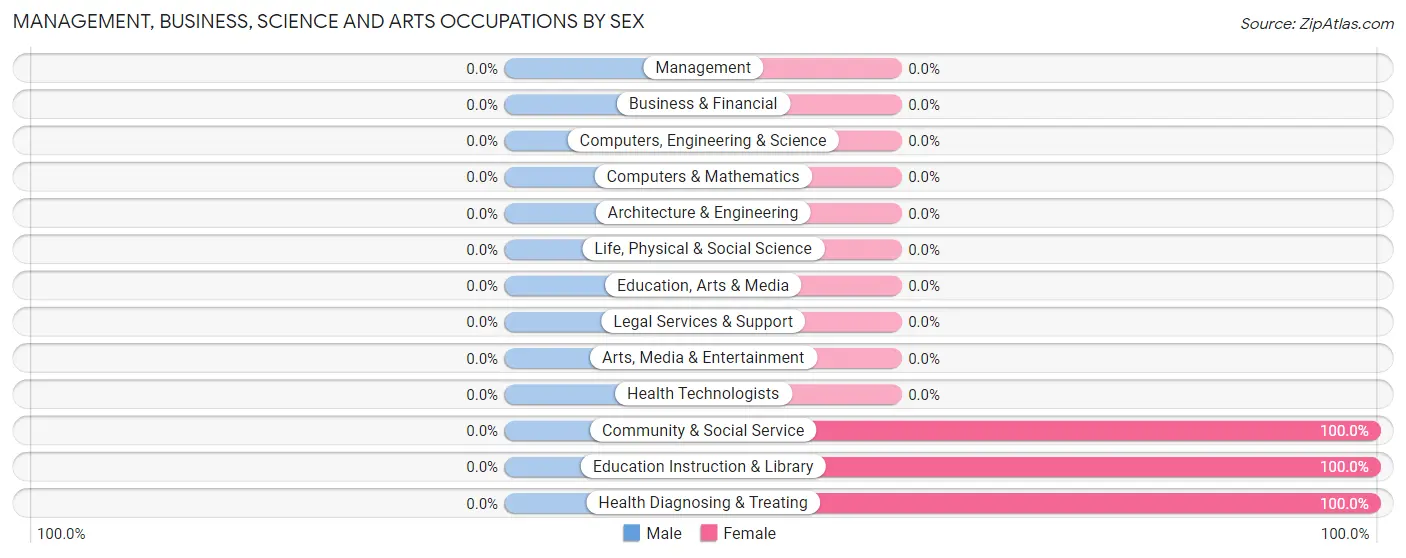
Management, Business, Science and Arts Occupations
The most common Management, Business, Science and Arts occupations in Midway are Community & Social Service (16 | 4.3%), Education Instruction & Library (16 | 4.3%), and Health Diagnosing & Treating (8 | 2.1%).
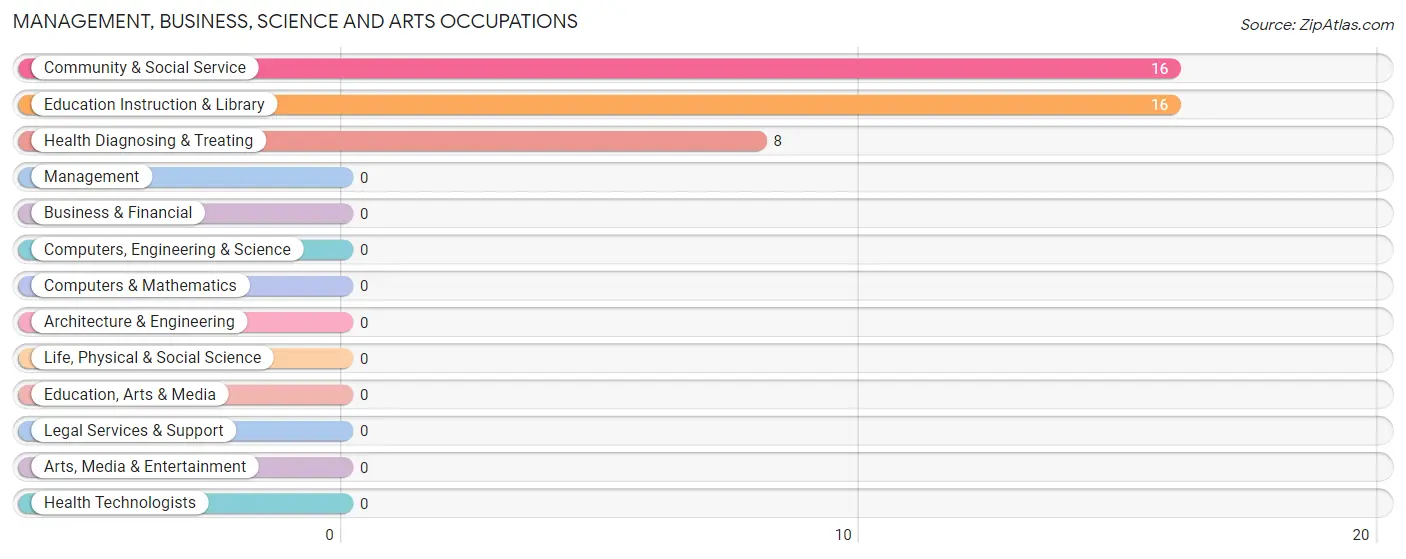
Management, Business, Science and Arts Occupations by Sex
| Occupation | Male | Female |
| Management | 0 (0.0%) | 0 (0.0%) |
| Business & Financial | 0 (0.0%) | 0 (0.0%) |
| Computers, Engineering & Science | 0 (0.0%) | 0 (0.0%) |
| Computers & Mathematics | 0 (0.0%) | 0 (0.0%) |
| Architecture & Engineering | 0 (0.0%) | 0 (0.0%) |
| Life, Physical & Social Science | 0 (0.0%) | 0 (0.0%) |
| Community & Social Service | 0 (0.0%) | 16 (100.0%) |
| Education, Arts & Media | 0 (0.0%) | 0 (0.0%) |
| Legal Services & Support | 0 (0.0%) | 0 (0.0%) |
| Education Instruction & Library | 0 (0.0%) | 16 (100.0%) |
| Arts, Media & Entertainment | 0 (0.0%) | 0 (0.0%) |
| Health Diagnosing & Treating | 0 (0.0%) | 8 (100.0%) |
| Health Technologists | 0 (0.0%) | 0 (0.0%) |
| Total (Category) | 0 (0.0%) | 24 (100.0%) |
| Total (Overall) | 89 (23.8%) | 285 (76.2%) |
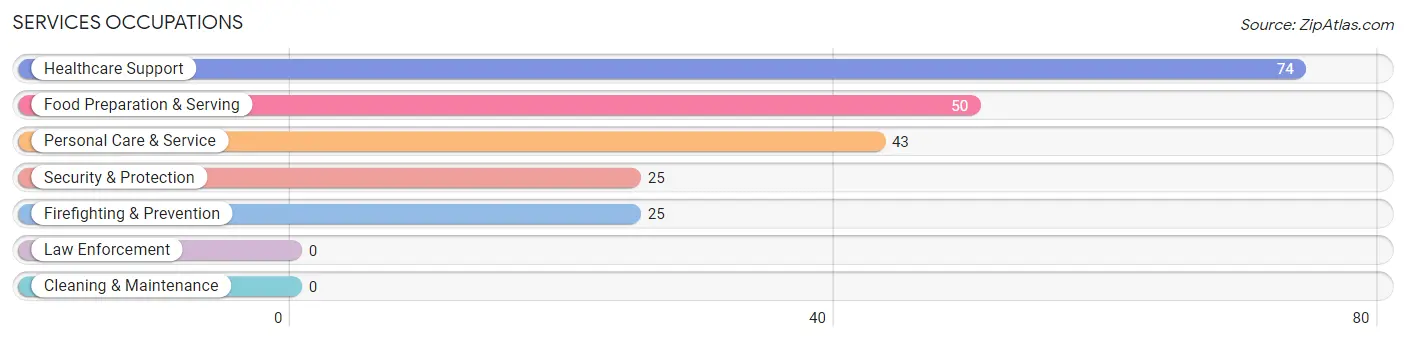
Services Occupations
The most common Services occupations in Midway are Healthcare Support (74 | 19.8%), Food Preparation & Serving (50 | 13.4%), Personal Care & Service (43 | 11.5%), Security & Protection (25 | 6.7%), and Firefighting & Prevention (25 | 6.7%).
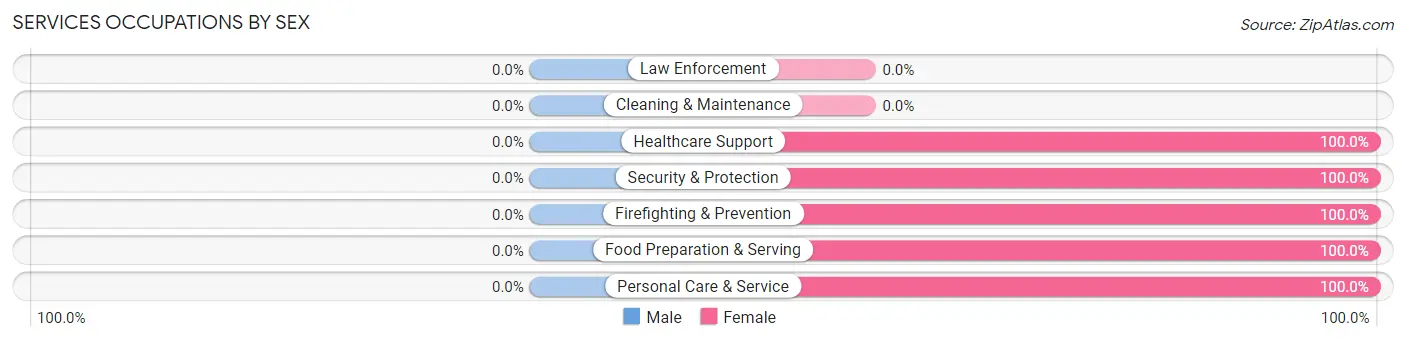
Services Occupations by Sex
| Occupation | Male | Female |
| Healthcare Support | 0 (0.0%) | 74 (100.0%) |
| Security & Protection | 0 (0.0%) | 25 (100.0%) |
| Firefighting & Prevention | 0 (0.0%) | 25 (100.0%) |
| Law Enforcement | 0 (0.0%) | 0 (0.0%) |
| Food Preparation & Serving | 0 (0.0%) | 50 (100.0%) |
| Cleaning & Maintenance | 0 (0.0%) | 0 (0.0%) |
| Personal Care & Service | 0 (0.0%) | 43 (100.0%) |
| Total (Category) | 0 (0.0%) | 192 (100.0%) |
| Total (Overall) | 89 (23.8%) | 285 (76.2%) |
Sales and Office Occupations
The most common Sales and Office occupations in Midway are Office & Administration (23 | 6.1%), and Sales & Related (8 | 2.1%).

Sales and Office Occupations by Sex

| Occupation | Male | Female |
| Sales & Related | 0 (0.0%) | 8 (100.0%) |
| Office & Administration | 0 (0.0%) | 23 (100.0%) |
| Total (Category) | 0 (0.0%) | 31 (100.0%) |
| Total (Overall) | 89 (23.8%) | 285 (76.2%) |
Natural Resources, Construction and Maintenance Occupations

Natural Resources, Construction and Maintenance Occupations by Sex

| Occupation | Male | Female |
| Farming, Fishing & Forestry | 0 (0.0%) | 0 (0.0%) |
| Construction & Extraction | 0 (0.0%) | 0 (0.0%) |
| Installation, Maintenance & Repair | 0 (0.0%) | 0 (0.0%) |
| Total (Category) | 0 (0.0%) | 0 (0.0%) |
| Total (Overall) | 89 (23.8%) | 285 (76.2%) |
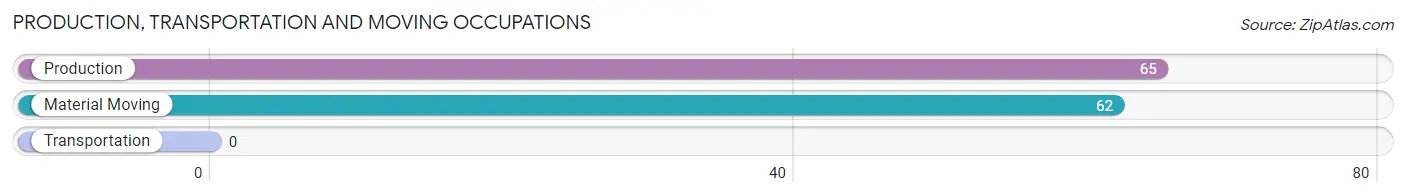
Production, Transportation and Moving Occupations
The most common Production, Transportation and Moving occupations in Midway are Production (65 | 17.4%), and Material Moving (62 | 16.6%).
Production, Transportation and Moving Occupations by Sex
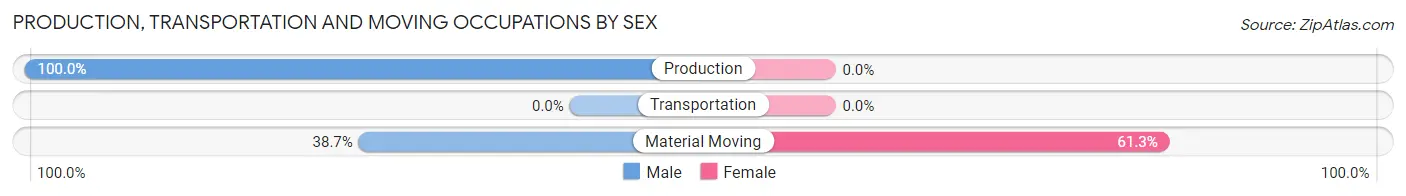
| Occupation | Male | Female |
| Production | 65 (100.0%) | 0 (0.0%) |
| Transportation | 0 (0.0%) | 0 (0.0%) |
| Material Moving | 24 (38.7%) | 38 (61.3%) |
| Total (Category) | 89 (70.1%) | 38 (29.9%) |
| Total (Overall) | 89 (23.8%) | 285 (76.2%) |
Employment Industries by Sex in Midway
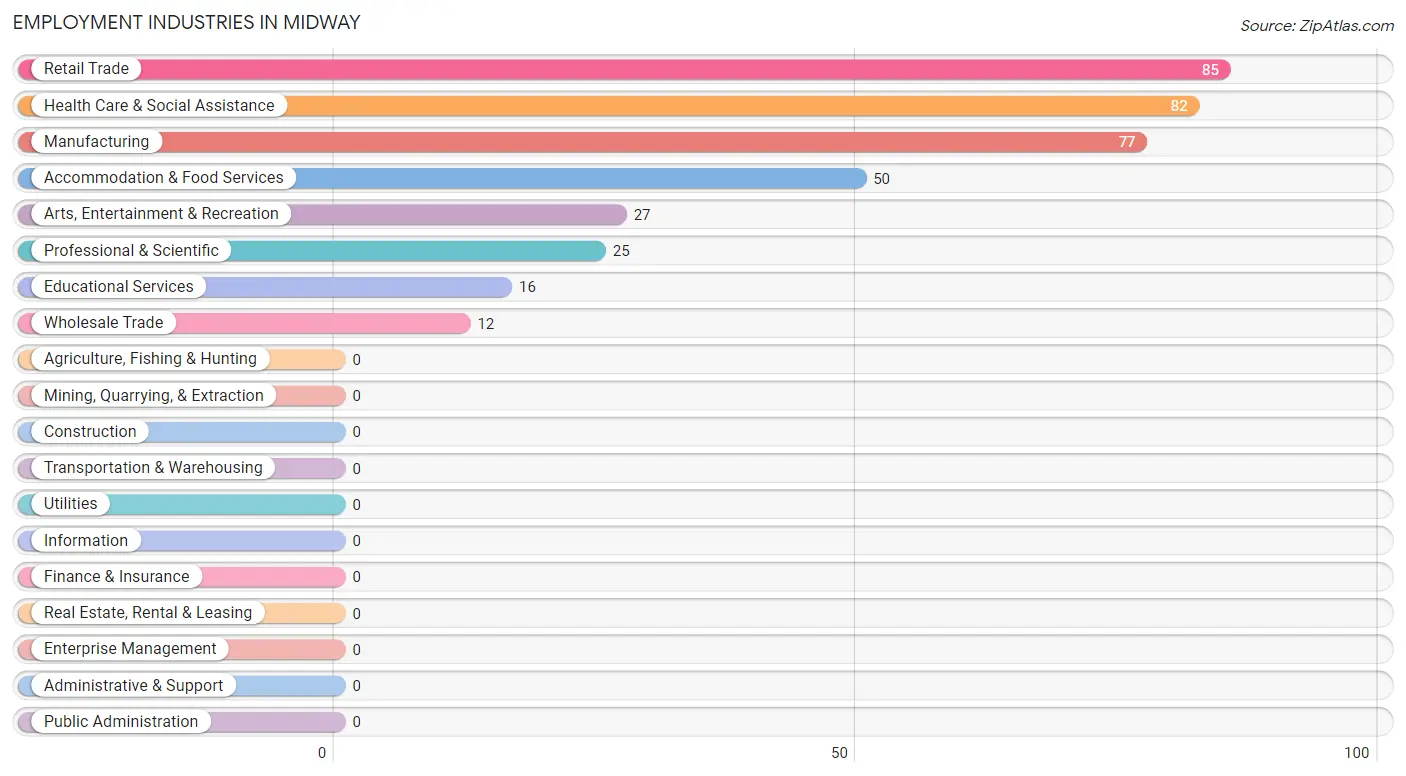
Employment Industries in Midway
The major employment industries in Midway include Retail Trade (85 | 22.7%), Health Care & Social Assistance (82 | 21.9%), Manufacturing (77 | 20.6%), Accommodation & Food Services (50 | 13.4%), and Arts, Entertainment & Recreation (27 | 7.2%).
Employment Industries by Sex in Midway
The Midway industries that see more men than women are Manufacturing (100.0%), and Retail Trade (14.1%), whereas the industries that tend to have a higher number of women are Wholesale Trade (100.0%), Professional & Scientific (100.0%), and Educational Services (100.0%).
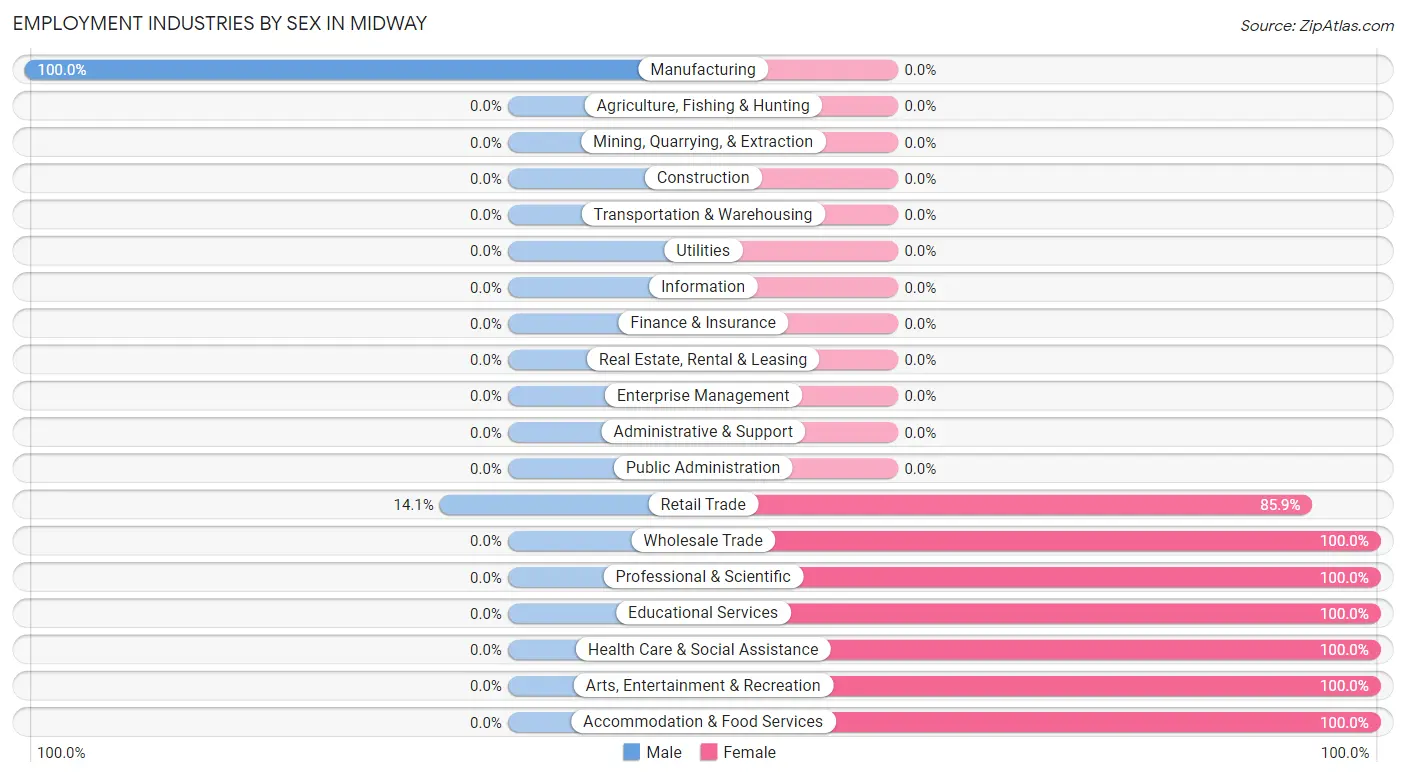
| Industry | Male | Female |
| Agriculture, Fishing & Hunting | 0 (0.0%) | 0 (0.0%) |
| Mining, Quarrying, & Extraction | 0 (0.0%) | 0 (0.0%) |
| Construction | 0 (0.0%) | 0 (0.0%) |
| Manufacturing | 77 (100.0%) | 0 (0.0%) |
| Wholesale Trade | 0 (0.0%) | 12 (100.0%) |
| Retail Trade | 12 (14.1%) | 73 (85.9%) |
| Transportation & Warehousing | 0 (0.0%) | 0 (0.0%) |
| Utilities | 0 (0.0%) | 0 (0.0%) |
| Information | 0 (0.0%) | 0 (0.0%) |
| Finance & Insurance | 0 (0.0%) | 0 (0.0%) |
| Real Estate, Rental & Leasing | 0 (0.0%) | 0 (0.0%) |
| Professional & Scientific | 0 (0.0%) | 25 (100.0%) |
| Enterprise Management | 0 (0.0%) | 0 (0.0%) |
| Administrative & Support | 0 (0.0%) | 0 (0.0%) |
| Educational Services | 0 (0.0%) | 16 (100.0%) |
| Health Care & Social Assistance | 0 (0.0%) | 82 (100.0%) |
| Arts, Entertainment & Recreation | 0 (0.0%) | 27 (100.0%) |
| Accommodation & Food Services | 0 (0.0%) | 50 (100.0%) |
| Public Administration | 0 (0.0%) | 0 (0.0%) |
| Total | 89 (23.8%) | 285 (76.2%) |
Education in Midway
School Enrollment in Midway
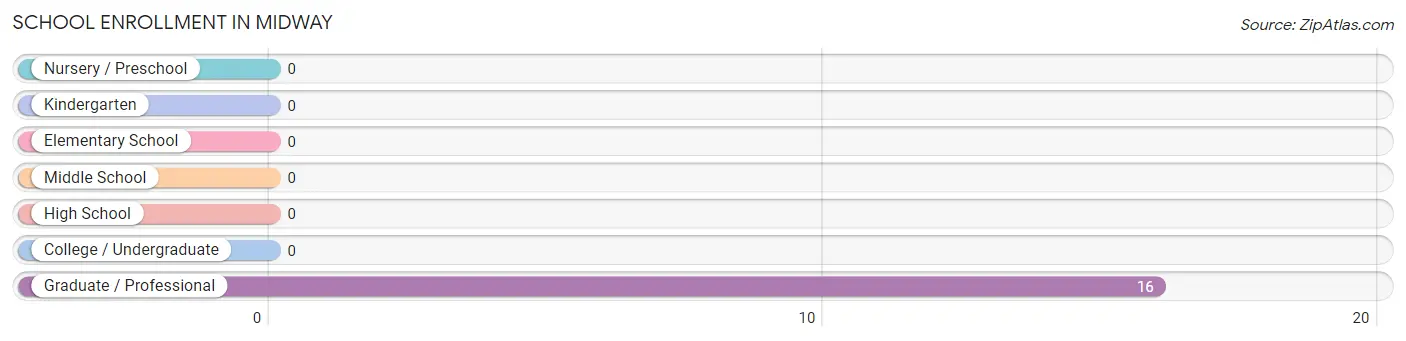
| School Level | # Students | % Students |
| Nursery / Preschool | 0 | 0.0% |
| Kindergarten | 0 | 0.0% |
| Elementary School | 0 | 0.0% |
| Middle School | 0 | 0.0% |
| High School | 0 | 0.0% |
| College / Undergraduate | 0 | 0.0% |
| Graduate / Professional | 16 | 100.0% |
| Total | 16 | 100.0% |
School Enrollment by Age by Funding Source in Midway
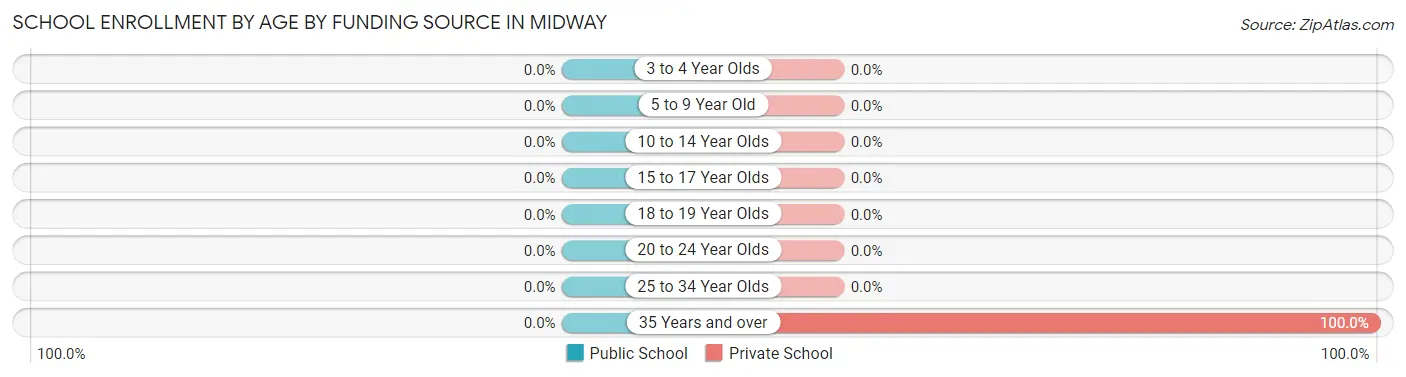
| Age Bracket | Public School | Private School |
| 3 to 4 Year Olds | 0 (0.0%) | 0 (0.0%) |
| 5 to 9 Year Old | 0 (0.0%) | 0 (0.0%) |
| 10 to 14 Year Olds | 0 (0.0%) | 0 (0.0%) |
| 15 to 17 Year Olds | 0 (0.0%) | 0 (0.0%) |
| 18 to 19 Year Olds | 0 (0.0%) | 0 (0.0%) |
| 20 to 24 Year Olds | 0 (0.0%) | 0 (0.0%) |
| 25 to 34 Year Olds | 0 (0.0%) | 0 (0.0%) |
| 35 Years and over | 0 (0.0%) | 16 (100.0%) |
| Total | 0 (0.0%) | 16 (100.0%) |
Educational Attainment by Field of Study in Midway
Education (31 | 46.3%), liberal arts & history (23 | 34.3%), and science & technology (13 | 19.4%) are the most common fields of study among 67 individuals in Midway who have obtained a bachelor's degree or higher.
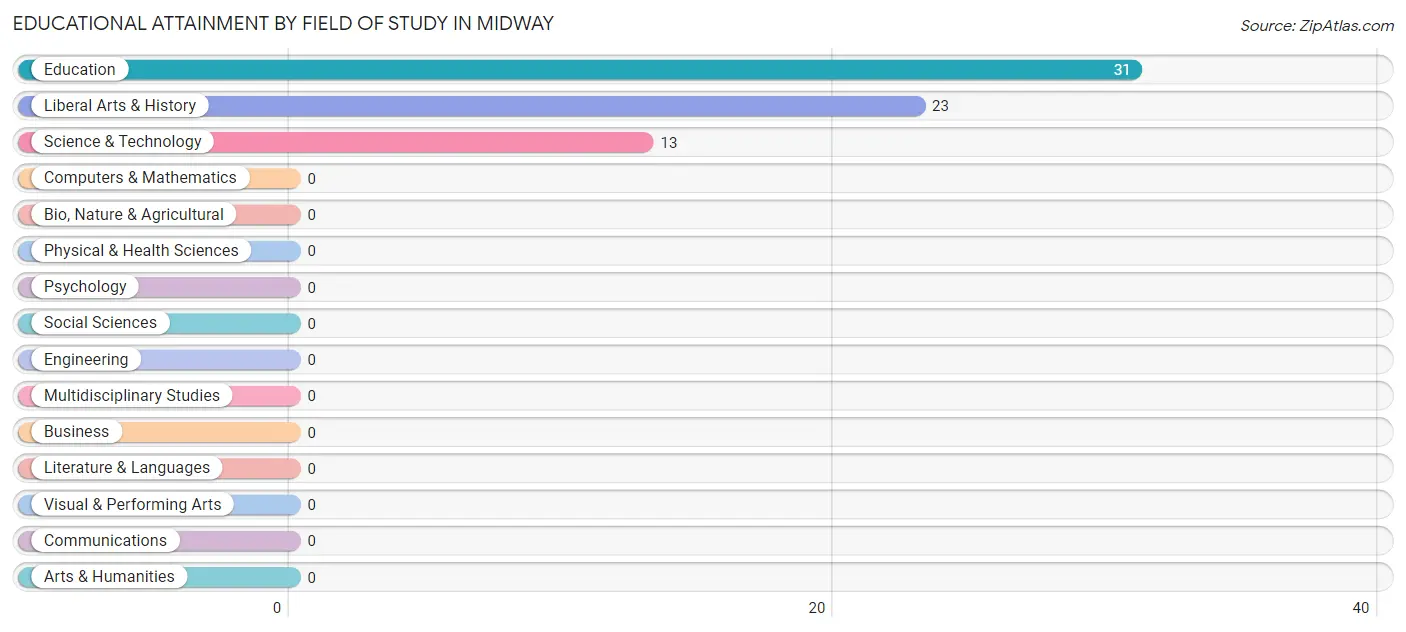
| Field of Study | # Graduates | % Graduates |
| Computers & Mathematics | 0 | 0.0% |
| Bio, Nature & Agricultural | 0 | 0.0% |
| Physical & Health Sciences | 0 | 0.0% |
| Psychology | 0 | 0.0% |
| Social Sciences | 0 | 0.0% |
| Engineering | 0 | 0.0% |
| Multidisciplinary Studies | 0 | 0.0% |
| Science & Technology | 13 | 19.4% |
| Business | 0 | 0.0% |
| Education | 31 | 46.3% |
| Literature & Languages | 0 | 0.0% |
| Liberal Arts & History | 23 | 34.3% |
| Visual & Performing Arts | 0 | 0.0% |
| Communications | 0 | 0.0% |
| Arts & Humanities | 0 | 0.0% |
| Total | 67 | 100.0% |
Transportation & Commute in Midway
Vehicle Availability by Sex in Midway
The most prevalent vehicle ownership categories in Midway are males with 4 vehicles (27, accounting for 30.3%) and females with 4 vehicles (25, making up 9.5%).
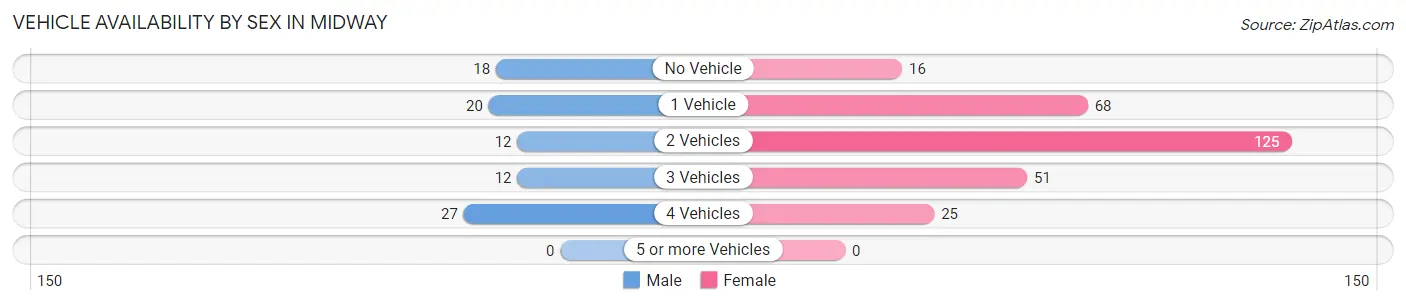
| Vehicles Available | Male | Female |
| No Vehicle | 18 (20.2%) | 16 (5.6%) |
| 1 Vehicle | 20 (22.5%) | 68 (23.9%) |
| 2 Vehicles | 12 (13.5%) | 125 (43.9%) |
| 3 Vehicles | 12 (13.5%) | 51 (17.9%) |
| 4 Vehicles | 27 (30.3%) | 25 (8.8%) |
| 5 or more Vehicles | 0 (0.0%) | 0 (0.0%) |
| Total | 89 (100.0%) | 285 (100.0%) |
Commute Time in Midway
The most frequently occuring commute durations in Midway are 5 to 9 minutes (128 commuters, 34.2%), 15 to 19 minutes (100 commuters, 26.7%), and 20 to 24 minutes (43 commuters, 11.5%).
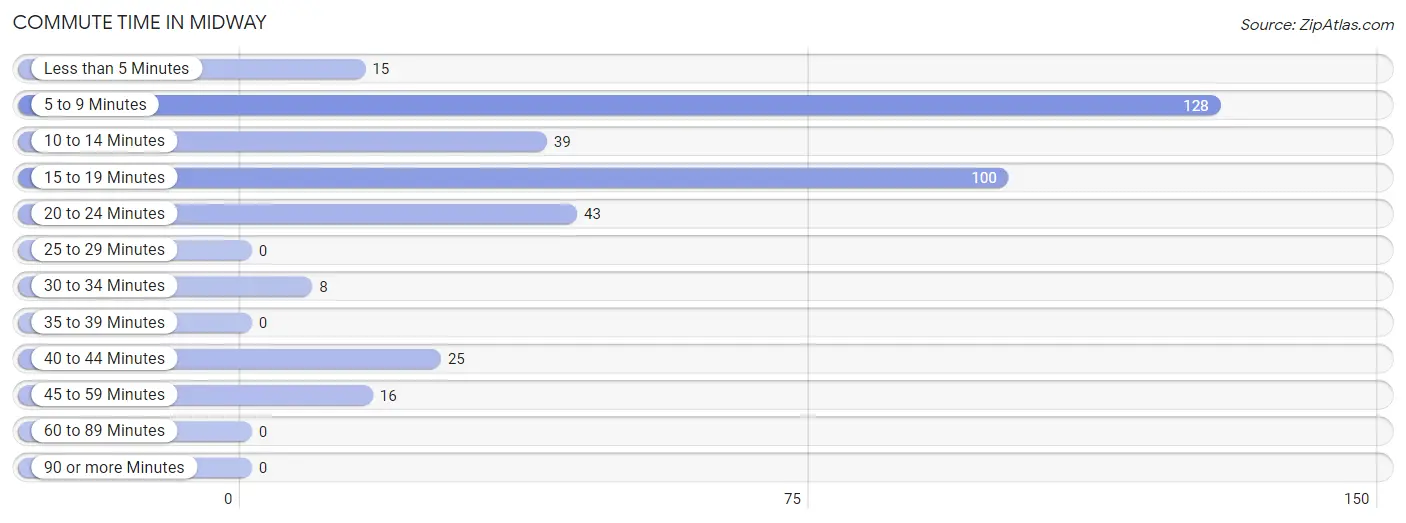
| Commute Time | # Commuters | % Commuters |
| Less than 5 Minutes | 15 | 4.0% |
| 5 to 9 Minutes | 128 | 34.2% |
| 10 to 14 Minutes | 39 | 10.4% |
| 15 to 19 Minutes | 100 | 26.7% |
| 20 to 24 Minutes | 43 | 11.5% |
| 25 to 29 Minutes | 0 | 0.0% |
| 30 to 34 Minutes | 8 | 2.1% |
| 35 to 39 Minutes | 0 | 0.0% |
| 40 to 44 Minutes | 25 | 6.7% |
| 45 to 59 Minutes | 16 | 4.3% |
| 60 to 89 Minutes | 0 | 0.0% |
| 90 or more Minutes | 0 | 0.0% |
Commute Time by Sex in Midway
The most common commute times in Midway are 15 to 19 minutes (39 commuters, 43.8%) for males and 5 to 9 minutes (98 commuters, 34.4%) for females.
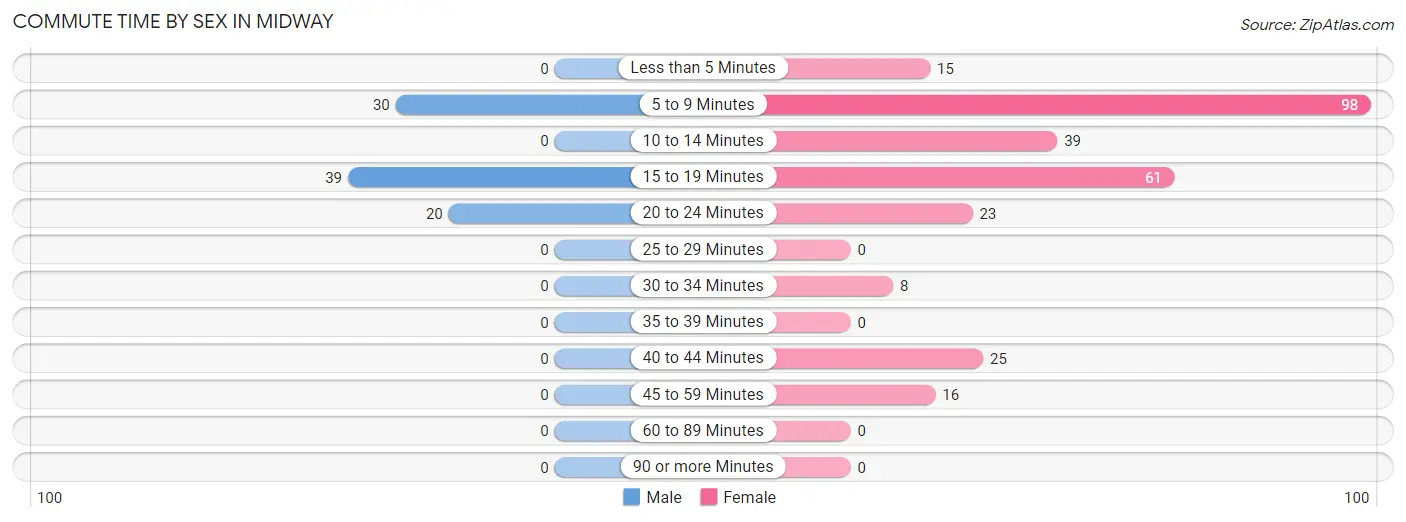
| Commute Time | Male | Female |
| Less than 5 Minutes | 0 (0.0%) | 15 (5.3%) |
| 5 to 9 Minutes | 30 (33.7%) | 98 (34.4%) |
| 10 to 14 Minutes | 0 (0.0%) | 39 (13.7%) |
| 15 to 19 Minutes | 39 (43.8%) | 61 (21.4%) |
| 20 to 24 Minutes | 20 (22.5%) | 23 (8.1%) |
| 25 to 29 Minutes | 0 (0.0%) | 0 (0.0%) |
| 30 to 34 Minutes | 0 (0.0%) | 8 (2.8%) |
| 35 to 39 Minutes | 0 (0.0%) | 0 (0.0%) |
| 40 to 44 Minutes | 0 (0.0%) | 25 (8.8%) |
| 45 to 59 Minutes | 0 (0.0%) | 16 (5.6%) |
| 60 to 89 Minutes | 0 (0.0%) | 0 (0.0%) |
| 90 or more Minutes | 0 (0.0%) | 0 (0.0%) |
Time of Departure to Work by Sex in Midway
The most frequent times of departure to work in Midway are 4:00 PM to 11:59 PM (27, 30.3%) for males and 12:00 PM to 3:59 PM (98, 34.4%) for females.
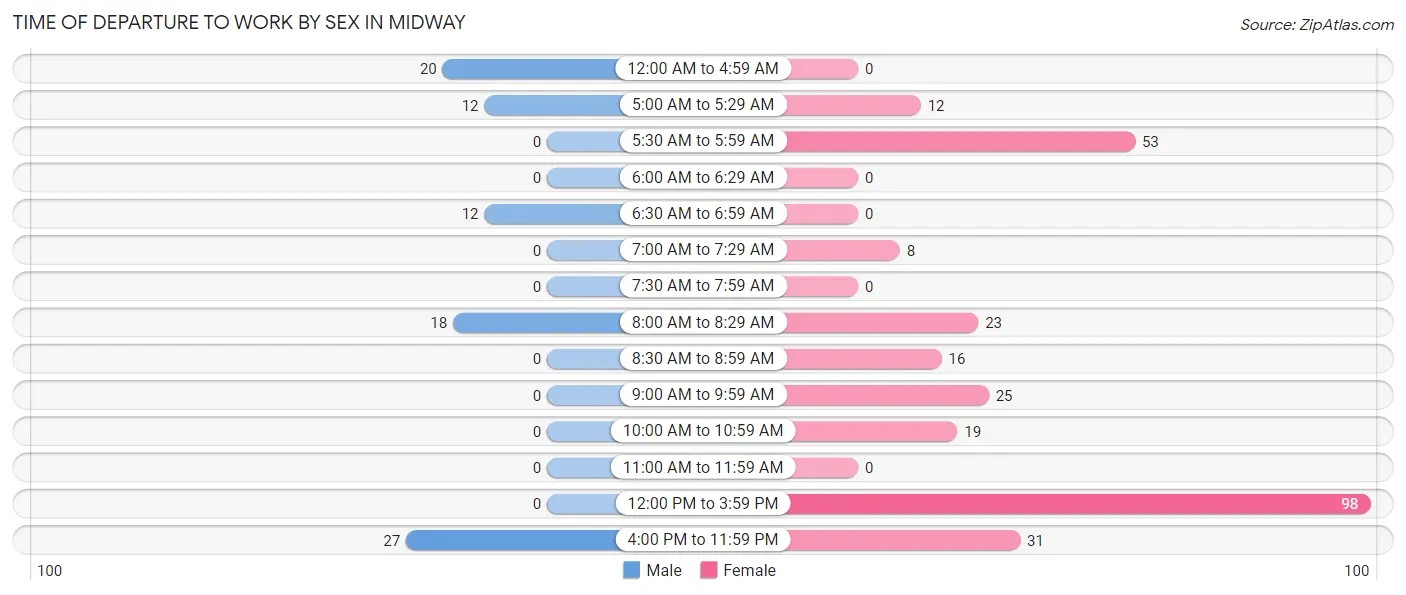
| Time of Departure | Male | Female |
| 12:00 AM to 4:59 AM | 20 (22.5%) | 0 (0.0%) |
| 5:00 AM to 5:29 AM | 12 (13.5%) | 12 (4.2%) |
| 5:30 AM to 5:59 AM | 0 (0.0%) | 53 (18.6%) |
| 6:00 AM to 6:29 AM | 0 (0.0%) | 0 (0.0%) |
| 6:30 AM to 6:59 AM | 12 (13.5%) | 0 (0.0%) |
| 7:00 AM to 7:29 AM | 0 (0.0%) | 8 (2.8%) |
| 7:30 AM to 7:59 AM | 0 (0.0%) | 0 (0.0%) |
| 8:00 AM to 8:29 AM | 18 (20.2%) | 23 (8.1%) |
| 8:30 AM to 8:59 AM | 0 (0.0%) | 16 (5.6%) |
| 9:00 AM to 9:59 AM | 0 (0.0%) | 25 (8.8%) |
| 10:00 AM to 10:59 AM | 0 (0.0%) | 19 (6.7%) |
| 11:00 AM to 11:59 AM | 0 (0.0%) | 0 (0.0%) |
| 12:00 PM to 3:59 PM | 0 (0.0%) | 98 (34.4%) |
| 4:00 PM to 11:59 PM | 27 (30.3%) | 31 (10.9%) |
| Total | 89 (100.0%) | 285 (100.0%) |
Housing Occupancy in Midway
Occupancy by Ownership in Midway
Of the total 403 dwellings in Midway, owner-occupied units account for 242 (60.1%), while renter-occupied units make up 161 (40.0%).
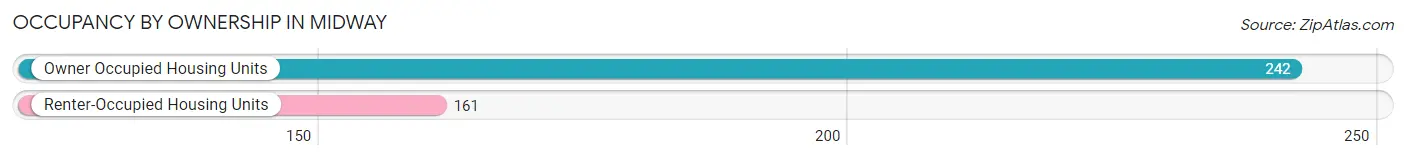
| Occupancy | # Housing Units | % Housing Units |
| Owner Occupied Housing Units | 242 | 60.1% |
| Renter-Occupied Housing Units | 161 | 40.0% |
| Total Occupied Housing Units | 403 | 100.0% |
Occupancy by Household Size in Midway
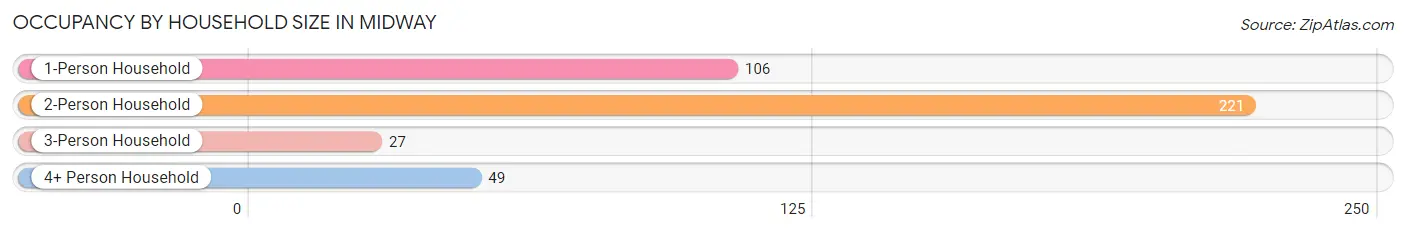
| Household Size | # Housing Units | % Housing Units |
| 1-Person Household | 106 | 26.3% |
| 2-Person Household | 221 | 54.8% |
| 3-Person Household | 27 | 6.7% |
| 4+ Person Household | 49 | 12.2% |
| Total Housing Units | 403 | 100.0% |
Occupancy by Ownership by Household Size in Midway
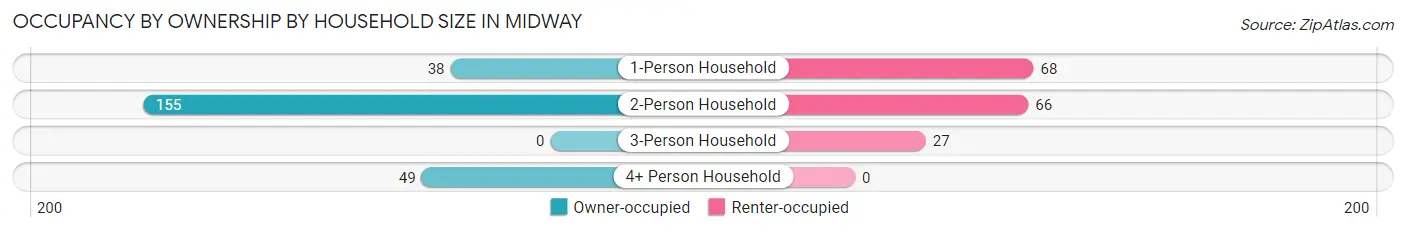
| Household Size | Owner-occupied | Renter-occupied |
| 1-Person Household | 38 (35.8%) | 68 (64.1%) |
| 2-Person Household | 155 (70.1%) | 66 (29.9%) |
| 3-Person Household | 0 (0.0%) | 27 (100.0%) |
| 4+ Person Household | 49 (100.0%) | 0 (0.0%) |
| Total Housing Units | 242 (60.1%) | 161 (40.0%) |
Occupancy by Educational Attainment in Midway
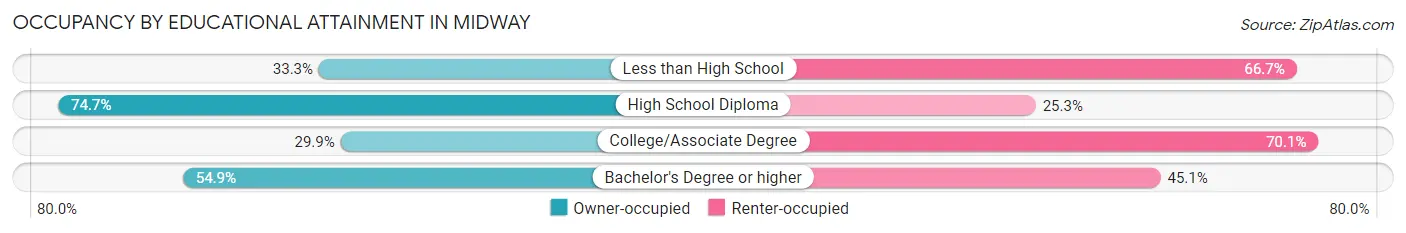
| Household Size | Owner-occupied | Renter-occupied |
| Less than High School | 8 (33.3%) | 16 (66.7%) |
| High School Diploma | 180 (74.7%) | 61 (25.3%) |
| College/Associate Degree | 26 (29.9%) | 61 (70.1%) |
| Bachelor's Degree or higher | 28 (54.9%) | 23 (45.1%) |
Occupancy by Age of Householder in Midway
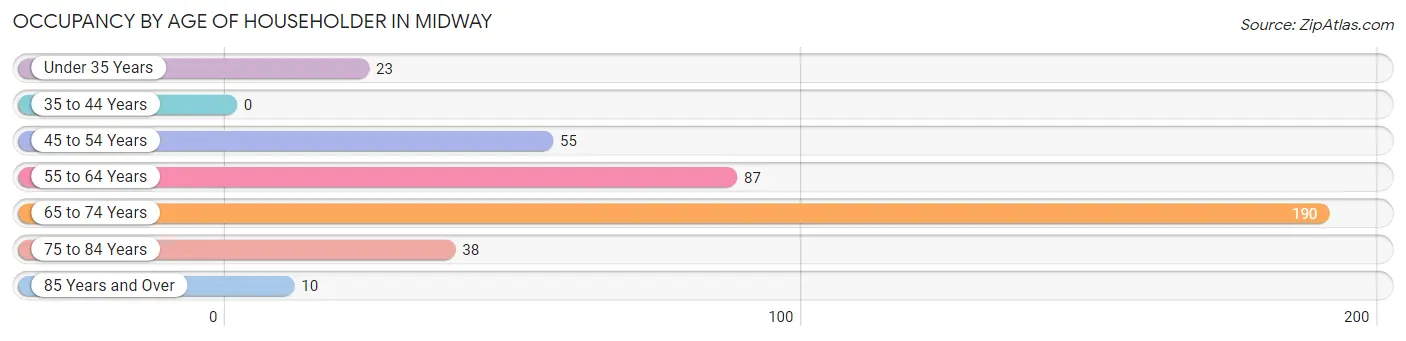
| Age Bracket | # Households | % Households |
| Under 35 Years | 23 | 5.7% |
| 35 to 44 Years | 0 | 0.0% |
| 45 to 54 Years | 55 | 13.7% |
| 55 to 64 Years | 87 | 21.6% |
| 65 to 74 Years | 190 | 47.1% |
| 75 to 84 Years | 38 | 9.4% |
| 85 Years and Over | 10 | 2.5% |
| Total | 403 | 100.0% |
Housing Finances in Midway
Median Income by Occupancy in Midway
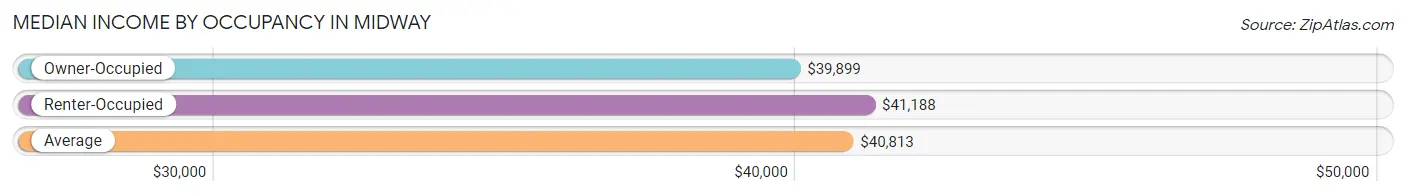
| Occupancy Type | # Households | Median Income |
| Owner-Occupied | 242 (60.1%) | $39,899 |
| Renter-Occupied | 161 (40.0%) | $41,188 |
| Average | 403 (100.0%) | $40,813 |
Occupancy by Householder Income Bracket in Midway
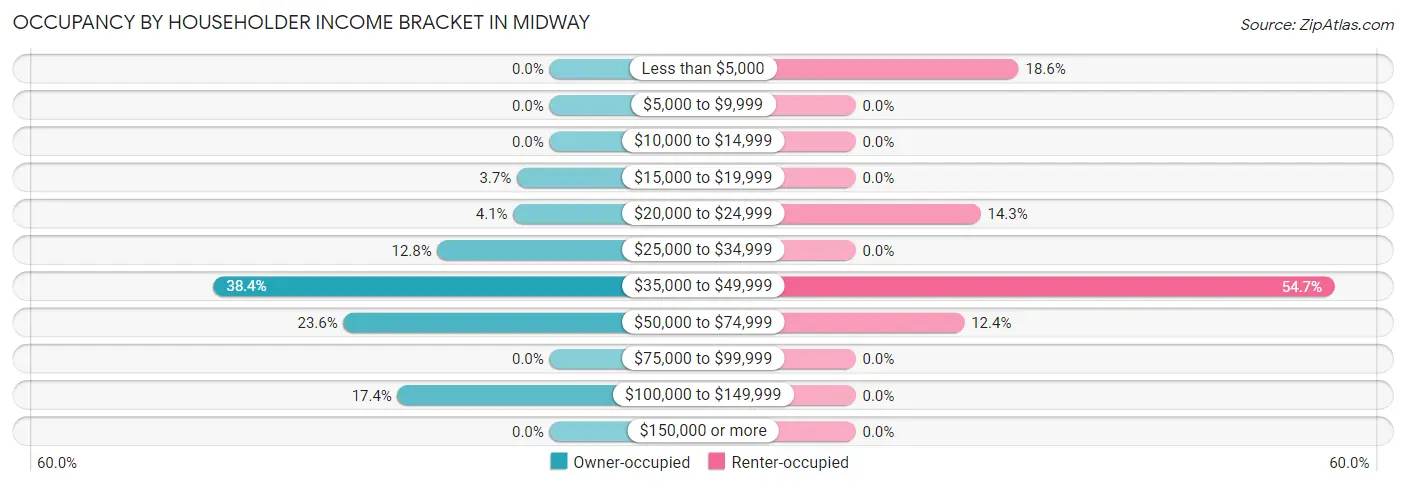
| Income Bracket | Owner-occupied | Renter-occupied |
| Less than $5,000 | 0 (0.0%) | 30 (18.6%) |
| $5,000 to $9,999 | 0 (0.0%) | 0 (0.0%) |
| $10,000 to $14,999 | 0 (0.0%) | 0 (0.0%) |
| $15,000 to $19,999 | 9 (3.7%) | 0 (0.0%) |
| $20,000 to $24,999 | 10 (4.1%) | 23 (14.3%) |
| $25,000 to $34,999 | 31 (12.8%) | 0 (0.0%) |
| $35,000 to $49,999 | 93 (38.4%) | 88 (54.7%) |
| $50,000 to $74,999 | 57 (23.5%) | 20 (12.4%) |
| $75,000 to $99,999 | 0 (0.0%) | 0 (0.0%) |
| $100,000 to $149,999 | 42 (17.4%) | 0 (0.0%) |
| $150,000 or more | 0 (0.0%) | 0 (0.0%) |
| Total | 242 (100.0%) | 161 (100.0%) |
Monthly Housing Cost Tiers in Midway
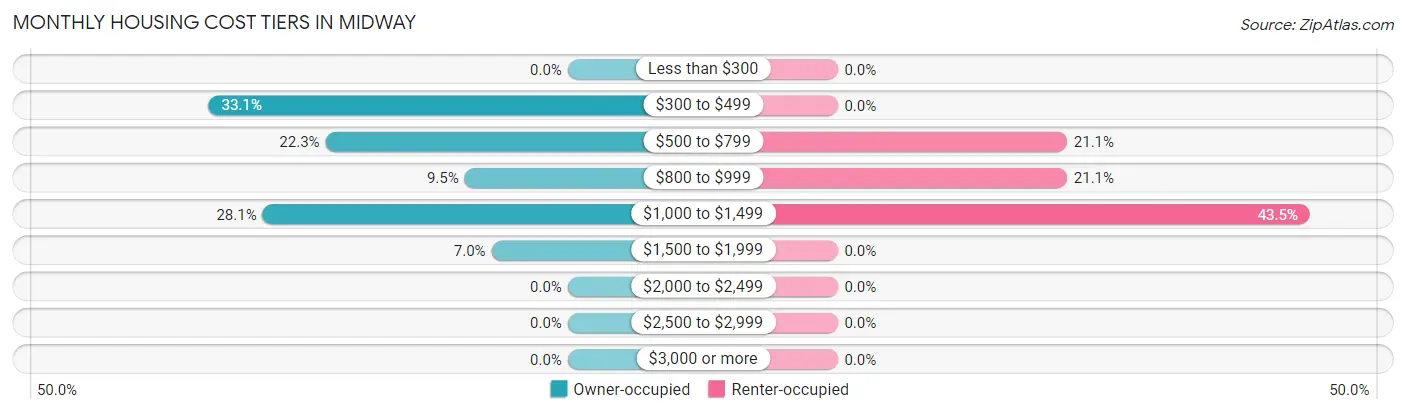
| Monthly Cost | Owner-occupied | Renter-occupied |
| Less than $300 | 0 (0.0%) | 0 (0.0%) |
| $300 to $499 | 80 (33.1%) | 0 (0.0%) |
| $500 to $799 | 54 (22.3%) | 34 (21.1%) |
| $800 to $999 | 23 (9.5%) | 34 (21.1%) |
| $1,000 to $1,499 | 68 (28.1%) | 70 (43.5%) |
| $1,500 to $1,999 | 17 (7.0%) | 0 (0.0%) |
| $2,000 to $2,499 | 0 (0.0%) | 0 (0.0%) |
| $2,500 to $2,999 | 0 (0.0%) | 0 (0.0%) |
| $3,000 or more | 0 (0.0%) | 0 (0.0%) |
| Total | 242 (100.0%) | 161 (100.0%) |
Physical Housing Characteristics in Midway
Housing Structures in Midway
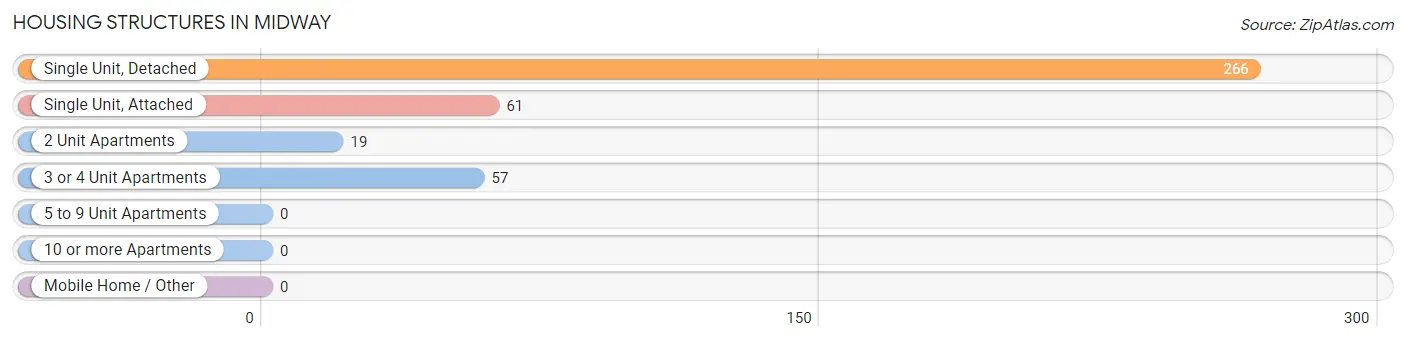
| Structure Type | # Housing Units | % Housing Units |
| Single Unit, Detached | 266 | 66.0% |
| Single Unit, Attached | 61 | 15.1% |
| 2 Unit Apartments | 19 | 4.7% |
| 3 or 4 Unit Apartments | 57 | 14.1% |
| 5 to 9 Unit Apartments | 0 | 0.0% |
| 10 or more Apartments | 0 | 0.0% |
| Mobile Home / Other | 0 | 0.0% |
| Total | 403 | 100.0% |
Housing Structures by Occupancy in Midway
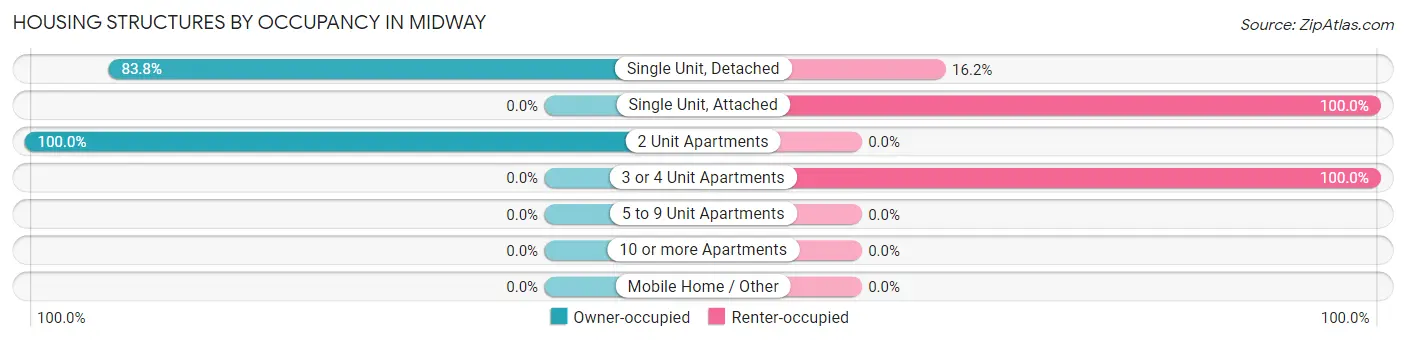
| Structure Type | Owner-occupied | Renter-occupied |
| Single Unit, Detached | 223 (83.8%) | 43 (16.2%) |
| Single Unit, Attached | 0 (0.0%) | 61 (100.0%) |
| 2 Unit Apartments | 19 (100.0%) | 0 (0.0%) |
| 3 or 4 Unit Apartments | 0 (0.0%) | 57 (100.0%) |
| 5 to 9 Unit Apartments | 0 (0.0%) | 0 (0.0%) |
| 10 or more Apartments | 0 (0.0%) | 0 (0.0%) |
| Mobile Home / Other | 0 (0.0%) | 0 (0.0%) |
| Total | 242 (60.1%) | 161 (40.0%) |
Housing Structures by Number of Rooms in Midway
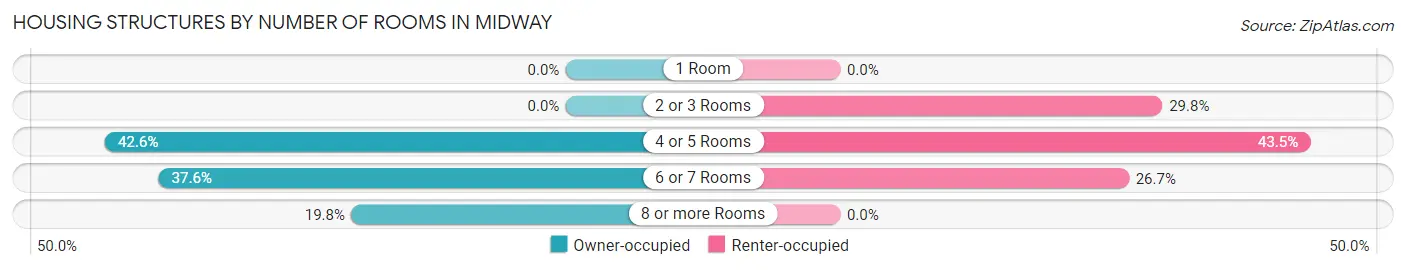
| Number of Rooms | Owner-occupied | Renter-occupied |
| 1 Room | 0 (0.0%) | 0 (0.0%) |
| 2 or 3 Rooms | 0 (0.0%) | 48 (29.8%) |
| 4 or 5 Rooms | 103 (42.6%) | 70 (43.5%) |
| 6 or 7 Rooms | 91 (37.6%) | 43 (26.7%) |
| 8 or more Rooms | 48 (19.8%) | 0 (0.0%) |
| Total | 242 (100.0%) | 161 (100.0%) |
Housing Structure by Heating Type in Midway
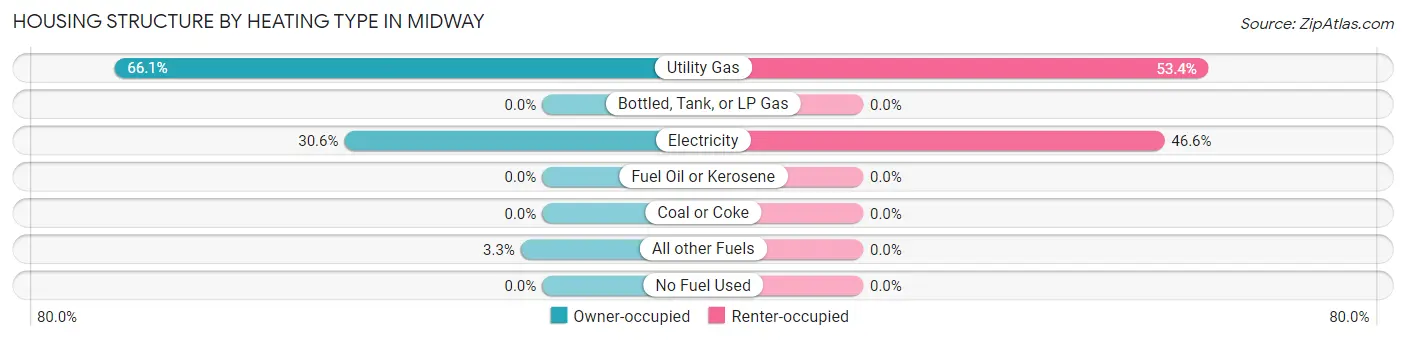
| Heating Type | Owner-occupied | Renter-occupied |
| Utility Gas | 160 (66.1%) | 86 (53.4%) |
| Bottled, Tank, or LP Gas | 0 (0.0%) | 0 (0.0%) |
| Electricity | 74 (30.6%) | 75 (46.6%) |
| Fuel Oil or Kerosene | 0 (0.0%) | 0 (0.0%) |
| Coal or Coke | 0 (0.0%) | 0 (0.0%) |
| All other Fuels | 8 (3.3%) | 0 (0.0%) |
| No Fuel Used | 0 (0.0%) | 0 (0.0%) |
| Total | 242 (100.0%) | 161 (100.0%) |
Household Vehicle Usage in Midway
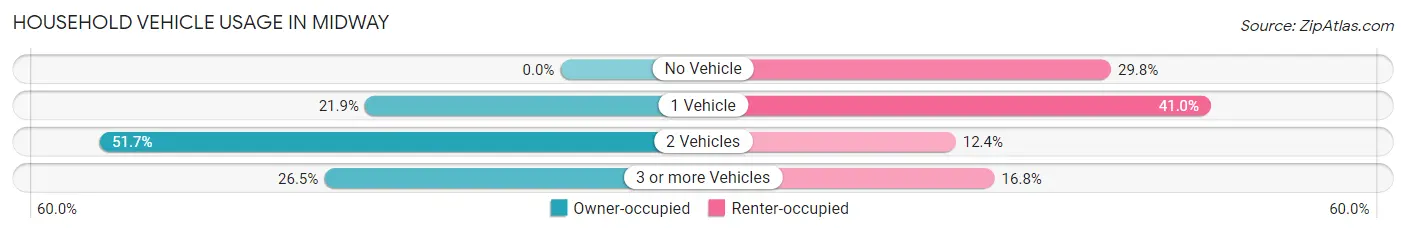
| Vehicles per Household | Owner-occupied | Renter-occupied |
| No Vehicle | 0 (0.0%) | 48 (29.8%) |
| 1 Vehicle | 53 (21.9%) | 66 (41.0%) |
| 2 Vehicles | 125 (51.6%) | 20 (12.4%) |
| 3 or more Vehicles | 64 (26.5%) | 27 (16.8%) |
| Total | 242 (100.0%) | 161 (100.0%) |
Real Estate & Mortgages in Midway
Real Estate and Mortgage Overview in Midway
| Characteristic | Without Mortgage | With Mortgage |
| Housing Units | 135 | 107 |
| Median Property Value | $165,900 | $148,500 |
| Median Household Income | - | - |
| Monthly Housing Costs | $396 | $0 |
| Real Estate Taxes | $2,750 | $0 |
Property Value by Mortgage Status in Midway
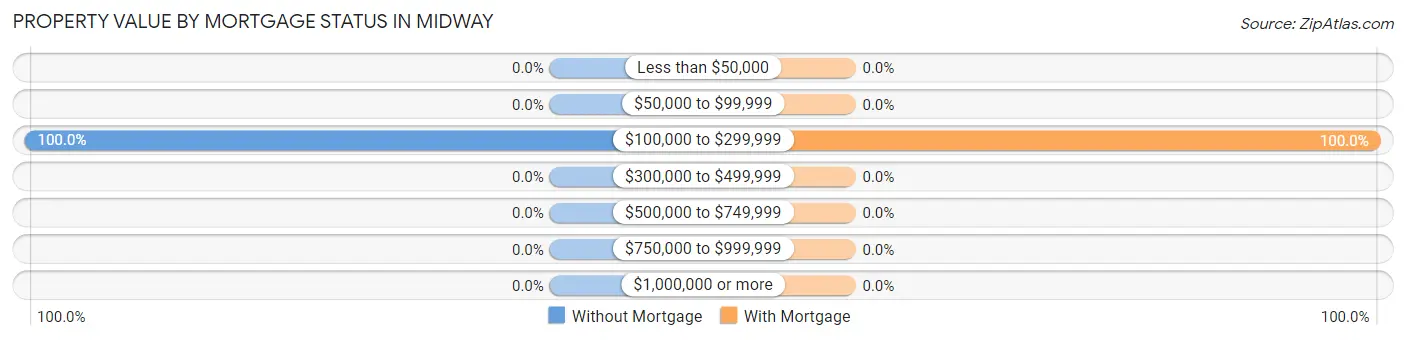
| Property Value | Without Mortgage | With Mortgage |
| Less than $50,000 | 0 (0.0%) | 0 (0.0%) |
| $50,000 to $99,999 | 0 (0.0%) | 0 (0.0%) |
| $100,000 to $299,999 | 135 (100.0%) | 107 (100.0%) |
| $300,000 to $499,999 | 0 (0.0%) | 0 (0.0%) |
| $500,000 to $749,999 | 0 (0.0%) | 0 (0.0%) |
| $750,000 to $999,999 | 0 (0.0%) | 0 (0.0%) |
| $1,000,000 or more | 0 (0.0%) | 0 (0.0%) |
| Total | 135 (100.0%) | 107 (100.0%) |
Household Income by Mortgage Status in Midway
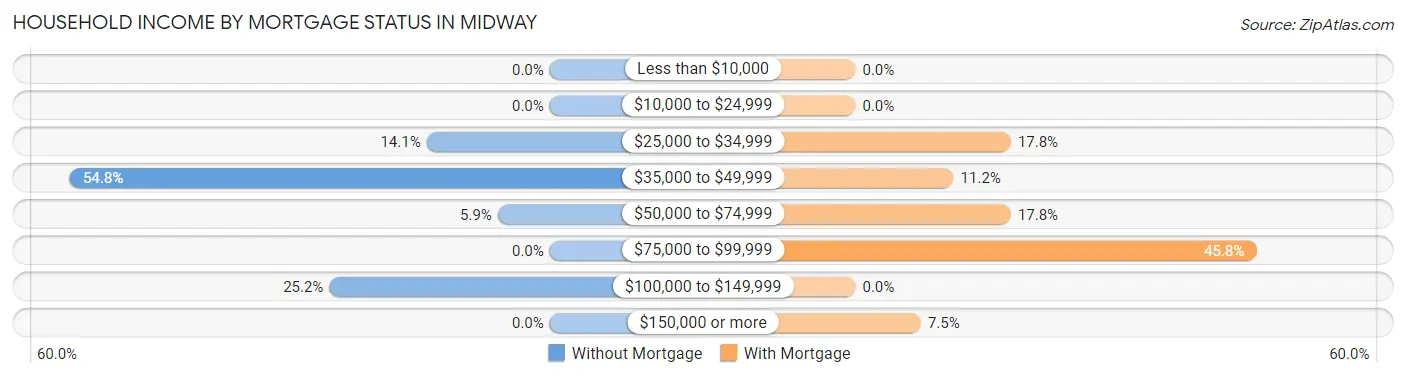
| Household Income | Without Mortgage | With Mortgage |
| Less than $10,000 | 0 (0.0%) | 0 (0.0%) |
| $10,000 to $24,999 | 0 (0.0%) | 0 (0.0%) |
| $25,000 to $34,999 | 19 (14.1%) | 19 (17.8%) |
| $35,000 to $49,999 | 74 (54.8%) | 12 (11.2%) |
| $50,000 to $74,999 | 8 (5.9%) | 19 (17.8%) |
| $75,000 to $99,999 | 0 (0.0%) | 49 (45.8%) |
| $100,000 to $149,999 | 34 (25.2%) | 0 (0.0%) |
| $150,000 or more | 0 (0.0%) | 8 (7.5%) |
| Total | 135 (100.0%) | 107 (100.0%) |
Property Value to Household Income Ratio in Midway
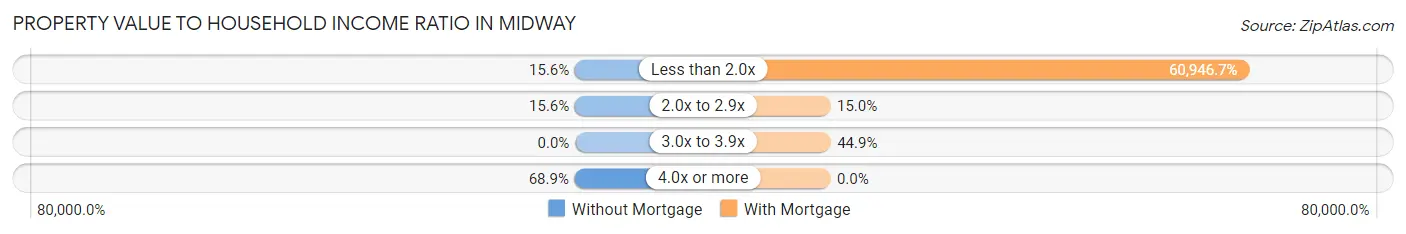
| Value-to-Income Ratio | Without Mortgage | With Mortgage |
| Less than 2.0x | 21 (15.6%) | 65,213 (60,946.7%) |
| 2.0x to 2.9x | 21 (15.6%) | 16 (14.9%) |
| 3.0x to 3.9x | 0 (0.0%) | 48 (44.9%) |
| 4.0x or more | 93 (68.9%) | 0 (0.0%) |
| Total | 135 (100.0%) | 107 (100.0%) |
Real Estate Taxes by Mortgage Status in Midway
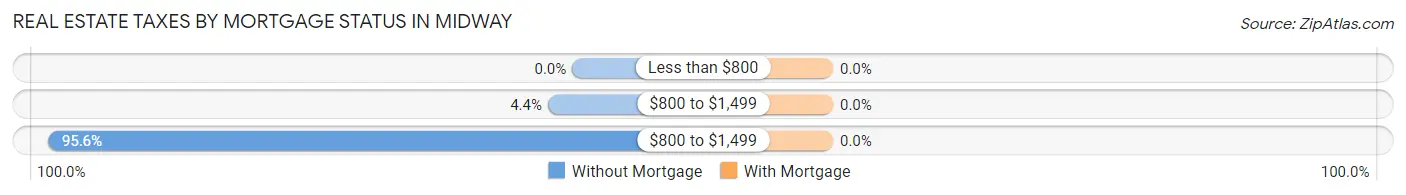
| Property Taxes | Without Mortgage | With Mortgage |
| Less than $800 | 0 (0.0%) | 0 (0.0%) |
| $800 to $1,499 | 6 (4.4%) | 0 (0.0%) |
| $800 to $1,499 | 129 (95.6%) | 0 (0.0%) |
| Total | 135 (100.0%) | 107 (100.0%) |
Health & Disability in Midway
Health Insurance Coverage by Age in Midway
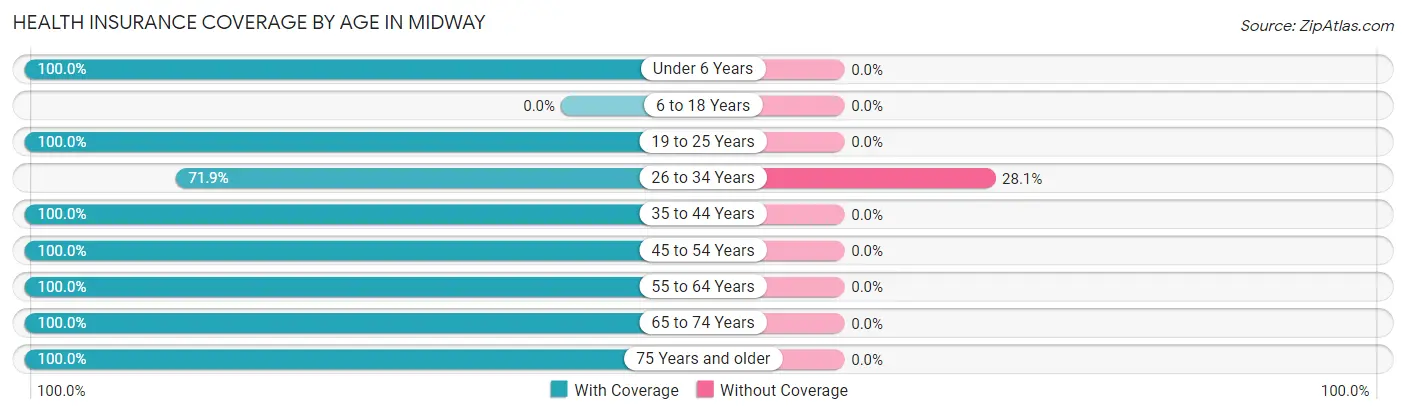
| Age Bracket | With Coverage | Without Coverage |
| Under 6 Years | 20 (100.0%) | 0 (0.0%) |
| 6 to 18 Years | 0 (0.0%) | 0 (0.0%) |
| 19 to 25 Years | 68 (100.0%) | 0 (0.0%) |
| 26 to 34 Years | 23 (71.9%) | 9 (28.1%) |
| 35 to 44 Years | 27 (100.0%) | 0 (0.0%) |
| 45 to 54 Years | 133 (100.0%) | 0 (0.0%) |
| 55 to 64 Years | 140 (100.0%) | 0 (0.0%) |
| 65 to 74 Years | 326 (100.0%) | 0 (0.0%) |
| 75 Years and older | 68 (100.0%) | 0 (0.0%) |
| Total | 805 (98.9%) | 9 (1.1%) |
Health Insurance Coverage by Citizenship Status in Midway
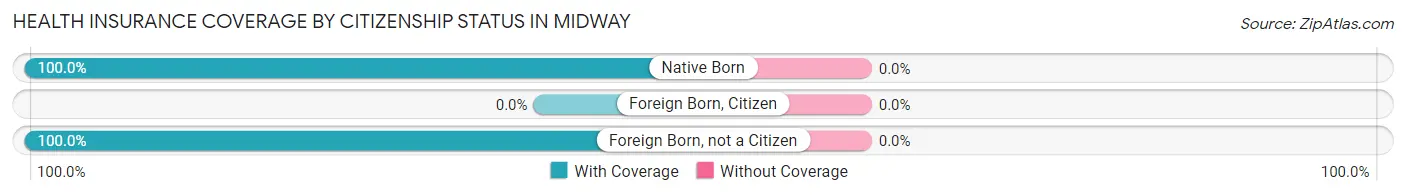
| Citizenship Status | With Coverage | Without Coverage |
| Native Born | 20 (100.0%) | 0 (0.0%) |
| Foreign Born, Citizen | 0 (0.0%) | 0 (0.0%) |
| Foreign Born, not a Citizen | 68 (100.0%) | 0 (0.0%) |
Health Insurance Coverage by Household Income in Midway
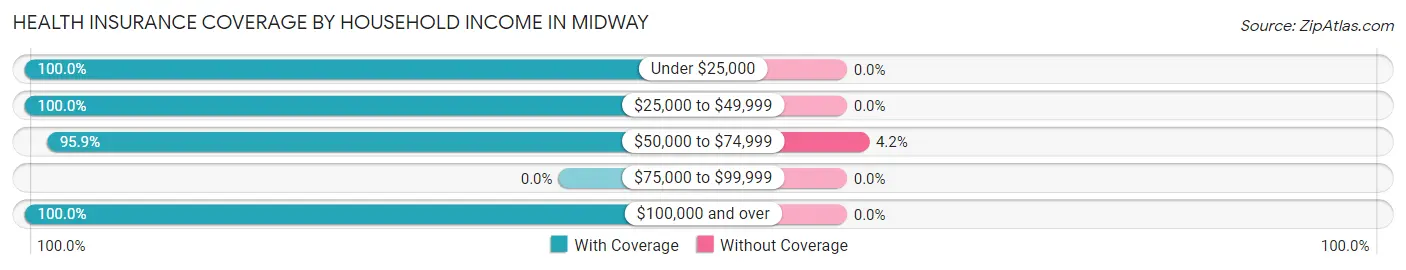
| Household Income | With Coverage | Without Coverage |
| Under $25,000 | 92 (100.0%) | 0 (0.0%) |
| $25,000 to $49,999 | 416 (100.0%) | 0 (0.0%) |
| $50,000 to $74,999 | 208 (95.9%) | 9 (4.2%) |
| $75,000 to $99,999 | 0 (0.0%) | 0 (0.0%) |
| $100,000 and over | 89 (100.0%) | 0 (0.0%) |
Public vs Private Health Insurance Coverage by Age in Midway
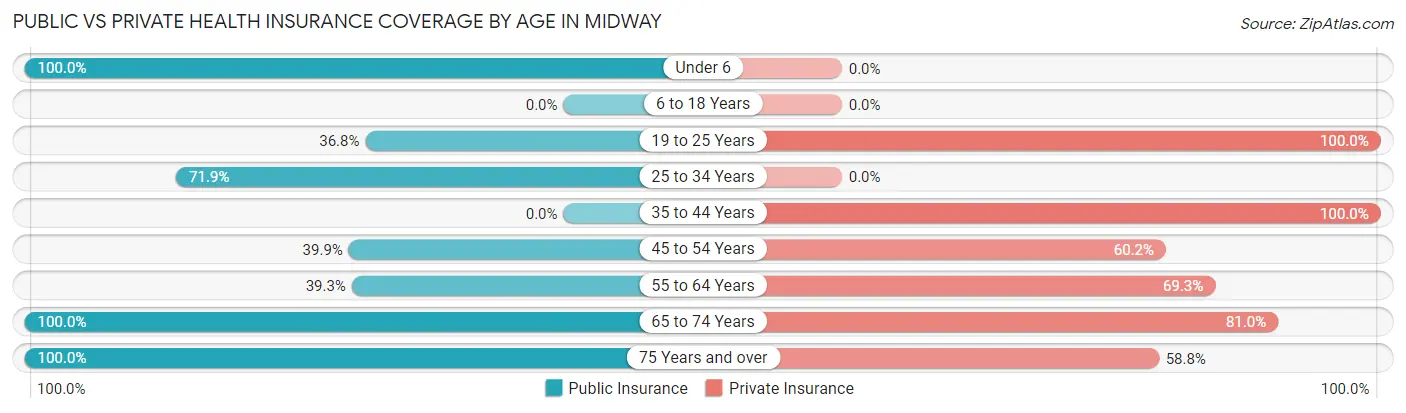
| Age Bracket | Public Insurance | Private Insurance |
| Under 6 | 20 (100.0%) | 0 (0.0%) |
| 6 to 18 Years | 0 (0.0%) | 0 (0.0%) |
| 19 to 25 Years | 25 (36.8%) | 68 (100.0%) |
| 25 to 34 Years | 23 (71.9%) | 0 (0.0%) |
| 35 to 44 Years | 0 (0.0%) | 27 (100.0%) |
| 45 to 54 Years | 53 (39.9%) | 80 (60.2%) |
| 55 to 64 Years | 55 (39.3%) | 97 (69.3%) |
| 65 to 74 Years | 326 (100.0%) | 264 (81.0%) |
| 75 Years and over | 68 (100.0%) | 40 (58.8%) |
| Total | 570 (70.0%) | 576 (70.8%) |
Disability Status by Sex by Age in Midway
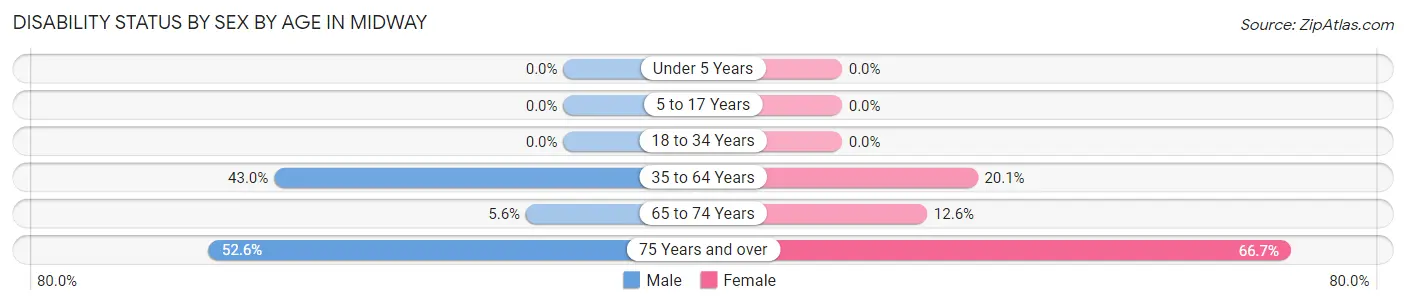
| Age Bracket | Male | Female |
| Under 5 Years | 0 (0.0%) | 0 (0.0%) |
| 5 to 17 Years | 0 (0.0%) | 0 (0.0%) |
| 18 to 34 Years | 0 (0.0%) | 0 (0.0%) |
| 35 to 64 Years | 67 (42.9%) | 29 (20.1%) |
| 65 to 74 Years | 8 (5.6%) | 23 (12.6%) |
| 75 Years and over | 20 (52.6%) | 20 (66.7%) |
Disability Class by Sex by Age in Midway
Disability Class: Hearing Difficulty
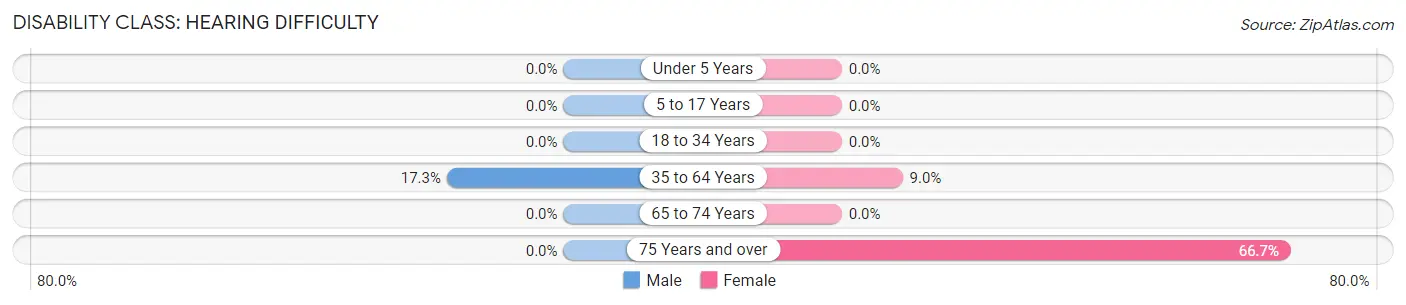
| Age Bracket | Male | Female |
| Under 5 Years | 0 (0.0%) | 0 (0.0%) |
| 5 to 17 Years | 0 (0.0%) | 0 (0.0%) |
| 18 to 34 Years | 0 (0.0%) | 0 (0.0%) |
| 35 to 64 Years | 27 (17.3%) | 13 (9.0%) |
| 65 to 74 Years | 0 (0.0%) | 0 (0.0%) |
| 75 Years and over | 0 (0.0%) | 20 (66.7%) |
Disability Class: Vision Difficulty
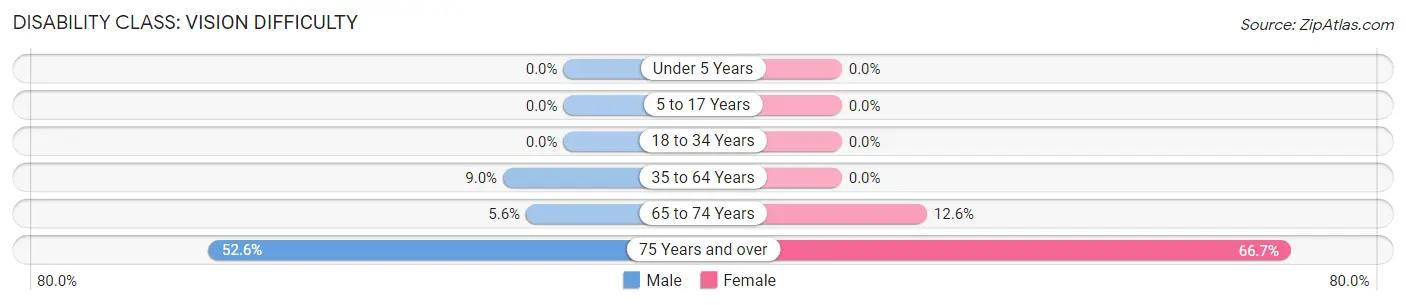
| Age Bracket | Male | Female |
| Under 5 Years | 0 (0.0%) | 0 (0.0%) |
| 5 to 17 Years | 0 (0.0%) | 0 (0.0%) |
| 18 to 34 Years | 0 (0.0%) | 0 (0.0%) |
| 35 to 64 Years | 14 (9.0%) | 0 (0.0%) |
| 65 to 74 Years | 8 (5.6%) | 23 (12.6%) |
| 75 Years and over | 20 (52.6%) | 20 (66.7%) |
Disability Class: Cognitive Difficulty
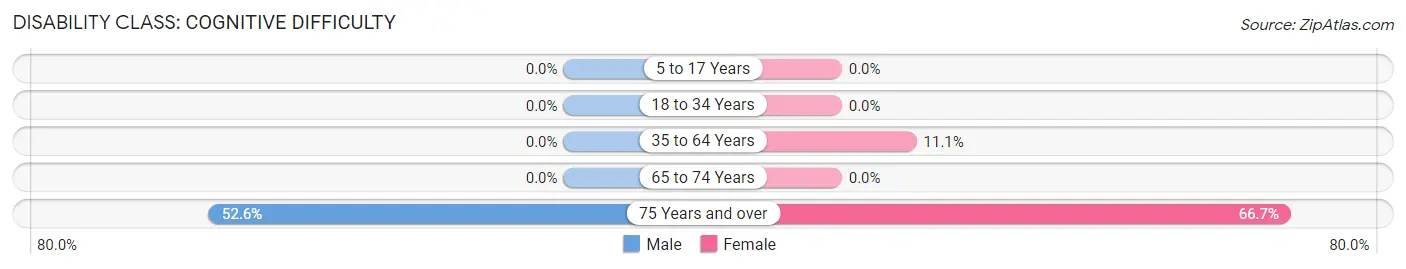
| Age Bracket | Male | Female |
| 5 to 17 Years | 0 (0.0%) | 0 (0.0%) |
| 18 to 34 Years | 0 (0.0%) | 0 (0.0%) |
| 35 to 64 Years | 0 (0.0%) | 16 (11.1%) |
| 65 to 74 Years | 0 (0.0%) | 0 (0.0%) |
| 75 Years and over | 20 (52.6%) | 20 (66.7%) |
Disability Class: Ambulatory Difficulty
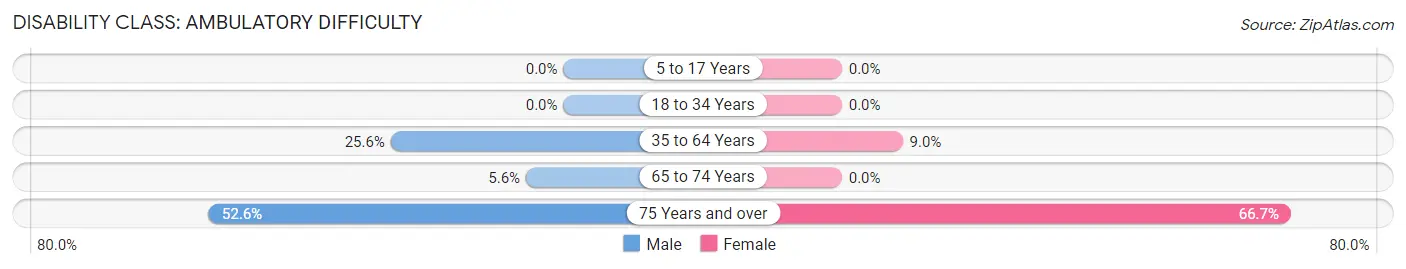
| Age Bracket | Male | Female |
| 5 to 17 Years | 0 (0.0%) | 0 (0.0%) |
| 18 to 34 Years | 0 (0.0%) | 0 (0.0%) |
| 35 to 64 Years | 40 (25.6%) | 13 (9.0%) |
| 65 to 74 Years | 8 (5.6%) | 0 (0.0%) |
| 75 Years and over | 20 (52.6%) | 20 (66.7%) |
Disability Class: Self-Care Difficulty

| Age Bracket | Male | Female |
| 5 to 17 Years | 0 (0.0%) | 0 (0.0%) |
| 18 to 34 Years | 0 (0.0%) | 0 (0.0%) |
| 35 to 64 Years | 0 (0.0%) | 13 (9.0%) |
| 65 to 74 Years | 0 (0.0%) | 0 (0.0%) |
| 75 Years and over | 20 (52.6%) | 20 (66.7%) |
Technology Access in Midway
Computing Device Access in Midway
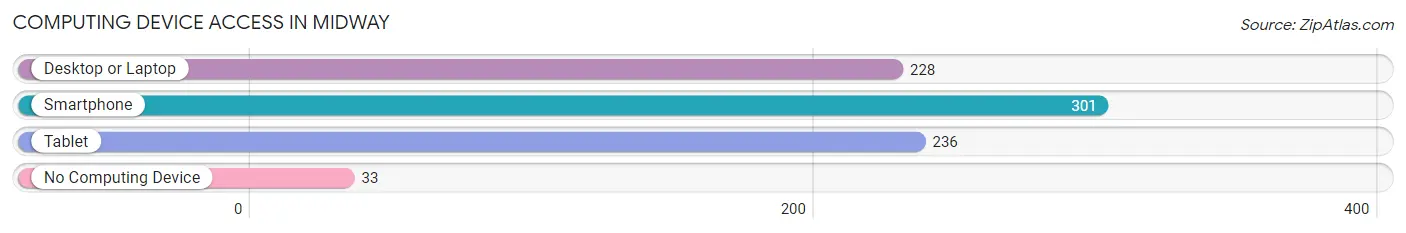
| Device Type | # Households | % Households |
| Desktop or Laptop | 228 | 56.6% |
| Smartphone | 301 | 74.7% |
| Tablet | 236 | 58.6% |
| No Computing Device | 33 | 8.2% |
| Total | 403 | 100.0% |
Internet Access in Midway
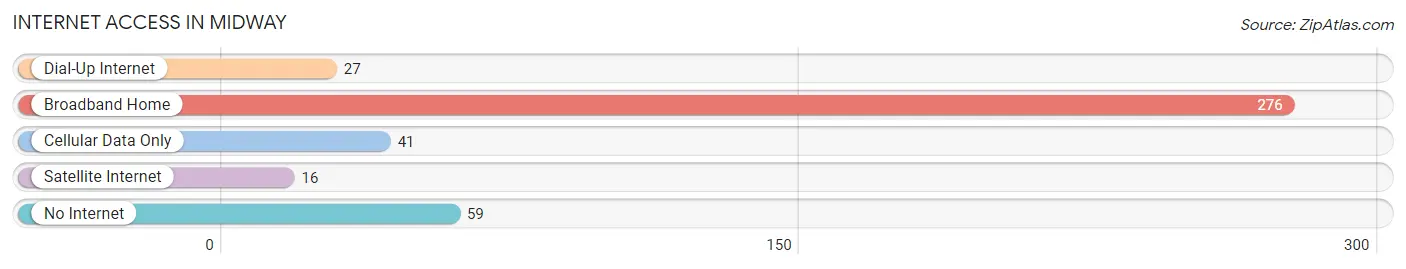
| Internet Type | # Households | % Households |
| Dial-Up Internet | 27 | 6.7% |
| Broadband Home | 276 | 68.5% |
| Cellular Data Only | 41 | 10.2% |
| Satellite Internet | 16 | 4.0% |
| No Internet | 59 | 14.6% |
| Total | 403 | 100.0% |
Midway Summary
Midway, Pennsylvania is a small borough located in Washington County, Pennsylvania. It is situated in the southwestern corner of the state, approximately 25 miles south of Pittsburgh. The population of Midway was 1,845 as of the 2010 census.
History
Midway was founded in 1817 by a group of settlers from Maryland. The town was originally known as “Midway Station” due to its location between two major cities, Pittsburgh and Washington, Pennsylvania. The town was officially incorporated in 1836.
In the late 19th century, Midway was a thriving industrial center. The town was home to several coal mines, brickyards, and a glass factory. The glass factory was the largest employer in the area and produced a variety of glass products, including bottles, jars, and window panes.
The town’s economy began to decline in the early 20th century as the coal and glass industries began to decline. The glass factory closed in the 1920s and the coal mines closed in the 1940s.
Geography
Midway is located in southwestern Pennsylvania, approximately 25 miles south of Pittsburgh. The borough is situated in the Monongahela Valley, which is part of the Appalachian Plateau. The borough is bordered by the towns of Claysville to the north, West Alexander to the east, and Beallsville to the south.
The borough is located in a hilly region and is surrounded by several small streams. The most prominent stream is the Little Chartiers Creek, which flows through the center of the borough.
Economy
The economy of Midway is largely based on agriculture and tourism. The town is home to several small farms, which produce a variety of crops, including corn, soybeans, and hay.
The town is also home to several small businesses, including a grocery store, a hardware store, and a few restaurants. The town is also home to a small winery, which produces a variety of wines.
The town is also a popular tourist destination. The town is home to several historic sites, including the Midway Historic District, which is listed on the National Register of Historic Places. The town is also home to several parks and recreational areas, including the Midway State Park.
Demographics
As of the 2010 census, the population of Midway was 1,845. The racial makeup of the borough was 97.3% White, 0.7% African American, 0.2% Native American, 0.2% Asian, 0.2% from other races, and 1.4% from two or more races. Hispanic or Latino of any race were 0.7% of the population.
The median household income in Midway was $37,917, and the median family income was $45,000. The per capita income for the borough was $18,945. About 11.2% of families and 13.2% of the population were below the poverty line, including 17.2% of those under age 18 and 8.2% of those age 65 or over.
Common Questions
What is Per Capita Income in Midway?
Per Capita income in Midway is $23,933.
What is the Median Family Income in Midway?
Median Family Income in Midway is $39,932.
What is the Median Household income in Midway?
Median Household Income in Midway is $40,813.
What is Inequality or Gini Index in Midway?
Inequality or Gini Index in Midway is 0.32.
What is the Total Population of Midway?
Total Population of Midway is 814.
What is the Total Male Population of Midway?
Total Male Population of Midway is 379.
What is the Total Female Population of Midway?
Total Female Population of Midway is 435.
What is the Ratio of Males per 100 Females in Midway?
There are 87.13 Males per 100 Females in Midway.
What is the Ratio of Females per 100 Males in Midway?
There are 114.78 Females per 100 Males in Midway.
What is the Median Population Age in Midway?
Median Population Age in Midway is 64.5 Years.
What is the Average Family Size in Midway
Average Family Size in Midway is 2.2 People.
What is the Average Household Size in Midway
Average Household Size in Midway is 2.0 People.
How Large is the Labor Force in Midway?
There are 383 People in the Labor Forcein in Midway.
What is the Percentage of People in the Labor Force in Midway?
48.2% of People are in the Labor Force in Midway.
What is the Unemployment Rate in Midway?
Unemployment Rate in Midway is 2.3%.