Midway borough, PA Map & Demographics
Midway borough Overview
$30,744
PER CAPITA INCOME
$58,750
AVG FAMILY INCOME
$57,981
AVG HOUSEHOLD INCOME
24.5%
WAGE / INCOME GAP [ % ]
75.5¢/ $1
WAGE / INCOME GAP [ $ ]
0.33
INEQUALITY / GINI INDEX
919
TOTAL POPULATION
499
MALE POPULATION
420
FEMALE POPULATION
118.81
MALES / 100 FEMALES
84.17
FEMALES / 100 MALES
43.8
MEDIAN AGE
2.8
AVG FAMILY SIZE
2.4
AVG HOUSEHOLD SIZE
467
LABOR FORCE [ PEOPLE ]
58.5%
PERCENT IN LABOR FORCE
11.3%
UNEMPLOYMENT RATE
Income in Midway borough
Income Overview in Midway borough
Per Capita Income in Midway borough is $30,744, while median incomes of families and households are $58,750 and $57,981 respectively.
| Characteristic | Number | Measure |
| Per Capita Income | 919 | $30,744 |
| Median Family Income | 251 | $58,750 |
| Mean Family Income | 251 | $79,117 |
| Median Household Income | 384 | $57,981 |
| Mean Household Income | 384 | $73,201 |
| Income Deficit | 251 | $0 |
| Wage / Income Gap (%) | 919 | 24.49% |
| Wage / Income Gap ($) | 919 | 75.51¢ per $1 |
| Gini / Inequality Index | 919 | 0.33 |
Earnings by Sex in Midway borough
Average Earnings in Midway borough are $35,093, $40,341 for men and $30,461 for women, a difference of 24.5%.
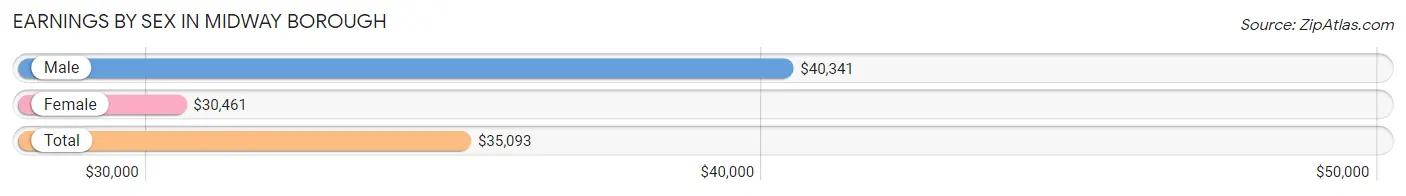
| Sex | Number | Average Earnings |
| Male | 267 (56.6%) | $40,341 |
| Female | 205 (43.4%) | $30,461 |
| Total | 472 (100.0%) | $35,093 |
Earnings by Sex by Income Bracket in Midway borough
The most common earnings brackets in Midway borough are $2,499 or less for men (34 | 12.7%) and $5,000 to $7,499 for women (21 | 10.2%).
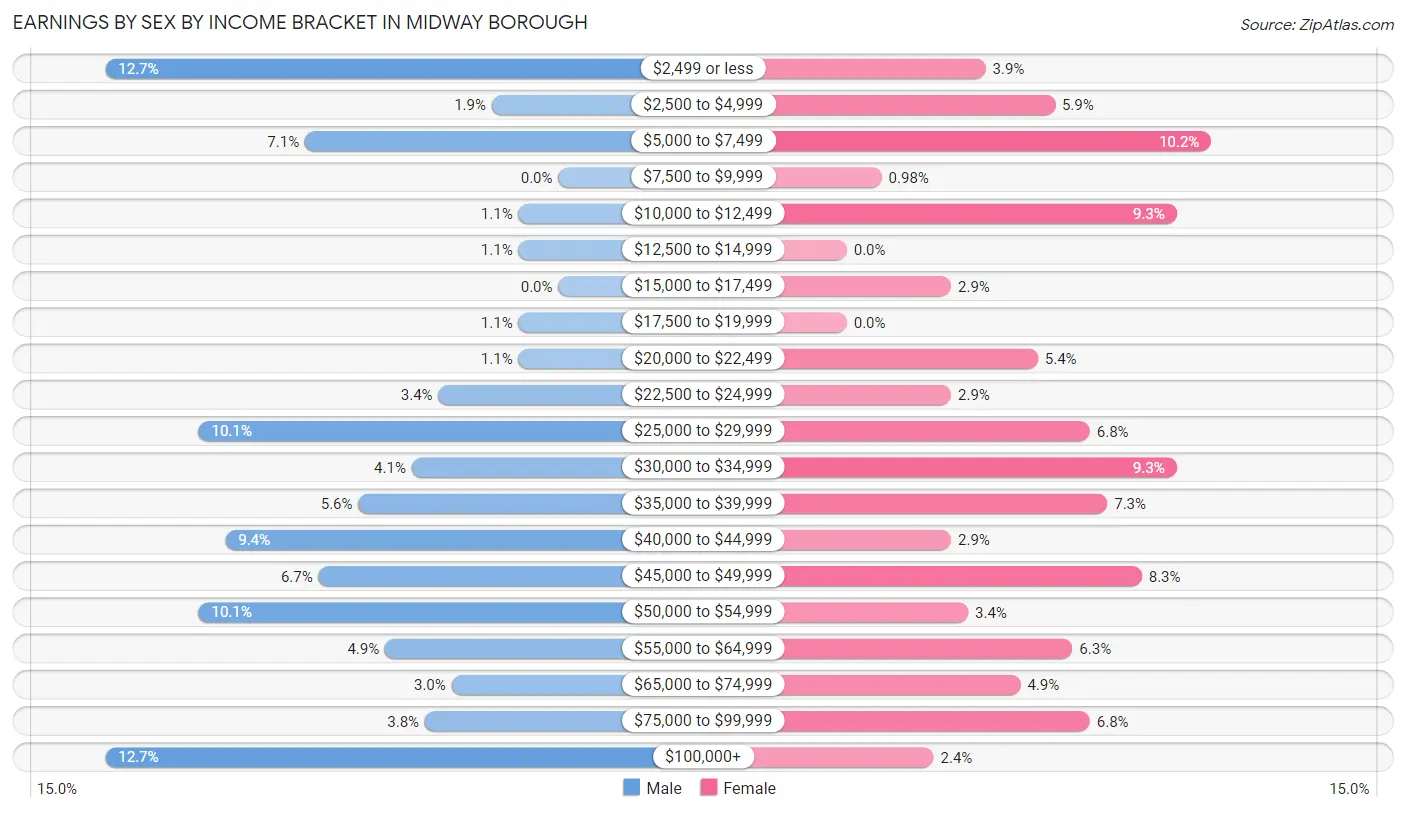
| Income | Male | Female |
| $2,499 or less | 34 (12.7%) | 8 (3.9%) |
| $2,500 to $4,999 | 5 (1.9%) | 12 (5.9%) |
| $5,000 to $7,499 | 19 (7.1%) | 21 (10.2%) |
| $7,500 to $9,999 | 0 (0.0%) | 2 (1.0%) |
| $10,000 to $12,499 | 3 (1.1%) | 19 (9.3%) |
| $12,500 to $14,999 | 3 (1.1%) | 0 (0.0%) |
| $15,000 to $17,499 | 0 (0.0%) | 6 (2.9%) |
| $17,500 to $19,999 | 3 (1.1%) | 0 (0.0%) |
| $20,000 to $22,499 | 3 (1.1%) | 11 (5.4%) |
| $22,500 to $24,999 | 9 (3.4%) | 6 (2.9%) |
| $25,000 to $29,999 | 27 (10.1%) | 14 (6.8%) |
| $30,000 to $34,999 | 11 (4.1%) | 19 (9.3%) |
| $35,000 to $39,999 | 15 (5.6%) | 15 (7.3%) |
| $40,000 to $44,999 | 25 (9.4%) | 6 (2.9%) |
| $45,000 to $49,999 | 18 (6.7%) | 17 (8.3%) |
| $50,000 to $54,999 | 27 (10.1%) | 7 (3.4%) |
| $55,000 to $64,999 | 13 (4.9%) | 13 (6.3%) |
| $65,000 to $74,999 | 8 (3.0%) | 10 (4.9%) |
| $75,000 to $99,999 | 10 (3.7%) | 14 (6.8%) |
| $100,000+ | 34 (12.7%) | 5 (2.4%) |
| Total | 267 (100.0%) | 205 (100.0%) |
Earnings by Sex by Educational Attainment in Midway borough
Average earnings in Midway borough are $46,563 for men and $31,776 for women, a difference of 31.8%. Men with an educational attainment of high school diploma enjoy the highest average annual earnings of $46,406, while those with college or associate's degree education earn the least with $44,286. Women with an educational attainment of graduate degree earn the most with the average annual earnings of $86,818, while those with college or associate's degree education have the smallest earnings of $36,607.
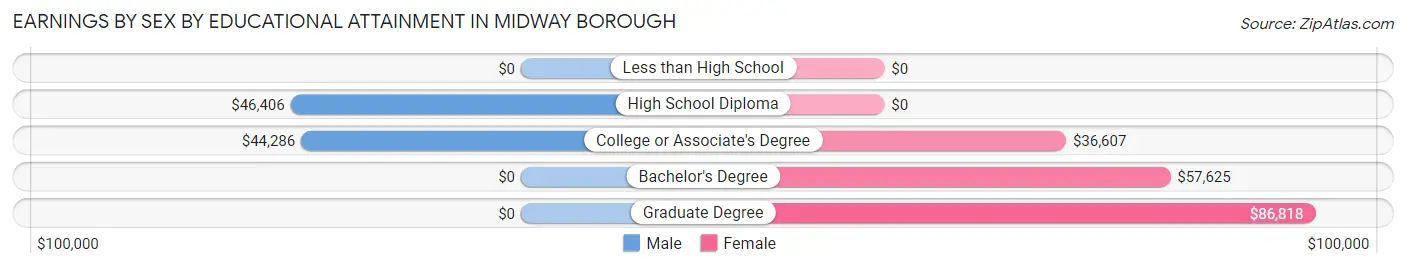
| Educational Attainment | Male Income | Female Income |
| Less than High School | - | - |
| High School Diploma | $46,406 | $0 |
| College or Associate's Degree | $44,286 | $36,607 |
| Bachelor's Degree | - | - |
| Graduate Degree | - | - |
| Total | $46,563 | $31,776 |
Family Income in Midway borough
Family Income Brackets in Midway borough
According to the Midway borough family income data, there are 74 families falling into the $35,000 to $49,999 income range, which is the most common income bracket and makes up 29.5% of all families.
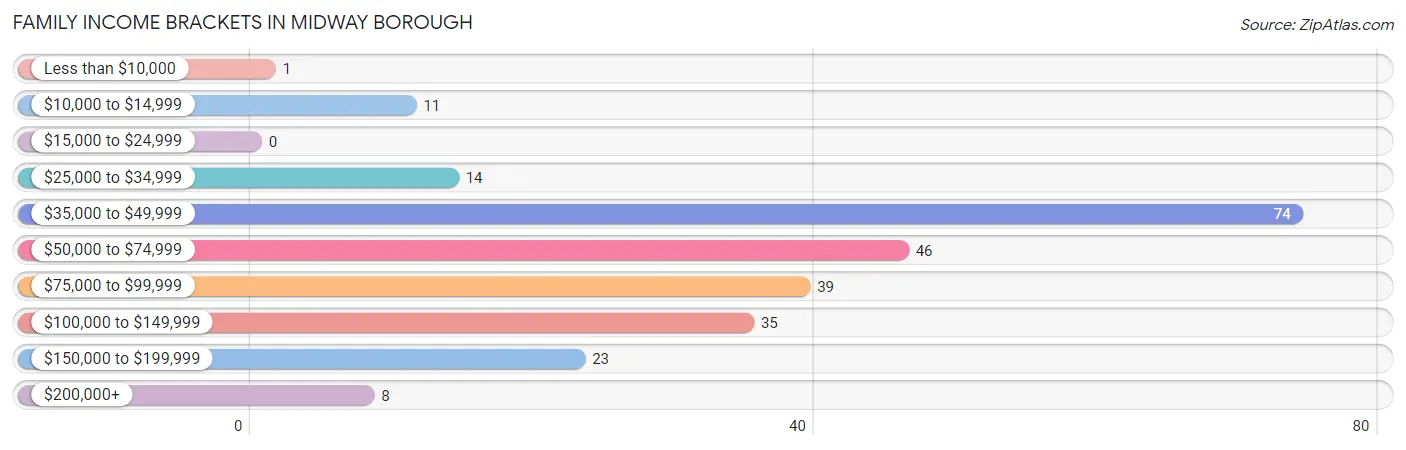
| Income Bracket | # Families | % Families |
| Less than $10,000 | 1 | 0.4% |
| $10,000 to $14,999 | 11 | 4.4% |
| $15,000 to $24,999 | 0 | 0.0% |
| $25,000 to $34,999 | 14 | 5.6% |
| $35,000 to $49,999 | 74 | 29.5% |
| $50,000 to $74,999 | 46 | 18.3% |
| $75,000 to $99,999 | 39 | 15.5% |
| $100,000 to $149,999 | 35 | 13.9% |
| $150,000 to $199,999 | 23 | 9.2% |
| $200,000+ | 8 | 3.2% |
Family Income by Famaliy Size in Midway borough
5-person families (10 | 4.0%) account for the highest median family income in Midway borough with $186,667 per family, while 5-person families (10 | 4.0%) have the highest median income of $37,333 per family member.
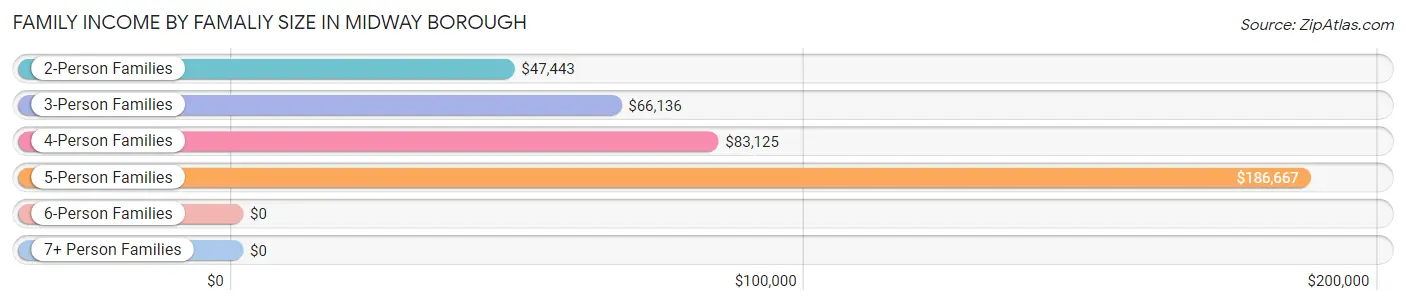
| Income Bracket | # Families | Median Income |
| 2-Person Families | 142 (56.6%) | $47,443 |
| 3-Person Families | 64 (25.5%) | $66,136 |
| 4-Person Families | 29 (11.6%) | $83,125 |
| 5-Person Families | 10 (4.0%) | $186,667 |
| 6-Person Families | 0 (0.0%) | $0 |
| 7+ Person Families | 6 (2.4%) | $0 |
| Total | 251 (100.0%) | $58,750 |
Family Income by Number of Earners in Midway borough
The median family income in Midway borough is $58,750, with families comprising 3+ earners (37) having the highest median family income of $170,625, while families with no earners (74) have the lowest median family income of $47,000, accounting for 14.7% and 29.5% of families, respectively.
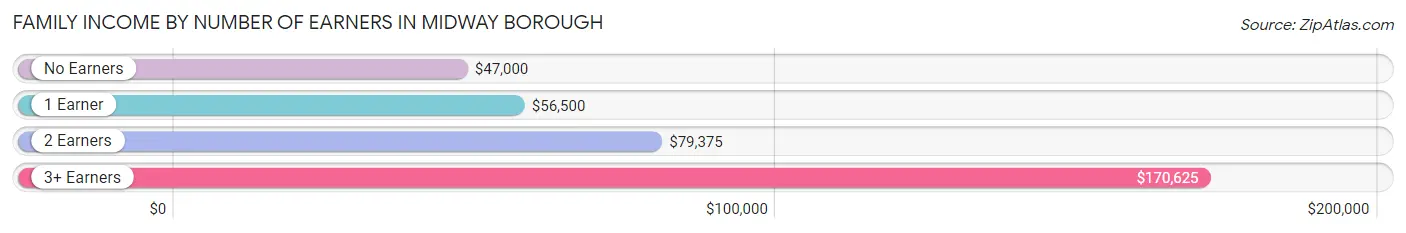
| Number of Earners | # Families | Median Income |
| No Earners | 74 (29.5%) | $47,000 |
| 1 Earner | 68 (27.1%) | $56,500 |
| 2 Earners | 72 (28.7%) | $79,375 |
| 3+ Earners | 37 (14.7%) | $170,625 |
| Total | 251 (100.0%) | $58,750 |
Household Income in Midway borough
Household Income Brackets in Midway borough
With 89 households falling in the category, the $35,000 to $49,999 income range is the most frequent in Midway borough, accounting for 23.2% of all households.
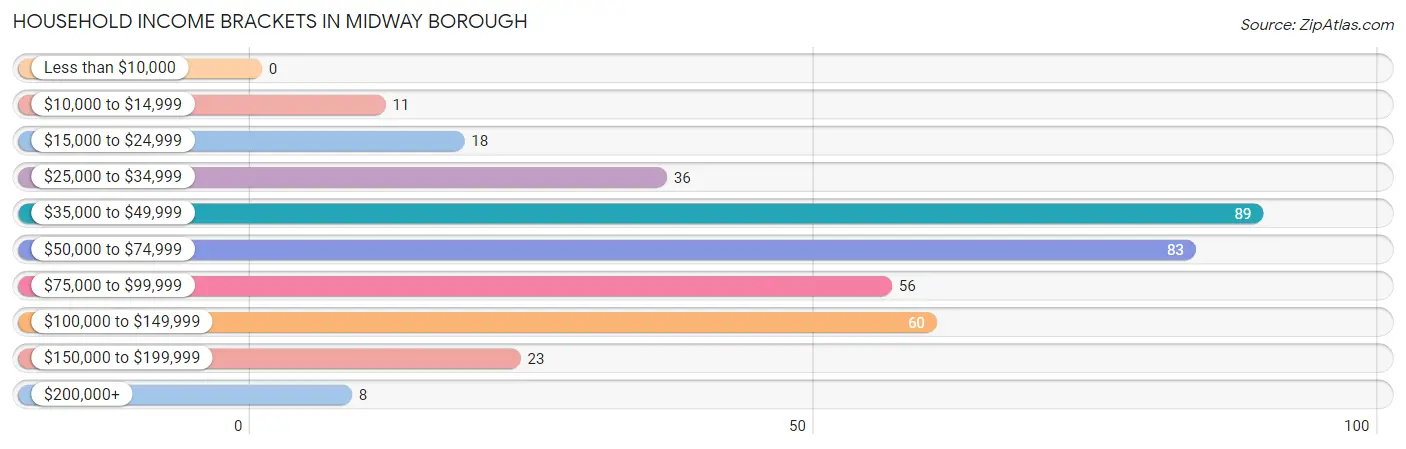
| Income Bracket | # Households | % Households |
| Less than $10,000 | 0 | 0.0% |
| $10,000 to $14,999 | 11 | 2.9% |
| $15,000 to $24,999 | 18 | 4.7% |
| $25,000 to $34,999 | 36 | 9.4% |
| $35,000 to $49,999 | 89 | 23.2% |
| $50,000 to $74,999 | 83 | 21.6% |
| $75,000 to $99,999 | 56 | 14.6% |
| $100,000 to $149,999 | 60 | 15.6% |
| $150,000 to $199,999 | 23 | 6.0% |
| $200,000+ | 8 | 2.1% |
Household Income by Householder Age in Midway borough
The median household income in Midway borough is $57,981, with the highest median household income of $85,000 found in the 45 to 64 years age bracket for the primary householder. A total of 106 households (27.6%) fall into this category. Meanwhile, the 15 to 24 years age bracket for the primary householder has the lowest median household income of $0, with 10 households (2.6%) in this group.
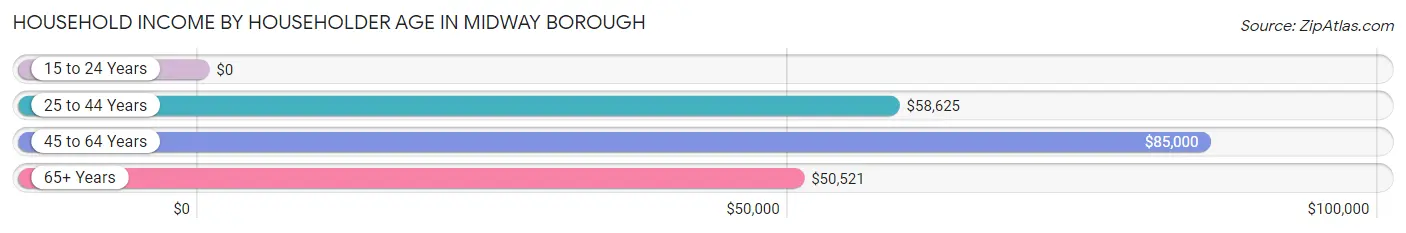
| Income Bracket | # Households | Median Income |
| 15 to 24 Years | 10 (2.6%) | $0 |
| 25 to 44 Years | 99 (25.8%) | $58,625 |
| 45 to 64 Years | 106 (27.6%) | $85,000 |
| 65+ Years | 169 (44.0%) | $50,521 |
| Total | 384 (100.0%) | $57,981 |
Poverty in Midway borough
Income Below Poverty by Sex and Age in Midway borough
With 10.8% poverty level for males and 9.8% for females among the residents of Midway borough, 75 year old and over males and 18 to 24 year old females are the most vulnerable to poverty, with 9 males (50.0%) and 11 females (37.9%) in their respective age groups living below the poverty level.
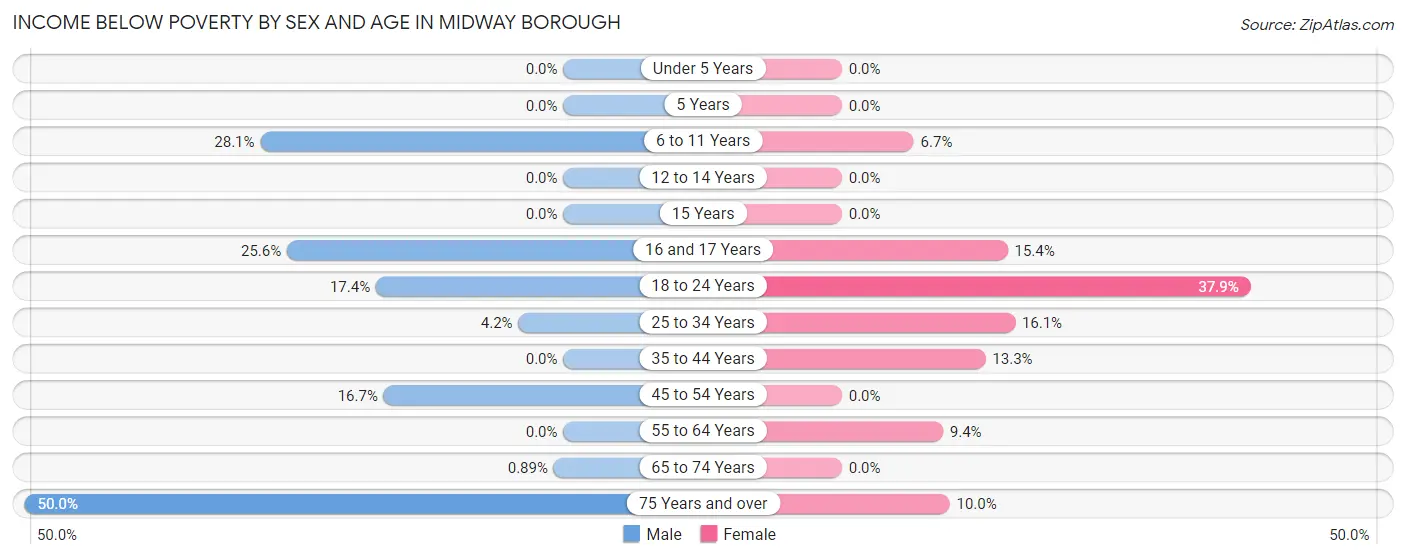
| Age Bracket | Male | Female |
| Under 5 Years | 0 (0.0%) | 0 (0.0%) |
| 5 Years | 0 (0.0%) | 0 (0.0%) |
| 6 to 11 Years | 9 (28.1%) | 2 (6.7%) |
| 12 to 14 Years | 0 (0.0%) | 0 (0.0%) |
| 15 Years | 0 (0.0%) | 0 (0.0%) |
| 16 and 17 Years | 10 (25.6%) | 2 (15.4%) |
| 18 to 24 Years | 12 (17.4%) | 11 (37.9%) |
| 25 to 34 Years | 2 (4.2%) | 9 (16.1%) |
| 35 to 44 Years | 0 (0.0%) | 8 (13.3%) |
| 45 to 54 Years | 10 (16.7%) | 0 (0.0%) |
| 55 to 64 Years | 0 (0.0%) | 6 (9.4%) |
| 65 to 74 Years | 1 (0.9%) | 0 (0.0%) |
| 75 Years and over | 9 (50.0%) | 2 (10.0%) |
| Total | 53 (10.8%) | 40 (9.8%) |
Income Above Poverty by Sex and Age in Midway borough
According to the poverty statistics in Midway borough, males aged under 5 years and females aged under 5 years are the age groups that are most secure financially, with 100.0% of males and 100.0% of females in these age groups living above the poverty line.
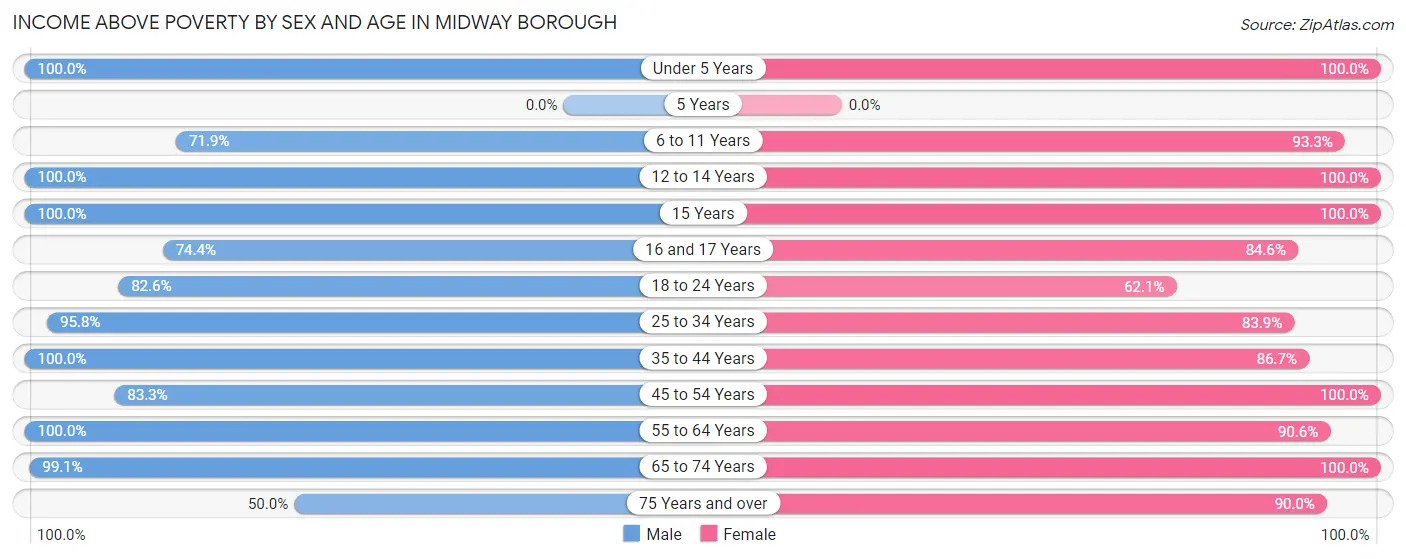
| Age Bracket | Male | Female |
| Under 5 Years | 22 (100.0%) | 2 (100.0%) |
| 5 Years | 0 (0.0%) | 0 (0.0%) |
| 6 to 11 Years | 23 (71.9%) | 28 (93.3%) |
| 12 to 14 Years | 4 (100.0%) | 7 (100.0%) |
| 15 Years | 3 (100.0%) | 4 (100.0%) |
| 16 and 17 Years | 29 (74.4%) | 11 (84.6%) |
| 18 to 24 Years | 57 (82.6%) | 18 (62.1%) |
| 25 to 34 Years | 46 (95.8%) | 47 (83.9%) |
| 35 to 44 Years | 27 (100.0%) | 52 (86.7%) |
| 45 to 54 Years | 50 (83.3%) | 30 (100.0%) |
| 55 to 64 Years | 58 (100.0%) | 58 (90.6%) |
| 65 to 74 Years | 111 (99.1%) | 95 (100.0%) |
| 75 Years and over | 9 (50.0%) | 18 (90.0%) |
| Total | 439 (89.2%) | 370 (90.2%) |
Income Below Poverty Among Married-Couple Families in Midway borough
The poverty statistics for married-couple families in Midway borough show that 1.8% or 3 of the total 168 families live below the poverty line. Families with no children have the highest poverty rate of 2.3%, comprising of 3 families. On the other hand, families with 1 or 2 children have the lowest poverty rate of 0.0%, which includes 0 families.
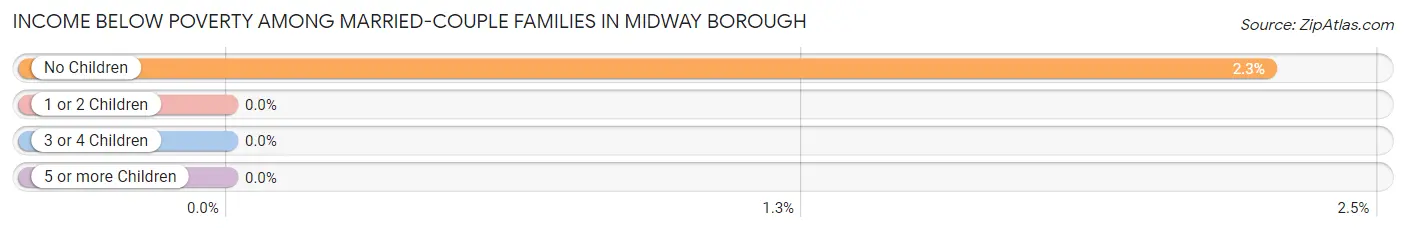
| Children | Above Poverty | Below Poverty |
| No Children | 130 (97.7%) | 3 (2.3%) |
| 1 or 2 Children | 23 (100.0%) | 0 (0.0%) |
| 3 or 4 Children | 12 (100.0%) | 0 (0.0%) |
| 5 or more Children | 0 (0.0%) | 0 (0.0%) |
| Total | 165 (98.2%) | 3 (1.8%) |
Income Below Poverty Among Single-Parent Households in Midway borough
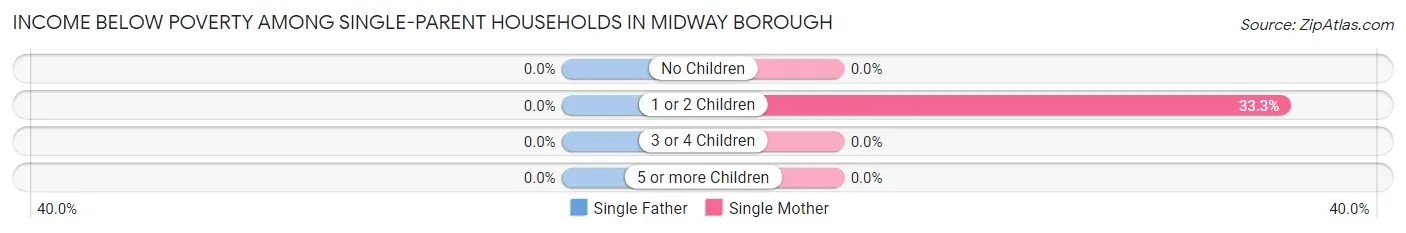
| Children | Single Father | Single Mother |
| No Children | 0 (0.0%) | 0 (0.0%) |
| 1 or 2 Children | 0 (0.0%) | 9 (33.3%) |
| 3 or 4 Children | 0 (0.0%) | 0 (0.0%) |
| 5 or more Children | 0 (0.0%) | 0 (0.0%) |
| Total | 0 (0.0%) | 9 (17.0%) |
Income Below Poverty Among Married-Couple vs Single-Parent Households in Midway borough
The poverty data for Midway borough shows that 3 of the married-couple family households (1.8%) and 9 of the single-parent households (10.8%) are living below the poverty level. Within the married-couple family households, those with no children have the highest poverty rate, with 3 households (2.3%) falling below the poverty line. Among the single-parent households, those with 1 or 2 children have the highest poverty rate, with 9 household (17.6%) living below poverty.
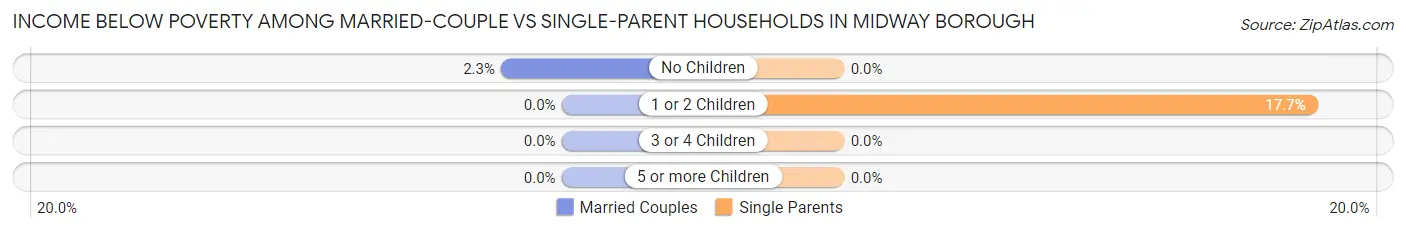
| Children | Married-Couple Families | Single-Parent Households |
| No Children | 3 (2.3%) | 0 (0.0%) |
| 1 or 2 Children | 0 (0.0%) | 9 (17.6%) |
| 3 or 4 Children | 0 (0.0%) | 0 (0.0%) |
| 5 or more Children | 0 (0.0%) | 0 (0.0%) |
| Total | 3 (1.8%) | 9 (10.8%) |
Race in Midway borough
The most populous races in Midway borough are White / Caucasian (886 | 96.4%), Two or more Races (27 | 2.9%), and Black / African American (6 | 0.6%).
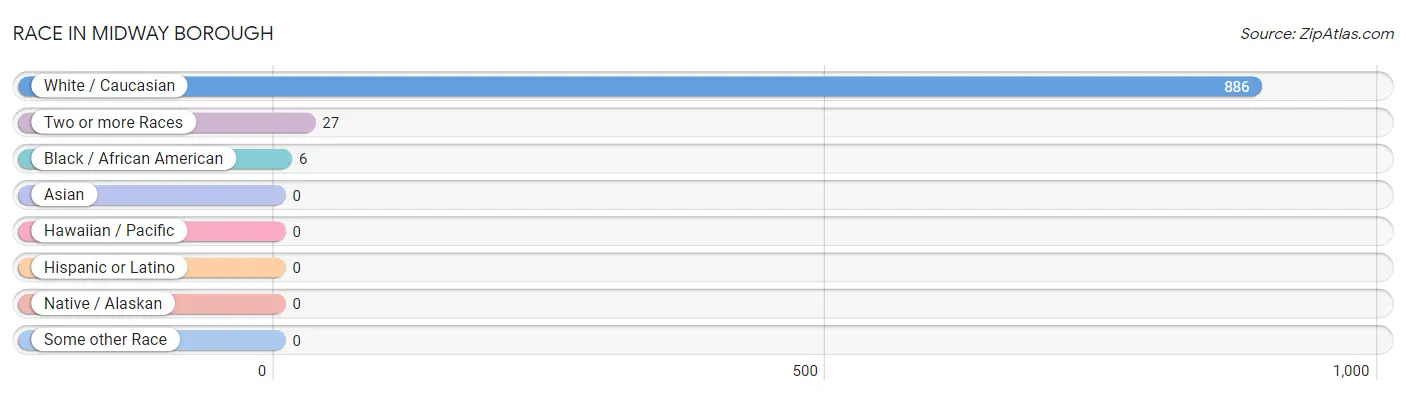
| Race | # Population | % Population |
| Asian | 0 | 0.0% |
| Black / African American | 6 | 0.6% |
| Hawaiian / Pacific | 0 | 0.0% |
| Hispanic or Latino | 0 | 0.0% |
| Native / Alaskan | 0 | 0.0% |
| White / Caucasian | 886 | 96.4% |
| Two or more Races | 27 | 2.9% |
| Some other Race | 0 | 0.0% |
| Total | 919 | 100.0% |
Ancestry in Midway borough
The most populous ancestries reported in Midway borough are German (291 | 31.7%), Irish (159 | 17.3%), Italian (94 | 10.2%), Polish (81 | 8.8%), and English (69 | 7.5%), together accounting for 75.5% of all Midway borough residents.
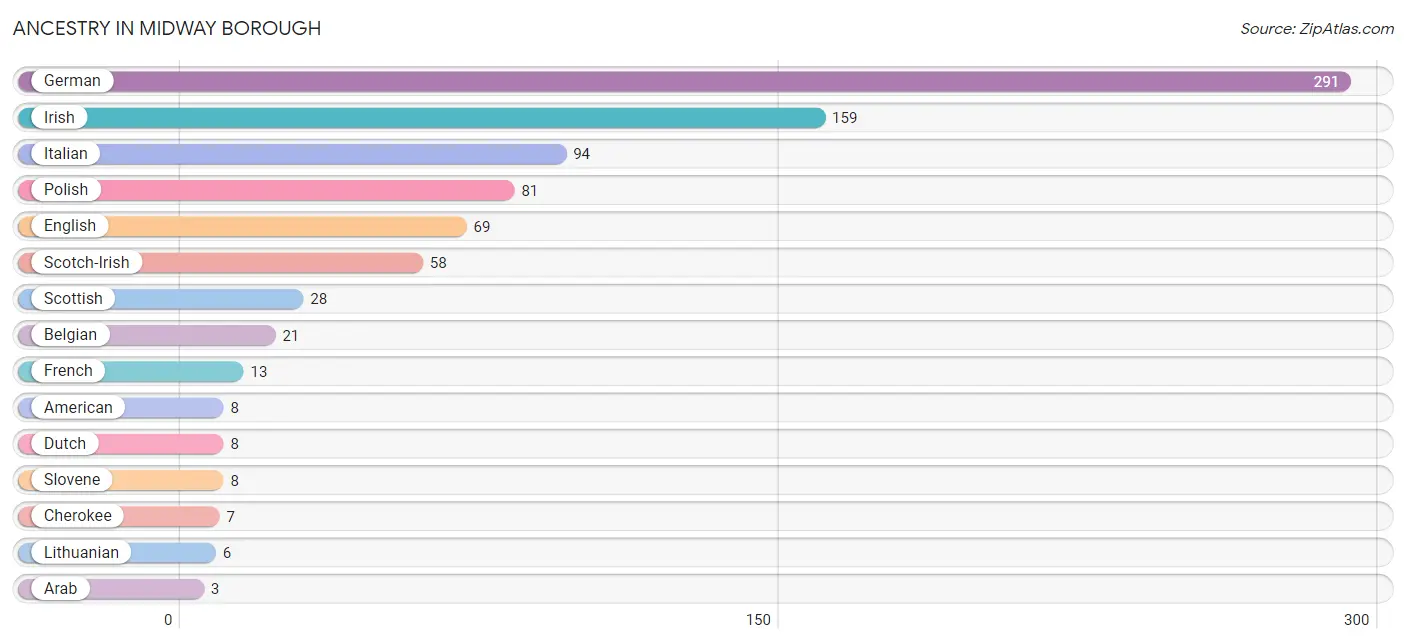
| Ancestry | # Population | % Population |
| American | 8 | 0.9% |
| Arab | 3 | 0.3% |
| Austrian | 3 | 0.3% |
| Belgian | 21 | 2.3% |
| Cherokee | 7 | 0.8% |
| Dutch | 8 | 0.9% |
| English | 69 | 7.5% |
| French | 13 | 1.4% |
| German | 291 | 31.7% |
| Irish | 159 | 17.3% |
| Italian | 94 | 10.2% |
| Lebanese | 1 | 0.1% |
| Lithuanian | 6 | 0.6% |
| Polish | 81 | 8.8% |
| Russian | 2 | 0.2% |
| Scotch-Irish | 58 | 6.3% |
| Scottish | 28 | 3.0% |
| Slavic | 3 | 0.3% |
| Slovak | 3 | 0.3% |
| Slovene | 8 | 0.9% |
| Swedish | 2 | 0.2% |
| Syrian | 2 | 0.2% |
| Ukrainian | 3 | 0.3% | View All 23 Rows |
Immigrants in Midway borough

| Immigration Origin | # Population | % Population | View All 0 Rows |
Sex and Age in Midway borough
Sex and Age in Midway borough
The most populous age groups in Midway borough are 15 to 19 Years (64 | 12.8%) for men and 65 to 69 Years (85 | 20.2%) for women.
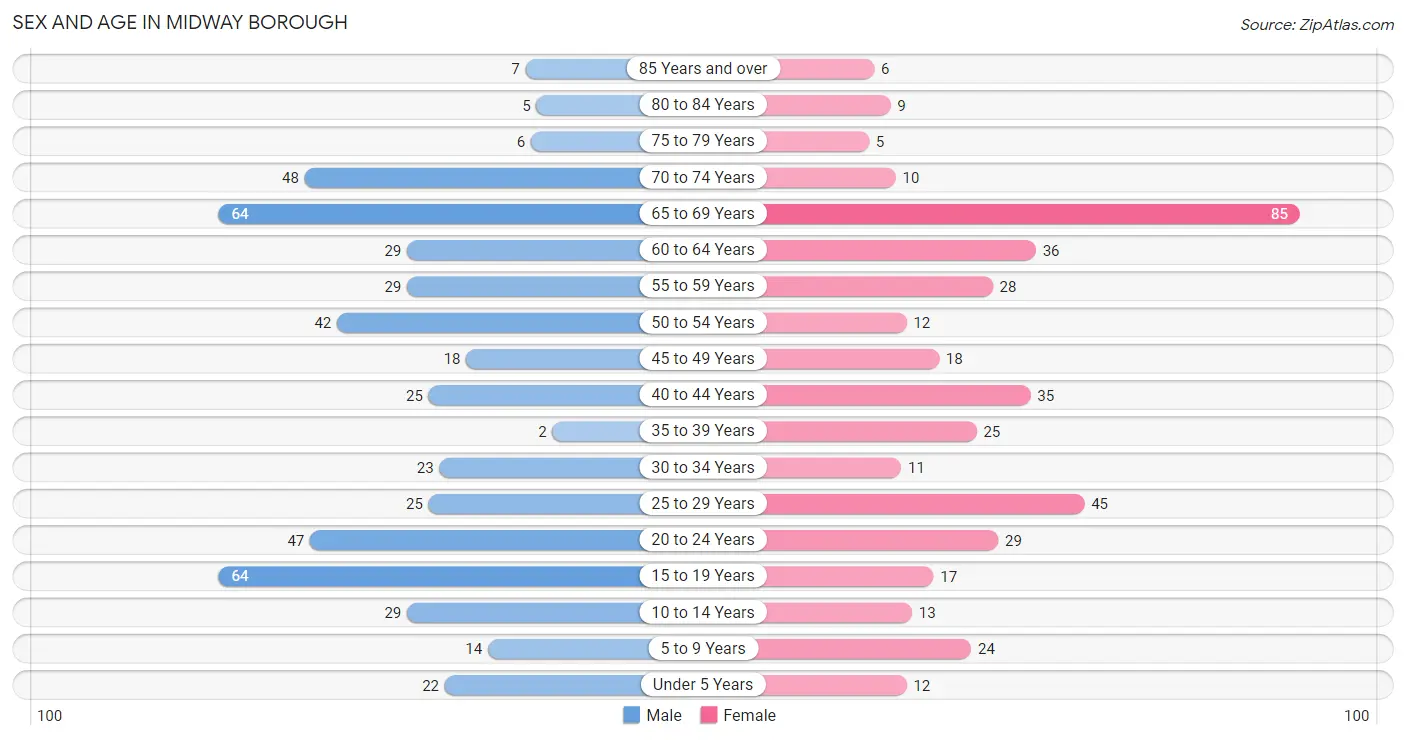
| Age Bracket | Male | Female |
| Under 5 Years | 22 (4.4%) | 12 (2.9%) |
| 5 to 9 Years | 14 (2.8%) | 24 (5.7%) |
| 10 to 14 Years | 29 (5.8%) | 13 (3.1%) |
| 15 to 19 Years | 64 (12.8%) | 17 (4.1%) |
| 20 to 24 Years | 47 (9.4%) | 29 (6.9%) |
| 25 to 29 Years | 25 (5.0%) | 45 (10.7%) |
| 30 to 34 Years | 23 (4.6%) | 11 (2.6%) |
| 35 to 39 Years | 2 (0.4%) | 25 (5.9%) |
| 40 to 44 Years | 25 (5.0%) | 35 (8.3%) |
| 45 to 49 Years | 18 (3.6%) | 18 (4.3%) |
| 50 to 54 Years | 42 (8.4%) | 12 (2.9%) |
| 55 to 59 Years | 29 (5.8%) | 28 (6.7%) |
| 60 to 64 Years | 29 (5.8%) | 36 (8.6%) |
| 65 to 69 Years | 64 (12.8%) | 85 (20.2%) |
| 70 to 74 Years | 48 (9.6%) | 10 (2.4%) |
| 75 to 79 Years | 6 (1.2%) | 5 (1.2%) |
| 80 to 84 Years | 5 (1.0%) | 9 (2.1%) |
| 85 Years and over | 7 (1.4%) | 6 (1.4%) |
| Total | 499 (100.0%) | 420 (100.0%) |
Families and Households in Midway borough
Median Family Size in Midway borough
The median family size in Midway borough is 2.83 persons per family, with married-couple families (168 | 66.9%) accounting for the largest median family size of 2.97 persons per family. On the other hand, single male/father families (30 | 11.9%) represent the smallest median family size with 2.53 persons per family.
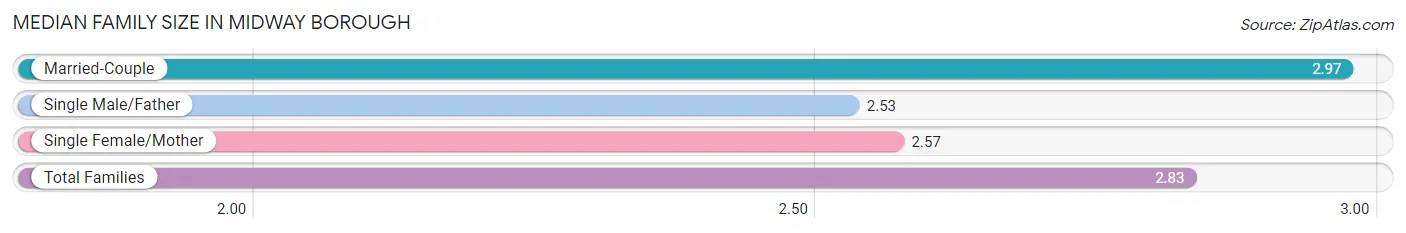
| Family Type | # Families | Family Size |
| Married-Couple | 168 (66.9%) | 2.97 |
| Single Male/Father | 30 (11.9%) | 2.53 |
| Single Female/Mother | 53 (21.1%) | 2.57 |
| Total Families | 251 (100.0%) | 2.83 |
Median Household Size in Midway borough
The median household size in Midway borough is 2.39 persons per household, with married-couple households (168 | 43.8%) accounting for the largest median household size of 2.97 persons per household. non-family households (133 | 34.6%) represent the smallest median household size with 1.43 persons per household.
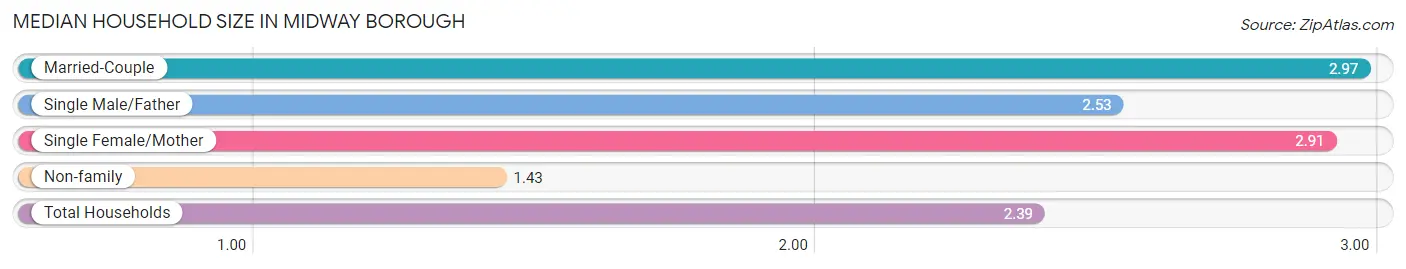
| Household Type | # Households | Household Size |
| Married-Couple | 168 (43.8%) | 2.97 |
| Single Male/Father | 30 (7.8%) | 2.53 |
| Single Female/Mother | 53 (13.8%) | 2.91 |
| Non-family | 133 (34.6%) | 1.43 |
| Total Households | 384 (100.0%) | 2.39 |
Household Size by Marriage Status in Midway borough
Out of a total of 384 households in Midway borough, 251 (65.4%) are family households, while 133 (34.6%) are nonfamily households. The most numerous type of family households are 2-person households, comprising 142, and the most common type of nonfamily households are 1-person households, comprising 103.
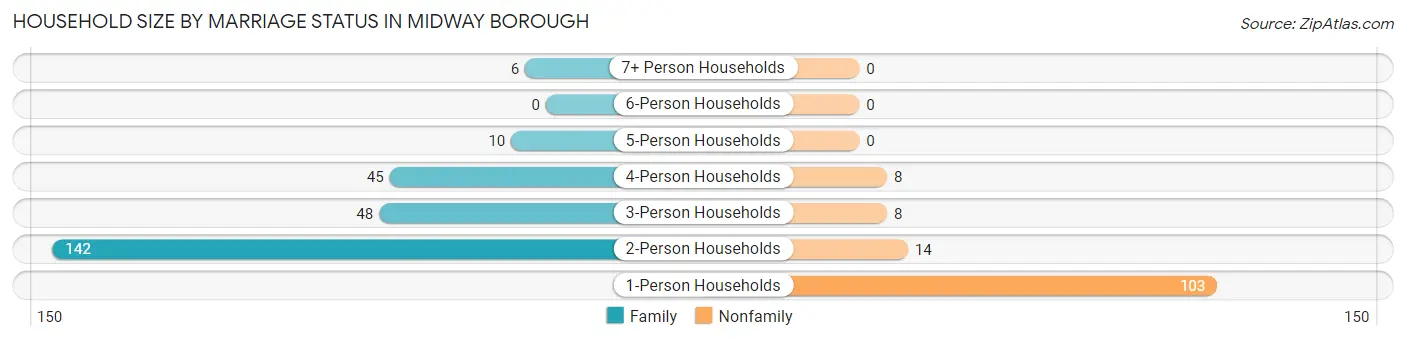
| Household Size | Family Households | Nonfamily Households |
| 1-Person Households | - | 103 (26.8%) |
| 2-Person Households | 142 (37.0%) | 14 (3.6%) |
| 3-Person Households | 48 (12.5%) | 8 (2.1%) |
| 4-Person Households | 45 (11.7%) | 8 (2.1%) |
| 5-Person Households | 10 (2.6%) | 0 (0.0%) |
| 6-Person Households | 0 (0.0%) | 0 (0.0%) |
| 7+ Person Households | 6 (1.6%) | 0 (0.0%) |
| Total | 251 (65.4%) | 133 (34.6%) |
Female Fertility in Midway borough
Fertility by Age in Midway borough
Average fertility rate in Midway borough is 11.0 births per 1,000 women. Women in the age bracket of 35 to 50 years have the highest fertility rate with 23.0 births per 1,000 women. Women in the age bracket of 35 to 50 years acount for 100.0% of all women with births.
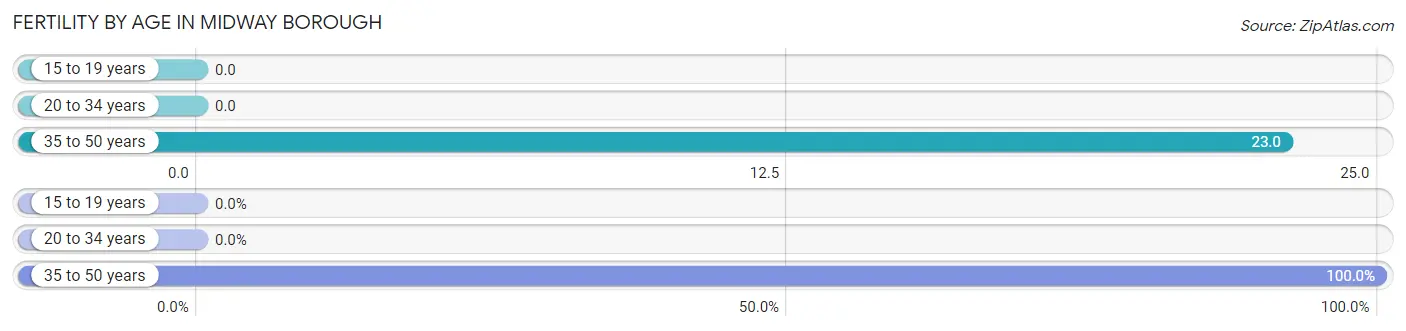
| Age Bracket | Women with Births | Births / 1,000 Women |
| 15 to 19 years | 0 (0.0%) | 0.0 |
| 20 to 34 years | 0 (0.0%) | 0.0 |
| 35 to 50 years | 2 (100.0%) | 23.0 |
| Total | 2 (100.0%) | 11.0 |
Fertility by Age by Marriage Status in Midway borough
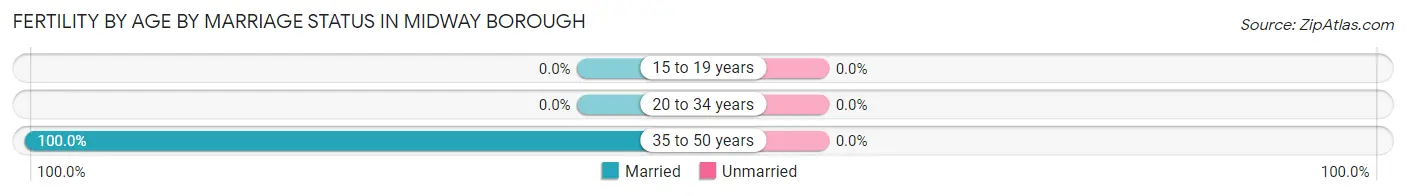
| Age Bracket | Married | Unmarried |
| 15 to 19 years | 0 (0.0%) | 0 (0.0%) |
| 20 to 34 years | 0 (0.0%) | 0 (0.0%) |
| 35 to 50 years | 2 (100.0%) | 0 (0.0%) |
| Total | 2 (100.0%) | 0 (0.0%) |
Fertility by Education in Midway borough
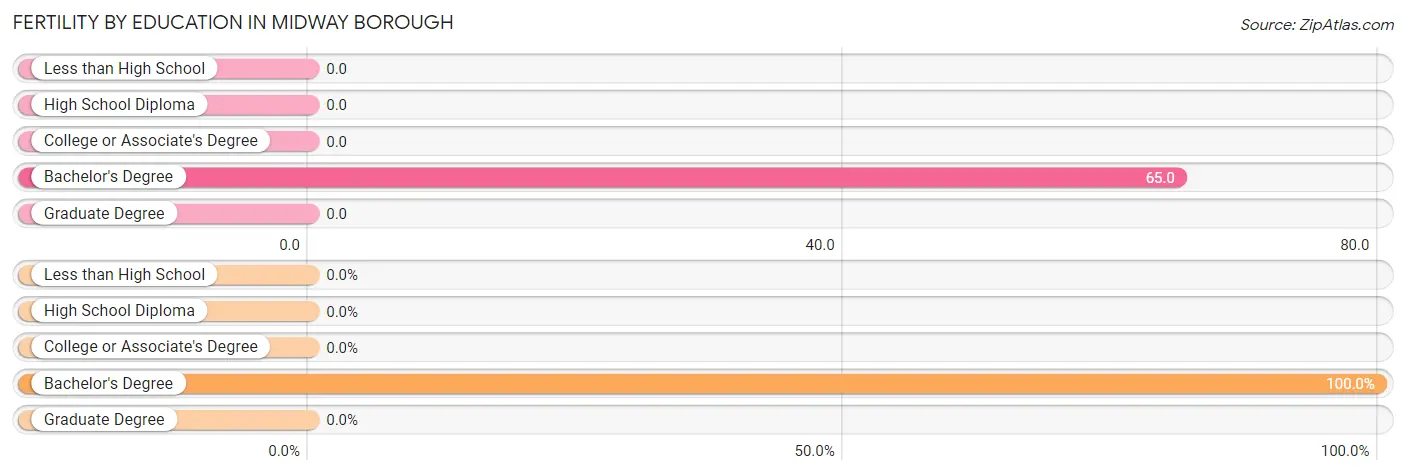
| Educational Attainment | Women with Births | Births / 1,000 Women |
| Less than High School | 0 (0.0%) | 0.0 |
| High School Diploma | 0 (0.0%) | 0.0 |
| College or Associate's Degree | 0 (0.0%) | 0.0 |
| Bachelor's Degree | 2 (100.0%) | 65.0 |
| Graduate Degree | 0 (0.0%) | 0.0 |
| Total | 2 (100.0%) | 11.0 |
Fertility by Education by Marriage Status in Midway borough
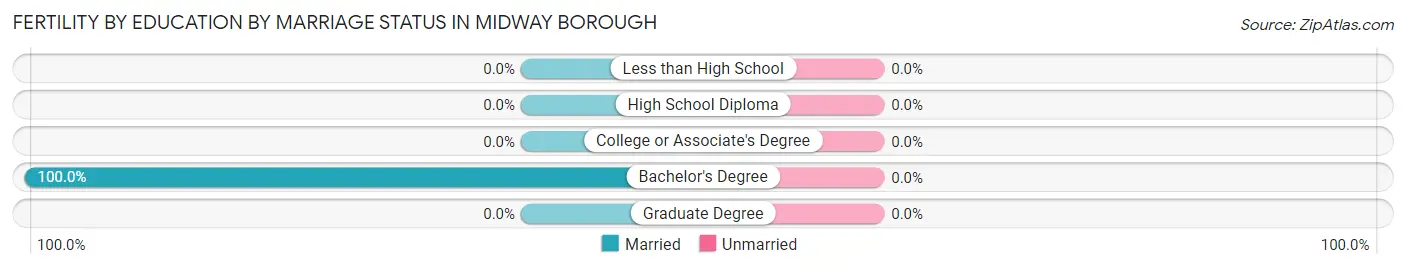
| Educational Attainment | Married | Unmarried |
| Less than High School | 0 (0.0%) | 0 (0.0%) |
| High School Diploma | 0 (0.0%) | 0 (0.0%) |
| College or Associate's Degree | 0 (0.0%) | 0 (0.0%) |
| Bachelor's Degree | 2 (100.0%) | 0 (0.0%) |
| Graduate Degree | 0 (0.0%) | 0 (0.0%) |
| Total | 2 (100.0%) | 0 (0.0%) |
Employment Characteristics in Midway borough
Employment by Class of Employer in Midway borough
Among the 410 employed individuals in Midway borough, private company employees (294 | 71.7%), not-for-profit organizations (40 | 9.8%), and local government employees (32 | 7.8%) make up the most common classes of employment.
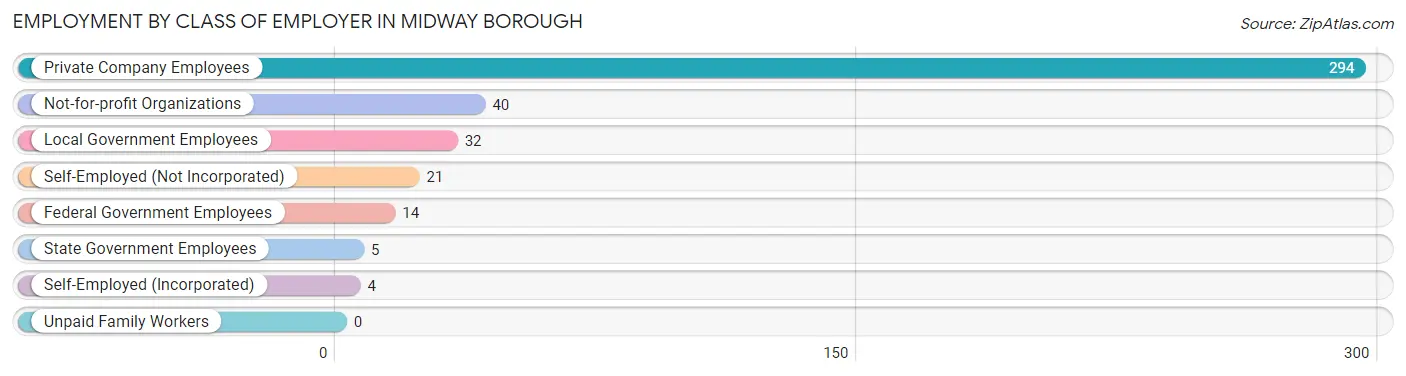
| Employer Class | # Employees | % Employees |
| Private Company Employees | 294 | 71.7% |
| Self-Employed (Incorporated) | 4 | 1.0% |
| Self-Employed (Not Incorporated) | 21 | 5.1% |
| Not-for-profit Organizations | 40 | 9.8% |
| Local Government Employees | 32 | 7.8% |
| State Government Employees | 5 | 1.2% |
| Federal Government Employees | 14 | 3.4% |
| Unpaid Family Workers | 0 | 0.0% |
| Total | 410 | 100.0% |
Employment Status by Age in Midway borough
According to the labor force statistics for Midway borough, out of the total population over 16 years of age (798), 58.5% or 467 individuals are in the labor force, with 11.3% or 53 of them unemployed. The age group with the highest labor force participation rate is 25 to 29 years, with 100.0% or 70 individuals in the labor force. Within the labor force, the 20 to 24 years age range has the highest percentage of unemployed individuals, with 33.9% or 21 of them being unemployed.
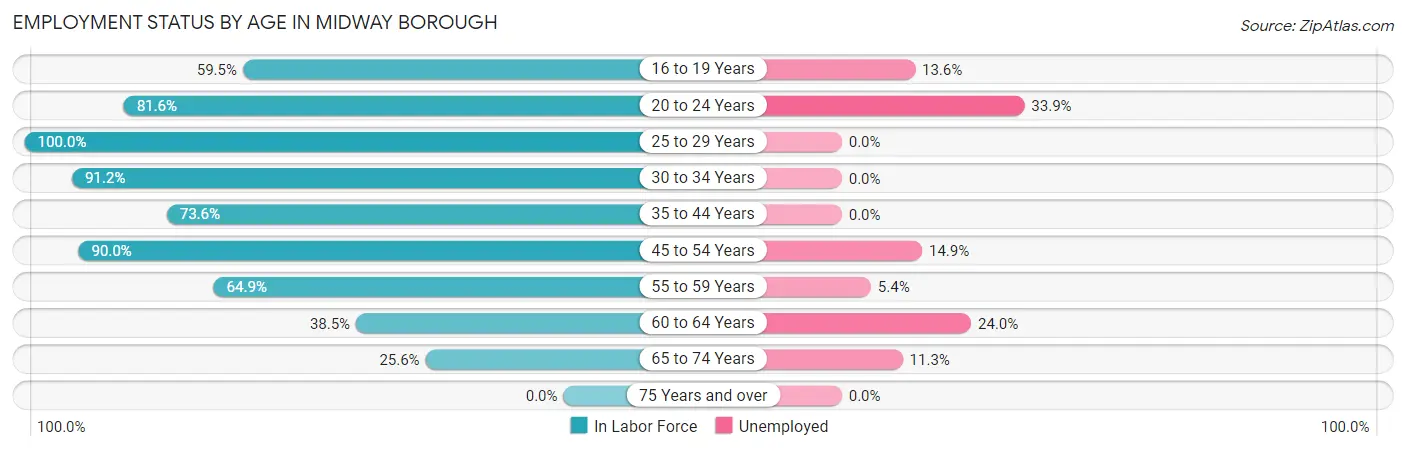
| Age Bracket | In Labor Force | Unemployed |
| 16 to 19 Years | 44 (59.5%) | 6 (13.6%) |
| 20 to 24 Years | 62 (81.6%) | 21 (33.9%) |
| 25 to 29 Years | 70 (100.0%) | 0 (0.0%) |
| 30 to 34 Years | 31 (91.2%) | 0 (0.0%) |
| 35 to 44 Years | 64 (73.6%) | 0 (0.0%) |
| 45 to 54 Years | 81 (90.0%) | 12 (14.9%) |
| 55 to 59 Years | 37 (64.9%) | 2 (5.4%) |
| 60 to 64 Years | 25 (38.5%) | 6 (24.0%) |
| 65 to 74 Years | 53 (25.6%) | 6 (11.3%) |
| 75 Years and over | 0 (0.0%) | 0 (0.0%) |
| Total | 467 (58.5%) | 53 (11.3%) |
Employment Status by Educational Attainment in Midway borough
According to labor force statistics for Midway borough, 76.4% of individuals (308) out of the total population between 25 and 64 years of age (403) are in the labor force, with 6.1% or 19 of them being unemployed. The group with the highest labor force participation rate are those with the educational attainment of college / associate degree, with 89.0% or 97 individuals in the labor force. Within the labor force, individuals with high school diploma education have the highest percentage of unemployment, with 12.4% or 16 of them being unemployed.
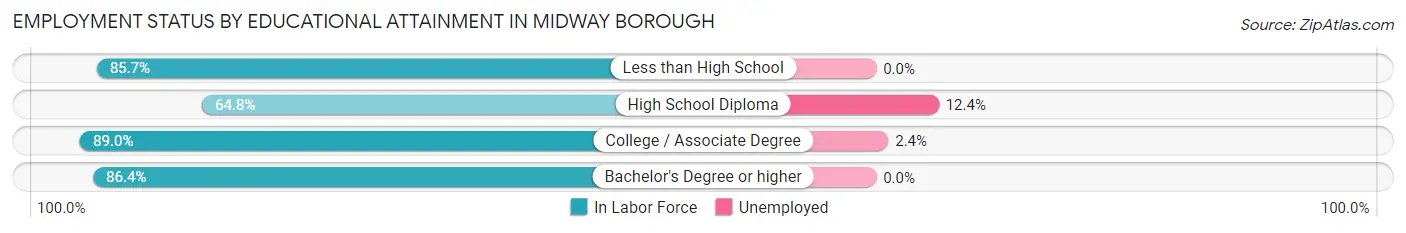
| Educational Attainment | In Labor Force | Unemployed |
| Less than High School | 12 (85.7%) | 0 (0.0%) |
| High School Diploma | 129 (64.8%) | 25 (12.4%) |
| College / Associate Degree | 97 (89.0%) | 3 (2.4%) |
| Bachelor's Degree or higher | 70 (86.4%) | 0 (0.0%) |
| Total | 308 (76.4%) | 25 (6.1%) |
Employment Occupations by Sex in Midway borough
Management, Business, Science and Arts Occupations
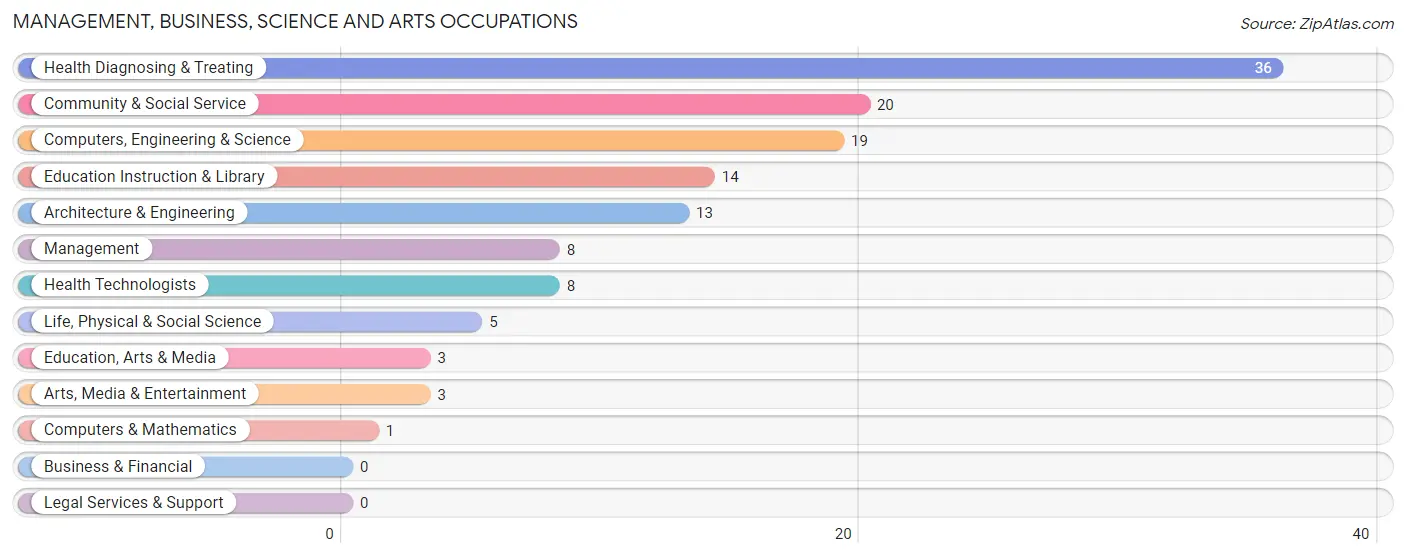
The most common Management, Business, Science and Arts occupations in Midway borough are Health Diagnosing & Treating (36 | 9.0%), Community & Social Service (20 | 5.0%), Computers, Engineering & Science (19 | 4.7%), Education Instruction & Library (14 | 3.5%), and Architecture & Engineering (13 | 3.2%).
Management, Business, Science and Arts Occupations by Sex
Within the Management, Business, Science and Arts occupations in Midway borough, the most male-oriented occupations are Life, Physical & Social Science (100.0%), Education, Arts & Media (100.0%), and Computers, Engineering & Science (78.9%), while the most female-oriented occupations are Computers & Mathematics (100.0%), Education Instruction & Library (100.0%), and Arts, Media & Entertainment (100.0%).
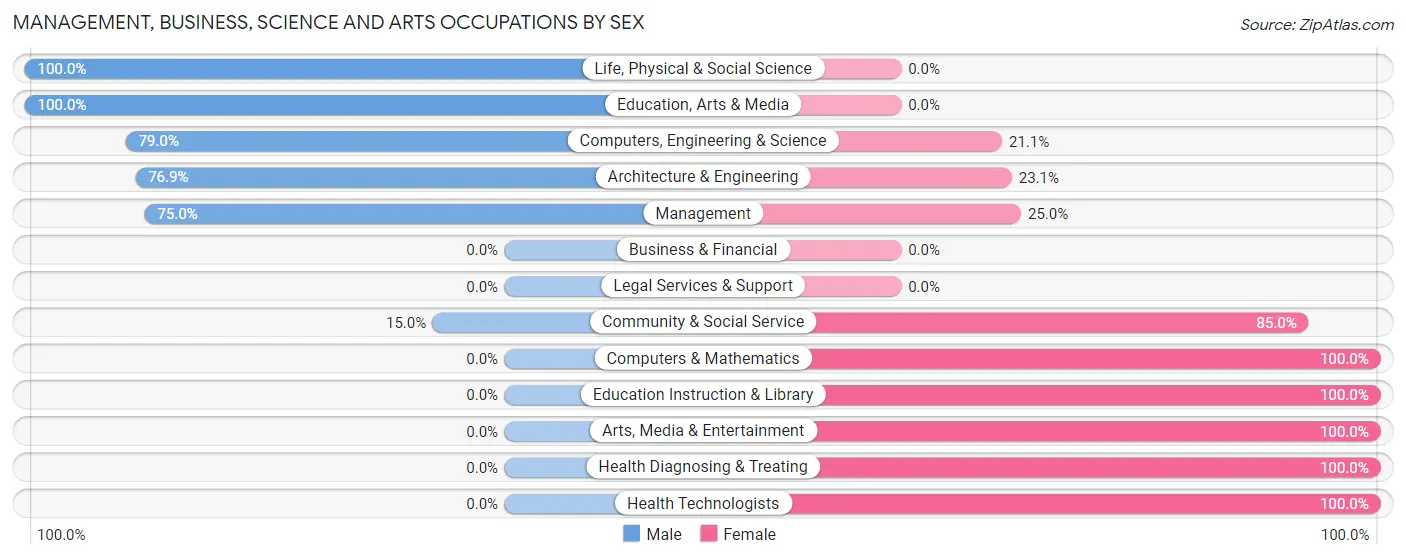
| Occupation | Male | Female |
| Management | 6 (75.0%) | 2 (25.0%) |
| Business & Financial | 0 (0.0%) | 0 (0.0%) |
| Computers, Engineering & Science | 15 (78.9%) | 4 (21.0%) |
| Computers & Mathematics | 0 (0.0%) | 1 (100.0%) |
| Architecture & Engineering | 10 (76.9%) | 3 (23.1%) |
| Life, Physical & Social Science | 5 (100.0%) | 0 (0.0%) |
| Community & Social Service | 3 (15.0%) | 17 (85.0%) |
| Education, Arts & Media | 3 (100.0%) | 0 (0.0%) |
| Legal Services & Support | 0 (0.0%) | 0 (0.0%) |
| Education Instruction & Library | 0 (0.0%) | 14 (100.0%) |
| Arts, Media & Entertainment | 0 (0.0%) | 3 (100.0%) |
| Health Diagnosing & Treating | 0 (0.0%) | 36 (100.0%) |
| Health Technologists | 0 (0.0%) | 8 (100.0%) |
| Total (Category) | 24 (28.9%) | 59 (71.1%) |
| Total (Overall) | 220 (54.7%) | 182 (45.3%) |
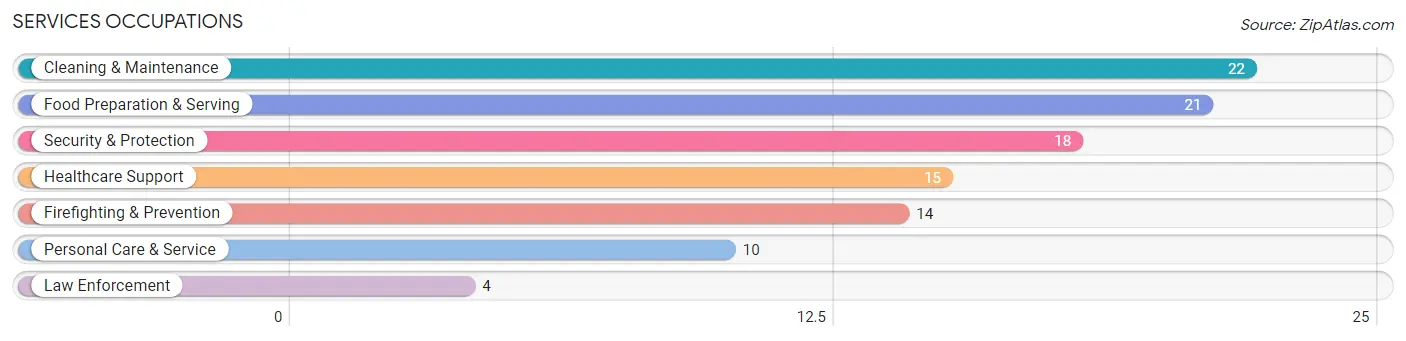
Services Occupations
The most common Services occupations in Midway borough are Cleaning & Maintenance (22 | 5.5%), Food Preparation & Serving (21 | 5.2%), Security & Protection (18 | 4.5%), Healthcare Support (15 | 3.7%), and Firefighting & Prevention (14 | 3.5%).
Services Occupations by Sex
Within the Services occupations in Midway borough, the most male-oriented occupations are Law Enforcement (100.0%), Security & Protection (77.8%), and Firefighting & Prevention (71.4%), while the most female-oriented occupations are Personal Care & Service (100.0%), Food Preparation & Serving (76.2%), and Healthcare Support (60.0%).
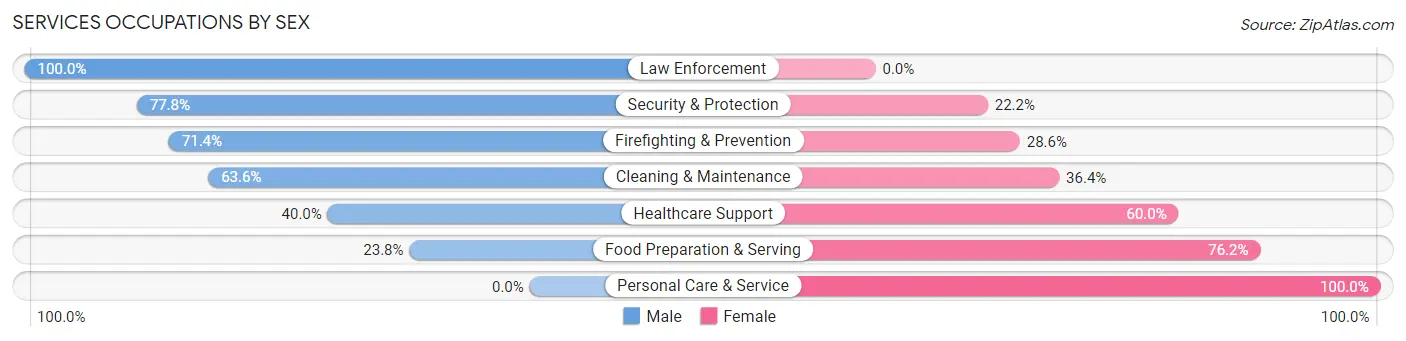
| Occupation | Male | Female |
| Healthcare Support | 6 (40.0%) | 9 (60.0%) |
| Security & Protection | 14 (77.8%) | 4 (22.2%) |
| Firefighting & Prevention | 10 (71.4%) | 4 (28.6%) |
| Law Enforcement | 4 (100.0%) | 0 (0.0%) |
| Food Preparation & Serving | 5 (23.8%) | 16 (76.2%) |
| Cleaning & Maintenance | 14 (63.6%) | 8 (36.4%) |
| Personal Care & Service | 0 (0.0%) | 10 (100.0%) |
| Total (Category) | 39 (45.4%) | 47 (54.6%) |
| Total (Overall) | 220 (54.7%) | 182 (45.3%) |
Sales and Office Occupations
The most common Sales and Office occupations in Midway borough are Sales & Related (55 | 13.7%), and Office & Administration (22 | 5.5%).

Sales and Office Occupations by Sex
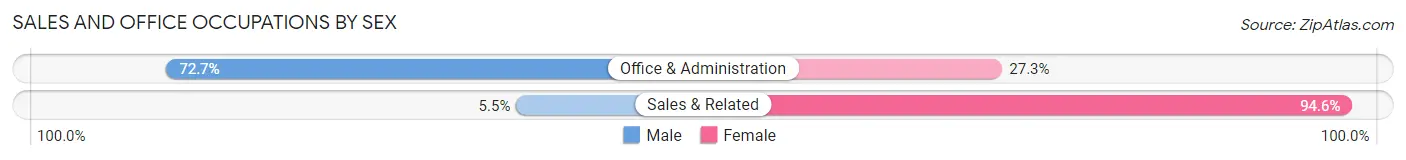
| Occupation | Male | Female |
| Sales & Related | 3 (5.4%) | 52 (94.6%) |
| Office & Administration | 16 (72.7%) | 6 (27.3%) |
| Total (Category) | 19 (24.7%) | 58 (75.3%) |
| Total (Overall) | 220 (54.7%) | 182 (45.3%) |
Natural Resources, Construction and Maintenance Occupations
The most common Natural Resources, Construction and Maintenance occupations in Midway borough are Construction & Extraction (43 | 10.7%), and Installation, Maintenance & Repair (10 | 2.5%).
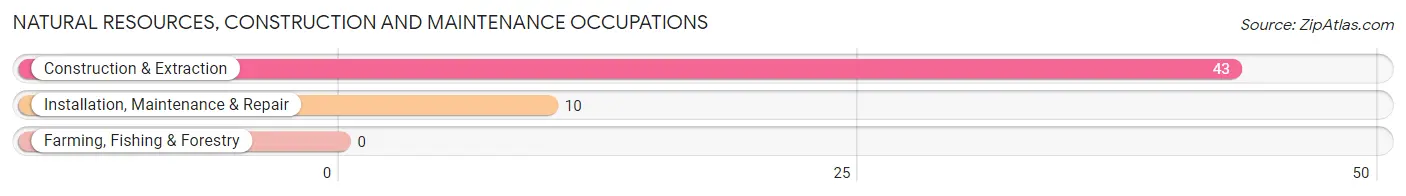
Natural Resources, Construction and Maintenance Occupations by Sex

| Occupation | Male | Female |
| Farming, Fishing & Forestry | 0 (0.0%) | 0 (0.0%) |
| Construction & Extraction | 38 (88.4%) | 5 (11.6%) |
| Installation, Maintenance & Repair | 10 (100.0%) | 0 (0.0%) |
| Total (Category) | 48 (90.6%) | 5 (9.4%) |
| Total (Overall) | 220 (54.7%) | 182 (45.3%) |
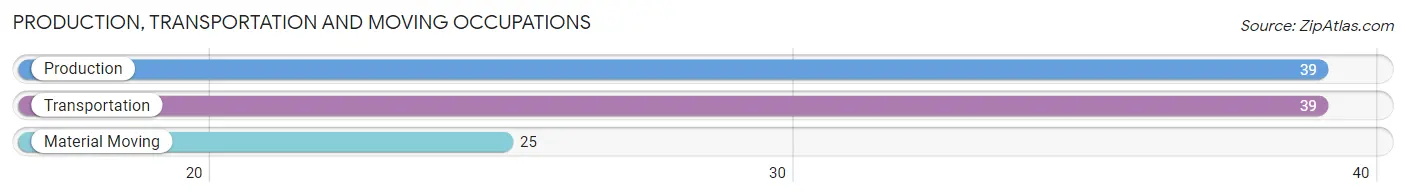
Production, Transportation and Moving Occupations
The most common Production, Transportation and Moving occupations in Midway borough are Production (39 | 9.7%), Transportation (39 | 9.7%), and Material Moving (25 | 6.2%).
Production, Transportation and Moving Occupations by Sex
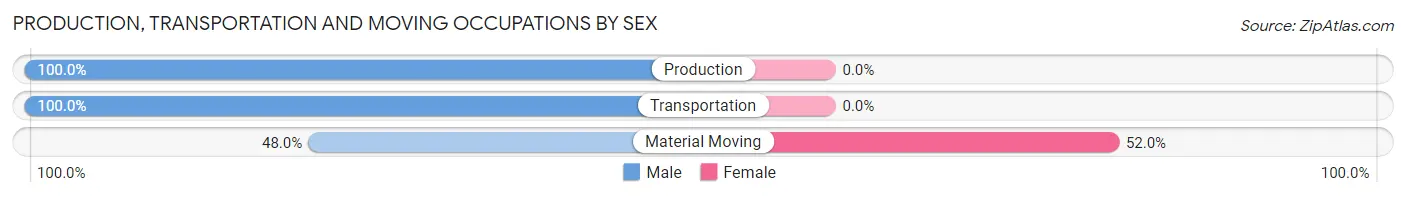
| Occupation | Male | Female |
| Production | 39 (100.0%) | 0 (0.0%) |
| Transportation | 39 (100.0%) | 0 (0.0%) |
| Material Moving | 12 (48.0%) | 13 (52.0%) |
| Total (Category) | 90 (87.4%) | 13 (12.6%) |
| Total (Overall) | 220 (54.7%) | 182 (45.3%) |
Employment Industries by Sex in Midway borough
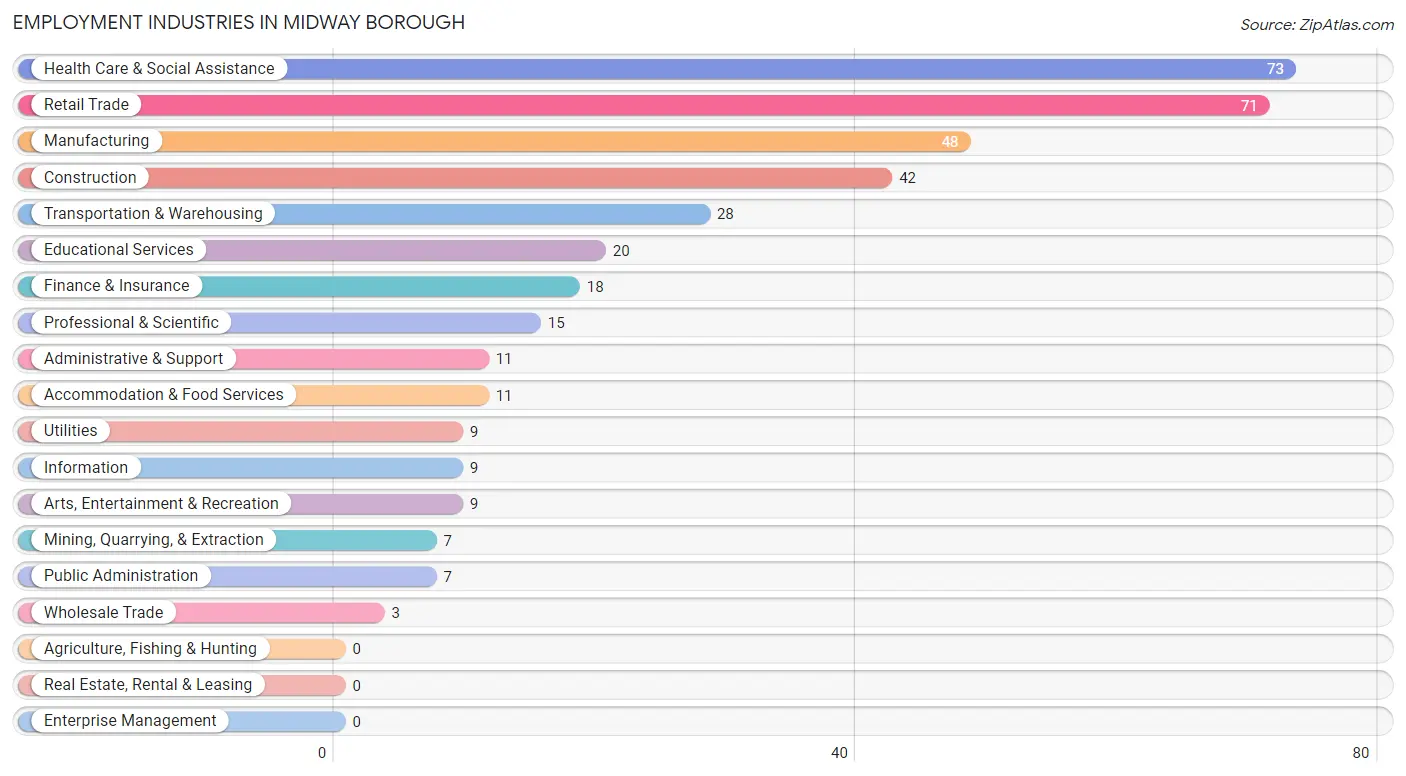
Employment Industries in Midway borough
The major employment industries in Midway borough include Health Care & Social Assistance (73 | 18.2%), Retail Trade (71 | 17.7%), Manufacturing (48 | 11.9%), Construction (42 | 10.4%), and Transportation & Warehousing (28 | 7.0%).
Employment Industries by Sex in Midway borough
The Midway borough industries that see more men than women are Mining, Quarrying, & Extraction (100.0%), Wholesale Trade (100.0%), and Utilities (100.0%), whereas the industries that tend to have a higher number of women are Information (100.0%), Educational Services (100.0%), and Health Care & Social Assistance (78.1%).
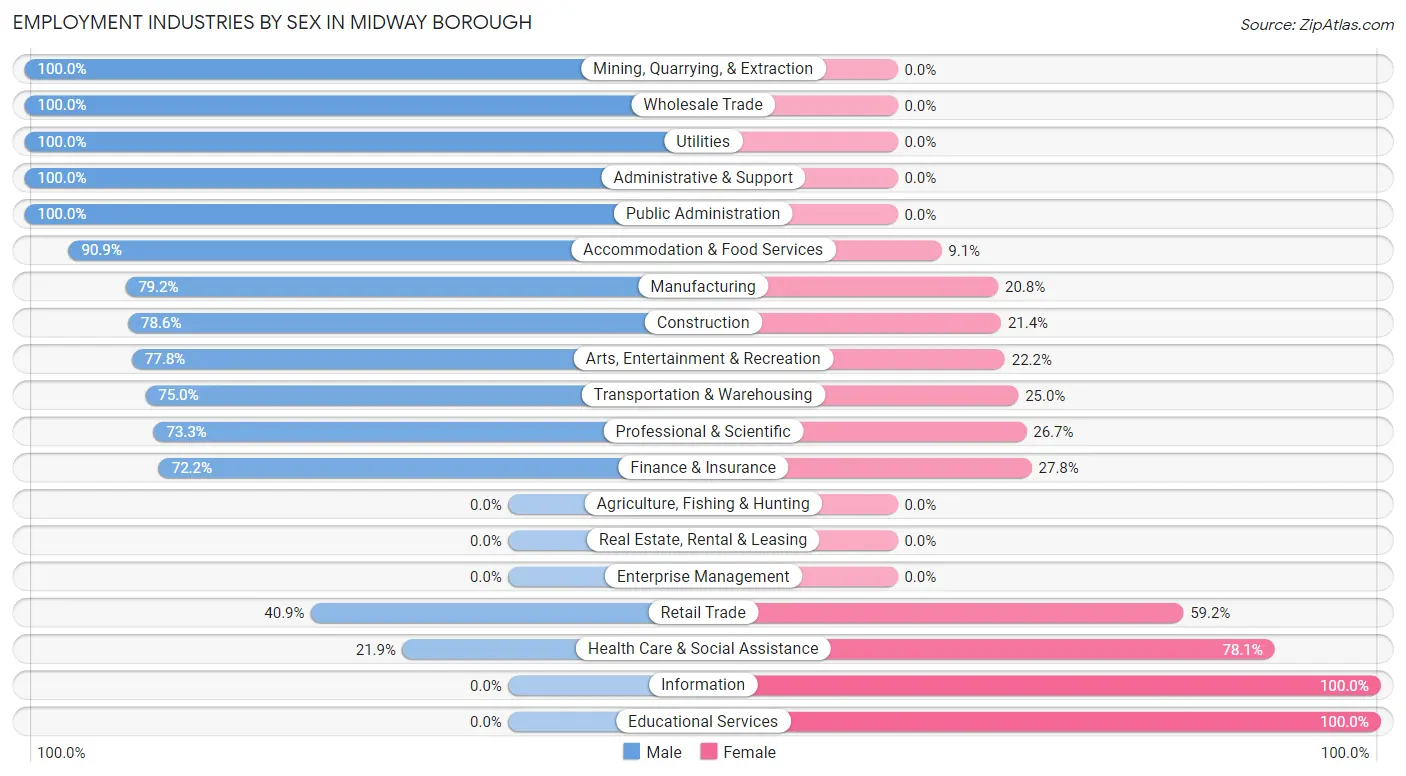
| Industry | Male | Female |
| Agriculture, Fishing & Hunting | 0 (0.0%) | 0 (0.0%) |
| Mining, Quarrying, & Extraction | 7 (100.0%) | 0 (0.0%) |
| Construction | 33 (78.6%) | 9 (21.4%) |
| Manufacturing | 38 (79.2%) | 10 (20.8%) |
| Wholesale Trade | 3 (100.0%) | 0 (0.0%) |
| Retail Trade | 29 (40.8%) | 42 (59.2%) |
| Transportation & Warehousing | 21 (75.0%) | 7 (25.0%) |
| Utilities | 9 (100.0%) | 0 (0.0%) |
| Information | 0 (0.0%) | 9 (100.0%) |
| Finance & Insurance | 13 (72.2%) | 5 (27.8%) |
| Real Estate, Rental & Leasing | 0 (0.0%) | 0 (0.0%) |
| Professional & Scientific | 11 (73.3%) | 4 (26.7%) |
| Enterprise Management | 0 (0.0%) | 0 (0.0%) |
| Administrative & Support | 11 (100.0%) | 0 (0.0%) |
| Educational Services | 0 (0.0%) | 20 (100.0%) |
| Health Care & Social Assistance | 16 (21.9%) | 57 (78.1%) |
| Arts, Entertainment & Recreation | 7 (77.8%) | 2 (22.2%) |
| Accommodation & Food Services | 10 (90.9%) | 1 (9.1%) |
| Public Administration | 7 (100.0%) | 0 (0.0%) |
| Total | 220 (54.7%) | 182 (45.3%) |
Education in Midway borough
School Enrollment in Midway borough
The most common levels of schooling among the 183 students in Midway borough are high school (57 | 31.1%), elementary school (53 | 29.0%), and college / undergraduate (39 | 21.3%).
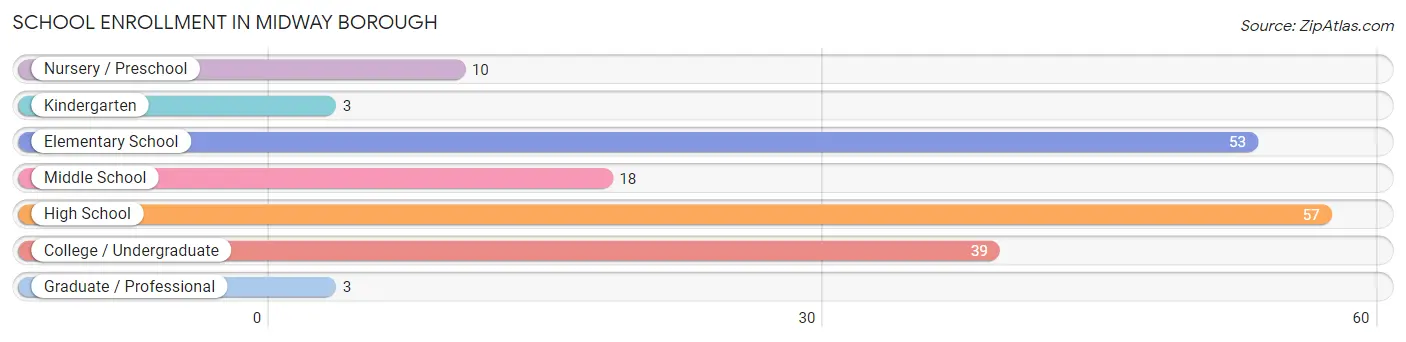
| School Level | # Students | % Students |
| Nursery / Preschool | 10 | 5.5% |
| Kindergarten | 3 | 1.6% |
| Elementary School | 53 | 29.0% |
| Middle School | 18 | 9.8% |
| High School | 57 | 31.1% |
| College / Undergraduate | 39 | 21.3% |
| Graduate / Professional | 3 | 1.6% |
| Total | 183 | 100.0% |
School Enrollment by Age by Funding Source in Midway borough
Out of a total of 183 students who are enrolled in schools in Midway borough, 26 (14.2%) attend a private institution, while the remaining 157 (85.8%) are enrolled in public schools. The age group of 25 to 34 year olds has the highest likelihood of being enrolled in private schools, with 7 (53.8% in the age bracket) enrolled. Conversely, the age group of 3 to 4 year olds has the lowest likelihood of being enrolled in a private school, with 10 (100.0% in the age bracket) attending a public institution.
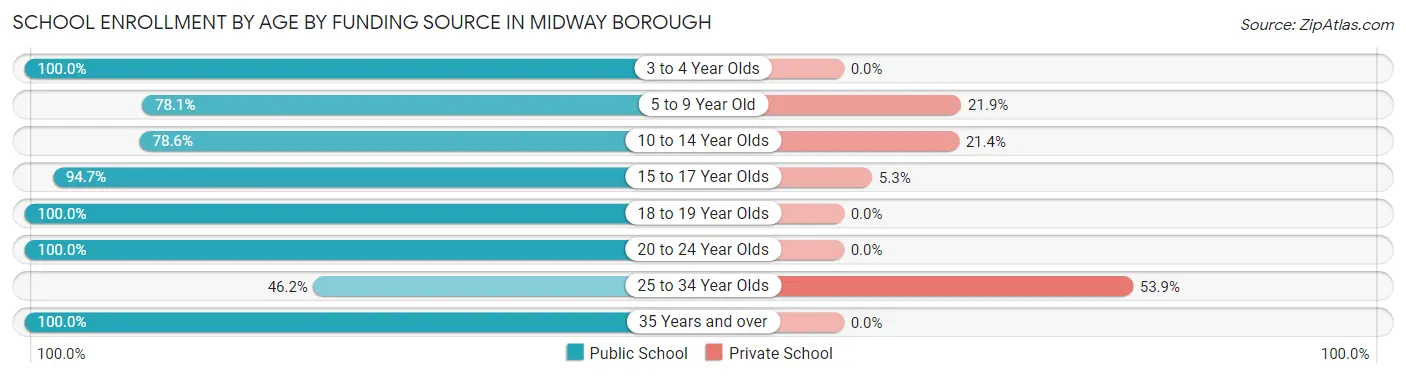
| Age Bracket | Public School | Private School |
| 3 to 4 Year Olds | 10 (100.0%) | 0 (0.0%) |
| 5 to 9 Year Old | 25 (78.1%) | 7 (21.9%) |
| 10 to 14 Year Olds | 33 (78.6%) | 9 (21.4%) |
| 15 to 17 Year Olds | 54 (94.7%) | 3 (5.3%) |
| 18 to 19 Year Olds | 15 (100.0%) | 0 (0.0%) |
| 20 to 24 Year Olds | 8 (100.0%) | 0 (0.0%) |
| 25 to 34 Year Olds | 6 (46.2%) | 7 (53.8%) |
| 35 Years and over | 6 (100.0%) | 0 (0.0%) |
| Total | 157 (85.8%) | 26 (14.2%) |
Educational Attainment by Field of Study in Midway borough
Science & technology (21 | 22.6%), social sciences (18 | 19.4%), computers & mathematics (15 | 16.1%), education (15 | 16.1%), and psychology (10 | 10.7%) are the most common fields of study among 93 individuals in Midway borough who have obtained a bachelor's degree or higher.
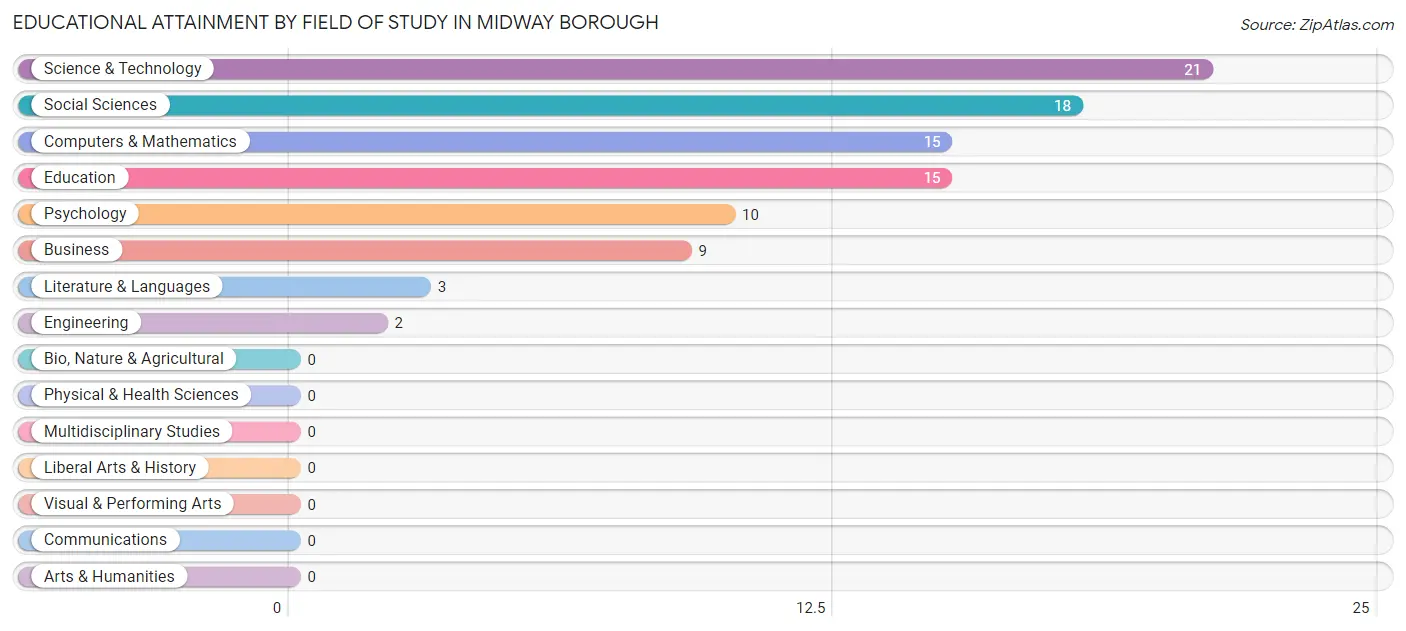
| Field of Study | # Graduates | % Graduates |
| Computers & Mathematics | 15 | 16.1% |
| Bio, Nature & Agricultural | 0 | 0.0% |
| Physical & Health Sciences | 0 | 0.0% |
| Psychology | 10 | 10.7% |
| Social Sciences | 18 | 19.4% |
| Engineering | 2 | 2.1% |
| Multidisciplinary Studies | 0 | 0.0% |
| Science & Technology | 21 | 22.6% |
| Business | 9 | 9.7% |
| Education | 15 | 16.1% |
| Literature & Languages | 3 | 3.2% |
| Liberal Arts & History | 0 | 0.0% |
| Visual & Performing Arts | 0 | 0.0% |
| Communications | 0 | 0.0% |
| Arts & Humanities | 0 | 0.0% |
| Total | 93 | 100.0% |
Transportation & Commute in Midway borough
Vehicle Availability by Sex in Midway borough
The most prevalent vehicle ownership categories in Midway borough are males with 2 vehicles (96, accounting for 42.1%) and females with 2 vehicles (66, making up 52.7%).
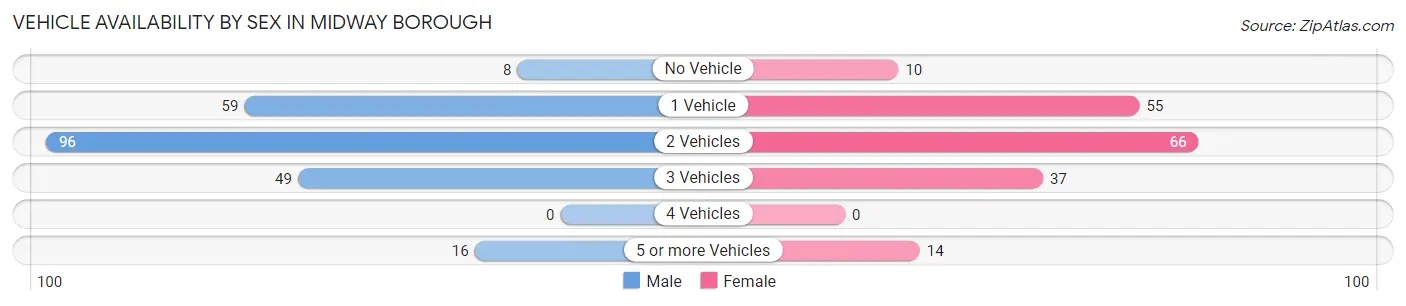
| Vehicles Available | Male | Female |
| No Vehicle | 8 (3.5%) | 10 (5.5%) |
| 1 Vehicle | 59 (25.9%) | 55 (30.2%) |
| 2 Vehicles | 96 (42.1%) | 66 (36.3%) |
| 3 Vehicles | 49 (21.5%) | 37 (20.3%) |
| 4 Vehicles | 0 (0.0%) | 0 (0.0%) |
| 5 or more Vehicles | 16 (7.0%) | 14 (7.7%) |
| Total | 228 (100.0%) | 182 (100.0%) |
Commute Time in Midway borough
The most frequently occuring commute durations in Midway borough are 30 to 34 minutes (85 commuters, 22.0%), 45 to 59 minutes (69 commuters, 17.8%), and 20 to 24 minutes (68 commuters, 17.6%).
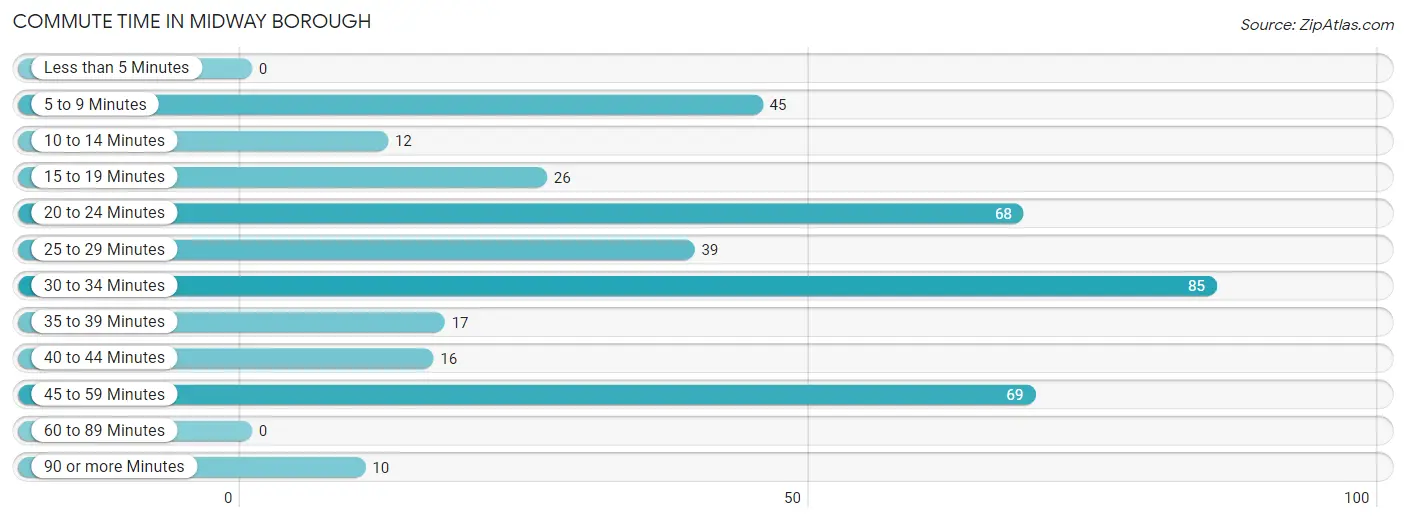
| Commute Time | # Commuters | % Commuters |
| Less than 5 Minutes | 0 | 0.0% |
| 5 to 9 Minutes | 45 | 11.6% |
| 10 to 14 Minutes | 12 | 3.1% |
| 15 to 19 Minutes | 26 | 6.7% |
| 20 to 24 Minutes | 68 | 17.6% |
| 25 to 29 Minutes | 39 | 10.1% |
| 30 to 34 Minutes | 85 | 22.0% |
| 35 to 39 Minutes | 17 | 4.4% |
| 40 to 44 Minutes | 16 | 4.1% |
| 45 to 59 Minutes | 69 | 17.8% |
| 60 to 89 Minutes | 0 | 0.0% |
| 90 or more Minutes | 10 | 2.6% |
Commute Time by Sex in Midway borough
The most common commute times in Midway borough are 30 to 34 minutes (55 commuters, 25.8%) for males and 20 to 24 minutes (36 commuters, 20.7%) for females.
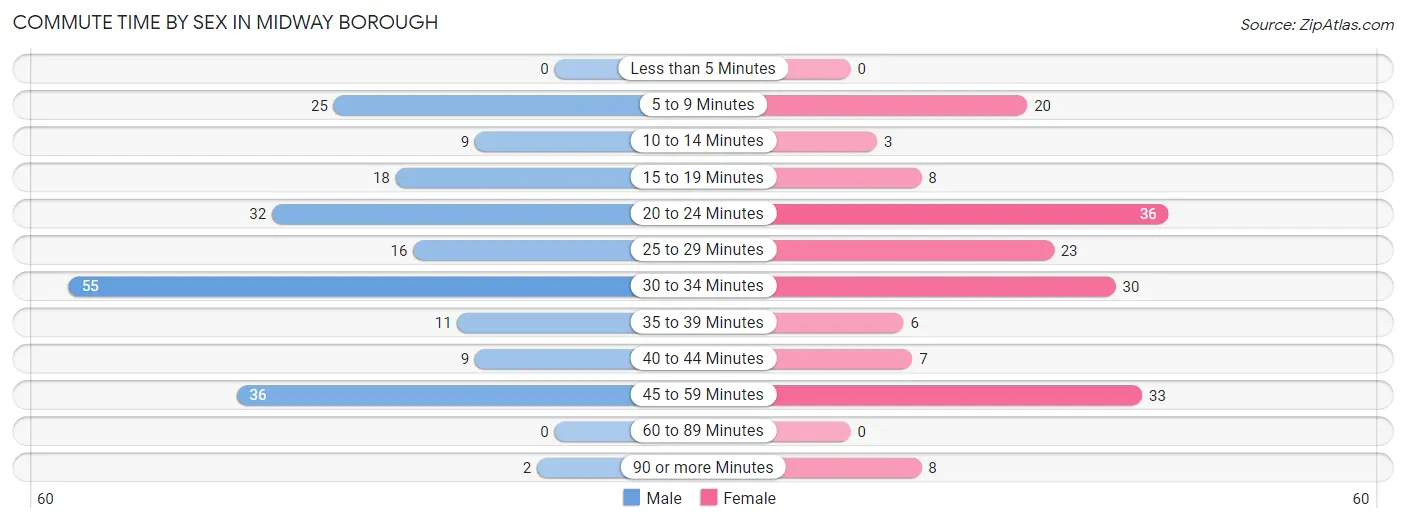
| Commute Time | Male | Female |
| Less than 5 Minutes | 0 (0.0%) | 0 (0.0%) |
| 5 to 9 Minutes | 25 (11.7%) | 20 (11.5%) |
| 10 to 14 Minutes | 9 (4.2%) | 3 (1.7%) |
| 15 to 19 Minutes | 18 (8.5%) | 8 (4.6%) |
| 20 to 24 Minutes | 32 (15.0%) | 36 (20.7%) |
| 25 to 29 Minutes | 16 (7.5%) | 23 (13.2%) |
| 30 to 34 Minutes | 55 (25.8%) | 30 (17.2%) |
| 35 to 39 Minutes | 11 (5.2%) | 6 (3.5%) |
| 40 to 44 Minutes | 9 (4.2%) | 7 (4.0%) |
| 45 to 59 Minutes | 36 (16.9%) | 33 (19.0%) |
| 60 to 89 Minutes | 0 (0.0%) | 0 (0.0%) |
| 90 or more Minutes | 2 (0.9%) | 8 (4.6%) |
Time of Departure to Work by Sex in Midway borough
The most frequent times of departure to work in Midway borough are 5:30 AM to 5:59 AM (42, 19.7%) for males and 7:30 AM to 7:59 AM (43, 24.7%) for females.
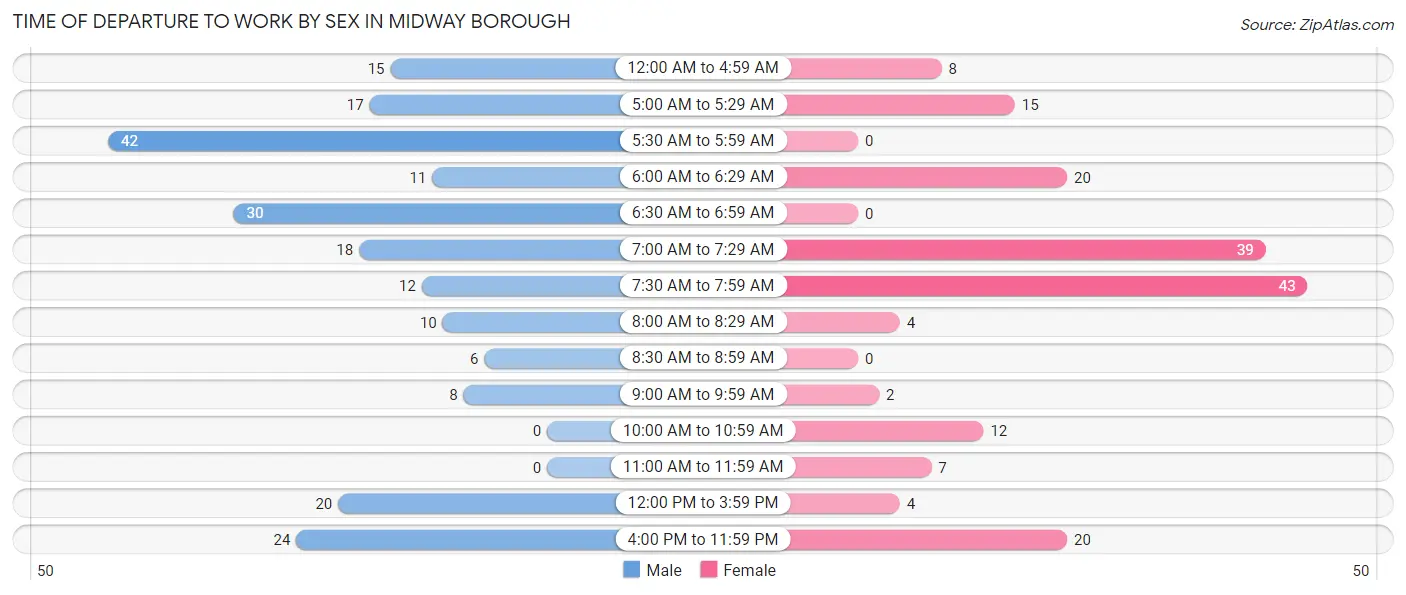
| Time of Departure | Male | Female |
| 12:00 AM to 4:59 AM | 15 (7.0%) | 8 (4.6%) |
| 5:00 AM to 5:29 AM | 17 (8.0%) | 15 (8.6%) |
| 5:30 AM to 5:59 AM | 42 (19.7%) | 0 (0.0%) |
| 6:00 AM to 6:29 AM | 11 (5.2%) | 20 (11.5%) |
| 6:30 AM to 6:59 AM | 30 (14.1%) | 0 (0.0%) |
| 7:00 AM to 7:29 AM | 18 (8.5%) | 39 (22.4%) |
| 7:30 AM to 7:59 AM | 12 (5.6%) | 43 (24.7%) |
| 8:00 AM to 8:29 AM | 10 (4.7%) | 4 (2.3%) |
| 8:30 AM to 8:59 AM | 6 (2.8%) | 0 (0.0%) |
| 9:00 AM to 9:59 AM | 8 (3.8%) | 2 (1.1%) |
| 10:00 AM to 10:59 AM | 0 (0.0%) | 12 (6.9%) |
| 11:00 AM to 11:59 AM | 0 (0.0%) | 7 (4.0%) |
| 12:00 PM to 3:59 PM | 20 (9.4%) | 4 (2.3%) |
| 4:00 PM to 11:59 PM | 24 (11.3%) | 20 (11.5%) |
| Total | 213 (100.0%) | 174 (100.0%) |
Housing Occupancy in Midway borough
Occupancy by Ownership in Midway borough
Of the total 384 dwellings in Midway borough, owner-occupied units account for 330 (85.9%), while renter-occupied units make up 54 (14.1%).
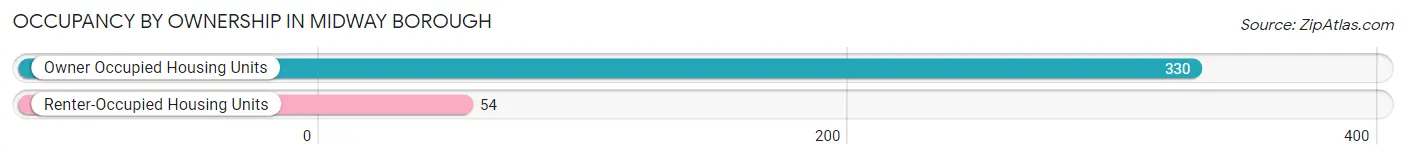
| Occupancy | # Housing Units | % Housing Units |
| Owner Occupied Housing Units | 330 | 85.9% |
| Renter-Occupied Housing Units | 54 | 14.1% |
| Total Occupied Housing Units | 384 | 100.0% |
Occupancy by Household Size in Midway borough
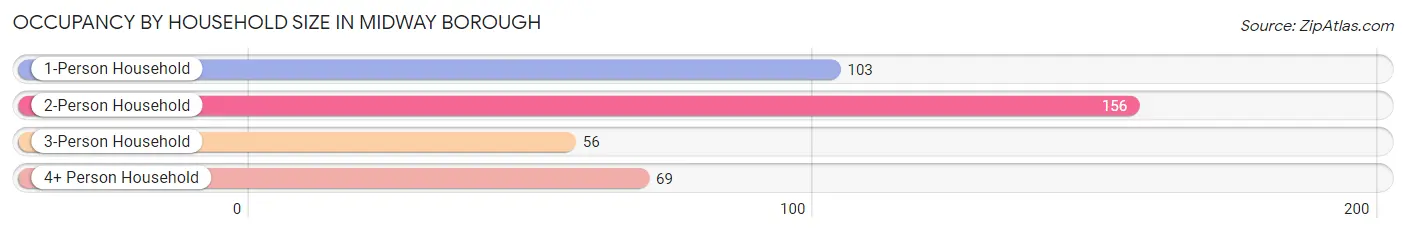
| Household Size | # Housing Units | % Housing Units |
| 1-Person Household | 103 | 26.8% |
| 2-Person Household | 156 | 40.6% |
| 3-Person Household | 56 | 14.6% |
| 4+ Person Household | 69 | 18.0% |
| Total Housing Units | 384 | 100.0% |
Occupancy by Ownership by Household Size in Midway borough
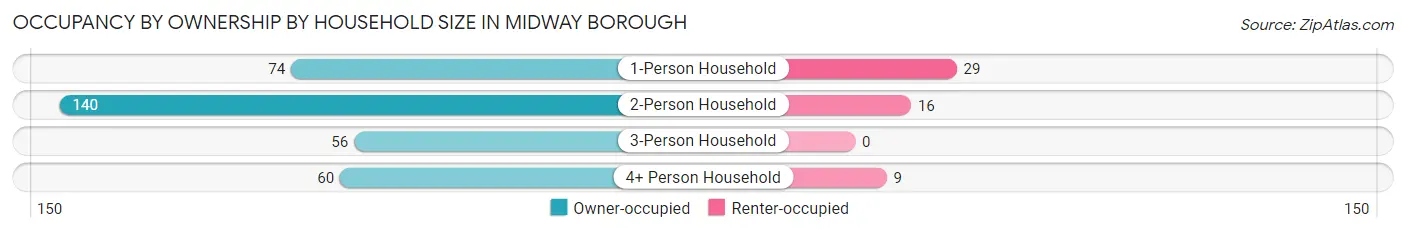
| Household Size | Owner-occupied | Renter-occupied |
| 1-Person Household | 74 (71.8%) | 29 (28.2%) |
| 2-Person Household | 140 (89.7%) | 16 (10.3%) |
| 3-Person Household | 56 (100.0%) | 0 (0.0%) |
| 4+ Person Household | 60 (87.0%) | 9 (13.0%) |
| Total Housing Units | 330 (85.9%) | 54 (14.1%) |
Occupancy by Educational Attainment in Midway borough
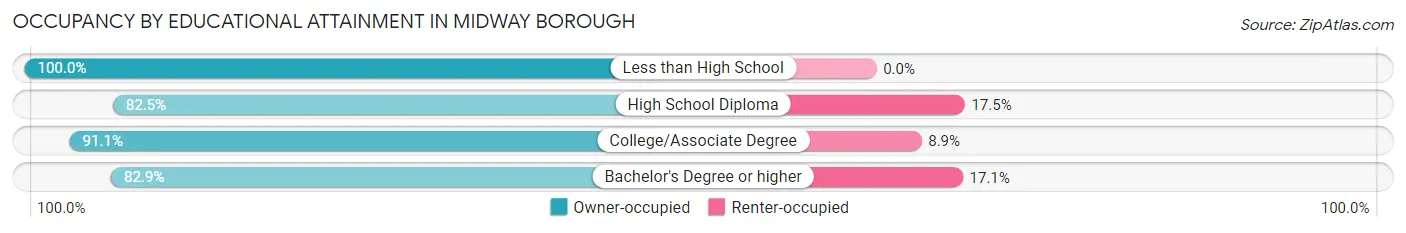
| Household Size | Owner-occupied | Renter-occupied |
| Less than High School | 14 (100.0%) | 0 (0.0%) |
| High School Diploma | 146 (82.5%) | 31 (17.5%) |
| College/Associate Degree | 112 (91.1%) | 11 (8.9%) |
| Bachelor's Degree or higher | 58 (82.9%) | 12 (17.1%) |
Occupancy by Age of Householder in Midway borough
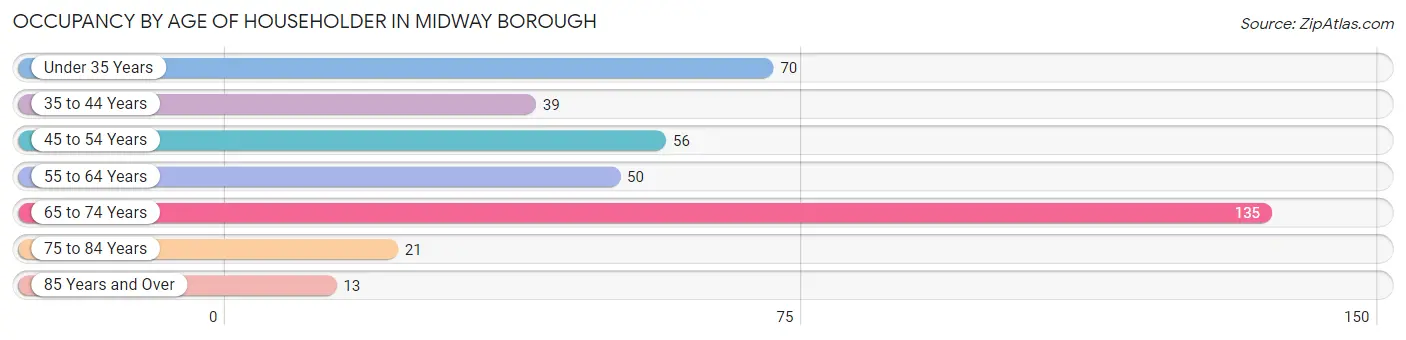
| Age Bracket | # Households | % Households |
| Under 35 Years | 70 | 18.2% |
| 35 to 44 Years | 39 | 10.2% |
| 45 to 54 Years | 56 | 14.6% |
| 55 to 64 Years | 50 | 13.0% |
| 65 to 74 Years | 135 | 35.2% |
| 75 to 84 Years | 21 | 5.5% |
| 85 Years and Over | 13 | 3.4% |
| Total | 384 | 100.0% |
Housing Finances in Midway borough
Median Income by Occupancy in Midway borough
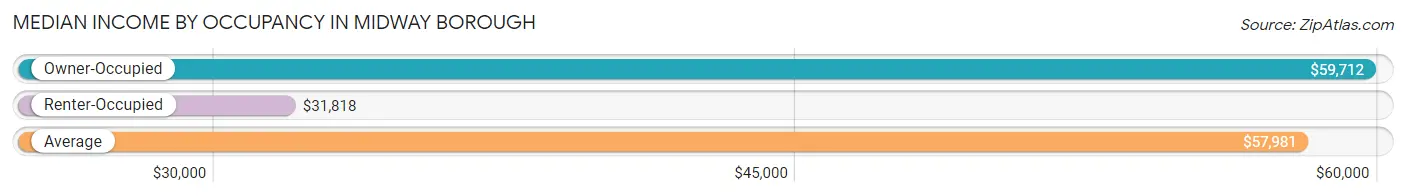
| Occupancy Type | # Households | Median Income |
| Owner-Occupied | 330 (85.9%) | $59,712 |
| Renter-Occupied | 54 (14.1%) | $31,818 |
| Average | 384 (100.0%) | $57,981 |
Occupancy by Householder Income Bracket in Midway borough
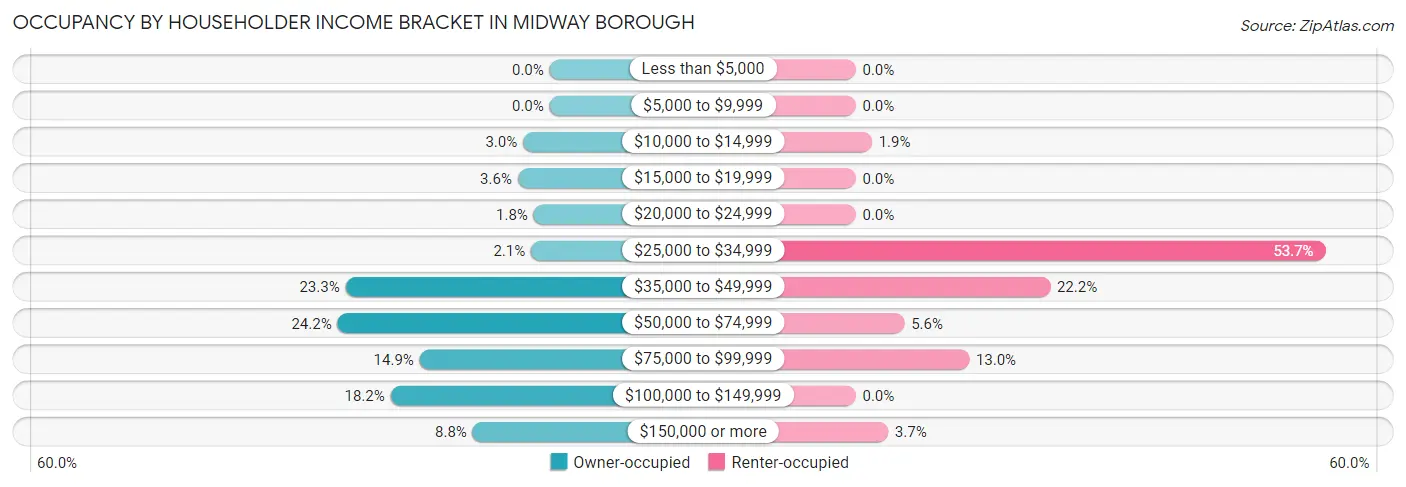
| Income Bracket | Owner-occupied | Renter-occupied |
| Less than $5,000 | 0 (0.0%) | 0 (0.0%) |
| $5,000 to $9,999 | 0 (0.0%) | 0 (0.0%) |
| $10,000 to $14,999 | 10 (3.0%) | 1 (1.8%) |
| $15,000 to $19,999 | 12 (3.6%) | 0 (0.0%) |
| $20,000 to $24,999 | 6 (1.8%) | 0 (0.0%) |
| $25,000 to $34,999 | 7 (2.1%) | 29 (53.7%) |
| $35,000 to $49,999 | 77 (23.3%) | 12 (22.2%) |
| $50,000 to $74,999 | 80 (24.2%) | 3 (5.6%) |
| $75,000 to $99,999 | 49 (14.8%) | 7 (13.0%) |
| $100,000 to $149,999 | 60 (18.2%) | 0 (0.0%) |
| $150,000 or more | 29 (8.8%) | 2 (3.7%) |
| Total | 330 (100.0%) | 54 (100.0%) |
Monthly Housing Cost Tiers in Midway borough
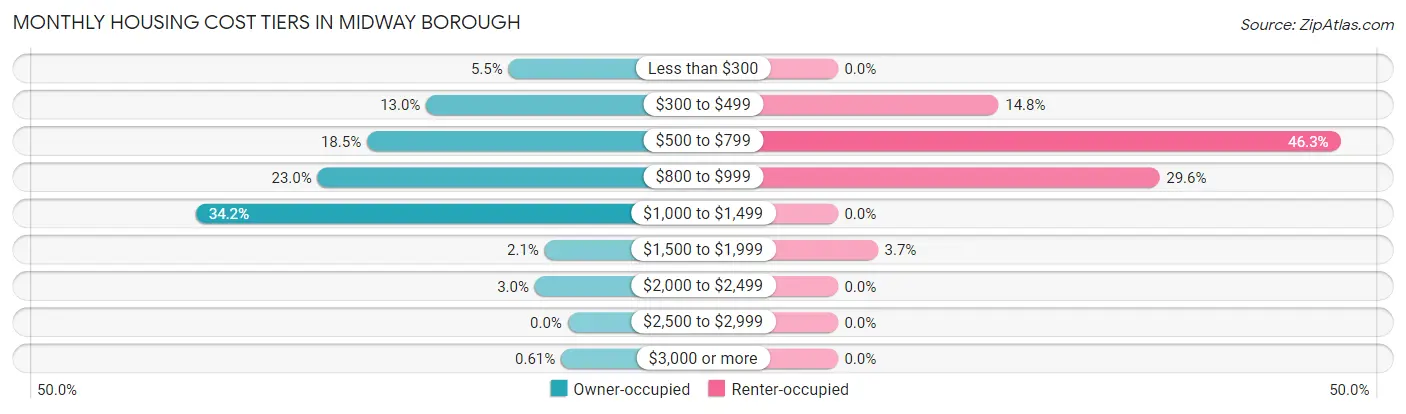
| Monthly Cost | Owner-occupied | Renter-occupied |
| Less than $300 | 18 (5.4%) | 0 (0.0%) |
| $300 to $499 | 43 (13.0%) | 8 (14.8%) |
| $500 to $799 | 61 (18.5%) | 25 (46.3%) |
| $800 to $999 | 76 (23.0%) | 16 (29.6%) |
| $1,000 to $1,499 | 113 (34.2%) | 0 (0.0%) |
| $1,500 to $1,999 | 7 (2.1%) | 2 (3.7%) |
| $2,000 to $2,499 | 10 (3.0%) | 0 (0.0%) |
| $2,500 to $2,999 | 0 (0.0%) | 0 (0.0%) |
| $3,000 or more | 2 (0.6%) | 0 (0.0%) |
| Total | 330 (100.0%) | 54 (100.0%) |
Physical Housing Characteristics in Midway borough
Housing Structures in Midway borough
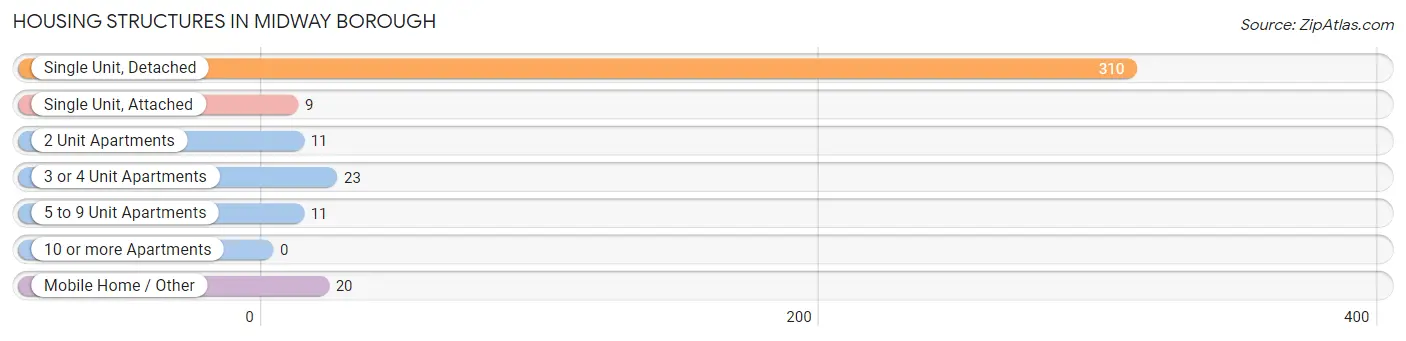
| Structure Type | # Housing Units | % Housing Units |
| Single Unit, Detached | 310 | 80.7% |
| Single Unit, Attached | 9 | 2.3% |
| 2 Unit Apartments | 11 | 2.9% |
| 3 or 4 Unit Apartments | 23 | 6.0% |
| 5 to 9 Unit Apartments | 11 | 2.9% |
| 10 or more Apartments | 0 | 0.0% |
| Mobile Home / Other | 20 | 5.2% |
| Total | 384 | 100.0% |
Housing Structures by Occupancy in Midway borough
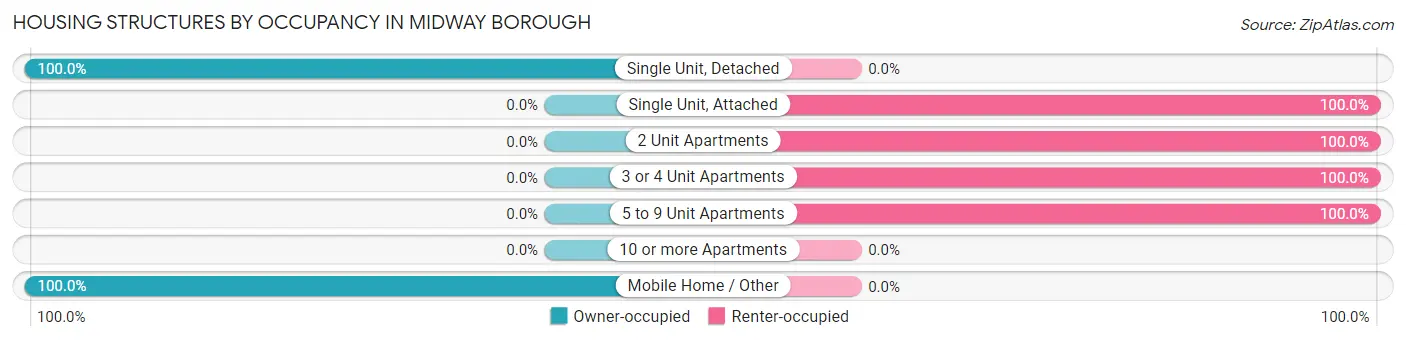
| Structure Type | Owner-occupied | Renter-occupied |
| Single Unit, Detached | 310 (100.0%) | 0 (0.0%) |
| Single Unit, Attached | 0 (0.0%) | 9 (100.0%) |
| 2 Unit Apartments | 0 (0.0%) | 11 (100.0%) |
| 3 or 4 Unit Apartments | 0 (0.0%) | 23 (100.0%) |
| 5 to 9 Unit Apartments | 0 (0.0%) | 11 (100.0%) |
| 10 or more Apartments | 0 (0.0%) | 0 (0.0%) |
| Mobile Home / Other | 20 (100.0%) | 0 (0.0%) |
| Total | 330 (85.9%) | 54 (14.1%) |
Housing Structures by Number of Rooms in Midway borough
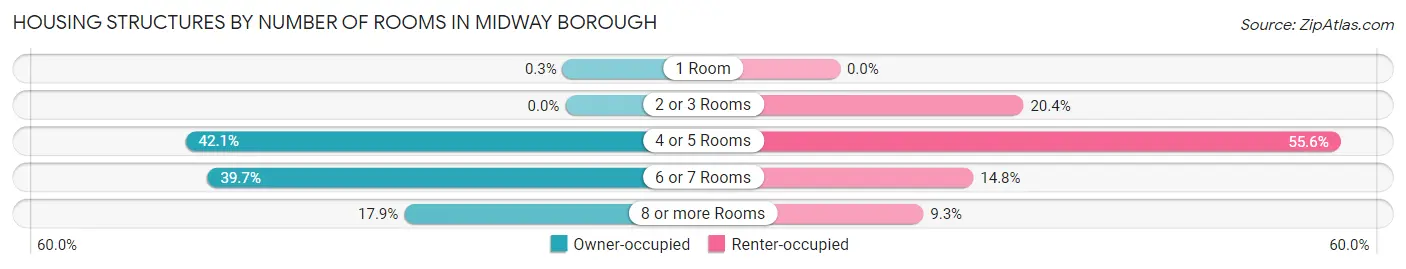
| Number of Rooms | Owner-occupied | Renter-occupied |
| 1 Room | 1 (0.3%) | 0 (0.0%) |
| 2 or 3 Rooms | 0 (0.0%) | 11 (20.4%) |
| 4 or 5 Rooms | 139 (42.1%) | 30 (55.6%) |
| 6 or 7 Rooms | 131 (39.7%) | 8 (14.8%) |
| 8 or more Rooms | 59 (17.9%) | 5 (9.3%) |
| Total | 330 (100.0%) | 54 (100.0%) |
Housing Structure by Heating Type in Midway borough
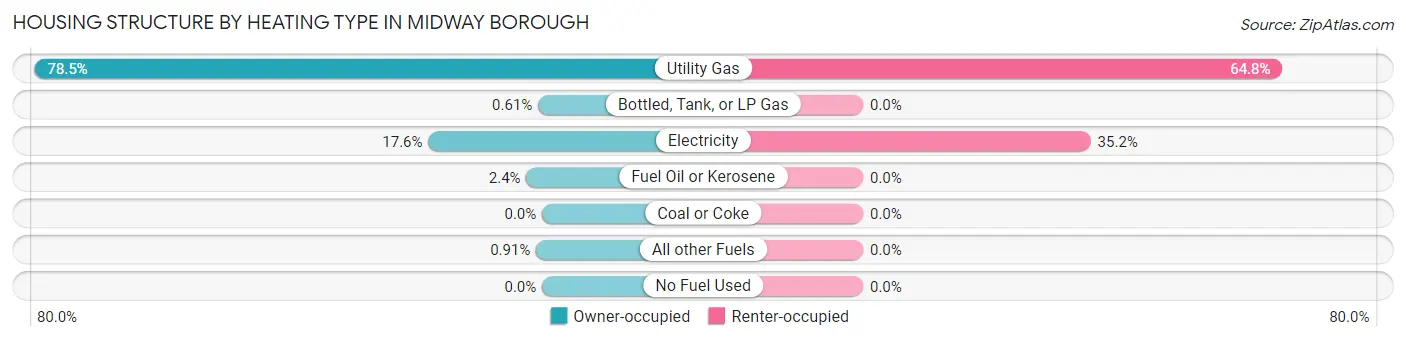
| Heating Type | Owner-occupied | Renter-occupied |
| Utility Gas | 259 (78.5%) | 35 (64.8%) |
| Bottled, Tank, or LP Gas | 2 (0.6%) | 0 (0.0%) |
| Electricity | 58 (17.6%) | 19 (35.2%) |
| Fuel Oil or Kerosene | 8 (2.4%) | 0 (0.0%) |
| Coal or Coke | 0 (0.0%) | 0 (0.0%) |
| All other Fuels | 3 (0.9%) | 0 (0.0%) |
| No Fuel Used | 0 (0.0%) | 0 (0.0%) |
| Total | 330 (100.0%) | 54 (100.0%) |
Household Vehicle Usage in Midway borough
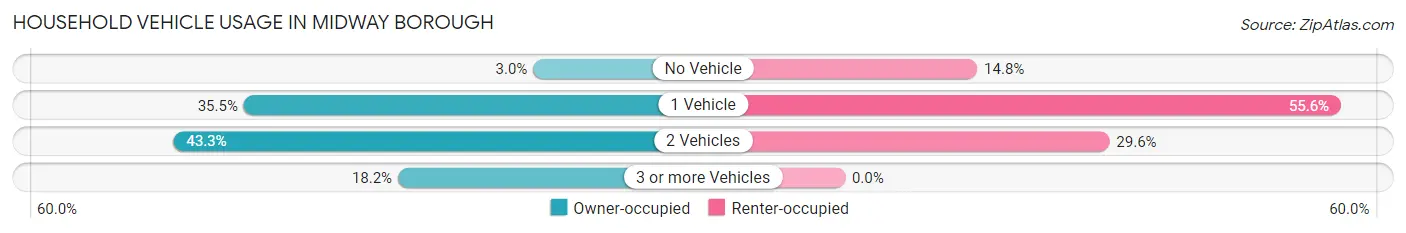
| Vehicles per Household | Owner-occupied | Renter-occupied |
| No Vehicle | 10 (3.0%) | 8 (14.8%) |
| 1 Vehicle | 117 (35.4%) | 30 (55.6%) |
| 2 Vehicles | 143 (43.3%) | 16 (29.6%) |
| 3 or more Vehicles | 60 (18.2%) | 0 (0.0%) |
| Total | 330 (100.0%) | 54 (100.0%) |
Real Estate & Mortgages in Midway borough
Real Estate and Mortgage Overview in Midway borough
| Characteristic | Without Mortgage | With Mortgage |
| Housing Units | 126 | 204 |
| Median Property Value | $107,500 | $118,000 |
| Median Household Income | $66,250 | $10 |
| Monthly Housing Costs | $512 | $2 |
| Real Estate Taxes | $1,633 | $0 |
Property Value by Mortgage Status in Midway borough
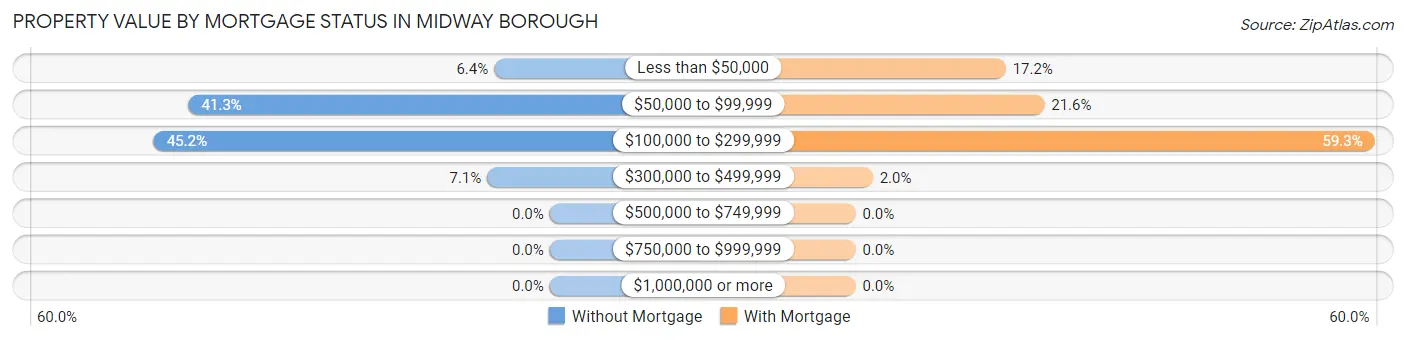
| Property Value | Without Mortgage | With Mortgage |
| Less than $50,000 | 8 (6.4%) | 35 (17.2%) |
| $50,000 to $99,999 | 52 (41.3%) | 44 (21.6%) |
| $100,000 to $299,999 | 57 (45.2%) | 121 (59.3%) |
| $300,000 to $499,999 | 9 (7.1%) | 4 (2.0%) |
| $500,000 to $749,999 | 0 (0.0%) | 0 (0.0%) |
| $750,000 to $999,999 | 0 (0.0%) | 0 (0.0%) |
| $1,000,000 or more | 0 (0.0%) | 0 (0.0%) |
| Total | 126 (100.0%) | 204 (100.0%) |
Household Income by Mortgage Status in Midway borough
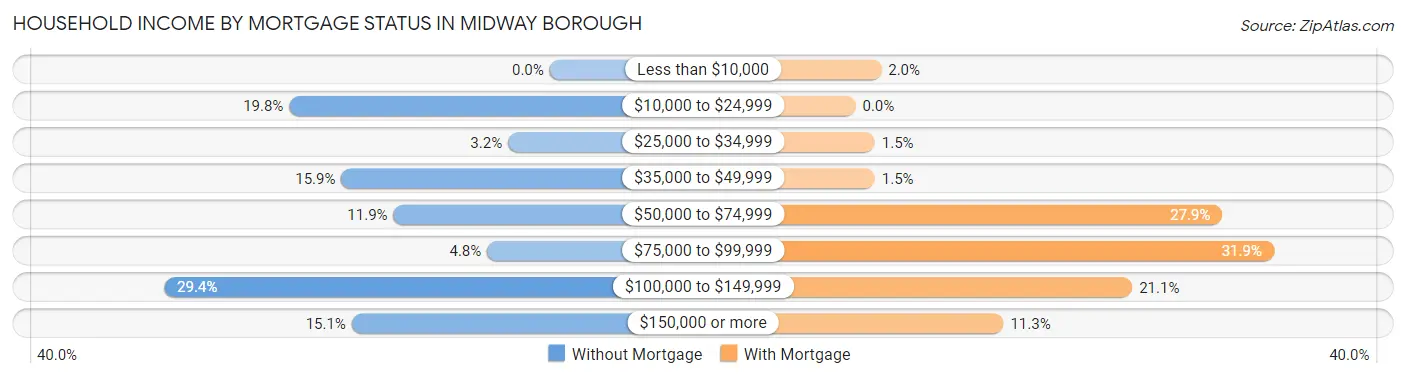
| Household Income | Without Mortgage | With Mortgage |
| Less than $10,000 | 0 (0.0%) | 4 (2.0%) |
| $10,000 to $24,999 | 25 (19.8%) | 0 (0.0%) |
| $25,000 to $34,999 | 4 (3.2%) | 3 (1.5%) |
| $35,000 to $49,999 | 20 (15.9%) | 3 (1.5%) |
| $50,000 to $74,999 | 15 (11.9%) | 57 (27.9%) |
| $75,000 to $99,999 | 6 (4.8%) | 65 (31.9%) |
| $100,000 to $149,999 | 37 (29.4%) | 43 (21.1%) |
| $150,000 or more | 19 (15.1%) | 23 (11.3%) |
| Total | 126 (100.0%) | 204 (100.0%) |
Property Value to Household Income Ratio in Midway borough
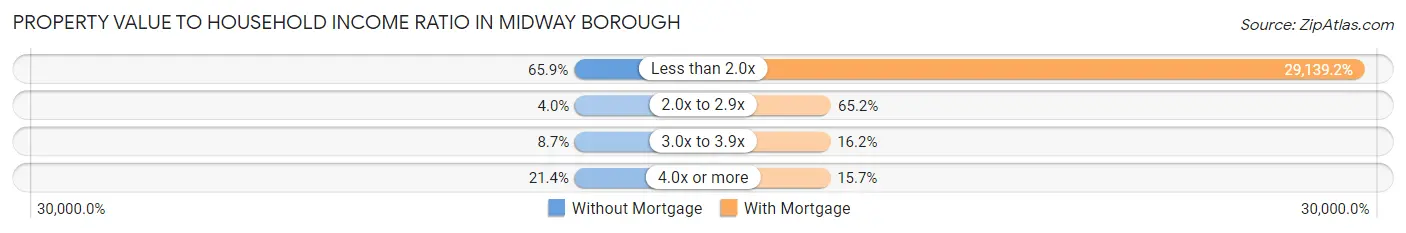
| Value-to-Income Ratio | Without Mortgage | With Mortgage |
| Less than 2.0x | 83 (65.9%) | 59,444 (29,139.2%) |
| 2.0x to 2.9x | 5 (4.0%) | 133 (65.2%) |
| 3.0x to 3.9x | 11 (8.7%) | 33 (16.2%) |
| 4.0x or more | 27 (21.4%) | 32 (15.7%) |
| Total | 126 (100.0%) | 204 (100.0%) |
Real Estate Taxes by Mortgage Status in Midway borough
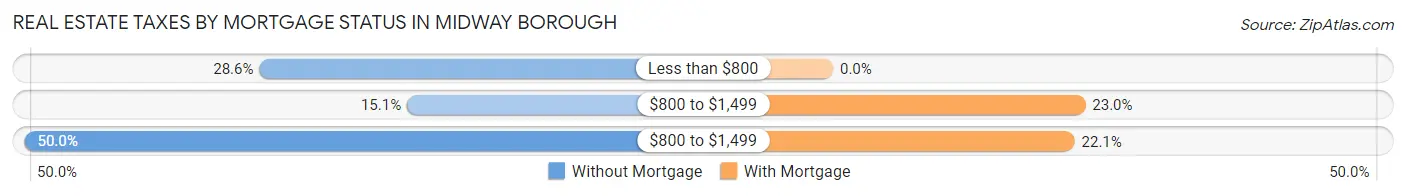
| Property Taxes | Without Mortgage | With Mortgage |
| Less than $800 | 36 (28.6%) | 0 (0.0%) |
| $800 to $1,499 | 19 (15.1%) | 47 (23.0%) |
| $800 to $1,499 | 63 (50.0%) | 45 (22.1%) |
| Total | 126 (100.0%) | 204 (100.0%) |
Health & Disability in Midway borough
Health Insurance Coverage by Age in Midway borough
| Age Bracket | With Coverage | Without Coverage |
| Under 6 Years | 32 (94.1%) | 2 (5.9%) |
| 6 to 18 Years | 152 (98.1%) | 3 (1.9%) |
| 19 to 25 Years | 97 (89.0%) | 12 (11.0%) |
| 26 to 34 Years | 69 (89.6%) | 8 (10.4%) |
| 35 to 44 Years | 72 (82.8%) | 15 (17.2%) |
| 45 to 54 Years | 63 (82.9%) | 13 (17.1%) |
| 55 to 64 Years | 118 (96.7%) | 4 (3.3%) |
| 65 to 74 Years | 207 (100.0%) | 0 (0.0%) |
| 75 Years and older | 38 (100.0%) | 0 (0.0%) |
| Total | 848 (93.7%) | 57 (6.3%) |
Health Insurance Coverage by Citizenship Status in Midway borough
| Citizenship Status | With Coverage | Without Coverage |
| Native Born | 32 (94.1%) | 2 (5.9%) |
| Foreign Born, Citizen | 152 (98.1%) | 3 (1.9%) |
| Foreign Born, not a Citizen | 97 (89.0%) | 12 (11.0%) |
Health Insurance Coverage by Household Income in Midway borough
| Household Income | With Coverage | Without Coverage |
| Under $25,000 | 57 (85.1%) | 10 (14.9%) |
| $25,000 to $49,999 | 222 (97.8%) | 5 (2.2%) |
| $50,000 to $74,999 | 164 (83.7%) | 32 (16.3%) |
| $75,000 to $99,999 | 187 (100.0%) | 0 (0.0%) |
| $100,000 and over | 218 (95.6%) | 10 (4.4%) |
Public vs Private Health Insurance Coverage by Age in Midway borough
| Age Bracket | Public Insurance | Private Insurance |
| Under 6 | 27 (79.4%) | 5 (14.7%) |
| 6 to 18 Years | 59 (38.1%) | 102 (65.8%) |
| 19 to 25 Years | 34 (31.2%) | 86 (78.9%) |
| 25 to 34 Years | 23 (29.9%) | 49 (63.6%) |
| 35 to 44 Years | 10 (11.5%) | 64 (73.6%) |
| 45 to 54 Years | 11 (14.5%) | 52 (68.4%) |
| 55 to 64 Years | 51 (41.8%) | 97 (79.5%) |
| 65 to 74 Years | 205 (99.0%) | 164 (79.2%) |
| 75 Years and over | 38 (100.0%) | 29 (76.3%) |
| Total | 458 (50.6%) | 648 (71.6%) |
Disability Status by Sex by Age in Midway borough
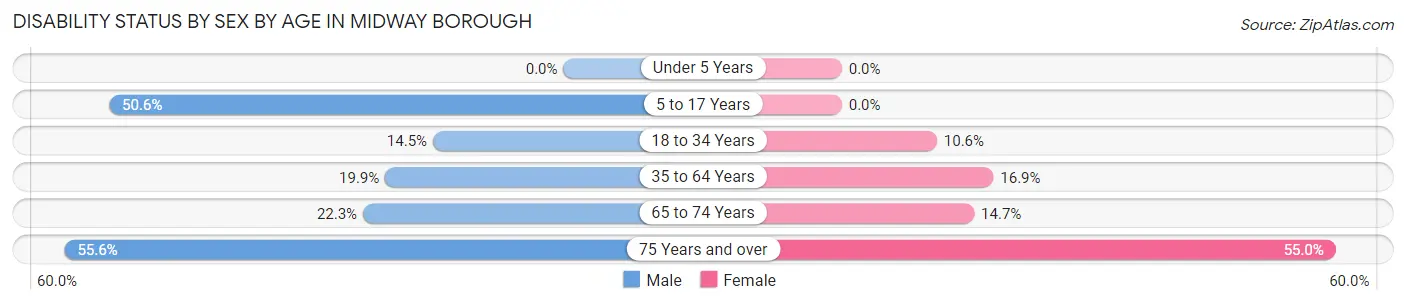
| Age Bracket | Male | Female |
| Under 5 Years | 0 (0.0%) | 0 (0.0%) |
| 5 to 17 Years | 43 (50.6%) | 0 (0.0%) |
| 18 to 34 Years | 17 (14.5%) | 9 (10.6%) |
| 35 to 64 Years | 26 (19.9%) | 26 (16.9%) |
| 65 to 74 Years | 25 (22.3%) | 14 (14.7%) |
| 75 Years and over | 10 (55.6%) | 11 (55.0%) |
Disability Class by Sex by Age in Midway borough
Disability Class: Hearing Difficulty
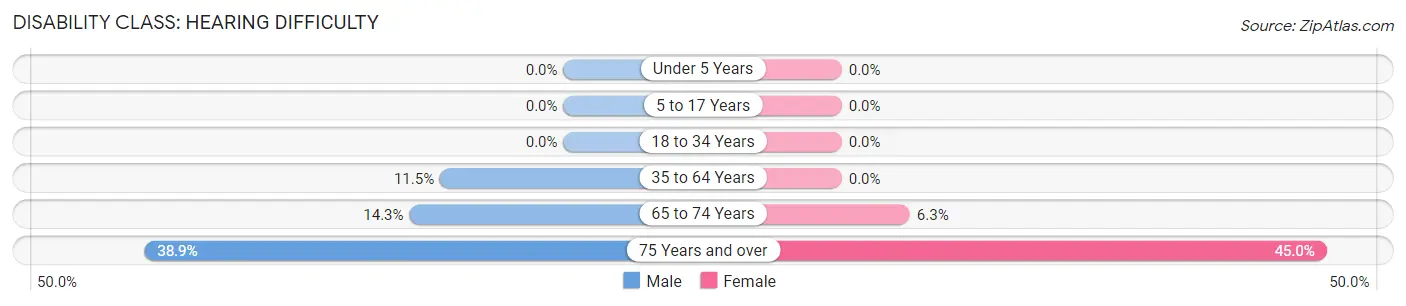
| Age Bracket | Male | Female |
| Under 5 Years | 0 (0.0%) | 0 (0.0%) |
| 5 to 17 Years | 0 (0.0%) | 0 (0.0%) |
| 18 to 34 Years | 0 (0.0%) | 0 (0.0%) |
| 35 to 64 Years | 15 (11.5%) | 0 (0.0%) |
| 65 to 74 Years | 16 (14.3%) | 6 (6.3%) |
| 75 Years and over | 7 (38.9%) | 9 (45.0%) |
Disability Class: Vision Difficulty
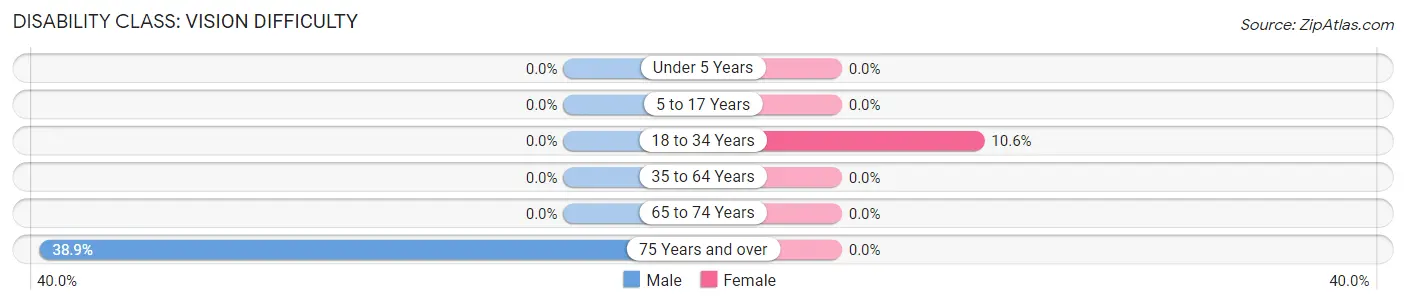
| Age Bracket | Male | Female |
| Under 5 Years | 0 (0.0%) | 0 (0.0%) |
| 5 to 17 Years | 0 (0.0%) | 0 (0.0%) |
| 18 to 34 Years | 0 (0.0%) | 9 (10.6%) |
| 35 to 64 Years | 0 (0.0%) | 0 (0.0%) |
| 65 to 74 Years | 0 (0.0%) | 0 (0.0%) |
| 75 Years and over | 7 (38.9%) | 0 (0.0%) |
Disability Class: Cognitive Difficulty

| Age Bracket | Male | Female |
| 5 to 17 Years | 43 (50.6%) | 0 (0.0%) |
| 18 to 34 Years | 17 (14.5%) | 9 (10.6%) |
| 35 to 64 Years | 8 (6.1%) | 14 (9.1%) |
| 65 to 74 Years | 0 (0.0%) | 3 (3.2%) |
| 75 Years and over | 0 (0.0%) | 0 (0.0%) |
Disability Class: Ambulatory Difficulty
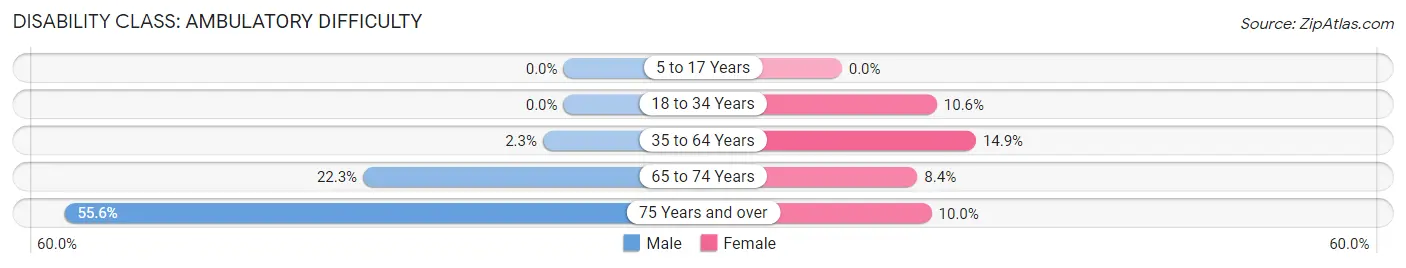
| Age Bracket | Male | Female |
| 5 to 17 Years | 0 (0.0%) | 0 (0.0%) |
| 18 to 34 Years | 0 (0.0%) | 9 (10.6%) |
| 35 to 64 Years | 3 (2.3%) | 23 (14.9%) |
| 65 to 74 Years | 25 (22.3%) | 8 (8.4%) |
| 75 Years and over | 10 (55.6%) | 2 (10.0%) |
Disability Class: Self-Care Difficulty
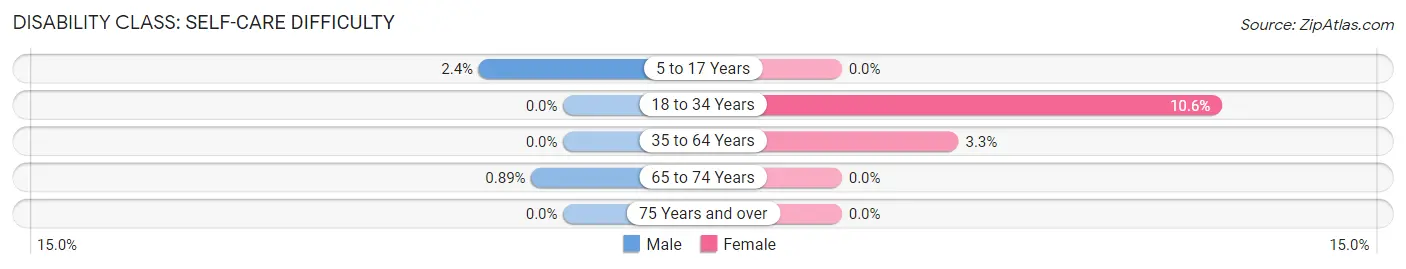
| Age Bracket | Male | Female |
| 5 to 17 Years | 2 (2.4%) | 0 (0.0%) |
| 18 to 34 Years | 0 (0.0%) | 9 (10.6%) |
| 35 to 64 Years | 0 (0.0%) | 5 (3.3%) |
| 65 to 74 Years | 1 (0.9%) | 0 (0.0%) |
| 75 Years and over | 0 (0.0%) | 0 (0.0%) |
Technology Access in Midway borough
Computing Device Access in Midway borough
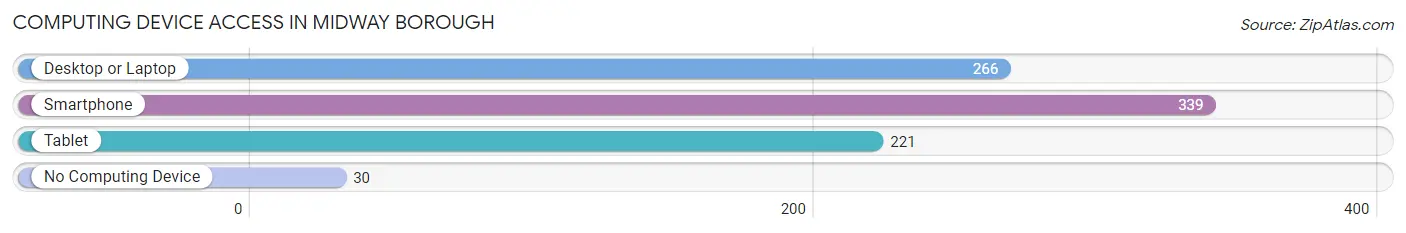
| Device Type | # Households | % Households |
| Desktop or Laptop | 266 | 69.3% |
| Smartphone | 339 | 88.3% |
| Tablet | 221 | 57.6% |
| No Computing Device | 30 | 7.8% |
| Total | 384 | 100.0% |
Internet Access in Midway borough
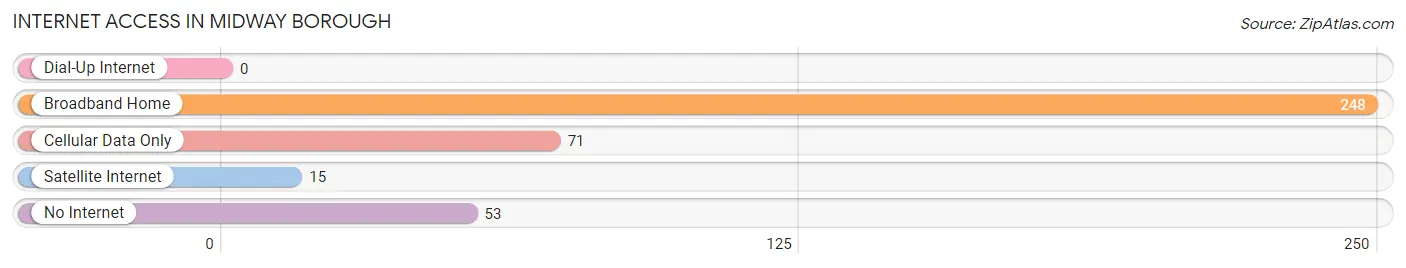
| Internet Type | # Households | % Households |
| Dial-Up Internet | 0 | 0.0% |
| Broadband Home | 248 | 64.6% |
| Cellular Data Only | 71 | 18.5% |
| Satellite Internet | 15 | 3.9% |
| No Internet | 53 | 13.8% |
| Total | 384 | 100.0% |
Midway borough Summary
Midway Borough is a small borough located in Beaver County, Pennsylvania. It is situated in the southwestern corner of the county, and is bordered by the townships of Hanover, Raccoon, and Independence. The population of Midway Borough was 1,845 at the 2010 census.
History
Midway Borough was founded in 1836 by a group of settlers from the nearby town of Hanover. The settlers chose the name Midway because of its location between Hanover and Raccoon townships. The first post office in Midway was established in 1837, and the first school was built in 1838.
In 1845, the Midway Presbyterian Church was founded, and the first church building was constructed in 1848. The church is still active today and is the oldest church in the borough.
In 1854, the Midway Railroad was built, connecting the borough to the nearby towns of Hanover and Raccoon. This allowed for the transportation of goods and people, and helped to spur the growth of the borough.
In 1871, the Midway Borough Council was established, and the first mayor was elected in 1872. The borough was officially incorporated in 1873.
Geography
Midway Borough is located at 40°33'N 80°17'W (40.55, -80.28). It has a total area of 0.7 square miles, all of which is land.
The borough is situated in the southwestern corner of Beaver County, and is bordered by the townships of Hanover, Raccoon, and Independence. The borough is located in the Ohio River Valley, and is surrounded by rolling hills and farmland.
Economy
The economy of Midway Borough is largely based on agriculture and manufacturing. The borough is home to several small businesses, including a grocery store, a hardware store, and a restaurant.
The borough is also home to several large manufacturing companies, including a steel mill, a paper mill, and a plastics factory. These companies provide employment for many of the borough's residents.
Demographics
As of the 2010 census, the population of Midway Borough was 1,845. The racial makeup of the borough was 97.3% White, 0.9% African American, 0.2% Native American, 0.3% Asian, 0.2% from other races, and 0.9% from two or more races. Hispanic or Latino of any race were 0.7% of the population.
The median household income in Midway Borough was $41,250, and the median family income was $50,000. The per capita income was $20,945. About 8.3% of families and 10.2% of the population were below the poverty line, including 14.3% of those under age 18 and 5.2% of those age 65 or over.
Common Questions
What is Per Capita Income in Midway borough?
Per Capita income in Midway borough is $30,744.
What is the Median Family Income in Midway borough?
Median Family Income in Midway borough is $58,750.
What is the Median Household income in Midway borough?
Median Household Income in Midway borough is $57,981.
What is Income or Wage Gap in Midway borough?
Income or Wage Gap in Midway borough is 24.5%.
Women in Midway borough earn 75.5 cents for every dollar earned by a man.
What is Inequality or Gini Index in Midway borough?
Inequality or Gini Index in Midway borough is 0.33.
What is the Total Population of Midway borough?
Total Population of Midway borough is 919.
What is the Total Male Population of Midway borough?
Total Male Population of Midway borough is 499.
What is the Total Female Population of Midway borough?
Total Female Population of Midway borough is 420.
What is the Ratio of Males per 100 Females in Midway borough?
There are 118.81 Males per 100 Females in Midway borough.
What is the Ratio of Females per 100 Males in Midway borough?
There are 84.17 Females per 100 Males in Midway borough.
What is the Median Population Age in Midway borough?
Median Population Age in Midway borough is 43.8 Years.
What is the Average Family Size in Midway borough
Average Family Size in Midway borough is 2.8 People.
What is the Average Household Size in Midway borough
Average Household Size in Midway borough is 2.4 People.
How Large is the Labor Force in Midway borough?
There are 467 People in the Labor Forcein in Midway borough.
What is the Percentage of People in the Labor Force in Midway borough?
58.5% of People are in the Labor Force in Midway borough.
What is the Unemployment Rate in Midway borough?
Unemployment Rate in Midway borough is 11.3%.