Marion, PA Map & Demographics
Marion Map
Marion Overview
$22,633
PER CAPITA INCOME
$61,825
AVG FAMILY INCOME
$53,929
AVG HOUSEHOLD INCOME
70.9%
WAGE / INCOME GAP [ % ]
29.1¢/ $1
WAGE / INCOME GAP [ $ ]
0.41
INEQUALITY / GINI INDEX
1,126
TOTAL POPULATION
553
MALE POPULATION
573
FEMALE POPULATION
96.51
MALES / 100 FEMALES
103.62
FEMALES / 100 MALES
34.1
MEDIAN AGE
3.9
AVG FAMILY SIZE
3.2
AVG HOUSEHOLD SIZE
444
LABOR FORCE [ PEOPLE ]
49.0%
PERCENT IN LABOR FORCE
Marion Zip Codes
Marion Area Codes
Income in Marion
Income Overview in Marion
Per Capita Income in Marion is $22,633, while median incomes of families and households are $61,825 and $53,929 respectively.
| Characteristic | Number | Measure |
| Per Capita Income | 1,126 | $22,633 |
| Median Family Income | 259 | $61,825 |
| Mean Family Income | 259 | $81,176 |
| Median Household Income | 356 | $53,929 |
| Mean Household Income | 356 | $65,979 |
| Income Deficit | 259 | $0 |
| Wage / Income Gap (%) | 1,126 | 70.87% |
| Wage / Income Gap ($) | 1,126 | 29.13¢ per $1 |
| Gini / Inequality Index | 1,126 | 0.41 |
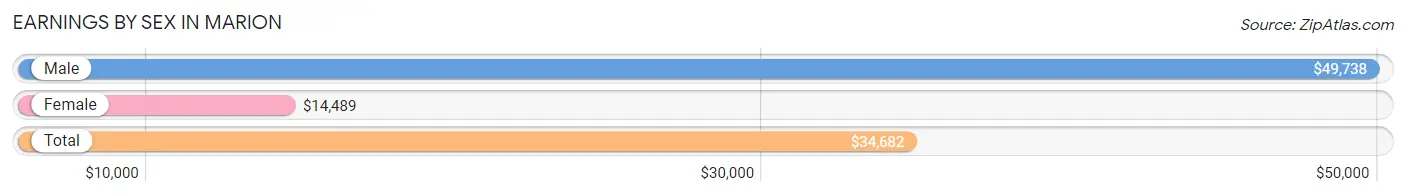
Earnings by Sex in Marion
Average Earnings in Marion are $34,682, $49,738 for men and $14,489 for women, a difference of 70.9%.
| Sex | Number | Average Earnings |
| Male | 307 (69.1%) | $49,738 |
| Female | 137 (30.9%) | $14,489 |
| Total | 444 (100.0%) | $34,682 |
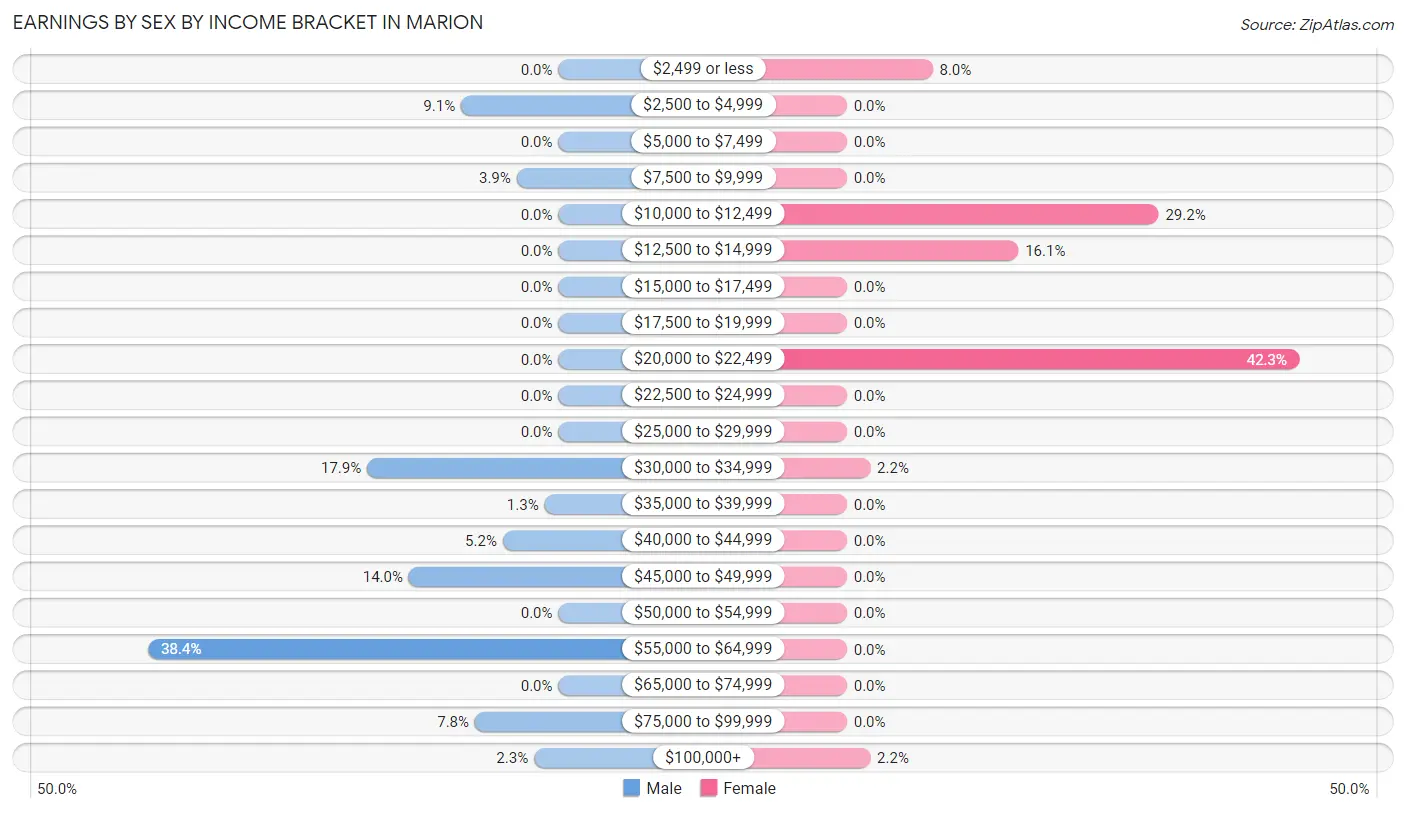
Earnings by Sex by Income Bracket in Marion
The most common earnings brackets in Marion are $55,000 to $64,999 for men (118 | 38.4%) and $20,000 to $22,499 for women (58 | 42.3%).
| Income | Male | Female |
| $2,499 or less | 0 (0.0%) | 11 (8.0%) |
| $2,500 to $4,999 | 28 (9.1%) | 0 (0.0%) |
| $5,000 to $7,499 | 0 (0.0%) | 0 (0.0%) |
| $7,500 to $9,999 | 12 (3.9%) | 0 (0.0%) |
| $10,000 to $12,499 | 0 (0.0%) | 40 (29.2%) |
| $12,500 to $14,999 | 0 (0.0%) | 22 (16.1%) |
| $15,000 to $17,499 | 0 (0.0%) | 0 (0.0%) |
| $17,500 to $19,999 | 0 (0.0%) | 0 (0.0%) |
| $20,000 to $22,499 | 0 (0.0%) | 58 (42.3%) |
| $22,500 to $24,999 | 0 (0.0%) | 0 (0.0%) |
| $25,000 to $29,999 | 0 (0.0%) | 0 (0.0%) |
| $30,000 to $34,999 | 55 (17.9%) | 3 (2.2%) |
| $35,000 to $39,999 | 4 (1.3%) | 0 (0.0%) |
| $40,000 to $44,999 | 16 (5.2%) | 0 (0.0%) |
| $45,000 to $49,999 | 43 (14.0%) | 0 (0.0%) |
| $50,000 to $54,999 | 0 (0.0%) | 0 (0.0%) |
| $55,000 to $64,999 | 118 (38.4%) | 0 (0.0%) |
| $65,000 to $74,999 | 0 (0.0%) | 0 (0.0%) |
| $75,000 to $99,999 | 24 (7.8%) | 0 (0.0%) |
| $100,000+ | 7 (2.3%) | 3 (2.2%) |
| Total | 307 (100.0%) | 137 (100.0%) |
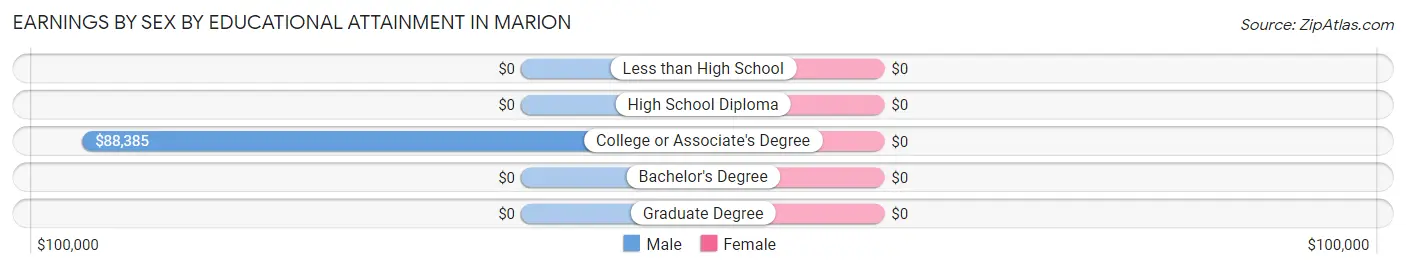
Earnings by Sex by Educational Attainment in Marion
| Educational Attainment | Male Income | Female Income |
| Less than High School | - | - |
| High School Diploma | - | - |
| College or Associate's Degree | $88,385 | $0 |
| Bachelor's Degree | - | - |
| Graduate Degree | - | - |
| Total | $49,070 | $12,727 |
Family Income in Marion
Family Income Brackets in Marion
According to the Marion family income data, there are 90 families falling into the $50,000 to $74,999 income range, which is the most common income bracket and makes up 34.7% of all families.
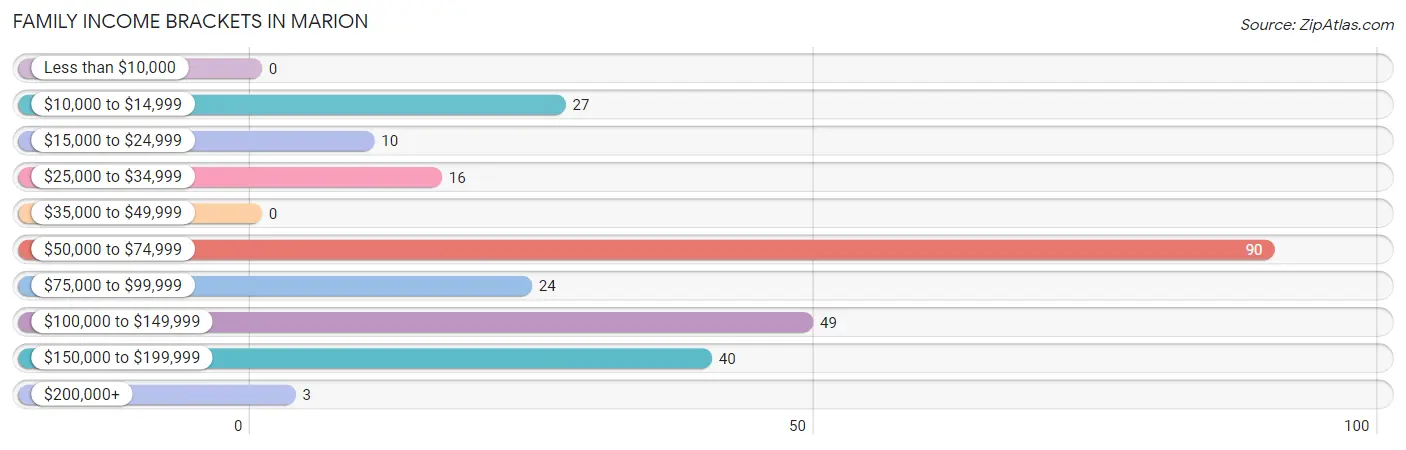
| Income Bracket | # Families | % Families |
| Less than $10,000 | 0 | 0.0% |
| $10,000 to $14,999 | 27 | 10.4% |
| $15,000 to $24,999 | 10 | 3.9% |
| $25,000 to $34,999 | 16 | 6.2% |
| $35,000 to $49,999 | 0 | 0.0% |
| $50,000 to $74,999 | 90 | 34.7% |
| $75,000 to $99,999 | 24 | 9.3% |
| $100,000 to $149,999 | 49 | 18.9% |
| $150,000 to $199,999 | 40 | 15.4% |
| $200,000+ | 3 | 1.2% |
Family Income by Famaliy Size in Marion
4-person families (66 | 25.5%) account for the highest median family income in Marion with $61,000 per family, while 2-person families (124 | 47.9%) have the highest median income of $25,938 per family member.
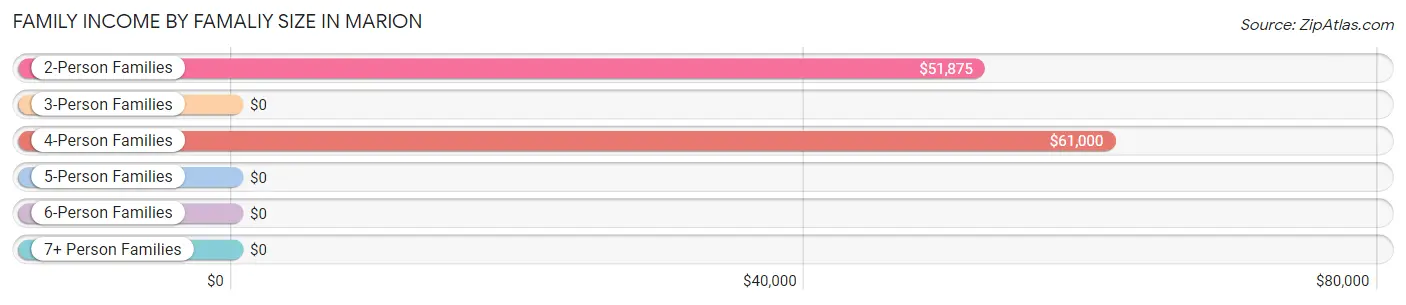
| Income Bracket | # Families | Median Income |
| 2-Person Families | 124 (47.9%) | $51,875 |
| 3-Person Families | 7 (2.7%) | $0 |
| 4-Person Families | 66 (25.5%) | $61,000 |
| 5-Person Families | 22 (8.5%) | $0 |
| 6-Person Families | 0 (0.0%) | $0 |
| 7+ Person Families | 40 (15.4%) | $0 |
| Total | 259 (100.0%) | $61,825 |
Family Income by Number of Earners in Marion
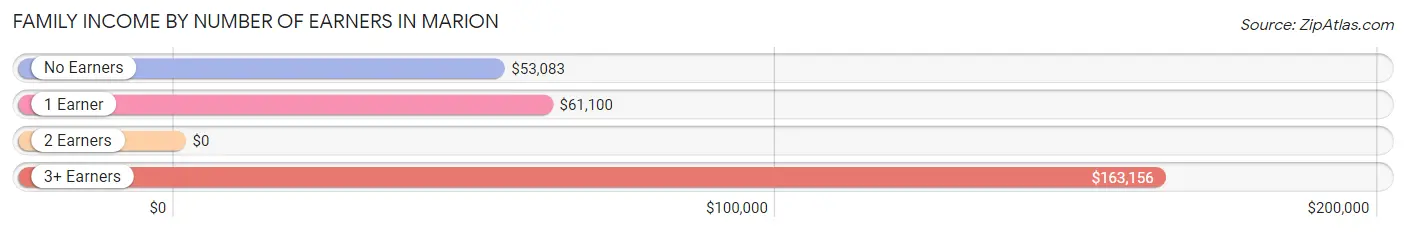
| Number of Earners | # Families | Median Income |
| No Earners | 59 (22.8%) | $53,083 |
| 1 Earner | 122 (47.1%) | $61,100 |
| 2 Earners | 13 (5.0%) | $0 |
| 3+ Earners | 65 (25.1%) | $163,156 |
| Total | 259 (100.0%) | $61,825 |
Household Income in Marion
Household Income Brackets in Marion
With 90 households falling in the category, the $50,000 to $74,999 income range is the most frequent in Marion, accounting for 25.3% of all households.
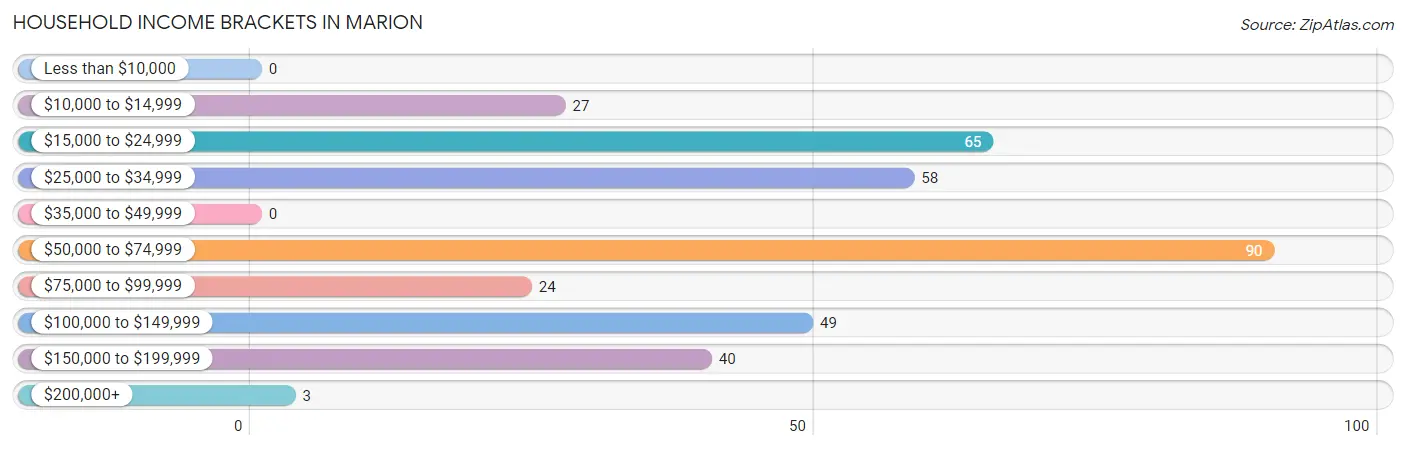
| Income Bracket | # Households | % Households |
| Less than $10,000 | 0 | 0.0% |
| $10,000 to $14,999 | 27 | 7.6% |
| $15,000 to $24,999 | 65 | 18.3% |
| $25,000 to $34,999 | 58 | 16.3% |
| $35,000 to $49,999 | 0 | 0.0% |
| $50,000 to $74,999 | 90 | 25.3% |
| $75,000 to $99,999 | 24 | 6.7% |
| $100,000 to $149,999 | 49 | 13.8% |
| $150,000 to $199,999 | 40 | 11.2% |
| $200,000+ | 3 | 0.8% |
Household Income by Householder Age in Marion
The median household income in Marion is $53,929, with the highest median household income of $162,938 found in the 45 to 64 years age bracket for the primary householder. A total of 72 households (20.2%) fall into this category. Meanwhile, the 15 to 24 years age bracket for the primary householder has the lowest median household income of $0, with 27 households (7.6%) in this group.
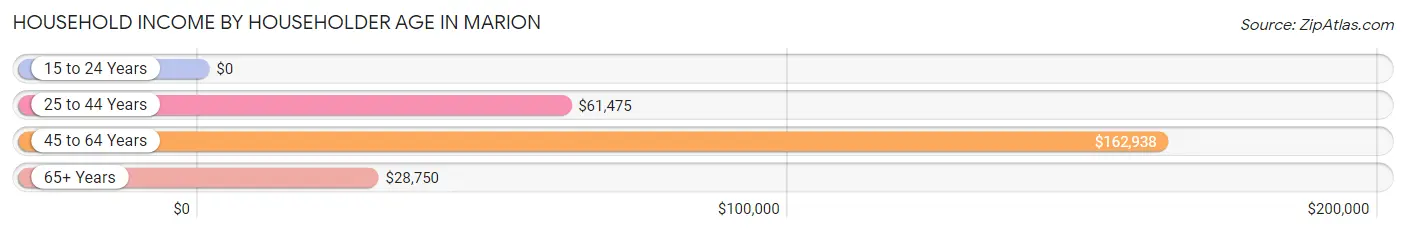
| Income Bracket | # Households | Median Income |
| 15 to 24 Years | 27 (7.6%) | $0 |
| 25 to 44 Years | 85 (23.9%) | $61,475 |
| 45 to 64 Years | 72 (20.2%) | $162,938 |
| 65+ Years | 172 (48.3%) | $28,750 |
| Total | 356 (100.0%) | $53,929 |
Poverty in Marion
Income Below Poverty by Sex and Age in Marion
With 12.1% poverty level for males and 7.0% for females among the residents of Marion, under 5 year old males and 18 to 24 year old females are the most vulnerable to poverty, with 31 males (63.3%) and 27 females (22.0%) in their respective age groups living below the poverty level.
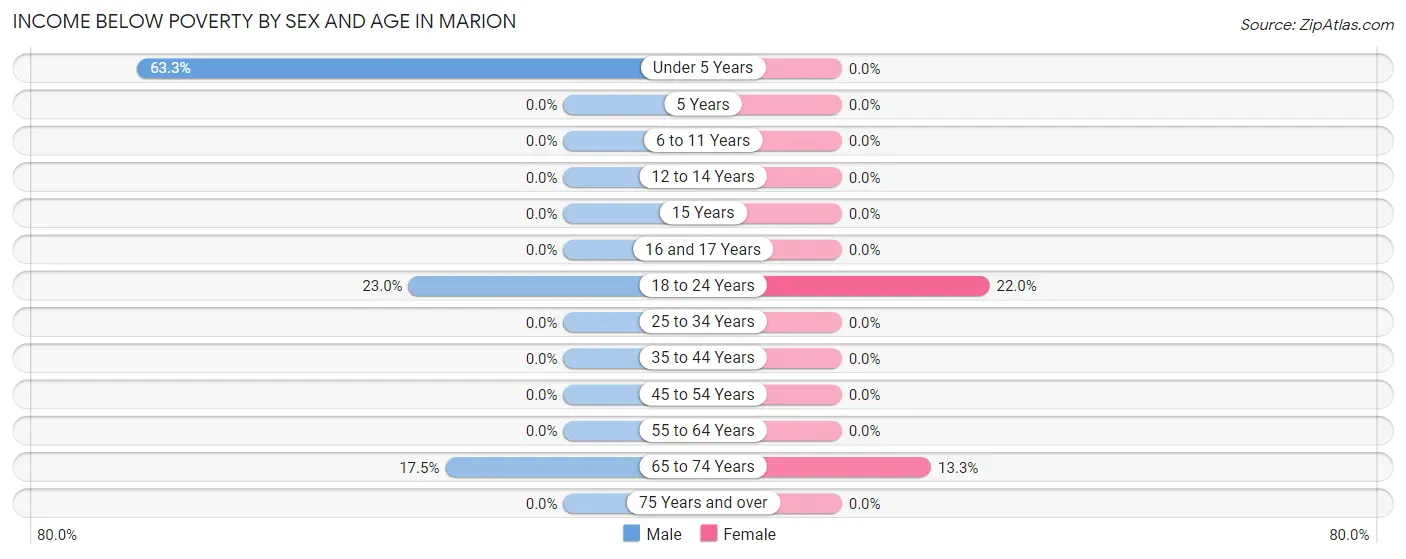
| Age Bracket | Male | Female |
| Under 5 Years | 31 (63.3%) | 0 (0.0%) |
| 5 Years | 0 (0.0%) | 0 (0.0%) |
| 6 to 11 Years | 0 (0.0%) | 0 (0.0%) |
| 12 to 14 Years | 0 (0.0%) | 0 (0.0%) |
| 15 Years | 0 (0.0%) | 0 (0.0%) |
| 16 and 17 Years | 0 (0.0%) | 0 (0.0%) |
| 18 to 24 Years | 26 (23.0%) | 27 (22.0%) |
| 25 to 34 Years | 0 (0.0%) | 0 (0.0%) |
| 35 to 44 Years | 0 (0.0%) | 0 (0.0%) |
| 45 to 54 Years | 0 (0.0%) | 0 (0.0%) |
| 55 to 64 Years | 0 (0.0%) | 0 (0.0%) |
| 65 to 74 Years | 10 (17.5%) | 13 (13.3%) |
| 75 Years and over | 0 (0.0%) | 0 (0.0%) |
| Total | 67 (12.1%) | 40 (7.0%) |
Income Above Poverty by Sex and Age in Marion
According to the poverty statistics in Marion, males aged 12 to 14 years and females aged under 5 years are the age groups that are most secure financially, with 100.0% of males and 100.0% of females in these age groups living above the poverty line.
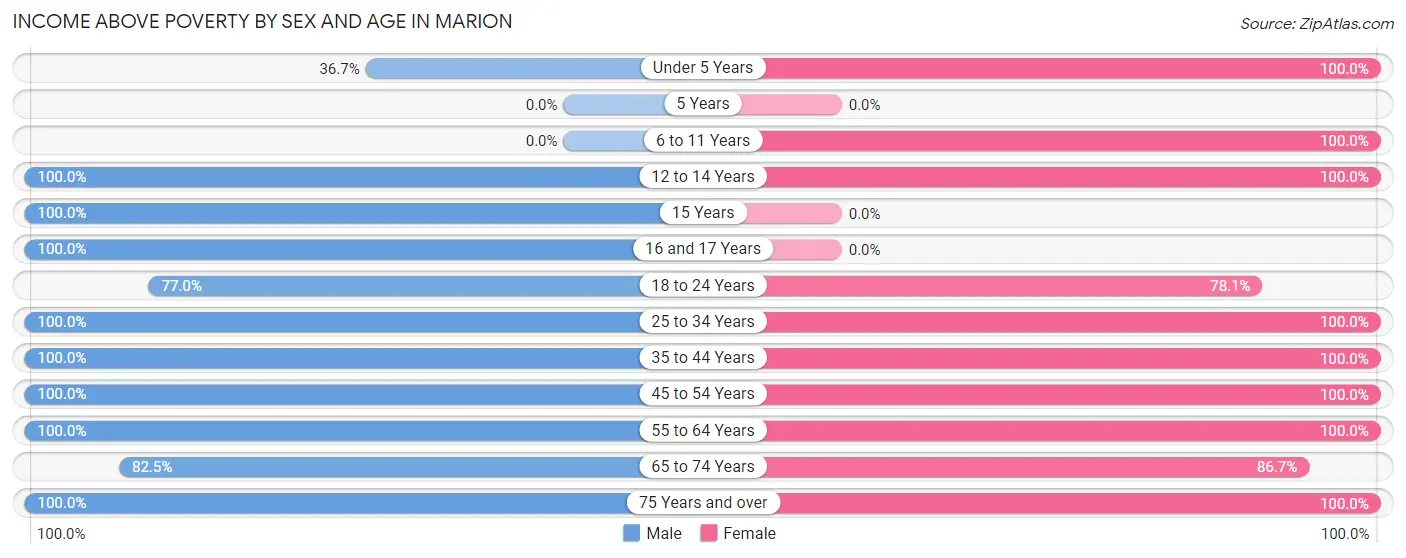
| Age Bracket | Male | Female |
| Under 5 Years | 18 (36.7%) | 18 (100.0%) |
| 5 Years | 0 (0.0%) | 0 (0.0%) |
| 6 to 11 Years | 0 (0.0%) | 42 (100.0%) |
| 12 to 14 Years | 45 (100.0%) | 51 (100.0%) |
| 15 Years | 14 (100.0%) | 0 (0.0%) |
| 16 and 17 Years | 42 (100.0%) | 0 (0.0%) |
| 18 to 24 Years | 87 (77.0%) | 96 (78.0%) |
| 25 to 34 Years | 79 (100.0%) | 53 (100.0%) |
| 35 to 44 Years | 46 (100.0%) | 44 (100.0%) |
| 45 to 54 Years | 16 (100.0%) | 40 (100.0%) |
| 55 to 64 Years | 74 (100.0%) | 32 (100.0%) |
| 65 to 74 Years | 47 (82.5%) | 85 (86.7%) |
| 75 Years and over | 18 (100.0%) | 72 (100.0%) |
| Total | 486 (87.9%) | 533 (93.0%) |
Income Below Poverty Among Married-Couple Families in Marion
The poverty statistics for married-couple families in Marion show that 4.3% or 10 of the total 232 families live below the poverty line. Families with no children have the highest poverty rate of 9.3%, comprising of 10 families. On the other hand, families with 1 or 2 children have the lowest poverty rate of 0.0%, which includes 0 families.
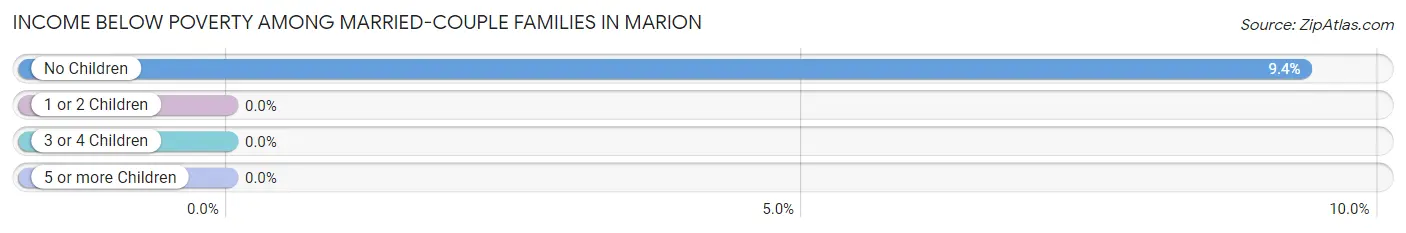
| Children | Above Poverty | Below Poverty |
| No Children | 97 (90.6%) | 10 (9.3%) |
| 1 or 2 Children | 85 (100.0%) | 0 (0.0%) |
| 3 or 4 Children | 40 (100.0%) | 0 (0.0%) |
| 5 or more Children | 0 (0.0%) | 0 (0.0%) |
| Total | 222 (95.7%) | 10 (4.3%) |
Income Below Poverty Among Single-Parent Households in Marion
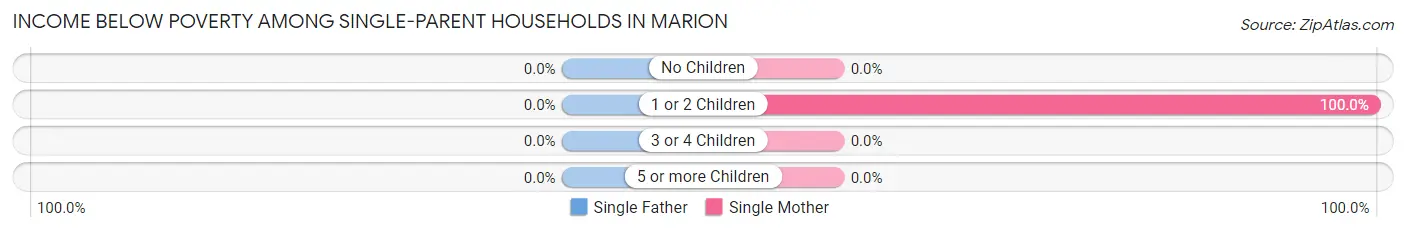
| Children | Single Father | Single Mother |
| No Children | 0 (0.0%) | 0 (0.0%) |
| 1 or 2 Children | 0 (0.0%) | 27 (100.0%) |
| 3 or 4 Children | 0 (0.0%) | 0 (0.0%) |
| 5 or more Children | 0 (0.0%) | 0 (0.0%) |
| Total | 0 (0.0%) | 27 (100.0%) |
Income Below Poverty Among Married-Couple vs Single-Parent Households in Marion
The poverty data for Marion shows that 10 of the married-couple family households (4.3%) and 27 of the single-parent households (100.0%) are living below the poverty level. Within the married-couple family households, those with no children have the highest poverty rate, with 10 households (9.3%) falling below the poverty line. Among the single-parent households, those with 1 or 2 children have the highest poverty rate, with 27 household (100.0%) living below poverty.
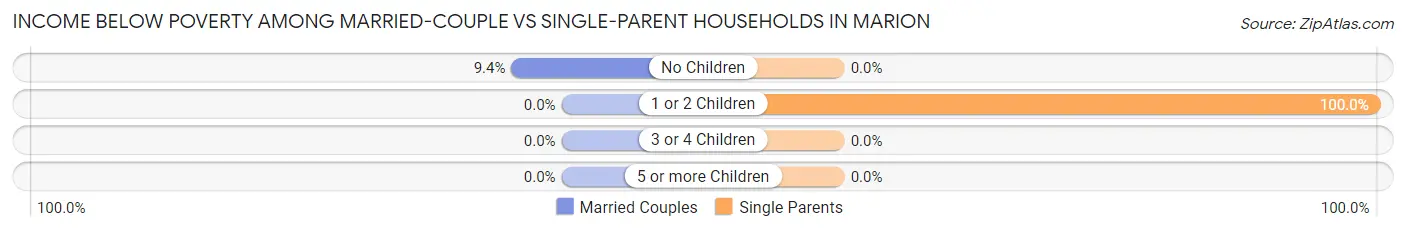
| Children | Married-Couple Families | Single-Parent Households |
| No Children | 10 (9.3%) | 0 (0.0%) |
| 1 or 2 Children | 0 (0.0%) | 27 (100.0%) |
| 3 or 4 Children | 0 (0.0%) | 0 (0.0%) |
| 5 or more Children | 0 (0.0%) | 0 (0.0%) |
| Total | 10 (4.3%) | 27 (100.0%) |
Race in Marion
The most populous races in Marion are White / Caucasian (1,040 | 92.4%), Asian (50 | 4.4%), and Two or more Races (36 | 3.2%).
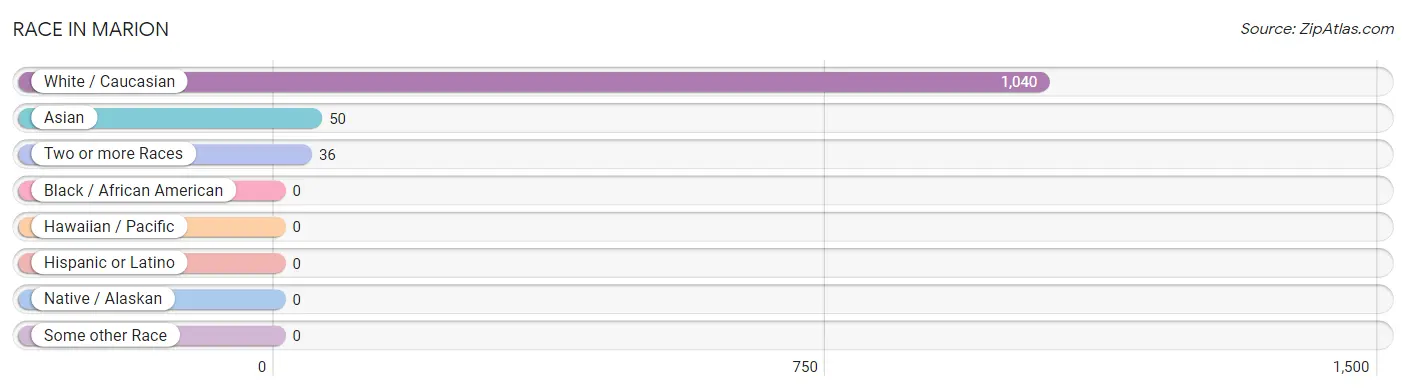
| Race | # Population | % Population |
| Asian | 50 | 4.4% |
| Black / African American | 0 | 0.0% |
| Hawaiian / Pacific | 0 | 0.0% |
| Hispanic or Latino | 0 | 0.0% |
| Native / Alaskan | 0 | 0.0% |
| White / Caucasian | 1,040 | 92.4% |
| Two or more Races | 36 | 3.2% |
| Some other Race | 0 | 0.0% |
| Total | 1,126 | 100.0% |
Ancestry in Marion
The most populous ancestries reported in Marion are German (525 | 46.6%), French (294 | 26.1%), English (175 | 15.5%), American (106 | 9.4%), and Korean (86 | 7.6%), together accounting for 105.3% of all Marion residents.
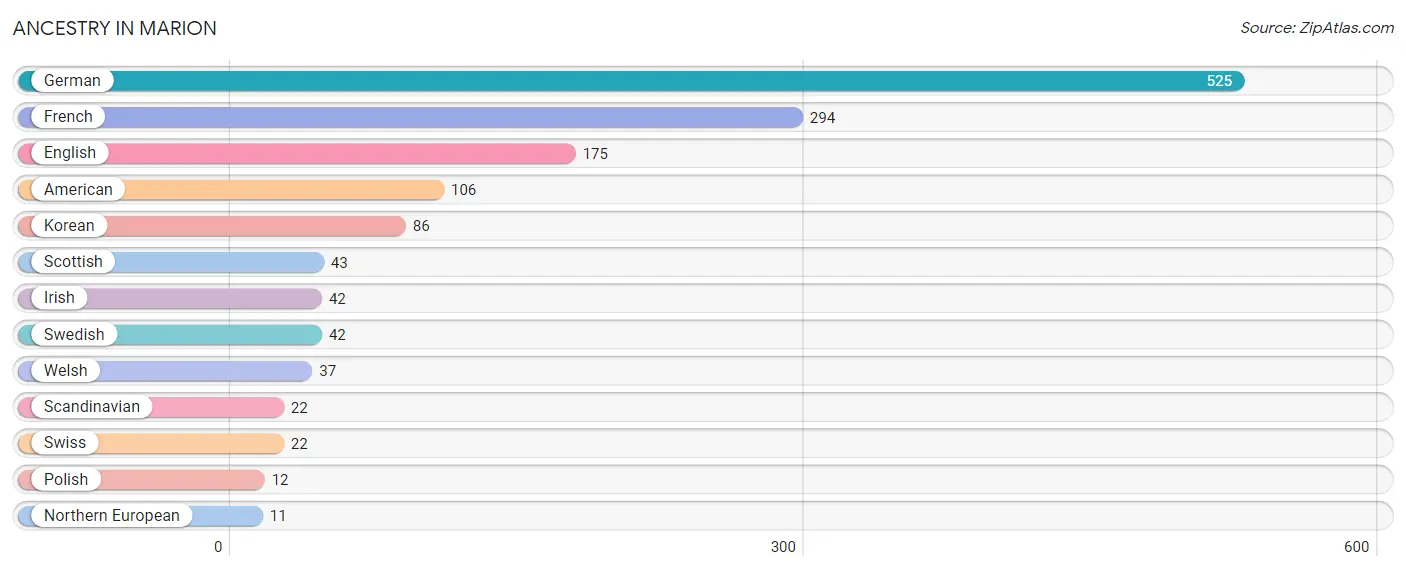
| Ancestry | # Population | % Population |
| American | 106 | 9.4% |
| English | 175 | 15.5% |
| French | 294 | 26.1% |
| German | 525 | 46.6% |
| Irish | 42 | 3.7% |
| Korean | 86 | 7.6% |
| Northern European | 11 | 1.0% |
| Polish | 12 | 1.1% |
| Scandinavian | 22 | 1.9% |
| Scottish | 43 | 3.8% |
| Swedish | 42 | 3.7% |
| Swiss | 22 | 1.9% |
| Welsh | 37 | 3.3% | View All 13 Rows |
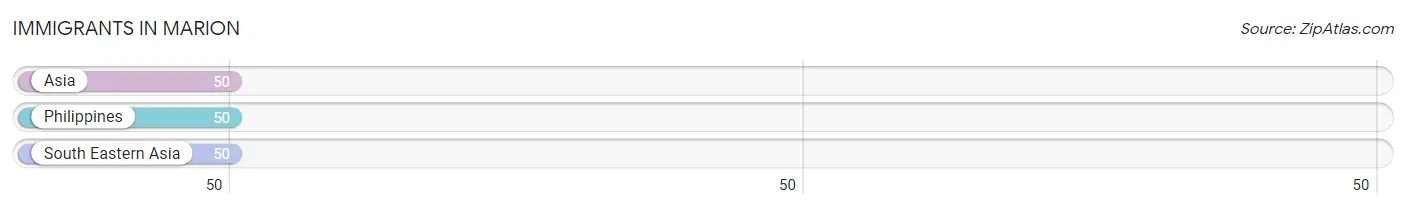
Immigrants in Marion
The most numerous immigrant groups reported in Marion came from Asia (50 | 4.4%), Philippines (50 | 4.4%), and South Eastern Asia (50 | 4.4%), together accounting for 13.3% of all Marion residents.
| Immigration Origin | # Population | % Population |
| Asia | 50 | 4.4% |
| Philippines | 50 | 4.4% |
| South Eastern Asia | 50 | 4.4% | View All 3 Rows |
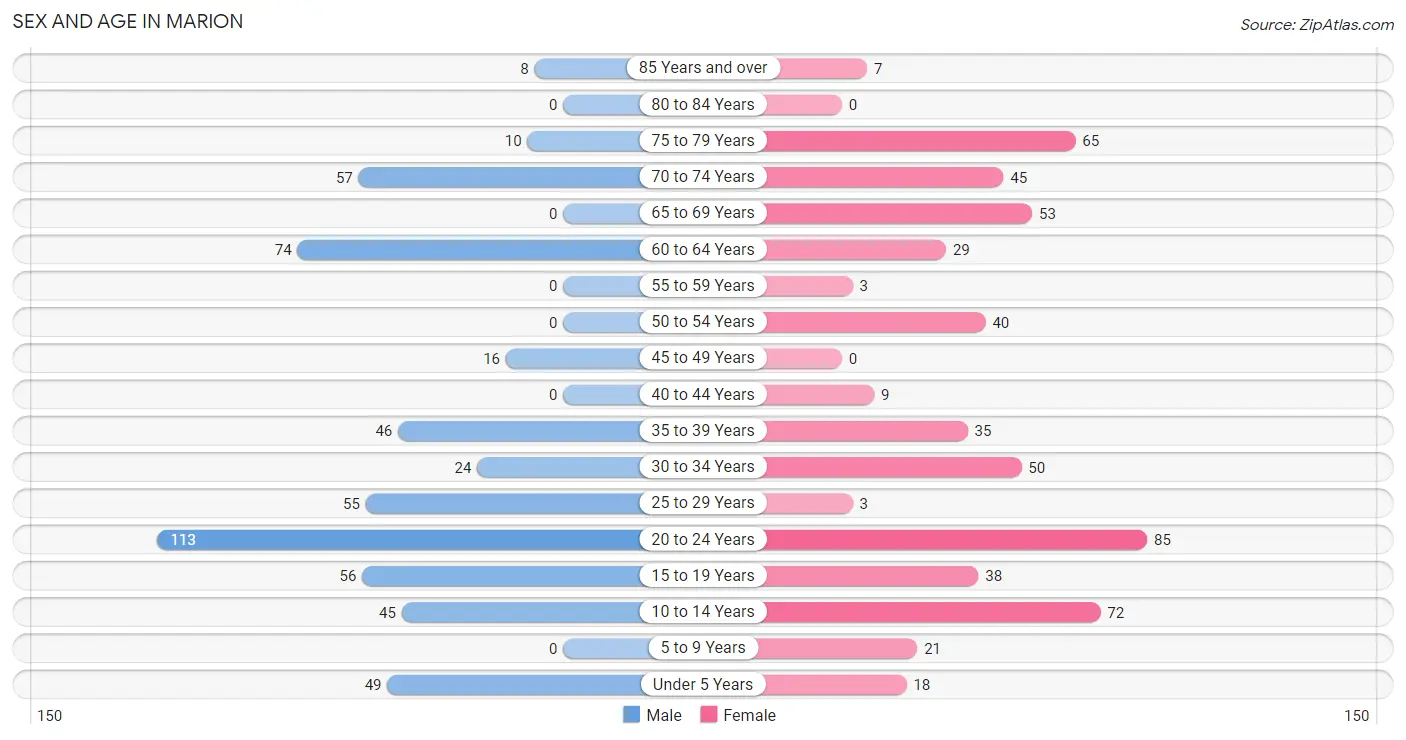
Sex and Age in Marion
Sex and Age in Marion
The most populous age groups in Marion are 20 to 24 Years (113 | 20.4%) for men and 20 to 24 Years (85 | 14.8%) for women.
| Age Bracket | Male | Female |
| Under 5 Years | 49 (8.9%) | 18 (3.1%) |
| 5 to 9 Years | 0 (0.0%) | 21 (3.7%) |
| 10 to 14 Years | 45 (8.1%) | 72 (12.6%) |
| 15 to 19 Years | 56 (10.1%) | 38 (6.6%) |
| 20 to 24 Years | 113 (20.4%) | 85 (14.8%) |
| 25 to 29 Years | 55 (10.0%) | 3 (0.5%) |
| 30 to 34 Years | 24 (4.3%) | 50 (8.7%) |
| 35 to 39 Years | 46 (8.3%) | 35 (6.1%) |
| 40 to 44 Years | 0 (0.0%) | 9 (1.6%) |
| 45 to 49 Years | 16 (2.9%) | 0 (0.0%) |
| 50 to 54 Years | 0 (0.0%) | 40 (7.0%) |
| 55 to 59 Years | 0 (0.0%) | 3 (0.5%) |
| 60 to 64 Years | 74 (13.4%) | 29 (5.1%) |
| 65 to 69 Years | 0 (0.0%) | 53 (9.2%) |
| 70 to 74 Years | 57 (10.3%) | 45 (7.9%) |
| 75 to 79 Years | 10 (1.8%) | 65 (11.3%) |
| 80 to 84 Years | 0 (0.0%) | 0 (0.0%) |
| 85 Years and over | 8 (1.5%) | 7 (1.2%) |
| Total | 553 (100.0%) | 573 (100.0%) |
Families and Households in Marion
Median Family Size in Marion
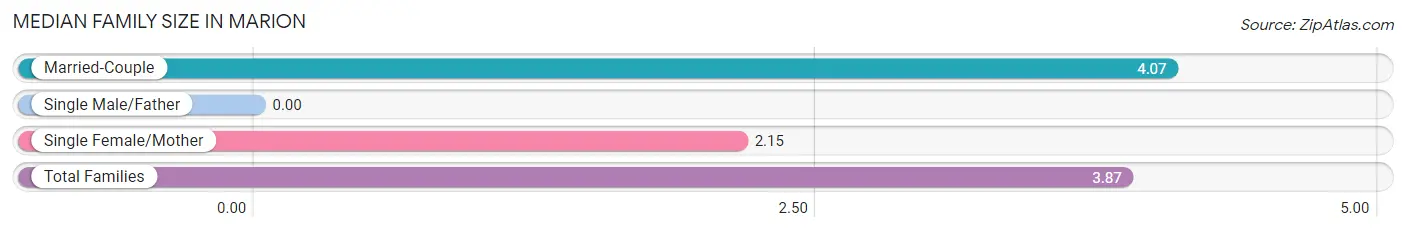
| Family Type | # Families | Family Size |
| Married-Couple | 232 (89.6%) | 4.07 |
| Single Male/Father | 0 (0.0%) | - |
| Single Female/Mother | 27 (10.4%) | 2.15 |
| Total Families | 259 (100.0%) | 3.87 |
Median Household Size in Marion
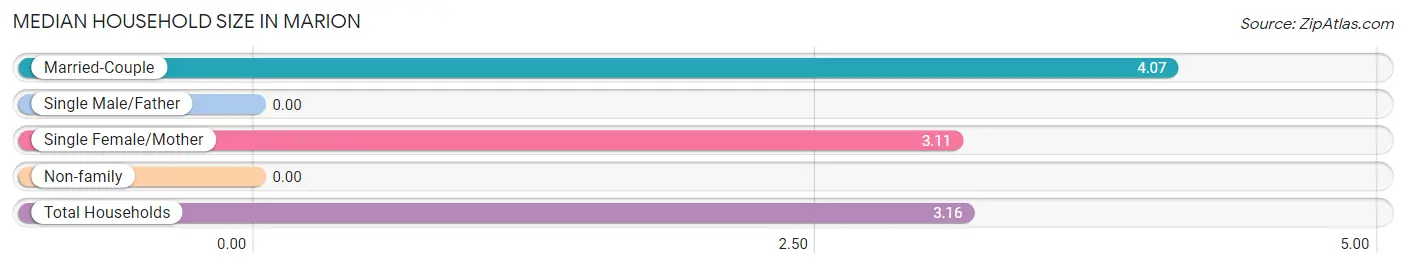
| Household Type | # Households | Household Size |
| Married-Couple | 232 (65.2%) | 4.07 |
| Single Male/Father | 0 (0.0%) | - |
| Single Female/Mother | 27 (7.6%) | 3.11 |
| Non-family | 97 (27.3%) | - |
| Total Households | 356 (100.0%) | 3.16 |
Household Size by Marriage Status in Marion
Out of a total of 356 households in Marion, 259 (72.8%) are family households, while 97 (27.3%) are nonfamily households. The most numerous type of family households are 2-person households, comprising 97, and the most common type of nonfamily households are 1-person households, comprising 97.
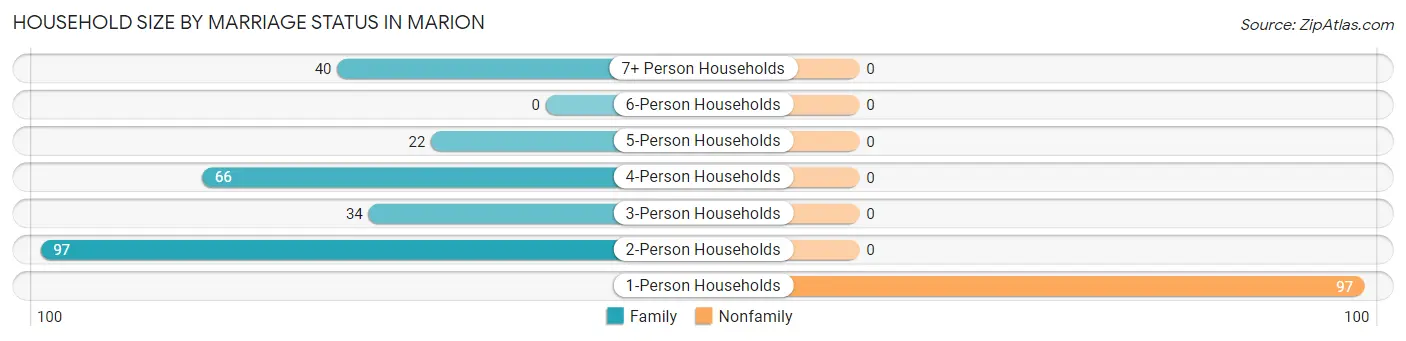
| Household Size | Family Households | Nonfamily Households |
| 1-Person Households | - | 97 (27.3%) |
| 2-Person Households | 97 (27.3%) | 0 (0.0%) |
| 3-Person Households | 34 (9.6%) | 0 (0.0%) |
| 4-Person Households | 66 (18.5%) | 0 (0.0%) |
| 5-Person Households | 22 (6.2%) | 0 (0.0%) |
| 6-Person Households | 0 (0.0%) | 0 (0.0%) |
| 7+ Person Households | 40 (11.2%) | 0 (0.0%) |
| Total | 259 (72.8%) | 97 (27.3%) |
Female Fertility in Marion
Fertility by Age in Marion
Average fertility rate in Marion is 227.0 births per 1,000 women. Women in the age bracket of 20 to 34 years have the highest fertility rate with 362.0 births per 1,000 women. Women in the age bracket of 20 to 34 years acount for 100.0% of all women with births.
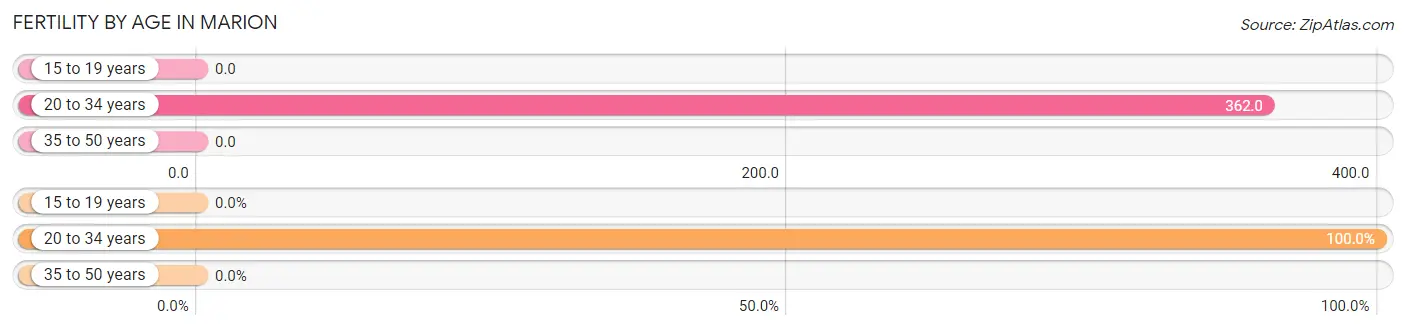
| Age Bracket | Women with Births | Births / 1,000 Women |
| 15 to 19 years | 0 (0.0%) | 0.0 |
| 20 to 34 years | 50 (100.0%) | 362.0 |
| 35 to 50 years | 0 (0.0%) | 0.0 |
| Total | 50 (100.0%) | 227.0 |
Fertility by Age by Marriage Status in Marion
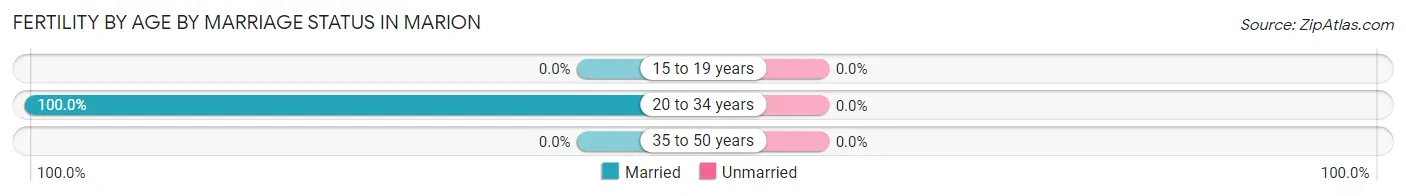
| Age Bracket | Married | Unmarried |
| 15 to 19 years | 0 (0.0%) | 0 (0.0%) |
| 20 to 34 years | 50 (100.0%) | 0 (0.0%) |
| 35 to 50 years | 0 (0.0%) | 0 (0.0%) |
| Total | 50 (100.0%) | 0 (0.0%) |
Fertility by Education in Marion
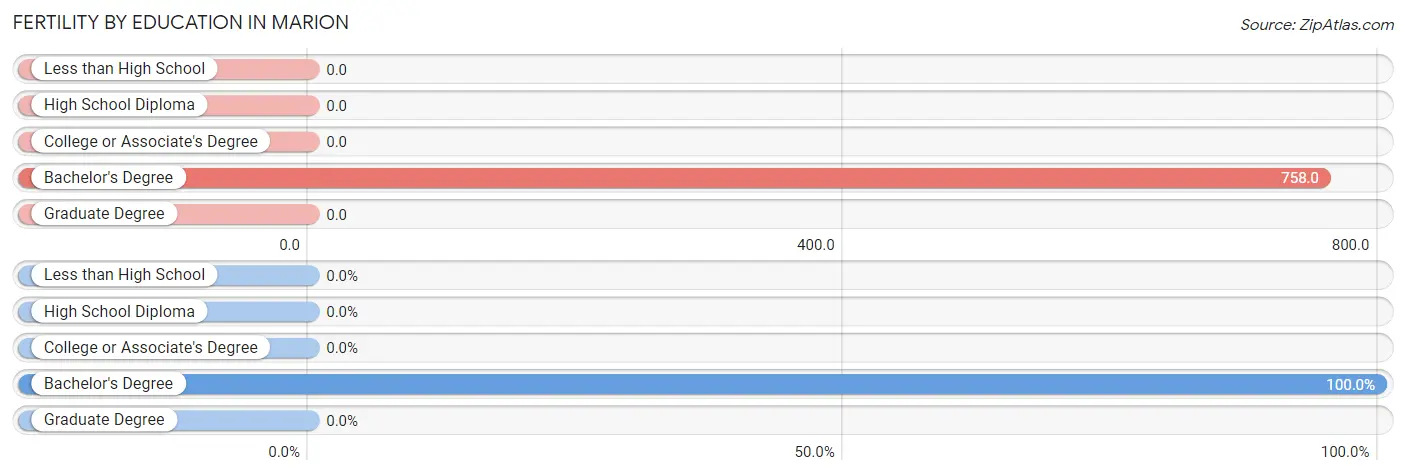
| Educational Attainment | Women with Births | Births / 1,000 Women |
| Less than High School | 0 (0.0%) | 0.0 |
| High School Diploma | 0 (0.0%) | 0.0 |
| College or Associate's Degree | 0 (0.0%) | 0.0 |
| Bachelor's Degree | 50 (100.0%) | 758.0 |
| Graduate Degree | 0 (0.0%) | 0.0 |
| Total | 50 (100.0%) | 227.0 |
Fertility by Education by Marriage Status in Marion
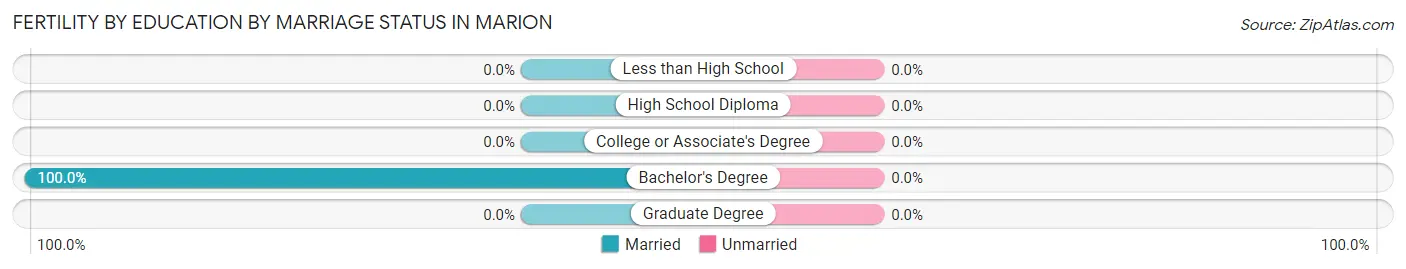
| Educational Attainment | Married | Unmarried |
| Less than High School | 0 (0.0%) | 0 (0.0%) |
| High School Diploma | 0 (0.0%) | 0 (0.0%) |
| College or Associate's Degree | 0 (0.0%) | 0 (0.0%) |
| Bachelor's Degree | 50 (100.0%) | 0 (0.0%) |
| Graduate Degree | 0 (0.0%) | 0 (0.0%) |
| Total | 50 (100.0%) | 0 (0.0%) |
Employment Characteristics in Marion
Employment by Class of Employer in Marion
Among the 444 employed individuals in Marion, private company employees (220 | 49.5%), self-employed (not incorporated) (124 | 27.9%), and federal government employees (60 | 13.5%) make up the most common classes of employment.
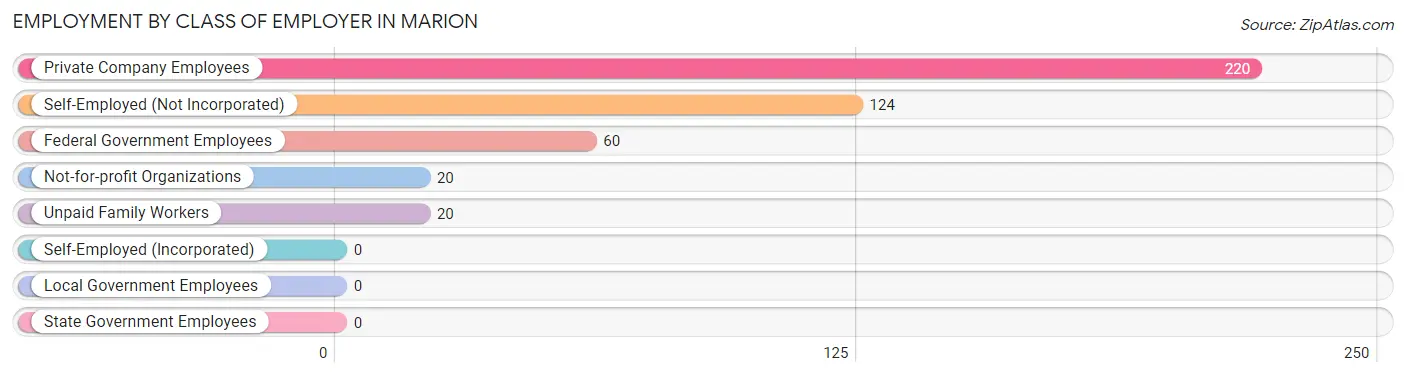
| Employer Class | # Employees | % Employees |
| Private Company Employees | 220 | 49.5% |
| Self-Employed (Incorporated) | 0 | 0.0% |
| Self-Employed (Not Incorporated) | 124 | 27.9% |
| Not-for-profit Organizations | 20 | 4.5% |
| Local Government Employees | 0 | 0.0% |
| State Government Employees | 0 | 0.0% |
| Federal Government Employees | 60 | 13.5% |
| Unpaid Family Workers | 20 | 4.5% |
| Total | 444 | 100.0% |
Employment Status by Age in Marion
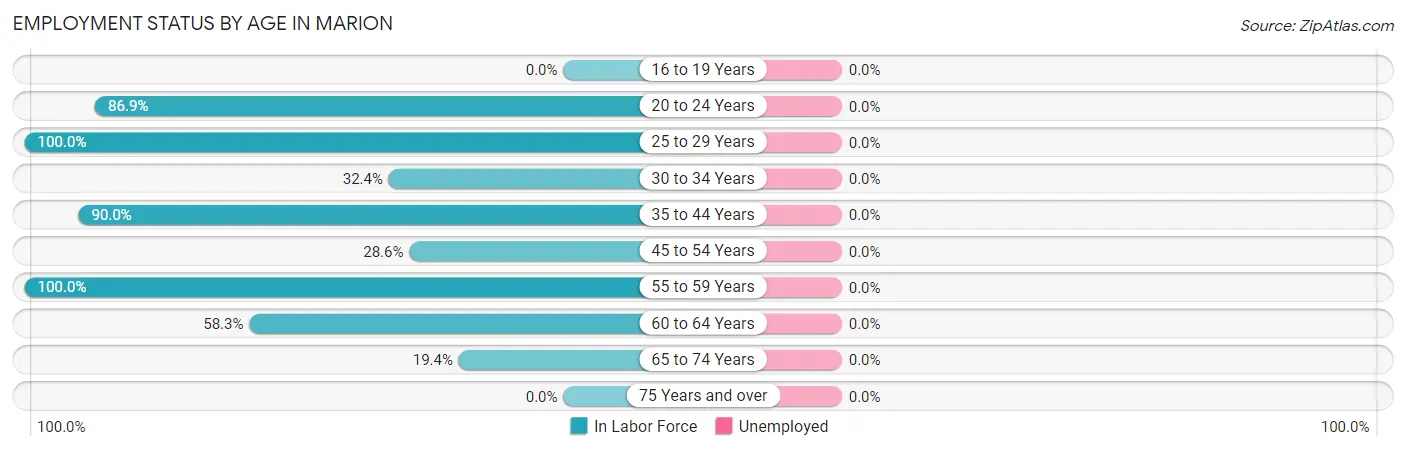
| Age Bracket | In Labor Force | Unemployed |
| 16 to 19 Years | 0 (0.0%) | 0 (0.0%) |
| 20 to 24 Years | 172 (86.9%) | 0 (0.0%) |
| 25 to 29 Years | 58 (100.0%) | 0 (0.0%) |
| 30 to 34 Years | 24 (32.4%) | 0 (0.0%) |
| 35 to 44 Years | 81 (90.0%) | 0 (0.0%) |
| 45 to 54 Years | 16 (28.6%) | 0 (0.0%) |
| 55 to 59 Years | 3 (100.0%) | 0 (0.0%) |
| 60 to 64 Years | 60 (58.3%) | 0 (0.0%) |
| 65 to 74 Years | 30 (19.4%) | 0 (0.0%) |
| 75 Years and over | 0 (0.0%) | 0 (0.0%) |
| Total | 444 (49.0%) | 0 (0.0%) |
Employment Status by Educational Attainment in Marion
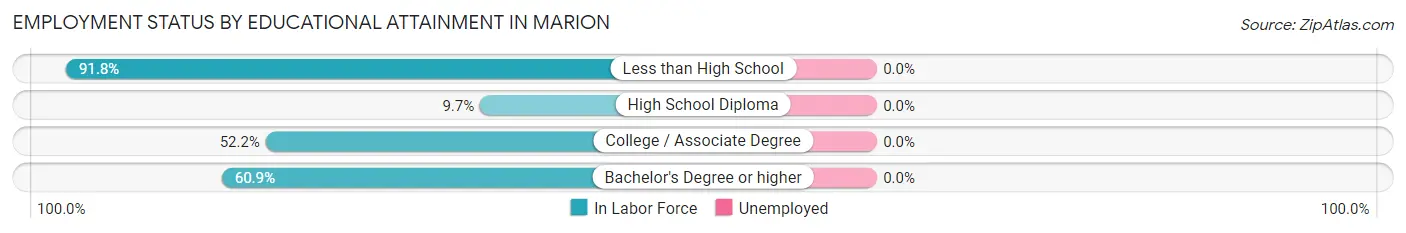
| Educational Attainment | In Labor Force | Unemployed |
| Less than High School | 101 (91.8%) | 0 (0.0%) |
| High School Diploma | 3 (9.7%) | 0 (0.0%) |
| College / Associate Degree | 60 (52.2%) | 0 (0.0%) |
| Bachelor's Degree or higher | 78 (60.9%) | 0 (0.0%) |
| Total | 242 (63.0%) | 0 (0.0%) |
Employment Occupations by Sex in Marion
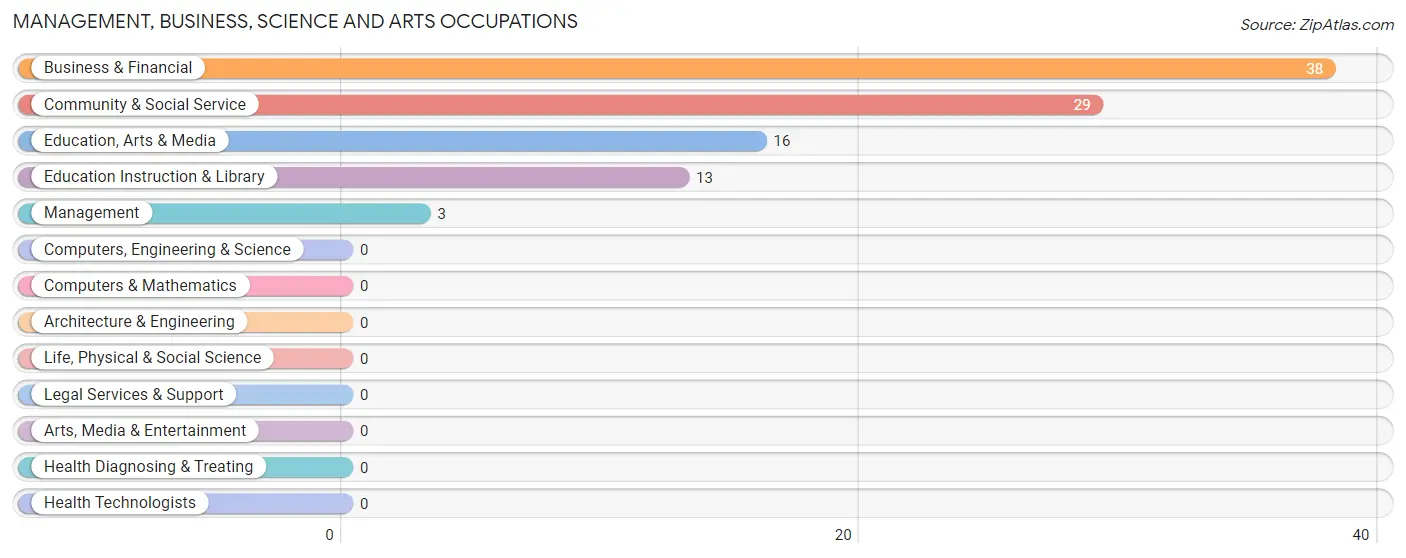
Management, Business, Science and Arts Occupations
The most common Management, Business, Science and Arts occupations in Marion are Business & Financial (38 | 8.6%), Community & Social Service (29 | 6.5%), Education, Arts & Media (16 | 3.6%), Education Instruction & Library (13 | 2.9%), and Management (3 | 0.7%).
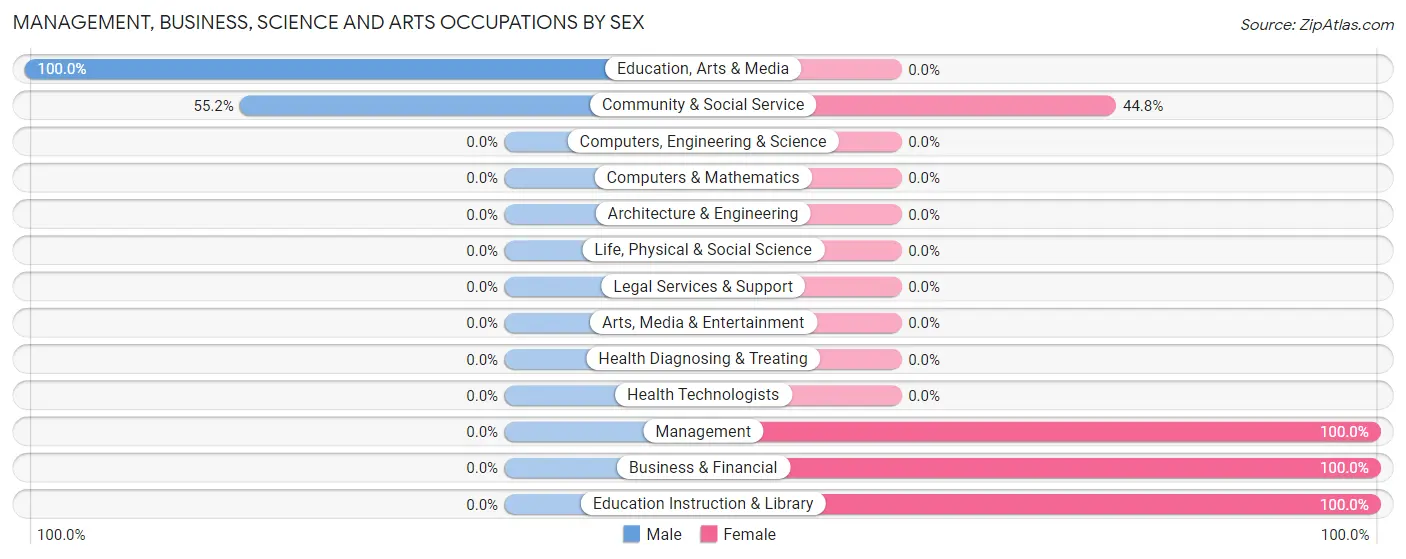
Management, Business, Science and Arts Occupations by Sex
Within the Management, Business, Science and Arts occupations in Marion, the most male-oriented occupations are Education, Arts & Media (100.0%), and Community & Social Service (55.2%), while the most female-oriented occupations are Management (100.0%), Business & Financial (100.0%), and Education Instruction & Library (100.0%).
| Occupation | Male | Female |
| Management | 0 (0.0%) | 3 (100.0%) |
| Business & Financial | 0 (0.0%) | 38 (100.0%) |
| Computers, Engineering & Science | 0 (0.0%) | 0 (0.0%) |
| Computers & Mathematics | 0 (0.0%) | 0 (0.0%) |
| Architecture & Engineering | 0 (0.0%) | 0 (0.0%) |
| Life, Physical & Social Science | 0 (0.0%) | 0 (0.0%) |
| Community & Social Service | 16 (55.2%) | 13 (44.8%) |
| Education, Arts & Media | 16 (100.0%) | 0 (0.0%) |
| Legal Services & Support | 0 (0.0%) | 0 (0.0%) |
| Education Instruction & Library | 0 (0.0%) | 13 (100.0%) |
| Arts, Media & Entertainment | 0 (0.0%) | 0 (0.0%) |
| Health Diagnosing & Treating | 0 (0.0%) | 0 (0.0%) |
| Health Technologists | 0 (0.0%) | 0 (0.0%) |
| Total (Category) | 16 (22.9%) | 54 (77.1%) |
| Total (Overall) | 307 (69.1%) | 137 (30.9%) |
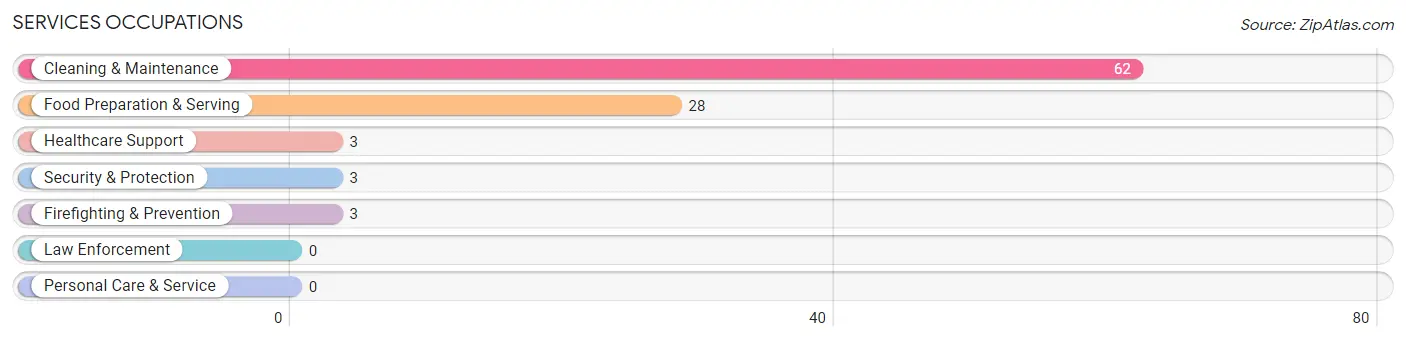
Services Occupations
The most common Services occupations in Marion are Cleaning & Maintenance (62 | 14.0%), Food Preparation & Serving (28 | 6.3%), Healthcare Support (3 | 0.7%), Security & Protection (3 | 0.7%), and Firefighting & Prevention (3 | 0.7%).
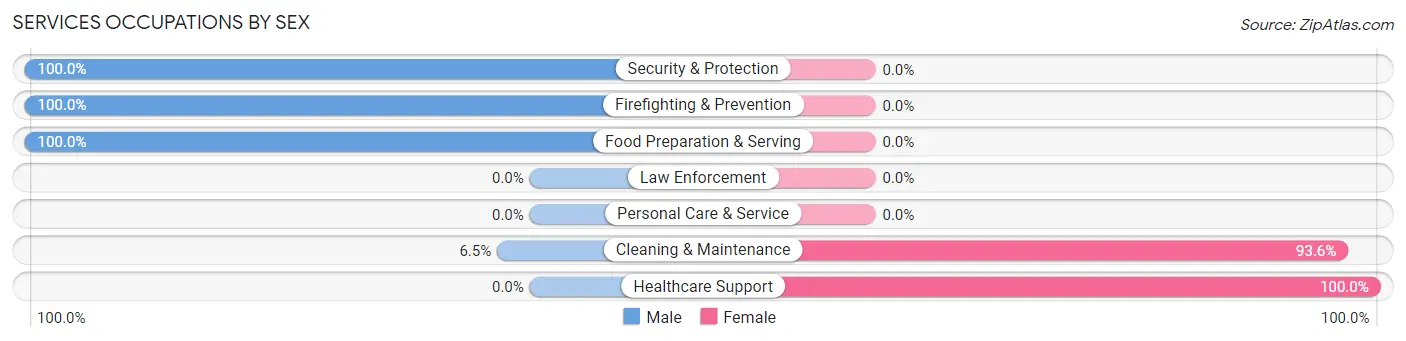
Services Occupations by Sex
Within the Services occupations in Marion, the most male-oriented occupations are Security & Protection (100.0%), Firefighting & Prevention (100.0%), and Food Preparation & Serving (100.0%), while the most female-oriented occupations are Healthcare Support (100.0%), and Cleaning & Maintenance (93.5%).
| Occupation | Male | Female |
| Healthcare Support | 0 (0.0%) | 3 (100.0%) |
| Security & Protection | 3 (100.0%) | 0 (0.0%) |
| Firefighting & Prevention | 3 (100.0%) | 0 (0.0%) |
| Law Enforcement | 0 (0.0%) | 0 (0.0%) |
| Food Preparation & Serving | 28 (100.0%) | 0 (0.0%) |
| Cleaning & Maintenance | 4 (6.5%) | 58 (93.5%) |
| Personal Care & Service | 0 (0.0%) | 0 (0.0%) |
| Total (Category) | 35 (36.5%) | 61 (63.5%) |
| Total (Overall) | 307 (69.1%) | 137 (30.9%) |
Sales and Office Occupations
The most common Sales and Office occupations in Marion are Office & Administration (77 | 17.3%), and Sales & Related (7 | 1.6%).
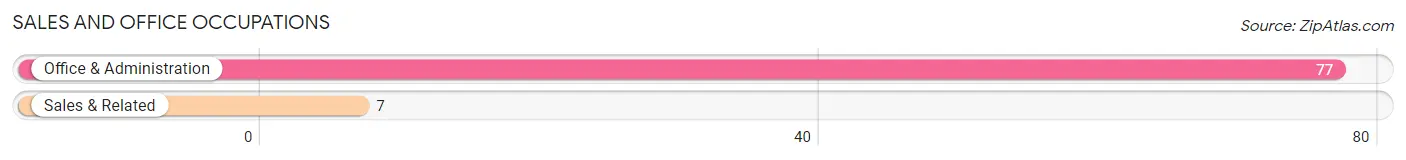
Sales and Office Occupations by Sex
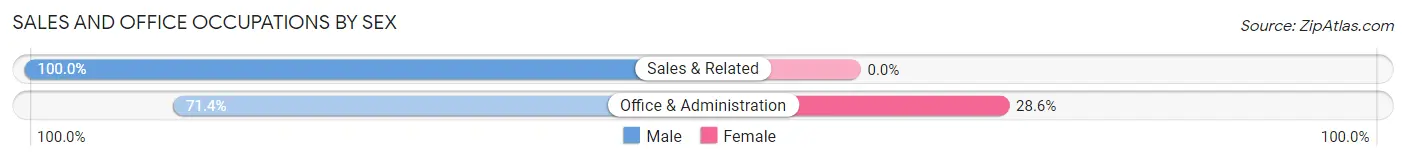
| Occupation | Male | Female |
| Sales & Related | 7 (100.0%) | 0 (0.0%) |
| Office & Administration | 55 (71.4%) | 22 (28.6%) |
| Total (Category) | 62 (73.8%) | 22 (26.2%) |
| Total (Overall) | 307 (69.1%) | 137 (30.9%) |
Natural Resources, Construction and Maintenance Occupations
The most common Natural Resources, Construction and Maintenance occupations in Marion are Construction & Extraction (110 | 24.8%), and Installation, Maintenance & Repair (24 | 5.4%).
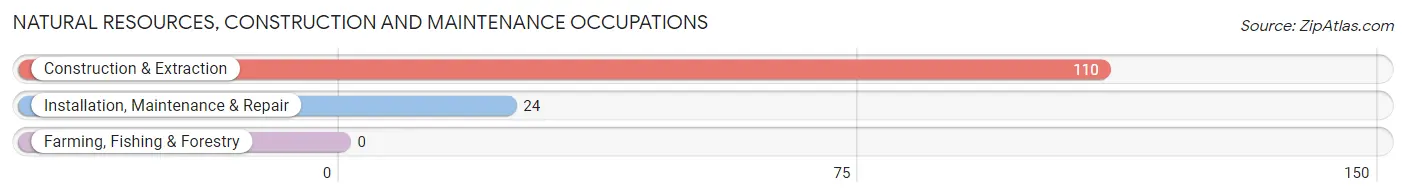
Natural Resources, Construction and Maintenance Occupations by Sex
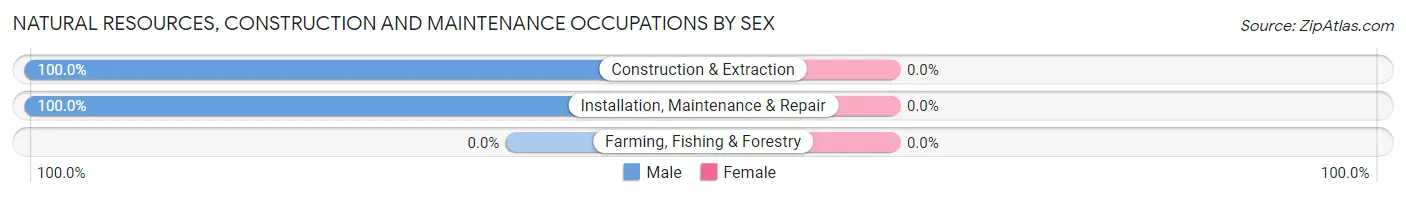
| Occupation | Male | Female |
| Farming, Fishing & Forestry | 0 (0.0%) | 0 (0.0%) |
| Construction & Extraction | 110 (100.0%) | 0 (0.0%) |
| Installation, Maintenance & Repair | 24 (100.0%) | 0 (0.0%) |
| Total (Category) | 134 (100.0%) | 0 (0.0%) |
| Total (Overall) | 307 (69.1%) | 137 (30.9%) |
Production, Transportation and Moving Occupations
The most common Production, Transportation and Moving occupations in Marion are Transportation (46 | 10.4%), and Material Moving (14 | 3.2%).
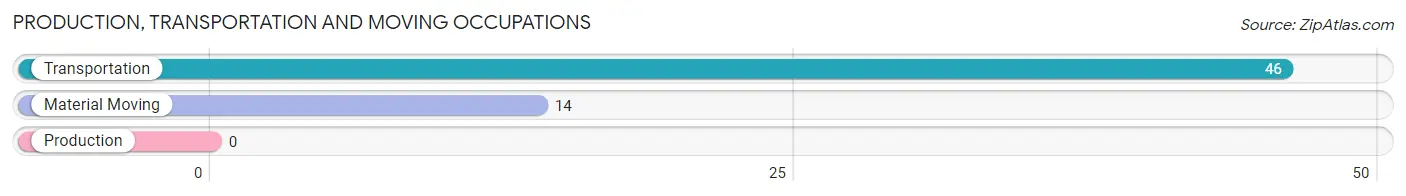
Production, Transportation and Moving Occupations by Sex
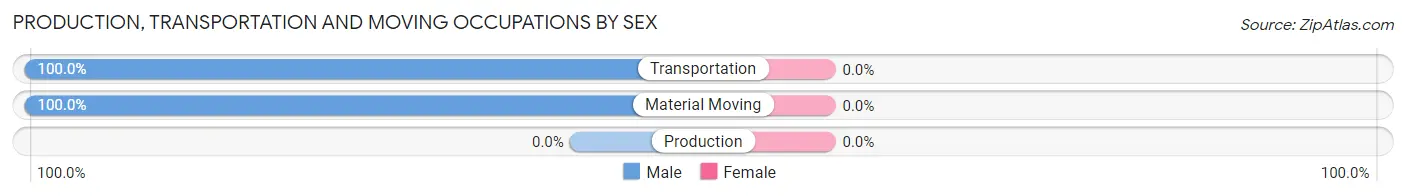
| Occupation | Male | Female |
| Production | 0 (0.0%) | 0 (0.0%) |
| Transportation | 46 (100.0%) | 0 (0.0%) |
| Material Moving | 14 (100.0%) | 0 (0.0%) |
| Total (Category) | 60 (100.0%) | 0 (0.0%) |
| Total (Overall) | 307 (69.1%) | 137 (30.9%) |
Employment Industries by Sex in Marion
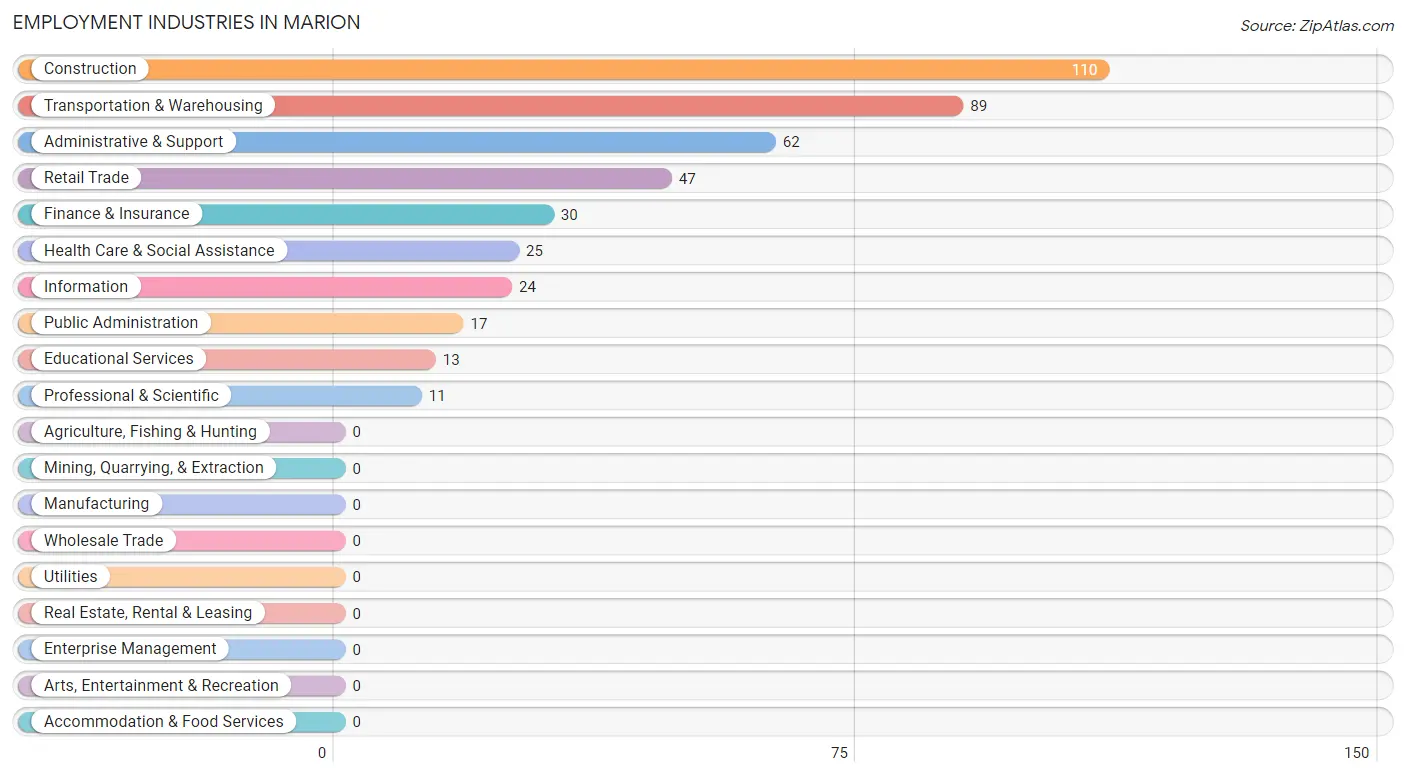
Employment Industries in Marion
The major employment industries in Marion include Construction (110 | 24.8%), Transportation & Warehousing (89 | 20.1%), Administrative & Support (62 | 14.0%), Retail Trade (47 | 10.6%), and Finance & Insurance (30 | 6.8%).
Employment Industries by Sex in Marion
The Marion industries that see more men than women are Construction (100.0%), Retail Trade (100.0%), and Transportation & Warehousing (100.0%), whereas the industries that tend to have a higher number of women are Finance & Insurance (100.0%), Professional & Scientific (100.0%), and Educational Services (100.0%).
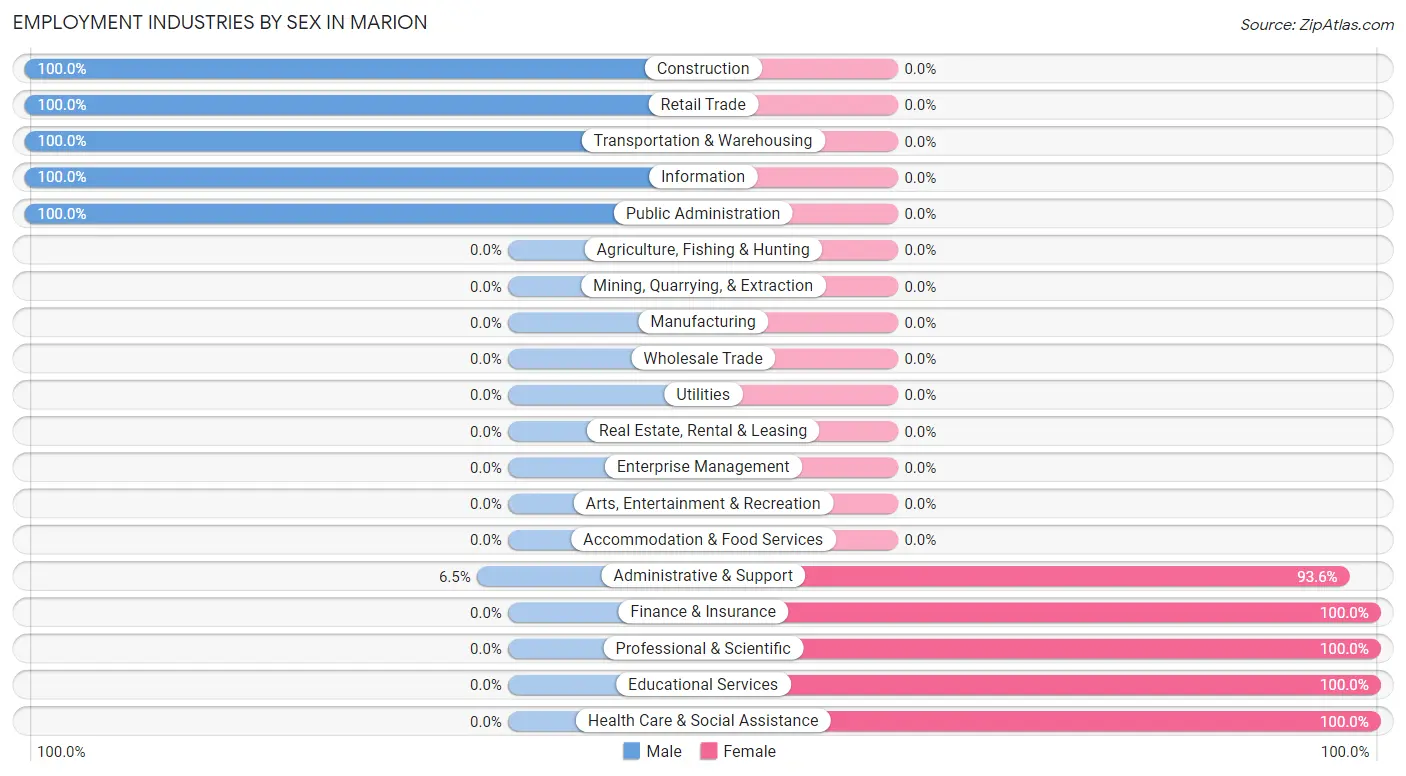
| Industry | Male | Female |
| Agriculture, Fishing & Hunting | 0 (0.0%) | 0 (0.0%) |
| Mining, Quarrying, & Extraction | 0 (0.0%) | 0 (0.0%) |
| Construction | 110 (100.0%) | 0 (0.0%) |
| Manufacturing | 0 (0.0%) | 0 (0.0%) |
| Wholesale Trade | 0 (0.0%) | 0 (0.0%) |
| Retail Trade | 47 (100.0%) | 0 (0.0%) |
| Transportation & Warehousing | 89 (100.0%) | 0 (0.0%) |
| Utilities | 0 (0.0%) | 0 (0.0%) |
| Information | 24 (100.0%) | 0 (0.0%) |
| Finance & Insurance | 0 (0.0%) | 30 (100.0%) |
| Real Estate, Rental & Leasing | 0 (0.0%) | 0 (0.0%) |
| Professional & Scientific | 0 (0.0%) | 11 (100.0%) |
| Enterprise Management | 0 (0.0%) | 0 (0.0%) |
| Administrative & Support | 4 (6.5%) | 58 (93.5%) |
| Educational Services | 0 (0.0%) | 13 (100.0%) |
| Health Care & Social Assistance | 0 (0.0%) | 25 (100.0%) |
| Arts, Entertainment & Recreation | 0 (0.0%) | 0 (0.0%) |
| Accommodation & Food Services | 0 (0.0%) | 0 (0.0%) |
| Public Administration | 17 (100.0%) | 0 (0.0%) |
| Total | 307 (69.1%) | 137 (30.9%) |
Education in Marion
School Enrollment in Marion
The most common levels of schooling among the 246 students in Marion are middle school (96 | 39.0%), high school (56 | 22.8%), and college / undergraduate (52 | 21.1%).
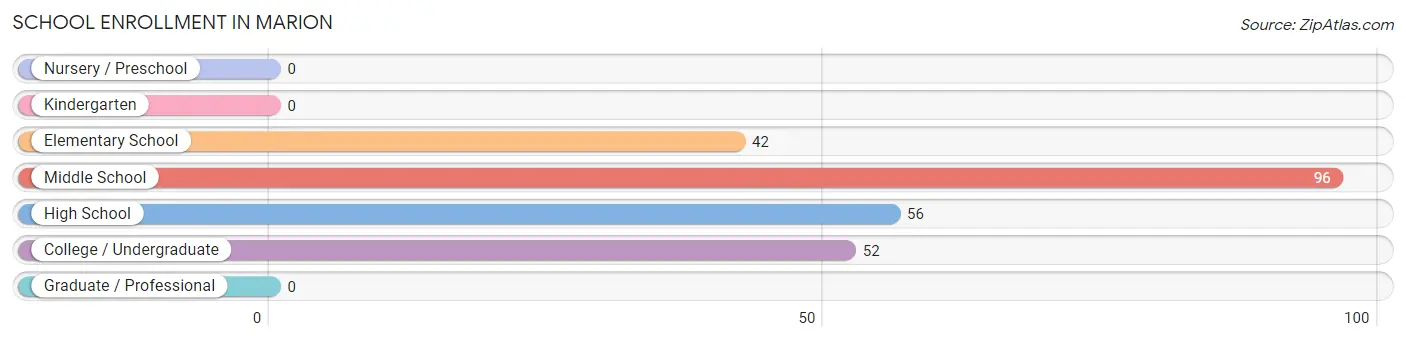
| School Level | # Students | % Students |
| Nursery / Preschool | 0 | 0.0% |
| Kindergarten | 0 | 0.0% |
| Elementary School | 42 | 17.1% |
| Middle School | 96 | 39.0% |
| High School | 56 | 22.8% |
| College / Undergraduate | 52 | 21.1% |
| Graduate / Professional | 0 | 0.0% |
| Total | 246 | 100.0% |
School Enrollment by Age by Funding Source in Marion
Out of a total of 246 students who are enrolled in schools in Marion, 150 (61.0%) attend a private institution, while the remaining 96 (39.0%) are enrolled in public schools. The age group of 25 to 34 year olds has the highest likelihood of being enrolled in private schools, with 24 (100.0% in the age bracket) enrolled. Conversely, the age group of 5 to 9 year old has the lowest likelihood of being enrolled in a private school, with 21 (100.0% in the age bracket) attending a public institution.
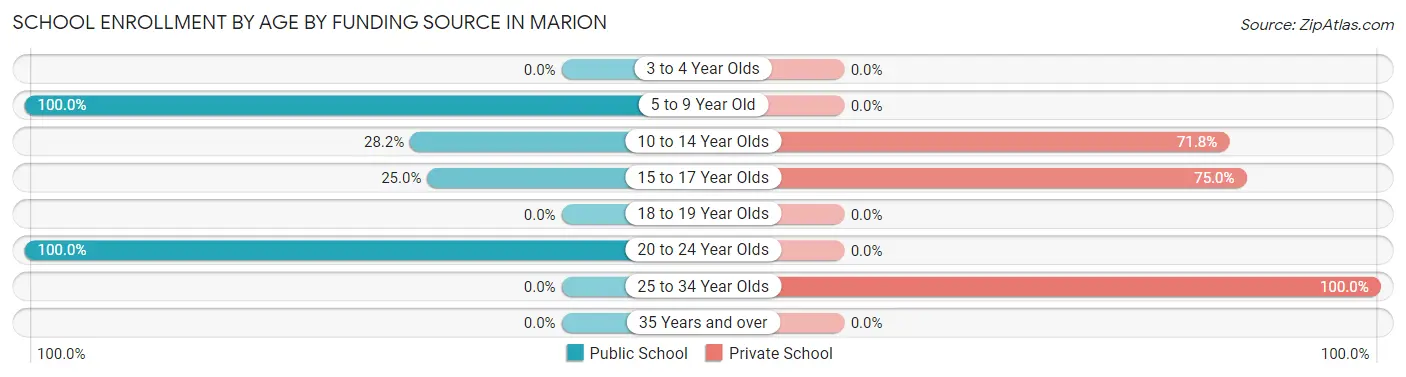
| Age Bracket | Public School | Private School |
| 3 to 4 Year Olds | 0 (0.0%) | 0 (0.0%) |
| 5 to 9 Year Old | 21 (100.0%) | 0 (0.0%) |
| 10 to 14 Year Olds | 33 (28.2%) | 84 (71.8%) |
| 15 to 17 Year Olds | 14 (25.0%) | 42 (75.0%) |
| 18 to 19 Year Olds | 0 (0.0%) | 0 (0.0%) |
| 20 to 24 Year Olds | 28 (100.0%) | 0 (0.0%) |
| 25 to 34 Year Olds | 0 (0.0%) | 24 (100.0%) |
| 35 Years and over | 0 (0.0%) | 0 (0.0%) |
| Total | 96 (39.0%) | 150 (61.0%) |
Educational Attainment by Field of Study in Marion
Education (62 | 40.5%), bio, nature & agricultural (46 | 30.1%), social sciences (16 | 10.5%), literature & languages (13 | 8.5%), and communications (13 | 8.5%) are the most common fields of study among 153 individuals in Marion who have obtained a bachelor's degree or higher.
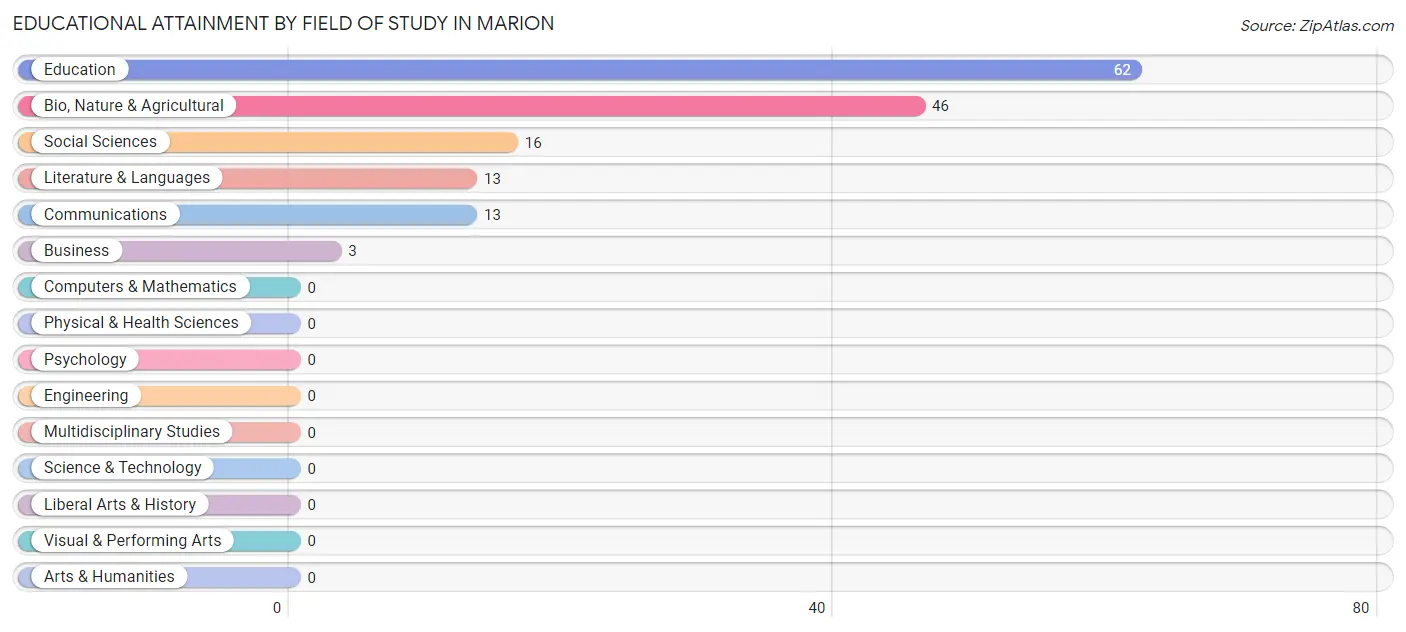
| Field of Study | # Graduates | % Graduates |
| Computers & Mathematics | 0 | 0.0% |
| Bio, Nature & Agricultural | 46 | 30.1% |
| Physical & Health Sciences | 0 | 0.0% |
| Psychology | 0 | 0.0% |
| Social Sciences | 16 | 10.5% |
| Engineering | 0 | 0.0% |
| Multidisciplinary Studies | 0 | 0.0% |
| Science & Technology | 0 | 0.0% |
| Business | 3 | 2.0% |
| Education | 62 | 40.5% |
| Literature & Languages | 13 | 8.5% |
| Liberal Arts & History | 0 | 0.0% |
| Visual & Performing Arts | 0 | 0.0% |
| Communications | 13 | 8.5% |
| Arts & Humanities | 0 | 0.0% |
| Total | 153 | 100.0% |
Transportation & Commute in Marion
Vehicle Availability by Sex in Marion
The most prevalent vehicle ownership categories in Marion are males with 5 or more vehicles (153, accounting for 49.8%) and females with 5 or more vehicles (58, making up 111.7%).
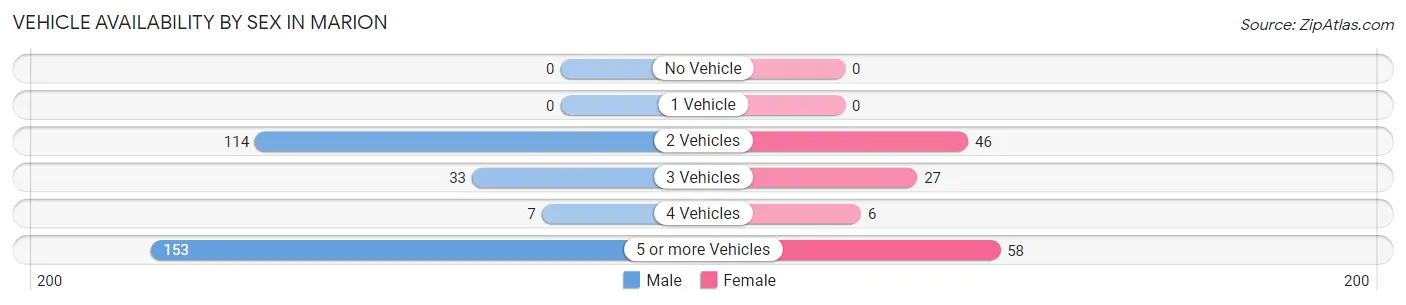
| Vehicles Available | Male | Female |
| No Vehicle | 0 (0.0%) | 0 (0.0%) |
| 1 Vehicle | 0 (0.0%) | 0 (0.0%) |
| 2 Vehicles | 114 (37.1%) | 46 (33.6%) |
| 3 Vehicles | 33 (10.7%) | 27 (19.7%) |
| 4 Vehicles | 7 (2.3%) | 6 (4.4%) |
| 5 or more Vehicles | 153 (49.8%) | 58 (42.3%) |
| Total | 307 (100.0%) | 137 (100.0%) |
Commute Time in Marion
The most frequently occuring commute durations in Marion are 15 to 19 minutes (153 commuters, 36.4%), 30 to 34 minutes (82 commuters, 19.5%), and less than 5 minutes (46 commuters, 11.0%).
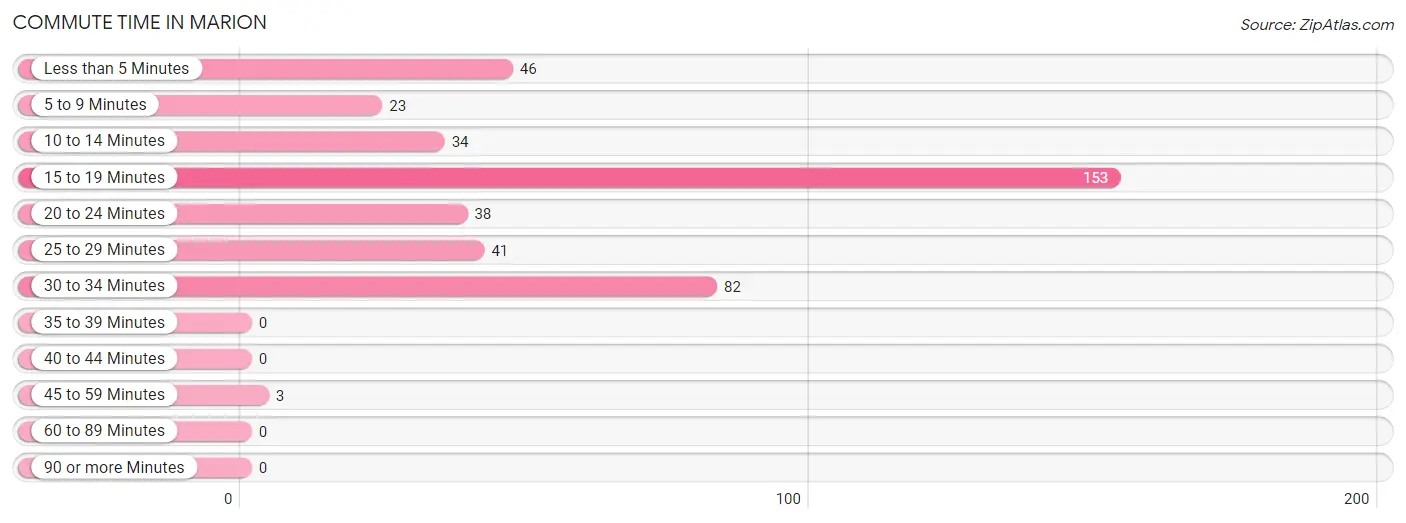
| Commute Time | # Commuters | % Commuters |
| Less than 5 Minutes | 46 | 11.0% |
| 5 to 9 Minutes | 23 | 5.5% |
| 10 to 14 Minutes | 34 | 8.1% |
| 15 to 19 Minutes | 153 | 36.4% |
| 20 to 24 Minutes | 38 | 9.0% |
| 25 to 29 Minutes | 41 | 9.8% |
| 30 to 34 Minutes | 82 | 19.5% |
| 35 to 39 Minutes | 0 | 0.0% |
| 40 to 44 Minutes | 0 | 0.0% |
| 45 to 59 Minutes | 3 | 0.7% |
| 60 to 89 Minutes | 0 | 0.0% |
| 90 or more Minutes | 0 | 0.0% |
Commute Time by Sex in Marion
The most common commute times in Marion are 15 to 19 minutes (153 commuters, 49.8%) for males and 30 to 34 minutes (58 commuters, 51.3%) for females.
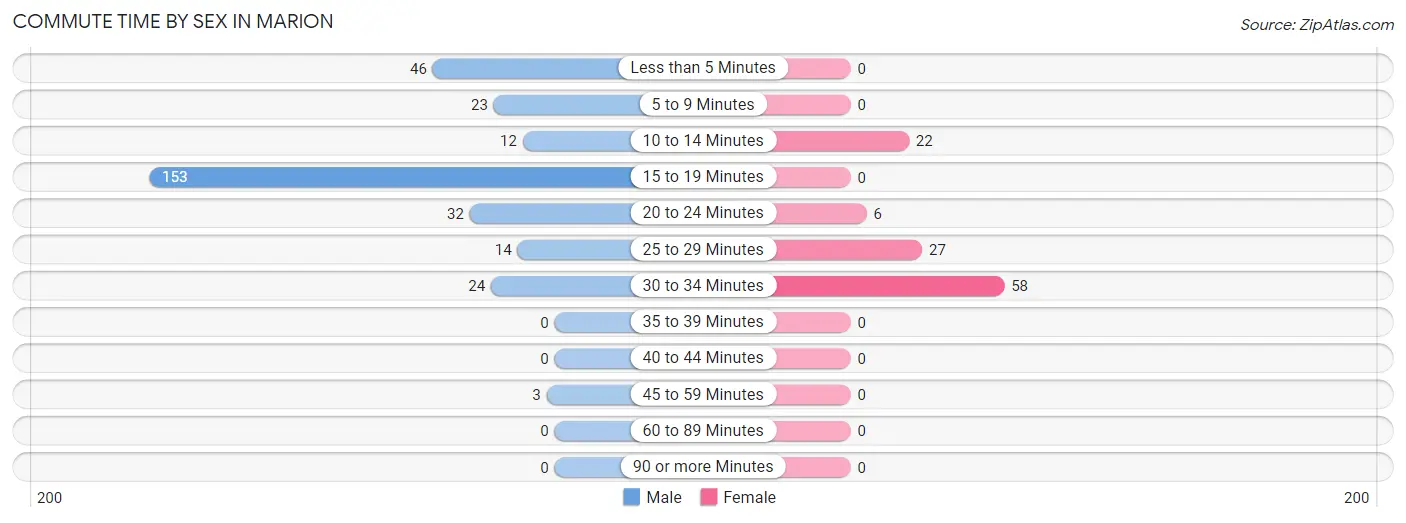
| Commute Time | Male | Female |
| Less than 5 Minutes | 46 (15.0%) | 0 (0.0%) |
| 5 to 9 Minutes | 23 (7.5%) | 0 (0.0%) |
| 10 to 14 Minutes | 12 (3.9%) | 22 (19.5%) |
| 15 to 19 Minutes | 153 (49.8%) | 0 (0.0%) |
| 20 to 24 Minutes | 32 (10.4%) | 6 (5.3%) |
| 25 to 29 Minutes | 14 (4.6%) | 27 (23.9%) |
| 30 to 34 Minutes | 24 (7.8%) | 58 (51.3%) |
| 35 to 39 Minutes | 0 (0.0%) | 0 (0.0%) |
| 40 to 44 Minutes | 0 (0.0%) | 0 (0.0%) |
| 45 to 59 Minutes | 3 (1.0%) | 0 (0.0%) |
| 60 to 89 Minutes | 0 (0.0%) | 0 (0.0%) |
| 90 or more Minutes | 0 (0.0%) | 0 (0.0%) |
Time of Departure to Work by Sex in Marion
The most frequent times of departure to work in Marion are 6:00 AM to 6:29 AM (124, 40.4%) for males and 7:30 AM to 7:59 AM (58, 51.3%) for females.
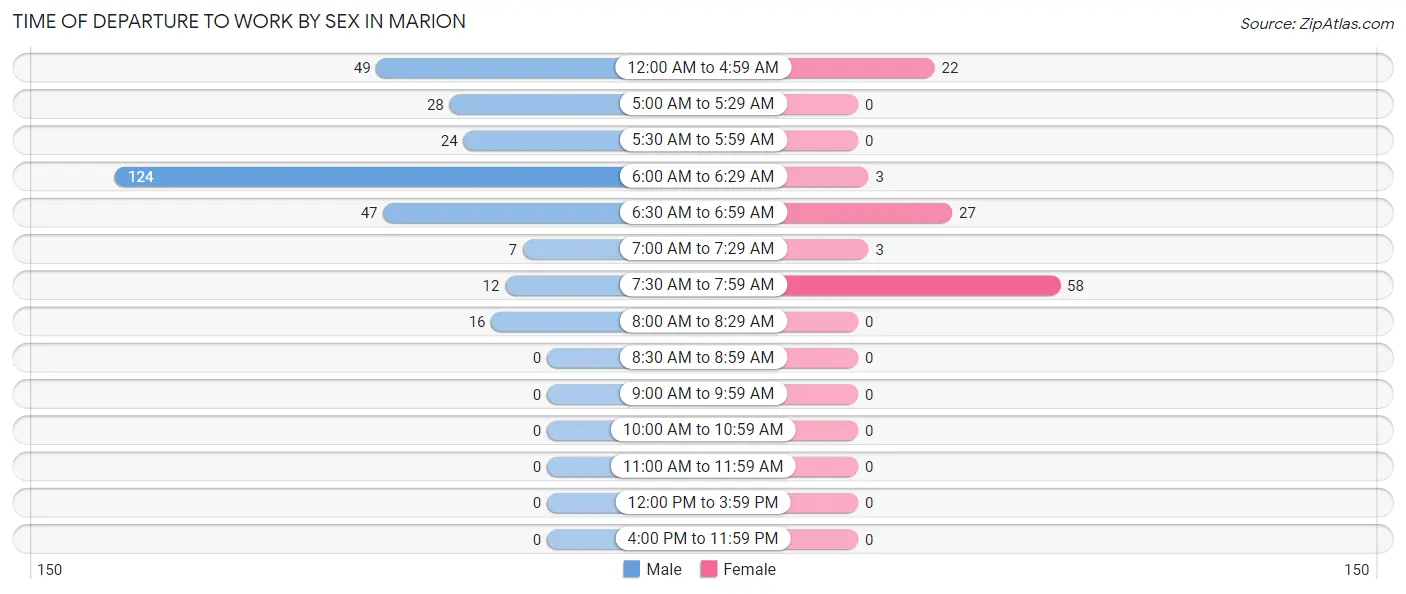
| Time of Departure | Male | Female |
| 12:00 AM to 4:59 AM | 49 (16.0%) | 22 (19.5%) |
| 5:00 AM to 5:29 AM | 28 (9.1%) | 0 (0.0%) |
| 5:30 AM to 5:59 AM | 24 (7.8%) | 0 (0.0%) |
| 6:00 AM to 6:29 AM | 124 (40.4%) | 3 (2.6%) |
| 6:30 AM to 6:59 AM | 47 (15.3%) | 27 (23.9%) |
| 7:00 AM to 7:29 AM | 7 (2.3%) | 3 (2.6%) |
| 7:30 AM to 7:59 AM | 12 (3.9%) | 58 (51.3%) |
| 8:00 AM to 8:29 AM | 16 (5.2%) | 0 (0.0%) |
| 8:30 AM to 8:59 AM | 0 (0.0%) | 0 (0.0%) |
| 9:00 AM to 9:59 AM | 0 (0.0%) | 0 (0.0%) |
| 10:00 AM to 10:59 AM | 0 (0.0%) | 0 (0.0%) |
| 11:00 AM to 11:59 AM | 0 (0.0%) | 0 (0.0%) |
| 12:00 PM to 3:59 PM | 0 (0.0%) | 0 (0.0%) |
| 4:00 PM to 11:59 PM | 0 (0.0%) | 0 (0.0%) |
| Total | 307 (100.0%) | 113 (100.0%) |
Housing Occupancy in Marion
Occupancy by Ownership in Marion
Of the total 356 dwellings in Marion, owner-occupied units account for 253 (71.1%), while renter-occupied units make up 103 (28.9%).
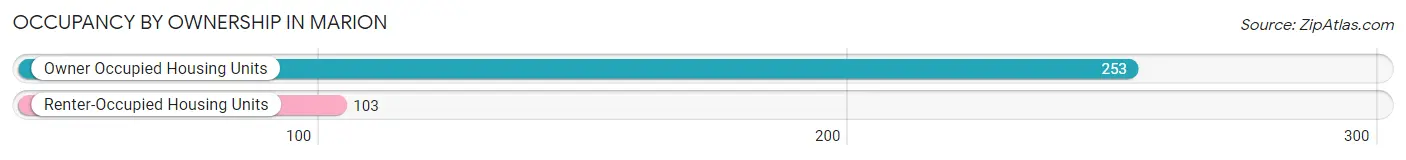
| Occupancy | # Housing Units | % Housing Units |
| Owner Occupied Housing Units | 253 | 71.1% |
| Renter-Occupied Housing Units | 103 | 28.9% |
| Total Occupied Housing Units | 356 | 100.0% |
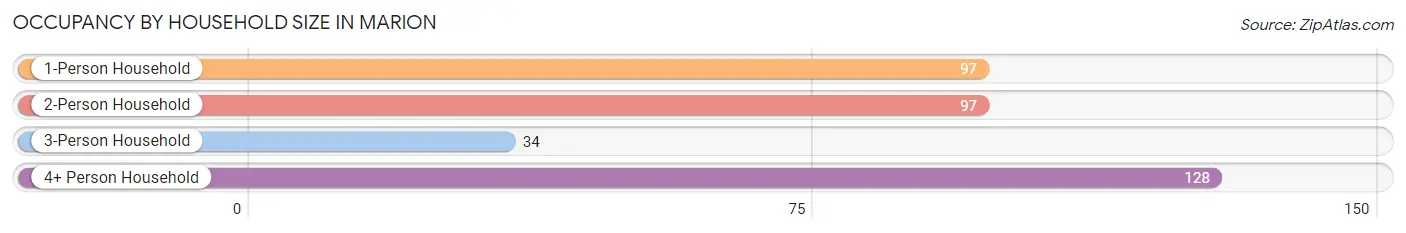
Occupancy by Household Size in Marion
| Household Size | # Housing Units | % Housing Units |
| 1-Person Household | 97 | 27.3% |
| 2-Person Household | 97 | 27.3% |
| 3-Person Household | 34 | 9.6% |
| 4+ Person Household | 128 | 36.0% |
| Total Housing Units | 356 | 100.0% |
Occupancy by Ownership by Household Size in Marion
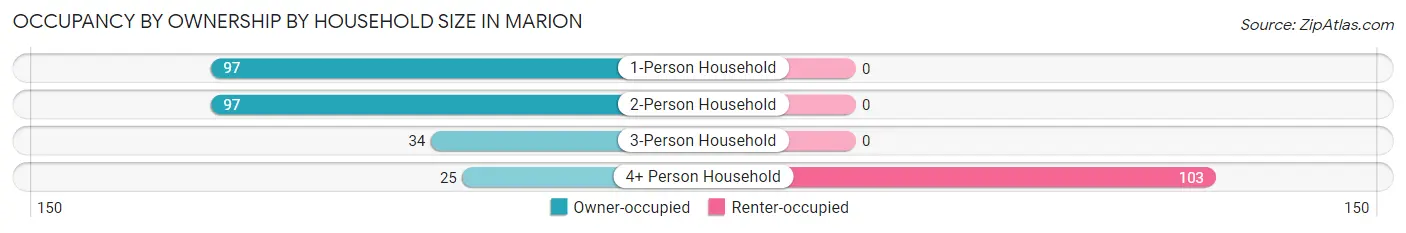
| Household Size | Owner-occupied | Renter-occupied |
| 1-Person Household | 97 (100.0%) | 0 (0.0%) |
| 2-Person Household | 97 (100.0%) | 0 (0.0%) |
| 3-Person Household | 34 (100.0%) | 0 (0.0%) |
| 4+ Person Household | 25 (19.5%) | 103 (80.5%) |
| Total Housing Units | 253 (71.1%) | 103 (28.9%) |
Occupancy by Educational Attainment in Marion
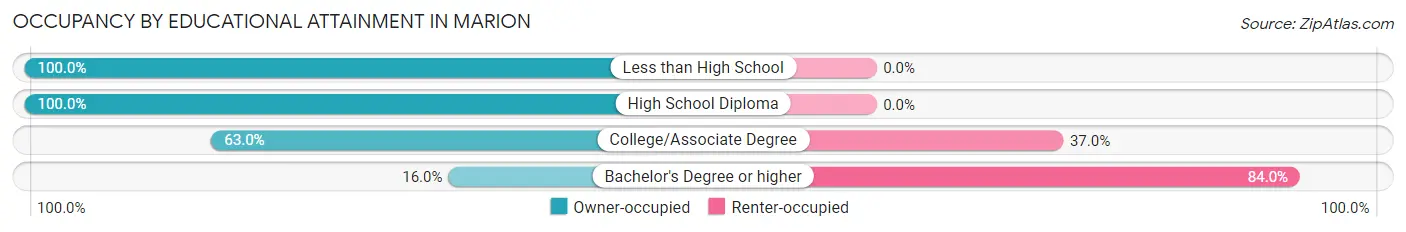
| Household Size | Owner-occupied | Renter-occupied |
| Less than High School | 55 (100.0%) | 0 (0.0%) |
| High School Diploma | 118 (100.0%) | 0 (0.0%) |
| College/Associate Degree | 68 (63.0%) | 40 (37.0%) |
| Bachelor's Degree or higher | 12 (16.0%) | 63 (84.0%) |
Occupancy by Age of Householder in Marion
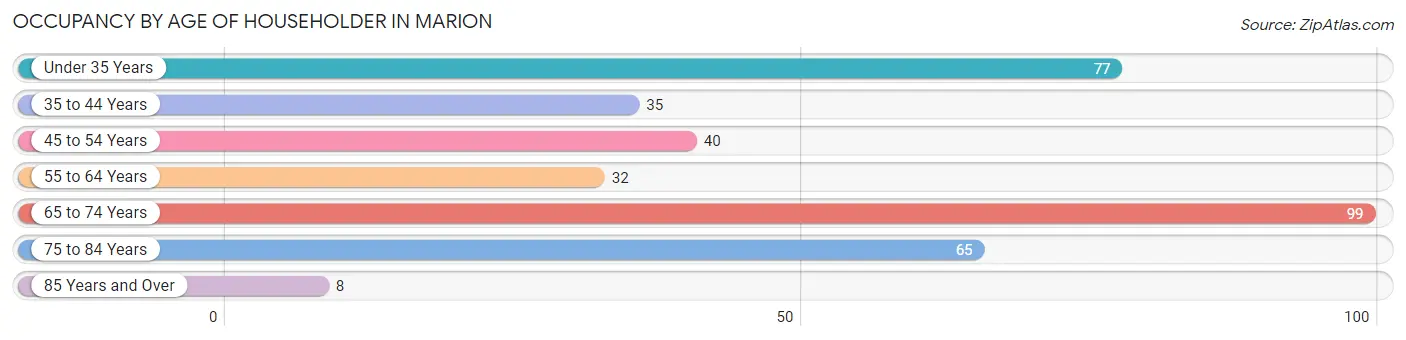
| Age Bracket | # Households | % Households |
| Under 35 Years | 77 | 21.6% |
| 35 to 44 Years | 35 | 9.8% |
| 45 to 54 Years | 40 | 11.2% |
| 55 to 64 Years | 32 | 9.0% |
| 65 to 74 Years | 99 | 27.8% |
| 75 to 84 Years | 65 | 18.3% |
| 85 Years and Over | 8 | 2.2% |
| Total | 356 | 100.0% |
Housing Finances in Marion
Median Income by Occupancy in Marion
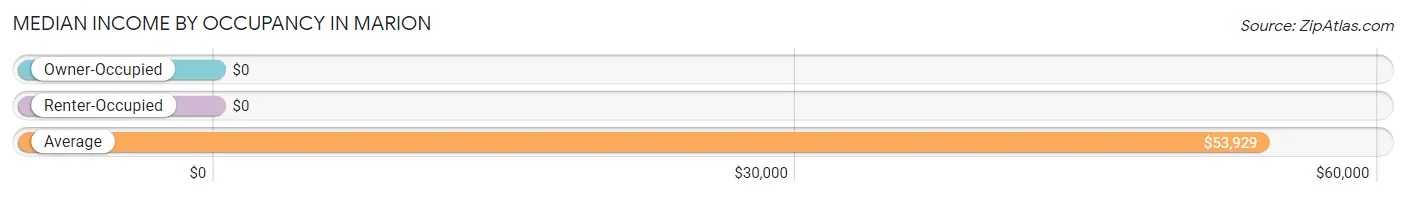
| Occupancy Type | # Households | Median Income |
| Owner-Occupied | 253 (71.1%) | $0 |
| Renter-Occupied | 103 (28.9%) | $0 |
| Average | 356 (100.0%) | $53,929 |
Occupancy by Householder Income Bracket in Marion
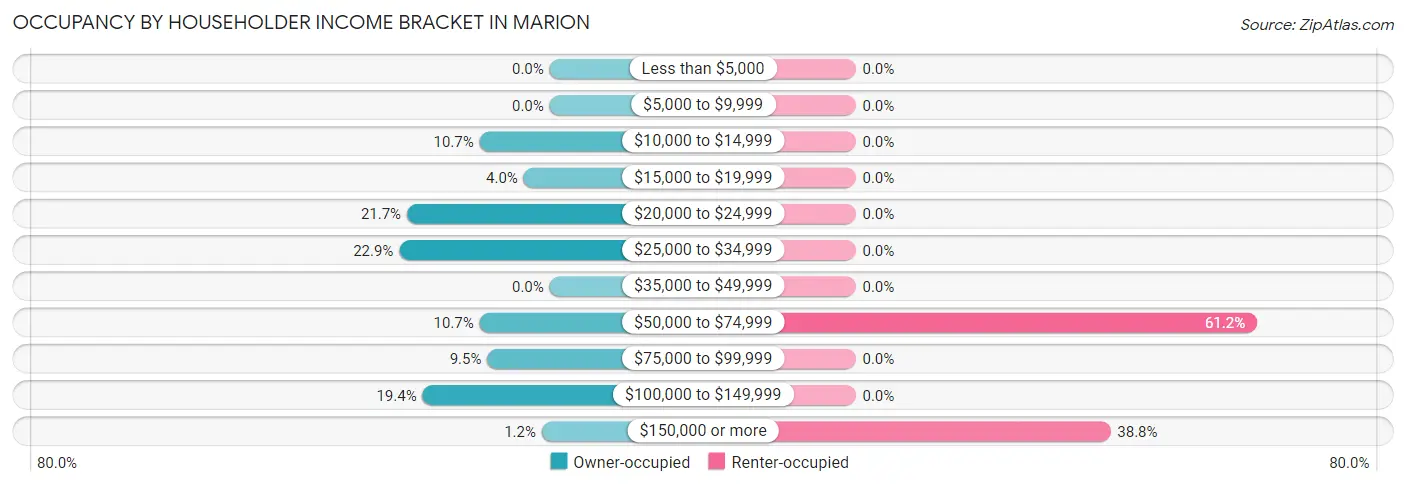
| Income Bracket | Owner-occupied | Renter-occupied |
| Less than $5,000 | 0 (0.0%) | 0 (0.0%) |
| $5,000 to $9,999 | 0 (0.0%) | 0 (0.0%) |
| $10,000 to $14,999 | 27 (10.7%) | 0 (0.0%) |
| $15,000 to $19,999 | 10 (4.0%) | 0 (0.0%) |
| $20,000 to $24,999 | 55 (21.7%) | 0 (0.0%) |
| $25,000 to $34,999 | 58 (22.9%) | 0 (0.0%) |
| $35,000 to $49,999 | 0 (0.0%) | 0 (0.0%) |
| $50,000 to $74,999 | 27 (10.7%) | 63 (61.2%) |
| $75,000 to $99,999 | 24 (9.5%) | 0 (0.0%) |
| $100,000 to $149,999 | 49 (19.4%) | 0 (0.0%) |
| $150,000 or more | 3 (1.2%) | 40 (38.8%) |
| Total | 253 (100.0%) | 103 (100.0%) |
Monthly Housing Cost Tiers in Marion
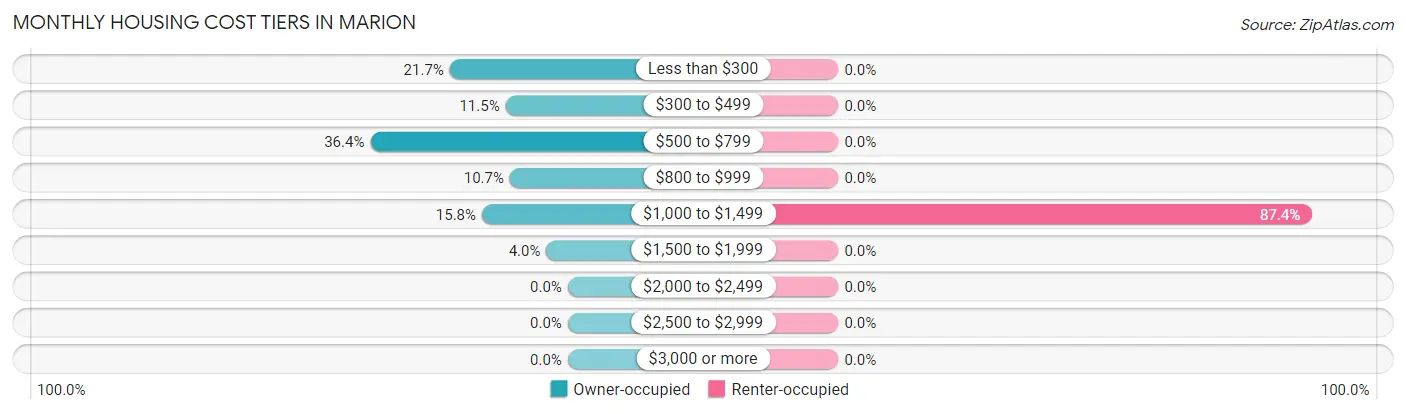
| Monthly Cost | Owner-occupied | Renter-occupied |
| Less than $300 | 55 (21.7%) | 0 (0.0%) |
| $300 to $499 | 29 (11.5%) | 0 (0.0%) |
| $500 to $799 | 92 (36.4%) | 0 (0.0%) |
| $800 to $999 | 27 (10.7%) | 0 (0.0%) |
| $1,000 to $1,499 | 40 (15.8%) | 90 (87.4%) |
| $1,500 to $1,999 | 10 (4.0%) | 0 (0.0%) |
| $2,000 to $2,499 | 0 (0.0%) | 0 (0.0%) |
| $2,500 to $2,999 | 0 (0.0%) | 0 (0.0%) |
| $3,000 or more | 0 (0.0%) | 0 (0.0%) |
| Total | 253 (100.0%) | 103 (100.0%) |
Physical Housing Characteristics in Marion
Housing Structures in Marion
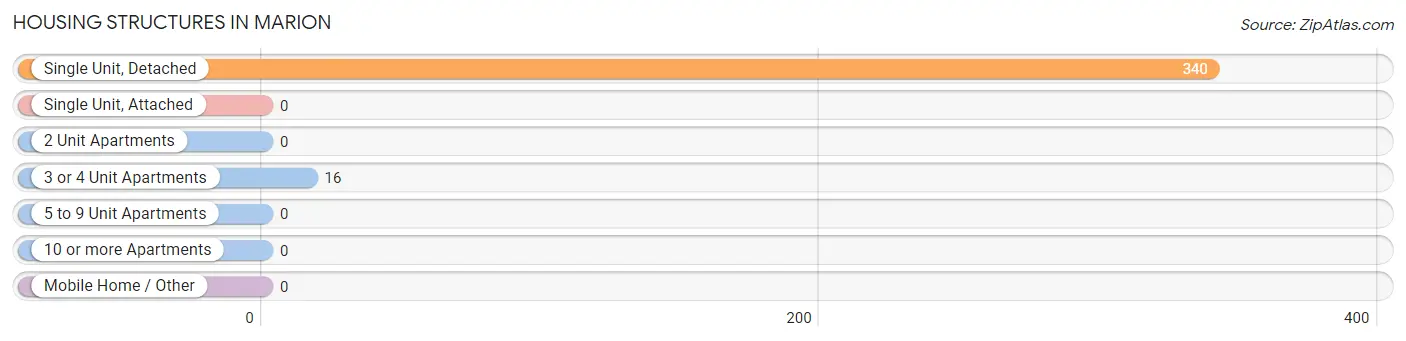
| Structure Type | # Housing Units | % Housing Units |
| Single Unit, Detached | 340 | 95.5% |
| Single Unit, Attached | 0 | 0.0% |
| 2 Unit Apartments | 0 | 0.0% |
| 3 or 4 Unit Apartments | 16 | 4.5% |
| 5 to 9 Unit Apartments | 0 | 0.0% |
| 10 or more Apartments | 0 | 0.0% |
| Mobile Home / Other | 0 | 0.0% |
| Total | 356 | 100.0% |
Housing Structures by Occupancy in Marion
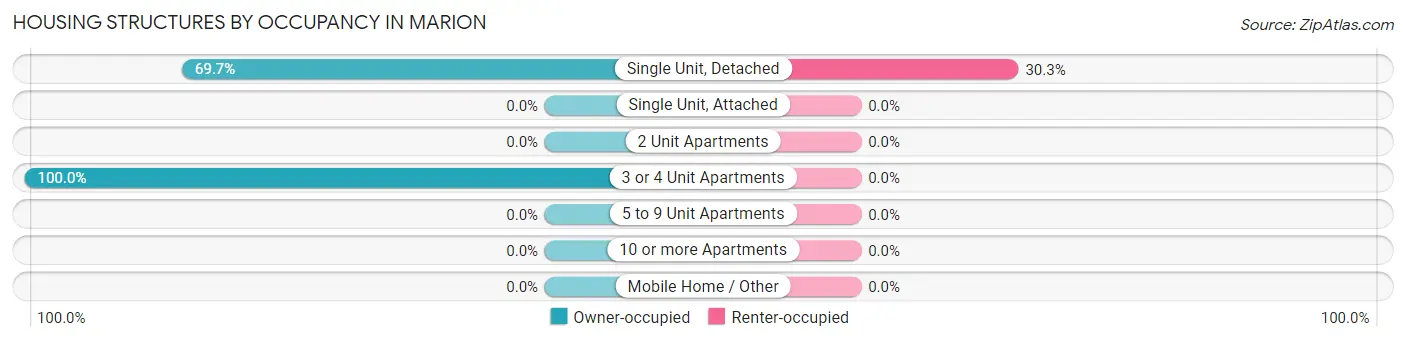
| Structure Type | Owner-occupied | Renter-occupied |
| Single Unit, Detached | 237 (69.7%) | 103 (30.3%) |
| Single Unit, Attached | 0 (0.0%) | 0 (0.0%) |
| 2 Unit Apartments | 0 (0.0%) | 0 (0.0%) |
| 3 or 4 Unit Apartments | 16 (100.0%) | 0 (0.0%) |
| 5 to 9 Unit Apartments | 0 (0.0%) | 0 (0.0%) |
| 10 or more Apartments | 0 (0.0%) | 0 (0.0%) |
| Mobile Home / Other | 0 (0.0%) | 0 (0.0%) |
| Total | 253 (71.1%) | 103 (28.9%) |
Housing Structures by Number of Rooms in Marion
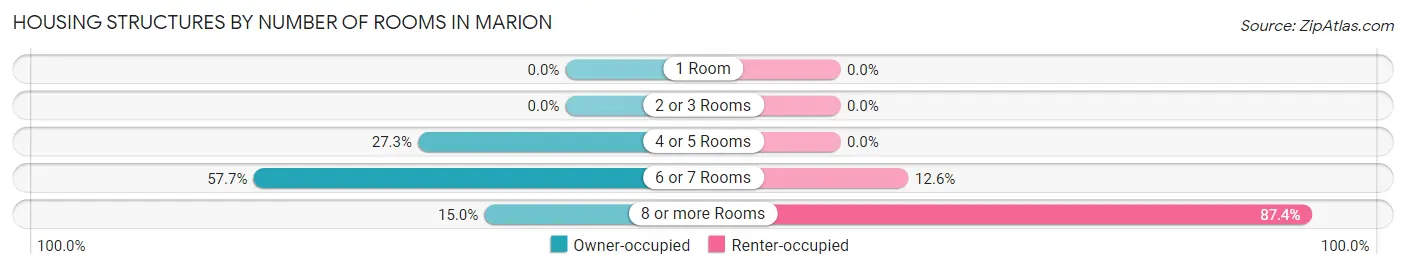
| Number of Rooms | Owner-occupied | Renter-occupied |
| 1 Room | 0 (0.0%) | 0 (0.0%) |
| 2 or 3 Rooms | 0 (0.0%) | 0 (0.0%) |
| 4 or 5 Rooms | 69 (27.3%) | 0 (0.0%) |
| 6 or 7 Rooms | 146 (57.7%) | 13 (12.6%) |
| 8 or more Rooms | 38 (15.0%) | 90 (87.4%) |
| Total | 253 (100.0%) | 103 (100.0%) |
Housing Structure by Heating Type in Marion
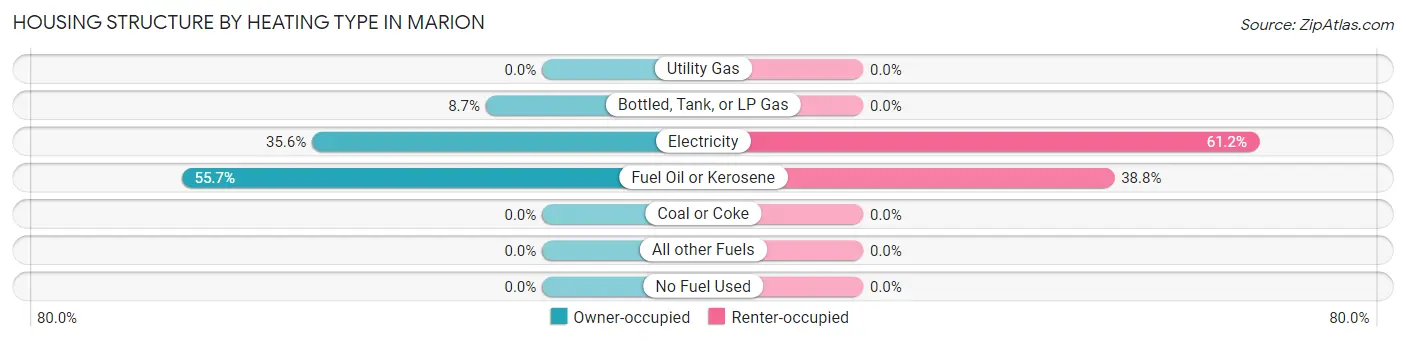
| Heating Type | Owner-occupied | Renter-occupied |
| Utility Gas | 0 (0.0%) | 0 (0.0%) |
| Bottled, Tank, or LP Gas | 22 (8.7%) | 0 (0.0%) |
| Electricity | 90 (35.6%) | 63 (61.2%) |
| Fuel Oil or Kerosene | 141 (55.7%) | 40 (38.8%) |
| Coal or Coke | 0 (0.0%) | 0 (0.0%) |
| All other Fuels | 0 (0.0%) | 0 (0.0%) |
| No Fuel Used | 0 (0.0%) | 0 (0.0%) |
| Total | 253 (100.0%) | 103 (100.0%) |
Household Vehicle Usage in Marion
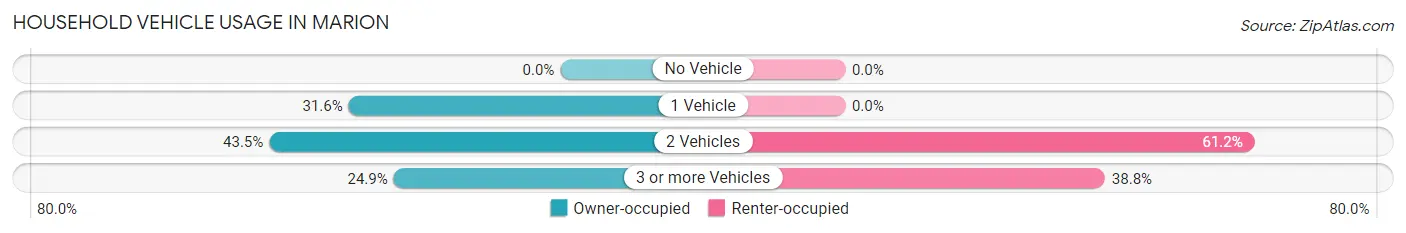
| Vehicles per Household | Owner-occupied | Renter-occupied |
| No Vehicle | 0 (0.0%) | 0 (0.0%) |
| 1 Vehicle | 80 (31.6%) | 0 (0.0%) |
| 2 Vehicles | 110 (43.5%) | 63 (61.2%) |
| 3 or more Vehicles | 63 (24.9%) | 40 (38.8%) |
| Total | 253 (100.0%) | 103 (100.0%) |
Real Estate & Mortgages in Marion
Real Estate and Mortgage Overview in Marion
| Characteristic | Without Mortgage | With Mortgage |
| Housing Units | 134 | 119 |
| Median Property Value | $229,600 | $183,400 |
| Median Household Income | - | - |
| Monthly Housing Costs | $375 | $0 |
| Real Estate Taxes | $2,561 | $69 |
Property Value by Mortgage Status in Marion
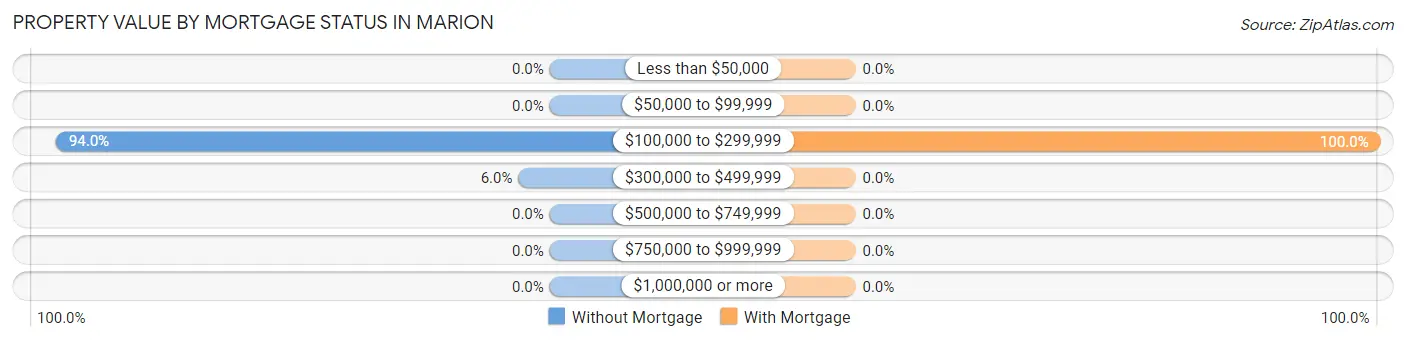
| Property Value | Without Mortgage | With Mortgage |
| Less than $50,000 | 0 (0.0%) | 0 (0.0%) |
| $50,000 to $99,999 | 0 (0.0%) | 0 (0.0%) |
| $100,000 to $299,999 | 126 (94.0%) | 119 (100.0%) |
| $300,000 to $499,999 | 8 (6.0%) | 0 (0.0%) |
| $500,000 to $749,999 | 0 (0.0%) | 0 (0.0%) |
| $750,000 to $999,999 | 0 (0.0%) | 0 (0.0%) |
| $1,000,000 or more | 0 (0.0%) | 0 (0.0%) |
| Total | 134 (100.0%) | 119 (100.0%) |
Household Income by Mortgage Status in Marion
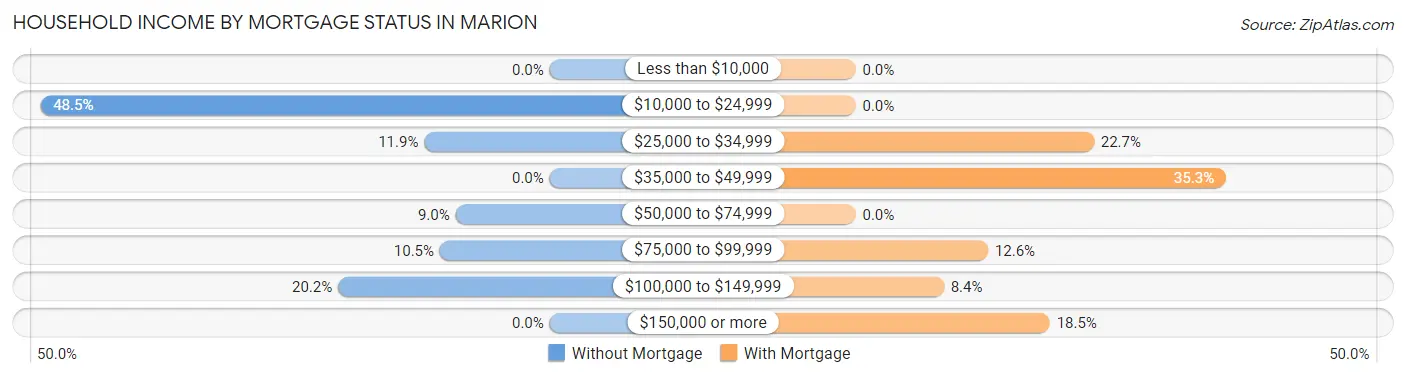
| Household Income | Without Mortgage | With Mortgage |
| Less than $10,000 | 0 (0.0%) | 0 (0.0%) |
| $10,000 to $24,999 | 65 (48.5%) | 0 (0.0%) |
| $25,000 to $34,999 | 16 (11.9%) | 27 (22.7%) |
| $35,000 to $49,999 | 0 (0.0%) | 42 (35.3%) |
| $50,000 to $74,999 | 12 (9.0%) | 0 (0.0%) |
| $75,000 to $99,999 | 14 (10.4%) | 15 (12.6%) |
| $100,000 to $149,999 | 27 (20.2%) | 10 (8.4%) |
| $150,000 or more | 0 (0.0%) | 22 (18.5%) |
| Total | 134 (100.0%) | 119 (100.0%) |
Property Value to Household Income Ratio in Marion
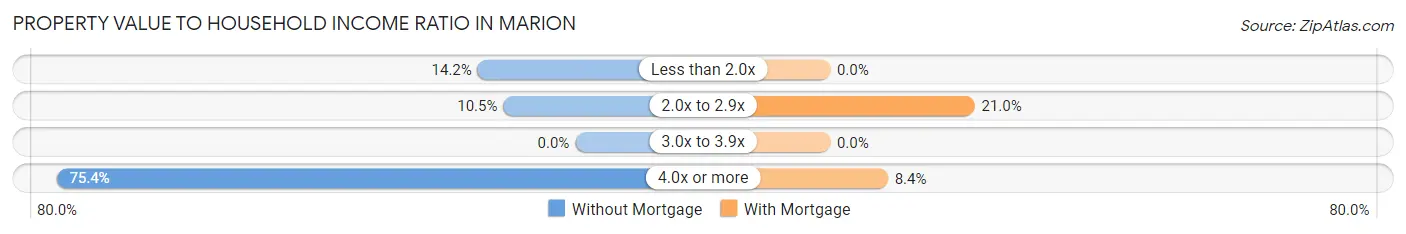
| Value-to-Income Ratio | Without Mortgage | With Mortgage |
| Less than 2.0x | 19 (14.2%) | 0 (0.0%) |
| 2.0x to 2.9x | 14 (10.4%) | 25 (21.0%) |
| 3.0x to 3.9x | 0 (0.0%) | 0 (0.0%) |
| 4.0x or more | 101 (75.4%) | 10 (8.4%) |
| Total | 134 (100.0%) | 119 (100.0%) |
Real Estate Taxes by Mortgage Status in Marion
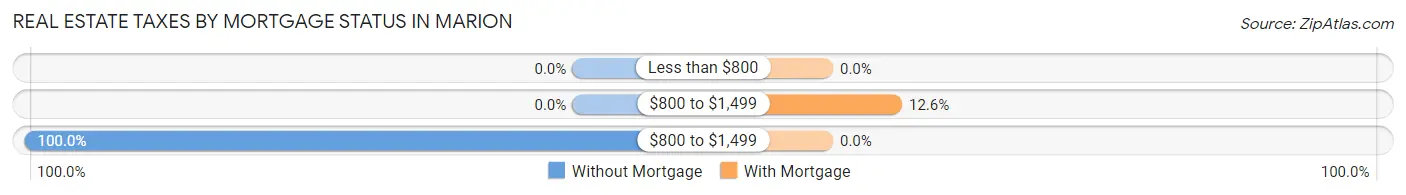
| Property Taxes | Without Mortgage | With Mortgage |
| Less than $800 | 0 (0.0%) | 0 (0.0%) |
| $800 to $1,499 | 0 (0.0%) | 15 (12.6%) |
| $800 to $1,499 | 134 (100.0%) | 0 (0.0%) |
| Total | 134 (100.0%) | 119 (100.0%) |
Health & Disability in Marion
Health Insurance Coverage by Age in Marion
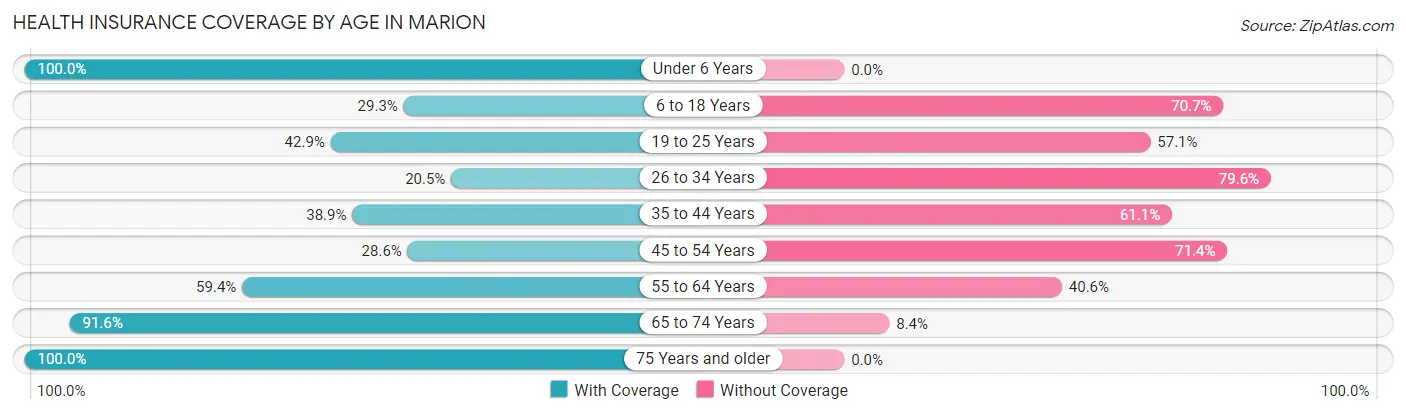
| Age Bracket | With Coverage | Without Coverage |
| Under 6 Years | 67 (100.0%) | 0 (0.0%) |
| 6 to 18 Years | 68 (29.3%) | 164 (70.7%) |
| 19 to 25 Years | 85 (42.9%) | 113 (57.1%) |
| 26 to 34 Years | 27 (20.4%) | 105 (79.5%) |
| 35 to 44 Years | 35 (38.9%) | 55 (61.1%) |
| 45 to 54 Years | 16 (28.6%) | 40 (71.4%) |
| 55 to 64 Years | 63 (59.4%) | 43 (40.6%) |
| 65 to 74 Years | 142 (91.6%) | 13 (8.4%) |
| 75 Years and older | 90 (100.0%) | 0 (0.0%) |
| Total | 593 (52.7%) | 533 (47.3%) |
Health Insurance Coverage by Citizenship Status in Marion
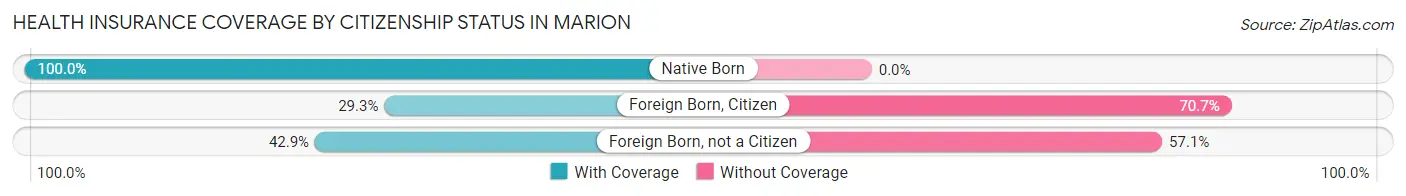
| Citizenship Status | With Coverage | Without Coverage |
| Native Born | 67 (100.0%) | 0 (0.0%) |
| Foreign Born, Citizen | 68 (29.3%) | 164 (70.7%) |
| Foreign Born, not a Citizen | 85 (42.9%) | 113 (57.1%) |
Health Insurance Coverage by Household Income in Marion
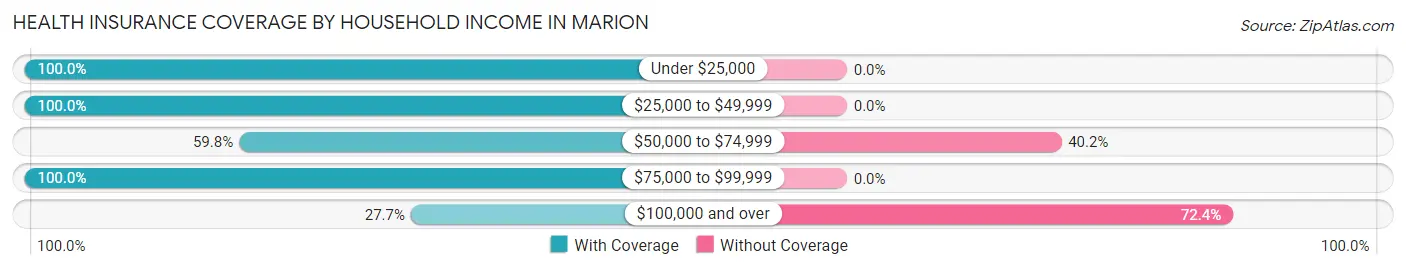
| Household Income | With Coverage | Without Coverage |
| Under $25,000 | 162 (100.0%) | 0 (0.0%) |
| $25,000 to $49,999 | 73 (100.0%) | 0 (0.0%) |
| $50,000 to $74,999 | 143 (59.8%) | 96 (40.2%) |
| $75,000 to $99,999 | 48 (100.0%) | 0 (0.0%) |
| $100,000 and over | 167 (27.7%) | 437 (72.4%) |
Public vs Private Health Insurance Coverage by Age in Marion
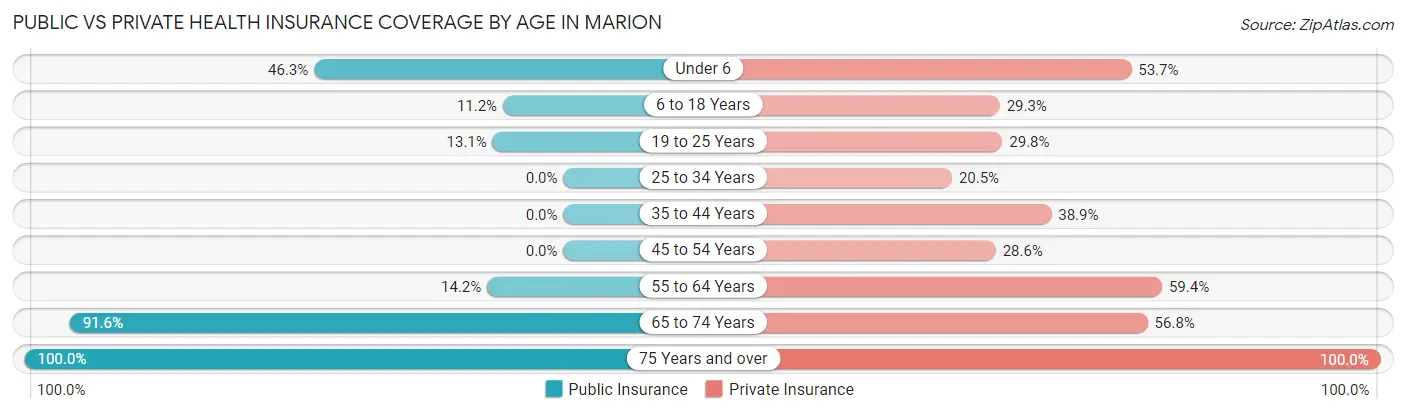
| Age Bracket | Public Insurance | Private Insurance |
| Under 6 | 31 (46.3%) | 36 (53.7%) |
| 6 to 18 Years | 26 (11.2%) | 68 (29.3%) |
| 19 to 25 Years | 26 (13.1%) | 59 (29.8%) |
| 25 to 34 Years | 0 (0.0%) | 27 (20.4%) |
| 35 to 44 Years | 0 (0.0%) | 35 (38.9%) |
| 45 to 54 Years | 0 (0.0%) | 16 (28.6%) |
| 55 to 64 Years | 15 (14.1%) | 63 (59.4%) |
| 65 to 74 Years | 142 (91.6%) | 88 (56.8%) |
| 75 Years and over | 90 (100.0%) | 90 (100.0%) |
| Total | 330 (29.3%) | 482 (42.8%) |
Disability Status by Sex by Age in Marion
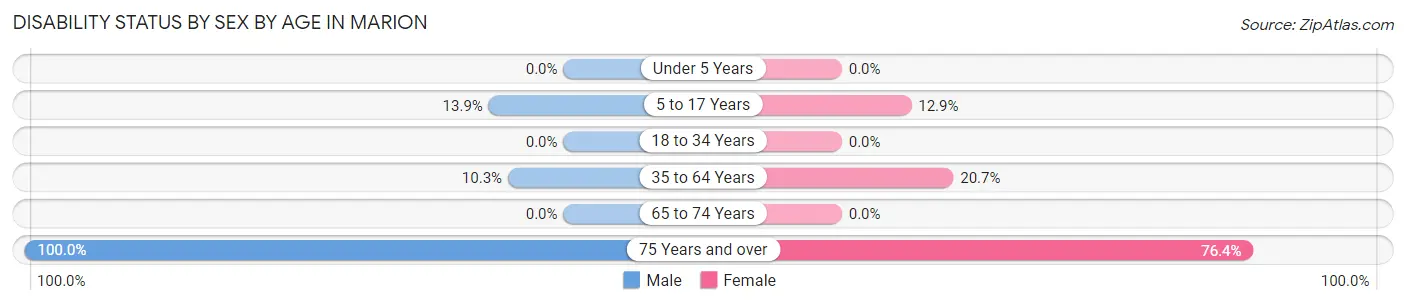
| Age Bracket | Male | Female |
| Under 5 Years | 0 (0.0%) | 0 (0.0%) |
| 5 to 17 Years | 14 (13.9%) | 12 (12.9%) |
| 18 to 34 Years | 0 (0.0%) | 0 (0.0%) |
| 35 to 64 Years | 14 (10.3%) | 24 (20.7%) |
| 65 to 74 Years | 0 (0.0%) | 0 (0.0%) |
| 75 Years and over | 18 (100.0%) | 55 (76.4%) |
Disability Class by Sex by Age in Marion
Disability Class: Hearing Difficulty
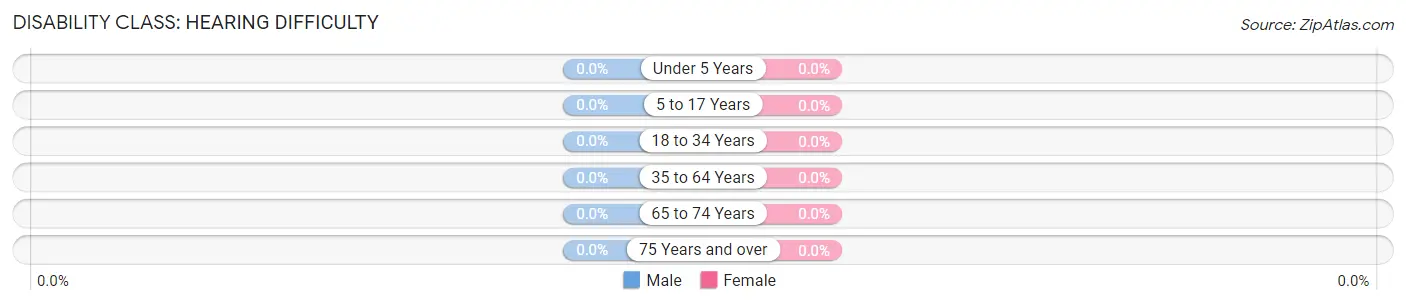
| Age Bracket | Male | Female |
| Under 5 Years | 0 (0.0%) | 0 (0.0%) |
| 5 to 17 Years | 0 (0.0%) | 0 (0.0%) |
| 18 to 34 Years | 0 (0.0%) | 0 (0.0%) |
| 35 to 64 Years | 0 (0.0%) | 0 (0.0%) |
| 65 to 74 Years | 0 (0.0%) | 0 (0.0%) |
| 75 Years and over | 0 (0.0%) | 0 (0.0%) |
Disability Class: Vision Difficulty
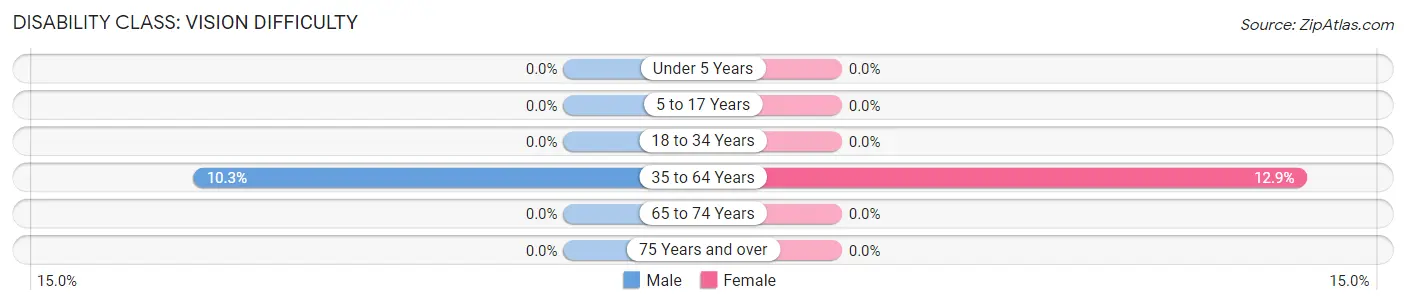
| Age Bracket | Male | Female |
| Under 5 Years | 0 (0.0%) | 0 (0.0%) |
| 5 to 17 Years | 0 (0.0%) | 0 (0.0%) |
| 18 to 34 Years | 0 (0.0%) | 0 (0.0%) |
| 35 to 64 Years | 14 (10.3%) | 15 (12.9%) |
| 65 to 74 Years | 0 (0.0%) | 0 (0.0%) |
| 75 Years and over | 0 (0.0%) | 0 (0.0%) |
Disability Class: Cognitive Difficulty
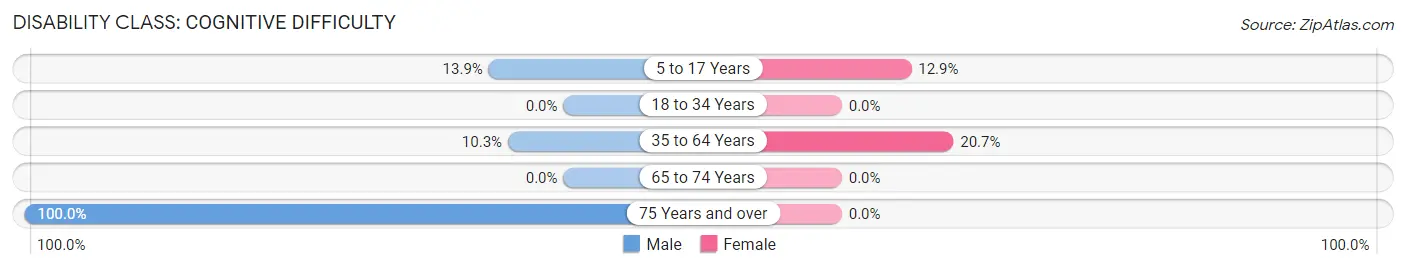
| Age Bracket | Male | Female |
| 5 to 17 Years | 14 (13.9%) | 12 (12.9%) |
| 18 to 34 Years | 0 (0.0%) | 0 (0.0%) |
| 35 to 64 Years | 14 (10.3%) | 24 (20.7%) |
| 65 to 74 Years | 0 (0.0%) | 0 (0.0%) |
| 75 Years and over | 18 (100.0%) | 0 (0.0%) |
Disability Class: Ambulatory Difficulty
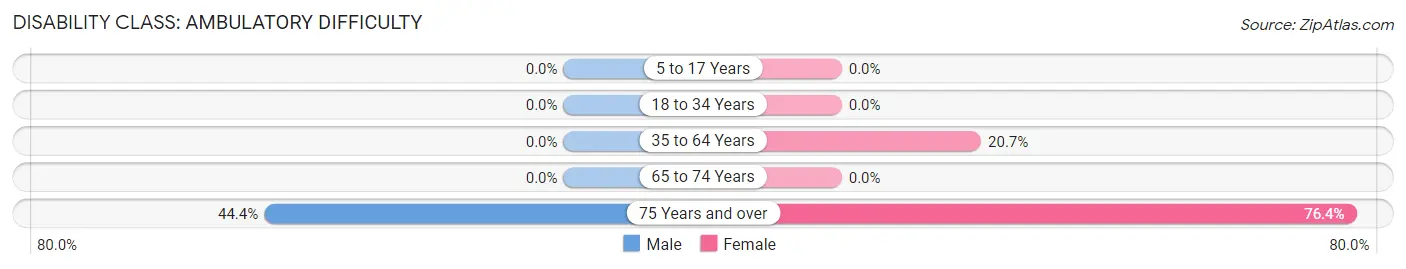
| Age Bracket | Male | Female |
| 5 to 17 Years | 0 (0.0%) | 0 (0.0%) |
| 18 to 34 Years | 0 (0.0%) | 0 (0.0%) |
| 35 to 64 Years | 0 (0.0%) | 24 (20.7%) |
| 65 to 74 Years | 0 (0.0%) | 0 (0.0%) |
| 75 Years and over | 8 (44.4%) | 55 (76.4%) |
Disability Class: Self-Care Difficulty
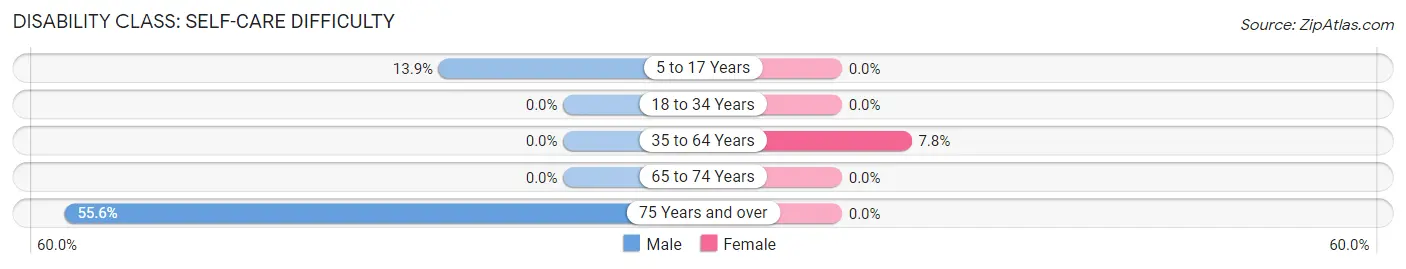
| Age Bracket | Male | Female |
| 5 to 17 Years | 14 (13.9%) | 0 (0.0%) |
| 18 to 34 Years | 0 (0.0%) | 0 (0.0%) |
| 35 to 64 Years | 0 (0.0%) | 9 (7.8%) |
| 65 to 74 Years | 0 (0.0%) | 0 (0.0%) |
| 75 Years and over | 10 (55.6%) | 0 (0.0%) |
Technology Access in Marion
Computing Device Access in Marion
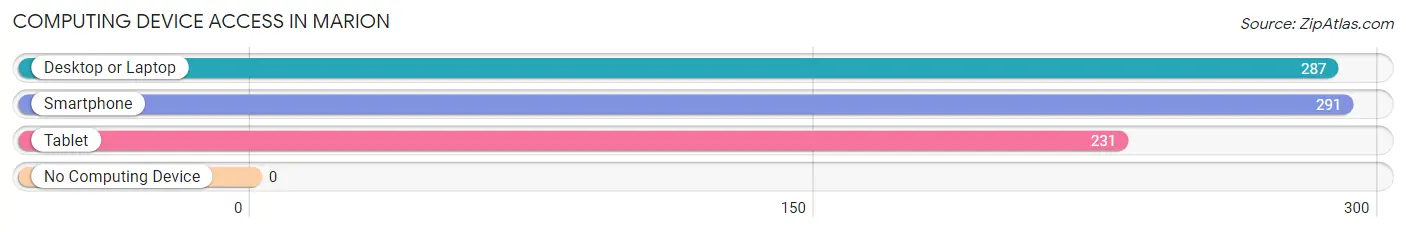
| Device Type | # Households | % Households |
| Desktop or Laptop | 287 | 80.6% |
| Smartphone | 291 | 81.7% |
| Tablet | 231 | 64.9% |
| No Computing Device | 0 | 0.0% |
| Total | 356 | 100.0% |
Internet Access in Marion
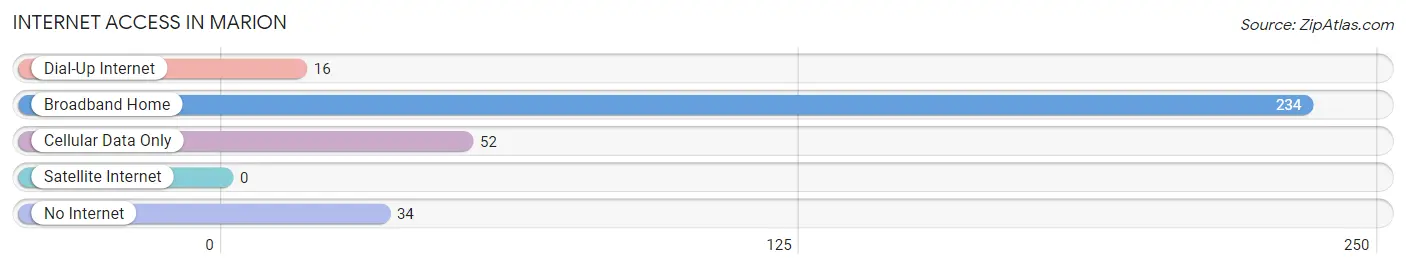
| Internet Type | # Households | % Households |
| Dial-Up Internet | 16 | 4.5% |
| Broadband Home | 234 | 65.7% |
| Cellular Data Only | 52 | 14.6% |
| Satellite Internet | 0 | 0.0% |
| No Internet | 34 | 9.6% |
| Total | 356 | 100.0% |
Marion Summary
Marion, Pennsylvania is a small borough located in the southwestern corner of the state. It is situated in the foothills of the Allegheny Mountains and is part of the Laurel Highlands region. The borough is located in Westmoreland County and is bordered by the townships of Donegal, Mount Pleasant, and Ligonier. The population of Marion was 1,845 as of the 2010 census.
History
Marion was founded in 1817 by John and Mary Miller, who purchased the land from the heirs of William Penn. The Millers named the town after their daughter, Marion. The town was incorporated in 1841 and was the first borough in Westmoreland County.
In the early 19th century, Marion was a thriving industrial center. The town was home to several coal mines, iron furnaces, and a glass factory. The glass factory was the first in the county and produced window glass, bottles, and other glass products. The coal mines and iron furnaces provided employment for many of the town’s residents.
In the late 19th century, Marion’s economy shifted from industry to agriculture. The town became known for its dairy farms and orchards. The town also had several mills, including a flour mill, a saw mill, and a grist mill.
Geography
Marion is located in the southwestern corner of Westmoreland County. It is situated in the foothills of the Allegheny Mountains and is part of the Laurel Highlands region. The borough is bordered by the townships of Donegal, Mount Pleasant, and Ligonier.
The terrain of Marion is mostly hilly and wooded. The borough is located in the Chestnut Ridge, which is part of the Allegheny Plateau. The highest point in the borough is 1,845 feet above sea level.
The climate of Marion is humid continental, with cold winters and warm summers. The average annual temperature is 48°F. The average annual precipitation is 40 inches.
Economy
Marion’s economy is largely based on agriculture and tourism. The town is home to several dairy farms and orchards. The town also has several small businesses, including restaurants, shops, and a bed and breakfast.
Tourism is an important part of the local economy. The town is home to several attractions, including the Marion Heritage Center, the Marion Historical Society, and the Marion County Park. The town also hosts several festivals and events throughout the year, including the Marion County Fair and the Marion County Apple Festival.
Demographics
As of the 2010 census, the population of Marion was 1,845. The racial makeup of the borough was 97.3% White, 0.7% African American, 0.2% Native American, 0.2% Asian, 0.2% from other races, and 1.4% from two or more races. Hispanic or Latino of any race were 0.7% of the population.
The median household income in Marion was $41,250, and the median family income was $50,000. The per capita income was $20,845. About 8.3% of the population was below the poverty line.
Common Questions
What is Per Capita Income in Marion?
Per Capita income in Marion is $22,633.
What is the Median Family Income in Marion?
Median Family Income in Marion is $61,825.
What is the Median Household income in Marion?
Median Household Income in Marion is $53,929.
What is Income or Wage Gap in Marion?
Income or Wage Gap in Marion is 70.9%.
Women in Marion earn 29.1 cents for every dollar earned by a man.
What is Inequality or Gini Index in Marion?
Inequality or Gini Index in Marion is 0.41.
What is the Total Population of Marion?
Total Population of Marion is 1,126.
What is the Total Male Population of Marion?
Total Male Population of Marion is 553.
What is the Total Female Population of Marion?
Total Female Population of Marion is 573.
What is the Ratio of Males per 100 Females in Marion?
There are 96.51 Males per 100 Females in Marion.
What is the Ratio of Females per 100 Males in Marion?
There are 103.62 Females per 100 Males in Marion.
What is the Median Population Age in Marion?
Median Population Age in Marion is 34.1 Years.
What is the Average Family Size in Marion
Average Family Size in Marion is 3.9 People.
What is the Average Household Size in Marion
Average Household Size in Marion is 3.2 People.
How Large is the Labor Force in Marion?
There are 444 People in the Labor Forcein in Marion.
What is the Percentage of People in the Labor Force in Marion?
49.0% of People are in the Labor Force in Marion.