Marion Center borough, PA Map & Demographics
Marion Center borough Overview
$26,693
PER CAPITA INCOME
$62,750
AVG FAMILY INCOME
$42,059
AVG HOUSEHOLD INCOME
21.5%
WAGE / INCOME GAP [ % ]
78.5¢/ $1
WAGE / INCOME GAP [ $ ]
0.44
INEQUALITY / GINI INDEX
492
TOTAL POPULATION
178
MALE POPULATION
314
FEMALE POPULATION
56.69
MALES / 100 FEMALES
176.40
FEMALES / 100 MALES
47.6
MEDIAN AGE
2.8
AVG FAMILY SIZE
2.5
AVG HOUSEHOLD SIZE
201
LABOR FORCE [ PEOPLE ]
50.1%
PERCENT IN LABOR FORCE
3.5%
UNEMPLOYMENT RATE
Income in Marion Center borough
Income Overview in Marion Center borough
Per Capita Income in Marion Center borough is $26,693, while median incomes of families and households are $62,750 and $42,059 respectively.
| Characteristic | Number | Measure |
| Per Capita Income | 492 | $26,693 |
| Median Family Income | 143 | $62,750 |
| Mean Family Income | 143 | $76,224 |
| Median Household Income | 198 | $42,059 |
| Mean Household Income | 198 | $65,495 |
| Income Deficit | 143 | $0 |
| Wage / Income Gap (%) | 492 | 21.52% |
| Wage / Income Gap ($) | 492 | 78.48¢ per $1 |
| Gini / Inequality Index | 492 | 0.44 |
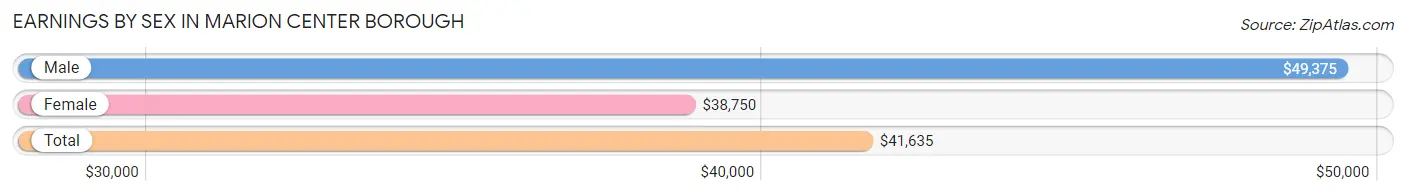
Earnings by Sex in Marion Center borough
Average Earnings in Marion Center borough are $41,635, $49,375 for men and $38,750 for women, a difference of 21.5%.
| Sex | Number | Average Earnings |
| Male | 89 (42.2%) | $49,375 |
| Female | 122 (57.8%) | $38,750 |
| Total | 211 (100.0%) | $41,635 |
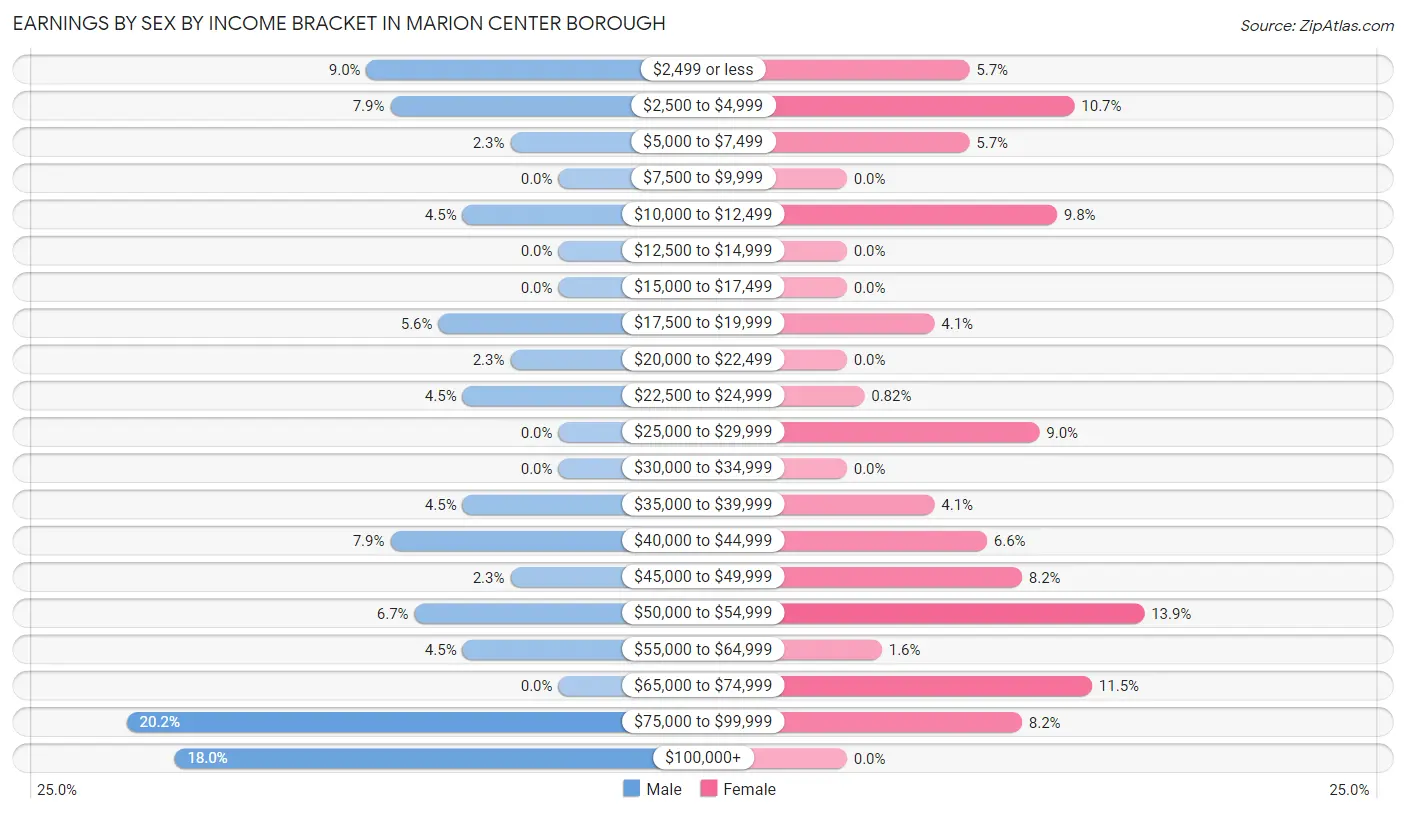
Earnings by Sex by Income Bracket in Marion Center borough
The most common earnings brackets in Marion Center borough are $75,000 to $99,999 for men (18 | 20.2%) and $50,000 to $54,999 for women (17 | 13.9%).
| Income | Male | Female |
| $2,499 or less | 8 (9.0%) | 7 (5.7%) |
| $2,500 to $4,999 | 7 (7.9%) | 13 (10.7%) |
| $5,000 to $7,499 | 2 (2.2%) | 7 (5.7%) |
| $7,500 to $9,999 | 0 (0.0%) | 0 (0.0%) |
| $10,000 to $12,499 | 4 (4.5%) | 12 (9.8%) |
| $12,500 to $14,999 | 0 (0.0%) | 0 (0.0%) |
| $15,000 to $17,499 | 0 (0.0%) | 0 (0.0%) |
| $17,500 to $19,999 | 5 (5.6%) | 5 (4.1%) |
| $20,000 to $22,499 | 2 (2.2%) | 0 (0.0%) |
| $22,500 to $24,999 | 4 (4.5%) | 1 (0.8%) |
| $25,000 to $29,999 | 0 (0.0%) | 11 (9.0%) |
| $30,000 to $34,999 | 0 (0.0%) | 0 (0.0%) |
| $35,000 to $39,999 | 4 (4.5%) | 5 (4.1%) |
| $40,000 to $44,999 | 7 (7.9%) | 8 (6.6%) |
| $45,000 to $49,999 | 2 (2.2%) | 10 (8.2%) |
| $50,000 to $54,999 | 6 (6.7%) | 17 (13.9%) |
| $55,000 to $64,999 | 4 (4.5%) | 2 (1.6%) |
| $65,000 to $74,999 | 0 (0.0%) | 14 (11.5%) |
| $75,000 to $99,999 | 18 (20.2%) | 10 (8.2%) |
| $100,000+ | 16 (18.0%) | 0 (0.0%) |
| Total | 89 (100.0%) | 122 (100.0%) |
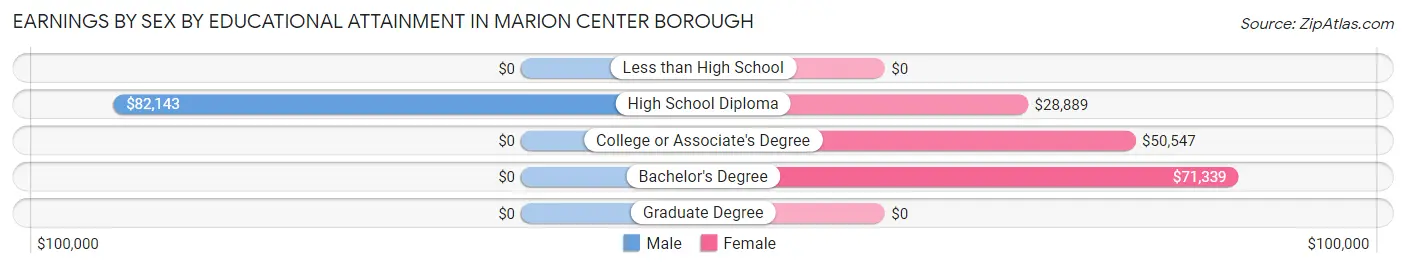
Earnings by Sex by Educational Attainment in Marion Center borough
Average earnings in Marion Center borough are $51,000 for men and $42,083 for women, a difference of 17.5%. Men with an educational attainment of high school diploma enjoy the highest average annual earnings of $82,143, while those with high school diploma education earn the least with $82,143. Women with an educational attainment of bachelor's degree earn the most with the average annual earnings of $71,339, while those with high school diploma education have the smallest earnings of $28,889.
| Educational Attainment | Male Income | Female Income |
| Less than High School | - | - |
| High School Diploma | $82,143 | $28,889 |
| College or Associate's Degree | - | - |
| Bachelor's Degree | - | - |
| Graduate Degree | - | - |
| Total | $51,000 | $42,083 |
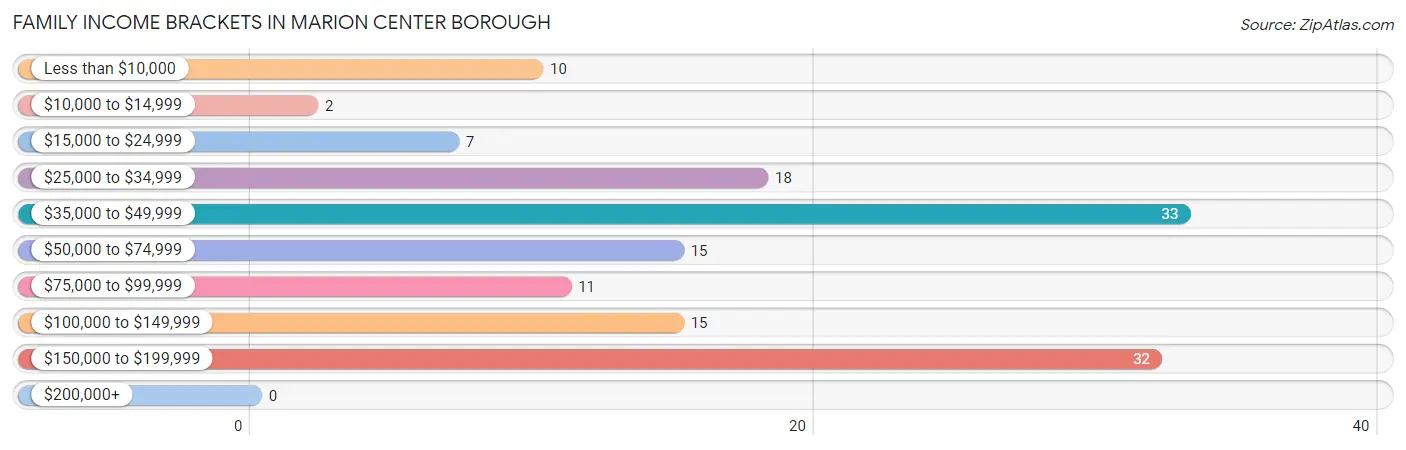
Family Income in Marion Center borough
Family Income Brackets in Marion Center borough
According to the Marion Center borough family income data, there are 33 families falling into the $35,000 to $49,999 income range, which is the most common income bracket and makes up 23.1% of all families.
| Income Bracket | # Families | % Families |
| Less than $10,000 | 10 | 7.0% |
| $10,000 to $14,999 | 2 | 1.4% |
| $15,000 to $24,999 | 7 | 4.9% |
| $25,000 to $34,999 | 18 | 12.6% |
| $35,000 to $49,999 | 33 | 23.1% |
| $50,000 to $74,999 | 15 | 10.5% |
| $75,000 to $99,999 | 11 | 7.7% |
| $100,000 to $149,999 | 15 | 10.5% |
| $150,000 to $199,999 | 32 | 22.4% |
| $200,000+ | 0 | 0.0% |
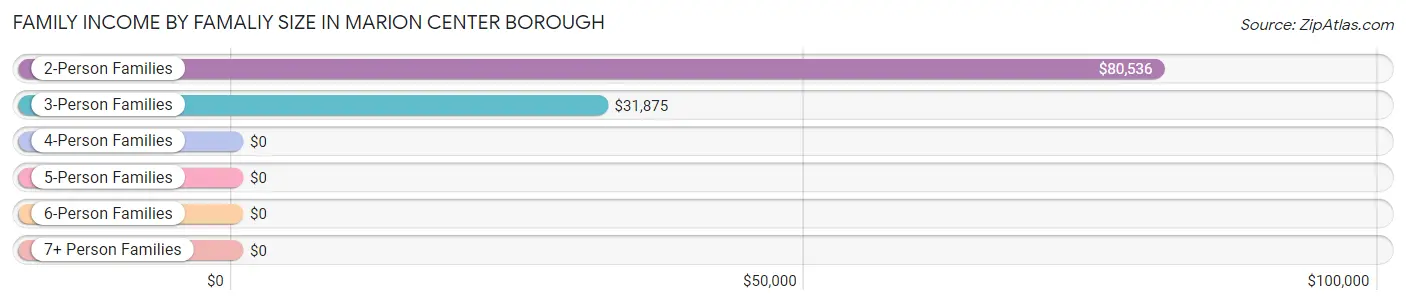
Family Income by Famaliy Size in Marion Center borough
2-person families (87 | 60.8%) account for the highest median family income in Marion Center borough with $80,536 per family, while 2-person families (87 | 60.8%) have the highest median income of $40,268 per family member.
| Income Bracket | # Families | Median Income |
| 2-Person Families | 87 (60.8%) | $80,536 |
| 3-Person Families | 29 (20.3%) | $31,875 |
| 4-Person Families | 24 (16.8%) | $0 |
| 5-Person Families | 3 (2.1%) | $0 |
| 6-Person Families | 0 (0.0%) | $0 |
| 7+ Person Families | 0 (0.0%) | $0 |
| Total | 143 (100.0%) | $62,750 |
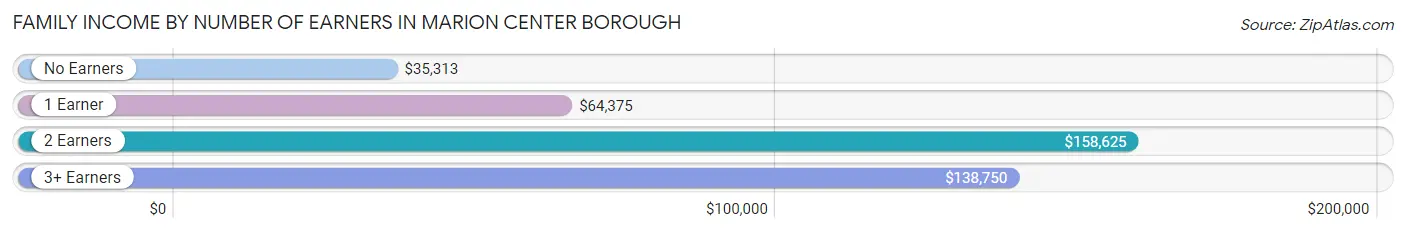
Family Income by Number of Earners in Marion Center borough
The median family income in Marion Center borough is $62,750, with families comprising 2 earners (39) having the highest median family income of $158,625, while families with no earners (47) have the lowest median family income of $35,313, accounting for 27.3% and 32.9% of families, respectively.
| Number of Earners | # Families | Median Income |
| No Earners | 47 (32.9%) | $35,313 |
| 1 Earner | 47 (32.9%) | $64,375 |
| 2 Earners | 39 (27.3%) | $158,625 |
| 3+ Earners | 10 (7.0%) | $138,750 |
| Total | 143 (100.0%) | $62,750 |
Household Income in Marion Center borough
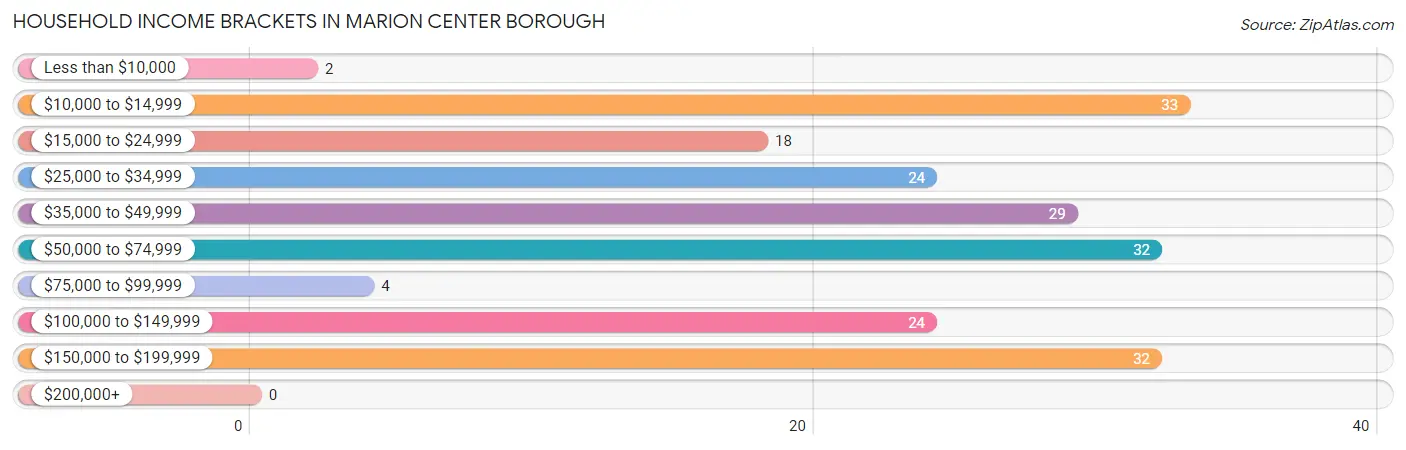
Household Income Brackets in Marion Center borough
With 33 households falling in the category, the $10,000 to $14,999 income range is the most frequent in Marion Center borough, accounting for 16.7% of all households.
| Income Bracket | # Households | % Households |
| Less than $10,000 | 2 | 1.0% |
| $10,000 to $14,999 | 33 | 16.7% |
| $15,000 to $24,999 | 18 | 9.1% |
| $25,000 to $34,999 | 24 | 12.1% |
| $35,000 to $49,999 | 29 | 14.6% |
| $50,000 to $74,999 | 32 | 16.2% |
| $75,000 to $99,999 | 4 | 2.0% |
| $100,000 to $149,999 | 24 | 12.1% |
| $150,000 to $199,999 | 32 | 16.2% |
| $200,000+ | 0 | 0.0% |
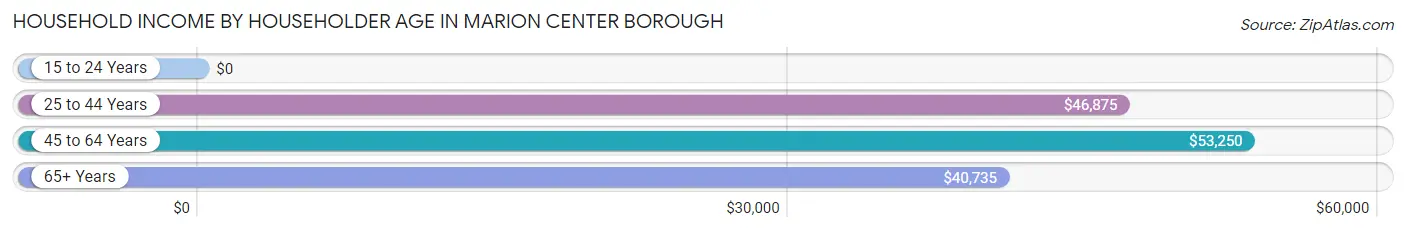
Household Income by Householder Age in Marion Center borough
The median household income in Marion Center borough is $42,059, with the highest median household income of $53,250 found in the 45 to 64 years age bracket for the primary householder. A total of 107 households (54.0%) fall into this category.
| Income Bracket | # Households | Median Income |
| 15 to 24 Years | 0 (0.0%) | $0 |
| 25 to 44 Years | 47 (23.7%) | $46,875 |
| 45 to 64 Years | 107 (54.0%) | $53,250 |
| 65+ Years | 44 (22.2%) | $40,735 |
| Total | 198 (100.0%) | $42,059 |
Poverty in Marion Center borough
Income Below Poverty by Sex and Age in Marion Center borough
With 25.8% poverty level for males and 30.2% for females among the residents of Marion Center borough, 6 to 11 year old males and 12 to 14 year old females are the most vulnerable to poverty, with 9 males (81.8%) and 15 females (78.9%) in their respective age groups living below the poverty level.
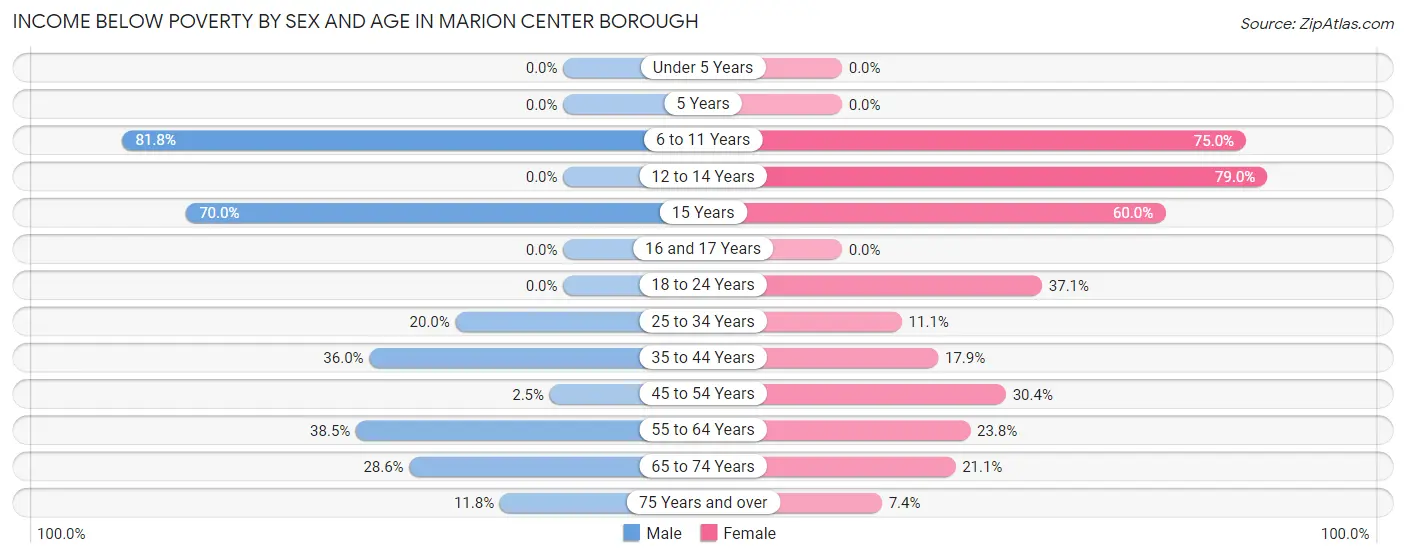
| Age Bracket | Male | Female |
| Under 5 Years | 0 (0.0%) | 0 (0.0%) |
| 5 Years | 0 (0.0%) | 0 (0.0%) |
| 6 to 11 Years | 9 (81.8%) | 12 (75.0%) |
| 12 to 14 Years | 0 (0.0%) | 15 (78.9%) |
| 15 Years | 7 (70.0%) | 9 (60.0%) |
| 16 and 17 Years | 0 (0.0%) | 0 (0.0%) |
| 18 to 24 Years | 0 (0.0%) | 13 (37.1%) |
| 25 to 34 Years | 2 (20.0%) | 2 (11.1%) |
| 35 to 44 Years | 9 (36.0%) | 5 (17.9%) |
| 45 to 54 Years | 1 (2.5%) | 28 (30.4%) |
| 55 to 64 Years | 10 (38.5%) | 5 (23.8%) |
| 65 to 74 Years | 6 (28.6%) | 4 (21.0%) |
| 75 Years and over | 2 (11.8%) | 2 (7.4%) |
| Total | 46 (25.8%) | 95 (30.2%) |
Income Above Poverty by Sex and Age in Marion Center borough
According to the poverty statistics in Marion Center borough, males aged under 5 years and females aged under 5 years are the age groups that are most secure financially, with 100.0% of males and 100.0% of females in these age groups living above the poverty line.
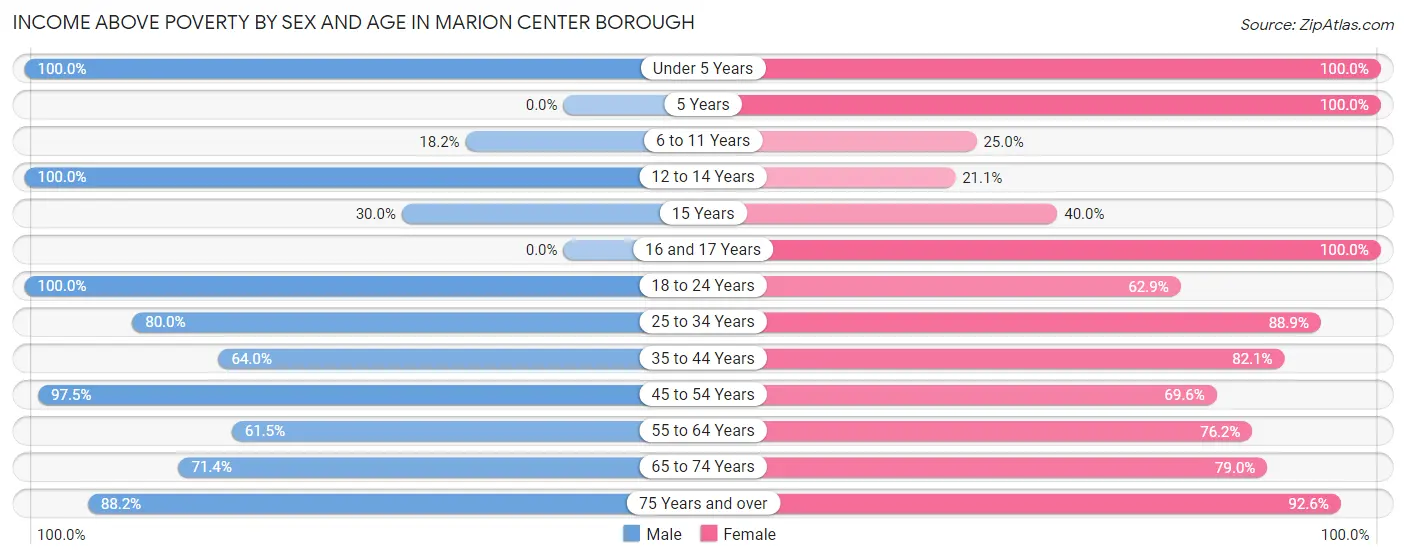
| Age Bracket | Male | Female |
| Under 5 Years | 2 (100.0%) | 4 (100.0%) |
| 5 Years | 0 (0.0%) | 7 (100.0%) |
| 6 to 11 Years | 2 (18.2%) | 4 (25.0%) |
| 12 to 14 Years | 7 (100.0%) | 4 (21.0%) |
| 15 Years | 3 (30.0%) | 6 (40.0%) |
| 16 and 17 Years | 0 (0.0%) | 13 (100.0%) |
| 18 to 24 Years | 9 (100.0%) | 22 (62.9%) |
| 25 to 34 Years | 8 (80.0%) | 16 (88.9%) |
| 35 to 44 Years | 16 (64.0%) | 23 (82.1%) |
| 45 to 54 Years | 39 (97.5%) | 64 (69.6%) |
| 55 to 64 Years | 16 (61.5%) | 16 (76.2%) |
| 65 to 74 Years | 15 (71.4%) | 15 (78.9%) |
| 75 Years and over | 15 (88.2%) | 25 (92.6%) |
| Total | 132 (74.2%) | 219 (69.8%) |
Income Below Poverty Among Married-Couple Families in Marion Center borough
The poverty statistics for married-couple families in Marion Center borough show that 11.9% or 12 of the total 101 families live below the poverty line. Families with 1 or 2 children have the highest poverty rate of 24.1%, comprising of 7 families. On the other hand, families with no children have the lowest poverty rate of 6.9%, which includes 5 families.
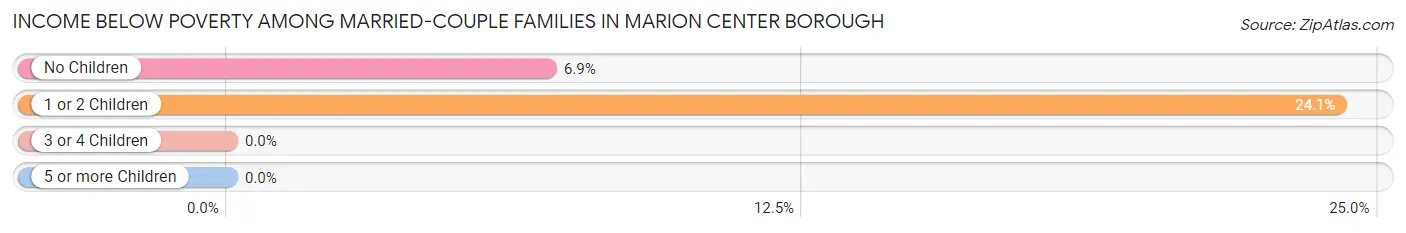
| Children | Above Poverty | Below Poverty |
| No Children | 67 (93.1%) | 5 (6.9%) |
| 1 or 2 Children | 22 (75.9%) | 7 (24.1%) |
| 3 or 4 Children | 0 (0.0%) | 0 (0.0%) |
| 5 or more Children | 0 (0.0%) | 0 (0.0%) |
| Total | 89 (88.1%) | 12 (11.9%) |
Income Below Poverty Among Single-Parent Households in Marion Center borough
According to the poverty data in Marion Center borough, 47.1% or 8 single-father households and 16.0% or 4 single-mother households are living below the poverty line. Among single-father households, those with 3 or 4 children have the highest poverty rate, with 8 households (100.0%) experiencing poverty. Likewise, among single-mother households, those with 1 or 2 children have the highest poverty rate, with 4 households (33.3%) falling below the poverty line.
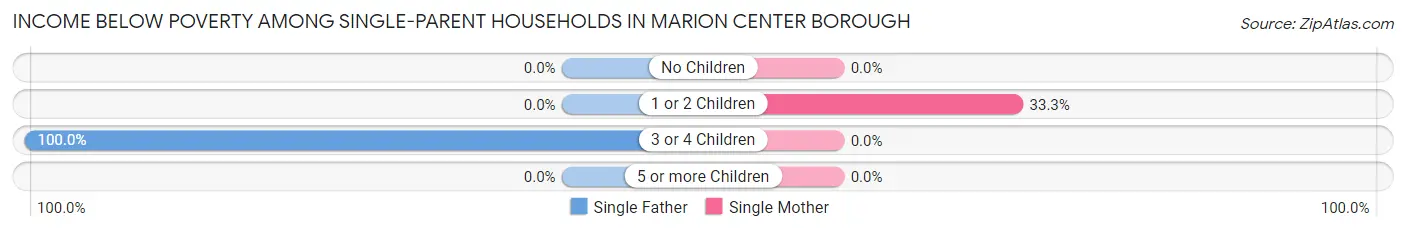
| Children | Single Father | Single Mother |
| No Children | 0 (0.0%) | 0 (0.0%) |
| 1 or 2 Children | 0 (0.0%) | 4 (33.3%) |
| 3 or 4 Children | 8 (100.0%) | 0 (0.0%) |
| 5 or more Children | 0 (0.0%) | 0 (0.0%) |
| Total | 8 (47.1%) | 4 (16.0%) |
Income Below Poverty Among Married-Couple vs Single-Parent Households in Marion Center borough
The poverty data for Marion Center borough shows that 12 of the married-couple family households (11.9%) and 12 of the single-parent households (28.6%) are living below the poverty level. Within the married-couple family households, those with 1 or 2 children have the highest poverty rate, with 7 households (24.1%) falling below the poverty line. Among the single-parent households, those with 3 or 4 children have the highest poverty rate, with 8 household (100.0%) living below poverty.
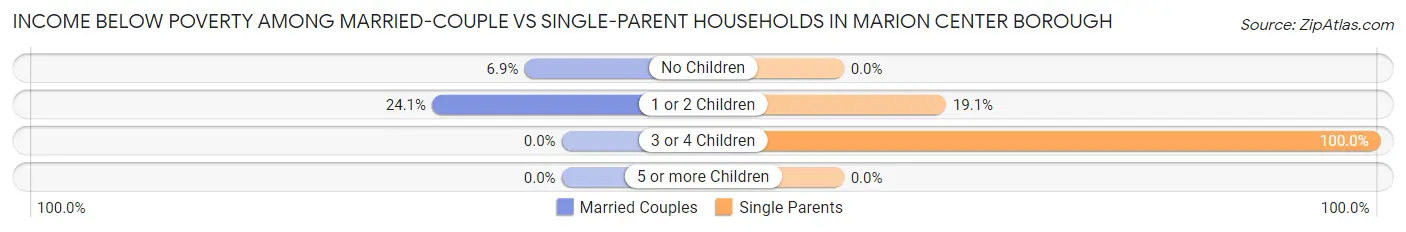
| Children | Married-Couple Families | Single-Parent Households |
| No Children | 5 (6.9%) | 0 (0.0%) |
| 1 or 2 Children | 7 (24.1%) | 4 (19.1%) |
| 3 or 4 Children | 0 (0.0%) | 8 (100.0%) |
| 5 or more Children | 0 (0.0%) | 0 (0.0%) |
| Total | 12 (11.9%) | 12 (28.6%) |
Race in Marion Center borough
The most populous races in Marion Center borough are White / Caucasian (446 | 90.6%), Two or more Races (43 | 8.7%), and Hispanic or Latino (17 | 3.5%).
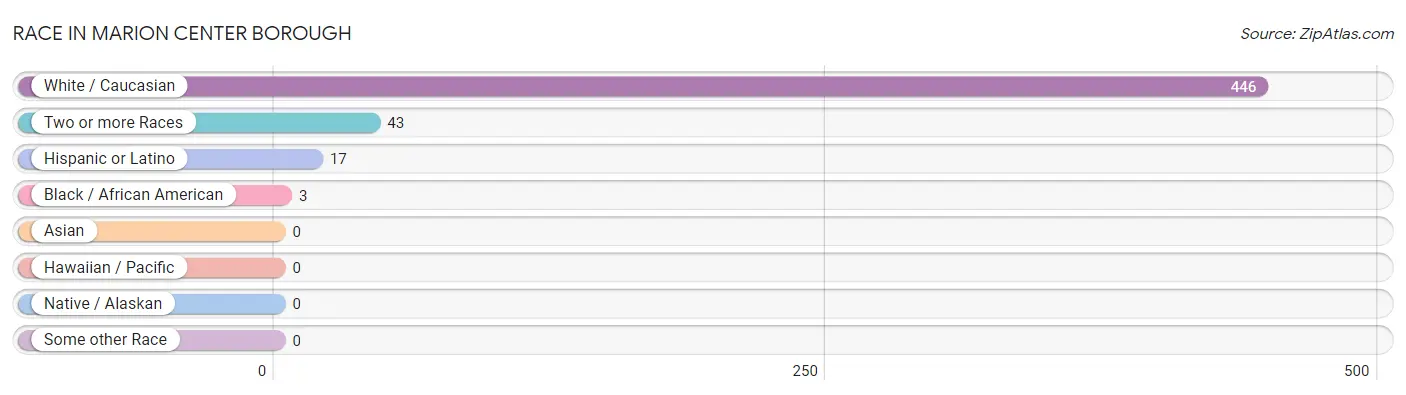
| Race | # Population | % Population |
| Asian | 0 | 0.0% |
| Black / African American | 3 | 0.6% |
| Hawaiian / Pacific | 0 | 0.0% |
| Hispanic or Latino | 17 | 3.5% |
| Native / Alaskan | 0 | 0.0% |
| White / Caucasian | 446 | 90.6% |
| Two or more Races | 43 | 8.7% |
| Some other Race | 0 | 0.0% |
| Total | 492 | 100.0% |
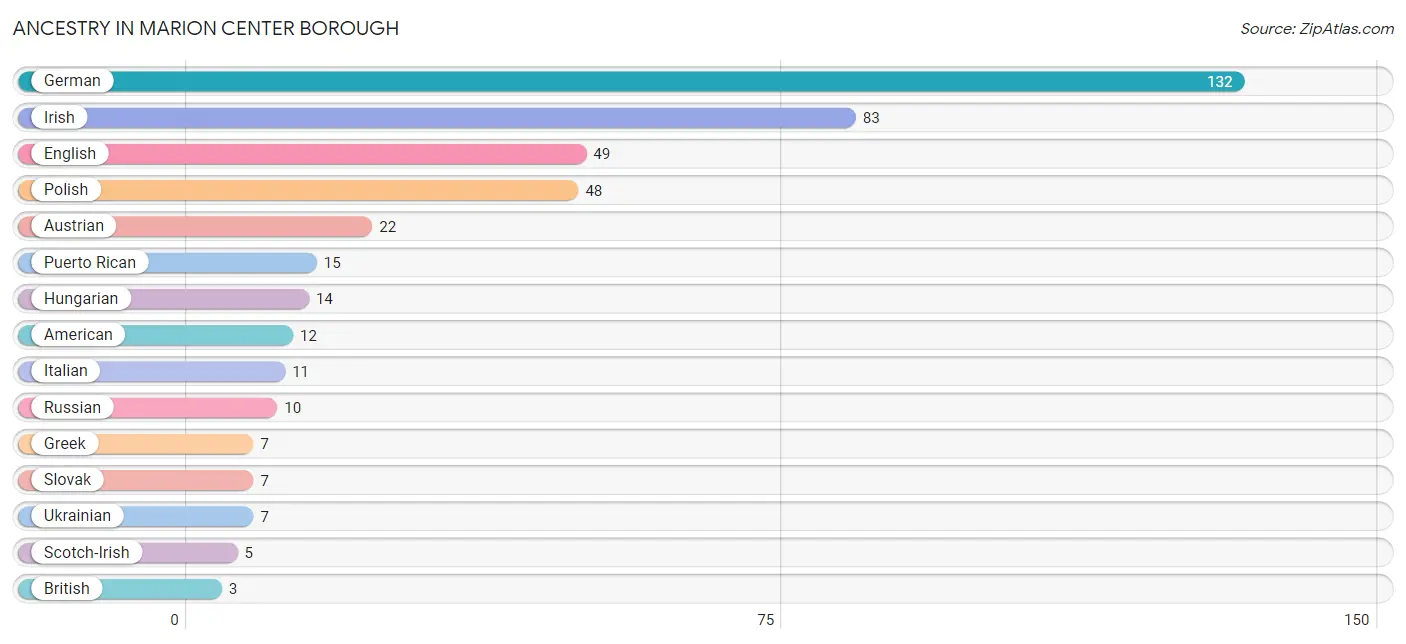
Ancestry in Marion Center borough
The most populous ancestries reported in Marion Center borough are German (132 | 26.8%), Irish (83 | 16.9%), English (49 | 10.0%), Polish (48 | 9.8%), and Austrian (22 | 4.5%), together accounting for 67.9% of all Marion Center borough residents.
| Ancestry | # Population | % Population |
| American | 12 | 2.4% |
| Austrian | 22 | 4.5% |
| British | 3 | 0.6% |
| Cherokee | 2 | 0.4% |
| Cuban | 2 | 0.4% |
| Czechoslovakian | 3 | 0.6% |
| Dutch | 2 | 0.4% |
| Eastern European | 2 | 0.4% |
| English | 49 | 10.0% |
| European | 1 | 0.2% |
| French | 2 | 0.4% |
| German | 132 | 26.8% |
| Greek | 7 | 1.4% |
| Hungarian | 14 | 2.9% |
| Irish | 83 | 16.9% |
| Italian | 11 | 2.2% |
| Polish | 48 | 9.8% |
| Puerto Rican | 15 | 3.0% |
| Russian | 10 | 2.0% |
| Scotch-Irish | 5 | 1.0% |
| Slovak | 7 | 1.4% |
| Swiss | 2 | 0.4% |
| Ukrainian | 7 | 1.4% |
| Welsh | 2 | 0.4% | View All 24 Rows |
Immigrants in Marion Center borough
The most numerous immigrant groups reported in Marion Center borough came from Europe (4 | 0.8%), England (2 | 0.4%), Germany (2 | 0.4%), Northern Europe (2 | 0.4%), and Western Europe (2 | 0.4%), together accounting for 2.4% of all Marion Center borough residents.
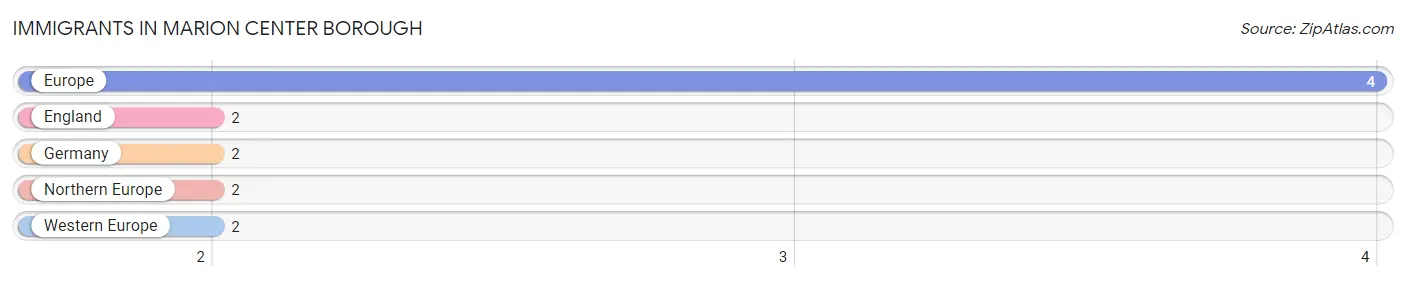
| Immigration Origin | # Population | % Population |
| England | 2 | 0.4% |
| Europe | 4 | 0.8% |
| Germany | 2 | 0.4% |
| Northern Europe | 2 | 0.4% |
| Western Europe | 2 | 0.4% | View All 5 Rows |
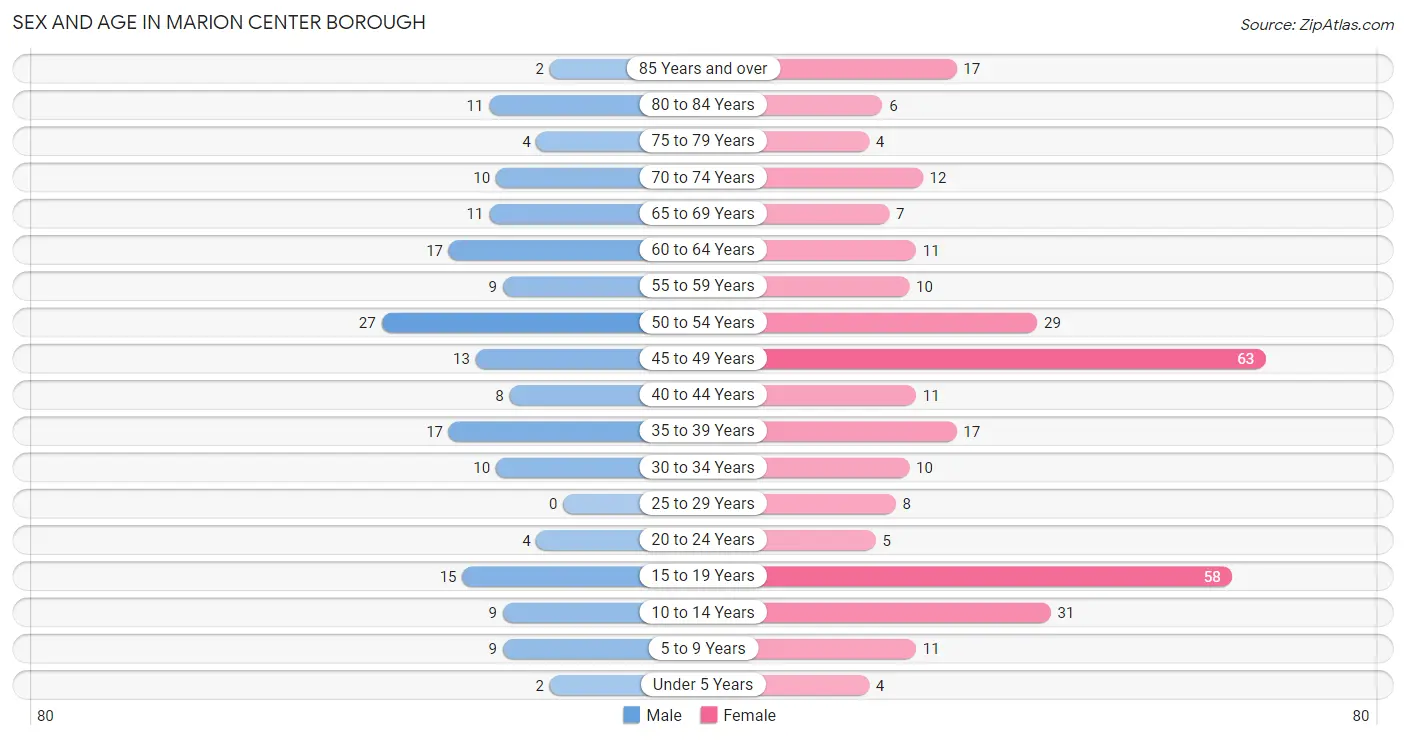
Sex and Age in Marion Center borough
Sex and Age in Marion Center borough
The most populous age groups in Marion Center borough are 50 to 54 Years (27 | 15.2%) for men and 45 to 49 Years (63 | 20.1%) for women.
| Age Bracket | Male | Female |
| Under 5 Years | 2 (1.1%) | 4 (1.3%) |
| 5 to 9 Years | 9 (5.1%) | 11 (3.5%) |
| 10 to 14 Years | 9 (5.1%) | 31 (9.9%) |
| 15 to 19 Years | 15 (8.4%) | 58 (18.5%) |
| 20 to 24 Years | 4 (2.2%) | 5 (1.6%) |
| 25 to 29 Years | 0 (0.0%) | 8 (2.5%) |
| 30 to 34 Years | 10 (5.6%) | 10 (3.2%) |
| 35 to 39 Years | 17 (9.6%) | 17 (5.4%) |
| 40 to 44 Years | 8 (4.5%) | 11 (3.5%) |
| 45 to 49 Years | 13 (7.3%) | 63 (20.1%) |
| 50 to 54 Years | 27 (15.2%) | 29 (9.2%) |
| 55 to 59 Years | 9 (5.1%) | 10 (3.2%) |
| 60 to 64 Years | 17 (9.6%) | 11 (3.5%) |
| 65 to 69 Years | 11 (6.2%) | 7 (2.2%) |
| 70 to 74 Years | 10 (5.6%) | 12 (3.8%) |
| 75 to 79 Years | 4 (2.2%) | 4 (1.3%) |
| 80 to 84 Years | 11 (6.2%) | 6 (1.9%) |
| 85 Years and over | 2 (1.1%) | 17 (5.4%) |
| Total | 178 (100.0%) | 314 (100.0%) |
Families and Households in Marion Center borough
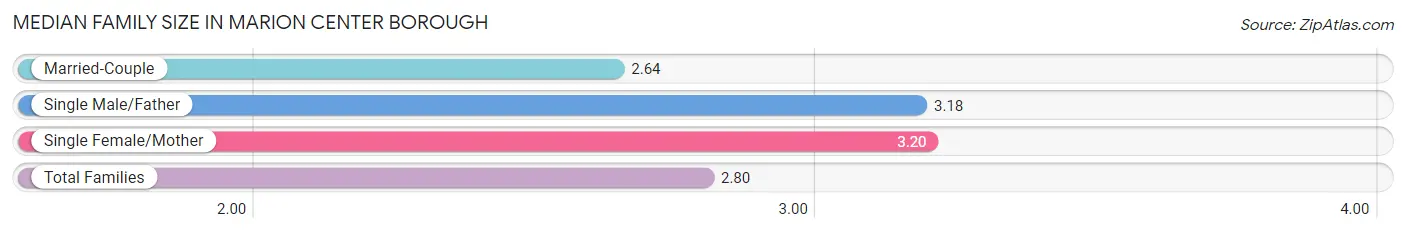
Median Family Size in Marion Center borough
The median family size in Marion Center borough is 2.80 persons per family, with single female/mother families (25 | 17.5%) accounting for the largest median family size of 3.2 persons per family. On the other hand, married-couple families (101 | 70.6%) represent the smallest median family size with 2.64 persons per family.
| Family Type | # Families | Family Size |
| Married-Couple | 101 (70.6%) | 2.64 |
| Single Male/Father | 17 (11.9%) | 3.18 |
| Single Female/Mother | 25 (17.5%) | 3.20 |
| Total Families | 143 (100.0%) | 2.80 |
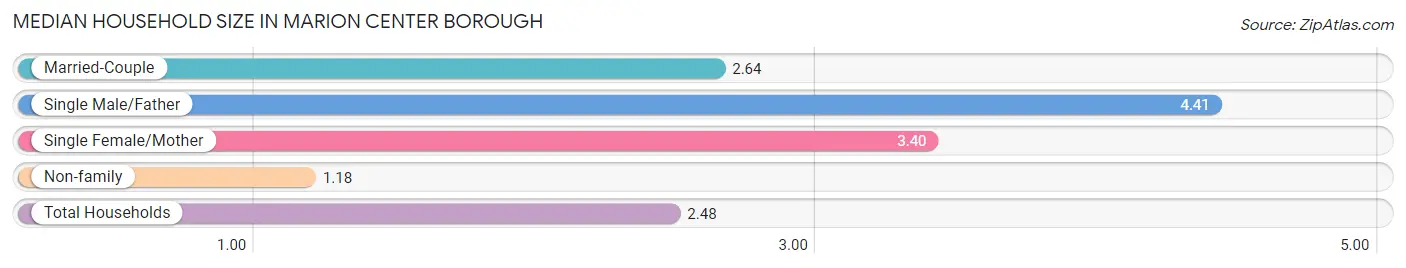
Median Household Size in Marion Center borough
The median household size in Marion Center borough is 2.48 persons per household, with single male/father households (17 | 8.6%) accounting for the largest median household size of 4.41 persons per household. non-family households (55 | 27.8%) represent the smallest median household size with 1.18 persons per household.
| Household Type | # Households | Household Size |
| Married-Couple | 101 (51.0%) | 2.64 |
| Single Male/Father | 17 (8.6%) | 4.41 |
| Single Female/Mother | 25 (12.6%) | 3.40 |
| Non-family | 55 (27.8%) | 1.18 |
| Total Households | 198 (100.0%) | 2.48 |
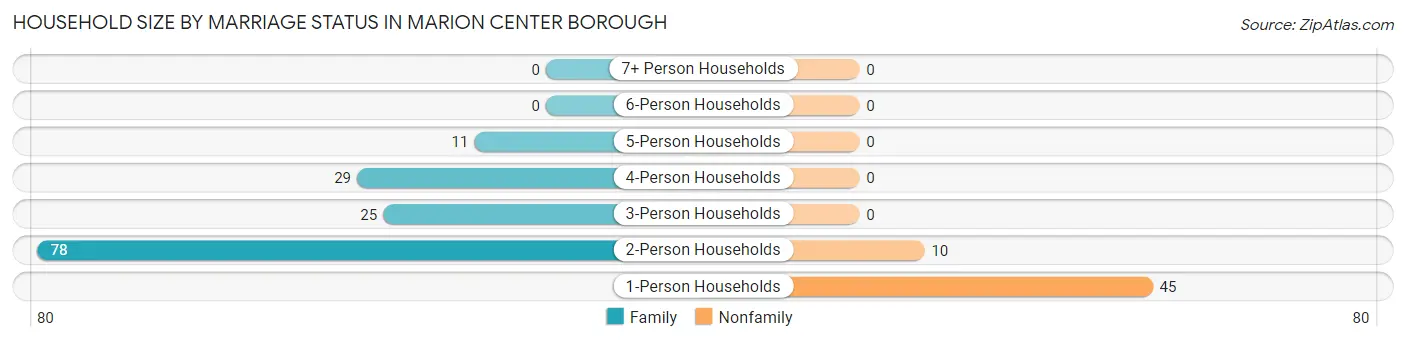
Household Size by Marriage Status in Marion Center borough
Out of a total of 198 households in Marion Center borough, 143 (72.2%) are family households, while 55 (27.8%) are nonfamily households. The most numerous type of family households are 2-person households, comprising 78, and the most common type of nonfamily households are 1-person households, comprising 45.
| Household Size | Family Households | Nonfamily Households |
| 1-Person Households | - | 45 (22.7%) |
| 2-Person Households | 78 (39.4%) | 10 (5.1%) |
| 3-Person Households | 25 (12.6%) | 0 (0.0%) |
| 4-Person Households | 29 (14.6%) | 0 (0.0%) |
| 5-Person Households | 11 (5.6%) | 0 (0.0%) |
| 6-Person Households | 0 (0.0%) | 0 (0.0%) |
| 7+ Person Households | 0 (0.0%) | 0 (0.0%) |
| Total | 143 (72.2%) | 55 (27.8%) |
Female Fertility in Marion Center borough
Fertility by Age in Marion Center borough
| Age Bracket | Women with Births | Births / 1,000 Women |
| 15 to 19 years | 0 (0.0%) | 0.0 |
| 20 to 34 years | 0 (0.0%) | 0.0 |
| 35 to 50 years | 0 (0.0%) | 0.0 |
| Total | 0 (0.0%) | 0.0 |
Fertility by Age by Marriage Status in Marion Center borough
| Age Bracket | Married | Unmarried |
| 15 to 19 years | 0 (0.0%) | 0 (0.0%) |
| 20 to 34 years | 0 (0.0%) | 0 (0.0%) |
| 35 to 50 years | 0 (0.0%) | 0 (0.0%) |
| Total | 0 (0.0%) | 0 (0.0%) |
Fertility by Education in Marion Center borough
| Educational Attainment | Women with Births | Births / 1,000 Women |
| Less than High School | 0 (0.0%) | 0.0 |
| High School Diploma | 0 (0.0%) | 0.0 |
| College or Associate's Degree | 0 (0.0%) | 0.0 |
| Bachelor's Degree | 0 (0.0%) | 0.0 |
| Graduate Degree | 0 (0.0%) | 0.0 |
| Total | 0 (0.0%) | 0.0 |
Fertility by Education by Marriage Status in Marion Center borough
| Educational Attainment | Married | Unmarried |
| Less than High School | 0 (0.0%) | 0 (0.0%) |
| High School Diploma | 0 (0.0%) | 0 (0.0%) |
| College or Associate's Degree | 0 (0.0%) | 0 (0.0%) |
| Bachelor's Degree | 0 (0.0%) | 0 (0.0%) |
| Graduate Degree | 0 (0.0%) | 0 (0.0%) |
| Total | 0 (0.0%) | 0 (0.0%) |
Employment Characteristics in Marion Center borough
Employment by Class of Employer in Marion Center borough
Among the 189 employed individuals in Marion Center borough, private company employees (141 | 74.6%), not-for-profit organizations (19 | 10.1%), and local government employees (19 | 10.1%) make up the most common classes of employment.
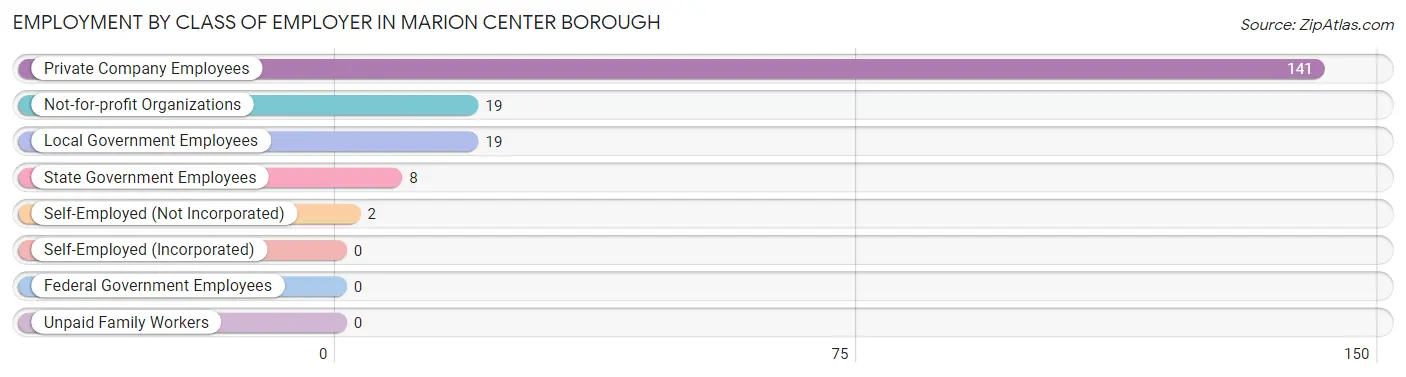
| Employer Class | # Employees | % Employees |
| Private Company Employees | 141 | 74.6% |
| Self-Employed (Incorporated) | 0 | 0.0% |
| Self-Employed (Not Incorporated) | 2 | 1.1% |
| Not-for-profit Organizations | 19 | 10.1% |
| Local Government Employees | 19 | 10.1% |
| State Government Employees | 8 | 4.2% |
| Federal Government Employees | 0 | 0.0% |
| Unpaid Family Workers | 0 | 0.0% |
| Total | 189 | 100.0% |
Employment Status by Age in Marion Center borough
According to the labor force statistics for Marion Center borough, out of the total population over 16 years of age (401), 50.1% or 201 individuals are in the labor force, with 3.5% or 7 of them unemployed. The age group with the highest labor force participation rate is 35 to 44 years, with 94.3% or 50 individuals in the labor force. Within the labor force, the 20 to 24 years age range has the highest percentage of unemployed individuals, with 100.0% or 5 of them being unemployed.
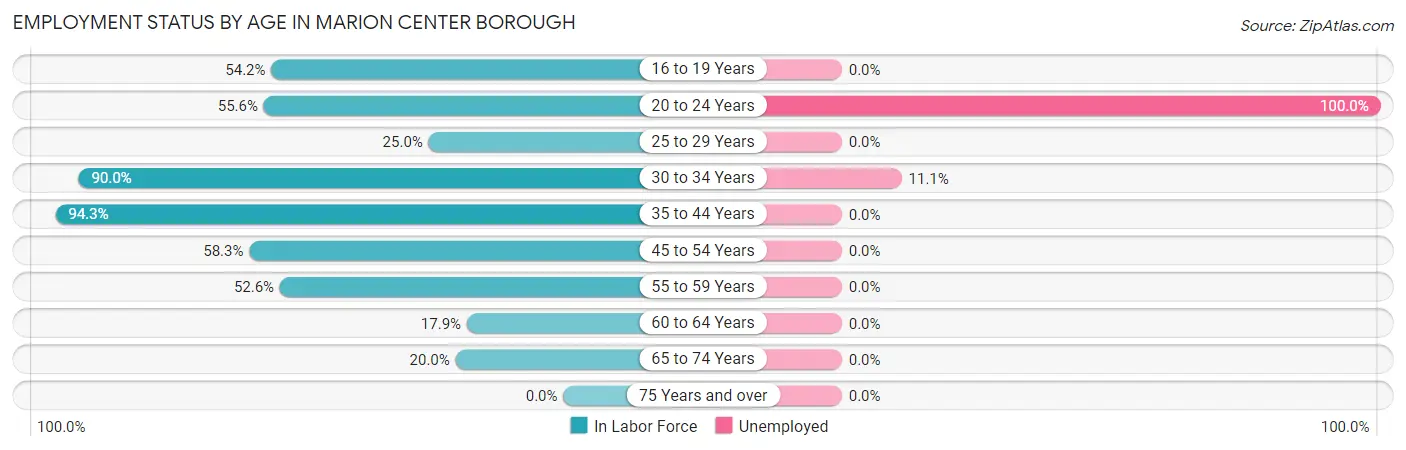
| Age Bracket | In Labor Force | Unemployed |
| 16 to 19 Years | 26 (54.2%) | 0 (0.0%) |
| 20 to 24 Years | 5 (55.6%) | 5 (100.0%) |
| 25 to 29 Years | 2 (25.0%) | 0 (0.0%) |
| 30 to 34 Years | 18 (90.0%) | 2 (11.1%) |
| 35 to 44 Years | 50 (94.3%) | 0 (0.0%) |
| 45 to 54 Years | 77 (58.3%) | 0 (0.0%) |
| 55 to 59 Years | 10 (52.6%) | 0 (0.0%) |
| 60 to 64 Years | 5 (17.9%) | 0 (0.0%) |
| 65 to 74 Years | 8 (20.0%) | 0 (0.0%) |
| 75 Years and over | 0 (0.0%) | 0 (0.0%) |
| Total | 201 (50.1%) | 7 (3.5%) |
Employment Status by Educational Attainment in Marion Center borough
According to labor force statistics for Marion Center borough, 62.3% of individuals (162) out of the total population between 25 and 64 years of age (260) are in the labor force, with 1.2% or 2 of them being unemployed. The group with the highest labor force participation rate are those with the educational attainment of bachelor's degree or higher, with 80.5% or 33 individuals in the labor force. Within the labor force, individuals with college / associate degree education have the highest percentage of unemployment, with 3.3% or 2 of them being unemployed.
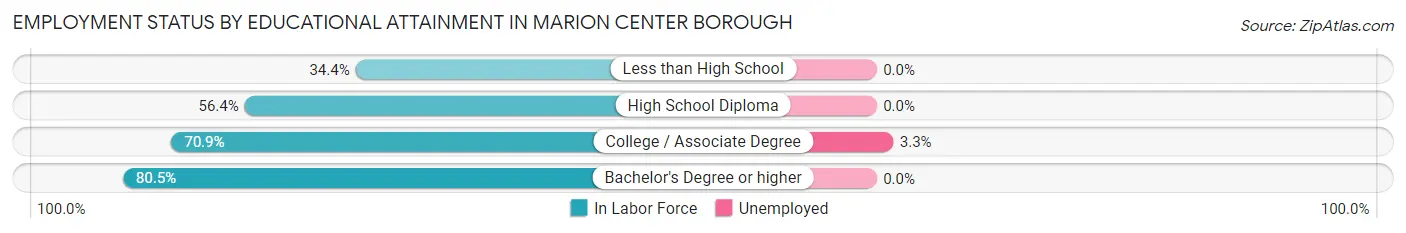
| Educational Attainment | In Labor Force | Unemployed |
| Less than High School | 11 (34.4%) | 0 (0.0%) |
| High School Diploma | 57 (56.4%) | 0 (0.0%) |
| College / Associate Degree | 61 (70.9%) | 3 (3.3%) |
| Bachelor's Degree or higher | 33 (80.5%) | 0 (0.0%) |
| Total | 162 (62.3%) | 3 (1.2%) |
Employment Occupations by Sex in Marion Center borough
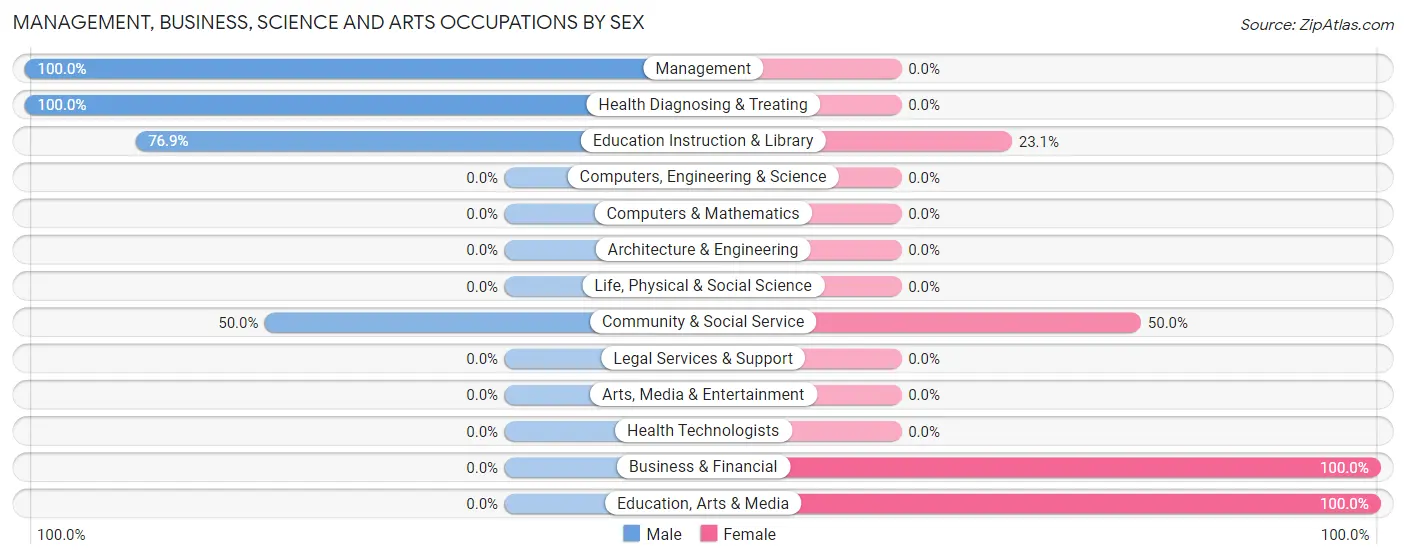
Management, Business, Science and Arts Occupations
The most common Management, Business, Science and Arts occupations in Marion Center borough are Business & Financial (26 | 13.4%), Community & Social Service (20 | 10.3%), Education Instruction & Library (13 | 6.7%), Health Diagnosing & Treating (8 | 4.1%), and Education, Arts & Media (7 | 3.6%).
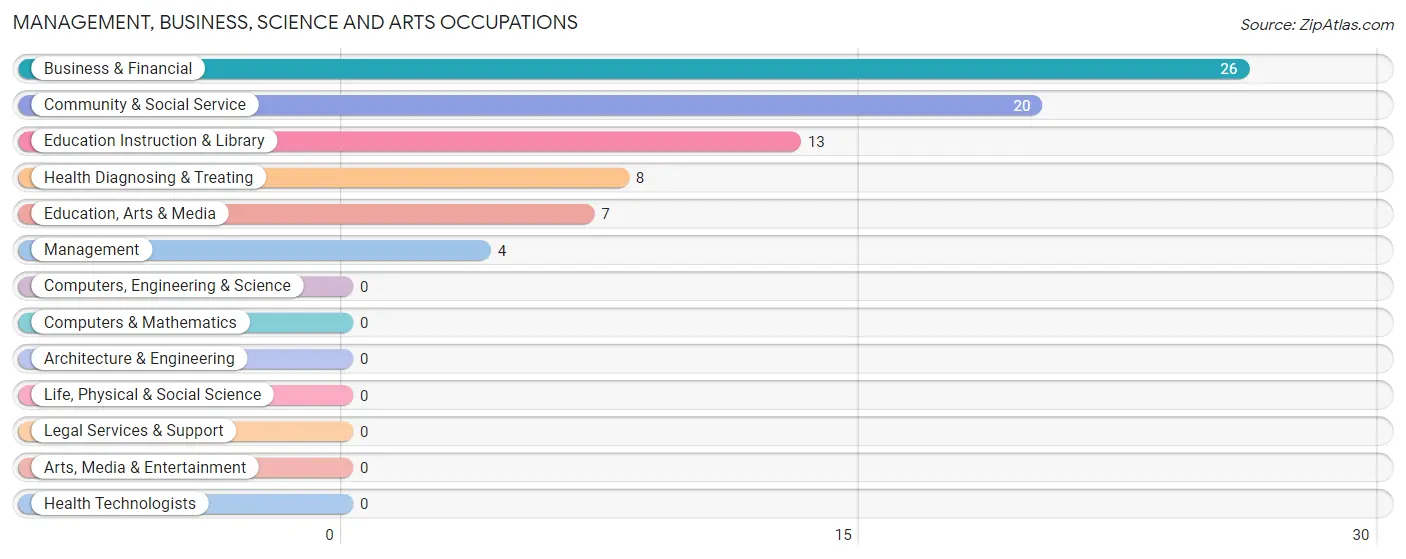
Management, Business, Science and Arts Occupations by Sex
Within the Management, Business, Science and Arts occupations in Marion Center borough, the most male-oriented occupations are Management (100.0%), Health Diagnosing & Treating (100.0%), and Education Instruction & Library (76.9%), while the most female-oriented occupations are Business & Financial (100.0%), Education, Arts & Media (100.0%), and Community & Social Service (50.0%).
| Occupation | Male | Female |
| Management | 4 (100.0%) | 0 (0.0%) |
| Business & Financial | 0 (0.0%) | 26 (100.0%) |
| Computers, Engineering & Science | 0 (0.0%) | 0 (0.0%) |
| Computers & Mathematics | 0 (0.0%) | 0 (0.0%) |
| Architecture & Engineering | 0 (0.0%) | 0 (0.0%) |
| Life, Physical & Social Science | 0 (0.0%) | 0 (0.0%) |
| Community & Social Service | 10 (50.0%) | 10 (50.0%) |
| Education, Arts & Media | 0 (0.0%) | 7 (100.0%) |
| Legal Services & Support | 0 (0.0%) | 0 (0.0%) |
| Education Instruction & Library | 10 (76.9%) | 3 (23.1%) |
| Arts, Media & Entertainment | 0 (0.0%) | 0 (0.0%) |
| Health Diagnosing & Treating | 8 (100.0%) | 0 (0.0%) |
| Health Technologists | 0 (0.0%) | 0 (0.0%) |
| Total (Category) | 22 (37.9%) | 36 (62.1%) |
| Total (Overall) | 84 (43.3%) | 110 (56.7%) |
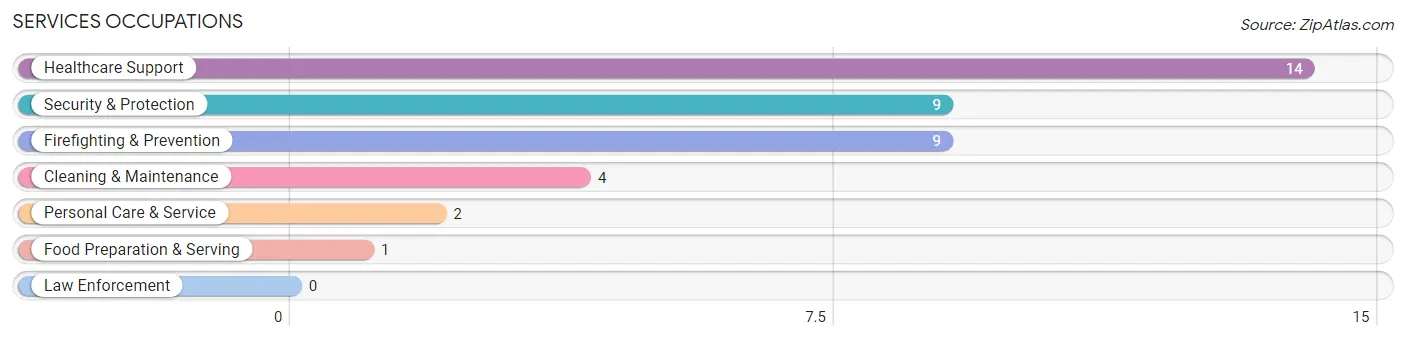
Services Occupations
The most common Services occupations in Marion Center borough are Healthcare Support (14 | 7.2%), Security & Protection (9 | 4.6%), Firefighting & Prevention (9 | 4.6%), Cleaning & Maintenance (4 | 2.1%), and Personal Care & Service (2 | 1.0%).
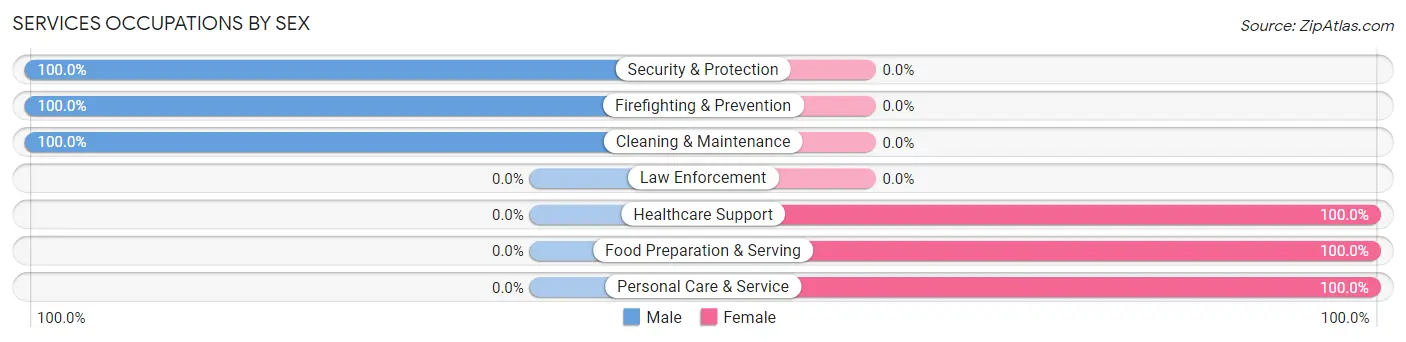
Services Occupations by Sex
Within the Services occupations in Marion Center borough, the most male-oriented occupations are Security & Protection (100.0%), Firefighting & Prevention (100.0%), and Cleaning & Maintenance (100.0%), while the most female-oriented occupations are Healthcare Support (100.0%), Food Preparation & Serving (100.0%), and Personal Care & Service (100.0%).
| Occupation | Male | Female |
| Healthcare Support | 0 (0.0%) | 14 (100.0%) |
| Security & Protection | 9 (100.0%) | 0 (0.0%) |
| Firefighting & Prevention | 9 (100.0%) | 0 (0.0%) |
| Law Enforcement | 0 (0.0%) | 0 (0.0%) |
| Food Preparation & Serving | 0 (0.0%) | 1 (100.0%) |
| Cleaning & Maintenance | 4 (100.0%) | 0 (0.0%) |
| Personal Care & Service | 0 (0.0%) | 2 (100.0%) |
| Total (Category) | 13 (43.3%) | 17 (56.7%) |
| Total (Overall) | 84 (43.3%) | 110 (56.7%) |
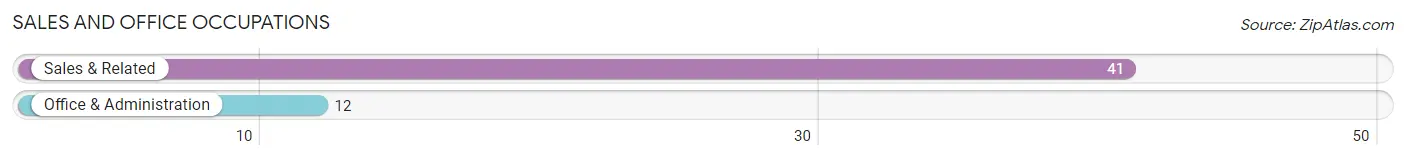
Sales and Office Occupations
The most common Sales and Office occupations in Marion Center borough are Sales & Related (41 | 21.1%), and Office & Administration (12 | 6.2%).
Sales and Office Occupations by Sex
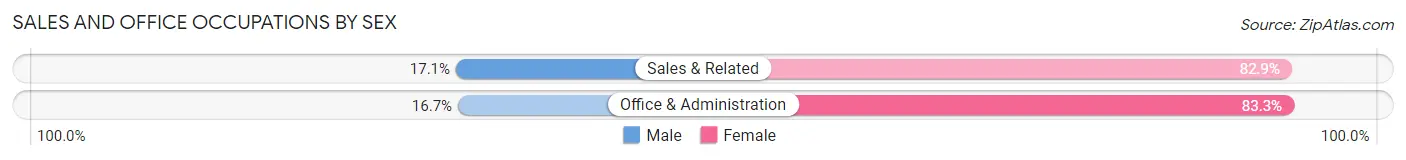
| Occupation | Male | Female |
| Sales & Related | 7 (17.1%) | 34 (82.9%) |
| Office & Administration | 2 (16.7%) | 10 (83.3%) |
| Total (Category) | 9 (17.0%) | 44 (83.0%) |
| Total (Overall) | 84 (43.3%) | 110 (56.7%) |
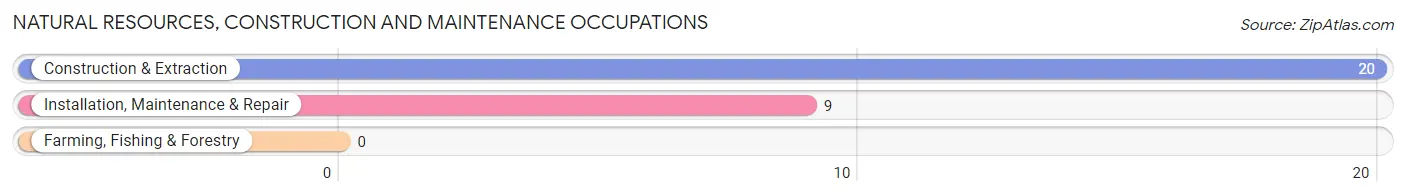
Natural Resources, Construction and Maintenance Occupations
The most common Natural Resources, Construction and Maintenance occupations in Marion Center borough are Construction & Extraction (20 | 10.3%), and Installation, Maintenance & Repair (9 | 4.6%).
Natural Resources, Construction and Maintenance Occupations by Sex
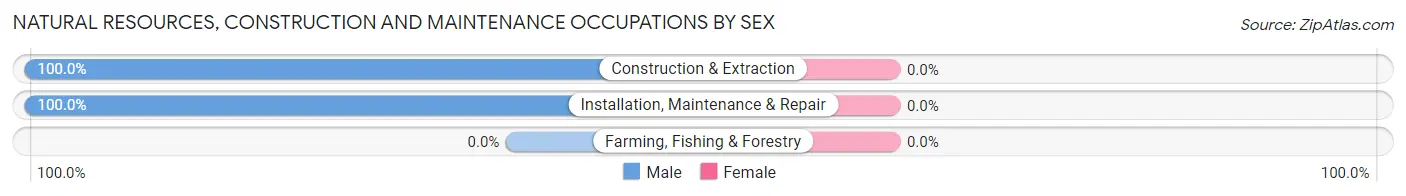
| Occupation | Male | Female |
| Farming, Fishing & Forestry | 0 (0.0%) | 0 (0.0%) |
| Construction & Extraction | 20 (100.0%) | 0 (0.0%) |
| Installation, Maintenance & Repair | 9 (100.0%) | 0 (0.0%) |
| Total (Category) | 29 (100.0%) | 0 (0.0%) |
| Total (Overall) | 84 (43.3%) | 110 (56.7%) |
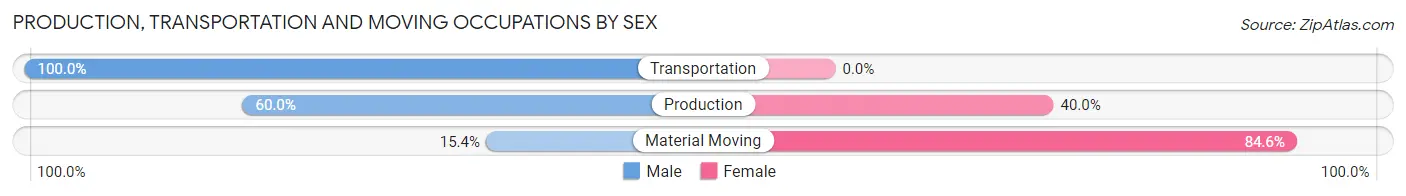
Production, Transportation and Moving Occupations
The most common Production, Transportation and Moving occupations in Marion Center borough are Material Moving (13 | 6.7%), Transportation (6 | 3.1%), and Production (5 | 2.6%).
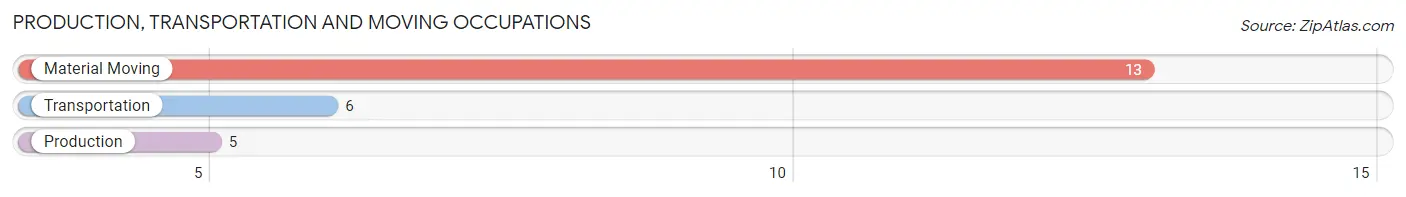
Production, Transportation and Moving Occupations by Sex
| Occupation | Male | Female |
| Production | 3 (60.0%) | 2 (40.0%) |
| Transportation | 6 (100.0%) | 0 (0.0%) |
| Material Moving | 2 (15.4%) | 11 (84.6%) |
| Total (Category) | 11 (45.8%) | 13 (54.2%) |
| Total (Overall) | 84 (43.3%) | 110 (56.7%) |
Employment Industries by Sex in Marion Center borough
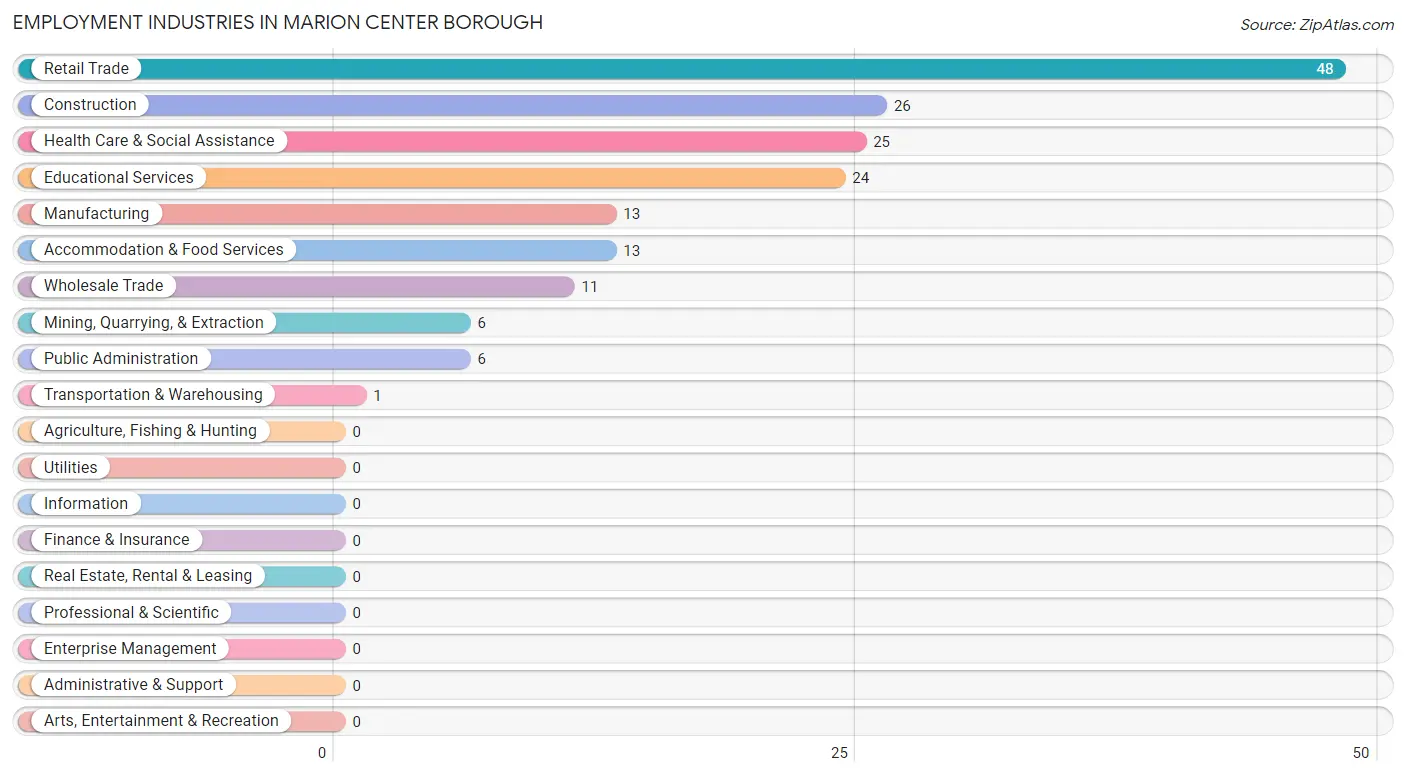
Employment Industries in Marion Center borough
The major employment industries in Marion Center borough include Retail Trade (48 | 24.7%), Construction (26 | 13.4%), Health Care & Social Assistance (25 | 12.9%), Educational Services (24 | 12.4%), and Manufacturing (13 | 6.7%).
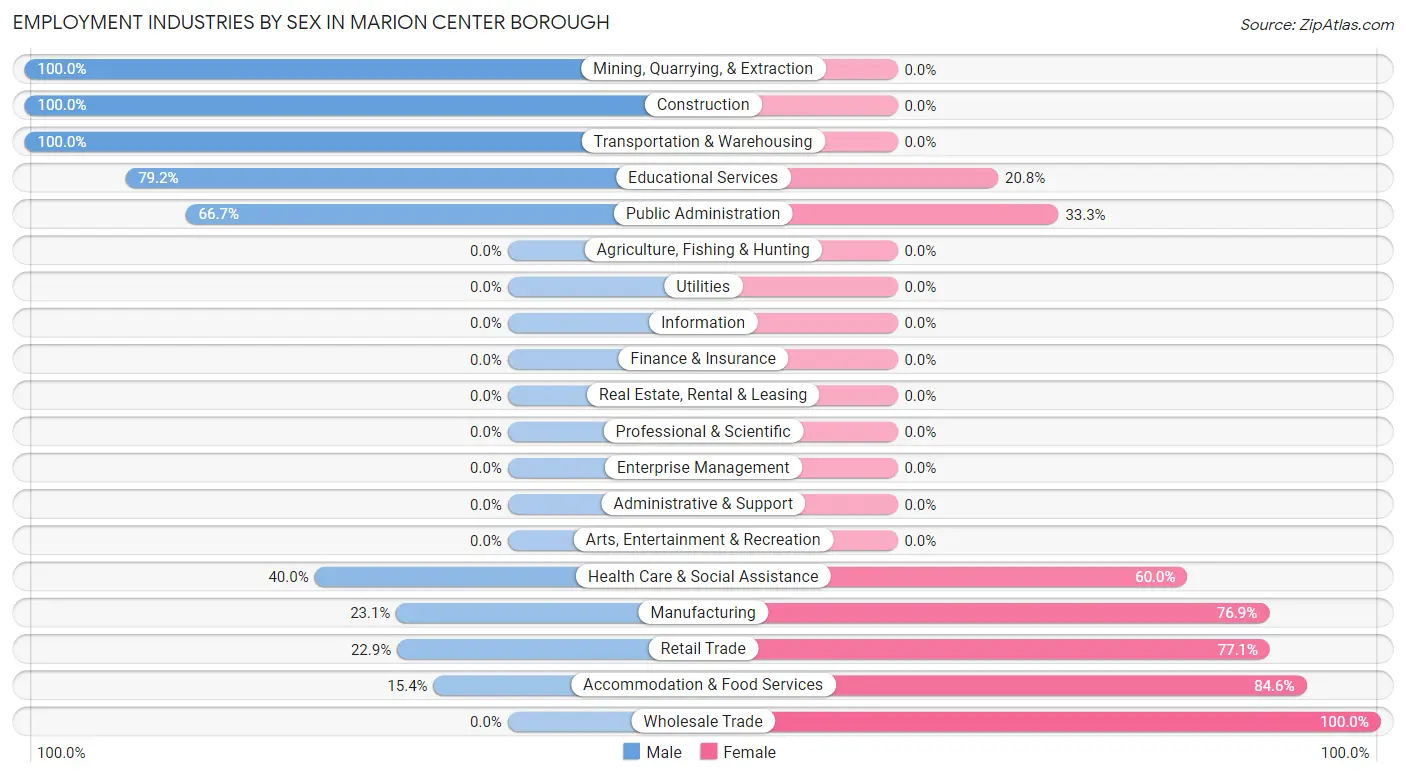
Employment Industries by Sex in Marion Center borough
The Marion Center borough industries that see more men than women are Mining, Quarrying, & Extraction (100.0%), Construction (100.0%), and Transportation & Warehousing (100.0%), whereas the industries that tend to have a higher number of women are Wholesale Trade (100.0%), Accommodation & Food Services (84.6%), and Retail Trade (77.1%).
| Industry | Male | Female |
| Agriculture, Fishing & Hunting | 0 (0.0%) | 0 (0.0%) |
| Mining, Quarrying, & Extraction | 6 (100.0%) | 0 (0.0%) |
| Construction | 26 (100.0%) | 0 (0.0%) |
| Manufacturing | 3 (23.1%) | 10 (76.9%) |
| Wholesale Trade | 0 (0.0%) | 11 (100.0%) |
| Retail Trade | 11 (22.9%) | 37 (77.1%) |
| Transportation & Warehousing | 1 (100.0%) | 0 (0.0%) |
| Utilities | 0 (0.0%) | 0 (0.0%) |
| Information | 0 (0.0%) | 0 (0.0%) |
| Finance & Insurance | 0 (0.0%) | 0 (0.0%) |
| Real Estate, Rental & Leasing | 0 (0.0%) | 0 (0.0%) |
| Professional & Scientific | 0 (0.0%) | 0 (0.0%) |
| Enterprise Management | 0 (0.0%) | 0 (0.0%) |
| Administrative & Support | 0 (0.0%) | 0 (0.0%) |
| Educational Services | 19 (79.2%) | 5 (20.8%) |
| Health Care & Social Assistance | 10 (40.0%) | 15 (60.0%) |
| Arts, Entertainment & Recreation | 0 (0.0%) | 0 (0.0%) |
| Accommodation & Food Services | 2 (15.4%) | 11 (84.6%) |
| Public Administration | 4 (66.7%) | 2 (33.3%) |
| Total | 84 (43.3%) | 110 (56.7%) |
Education in Marion Center borough
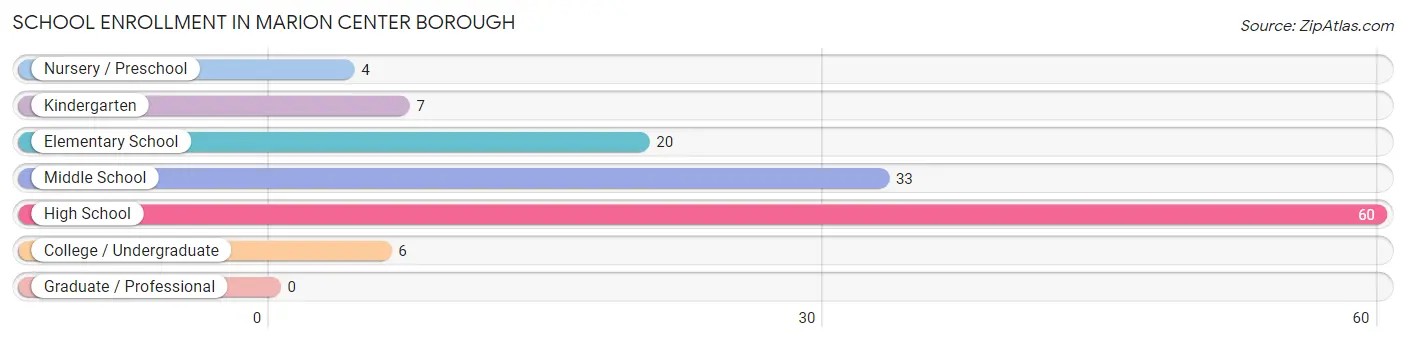
School Enrollment in Marion Center borough
The most common levels of schooling among the 130 students in Marion Center borough are high school (60 | 46.2%), middle school (33 | 25.4%), and elementary school (20 | 15.4%).
| School Level | # Students | % Students |
| Nursery / Preschool | 4 | 3.1% |
| Kindergarten | 7 | 5.4% |
| Elementary School | 20 | 15.4% |
| Middle School | 33 | 25.4% |
| High School | 60 | 46.2% |
| College / Undergraduate | 6 | 4.6% |
| Graduate / Professional | 0 | 0.0% |
| Total | 130 | 100.0% |
School Enrollment by Age by Funding Source in Marion Center borough
Out of a total of 130 students who are enrolled in schools in Marion Center borough, 4 (3.1%) attend a private institution, while the remaining 126 (96.9%) are enrolled in public schools. The age group of 3 to 4 year olds has the highest likelihood of being enrolled in private schools, with 4 (100.0% in the age bracket) enrolled. Conversely, the age group of 5 to 9 year old has the lowest likelihood of being enrolled in a private school, with 20 (100.0% in the age bracket) attending a public institution.
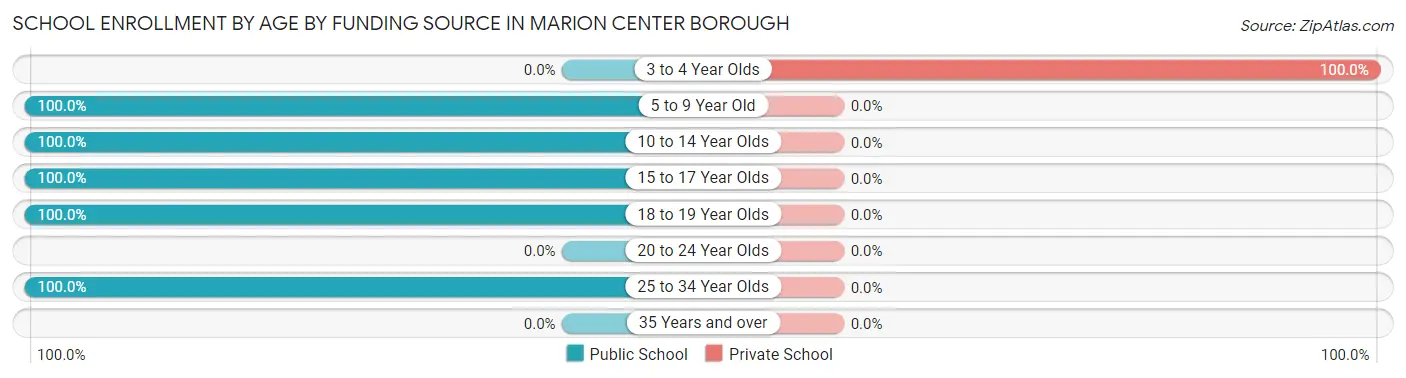
| Age Bracket | Public School | Private School |
| 3 to 4 Year Olds | 0 (0.0%) | 4 (100.0%) |
| 5 to 9 Year Old | 20 (100.0%) | 0 (0.0%) |
| 10 to 14 Year Olds | 40 (100.0%) | 0 (0.0%) |
| 15 to 17 Year Olds | 38 (100.0%) | 0 (0.0%) |
| 18 to 19 Year Olds | 27 (100.0%) | 0 (0.0%) |
| 20 to 24 Year Olds | 0 (0.0%) | 0 (0.0%) |
| 25 to 34 Year Olds | 1 (100.0%) | 0 (0.0%) |
| 35 Years and over | 0 (0.0%) | 0 (0.0%) |
| Total | 126 (96.9%) | 4 (3.1%) |
Educational Attainment by Field of Study in Marion Center borough
Visual & performing arts (26 | 51.0%), education (10 | 19.6%), business (8 | 15.7%), social sciences (3 | 5.9%), and science & technology (2 | 3.9%) are the most common fields of study among 51 individuals in Marion Center borough who have obtained a bachelor's degree or higher.
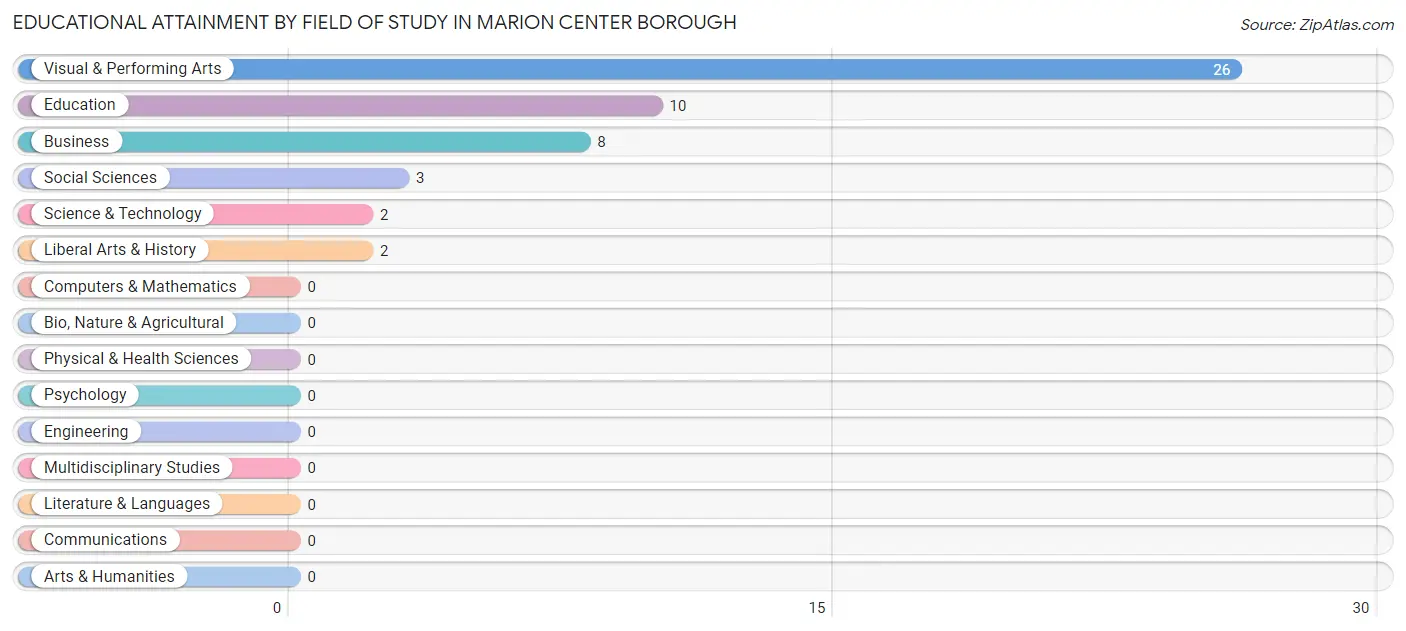
| Field of Study | # Graduates | % Graduates |
| Computers & Mathematics | 0 | 0.0% |
| Bio, Nature & Agricultural | 0 | 0.0% |
| Physical & Health Sciences | 0 | 0.0% |
| Psychology | 0 | 0.0% |
| Social Sciences | 3 | 5.9% |
| Engineering | 0 | 0.0% |
| Multidisciplinary Studies | 0 | 0.0% |
| Science & Technology | 2 | 3.9% |
| Business | 8 | 15.7% |
| Education | 10 | 19.6% |
| Literature & Languages | 0 | 0.0% |
| Liberal Arts & History | 2 | 3.9% |
| Visual & Performing Arts | 26 | 51.0% |
| Communications | 0 | 0.0% |
| Arts & Humanities | 0 | 0.0% |
| Total | 51 | 100.0% |
Transportation & Commute in Marion Center borough
Vehicle Availability by Sex in Marion Center borough
The most prevalent vehicle ownership categories in Marion Center borough are males with 3 vehicles (32, accounting for 40.5%) and females with 3 vehicles (63, making up 29.1%).
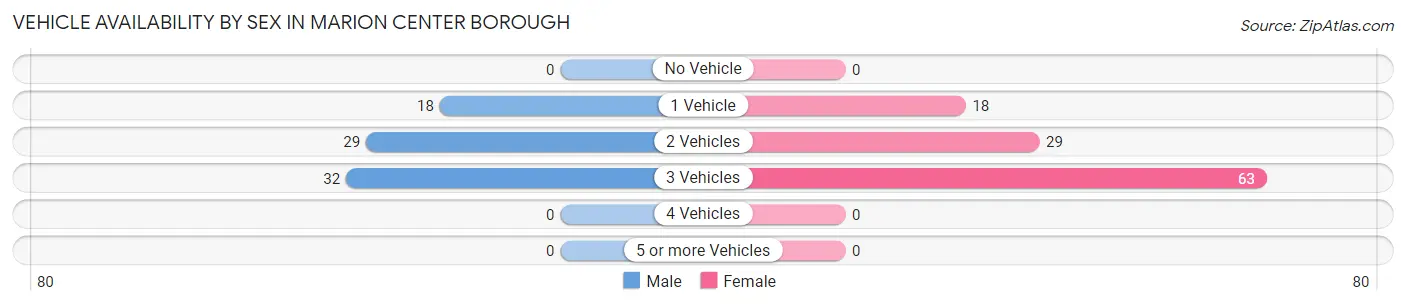
| Vehicles Available | Male | Female |
| No Vehicle | 0 (0.0%) | 0 (0.0%) |
| 1 Vehicle | 18 (22.8%) | 18 (16.4%) |
| 2 Vehicles | 29 (36.7%) | 29 (26.4%) |
| 3 Vehicles | 32 (40.5%) | 63 (57.3%) |
| 4 Vehicles | 0 (0.0%) | 0 (0.0%) |
| 5 or more Vehicles | 0 (0.0%) | 0 (0.0%) |
| Total | 79 (100.0%) | 110 (100.0%) |
Commute Time in Marion Center borough
The most frequently occuring commute durations in Marion Center borough are 20 to 24 minutes (57 commuters, 30.2%), 30 to 34 minutes (30 commuters, 15.9%), and 60 to 89 minutes (23 commuters, 12.2%).
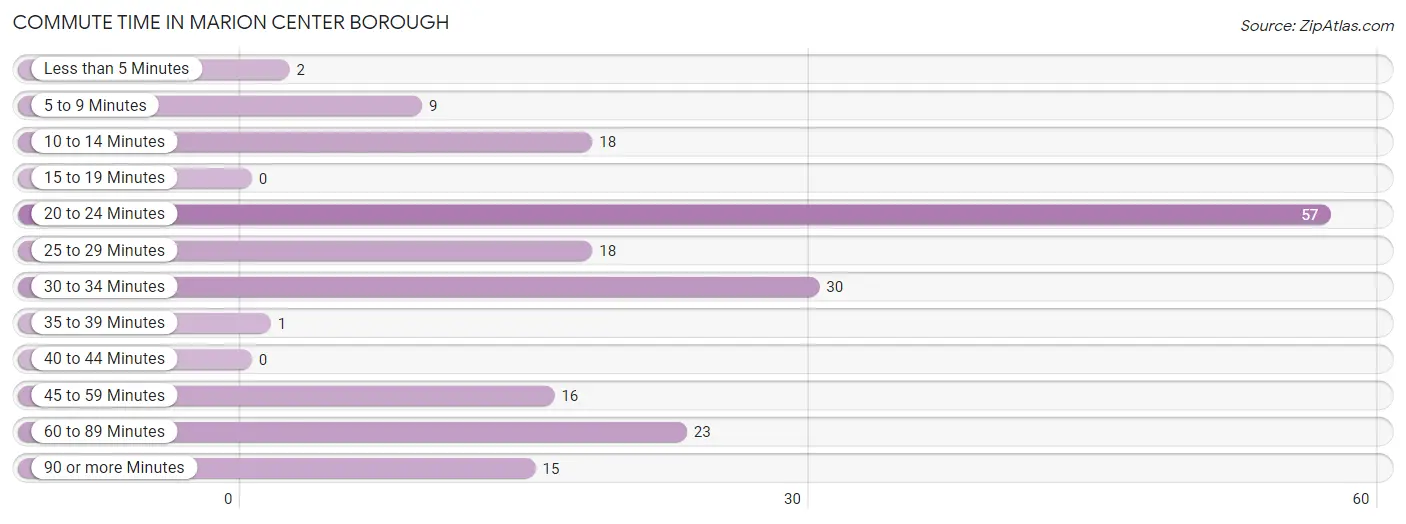
| Commute Time | # Commuters | % Commuters |
| Less than 5 Minutes | 2 | 1.1% |
| 5 to 9 Minutes | 9 | 4.8% |
| 10 to 14 Minutes | 18 | 9.5% |
| 15 to 19 Minutes | 0 | 0.0% |
| 20 to 24 Minutes | 57 | 30.2% |
| 25 to 29 Minutes | 18 | 9.5% |
| 30 to 34 Minutes | 30 | 15.9% |
| 35 to 39 Minutes | 1 | 0.5% |
| 40 to 44 Minutes | 0 | 0.0% |
| 45 to 59 Minutes | 16 | 8.5% |
| 60 to 89 Minutes | 23 | 12.2% |
| 90 or more Minutes | 15 | 7.9% |
Commute Time by Sex in Marion Center borough
The most common commute times in Marion Center borough are 20 to 24 minutes (16 commuters, 20.3%) for males and 20 to 24 minutes (41 commuters, 37.3%) for females.
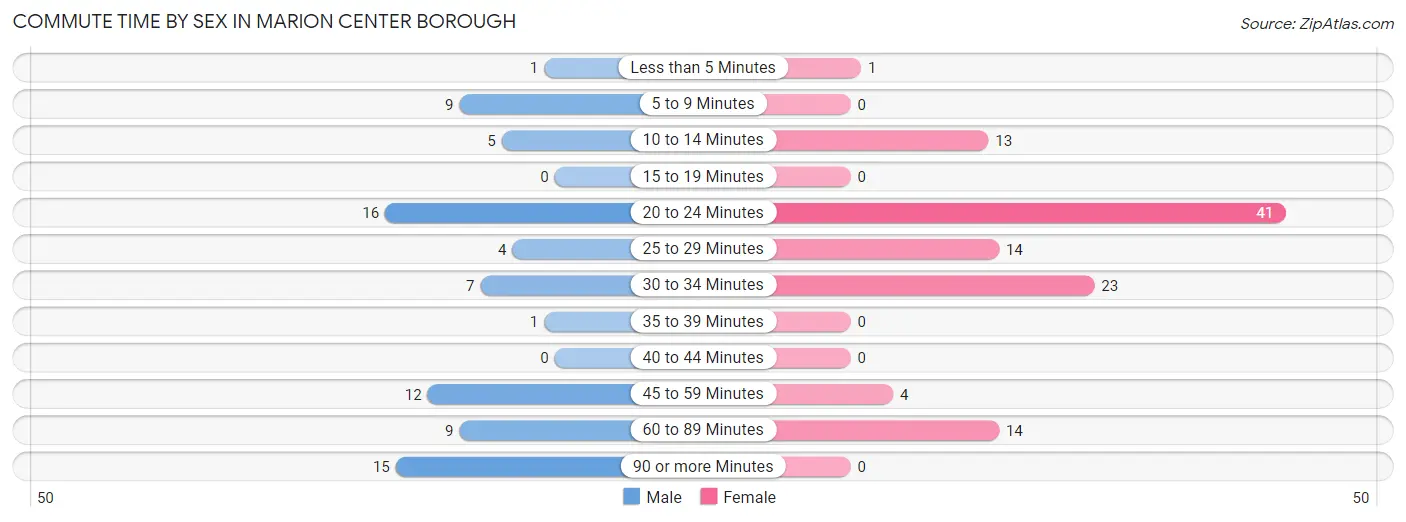
| Commute Time | Male | Female |
| Less than 5 Minutes | 1 (1.3%) | 1 (0.9%) |
| 5 to 9 Minutes | 9 (11.4%) | 0 (0.0%) |
| 10 to 14 Minutes | 5 (6.3%) | 13 (11.8%) |
| 15 to 19 Minutes | 0 (0.0%) | 0 (0.0%) |
| 20 to 24 Minutes | 16 (20.3%) | 41 (37.3%) |
| 25 to 29 Minutes | 4 (5.1%) | 14 (12.7%) |
| 30 to 34 Minutes | 7 (8.9%) | 23 (20.9%) |
| 35 to 39 Minutes | 1 (1.3%) | 0 (0.0%) |
| 40 to 44 Minutes | 0 (0.0%) | 0 (0.0%) |
| 45 to 59 Minutes | 12 (15.2%) | 4 (3.6%) |
| 60 to 89 Minutes | 9 (11.4%) | 14 (12.7%) |
| 90 or more Minutes | 15 (19.0%) | 0 (0.0%) |
Time of Departure to Work by Sex in Marion Center borough
The most frequent times of departure to work in Marion Center borough are 7:00 AM to 7:29 AM (25, 31.7%) for males and 7:00 AM to 7:29 AM (57, 51.8%) for females.
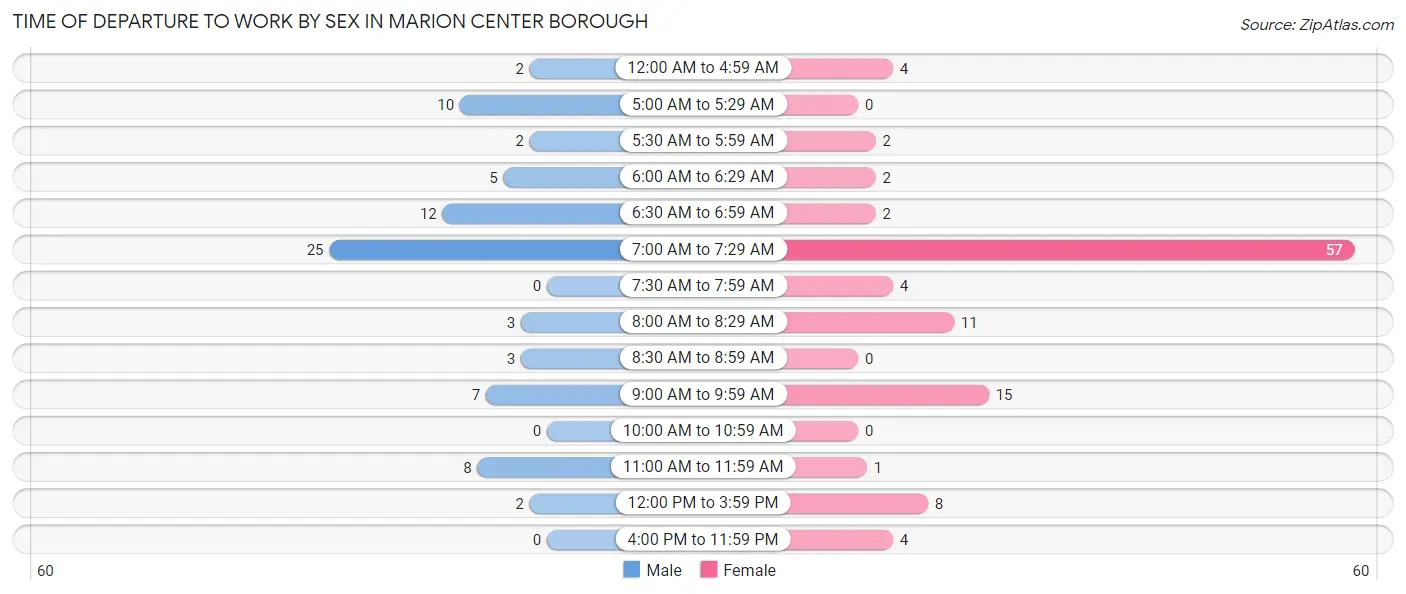
| Time of Departure | Male | Female |
| 12:00 AM to 4:59 AM | 2 (2.5%) | 4 (3.6%) |
| 5:00 AM to 5:29 AM | 10 (12.7%) | 0 (0.0%) |
| 5:30 AM to 5:59 AM | 2 (2.5%) | 2 (1.8%) |
| 6:00 AM to 6:29 AM | 5 (6.3%) | 2 (1.8%) |
| 6:30 AM to 6:59 AM | 12 (15.2%) | 2 (1.8%) |
| 7:00 AM to 7:29 AM | 25 (31.7%) | 57 (51.8%) |
| 7:30 AM to 7:59 AM | 0 (0.0%) | 4 (3.6%) |
| 8:00 AM to 8:29 AM | 3 (3.8%) | 11 (10.0%) |
| 8:30 AM to 8:59 AM | 3 (3.8%) | 0 (0.0%) |
| 9:00 AM to 9:59 AM | 7 (8.9%) | 15 (13.6%) |
| 10:00 AM to 10:59 AM | 0 (0.0%) | 0 (0.0%) |
| 11:00 AM to 11:59 AM | 8 (10.1%) | 1 (0.9%) |
| 12:00 PM to 3:59 PM | 2 (2.5%) | 8 (7.3%) |
| 4:00 PM to 11:59 PM | 0 (0.0%) | 4 (3.6%) |
| Total | 79 (100.0%) | 110 (100.0%) |
Housing Occupancy in Marion Center borough
Occupancy by Ownership in Marion Center borough
Of the total 198 dwellings in Marion Center borough, owner-occupied units account for 112 (56.6%), while renter-occupied units make up 86 (43.4%).
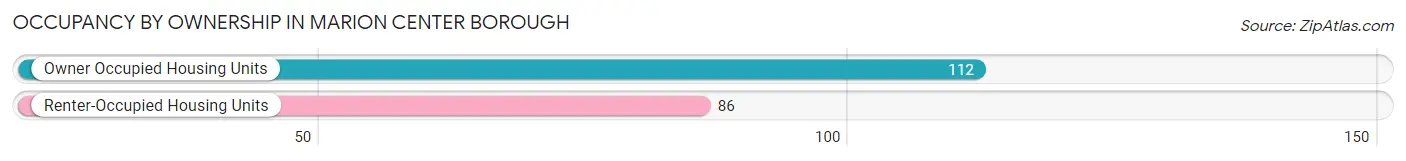
| Occupancy | # Housing Units | % Housing Units |
| Owner Occupied Housing Units | 112 | 56.6% |
| Renter-Occupied Housing Units | 86 | 43.4% |
| Total Occupied Housing Units | 198 | 100.0% |
Occupancy by Household Size in Marion Center borough
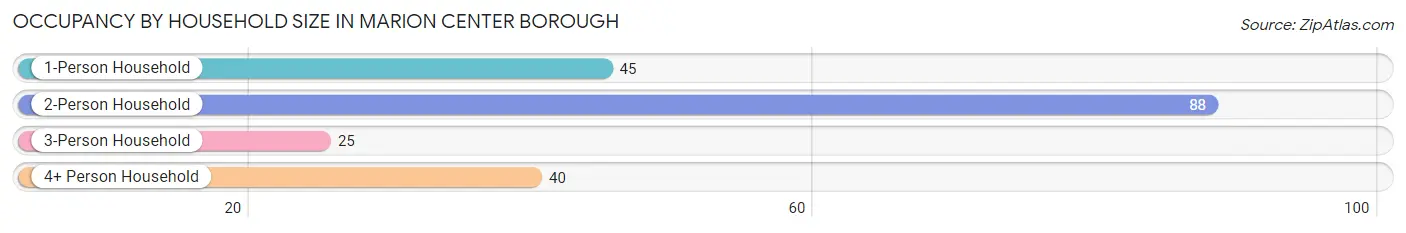
| Household Size | # Housing Units | % Housing Units |
| 1-Person Household | 45 | 22.7% |
| 2-Person Household | 88 | 44.4% |
| 3-Person Household | 25 | 12.6% |
| 4+ Person Household | 40 | 20.2% |
| Total Housing Units | 198 | 100.0% |
Occupancy by Ownership by Household Size in Marion Center borough
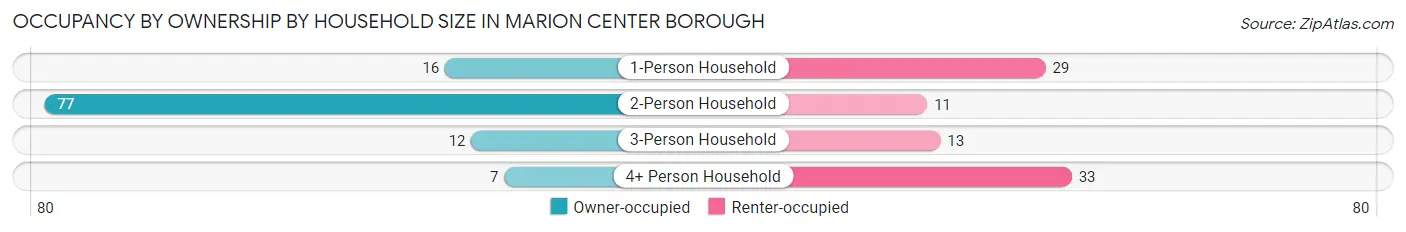
| Household Size | Owner-occupied | Renter-occupied |
| 1-Person Household | 16 (35.6%) | 29 (64.4%) |
| 2-Person Household | 77 (87.5%) | 11 (12.5%) |
| 3-Person Household | 12 (48.0%) | 13 (52.0%) |
| 4+ Person Household | 7 (17.5%) | 33 (82.5%) |
| Total Housing Units | 112 (56.6%) | 86 (43.4%) |
Occupancy by Educational Attainment in Marion Center borough
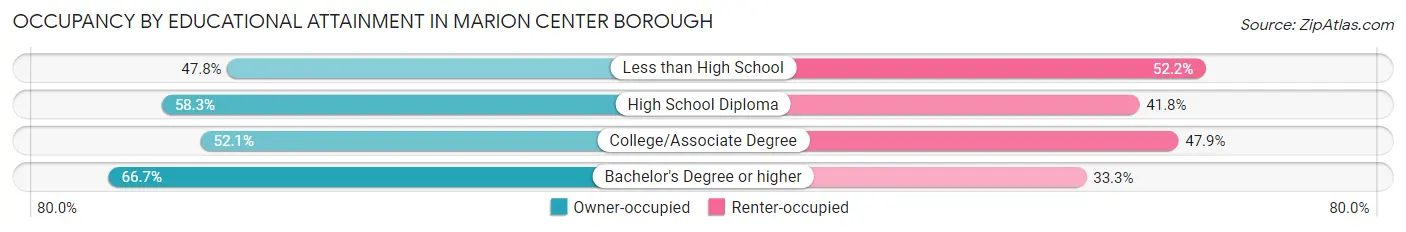
| Household Size | Owner-occupied | Renter-occupied |
| Less than High School | 11 (47.8%) | 12 (52.2%) |
| High School Diploma | 60 (58.3%) | 43 (41.7%) |
| College/Associate Degree | 25 (52.1%) | 23 (47.9%) |
| Bachelor's Degree or higher | 16 (66.7%) | 8 (33.3%) |
Occupancy by Age of Householder in Marion Center borough
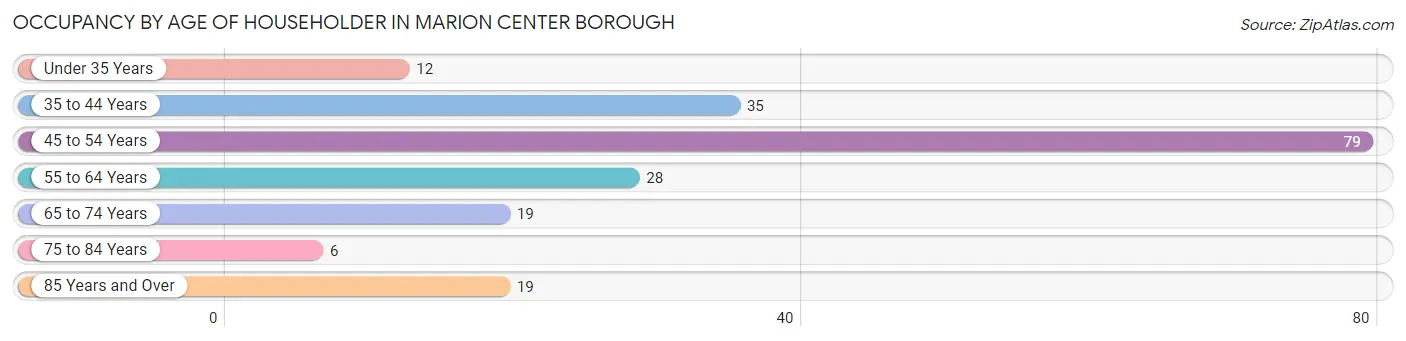
| Age Bracket | # Households | % Households |
| Under 35 Years | 12 | 6.1% |
| 35 to 44 Years | 35 | 17.7% |
| 45 to 54 Years | 79 | 39.9% |
| 55 to 64 Years | 28 | 14.1% |
| 65 to 74 Years | 19 | 9.6% |
| 75 to 84 Years | 6 | 3.0% |
| 85 Years and Over | 19 | 9.6% |
| Total | 198 | 100.0% |
Housing Finances in Marion Center borough
Median Income by Occupancy in Marion Center borough
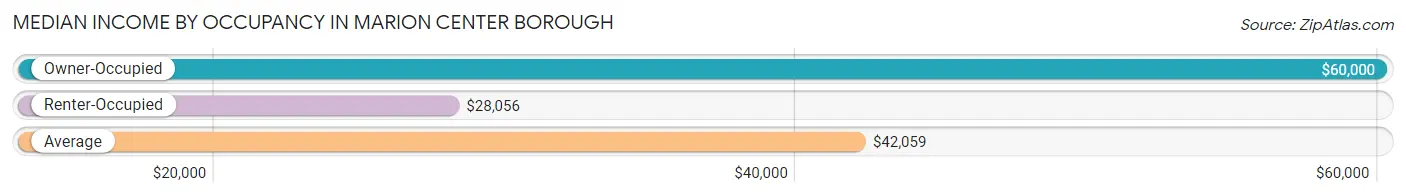
| Occupancy Type | # Households | Median Income |
| Owner-Occupied | 112 (56.6%) | $60,000 |
| Renter-Occupied | 86 (43.4%) | $28,056 |
| Average | 198 (100.0%) | $42,059 |
Occupancy by Householder Income Bracket in Marion Center borough
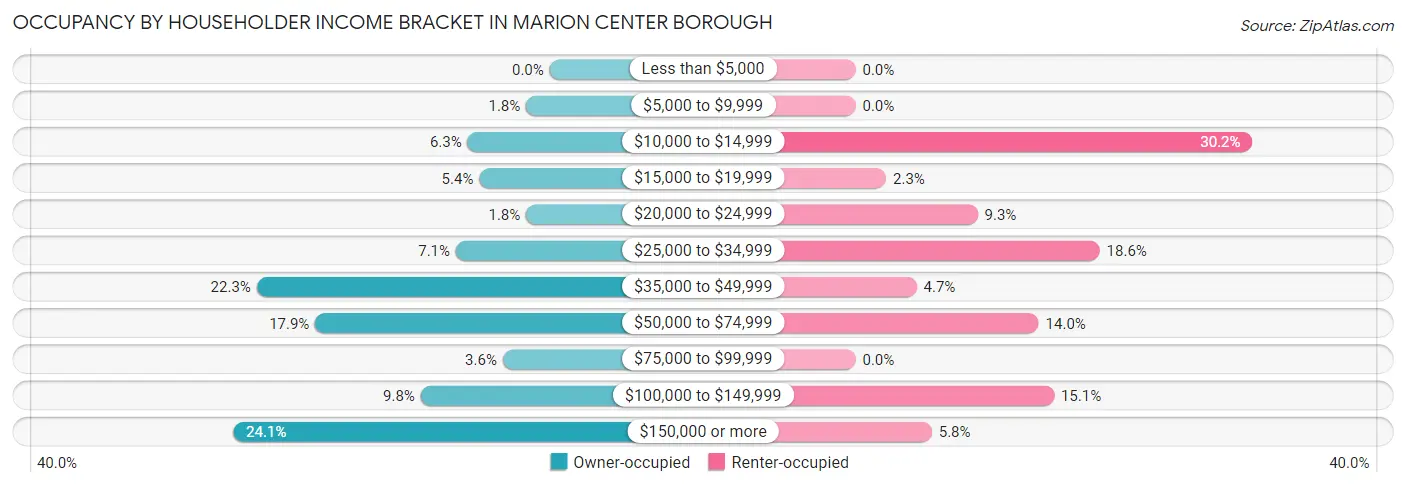
| Income Bracket | Owner-occupied | Renter-occupied |
| Less than $5,000 | 0 (0.0%) | 0 (0.0%) |
| $5,000 to $9,999 | 2 (1.8%) | 0 (0.0%) |
| $10,000 to $14,999 | 7 (6.2%) | 26 (30.2%) |
| $15,000 to $19,999 | 6 (5.4%) | 2 (2.3%) |
| $20,000 to $24,999 | 2 (1.8%) | 8 (9.3%) |
| $25,000 to $34,999 | 8 (7.1%) | 16 (18.6%) |
| $35,000 to $49,999 | 25 (22.3%) | 4 (4.6%) |
| $50,000 to $74,999 | 20 (17.9%) | 12 (14.0%) |
| $75,000 to $99,999 | 4 (3.6%) | 0 (0.0%) |
| $100,000 to $149,999 | 11 (9.8%) | 13 (15.1%) |
| $150,000 or more | 27 (24.1%) | 5 (5.8%) |
| Total | 112 (100.0%) | 86 (100.0%) |
Monthly Housing Cost Tiers in Marion Center borough
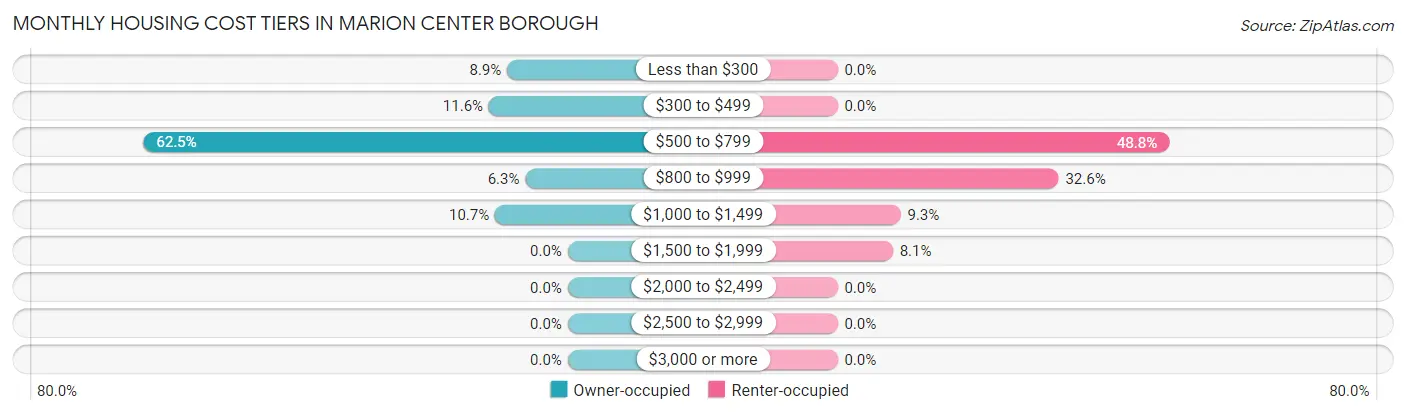
| Monthly Cost | Owner-occupied | Renter-occupied |
| Less than $300 | 10 (8.9%) | 0 (0.0%) |
| $300 to $499 | 13 (11.6%) | 0 (0.0%) |
| $500 to $799 | 70 (62.5%) | 42 (48.8%) |
| $800 to $999 | 7 (6.2%) | 28 (32.6%) |
| $1,000 to $1,499 | 12 (10.7%) | 8 (9.3%) |
| $1,500 to $1,999 | 0 (0.0%) | 7 (8.1%) |
| $2,000 to $2,499 | 0 (0.0%) | 0 (0.0%) |
| $2,500 to $2,999 | 0 (0.0%) | 0 (0.0%) |
| $3,000 or more | 0 (0.0%) | 0 (0.0%) |
| Total | 112 (100.0%) | 86 (100.0%) |
Physical Housing Characteristics in Marion Center borough
Housing Structures in Marion Center borough
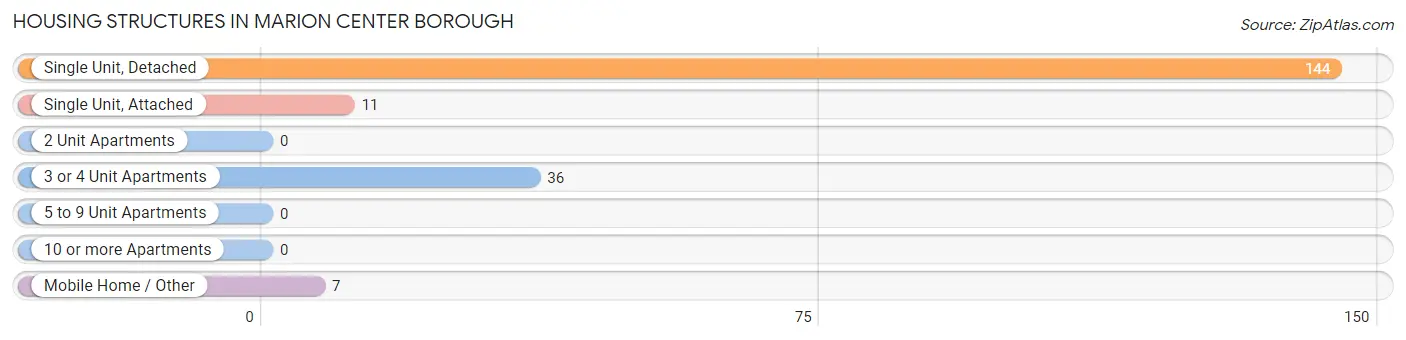
| Structure Type | # Housing Units | % Housing Units |
| Single Unit, Detached | 144 | 72.7% |
| Single Unit, Attached | 11 | 5.6% |
| 2 Unit Apartments | 0 | 0.0% |
| 3 or 4 Unit Apartments | 36 | 18.2% |
| 5 to 9 Unit Apartments | 0 | 0.0% |
| 10 or more Apartments | 0 | 0.0% |
| Mobile Home / Other | 7 | 3.5% |
| Total | 198 | 100.0% |
Housing Structures by Occupancy in Marion Center borough
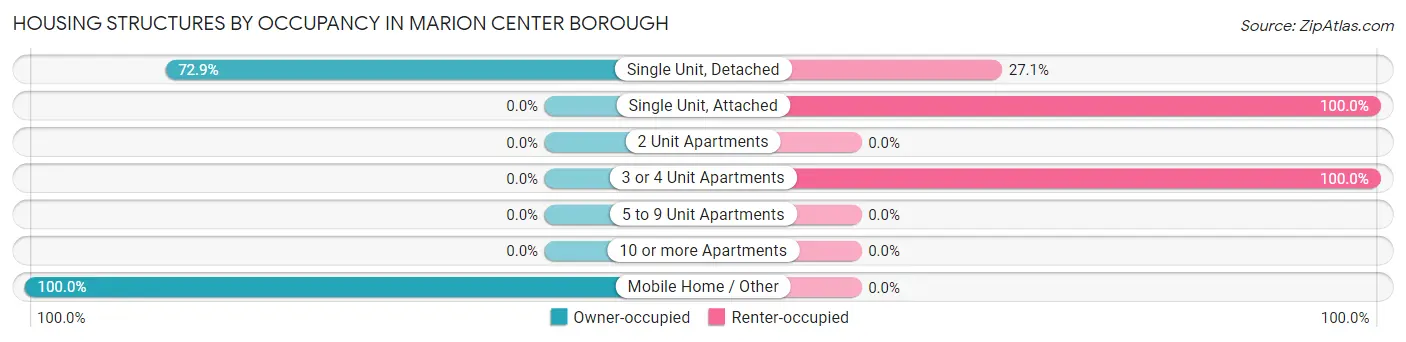
| Structure Type | Owner-occupied | Renter-occupied |
| Single Unit, Detached | 105 (72.9%) | 39 (27.1%) |
| Single Unit, Attached | 0 (0.0%) | 11 (100.0%) |
| 2 Unit Apartments | 0 (0.0%) | 0 (0.0%) |
| 3 or 4 Unit Apartments | 0 (0.0%) | 36 (100.0%) |
| 5 to 9 Unit Apartments | 0 (0.0%) | 0 (0.0%) |
| 10 or more Apartments | 0 (0.0%) | 0 (0.0%) |
| Mobile Home / Other | 7 (100.0%) | 0 (0.0%) |
| Total | 112 (56.6%) | 86 (43.4%) |
Housing Structures by Number of Rooms in Marion Center borough
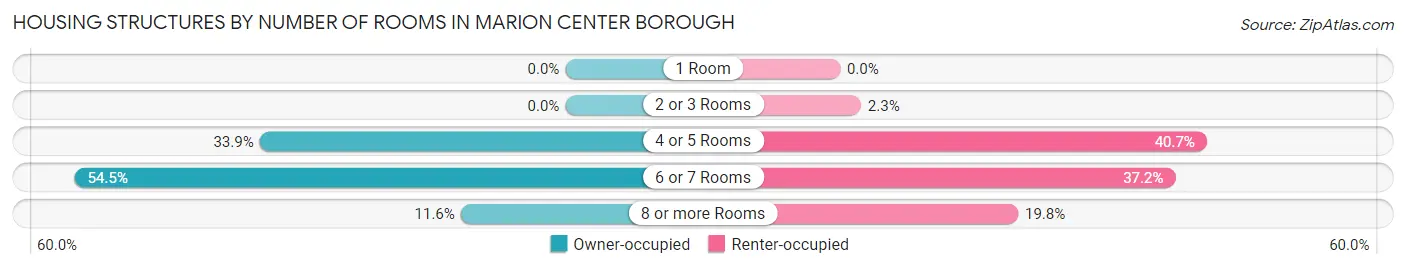
| Number of Rooms | Owner-occupied | Renter-occupied |
| 1 Room | 0 (0.0%) | 0 (0.0%) |
| 2 or 3 Rooms | 0 (0.0%) | 2 (2.3%) |
| 4 or 5 Rooms | 38 (33.9%) | 35 (40.7%) |
| 6 or 7 Rooms | 61 (54.5%) | 32 (37.2%) |
| 8 or more Rooms | 13 (11.6%) | 17 (19.8%) |
| Total | 112 (100.0%) | 86 (100.0%) |
Housing Structure by Heating Type in Marion Center borough
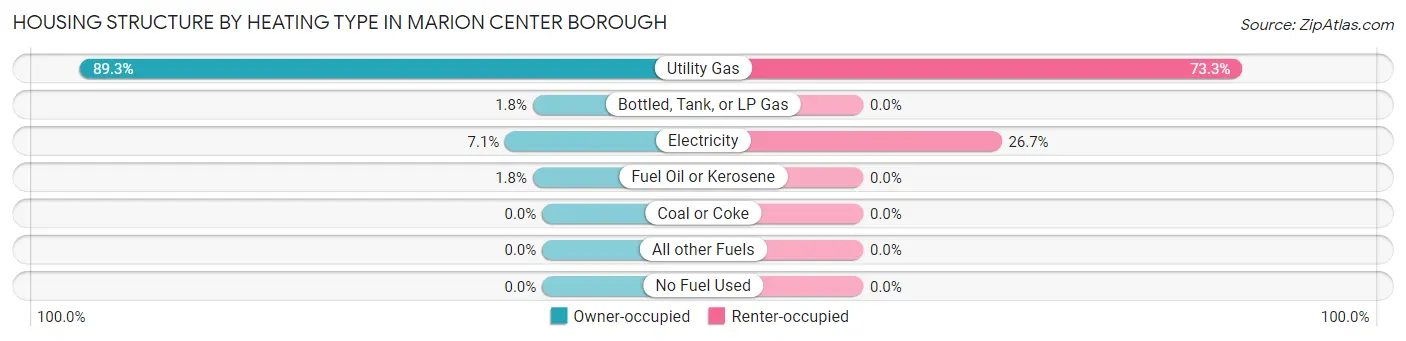
| Heating Type | Owner-occupied | Renter-occupied |
| Utility Gas | 100 (89.3%) | 63 (73.3%) |
| Bottled, Tank, or LP Gas | 2 (1.8%) | 0 (0.0%) |
| Electricity | 8 (7.1%) | 23 (26.7%) |
| Fuel Oil or Kerosene | 2 (1.8%) | 0 (0.0%) |
| Coal or Coke | 0 (0.0%) | 0 (0.0%) |
| All other Fuels | 0 (0.0%) | 0 (0.0%) |
| No Fuel Used | 0 (0.0%) | 0 (0.0%) |
| Total | 112 (100.0%) | 86 (100.0%) |
Household Vehicle Usage in Marion Center borough
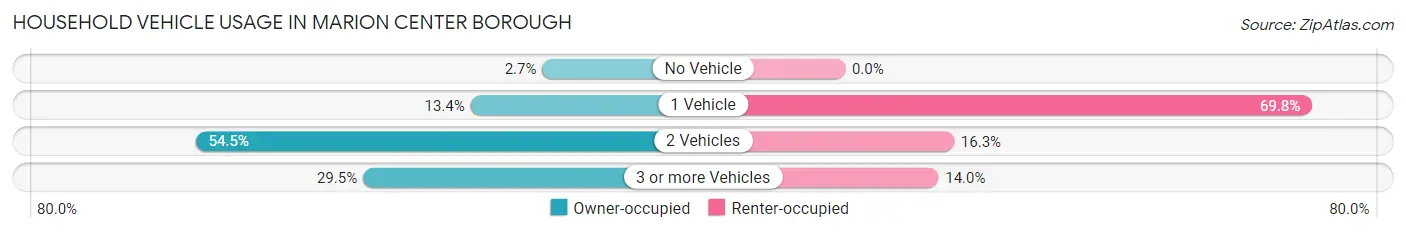
| Vehicles per Household | Owner-occupied | Renter-occupied |
| No Vehicle | 3 (2.7%) | 0 (0.0%) |
| 1 Vehicle | 15 (13.4%) | 60 (69.8%) |
| 2 Vehicles | 61 (54.5%) | 14 (16.3%) |
| 3 or more Vehicles | 33 (29.5%) | 12 (14.0%) |
| Total | 112 (100.0%) | 86 (100.0%) |
Real Estate & Mortgages in Marion Center borough
Real Estate and Mortgage Overview in Marion Center borough
| Characteristic | Without Mortgage | With Mortgage |
| Housing Units | 70 | 42 |
| Median Property Value | $144,100 | $130,600 |
| Median Household Income | $42,206 | $10 |
| Monthly Housing Costs | $612 | $0 |
| Real Estate Taxes | $2,081 | $0 |
Property Value by Mortgage Status in Marion Center borough
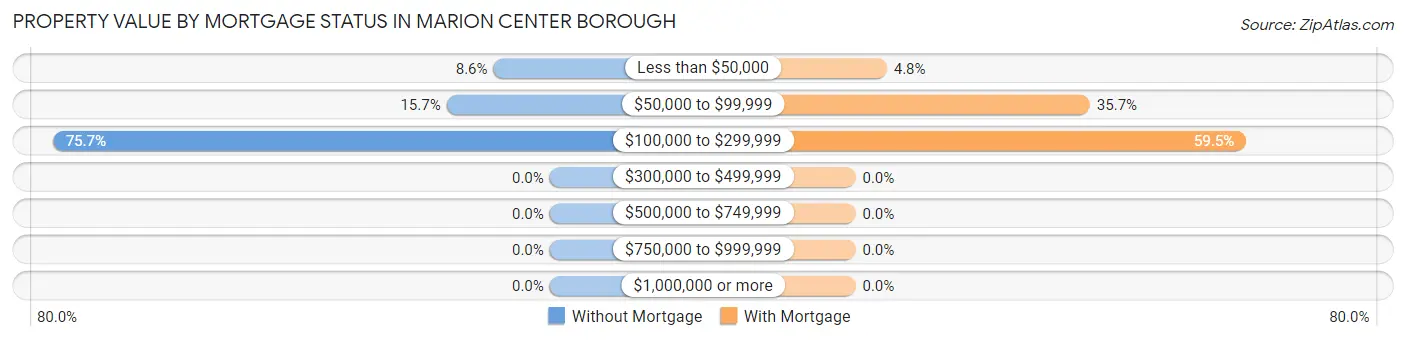
| Property Value | Without Mortgage | With Mortgage |
| Less than $50,000 | 6 (8.6%) | 2 (4.8%) |
| $50,000 to $99,999 | 11 (15.7%) | 15 (35.7%) |
| $100,000 to $299,999 | 53 (75.7%) | 25 (59.5%) |
| $300,000 to $499,999 | 0 (0.0%) | 0 (0.0%) |
| $500,000 to $749,999 | 0 (0.0%) | 0 (0.0%) |
| $750,000 to $999,999 | 0 (0.0%) | 0 (0.0%) |
| $1,000,000 or more | 0 (0.0%) | 0 (0.0%) |
| Total | 70 (100.0%) | 42 (100.0%) |
Household Income by Mortgage Status in Marion Center borough
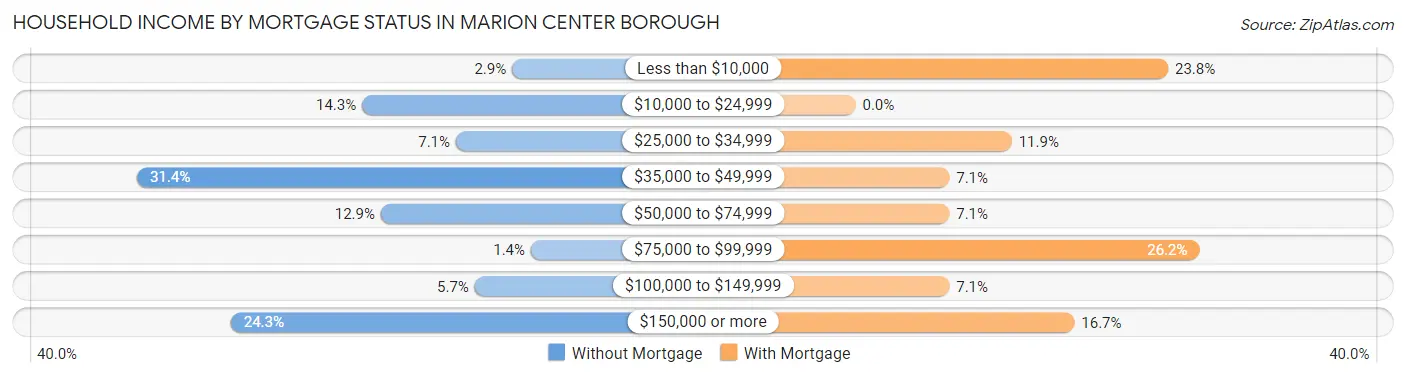
| Household Income | Without Mortgage | With Mortgage |
| Less than $10,000 | 2 (2.9%) | 10 (23.8%) |
| $10,000 to $24,999 | 10 (14.3%) | 0 (0.0%) |
| $25,000 to $34,999 | 5 (7.1%) | 5 (11.9%) |
| $35,000 to $49,999 | 22 (31.4%) | 3 (7.1%) |
| $50,000 to $74,999 | 9 (12.9%) | 3 (7.1%) |
| $75,000 to $99,999 | 1 (1.4%) | 11 (26.2%) |
| $100,000 to $149,999 | 4 (5.7%) | 3 (7.1%) |
| $150,000 or more | 17 (24.3%) | 7 (16.7%) |
| Total | 70 (100.0%) | 42 (100.0%) |
Property Value to Household Income Ratio in Marion Center borough
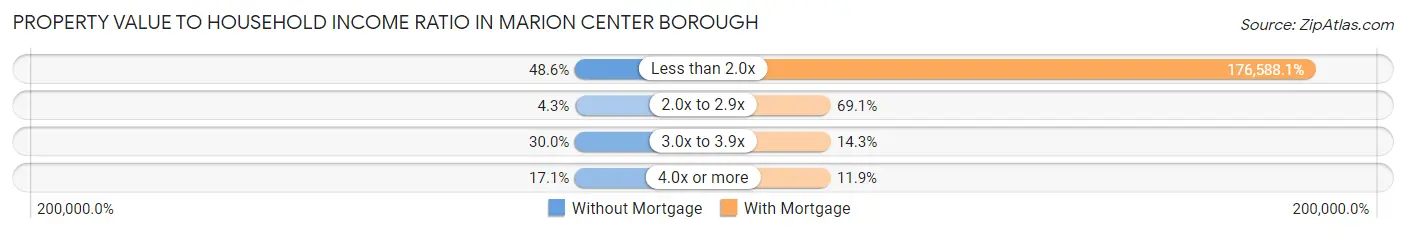
| Value-to-Income Ratio | Without Mortgage | With Mortgage |
| Less than 2.0x | 34 (48.6%) | 74,167 (176,588.1%) |
| 2.0x to 2.9x | 3 (4.3%) | 29 (69.1%) |
| 3.0x to 3.9x | 21 (30.0%) | 6 (14.3%) |
| 4.0x or more | 12 (17.1%) | 5 (11.9%) |
| Total | 70 (100.0%) | 42 (100.0%) |
Real Estate Taxes by Mortgage Status in Marion Center borough
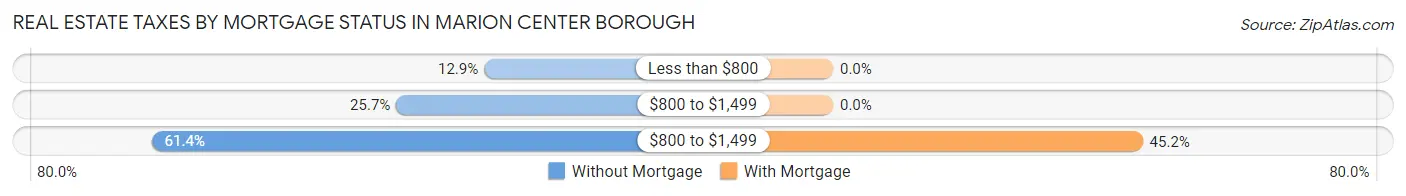
| Property Taxes | Without Mortgage | With Mortgage |
| Less than $800 | 9 (12.9%) | 0 (0.0%) |
| $800 to $1,499 | 18 (25.7%) | 0 (0.0%) |
| $800 to $1,499 | 43 (61.4%) | 19 (45.2%) |
| Total | 70 (100.0%) | 42 (100.0%) |
Health & Disability in Marion Center borough
Health Insurance Coverage by Age in Marion Center borough
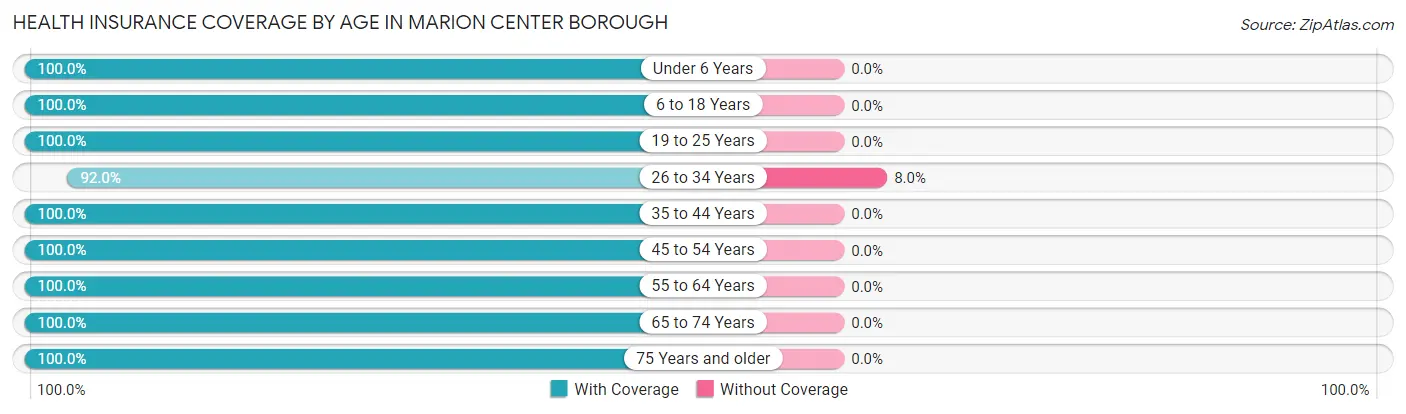
| Age Bracket | With Coverage | Without Coverage |
| Under 6 Years | 13 (100.0%) | 0 (0.0%) |
| 6 to 18 Years | 113 (100.0%) | 0 (0.0%) |
| 19 to 25 Years | 25 (100.0%) | 0 (0.0%) |
| 26 to 34 Years | 23 (92.0%) | 2 (8.0%) |
| 35 to 44 Years | 53 (100.0%) | 0 (0.0%) |
| 45 to 54 Years | 132 (100.0%) | 0 (0.0%) |
| 55 to 64 Years | 47 (100.0%) | 0 (0.0%) |
| 65 to 74 Years | 40 (100.0%) | 0 (0.0%) |
| 75 Years and older | 44 (100.0%) | 0 (0.0%) |
| Total | 490 (99.6%) | 2 (0.4%) |
Health Insurance Coverage by Citizenship Status in Marion Center borough
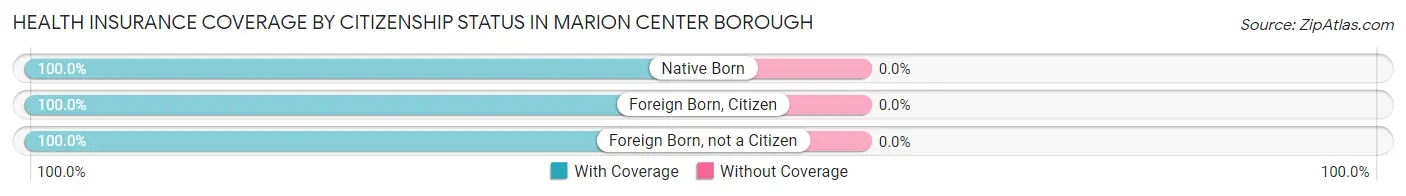
| Citizenship Status | With Coverage | Without Coverage |
| Native Born | 13 (100.0%) | 0 (0.0%) |
| Foreign Born, Citizen | 113 (100.0%) | 0 (0.0%) |
| Foreign Born, not a Citizen | 25 (100.0%) | 0 (0.0%) |
Health Insurance Coverage by Household Income in Marion Center borough
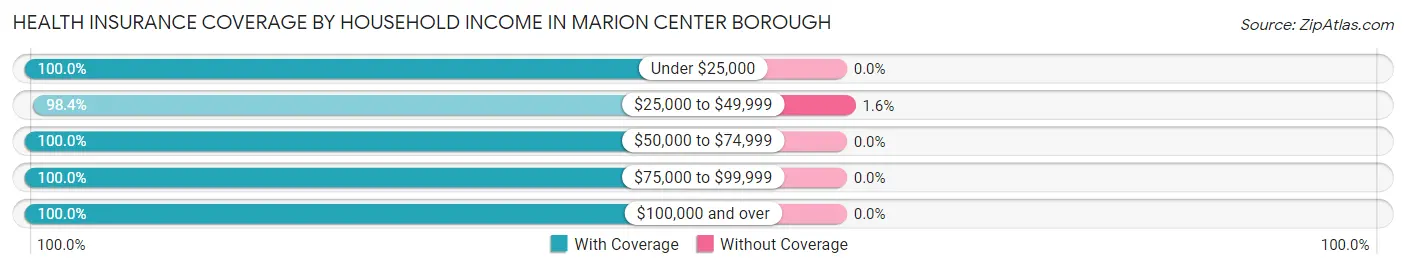
| Household Income | With Coverage | Without Coverage |
| Under $25,000 | 112 (100.0%) | 0 (0.0%) |
| $25,000 to $49,999 | 121 (98.4%) | 2 (1.6%) |
| $50,000 to $74,999 | 80 (100.0%) | 0 (0.0%) |
| $75,000 to $99,999 | 24 (100.0%) | 0 (0.0%) |
| $100,000 and over | 153 (100.0%) | 0 (0.0%) |
Public vs Private Health Insurance Coverage by Age in Marion Center borough
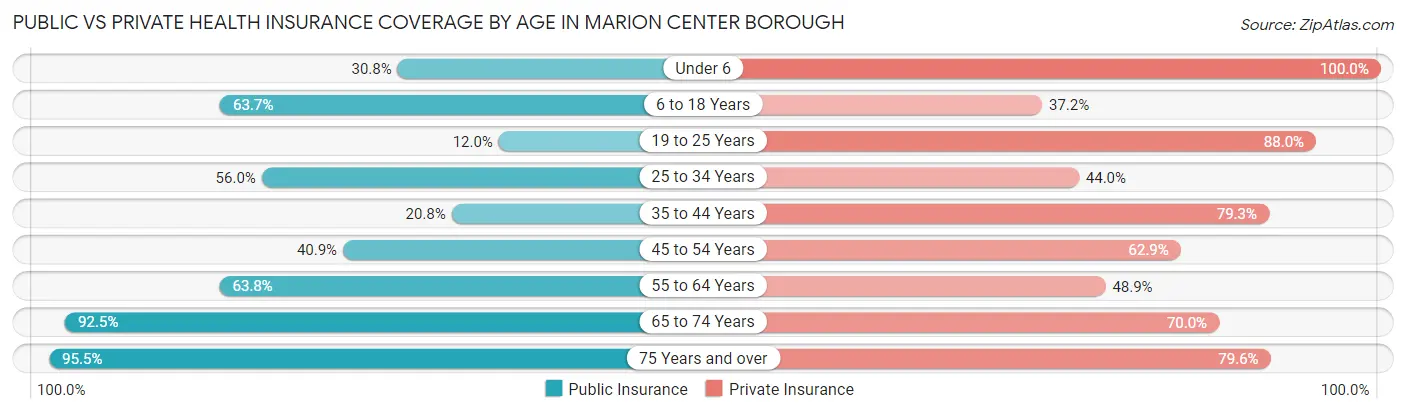
| Age Bracket | Public Insurance | Private Insurance |
| Under 6 | 4 (30.8%) | 13 (100.0%) |
| 6 to 18 Years | 72 (63.7%) | 42 (37.2%) |
| 19 to 25 Years | 3 (12.0%) | 22 (88.0%) |
| 25 to 34 Years | 14 (56.0%) | 11 (44.0%) |
| 35 to 44 Years | 11 (20.7%) | 42 (79.2%) |
| 45 to 54 Years | 54 (40.9%) | 83 (62.9%) |
| 55 to 64 Years | 30 (63.8%) | 23 (48.9%) |
| 65 to 74 Years | 37 (92.5%) | 28 (70.0%) |
| 75 Years and over | 42 (95.5%) | 35 (79.5%) |
| Total | 267 (54.3%) | 299 (60.8%) |
Disability Status by Sex by Age in Marion Center borough
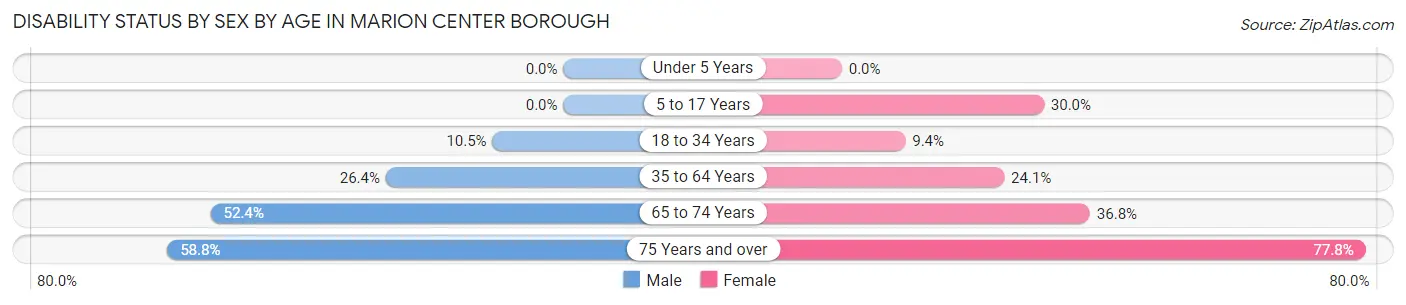
| Age Bracket | Male | Female |
| Under 5 Years | 0 (0.0%) | 0 (0.0%) |
| 5 to 17 Years | 0 (0.0%) | 21 (30.0%) |
| 18 to 34 Years | 2 (10.5%) | 5 (9.4%) |
| 35 to 64 Years | 24 (26.4%) | 34 (24.1%) |
| 65 to 74 Years | 11 (52.4%) | 7 (36.8%) |
| 75 Years and over | 10 (58.8%) | 21 (77.8%) |
Disability Class by Sex by Age in Marion Center borough
Disability Class: Hearing Difficulty
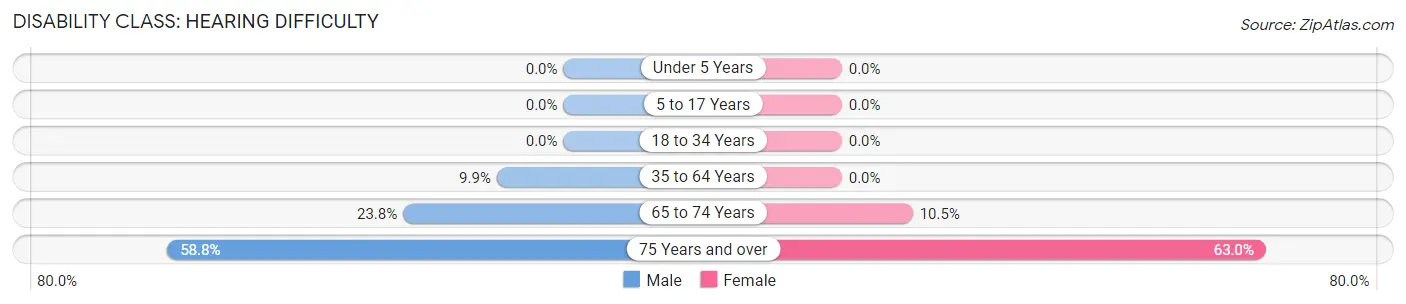
| Age Bracket | Male | Female |
| Under 5 Years | 0 (0.0%) | 0 (0.0%) |
| 5 to 17 Years | 0 (0.0%) | 0 (0.0%) |
| 18 to 34 Years | 0 (0.0%) | 0 (0.0%) |
| 35 to 64 Years | 9 (9.9%) | 0 (0.0%) |
| 65 to 74 Years | 5 (23.8%) | 2 (10.5%) |
| 75 Years and over | 10 (58.8%) | 17 (63.0%) |
Disability Class: Vision Difficulty
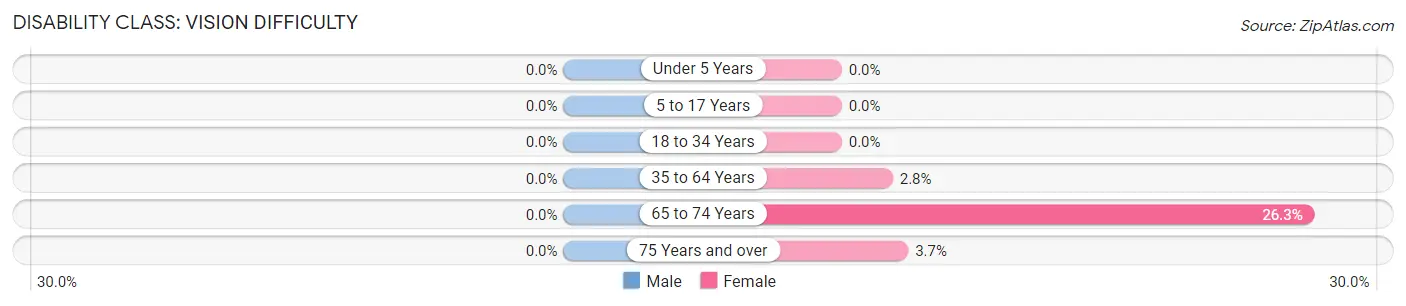
| Age Bracket | Male | Female |
| Under 5 Years | 0 (0.0%) | 0 (0.0%) |
| 5 to 17 Years | 0 (0.0%) | 0 (0.0%) |
| 18 to 34 Years | 0 (0.0%) | 0 (0.0%) |
| 35 to 64 Years | 0 (0.0%) | 4 (2.8%) |
| 65 to 74 Years | 0 (0.0%) | 5 (26.3%) |
| 75 Years and over | 0 (0.0%) | 1 (3.7%) |
Disability Class: Cognitive Difficulty
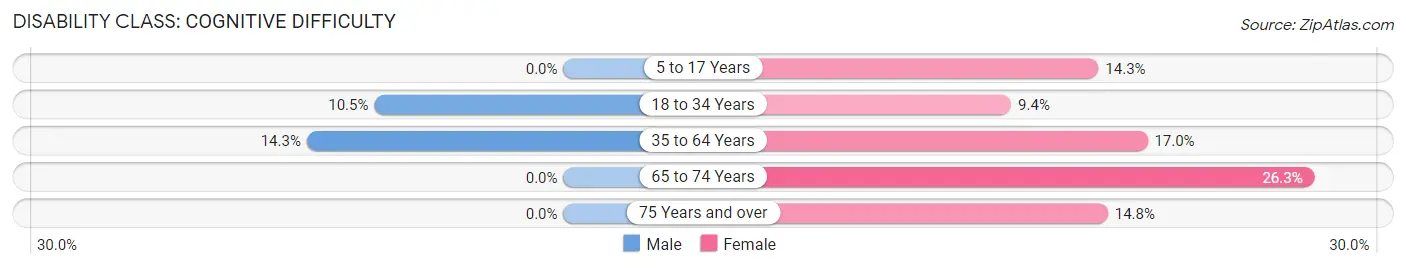
| Age Bracket | Male | Female |
| 5 to 17 Years | 0 (0.0%) | 10 (14.3%) |
| 18 to 34 Years | 2 (10.5%) | 5 (9.4%) |
| 35 to 64 Years | 13 (14.3%) | 24 (17.0%) |
| 65 to 74 Years | 0 (0.0%) | 5 (26.3%) |
| 75 Years and over | 0 (0.0%) | 4 (14.8%) |
Disability Class: Ambulatory Difficulty
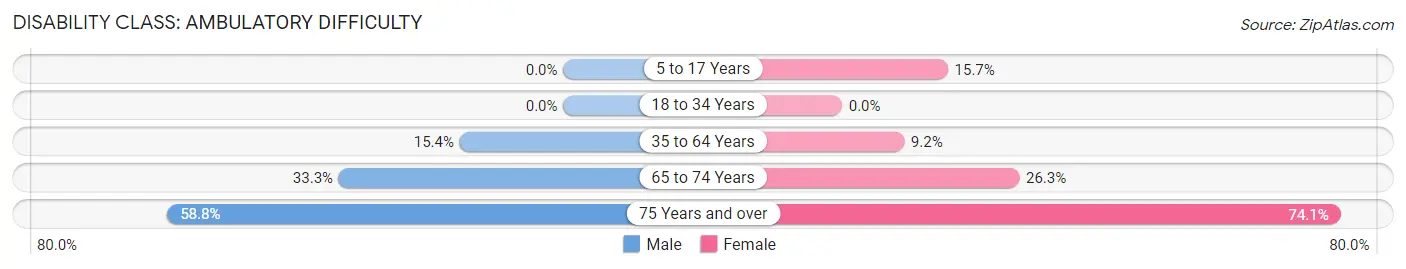
| Age Bracket | Male | Female |
| 5 to 17 Years | 0 (0.0%) | 11 (15.7%) |
| 18 to 34 Years | 0 (0.0%) | 0 (0.0%) |
| 35 to 64 Years | 14 (15.4%) | 13 (9.2%) |
| 65 to 74 Years | 7 (33.3%) | 5 (26.3%) |
| 75 Years and over | 10 (58.8%) | 20 (74.1%) |
Disability Class: Self-Care Difficulty
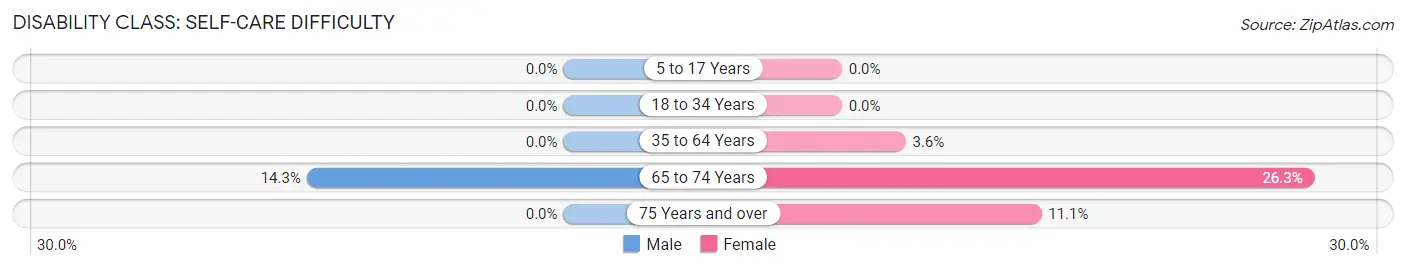
| Age Bracket | Male | Female |
| 5 to 17 Years | 0 (0.0%) | 0 (0.0%) |
| 18 to 34 Years | 0 (0.0%) | 0 (0.0%) |
| 35 to 64 Years | 0 (0.0%) | 5 (3.5%) |
| 65 to 74 Years | 3 (14.3%) | 5 (26.3%) |
| 75 Years and over | 0 (0.0%) | 3 (11.1%) |
Technology Access in Marion Center borough
Computing Device Access in Marion Center borough
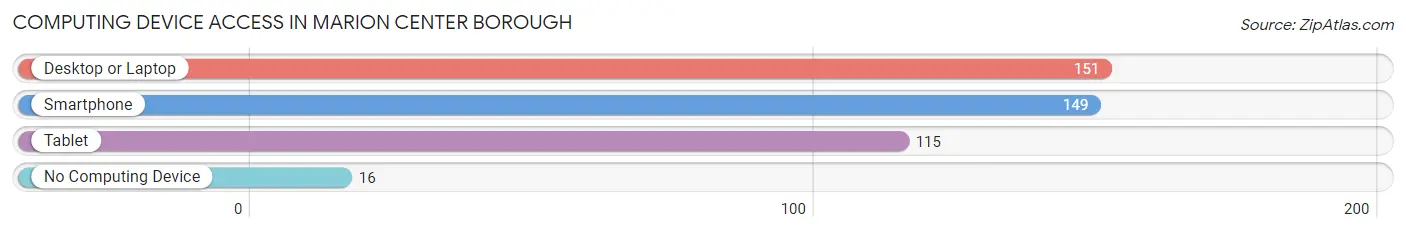
| Device Type | # Households | % Households |
| Desktop or Laptop | 151 | 76.3% |
| Smartphone | 149 | 75.2% |
| Tablet | 115 | 58.1% |
| No Computing Device | 16 | 8.1% |
| Total | 198 | 100.0% |
Internet Access in Marion Center borough
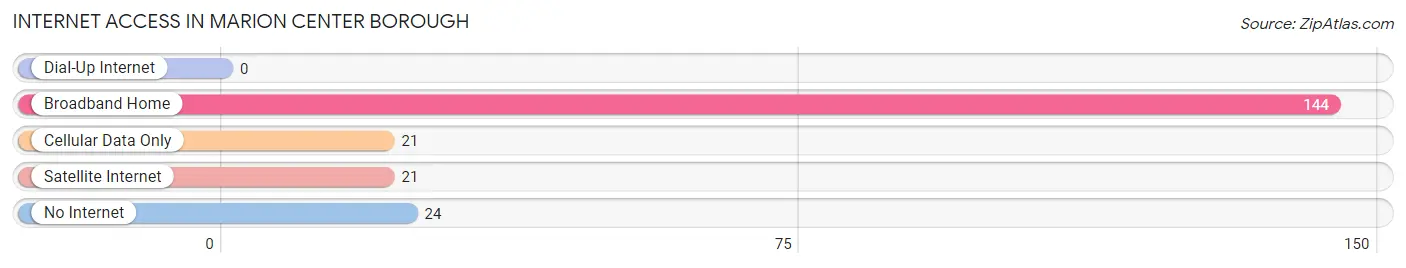
| Internet Type | # Households | % Households |
| Dial-Up Internet | 0 | 0.0% |
| Broadband Home | 144 | 72.7% |
| Cellular Data Only | 21 | 10.6% |
| Satellite Internet | 21 | 10.6% |
| No Internet | 24 | 12.1% |
| Total | 198 | 100.0% |
Marion Center borough Summary
Marion Center Borough is a small borough located in Indiana County, Pennsylvania. It is situated in the foothills of the Allegheny Mountains, approximately 30 miles northeast of Pittsburgh. The borough is home to a population of approximately 1,000 people, and is part of the greater Indiana County area.
History
Marion Center Borough was founded in 1876, when the area was still part of Westmoreland County. The borough was named after General Francis Marion, a Revolutionary War hero. The area was originally settled by German and Scotch-Irish immigrants, who were attracted to the area by its rich soil and abundant natural resources.
In the late 19th century, the borough was a thriving agricultural community, with a variety of crops being grown in the area. The borough was also home to several small businesses, including a sawmill, a gristmill, and a tannery.
In the early 20th century, the borough began to experience a period of growth and development. The Pennsylvania Railroad opened a line through the borough in 1906, and the Marion Center Bank was established in 1908. The borough also saw the construction of several new buildings, including a post office, a school, and a library.
Geography
Marion Center Borough is located in the foothills of the Allegheny Mountains, approximately 30 miles northeast of Pittsburgh. The borough is situated in a rural area, with rolling hills and forests. The borough is bordered by the townships of East Mahoning, West Mahoning, and White Township.
The borough is located in the Allegheny Plateau region of Pennsylvania, and is part of the greater Indiana County area. The borough is situated at an elevation of 1,400 feet above sea level.
Economy
Marion Center Borough is a small, rural community with a limited economy. The borough is home to several small businesses, including a grocery store, a hardware store, and a few restaurants. The borough also has a few small manufacturing companies, including a furniture manufacturer and a plastics manufacturer.
The borough is also home to a few farms, which produce a variety of crops, including corn, soybeans, and hay. The borough is also home to a few small wineries, which produce a variety of wines.
Demographics
As of the 2010 census, Marion Center Borough had a population of 1,000 people. The racial makeup of the borough was 97.2% White, 0.7% African American, 0.2% Native American, 0.2% Asian, and 1.7% from other races.
The median household income in the borough was $37,500, and the median family income was $45,000. The per capita income in the borough was $18,000. Approximately 11.2% of the population was below the poverty line.
Common Questions
What is Per Capita Income in Marion Center borough?
Per Capita income in Marion Center borough is $26,693.
What is the Median Family Income in Marion Center borough?
Median Family Income in Marion Center borough is $62,750.
What is the Median Household income in Marion Center borough?
Median Household Income in Marion Center borough is $42,059.
What is Income or Wage Gap in Marion Center borough?
Income or Wage Gap in Marion Center borough is 21.5%.
Women in Marion Center borough earn 78.5 cents for every dollar earned by a man.
What is Inequality or Gini Index in Marion Center borough?
Inequality or Gini Index in Marion Center borough is 0.44.
What is the Total Population of Marion Center borough?
Total Population of Marion Center borough is 492.
What is the Total Male Population of Marion Center borough?
Total Male Population of Marion Center borough is 178.
What is the Total Female Population of Marion Center borough?
Total Female Population of Marion Center borough is 314.
What is the Ratio of Males per 100 Females in Marion Center borough?
There are 56.69 Males per 100 Females in Marion Center borough.
What is the Ratio of Females per 100 Males in Marion Center borough?
There are 176.40 Females per 100 Males in Marion Center borough.
What is the Median Population Age in Marion Center borough?
Median Population Age in Marion Center borough is 47.6 Years.
What is the Average Family Size in Marion Center borough
Average Family Size in Marion Center borough is 2.8 People.
What is the Average Household Size in Marion Center borough
Average Household Size in Marion Center borough is 2.5 People.
How Large is the Labor Force in Marion Center borough?
There are 201 People in the Labor Forcein in Marion Center borough.
What is the Percentage of People in the Labor Force in Marion Center borough?
50.1% of People are in the Labor Force in Marion Center borough.
What is the Unemployment Rate in Marion Center borough?
Unemployment Rate in Marion Center borough is 3.5%.