Marietta borough, PA Map & Demographics
Marietta borough Overview
$34,862
PER CAPITA INCOME
$74,779
AVG FAMILY INCOME
$56,429
AVG HOUSEHOLD INCOME
37.1%
WAGE / INCOME GAP [ % ]
62.9¢/ $1
WAGE / INCOME GAP [ $ ]
$10,639
FAMILY INCOME DEFICIT
0.40
INEQUALITY / GINI INDEX
2,769
TOTAL POPULATION
1,553
MALE POPULATION
1,216
FEMALE POPULATION
127.71
MALES / 100 FEMALES
78.30
FEMALES / 100 MALES
46.2
MEDIAN AGE
2.5
AVG FAMILY SIZE
2.1
AVG HOUSEHOLD SIZE
1,466
LABOR FORCE [ PEOPLE ]
61.2%
PERCENT IN LABOR FORCE
5.8%
UNEMPLOYMENT RATE
Income in Marietta borough
Income Overview in Marietta borough
Per Capita Income in Marietta borough is $34,862, while median incomes of families and households are $74,779 and $56,429 respectively.
| Characteristic | Number | Measure |
| Per Capita Income | 2,769 | $34,862 |
| Median Family Income | 826 | $74,779 |
| Mean Family Income | 826 | $86,903 |
| Median Household Income | 1,316 | $56,429 |
| Mean Household Income | 1,316 | $73,834 |
| Income Deficit | 826 | $10,639 |
| Wage / Income Gap (%) | 2,769 | 37.13% |
| Wage / Income Gap ($) | 2,769 | 62.87¢ per $1 |
| Gini / Inequality Index | 2,769 | 0.40 |
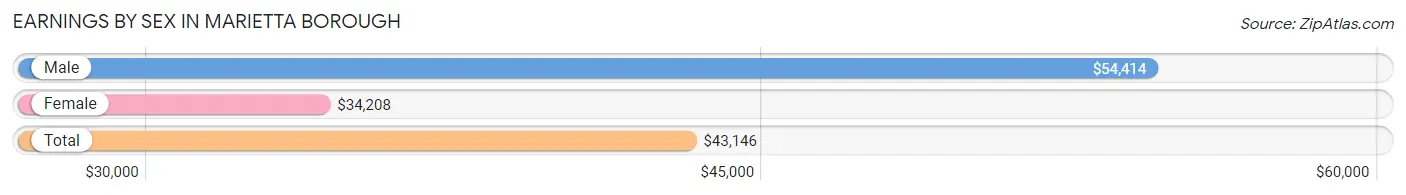
Earnings by Sex in Marietta borough
Average Earnings in Marietta borough are $43,146, $54,414 for men and $34,208 for women, a difference of 37.1%.
| Sex | Number | Average Earnings |
| Male | 795 (54.7%) | $54,414 |
| Female | 659 (45.3%) | $34,208 |
| Total | 1,454 (100.0%) | $43,146 |
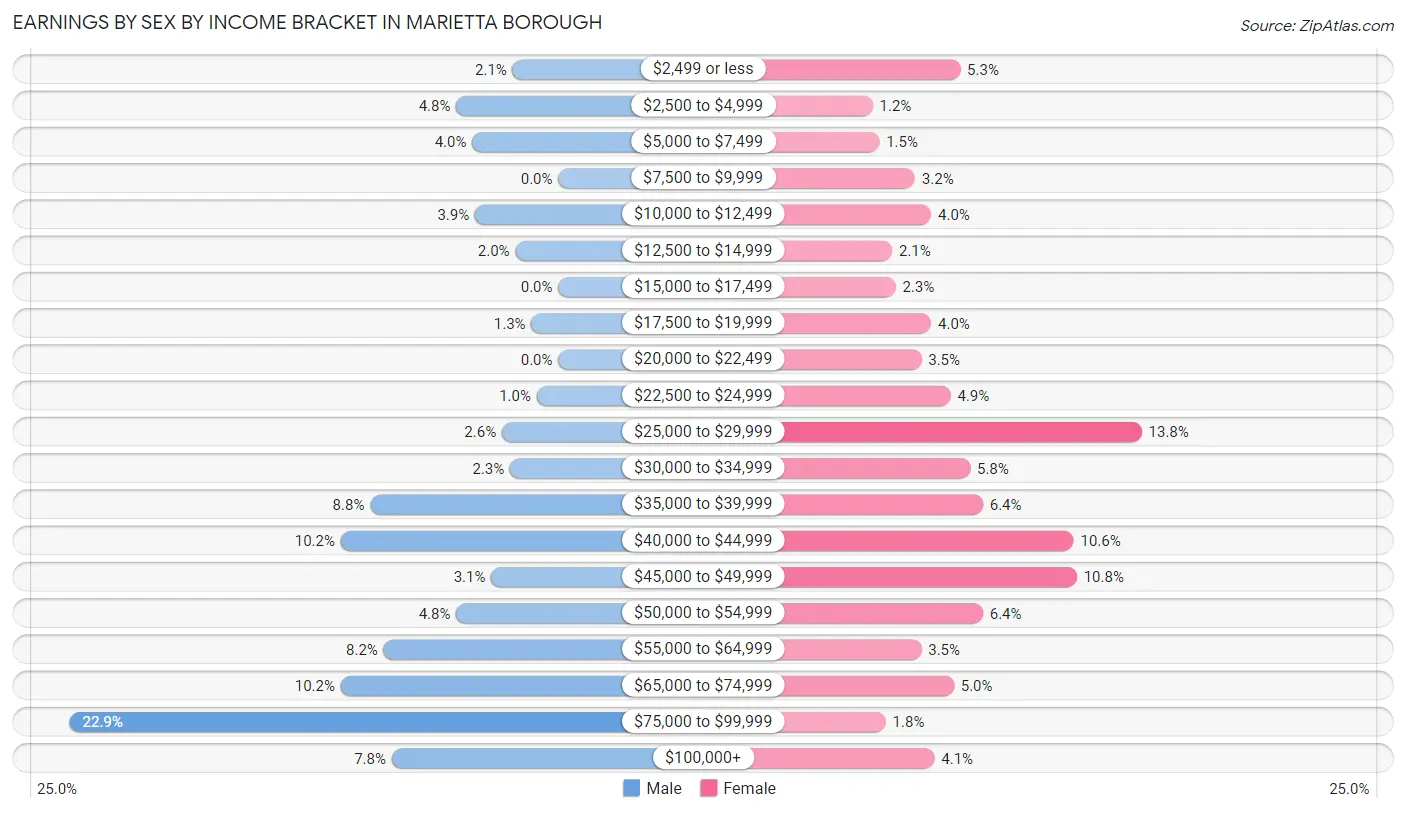
Earnings by Sex by Income Bracket in Marietta borough
The most common earnings brackets in Marietta borough are $75,000 to $99,999 for men (182 | 22.9%) and $25,000 to $29,999 for women (91 | 13.8%).
| Income | Male | Female |
| $2,499 or less | 17 (2.1%) | 35 (5.3%) |
| $2,500 to $4,999 | 38 (4.8%) | 8 (1.2%) |
| $5,000 to $7,499 | 32 (4.0%) | 10 (1.5%) |
| $7,500 to $9,999 | 0 (0.0%) | 21 (3.2%) |
| $10,000 to $12,499 | 31 (3.9%) | 26 (4.0%) |
| $12,500 to $14,999 | 16 (2.0%) | 14 (2.1%) |
| $15,000 to $17,499 | 0 (0.0%) | 15 (2.3%) |
| $17,500 to $19,999 | 10 (1.3%) | 26 (4.0%) |
| $20,000 to $22,499 | 0 (0.0%) | 23 (3.5%) |
| $22,500 to $24,999 | 8 (1.0%) | 32 (4.9%) |
| $25,000 to $29,999 | 21 (2.6%) | 91 (13.8%) |
| $30,000 to $34,999 | 18 (2.3%) | 38 (5.8%) |
| $35,000 to $39,999 | 70 (8.8%) | 42 (6.4%) |
| $40,000 to $44,999 | 81 (10.2%) | 70 (10.6%) |
| $45,000 to $49,999 | 25 (3.1%) | 71 (10.8%) |
| $50,000 to $54,999 | 38 (4.8%) | 42 (6.4%) |
| $55,000 to $64,999 | 65 (8.2%) | 23 (3.5%) |
| $65,000 to $74,999 | 81 (10.2%) | 33 (5.0%) |
| $75,000 to $99,999 | 182 (22.9%) | 12 (1.8%) |
| $100,000+ | 62 (7.8%) | 27 (4.1%) |
| Total | 795 (100.0%) | 659 (100.0%) |
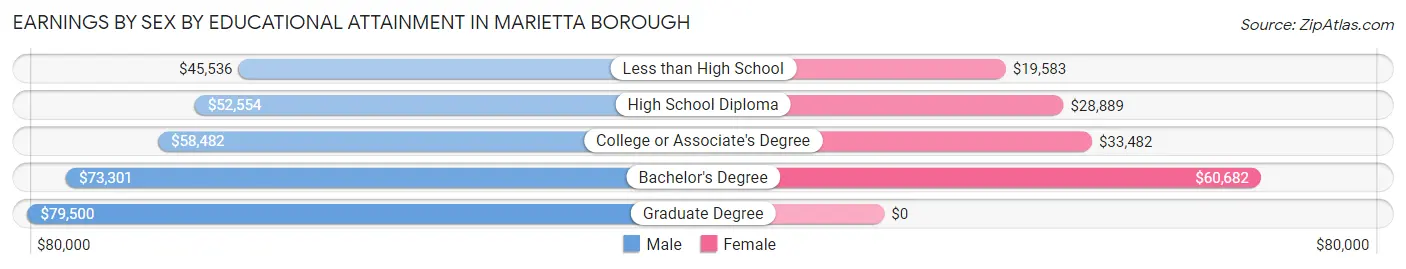
Earnings by Sex by Educational Attainment in Marietta borough
Average earnings in Marietta borough are $58,482 for men and $34,958 for women, a difference of 40.2%. Men with an educational attainment of graduate degree enjoy the highest average annual earnings of $79,500, while those with less than high school education earn the least with $45,536. Women with an educational attainment of bachelor's degree earn the most with the average annual earnings of $60,682, while those with less than high school education have the smallest earnings of $19,583.
| Educational Attainment | Male Income | Female Income |
| Less than High School | $45,536 | $19,583 |
| High School Diploma | $52,554 | $28,889 |
| College or Associate's Degree | $58,482 | $33,482 |
| Bachelor's Degree | $73,301 | $60,682 |
| Graduate Degree | $79,500 | $0 |
| Total | $58,482 | $34,958 |
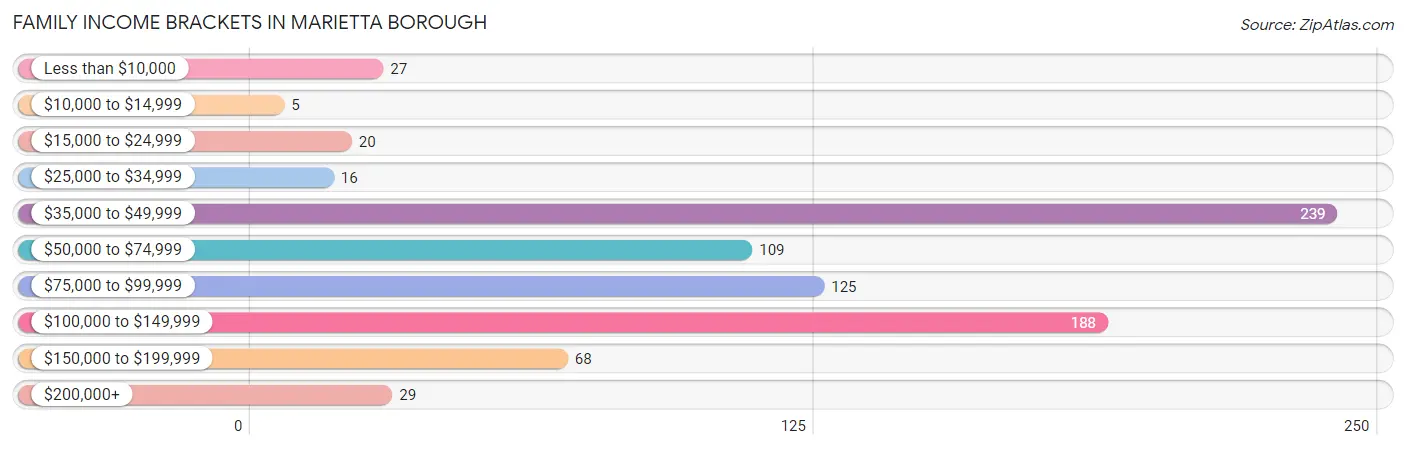
Family Income in Marietta borough
Family Income Brackets in Marietta borough
According to the Marietta borough family income data, there are 239 families falling into the $35,000 to $49,999 income range, which is the most common income bracket and makes up 28.9% of all families. Conversely, the $10,000 to $14,999 income bracket is the least frequent group with only 5 families (0.6%) belonging to this category.
| Income Bracket | # Families | % Families |
| Less than $10,000 | 27 | 3.3% |
| $10,000 to $14,999 | 5 | 0.6% |
| $15,000 to $24,999 | 20 | 2.4% |
| $25,000 to $34,999 | 16 | 1.9% |
| $35,000 to $49,999 | 239 | 28.9% |
| $50,000 to $74,999 | 109 | 13.2% |
| $75,000 to $99,999 | 125 | 15.1% |
| $100,000 to $149,999 | 188 | 22.8% |
| $150,000 to $199,999 | 68 | 8.2% |
| $200,000+ | 29 | 3.5% |
Family Income by Famaliy Size in Marietta borough
5-person families (32 | 3.9%) account for the highest median family income in Marietta borough with $167,750 per family, while 3-person families (171 | 20.7%) have the highest median income of $34,392 per family member.
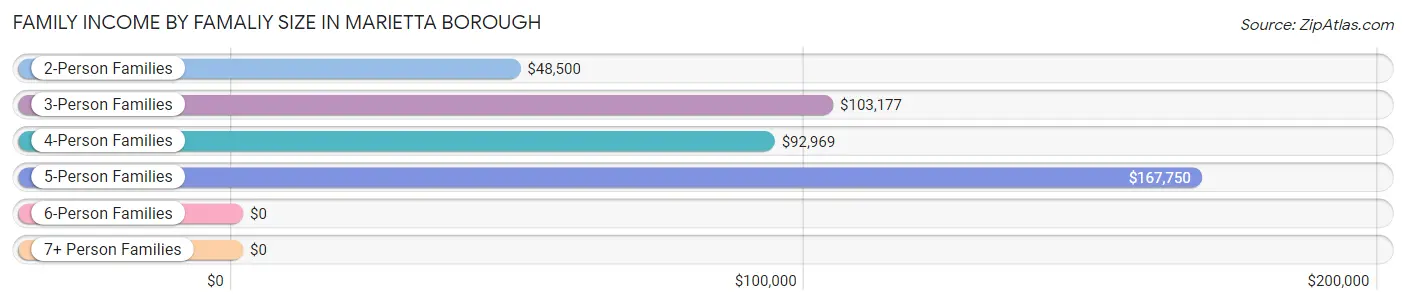
| Income Bracket | # Families | Median Income |
| 2-Person Families | 514 (62.2%) | $48,500 |
| 3-Person Families | 171 (20.7%) | $103,177 |
| 4-Person Families | 100 (12.1%) | $92,969 |
| 5-Person Families | 32 (3.9%) | $167,750 |
| 6-Person Families | 9 (1.1%) | $0 |
| 7+ Person Families | 0 (0.0%) | $0 |
| Total | 826 (100.0%) | $74,779 |
Family Income by Number of Earners in Marietta borough
The median family income in Marietta borough is $74,779, with families comprising 3+ earners (80) having the highest median family income of $153,611, while families with no earners (261) have the lowest median family income of $36,333, accounting for 9.7% and 31.6% of families, respectively.
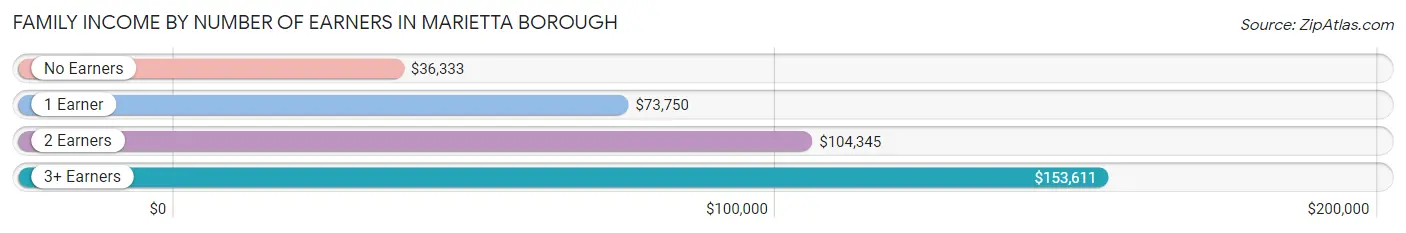
| Number of Earners | # Families | Median Income |
| No Earners | 261 (31.6%) | $36,333 |
| 1 Earner | 150 (18.2%) | $73,750 |
| 2 Earners | 335 (40.6%) | $104,345 |
| 3+ Earners | 80 (9.7%) | $153,611 |
| Total | 826 (100.0%) | $74,779 |
Household Income in Marietta borough
Household Income Brackets in Marietta borough
With 324 households falling in the category, the $35,000 to $49,999 income range is the most frequent in Marietta borough, accounting for 24.6% of all households. In contrast, only 29 households (2.2%) fall into the $200,000+ income bracket, making it the least populous group.
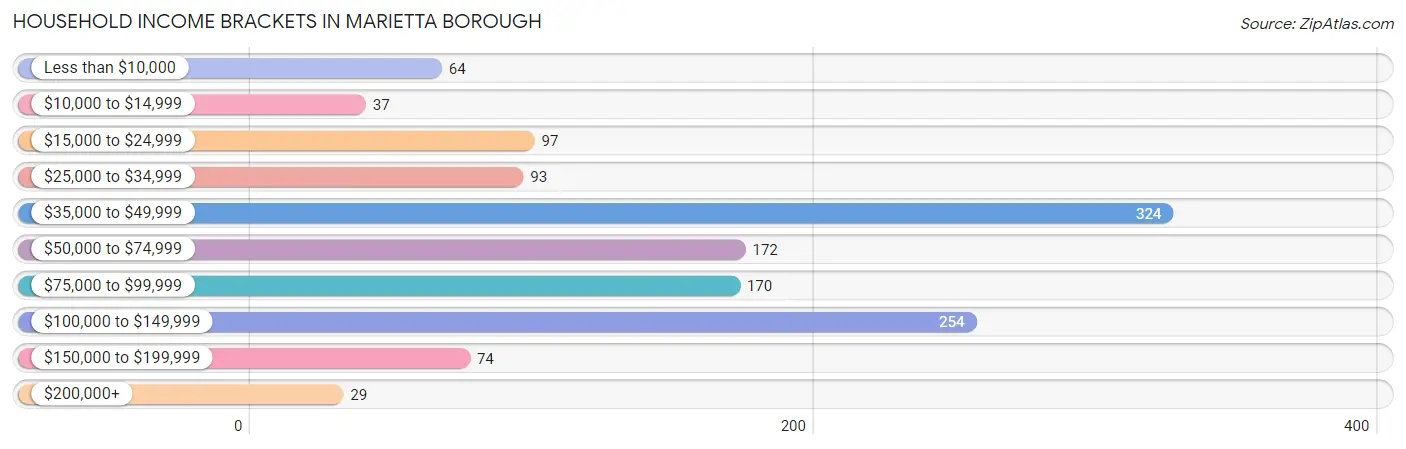
| Income Bracket | # Households | % Households |
| Less than $10,000 | 64 | 4.9% |
| $10,000 to $14,999 | 37 | 2.8% |
| $15,000 to $24,999 | 97 | 7.4% |
| $25,000 to $34,999 | 93 | 7.1% |
| $35,000 to $49,999 | 324 | 24.6% |
| $50,000 to $74,999 | 172 | 13.1% |
| $75,000 to $99,999 | 170 | 12.9% |
| $100,000 to $149,999 | 254 | 19.3% |
| $150,000 to $199,999 | 74 | 5.6% |
| $200,000+ | 29 | 2.2% |
Household Income by Householder Age in Marietta borough
The median household income in Marietta borough is $56,429, with the highest median household income of $88,625 found in the 25 to 44 years age bracket for the primary householder. A total of 425 households (32.3%) fall into this category. Meanwhile, the 15 to 24 years age bracket for the primary householder has the lowest median household income of $0, with 17 households (1.3%) in this group.
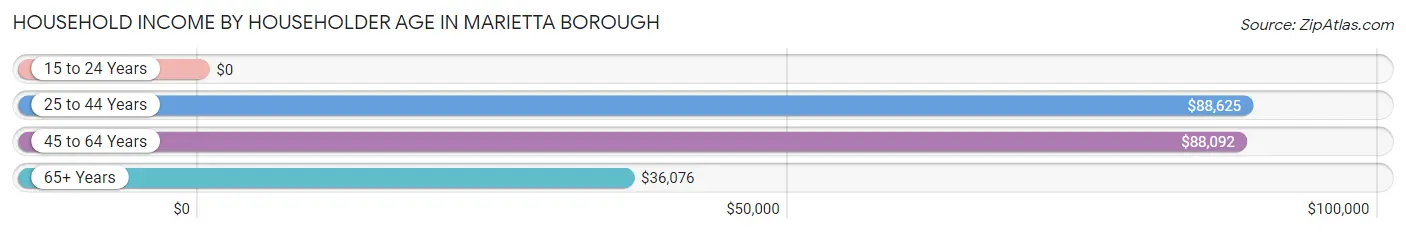
| Income Bracket | # Households | Median Income |
| 15 to 24 Years | 17 (1.3%) | $0 |
| 25 to 44 Years | 425 (32.3%) | $88,625 |
| 45 to 64 Years | 389 (29.6%) | $88,092 |
| 65+ Years | 485 (36.8%) | $36,076 |
| Total | 1,316 (100.0%) | $56,429 |
Poverty in Marietta borough
Income Below Poverty by Sex and Age in Marietta borough
With 11.4% poverty level for males and 13.2% for females among the residents of Marietta borough, 6 to 11 year old males and 6 to 11 year old females are the most vulnerable to poverty, with 29 males (47.5%) and 6 females (22.2%) in their respective age groups living below the poverty level.
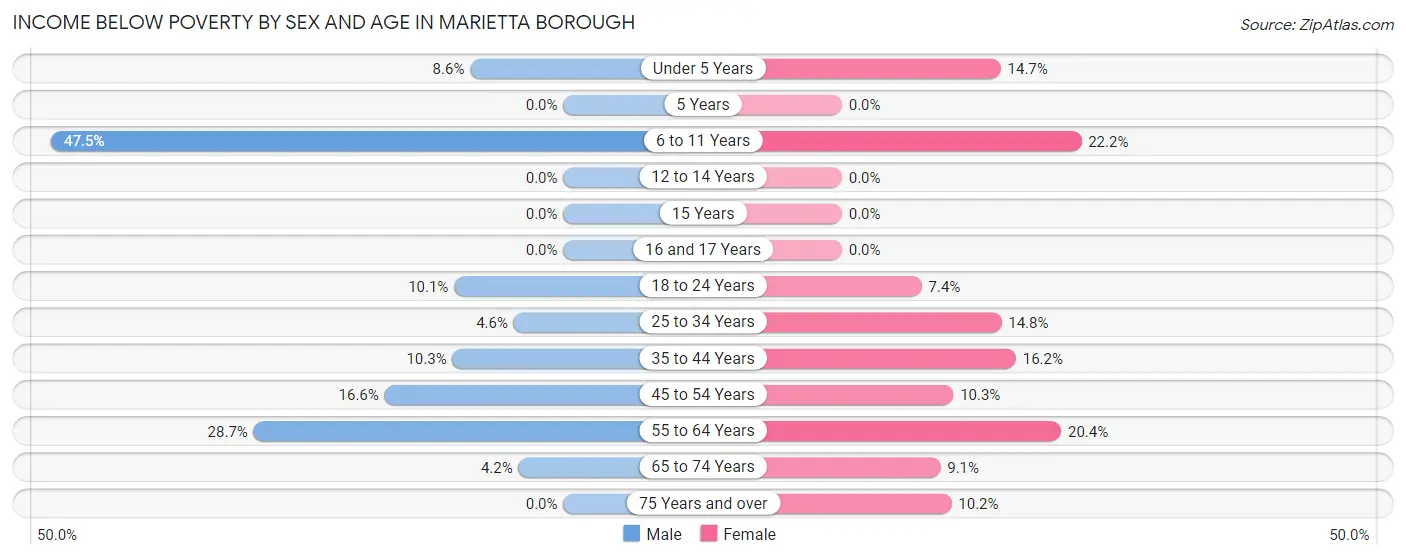
| Age Bracket | Male | Female |
| Under 5 Years | 7 (8.6%) | 14 (14.7%) |
| 5 Years | 0 (0.0%) | 0 (0.0%) |
| 6 to 11 Years | 29 (47.5%) | 6 (22.2%) |
| 12 to 14 Years | 0 (0.0%) | 0 (0.0%) |
| 15 Years | 0 (0.0%) | 0 (0.0%) |
| 16 and 17 Years | 0 (0.0%) | 0 (0.0%) |
| 18 to 24 Years | 8 (10.1%) | 6 (7.4%) |
| 25 to 34 Years | 11 (4.6%) | 29 (14.8%) |
| 35 to 44 Years | 21 (10.3%) | 26 (16.2%) |
| 45 to 54 Years | 37 (16.6%) | 15 (10.3%) |
| 55 to 64 Years | 48 (28.7%) | 35 (20.3%) |
| 65 to 74 Years | 15 (4.2%) | 17 (9.1%) |
| 75 Years and over | 0 (0.0%) | 12 (10.2%) |
| Total | 176 (11.4%) | 160 (13.2%) |
Income Above Poverty by Sex and Age in Marietta borough
According to the poverty statistics in Marietta borough, males aged 5 years and females aged 5 years are the age groups that are most secure financially, with 100.0% of males and 100.0% of females in these age groups living above the poverty line.
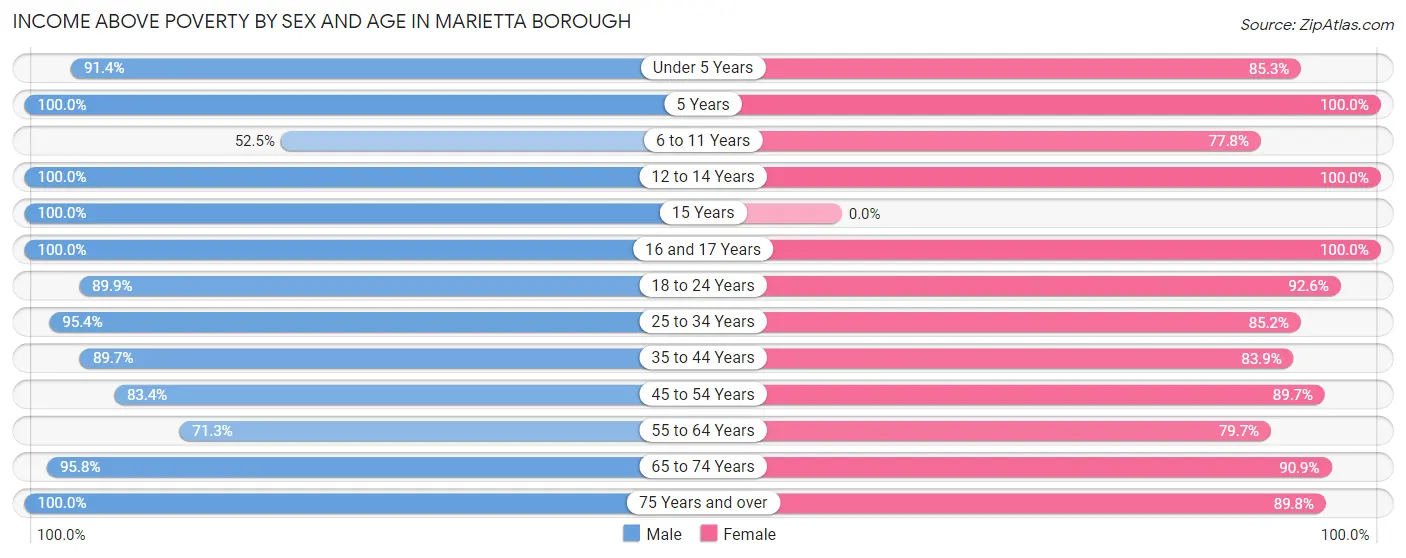
| Age Bracket | Male | Female |
| Under 5 Years | 74 (91.4%) | 81 (85.3%) |
| 5 Years | 10 (100.0%) | 6 (100.0%) |
| 6 to 11 Years | 32 (52.5%) | 21 (77.8%) |
| 12 to 14 Years | 25 (100.0%) | 16 (100.0%) |
| 15 Years | 42 (100.0%) | 0 (0.0%) |
| 16 and 17 Years | 7 (100.0%) | 13 (100.0%) |
| 18 to 24 Years | 71 (89.9%) | 75 (92.6%) |
| 25 to 34 Years | 228 (95.4%) | 167 (85.2%) |
| 35 to 44 Years | 183 (89.7%) | 135 (83.9%) |
| 45 to 54 Years | 186 (83.4%) | 130 (89.7%) |
| 55 to 64 Years | 119 (71.3%) | 137 (79.6%) |
| 65 to 74 Years | 346 (95.8%) | 169 (90.9%) |
| 75 Years and over | 43 (100.0%) | 106 (89.8%) |
| Total | 1,366 (88.6%) | 1,056 (86.8%) |
Income Below Poverty Among Married-Couple Families in Marietta borough
The poverty statistics for married-couple families in Marietta borough show that 3.2% or 23 of the total 719 families live below the poverty line. Families with 1 or 2 children have the highest poverty rate of 4.4%, comprising of 7 families. On the other hand, families with 3 or 4 children have the lowest poverty rate of 0.0%, which includes 0 families.
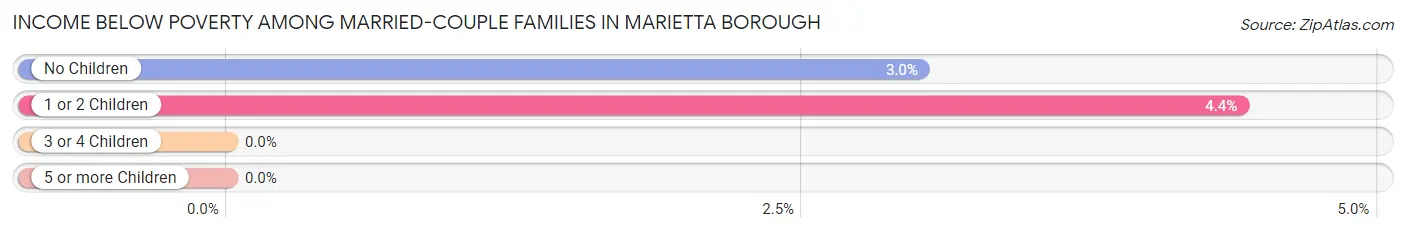
| Children | Above Poverty | Below Poverty |
| No Children | 515 (97.0%) | 16 (3.0%) |
| 1 or 2 Children | 152 (95.6%) | 7 (4.4%) |
| 3 or 4 Children | 29 (100.0%) | 0 (0.0%) |
| 5 or more Children | 0 (0.0%) | 0 (0.0%) |
| Total | 696 (96.8%) | 23 (3.2%) |
Income Below Poverty Among Single-Parent Households in Marietta borough
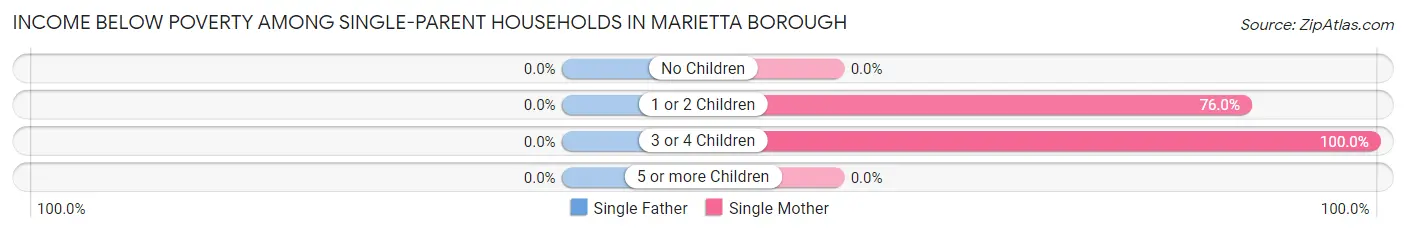
| Children | Single Father | Single Mother |
| No Children | 0 (0.0%) | 0 (0.0%) |
| 1 or 2 Children | 0 (0.0%) | 19 (76.0%) |
| 3 or 4 Children | 0 (0.0%) | 7 (100.0%) |
| 5 or more Children | 0 (0.0%) | 0 (0.0%) |
| Total | 0 (0.0%) | 26 (32.9%) |
Income Below Poverty Among Married-Couple vs Single-Parent Households in Marietta borough
The poverty data for Marietta borough shows that 23 of the married-couple family households (3.2%) and 26 of the single-parent households (24.3%) are living below the poverty level. Within the married-couple family households, those with 1 or 2 children have the highest poverty rate, with 7 households (4.4%) falling below the poverty line. Among the single-parent households, those with 3 or 4 children have the highest poverty rate, with 7 household (100.0%) living below poverty.
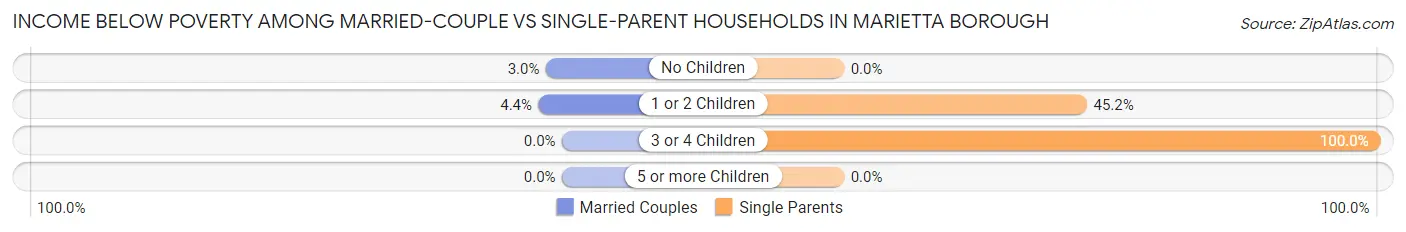
| Children | Married-Couple Families | Single-Parent Households |
| No Children | 16 (3.0%) | 0 (0.0%) |
| 1 or 2 Children | 7 (4.4%) | 19 (45.2%) |
| 3 or 4 Children | 0 (0.0%) | 7 (100.0%) |
| 5 or more Children | 0 (0.0%) | 0 (0.0%) |
| Total | 23 (3.2%) | 26 (24.3%) |
Race in Marietta borough
The most populous races in Marietta borough are White / Caucasian (2,296 | 82.9%), Some other Race (263 | 9.5%), and Two or more Races (115 | 4.2%).
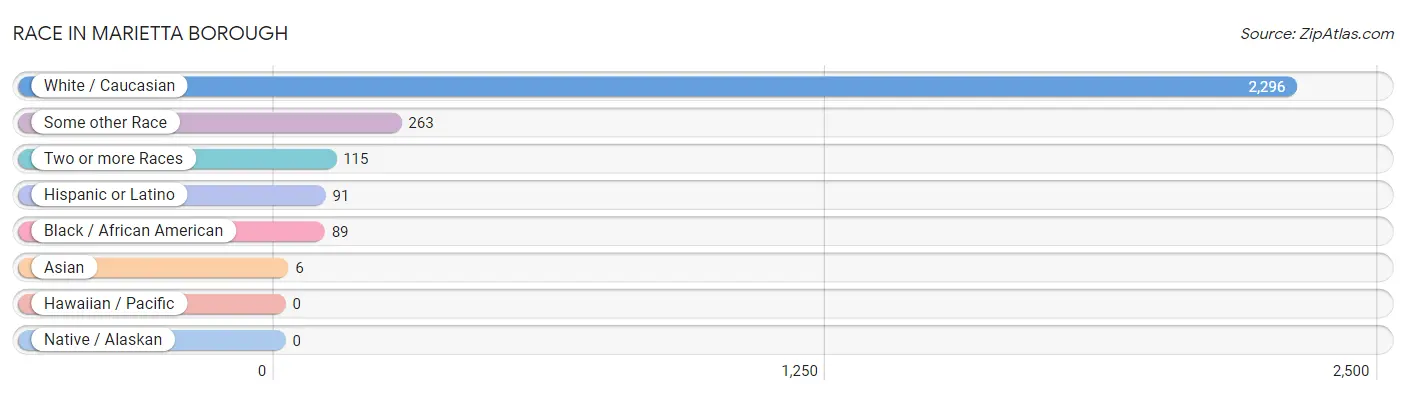
| Race | # Population | % Population |
| Asian | 6 | 0.2% |
| Black / African American | 89 | 3.2% |
| Hawaiian / Pacific | 0 | 0.0% |
| Hispanic or Latino | 91 | 3.3% |
| Native / Alaskan | 0 | 0.0% |
| White / Caucasian | 2,296 | 82.9% |
| Two or more Races | 115 | 4.2% |
| Some other Race | 263 | 9.5% |
| Total | 2,769 | 100.0% |
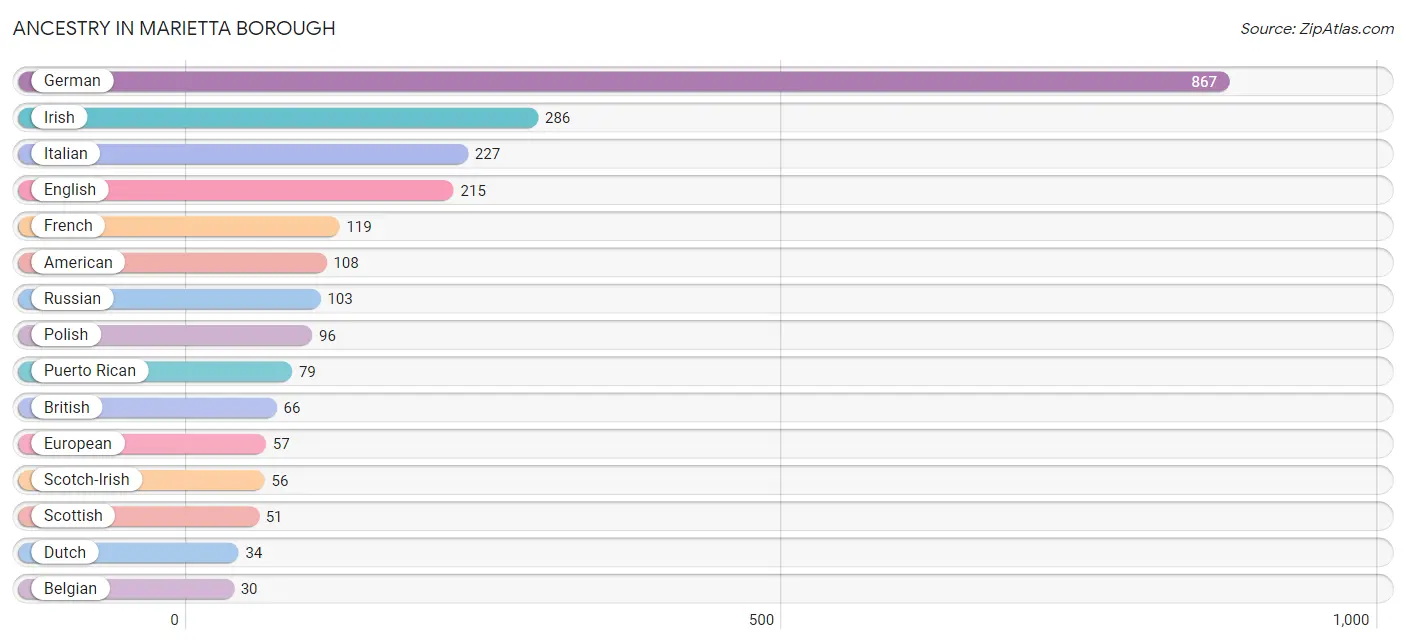
Ancestry in Marietta borough
The most populous ancestries reported in Marietta borough are German (867 | 31.3%), Irish (286 | 10.3%), Italian (227 | 8.2%), English (215 | 7.8%), and French (119 | 4.3%), together accounting for 61.9% of all Marietta borough residents.
| Ancestry | # Population | % Population |
| American | 108 | 3.9% |
| Austrian | 7 | 0.3% |
| Belgian | 30 | 1.1% |
| British | 66 | 2.4% |
| Cherokee | 6 | 0.2% |
| Czechoslovakian | 2 | 0.1% |
| Dominican | 12 | 0.4% |
| Dutch | 34 | 1.2% |
| English | 215 | 7.8% |
| European | 57 | 2.1% |
| French | 119 | 4.3% |
| German | 867 | 31.3% |
| Hungarian | 7 | 0.3% |
| Iranian | 3 | 0.1% |
| Irish | 286 | 10.3% |
| Italian | 227 | 8.2% |
| Korean | 12 | 0.4% |
| Pennsylvania German | 7 | 0.3% |
| Polish | 96 | 3.5% |
| Puerto Rican | 79 | 2.9% |
| Russian | 103 | 3.7% |
| Scandinavian | 5 | 0.2% |
| Scotch-Irish | 56 | 2.0% |
| Scottish | 51 | 1.8% |
| Serbian | 4 | 0.1% |
| Swedish | 6 | 0.2% |
| Swiss | 28 | 1.0% |
| Ukrainian | 17 | 0.6% |
| Welsh | 6 | 0.2% |
| Yugoslavian | 6 | 0.2% | View All 30 Rows |
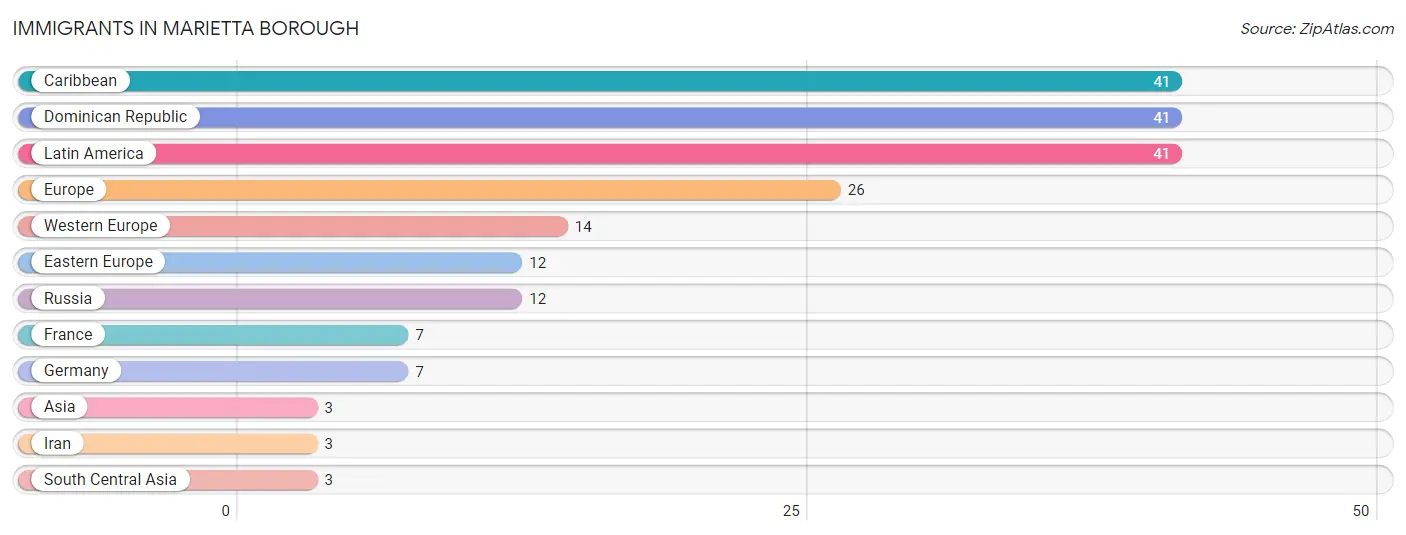
Immigrants in Marietta borough
The most numerous immigrant groups reported in Marietta borough came from Caribbean (41 | 1.5%), Dominican Republic (41 | 1.5%), Latin America (41 | 1.5%), Europe (26 | 0.9%), and Western Europe (14 | 0.5%), together accounting for 5.9% of all Marietta borough residents.
| Immigration Origin | # Population | % Population |
| Asia | 3 | 0.1% |
| Caribbean | 41 | 1.5% |
| Dominican Republic | 41 | 1.5% |
| Eastern Europe | 12 | 0.4% |
| Europe | 26 | 0.9% |
| France | 7 | 0.3% |
| Germany | 7 | 0.3% |
| Iran | 3 | 0.1% |
| Latin America | 41 | 1.5% |
| Russia | 12 | 0.4% |
| South Central Asia | 3 | 0.1% |
| Western Europe | 14 | 0.5% | View All 12 Rows |
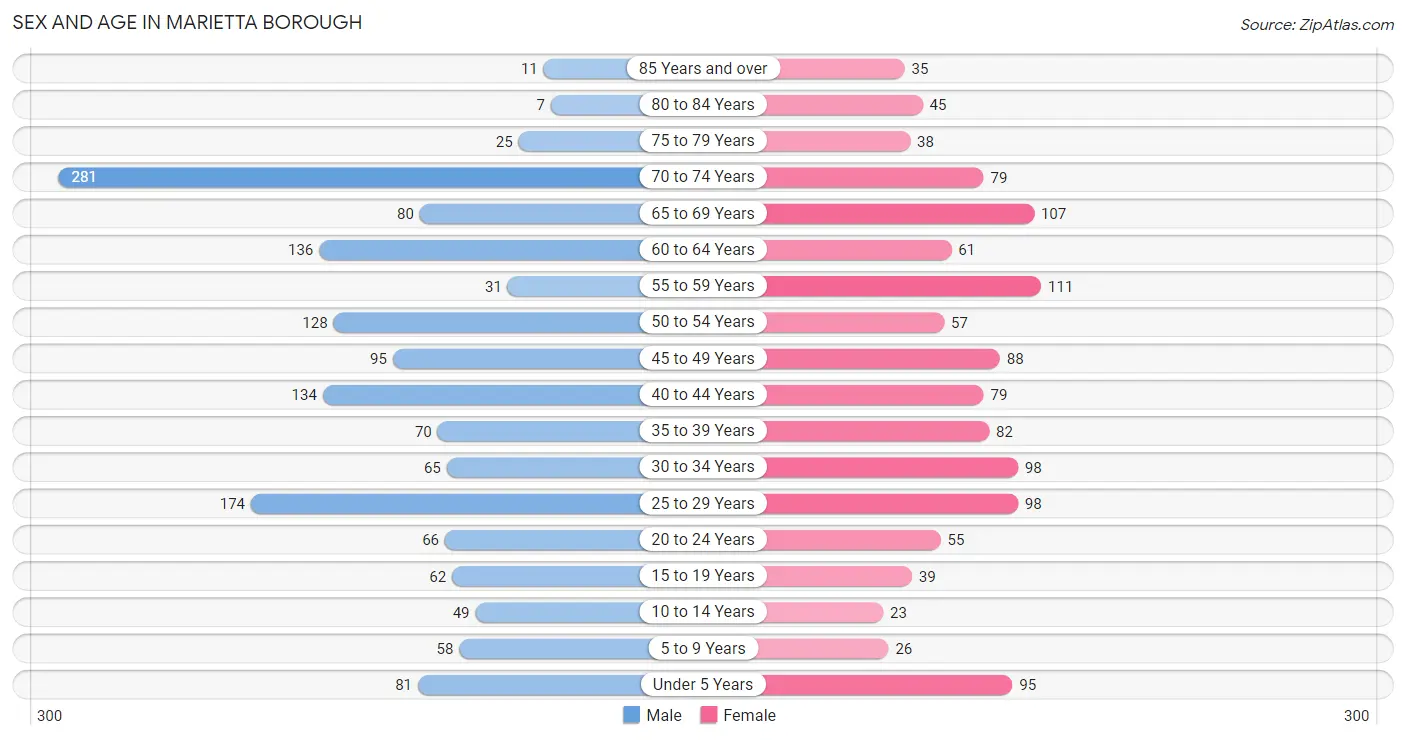
Sex and Age in Marietta borough
Sex and Age in Marietta borough
The most populous age groups in Marietta borough are 70 to 74 Years (281 | 18.1%) for men and 55 to 59 Years (111 | 9.1%) for women.
| Age Bracket | Male | Female |
| Under 5 Years | 81 (5.2%) | 95 (7.8%) |
| 5 to 9 Years | 58 (3.7%) | 26 (2.1%) |
| 10 to 14 Years | 49 (3.2%) | 23 (1.9%) |
| 15 to 19 Years | 62 (4.0%) | 39 (3.2%) |
| 20 to 24 Years | 66 (4.3%) | 55 (4.5%) |
| 25 to 29 Years | 174 (11.2%) | 98 (8.1%) |
| 30 to 34 Years | 65 (4.2%) | 98 (8.1%) |
| 35 to 39 Years | 70 (4.5%) | 82 (6.7%) |
| 40 to 44 Years | 134 (8.6%) | 79 (6.5%) |
| 45 to 49 Years | 95 (6.1%) | 88 (7.2%) |
| 50 to 54 Years | 128 (8.2%) | 57 (4.7%) |
| 55 to 59 Years | 31 (2.0%) | 111 (9.1%) |
| 60 to 64 Years | 136 (8.8%) | 61 (5.0%) |
| 65 to 69 Years | 80 (5.1%) | 107 (8.8%) |
| 70 to 74 Years | 281 (18.1%) | 79 (6.5%) |
| 75 to 79 Years | 25 (1.6%) | 38 (3.1%) |
| 80 to 84 Years | 7 (0.4%) | 45 (3.7%) |
| 85 Years and over | 11 (0.7%) | 35 (2.9%) |
| Total | 1,553 (100.0%) | 1,216 (100.0%) |
Families and Households in Marietta borough
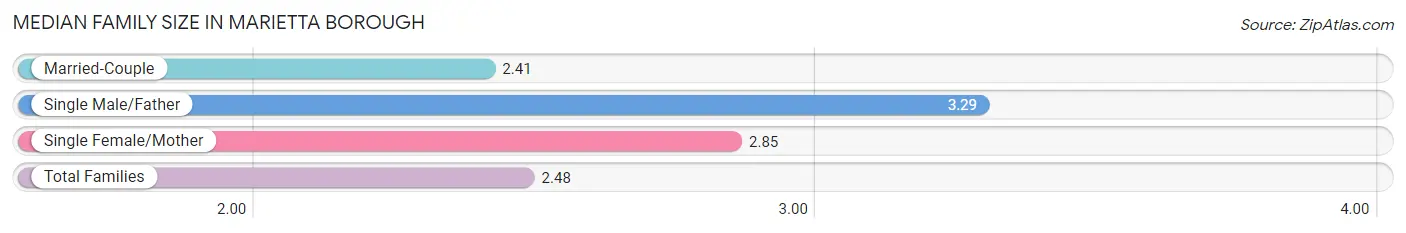
Median Family Size in Marietta borough
The median family size in Marietta borough is 2.48 persons per family, with single male/father families (28 | 3.4%) accounting for the largest median family size of 3.29 persons per family. On the other hand, married-couple families (719 | 87.1%) represent the smallest median family size with 2.41 persons per family.
| Family Type | # Families | Family Size |
| Married-Couple | 719 (87.1%) | 2.41 |
| Single Male/Father | 28 (3.4%) | 3.29 |
| Single Female/Mother | 79 (9.6%) | 2.85 |
| Total Families | 826 (100.0%) | 2.48 |
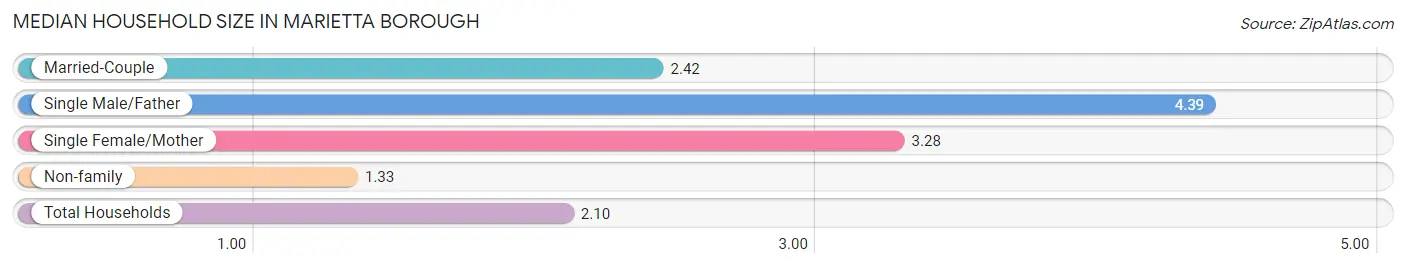
Median Household Size in Marietta borough
The median household size in Marietta borough is 2.10 persons per household, with single male/father households (28 | 2.1%) accounting for the largest median household size of 4.39 persons per household. non-family households (490 | 37.2%) represent the smallest median household size with 1.33 persons per household.
| Household Type | # Households | Household Size |
| Married-Couple | 719 (54.6%) | 2.42 |
| Single Male/Father | 28 (2.1%) | 4.39 |
| Single Female/Mother | 79 (6.0%) | 3.28 |
| Non-family | 490 (37.2%) | 1.33 |
| Total Households | 1,316 (100.0%) | 2.10 |
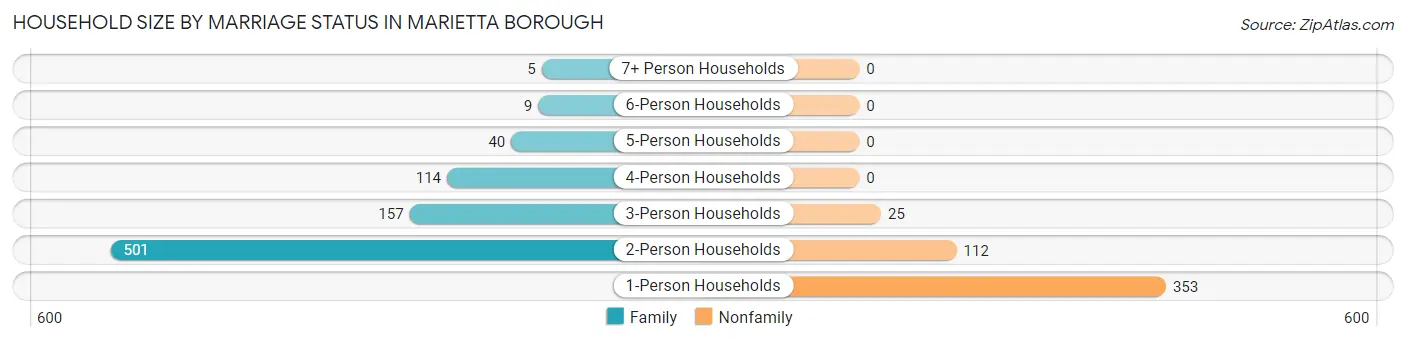
Household Size by Marriage Status in Marietta borough
Out of a total of 1,316 households in Marietta borough, 826 (62.8%) are family households, while 490 (37.2%) are nonfamily households. The most numerous type of family households are 2-person households, comprising 501, and the most common type of nonfamily households are 1-person households, comprising 353.
| Household Size | Family Households | Nonfamily Households |
| 1-Person Households | - | 353 (26.8%) |
| 2-Person Households | 501 (38.1%) | 112 (8.5%) |
| 3-Person Households | 157 (11.9%) | 25 (1.9%) |
| 4-Person Households | 114 (8.7%) | 0 (0.0%) |
| 5-Person Households | 40 (3.0%) | 0 (0.0%) |
| 6-Person Households | 9 (0.7%) | 0 (0.0%) |
| 7+ Person Households | 5 (0.4%) | 0 (0.0%) |
| Total | 826 (62.8%) | 490 (37.2%) |
Female Fertility in Marietta borough
Fertility by Age in Marietta borough
Average fertility rate in Marietta borough is 56.0 births per 1,000 women. Women in the age bracket of 35 to 50 years have the highest fertility rate with 68.0 births per 1,000 women. Women in the age bracket of 35 to 50 years acount for 58.1% of all women with births.
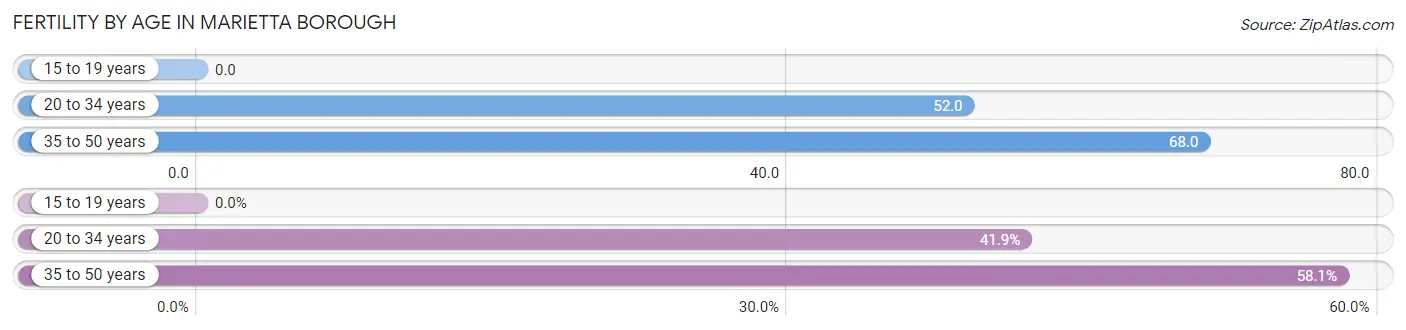
| Age Bracket | Women with Births | Births / 1,000 Women |
| 15 to 19 years | 0 (0.0%) | 0.0 |
| 20 to 34 years | 13 (41.9%) | 52.0 |
| 35 to 50 years | 18 (58.1%) | 68.0 |
| Total | 31 (100.0%) | 56.0 |
Fertility by Age by Marriage Status in Marietta borough
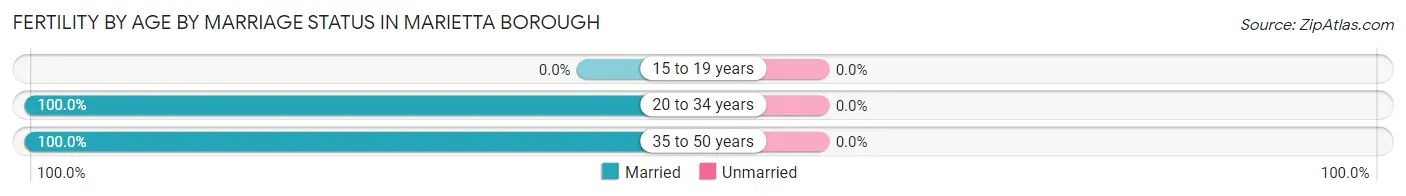
| Age Bracket | Married | Unmarried |
| 15 to 19 years | 0 (0.0%) | 0 (0.0%) |
| 20 to 34 years | 13 (100.0%) | 0 (0.0%) |
| 35 to 50 years | 18 (100.0%) | 0 (0.0%) |
| Total | 31 (100.0%) | 0 (0.0%) |
Fertility by Education in Marietta borough
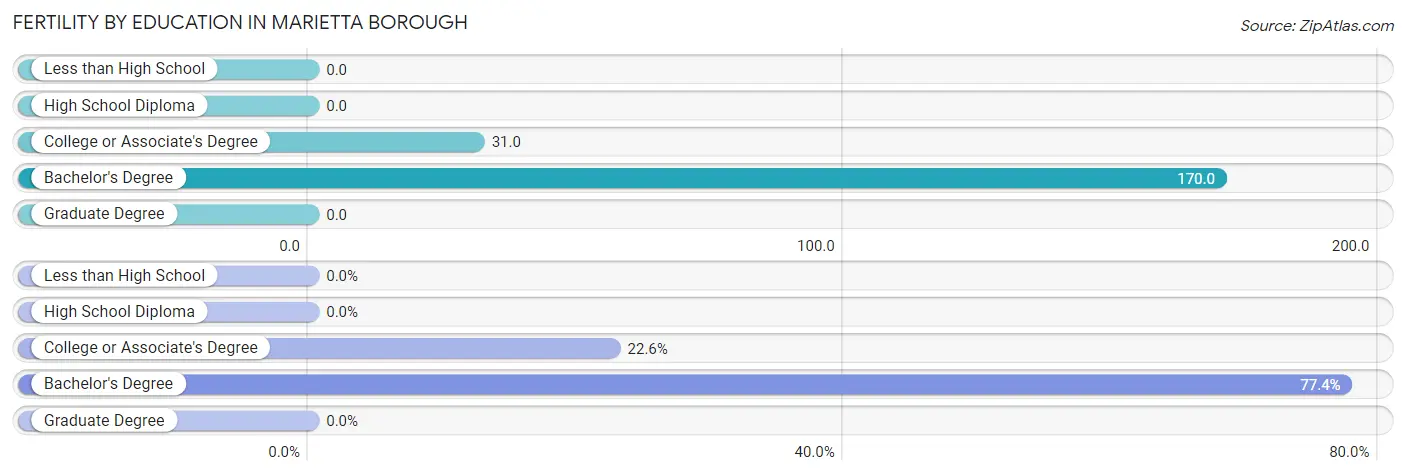
| Educational Attainment | Women with Births | Births / 1,000 Women |
| Less than High School | 0 (0.0%) | 0.0 |
| High School Diploma | 0 (0.0%) | 0.0 |
| College or Associate's Degree | 7 (22.6%) | 31.0 |
| Bachelor's Degree | 24 (77.4%) | 170.0 |
| Graduate Degree | 0 (0.0%) | 0.0 |
| Total | 31 (100.0%) | 56.0 |
Fertility by Education by Marriage Status in Marietta borough
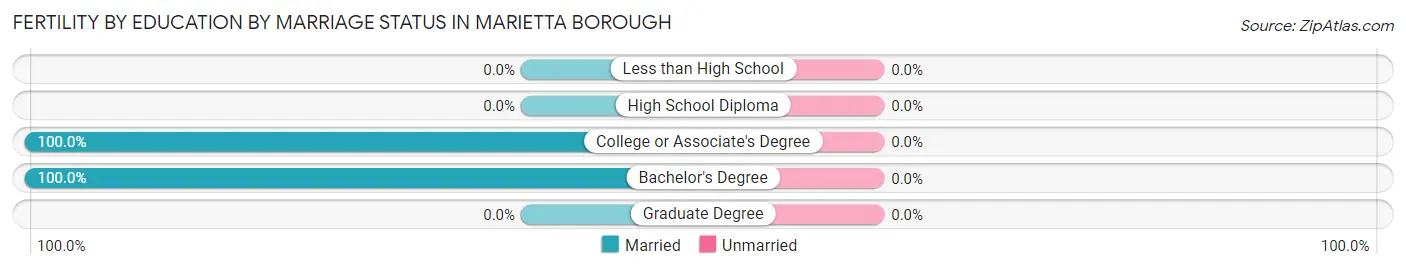
| Educational Attainment | Married | Unmarried |
| Less than High School | 0 (0.0%) | 0 (0.0%) |
| High School Diploma | 0 (0.0%) | 0 (0.0%) |
| College or Associate's Degree | 7 (100.0%) | 0 (0.0%) |
| Bachelor's Degree | 24 (100.0%) | 0 (0.0%) |
| Graduate Degree | 0 (0.0%) | 0 (0.0%) |
| Total | 31 (100.0%) | 0 (0.0%) |
Employment Characteristics in Marietta borough
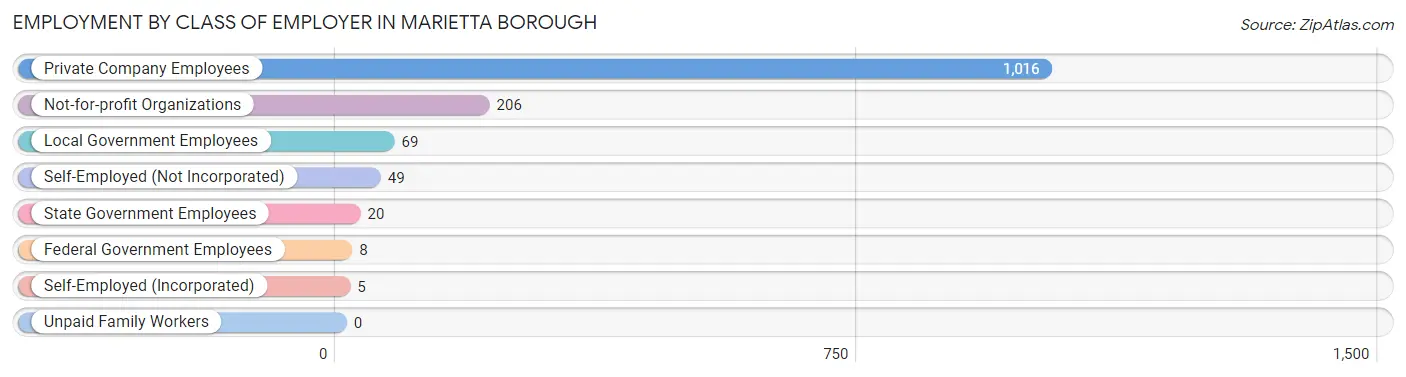
Employment by Class of Employer in Marietta borough
Among the 1,373 employed individuals in Marietta borough, private company employees (1,016 | 74.0%), not-for-profit organizations (206 | 15.0%), and local government employees (69 | 5.0%) make up the most common classes of employment.
| Employer Class | # Employees | % Employees |
| Private Company Employees | 1,016 | 74.0% |
| Self-Employed (Incorporated) | 5 | 0.4% |
| Self-Employed (Not Incorporated) | 49 | 3.6% |
| Not-for-profit Organizations | 206 | 15.0% |
| Local Government Employees | 69 | 5.0% |
| State Government Employees | 20 | 1.5% |
| Federal Government Employees | 8 | 0.6% |
| Unpaid Family Workers | 0 | 0.0% |
| Total | 1,373 | 100.0% |
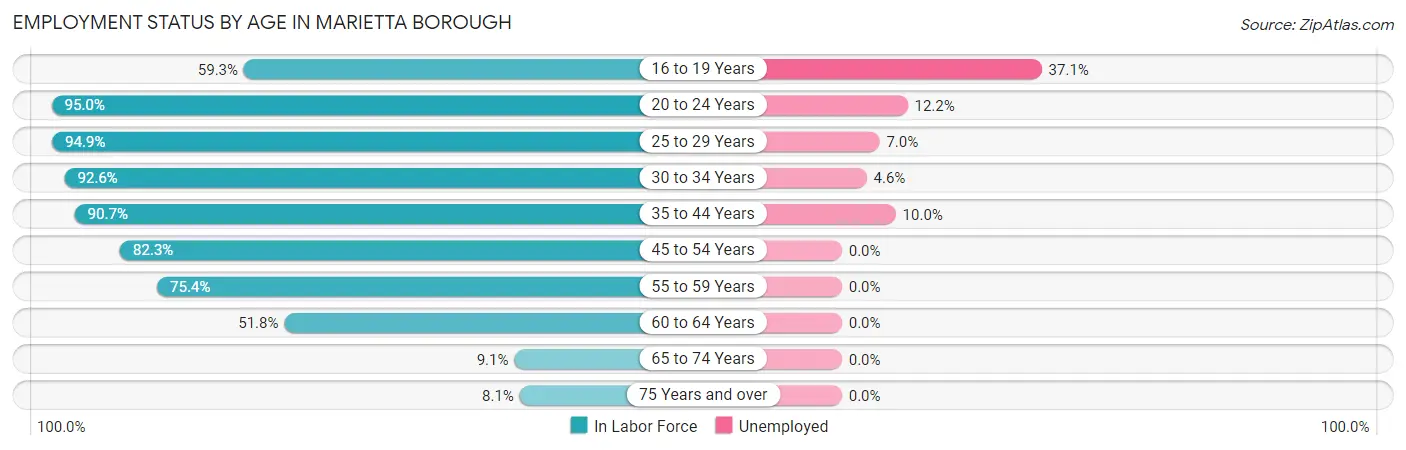
Employment Status by Age in Marietta borough
According to the labor force statistics for Marietta borough, out of the total population over 16 years of age (2,395), 61.2% or 1,466 individuals are in the labor force, with 5.8% or 85 of them unemployed. The age group with the highest labor force participation rate is 20 to 24 years, with 95.0% or 115 individuals in the labor force. Within the labor force, the 16 to 19 years age range has the highest percentage of unemployed individuals, with 37.1% or 13 of them being unemployed.
| Age Bracket | In Labor Force | Unemployed |
| 16 to 19 Years | 35 (59.3%) | 13 (37.1%) |
| 20 to 24 Years | 115 (95.0%) | 14 (12.2%) |
| 25 to 29 Years | 258 (94.9%) | 18 (7.0%) |
| 30 to 34 Years | 151 (92.6%) | 7 (4.6%) |
| 35 to 44 Years | 331 (90.7%) | 33 (10.0%) |
| 45 to 54 Years | 303 (82.3%) | 0 (0.0%) |
| 55 to 59 Years | 107 (75.4%) | 0 (0.0%) |
| 60 to 64 Years | 102 (51.8%) | 0 (0.0%) |
| 65 to 74 Years | 50 (9.1%) | 0 (0.0%) |
| 75 Years and over | 13 (8.1%) | 0 (0.0%) |
| Total | 1,466 (61.2%) | 85 (5.8%) |
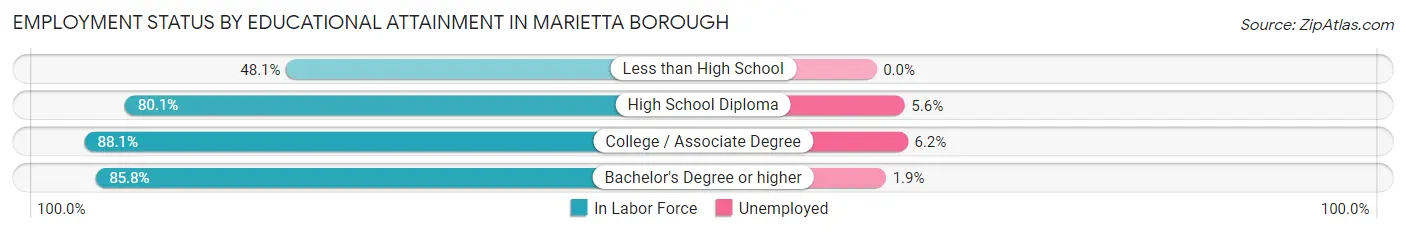
Employment Status by Educational Attainment in Marietta borough
According to labor force statistics for Marietta borough, 83.1% of individuals (1,252) out of the total population between 25 and 64 years of age (1,507) are in the labor force, with 4.6% or 58 of them being unemployed. The group with the highest labor force participation rate are those with the educational attainment of college / associate degree, with 88.1% or 420 individuals in the labor force. Within the labor force, individuals with college / associate degree education have the highest percentage of unemployment, with 6.2% or 26 of them being unemployed.
| Educational Attainment | In Labor Force | Unemployed |
| Less than High School | 26 (48.1%) | 0 (0.0%) |
| High School Diploma | 444 (80.1%) | 31 (5.6%) |
| College / Associate Degree | 420 (88.1%) | 30 (6.2%) |
| Bachelor's Degree or higher | 362 (85.8%) | 8 (1.9%) |
| Total | 1,252 (83.1%) | 69 (4.6%) |
Employment Occupations by Sex in Marietta borough
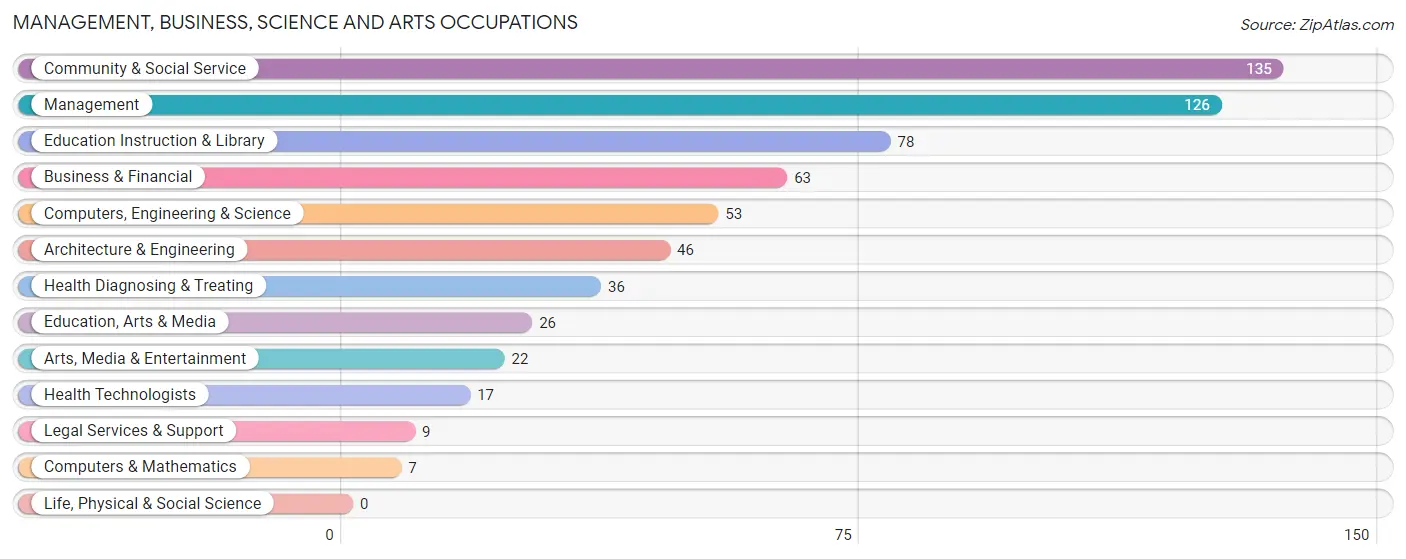
Management, Business, Science and Arts Occupations
The most common Management, Business, Science and Arts occupations in Marietta borough are Community & Social Service (135 | 9.8%), Management (126 | 9.1%), Education Instruction & Library (78 | 5.7%), Business & Financial (63 | 4.6%), and Computers, Engineering & Science (53 | 3.8%).
Management, Business, Science and Arts Occupations by Sex
Within the Management, Business, Science and Arts occupations in Marietta borough, the most male-oriented occupations are Computers & Mathematics (100.0%), Arts, Media & Entertainment (100.0%), and Computers, Engineering & Science (81.1%), while the most female-oriented occupations are Legal Services & Support (100.0%), Health Technologists (100.0%), and Health Diagnosing & Treating (80.6%).
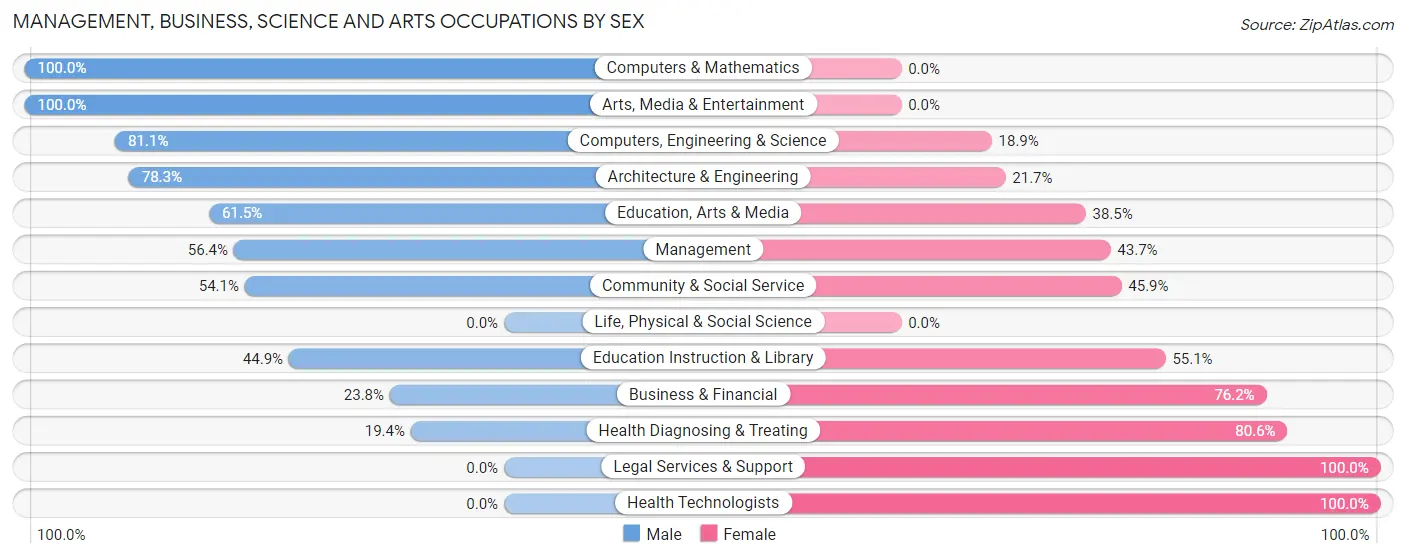
| Occupation | Male | Female |
| Management | 71 (56.4%) | 55 (43.6%) |
| Business & Financial | 15 (23.8%) | 48 (76.2%) |
| Computers, Engineering & Science | 43 (81.1%) | 10 (18.9%) |
| Computers & Mathematics | 7 (100.0%) | 0 (0.0%) |
| Architecture & Engineering | 36 (78.3%) | 10 (21.7%) |
| Life, Physical & Social Science | 0 (0.0%) | 0 (0.0%) |
| Community & Social Service | 73 (54.1%) | 62 (45.9%) |
| Education, Arts & Media | 16 (61.5%) | 10 (38.5%) |
| Legal Services & Support | 0 (0.0%) | 9 (100.0%) |
| Education Instruction & Library | 35 (44.9%) | 43 (55.1%) |
| Arts, Media & Entertainment | 22 (100.0%) | 0 (0.0%) |
| Health Diagnosing & Treating | 7 (19.4%) | 29 (80.6%) |
| Health Technologists | 0 (0.0%) | 17 (100.0%) |
| Total (Category) | 209 (50.6%) | 204 (49.4%) |
| Total (Overall) | 767 (55.6%) | 613 (44.4%) |
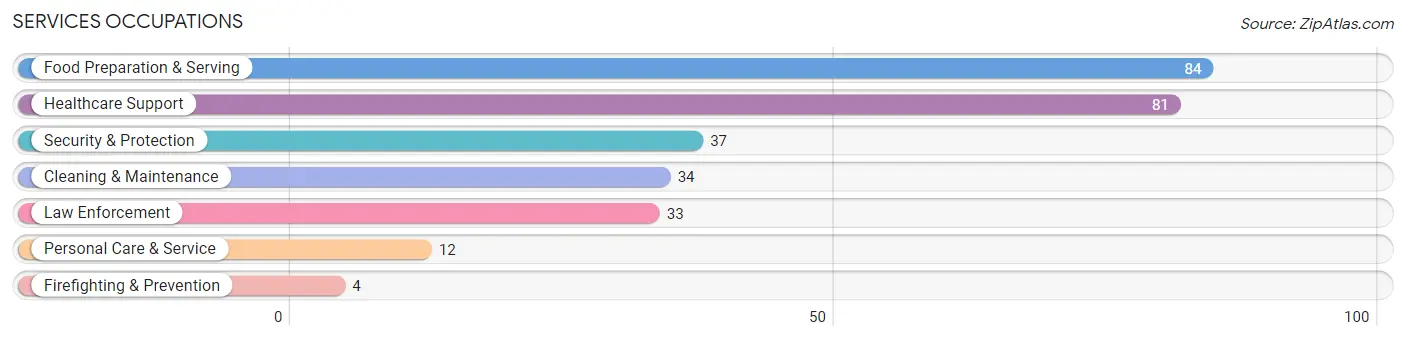
Services Occupations
The most common Services occupations in Marietta borough are Food Preparation & Serving (84 | 6.1%), Healthcare Support (81 | 5.9%), Security & Protection (37 | 2.7%), Cleaning & Maintenance (34 | 2.5%), and Law Enforcement (33 | 2.4%).
Services Occupations by Sex
Within the Services occupations in Marietta borough, the most male-oriented occupations are Firefighting & Prevention (100.0%), Cleaning & Maintenance (85.3%), and Food Preparation & Serving (59.5%), while the most female-oriented occupations are Personal Care & Service (100.0%), Healthcare Support (76.5%), and Law Enforcement (51.5%).
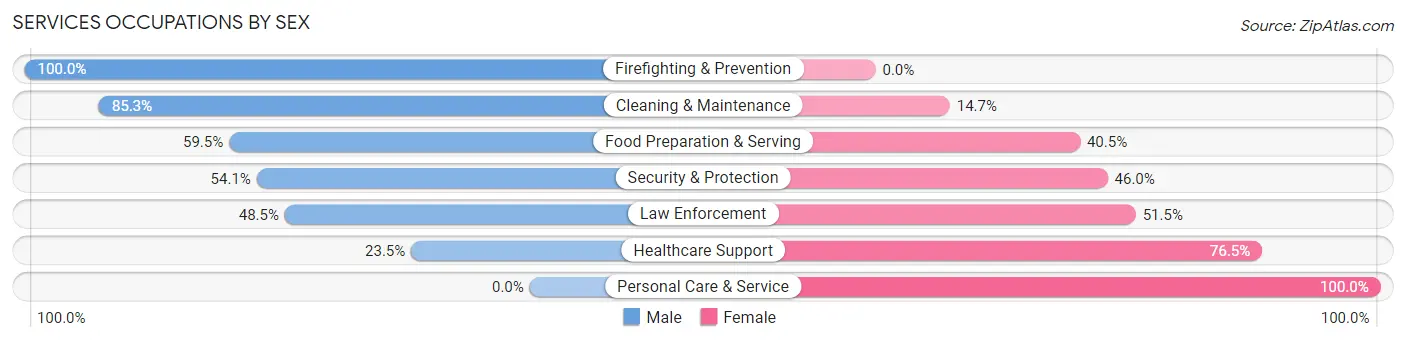
| Occupation | Male | Female |
| Healthcare Support | 19 (23.5%) | 62 (76.5%) |
| Security & Protection | 20 (54.0%) | 17 (46.0%) |
| Firefighting & Prevention | 4 (100.0%) | 0 (0.0%) |
| Law Enforcement | 16 (48.5%) | 17 (51.5%) |
| Food Preparation & Serving | 50 (59.5%) | 34 (40.5%) |
| Cleaning & Maintenance | 29 (85.3%) | 5 (14.7%) |
| Personal Care & Service | 0 (0.0%) | 12 (100.0%) |
| Total (Category) | 118 (47.6%) | 130 (52.4%) |
| Total (Overall) | 767 (55.6%) | 613 (44.4%) |
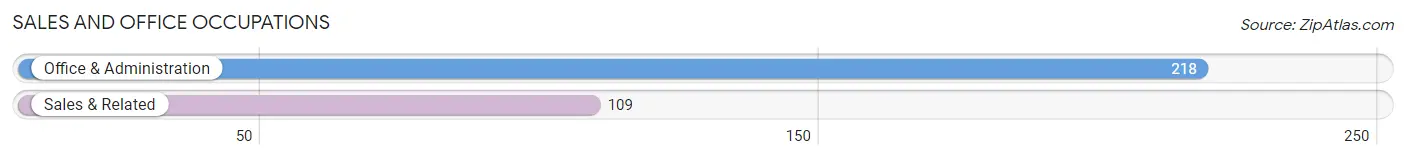
Sales and Office Occupations
The most common Sales and Office occupations in Marietta borough are Office & Administration (218 | 15.8%), and Sales & Related (109 | 7.9%).
Sales and Office Occupations by Sex
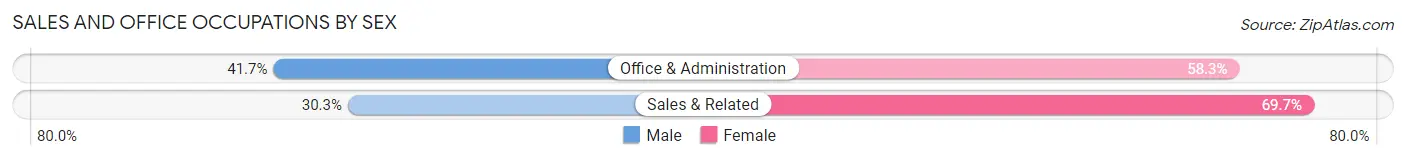
| Occupation | Male | Female |
| Sales & Related | 33 (30.3%) | 76 (69.7%) |
| Office & Administration | 91 (41.7%) | 127 (58.3%) |
| Total (Category) | 124 (37.9%) | 203 (62.1%) |
| Total (Overall) | 767 (55.6%) | 613 (44.4%) |
Natural Resources, Construction and Maintenance Occupations
The most common Natural Resources, Construction and Maintenance occupations in Marietta borough are Construction & Extraction (108 | 7.8%), and Installation, Maintenance & Repair (106 | 7.7%).
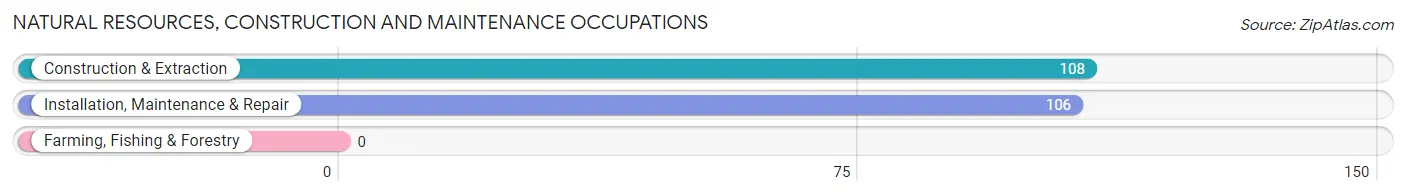
Natural Resources, Construction and Maintenance Occupations by Sex
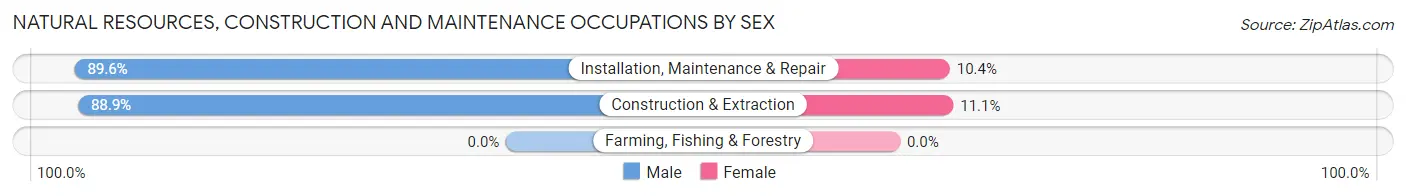
| Occupation | Male | Female |
| Farming, Fishing & Forestry | 0 (0.0%) | 0 (0.0%) |
| Construction & Extraction | 96 (88.9%) | 12 (11.1%) |
| Installation, Maintenance & Repair | 95 (89.6%) | 11 (10.4%) |
| Total (Category) | 191 (89.2%) | 23 (10.7%) |
| Total (Overall) | 767 (55.6%) | 613 (44.4%) |
Production, Transportation and Moving Occupations
The most common Production, Transportation and Moving occupations in Marietta borough are Production (85 | 6.2%), Material Moving (64 | 4.6%), and Transportation (29 | 2.1%).
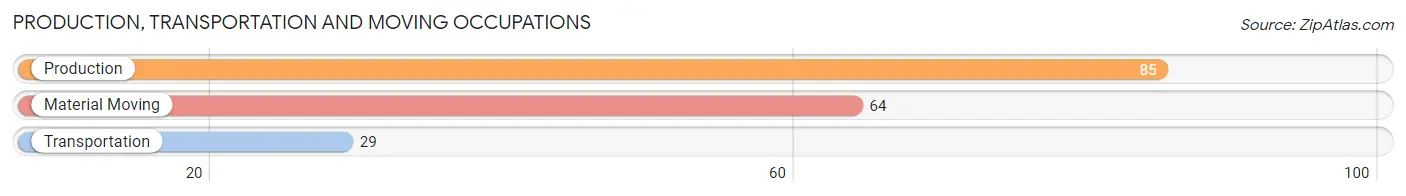
Production, Transportation and Moving Occupations by Sex
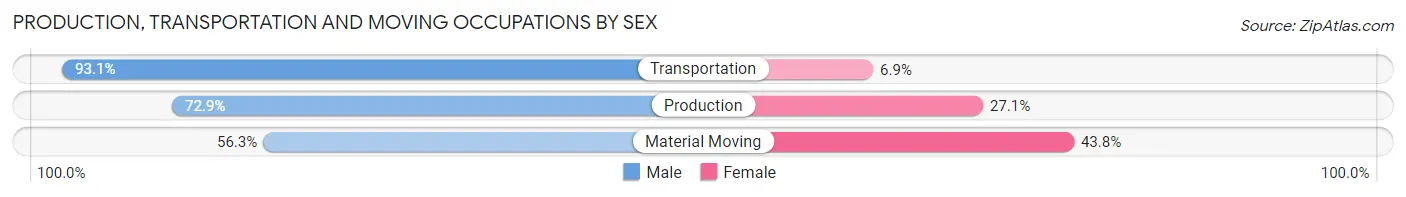
| Occupation | Male | Female |
| Production | 62 (72.9%) | 23 (27.1%) |
| Transportation | 27 (93.1%) | 2 (6.9%) |
| Material Moving | 36 (56.2%) | 28 (43.8%) |
| Total (Category) | 125 (70.2%) | 53 (29.8%) |
| Total (Overall) | 767 (55.6%) | 613 (44.4%) |
Employment Industries by Sex in Marietta borough
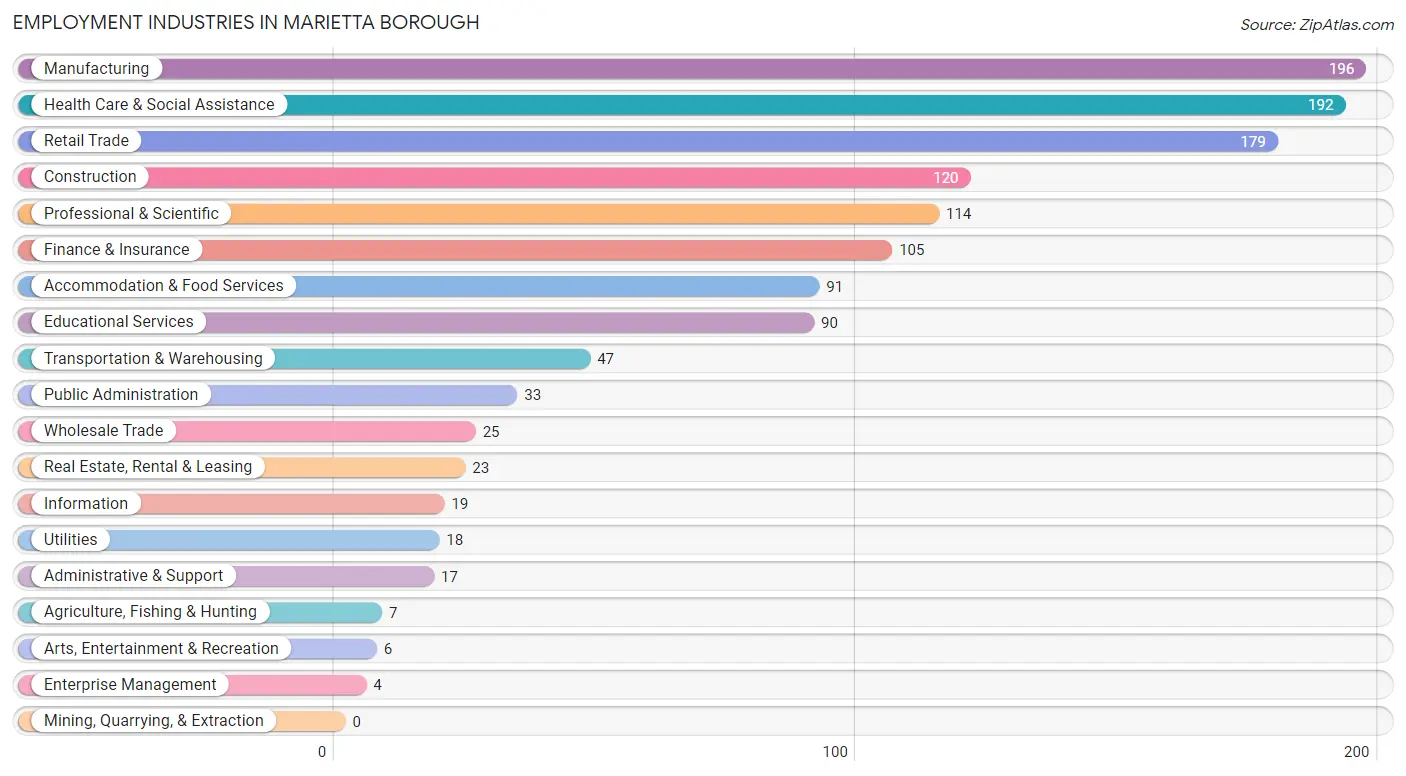
Employment Industries in Marietta borough
The major employment industries in Marietta borough include Manufacturing (196 | 14.2%), Health Care & Social Assistance (192 | 13.9%), Retail Trade (179 | 13.0%), Construction (120 | 8.7%), and Professional & Scientific (114 | 8.3%).
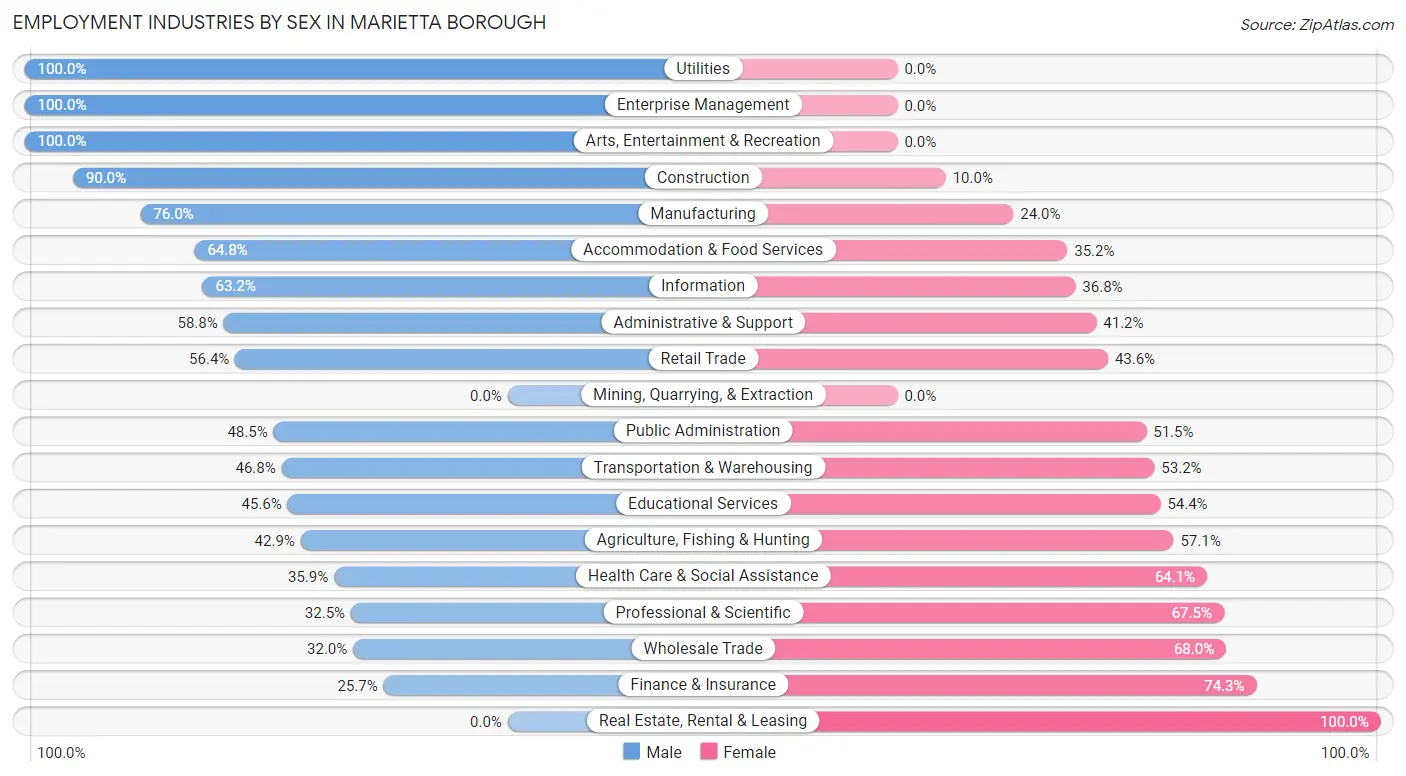
Employment Industries by Sex in Marietta borough
The Marietta borough industries that see more men than women are Utilities (100.0%), Enterprise Management (100.0%), and Arts, Entertainment & Recreation (100.0%), whereas the industries that tend to have a higher number of women are Real Estate, Rental & Leasing (100.0%), Finance & Insurance (74.3%), and Wholesale Trade (68.0%).
| Industry | Male | Female |
| Agriculture, Fishing & Hunting | 3 (42.9%) | 4 (57.1%) |
| Mining, Quarrying, & Extraction | 0 (0.0%) | 0 (0.0%) |
| Construction | 108 (90.0%) | 12 (10.0%) |
| Manufacturing | 149 (76.0%) | 47 (24.0%) |
| Wholesale Trade | 8 (32.0%) | 17 (68.0%) |
| Retail Trade | 101 (56.4%) | 78 (43.6%) |
| Transportation & Warehousing | 22 (46.8%) | 25 (53.2%) |
| Utilities | 18 (100.0%) | 0 (0.0%) |
| Information | 12 (63.2%) | 7 (36.8%) |
| Finance & Insurance | 27 (25.7%) | 78 (74.3%) |
| Real Estate, Rental & Leasing | 0 (0.0%) | 23 (100.0%) |
| Professional & Scientific | 37 (32.5%) | 77 (67.5%) |
| Enterprise Management | 4 (100.0%) | 0 (0.0%) |
| Administrative & Support | 10 (58.8%) | 7 (41.2%) |
| Educational Services | 41 (45.6%) | 49 (54.4%) |
| Health Care & Social Assistance | 69 (35.9%) | 123 (64.1%) |
| Arts, Entertainment & Recreation | 6 (100.0%) | 0 (0.0%) |
| Accommodation & Food Services | 59 (64.8%) | 32 (35.2%) |
| Public Administration | 16 (48.5%) | 17 (51.5%) |
| Total | 767 (55.6%) | 613 (44.4%) |
Education in Marietta borough
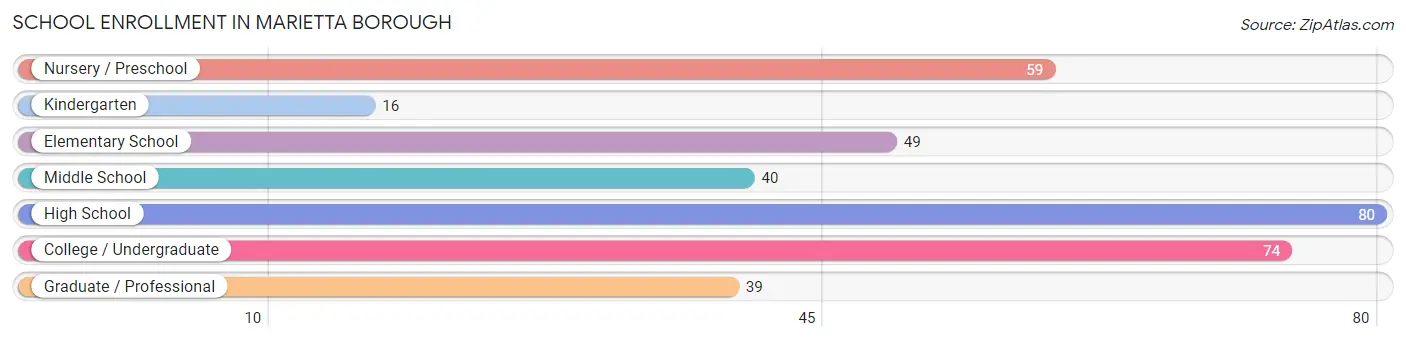
School Enrollment in Marietta borough
The most common levels of schooling among the 357 students in Marietta borough are high school (80 | 22.4%), college / undergraduate (74 | 20.7%), and nursery / preschool (59 | 16.5%).
| School Level | # Students | % Students |
| Nursery / Preschool | 59 | 16.5% |
| Kindergarten | 16 | 4.5% |
| Elementary School | 49 | 13.7% |
| Middle School | 40 | 11.2% |
| High School | 80 | 22.4% |
| College / Undergraduate | 74 | 20.7% |
| Graduate / Professional | 39 | 10.9% |
| Total | 357 | 100.0% |
School Enrollment by Age by Funding Source in Marietta borough
Out of a total of 357 students who are enrolled in schools in Marietta borough, 141 (39.5%) attend a private institution, while the remaining 216 (60.5%) are enrolled in public schools. The age group of 3 to 4 year olds has the highest likelihood of being enrolled in private schools, with 46 (86.8% in the age bracket) enrolled. Conversely, the age group of 15 to 17 year olds has the lowest likelihood of being enrolled in a private school, with 54 (100.0% in the age bracket) attending a public institution.
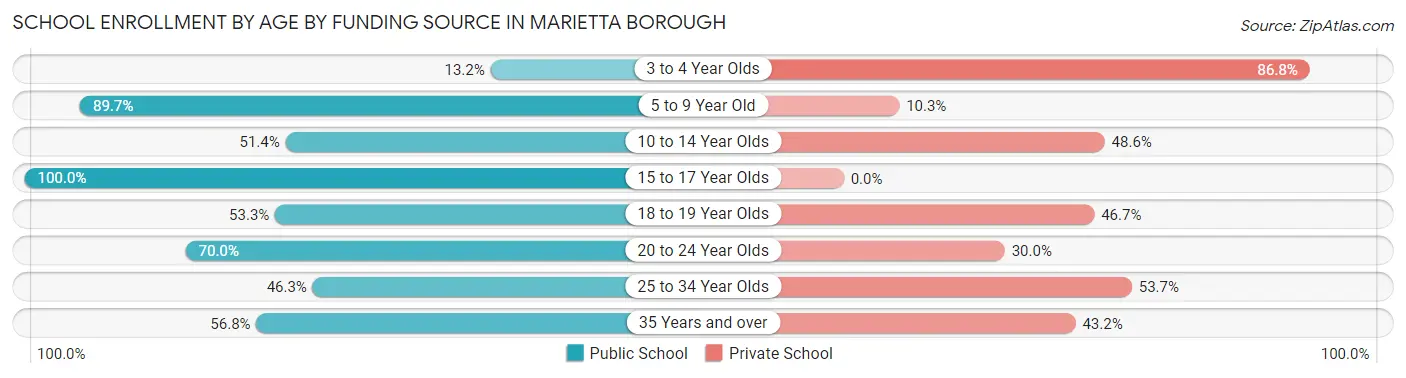
| Age Bracket | Public School | Private School |
| 3 to 4 Year Olds | 7 (13.2%) | 46 (86.8%) |
| 5 to 9 Year Old | 52 (89.7%) | 6 (10.3%) |
| 10 to 14 Year Olds | 37 (51.4%) | 35 (48.6%) |
| 15 to 17 Year Olds | 54 (100.0%) | 0 (0.0%) |
| 18 to 19 Year Olds | 8 (53.3%) | 7 (46.7%) |
| 20 to 24 Year Olds | 14 (70.0%) | 6 (30.0%) |
| 25 to 34 Year Olds | 19 (46.3%) | 22 (53.7%) |
| 35 Years and over | 25 (56.8%) | 19 (43.2%) |
| Total | 216 (60.5%) | 141 (39.5%) |
Educational Attainment by Field of Study in Marietta borough
Business (125 | 22.0%), education (68 | 12.0%), bio, nature & agricultural (53 | 9.3%), science & technology (50 | 8.8%), and engineering (49 | 8.6%) are the most common fields of study among 568 individuals in Marietta borough who have obtained a bachelor's degree or higher.
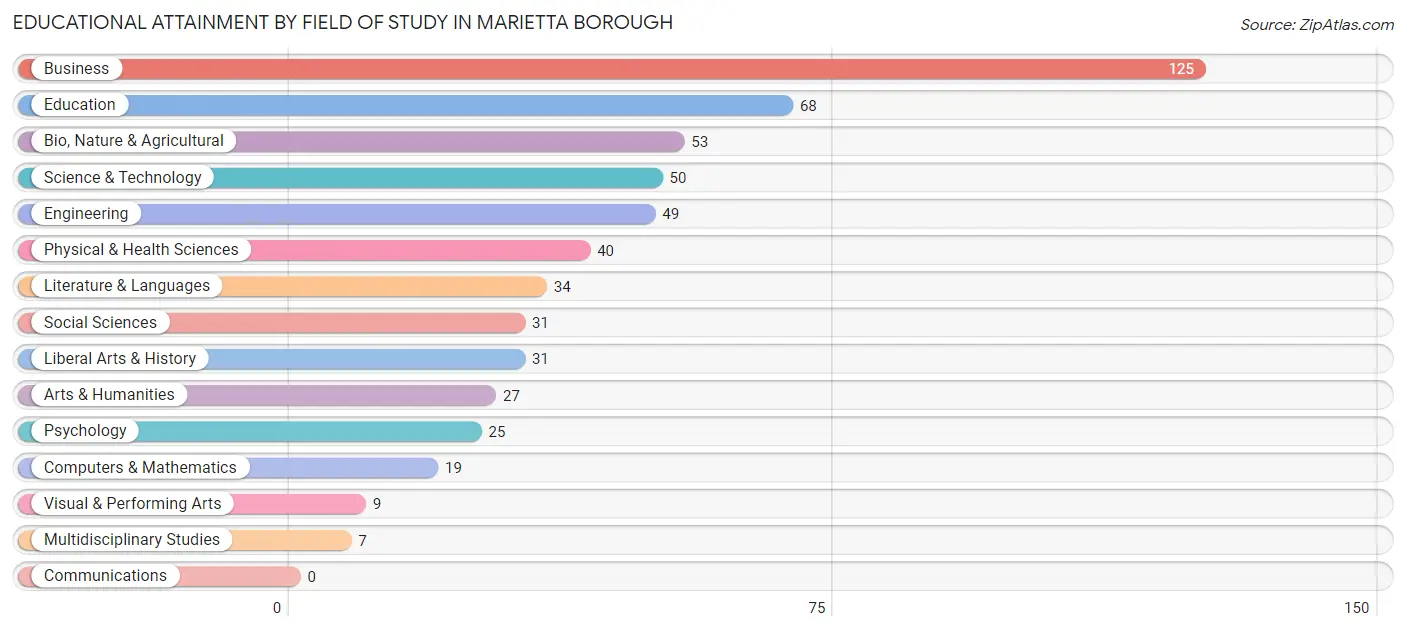
| Field of Study | # Graduates | % Graduates |
| Computers & Mathematics | 19 | 3.4% |
| Bio, Nature & Agricultural | 53 | 9.3% |
| Physical & Health Sciences | 40 | 7.0% |
| Psychology | 25 | 4.4% |
| Social Sciences | 31 | 5.5% |
| Engineering | 49 | 8.6% |
| Multidisciplinary Studies | 7 | 1.2% |
| Science & Technology | 50 | 8.8% |
| Business | 125 | 22.0% |
| Education | 68 | 12.0% |
| Literature & Languages | 34 | 6.0% |
| Liberal Arts & History | 31 | 5.5% |
| Visual & Performing Arts | 9 | 1.6% |
| Communications | 0 | 0.0% |
| Arts & Humanities | 27 | 4.8% |
| Total | 568 | 100.0% |
Transportation & Commute in Marietta borough
Vehicle Availability by Sex in Marietta borough
The most prevalent vehicle ownership categories in Marietta borough are males with 2 vehicles (300, accounting for 39.5%) and females with 2 vehicles (220, making up 48.9%).
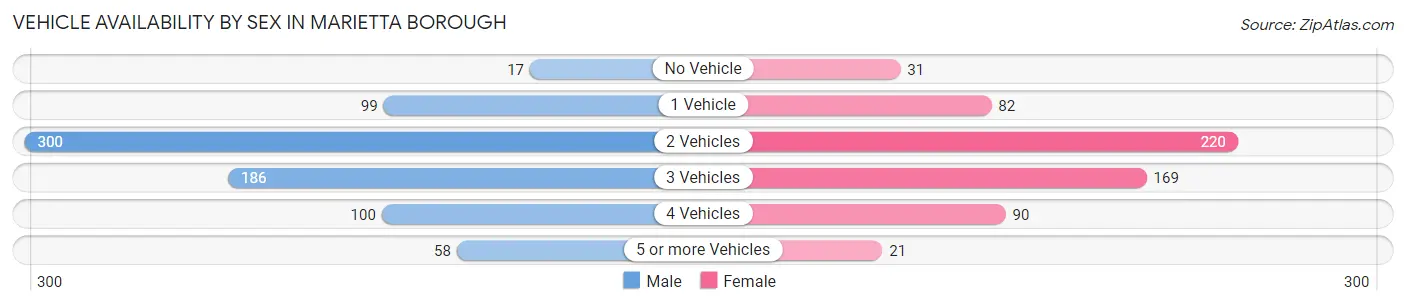
| Vehicles Available | Male | Female |
| No Vehicle | 17 (2.2%) | 31 (5.1%) |
| 1 Vehicle | 99 (13.0%) | 82 (13.4%) |
| 2 Vehicles | 300 (39.5%) | 220 (35.9%) |
| 3 Vehicles | 186 (24.5%) | 169 (27.6%) |
| 4 Vehicles | 100 (13.2%) | 90 (14.7%) |
| 5 or more Vehicles | 58 (7.6%) | 21 (3.4%) |
| Total | 760 (100.0%) | 613 (100.0%) |
Commute Time in Marietta borough
The most frequently occuring commute durations in Marietta borough are 20 to 24 minutes (269 commuters, 21.8%), 30 to 34 minutes (213 commuters, 17.3%), and 15 to 19 minutes (209 commuters, 17.0%).
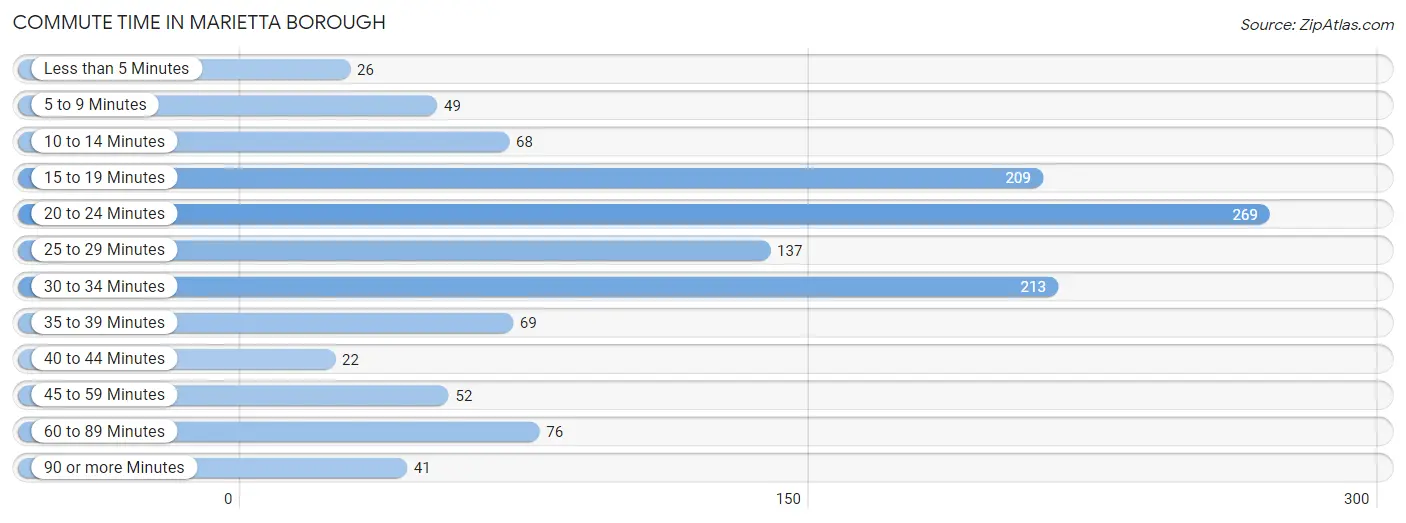
| Commute Time | # Commuters | % Commuters |
| Less than 5 Minutes | 26 | 2.1% |
| 5 to 9 Minutes | 49 | 4.0% |
| 10 to 14 Minutes | 68 | 5.5% |
| 15 to 19 Minutes | 209 | 17.0% |
| 20 to 24 Minutes | 269 | 21.8% |
| 25 to 29 Minutes | 137 | 11.1% |
| 30 to 34 Minutes | 213 | 17.3% |
| 35 to 39 Minutes | 69 | 5.6% |
| 40 to 44 Minutes | 22 | 1.8% |
| 45 to 59 Minutes | 52 | 4.2% |
| 60 to 89 Minutes | 76 | 6.2% |
| 90 or more Minutes | 41 | 3.3% |
Commute Time by Sex in Marietta borough
The most common commute times in Marietta borough are 20 to 24 minutes (142 commuters, 20.0%) for males and 20 to 24 minutes (127 commuters, 24.4%) for females.
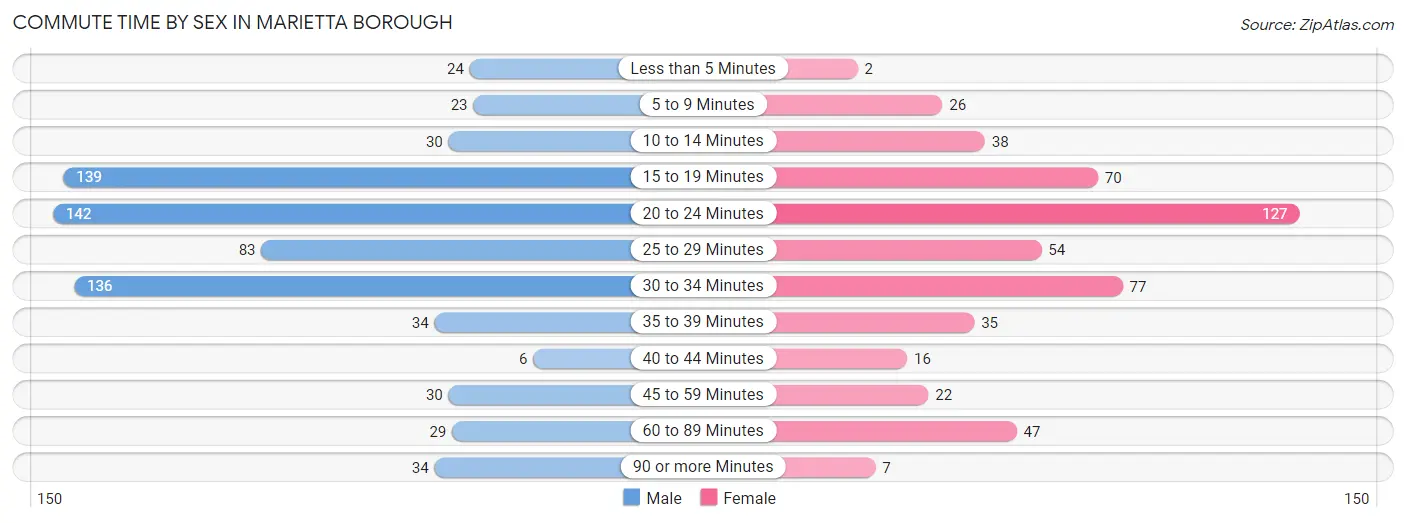
| Commute Time | Male | Female |
| Less than 5 Minutes | 24 (3.4%) | 2 (0.4%) |
| 5 to 9 Minutes | 23 (3.2%) | 26 (5.0%) |
| 10 to 14 Minutes | 30 (4.2%) | 38 (7.3%) |
| 15 to 19 Minutes | 139 (19.6%) | 70 (13.4%) |
| 20 to 24 Minutes | 142 (20.0%) | 127 (24.4%) |
| 25 to 29 Minutes | 83 (11.7%) | 54 (10.4%) |
| 30 to 34 Minutes | 136 (19.2%) | 77 (14.8%) |
| 35 to 39 Minutes | 34 (4.8%) | 35 (6.7%) |
| 40 to 44 Minutes | 6 (0.9%) | 16 (3.1%) |
| 45 to 59 Minutes | 30 (4.2%) | 22 (4.2%) |
| 60 to 89 Minutes | 29 (4.1%) | 47 (9.0%) |
| 90 or more Minutes | 34 (4.8%) | 7 (1.3%) |
Time of Departure to Work by Sex in Marietta borough
The most frequent times of departure to work in Marietta borough are 6:00 AM to 6:29 AM (104, 14.6%) for males and 12:00 PM to 3:59 PM (81, 15.5%) for females.
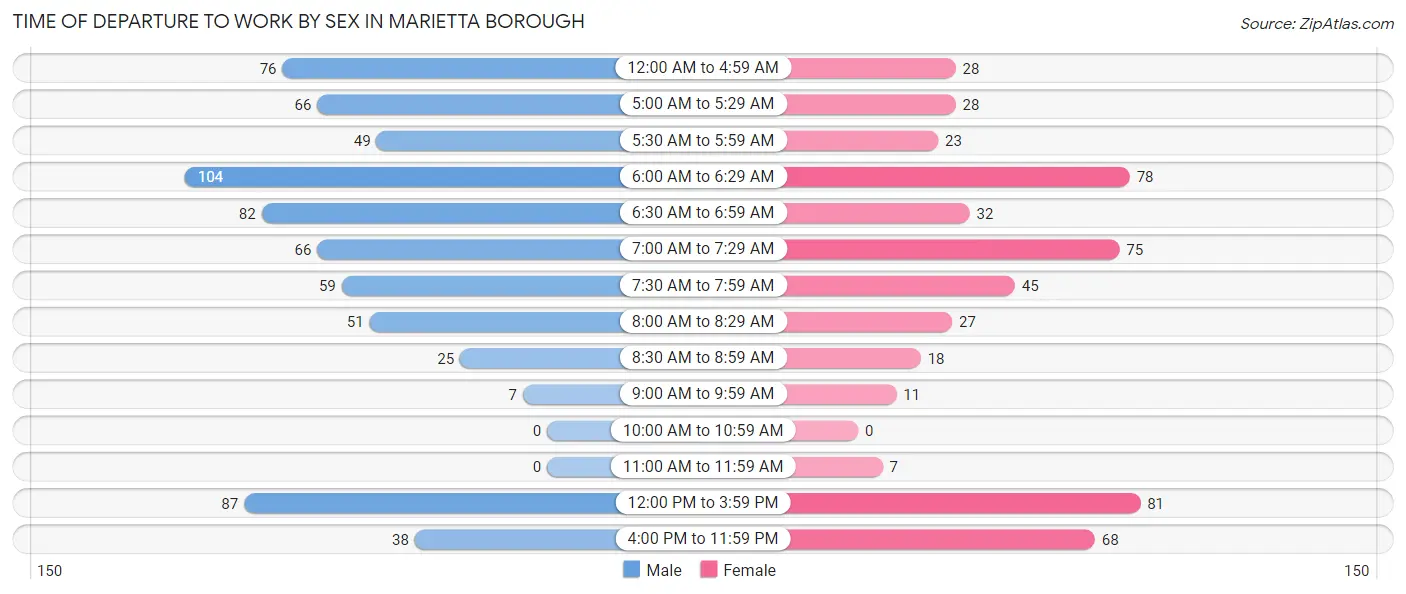
| Time of Departure | Male | Female |
| 12:00 AM to 4:59 AM | 76 (10.7%) | 28 (5.4%) |
| 5:00 AM to 5:29 AM | 66 (9.3%) | 28 (5.4%) |
| 5:30 AM to 5:59 AM | 49 (6.9%) | 23 (4.4%) |
| 6:00 AM to 6:29 AM | 104 (14.6%) | 78 (15.0%) |
| 6:30 AM to 6:59 AM | 82 (11.6%) | 32 (6.1%) |
| 7:00 AM to 7:29 AM | 66 (9.3%) | 75 (14.4%) |
| 7:30 AM to 7:59 AM | 59 (8.3%) | 45 (8.6%) |
| 8:00 AM to 8:29 AM | 51 (7.2%) | 27 (5.2%) |
| 8:30 AM to 8:59 AM | 25 (3.5%) | 18 (3.5%) |
| 9:00 AM to 9:59 AM | 7 (1.0%) | 11 (2.1%) |
| 10:00 AM to 10:59 AM | 0 (0.0%) | 0 (0.0%) |
| 11:00 AM to 11:59 AM | 0 (0.0%) | 7 (1.3%) |
| 12:00 PM to 3:59 PM | 87 (12.2%) | 81 (15.5%) |
| 4:00 PM to 11:59 PM | 38 (5.3%) | 68 (13.1%) |
| Total | 710 (100.0%) | 521 (100.0%) |
Housing Occupancy in Marietta borough
Occupancy by Ownership in Marietta borough
Of the total 1,316 dwellings in Marietta borough, owner-occupied units account for 910 (69.2%), while renter-occupied units make up 406 (30.8%).
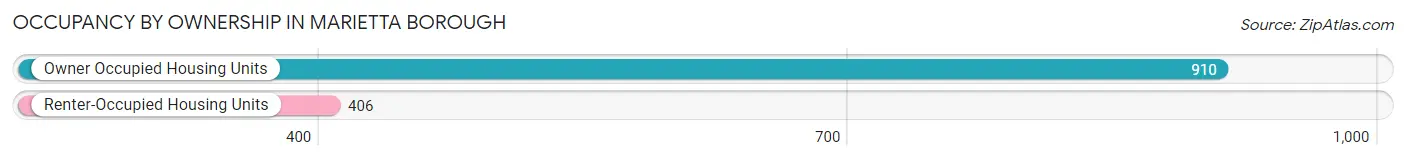
| Occupancy | # Housing Units | % Housing Units |
| Owner Occupied Housing Units | 910 | 69.2% |
| Renter-Occupied Housing Units | 406 | 30.8% |
| Total Occupied Housing Units | 1,316 | 100.0% |
Occupancy by Household Size in Marietta borough
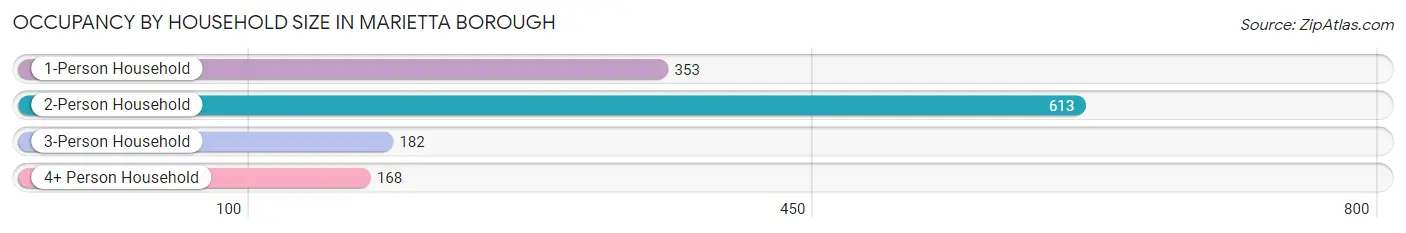
| Household Size | # Housing Units | % Housing Units |
| 1-Person Household | 353 | 26.8% |
| 2-Person Household | 613 | 46.6% |
| 3-Person Household | 182 | 13.8% |
| 4+ Person Household | 168 | 12.8% |
| Total Housing Units | 1,316 | 100.0% |
Occupancy by Ownership by Household Size in Marietta borough
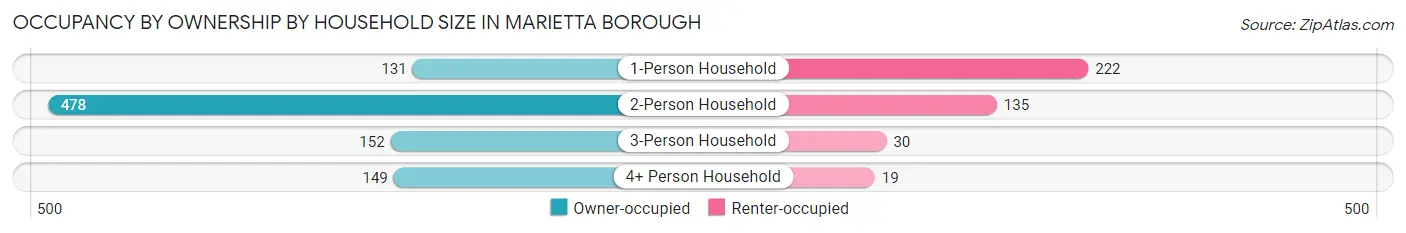
| Household Size | Owner-occupied | Renter-occupied |
| 1-Person Household | 131 (37.1%) | 222 (62.9%) |
| 2-Person Household | 478 (78.0%) | 135 (22.0%) |
| 3-Person Household | 152 (83.5%) | 30 (16.5%) |
| 4+ Person Household | 149 (88.7%) | 19 (11.3%) |
| Total Housing Units | 910 (69.2%) | 406 (30.8%) |
Occupancy by Educational Attainment in Marietta borough
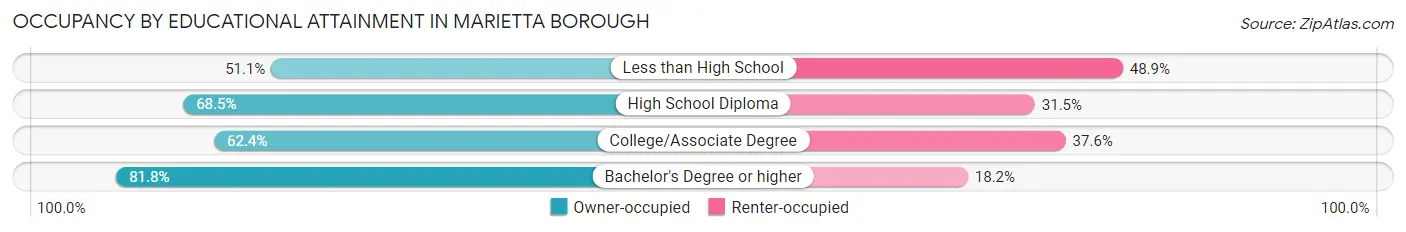
| Household Size | Owner-occupied | Renter-occupied |
| Less than High School | 23 (51.1%) | 22 (48.9%) |
| High School Diploma | 451 (68.5%) | 207 (31.5%) |
| College/Associate Degree | 211 (62.4%) | 127 (37.6%) |
| Bachelor's Degree or higher | 225 (81.8%) | 50 (18.2%) |
Occupancy by Age of Householder in Marietta borough
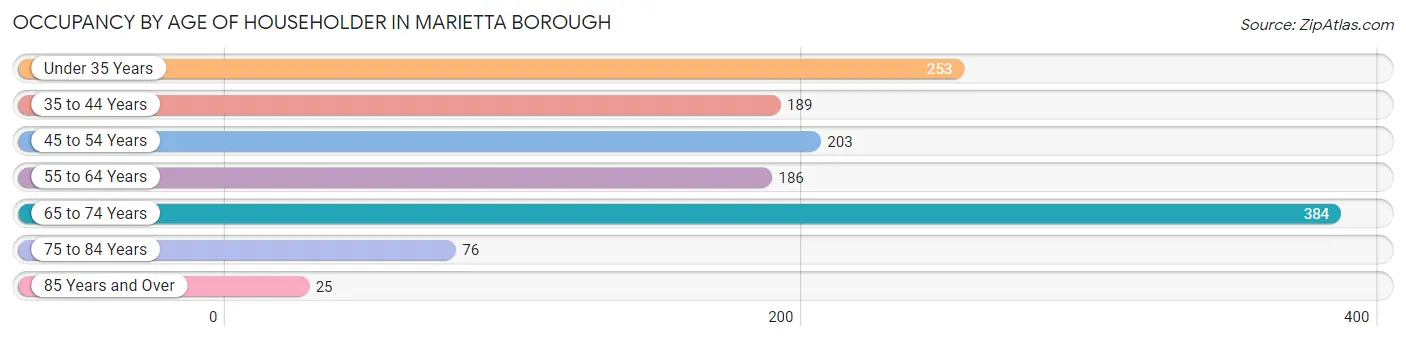
| Age Bracket | # Households | % Households |
| Under 35 Years | 253 | 19.2% |
| 35 to 44 Years | 189 | 14.4% |
| 45 to 54 Years | 203 | 15.4% |
| 55 to 64 Years | 186 | 14.1% |
| 65 to 74 Years | 384 | 29.2% |
| 75 to 84 Years | 76 | 5.8% |
| 85 Years and Over | 25 | 1.9% |
| Total | 1,316 | 100.0% |
Housing Finances in Marietta borough
Median Income by Occupancy in Marietta borough
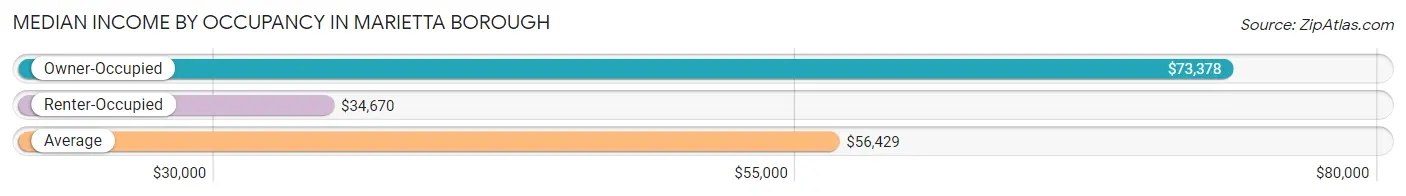
| Occupancy Type | # Households | Median Income |
| Owner-Occupied | 910 (69.2%) | $73,378 |
| Renter-Occupied | 406 (30.8%) | $34,670 |
| Average | 1,316 (100.0%) | $56,429 |
Occupancy by Householder Income Bracket in Marietta borough
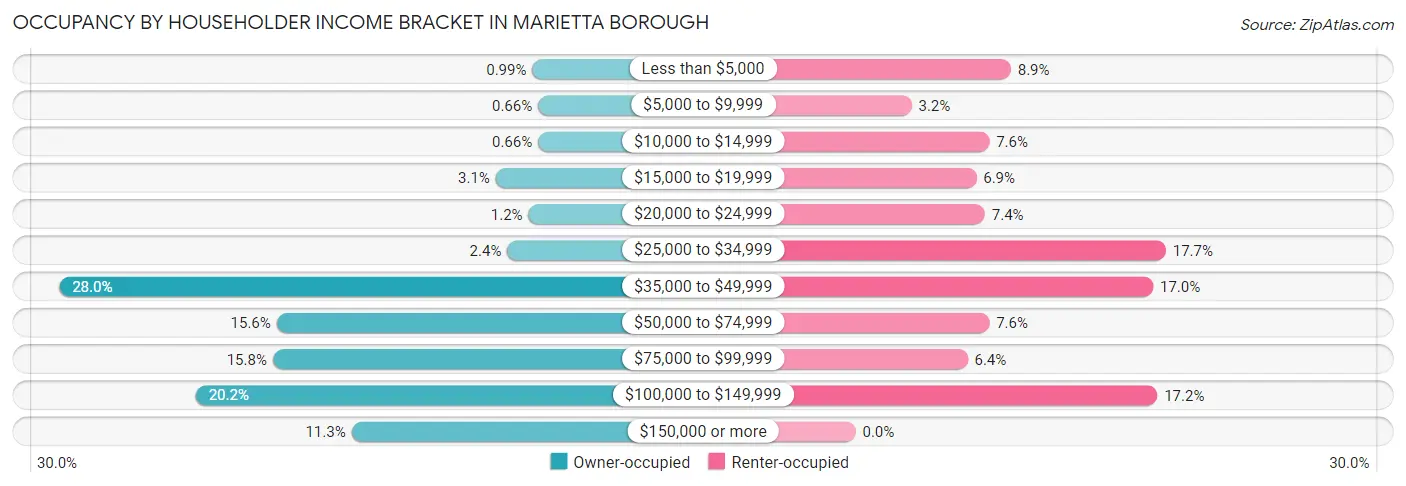
| Income Bracket | Owner-occupied | Renter-occupied |
| Less than $5,000 | 9 (1.0%) | 36 (8.9%) |
| $5,000 to $9,999 | 6 (0.7%) | 13 (3.2%) |
| $10,000 to $14,999 | 6 (0.7%) | 31 (7.6%) |
| $15,000 to $19,999 | 28 (3.1%) | 28 (6.9%) |
| $20,000 to $24,999 | 11 (1.2%) | 30 (7.4%) |
| $25,000 to $34,999 | 22 (2.4%) | 72 (17.7%) |
| $35,000 to $49,999 | 255 (28.0%) | 69 (17.0%) |
| $50,000 to $74,999 | 142 (15.6%) | 31 (7.6%) |
| $75,000 to $99,999 | 144 (15.8%) | 26 (6.4%) |
| $100,000 to $149,999 | 184 (20.2%) | 70 (17.2%) |
| $150,000 or more | 103 (11.3%) | 0 (0.0%) |
| Total | 910 (100.0%) | 406 (100.0%) |
Monthly Housing Cost Tiers in Marietta borough
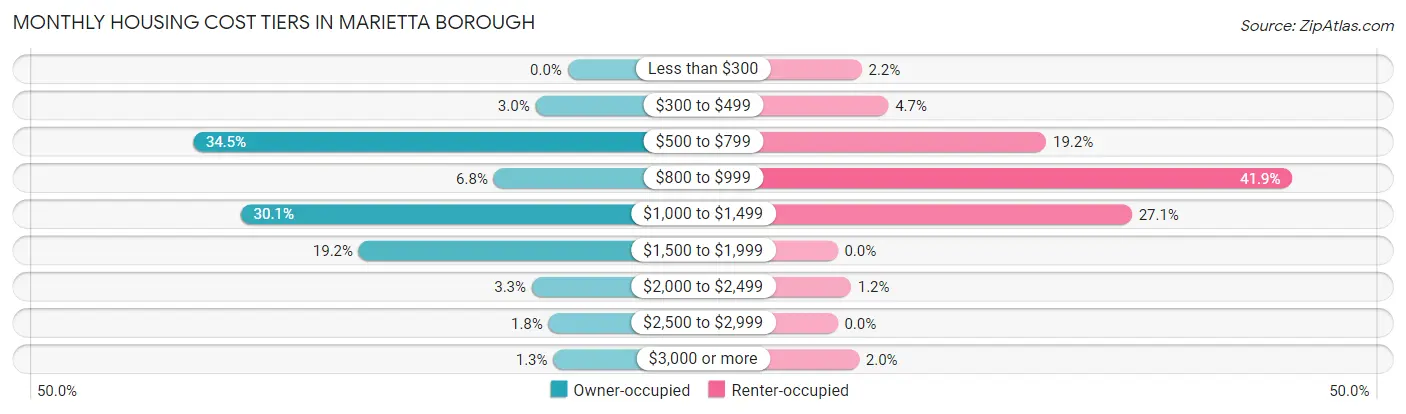
| Monthly Cost | Owner-occupied | Renter-occupied |
| Less than $300 | 0 (0.0%) | 9 (2.2%) |
| $300 to $499 | 27 (3.0%) | 19 (4.7%) |
| $500 to $799 | 314 (34.5%) | 78 (19.2%) |
| $800 to $999 | 62 (6.8%) | 170 (41.9%) |
| $1,000 to $1,499 | 274 (30.1%) | 110 (27.1%) |
| $1,500 to $1,999 | 175 (19.2%) | 0 (0.0%) |
| $2,000 to $2,499 | 30 (3.3%) | 5 (1.2%) |
| $2,500 to $2,999 | 16 (1.8%) | 0 (0.0%) |
| $3,000 or more | 12 (1.3%) | 8 (2.0%) |
| Total | 910 (100.0%) | 406 (100.0%) |
Physical Housing Characteristics in Marietta borough
Housing Structures in Marietta borough
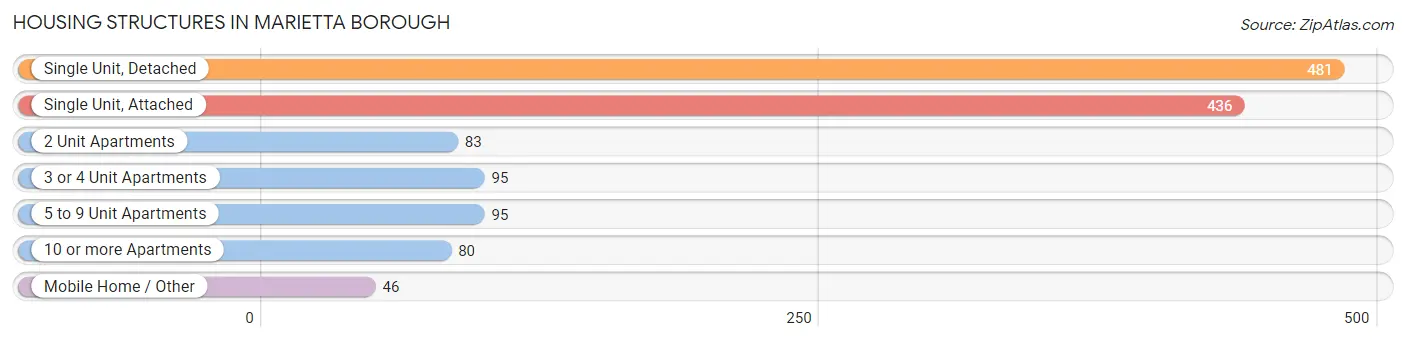
| Structure Type | # Housing Units | % Housing Units |
| Single Unit, Detached | 481 | 36.5% |
| Single Unit, Attached | 436 | 33.1% |
| 2 Unit Apartments | 83 | 6.3% |
| 3 or 4 Unit Apartments | 95 | 7.2% |
| 5 to 9 Unit Apartments | 95 | 7.2% |
| 10 or more Apartments | 80 | 6.1% |
| Mobile Home / Other | 46 | 3.5% |
| Total | 1,316 | 100.0% |
Housing Structures by Occupancy in Marietta borough
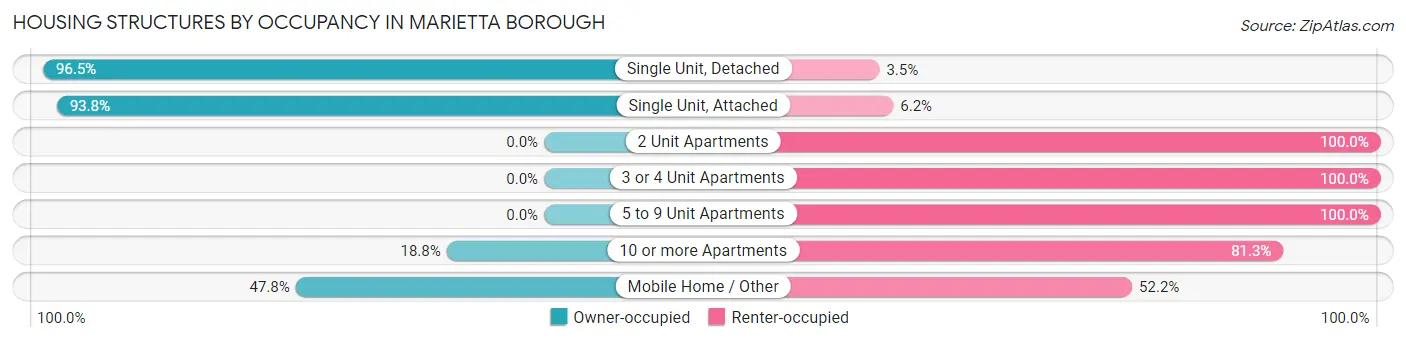
| Structure Type | Owner-occupied | Renter-occupied |
| Single Unit, Detached | 464 (96.5%) | 17 (3.5%) |
| Single Unit, Attached | 409 (93.8%) | 27 (6.2%) |
| 2 Unit Apartments | 0 (0.0%) | 83 (100.0%) |
| 3 or 4 Unit Apartments | 0 (0.0%) | 95 (100.0%) |
| 5 to 9 Unit Apartments | 0 (0.0%) | 95 (100.0%) |
| 10 or more Apartments | 15 (18.8%) | 65 (81.2%) |
| Mobile Home / Other | 22 (47.8%) | 24 (52.2%) |
| Total | 910 (69.2%) | 406 (30.8%) |
Housing Structures by Number of Rooms in Marietta borough
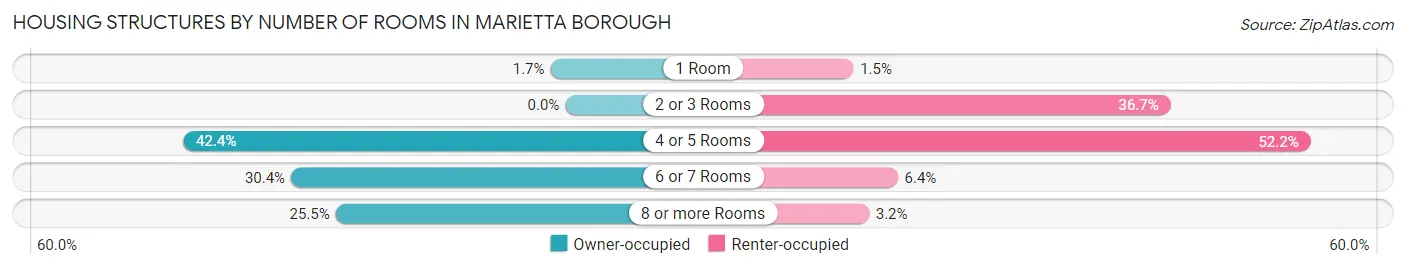
| Number of Rooms | Owner-occupied | Renter-occupied |
| 1 Room | 15 (1.7%) | 6 (1.5%) |
| 2 or 3 Rooms | 0 (0.0%) | 149 (36.7%) |
| 4 or 5 Rooms | 386 (42.4%) | 212 (52.2%) |
| 6 or 7 Rooms | 277 (30.4%) | 26 (6.4%) |
| 8 or more Rooms | 232 (25.5%) | 13 (3.2%) |
| Total | 910 (100.0%) | 406 (100.0%) |
Housing Structure by Heating Type in Marietta borough
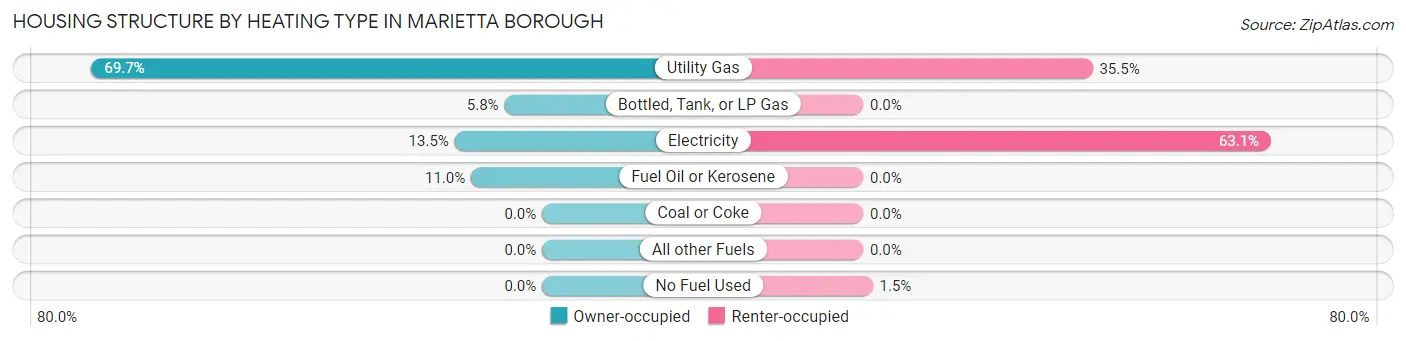
| Heating Type | Owner-occupied | Renter-occupied |
| Utility Gas | 634 (69.7%) | 144 (35.5%) |
| Bottled, Tank, or LP Gas | 53 (5.8%) | 0 (0.0%) |
| Electricity | 123 (13.5%) | 256 (63.0%) |
| Fuel Oil or Kerosene | 100 (11.0%) | 0 (0.0%) |
| Coal or Coke | 0 (0.0%) | 0 (0.0%) |
| All other Fuels | 0 (0.0%) | 0 (0.0%) |
| No Fuel Used | 0 (0.0%) | 6 (1.5%) |
| Total | 910 (100.0%) | 406 (100.0%) |
Household Vehicle Usage in Marietta borough
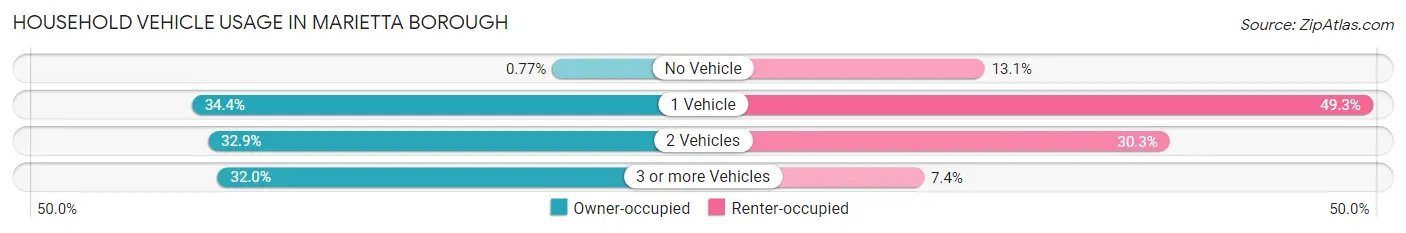
| Vehicles per Household | Owner-occupied | Renter-occupied |
| No Vehicle | 7 (0.8%) | 53 (13.1%) |
| 1 Vehicle | 313 (34.4%) | 200 (49.3%) |
| 2 Vehicles | 299 (32.9%) | 123 (30.3%) |
| 3 or more Vehicles | 291 (32.0%) | 30 (7.4%) |
| Total | 910 (100.0%) | 406 (100.0%) |
Real Estate & Mortgages in Marietta borough
Real Estate and Mortgage Overview in Marietta borough
| Characteristic | Without Mortgage | With Mortgage |
| Housing Units | 396 | 514 |
| Median Property Value | $219,400 | $171,900 |
| Median Household Income | $37,126 | $75 |
| Monthly Housing Costs | $589 | $12 |
| Real Estate Taxes | $3,619 | $0 |
Property Value by Mortgage Status in Marietta borough
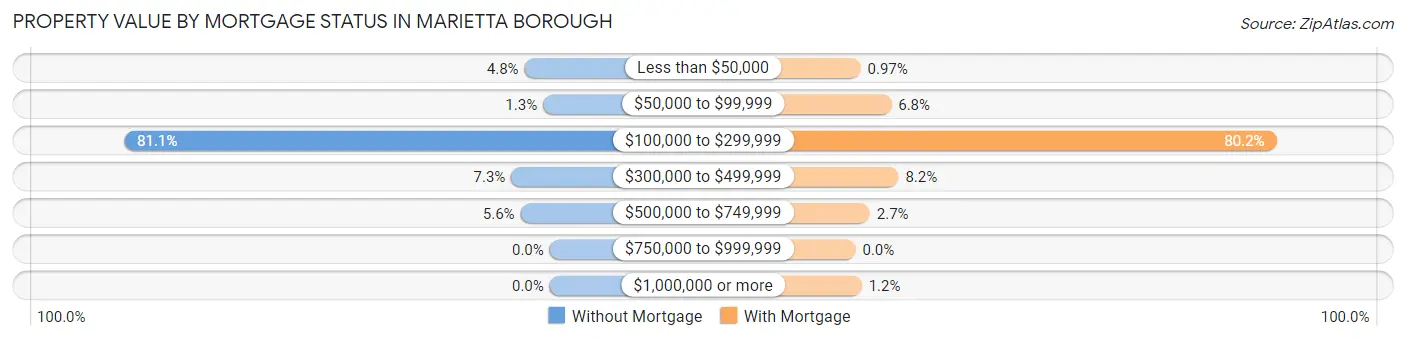
| Property Value | Without Mortgage | With Mortgage |
| Less than $50,000 | 19 (4.8%) | 5 (1.0%) |
| $50,000 to $99,999 | 5 (1.3%) | 35 (6.8%) |
| $100,000 to $299,999 | 321 (81.1%) | 412 (80.2%) |
| $300,000 to $499,999 | 29 (7.3%) | 42 (8.2%) |
| $500,000 to $749,999 | 22 (5.6%) | 14 (2.7%) |
| $750,000 to $999,999 | 0 (0.0%) | 0 (0.0%) |
| $1,000,000 or more | 0 (0.0%) | 6 (1.2%) |
| Total | 396 (100.0%) | 514 (100.0%) |
Household Income by Mortgage Status in Marietta borough
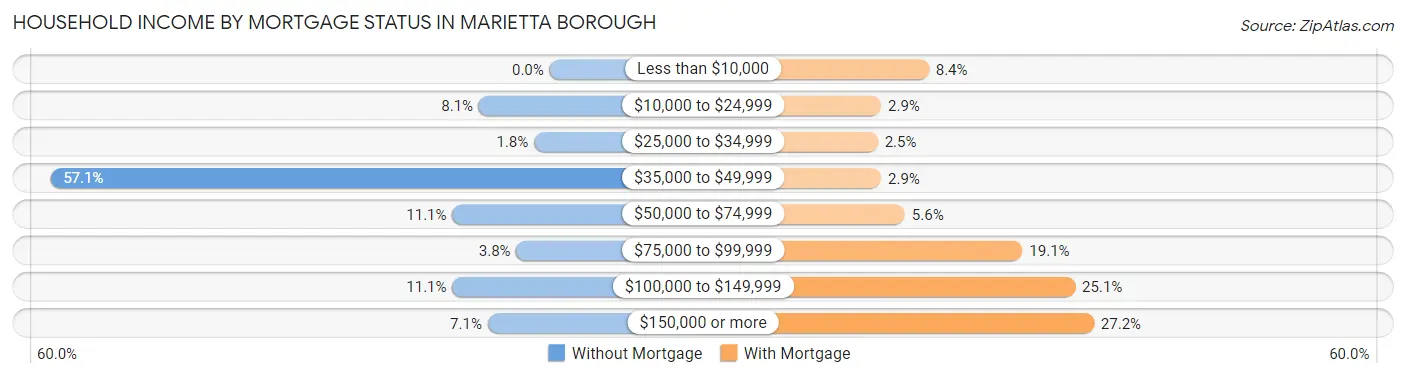
| Household Income | Without Mortgage | With Mortgage |
| Less than $10,000 | 0 (0.0%) | 43 (8.4%) |
| $10,000 to $24,999 | 32 (8.1%) | 15 (2.9%) |
| $25,000 to $34,999 | 7 (1.8%) | 13 (2.5%) |
| $35,000 to $49,999 | 226 (57.1%) | 15 (2.9%) |
| $50,000 to $74,999 | 44 (11.1%) | 29 (5.6%) |
| $75,000 to $99,999 | 15 (3.8%) | 98 (19.1%) |
| $100,000 to $149,999 | 44 (11.1%) | 129 (25.1%) |
| $150,000 or more | 28 (7.1%) | 140 (27.2%) |
| Total | 396 (100.0%) | 514 (100.0%) |
Property Value to Household Income Ratio in Marietta borough
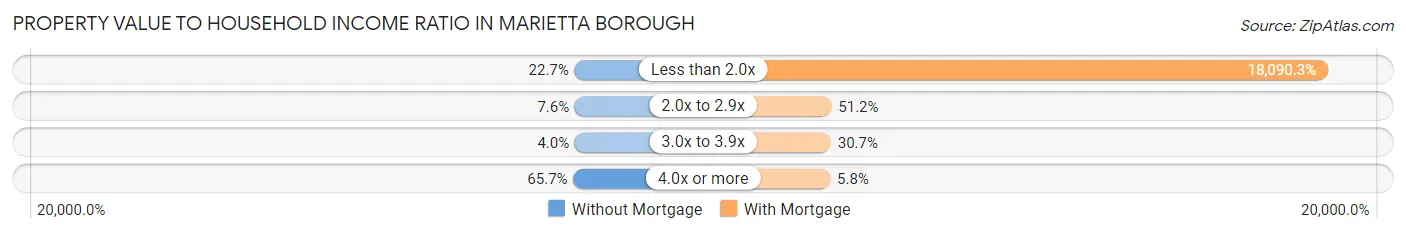
| Value-to-Income Ratio | Without Mortgage | With Mortgage |
| Less than 2.0x | 90 (22.7%) | 92,984 (18,090.3%) |
| 2.0x to 2.9x | 30 (7.6%) | 263 (51.2%) |
| 3.0x to 3.9x | 16 (4.0%) | 158 (30.7%) |
| 4.0x or more | 260 (65.7%) | 30 (5.8%) |
| Total | 396 (100.0%) | 514 (100.0%) |
Real Estate Taxes by Mortgage Status in Marietta borough
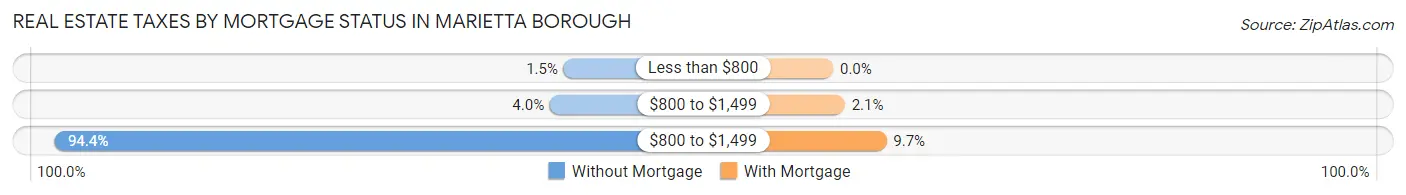
| Property Taxes | Without Mortgage | With Mortgage |
| Less than $800 | 6 (1.5%) | 0 (0.0%) |
| $800 to $1,499 | 16 (4.0%) | 11 (2.1%) |
| $800 to $1,499 | 374 (94.4%) | 50 (9.7%) |
| Total | 396 (100.0%) | 514 (100.0%) |
Health & Disability in Marietta borough
Health Insurance Coverage by Age in Marietta borough
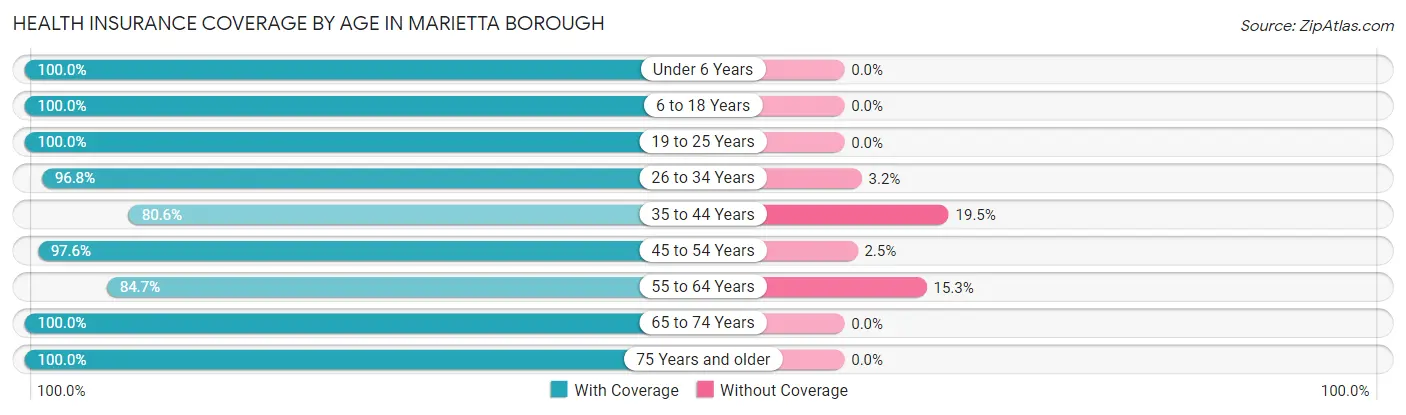
| Age Bracket | With Coverage | Without Coverage |
| Under 6 Years | 192 (100.0%) | 0 (0.0%) |
| 6 to 18 Years | 217 (100.0%) | 0 (0.0%) |
| 19 to 25 Years | 177 (100.0%) | 0 (0.0%) |
| 26 to 34 Years | 390 (96.8%) | 13 (3.2%) |
| 35 to 44 Years | 294 (80.5%) | 71 (19.5%) |
| 45 to 54 Years | 359 (97.6%) | 9 (2.5%) |
| 55 to 64 Years | 287 (84.7%) | 52 (15.3%) |
| 65 to 74 Years | 547 (100.0%) | 0 (0.0%) |
| 75 Years and older | 161 (100.0%) | 0 (0.0%) |
| Total | 2,624 (94.8%) | 145 (5.2%) |
Health Insurance Coverage by Citizenship Status in Marietta borough
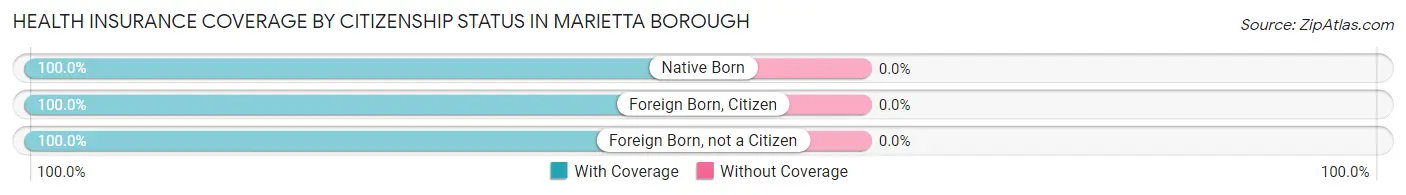
| Citizenship Status | With Coverage | Without Coverage |
| Native Born | 192 (100.0%) | 0 (0.0%) |
| Foreign Born, Citizen | 217 (100.0%) | 0 (0.0%) |
| Foreign Born, not a Citizen | 177 (100.0%) | 0 (0.0%) |
Health Insurance Coverage by Household Income in Marietta borough
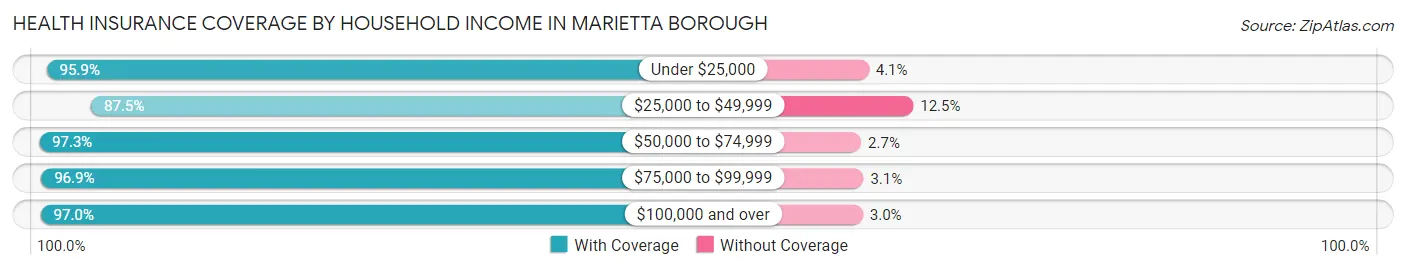
| Household Income | With Coverage | Without Coverage |
| Under $25,000 | 279 (95.9%) | 12 (4.1%) |
| $25,000 to $49,999 | 548 (87.5%) | 78 (12.5%) |
| $50,000 to $74,999 | 362 (97.3%) | 10 (2.7%) |
| $75,000 to $99,999 | 403 (96.9%) | 13 (3.1%) |
| $100,000 and over | 1,032 (97.0%) | 32 (3.0%) |
Public vs Private Health Insurance Coverage by Age in Marietta borough
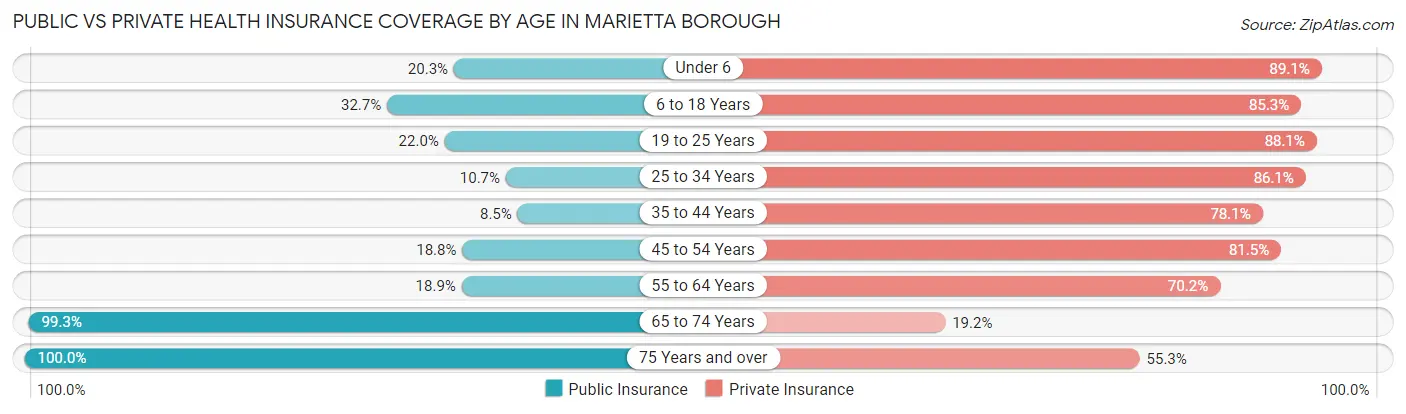
| Age Bracket | Public Insurance | Private Insurance |
| Under 6 | 39 (20.3%) | 171 (89.1%) |
| 6 to 18 Years | 71 (32.7%) | 185 (85.3%) |
| 19 to 25 Years | 39 (22.0%) | 156 (88.1%) |
| 25 to 34 Years | 43 (10.7%) | 347 (86.1%) |
| 35 to 44 Years | 31 (8.5%) | 285 (78.1%) |
| 45 to 54 Years | 69 (18.8%) | 300 (81.5%) |
| 55 to 64 Years | 64 (18.9%) | 238 (70.2%) |
| 65 to 74 Years | 543 (99.3%) | 105 (19.2%) |
| 75 Years and over | 161 (100.0%) | 89 (55.3%) |
| Total | 1,060 (38.3%) | 1,876 (67.7%) |
Disability Status by Sex by Age in Marietta borough
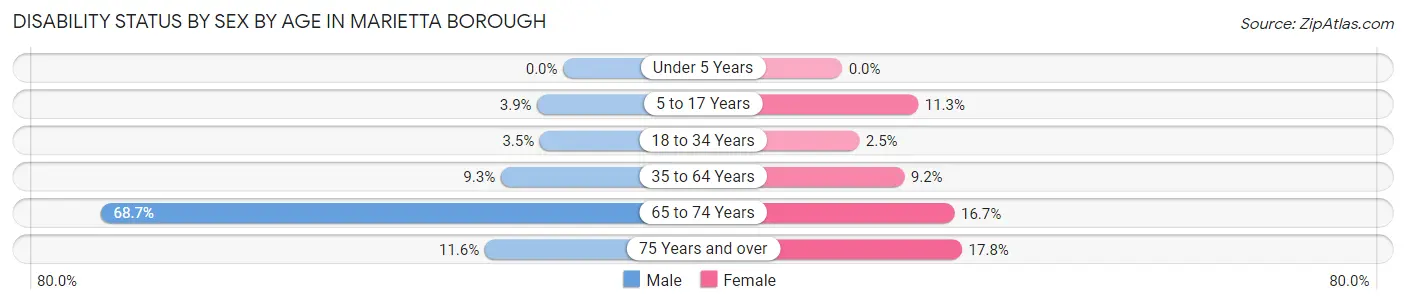
| Age Bracket | Male | Female |
| Under 5 Years | 0 (0.0%) | 0 (0.0%) |
| 5 to 17 Years | 6 (3.8%) | 7 (11.3%) |
| 18 to 34 Years | 11 (3.5%) | 7 (2.5%) |
| 35 to 64 Years | 55 (9.3%) | 44 (9.2%) |
| 65 to 74 Years | 248 (68.7%) | 31 (16.7%) |
| 75 Years and over | 5 (11.6%) | 21 (17.8%) |
Disability Class by Sex by Age in Marietta borough
Disability Class: Hearing Difficulty
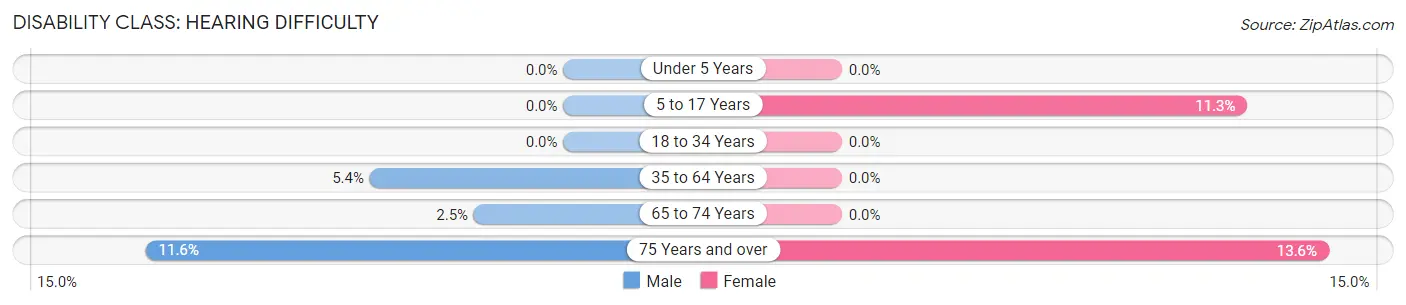
| Age Bracket | Male | Female |
| Under 5 Years | 0 (0.0%) | 0 (0.0%) |
| 5 to 17 Years | 0 (0.0%) | 7 (11.3%) |
| 18 to 34 Years | 0 (0.0%) | 0 (0.0%) |
| 35 to 64 Years | 32 (5.4%) | 0 (0.0%) |
| 65 to 74 Years | 9 (2.5%) | 0 (0.0%) |
| 75 Years and over | 5 (11.6%) | 16 (13.6%) |
Disability Class: Vision Difficulty
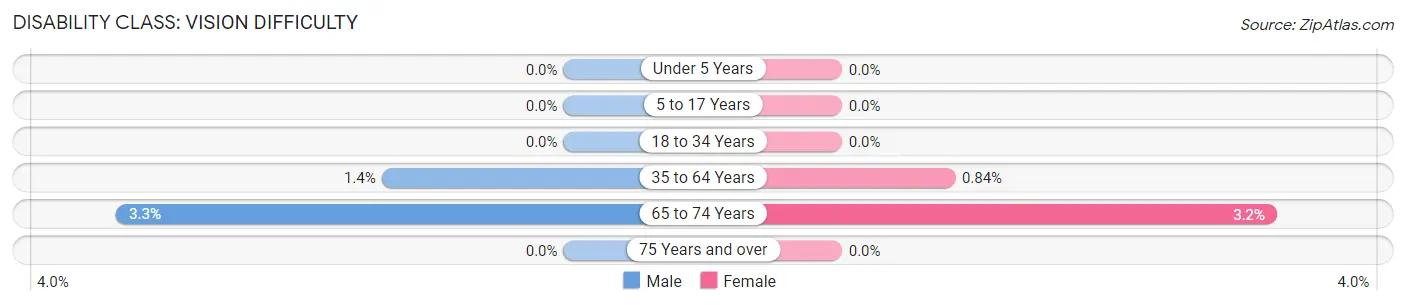
| Age Bracket | Male | Female |
| Under 5 Years | 0 (0.0%) | 0 (0.0%) |
| 5 to 17 Years | 0 (0.0%) | 0 (0.0%) |
| 18 to 34 Years | 0 (0.0%) | 0 (0.0%) |
| 35 to 64 Years | 8 (1.3%) | 4 (0.8%) |
| 65 to 74 Years | 12 (3.3%) | 6 (3.2%) |
| 75 Years and over | 0 (0.0%) | 0 (0.0%) |
Disability Class: Cognitive Difficulty
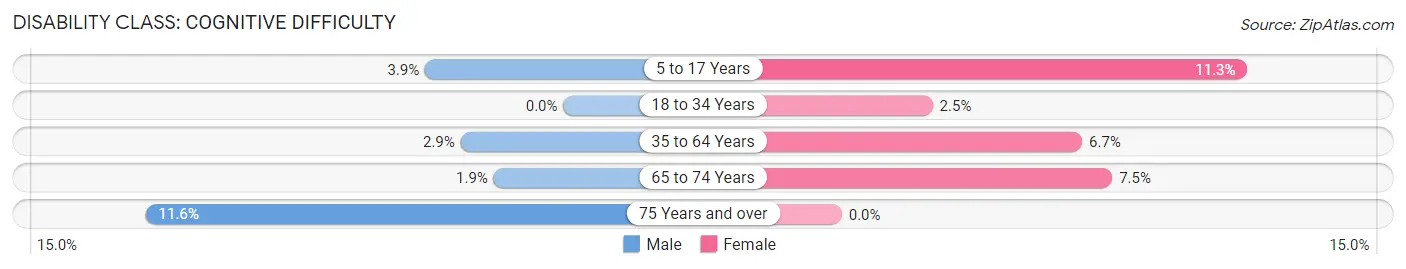
| Age Bracket | Male | Female |
| 5 to 17 Years | 6 (3.8%) | 7 (11.3%) |
| 18 to 34 Years | 0 (0.0%) | 7 (2.5%) |
| 35 to 64 Years | 17 (2.9%) | 32 (6.7%) |
| 65 to 74 Years | 7 (1.9%) | 14 (7.5%) |
| 75 Years and over | 5 (11.6%) | 0 (0.0%) |
Disability Class: Ambulatory Difficulty
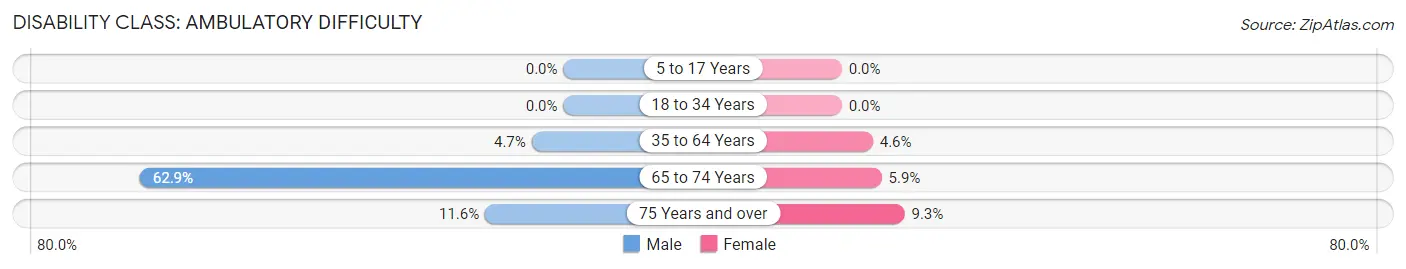
| Age Bracket | Male | Female |
| 5 to 17 Years | 0 (0.0%) | 0 (0.0%) |
| 18 to 34 Years | 0 (0.0%) | 0 (0.0%) |
| 35 to 64 Years | 28 (4.7%) | 22 (4.6%) |
| 65 to 74 Years | 227 (62.9%) | 11 (5.9%) |
| 75 Years and over | 5 (11.6%) | 11 (9.3%) |
Disability Class: Self-Care Difficulty
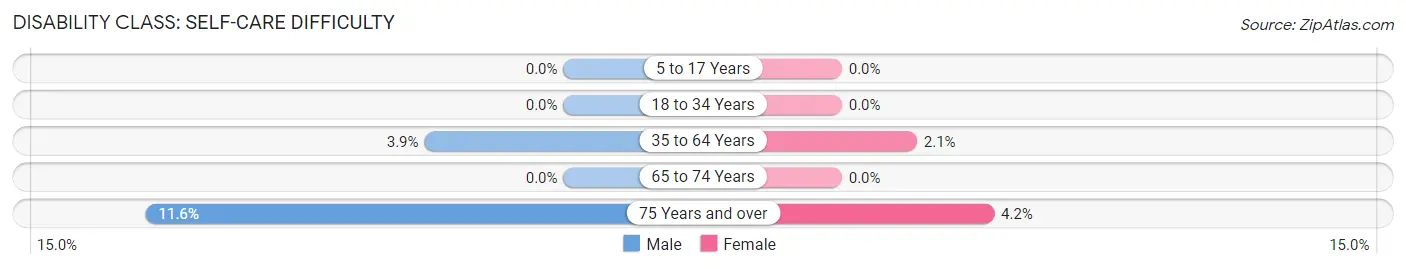
| Age Bracket | Male | Female |
| 5 to 17 Years | 0 (0.0%) | 0 (0.0%) |
| 18 to 34 Years | 0 (0.0%) | 0 (0.0%) |
| 35 to 64 Years | 23 (3.9%) | 10 (2.1%) |
| 65 to 74 Years | 0 (0.0%) | 0 (0.0%) |
| 75 Years and over | 5 (11.6%) | 5 (4.2%) |
Technology Access in Marietta borough
Computing Device Access in Marietta borough
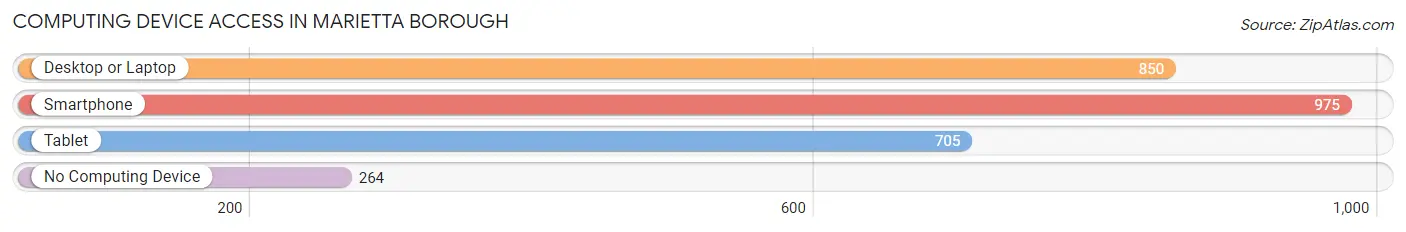
| Device Type | # Households | % Households |
| Desktop or Laptop | 850 | 64.6% |
| Smartphone | 975 | 74.1% |
| Tablet | 705 | 53.6% |
| No Computing Device | 264 | 20.1% |
| Total | 1,316 | 100.0% |
Internet Access in Marietta borough
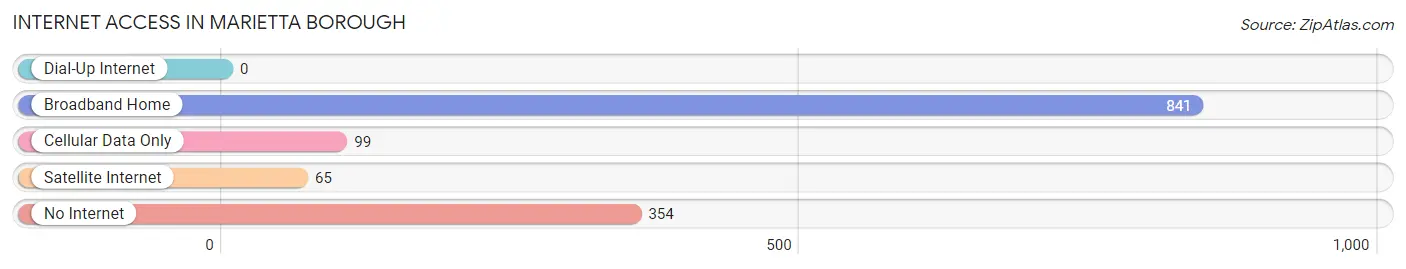
| Internet Type | # Households | % Households |
| Dial-Up Internet | 0 | 0.0% |
| Broadband Home | 841 | 63.9% |
| Cellular Data Only | 99 | 7.5% |
| Satellite Internet | 65 | 4.9% |
| No Internet | 354 | 26.9% |
| Total | 1,316 | 100.0% |
Marietta borough Summary
Marietta Borough is a small borough located in Lancaster County, Pennsylvania. It is situated along the Susquehanna River, approximately 10 miles east of the city of Lancaster. The borough has a population of approximately 1,500 people and covers an area of 0.6 square miles.
History
Marietta Borough was founded in 1764 by a group of German settlers who had come to the area from the Palatinate region of Germany. The settlers named the town after the wife of one of the original settlers, Maria. The town was incorporated in 1814 and has remained relatively unchanged since then.
The town was an important stop on the Susquehanna and Tidewater Canal, which was built in the early 19th century to connect the Susquehanna River with the Chesapeake Bay. The canal was an important transportation route for goods and people, and it helped to spur the growth of the town.
The town was also an important stop on the Underground Railroad, which was used by escaped slaves to travel to freedom in the northern states. Marietta was a safe haven for many of these escaped slaves, and the town was home to several prominent abolitionists.
Geography
Marietta Borough is located in southeastern Lancaster County, Pennsylvania. It is situated along the Susquehanna River, approximately 10 miles east of the city of Lancaster. The borough has a total area of 0.6 square miles, all of which is land.
The borough is located in a rural area, and the landscape is mostly flat. The Susquehanna River forms the western boundary of the borough, and the Conestoga River forms the eastern boundary. The borough is located in the Piedmont region of Pennsylvania, and the climate is generally mild.
Economy
Marietta Borough has a small, but diverse economy. The town is home to several small businesses, including a grocery store, a hardware store, a pharmacy, and a few restaurants. The town also has a few small manufacturing companies, including a furniture maker and a metal fabricator.
The town is also home to several farms, which produce a variety of crops, including corn, soybeans, and hay. The town also has a few small wineries, which produce a variety of wines.
Demographics
As of the 2010 census, Marietta Borough had a population of 1,500 people. The racial makeup of the borough was 95.3% White, 1.3% African American, 0.7% Asian, 0.3% Native American, and 2.3% from other races. The median household income was $45,000, and the median family income was $50,000.
The town is home to a variety of religious denominations, including Catholic, Lutheran, and Methodist. The town also has a few small churches, including a Baptist church and a Presbyterian church.
Conclusion
Marietta Borough is a small borough located in Lancaster County, Pennsylvania. It is situated along the Susquehanna River, approximately 10 miles east of the city of Lancaster. The borough has a population of approximately 1,500 people and covers an area of 0.6 square miles. The town has a small, but diverse economy, and the racial makeup of the borough is mostly White. The town is home to a variety of religious denominations, and it was an important stop on the Underground Railroad. Marietta Borough is a small, but vibrant community that has remained relatively unchanged since its founding in 1764.
Common Questions
What is Per Capita Income in Marietta borough?
Per Capita income in Marietta borough is $34,862.
What is the Median Family Income in Marietta borough?
Median Family Income in Marietta borough is $74,779.
What is the Median Household income in Marietta borough?
Median Household Income in Marietta borough is $56,429.
What is Income or Wage Gap in Marietta borough?
Income or Wage Gap in Marietta borough is 37.1%.
Women in Marietta borough earn 62.9 cents for every dollar earned by a man.
What is Family Income Deficit in Marietta borough?
Family Income Deficit in Marietta borough is $10,639.
Families that are below poverty line in Marietta borough earn $10,639 less on average than the poverty threshold level.
What is Inequality or Gini Index in Marietta borough?
Inequality or Gini Index in Marietta borough is 0.40.
What is the Total Population of Marietta borough?
Total Population of Marietta borough is 2,769.
What is the Total Male Population of Marietta borough?
Total Male Population of Marietta borough is 1,553.
What is the Total Female Population of Marietta borough?
Total Female Population of Marietta borough is 1,216.
What is the Ratio of Males per 100 Females in Marietta borough?
There are 127.71 Males per 100 Females in Marietta borough.
What is the Ratio of Females per 100 Males in Marietta borough?
There are 78.30 Females per 100 Males in Marietta borough.
What is the Median Population Age in Marietta borough?
Median Population Age in Marietta borough is 46.2 Years.
What is the Average Family Size in Marietta borough
Average Family Size in Marietta borough is 2.5 People.
What is the Average Household Size in Marietta borough
Average Household Size in Marietta borough is 2.1 People.
How Large is the Labor Force in Marietta borough?
There are 1,466 People in the Labor Forcein in Marietta borough.
What is the Percentage of People in the Labor Force in Marietta borough?
61.2% of People are in the Labor Force in Marietta borough.
What is the Unemployment Rate in Marietta borough?
Unemployment Rate in Marietta borough is 5.8%.