Manheim borough, PA Map & Demographics
Manheim borough Overview
$33,800
PER CAPITA INCOME
$85,682
AVG FAMILY INCOME
$75,833
AVG HOUSEHOLD INCOME
34.2%
WAGE / INCOME GAP [ % ]
65.8¢/ $1
WAGE / INCOME GAP [ $ ]
$13,111
FAMILY INCOME DEFICIT
0.40
INEQUALITY / GINI INDEX
5,028
TOTAL POPULATION
2,744
MALE POPULATION
2,284
FEMALE POPULATION
120.14
MALES / 100 FEMALES
83.24
FEMALES / 100 MALES
33.6
MEDIAN AGE
3.1
AVG FAMILY SIZE
2.6
AVG HOUSEHOLD SIZE
2,647
LABOR FORCE [ PEOPLE ]
70.6%
PERCENT IN LABOR FORCE
5.8%
UNEMPLOYMENT RATE
Income in Manheim borough
Income Overview in Manheim borough
Per Capita Income in Manheim borough is $33,800, while median incomes of families and households are $85,682 and $75,833 respectively.
| Characteristic | Number | Measure |
| Per Capita Income | 5,028 | $33,800 |
| Median Family Income | 1,298 | $85,682 |
| Mean Family Income | 1,298 | $102,256 |
| Median Household Income | 1,922 | $75,833 |
| Mean Household Income | 1,922 | $89,386 |
| Income Deficit | 1,298 | $13,111 |
| Wage / Income Gap (%) | 5,028 | 34.24% |
| Wage / Income Gap ($) | 5,028 | 65.76¢ per $1 |
| Gini / Inequality Index | 5,028 | 0.40 |
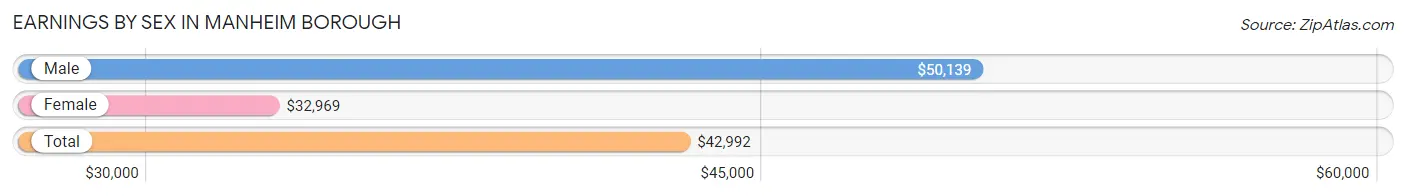
Earnings by Sex in Manheim borough
Average Earnings in Manheim borough are $42,992, $50,139 for men and $32,969 for women, a difference of 34.2%.
| Sex | Number | Average Earnings |
| Male | 1,547 (55.0%) | $50,139 |
| Female | 1,264 (45.0%) | $32,969 |
| Total | 2,811 (100.0%) | $42,992 |
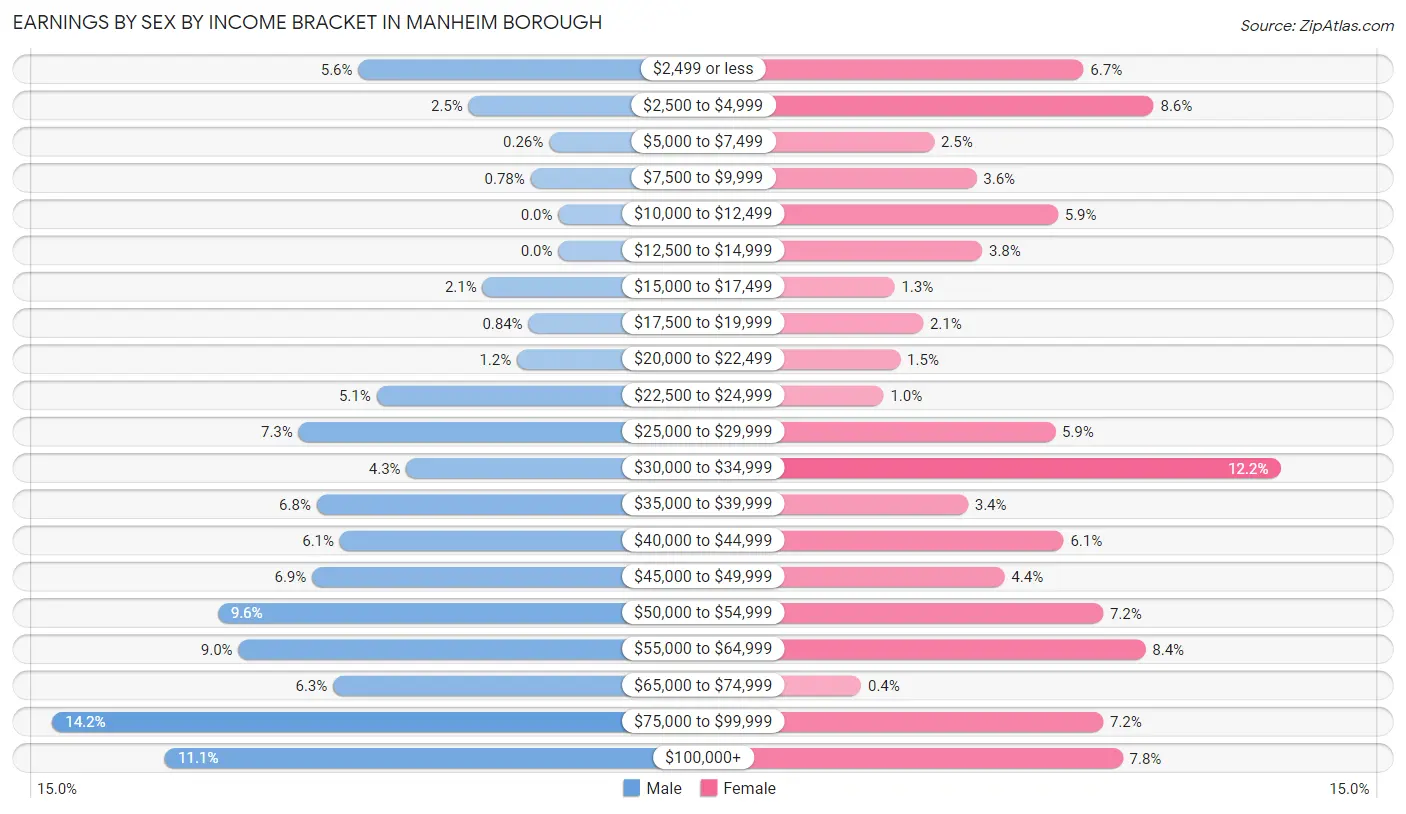
Earnings by Sex by Income Bracket in Manheim borough
The most common earnings brackets in Manheim borough are $75,000 to $99,999 for men (220 | 14.2%) and $30,000 to $34,999 for women (154 | 12.2%).
| Income | Male | Female |
| $2,499 or less | 87 (5.6%) | 84 (6.7%) |
| $2,500 to $4,999 | 39 (2.5%) | 109 (8.6%) |
| $5,000 to $7,499 | 4 (0.3%) | 31 (2.5%) |
| $7,500 to $9,999 | 12 (0.8%) | 46 (3.6%) |
| $10,000 to $12,499 | 0 (0.0%) | 75 (5.9%) |
| $12,500 to $14,999 | 0 (0.0%) | 48 (3.8%) |
| $15,000 to $17,499 | 33 (2.1%) | 17 (1.3%) |
| $17,500 to $19,999 | 13 (0.8%) | 27 (2.1%) |
| $20,000 to $22,499 | 18 (1.2%) | 19 (1.5%) |
| $22,500 to $24,999 | 79 (5.1%) | 13 (1.0%) |
| $25,000 to $29,999 | 113 (7.3%) | 74 (5.9%) |
| $30,000 to $34,999 | 66 (4.3%) | 154 (12.2%) |
| $35,000 to $39,999 | 105 (6.8%) | 43 (3.4%) |
| $40,000 to $44,999 | 95 (6.1%) | 77 (6.1%) |
| $45,000 to $49,999 | 107 (6.9%) | 56 (4.4%) |
| $50,000 to $54,999 | 148 (9.6%) | 91 (7.2%) |
| $55,000 to $64,999 | 139 (9.0%) | 106 (8.4%) |
| $65,000 to $74,999 | 98 (6.3%) | 5 (0.4%) |
| $75,000 to $99,999 | 220 (14.2%) | 91 (7.2%) |
| $100,000+ | 171 (11.1%) | 98 (7.7%) |
| Total | 1,547 (100.0%) | 1,264 (100.0%) |
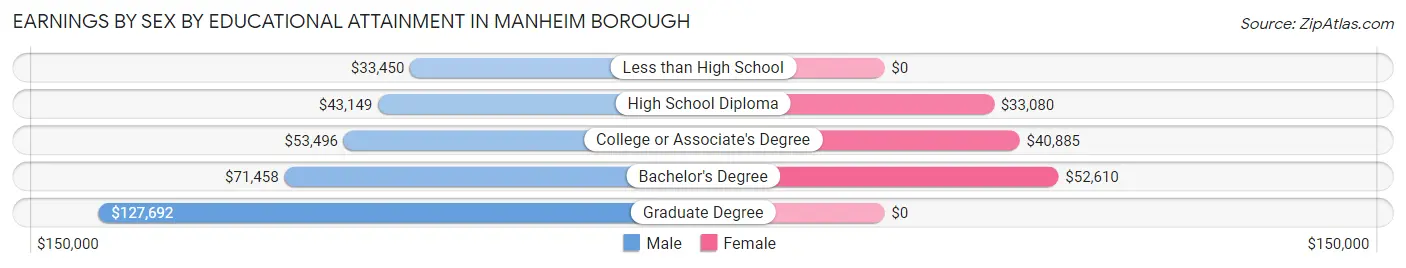
Earnings by Sex by Educational Attainment in Manheim borough
Average earnings in Manheim borough are $53,714 for men and $34,719 for women, a difference of 35.4%. Men with an educational attainment of graduate degree enjoy the highest average annual earnings of $127,692, while those with less than high school education earn the least with $33,450. Women with an educational attainment of bachelor's degree earn the most with the average annual earnings of $52,610, while those with high school diploma education have the smallest earnings of $33,080.
| Educational Attainment | Male Income | Female Income |
| Less than High School | $33,450 | $0 |
| High School Diploma | $43,149 | $33,080 |
| College or Associate's Degree | $53,496 | $40,885 |
| Bachelor's Degree | $71,458 | $52,610 |
| Graduate Degree | $127,692 | $0 |
| Total | $53,714 | $34,719 |
Family Income in Manheim borough
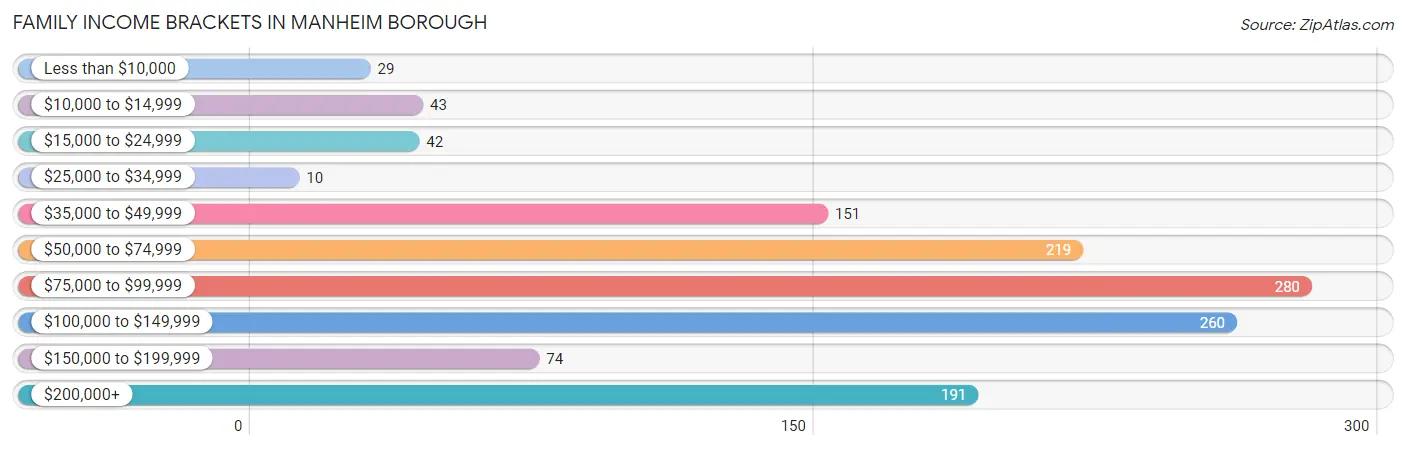
Family Income Brackets in Manheim borough
According to the Manheim borough family income data, there are 280 families falling into the $75,000 to $99,999 income range, which is the most common income bracket and makes up 21.6% of all families. Conversely, the $25,000 to $34,999 income bracket is the least frequent group with only 10 families (0.8%) belonging to this category.
| Income Bracket | # Families | % Families |
| Less than $10,000 | 29 | 2.2% |
| $10,000 to $14,999 | 43 | 3.3% |
| $15,000 to $24,999 | 42 | 3.2% |
| $25,000 to $34,999 | 10 | 0.8% |
| $35,000 to $49,999 | 151 | 11.6% |
| $50,000 to $74,999 | 219 | 16.9% |
| $75,000 to $99,999 | 280 | 21.6% |
| $100,000 to $149,999 | 260 | 20.0% |
| $150,000 to $199,999 | 74 | 5.7% |
| $200,000+ | 191 | 14.7% |
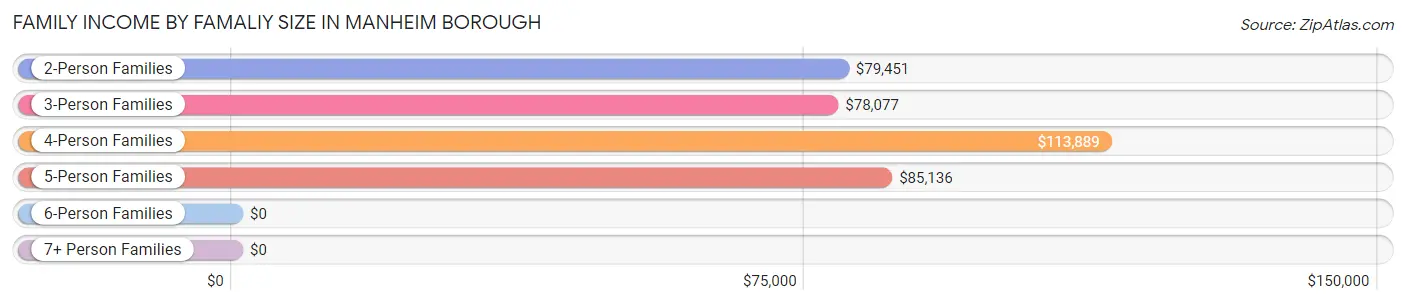
Family Income by Famaliy Size in Manheim borough
4-person families (222 | 17.1%) account for the highest median family income in Manheim borough with $113,889 per family, while 2-person families (550 | 42.4%) have the highest median income of $39,726 per family member.
| Income Bracket | # Families | Median Income |
| 2-Person Families | 550 (42.4%) | $79,451 |
| 3-Person Families | 270 (20.8%) | $78,077 |
| 4-Person Families | 222 (17.1%) | $113,889 |
| 5-Person Families | 256 (19.7%) | $85,136 |
| 6-Person Families | 0 (0.0%) | $0 |
| 7+ Person Families | 0 (0.0%) | $0 |
| Total | 1,298 (100.0%) | $85,682 |
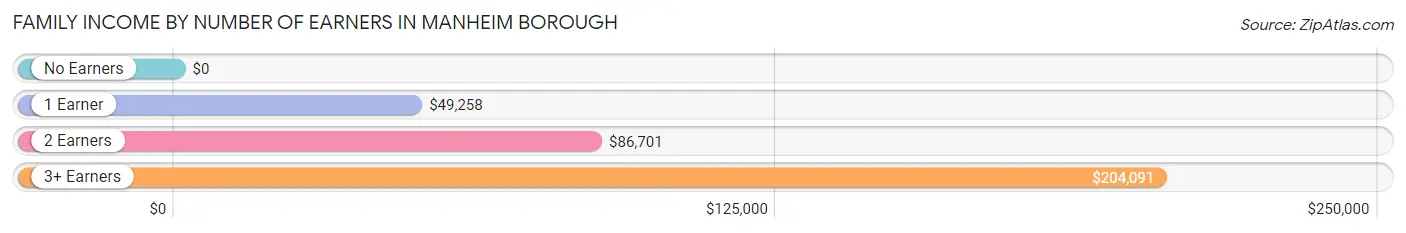
Family Income by Number of Earners in Manheim borough
| Number of Earners | # Families | Median Income |
| No Earners | 124 (9.6%) | $0 |
| 1 Earner | 369 (28.4%) | $49,258 |
| 2 Earners | 563 (43.4%) | $86,701 |
| 3+ Earners | 242 (18.6%) | $204,091 |
| Total | 1,298 (100.0%) | $85,682 |
Household Income in Manheim borough
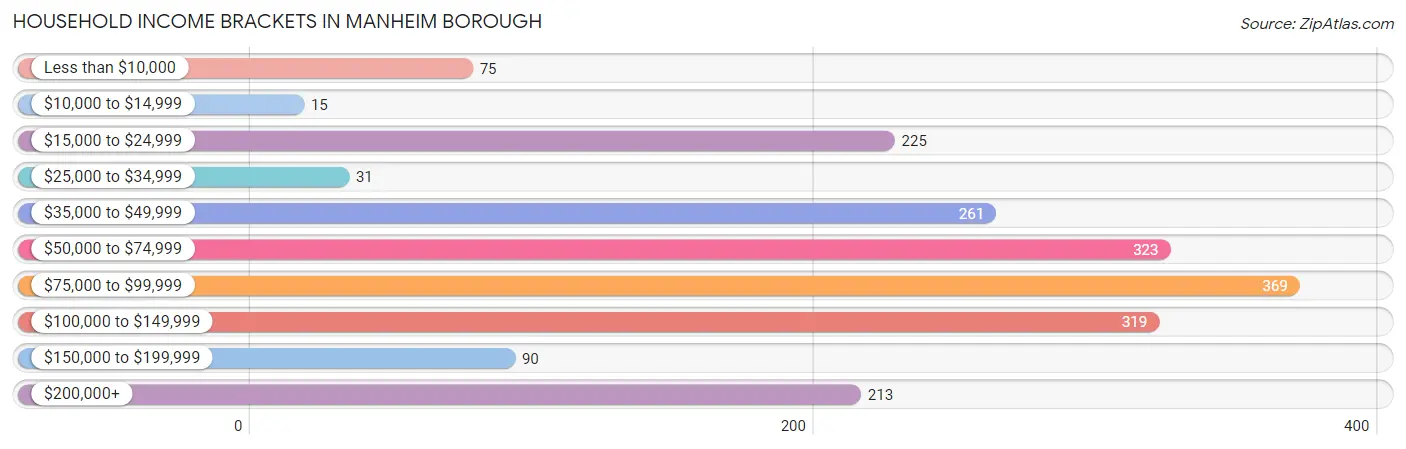
Household Income Brackets in Manheim borough
With 369 households falling in the category, the $75,000 to $99,999 income range is the most frequent in Manheim borough, accounting for 19.2% of all households. In contrast, only 15 households (0.8%) fall into the $10,000 to $14,999 income bracket, making it the least populous group.
| Income Bracket | # Households | % Households |
| Less than $10,000 | 75 | 3.9% |
| $10,000 to $14,999 | 15 | 0.8% |
| $15,000 to $24,999 | 225 | 11.7% |
| $25,000 to $34,999 | 31 | 1.6% |
| $35,000 to $49,999 | 261 | 13.6% |
| $50,000 to $74,999 | 323 | 16.8% |
| $75,000 to $99,999 | 369 | 19.2% |
| $100,000 to $149,999 | 319 | 16.6% |
| $150,000 to $199,999 | 90 | 4.7% |
| $200,000+ | 213 | 11.1% |
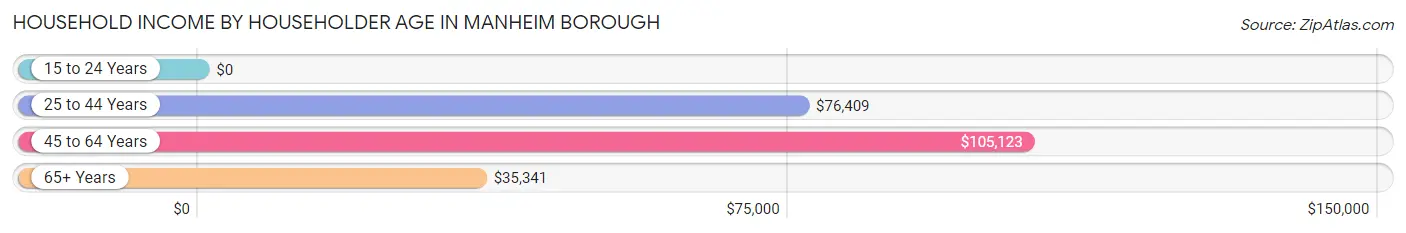
Household Income by Householder Age in Manheim borough
The median household income in Manheim borough is $75,833, with the highest median household income of $105,123 found in the 45 to 64 years age bracket for the primary householder. A total of 754 households (39.2%) fall into this category. Meanwhile, the 15 to 24 years age bracket for the primary householder has the lowest median household income of $0, with 33 households (1.7%) in this group.
| Income Bracket | # Households | Median Income |
| 15 to 24 Years | 33 (1.7%) | $0 |
| 25 to 44 Years | 729 (37.9%) | $76,409 |
| 45 to 64 Years | 754 (39.2%) | $105,123 |
| 65+ Years | 406 (21.1%) | $35,341 |
| Total | 1,922 (100.0%) | $75,833 |
Poverty in Manheim borough
Income Below Poverty by Sex and Age in Manheim borough
With 5.5% poverty level for males and 18.2% for females among the residents of Manheim borough, 15 year old males and 6 to 11 year old females are the most vulnerable to poverty, with 42 males (80.8%) and 42 females (46.7%) in their respective age groups living below the poverty level.
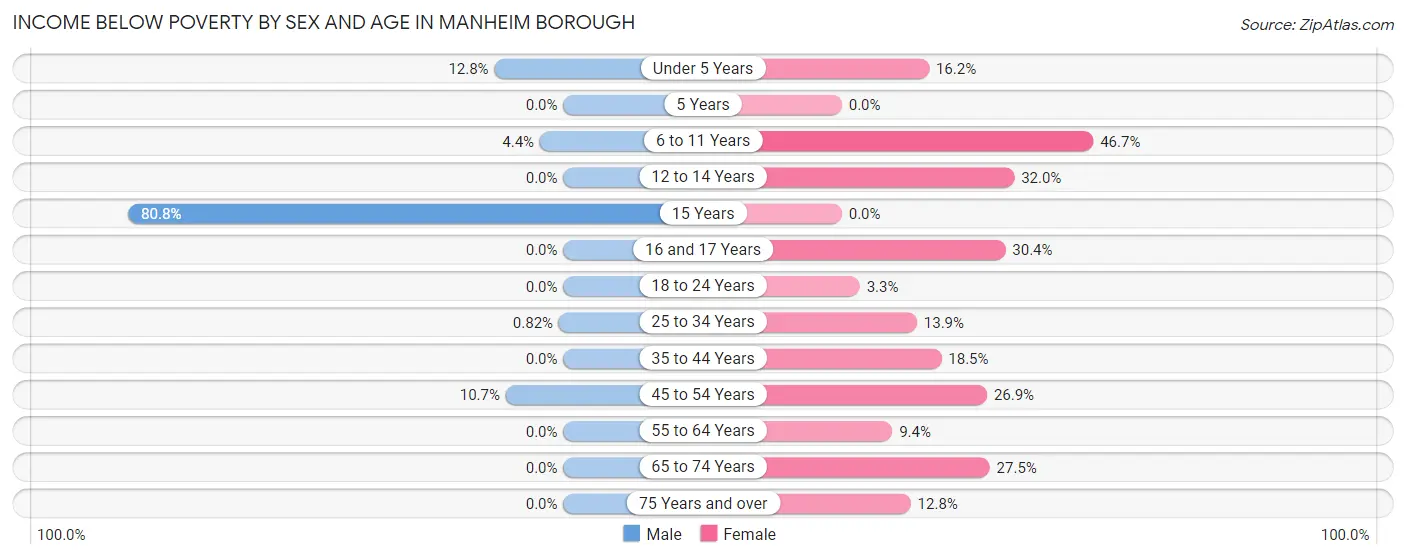
| Age Bracket | Male | Female |
| Under 5 Years | 39 (12.8%) | 28 (16.2%) |
| 5 Years | 0 (0.0%) | 0 (0.0%) |
| 6 to 11 Years | 13 (4.3%) | 42 (46.7%) |
| 12 to 14 Years | 0 (0.0%) | 32 (32.0%) |
| 15 Years | 42 (80.8%) | 0 (0.0%) |
| 16 and 17 Years | 0 (0.0%) | 17 (30.4%) |
| 18 to 24 Years | 0 (0.0%) | 3 (3.3%) |
| 25 to 34 Years | 4 (0.8%) | 78 (13.9%) |
| 35 to 44 Years | 0 (0.0%) | 51 (18.5%) |
| 45 to 54 Years | 51 (10.7%) | 80 (26.9%) |
| 55 to 64 Years | 0 (0.0%) | 19 (9.4%) |
| 65 to 74 Years | 0 (0.0%) | 42 (27.5%) |
| 75 Years and over | 0 (0.0%) | 17 (12.8%) |
| Total | 149 (5.5%) | 409 (18.2%) |
Income Above Poverty by Sex and Age in Manheim borough
According to the poverty statistics in Manheim borough, males aged 12 to 14 years and females aged 5 years are the age groups that are most secure financially, with 100.0% of males and 100.0% of females in these age groups living above the poverty line.
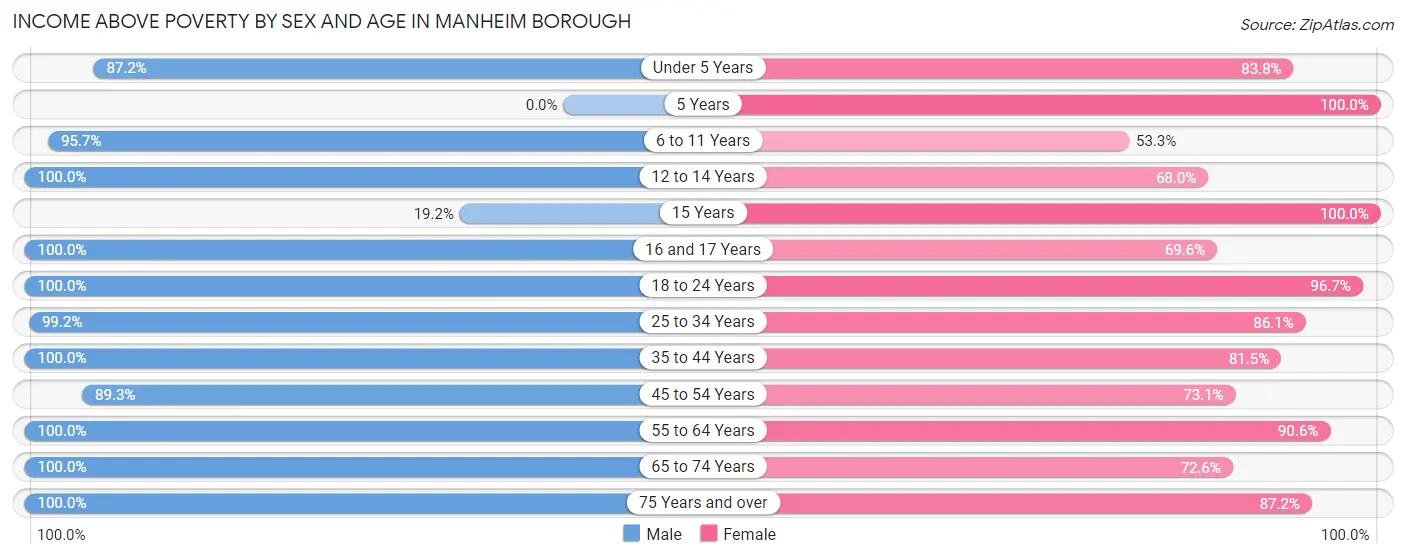
| Age Bracket | Male | Female |
| Under 5 Years | 266 (87.2%) | 145 (83.8%) |
| 5 Years | 0 (0.0%) | 76 (100.0%) |
| 6 to 11 Years | 286 (95.7%) | 48 (53.3%) |
| 12 to 14 Years | 88 (100.0%) | 68 (68.0%) |
| 15 Years | 10 (19.2%) | 43 (100.0%) |
| 16 and 17 Years | 57 (100.0%) | 39 (69.6%) |
| 18 to 24 Years | 161 (100.0%) | 87 (96.7%) |
| 25 to 34 Years | 485 (99.2%) | 482 (86.1%) |
| 35 to 44 Years | 227 (100.0%) | 225 (81.5%) |
| 45 to 54 Years | 426 (89.3%) | 217 (73.1%) |
| 55 to 64 Years | 285 (100.0%) | 184 (90.6%) |
| 65 to 74 Years | 190 (100.0%) | 111 (72.6%) |
| 75 Years and over | 95 (100.0%) | 116 (87.2%) |
| Total | 2,576 (94.5%) | 1,841 (81.8%) |
Income Below Poverty Among Married-Couple Families in Manheim borough
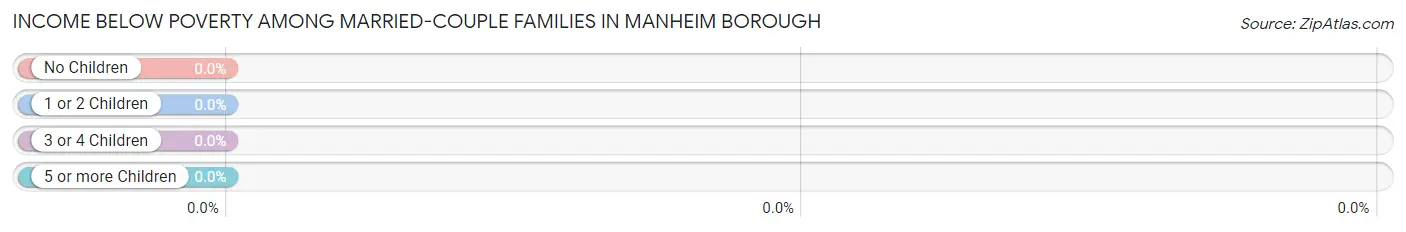
| Children | Above Poverty | Below Poverty |
| No Children | 451 (100.0%) | 0 (0.0%) |
| 1 or 2 Children | 337 (100.0%) | 0 (0.0%) |
| 3 or 4 Children | 172 (100.0%) | 0 (0.0%) |
| 5 or more Children | 0 (0.0%) | 0 (0.0%) |
| Total | 960 (100.0%) | 0 (0.0%) |
Income Below Poverty Among Single-Parent Households in Manheim borough
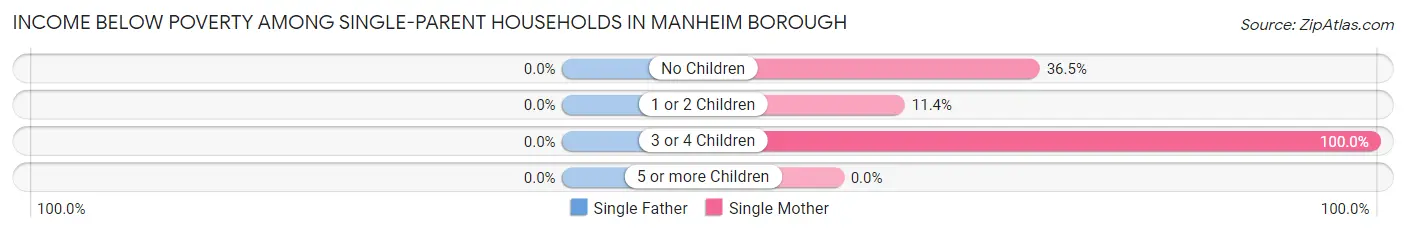
| Children | Single Father | Single Mother |
| No Children | 0 (0.0%) | 42 (36.5%) |
| 1 or 2 Children | 0 (0.0%) | 13 (11.4%) |
| 3 or 4 Children | 0 (0.0%) | 58 (100.0%) |
| 5 or more Children | 0 (0.0%) | 0 (0.0%) |
| Total | 0 (0.0%) | 113 (39.4%) |
Income Below Poverty Among Married-Couple vs Single-Parent Households in Manheim borough
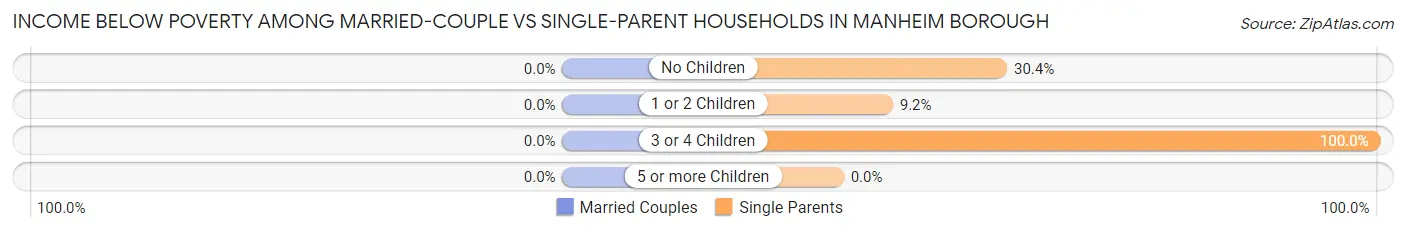
| Children | Married-Couple Families | Single-Parent Households |
| No Children | 0 (0.0%) | 42 (30.4%) |
| 1 or 2 Children | 0 (0.0%) | 13 (9.1%) |
| 3 or 4 Children | 0 (0.0%) | 58 (100.0%) |
| 5 or more Children | 0 (0.0%) | 0 (0.0%) |
| Total | 0 (0.0%) | 113 (33.4%) |
Race in Manheim borough
The most populous races in Manheim borough are White / Caucasian (4,643 | 92.3%), Two or more Races (331 | 6.6%), and Hispanic or Latino (240 | 4.8%).
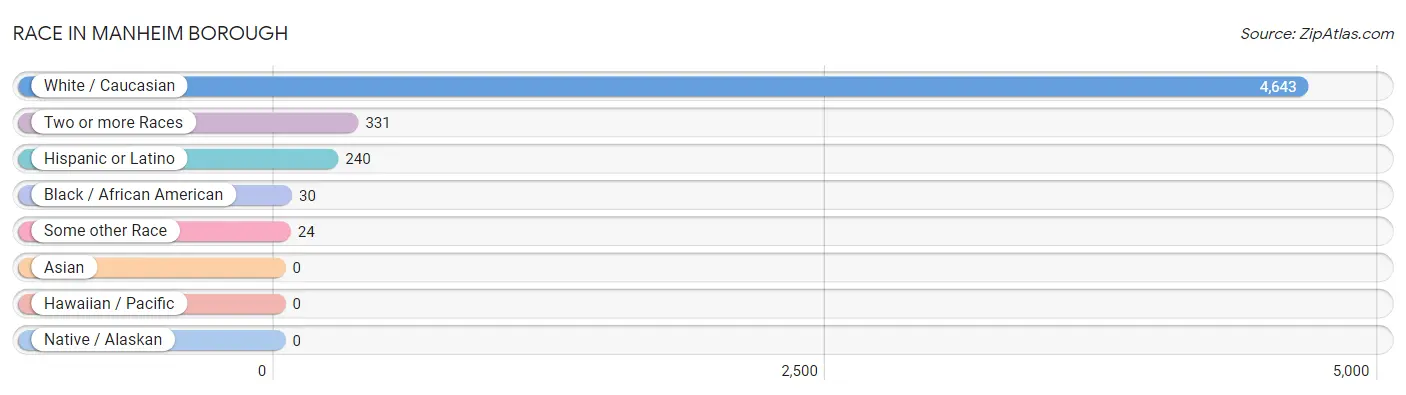
| Race | # Population | % Population |
| Asian | 0 | 0.0% |
| Black / African American | 30 | 0.6% |
| Hawaiian / Pacific | 0 | 0.0% |
| Hispanic or Latino | 240 | 4.8% |
| Native / Alaskan | 0 | 0.0% |
| White / Caucasian | 4,643 | 92.3% |
| Two or more Races | 331 | 6.6% |
| Some other Race | 24 | 0.5% |
| Total | 5,028 | 100.0% |
Ancestry in Manheim borough
The most populous ancestries reported in Manheim borough are German (2,108 | 41.9%), Irish (798 | 15.9%), Italian (660 | 13.1%), English (563 | 11.2%), and American (359 | 7.1%), together accounting for 89.3% of all Manheim borough residents.
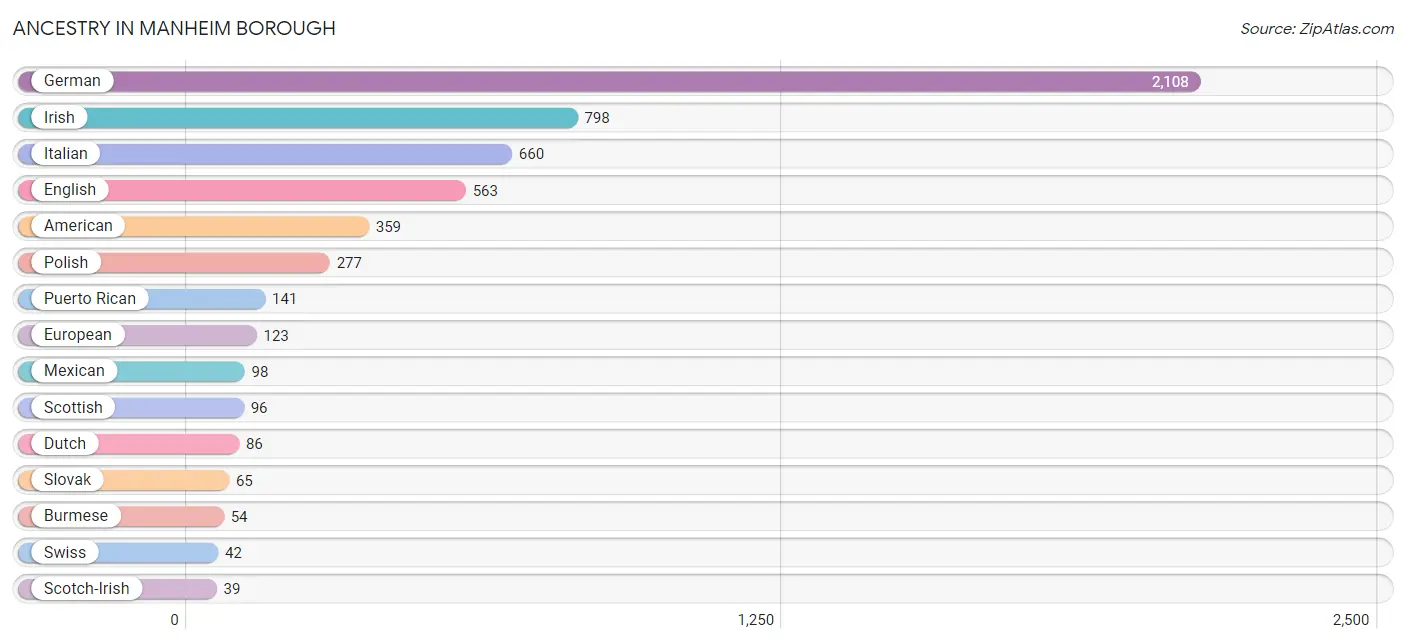
| Ancestry | # Population | % Population |
| American | 359 | 7.1% |
| Armenian | 9 | 0.2% |
| Brazilian | 15 | 0.3% |
| British | 16 | 0.3% |
| Bulgarian | 18 | 0.4% |
| Burmese | 54 | 1.1% |
| Danish | 5 | 0.1% |
| Dutch | 86 | 1.7% |
| Dutch West Indian | 1 | 0.0% |
| Eastern European | 13 | 0.3% |
| English | 563 | 11.2% |
| European | 123 | 2.5% |
| French | 27 | 0.5% |
| German | 2,108 | 41.9% |
| Greek | 10 | 0.2% |
| Irish | 798 | 15.9% |
| Italian | 660 | 13.1% |
| Lithuanian | 13 | 0.3% |
| Mexican | 98 | 1.9% |
| Polish | 277 | 5.5% |
| Puerto Rican | 141 | 2.8% |
| Scotch-Irish | 39 | 0.8% |
| Scottish | 96 | 1.9% |
| Slovak | 65 | 1.3% |
| Swedish | 15 | 0.3% |
| Swiss | 42 | 0.8% |
| Ukrainian | 26 | 0.5% |
| Welsh | 24 | 0.5% | View All 28 Rows |
Immigrants in Manheim borough
The most numerous immigrant groups reported in Manheim borough came from Latin America (46 | 0.9%), Central America (29 | 0.6%), Mexico (29 | 0.6%), Brazil (17 | 0.3%), and South America (17 | 0.3%), together accounting for 2.8% of all Manheim borough residents.
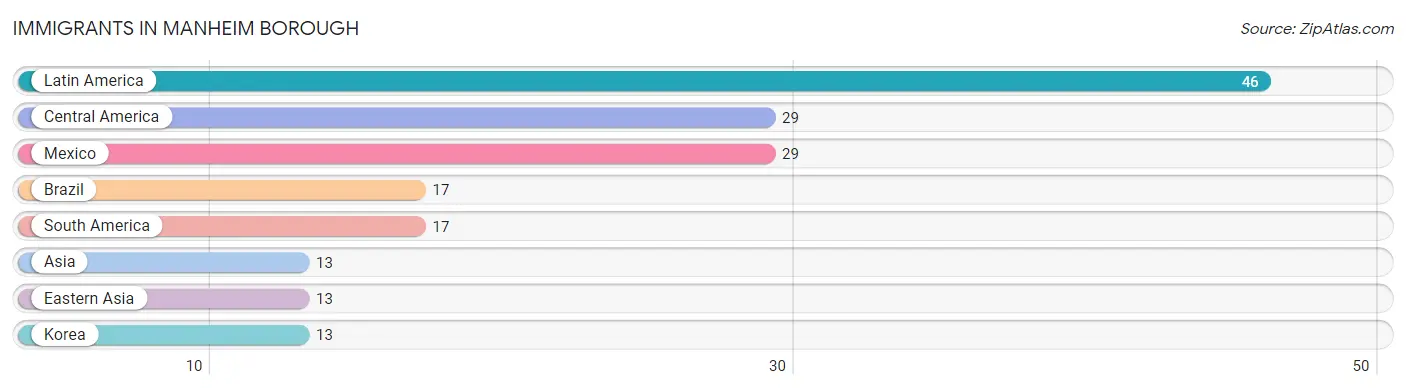
| Immigration Origin | # Population | % Population |
| Asia | 13 | 0.3% |
| Brazil | 17 | 0.3% |
| Central America | 29 | 0.6% |
| Eastern Asia | 13 | 0.3% |
| Korea | 13 | 0.3% |
| Latin America | 46 | 0.9% |
| Mexico | 29 | 0.6% |
| South America | 17 | 0.3% | View All 8 Rows |
Sex and Age in Manheim borough
Sex and Age in Manheim borough
The most populous age groups in Manheim borough are 30 to 34 Years (359 | 13.1%) for men and 30 to 34 Years (378 | 16.6%) for women.
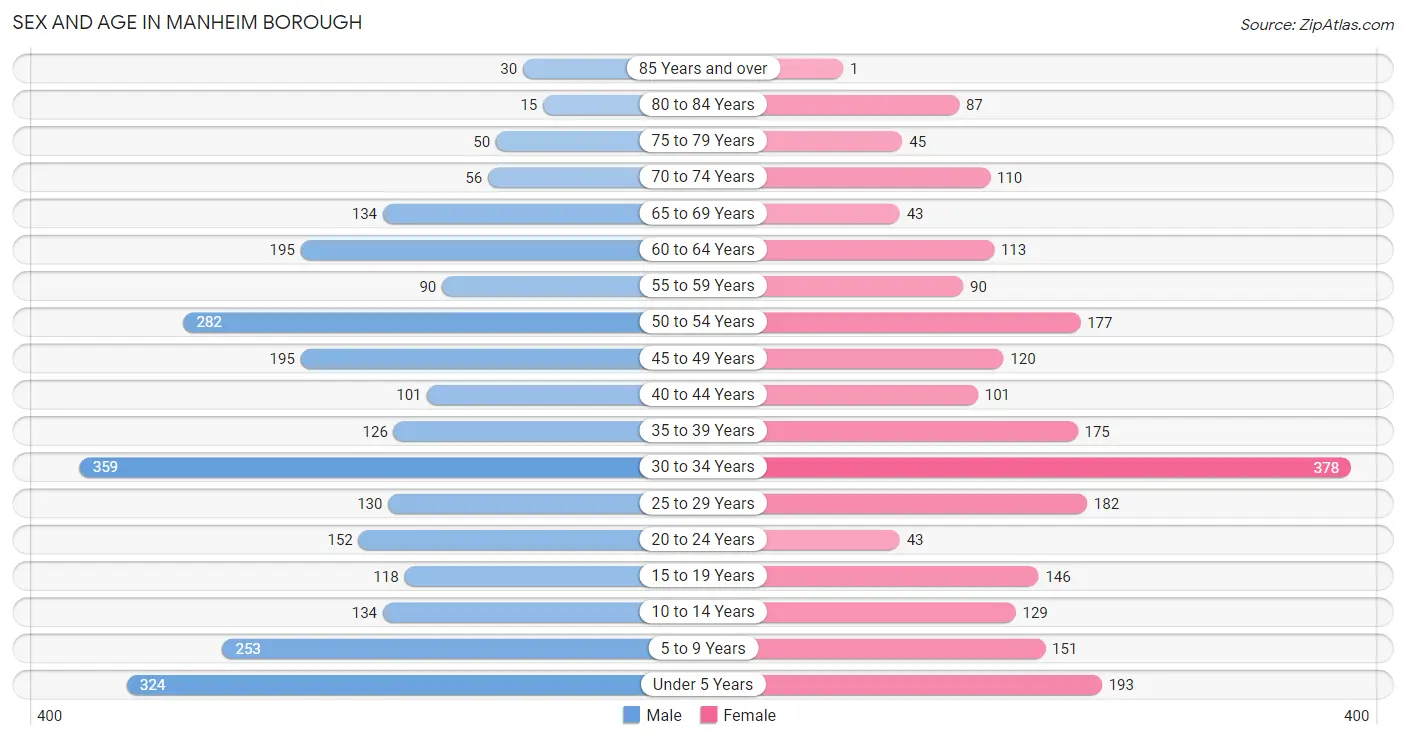
| Age Bracket | Male | Female |
| Under 5 Years | 324 (11.8%) | 193 (8.5%) |
| 5 to 9 Years | 253 (9.2%) | 151 (6.6%) |
| 10 to 14 Years | 134 (4.9%) | 129 (5.7%) |
| 15 to 19 Years | 118 (4.3%) | 146 (6.4%) |
| 20 to 24 Years | 152 (5.5%) | 43 (1.9%) |
| 25 to 29 Years | 130 (4.7%) | 182 (8.0%) |
| 30 to 34 Years | 359 (13.1%) | 378 (16.6%) |
| 35 to 39 Years | 126 (4.6%) | 175 (7.7%) |
| 40 to 44 Years | 101 (3.7%) | 101 (4.4%) |
| 45 to 49 Years | 195 (7.1%) | 120 (5.2%) |
| 50 to 54 Years | 282 (10.3%) | 177 (7.7%) |
| 55 to 59 Years | 90 (3.3%) | 90 (3.9%) |
| 60 to 64 Years | 195 (7.1%) | 113 (5.0%) |
| 65 to 69 Years | 134 (4.9%) | 43 (1.9%) |
| 70 to 74 Years | 56 (2.0%) | 110 (4.8%) |
| 75 to 79 Years | 50 (1.8%) | 45 (2.0%) |
| 80 to 84 Years | 15 (0.5%) | 87 (3.8%) |
| 85 Years and over | 30 (1.1%) | 1 (0.0%) |
| Total | 2,744 (100.0%) | 2,284 (100.0%) |
Families and Households in Manheim borough
Median Family Size in Manheim borough
The median family size in Manheim borough is 3.08 persons per family, with married-couple families (960 | 74.0%) accounting for the largest median family size of 3.2 persons per family. On the other hand, single male/father families (51 | 3.9%) represent the smallest median family size with 2.55 persons per family.
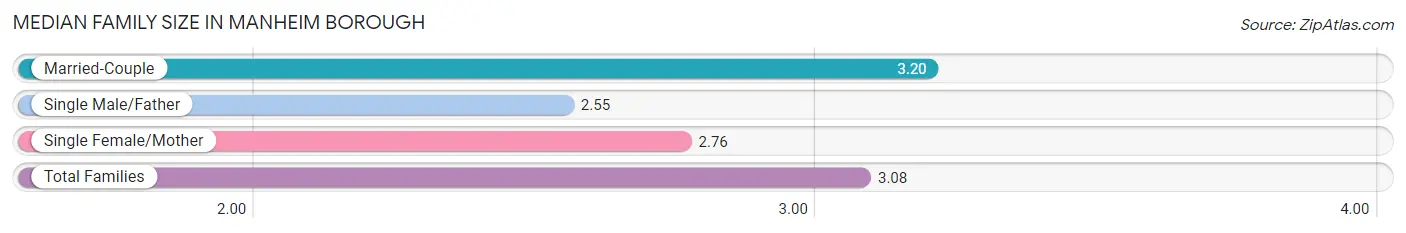
| Family Type | # Families | Family Size |
| Married-Couple | 960 (74.0%) | 3.20 |
| Single Male/Father | 51 (3.9%) | 2.55 |
| Single Female/Mother | 287 (22.1%) | 2.76 |
| Total Families | 1,298 (100.0%) | 3.08 |
Median Household Size in Manheim borough
The median household size in Manheim borough is 2.61 persons per household, with married-couple households (960 | 49.9%) accounting for the largest median household size of 3.23 persons per household. non-family households (624 | 32.5%) represent the smallest median household size with 1.37 persons per household.
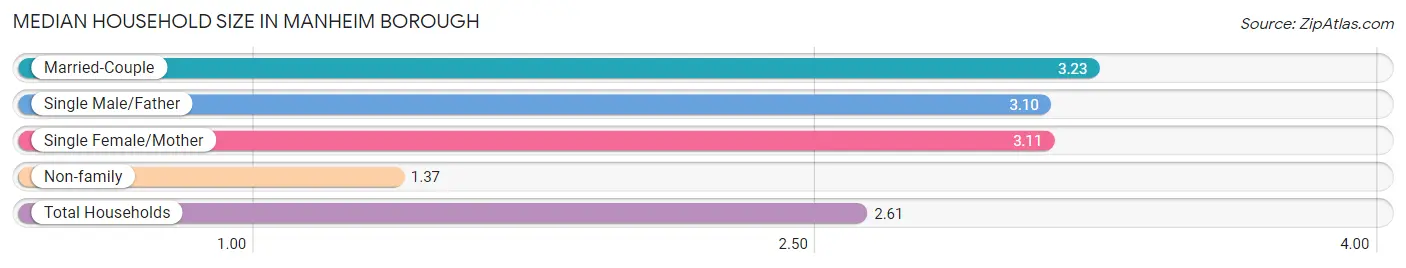
| Household Type | # Households | Household Size |
| Married-Couple | 960 (49.9%) | 3.23 |
| Single Male/Father | 51 (2.6%) | 3.10 |
| Single Female/Mother | 287 (14.9%) | 3.11 |
| Non-family | 624 (32.5%) | 1.37 |
| Total Households | 1,922 (100.0%) | 2.61 |
Household Size by Marriage Status in Manheim borough
Out of a total of 1,922 households in Manheim borough, 1,298 (67.5%) are family households, while 624 (32.5%) are nonfamily households. The most numerous type of family households are 2-person households, comprising 515, and the most common type of nonfamily households are 1-person households, comprising 463.
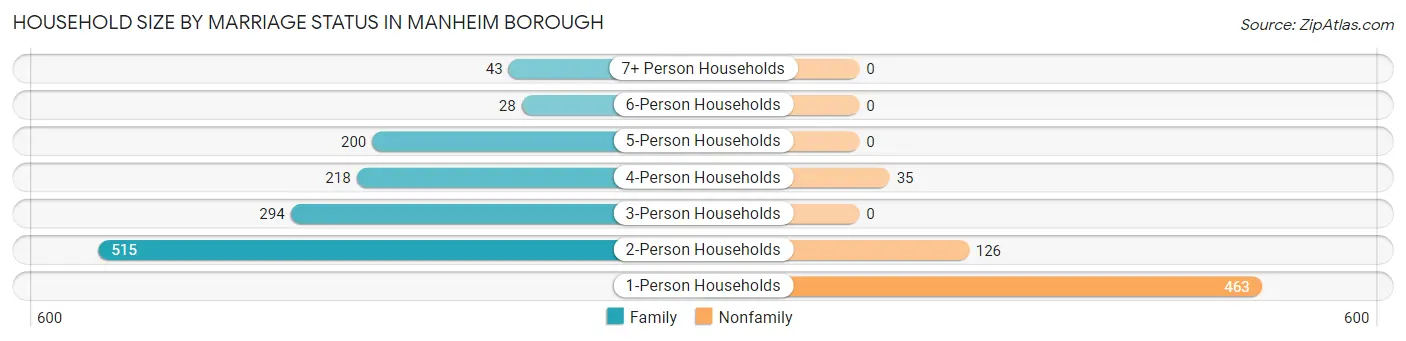
| Household Size | Family Households | Nonfamily Households |
| 1-Person Households | - | 463 (24.1%) |
| 2-Person Households | 515 (26.8%) | 126 (6.6%) |
| 3-Person Households | 294 (15.3%) | 0 (0.0%) |
| 4-Person Households | 218 (11.3%) | 35 (1.8%) |
| 5-Person Households | 200 (10.4%) | 0 (0.0%) |
| 6-Person Households | 28 (1.5%) | 0 (0.0%) |
| 7+ Person Households | 43 (2.2%) | 0 (0.0%) |
| Total | 1,298 (67.5%) | 624 (32.5%) |
Female Fertility in Manheim borough
Fertility by Age in Manheim borough
Average fertility rate in Manheim borough is 159.0 births per 1,000 women. Women in the age bracket of 20 to 34 years have the highest fertility rate with 320.0 births per 1,000 women. Women in the age bracket of 20 to 34 years acount for 99.5% of all women with births.
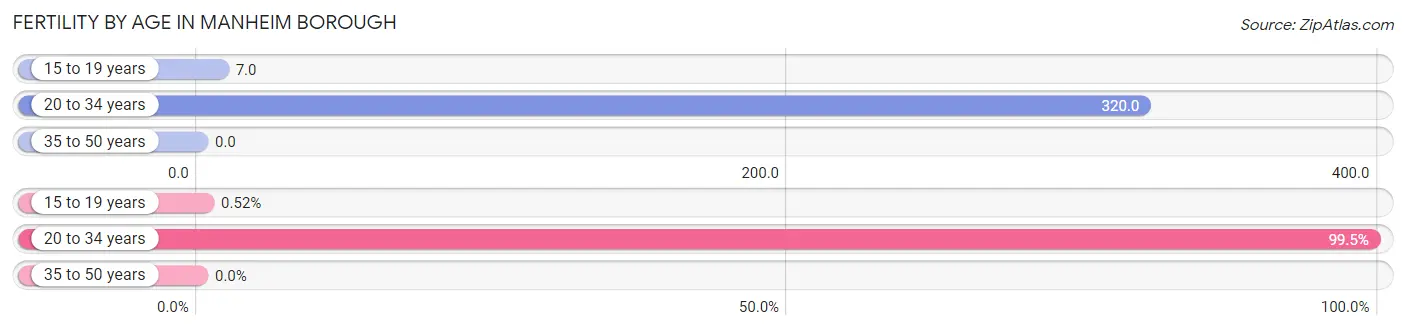
| Age Bracket | Women with Births | Births / 1,000 Women |
| 15 to 19 years | 1 (0.5%) | 7.0 |
| 20 to 34 years | 193 (99.5%) | 320.0 |
| 35 to 50 years | 0 (0.0%) | 0.0 |
| Total | 194 (100.0%) | 159.0 |
Fertility by Age by Marriage Status in Manheim borough
99.5% of women with births (194) in Manheim borough are married. The highest percentage of unmarried women with births falls into 15 to 19 years age bracket with 100.0% of them unmarried at the time of birth, while the lowest percentage of unmarried women with births belong to 20 to 34 years age bracket with 0.0% of them unmarried.
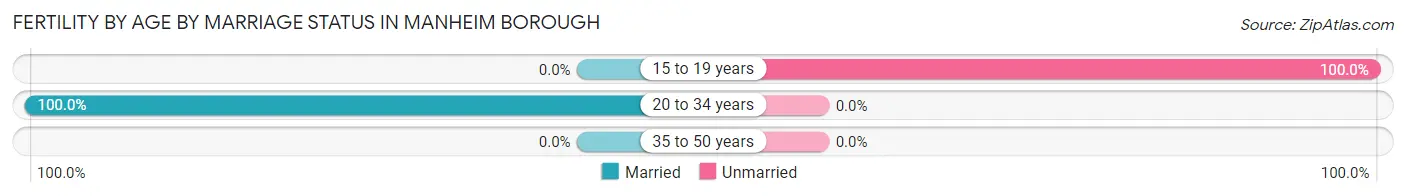
| Age Bracket | Married | Unmarried |
| 15 to 19 years | 0 (0.0%) | 1 (100.0%) |
| 20 to 34 years | 193 (100.0%) | 0 (0.0%) |
| 35 to 50 years | 0 (0.0%) | 0 (0.0%) |
| Total | 193 (99.5%) | 1 (0.5%) |
Fertility by Education in Manheim borough
Average fertility rate in Manheim borough is 159.0 births per 1,000 women. Women with the education attainment of bachelor's degree have the highest fertility rate of 404.0 births per 1,000 women, while women with the education attainment of less than high school have the lowest fertility at 7.0 births per 1,000 women. Women with the education attainment of bachelor's degree represent 54.1% of all women with births.
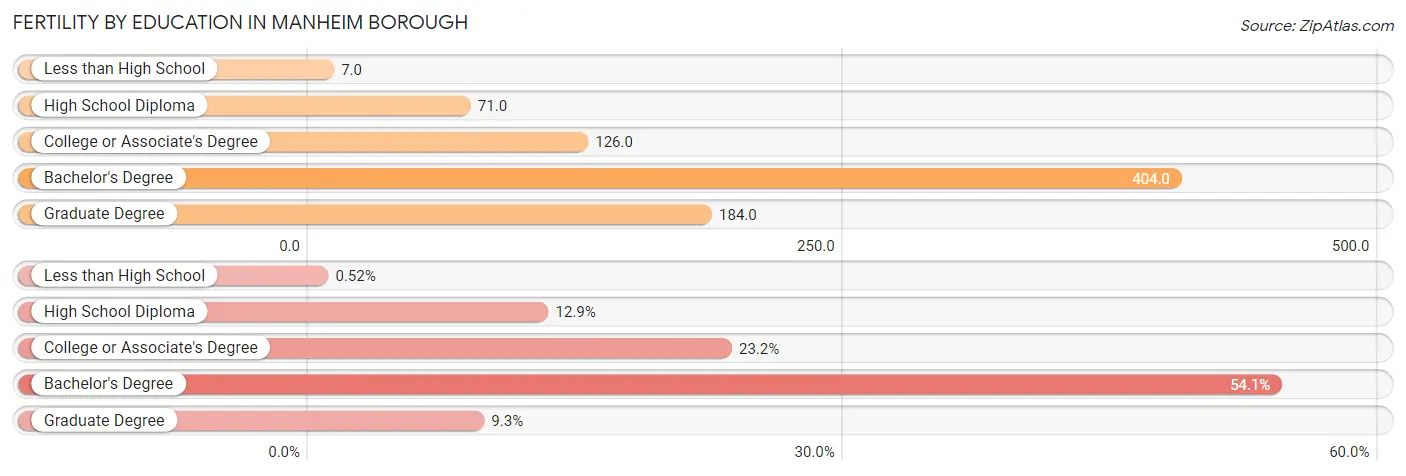
| Educational Attainment | Women with Births | Births / 1,000 Women |
| Less than High School | 1 (0.5%) | 7.0 |
| High School Diploma | 25 (12.9%) | 71.0 |
| College or Associate's Degree | 45 (23.2%) | 126.0 |
| Bachelor's Degree | 105 (54.1%) | 404.0 |
| Graduate Degree | 18 (9.3%) | 184.0 |
| Total | 194 (100.0%) | 159.0 |
Fertility by Education by Marriage Status in Manheim borough
0.5% of women with births in Manheim borough are unmarried. Women with the educational attainment of high school diploma are most likely to be married with 100.0% of them married at childbirth, while women with the educational attainment of less than high school are least likely to be married with 100.0% of them unmarried at childbirth.
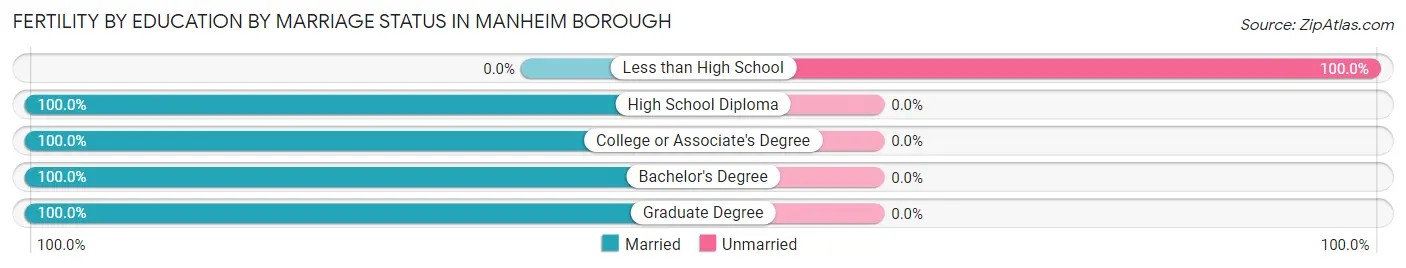
| Educational Attainment | Married | Unmarried |
| Less than High School | 0 (0.0%) | 1 (100.0%) |
| High School Diploma | 25 (100.0%) | 0 (0.0%) |
| College or Associate's Degree | 45 (100.0%) | 0 (0.0%) |
| Bachelor's Degree | 105 (100.0%) | 0 (0.0%) |
| Graduate Degree | 18 (100.0%) | 0 (0.0%) |
| Total | 193 (99.5%) | 1 (0.5%) |
Employment Characteristics in Manheim borough
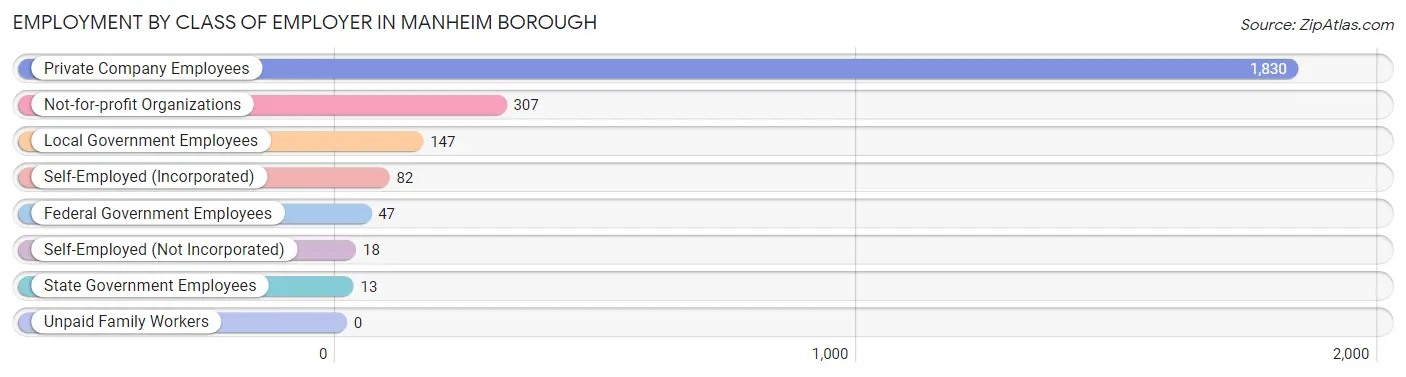
Employment by Class of Employer in Manheim borough
Among the 2,444 employed individuals in Manheim borough, private company employees (1,830 | 74.9%), not-for-profit organizations (307 | 12.6%), and local government employees (147 | 6.0%) make up the most common classes of employment.
| Employer Class | # Employees | % Employees |
| Private Company Employees | 1,830 | 74.9% |
| Self-Employed (Incorporated) | 82 | 3.4% |
| Self-Employed (Not Incorporated) | 18 | 0.7% |
| Not-for-profit Organizations | 307 | 12.6% |
| Local Government Employees | 147 | 6.0% |
| State Government Employees | 13 | 0.5% |
| Federal Government Employees | 47 | 1.9% |
| Unpaid Family Workers | 0 | 0.0% |
| Total | 2,444 | 100.0% |
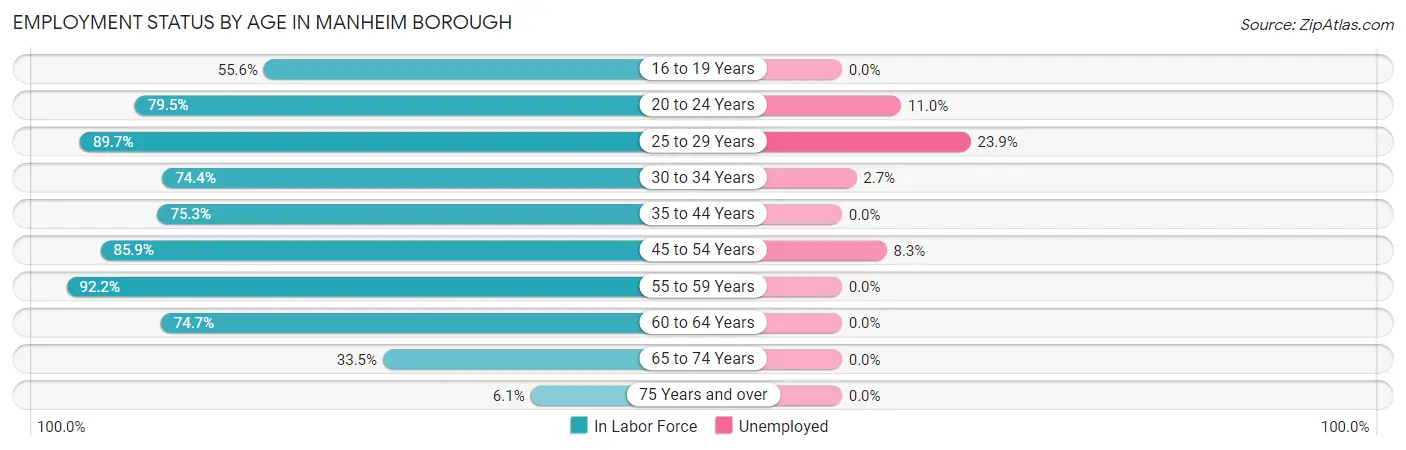
Employment Status by Age in Manheim borough
According to the labor force statistics for Manheim borough, out of the total population over 16 years of age (3,749), 70.6% or 2,647 individuals are in the labor force, with 5.8% or 154 of them unemployed. The age group with the highest labor force participation rate is 55 to 59 years, with 92.2% or 166 individuals in the labor force. Within the labor force, the 25 to 29 years age range has the highest percentage of unemployed individuals, with 23.9% or 67 of them being unemployed.
| Age Bracket | In Labor Force | Unemployed |
| 16 to 19 Years | 94 (55.6%) | 0 (0.0%) |
| 20 to 24 Years | 155 (79.5%) | 17 (11.0%) |
| 25 to 29 Years | 280 (89.7%) | 67 (23.9%) |
| 30 to 34 Years | 548 (74.4%) | 15 (2.7%) |
| 35 to 44 Years | 379 (75.3%) | 0 (0.0%) |
| 45 to 54 Years | 665 (85.9%) | 55 (8.3%) |
| 55 to 59 Years | 166 (92.2%) | 0 (0.0%) |
| 60 to 64 Years | 230 (74.7%) | 0 (0.0%) |
| 65 to 74 Years | 115 (33.5%) | 0 (0.0%) |
| 75 Years and over | 14 (6.1%) | 0 (0.0%) |
| Total | 2,647 (70.6%) | 154 (5.8%) |
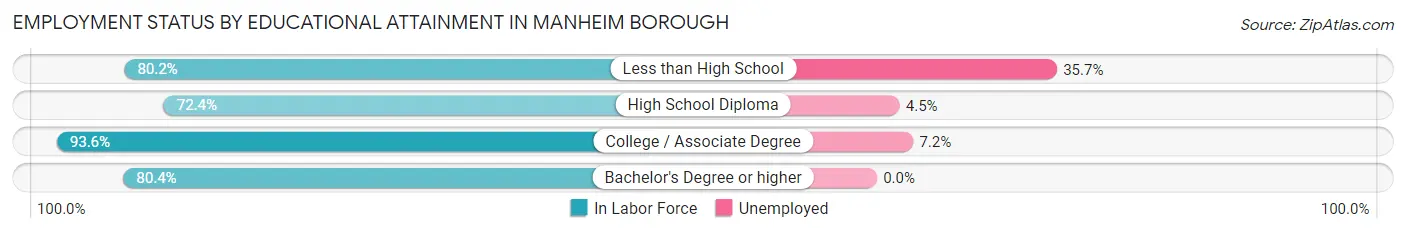
Employment Status by Educational Attainment in Manheim borough
According to labor force statistics for Manheim borough, 80.6% of individuals (2,268) out of the total population between 25 and 64 years of age (2,814) are in the labor force, with 6.0% or 136 of them being unemployed. The group with the highest labor force participation rate are those with the educational attainment of college / associate degree, with 93.6% or 655 individuals in the labor force. Within the labor force, individuals with less than high school education have the highest percentage of unemployment, with 35.7% or 55 of them being unemployed.
| Educational Attainment | In Labor Force | Unemployed |
| Less than High School | 154 (80.2%) | 69 (35.7%) |
| High School Diploma | 782 (72.4%) | 49 (4.5%) |
| College / Associate Degree | 655 (93.6%) | 50 (7.2%) |
| Bachelor's Degree or higher | 677 (80.4%) | 0 (0.0%) |
| Total | 2,268 (80.6%) | 169 (6.0%) |
Employment Occupations by Sex in Manheim borough
Management, Business, Science and Arts Occupations
The most common Management, Business, Science and Arts occupations in Manheim borough are Management (285 | 11.4%), Community & Social Service (206 | 8.3%), Education Instruction & Library (158 | 6.3%), Business & Financial (138 | 5.5%), and Health Diagnosing & Treating (135 | 5.4%).
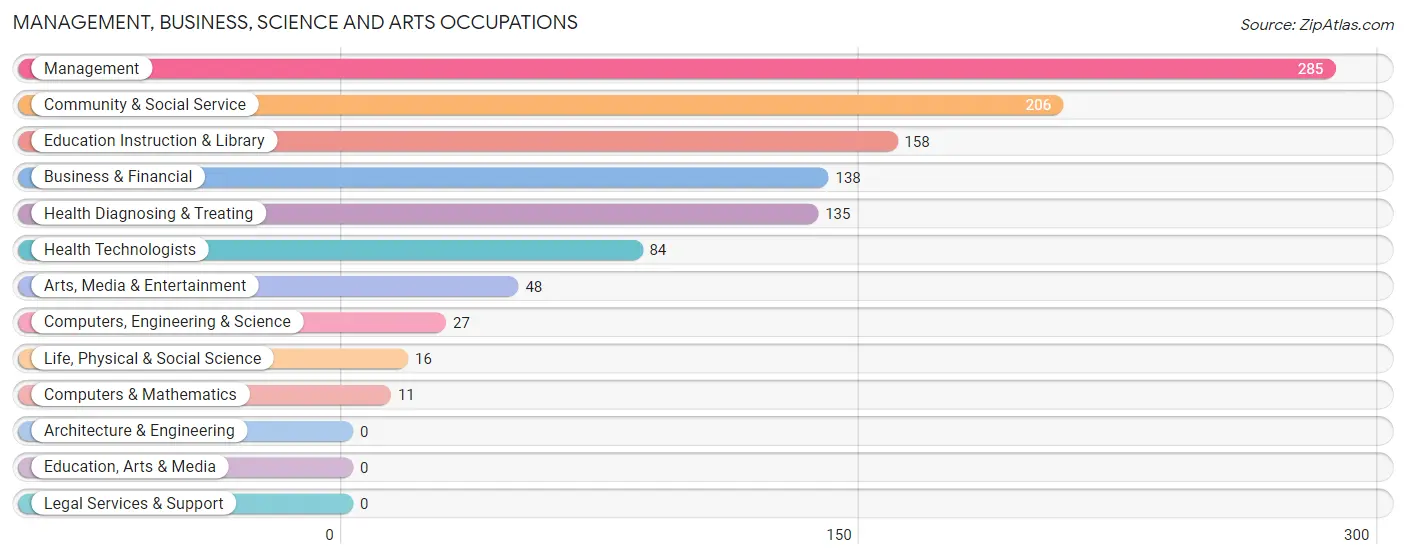
Management, Business, Science and Arts Occupations by Sex
Within the Management, Business, Science and Arts occupations in Manheim borough, the most male-oriented occupations are Life, Physical & Social Science (100.0%), Management (73.7%), and Health Diagnosing & Treating (61.5%), while the most female-oriented occupations are Computers & Mathematics (100.0%), Business & Financial (65.2%), and Health Technologists (61.9%).
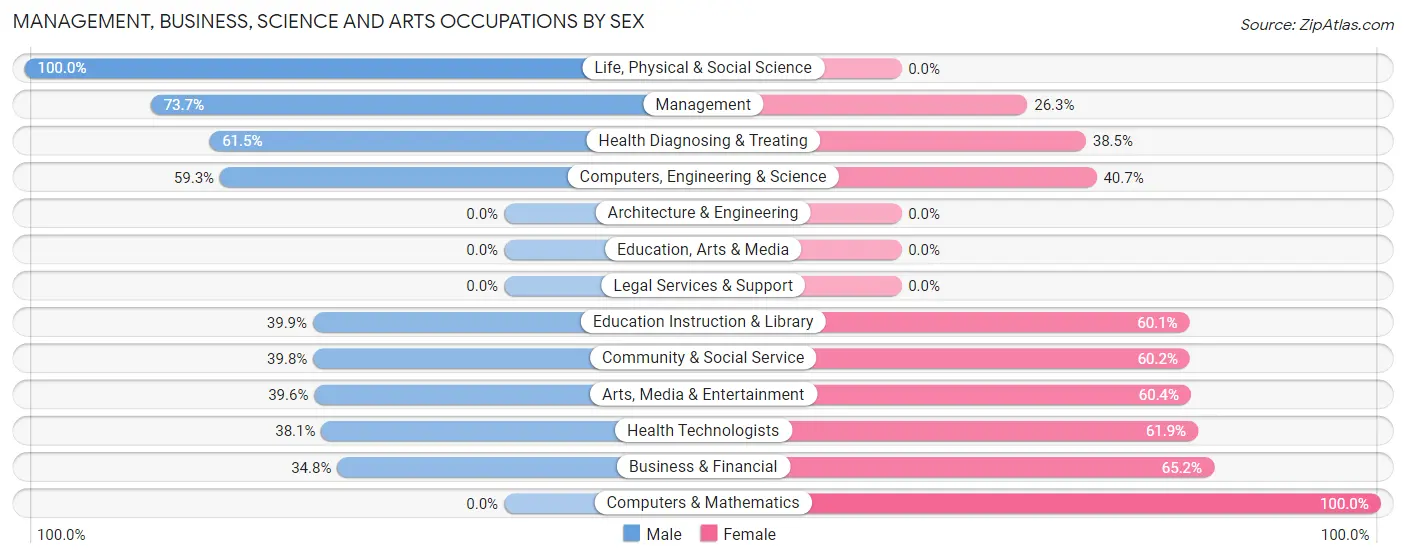
| Occupation | Male | Female |
| Management | 210 (73.7%) | 75 (26.3%) |
| Business & Financial | 48 (34.8%) | 90 (65.2%) |
| Computers, Engineering & Science | 16 (59.3%) | 11 (40.7%) |
| Computers & Mathematics | 0 (0.0%) | 11 (100.0%) |
| Architecture & Engineering | 0 (0.0%) | 0 (0.0%) |
| Life, Physical & Social Science | 16 (100.0%) | 0 (0.0%) |
| Community & Social Service | 82 (39.8%) | 124 (60.2%) |
| Education, Arts & Media | 0 (0.0%) | 0 (0.0%) |
| Legal Services & Support | 0 (0.0%) | 0 (0.0%) |
| Education Instruction & Library | 63 (39.9%) | 95 (60.1%) |
| Arts, Media & Entertainment | 19 (39.6%) | 29 (60.4%) |
| Health Diagnosing & Treating | 83 (61.5%) | 52 (38.5%) |
| Health Technologists | 32 (38.1%) | 52 (61.9%) |
| Total (Category) | 439 (55.5%) | 352 (44.5%) |
| Total (Overall) | 1,380 (55.4%) | 1,112 (44.6%) |
Services Occupations
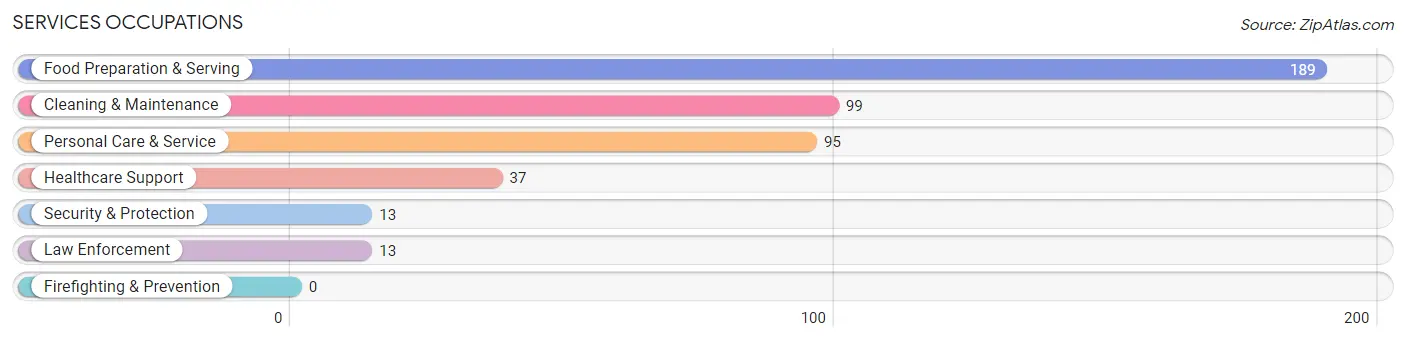
The most common Services occupations in Manheim borough are Food Preparation & Serving (189 | 7.6%), Cleaning & Maintenance (99 | 4.0%), Personal Care & Service (95 | 3.8%), Healthcare Support (37 | 1.5%), and Security & Protection (13 | 0.5%).
Services Occupations by Sex
Within the Services occupations in Manheim borough, the most male-oriented occupations are Security & Protection (100.0%), Law Enforcement (100.0%), and Cleaning & Maintenance (64.6%), while the most female-oriented occupations are Healthcare Support (100.0%), Personal Care & Service (100.0%), and Food Preparation & Serving (89.9%).
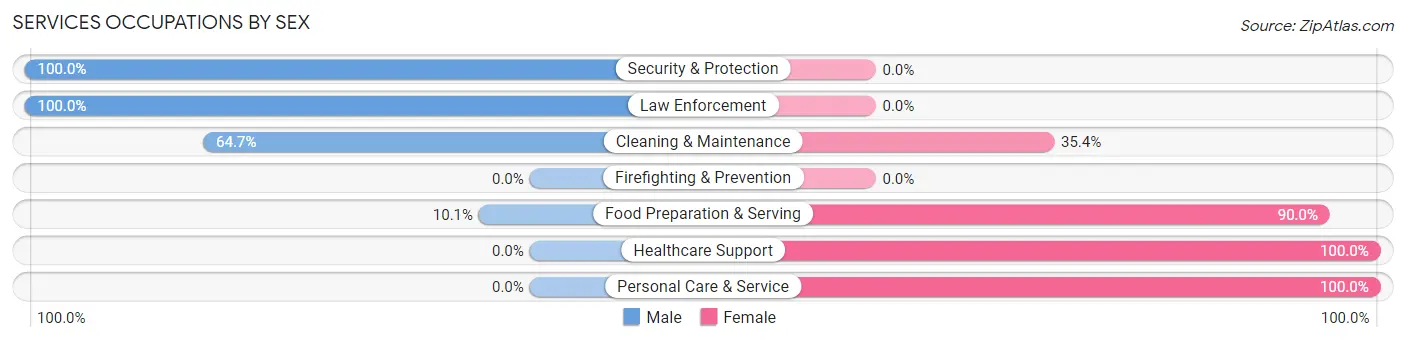
| Occupation | Male | Female |
| Healthcare Support | 0 (0.0%) | 37 (100.0%) |
| Security & Protection | 13 (100.0%) | 0 (0.0%) |
| Firefighting & Prevention | 0 (0.0%) | 0 (0.0%) |
| Law Enforcement | 13 (100.0%) | 0 (0.0%) |
| Food Preparation & Serving | 19 (10.1%) | 170 (89.9%) |
| Cleaning & Maintenance | 64 (64.6%) | 35 (35.3%) |
| Personal Care & Service | 0 (0.0%) | 95 (100.0%) |
| Total (Category) | 96 (22.2%) | 337 (77.8%) |
| Total (Overall) | 1,380 (55.4%) | 1,112 (44.6%) |
Sales and Office Occupations
The most common Sales and Office occupations in Manheim borough are Office & Administration (255 | 10.2%), and Sales & Related (241 | 9.7%).

Sales and Office Occupations by Sex
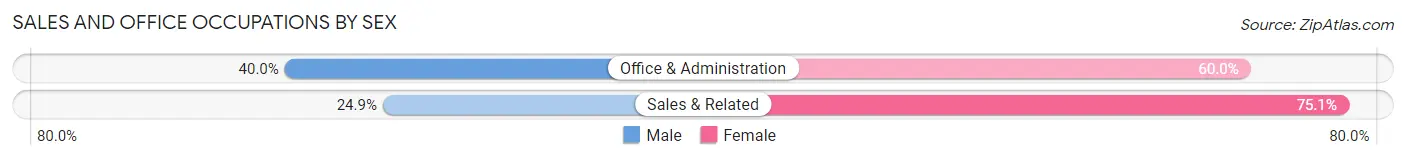
| Occupation | Male | Female |
| Sales & Related | 60 (24.9%) | 181 (75.1%) |
| Office & Administration | 102 (40.0%) | 153 (60.0%) |
| Total (Category) | 162 (32.7%) | 334 (67.3%) |
| Total (Overall) | 1,380 (55.4%) | 1,112 (44.6%) |
Natural Resources, Construction and Maintenance Occupations
The most common Natural Resources, Construction and Maintenance occupations in Manheim borough are Construction & Extraction (175 | 7.0%), Installation, Maintenance & Repair (65 | 2.6%), and Farming, Fishing & Forestry (35 | 1.4%).
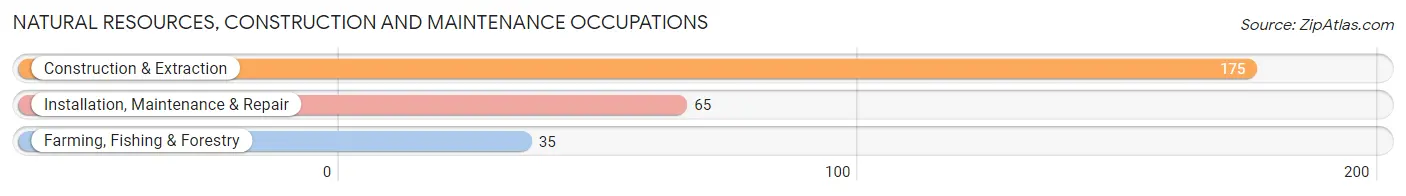
Natural Resources, Construction and Maintenance Occupations by Sex

| Occupation | Male | Female |
| Farming, Fishing & Forestry | 30 (85.7%) | 5 (14.3%) |
| Construction & Extraction | 175 (100.0%) | 0 (0.0%) |
| Installation, Maintenance & Repair | 65 (100.0%) | 0 (0.0%) |
| Total (Category) | 270 (98.2%) | 5 (1.8%) |
| Total (Overall) | 1,380 (55.4%) | 1,112 (44.6%) |
Production, Transportation and Moving Occupations
The most common Production, Transportation and Moving occupations in Manheim borough are Production (282 | 11.3%), Transportation (113 | 4.5%), and Material Moving (102 | 4.1%).
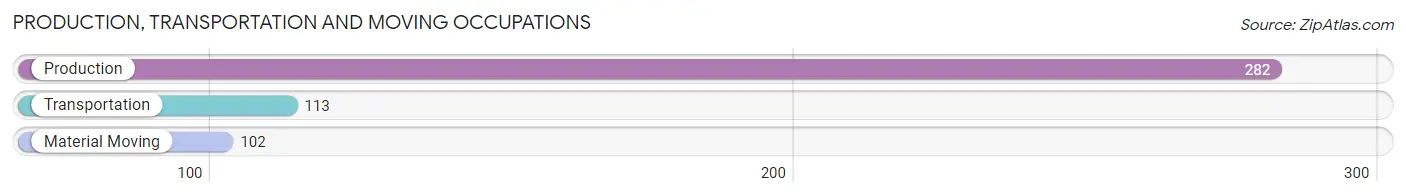
Production, Transportation and Moving Occupations by Sex
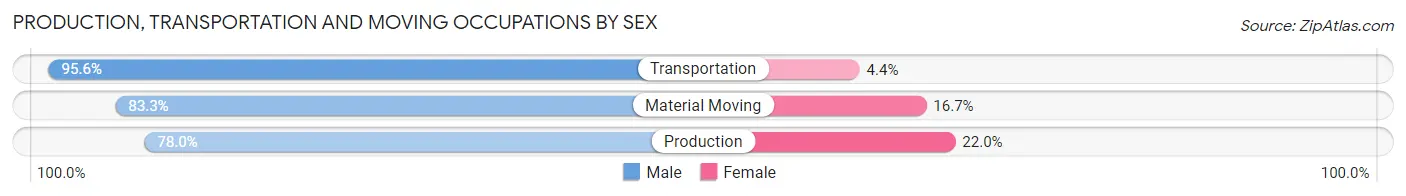
| Occupation | Male | Female |
| Production | 220 (78.0%) | 62 (22.0%) |
| Transportation | 108 (95.6%) | 5 (4.4%) |
| Material Moving | 85 (83.3%) | 17 (16.7%) |
| Total (Category) | 413 (83.1%) | 84 (16.9%) |
| Total (Overall) | 1,380 (55.4%) | 1,112 (44.6%) |
Employment Industries by Sex in Manheim borough
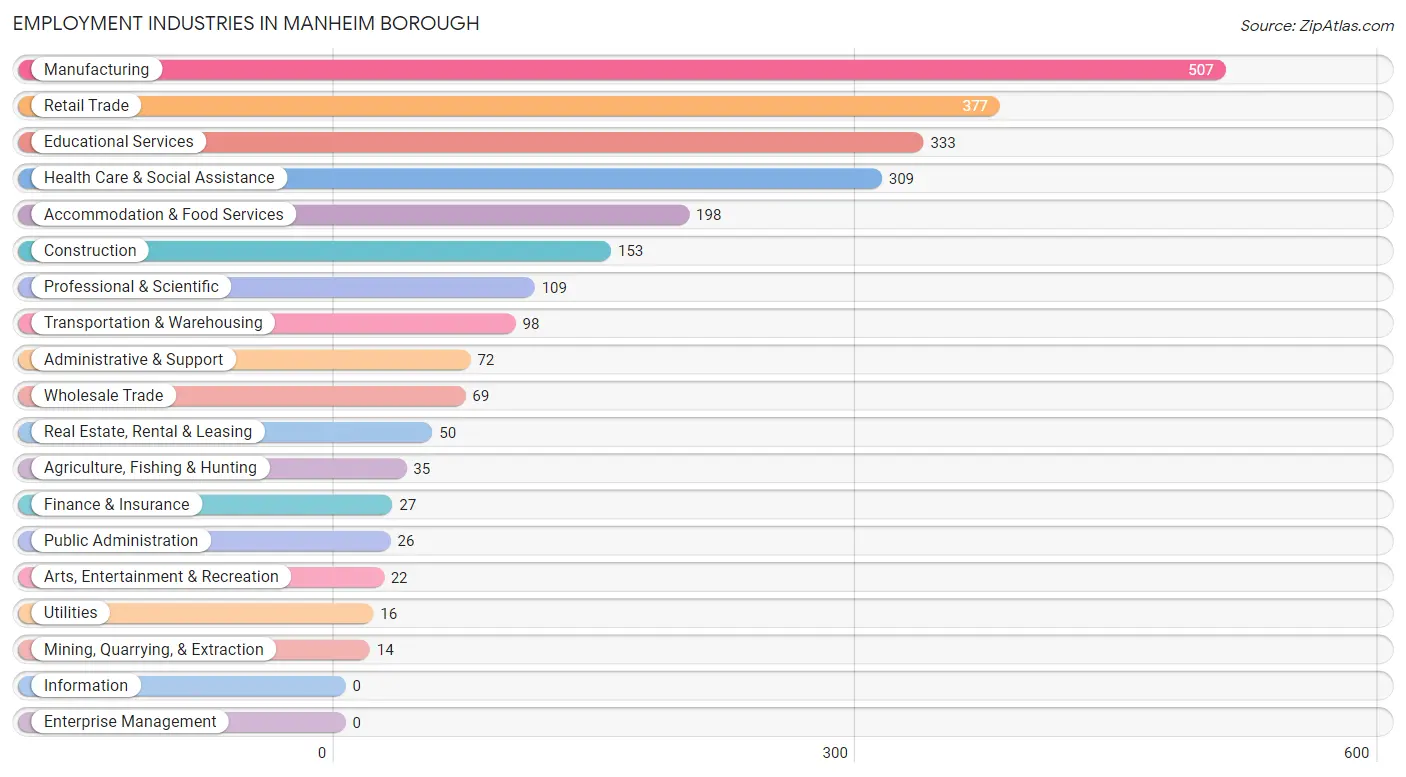
Employment Industries in Manheim borough
The major employment industries in Manheim borough include Manufacturing (507 | 20.3%), Retail Trade (377 | 15.1%), Educational Services (333 | 13.4%), Health Care & Social Assistance (309 | 12.4%), and Accommodation & Food Services (198 | 8.0%).
Employment Industries by Sex in Manheim borough
The Manheim borough industries that see more men than women are Mining, Quarrying, & Extraction (100.0%), Utilities (100.0%), and Wholesale Trade (88.4%), whereas the industries that tend to have a higher number of women are Finance & Insurance (100.0%), Arts, Entertainment & Recreation (100.0%), and Accommodation & Food Services (88.9%).
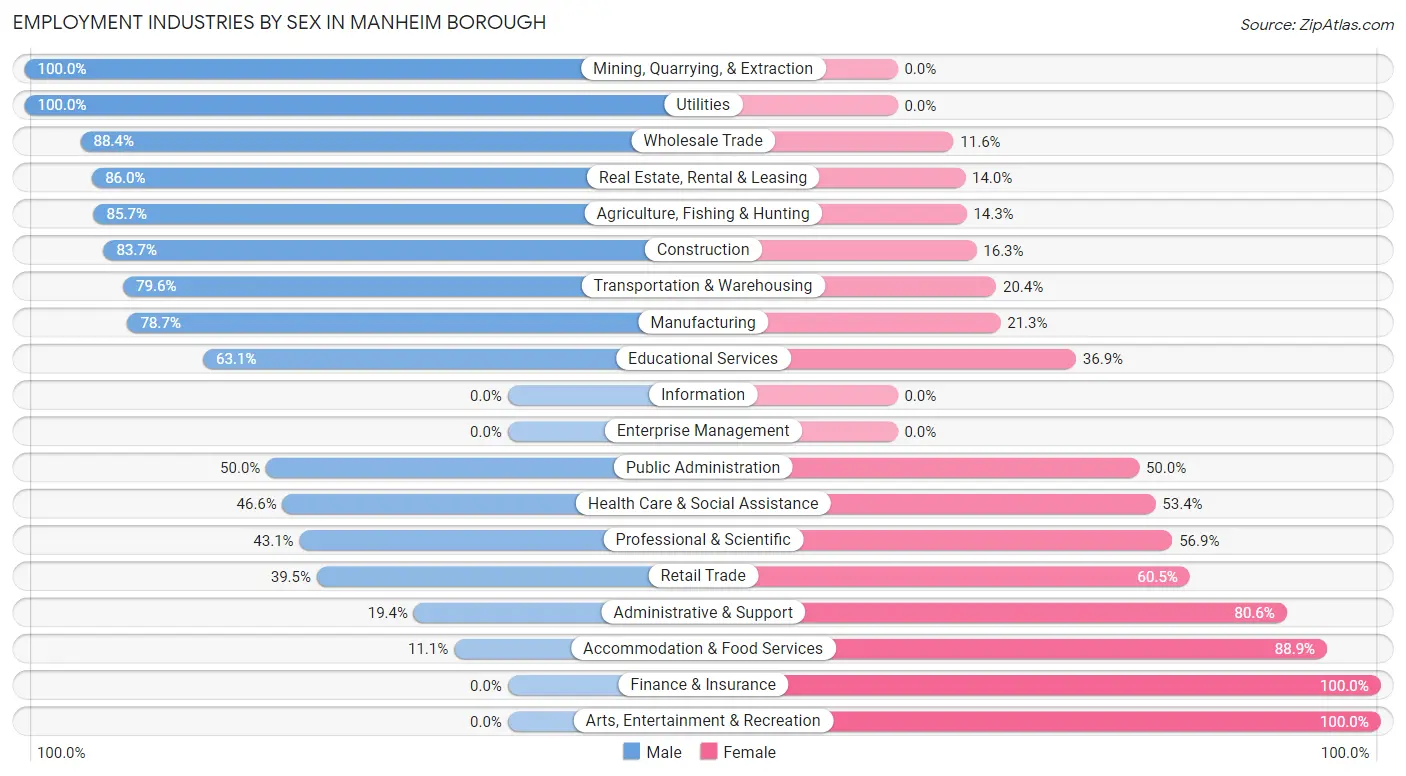
| Industry | Male | Female |
| Agriculture, Fishing & Hunting | 30 (85.7%) | 5 (14.3%) |
| Mining, Quarrying, & Extraction | 14 (100.0%) | 0 (0.0%) |
| Construction | 128 (83.7%) | 25 (16.3%) |
| Manufacturing | 399 (78.7%) | 108 (21.3%) |
| Wholesale Trade | 61 (88.4%) | 8 (11.6%) |
| Retail Trade | 149 (39.5%) | 228 (60.5%) |
| Transportation & Warehousing | 78 (79.6%) | 20 (20.4%) |
| Utilities | 16 (100.0%) | 0 (0.0%) |
| Information | 0 (0.0%) | 0 (0.0%) |
| Finance & Insurance | 0 (0.0%) | 27 (100.0%) |
| Real Estate, Rental & Leasing | 43 (86.0%) | 7 (14.0%) |
| Professional & Scientific | 47 (43.1%) | 62 (56.9%) |
| Enterprise Management | 0 (0.0%) | 0 (0.0%) |
| Administrative & Support | 14 (19.4%) | 58 (80.6%) |
| Educational Services | 210 (63.1%) | 123 (36.9%) |
| Health Care & Social Assistance | 144 (46.6%) | 165 (53.4%) |
| Arts, Entertainment & Recreation | 0 (0.0%) | 22 (100.0%) |
| Accommodation & Food Services | 22 (11.1%) | 176 (88.9%) |
| Public Administration | 13 (50.0%) | 13 (50.0%) |
| Total | 1,380 (55.4%) | 1,112 (44.6%) |
Education in Manheim borough
School Enrollment in Manheim borough
The most common levels of schooling among the 1,058 students in Manheim borough are elementary school (342 | 32.3%), middle school (235 | 22.2%), and high school (192 | 18.1%).
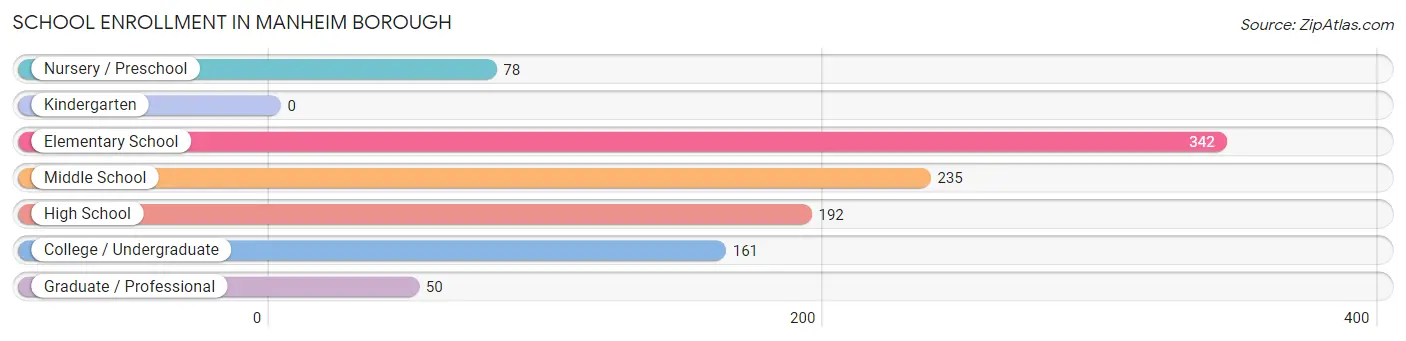
| School Level | # Students | % Students |
| Nursery / Preschool | 78 | 7.4% |
| Kindergarten | 0 | 0.0% |
| Elementary School | 342 | 32.3% |
| Middle School | 235 | 22.2% |
| High School | 192 | 18.1% |
| College / Undergraduate | 161 | 15.2% |
| Graduate / Professional | 50 | 4.7% |
| Total | 1,058 | 100.0% |
School Enrollment by Age by Funding Source in Manheim borough
Out of a total of 1,058 students who are enrolled in schools in Manheim borough, 247 (23.3%) attend a private institution, while the remaining 811 (76.7%) are enrolled in public schools. The age group of 3 to 4 year olds has the highest likelihood of being enrolled in private schools, with 60 (76.9% in the age bracket) enrolled. Conversely, the age group of 15 to 17 year olds has the lowest likelihood of being enrolled in a private school, with 191 (100.0% in the age bracket) attending a public institution.
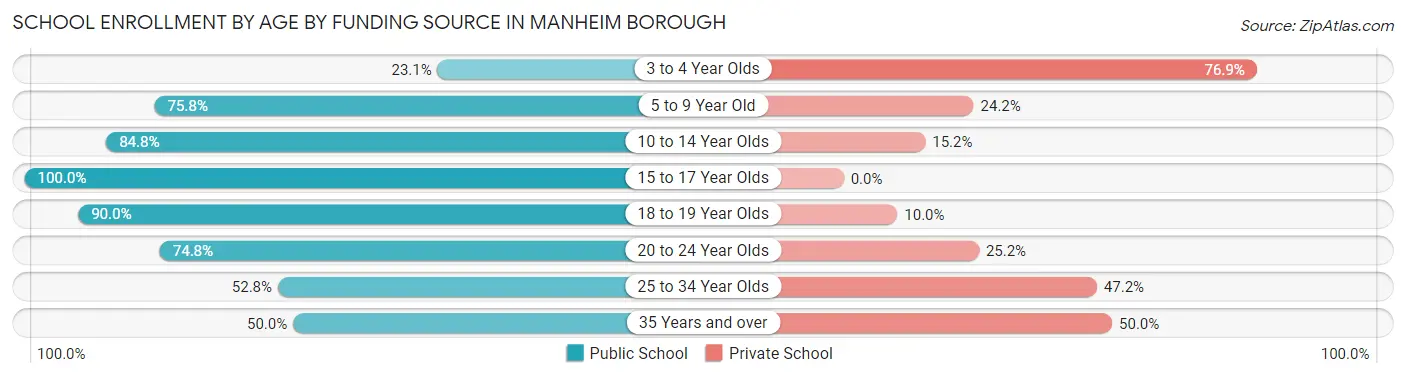
| Age Bracket | Public School | Private School |
| 3 to 4 Year Olds | 18 (23.1%) | 60 (76.9%) |
| 5 to 9 Year Old | 238 (75.8%) | 76 (24.2%) |
| 10 to 14 Year Olds | 223 (84.8%) | 40 (15.2%) |
| 15 to 17 Year Olds | 191 (100.0%) | 0 (0.0%) |
| 18 to 19 Year Olds | 9 (90.0%) | 1 (10.0%) |
| 20 to 24 Year Olds | 92 (74.8%) | 31 (25.2%) |
| 25 to 34 Year Olds | 28 (52.8%) | 25 (47.2%) |
| 35 Years and over | 13 (50.0%) | 13 (50.0%) |
| Total | 811 (76.7%) | 247 (23.3%) |
Educational Attainment by Field of Study in Manheim borough
Education (266 | 25.1%), business (185 | 17.5%), social sciences (154 | 14.5%), science & technology (154 | 14.5%), and bio, nature & agricultural (72 | 6.8%) are the most common fields of study among 1,059 individuals in Manheim borough who have obtained a bachelor's degree or higher.
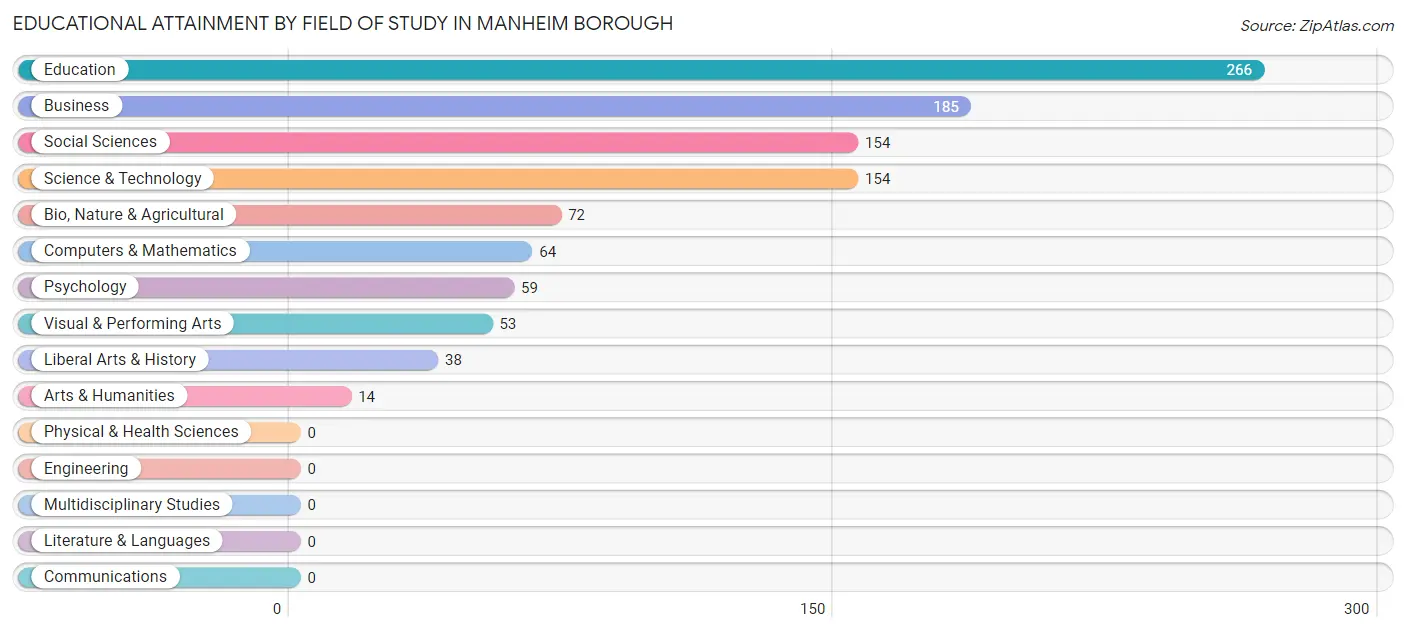
| Field of Study | # Graduates | % Graduates |
| Computers & Mathematics | 64 | 6.0% |
| Bio, Nature & Agricultural | 72 | 6.8% |
| Physical & Health Sciences | 0 | 0.0% |
| Psychology | 59 | 5.6% |
| Social Sciences | 154 | 14.5% |
| Engineering | 0 | 0.0% |
| Multidisciplinary Studies | 0 | 0.0% |
| Science & Technology | 154 | 14.5% |
| Business | 185 | 17.5% |
| Education | 266 | 25.1% |
| Literature & Languages | 0 | 0.0% |
| Liberal Arts & History | 38 | 3.6% |
| Visual & Performing Arts | 53 | 5.0% |
| Communications | 0 | 0.0% |
| Arts & Humanities | 14 | 1.3% |
| Total | 1,059 | 100.0% |
Transportation & Commute in Manheim borough
Vehicle Availability by Sex in Manheim borough
The most prevalent vehicle ownership categories in Manheim borough are males with 2 vehicles (679, accounting for 50.7%) and females with 2 vehicles (497, making up 62.2%).
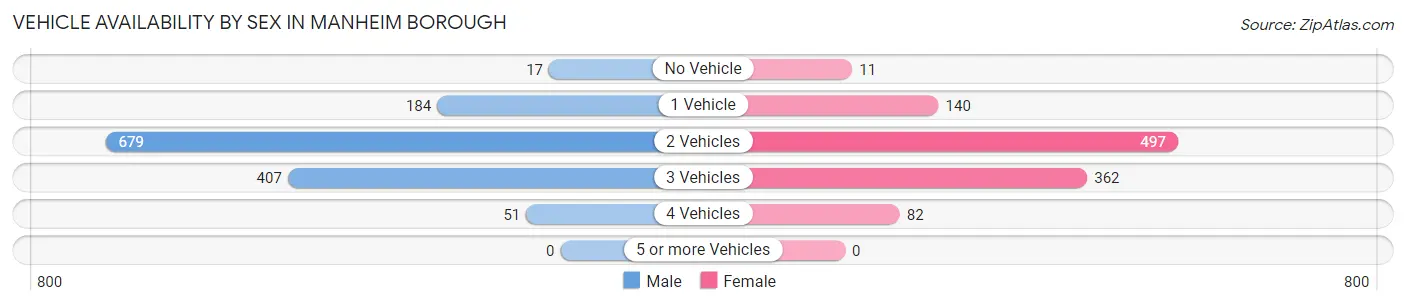
| Vehicles Available | Male | Female |
| No Vehicle | 17 (1.3%) | 11 (1.0%) |
| 1 Vehicle | 184 (13.8%) | 140 (12.8%) |
| 2 Vehicles | 679 (50.7%) | 497 (45.5%) |
| 3 Vehicles | 407 (30.4%) | 362 (33.2%) |
| 4 Vehicles | 51 (3.8%) | 82 (7.5%) |
| 5 or more Vehicles | 0 (0.0%) | 0 (0.0%) |
| Total | 1,338 (100.0%) | 1,092 (100.0%) |
Commute Time in Manheim borough
The most frequently occuring commute durations in Manheim borough are 5 to 9 minutes (370 commuters, 16.7%), 30 to 34 minutes (323 commuters, 14.6%), and 25 to 29 minutes (292 commuters, 13.2%).
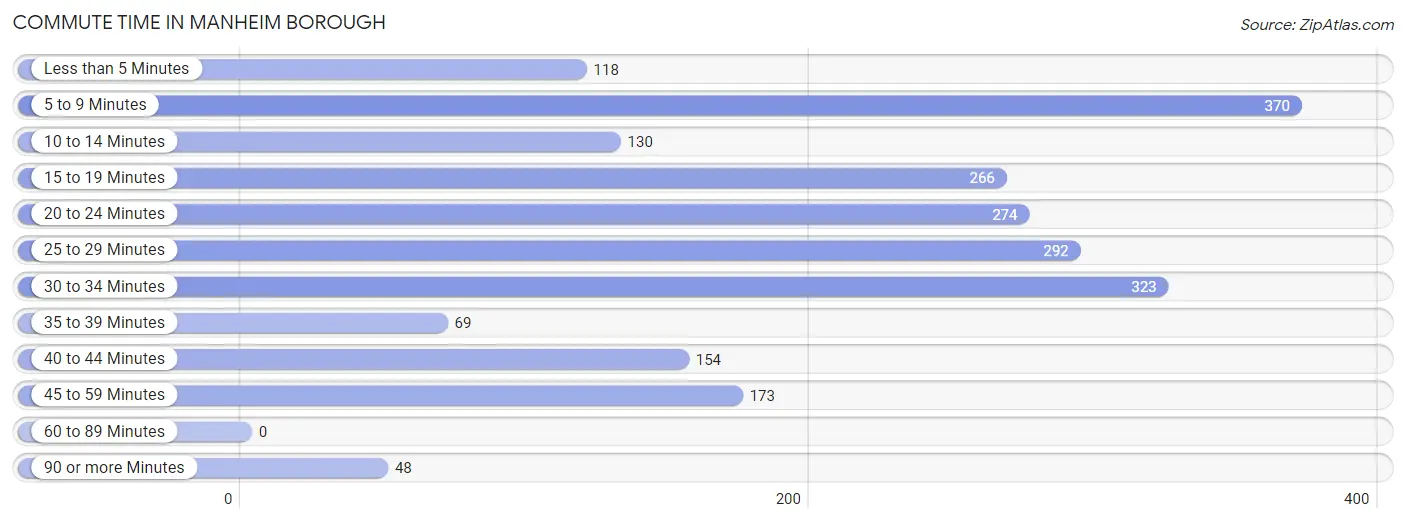
| Commute Time | # Commuters | % Commuters |
| Less than 5 Minutes | 118 | 5.3% |
| 5 to 9 Minutes | 370 | 16.7% |
| 10 to 14 Minutes | 130 | 5.9% |
| 15 to 19 Minutes | 266 | 12.0% |
| 20 to 24 Minutes | 274 | 12.4% |
| 25 to 29 Minutes | 292 | 13.2% |
| 30 to 34 Minutes | 323 | 14.6% |
| 35 to 39 Minutes | 69 | 3.1% |
| 40 to 44 Minutes | 154 | 7.0% |
| 45 to 59 Minutes | 173 | 7.8% |
| 60 to 89 Minutes | 0 | 0.0% |
| 90 or more Minutes | 48 | 2.2% |
Commute Time by Sex in Manheim borough
The most common commute times in Manheim borough are 5 to 9 minutes (251 commuters, 20.9%) for males and 15 to 19 minutes (200 commuters, 19.7%) for females.
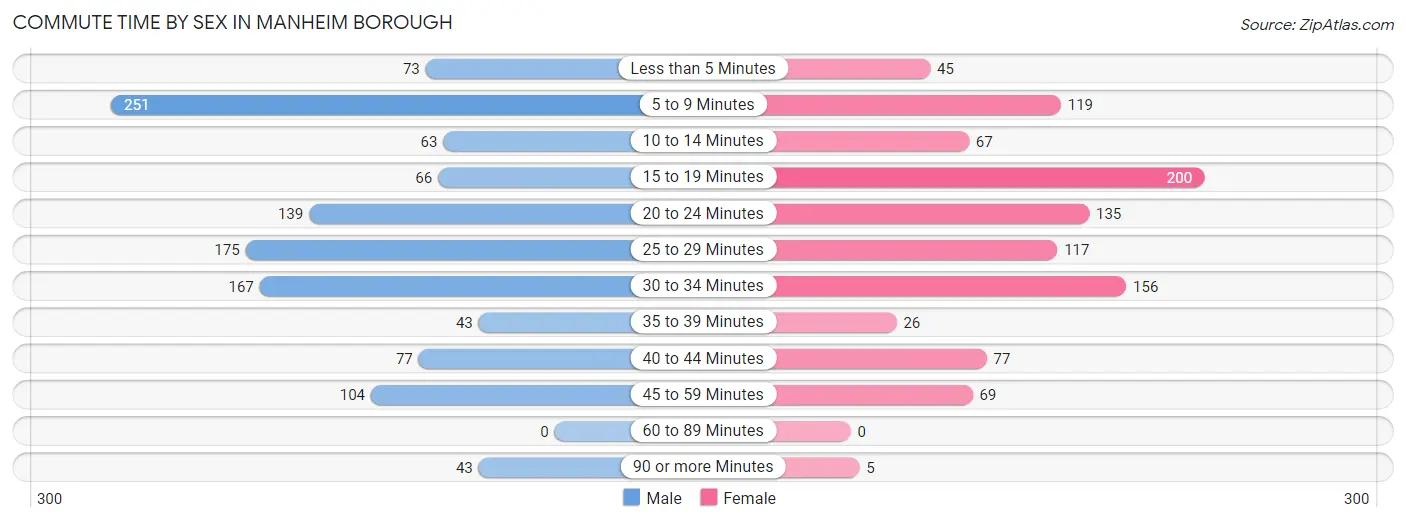
| Commute Time | Male | Female |
| Less than 5 Minutes | 73 (6.1%) | 45 (4.4%) |
| 5 to 9 Minutes | 251 (20.9%) | 119 (11.7%) |
| 10 to 14 Minutes | 63 (5.2%) | 67 (6.6%) |
| 15 to 19 Minutes | 66 (5.5%) | 200 (19.7%) |
| 20 to 24 Minutes | 139 (11.6%) | 135 (13.3%) |
| 25 to 29 Minutes | 175 (14.6%) | 117 (11.5%) |
| 30 to 34 Minutes | 167 (13.9%) | 156 (15.3%) |
| 35 to 39 Minutes | 43 (3.6%) | 26 (2.6%) |
| 40 to 44 Minutes | 77 (6.4%) | 77 (7.6%) |
| 45 to 59 Minutes | 104 (8.7%) | 69 (6.8%) |
| 60 to 89 Minutes | 0 (0.0%) | 0 (0.0%) |
| 90 or more Minutes | 43 (3.6%) | 5 (0.5%) |
Time of Departure to Work by Sex in Manheim borough
The most frequent times of departure to work in Manheim borough are 7:00 AM to 7:29 AM (222, 18.5%) for males and 7:30 AM to 7:59 AM (225, 22.2%) for females.
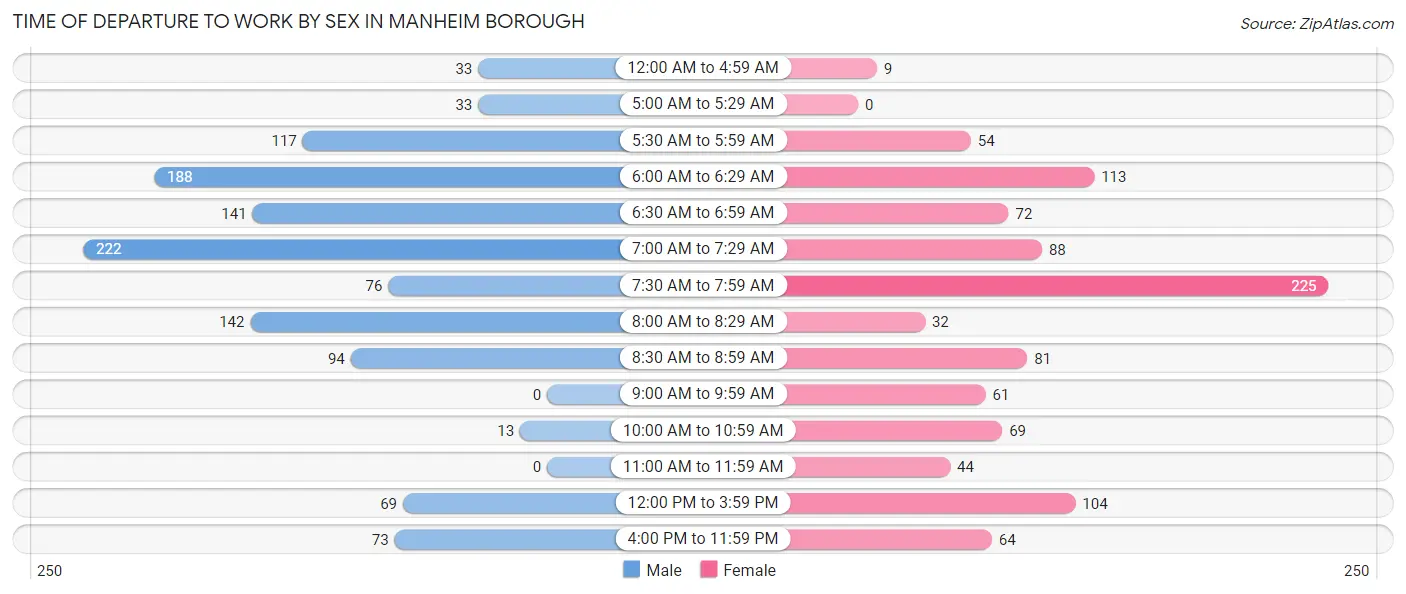
| Time of Departure | Male | Female |
| 12:00 AM to 4:59 AM | 33 (2.8%) | 9 (0.9%) |
| 5:00 AM to 5:29 AM | 33 (2.8%) | 0 (0.0%) |
| 5:30 AM to 5:59 AM | 117 (9.7%) | 54 (5.3%) |
| 6:00 AM to 6:29 AM | 188 (15.7%) | 113 (11.1%) |
| 6:30 AM to 6:59 AM | 141 (11.7%) | 72 (7.1%) |
| 7:00 AM to 7:29 AM | 222 (18.5%) | 88 (8.7%) |
| 7:30 AM to 7:59 AM | 76 (6.3%) | 225 (22.2%) |
| 8:00 AM to 8:29 AM | 142 (11.8%) | 32 (3.2%) |
| 8:30 AM to 8:59 AM | 94 (7.8%) | 81 (8.0%) |
| 9:00 AM to 9:59 AM | 0 (0.0%) | 61 (6.0%) |
| 10:00 AM to 10:59 AM | 13 (1.1%) | 69 (6.8%) |
| 11:00 AM to 11:59 AM | 0 (0.0%) | 44 (4.3%) |
| 12:00 PM to 3:59 PM | 69 (5.8%) | 104 (10.2%) |
| 4:00 PM to 11:59 PM | 73 (6.1%) | 64 (6.3%) |
| Total | 1,201 (100.0%) | 1,016 (100.0%) |
Housing Occupancy in Manheim borough
Occupancy by Ownership in Manheim borough
Of the total 1,922 dwellings in Manheim borough, owner-occupied units account for 1,321 (68.7%), while renter-occupied units make up 601 (31.3%).
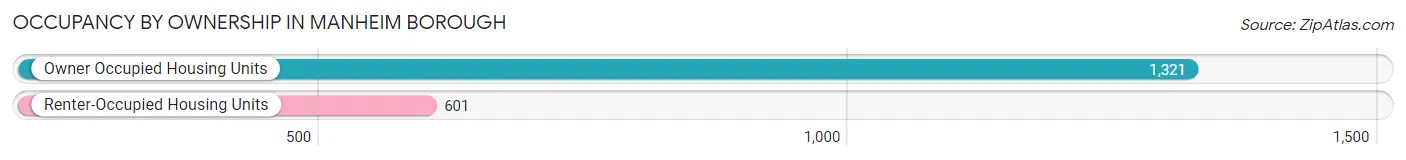
| Occupancy | # Housing Units | % Housing Units |
| Owner Occupied Housing Units | 1,321 | 68.7% |
| Renter-Occupied Housing Units | 601 | 31.3% |
| Total Occupied Housing Units | 1,922 | 100.0% |
Occupancy by Household Size in Manheim borough
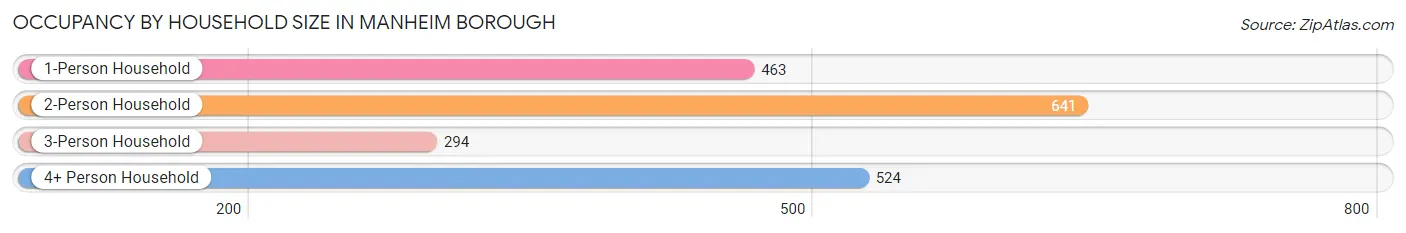
| Household Size | # Housing Units | % Housing Units |
| 1-Person Household | 463 | 24.1% |
| 2-Person Household | 641 | 33.4% |
| 3-Person Household | 294 | 15.3% |
| 4+ Person Household | 524 | 27.3% |
| Total Housing Units | 1,922 | 100.0% |
Occupancy by Ownership by Household Size in Manheim borough
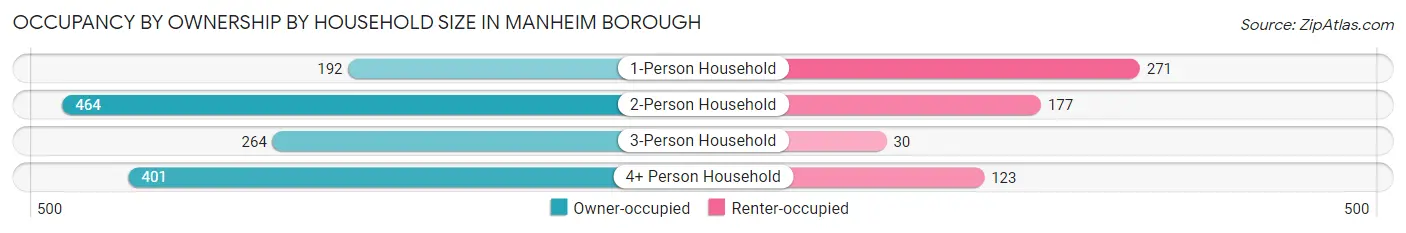
| Household Size | Owner-occupied | Renter-occupied |
| 1-Person Household | 192 (41.5%) | 271 (58.5%) |
| 2-Person Household | 464 (72.4%) | 177 (27.6%) |
| 3-Person Household | 264 (89.8%) | 30 (10.2%) |
| 4+ Person Household | 401 (76.5%) | 123 (23.5%) |
| Total Housing Units | 1,321 (68.7%) | 601 (31.3%) |
Occupancy by Educational Attainment in Manheim borough
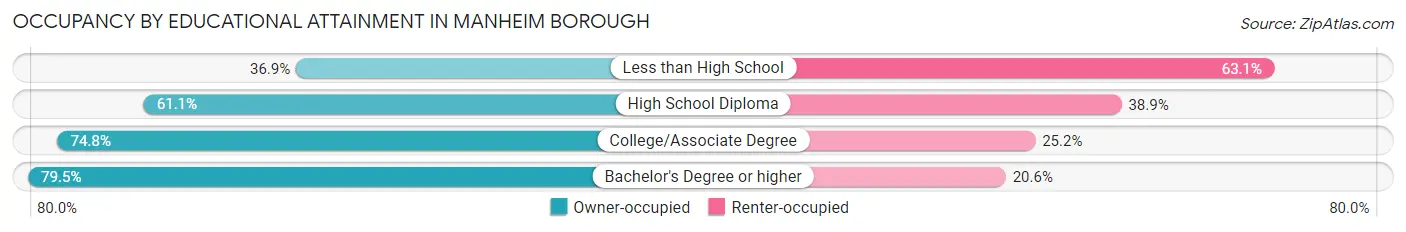
| Household Size | Owner-occupied | Renter-occupied |
| Less than High School | 41 (36.9%) | 70 (63.1%) |
| High School Diploma | 460 (61.1%) | 293 (38.9%) |
| College/Associate Degree | 329 (74.8%) | 111 (25.2%) |
| Bachelor's Degree or higher | 491 (79.4%) | 127 (20.5%) |
Occupancy by Age of Householder in Manheim borough
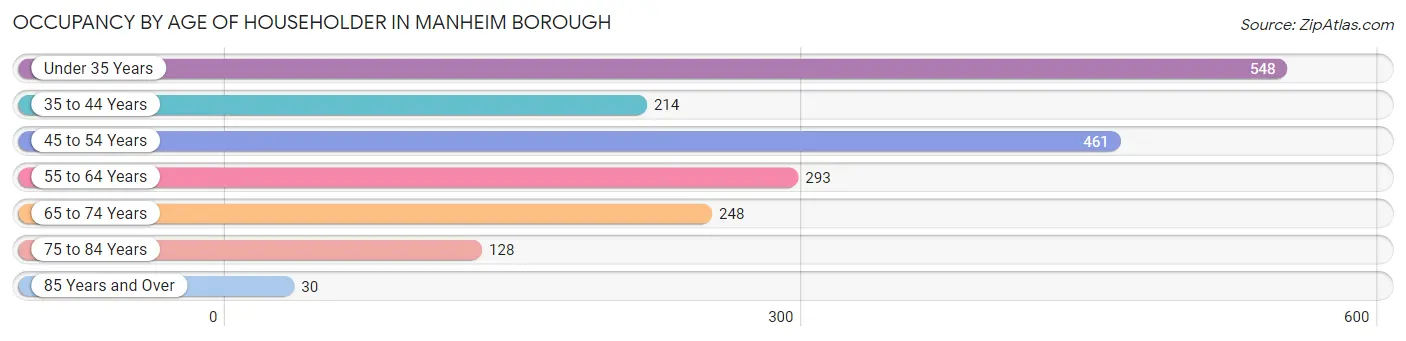
| Age Bracket | # Households | % Households |
| Under 35 Years | 548 | 28.5% |
| 35 to 44 Years | 214 | 11.1% |
| 45 to 54 Years | 461 | 24.0% |
| 55 to 64 Years | 293 | 15.2% |
| 65 to 74 Years | 248 | 12.9% |
| 75 to 84 Years | 128 | 6.7% |
| 85 Years and Over | 30 | 1.6% |
| Total | 1,922 | 100.0% |
Housing Finances in Manheim borough
Median Income by Occupancy in Manheim borough
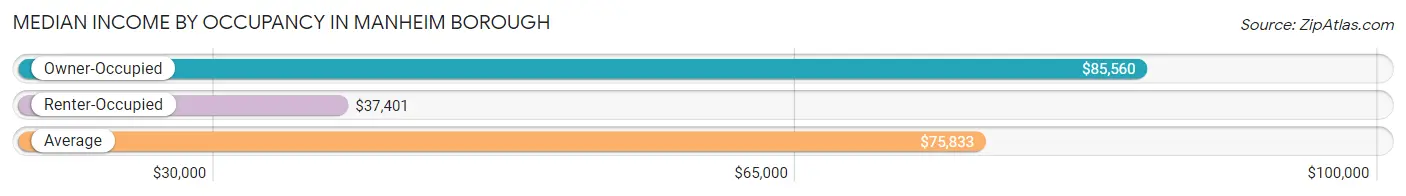
| Occupancy Type | # Households | Median Income |
| Owner-Occupied | 1,321 (68.7%) | $85,560 |
| Renter-Occupied | 601 (31.3%) | $37,401 |
| Average | 1,922 (100.0%) | $75,833 |
Occupancy by Householder Income Bracket in Manheim borough
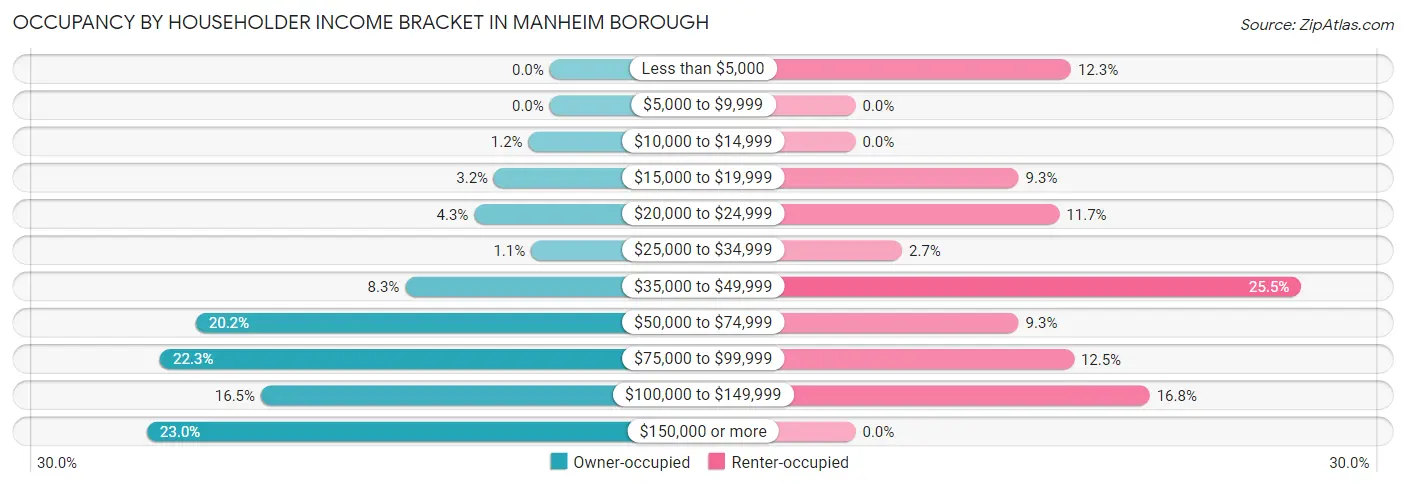
| Income Bracket | Owner-occupied | Renter-occupied |
| Less than $5,000 | 0 (0.0%) | 74 (12.3%) |
| $5,000 to $9,999 | 0 (0.0%) | 0 (0.0%) |
| $10,000 to $14,999 | 16 (1.2%) | 0 (0.0%) |
| $15,000 to $19,999 | 42 (3.2%) | 56 (9.3%) |
| $20,000 to $24,999 | 57 (4.3%) | 70 (11.7%) |
| $25,000 to $34,999 | 14 (1.1%) | 16 (2.7%) |
| $35,000 to $49,999 | 109 (8.3%) | 153 (25.5%) |
| $50,000 to $74,999 | 267 (20.2%) | 56 (9.3%) |
| $75,000 to $99,999 | 294 (22.3%) | 75 (12.5%) |
| $100,000 to $149,999 | 218 (16.5%) | 101 (16.8%) |
| $150,000 or more | 304 (23.0%) | 0 (0.0%) |
| Total | 1,321 (100.0%) | 601 (100.0%) |
Monthly Housing Cost Tiers in Manheim borough
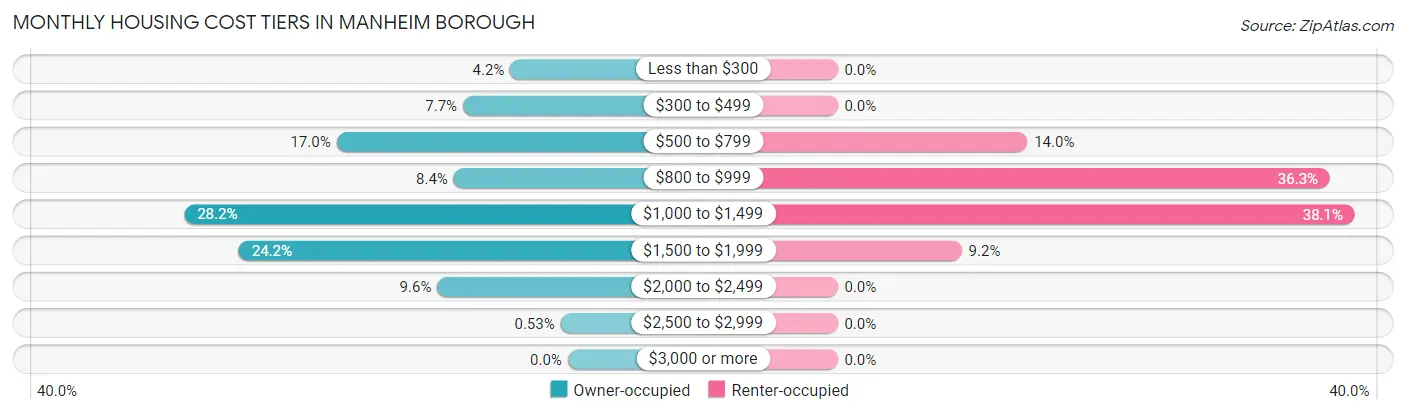
| Monthly Cost | Owner-occupied | Renter-occupied |
| Less than $300 | 56 (4.2%) | 0 (0.0%) |
| $300 to $499 | 102 (7.7%) | 0 (0.0%) |
| $500 to $799 | 225 (17.0%) | 84 (14.0%) |
| $800 to $999 | 111 (8.4%) | 218 (36.3%) |
| $1,000 to $1,499 | 373 (28.2%) | 229 (38.1%) |
| $1,500 to $1,999 | 320 (24.2%) | 55 (9.1%) |
| $2,000 to $2,499 | 127 (9.6%) | 0 (0.0%) |
| $2,500 to $2,999 | 7 (0.5%) | 0 (0.0%) |
| $3,000 or more | 0 (0.0%) | 0 (0.0%) |
| Total | 1,321 (100.0%) | 601 (100.0%) |
Physical Housing Characteristics in Manheim borough
Housing Structures in Manheim borough
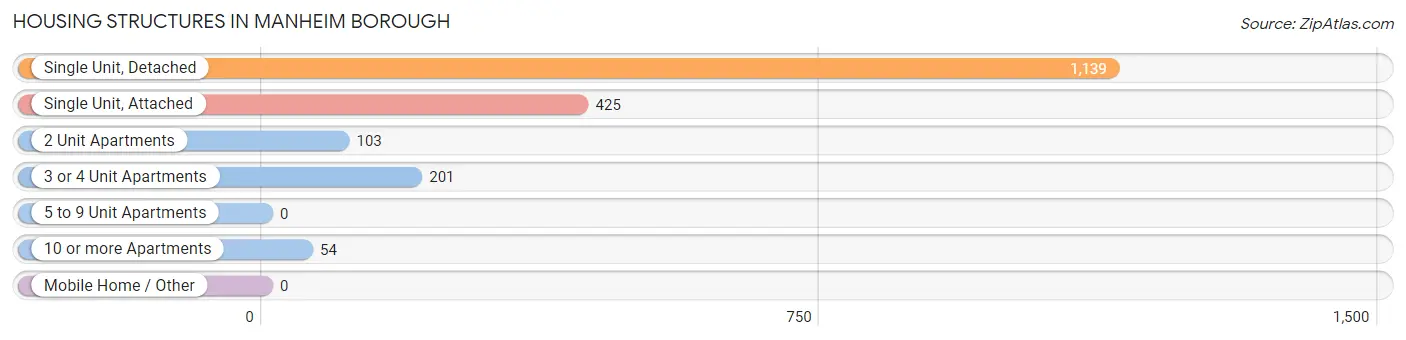
| Structure Type | # Housing Units | % Housing Units |
| Single Unit, Detached | 1,139 | 59.3% |
| Single Unit, Attached | 425 | 22.1% |
| 2 Unit Apartments | 103 | 5.4% |
| 3 or 4 Unit Apartments | 201 | 10.5% |
| 5 to 9 Unit Apartments | 0 | 0.0% |
| 10 or more Apartments | 54 | 2.8% |
| Mobile Home / Other | 0 | 0.0% |
| Total | 1,922 | 100.0% |
Housing Structures by Occupancy in Manheim borough
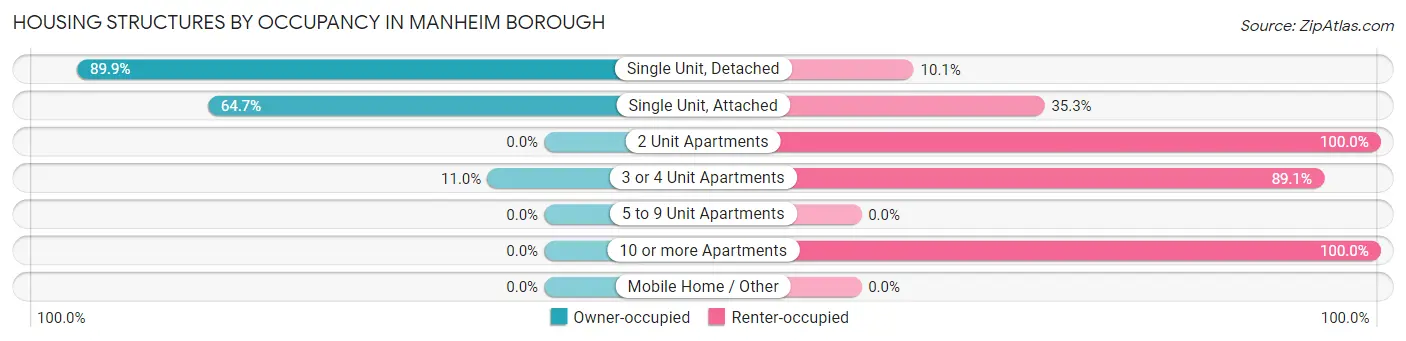
| Structure Type | Owner-occupied | Renter-occupied |
| Single Unit, Detached | 1,024 (89.9%) | 115 (10.1%) |
| Single Unit, Attached | 275 (64.7%) | 150 (35.3%) |
| 2 Unit Apartments | 0 (0.0%) | 103 (100.0%) |
| 3 or 4 Unit Apartments | 22 (11.0%) | 179 (89.0%) |
| 5 to 9 Unit Apartments | 0 (0.0%) | 0 (0.0%) |
| 10 or more Apartments | 0 (0.0%) | 54 (100.0%) |
| Mobile Home / Other | 0 (0.0%) | 0 (0.0%) |
| Total | 1,321 (68.7%) | 601 (31.3%) |
Housing Structures by Number of Rooms in Manheim borough
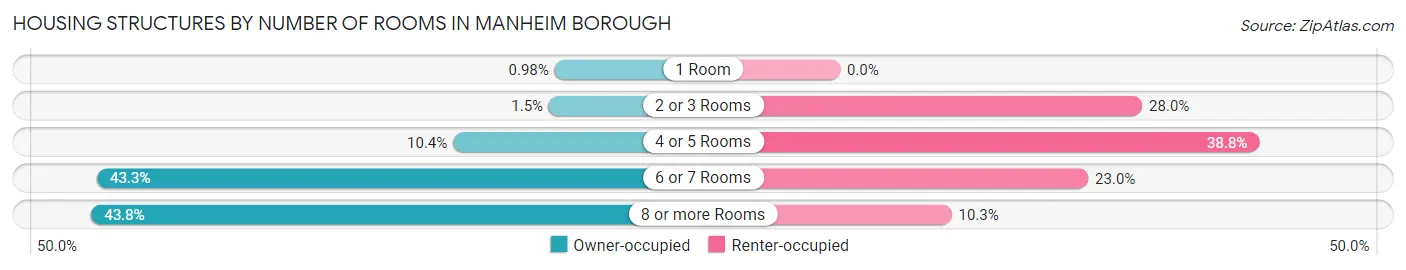
| Number of Rooms | Owner-occupied | Renter-occupied |
| 1 Room | 13 (1.0%) | 0 (0.0%) |
| 2 or 3 Rooms | 20 (1.5%) | 168 (28.0%) |
| 4 or 5 Rooms | 137 (10.4%) | 233 (38.8%) |
| 6 or 7 Rooms | 572 (43.3%) | 138 (23.0%) |
| 8 or more Rooms | 579 (43.8%) | 62 (10.3%) |
| Total | 1,321 (100.0%) | 601 (100.0%) |
Housing Structure by Heating Type in Manheim borough
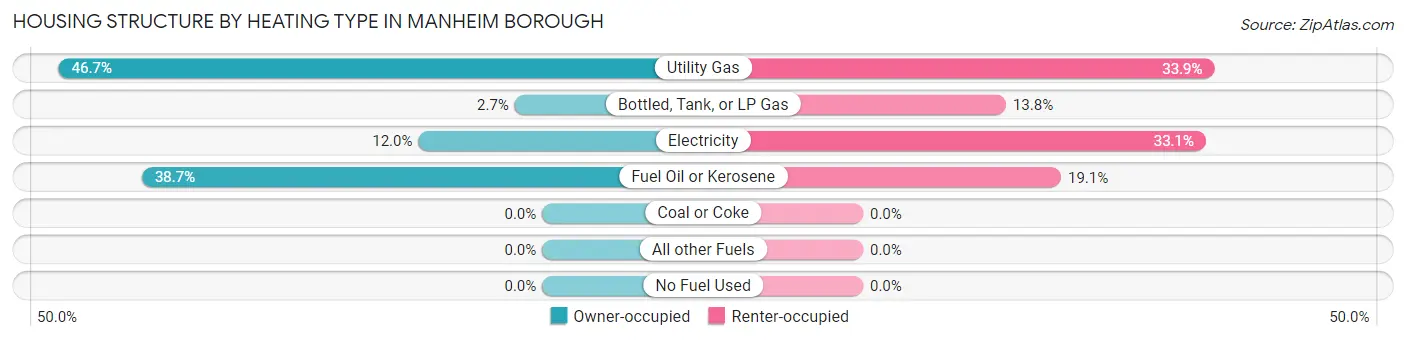
| Heating Type | Owner-occupied | Renter-occupied |
| Utility Gas | 617 (46.7%) | 204 (33.9%) |
| Bottled, Tank, or LP Gas | 35 (2.6%) | 83 (13.8%) |
| Electricity | 158 (12.0%) | 199 (33.1%) |
| Fuel Oil or Kerosene | 511 (38.7%) | 115 (19.1%) |
| Coal or Coke | 0 (0.0%) | 0 (0.0%) |
| All other Fuels | 0 (0.0%) | 0 (0.0%) |
| No Fuel Used | 0 (0.0%) | 0 (0.0%) |
| Total | 1,321 (100.0%) | 601 (100.0%) |
Household Vehicle Usage in Manheim borough
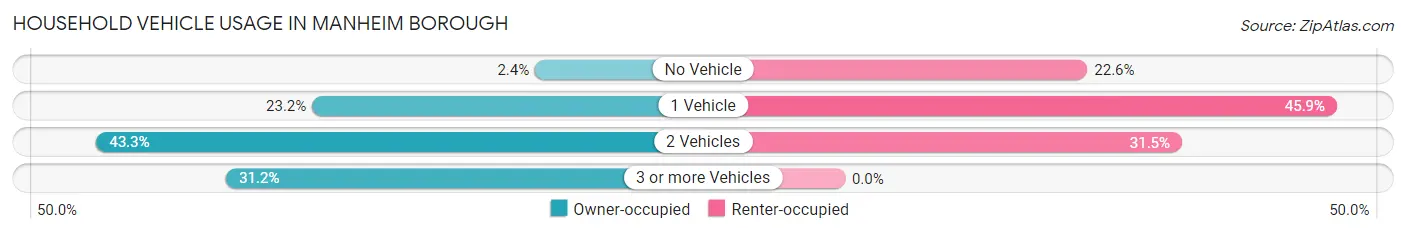
| Vehicles per Household | Owner-occupied | Renter-occupied |
| No Vehicle | 31 (2.4%) | 136 (22.6%) |
| 1 Vehicle | 306 (23.2%) | 276 (45.9%) |
| 2 Vehicles | 572 (43.3%) | 189 (31.5%) |
| 3 or more Vehicles | 412 (31.2%) | 0 (0.0%) |
| Total | 1,321 (100.0%) | 601 (100.0%) |
Real Estate & Mortgages in Manheim borough
Real Estate and Mortgage Overview in Manheim borough
| Characteristic | Without Mortgage | With Mortgage |
| Housing Units | 423 | 898 |
| Median Property Value | $169,600 | $218,800 |
| Median Household Income | $75,669 | $193 |
| Monthly Housing Costs | $612 | $0 |
| Real Estate Taxes | $3,542 | $23 |
Property Value by Mortgage Status in Manheim borough
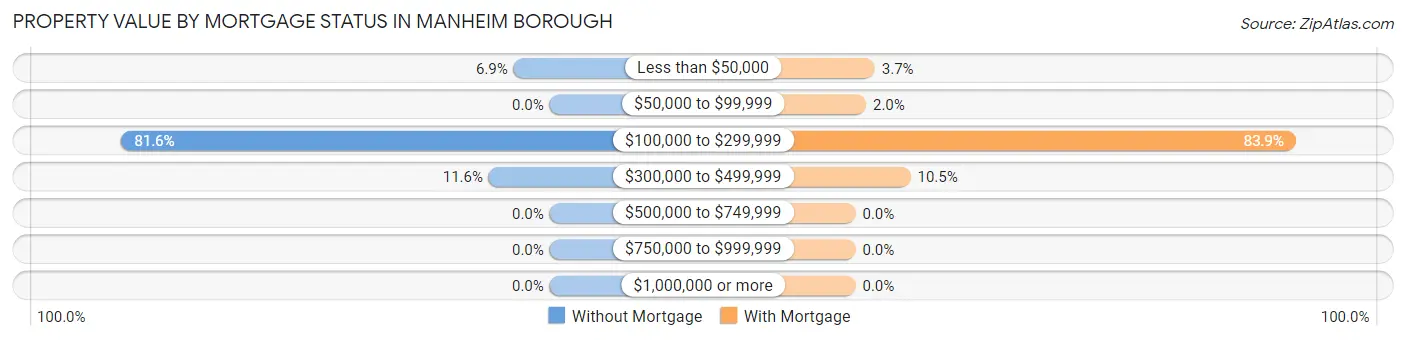
| Property Value | Without Mortgage | With Mortgage |
| Less than $50,000 | 29 (6.9%) | 33 (3.7%) |
| $50,000 to $99,999 | 0 (0.0%) | 18 (2.0%) |
| $100,000 to $299,999 | 345 (81.6%) | 753 (83.9%) |
| $300,000 to $499,999 | 49 (11.6%) | 94 (10.5%) |
| $500,000 to $749,999 | 0 (0.0%) | 0 (0.0%) |
| $750,000 to $999,999 | 0 (0.0%) | 0 (0.0%) |
| $1,000,000 or more | 0 (0.0%) | 0 (0.0%) |
| Total | 423 (100.0%) | 898 (100.0%) |
Household Income by Mortgage Status in Manheim borough
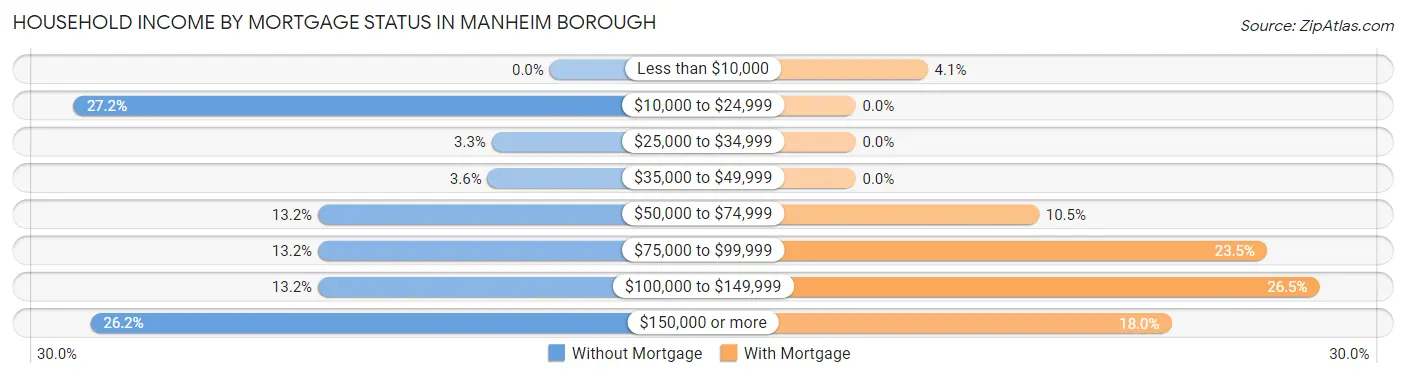
| Household Income | Without Mortgage | With Mortgage |
| Less than $10,000 | 0 (0.0%) | 37 (4.1%) |
| $10,000 to $24,999 | 115 (27.2%) | 0 (0.0%) |
| $25,000 to $34,999 | 14 (3.3%) | 0 (0.0%) |
| $35,000 to $49,999 | 15 (3.5%) | 0 (0.0%) |
| $50,000 to $74,999 | 56 (13.2%) | 94 (10.5%) |
| $75,000 to $99,999 | 56 (13.2%) | 211 (23.5%) |
| $100,000 to $149,999 | 56 (13.2%) | 238 (26.5%) |
| $150,000 or more | 111 (26.2%) | 162 (18.0%) |
| Total | 423 (100.0%) | 898 (100.0%) |
Property Value to Household Income Ratio in Manheim borough
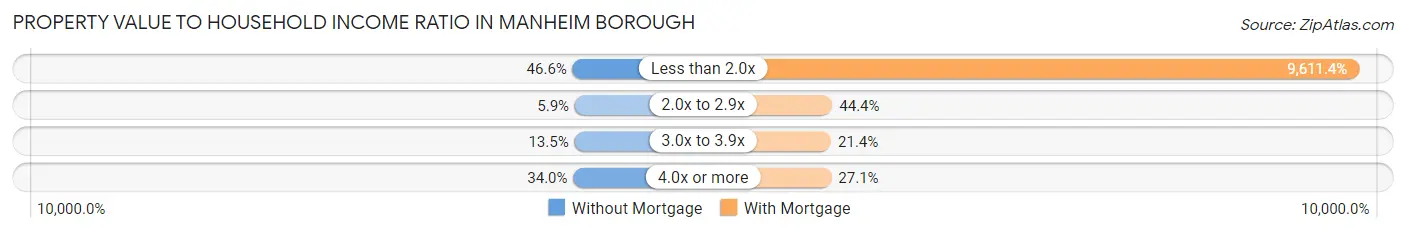
| Value-to-Income Ratio | Without Mortgage | With Mortgage |
| Less than 2.0x | 197 (46.6%) | 86,310 (9,611.4%) |
| 2.0x to 2.9x | 25 (5.9%) | 399 (44.4%) |
| 3.0x to 3.9x | 57 (13.5%) | 192 (21.4%) |
| 4.0x or more | 144 (34.0%) | 243 (27.1%) |
| Total | 423 (100.0%) | 898 (100.0%) |
Real Estate Taxes by Mortgage Status in Manheim borough
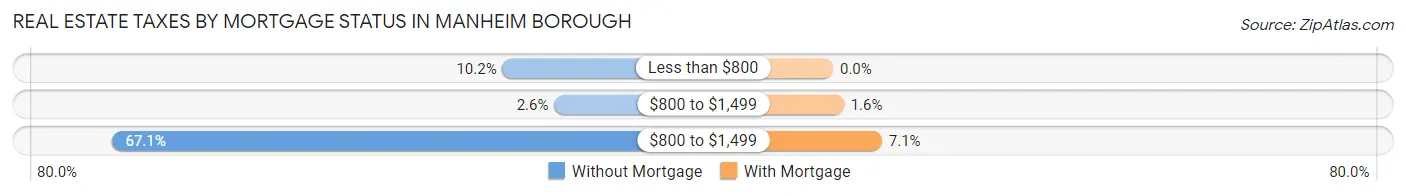
| Property Taxes | Without Mortgage | With Mortgage |
| Less than $800 | 43 (10.2%) | 0 (0.0%) |
| $800 to $1,499 | 11 (2.6%) | 14 (1.6%) |
| $800 to $1,499 | 284 (67.1%) | 64 (7.1%) |
| Total | 423 (100.0%) | 898 (100.0%) |
Health & Disability in Manheim borough
Health Insurance Coverage by Age in Manheim borough
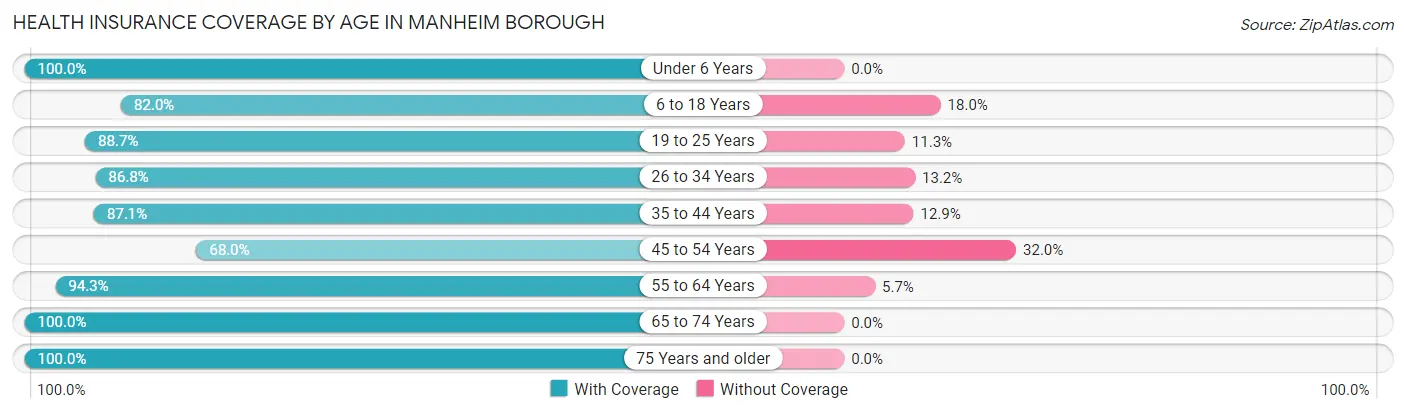
| Age Bracket | With Coverage | Without Coverage |
| Under 6 Years | 593 (100.0%) | 0 (0.0%) |
| 6 to 18 Years | 694 (82.0%) | 152 (18.0%) |
| 19 to 25 Years | 212 (88.7%) | 27 (11.3%) |
| 26 to 34 Years | 880 (86.8%) | 134 (13.2%) |
| 35 to 44 Years | 438 (87.1%) | 65 (12.9%) |
| 45 to 54 Years | 526 (68.0%) | 248 (32.0%) |
| 55 to 64 Years | 460 (94.3%) | 28 (5.7%) |
| 65 to 74 Years | 343 (100.0%) | 0 (0.0%) |
| 75 Years and older | 228 (100.0%) | 0 (0.0%) |
| Total | 4,374 (87.0%) | 654 (13.0%) |
Health Insurance Coverage by Citizenship Status in Manheim borough
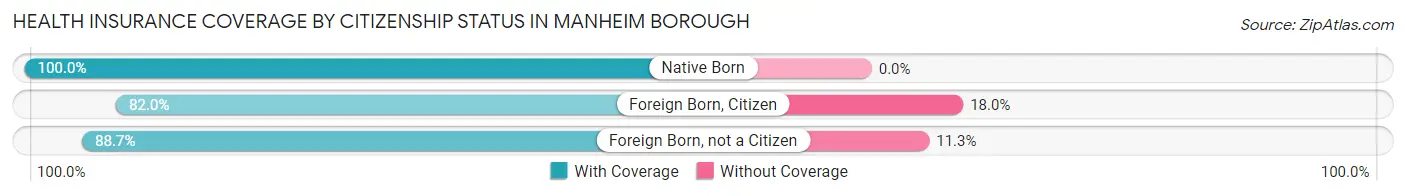
| Citizenship Status | With Coverage | Without Coverage |
| Native Born | 593 (100.0%) | 0 (0.0%) |
| Foreign Born, Citizen | 694 (82.0%) | 152 (18.0%) |
| Foreign Born, not a Citizen | 212 (88.7%) | 27 (11.3%) |
Health Insurance Coverage by Household Income in Manheim borough
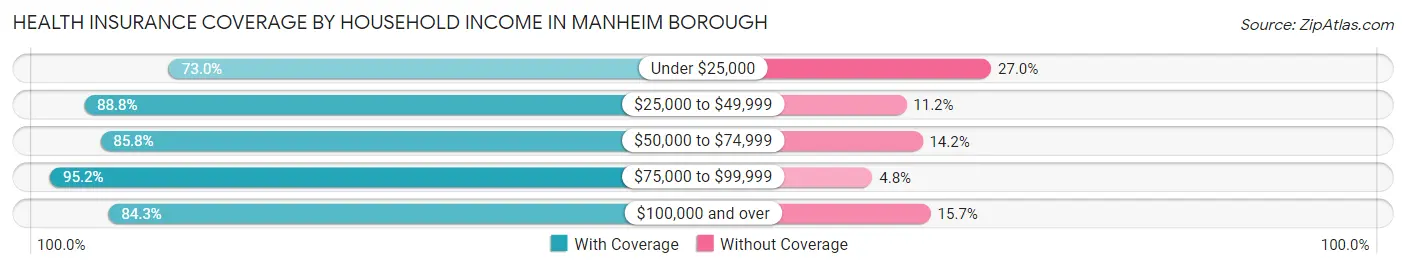
| Household Income | With Coverage | Without Coverage |
| Under $25,000 | 286 (73.0%) | 106 (27.0%) |
| $25,000 to $49,999 | 557 (88.8%) | 70 (11.2%) |
| $50,000 to $74,999 | 787 (85.8%) | 130 (14.2%) |
| $75,000 to $99,999 | 1,174 (95.2%) | 59 (4.8%) |
| $100,000 and over | 1,551 (84.3%) | 289 (15.7%) |
Public vs Private Health Insurance Coverage by Age in Manheim borough
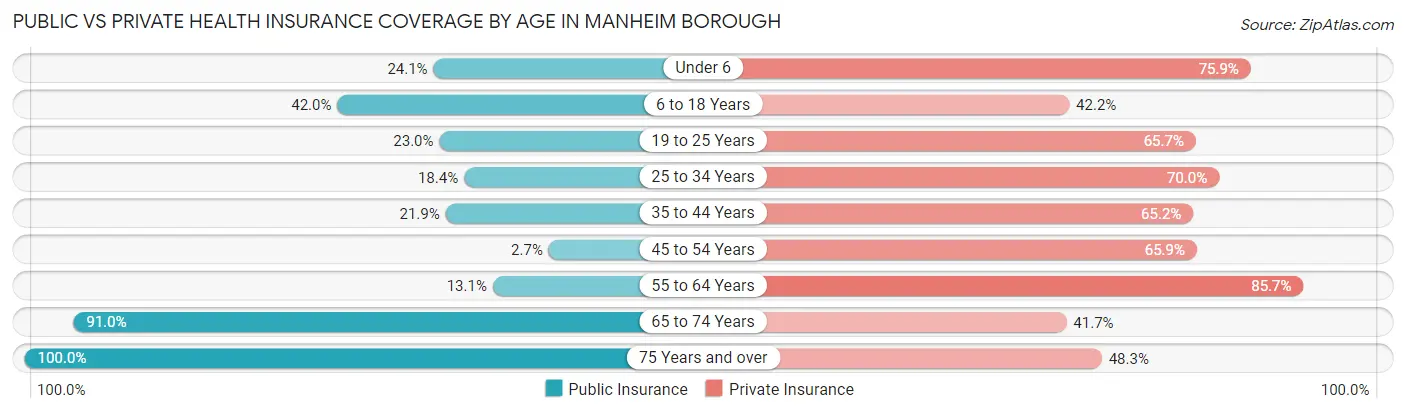
| Age Bracket | Public Insurance | Private Insurance |
| Under 6 | 143 (24.1%) | 450 (75.9%) |
| 6 to 18 Years | 355 (42.0%) | 357 (42.2%) |
| 19 to 25 Years | 55 (23.0%) | 157 (65.7%) |
| 25 to 34 Years | 187 (18.4%) | 710 (70.0%) |
| 35 to 44 Years | 110 (21.9%) | 328 (65.2%) |
| 45 to 54 Years | 21 (2.7%) | 510 (65.9%) |
| 55 to 64 Years | 64 (13.1%) | 418 (85.7%) |
| 65 to 74 Years | 312 (91.0%) | 143 (41.7%) |
| 75 Years and over | 228 (100.0%) | 110 (48.2%) |
| Total | 1,475 (29.3%) | 3,183 (63.3%) |
Disability Status by Sex by Age in Manheim borough
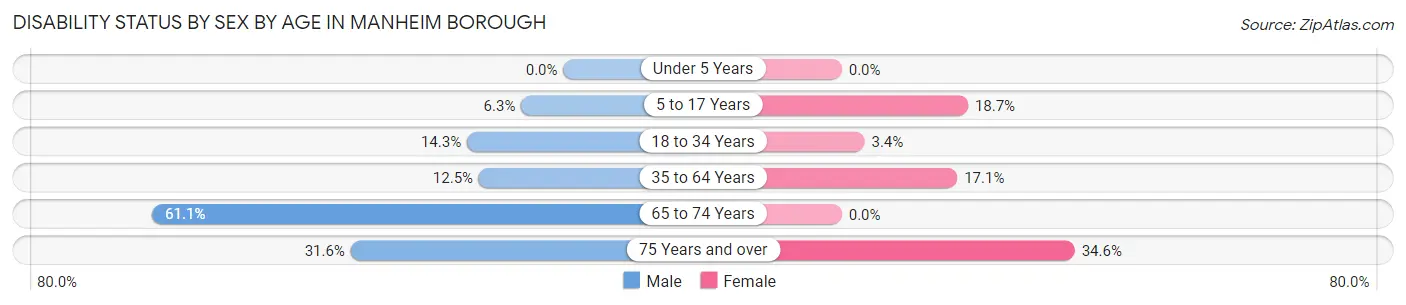
| Age Bracket | Male | Female |
| Under 5 Years | 0 (0.0%) | 0 (0.0%) |
| 5 to 17 Years | 31 (6.2%) | 71 (18.7%) |
| 18 to 34 Years | 93 (14.3%) | 22 (3.4%) |
| 35 to 64 Years | 124 (12.5%) | 133 (17.1%) |
| 65 to 74 Years | 116 (61.1%) | 0 (0.0%) |
| 75 Years and over | 30 (31.6%) | 46 (34.6%) |
Disability Class by Sex by Age in Manheim borough
Disability Class: Hearing Difficulty
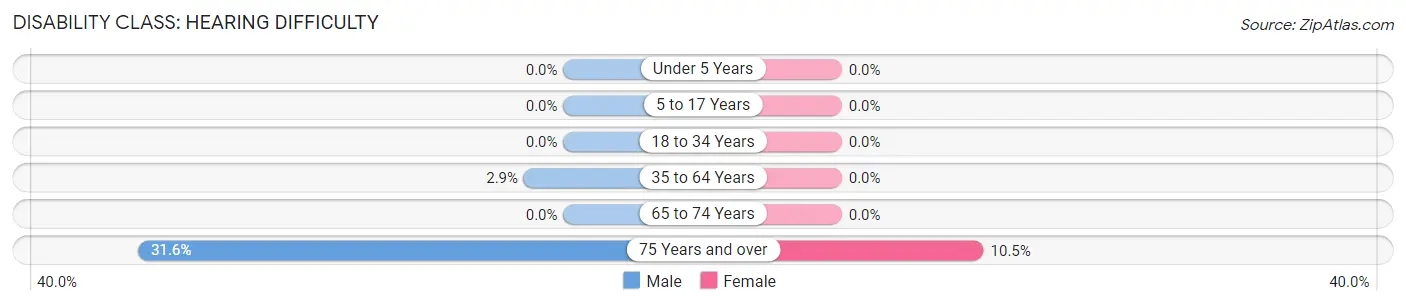
| Age Bracket | Male | Female |
| Under 5 Years | 0 (0.0%) | 0 (0.0%) |
| 5 to 17 Years | 0 (0.0%) | 0 (0.0%) |
| 18 to 34 Years | 0 (0.0%) | 0 (0.0%) |
| 35 to 64 Years | 29 (2.9%) | 0 (0.0%) |
| 65 to 74 Years | 0 (0.0%) | 0 (0.0%) |
| 75 Years and over | 30 (31.6%) | 14 (10.5%) |
Disability Class: Vision Difficulty
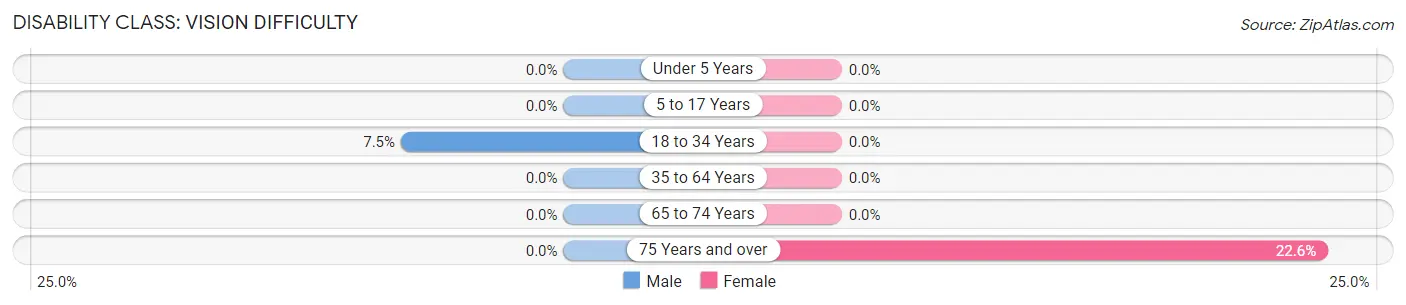
| Age Bracket | Male | Female |
| Under 5 Years | 0 (0.0%) | 0 (0.0%) |
| 5 to 17 Years | 0 (0.0%) | 0 (0.0%) |
| 18 to 34 Years | 49 (7.5%) | 0 (0.0%) |
| 35 to 64 Years | 0 (0.0%) | 0 (0.0%) |
| 65 to 74 Years | 0 (0.0%) | 0 (0.0%) |
| 75 Years and over | 0 (0.0%) | 30 (22.6%) |
Disability Class: Cognitive Difficulty
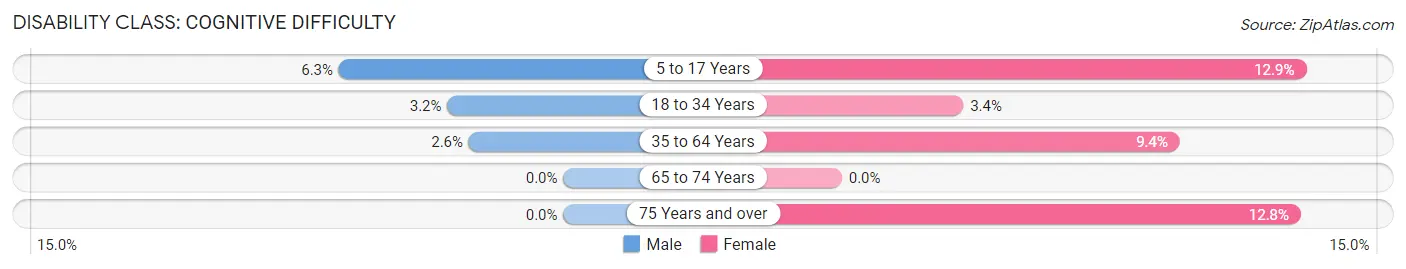
| Age Bracket | Male | Female |
| 5 to 17 Years | 31 (6.2%) | 49 (12.9%) |
| 18 to 34 Years | 21 (3.2%) | 22 (3.4%) |
| 35 to 64 Years | 26 (2.6%) | 73 (9.4%) |
| 65 to 74 Years | 0 (0.0%) | 0 (0.0%) |
| 75 Years and over | 0 (0.0%) | 17 (12.8%) |
Disability Class: Ambulatory Difficulty
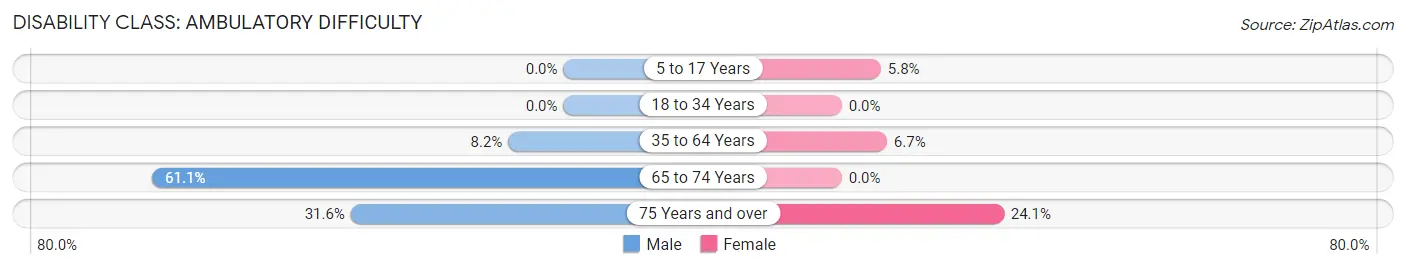
| Age Bracket | Male | Female |
| 5 to 17 Years | 0 (0.0%) | 22 (5.8%) |
| 18 to 34 Years | 0 (0.0%) | 0 (0.0%) |
| 35 to 64 Years | 81 (8.2%) | 52 (6.7%) |
| 65 to 74 Years | 116 (61.1%) | 0 (0.0%) |
| 75 Years and over | 30 (31.6%) | 32 (24.1%) |
Disability Class: Self-Care Difficulty
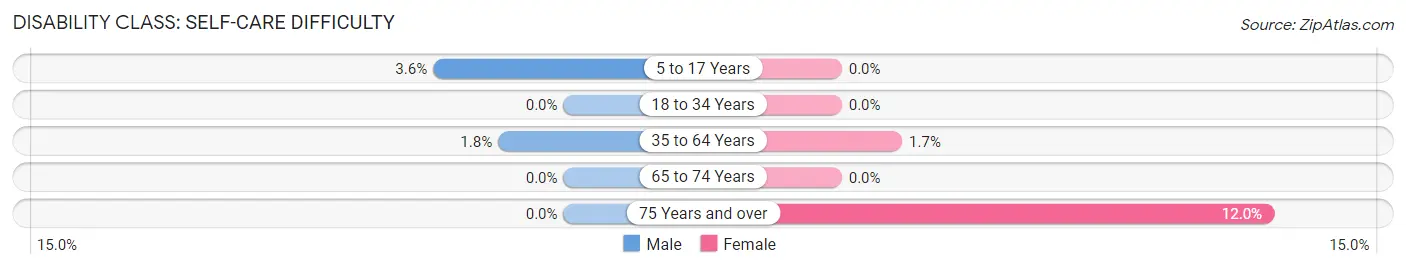
| Age Bracket | Male | Female |
| 5 to 17 Years | 18 (3.6%) | 0 (0.0%) |
| 18 to 34 Years | 0 (0.0%) | 0 (0.0%) |
| 35 to 64 Years | 18 (1.8%) | 13 (1.7%) |
| 65 to 74 Years | 0 (0.0%) | 0 (0.0%) |
| 75 Years and over | 0 (0.0%) | 16 (12.0%) |
Technology Access in Manheim borough
Computing Device Access in Manheim borough
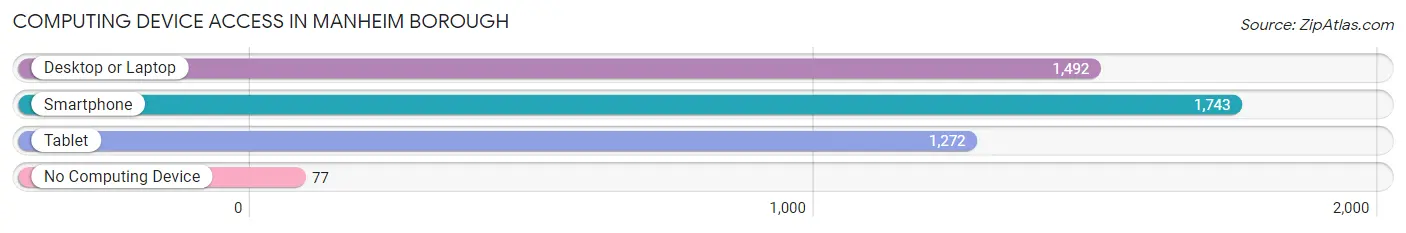
| Device Type | # Households | % Households |
| Desktop or Laptop | 1,492 | 77.6% |
| Smartphone | 1,743 | 90.7% |
| Tablet | 1,272 | 66.2% |
| No Computing Device | 77 | 4.0% |
| Total | 1,922 | 100.0% |
Internet Access in Manheim borough
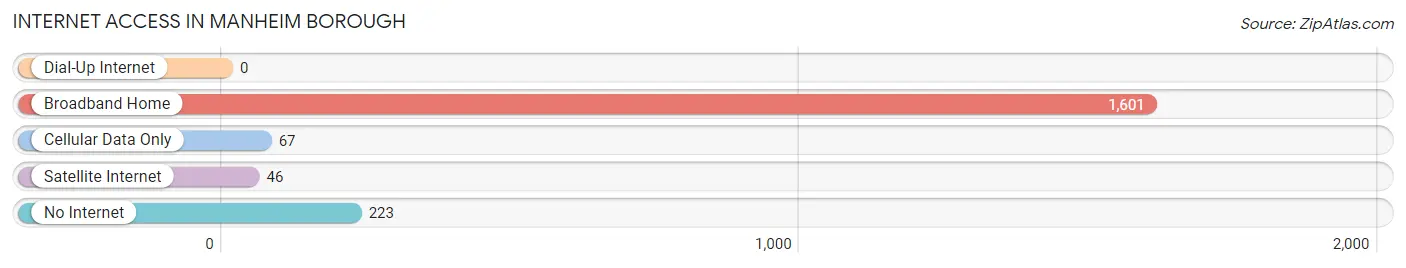
| Internet Type | # Households | % Households |
| Dial-Up Internet | 0 | 0.0% |
| Broadband Home | 1,601 | 83.3% |
| Cellular Data Only | 67 | 3.5% |
| Satellite Internet | 46 | 2.4% |
| No Internet | 223 | 11.6% |
| Total | 1,922 | 100.0% |
Manheim borough Summary
Manheim Borough is a borough located in Lancaster County, Pennsylvania. It is situated in the heart of the Pennsylvania Dutch Country, and is home to a population of 4,858 people as of the 2010 census. The borough is located in the southeastern corner of the county, and is bordered by the townships of Rapho, Penn, and West Hempfield.
History
The area that is now Manheim Borough was first settled in 1719 by a group of Mennonites from Germany. The town was originally known as “Mannheim”, after the German city of Mannheim. The name was later changed to Manheim in 1817. The town was officially incorporated as a borough in 1838.
In the 19th century, Manheim was a major center of the Pennsylvania Dutch culture. The town was home to a variety of businesses, including a tannery, a brewery, a distillery, and a number of mills. The town was also home to a number of churches, including the Manheim Mennonite Church, which was founded in 1719.
Geography
Manheim Borough is located at 40°10'17" North, 76°20'17" West (40.1714, -76.3381). It has a total area of 1.2 square miles, all of which is land. The borough is located in the southeastern corner of Lancaster County, and is bordered by the townships of Rapho, Penn, and West Hempfield.
The borough is located in the Susquehanna River Valley, and is surrounded by rolling hills and farmland. The borough is located approximately 10 miles east of the city of Lancaster, and is accessible via U.S. Route 222 and Pennsylvania Route 72.
Economy
The economy of Manheim Borough is largely based on agriculture and tourism. The borough is home to a number of farms, which produce a variety of crops, including corn, soybeans, wheat, and hay. The borough is also home to a number of tourist attractions, including the Manheim Historical Society Museum, the Manheim Auto Auction, and the Manheim Central Railroad.
The borough is also home to a number of businesses, including a number of restaurants, retail stores, and service providers. The borough is also home to a number of manufacturing companies, including a number of food processing plants.
Demographics
As of the 2010 census, the population of Manheim Borough was 4,858. The racial makeup of the borough was 95.3% White, 1.2% African American, 0.3% Native American, 0.7% Asian, 0.1% Pacific Islander, 0.7% from other races, and 1.9% from two or more races. Hispanic or Latino of any race were 2.2% of the population.
The median household income in Manheim Borough was $50,902, and the median family income was $60,902. The per capita income for the borough was $25,902. About 5.3% of families and 7.2% of the population were below the poverty line, including 8.3% of those under age 18 and 5.2% of those age 65 or over.
Manheim Borough is served by the Manheim Central School District. The borough is home to a number of churches, including the Manheim Mennonite Church, which was founded in 1719. The borough is also home to a number of parks, including the Manheim Community Park, which features a playground, a basketball court, and a walking trail.
Common Questions
What is Per Capita Income in Manheim borough?
Per Capita income in Manheim borough is $33,800.
What is the Median Family Income in Manheim borough?
Median Family Income in Manheim borough is $85,682.
What is the Median Household income in Manheim borough?
Median Household Income in Manheim borough is $75,833.
What is Income or Wage Gap in Manheim borough?
Income or Wage Gap in Manheim borough is 34.2%.
Women in Manheim borough earn 65.8 cents for every dollar earned by a man.
What is Family Income Deficit in Manheim borough?
Family Income Deficit in Manheim borough is $13,111.
Families that are below poverty line in Manheim borough earn $13,111 less on average than the poverty threshold level.
What is Inequality or Gini Index in Manheim borough?
Inequality or Gini Index in Manheim borough is 0.40.
What is the Total Population of Manheim borough?
Total Population of Manheim borough is 5,028.
What is the Total Male Population of Manheim borough?
Total Male Population of Manheim borough is 2,744.
What is the Total Female Population of Manheim borough?
Total Female Population of Manheim borough is 2,284.
What is the Ratio of Males per 100 Females in Manheim borough?
There are 120.14 Males per 100 Females in Manheim borough.
What is the Ratio of Females per 100 Males in Manheim borough?
There are 83.24 Females per 100 Males in Manheim borough.
What is the Median Population Age in Manheim borough?
Median Population Age in Manheim borough is 33.6 Years.
What is the Average Family Size in Manheim borough
Average Family Size in Manheim borough is 3.1 People.
What is the Average Household Size in Manheim borough
Average Household Size in Manheim borough is 2.6 People.
How Large is the Labor Force in Manheim borough?
There are 2,647 People in the Labor Forcein in Manheim borough.
What is the Percentage of People in the Labor Force in Manheim borough?
70.6% of People are in the Labor Force in Manheim borough.
What is the Unemployment Rate in Manheim borough?
Unemployment Rate in Manheim borough is 5.8%.