Lititz borough, PA
Lititz borough Overview
9,559
TOTAL POPULATION
4,815
MALE POPULATION
4,744
FEMALE POPULATION
101.50
MALES / 100 FEMALES
98.53
FEMALES / 100 MALES
40.5
MEDIAN AGE
3.1
AVG FAMILY SIZE
2.4
AVG HOUSEHOLD SIZE
$46,076
PER CAPITA INCOME
$104,276
AVG FAMILY INCOME
$80,533
AVG HOUSEHOLD INCOME
23.5%
WAGE / INCOME GAP [ % ]
76.5¢/ $1
WAGE / INCOME GAP [ $ ]
0.45
INEQUALITY / GINI INDEX
5,011
LABOR FORCE [ PEOPLE ]
66.1%
PERCENT IN LABOR FORCE
2.6%
UNEMPLOYMENT RATE
Race in Lititz borough
The most populous races in Lititz borough are White / Caucasian (8,878 | 92.9%), Hispanic or Latino (649 | 6.8%), and Asian (246 | 2.6%).
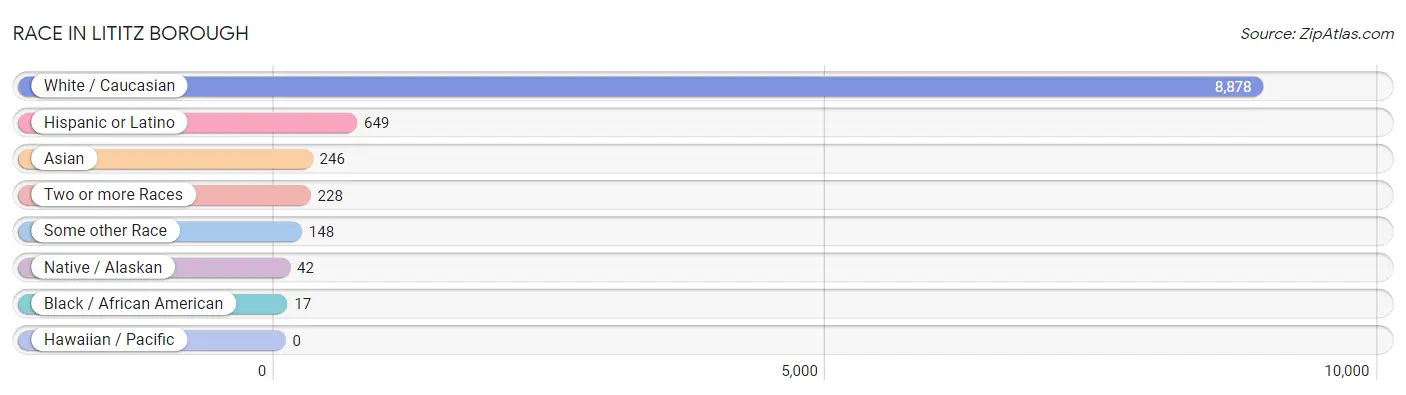
| Race | # Population | % Population |
| Asian | 246 | 2.6% |
| Black / African American | 17 | 0.2% |
| Hawaiian / Pacific | 0 | 0.0% |
| Hispanic or Latino | 649 | 6.8% |
| Native / Alaskan | 42 | 0.4% |
| White / Caucasian | 8,878 | 92.9% |
| Two or more Races | 228 | 2.4% |
| Some other Race | 148 | 1.5% |
| Total | 9,559 | 100.0% |
Ancestry in Lititz borough
The most populous ancestries reported in Lititz borough are German (3,199 | 33.5%), Irish (1,274 | 13.3%), English (747 | 7.8%), Italian (500 | 5.2%), and French (450 | 4.7%), together accounting for 64.6% of all Lititz borough residents.
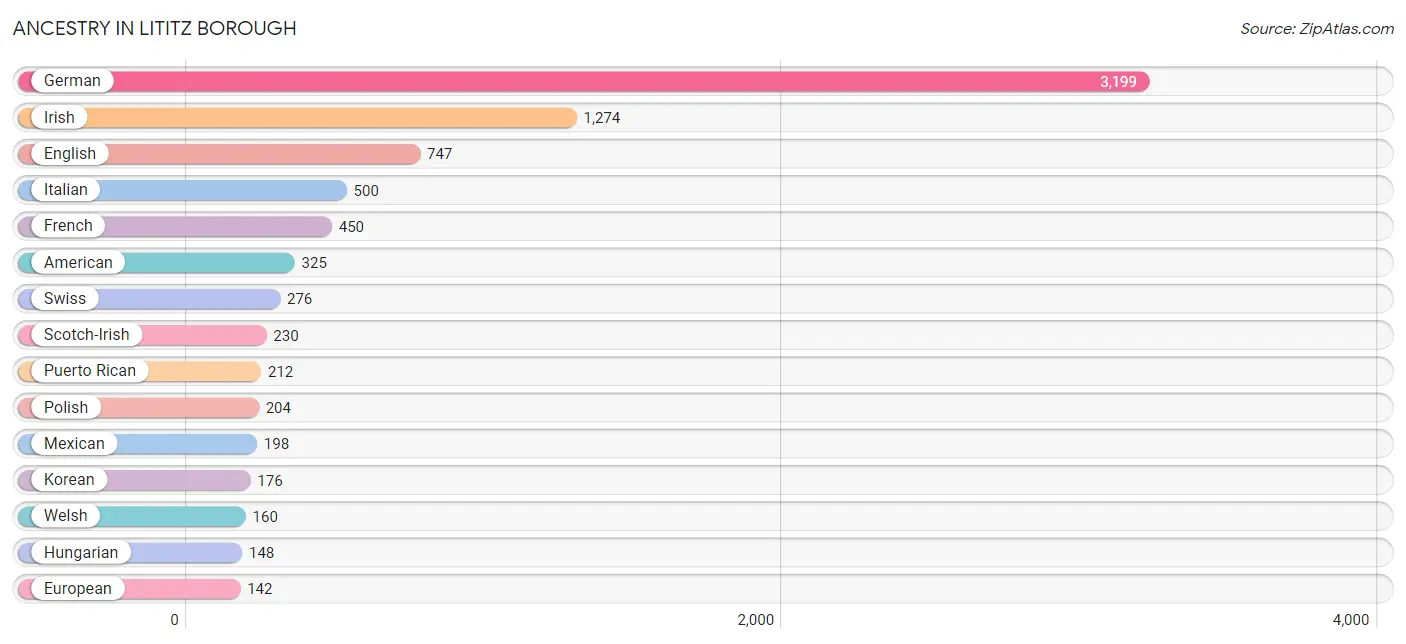
| Ancestry | # Population | % Population |
| American | 325 | 3.4% |
| Arab | 12 | 0.1% |
| Austrian | 56 | 0.6% |
| British | 19 | 0.2% |
| Cajun | 16 | 0.2% |
| Central American | 136 | 1.4% |
| Central American Indian | 42 | 0.4% |
| Czech | 55 | 0.6% |
| Czechoslovakian | 14 | 0.2% |
| Danish | 14 | 0.2% |
| Dominican | 99 | 1.0% |
| Dutch | 96 | 1.0% |
| Eastern European | 28 | 0.3% |
| English | 747 | 7.8% |
| European | 142 | 1.5% |
| Finnish | 16 | 0.2% |
| French | 450 | 4.7% |
| French Canadian | 45 | 0.5% |
| German | 3,199 | 33.5% |
| Guatemalan | 42 | 0.4% |
| Hungarian | 148 | 1.5% |
| Indonesian | 53 | 0.5% |
| Irish | 1,274 | 13.3% |
| Iroquois | 14 | 0.2% |
| Italian | 500 | 5.2% |
| Korean | 176 | 1.8% |
| Latvian | 17 | 0.2% |
| Lebanese | 12 | 0.1% |
| Lithuanian | 82 | 0.9% |
| Mexican | 198 | 2.1% |
| Nicaraguan | 38 | 0.4% |
| Northern European | 26 | 0.3% |
| Norwegian | 46 | 0.5% |
| Pennsylvania German | 94 | 1.0% |
| Polish | 204 | 2.1% |
| Portuguese | 25 | 0.3% |
| Puerto Rican | 212 | 2.2% |
| Russian | 53 | 0.5% |
| Salvadoran | 56 | 0.6% |
| Scotch-Irish | 230 | 2.4% |
| Scottish | 58 | 0.6% |
| Slovak | 79 | 0.8% |
| Swedish | 87 | 0.9% |
| Swiss | 276 | 2.9% |
| Ukrainian | 38 | 0.4% |
| Welsh | 160 | 1.7% | View All 46 Rows |
Immigrants in Lititz borough
The most numerous immigrant groups reported in Lititz borough came from Asia (186 | 1.9%), South Eastern Asia (186 | 1.9%), Philippines (152 | 1.6%), Europe (151 | 1.6%), and Northern Europe (90 | 0.9%), together accounting for 8.0% of all Lititz borough residents.
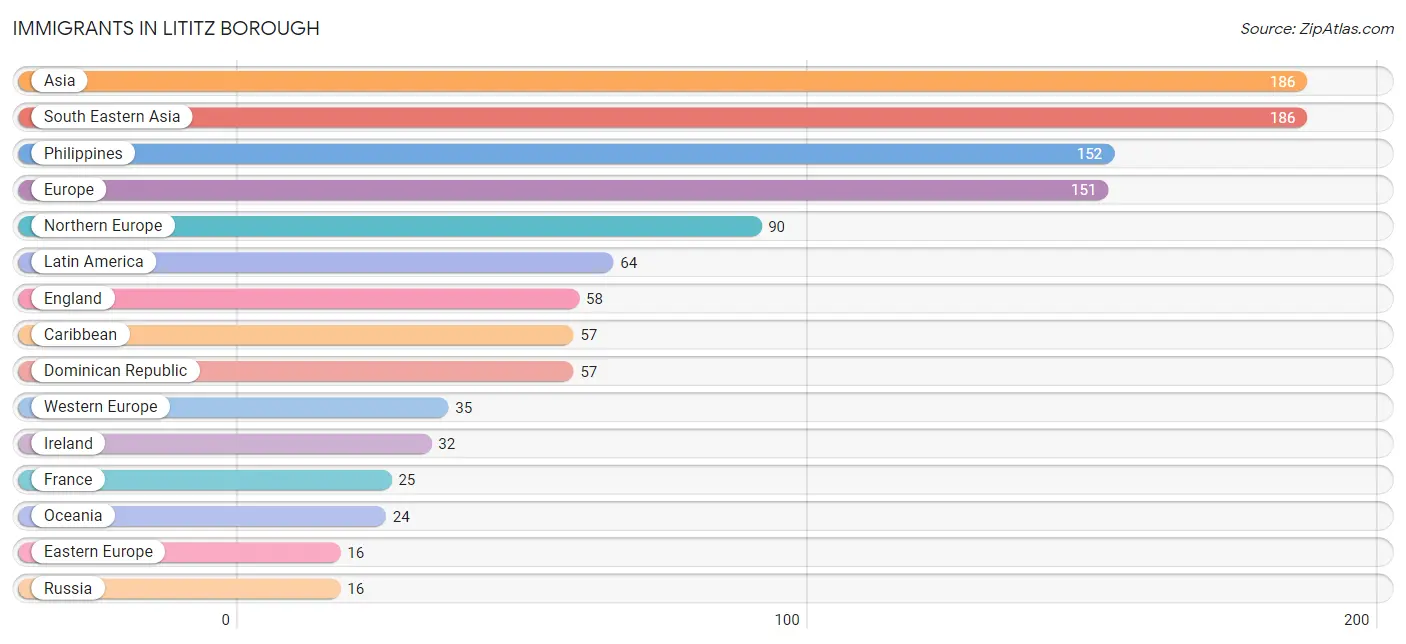
| Immigration Origin | # Population | % Population |
| Asia | 186 | 1.9% |
| Caribbean | 57 | 0.6% |
| Central America | 7 | 0.1% |
| Dominican Republic | 57 | 0.6% |
| Eastern Europe | 16 | 0.2% |
| England | 58 | 0.6% |
| Europe | 151 | 1.6% |
| France | 25 | 0.3% |
| Ireland | 32 | 0.3% |
| Italy | 10 | 0.1% |
| Latin America | 64 | 0.7% |
| Nicaragua | 7 | 0.1% |
| Northern Europe | 90 | 0.9% |
| Oceania | 24 | 0.3% |
| Philippines | 152 | 1.6% |
| Russia | 16 | 0.2% |
| South Eastern Asia | 186 | 1.9% |
| Southern Europe | 10 | 0.1% |
| Switzerland | 10 | 0.1% |
| Thailand | 15 | 0.2% |
| Western Europe | 35 | 0.4% | View All 21 Rows |
Sex and Age in Lititz borough
Sex and Age in Lititz borough
The most populous age groups in Lititz borough are Under 5 Years (460 | 9.6%) for men and 5 to 9 Years (441 | 9.3%) for women.
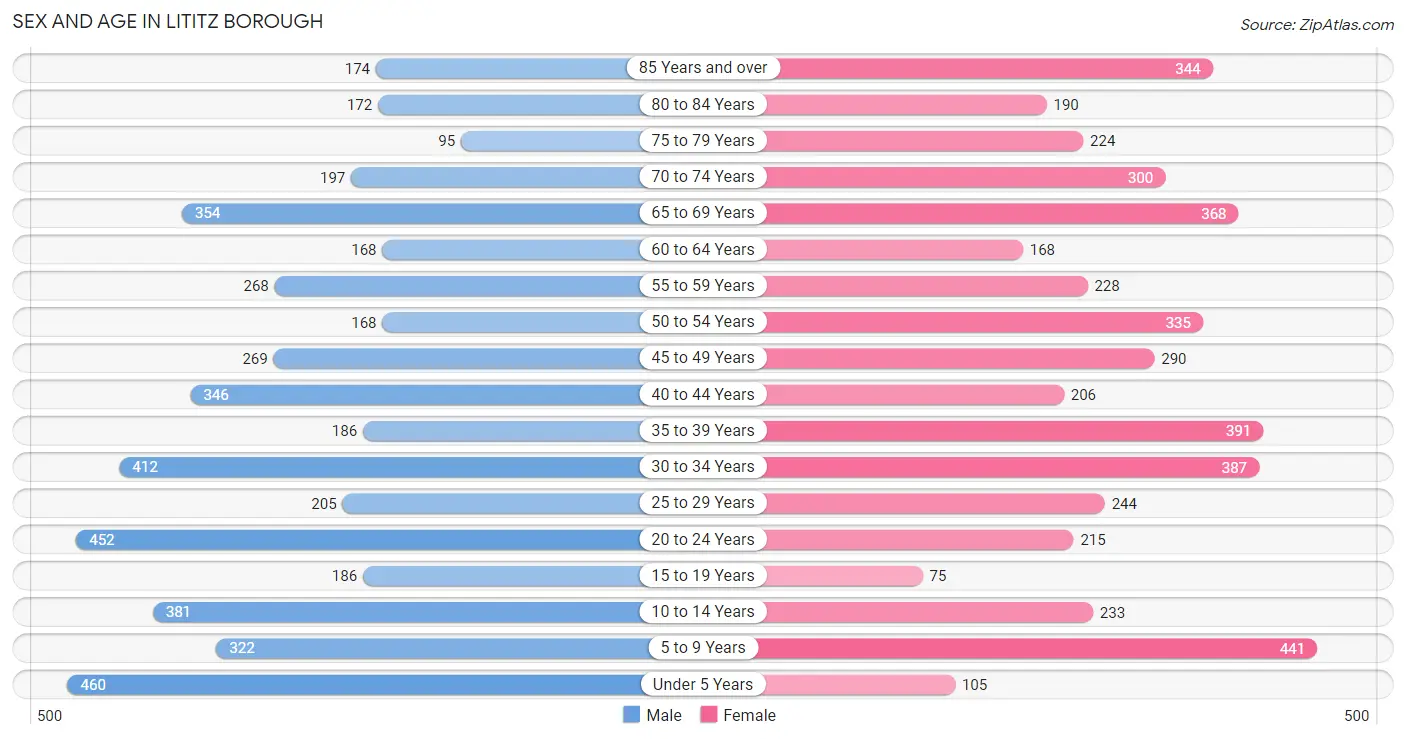
| Age Bracket | Male | Female |
| Under 5 Years | 460 (9.6%) | 105 (2.2%) |
| 5 to 9 Years | 322 (6.7%) | 441 (9.3%) |
| 10 to 14 Years | 381 (7.9%) | 233 (4.9%) |
| 15 to 19 Years | 186 (3.9%) | 75 (1.6%) |
| 20 to 24 Years | 452 (9.4%) | 215 (4.5%) |
| 25 to 29 Years | 205 (4.3%) | 244 (5.1%) |
| 30 to 34 Years | 412 (8.6%) | 387 (8.2%) |
| 35 to 39 Years | 186 (3.9%) | 391 (8.2%) |
| 40 to 44 Years | 346 (7.2%) | 206 (4.3%) |
| 45 to 49 Years | 269 (5.6%) | 290 (6.1%) |
| 50 to 54 Years | 168 (3.5%) | 335 (7.1%) |
| 55 to 59 Years | 268 (5.6%) | 228 (4.8%) |
| 60 to 64 Years | 168 (3.5%) | 168 (3.5%) |
| 65 to 69 Years | 354 (7.3%) | 368 (7.8%) |
| 70 to 74 Years | 197 (4.1%) | 300 (6.3%) |
| 75 to 79 Years | 95 (2.0%) | 224 (4.7%) |
| 80 to 84 Years | 172 (3.6%) | 190 (4.0%) |
| 85 Years and over | 174 (3.6%) | 344 (7.2%) |
| Total | 4,815 (100.0%) | 4,744 (100.0%) |
Families and Households in Lititz borough
Median Family Size in Lititz borough
The median family size in Lititz borough is 3.06 persons per family, with single male/father families (88 | 3.6%) accounting for the largest median family size of 3.26 persons per family. On the other hand, single female/mother families (238 | 9.7%) represent the smallest median family size with 2.66 persons per family.
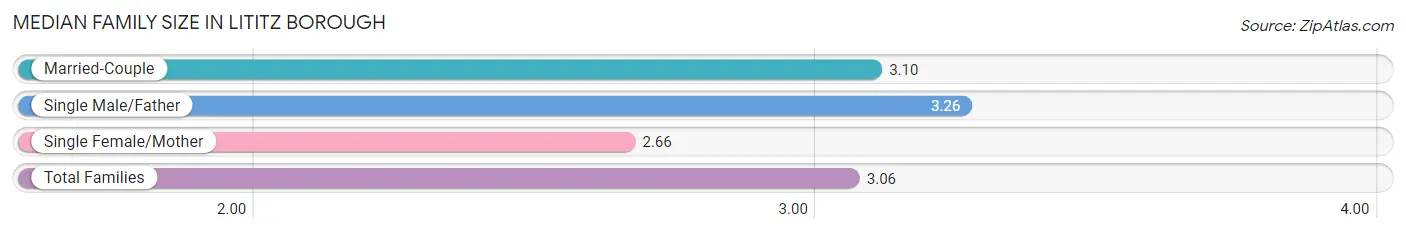
| Family Type | # Families | Family Size |
| Married-Couple | 2,125 (86.7%) | 3.10 |
| Single Male/Father | 88 (3.6%) | 3.26 |
| Single Female/Mother | 238 (9.7%) | 2.66 |
| Total Families | 2,451 (100.0%) | 3.06 |
Median Household Size in Lititz borough
The median household size in Lititz borough is 2.41 persons per household, with single male/father households (88 | 2.3%) accounting for the largest median household size of 4.2 persons per household. non-family households (1,382 | 36.1%) represent the smallest median household size with 1.12 persons per household.
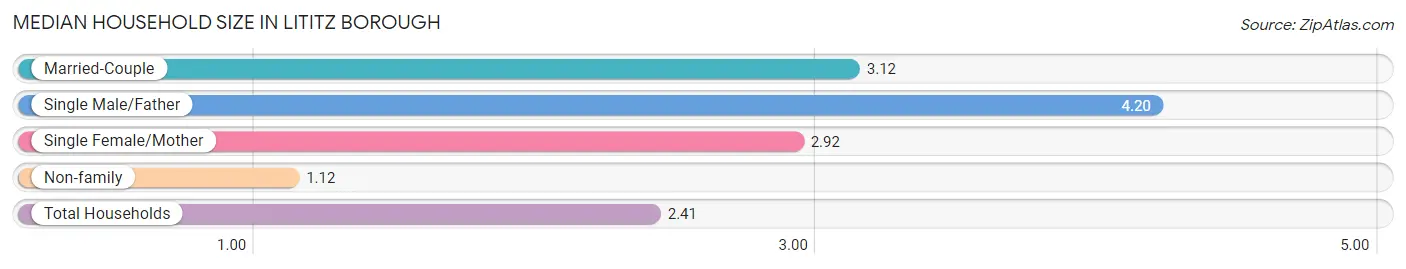
| Household Type | # Households | Household Size |
| Married-Couple | 2,125 (55.4%) | 3.12 |
| Single Male/Father | 88 (2.3%) | 4.20 |
| Single Female/Mother | 238 (6.2%) | 2.92 |
| Non-family | 1,382 (36.1%) | 1.12 |
| Total Households | 3,833 (100.0%) | 2.41 |
Household Size by Marriage Status in Lititz borough
Out of a total of 3,833 households in Lititz borough, 2,451 (63.9%) are family households, while 1,382 (36.1%) are nonfamily households. The most numerous type of family households are 2-person households, comprising 1,127, and the most common type of nonfamily households are 1-person households, comprising 1,241.
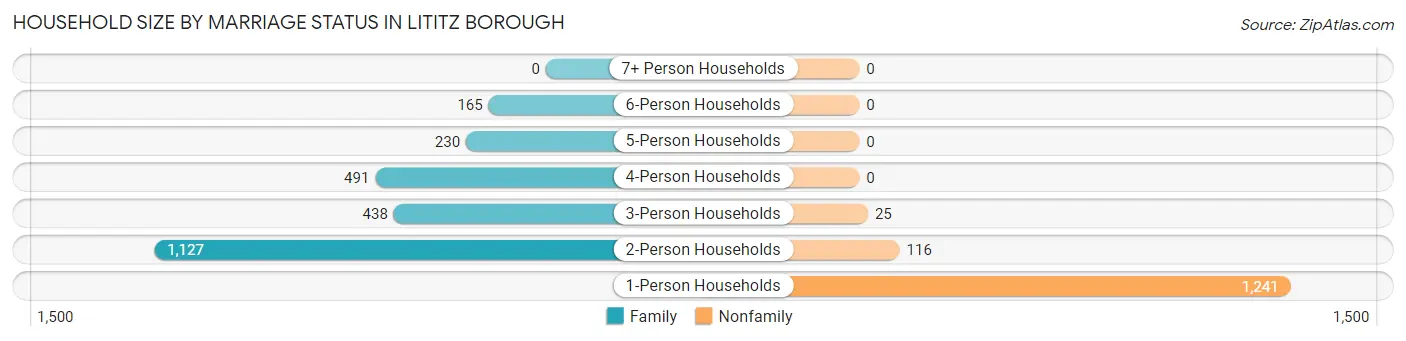
| Household Size | Family Households | Nonfamily Households |
| 1-Person Households | - | 1,241 (32.4%) |
| 2-Person Households | 1,127 (29.4%) | 116 (3.0%) |
| 3-Person Households | 438 (11.4%) | 25 (0.6%) |
| 4-Person Households | 491 (12.8%) | 0 (0.0%) |
| 5-Person Households | 230 (6.0%) | 0 (0.0%) |
| 6-Person Households | 165 (4.3%) | 0 (0.0%) |
| 7+ Person Households | 0 (0.0%) | 0 (0.0%) |
| Total | 2,451 (63.9%) | 1,382 (36.1%) |
Female Fertility in Lititz borough
Fertility by Age in Lititz borough
Average fertility rate in Lititz borough is 54.0 births per 1,000 women. Women in the age bracket of 20 to 34 years have the highest fertility rate with 65.0 births per 1,000 women. Women in the age bracket of 20 to 34 years acount for 54.5% of all women with births.
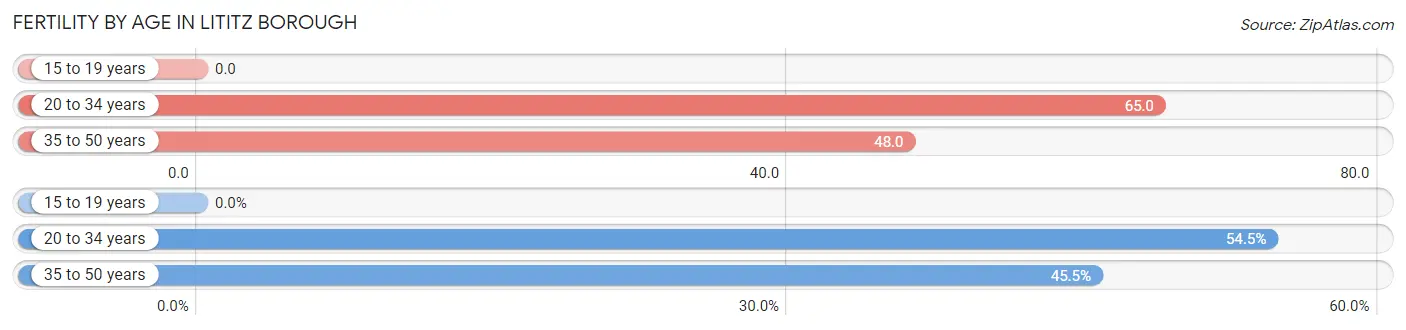
| Age Bracket | Women with Births | Births / 1,000 Women |
| 15 to 19 years | 0 (0.0%) | 0.0 |
| 20 to 34 years | 55 (54.5%) | 65.0 |
| 35 to 50 years | 46 (45.5%) | 48.0 |
| Total | 101 (100.0%) | 54.0 |
Fertility by Age by Marriage Status in Lititz borough
81.2% of women with births (101) in Lititz borough are married. The highest percentage of unmarried women with births falls into 20 to 34 years age bracket with 34.5% of them unmarried at the time of birth, while the lowest percentage of unmarried women with births belong to 35 to 50 years age bracket with 0.0% of them unmarried.
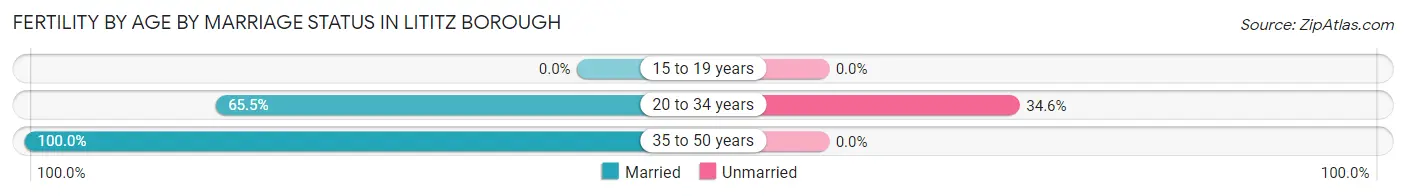
| Age Bracket | Married | Unmarried |
| 15 to 19 years | 0 (0.0%) | 0 (0.0%) |
| 20 to 34 years | 36 (65.4%) | 19 (34.5%) |
| 35 to 50 years | 46 (100.0%) | 0 (0.0%) |
| Total | 82 (81.2%) | 19 (18.8%) |
Fertility by Education in Lititz borough
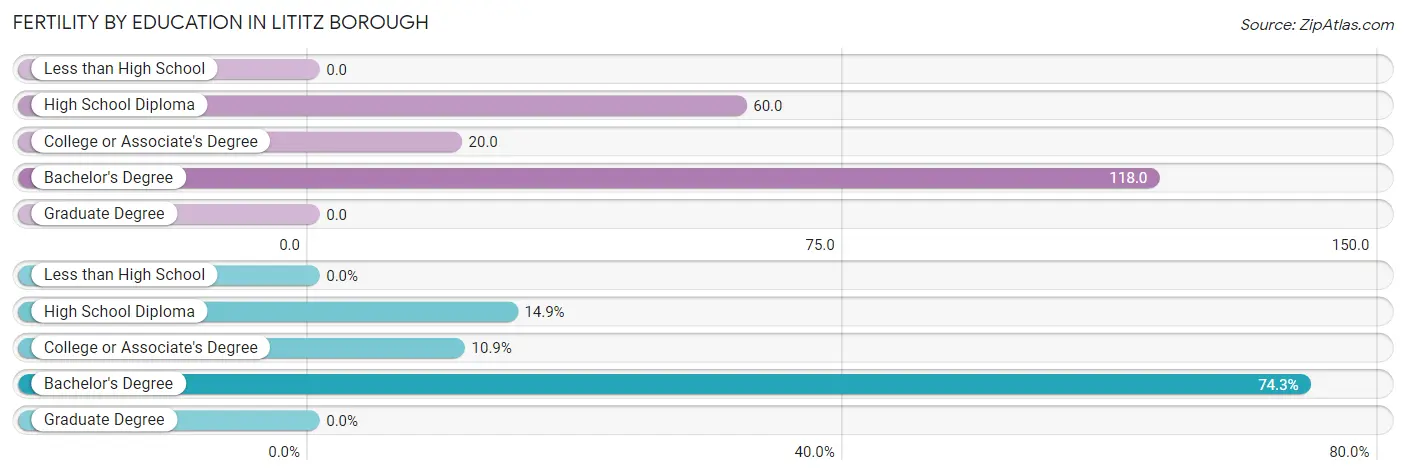
| Educational Attainment | Women with Births | Births / 1,000 Women |
| Less than High School | 0 (0.0%) | 0.0 |
| High School Diploma | 15 (14.8%) | 60.0 |
| College or Associate's Degree | 11 (10.9%) | 20.0 |
| Bachelor's Degree | 75 (74.3%) | 118.0 |
| Graduate Degree | 0 (0.0%) | 0.0 |
| Total | 101 (100.0%) | 54.0 |
Fertility by Education by Marriage Status in Lititz borough
18.8% of women with births in Lititz borough are unmarried. Women with the educational attainment of high school diploma are most likely to be married with 100.0% of them married at childbirth, while women with the educational attainment of college or associate's degree are least likely to be married with 100.0% of them unmarried at childbirth.
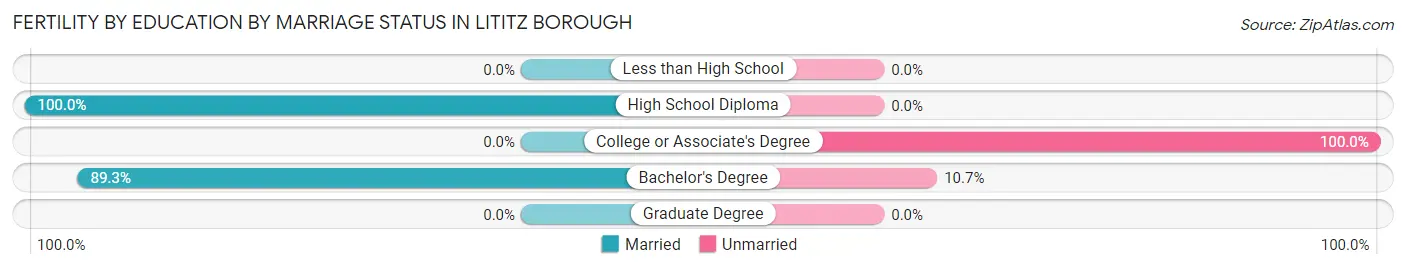
| Educational Attainment | Married | Unmarried |
| Less than High School | 0 (0.0%) | 0 (0.0%) |
| High School Diploma | 15 (100.0%) | 0 (0.0%) |
| College or Associate's Degree | 0 (0.0%) | 11 (100.0%) |
| Bachelor's Degree | 67 (89.3%) | 8 (10.7%) |
| Graduate Degree | 0 (0.0%) | 0 (0.0%) |
| Total | 82 (81.2%) | 19 (18.8%) |
Income in Lititz borough
Income Overview in Lititz borough
Per Capita Income in Lititz borough is $46,076, while median incomes of families and households are $104,276 and $80,533 respectively.
| Characteristic | Number | Measure |
| Per Capita Income | 9,559 | $46,076 |
| Median Family Income | 2,451 | $104,276 |
| Mean Family Income | 2,451 | $140,411 |
| Median Household Income | 3,833 | $80,533 |
| Mean Household Income | 3,833 | $111,870 |
| Income Deficit | 2,451 | $0 |
| Wage / Income Gap (%) | 9,559 | 23.46% |
| Wage / Income Gap ($) | 9,559 | 76.54¢ per $1 |
| Gini / Inequality Index | 9,559 | 0.45 |
Earnings by Sex in Lititz borough
Average Earnings in Lititz borough are $46,016, $51,493 for men and $39,412 for women, a difference of 23.5%.
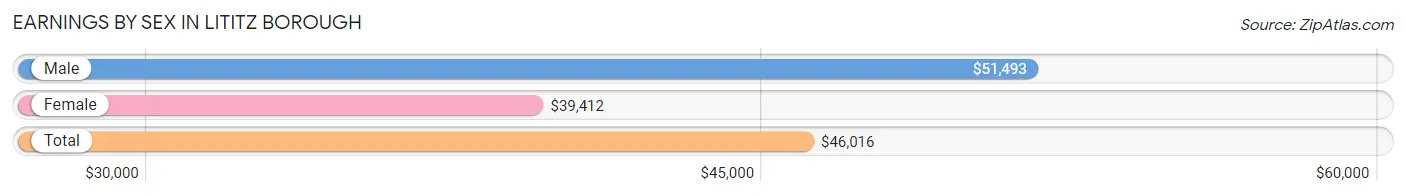
| Sex | Number | Average Earnings |
| Male | 2,801 (53.1%) | $51,493 |
| Female | 2,478 (46.9%) | $39,412 |
| Total | 5,279 (100.0%) | $46,016 |
Earnings by Sex by Income Bracket in Lititz borough
The most common earnings brackets in Lititz borough are $100,000+ for men (523 | 18.7%) and $55,000 to $64,999 for women (325 | 13.1%).
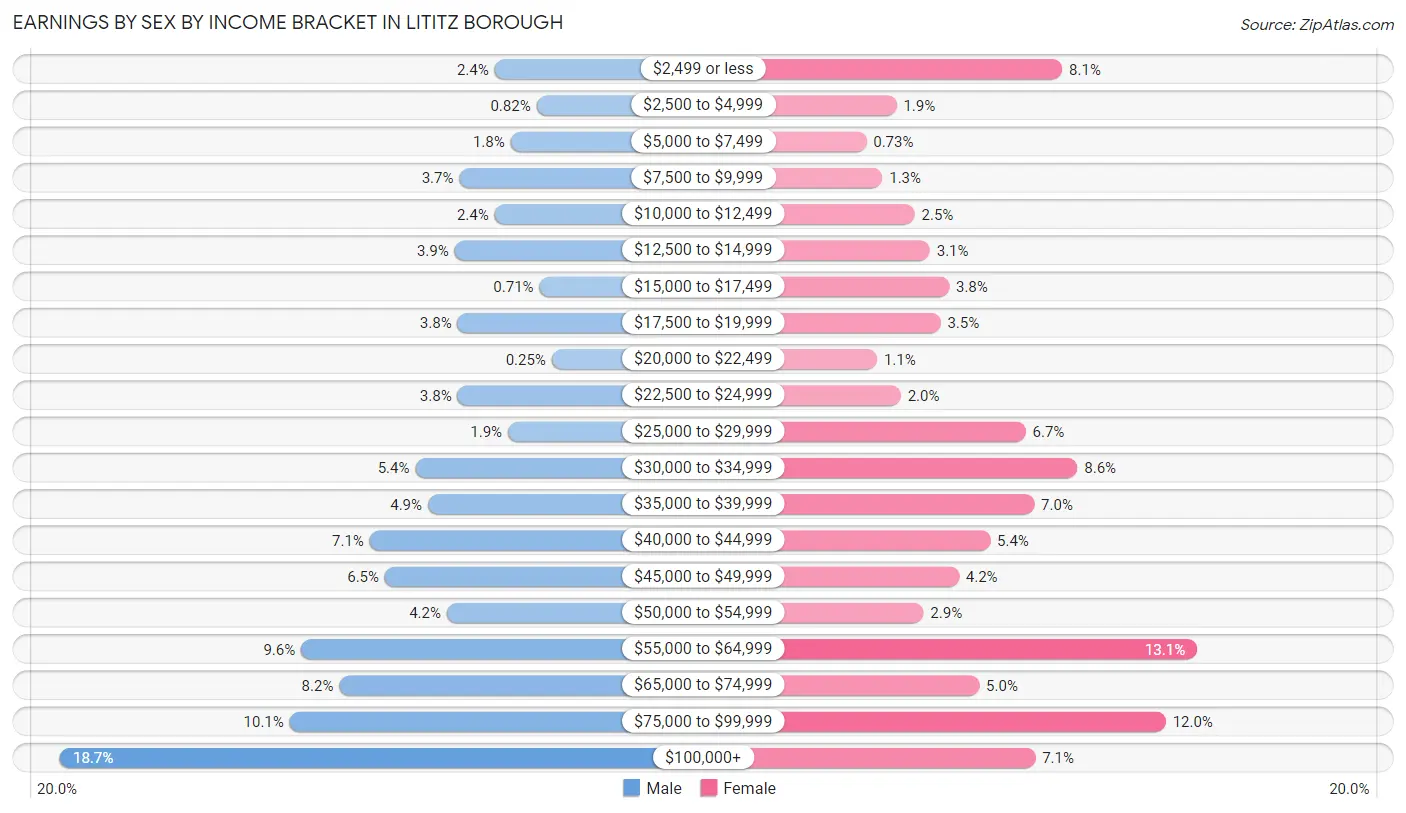
| Income | Male | Female |
| $2,499 or less | 67 (2.4%) | 200 (8.1%) |
| $2,500 to $4,999 | 23 (0.8%) | 46 (1.9%) |
| $5,000 to $7,499 | 50 (1.8%) | 18 (0.7%) |
| $7,500 to $9,999 | 104 (3.7%) | 33 (1.3%) |
| $10,000 to $12,499 | 67 (2.4%) | 63 (2.5%) |
| $12,500 to $14,999 | 109 (3.9%) | 77 (3.1%) |
| $15,000 to $17,499 | 20 (0.7%) | 95 (3.8%) |
| $17,500 to $19,999 | 106 (3.8%) | 87 (3.5%) |
| $20,000 to $22,499 | 7 (0.3%) | 28 (1.1%) |
| $22,500 to $24,999 | 106 (3.8%) | 50 (2.0%) |
| $25,000 to $29,999 | 53 (1.9%) | 166 (6.7%) |
| $30,000 to $34,999 | 150 (5.4%) | 214 (8.6%) |
| $35,000 to $39,999 | 137 (4.9%) | 174 (7.0%) |
| $40,000 to $44,999 | 198 (7.1%) | 133 (5.4%) |
| $45,000 to $49,999 | 182 (6.5%) | 104 (4.2%) |
| $50,000 to $54,999 | 117 (4.2%) | 71 (2.9%) |
| $55,000 to $64,999 | 270 (9.6%) | 325 (13.1%) |
| $65,000 to $74,999 | 230 (8.2%) | 123 (5.0%) |
| $75,000 to $99,999 | 282 (10.1%) | 296 (11.9%) |
| $100,000+ | 523 (18.7%) | 175 (7.1%) |
| Total | 2,801 (100.0%) | 2,478 (100.0%) |
Earnings by Sex by Educational Attainment in Lititz borough
Average earnings in Lititz borough are $61,352 for men and $43,450 for women, a difference of 29.2%. Men with an educational attainment of graduate degree enjoy the highest average annual earnings of $100,074, while those with high school diploma education earn the least with $42,029. Women with an educational attainment of graduate degree earn the most with the average annual earnings of $64,309, while those with high school diploma education have the smallest earnings of $29,554.
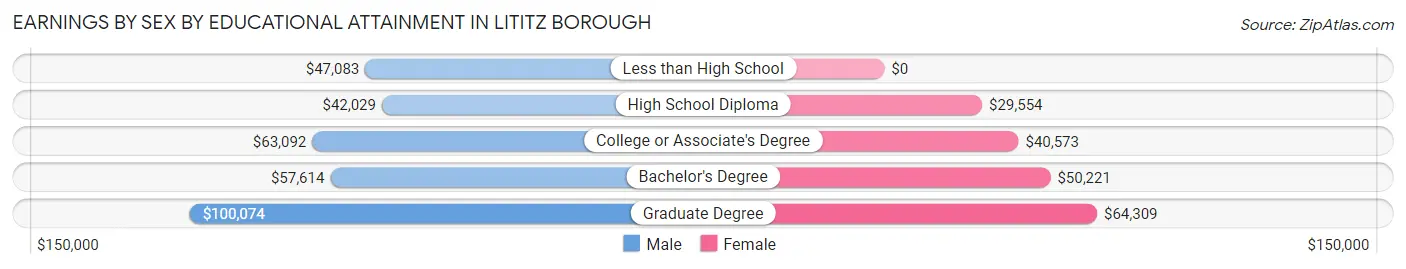
| Educational Attainment | Male Income | Female Income |
| Less than High School | $47,083 | $0 |
| High School Diploma | $42,029 | $29,554 |
| College or Associate's Degree | $63,092 | $40,573 |
| Bachelor's Degree | $57,614 | $50,221 |
| Graduate Degree | $100,074 | $64,309 |
| Total | $61,352 | $43,450 |
Family Income in Lititz borough
Family Income Brackets in Lititz borough
According to the Lititz borough family income data, there are 625 families falling into the $100,000 to $149,999 income range, which is the most common income bracket and makes up 25.5% of all families.
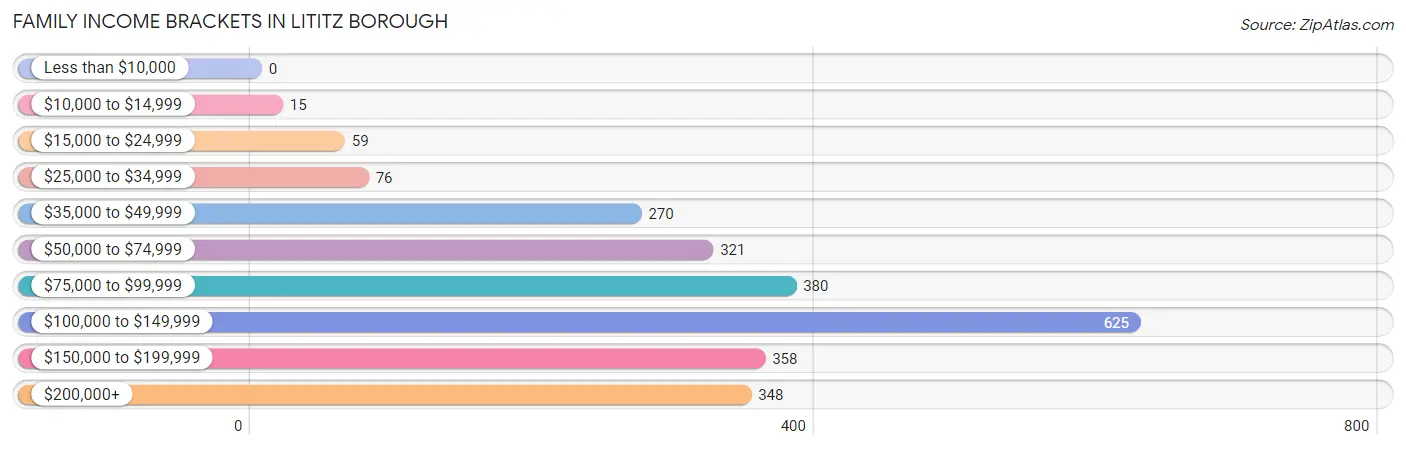
| Income Bracket | # Families | % Families |
| Less than $10,000 | 0 | 0.0% |
| $10,000 to $14,999 | 15 | 0.6% |
| $15,000 to $24,999 | 59 | 2.4% |
| $25,000 to $34,999 | 76 | 3.1% |
| $35,000 to $49,999 | 270 | 11.0% |
| $50,000 to $74,999 | 321 | 13.1% |
| $75,000 to $99,999 | 380 | 15.5% |
| $100,000 to $149,999 | 625 | 25.5% |
| $150,000 to $199,999 | 358 | 14.6% |
| $200,000+ | 348 | 14.2% |
Family Income by Famaliy Size in Lititz borough
6-person families (137 | 5.6%) account for the highest median family income in Lititz borough with $148,203 per family, while 2-person families (1,182 | 48.2%) have the highest median income of $49,070 per family member.
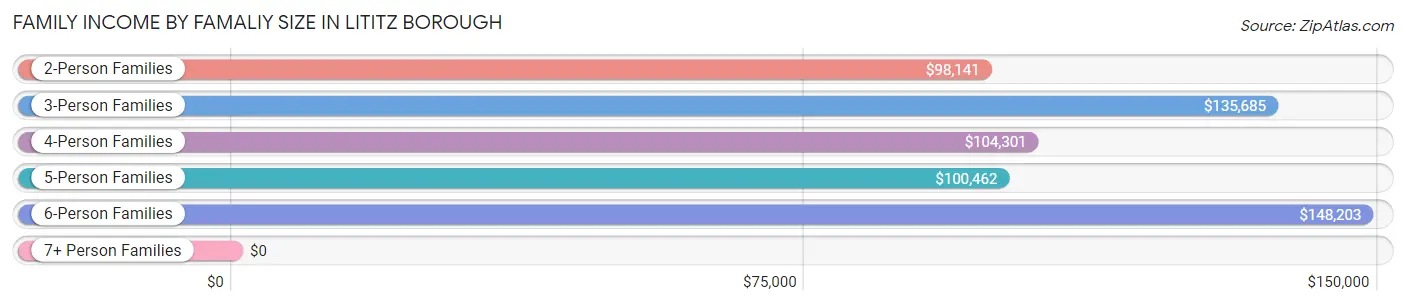
| Income Bracket | # Families | Median Income |
| 2-Person Families | 1,182 (48.2%) | $98,141 |
| 3-Person Families | 445 (18.2%) | $135,685 |
| 4-Person Families | 449 (18.3%) | $104,301 |
| 5-Person Families | 238 (9.7%) | $100,462 |
| 6-Person Families | 137 (5.6%) | $148,203 |
| 7+ Person Families | 0 (0.0%) | $0 |
| Total | 2,451 (100.0%) | $104,276 |
Family Income by Number of Earners in Lititz borough
The median family income in Lititz borough is $104,276, with families comprising 3+ earners (342) having the highest median family income of $166,111, while families with no earners (283) have the lowest median family income of $48,482, accounting for 14.0% and 11.6% of families, respectively.
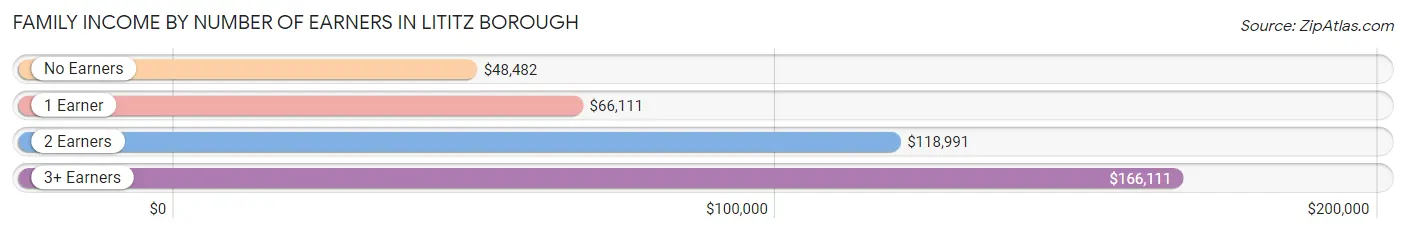
| Number of Earners | # Families | Median Income |
| No Earners | 283 (11.6%) | $48,482 |
| 1 Earner | 566 (23.1%) | $66,111 |
| 2 Earners | 1,260 (51.4%) | $118,991 |
| 3+ Earners | 342 (14.0%) | $166,111 |
| Total | 2,451 (100.0%) | $104,276 |
Household Income in Lititz borough
Household Income Brackets in Lititz borough
With 740 households falling in the category, the $100,000 to $149,999 income range is the most frequent in Lititz borough, accounting for 19.3% of all households. In contrast, only 57 households (1.5%) fall into the less than $10,000 income bracket, making it the least populous group.
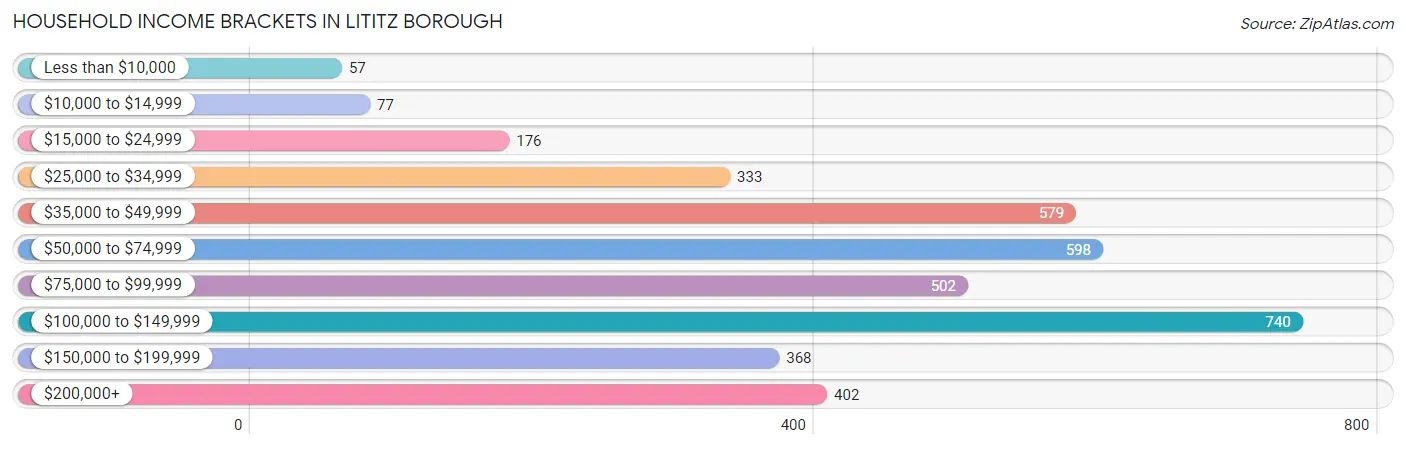
| Income Bracket | # Households | % Households |
| Less than $10,000 | 57 | 1.5% |
| $10,000 to $14,999 | 77 | 2.0% |
| $15,000 to $24,999 | 176 | 4.6% |
| $25,000 to $34,999 | 333 | 8.7% |
| $35,000 to $49,999 | 579 | 15.1% |
| $50,000 to $74,999 | 598 | 15.6% |
| $75,000 to $99,999 | 502 | 13.1% |
| $100,000 to $149,999 | 740 | 19.3% |
| $150,000 to $199,999 | 368 | 9.6% |
| $200,000+ | 402 | 10.5% |
Household Income by Householder Age in Lititz borough
The median household income in Lititz borough is $80,533, with the highest median household income of $109,167 found in the 45 to 64 years age bracket for the primary householder. A total of 1,130 households (29.5%) fall into this category. Meanwhile, the 15 to 24 years age bracket for the primary householder has the lowest median household income of $0, with 29 households (0.8%) in this group.
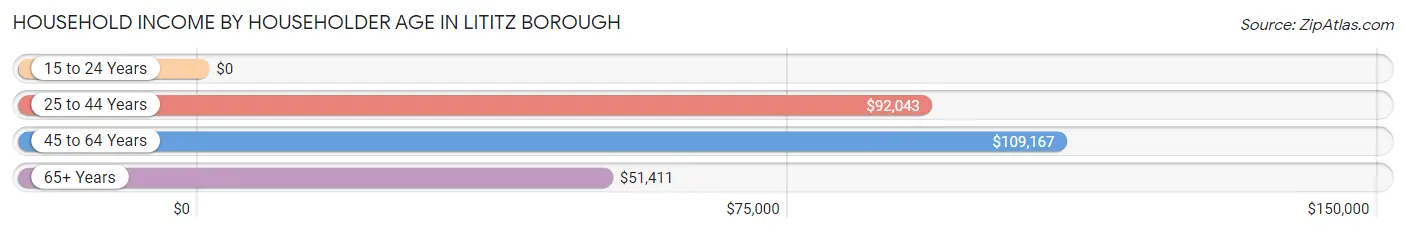
| Income Bracket | # Households | Median Income |
| 15 to 24 Years | 29 (0.8%) | $0 |
| 25 to 44 Years | 1,281 (33.4%) | $92,043 |
| 45 to 64 Years | 1,130 (29.5%) | $109,167 |
| 65+ Years | 1,393 (36.3%) | $51,411 |
| Total | 3,833 (100.0%) | $80,533 |
Poverty in Lititz borough
Income Below Poverty by Sex and Age in Lititz borough
With 3.9% poverty level for males and 3.5% for females among the residents of Lititz borough, 65 to 74 year old males and 75 year old and over females are the most vulnerable to poverty, with 52 males (9.6%) and 46 females (8.0%) in their respective age groups living below the poverty level.
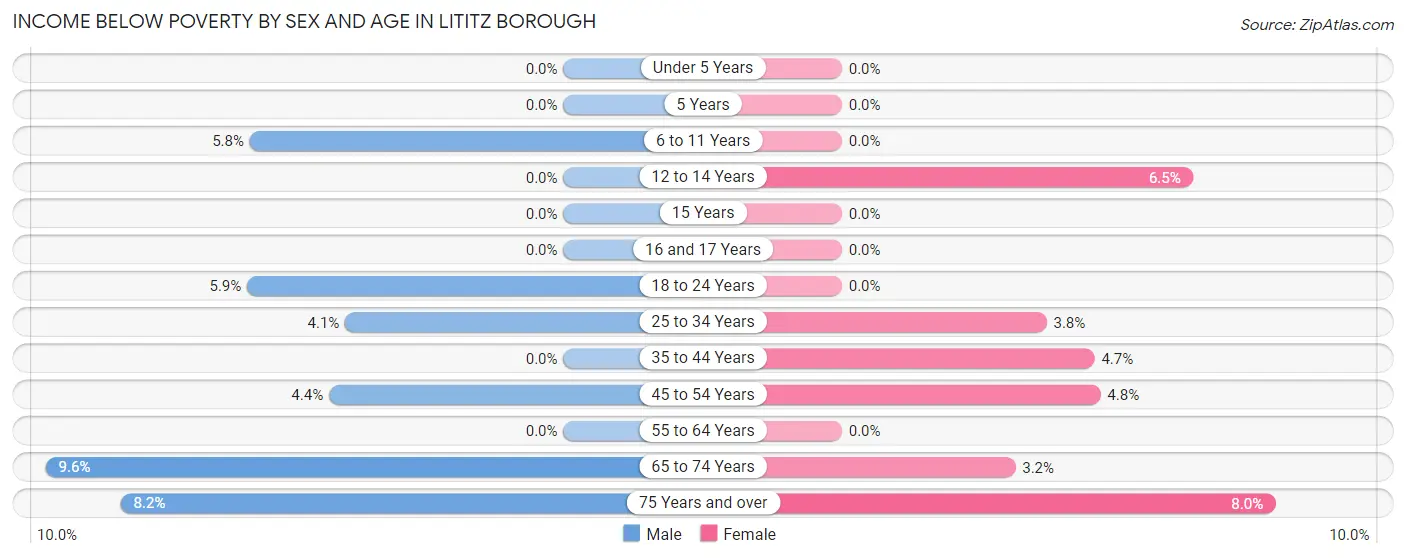
| Age Bracket | Male | Female |
| Under 5 Years | 0 (0.0%) | 0 (0.0%) |
| 5 Years | 0 (0.0%) | 0 (0.0%) |
| 6 to 11 Years | 22 (5.8%) | 0 (0.0%) |
| 12 to 14 Years | 0 (0.0%) | 11 (6.5%) |
| 15 Years | 0 (0.0%) | 0 (0.0%) |
| 16 and 17 Years | 0 (0.0%) | 0 (0.0%) |
| 18 to 24 Years | 33 (5.9%) | 0 (0.0%) |
| 25 to 34 Years | 25 (4.1%) | 24 (3.8%) |
| 35 to 44 Years | 0 (0.0%) | 28 (4.7%) |
| 45 to 54 Years | 19 (4.3%) | 30 (4.8%) |
| 55 to 64 Years | 0 (0.0%) | 0 (0.0%) |
| 65 to 74 Years | 52 (9.6%) | 21 (3.2%) |
| 75 Years and over | 31 (8.2%) | 46 (8.0%) |
| Total | 182 (3.9%) | 160 (3.5%) |
Income Above Poverty by Sex and Age in Lititz borough
According to the poverty statistics in Lititz borough, males aged under 5 years and females aged under 5 years are the age groups that are most secure financially, with 100.0% of males and 100.0% of females in these age groups living above the poverty line.
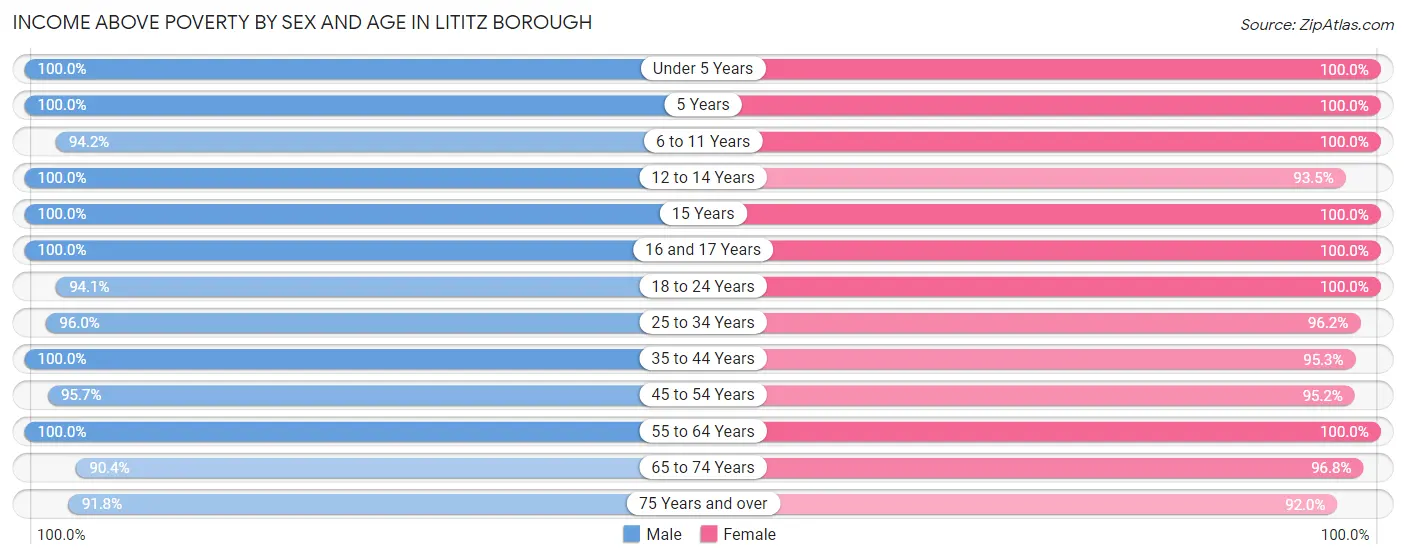
| Age Bracket | Male | Female |
| Under 5 Years | 460 (100.0%) | 105 (100.0%) |
| 5 Years | 106 (100.0%) | 111 (100.0%) |
| 6 to 11 Years | 356 (94.2%) | 394 (100.0%) |
| 12 to 14 Years | 199 (100.0%) | 158 (93.5%) |
| 15 Years | 10 (100.0%) | 26 (100.0%) |
| 16 and 17 Years | 66 (100.0%) | 41 (100.0%) |
| 18 to 24 Years | 529 (94.1%) | 223 (100.0%) |
| 25 to 34 Years | 592 (96.0%) | 607 (96.2%) |
| 35 to 44 Years | 532 (100.0%) | 569 (95.3%) |
| 45 to 54 Years | 418 (95.7%) | 595 (95.2%) |
| 55 to 64 Years | 433 (100.0%) | 396 (100.0%) |
| 65 to 74 Years | 489 (90.4%) | 632 (96.8%) |
| 75 Years and over | 346 (91.8%) | 526 (92.0%) |
| Total | 4,536 (96.1%) | 4,383 (96.5%) |
Income Below Poverty Among Married-Couple Families in Lititz borough
The poverty statistics for married-couple families in Lititz borough show that 1.3% or 27 of the total 2,125 families live below the poverty line. Families with 3 or 4 children have the highest poverty rate of 3.8%, comprising of 12 families. On the other hand, families with 1 or 2 children have the lowest poverty rate of 0.0%, which includes 0 families.
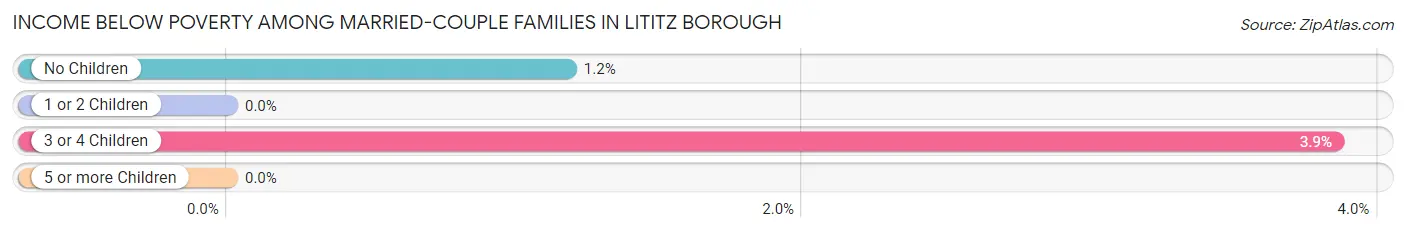
| Children | Above Poverty | Below Poverty |
| No Children | 1,253 (98.8%) | 15 (1.2%) |
| 1 or 2 Children | 545 (100.0%) | 0 (0.0%) |
| 3 or 4 Children | 300 (96.2%) | 12 (3.8%) |
| 5 or more Children | 0 (0.0%) | 0 (0.0%) |
| Total | 2,098 (98.7%) | 27 (1.3%) |
Income Below Poverty Among Single-Parent Households in Lititz borough
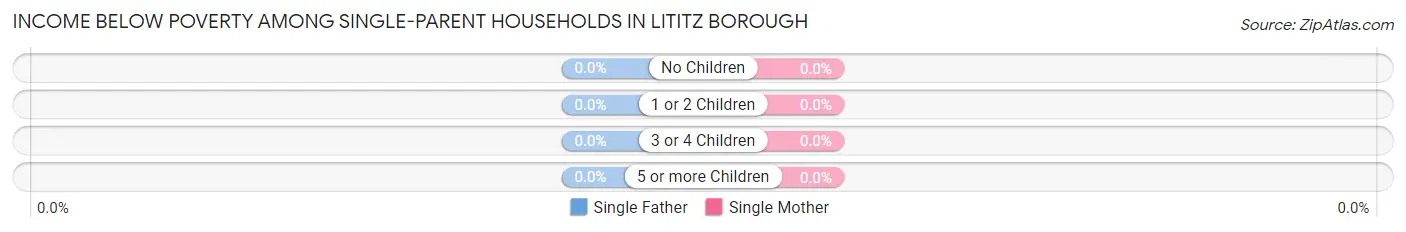
| Children | Single Father | Single Mother |
| No Children | 0 (0.0%) | 0 (0.0%) |
| 1 or 2 Children | 0 (0.0%) | 0 (0.0%) |
| 3 or 4 Children | 0 (0.0%) | 0 (0.0%) |
| 5 or more Children | 0 (0.0%) | 0 (0.0%) |
| Total | 0 (0.0%) | 0 (0.0%) |
Income Below Poverty Among Married-Couple vs Single-Parent Households in Lititz borough
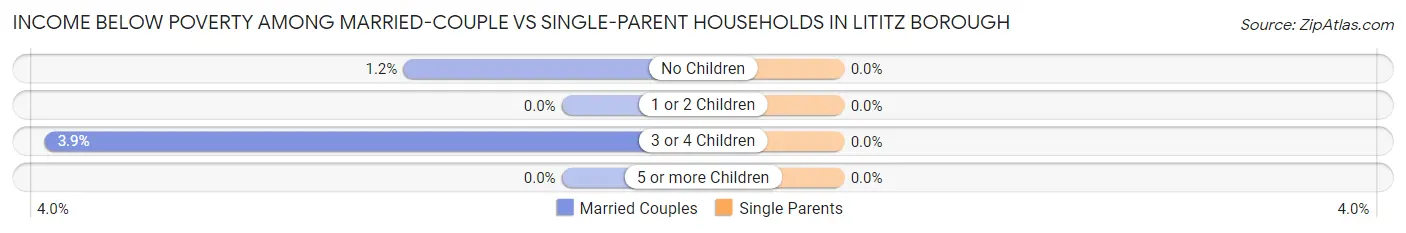
| Children | Married-Couple Families | Single-Parent Households |
| No Children | 15 (1.2%) | 0 (0.0%) |
| 1 or 2 Children | 0 (0.0%) | 0 (0.0%) |
| 3 or 4 Children | 12 (3.8%) | 0 (0.0%) |
| 5 or more Children | 0 (0.0%) | 0 (0.0%) |
| Total | 27 (1.3%) | 0 (0.0%) |
Employment Characteristics in Lititz borough
Employment by Class of Employer in Lititz borough
Among the 4,831 employed individuals in Lititz borough, private company employees (3,085 | 63.9%), not-for-profit organizations (739 | 15.3%), and local government employees (503 | 10.4%) make up the most common classes of employment.
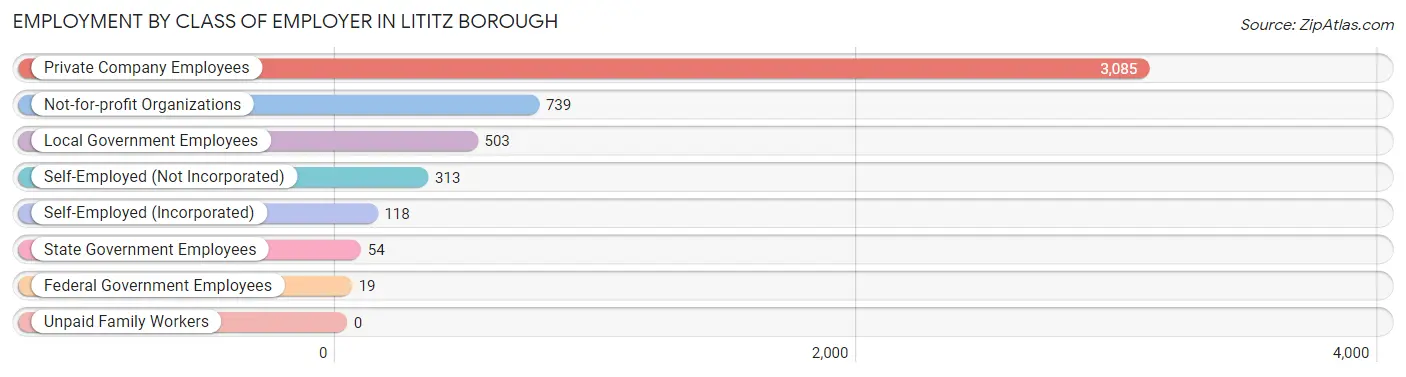
| Employer Class | # Employees | % Employees |
| Private Company Employees | 3,085 | 63.9% |
| Self-Employed (Incorporated) | 118 | 2.4% |
| Self-Employed (Not Incorporated) | 313 | 6.5% |
| Not-for-profit Organizations | 739 | 15.3% |
| Local Government Employees | 503 | 10.4% |
| State Government Employees | 54 | 1.1% |
| Federal Government Employees | 19 | 0.4% |
| Unpaid Family Workers | 0 | 0.0% |
| Total | 4,831 | 100.0% |
Employment Status by Age in Lititz borough
According to the labor force statistics for Lititz borough, out of the total population over 16 years of age (7,581), 66.1% or 5,011 individuals are in the labor force, with 2.6% or 130 of them unemployed. The age group with the highest labor force participation rate is 45 to 54 years, with 94.8% or 1,007 individuals in the labor force. Within the labor force, the 16 to 19 years age range has the highest percentage of unemployed individuals, with 15.3% or 19 of them being unemployed.
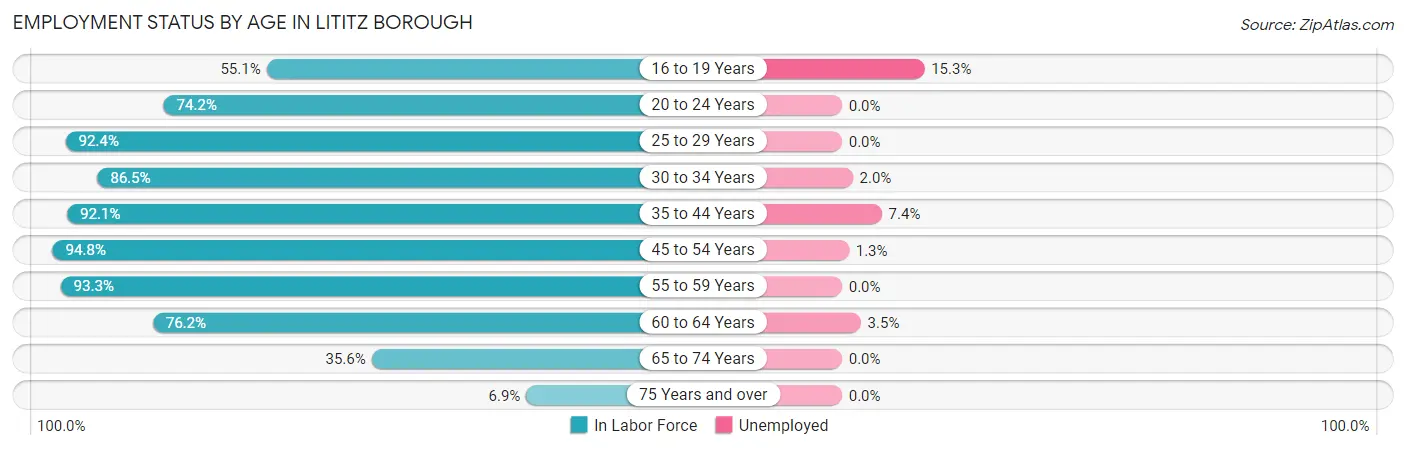
| Age Bracket | In Labor Force | Unemployed |
| 16 to 19 Years | 124 (55.1%) | 19 (15.3%) |
| 20 to 24 Years | 495 (74.2%) | 0 (0.0%) |
| 25 to 29 Years | 415 (92.4%) | 0 (0.0%) |
| 30 to 34 Years | 691 (86.5%) | 14 (2.0%) |
| 35 to 44 Years | 1,040 (92.1%) | 77 (7.4%) |
| 45 to 54 Years | 1,007 (94.8%) | 13 (1.3%) |
| 55 to 59 Years | 463 (93.3%) | 0 (0.0%) |
| 60 to 64 Years | 256 (76.2%) | 9 (3.5%) |
| 65 to 74 Years | 434 (35.6%) | 0 (0.0%) |
| 75 Years and over | 83 (6.9%) | 0 (0.0%) |
| Total | 5,011 (66.1%) | 130 (2.6%) |
Employment Status by Educational Attainment in Lititz borough
According to labor force statistics for Lititz borough, 90.7% of individuals (3,874) out of the total population between 25 and 64 years of age (4,271) are in the labor force, with 2.9% or 112 of them being unemployed. The group with the highest labor force participation rate are those with the educational attainment of bachelor's degree or higher, with 95.8% or 1,908 individuals in the labor force. Within the labor force, individuals with college / associate degree education have the highest percentage of unemployment, with 8.7% or 91 of them being unemployed.
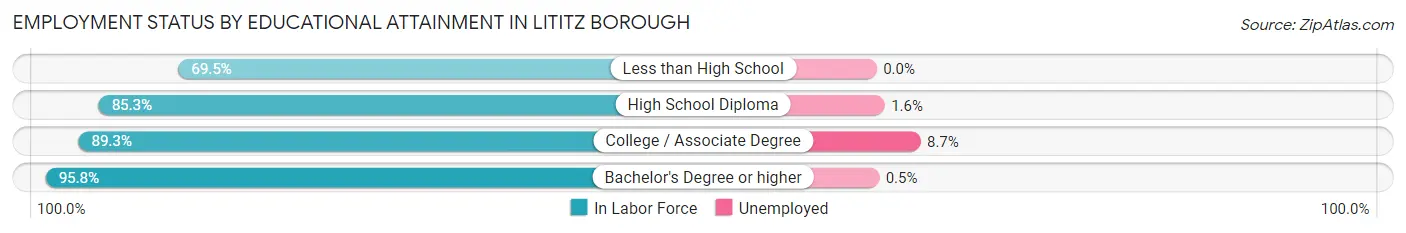
| Educational Attainment | In Labor Force | Unemployed |
| Less than High School | 116 (69.5%) | 0 (0.0%) |
| High School Diploma | 799 (85.3%) | 15 (1.6%) |
| College / Associate Degree | 1,049 (89.3%) | 102 (8.7%) |
| Bachelor's Degree or higher | 1,908 (95.8%) | 10 (0.5%) |
| Total | 3,874 (90.7%) | 124 (2.9%) |
Employment Occupations by Sex in Lititz borough
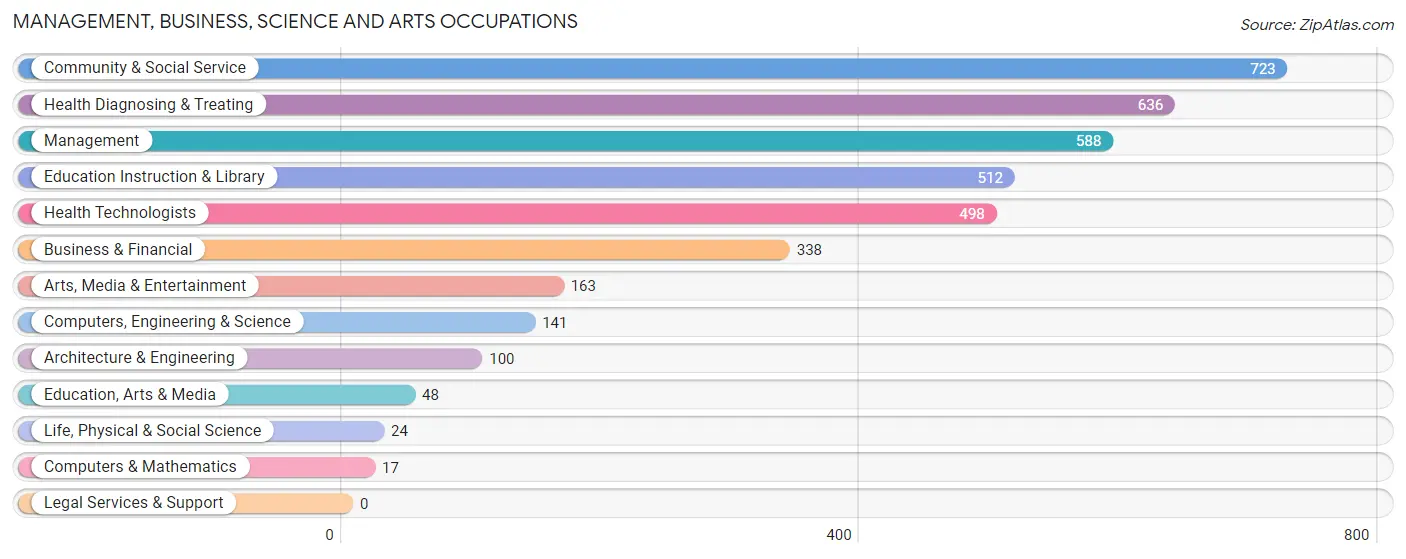
Management, Business, Science and Arts Occupations
The most common Management, Business, Science and Arts occupations in Lititz borough are Community & Social Service (723 | 14.8%), Health Diagnosing & Treating (636 | 13.0%), Management (588 | 12.1%), Education Instruction & Library (512 | 10.5%), and Health Technologists (498 | 10.2%).
Management, Business, Science and Arts Occupations by Sex
Within the Management, Business, Science and Arts occupations in Lititz borough, the most male-oriented occupations are Computers & Mathematics (100.0%), Arts, Media & Entertainment (79.7%), and Architecture & Engineering (72.0%), while the most female-oriented occupations are Health Technologists (81.9%), Health Diagnosing & Treating (78.5%), and Education Instruction & Library (76.2%).
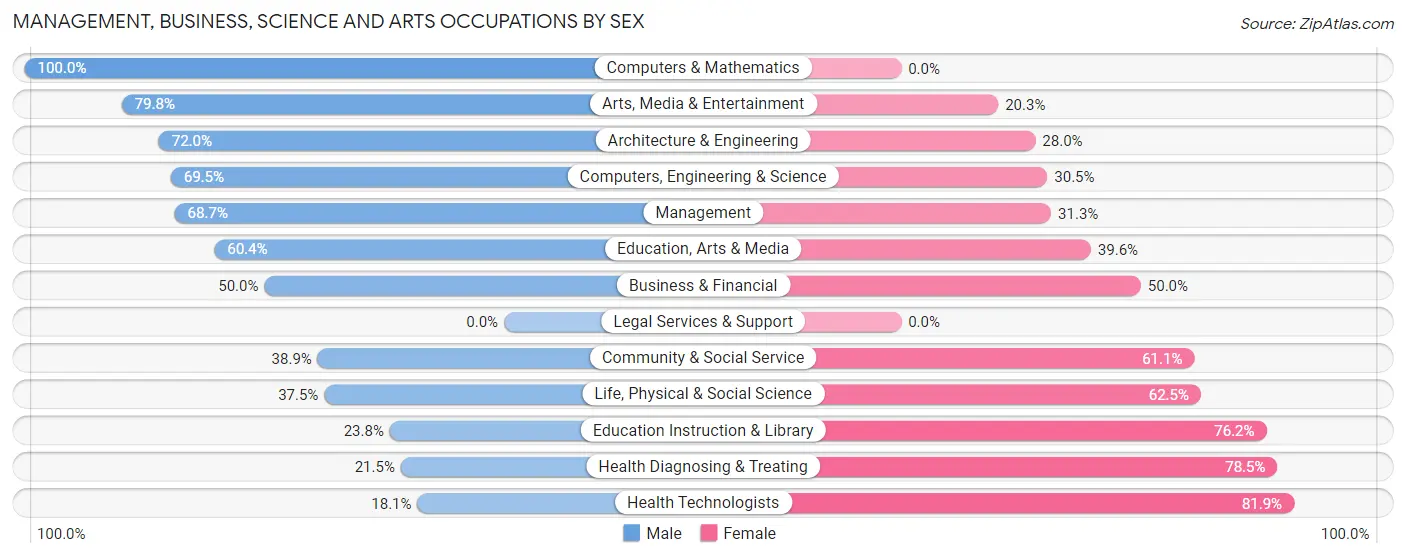
| Occupation | Male | Female |
| Management | 404 (68.7%) | 184 (31.3%) |
| Business & Financial | 169 (50.0%) | 169 (50.0%) |
| Computers, Engineering & Science | 98 (69.5%) | 43 (30.5%) |
| Computers & Mathematics | 17 (100.0%) | 0 (0.0%) |
| Architecture & Engineering | 72 (72.0%) | 28 (28.0%) |
| Life, Physical & Social Science | 9 (37.5%) | 15 (62.5%) |
| Community & Social Service | 281 (38.9%) | 442 (61.1%) |
| Education, Arts & Media | 29 (60.4%) | 19 (39.6%) |
| Legal Services & Support | 0 (0.0%) | 0 (0.0%) |
| Education Instruction & Library | 122 (23.8%) | 390 (76.2%) |
| Arts, Media & Entertainment | 130 (79.7%) | 33 (20.3%) |
| Health Diagnosing & Treating | 137 (21.5%) | 499 (78.5%) |
| Health Technologists | 90 (18.1%) | 408 (81.9%) |
| Total (Category) | 1,089 (44.9%) | 1,337 (55.1%) |
| Total (Overall) | 2,585 (53.0%) | 2,291 (47.0%) |
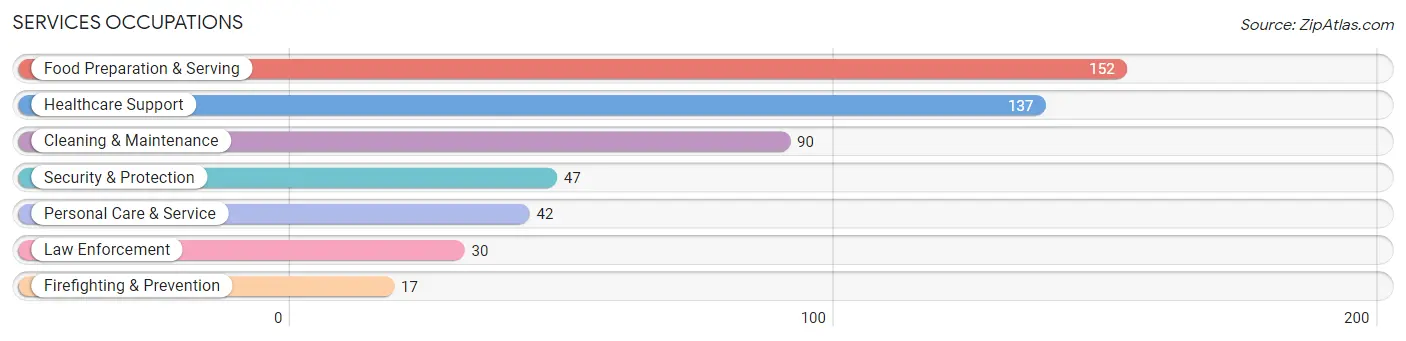
Services Occupations
The most common Services occupations in Lititz borough are Food Preparation & Serving (152 | 3.1%), Healthcare Support (137 | 2.8%), Cleaning & Maintenance (90 | 1.8%), Security & Protection (47 | 1.0%), and Personal Care & Service (42 | 0.9%).
Services Occupations by Sex
Within the Services occupations in Lititz borough, the most male-oriented occupations are Law Enforcement (100.0%), Cleaning & Maintenance (90.0%), and Security & Protection (63.8%), while the most female-oriented occupations are Firefighting & Prevention (100.0%), Food Preparation & Serving (86.2%), and Personal Care & Service (69.1%).
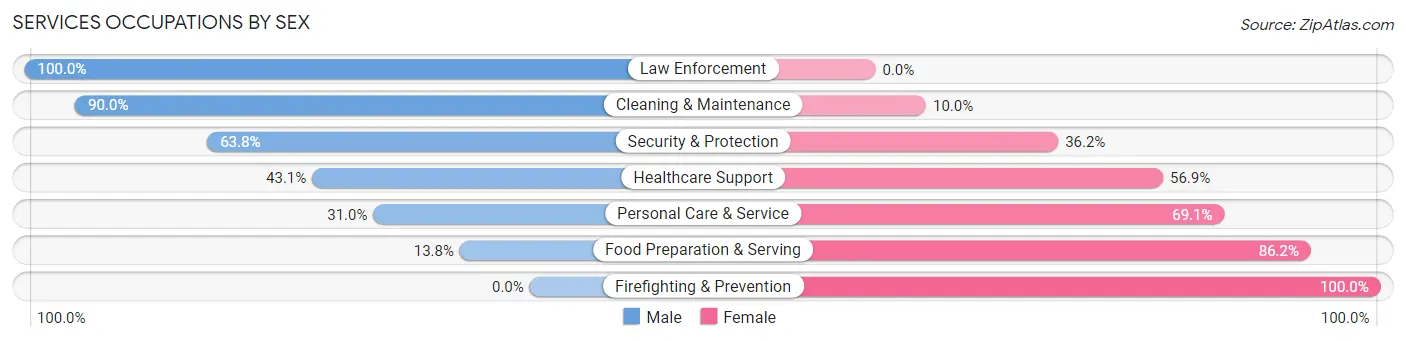
| Occupation | Male | Female |
| Healthcare Support | 59 (43.1%) | 78 (56.9%) |
| Security & Protection | 30 (63.8%) | 17 (36.2%) |
| Firefighting & Prevention | 0 (0.0%) | 17 (100.0%) |
| Law Enforcement | 30 (100.0%) | 0 (0.0%) |
| Food Preparation & Serving | 21 (13.8%) | 131 (86.2%) |
| Cleaning & Maintenance | 81 (90.0%) | 9 (10.0%) |
| Personal Care & Service | 13 (30.9%) | 29 (69.1%) |
| Total (Category) | 204 (43.6%) | 264 (56.4%) |
| Total (Overall) | 2,585 (53.0%) | 2,291 (47.0%) |
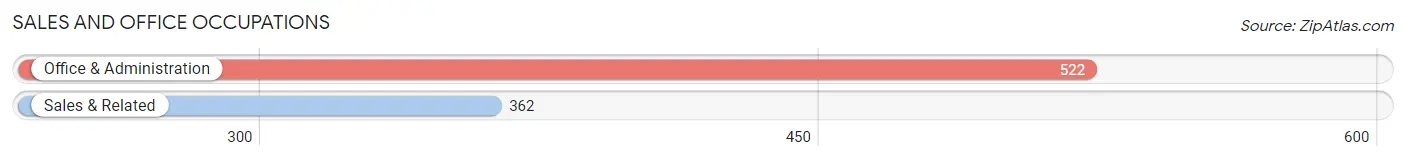
Sales and Office Occupations
The most common Sales and Office occupations in Lititz borough are Office & Administration (522 | 10.7%), and Sales & Related (362 | 7.4%).
Sales and Office Occupations by Sex
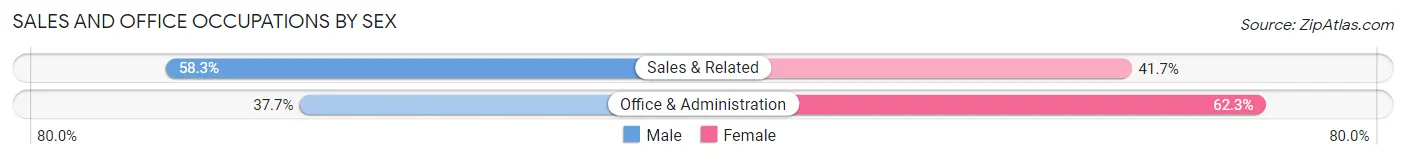
| Occupation | Male | Female |
| Sales & Related | 211 (58.3%) | 151 (41.7%) |
| Office & Administration | 197 (37.7%) | 325 (62.3%) |
| Total (Category) | 408 (46.2%) | 476 (53.8%) |
| Total (Overall) | 2,585 (53.0%) | 2,291 (47.0%) |
Natural Resources, Construction and Maintenance Occupations
The most common Natural Resources, Construction and Maintenance occupations in Lititz borough are Construction & Extraction (140 | 2.9%), Installation, Maintenance & Repair (42 | 0.9%), and Farming, Fishing & Forestry (10 | 0.2%).
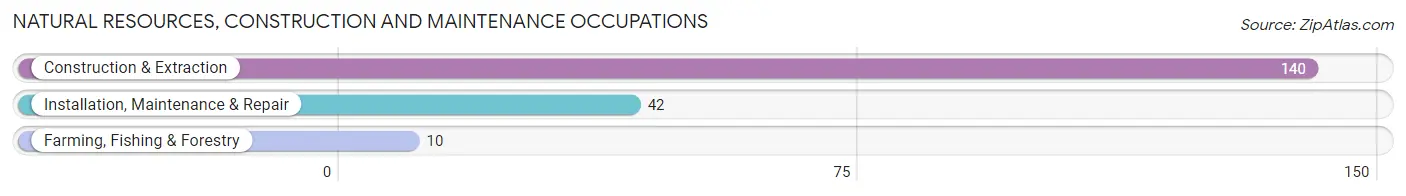
Natural Resources, Construction and Maintenance Occupations by Sex
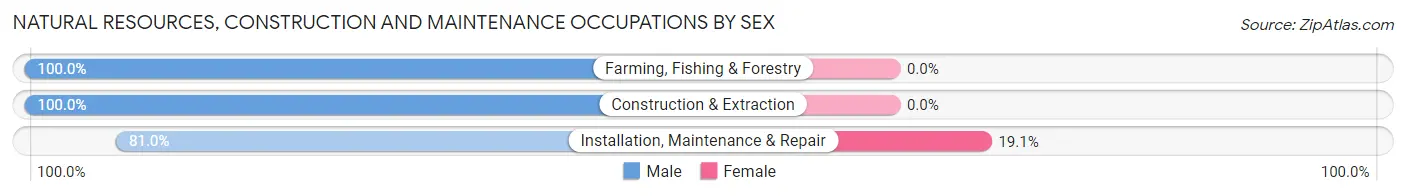
| Occupation | Male | Female |
| Farming, Fishing & Forestry | 10 (100.0%) | 0 (0.0%) |
| Construction & Extraction | 140 (100.0%) | 0 (0.0%) |
| Installation, Maintenance & Repair | 34 (80.9%) | 8 (19.1%) |
| Total (Category) | 184 (95.8%) | 8 (4.2%) |
| Total (Overall) | 2,585 (53.0%) | 2,291 (47.0%) |
Production, Transportation and Moving Occupations
The most common Production, Transportation and Moving occupations in Lititz borough are Production (444 | 9.1%), Material Moving (309 | 6.3%), and Transportation (153 | 3.1%).
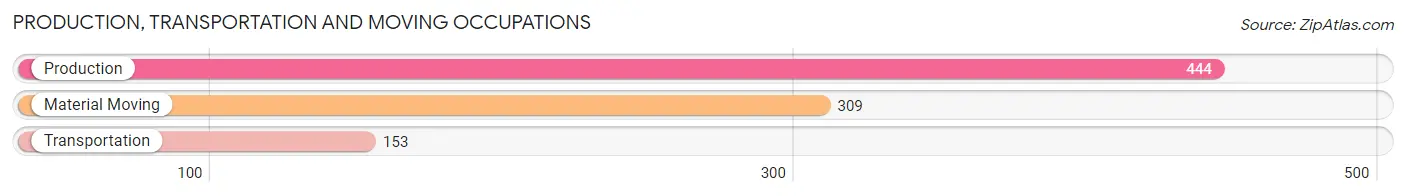
Production, Transportation and Moving Occupations by Sex
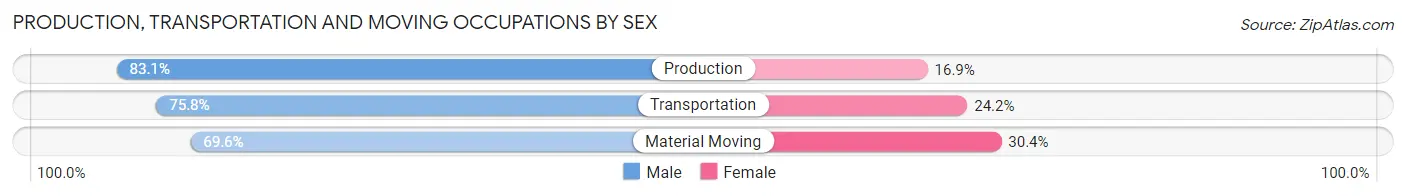
| Occupation | Male | Female |
| Production | 369 (83.1%) | 75 (16.9%) |
| Transportation | 116 (75.8%) | 37 (24.2%) |
| Material Moving | 215 (69.6%) | 94 (30.4%) |
| Total (Category) | 700 (77.3%) | 206 (22.7%) |
| Total (Overall) | 2,585 (53.0%) | 2,291 (47.0%) |
Employment Industries by Sex in Lititz borough
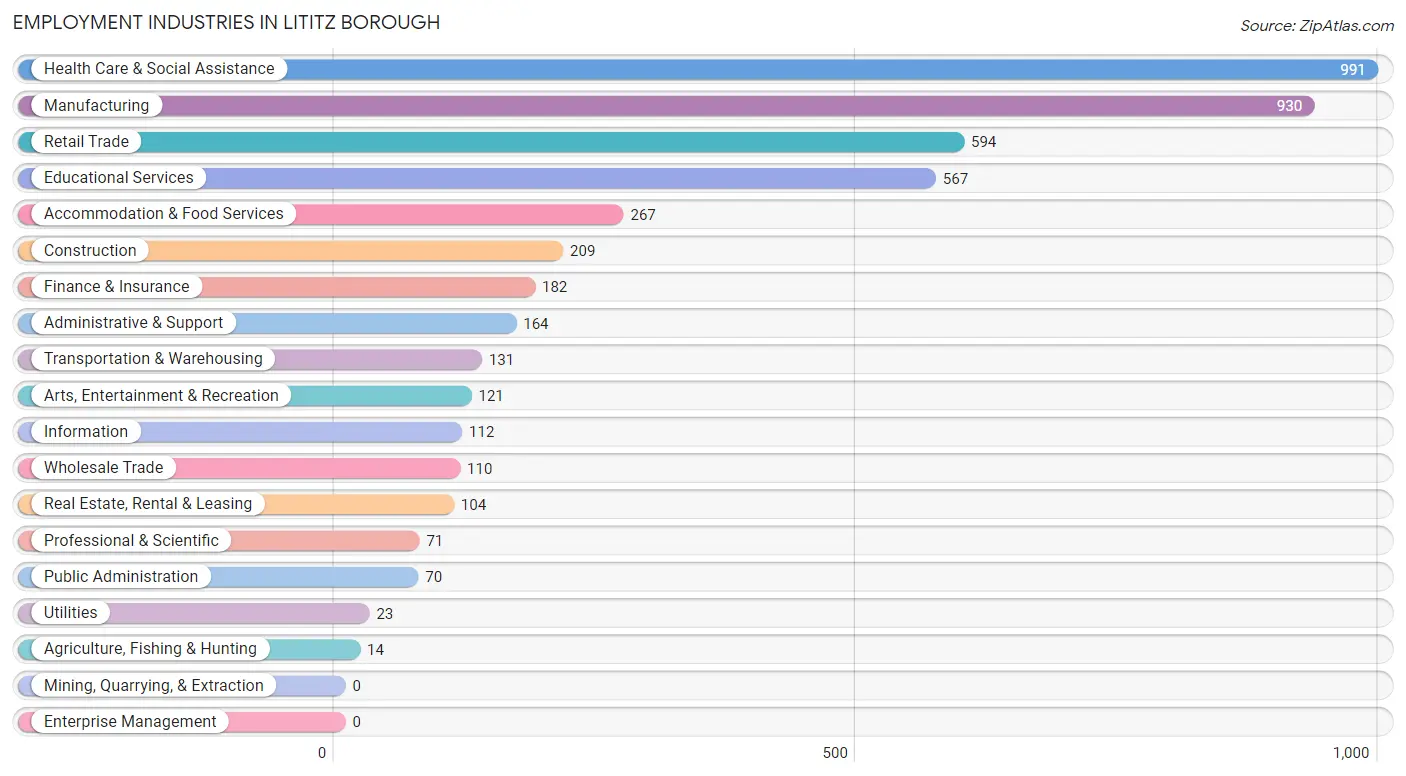
Employment Industries in Lititz borough
The major employment industries in Lititz borough include Health Care & Social Assistance (991 | 20.3%), Manufacturing (930 | 19.1%), Retail Trade (594 | 12.2%), Educational Services (567 | 11.6%), and Accommodation & Food Services (267 | 5.5%).
Employment Industries by Sex in Lititz borough
The Lititz borough industries that see more men than women are Utilities (100.0%), Construction (88.0%), and Information (87.5%), whereas the industries that tend to have a higher number of women are Health Care & Social Assistance (77.5%), Educational Services (75.5%), and Finance & Insurance (70.3%).
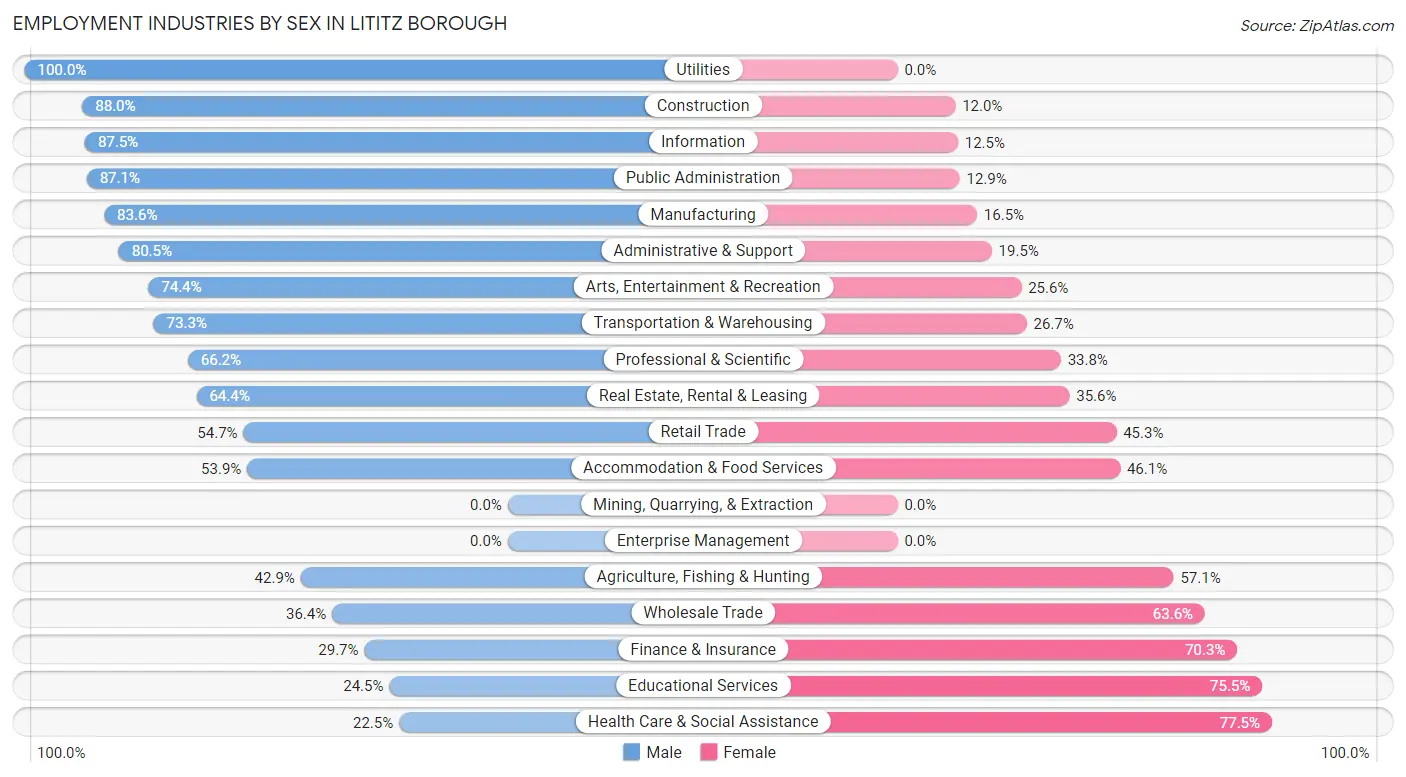
| Industry | Male | Female |
| Agriculture, Fishing & Hunting | 6 (42.9%) | 8 (57.1%) |
| Mining, Quarrying, & Extraction | 0 (0.0%) | 0 (0.0%) |
| Construction | 184 (88.0%) | 25 (12.0%) |
| Manufacturing | 777 (83.6%) | 153 (16.5%) |
| Wholesale Trade | 40 (36.4%) | 70 (63.6%) |
| Retail Trade | 325 (54.7%) | 269 (45.3%) |
| Transportation & Warehousing | 96 (73.3%) | 35 (26.7%) |
| Utilities | 23 (100.0%) | 0 (0.0%) |
| Information | 98 (87.5%) | 14 (12.5%) |
| Finance & Insurance | 54 (29.7%) | 128 (70.3%) |
| Real Estate, Rental & Leasing | 67 (64.4%) | 37 (35.6%) |
| Professional & Scientific | 47 (66.2%) | 24 (33.8%) |
| Enterprise Management | 0 (0.0%) | 0 (0.0%) |
| Administrative & Support | 132 (80.5%) | 32 (19.5%) |
| Educational Services | 139 (24.5%) | 428 (75.5%) |
| Health Care & Social Assistance | 223 (22.5%) | 768 (77.5%) |
| Arts, Entertainment & Recreation | 90 (74.4%) | 31 (25.6%) |
| Accommodation & Food Services | 144 (53.9%) | 123 (46.1%) |
| Public Administration | 61 (87.1%) | 9 (12.9%) |
| Total | 2,585 (53.0%) | 2,291 (47.0%) |
Education in Lititz borough
School Enrollment in Lititz borough
The most common levels of schooling among the 1,952 students in Lititz borough are elementary school (489 | 25.1%), middle school (356 | 18.2%), and high school (312 | 16.0%).
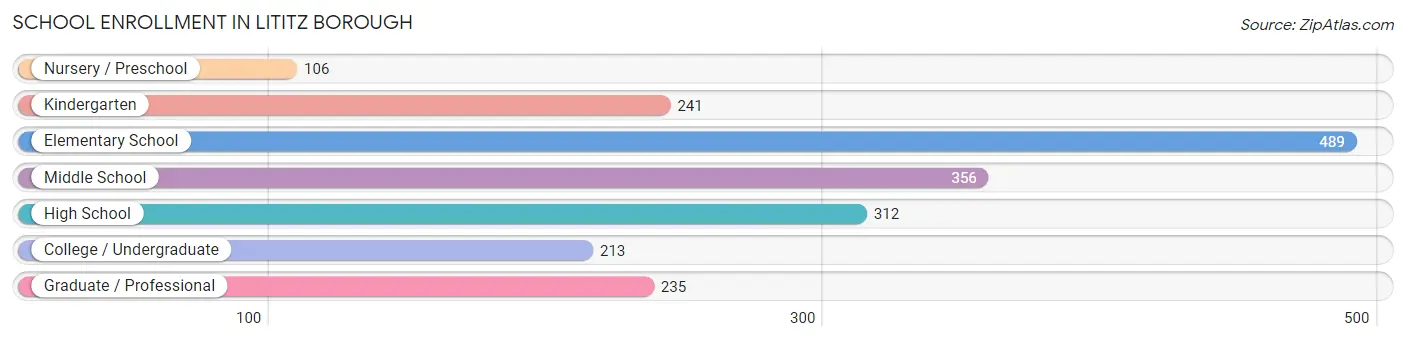
| School Level | # Students | % Students |
| Nursery / Preschool | 106 | 5.4% |
| Kindergarten | 241 | 12.3% |
| Elementary School | 489 | 25.1% |
| Middle School | 356 | 18.2% |
| High School | 312 | 16.0% |
| College / Undergraduate | 213 | 10.9% |
| Graduate / Professional | 235 | 12.0% |
| Total | 1,952 | 100.0% |
School Enrollment by Age by Funding Source in Lititz borough
Out of a total of 1,952 students who are enrolled in schools in Lititz borough, 390 (20.0%) attend a private institution, while the remaining 1,562 (80.0%) are enrolled in public schools. The age group of 3 to 4 year olds has the highest likelihood of being enrolled in private schools, with 63 (59.4% in the age bracket) enrolled. Conversely, the age group of 10 to 14 year olds has the lowest likelihood of being enrolled in a private school, with 540 (91.1% in the age bracket) attending a public institution.
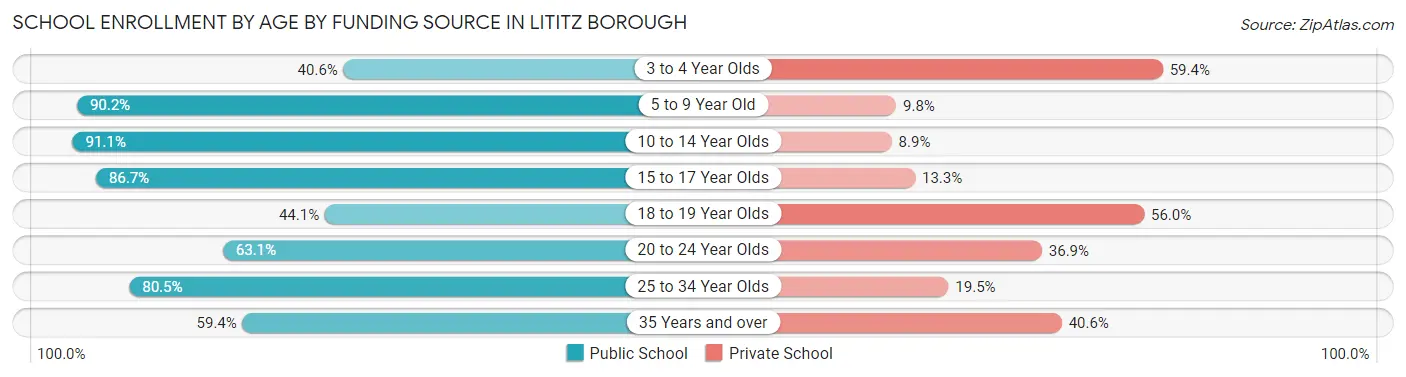
| Age Bracket | Public School | Private School |
| 3 to 4 Year Olds | 43 (40.6%) | 63 (59.4%) |
| 5 to 9 Year Old | 564 (90.2%) | 61 (9.8%) |
| 10 to 14 Year Olds | 540 (91.1%) | 53 (8.9%) |
| 15 to 17 Year Olds | 124 (86.7%) | 19 (13.3%) |
| 18 to 19 Year Olds | 37 (44.1%) | 47 (55.9%) |
| 20 to 24 Year Olds | 123 (63.1%) | 72 (36.9%) |
| 25 to 34 Year Olds | 33 (80.5%) | 8 (19.5%) |
| 35 Years and over | 98 (59.4%) | 67 (40.6%) |
| Total | 1,562 (80.0%) | 390 (20.0%) |
Educational Attainment by Field of Study in Lititz borough
Education (692 | 24.1%), business (480 | 16.7%), science & technology (383 | 13.3%), bio, nature & agricultural (204 | 7.1%), and visual & performing arts (201 | 7.0%) are the most common fields of study among 2,875 individuals in Lititz borough who have obtained a bachelor's degree or higher.
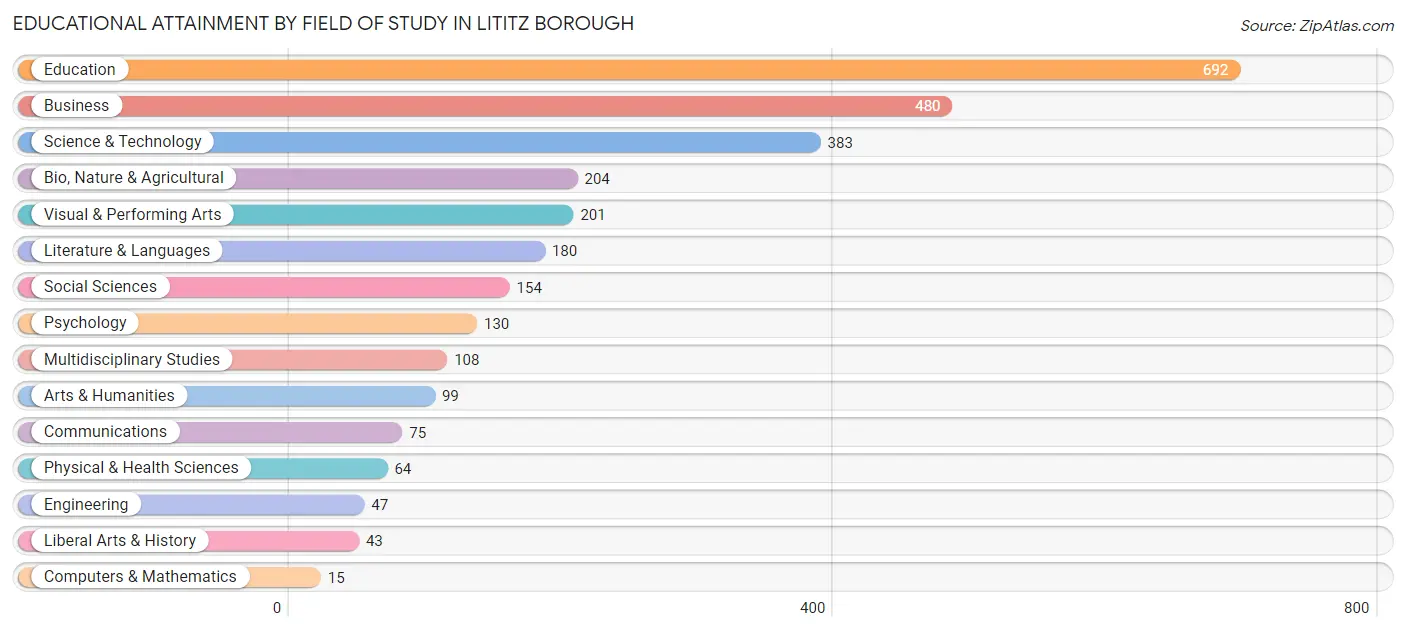
| Field of Study | # Graduates | % Graduates |
| Computers & Mathematics | 15 | 0.5% |
| Bio, Nature & Agricultural | 204 | 7.1% |
| Physical & Health Sciences | 64 | 2.2% |
| Psychology | 130 | 4.5% |
| Social Sciences | 154 | 5.4% |
| Engineering | 47 | 1.6% |
| Multidisciplinary Studies | 108 | 3.8% |
| Science & Technology | 383 | 13.3% |
| Business | 480 | 16.7% |
| Education | 692 | 24.1% |
| Literature & Languages | 180 | 6.3% |
| Liberal Arts & History | 43 | 1.5% |
| Visual & Performing Arts | 201 | 7.0% |
| Communications | 75 | 2.6% |
| Arts & Humanities | 99 | 3.4% |
| Total | 2,875 | 100.0% |
Transportation & Commute in Lititz borough
Vehicle Availability by Sex in Lititz borough
The most prevalent vehicle ownership categories in Lititz borough are males with 2 vehicles (1,318, accounting for 51.3%) and females with 2 vehicles (1,093, making up 59.1%).
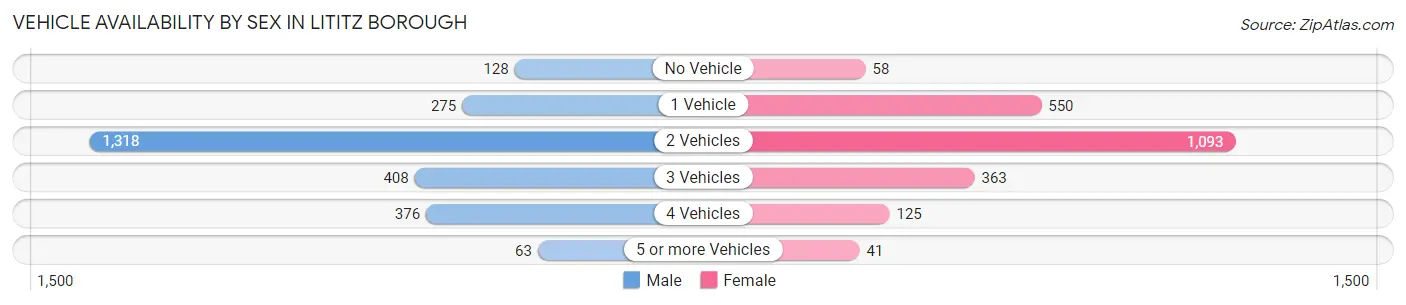
| Vehicles Available | Male | Female |
| No Vehicle | 128 (5.0%) | 58 (2.6%) |
| 1 Vehicle | 275 (10.7%) | 550 (24.7%) |
| 2 Vehicles | 1,318 (51.3%) | 1,093 (49.0%) |
| 3 Vehicles | 408 (15.9%) | 363 (16.3%) |
| 4 Vehicles | 376 (14.6%) | 125 (5.6%) |
| 5 or more Vehicles | 63 (2.5%) | 41 (1.8%) |
| Total | 2,568 (100.0%) | 2,230 (100.0%) |
Commute Time in Lititz borough
The most frequently occuring commute durations in Lititz borough are 20 to 24 minutes (756 commuters, 17.0%), 10 to 14 minutes (718 commuters, 16.2%), and 5 to 9 minutes (684 commuters, 15.4%).
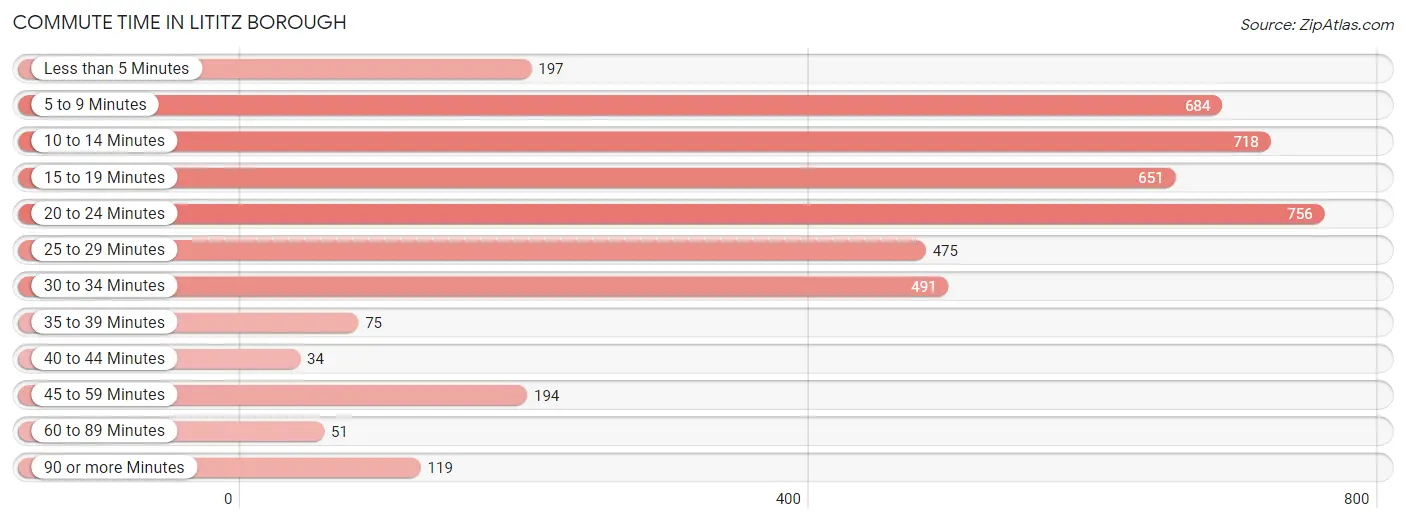
| Commute Time | # Commuters | % Commuters |
| Less than 5 Minutes | 197 | 4.4% |
| 5 to 9 Minutes | 684 | 15.4% |
| 10 to 14 Minutes | 718 | 16.2% |
| 15 to 19 Minutes | 651 | 14.6% |
| 20 to 24 Minutes | 756 | 17.0% |
| 25 to 29 Minutes | 475 | 10.7% |
| 30 to 34 Minutes | 491 | 11.1% |
| 35 to 39 Minutes | 75 | 1.7% |
| 40 to 44 Minutes | 34 | 0.8% |
| 45 to 59 Minutes | 194 | 4.4% |
| 60 to 89 Minutes | 51 | 1.1% |
| 90 or more Minutes | 119 | 2.7% |
Commute Time by Sex in Lititz borough
The most common commute times in Lititz borough are 20 to 24 minutes (472 commuters, 20.1%) for males and 5 to 9 minutes (487 commuters, 23.3%) for females.
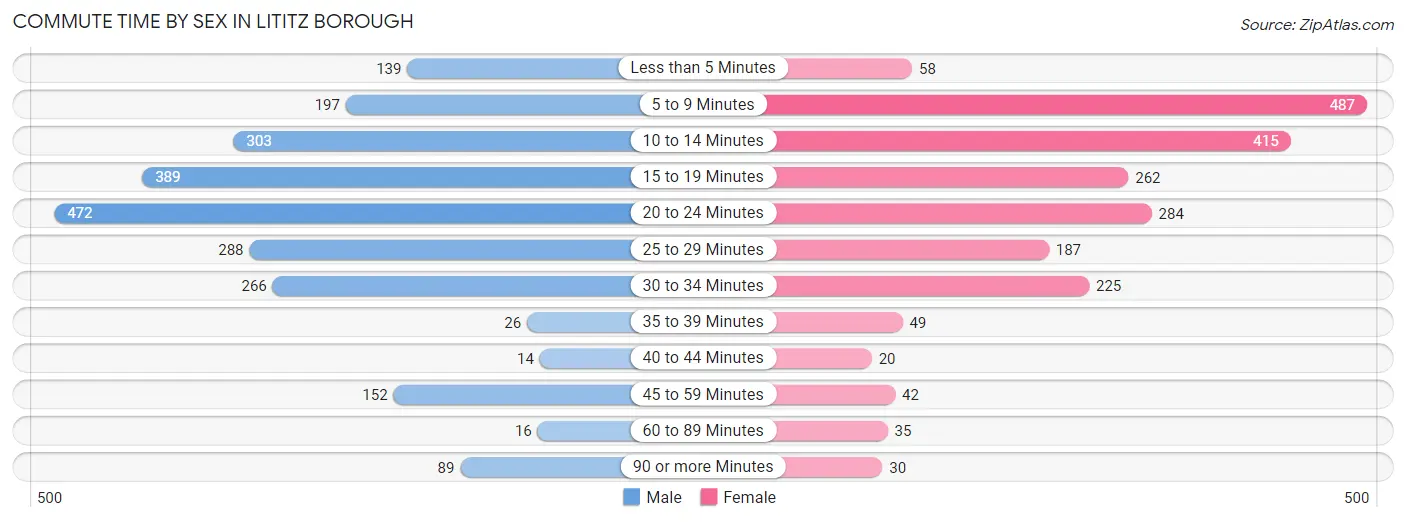
| Commute Time | Male | Female |
| Less than 5 Minutes | 139 (5.9%) | 58 (2.8%) |
| 5 to 9 Minutes | 197 (8.4%) | 487 (23.3%) |
| 10 to 14 Minutes | 303 (12.9%) | 415 (19.8%) |
| 15 to 19 Minutes | 389 (16.6%) | 262 (12.5%) |
| 20 to 24 Minutes | 472 (20.1%) | 284 (13.6%) |
| 25 to 29 Minutes | 288 (12.2%) | 187 (8.9%) |
| 30 to 34 Minutes | 266 (11.3%) | 225 (10.7%) |
| 35 to 39 Minutes | 26 (1.1%) | 49 (2.3%) |
| 40 to 44 Minutes | 14 (0.6%) | 20 (1.0%) |
| 45 to 59 Minutes | 152 (6.5%) | 42 (2.0%) |
| 60 to 89 Minutes | 16 (0.7%) | 35 (1.7%) |
| 90 or more Minutes | 89 (3.8%) | 30 (1.4%) |
Time of Departure to Work by Sex in Lititz borough
The most frequent times of departure to work in Lititz borough are 7:30 AM to 7:59 AM (400, 17.0%) for males and 7:00 AM to 7:29 AM (360, 17.2%) for females.
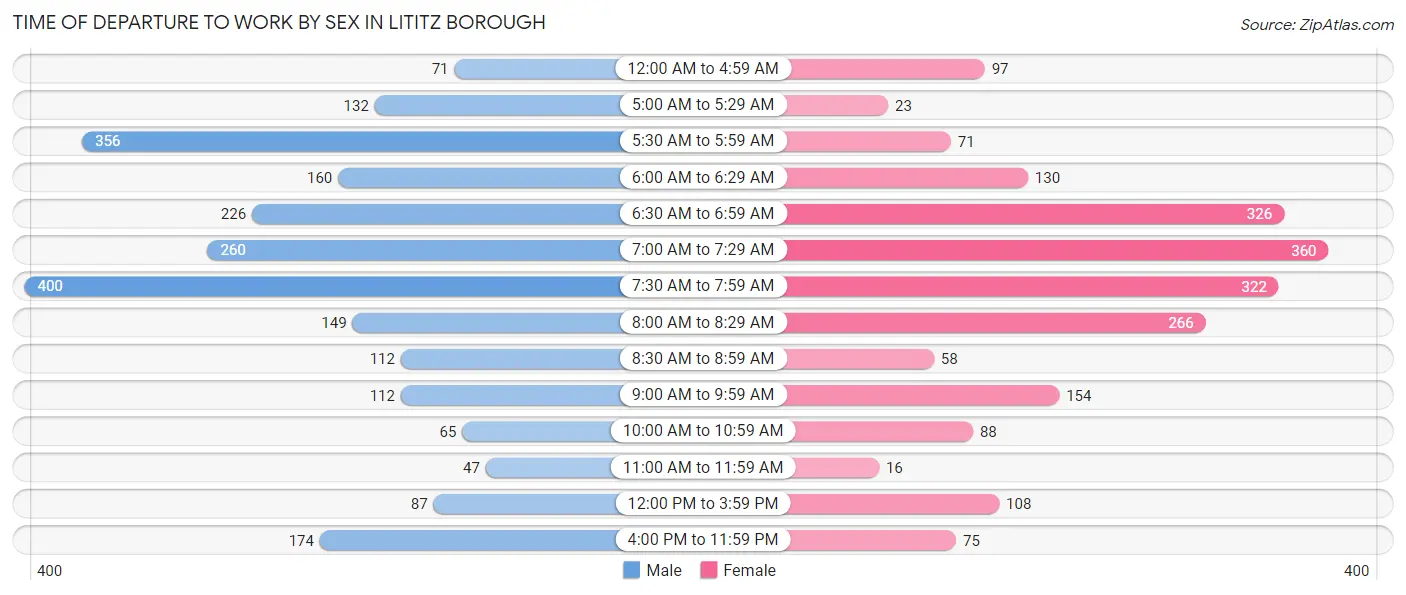
| Time of Departure | Male | Female |
| 12:00 AM to 4:59 AM | 71 (3.0%) | 97 (4.6%) |
| 5:00 AM to 5:29 AM | 132 (5.6%) | 23 (1.1%) |
| 5:30 AM to 5:59 AM | 356 (15.1%) | 71 (3.4%) |
| 6:00 AM to 6:29 AM | 160 (6.8%) | 130 (6.2%) |
| 6:30 AM to 6:59 AM | 226 (9.6%) | 326 (15.6%) |
| 7:00 AM to 7:29 AM | 260 (11.1%) | 360 (17.2%) |
| 7:30 AM to 7:59 AM | 400 (17.0%) | 322 (15.4%) |
| 8:00 AM to 8:29 AM | 149 (6.3%) | 266 (12.7%) |
| 8:30 AM to 8:59 AM | 112 (4.8%) | 58 (2.8%) |
| 9:00 AM to 9:59 AM | 112 (4.8%) | 154 (7.3%) |
| 10:00 AM to 10:59 AM | 65 (2.8%) | 88 (4.2%) |
| 11:00 AM to 11:59 AM | 47 (2.0%) | 16 (0.8%) |
| 12:00 PM to 3:59 PM | 87 (3.7%) | 108 (5.2%) |
| 4:00 PM to 11:59 PM | 174 (7.4%) | 75 (3.6%) |
| Total | 2,351 (100.0%) | 2,094 (100.0%) |
Housing Occupancy in Lititz borough
Occupancy by Ownership in Lititz borough
Of the total 3,833 dwellings in Lititz borough, owner-occupied units account for 2,660 (69.4%), while renter-occupied units make up 1,173 (30.6%).
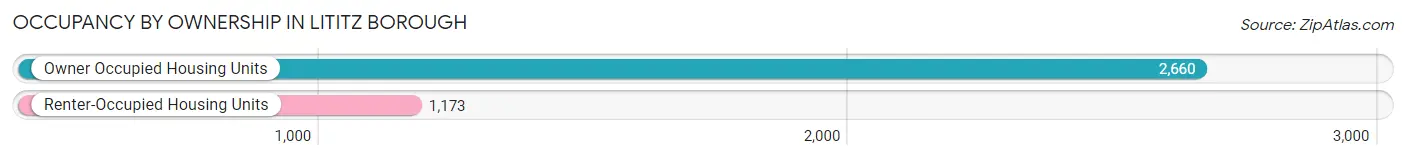
| Occupancy | # Housing Units | % Housing Units |
| Owner Occupied Housing Units | 2,660 | 69.4% |
| Renter-Occupied Housing Units | 1,173 | 30.6% |
| Total Occupied Housing Units | 3,833 | 100.0% |
Occupancy by Household Size in Lititz borough
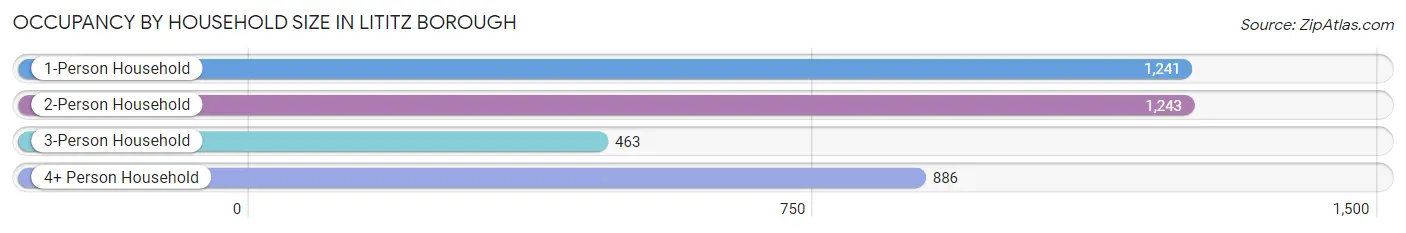
| Household Size | # Housing Units | % Housing Units |
| 1-Person Household | 1,241 | 32.4% |
| 2-Person Household | 1,243 | 32.4% |
| 3-Person Household | 463 | 12.1% |
| 4+ Person Household | 886 | 23.1% |
| Total Housing Units | 3,833 | 100.0% |
Occupancy by Ownership by Household Size in Lititz borough
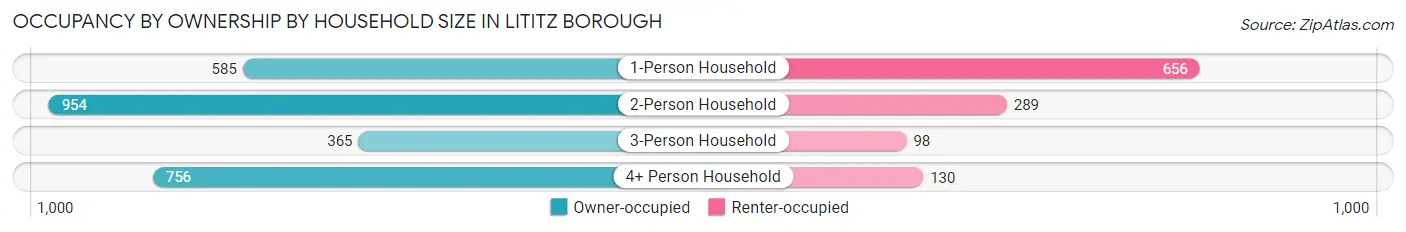
| Household Size | Owner-occupied | Renter-occupied |
| 1-Person Household | 585 (47.1%) | 656 (52.9%) |
| 2-Person Household | 954 (76.7%) | 289 (23.3%) |
| 3-Person Household | 365 (78.8%) | 98 (21.2%) |
| 4+ Person Household | 756 (85.3%) | 130 (14.7%) |
| Total Housing Units | 2,660 (69.4%) | 1,173 (30.6%) |
Occupancy by Educational Attainment in Lititz borough
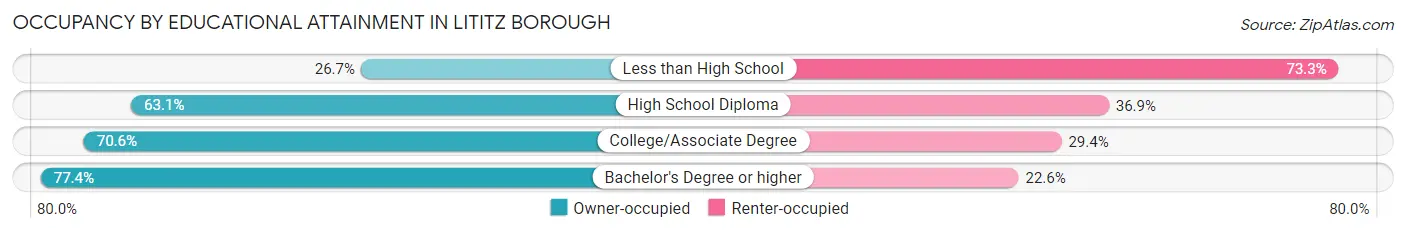
| Household Size | Owner-occupied | Renter-occupied |
| Less than High School | 36 (26.7%) | 99 (73.3%) |
| High School Diploma | 744 (63.1%) | 435 (36.9%) |
| College/Associate Degree | 728 (70.6%) | 303 (29.4%) |
| Bachelor's Degree or higher | 1,152 (77.4%) | 336 (22.6%) |
Occupancy by Age of Householder in Lititz borough
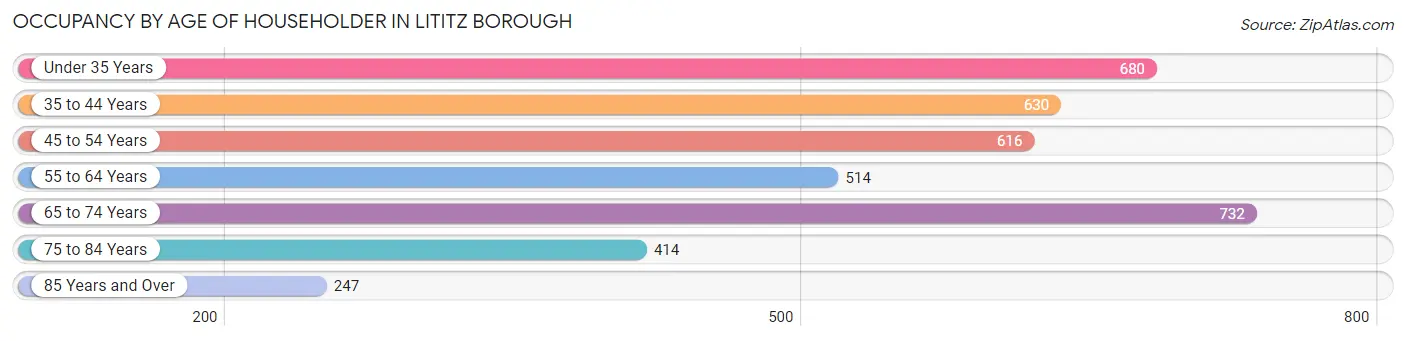
| Age Bracket | # Households | % Households |
| Under 35 Years | 680 | 17.7% |
| 35 to 44 Years | 630 | 16.4% |
| 45 to 54 Years | 616 | 16.1% |
| 55 to 64 Years | 514 | 13.4% |
| 65 to 74 Years | 732 | 19.1% |
| 75 to 84 Years | 414 | 10.8% |
| 85 Years and Over | 247 | 6.4% |
| Total | 3,833 | 100.0% |
Housing Finances in Lititz borough
Median Income by Occupancy in Lititz borough
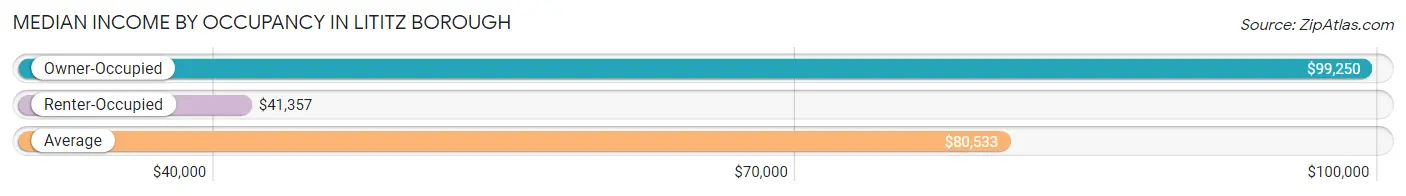
| Occupancy Type | # Households | Median Income |
| Owner-Occupied | 2,660 (69.4%) | $99,250 |
| Renter-Occupied | 1,173 (30.6%) | $41,357 |
| Average | 3,833 (100.0%) | $80,533 |
Occupancy by Householder Income Bracket in Lititz borough
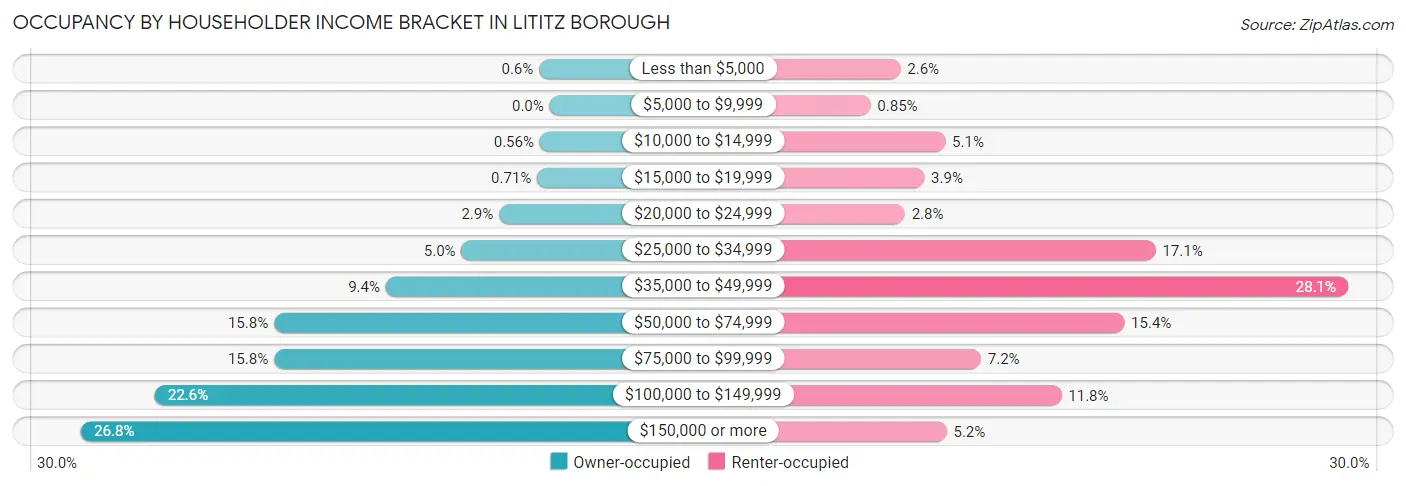
| Income Bracket | Owner-occupied | Renter-occupied |
| Less than $5,000 | 16 (0.6%) | 30 (2.6%) |
| $5,000 to $9,999 | 0 (0.0%) | 10 (0.9%) |
| $10,000 to $14,999 | 15 (0.6%) | 60 (5.1%) |
| $15,000 to $19,999 | 19 (0.7%) | 46 (3.9%) |
| $20,000 to $24,999 | 77 (2.9%) | 33 (2.8%) |
| $25,000 to $34,999 | 134 (5.0%) | 201 (17.1%) |
| $35,000 to $49,999 | 249 (9.4%) | 330 (28.1%) |
| $50,000 to $74,999 | 419 (15.8%) | 180 (15.3%) |
| $75,000 to $99,999 | 419 (15.8%) | 84 (7.2%) |
| $100,000 to $149,999 | 600 (22.6%) | 138 (11.8%) |
| $150,000 or more | 712 (26.8%) | 61 (5.2%) |
| Total | 2,660 (100.0%) | 1,173 (100.0%) |
Monthly Housing Cost Tiers in Lititz borough
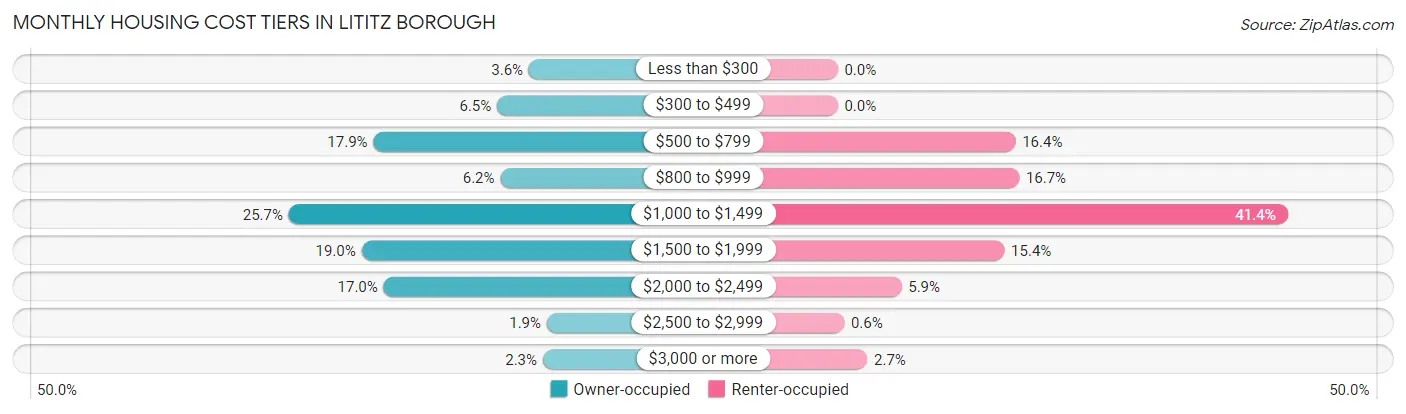
| Monthly Cost | Owner-occupied | Renter-occupied |
| Less than $300 | 95 (3.6%) | 0 (0.0%) |
| $300 to $499 | 173 (6.5%) | 0 (0.0%) |
| $500 to $799 | 476 (17.9%) | 192 (16.4%) |
| $800 to $999 | 165 (6.2%) | 196 (16.7%) |
| $1,000 to $1,499 | 683 (25.7%) | 486 (41.4%) |
| $1,500 to $1,999 | 505 (19.0%) | 180 (15.3%) |
| $2,000 to $2,499 | 451 (17.0%) | 69 (5.9%) |
| $2,500 to $2,999 | 51 (1.9%) | 7 (0.6%) |
| $3,000 or more | 61 (2.3%) | 32 (2.7%) |
| Total | 2,660 (100.0%) | 1,173 (100.0%) |
Physical Housing Characteristics in Lititz borough
Housing Structures in Lititz borough
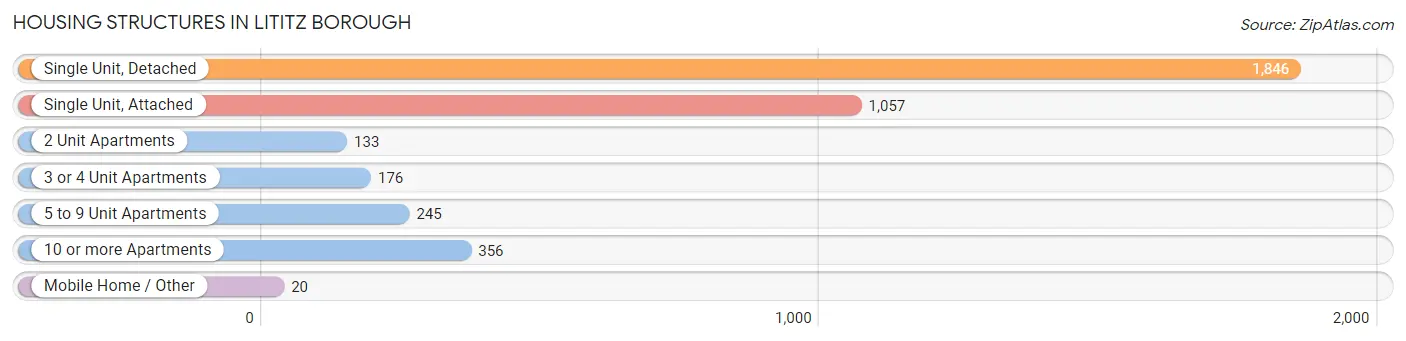
| Structure Type | # Housing Units | % Housing Units |
| Single Unit, Detached | 1,846 | 48.2% |
| Single Unit, Attached | 1,057 | 27.6% |
| 2 Unit Apartments | 133 | 3.5% |
| 3 or 4 Unit Apartments | 176 | 4.6% |
| 5 to 9 Unit Apartments | 245 | 6.4% |
| 10 or more Apartments | 356 | 9.3% |
| Mobile Home / Other | 20 | 0.5% |
| Total | 3,833 | 100.0% |
Housing Structures by Occupancy in Lititz borough
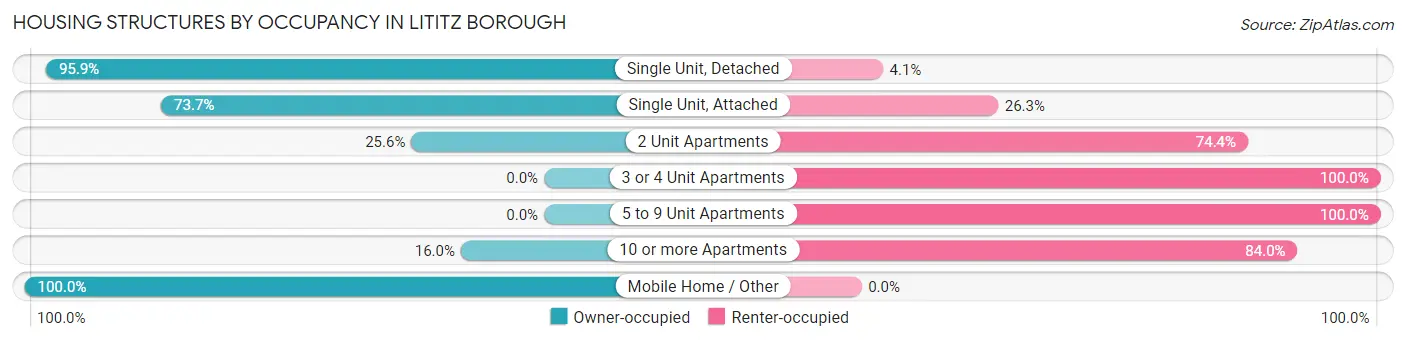
| Structure Type | Owner-occupied | Renter-occupied |
| Single Unit, Detached | 1,770 (95.9%) | 76 (4.1%) |
| Single Unit, Attached | 779 (73.7%) | 278 (26.3%) |
| 2 Unit Apartments | 34 (25.6%) | 99 (74.4%) |
| 3 or 4 Unit Apartments | 0 (0.0%) | 176 (100.0%) |
| 5 to 9 Unit Apartments | 0 (0.0%) | 245 (100.0%) |
| 10 or more Apartments | 57 (16.0%) | 299 (84.0%) |
| Mobile Home / Other | 20 (100.0%) | 0 (0.0%) |
| Total | 2,660 (69.4%) | 1,173 (30.6%) |
Housing Structures by Number of Rooms in Lititz borough
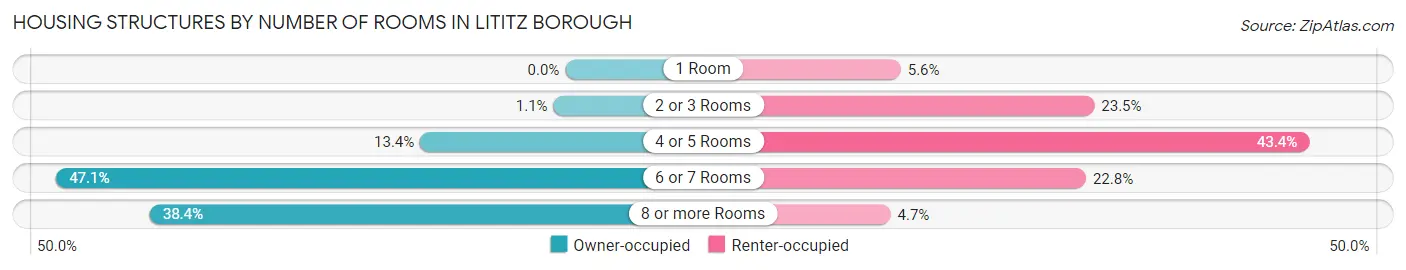
| Number of Rooms | Owner-occupied | Renter-occupied |
| 1 Room | 0 (0.0%) | 66 (5.6%) |
| 2 or 3 Rooms | 29 (1.1%) | 276 (23.5%) |
| 4 or 5 Rooms | 357 (13.4%) | 509 (43.4%) |
| 6 or 7 Rooms | 1,252 (47.1%) | 267 (22.8%) |
| 8 or more Rooms | 1,022 (38.4%) | 55 (4.7%) |
| Total | 2,660 (100.0%) | 1,173 (100.0%) |
Housing Structure by Heating Type in Lititz borough
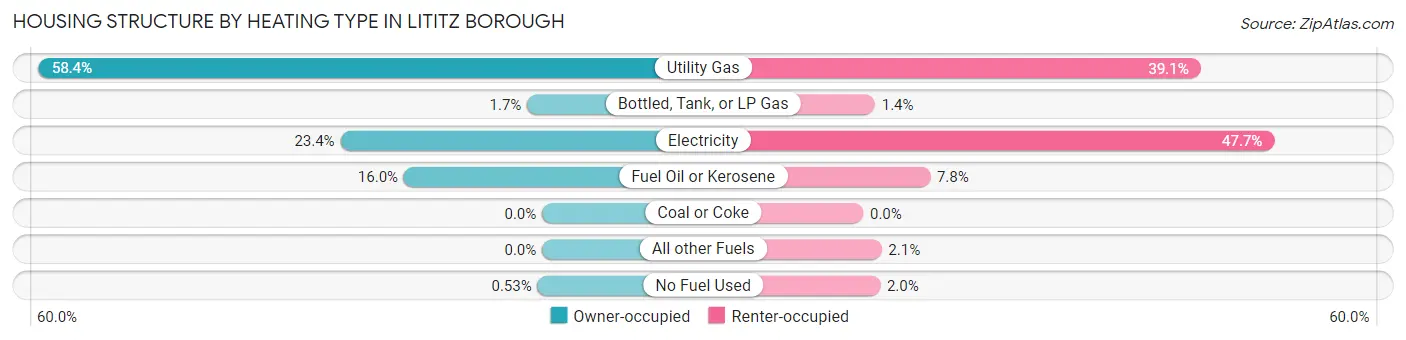
| Heating Type | Owner-occupied | Renter-occupied |
| Utility Gas | 1,552 (58.4%) | 459 (39.1%) |
| Bottled, Tank, or LP Gas | 46 (1.7%) | 16 (1.4%) |
| Electricity | 622 (23.4%) | 559 (47.7%) |
| Fuel Oil or Kerosene | 426 (16.0%) | 91 (7.8%) |
| Coal or Coke | 0 (0.0%) | 0 (0.0%) |
| All other Fuels | 0 (0.0%) | 25 (2.1%) |
| No Fuel Used | 14 (0.5%) | 23 (2.0%) |
| Total | 2,660 (100.0%) | 1,173 (100.0%) |
Household Vehicle Usage in Lititz borough
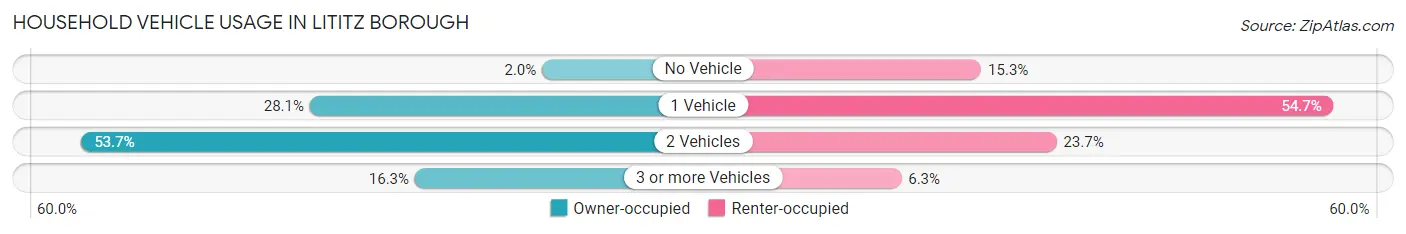
| Vehicles per Household | Owner-occupied | Renter-occupied |
| No Vehicle | 54 (2.0%) | 179 (15.3%) |
| 1 Vehicle | 746 (28.1%) | 642 (54.7%) |
| 2 Vehicles | 1,427 (53.6%) | 278 (23.7%) |
| 3 or more Vehicles | 433 (16.3%) | 74 (6.3%) |
| Total | 2,660 (100.0%) | 1,173 (100.0%) |
Real Estate & Mortgages in Lititz borough
Real Estate and Mortgage Overview in Lititz borough
| Characteristic | Without Mortgage | With Mortgage |
| Housing Units | 913 | 1,747 |
| Median Property Value | $235,800 | $262,200 |
| Median Household Income | $82,422 | $503 |
| Monthly Housing Costs | $628 | $61 |
| Real Estate Taxes | $3,604 | $88 |
Property Value by Mortgage Status in Lititz borough
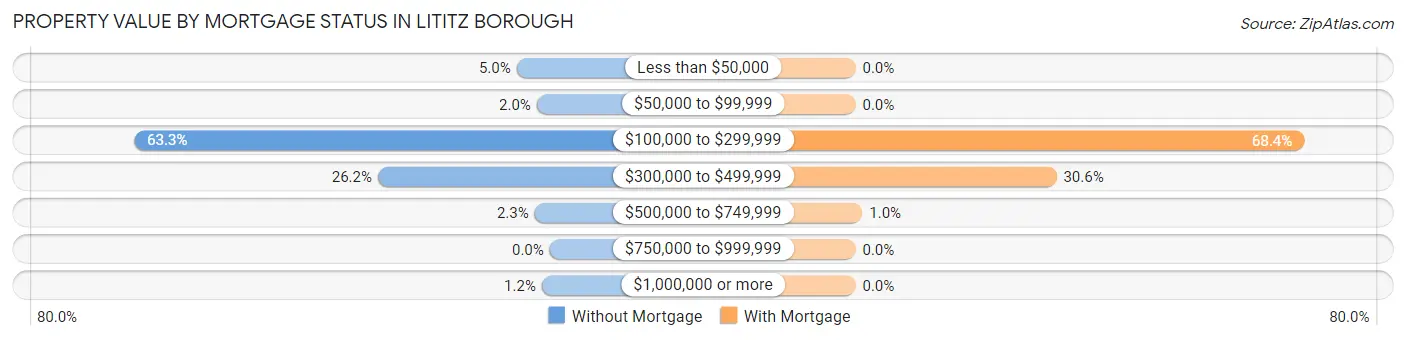
| Property Value | Without Mortgage | With Mortgage |
| Less than $50,000 | 46 (5.0%) | 0 (0.0%) |
| $50,000 to $99,999 | 18 (2.0%) | 0 (0.0%) |
| $100,000 to $299,999 | 578 (63.3%) | 1,194 (68.3%) |
| $300,000 to $499,999 | 239 (26.2%) | 535 (30.6%) |
| $500,000 to $749,999 | 21 (2.3%) | 18 (1.0%) |
| $750,000 to $999,999 | 0 (0.0%) | 0 (0.0%) |
| $1,000,000 or more | 11 (1.2%) | 0 (0.0%) |
| Total | 913 (100.0%) | 1,747 (100.0%) |
Household Income by Mortgage Status in Lititz borough
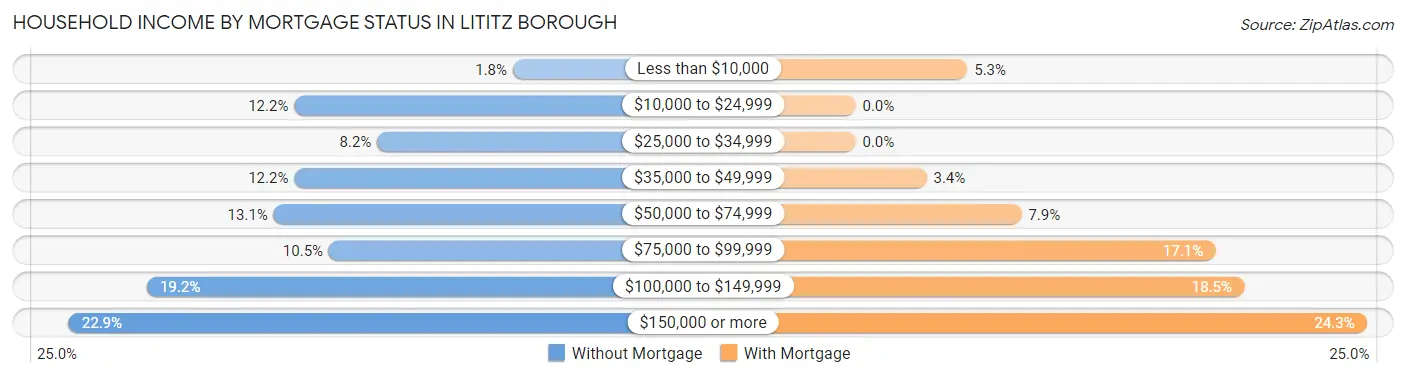
| Household Income | Without Mortgage | With Mortgage |
| Less than $10,000 | 16 (1.8%) | 93 (5.3%) |
| $10,000 to $24,999 | 111 (12.2%) | 0 (0.0%) |
| $25,000 to $34,999 | 75 (8.2%) | 0 (0.0%) |
| $35,000 to $49,999 | 111 (12.2%) | 59 (3.4%) |
| $50,000 to $74,999 | 120 (13.1%) | 138 (7.9%) |
| $75,000 to $99,999 | 96 (10.5%) | 299 (17.1%) |
| $100,000 to $149,999 | 175 (19.2%) | 323 (18.5%) |
| $150,000 or more | 209 (22.9%) | 425 (24.3%) |
| Total | 913 (100.0%) | 1,747 (100.0%) |
Property Value to Household Income Ratio in Lititz borough
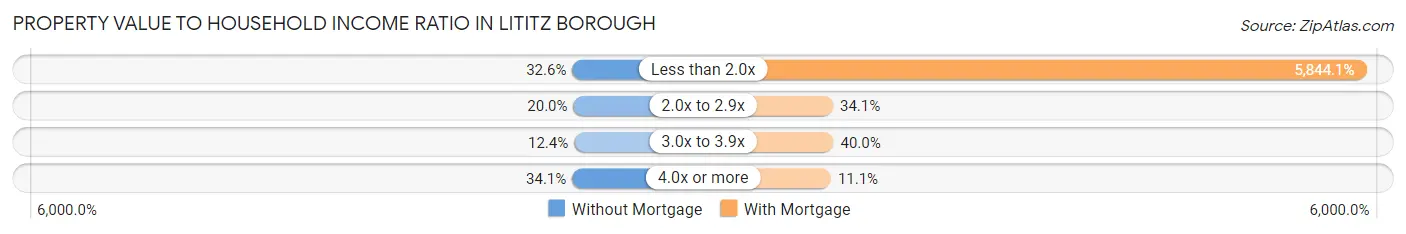
| Value-to-Income Ratio | Without Mortgage | With Mortgage |
| Less than 2.0x | 298 (32.6%) | 102,096 (5,844.1%) |
| 2.0x to 2.9x | 183 (20.0%) | 595 (34.1%) |
| 3.0x to 3.9x | 113 (12.4%) | 699 (40.0%) |
| 4.0x or more | 311 (34.1%) | 194 (11.1%) |
| Total | 913 (100.0%) | 1,747 (100.0%) |
Real Estate Taxes by Mortgage Status in Lititz borough
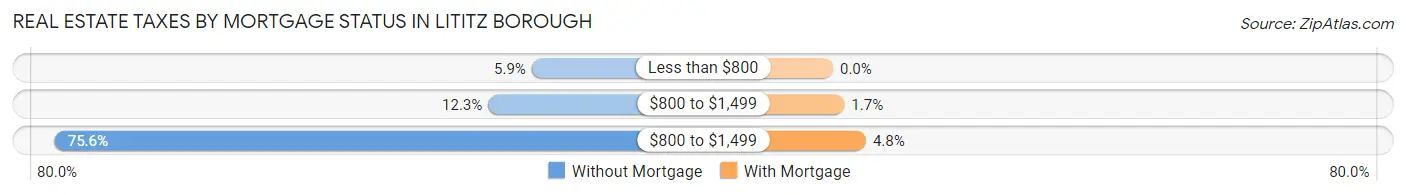
| Property Taxes | Without Mortgage | With Mortgage |
| Less than $800 | 54 (5.9%) | 0 (0.0%) |
| $800 to $1,499 | 112 (12.3%) | 29 (1.7%) |
| $800 to $1,499 | 690 (75.6%) | 84 (4.8%) |
| Total | 913 (100.0%) | 1,747 (100.0%) |
Health & Disability in Lititz borough
Health Insurance Coverage by Age in Lititz borough
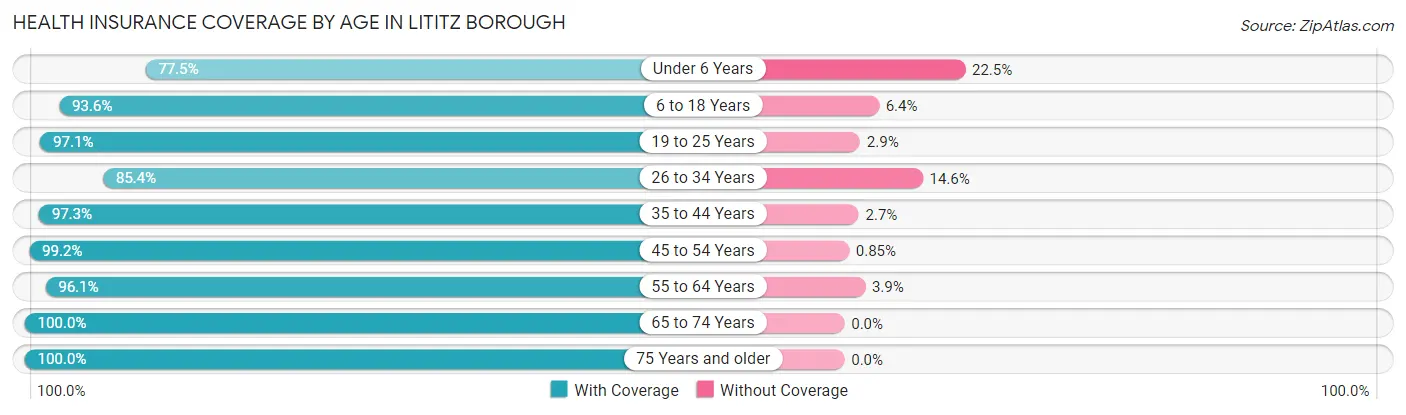
| Age Bracket | With Coverage | Without Coverage |
| Under 6 Years | 606 (77.5%) | 176 (22.5%) |
| 6 to 18 Years | 1,254 (93.6%) | 86 (6.4%) |
| 19 to 25 Years | 800 (97.1%) | 24 (2.9%) |
| 26 to 34 Years | 1,001 (85.4%) | 171 (14.6%) |
| 35 to 44 Years | 1,099 (97.3%) | 30 (2.7%) |
| 45 to 54 Years | 1,053 (99.2%) | 9 (0.9%) |
| 55 to 64 Years | 797 (96.1%) | 32 (3.9%) |
| 65 to 74 Years | 1,194 (100.0%) | 0 (0.0%) |
| 75 Years and older | 949 (100.0%) | 0 (0.0%) |
| Total | 8,753 (94.3%) | 528 (5.7%) |
Health Insurance Coverage by Citizenship Status in Lititz borough
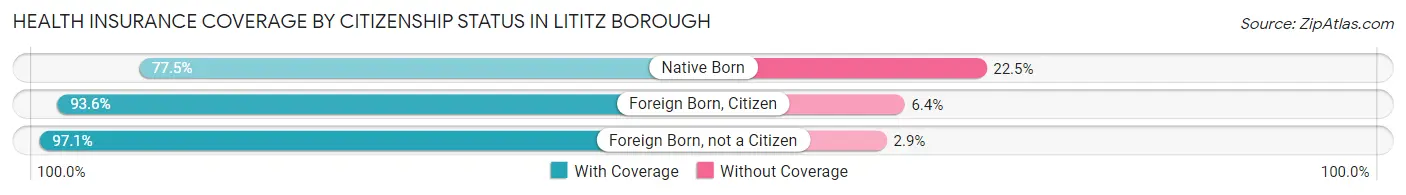
| Citizenship Status | With Coverage | Without Coverage |
| Native Born | 606 (77.5%) | 176 (22.5%) |
| Foreign Born, Citizen | 1,254 (93.6%) | 86 (6.4%) |
| Foreign Born, not a Citizen | 800 (97.1%) | 24 (2.9%) |
Health Insurance Coverage by Household Income in Lititz borough
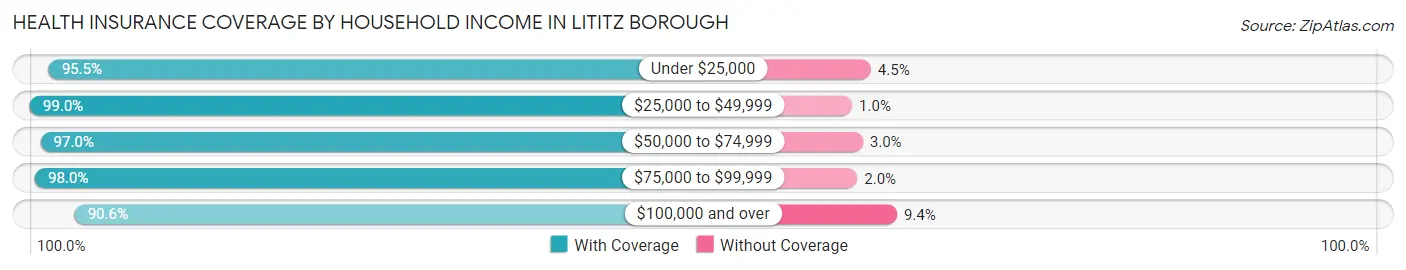
| Household Income | With Coverage | Without Coverage |
| Under $25,000 | 338 (95.5%) | 16 (4.5%) |
| $25,000 to $49,999 | 1,688 (99.0%) | 17 (1.0%) |
| $50,000 to $74,999 | 1,287 (97.0%) | 40 (3.0%) |
| $75,000 to $99,999 | 1,244 (98.0%) | 25 (2.0%) |
| $100,000 and over | 4,144 (90.6%) | 430 (9.4%) |
Public vs Private Health Insurance Coverage by Age in Lititz borough
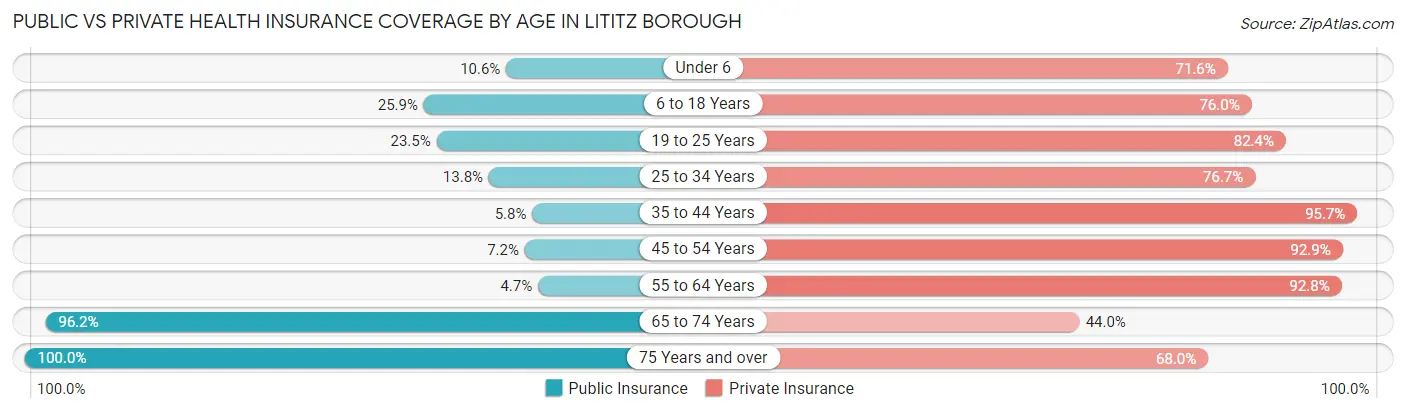
| Age Bracket | Public Insurance | Private Insurance |
| Under 6 | 83 (10.6%) | 560 (71.6%) |
| 6 to 18 Years | 347 (25.9%) | 1,019 (76.0%) |
| 19 to 25 Years | 194 (23.5%) | 679 (82.4%) |
| 25 to 34 Years | 162 (13.8%) | 899 (76.7%) |
| 35 to 44 Years | 65 (5.8%) | 1,080 (95.7%) |
| 45 to 54 Years | 76 (7.2%) | 987 (92.9%) |
| 55 to 64 Years | 39 (4.7%) | 769 (92.8%) |
| 65 to 74 Years | 1,148 (96.2%) | 525 (44.0%) |
| 75 Years and over | 949 (100.0%) | 645 (68.0%) |
| Total | 3,063 (33.0%) | 7,163 (77.2%) |
Disability Status by Sex by Age in Lititz borough
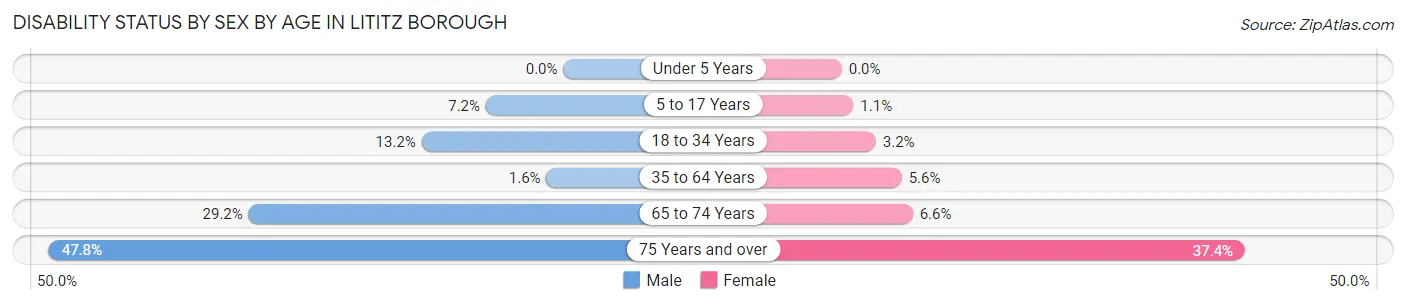
| Age Bracket | Male | Female |
| Under 5 Years | 0 (0.0%) | 0 (0.0%) |
| 5 to 17 Years | 56 (7.2%) | 8 (1.1%) |
| 18 to 34 Years | 155 (13.2%) | 27 (3.2%) |
| 35 to 64 Years | 22 (1.6%) | 90 (5.6%) |
| 65 to 74 Years | 158 (29.2%) | 43 (6.6%) |
| 75 Years and over | 180 (47.7%) | 214 (37.4%) |
Disability Class by Sex by Age in Lititz borough
Disability Class: Hearing Difficulty
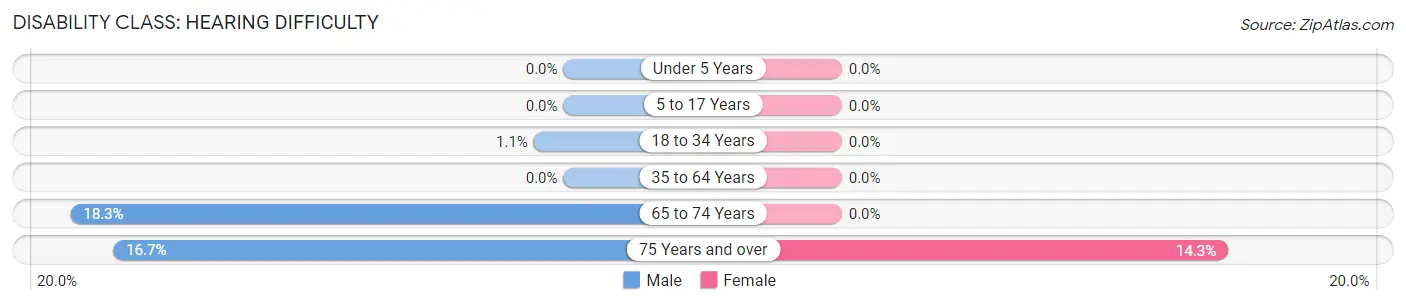
| Age Bracket | Male | Female |
| Under 5 Years | 0 (0.0%) | 0 (0.0%) |
| 5 to 17 Years | 0 (0.0%) | 0 (0.0%) |
| 18 to 34 Years | 13 (1.1%) | 0 (0.0%) |
| 35 to 64 Years | 0 (0.0%) | 0 (0.0%) |
| 65 to 74 Years | 99 (18.3%) | 0 (0.0%) |
| 75 Years and over | 63 (16.7%) | 82 (14.3%) |
Disability Class: Vision Difficulty
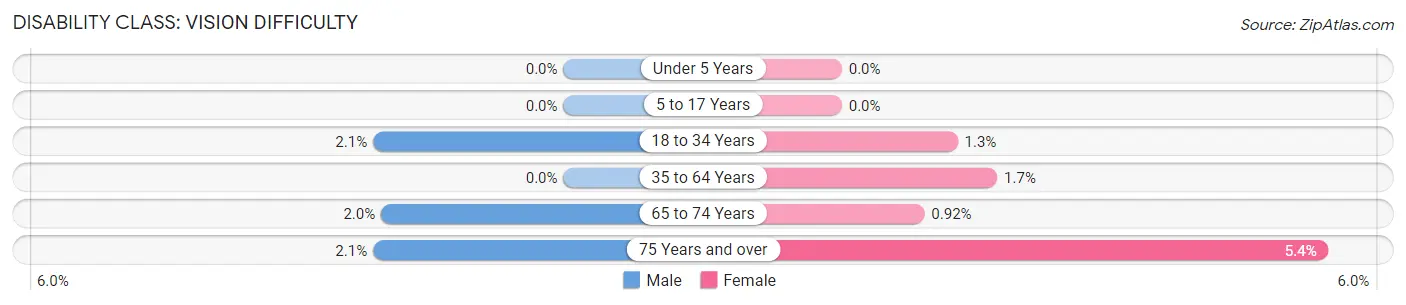
| Age Bracket | Male | Female |
| Under 5 Years | 0 (0.0%) | 0 (0.0%) |
| 5 to 17 Years | 0 (0.0%) | 0 (0.0%) |
| 18 to 34 Years | 25 (2.1%) | 11 (1.3%) |
| 35 to 64 Years | 0 (0.0%) | 28 (1.7%) |
| 65 to 74 Years | 11 (2.0%) | 6 (0.9%) |
| 75 Years and over | 8 (2.1%) | 31 (5.4%) |
Disability Class: Cognitive Difficulty
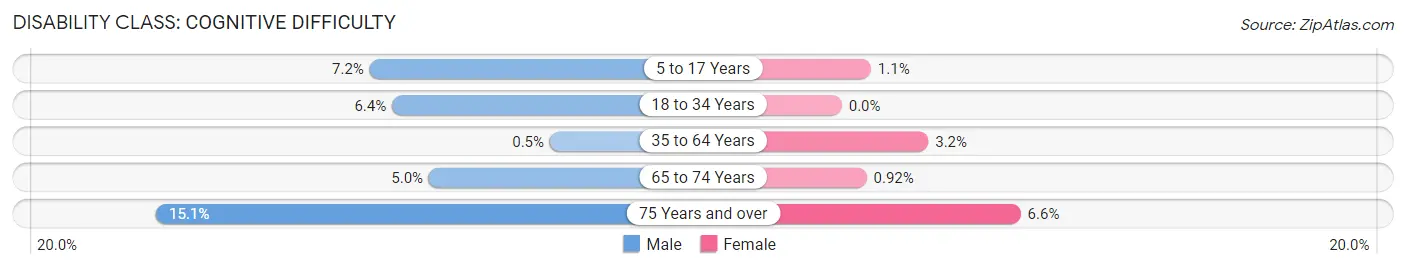
| Age Bracket | Male | Female |
| 5 to 17 Years | 56 (7.2%) | 8 (1.1%) |
| 18 to 34 Years | 75 (6.4%) | 0 (0.0%) |
| 35 to 64 Years | 7 (0.5%) | 52 (3.2%) |
| 65 to 74 Years | 27 (5.0%) | 6 (0.9%) |
| 75 Years and over | 57 (15.1%) | 38 (6.6%) |
Disability Class: Ambulatory Difficulty
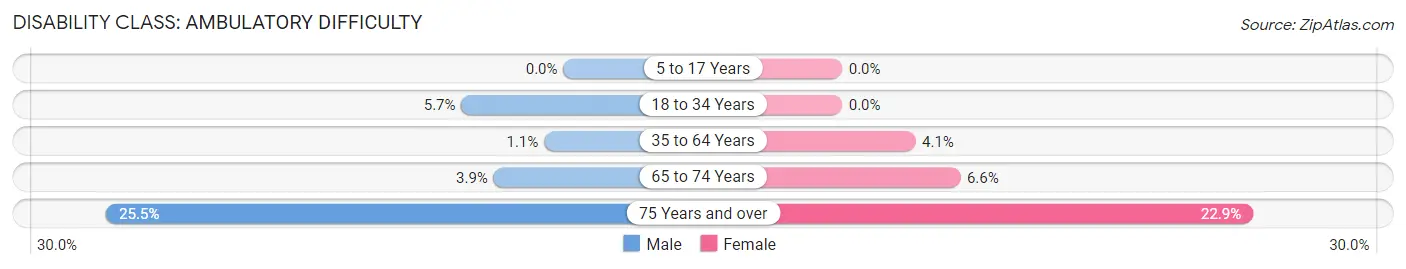
| Age Bracket | Male | Female |
| 5 to 17 Years | 0 (0.0%) | 0 (0.0%) |
| 18 to 34 Years | 67 (5.7%) | 0 (0.0%) |
| 35 to 64 Years | 15 (1.1%) | 66 (4.1%) |
| 65 to 74 Years | 21 (3.9%) | 43 (6.6%) |
| 75 Years and over | 96 (25.5%) | 131 (22.9%) |
Disability Class: Self-Care Difficulty
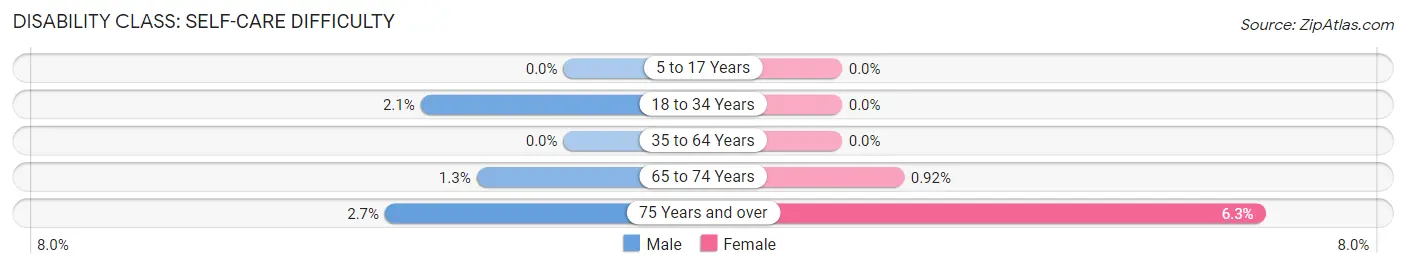
| Age Bracket | Male | Female |
| 5 to 17 Years | 0 (0.0%) | 0 (0.0%) |
| 18 to 34 Years | 25 (2.1%) | 0 (0.0%) |
| 35 to 64 Years | 0 (0.0%) | 0 (0.0%) |
| 65 to 74 Years | 7 (1.3%) | 6 (0.9%) |
| 75 Years and over | 10 (2.6%) | 36 (6.3%) |
Technology Access in Lititz borough
Computing Device Access in Lititz borough
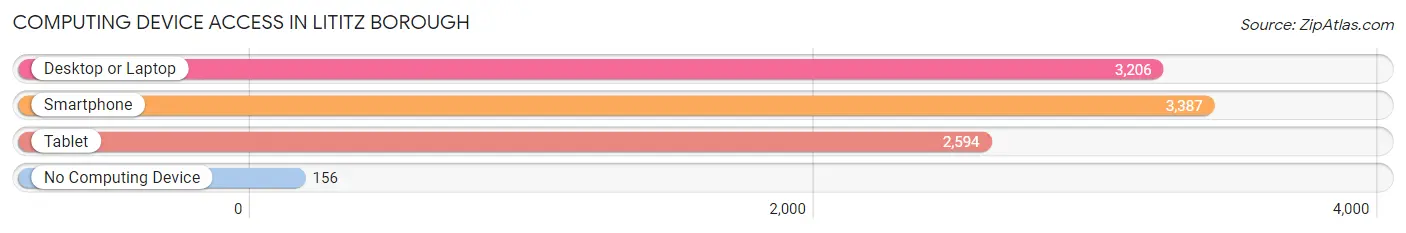
| Device Type | # Households | % Households |
| Desktop or Laptop | 3,206 | 83.6% |
| Smartphone | 3,387 | 88.4% |
| Tablet | 2,594 | 67.7% |
| No Computing Device | 156 | 4.1% |
| Total | 3,833 | 100.0% |
Internet Access in Lititz borough
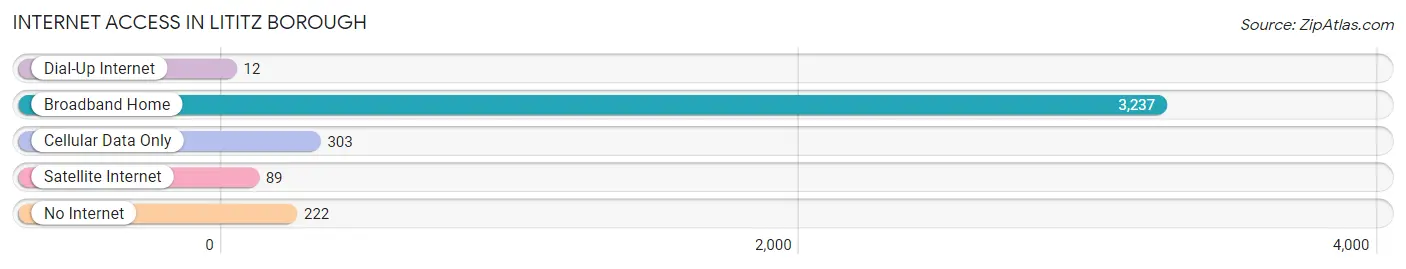
| Internet Type | # Households | % Households |
| Dial-Up Internet | 12 | 0.3% |
| Broadband Home | 3,237 | 84.5% |
| Cellular Data Only | 303 | 7.9% |
| Satellite Internet | 89 | 2.3% |
| No Internet | 222 | 5.8% |
| Total | 3,833 | 100.0% |
Lititz borough Summary
Lititz Borough is a small borough located in Lancaster County, Pennsylvania. It is situated in the heart of the Pennsylvania Dutch Country, and is known for its quaint charm and historic buildings. The borough is home to a population of 8,919 people, according to the 2010 census.
History
Lititz was founded in 1756 by Moravian settlers from Germany. The settlers named the town after a castle in Bohemia, which was the birthplace of Count Zinzendorf, the founder of the Moravian Church. The town was originally known as “Litiz”, but the spelling was changed to “Lititz” in 1814.
The town was an important center of the Moravian Church in the United States, and the first Moravian Church in the country was built in Lititz in 1787. The town was also home to the first Sunday school in the United States, which was established in 1790.
In the 19th century, Lititz became an important center of industry. The town was home to several factories, including a cigar factory, a paper mill, and a silk mill. The town was also home to a number of tanneries, which produced leather goods.
Geography
Lititz is located in the southeastern corner of Lancaster County, in the Susquehanna Valley. The borough is situated on the banks of the Conestoga River, and is surrounded by rolling hills and farmland. The borough covers an area of 1.3 square miles, and is located approximately 25 miles east of Harrisburg, the state capital.
Economy
Lititz is home to a number of small businesses, including restaurants, shops, and galleries. The town is also home to a number of manufacturing companies, including a chocolate factory, a printing company, and a furniture manufacturer. The town is also home to a number of corporate offices, including a regional office of the Hershey Company.
Demographics
According to the 2010 census, the population of Lititz was 8,919. The racial makeup of the borough was 94.3% White, 1.2% African American, 0.3% Native American, 1.2% Asian, 0.1% Pacific Islander, 1.2% from other races, and 1.9% from two or more races. Hispanic or Latino of any race were 3.2% of the population.
The median household income in Lititz was $50,945, and the median family income was $62,917. The per capita income for the borough was $25,945. About 4.3% of families and 5.7% of the population were below the poverty line, including 6.3% of those under age 18 and 4.2% of those age 65 or over.
Lititz is a small borough with a rich history and a vibrant economy. The town is home to a diverse population, and is a popular destination for tourists and locals alike. The town is known for its quaint charm and historic buildings, and is a great place to live, work, and visit.
Common Questions
What is the Total Population of Lititz borough?
Total Population of Lititz borough is 9,559.
What is the Total Male Population of Lititz borough?
Total Male Population of Lititz borough is 4,815.
What is the Total Female Population of Lititz borough?
Total Female Population of Lititz borough is 4,744.
What is the Ratio of Males per 100 Females in Lititz borough?
There are 101.50 Males per 100 Females in Lititz borough.
What is the Ratio of Females per 100 Males in Lititz borough?
There are 98.53 Females per 100 Males in Lititz borough.
What is the Median Population Age in Lititz borough?
Median Population Age in Lititz borough is 40.5 Years.
What is the Average Family Size in Lititz borough
Average Family Size in Lititz borough is 3.1 People.
What is the Average Household Size in Lititz borough
Average Household Size in Lititz borough is 2.4 People.
What is Per Capita Income in Lititz borough?
Per Capita income in Lititz borough is $46,076.
What is the Median Family Income in Lititz borough?
Median Family Income in Lititz borough is $104,276.
What is the Median Household income in Lititz borough?
Median Household Income in Lititz borough is $80,533.
What is Income or Wage Gap in Lititz borough?
Income or Wage Gap in Lititz borough is 23.5%.
Women in Lititz borough earn 76.5 cents for every dollar earned by a man.
What is Inequality or Gini Index in Lititz borough?
Inequality or Gini Index in Lititz borough is 0.45.
How Large is the Labor Force in Lititz borough?
There are 5,011 People in the Labor Forcein in Lititz borough.
What is the Percentage of People in the Labor Force in Lititz borough?
66.1% of People are in the Labor Force in Lititz borough.
What is the Unemployment Rate in Lititz borough?
Unemployment Rate in Lititz borough is 2.6%.