Ligonier borough, PA Map & Demographics
Ligonier borough Overview
$54,940
PER CAPITA INCOME
$96,292
AVG FAMILY INCOME
$68,523
AVG HOUSEHOLD INCOME
19.8%
WAGE / INCOME GAP [ % ]
80.2¢/ $1
WAGE / INCOME GAP [ $ ]
0.48
INEQUALITY / GINI INDEX
1,510
TOTAL POPULATION
718
MALE POPULATION
792
FEMALE POPULATION
90.66
MALES / 100 FEMALES
110.31
FEMALES / 100 MALES
54.2
MEDIAN AGE
2.6
AVG FAMILY SIZE
1.9
AVG HOUSEHOLD SIZE
857
LABOR FORCE [ PEOPLE ]
63.2%
PERCENT IN LABOR FORCE
3.3%
UNEMPLOYMENT RATE
Income in Ligonier borough
Income Overview in Ligonier borough
Per Capita Income in Ligonier borough is $54,940, while median incomes of families and households are $96,292 and $68,523 respectively.
| Characteristic | Number | Measure |
| Per Capita Income | 1,510 | $54,940 |
| Median Family Income | 423 | $96,292 |
| Mean Family Income | 423 | $142,454 |
| Median Household Income | 776 | $68,523 |
| Mean Household Income | 776 | $103,103 |
| Income Deficit | 423 | $0 |
| Wage / Income Gap (%) | 1,510 | 19.76% |
| Wage / Income Gap ($) | 1,510 | 80.24¢ per $1 |
| Gini / Inequality Index | 1,510 | 0.48 |
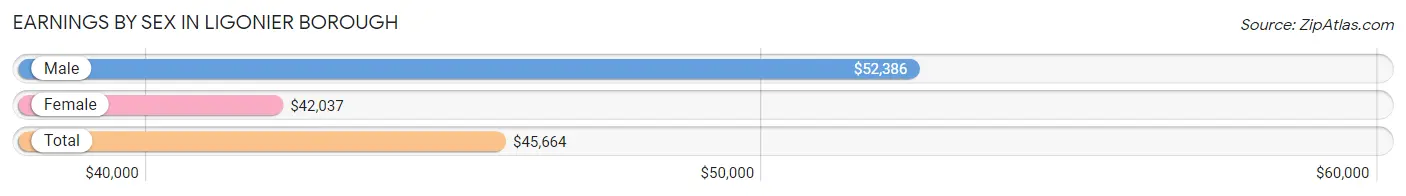
Earnings by Sex in Ligonier borough
Average Earnings in Ligonier borough are $45,664, $52,386 for men and $42,037 for women, a difference of 19.8%.
| Sex | Number | Average Earnings |
| Male | 475 (55.3%) | $52,386 |
| Female | 384 (44.7%) | $42,037 |
| Total | 859 (100.0%) | $45,664 |
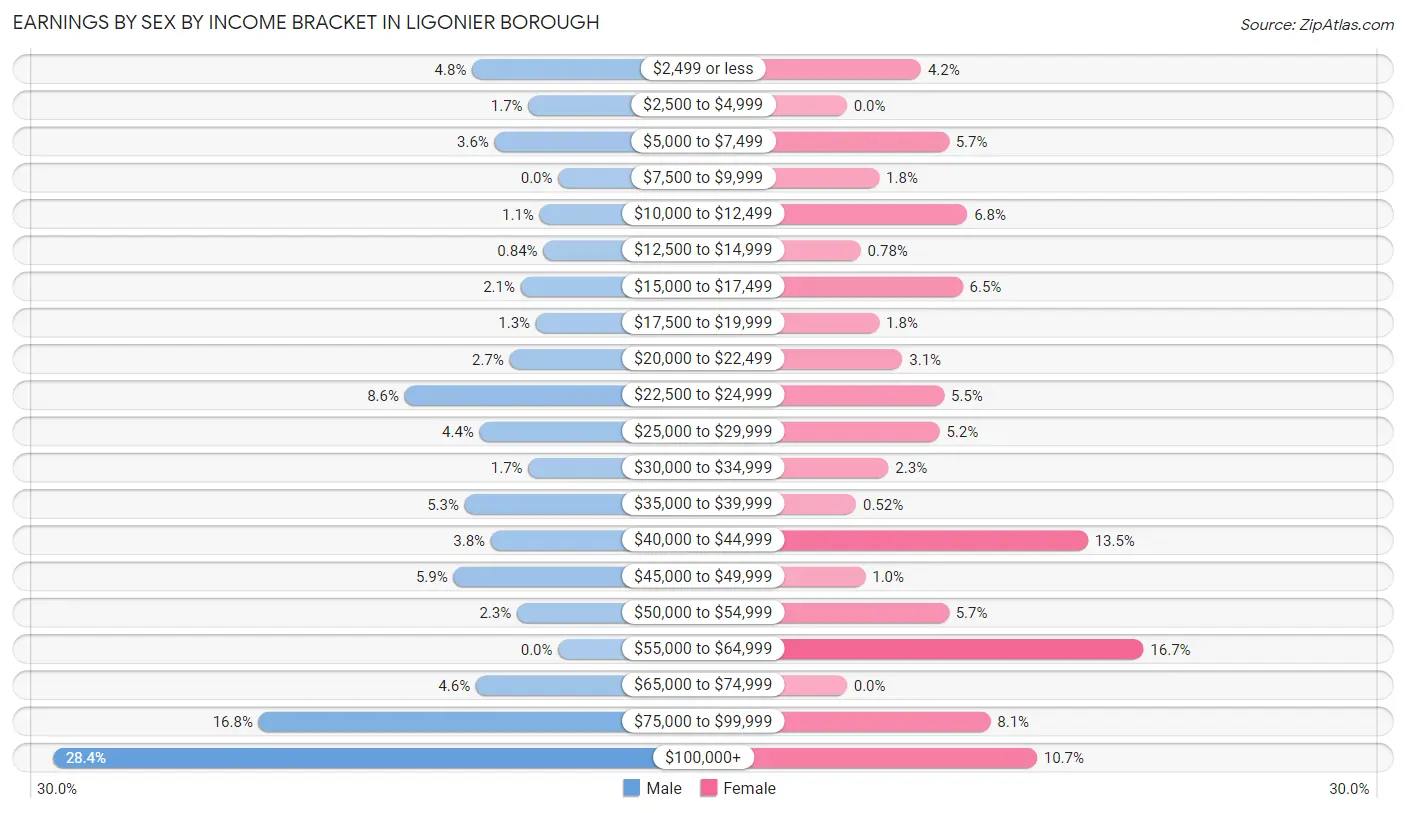
Earnings by Sex by Income Bracket in Ligonier borough
The most common earnings brackets in Ligonier borough are $100,000+ for men (135 | 28.4%) and $55,000 to $64,999 for women (64 | 16.7%).
| Income | Male | Female |
| $2,499 or less | 23 (4.8%) | 16 (4.2%) |
| $2,500 to $4,999 | 8 (1.7%) | 0 (0.0%) |
| $5,000 to $7,499 | 17 (3.6%) | 22 (5.7%) |
| $7,500 to $9,999 | 0 (0.0%) | 7 (1.8%) |
| $10,000 to $12,499 | 5 (1.1%) | 26 (6.8%) |
| $12,500 to $14,999 | 4 (0.8%) | 3 (0.8%) |
| $15,000 to $17,499 | 10 (2.1%) | 25 (6.5%) |
| $17,500 to $19,999 | 6 (1.3%) | 7 (1.8%) |
| $20,000 to $22,499 | 13 (2.7%) | 12 (3.1%) |
| $22,500 to $24,999 | 41 (8.6%) | 21 (5.5%) |
| $25,000 to $29,999 | 21 (4.4%) | 20 (5.2%) |
| $30,000 to $34,999 | 8 (1.7%) | 9 (2.3%) |
| $35,000 to $39,999 | 25 (5.3%) | 2 (0.5%) |
| $40,000 to $44,999 | 18 (3.8%) | 52 (13.5%) |
| $45,000 to $49,999 | 28 (5.9%) | 4 (1.0%) |
| $50,000 to $54,999 | 11 (2.3%) | 22 (5.7%) |
| $55,000 to $64,999 | 0 (0.0%) | 64 (16.7%) |
| $65,000 to $74,999 | 22 (4.6%) | 0 (0.0%) |
| $75,000 to $99,999 | 80 (16.8%) | 31 (8.1%) |
| $100,000+ | 135 (28.4%) | 41 (10.7%) |
| Total | 475 (100.0%) | 384 (100.0%) |
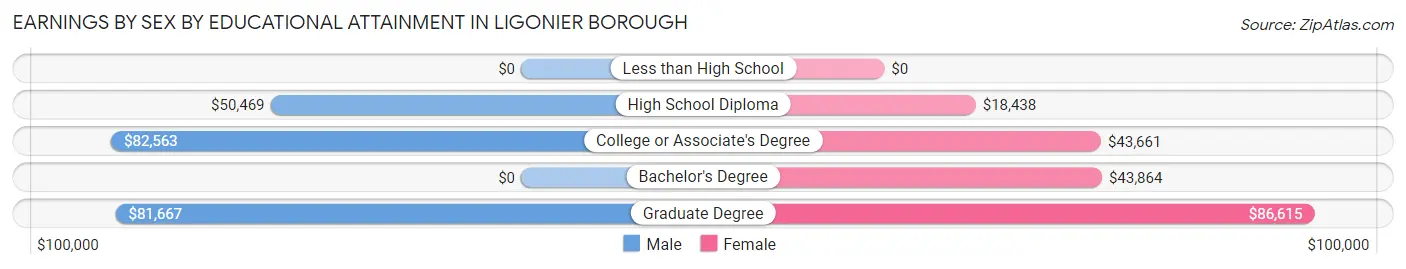
Earnings by Sex by Educational Attainment in Ligonier borough
Average earnings in Ligonier borough are $71,944 for men and $44,450 for women, a difference of 38.2%. Men with an educational attainment of college or associate's degree enjoy the highest average annual earnings of $82,563, while those with high school diploma education earn the least with $50,469. Women with an educational attainment of graduate degree earn the most with the average annual earnings of $86,615, while those with high school diploma education have the smallest earnings of $18,438.
| Educational Attainment | Male Income | Female Income |
| Less than High School | - | - |
| High School Diploma | $50,469 | $18,438 |
| College or Associate's Degree | $82,563 | $43,661 |
| Bachelor's Degree | - | - |
| Graduate Degree | $81,667 | $86,615 |
| Total | $71,944 | $44,450 |
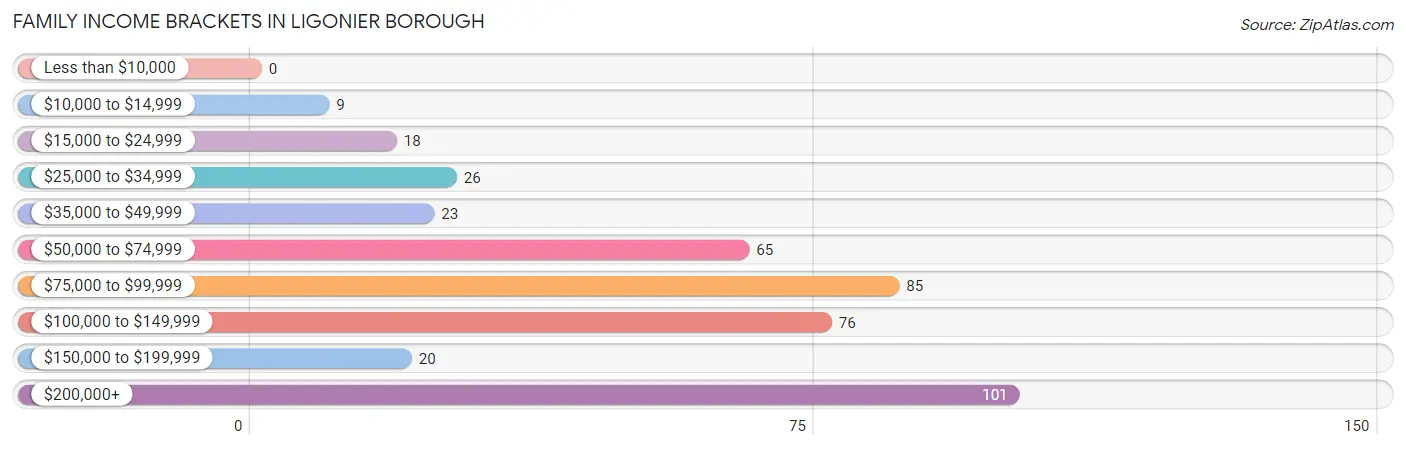
Family Income in Ligonier borough
Family Income Brackets in Ligonier borough
According to the Ligonier borough family income data, there are 101 families falling into the $200,000+ income range, which is the most common income bracket and makes up 23.9% of all families.
| Income Bracket | # Families | % Families |
| Less than $10,000 | 0 | 0.0% |
| $10,000 to $14,999 | 9 | 2.1% |
| $15,000 to $24,999 | 18 | 4.3% |
| $25,000 to $34,999 | 26 | 6.1% |
| $35,000 to $49,999 | 23 | 5.4% |
| $50,000 to $74,999 | 65 | 15.4% |
| $75,000 to $99,999 | 85 | 20.1% |
| $100,000 to $149,999 | 76 | 18.0% |
| $150,000 to $199,999 | 20 | 4.7% |
| $200,000+ | 101 | 23.9% |
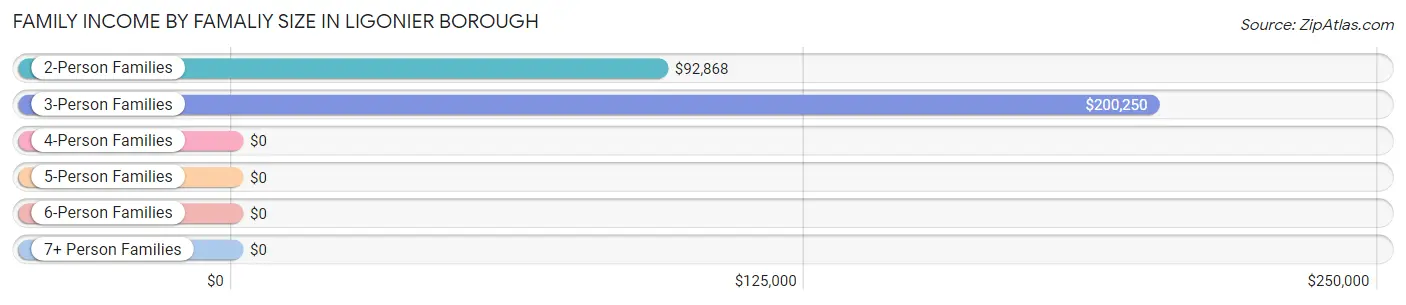
Family Income by Famaliy Size in Ligonier borough
3-person families (45 | 10.6%) account for the highest median family income in Ligonier borough with $200,250 per family, while 3-person families (45 | 10.6%) have the highest median income of $66,750 per family member.
| Income Bracket | # Families | Median Income |
| 2-Person Families | 293 (69.3%) | $92,868 |
| 3-Person Families | 45 (10.6%) | $200,250 |
| 4-Person Families | 83 (19.6%) | $0 |
| 5-Person Families | 0 (0.0%) | $0 |
| 6-Person Families | 2 (0.5%) | $0 |
| 7+ Person Families | 0 (0.0%) | $0 |
| Total | 423 (100.0%) | $96,292 |
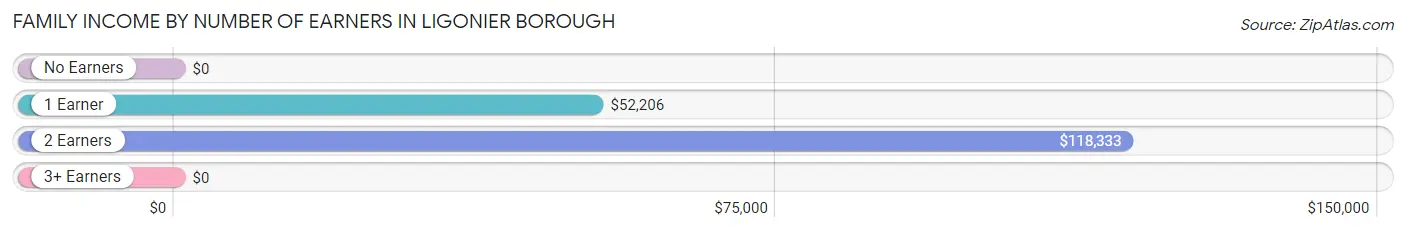
Family Income by Number of Earners in Ligonier borough
| Number of Earners | # Families | Median Income |
| No Earners | 104 (24.6%) | $0 |
| 1 Earner | 82 (19.4%) | $52,206 |
| 2 Earners | 212 (50.1%) | $118,333 |
| 3+ Earners | 25 (5.9%) | $0 |
| Total | 423 (100.0%) | $96,292 |
Household Income in Ligonier borough
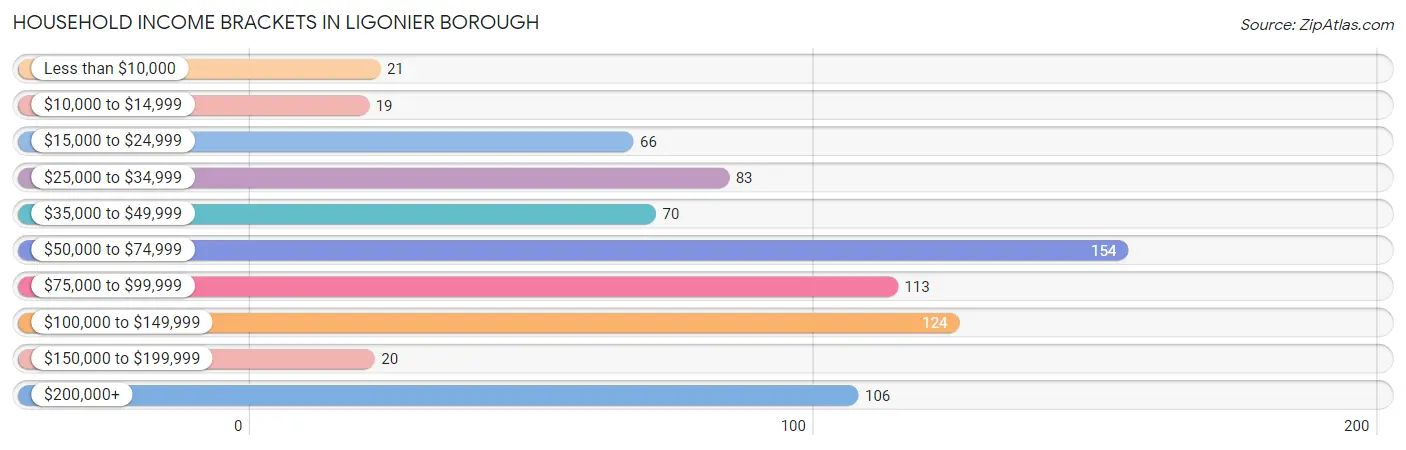
Household Income Brackets in Ligonier borough
With 154 households falling in the category, the $50,000 to $74,999 income range is the most frequent in Ligonier borough, accounting for 19.9% of all households. In contrast, only 19 households (2.5%) fall into the $10,000 to $14,999 income bracket, making it the least populous group.
| Income Bracket | # Households | % Households |
| Less than $10,000 | 21 | 2.7% |
| $10,000 to $14,999 | 19 | 2.4% |
| $15,000 to $24,999 | 66 | 8.5% |
| $25,000 to $34,999 | 83 | 10.7% |
| $35,000 to $49,999 | 70 | 9.0% |
| $50,000 to $74,999 | 154 | 19.8% |
| $75,000 to $99,999 | 113 | 14.6% |
| $100,000 to $149,999 | 124 | 16.0% |
| $150,000 to $199,999 | 20 | 2.6% |
| $200,000+ | 106 | 13.7% |
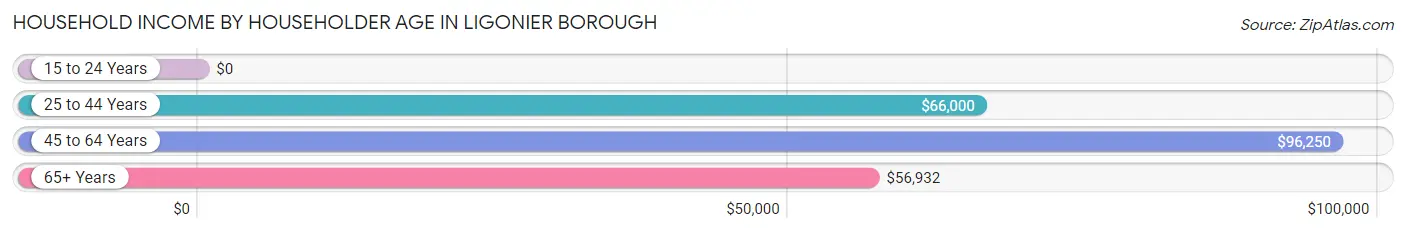
Household Income by Householder Age in Ligonier borough
The median household income in Ligonier borough is $68,523, with the highest median household income of $96,250 found in the 45 to 64 years age bracket for the primary householder. A total of 254 households (32.7%) fall into this category. Meanwhile, the 15 to 24 years age bracket for the primary householder has the lowest median household income of $0, with 17 households (2.2%) in this group.
| Income Bracket | # Households | Median Income |
| 15 to 24 Years | 17 (2.2%) | $0 |
| 25 to 44 Years | 190 (24.5%) | $66,000 |
| 45 to 64 Years | 254 (32.7%) | $96,250 |
| 65+ Years | 315 (40.6%) | $56,932 |
| Total | 776 (100.0%) | $68,523 |
Poverty in Ligonier borough
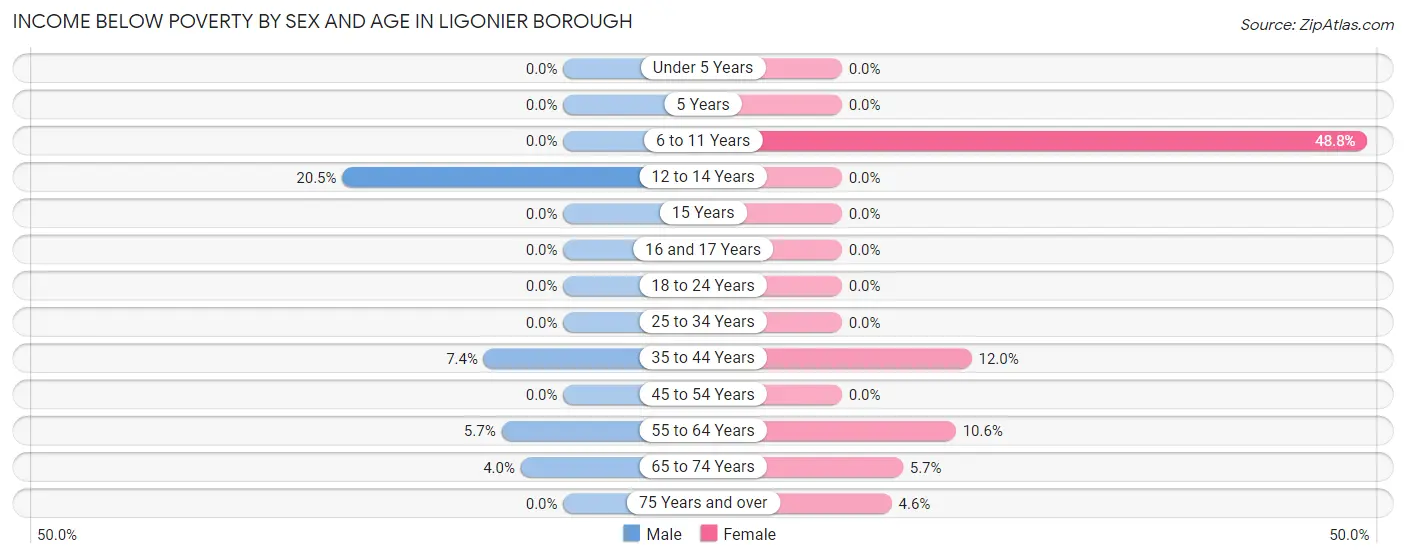
Income Below Poverty by Sex and Age in Ligonier borough
With 4.2% poverty level for males and 7.7% for females among the residents of Ligonier borough, 12 to 14 year old males and 6 to 11 year old females are the most vulnerable to poverty, with 8 males (20.5%) and 20 females (48.8%) in their respective age groups living below the poverty level.
| Age Bracket | Male | Female |
| Under 5 Years | 0 (0.0%) | 0 (0.0%) |
| 5 Years | 0 (0.0%) | 0 (0.0%) |
| 6 to 11 Years | 0 (0.0%) | 20 (48.8%) |
| 12 to 14 Years | 8 (20.5%) | 0 (0.0%) |
| 15 Years | 0 (0.0%) | 0 (0.0%) |
| 16 and 17 Years | 0 (0.0%) | 0 (0.0%) |
| 18 to 24 Years | 0 (0.0%) | 0 (0.0%) |
| 25 to 34 Years | 0 (0.0%) | 0 (0.0%) |
| 35 to 44 Years | 9 (7.4%) | 13 (12.0%) |
| 45 to 54 Years | 0 (0.0%) | 0 (0.0%) |
| 55 to 64 Years | 7 (5.7%) | 13 (10.6%) |
| 65 to 74 Years | 6 (4.0%) | 9 (5.7%) |
| 75 Years and over | 0 (0.0%) | 6 (4.6%) |
| Total | 30 (4.2%) | 61 (7.7%) |
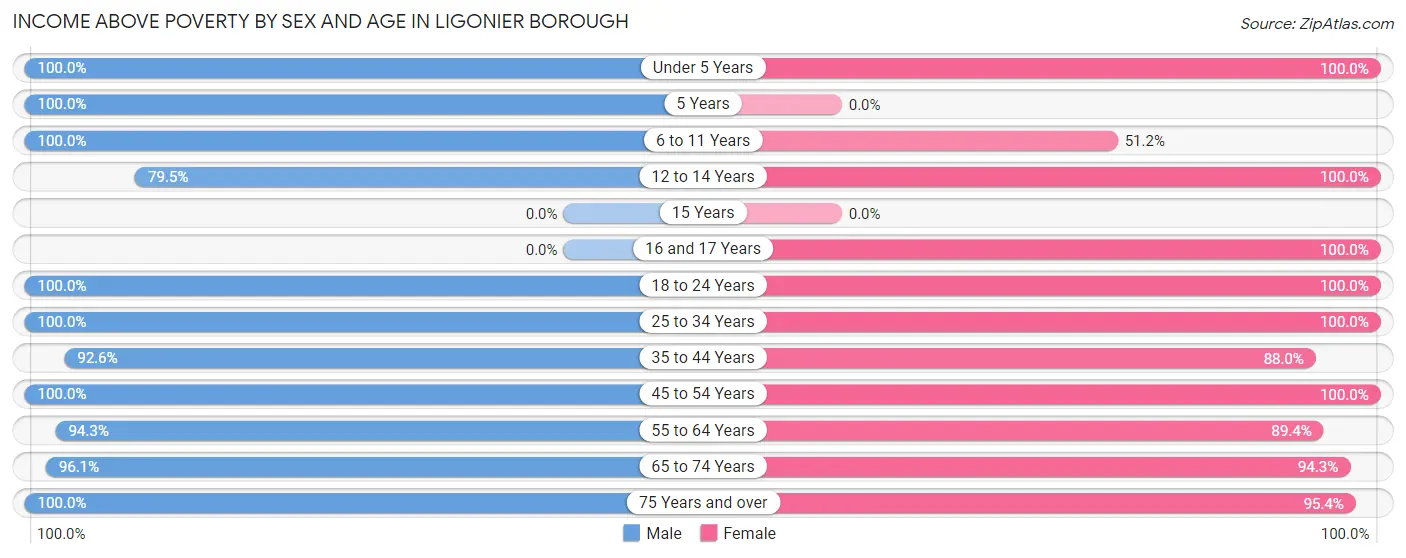
Income Above Poverty by Sex and Age in Ligonier borough
According to the poverty statistics in Ligonier borough, males aged under 5 years and females aged under 5 years are the age groups that are most secure financially, with 100.0% of males and 100.0% of females in these age groups living above the poverty line.
| Age Bracket | Male | Female |
| Under 5 Years | 3 (100.0%) | 25 (100.0%) |
| 5 Years | 15 (100.0%) | 0 (0.0%) |
| 6 to 11 Years | 26 (100.0%) | 21 (51.2%) |
| 12 to 14 Years | 31 (79.5%) | 5 (100.0%) |
| 15 Years | 0 (0.0%) | 0 (0.0%) |
| 16 and 17 Years | 0 (0.0%) | 27 (100.0%) |
| 18 to 24 Years | 41 (100.0%) | 49 (100.0%) |
| 25 to 34 Years | 65 (100.0%) | 51 (100.0%) |
| 35 to 44 Years | 113 (92.6%) | 95 (88.0%) |
| 45 to 54 Years | 78 (100.0%) | 74 (100.0%) |
| 55 to 64 Years | 115 (94.3%) | 110 (89.4%) |
| 65 to 74 Years | 146 (96.1%) | 150 (94.3%) |
| 75 Years and over | 55 (100.0%) | 124 (95.4%) |
| Total | 688 (95.8%) | 731 (92.3%) |
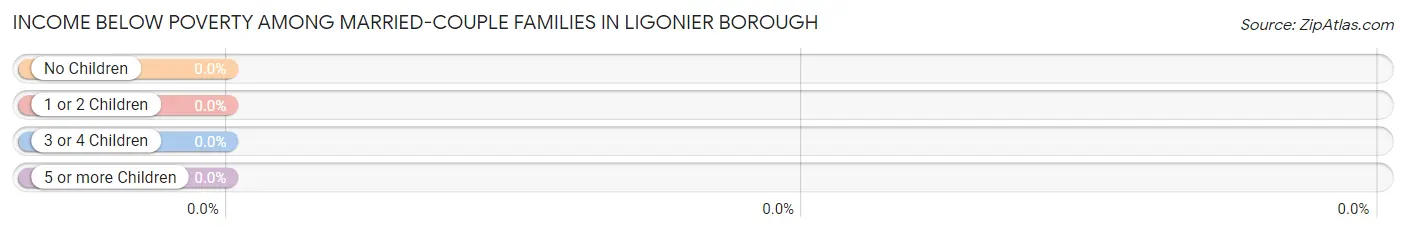
Income Below Poverty Among Married-Couple Families in Ligonier borough
| Children | Above Poverty | Below Poverty |
| No Children | 278 (100.0%) | 0 (0.0%) |
| 1 or 2 Children | 62 (100.0%) | 0 (0.0%) |
| 3 or 4 Children | 2 (100.0%) | 0 (0.0%) |
| 5 or more Children | 0 (0.0%) | 0 (0.0%) |
| Total | 342 (100.0%) | 0 (0.0%) |
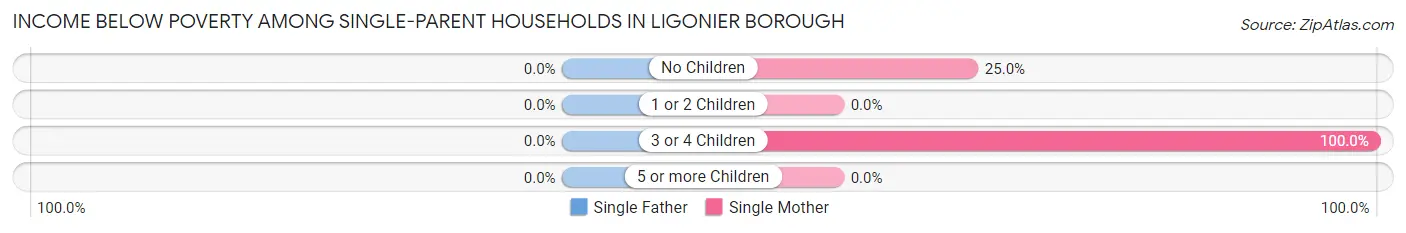
Income Below Poverty Among Single-Parent Households in Ligonier borough
| Children | Single Father | Single Mother |
| No Children | 0 (0.0%) | 9 (25.0%) |
| 1 or 2 Children | 0 (0.0%) | 0 (0.0%) |
| 3 or 4 Children | 0 (0.0%) | 8 (100.0%) |
| 5 or more Children | 0 (0.0%) | 0 (0.0%) |
| Total | 0 (0.0%) | 17 (30.4%) |
Income Below Poverty Among Married-Couple vs Single-Parent Households in Ligonier borough
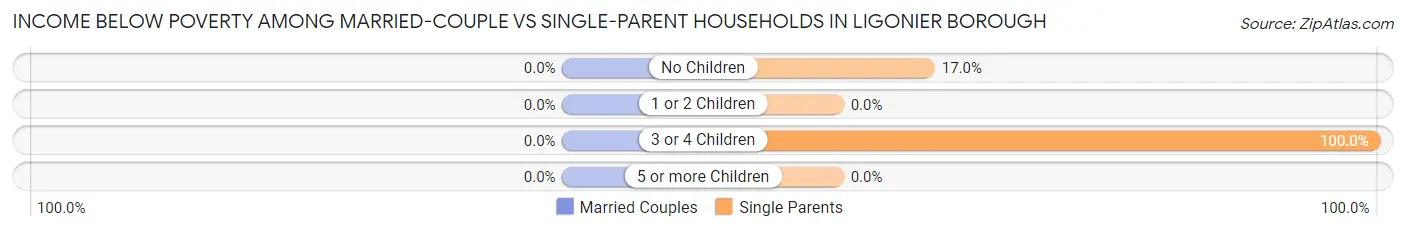
| Children | Married-Couple Families | Single-Parent Households |
| No Children | 0 (0.0%) | 9 (17.0%) |
| 1 or 2 Children | 0 (0.0%) | 0 (0.0%) |
| 3 or 4 Children | 0 (0.0%) | 8 (100.0%) |
| 5 or more Children | 0 (0.0%) | 0 (0.0%) |
| Total | 0 (0.0%) | 17 (21.0%) |
Race in Ligonier borough
The most populous races in Ligonier borough are White / Caucasian (1,506 | 99.7%), Hispanic or Latino (34 | 2.2%), and Two or more Races (4 | 0.3%).
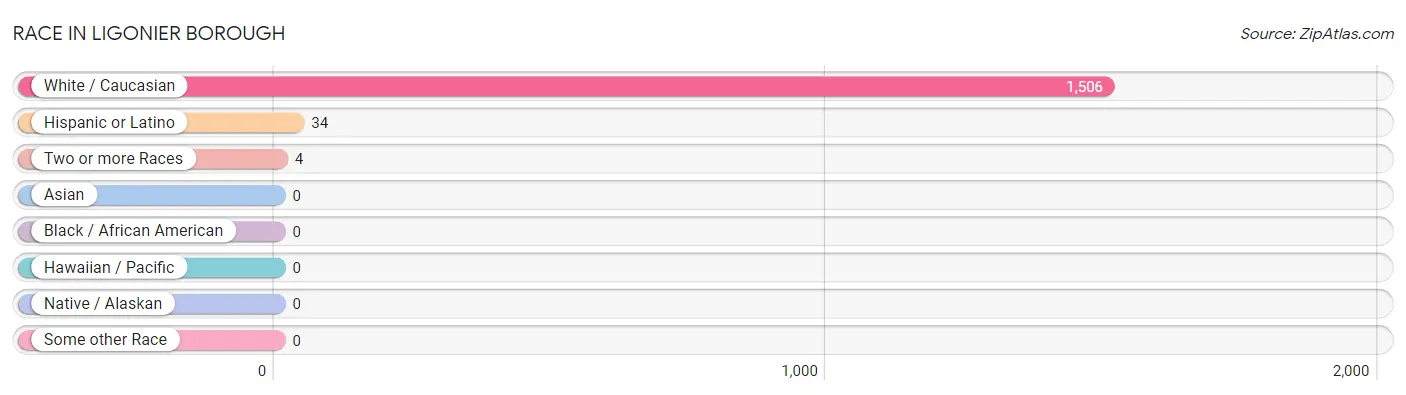
| Race | # Population | % Population |
| Asian | 0 | 0.0% |
| Black / African American | 0 | 0.0% |
| Hawaiian / Pacific | 0 | 0.0% |
| Hispanic or Latino | 34 | 2.2% |
| Native / Alaskan | 0 | 0.0% |
| White / Caucasian | 1,506 | 99.7% |
| Two or more Races | 4 | 0.3% |
| Some other Race | 0 | 0.0% |
| Total | 1,510 | 100.0% |
Ancestry in Ligonier borough
The most populous ancestries reported in Ligonier borough are German (499 | 33.1%), Irish (206 | 13.6%), English (179 | 11.8%), Italian (178 | 11.8%), and Polish (103 | 6.8%), together accounting for 77.1% of all Ligonier borough residents.
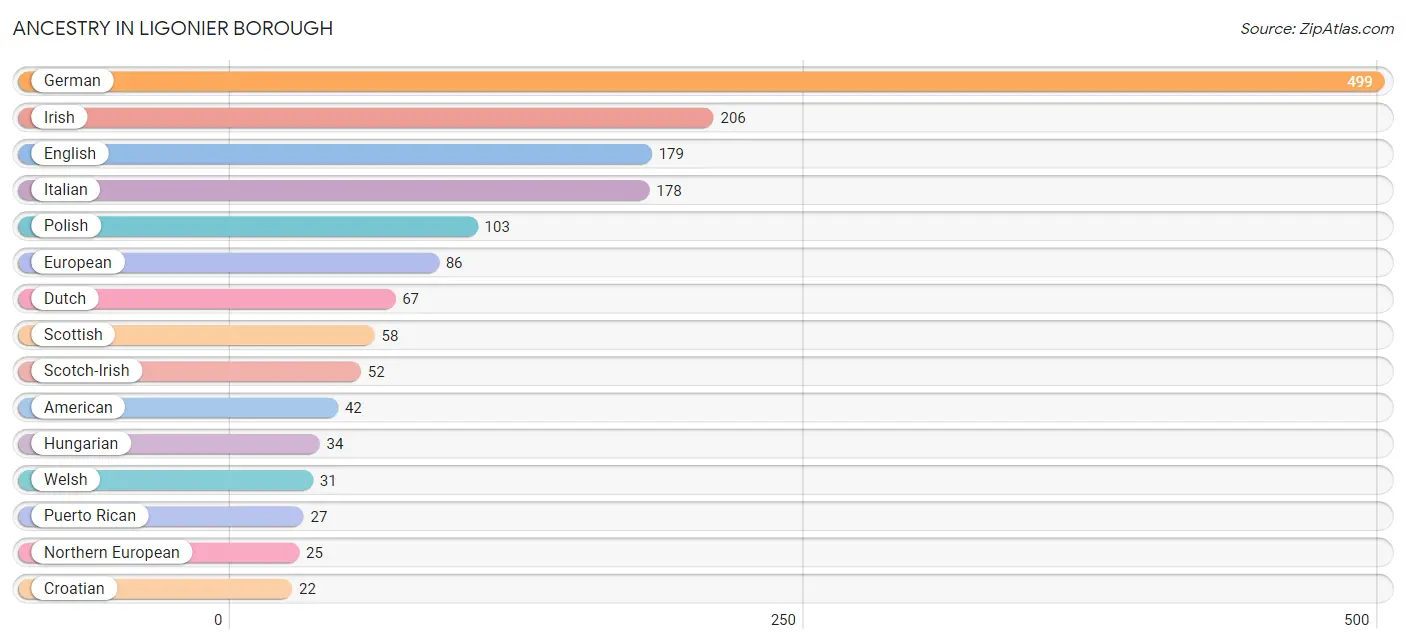
| Ancestry | # Population | % Population |
| American | 42 | 2.8% |
| Austrian | 12 | 0.8% |
| British | 6 | 0.4% |
| Croatian | 22 | 1.5% |
| Danish | 3 | 0.2% |
| Dutch | 67 | 4.4% |
| English | 179 | 11.8% |
| European | 86 | 5.7% |
| French | 17 | 1.1% |
| German | 499 | 33.1% |
| Hungarian | 34 | 2.2% |
| Irish | 206 | 13.6% |
| Italian | 178 | 11.8% |
| Mexican | 7 | 0.5% |
| Northern European | 25 | 1.7% |
| Norwegian | 3 | 0.2% |
| Pennsylvania German | 4 | 0.3% |
| Polish | 103 | 6.8% |
| Puerto Rican | 27 | 1.8% |
| Russian | 16 | 1.1% |
| Scotch-Irish | 52 | 3.4% |
| Scottish | 58 | 3.8% |
| Slavic | 4 | 0.3% |
| Slovak | 20 | 1.3% |
| Slovene | 7 | 0.5% |
| Swedish | 4 | 0.3% |
| Swiss | 3 | 0.2% |
| Welsh | 31 | 2.1% |
| Yugoslavian | 12 | 0.8% | View All 29 Rows |
Immigrants in Ligonier borough
The most numerous immigrant groups reported in Ligonier borough came from Eastern Europe (6 | 0.4%), Europe (6 | 0.4%), and Romania (6 | 0.4%), together accounting for 1.2% of all Ligonier borough residents.
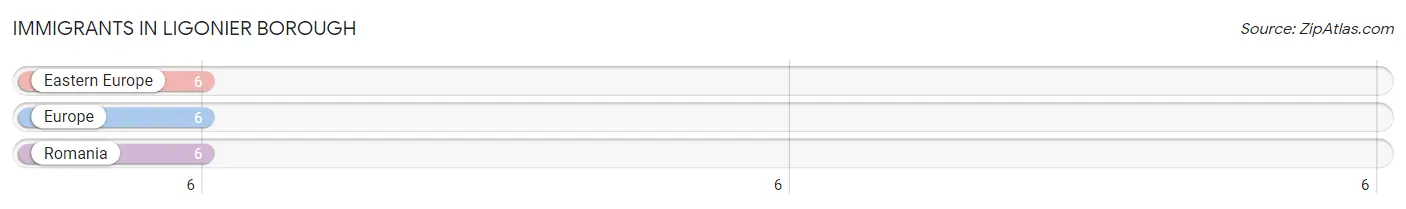
| Immigration Origin | # Population | % Population |
| Eastern Europe | 6 | 0.4% |
| Europe | 6 | 0.4% |
| Romania | 6 | 0.4% | View All 3 Rows |
Sex and Age in Ligonier borough
Sex and Age in Ligonier borough
The most populous age groups in Ligonier borough are 70 to 74 Years (106 | 14.8%) for men and 65 to 69 Years (87 | 11.0%) for women.
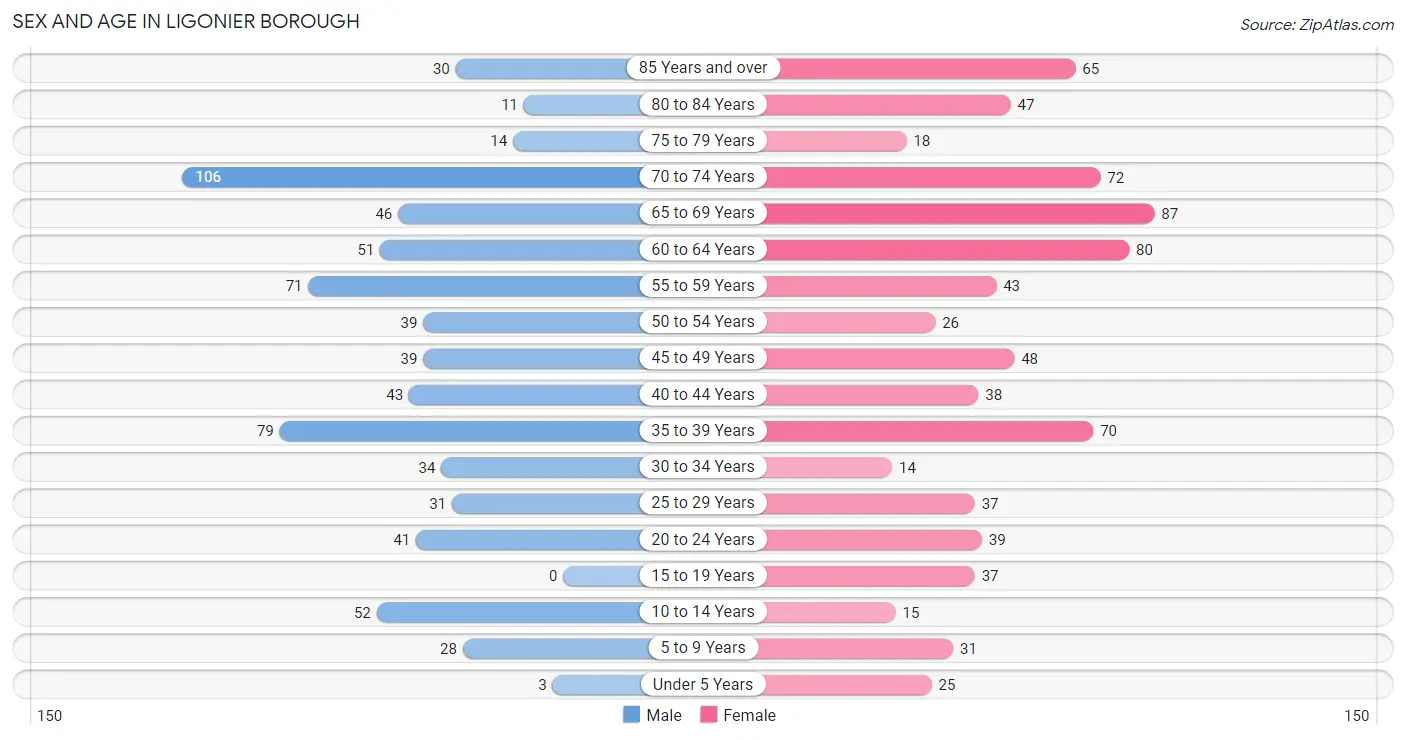
| Age Bracket | Male | Female |
| Under 5 Years | 3 (0.4%) | 25 (3.2%) |
| 5 to 9 Years | 28 (3.9%) | 31 (3.9%) |
| 10 to 14 Years | 52 (7.2%) | 15 (1.9%) |
| 15 to 19 Years | 0 (0.0%) | 37 (4.7%) |
| 20 to 24 Years | 41 (5.7%) | 39 (4.9%) |
| 25 to 29 Years | 31 (4.3%) | 37 (4.7%) |
| 30 to 34 Years | 34 (4.7%) | 14 (1.8%) |
| 35 to 39 Years | 79 (11.0%) | 70 (8.8%) |
| 40 to 44 Years | 43 (6.0%) | 38 (4.8%) |
| 45 to 49 Years | 39 (5.4%) | 48 (6.1%) |
| 50 to 54 Years | 39 (5.4%) | 26 (3.3%) |
| 55 to 59 Years | 71 (9.9%) | 43 (5.4%) |
| 60 to 64 Years | 51 (7.1%) | 80 (10.1%) |
| 65 to 69 Years | 46 (6.4%) | 87 (11.0%) |
| 70 to 74 Years | 106 (14.8%) | 72 (9.1%) |
| 75 to 79 Years | 14 (1.9%) | 18 (2.3%) |
| 80 to 84 Years | 11 (1.5%) | 47 (5.9%) |
| 85 Years and over | 30 (4.2%) | 65 (8.2%) |
| Total | 718 (100.0%) | 792 (100.0%) |
Families and Households in Ligonier borough
Median Family Size in Ligonier borough
The median family size in Ligonier borough is 2.58 persons per family, with single female/mother families (56 | 13.2%) accounting for the largest median family size of 2.66 persons per family. On the other hand, single male/father families (25 | 5.9%) represent the smallest median family size with 1.96 persons per family.
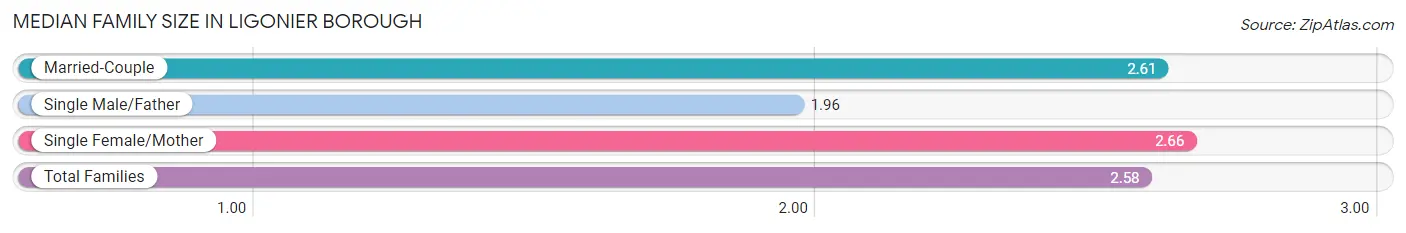
| Family Type | # Families | Family Size |
| Married-Couple | 342 (80.8%) | 2.61 |
| Single Male/Father | 25 (5.9%) | 1.96 |
| Single Female/Mother | 56 (13.2%) | 2.66 |
| Total Families | 423 (100.0%) | 2.58 |
Median Household Size in Ligonier borough
The median household size in Ligonier borough is 1.95 persons per household, with single female/mother households (56 | 7.2%) accounting for the largest median household size of 2.8 persons per household. non-family households (353 | 45.5%) represent the smallest median household size with 1.16 persons per household.
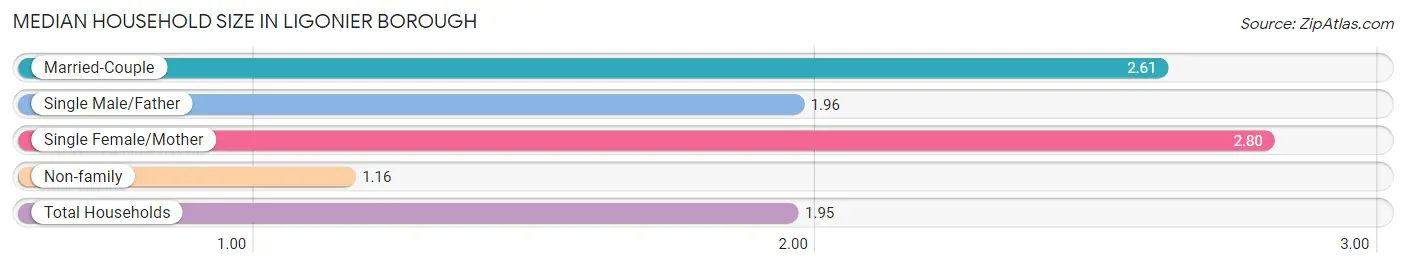
| Household Type | # Households | Household Size |
| Married-Couple | 342 (44.1%) | 2.61 |
| Single Male/Father | 25 (3.2%) | 1.96 |
| Single Female/Mother | 56 (7.2%) | 2.80 |
| Non-family | 353 (45.5%) | 1.16 |
| Total Households | 776 (100.0%) | 1.95 |
Household Size by Marriage Status in Ligonier borough
Out of a total of 776 households in Ligonier borough, 423 (54.5%) are family households, while 353 (45.5%) are nonfamily households. The most numerous type of family households are 2-person households, comprising 287, and the most common type of nonfamily households are 1-person households, comprising 309.
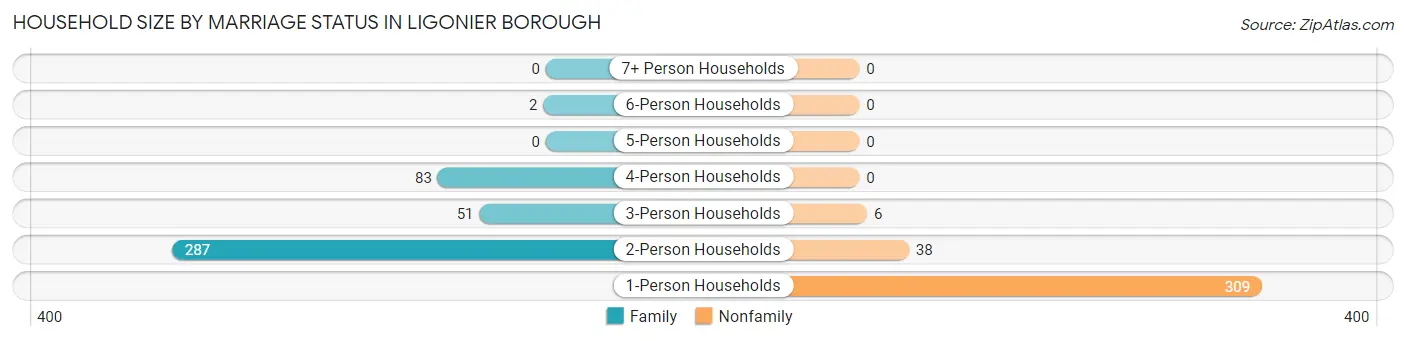
| Household Size | Family Households | Nonfamily Households |
| 1-Person Households | - | 309 (39.8%) |
| 2-Person Households | 287 (37.0%) | 38 (4.9%) |
| 3-Person Households | 51 (6.6%) | 6 (0.8%) |
| 4-Person Households | 83 (10.7%) | 0 (0.0%) |
| 5-Person Households | 0 (0.0%) | 0 (0.0%) |
| 6-Person Households | 2 (0.3%) | 0 (0.0%) |
| 7+ Person Households | 0 (0.0%) | 0 (0.0%) |
| Total | 423 (54.5%) | 353 (45.5%) |
Female Fertility in Ligonier borough
Fertility by Age in Ligonier borough
| Age Bracket | Women with Births | Births / 1,000 Women |
| 15 to 19 years | 0 (0.0%) | 0.0 |
| 20 to 34 years | 0 (0.0%) | 0.0 |
| 35 to 50 years | 0 (0.0%) | 0.0 |
| Total | 0 (0.0%) | 0.0 |
Fertility by Age by Marriage Status in Ligonier borough
| Age Bracket | Married | Unmarried |
| 15 to 19 years | 0 (0.0%) | 0 (0.0%) |
| 20 to 34 years | 0 (0.0%) | 0 (0.0%) |
| 35 to 50 years | 0 (0.0%) | 0 (0.0%) |
| Total | 0 (0.0%) | 0 (0.0%) |
Fertility by Education in Ligonier borough
| Educational Attainment | Women with Births | Births / 1,000 Women |
| Less than High School | 0 (0.0%) | 0.0 |
| High School Diploma | 0 (0.0%) | 0.0 |
| College or Associate's Degree | 0 (0.0%) | 0.0 |
| Bachelor's Degree | 0 (0.0%) | 0.0 |
| Graduate Degree | 0 (0.0%) | 0.0 |
| Total | 0 (0.0%) | 0.0 |
Fertility by Education by Marriage Status in Ligonier borough
| Educational Attainment | Married | Unmarried |
| Less than High School | 0 (0.0%) | 0 (0.0%) |
| High School Diploma | 0 (0.0%) | 0 (0.0%) |
| College or Associate's Degree | 0 (0.0%) | 0 (0.0%) |
| Bachelor's Degree | 0 (0.0%) | 0 (0.0%) |
| Graduate Degree | 0 (0.0%) | 0 (0.0%) |
| Total | 0 (0.0%) | 0 (0.0%) |
Employment Characteristics in Ligonier borough
Employment by Class of Employer in Ligonier borough
Among the 799 employed individuals in Ligonier borough, private company employees (354 | 44.3%), not-for-profit organizations (160 | 20.0%), and self-employed (not incorporated) (109 | 13.6%) make up the most common classes of employment.
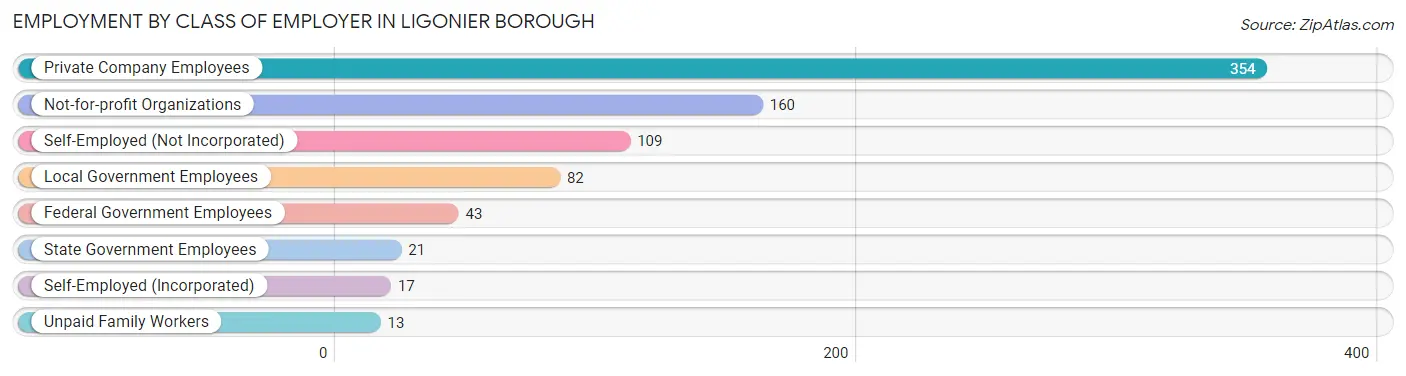
| Employer Class | # Employees | % Employees |
| Private Company Employees | 354 | 44.3% |
| Self-Employed (Incorporated) | 17 | 2.1% |
| Self-Employed (Not Incorporated) | 109 | 13.6% |
| Not-for-profit Organizations | 160 | 20.0% |
| Local Government Employees | 82 | 10.3% |
| State Government Employees | 21 | 2.6% |
| Federal Government Employees | 43 | 5.4% |
| Unpaid Family Workers | 13 | 1.6% |
| Total | 799 | 100.0% |
Employment Status by Age in Ligonier borough
According to the labor force statistics for Ligonier borough, out of the total population over 16 years of age (1,356), 63.2% or 857 individuals are in the labor force, with 3.3% or 28 of them unemployed. The age group with the highest labor force participation rate is 20 to 24 years, with 100.0% or 80 individuals in the labor force. Within the labor force, the 30 to 34 years age range has the highest percentage of unemployed individuals, with 16.7% or 8 of them being unemployed.
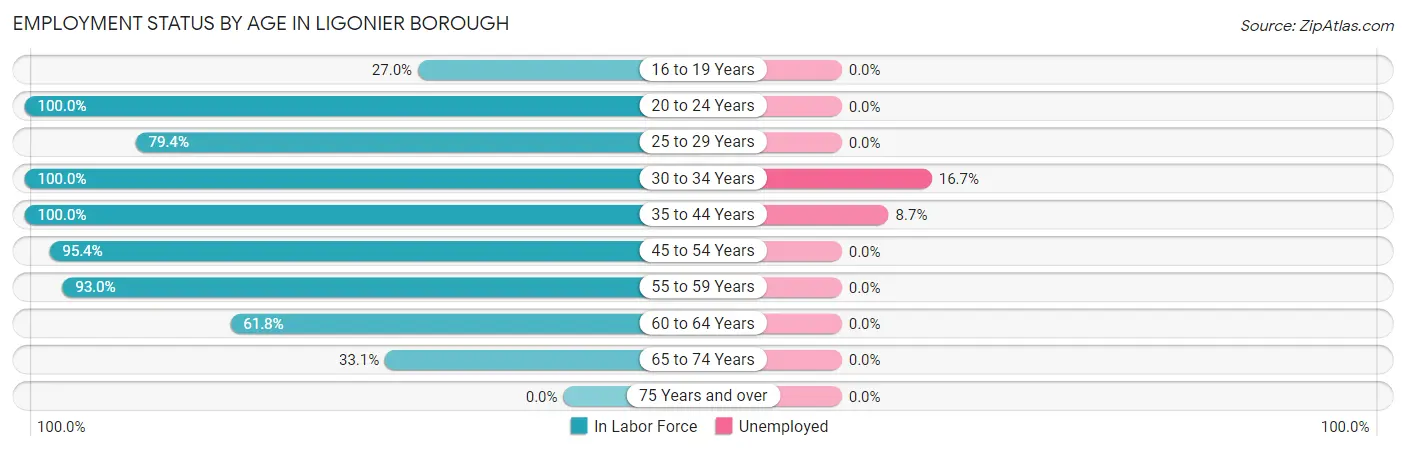
| Age Bracket | In Labor Force | Unemployed |
| 16 to 19 Years | 10 (27.0%) | 0 (0.0%) |
| 20 to 24 Years | 80 (100.0%) | 0 (0.0%) |
| 25 to 29 Years | 54 (79.4%) | 0 (0.0%) |
| 30 to 34 Years | 48 (100.0%) | 8 (16.7%) |
| 35 to 44 Years | 230 (100.0%) | 20 (8.7%) |
| 45 to 54 Years | 145 (95.4%) | 0 (0.0%) |
| 55 to 59 Years | 106 (93.0%) | 0 (0.0%) |
| 60 to 64 Years | 81 (61.8%) | 0 (0.0%) |
| 65 to 74 Years | 103 (33.1%) | 0 (0.0%) |
| 75 Years and over | 0 (0.0%) | 0 (0.0%) |
| Total | 857 (63.2%) | 28 (3.3%) |
Employment Status by Educational Attainment in Ligonier borough
According to labor force statistics for Ligonier borough, 89.4% of individuals (664) out of the total population between 25 and 64 years of age (743) are in the labor force, with 4.2% or 28 of them being unemployed. The group with the highest labor force participation rate are those with the educational attainment of bachelor's degree or higher, with 93.0% or 267 individuals in the labor force. Within the labor force, individuals with high school diploma education have the highest percentage of unemployment, with 16.7% or 19 of them being unemployed.
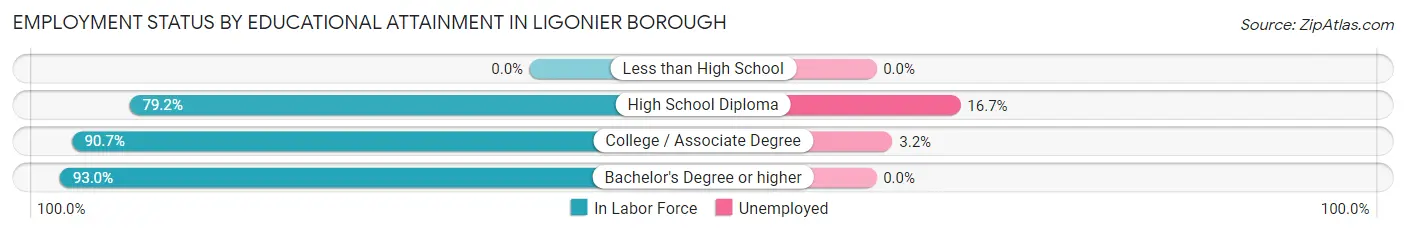
| Educational Attainment | In Labor Force | Unemployed |
| Less than High School | 0 (0.0%) | 0 (0.0%) |
| High School Diploma | 114 (79.2%) | 24 (16.7%) |
| College / Associate Degree | 283 (90.7%) | 10 (3.2%) |
| Bachelor's Degree or higher | 267 (93.0%) | 0 (0.0%) |
| Total | 664 (89.4%) | 31 (4.2%) |
Employment Occupations by Sex in Ligonier borough
Management, Business, Science and Arts Occupations
The most common Management, Business, Science and Arts occupations in Ligonier borough are Management (143 | 17.2%), Community & Social Service (121 | 14.6%), Education Instruction & Library (83 | 10.0%), Business & Financial (70 | 8.4%), and Health Diagnosing & Treating (47 | 5.7%).
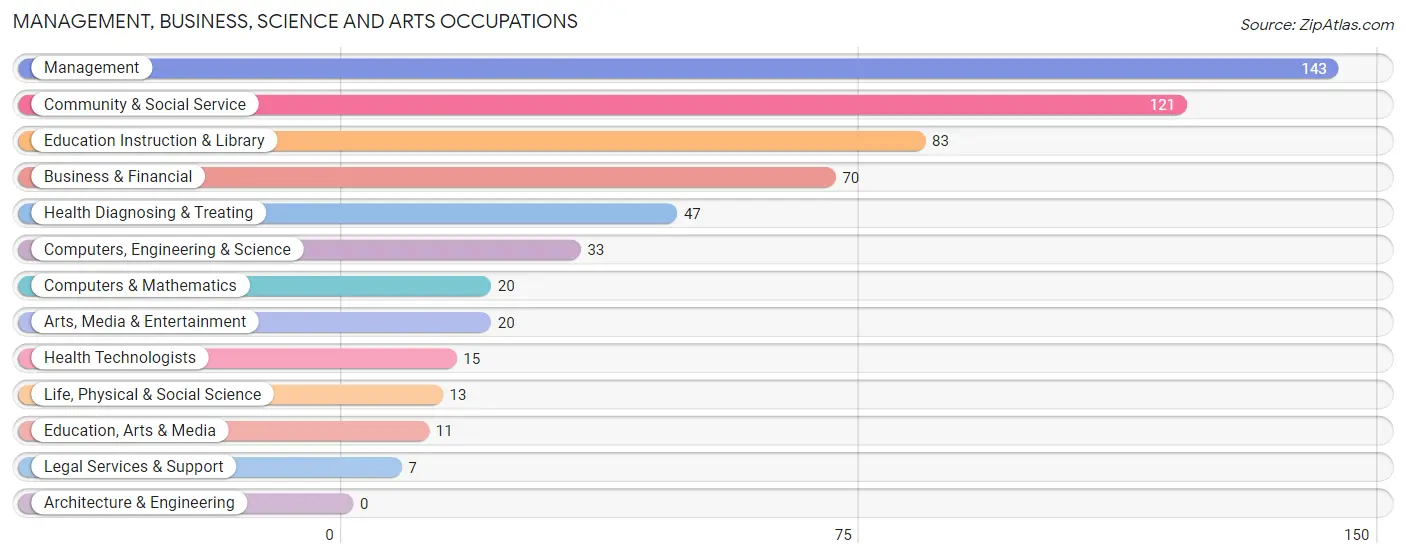
Management, Business, Science and Arts Occupations by Sex
Within the Management, Business, Science and Arts occupations in Ligonier borough, the most male-oriented occupations are Computers & Mathematics (100.0%), Education, Arts & Media (100.0%), and Legal Services & Support (100.0%), while the most female-oriented occupations are Arts, Media & Entertainment (100.0%), Health Diagnosing & Treating (89.4%), and Business & Financial (88.6%).
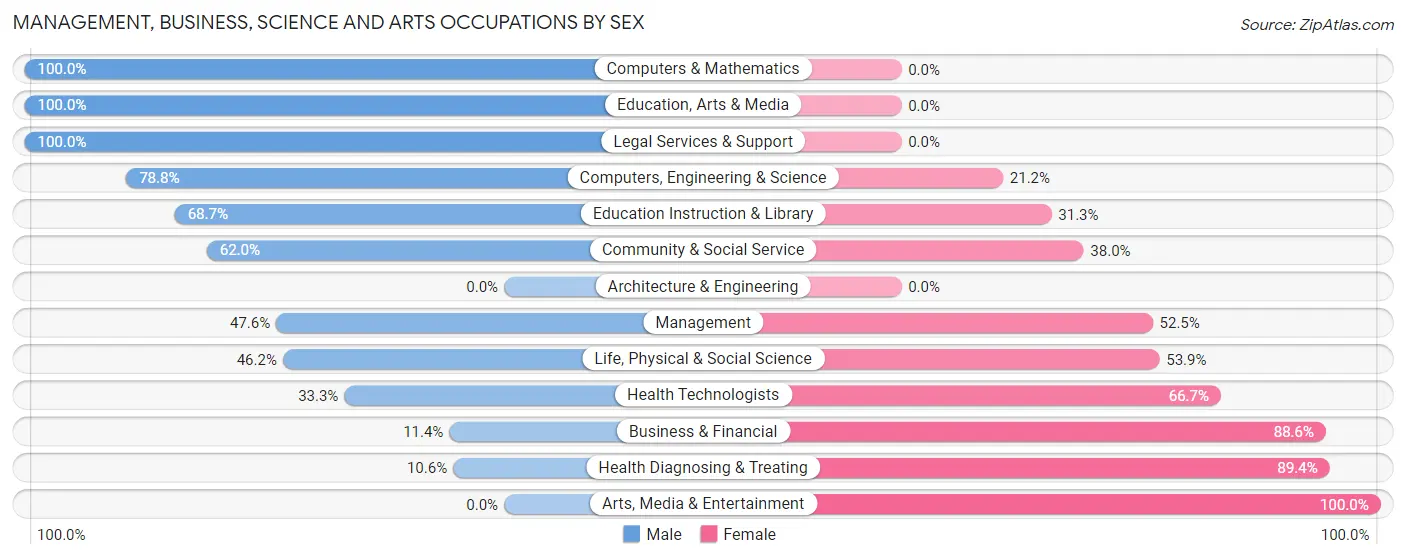
| Occupation | Male | Female |
| Management | 68 (47.5%) | 75 (52.4%) |
| Business & Financial | 8 (11.4%) | 62 (88.6%) |
| Computers, Engineering & Science | 26 (78.8%) | 7 (21.2%) |
| Computers & Mathematics | 20 (100.0%) | 0 (0.0%) |
| Architecture & Engineering | 0 (0.0%) | 0 (0.0%) |
| Life, Physical & Social Science | 6 (46.2%) | 7 (53.8%) |
| Community & Social Service | 75 (62.0%) | 46 (38.0%) |
| Education, Arts & Media | 11 (100.0%) | 0 (0.0%) |
| Legal Services & Support | 7 (100.0%) | 0 (0.0%) |
| Education Instruction & Library | 57 (68.7%) | 26 (31.3%) |
| Arts, Media & Entertainment | 0 (0.0%) | 20 (100.0%) |
| Health Diagnosing & Treating | 5 (10.6%) | 42 (89.4%) |
| Health Technologists | 5 (33.3%) | 10 (66.7%) |
| Total (Category) | 182 (44.0%) | 232 (56.0%) |
| Total (Overall) | 450 (54.3%) | 379 (45.7%) |
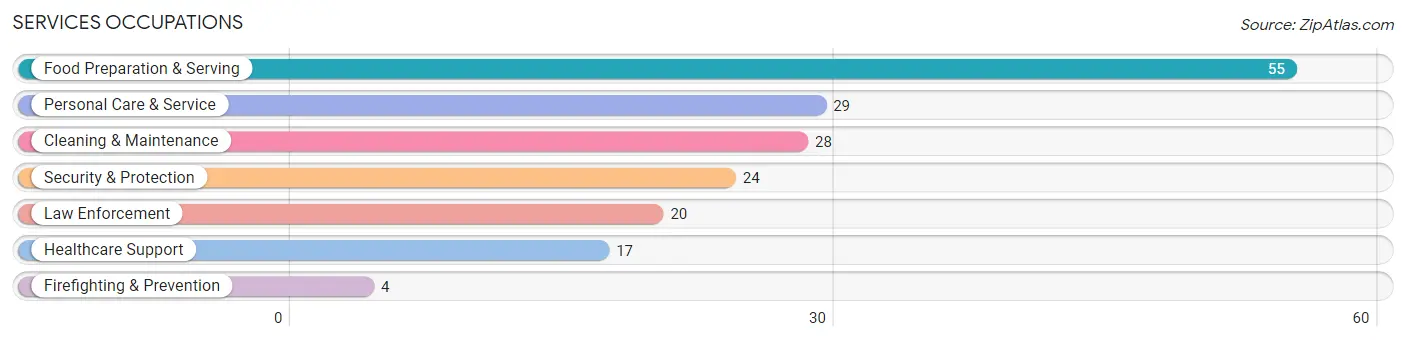
Services Occupations
The most common Services occupations in Ligonier borough are Food Preparation & Serving (55 | 6.6%), Personal Care & Service (29 | 3.5%), Cleaning & Maintenance (28 | 3.4%), Security & Protection (24 | 2.9%), and Law Enforcement (20 | 2.4%).
Services Occupations by Sex
Within the Services occupations in Ligonier borough, the most male-oriented occupations are Security & Protection (100.0%), Firefighting & Prevention (100.0%), and Law Enforcement (100.0%), while the most female-oriented occupations are Healthcare Support (100.0%), Personal Care & Service (65.5%), and Food Preparation & Serving (43.6%).
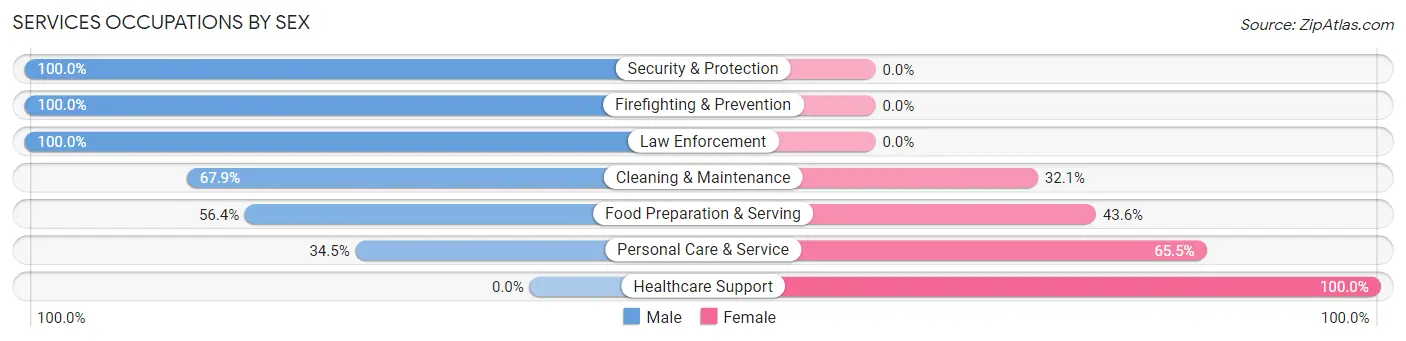
| Occupation | Male | Female |
| Healthcare Support | 0 (0.0%) | 17 (100.0%) |
| Security & Protection | 24 (100.0%) | 0 (0.0%) |
| Firefighting & Prevention | 4 (100.0%) | 0 (0.0%) |
| Law Enforcement | 20 (100.0%) | 0 (0.0%) |
| Food Preparation & Serving | 31 (56.4%) | 24 (43.6%) |
| Cleaning & Maintenance | 19 (67.9%) | 9 (32.1%) |
| Personal Care & Service | 10 (34.5%) | 19 (65.5%) |
| Total (Category) | 84 (54.9%) | 69 (45.1%) |
| Total (Overall) | 450 (54.3%) | 379 (45.7%) |
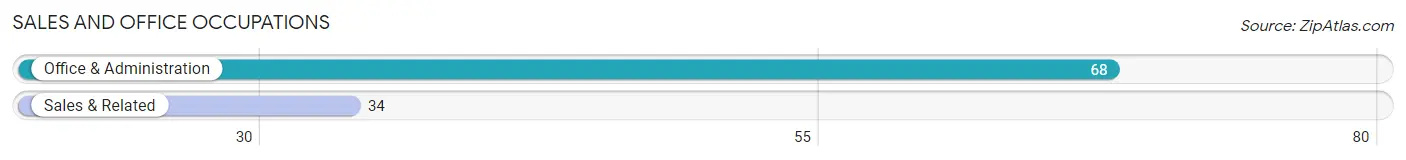
Sales and Office Occupations
The most common Sales and Office occupations in Ligonier borough are Office & Administration (68 | 8.2%), and Sales & Related (34 | 4.1%).
Sales and Office Occupations by Sex
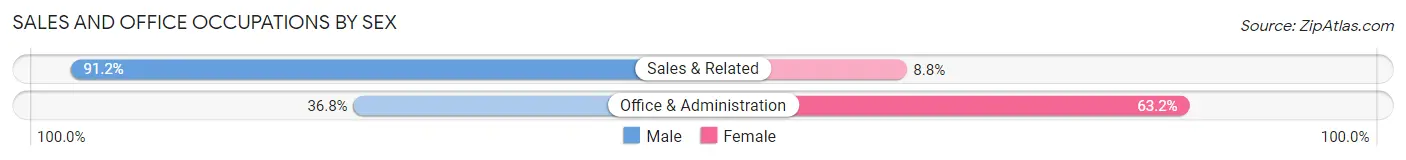
| Occupation | Male | Female |
| Sales & Related | 31 (91.2%) | 3 (8.8%) |
| Office & Administration | 25 (36.8%) | 43 (63.2%) |
| Total (Category) | 56 (54.9%) | 46 (45.1%) |
| Total (Overall) | 450 (54.3%) | 379 (45.7%) |
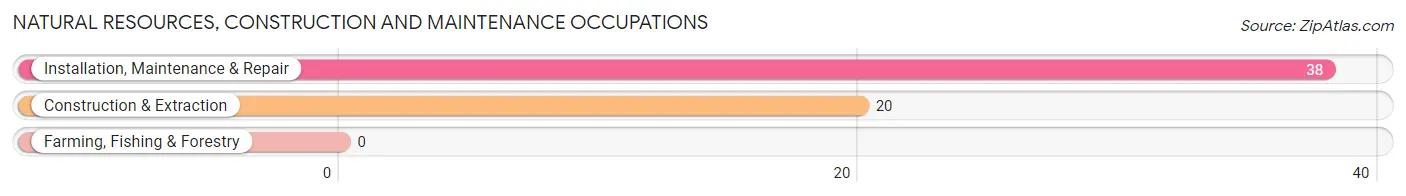
Natural Resources, Construction and Maintenance Occupations
The most common Natural Resources, Construction and Maintenance occupations in Ligonier borough are Installation, Maintenance & Repair (38 | 4.6%), and Construction & Extraction (20 | 2.4%).
Natural Resources, Construction and Maintenance Occupations by Sex
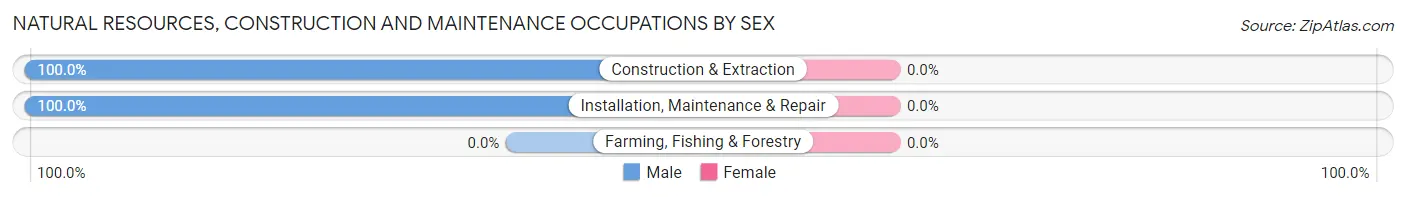
| Occupation | Male | Female |
| Farming, Fishing & Forestry | 0 (0.0%) | 0 (0.0%) |
| Construction & Extraction | 20 (100.0%) | 0 (0.0%) |
| Installation, Maintenance & Repair | 38 (100.0%) | 0 (0.0%) |
| Total (Category) | 58 (100.0%) | 0 (0.0%) |
| Total (Overall) | 450 (54.3%) | 379 (45.7%) |
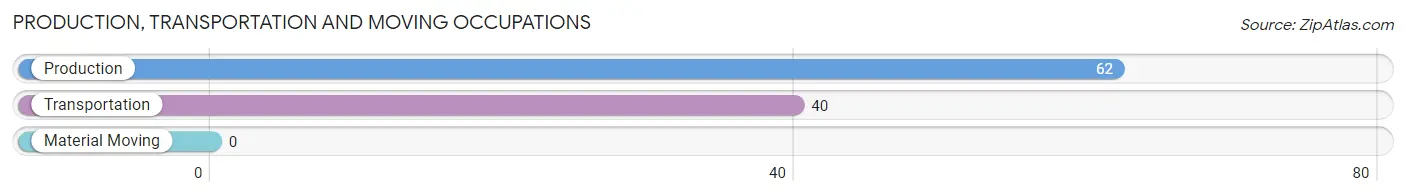
Production, Transportation and Moving Occupations
The most common Production, Transportation and Moving occupations in Ligonier borough are Production (62 | 7.5%), and Transportation (40 | 4.8%).
Production, Transportation and Moving Occupations by Sex
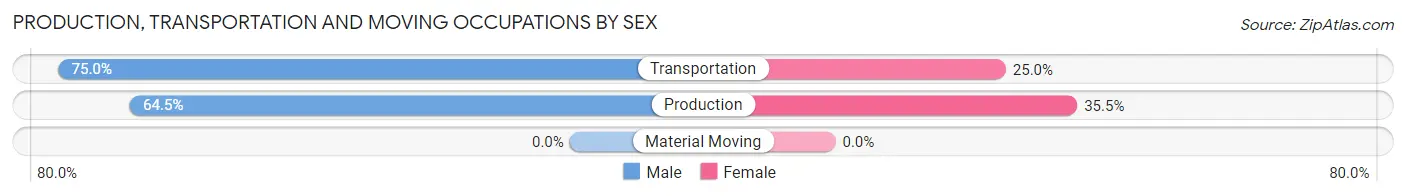
| Occupation | Male | Female |
| Production | 40 (64.5%) | 22 (35.5%) |
| Transportation | 30 (75.0%) | 10 (25.0%) |
| Material Moving | 0 (0.0%) | 0 (0.0%) |
| Total (Category) | 70 (68.6%) | 32 (31.4%) |
| Total (Overall) | 450 (54.3%) | 379 (45.7%) |
Employment Industries by Sex in Ligonier borough
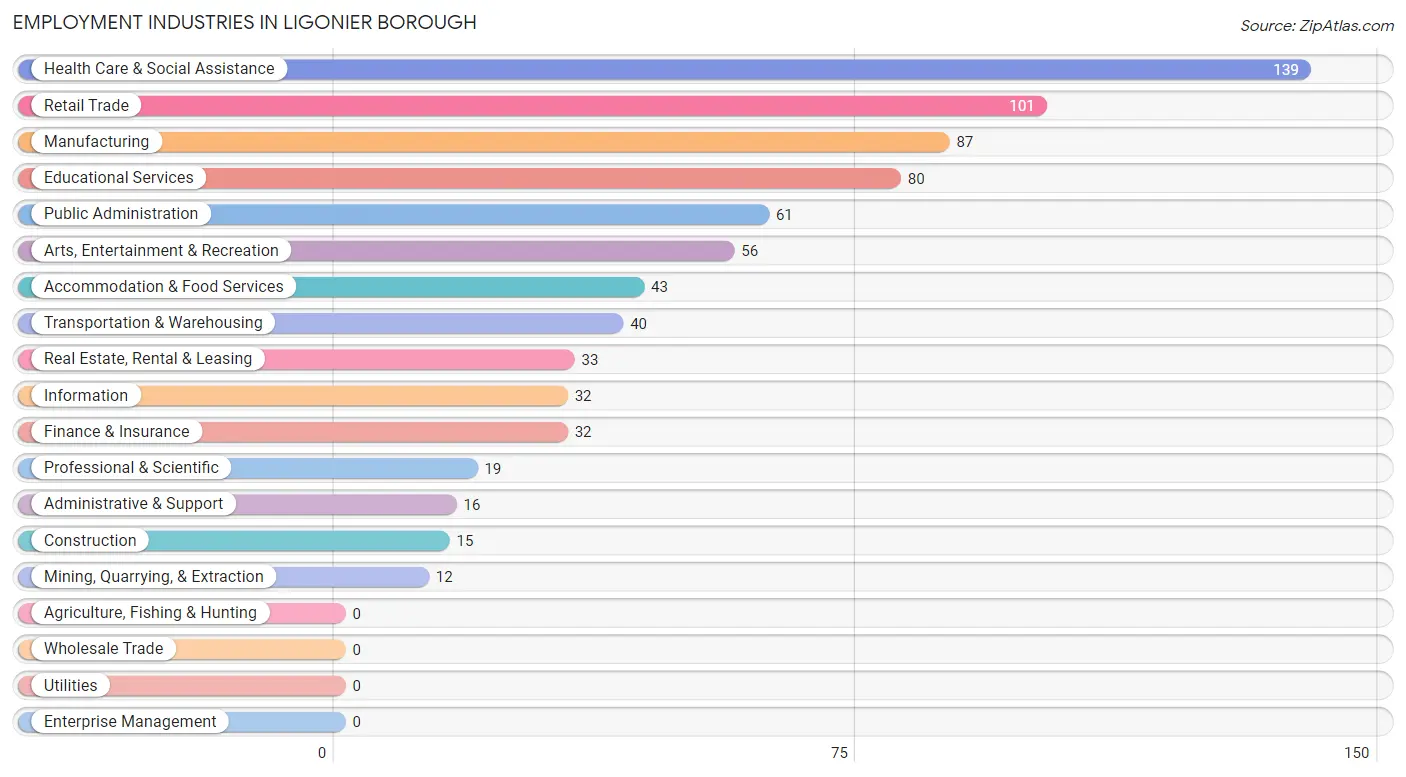
Employment Industries in Ligonier borough
The major employment industries in Ligonier borough include Health Care & Social Assistance (139 | 16.8%), Retail Trade (101 | 12.2%), Manufacturing (87 | 10.5%), Educational Services (80 | 9.7%), and Public Administration (61 | 7.4%).
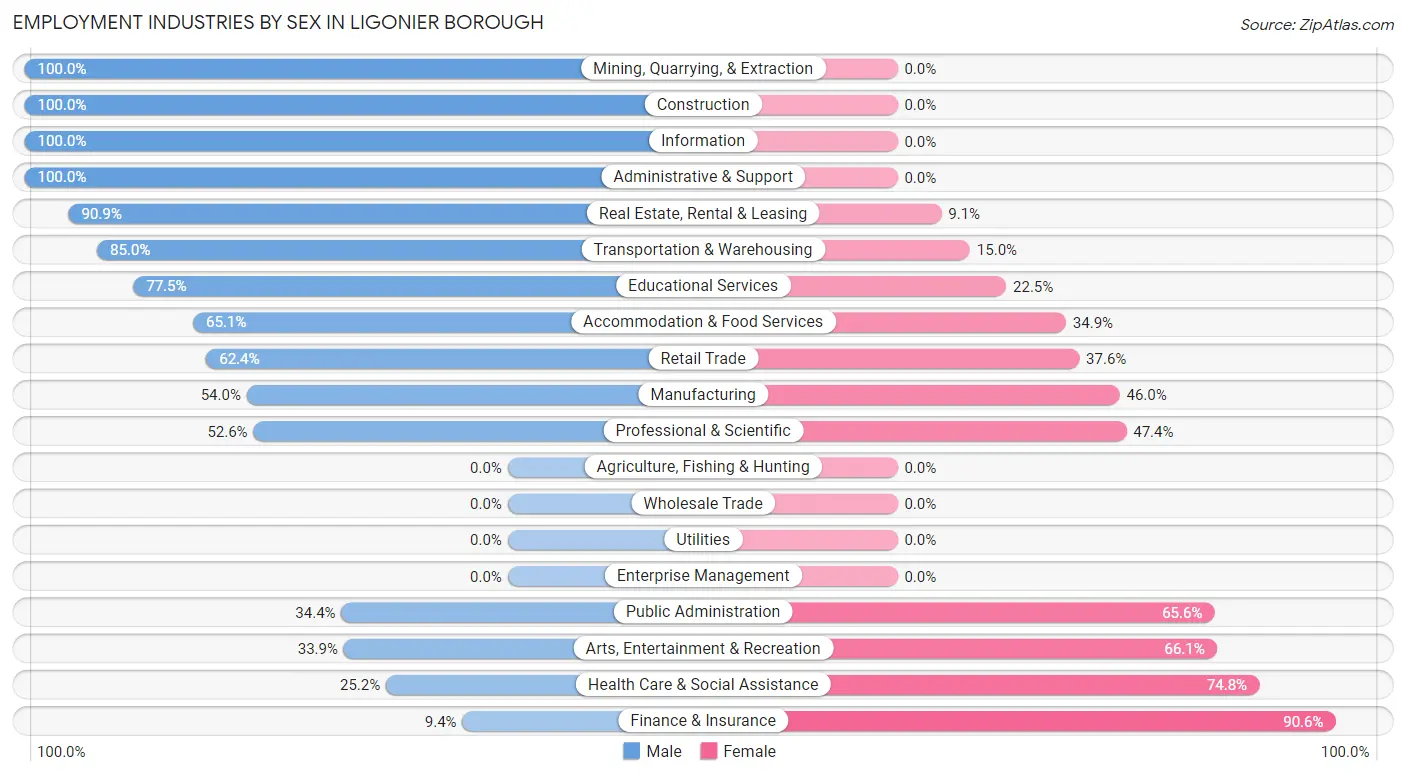
Employment Industries by Sex in Ligonier borough
The Ligonier borough industries that see more men than women are Mining, Quarrying, & Extraction (100.0%), Construction (100.0%), and Information (100.0%), whereas the industries that tend to have a higher number of women are Finance & Insurance (90.6%), Health Care & Social Assistance (74.8%), and Arts, Entertainment & Recreation (66.1%).
| Industry | Male | Female |
| Agriculture, Fishing & Hunting | 0 (0.0%) | 0 (0.0%) |
| Mining, Quarrying, & Extraction | 12 (100.0%) | 0 (0.0%) |
| Construction | 15 (100.0%) | 0 (0.0%) |
| Manufacturing | 47 (54.0%) | 40 (46.0%) |
| Wholesale Trade | 0 (0.0%) | 0 (0.0%) |
| Retail Trade | 63 (62.4%) | 38 (37.6%) |
| Transportation & Warehousing | 34 (85.0%) | 6 (15.0%) |
| Utilities | 0 (0.0%) | 0 (0.0%) |
| Information | 32 (100.0%) | 0 (0.0%) |
| Finance & Insurance | 3 (9.4%) | 29 (90.6%) |
| Real Estate, Rental & Leasing | 30 (90.9%) | 3 (9.1%) |
| Professional & Scientific | 10 (52.6%) | 9 (47.4%) |
| Enterprise Management | 0 (0.0%) | 0 (0.0%) |
| Administrative & Support | 16 (100.0%) | 0 (0.0%) |
| Educational Services | 62 (77.5%) | 18 (22.5%) |
| Health Care & Social Assistance | 35 (25.2%) | 104 (74.8%) |
| Arts, Entertainment & Recreation | 19 (33.9%) | 37 (66.1%) |
| Accommodation & Food Services | 28 (65.1%) | 15 (34.9%) |
| Public Administration | 21 (34.4%) | 40 (65.6%) |
| Total | 450 (54.3%) | 379 (45.7%) |
Education in Ligonier borough
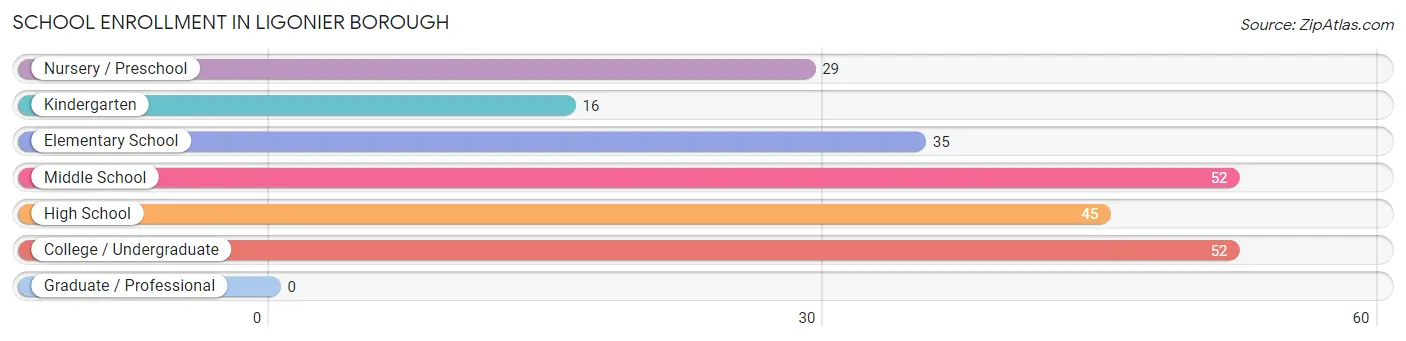
School Enrollment in Ligonier borough
The most common levels of schooling among the 229 students in Ligonier borough are middle school (52 | 22.7%), college / undergraduate (52 | 22.7%), and high school (45 | 19.7%).
| School Level | # Students | % Students |
| Nursery / Preschool | 29 | 12.7% |
| Kindergarten | 16 | 7.0% |
| Elementary School | 35 | 15.3% |
| Middle School | 52 | 22.7% |
| High School | 45 | 19.7% |
| College / Undergraduate | 52 | 22.7% |
| Graduate / Professional | 0 | 0.0% |
| Total | 229 | 100.0% |
School Enrollment by Age by Funding Source in Ligonier borough
Out of a total of 229 students who are enrolled in schools in Ligonier borough, 42 (18.3%) attend a private institution, while the remaining 187 (81.7%) are enrolled in public schools. The age group of 18 to 19 year olds has the highest likelihood of being enrolled in private schools, with 10 (100.0% in the age bracket) enrolled. Conversely, the age group of 3 to 4 year olds has the lowest likelihood of being enrolled in a private school, with 14 (100.0% in the age bracket) attending a public institution.
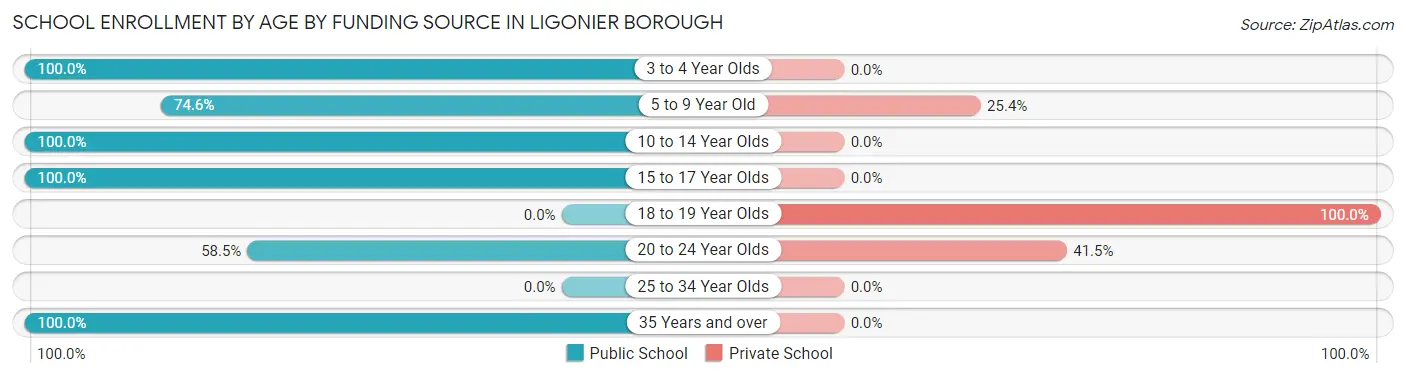
| Age Bracket | Public School | Private School |
| 3 to 4 Year Olds | 14 (100.0%) | 0 (0.0%) |
| 5 to 9 Year Old | 44 (74.6%) | 15 (25.4%) |
| 10 to 14 Year Olds | 67 (100.0%) | 0 (0.0%) |
| 15 to 17 Year Olds | 27 (100.0%) | 0 (0.0%) |
| 18 to 19 Year Olds | 0 (0.0%) | 10 (100.0%) |
| 20 to 24 Year Olds | 24 (58.5%) | 17 (41.5%) |
| 25 to 34 Year Olds | 0 (0.0%) | 0 (0.0%) |
| 35 Years and over | 11 (100.0%) | 0 (0.0%) |
| Total | 187 (81.7%) | 42 (18.3%) |
Educational Attainment by Field of Study in Ligonier borough
Education (139 | 25.5%), literature & languages (75 | 13.8%), business (70 | 12.8%), liberal arts & history (59 | 10.8%), and computers & mathematics (46 | 8.4%) are the most common fields of study among 545 individuals in Ligonier borough who have obtained a bachelor's degree or higher.
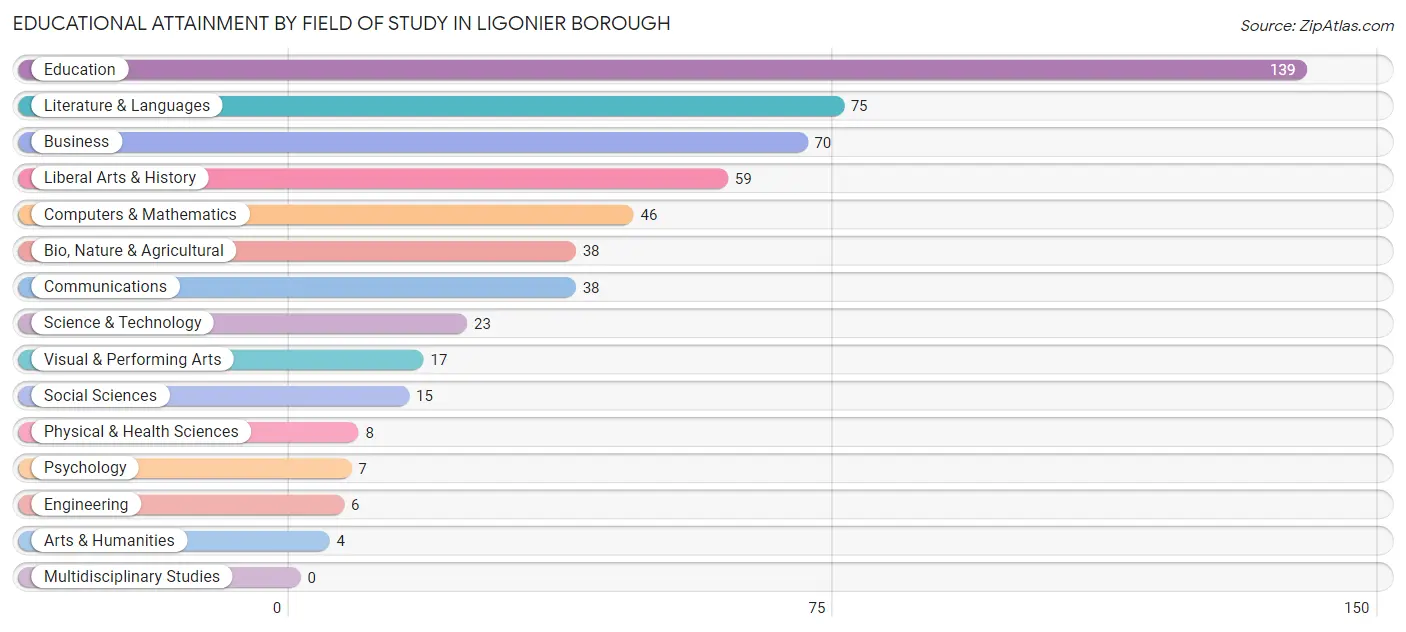
| Field of Study | # Graduates | % Graduates |
| Computers & Mathematics | 46 | 8.4% |
| Bio, Nature & Agricultural | 38 | 7.0% |
| Physical & Health Sciences | 8 | 1.5% |
| Psychology | 7 | 1.3% |
| Social Sciences | 15 | 2.8% |
| Engineering | 6 | 1.1% |
| Multidisciplinary Studies | 0 | 0.0% |
| Science & Technology | 23 | 4.2% |
| Business | 70 | 12.8% |
| Education | 139 | 25.5% |
| Literature & Languages | 75 | 13.8% |
| Liberal Arts & History | 59 | 10.8% |
| Visual & Performing Arts | 17 | 3.1% |
| Communications | 38 | 7.0% |
| Arts & Humanities | 4 | 0.7% |
| Total | 545 | 100.0% |
Transportation & Commute in Ligonier borough
Vehicle Availability by Sex in Ligonier borough
The most prevalent vehicle ownership categories in Ligonier borough are males with 2 vehicles (297, accounting for 68.4%) and females with 2 vehicles (215, making up 81.4%).
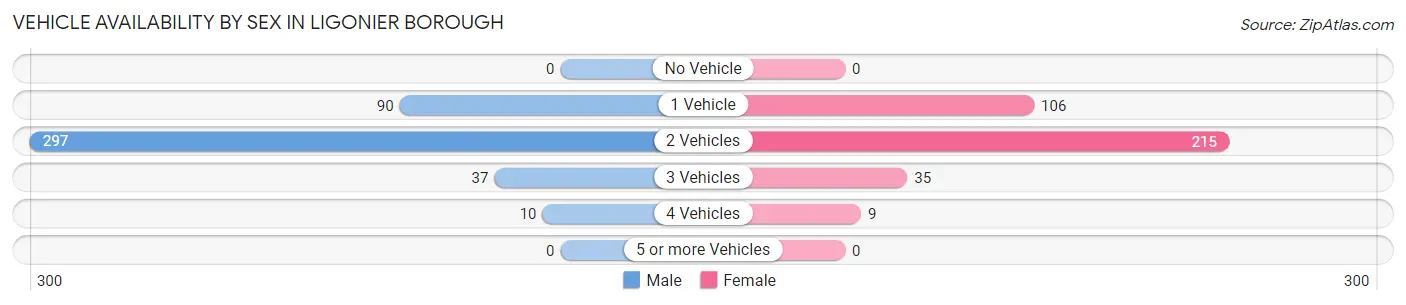
| Vehicles Available | Male | Female |
| No Vehicle | 0 (0.0%) | 0 (0.0%) |
| 1 Vehicle | 90 (20.7%) | 106 (29.0%) |
| 2 Vehicles | 297 (68.4%) | 215 (58.9%) |
| 3 Vehicles | 37 (8.5%) | 35 (9.6%) |
| 4 Vehicles | 10 (2.3%) | 9 (2.5%) |
| 5 or more Vehicles | 0 (0.0%) | 0 (0.0%) |
| Total | 434 (100.0%) | 365 (100.0%) |
Commute Time in Ligonier borough
The most frequently occuring commute durations in Ligonier borough are 5 to 9 minutes (197 commuters, 29.7%), 30 to 34 minutes (95 commuters, 14.3%), and 10 to 14 minutes (87 commuters, 13.1%).
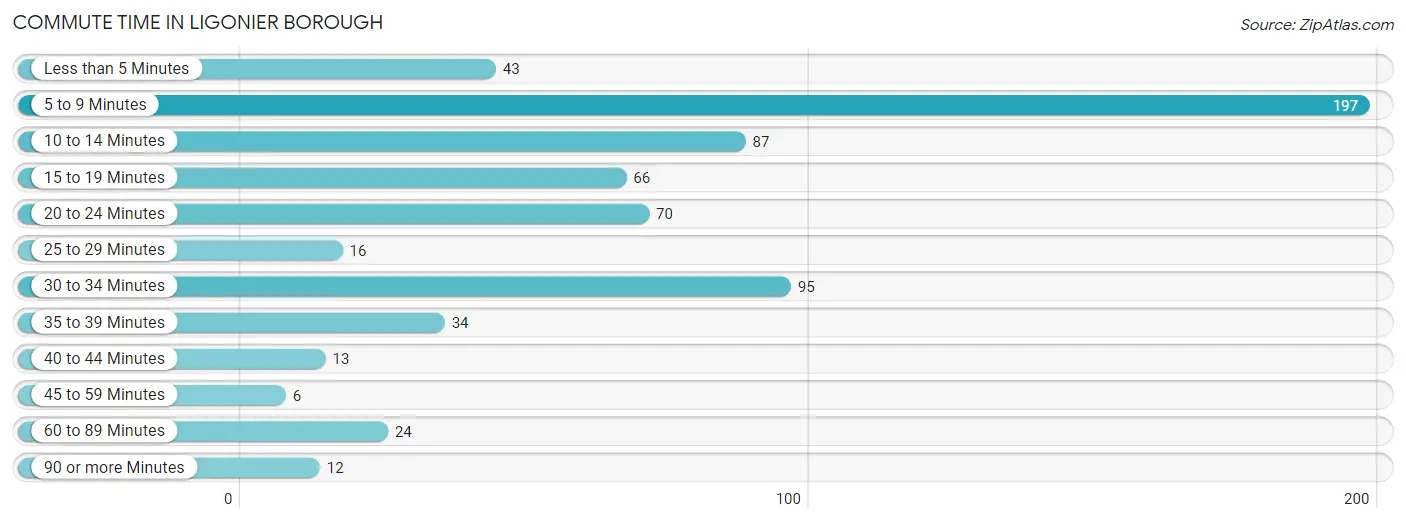
| Commute Time | # Commuters | % Commuters |
| Less than 5 Minutes | 43 | 6.5% |
| 5 to 9 Minutes | 197 | 29.7% |
| 10 to 14 Minutes | 87 | 13.1% |
| 15 to 19 Minutes | 66 | 10.0% |
| 20 to 24 Minutes | 70 | 10.6% |
| 25 to 29 Minutes | 16 | 2.4% |
| 30 to 34 Minutes | 95 | 14.3% |
| 35 to 39 Minutes | 34 | 5.1% |
| 40 to 44 Minutes | 13 | 2.0% |
| 45 to 59 Minutes | 6 | 0.9% |
| 60 to 89 Minutes | 24 | 3.6% |
| 90 or more Minutes | 12 | 1.8% |
Commute Time by Sex in Ligonier borough
The most common commute times in Ligonier borough are 5 to 9 minutes (125 commuters, 33.2%) for males and 5 to 9 minutes (72 commuters, 25.2%) for females.
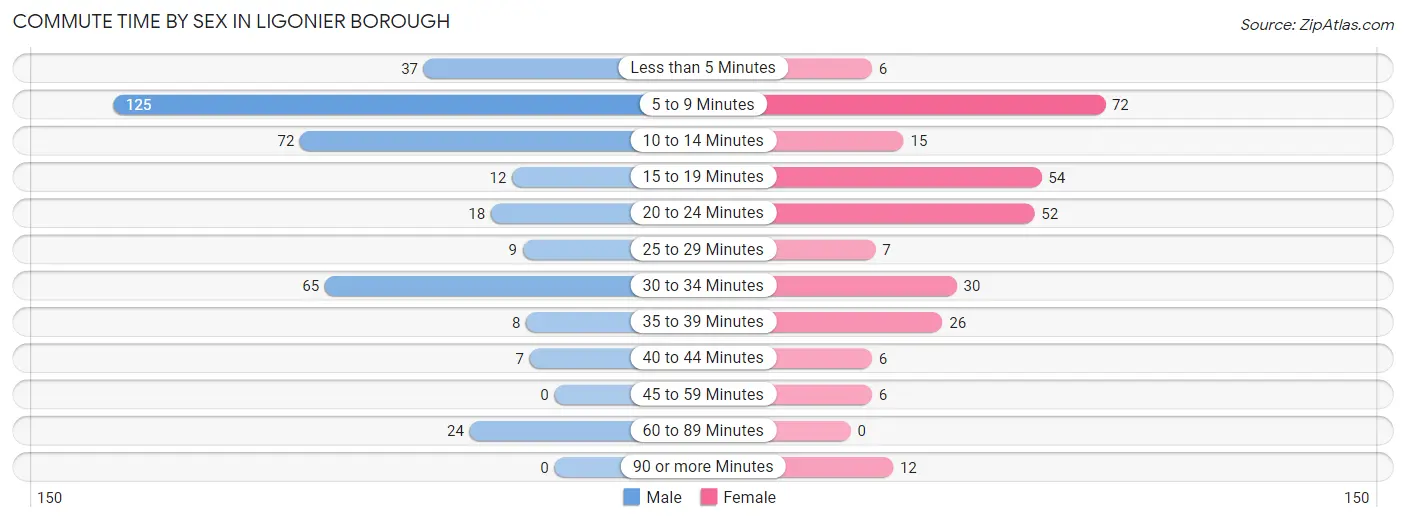
| Commute Time | Male | Female |
| Less than 5 Minutes | 37 (9.8%) | 6 (2.1%) |
| 5 to 9 Minutes | 125 (33.2%) | 72 (25.2%) |
| 10 to 14 Minutes | 72 (19.1%) | 15 (5.2%) |
| 15 to 19 Minutes | 12 (3.2%) | 54 (18.9%) |
| 20 to 24 Minutes | 18 (4.8%) | 52 (18.2%) |
| 25 to 29 Minutes | 9 (2.4%) | 7 (2.5%) |
| 30 to 34 Minutes | 65 (17.2%) | 30 (10.5%) |
| 35 to 39 Minutes | 8 (2.1%) | 26 (9.1%) |
| 40 to 44 Minutes | 7 (1.9%) | 6 (2.1%) |
| 45 to 59 Minutes | 0 (0.0%) | 6 (2.1%) |
| 60 to 89 Minutes | 24 (6.4%) | 0 (0.0%) |
| 90 or more Minutes | 0 (0.0%) | 12 (4.2%) |
Time of Departure to Work by Sex in Ligonier borough
The most frequent times of departure to work in Ligonier borough are 7:30 AM to 7:59 AM (76, 20.2%) for males and 4:00 PM to 11:59 PM (73, 25.5%) for females.
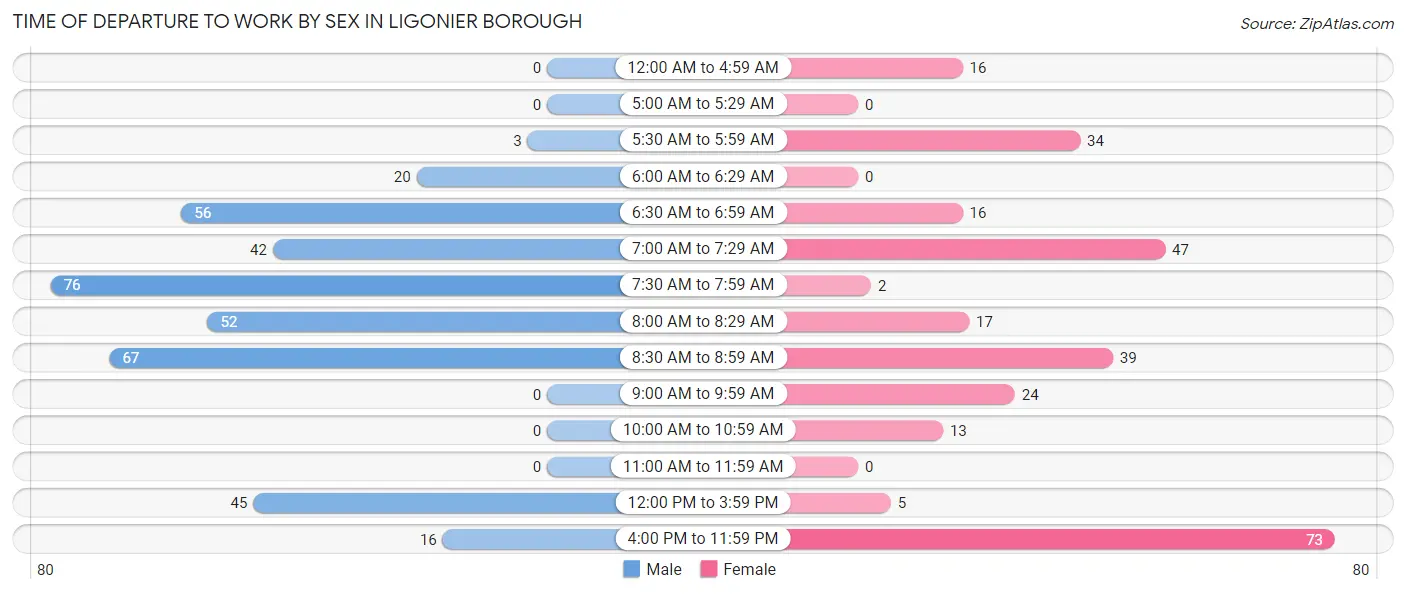
| Time of Departure | Male | Female |
| 12:00 AM to 4:59 AM | 0 (0.0%) | 16 (5.6%) |
| 5:00 AM to 5:29 AM | 0 (0.0%) | 0 (0.0%) |
| 5:30 AM to 5:59 AM | 3 (0.8%) | 34 (11.9%) |
| 6:00 AM to 6:29 AM | 20 (5.3%) | 0 (0.0%) |
| 6:30 AM to 6:59 AM | 56 (14.8%) | 16 (5.6%) |
| 7:00 AM to 7:29 AM | 42 (11.1%) | 47 (16.4%) |
| 7:30 AM to 7:59 AM | 76 (20.2%) | 2 (0.7%) |
| 8:00 AM to 8:29 AM | 52 (13.8%) | 17 (5.9%) |
| 8:30 AM to 8:59 AM | 67 (17.8%) | 39 (13.6%) |
| 9:00 AM to 9:59 AM | 0 (0.0%) | 24 (8.4%) |
| 10:00 AM to 10:59 AM | 0 (0.0%) | 13 (4.5%) |
| 11:00 AM to 11:59 AM | 0 (0.0%) | 0 (0.0%) |
| 12:00 PM to 3:59 PM | 45 (11.9%) | 5 (1.8%) |
| 4:00 PM to 11:59 PM | 16 (4.2%) | 73 (25.5%) |
| Total | 377 (100.0%) | 286 (100.0%) |
Housing Occupancy in Ligonier borough
Occupancy by Ownership in Ligonier borough
Of the total 776 dwellings in Ligonier borough, owner-occupied units account for 509 (65.6%), while renter-occupied units make up 267 (34.4%).
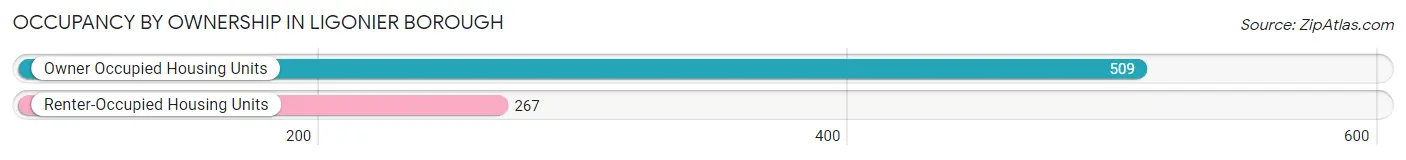
| Occupancy | # Housing Units | % Housing Units |
| Owner Occupied Housing Units | 509 | 65.6% |
| Renter-Occupied Housing Units | 267 | 34.4% |
| Total Occupied Housing Units | 776 | 100.0% |
Occupancy by Household Size in Ligonier borough
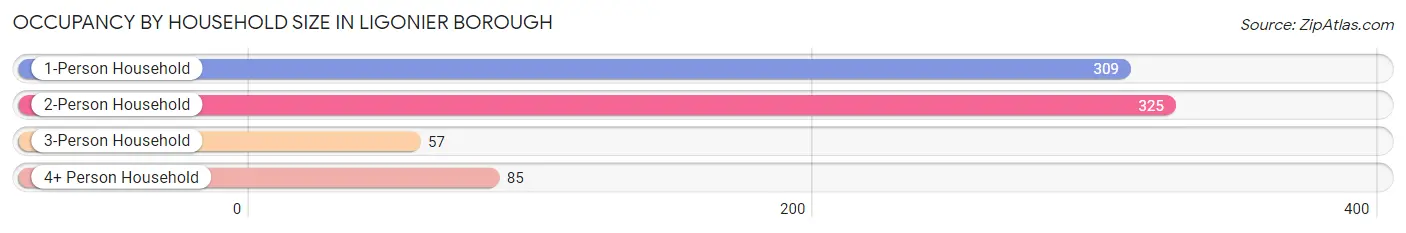
| Household Size | # Housing Units | % Housing Units |
| 1-Person Household | 309 | 39.8% |
| 2-Person Household | 325 | 41.9% |
| 3-Person Household | 57 | 7.3% |
| 4+ Person Household | 85 | 11.0% |
| Total Housing Units | 776 | 100.0% |
Occupancy by Ownership by Household Size in Ligonier borough
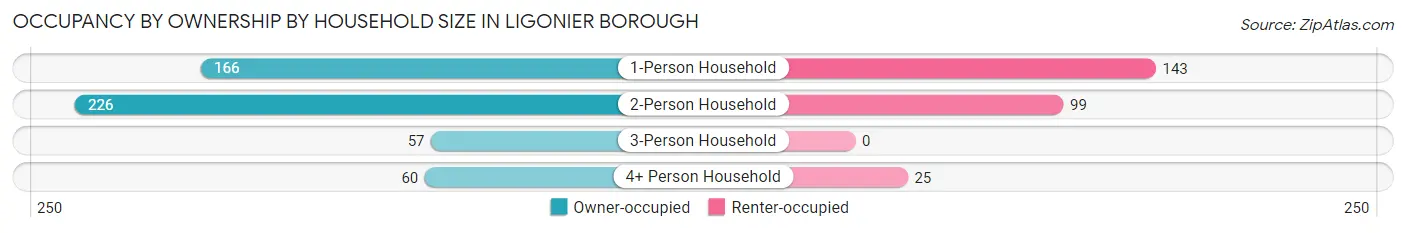
| Household Size | Owner-occupied | Renter-occupied |
| 1-Person Household | 166 (53.7%) | 143 (46.3%) |
| 2-Person Household | 226 (69.5%) | 99 (30.5%) |
| 3-Person Household | 57 (100.0%) | 0 (0.0%) |
| 4+ Person Household | 60 (70.6%) | 25 (29.4%) |
| Total Housing Units | 509 (65.6%) | 267 (34.4%) |
Occupancy by Educational Attainment in Ligonier borough
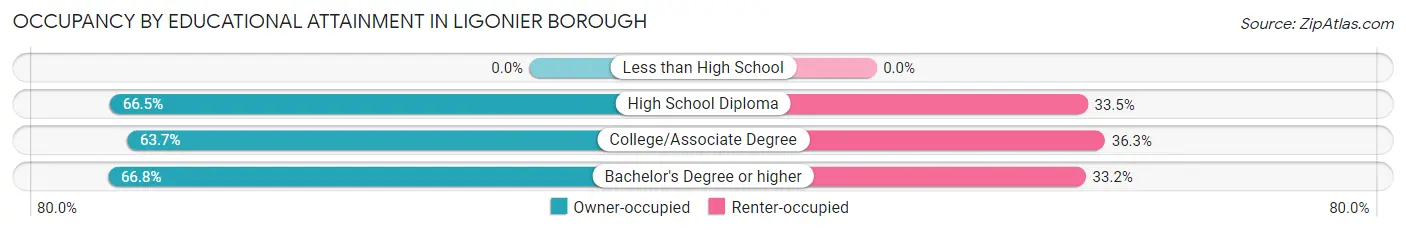
| Household Size | Owner-occupied | Renter-occupied |
| Less than High School | 0 (0.0%) | 0 (0.0%) |
| High School Diploma | 117 (66.5%) | 59 (33.5%) |
| College/Associate Degree | 181 (63.7%) | 103 (36.3%) |
| Bachelor's Degree or higher | 211 (66.8%) | 105 (33.2%) |
Occupancy by Age of Householder in Ligonier borough
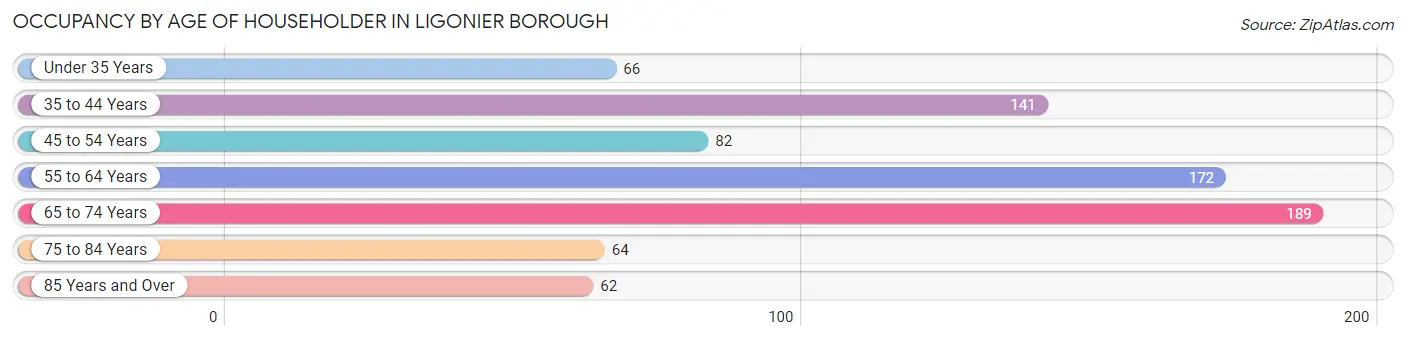
| Age Bracket | # Households | % Households |
| Under 35 Years | 66 | 8.5% |
| 35 to 44 Years | 141 | 18.2% |
| 45 to 54 Years | 82 | 10.6% |
| 55 to 64 Years | 172 | 22.2% |
| 65 to 74 Years | 189 | 24.4% |
| 75 to 84 Years | 64 | 8.3% |
| 85 Years and Over | 62 | 8.0% |
| Total | 776 | 100.0% |
Housing Finances in Ligonier borough
Median Income by Occupancy in Ligonier borough
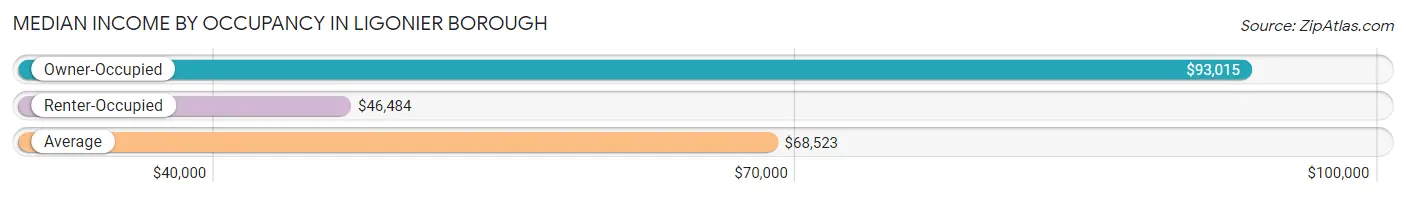
| Occupancy Type | # Households | Median Income |
| Owner-Occupied | 509 (65.6%) | $93,015 |
| Renter-Occupied | 267 (34.4%) | $46,484 |
| Average | 776 (100.0%) | $68,523 |
Occupancy by Householder Income Bracket in Ligonier borough
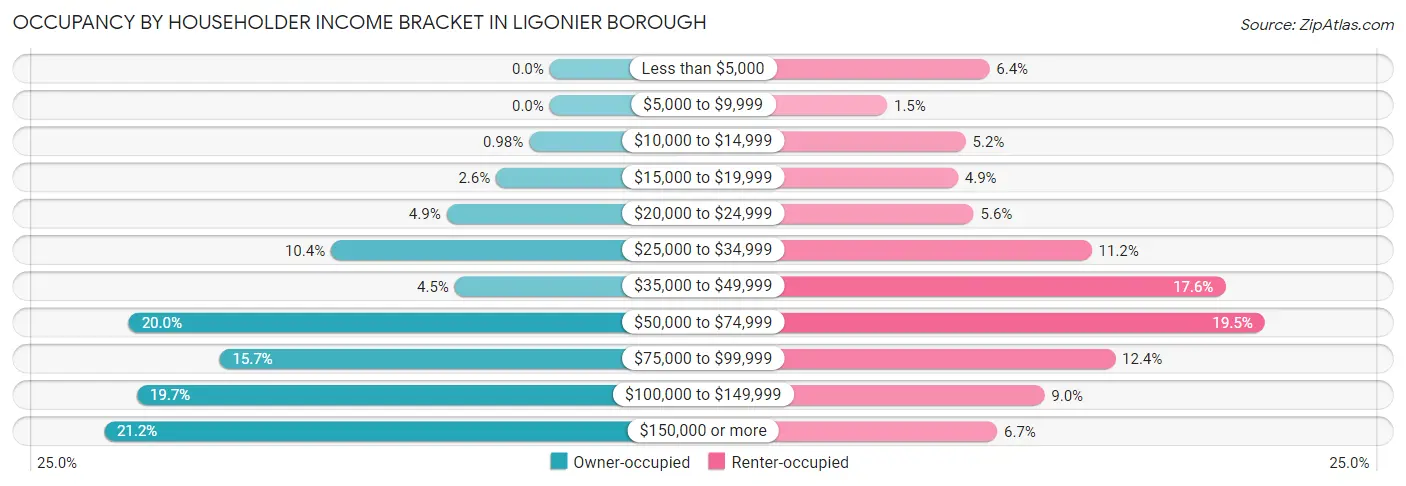
| Income Bracket | Owner-occupied | Renter-occupied |
| Less than $5,000 | 0 (0.0%) | 17 (6.4%) |
| $5,000 to $9,999 | 0 (0.0%) | 4 (1.5%) |
| $10,000 to $14,999 | 5 (1.0%) | 14 (5.2%) |
| $15,000 to $19,999 | 13 (2.5%) | 13 (4.9%) |
| $20,000 to $24,999 | 25 (4.9%) | 15 (5.6%) |
| $25,000 to $34,999 | 53 (10.4%) | 30 (11.2%) |
| $35,000 to $49,999 | 23 (4.5%) | 47 (17.6%) |
| $50,000 to $74,999 | 102 (20.0%) | 52 (19.5%) |
| $75,000 to $99,999 | 80 (15.7%) | 33 (12.4%) |
| $100,000 to $149,999 | 100 (19.7%) | 24 (9.0%) |
| $150,000 or more | 108 (21.2%) | 18 (6.7%) |
| Total | 509 (100.0%) | 267 (100.0%) |
Monthly Housing Cost Tiers in Ligonier borough
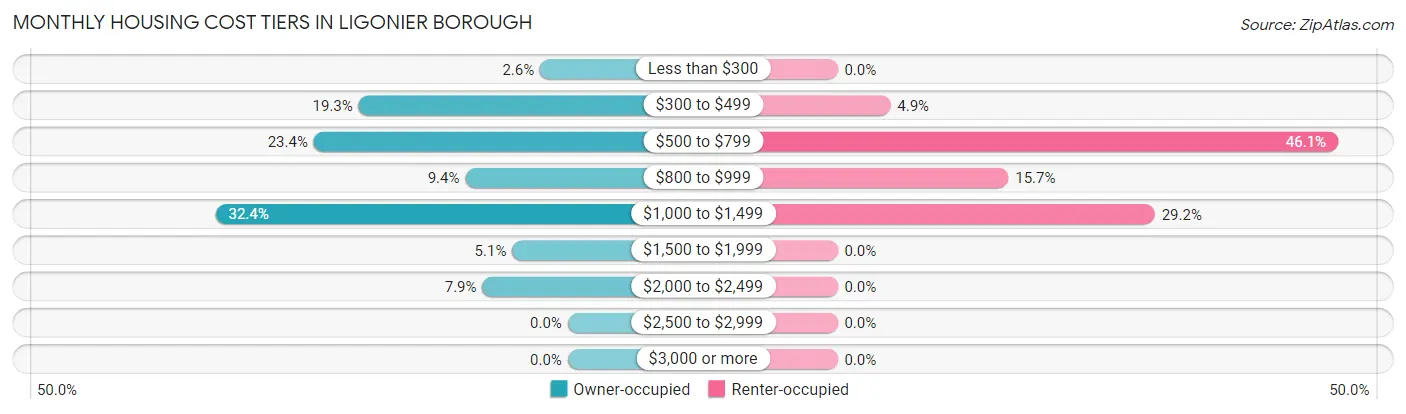
| Monthly Cost | Owner-occupied | Renter-occupied |
| Less than $300 | 13 (2.5%) | 0 (0.0%) |
| $300 to $499 | 98 (19.3%) | 13 (4.9%) |
| $500 to $799 | 119 (23.4%) | 123 (46.1%) |
| $800 to $999 | 48 (9.4%) | 42 (15.7%) |
| $1,000 to $1,499 | 165 (32.4%) | 78 (29.2%) |
| $1,500 to $1,999 | 26 (5.1%) | 0 (0.0%) |
| $2,000 to $2,499 | 40 (7.9%) | 0 (0.0%) |
| $2,500 to $2,999 | 0 (0.0%) | 0 (0.0%) |
| $3,000 or more | 0 (0.0%) | 0 (0.0%) |
| Total | 509 (100.0%) | 267 (100.0%) |
Physical Housing Characteristics in Ligonier borough
Housing Structures in Ligonier borough
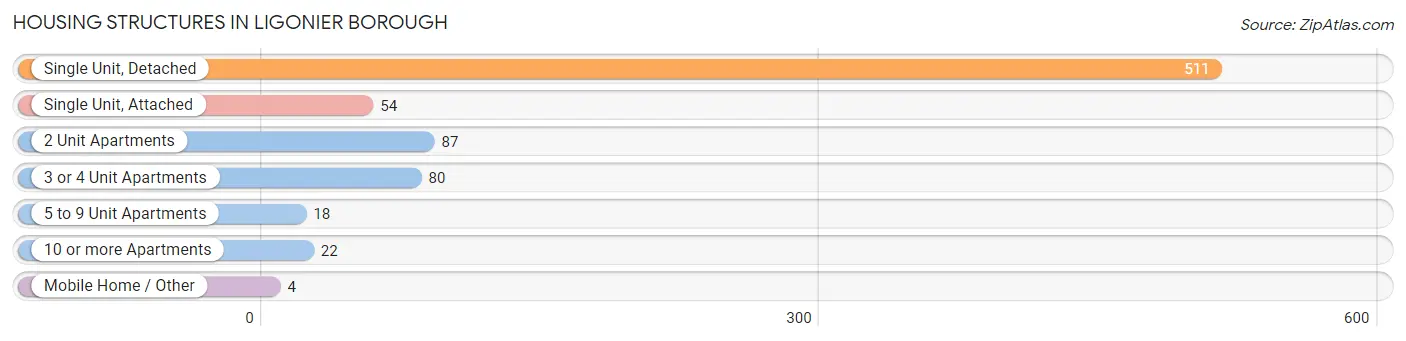
| Structure Type | # Housing Units | % Housing Units |
| Single Unit, Detached | 511 | 65.8% |
| Single Unit, Attached | 54 | 7.0% |
| 2 Unit Apartments | 87 | 11.2% |
| 3 or 4 Unit Apartments | 80 | 10.3% |
| 5 to 9 Unit Apartments | 18 | 2.3% |
| 10 or more Apartments | 22 | 2.8% |
| Mobile Home / Other | 4 | 0.5% |
| Total | 776 | 100.0% |
Housing Structures by Occupancy in Ligonier borough
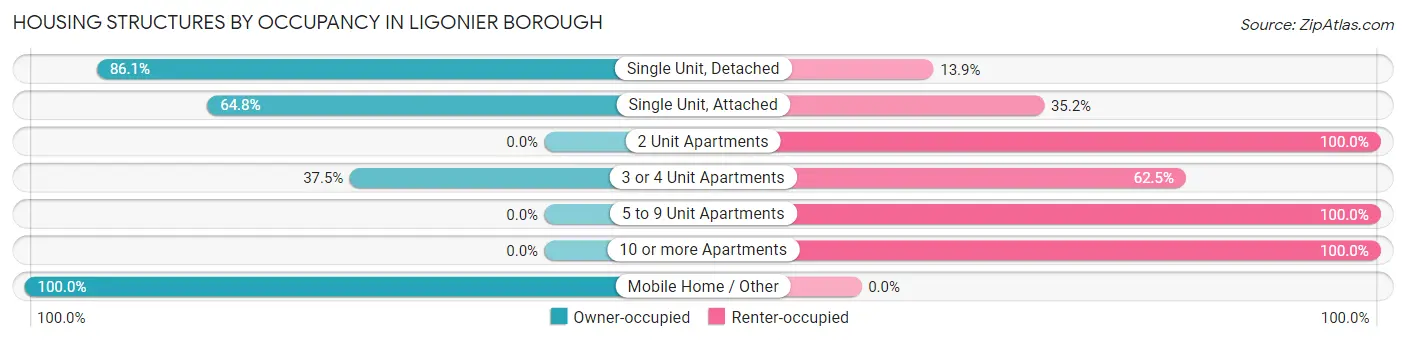
| Structure Type | Owner-occupied | Renter-occupied |
| Single Unit, Detached | 440 (86.1%) | 71 (13.9%) |
| Single Unit, Attached | 35 (64.8%) | 19 (35.2%) |
| 2 Unit Apartments | 0 (0.0%) | 87 (100.0%) |
| 3 or 4 Unit Apartments | 30 (37.5%) | 50 (62.5%) |
| 5 to 9 Unit Apartments | 0 (0.0%) | 18 (100.0%) |
| 10 or more Apartments | 0 (0.0%) | 22 (100.0%) |
| Mobile Home / Other | 4 (100.0%) | 0 (0.0%) |
| Total | 509 (65.6%) | 267 (34.4%) |
Housing Structures by Number of Rooms in Ligonier borough
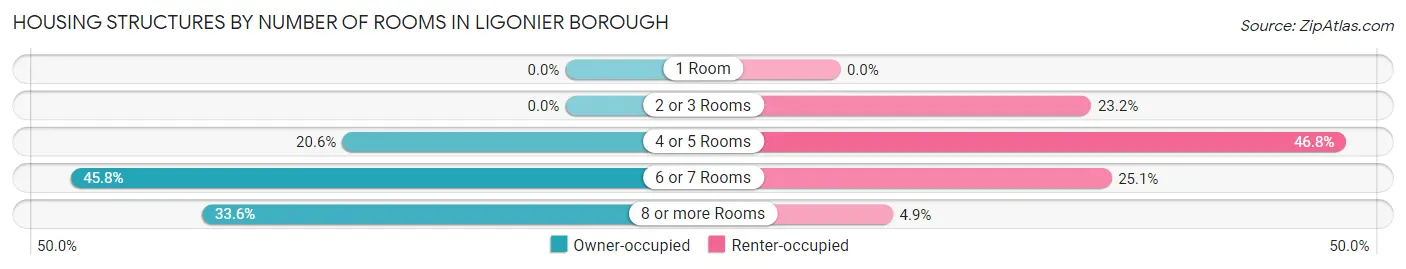
| Number of Rooms | Owner-occupied | Renter-occupied |
| 1 Room | 0 (0.0%) | 0 (0.0%) |
| 2 or 3 Rooms | 0 (0.0%) | 62 (23.2%) |
| 4 or 5 Rooms | 105 (20.6%) | 125 (46.8%) |
| 6 or 7 Rooms | 233 (45.8%) | 67 (25.1%) |
| 8 or more Rooms | 171 (33.6%) | 13 (4.9%) |
| Total | 509 (100.0%) | 267 (100.0%) |
Housing Structure by Heating Type in Ligonier borough
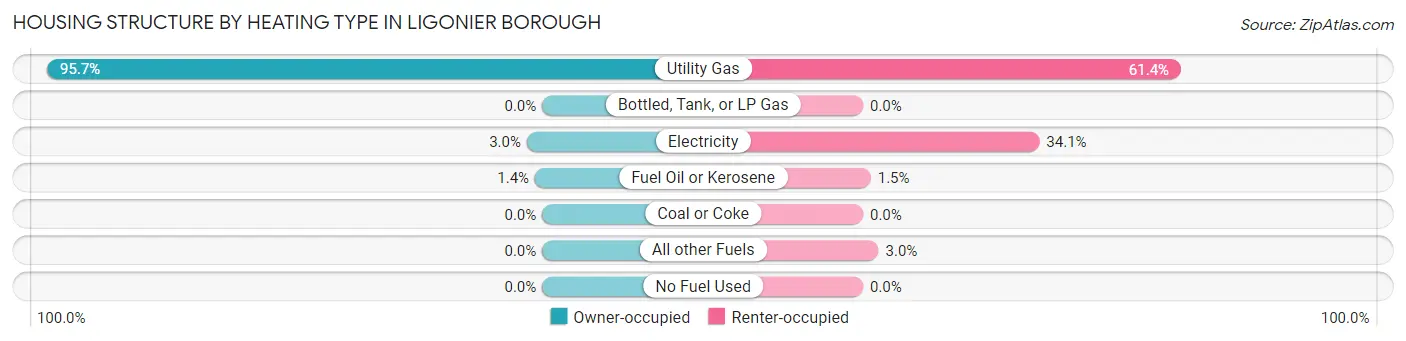
| Heating Type | Owner-occupied | Renter-occupied |
| Utility Gas | 487 (95.7%) | 164 (61.4%) |
| Bottled, Tank, or LP Gas | 0 (0.0%) | 0 (0.0%) |
| Electricity | 15 (2.9%) | 91 (34.1%) |
| Fuel Oil or Kerosene | 7 (1.4%) | 4 (1.5%) |
| Coal or Coke | 0 (0.0%) | 0 (0.0%) |
| All other Fuels | 0 (0.0%) | 8 (3.0%) |
| No Fuel Used | 0 (0.0%) | 0 (0.0%) |
| Total | 509 (100.0%) | 267 (100.0%) |
Household Vehicle Usage in Ligonier borough
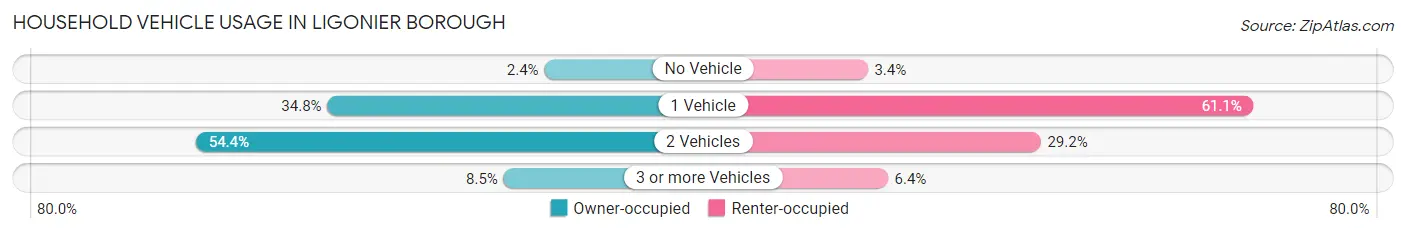
| Vehicles per Household | Owner-occupied | Renter-occupied |
| No Vehicle | 12 (2.4%) | 9 (3.4%) |
| 1 Vehicle | 177 (34.8%) | 163 (61.1%) |
| 2 Vehicles | 277 (54.4%) | 78 (29.2%) |
| 3 or more Vehicles | 43 (8.5%) | 17 (6.4%) |
| Total | 509 (100.0%) | 267 (100.0%) |
Real Estate & Mortgages in Ligonier borough
Real Estate and Mortgage Overview in Ligonier borough
| Characteristic | Without Mortgage | With Mortgage |
| Housing Units | 235 | 274 |
| Median Property Value | $216,400 | $209,600 |
| Median Household Income | $55,114 | $65 |
| Monthly Housing Costs | $519 | $0 |
| Real Estate Taxes | $2,186 | $10 |
Property Value by Mortgage Status in Ligonier borough
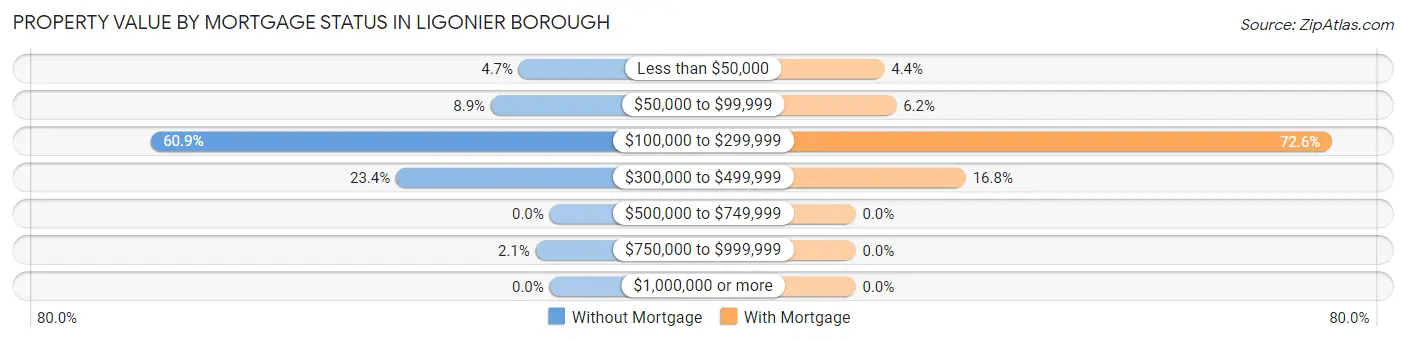
| Property Value | Without Mortgage | With Mortgage |
| Less than $50,000 | 11 (4.7%) | 12 (4.4%) |
| $50,000 to $99,999 | 21 (8.9%) | 17 (6.2%) |
| $100,000 to $299,999 | 143 (60.9%) | 199 (72.6%) |
| $300,000 to $499,999 | 55 (23.4%) | 46 (16.8%) |
| $500,000 to $749,999 | 0 (0.0%) | 0 (0.0%) |
| $750,000 to $999,999 | 5 (2.1%) | 0 (0.0%) |
| $1,000,000 or more | 0 (0.0%) | 0 (0.0%) |
| Total | 235 (100.0%) | 274 (100.0%) |
Household Income by Mortgage Status in Ligonier borough
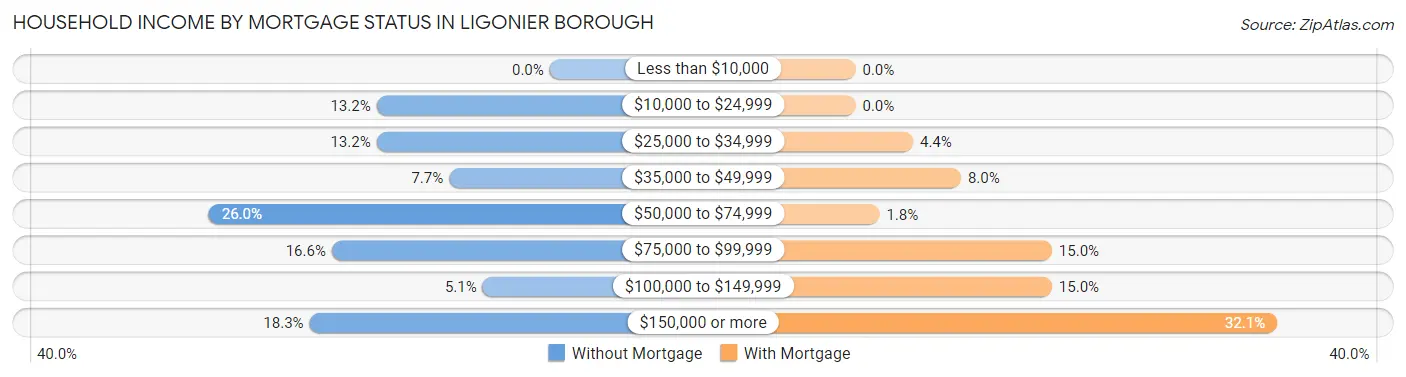
| Household Income | Without Mortgage | With Mortgage |
| Less than $10,000 | 0 (0.0%) | 0 (0.0%) |
| $10,000 to $24,999 | 31 (13.2%) | 0 (0.0%) |
| $25,000 to $34,999 | 31 (13.2%) | 12 (4.4%) |
| $35,000 to $49,999 | 18 (7.7%) | 22 (8.0%) |
| $50,000 to $74,999 | 61 (26.0%) | 5 (1.8%) |
| $75,000 to $99,999 | 39 (16.6%) | 41 (15.0%) |
| $100,000 to $149,999 | 12 (5.1%) | 41 (15.0%) |
| $150,000 or more | 43 (18.3%) | 88 (32.1%) |
| Total | 235 (100.0%) | 274 (100.0%) |
Property Value to Household Income Ratio in Ligonier borough
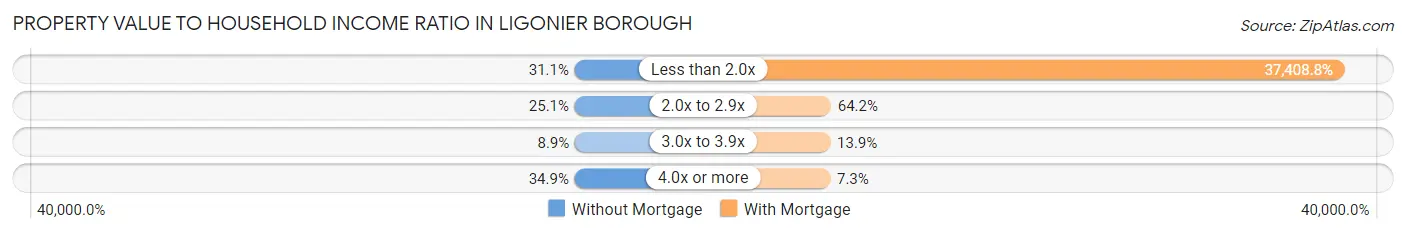
| Value-to-Income Ratio | Without Mortgage | With Mortgage |
| Less than 2.0x | 73 (31.1%) | 102,500 (37,408.8%) |
| 2.0x to 2.9x | 59 (25.1%) | 176 (64.2%) |
| 3.0x to 3.9x | 21 (8.9%) | 38 (13.9%) |
| 4.0x or more | 82 (34.9%) | 20 (7.3%) |
| Total | 235 (100.0%) | 274 (100.0%) |
Real Estate Taxes by Mortgage Status in Ligonier borough
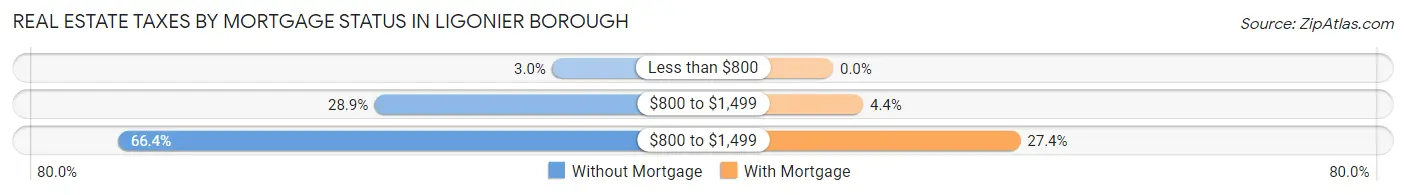
| Property Taxes | Without Mortgage | With Mortgage |
| Less than $800 | 7 (3.0%) | 0 (0.0%) |
| $800 to $1,499 | 68 (28.9%) | 12 (4.4%) |
| $800 to $1,499 | 156 (66.4%) | 75 (27.4%) |
| Total | 235 (100.0%) | 274 (100.0%) |
Health & Disability in Ligonier borough
Health Insurance Coverage by Age in Ligonier borough
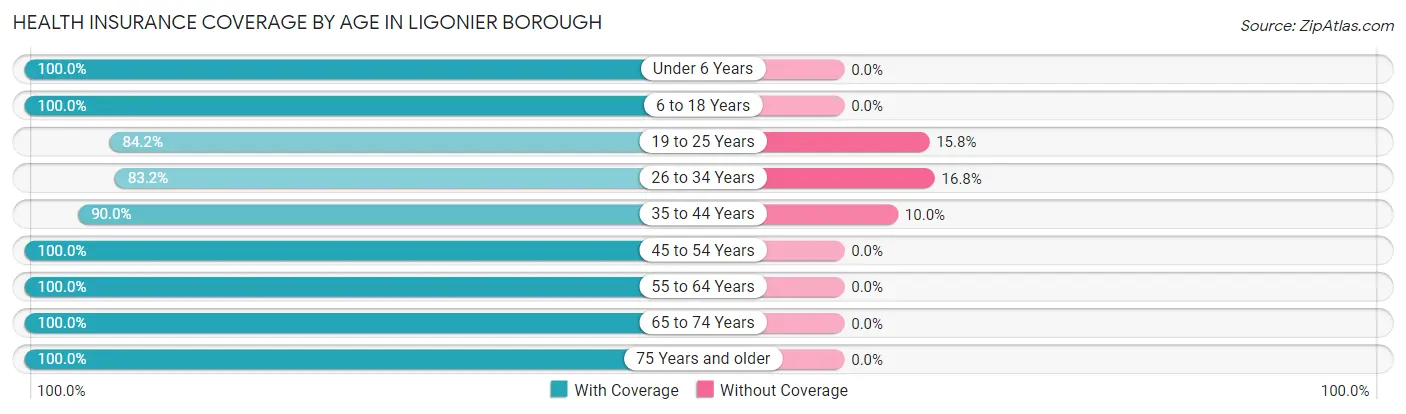
| Age Bracket | With Coverage | Without Coverage |
| Under 6 Years | 43 (100.0%) | 0 (0.0%) |
| 6 to 18 Years | 148 (100.0%) | 0 (0.0%) |
| 19 to 25 Years | 85 (84.2%) | 16 (15.8%) |
| 26 to 34 Years | 79 (83.2%) | 16 (16.8%) |
| 35 to 44 Years | 207 (90.0%) | 23 (10.0%) |
| 45 to 54 Years | 152 (100.0%) | 0 (0.0%) |
| 55 to 64 Years | 245 (100.0%) | 0 (0.0%) |
| 65 to 74 Years | 311 (100.0%) | 0 (0.0%) |
| 75 Years and older | 185 (100.0%) | 0 (0.0%) |
| Total | 1,455 (96.4%) | 55 (3.6%) |
Health Insurance Coverage by Citizenship Status in Ligonier borough
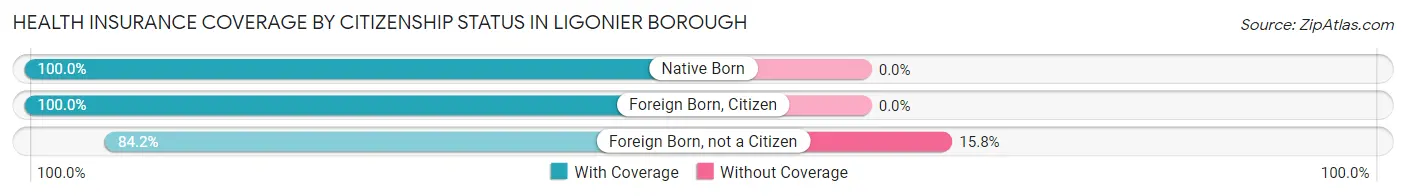
| Citizenship Status | With Coverage | Without Coverage |
| Native Born | 43 (100.0%) | 0 (0.0%) |
| Foreign Born, Citizen | 148 (100.0%) | 0 (0.0%) |
| Foreign Born, not a Citizen | 85 (84.2%) | 16 (15.8%) |
Health Insurance Coverage by Household Income in Ligonier borough
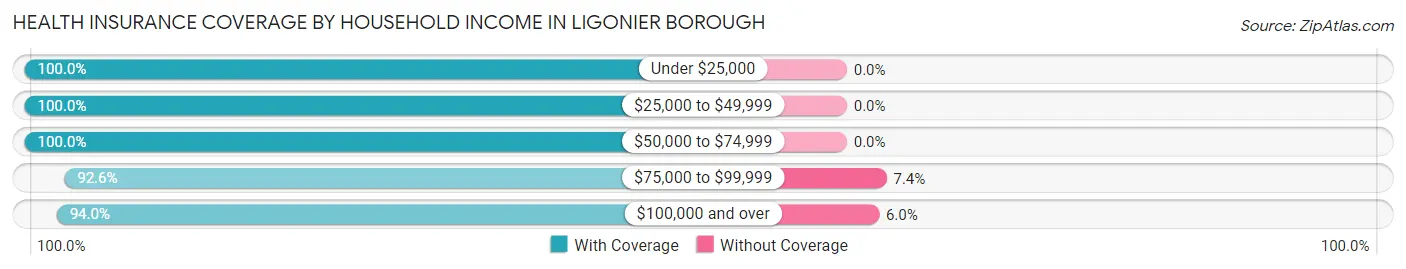
| Household Income | With Coverage | Without Coverage |
| Under $25,000 | 152 (100.0%) | 0 (0.0%) |
| $25,000 to $49,999 | 222 (100.0%) | 0 (0.0%) |
| $50,000 to $74,999 | 273 (100.0%) | 0 (0.0%) |
| $75,000 to $99,999 | 199 (92.6%) | 16 (7.4%) |
| $100,000 and over | 609 (94.0%) | 39 (6.0%) |
Public vs Private Health Insurance Coverage by Age in Ligonier borough
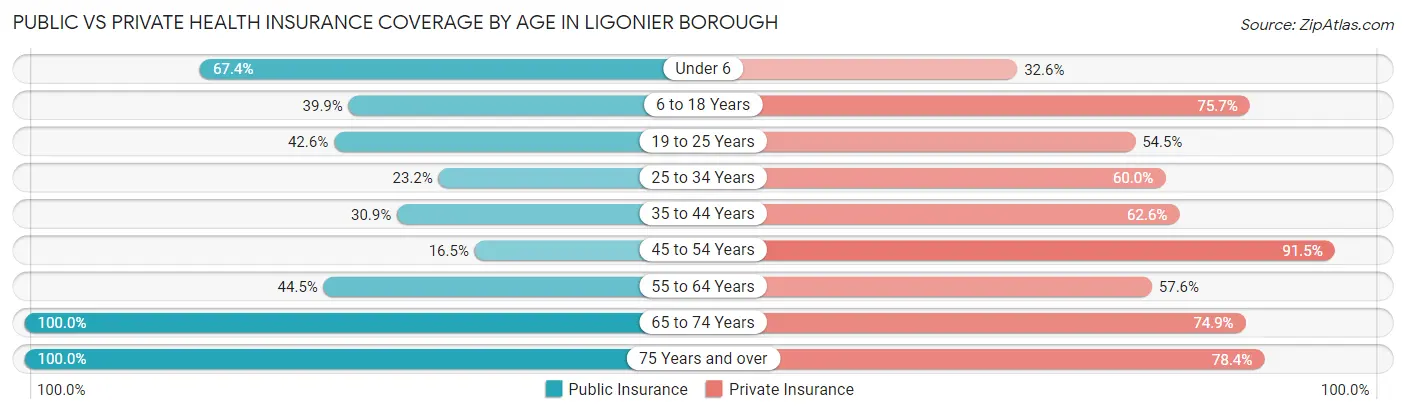
| Age Bracket | Public Insurance | Private Insurance |
| Under 6 | 29 (67.4%) | 14 (32.6%) |
| 6 to 18 Years | 59 (39.9%) | 112 (75.7%) |
| 19 to 25 Years | 43 (42.6%) | 55 (54.5%) |
| 25 to 34 Years | 22 (23.2%) | 57 (60.0%) |
| 35 to 44 Years | 71 (30.9%) | 144 (62.6%) |
| 45 to 54 Years | 25 (16.5%) | 139 (91.4%) |
| 55 to 64 Years | 109 (44.5%) | 141 (57.6%) |
| 65 to 74 Years | 311 (100.0%) | 233 (74.9%) |
| 75 Years and over | 185 (100.0%) | 145 (78.4%) |
| Total | 854 (56.6%) | 1,040 (68.9%) |
Disability Status by Sex by Age in Ligonier borough
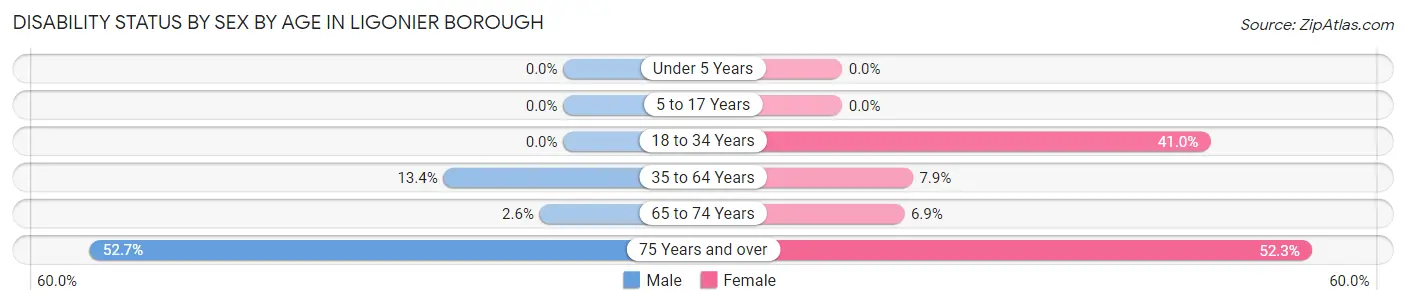
| Age Bracket | Male | Female |
| Under 5 Years | 0 (0.0%) | 0 (0.0%) |
| 5 to 17 Years | 0 (0.0%) | 0 (0.0%) |
| 18 to 34 Years | 0 (0.0%) | 41 (41.0%) |
| 35 to 64 Years | 43 (13.4%) | 24 (7.9%) |
| 65 to 74 Years | 4 (2.6%) | 11 (6.9%) |
| 75 Years and over | 29 (52.7%) | 68 (52.3%) |
Disability Class by Sex by Age in Ligonier borough
Disability Class: Hearing Difficulty
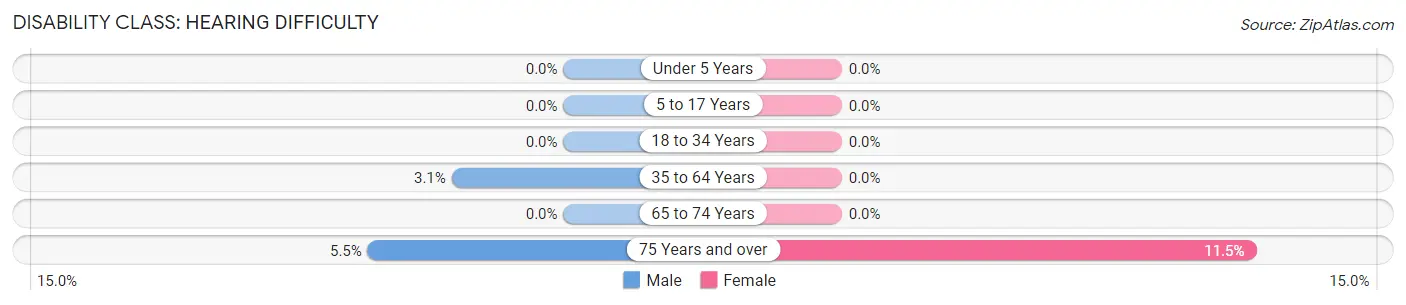
| Age Bracket | Male | Female |
| Under 5 Years | 0 (0.0%) | 0 (0.0%) |
| 5 to 17 Years | 0 (0.0%) | 0 (0.0%) |
| 18 to 34 Years | 0 (0.0%) | 0 (0.0%) |
| 35 to 64 Years | 10 (3.1%) | 0 (0.0%) |
| 65 to 74 Years | 0 (0.0%) | 0 (0.0%) |
| 75 Years and over | 3 (5.4%) | 15 (11.5%) |
Disability Class: Vision Difficulty
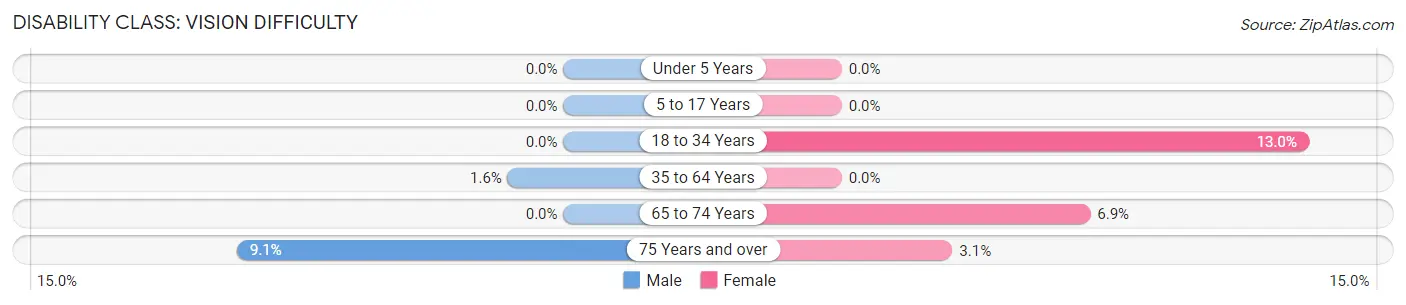
| Age Bracket | Male | Female |
| Under 5 Years | 0 (0.0%) | 0 (0.0%) |
| 5 to 17 Years | 0 (0.0%) | 0 (0.0%) |
| 18 to 34 Years | 0 (0.0%) | 13 (13.0%) |
| 35 to 64 Years | 5 (1.5%) | 0 (0.0%) |
| 65 to 74 Years | 0 (0.0%) | 11 (6.9%) |
| 75 Years and over | 5 (9.1%) | 4 (3.1%) |
Disability Class: Cognitive Difficulty
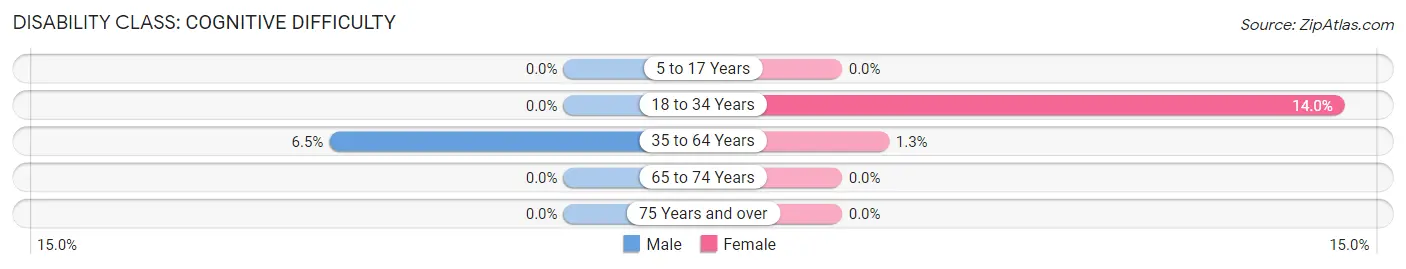
| Age Bracket | Male | Female |
| 5 to 17 Years | 0 (0.0%) | 0 (0.0%) |
| 18 to 34 Years | 0 (0.0%) | 14 (14.0%) |
| 35 to 64 Years | 21 (6.5%) | 4 (1.3%) |
| 65 to 74 Years | 0 (0.0%) | 0 (0.0%) |
| 75 Years and over | 0 (0.0%) | 0 (0.0%) |
Disability Class: Ambulatory Difficulty
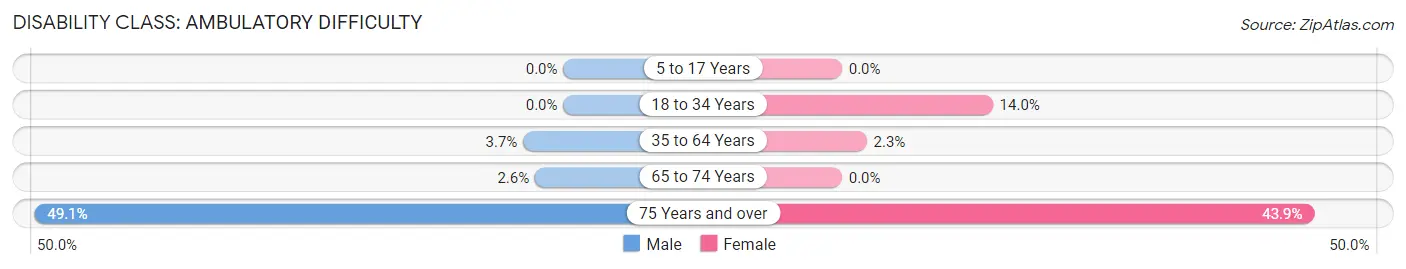
| Age Bracket | Male | Female |
| 5 to 17 Years | 0 (0.0%) | 0 (0.0%) |
| 18 to 34 Years | 0 (0.0%) | 14 (14.0%) |
| 35 to 64 Years | 12 (3.7%) | 7 (2.3%) |
| 65 to 74 Years | 4 (2.6%) | 0 (0.0%) |
| 75 Years and over | 27 (49.1%) | 57 (43.9%) |
Disability Class: Self-Care Difficulty
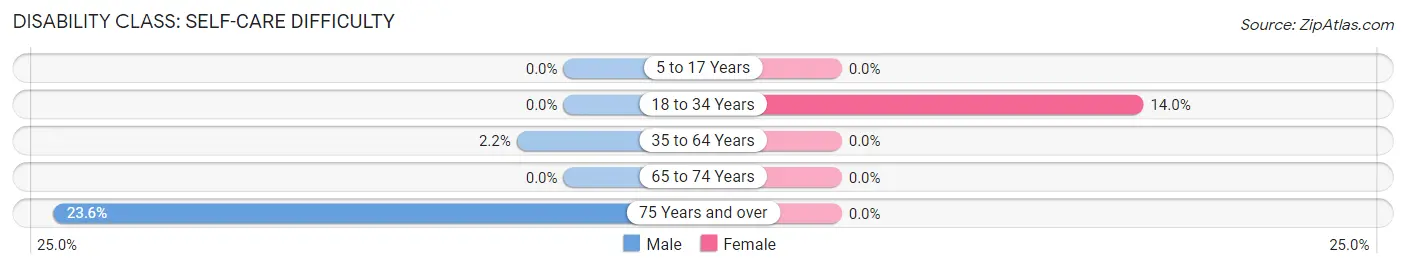
| Age Bracket | Male | Female |
| 5 to 17 Years | 0 (0.0%) | 0 (0.0%) |
| 18 to 34 Years | 0 (0.0%) | 14 (14.0%) |
| 35 to 64 Years | 7 (2.2%) | 0 (0.0%) |
| 65 to 74 Years | 0 (0.0%) | 0 (0.0%) |
| 75 Years and over | 13 (23.6%) | 0 (0.0%) |
Technology Access in Ligonier borough
Computing Device Access in Ligonier borough
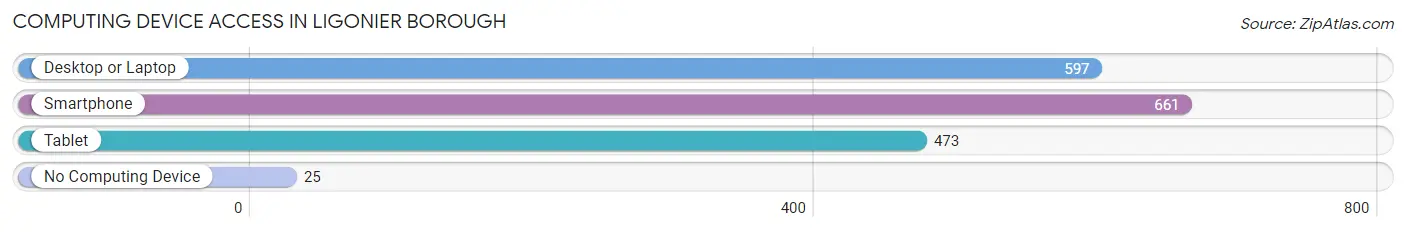
| Device Type | # Households | % Households |
| Desktop or Laptop | 597 | 76.9% |
| Smartphone | 661 | 85.2% |
| Tablet | 473 | 61.0% |
| No Computing Device | 25 | 3.2% |
| Total | 776 | 100.0% |
Internet Access in Ligonier borough
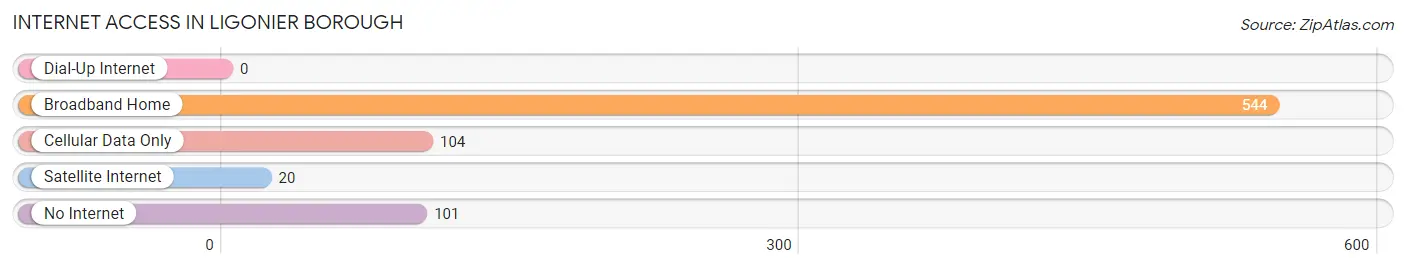
| Internet Type | # Households | % Households |
| Dial-Up Internet | 0 | 0.0% |
| Broadband Home | 544 | 70.1% |
| Cellular Data Only | 104 | 13.4% |
| Satellite Internet | 20 | 2.6% |
| No Internet | 101 | 13.0% |
| Total | 776 | 100.0% |
Ligonier borough Summary
Ligonier Borough is a small borough located in Westmoreland County, Pennsylvania. It is situated in the Laurel Highlands region of the state, approximately 40 miles east of Pittsburgh. The borough is home to a population of approximately 1,500 people and is known for its picturesque downtown area, which is listed on the National Register of Historic Places.
History
The area that is now Ligonier Borough was first settled in 1758 by James and John Ligonier, two brothers from Scotland. The brothers purchased the land from the Iroquois Indians and established a trading post. The area was known as Ligonier Valley, and the brothers built a log cabin and a grist mill. The area quickly grew, and in 1799, the borough was officially incorporated.
In the early 19th century, the borough became a popular destination for wealthy families from Pittsburgh and Philadelphia. The area was known for its natural beauty and its mineral springs, which were believed to have healing properties. The town was also home to several resorts, including the Ligonier Hotel, which was built in 1820.
In the late 19th century, the borough became a popular tourist destination. The town was home to several hotels, including the Ligonier Inn, which was built in 1891. The town also had several attractions, including a zoo, a golf course, and a casino.
Geography
Ligonier Borough is located in Westmoreland County, Pennsylvania. It is situated in the Laurel Highlands region of the state, approximately 40 miles east of Pittsburgh. The borough is bordered by the townships of Ligonier, Fairfield, and Donegal. The borough is situated in a valley, surrounded by rolling hills and forests. The borough is home to several parks, including Idlewild Park, which is the largest amusement park in Pennsylvania.
Economy
The economy of Ligonier Borough is largely based on tourism. The borough is home to several attractions, including Idlewild Park, which is the largest amusement park in Pennsylvania. The town is also home to several resorts, including the Ligonier Inn, which was built in 1891. The town also has several restaurants, shops, and galleries.
Demographics
As of the 2010 census, the population of Ligonier Borough was 1,541. The racial makeup of the borough was 97.3% White, 0.7% African American, 0.2% Native American, 0.4% Asian, 0.1% Pacific Islander, 0.3% from other races, and 1.0% from two or more races. Hispanic or Latino of any race were 1.2% of the population.
The median household income in Ligonier Borough was $45,938, and the median family income was $51,964. The per capita income for the borough was $22,945. About 8.3% of families and 10.2% of the population were below the poverty line, including 14.2% of those under age 18 and 5.2% of those age 65 or over.
Common Questions
What is Per Capita Income in Ligonier borough?
Per Capita income in Ligonier borough is $54,940.
What is the Median Family Income in Ligonier borough?
Median Family Income in Ligonier borough is $96,292.
What is the Median Household income in Ligonier borough?
Median Household Income in Ligonier borough is $68,523.
What is Income or Wage Gap in Ligonier borough?
Income or Wage Gap in Ligonier borough is 19.8%.
Women in Ligonier borough earn 80.2 cents for every dollar earned by a man.
What is Inequality or Gini Index in Ligonier borough?
Inequality or Gini Index in Ligonier borough is 0.48.
What is the Total Population of Ligonier borough?
Total Population of Ligonier borough is 1,510.
What is the Total Male Population of Ligonier borough?
Total Male Population of Ligonier borough is 718.
What is the Total Female Population of Ligonier borough?
Total Female Population of Ligonier borough is 792.
What is the Ratio of Males per 100 Females in Ligonier borough?
There are 90.66 Males per 100 Females in Ligonier borough.
What is the Ratio of Females per 100 Males in Ligonier borough?
There are 110.31 Females per 100 Males in Ligonier borough.
What is the Median Population Age in Ligonier borough?
Median Population Age in Ligonier borough is 54.2 Years.
What is the Average Family Size in Ligonier borough
Average Family Size in Ligonier borough is 2.6 People.
What is the Average Household Size in Ligonier borough
Average Household Size in Ligonier borough is 1.9 People.
How Large is the Labor Force in Ligonier borough?
There are 857 People in the Labor Forcein in Ligonier borough.
What is the Percentage of People in the Labor Force in Ligonier borough?
63.2% of People are in the Labor Force in Ligonier borough.
What is the Unemployment Rate in Ligonier borough?
Unemployment Rate in Ligonier borough is 3.3%.