Lewistown borough, PA Map & Demographics
Lewistown borough Overview
$23,370
PER CAPITA INCOME
$37,014
AVG FAMILY INCOME
$36,166
AVG HOUSEHOLD INCOME
28.8%
WAGE / INCOME GAP [ % ]
71.2¢/ $1
WAGE / INCOME GAP [ $ ]
$10,776
FAMILY INCOME DEFICIT
0.45
INEQUALITY / GINI INDEX
8,522
TOTAL POPULATION
3,939
MALE POPULATION
4,583
FEMALE POPULATION
85.95
MALES / 100 FEMALES
116.35
FEMALES / 100 MALES
34.3
MEDIAN AGE
2.9
AVG FAMILY SIZE
2.1
AVG HOUSEHOLD SIZE
3,639
LABOR FORCE [ PEOPLE ]
56.5%
PERCENT IN LABOR FORCE
7.3%
UNEMPLOYMENT RATE
Income in Lewistown borough
Income Overview in Lewistown borough
Per Capita Income in Lewistown borough is $23,370, while median incomes of families and households are $37,014 and $36,166 respectively.
| Characteristic | Number | Measure |
| Per Capita Income | 8,522 | $23,370 |
| Median Family Income | 1,906 | $37,014 |
| Mean Family Income | 1,906 | $58,654 |
| Median Household Income | 3,895 | $36,166 |
| Mean Household Income | 3,895 | $50,071 |
| Income Deficit | 1,906 | $10,776 |
| Wage / Income Gap (%) | 8,522 | 28.82% |
| Wage / Income Gap ($) | 8,522 | 71.18¢ per $1 |
| Gini / Inequality Index | 8,522 | 0.45 |
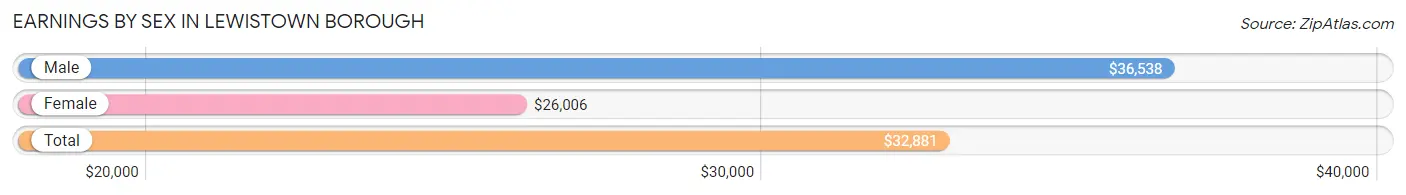
Earnings by Sex in Lewistown borough
Average Earnings in Lewistown borough are $32,881, $36,538 for men and $26,006 for women, a difference of 28.8%.
| Sex | Number | Average Earnings |
| Male | 1,910 (51.1%) | $36,538 |
| Female | 1,830 (48.9%) | $26,006 |
| Total | 3,740 (100.0%) | $32,881 |
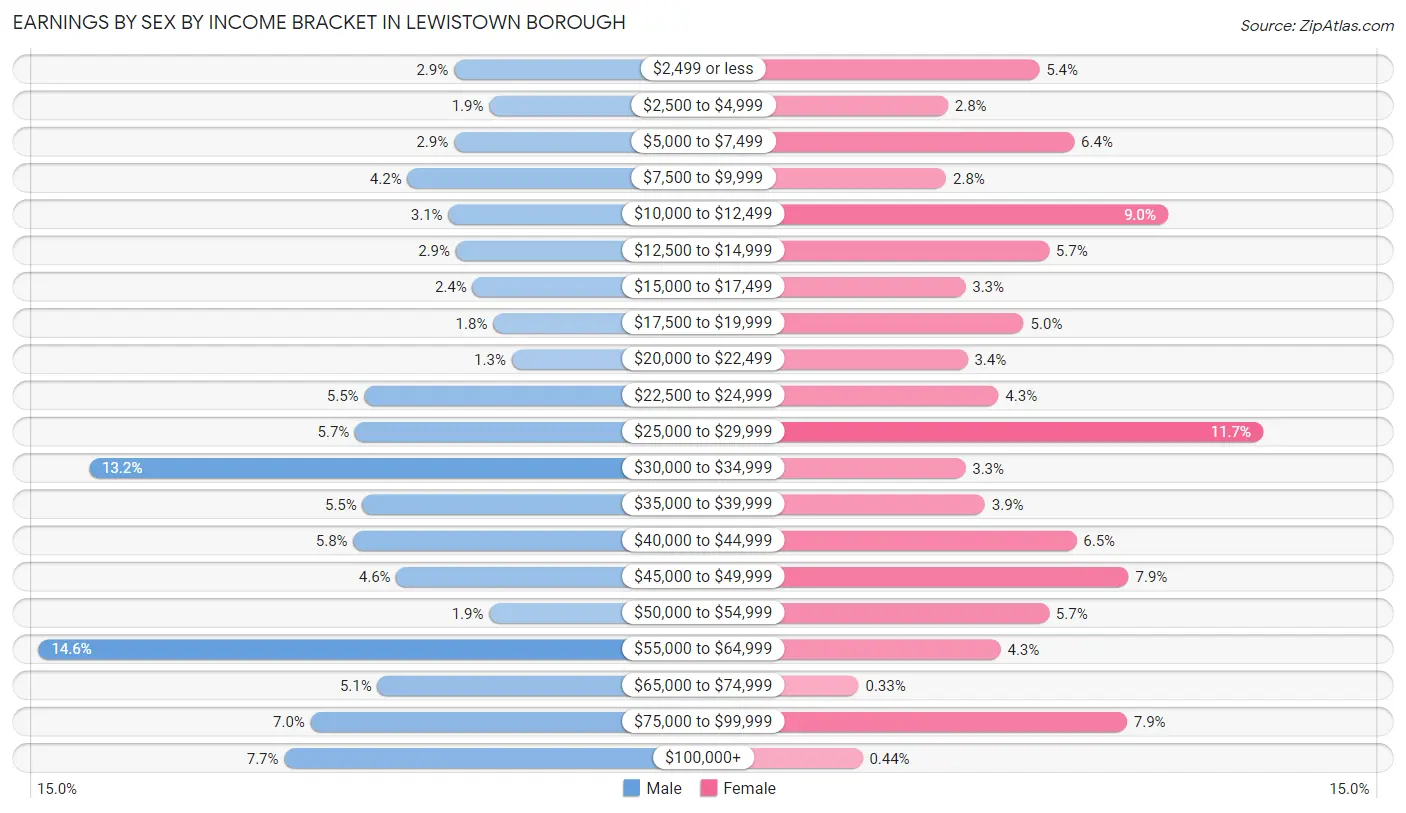
Earnings by Sex by Income Bracket in Lewistown borough
The most common earnings brackets in Lewistown borough are $55,000 to $64,999 for men (279 | 14.6%) and $25,000 to $29,999 for women (214 | 11.7%).
| Income | Male | Female |
| $2,499 or less | 56 (2.9%) | 99 (5.4%) |
| $2,500 to $4,999 | 37 (1.9%) | 52 (2.8%) |
| $5,000 to $7,499 | 56 (2.9%) | 117 (6.4%) |
| $7,500 to $9,999 | 81 (4.2%) | 51 (2.8%) |
| $10,000 to $12,499 | 59 (3.1%) | 165 (9.0%) |
| $12,500 to $14,999 | 55 (2.9%) | 104 (5.7%) |
| $15,000 to $17,499 | 46 (2.4%) | 61 (3.3%) |
| $17,500 to $19,999 | 35 (1.8%) | 91 (5.0%) |
| $20,000 to $22,499 | 25 (1.3%) | 62 (3.4%) |
| $22,500 to $24,999 | 104 (5.4%) | 78 (4.3%) |
| $25,000 to $29,999 | 109 (5.7%) | 214 (11.7%) |
| $30,000 to $34,999 | 252 (13.2%) | 61 (3.3%) |
| $35,000 to $39,999 | 105 (5.5%) | 71 (3.9%) |
| $40,000 to $44,999 | 110 (5.8%) | 118 (6.5%) |
| $45,000 to $49,999 | 87 (4.5%) | 145 (7.9%) |
| $50,000 to $54,999 | 37 (1.9%) | 104 (5.7%) |
| $55,000 to $64,999 | 279 (14.6%) | 79 (4.3%) |
| $65,000 to $74,999 | 97 (5.1%) | 6 (0.3%) |
| $75,000 to $99,999 | 133 (7.0%) | 144 (7.9%) |
| $100,000+ | 147 (7.7%) | 8 (0.4%) |
| Total | 1,910 (100.0%) | 1,830 (100.0%) |
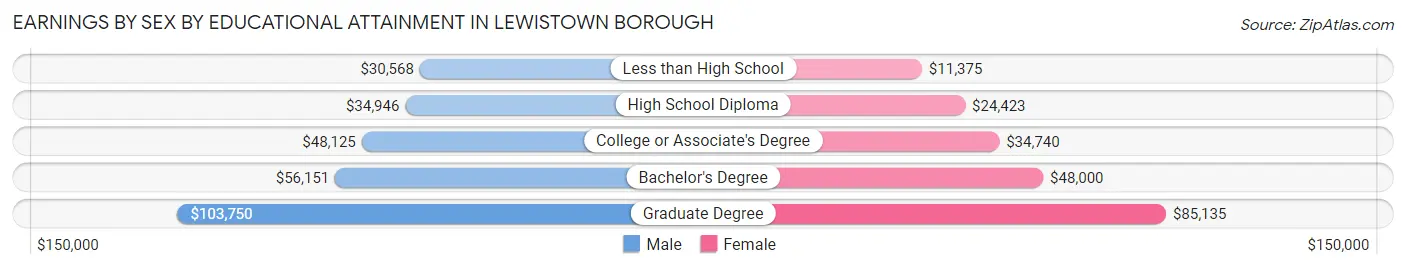
Earnings by Sex by Educational Attainment in Lewistown borough
Average earnings in Lewistown borough are $38,438 for men and $28,415 for women, a difference of 26.1%. Men with an educational attainment of graduate degree enjoy the highest average annual earnings of $103,750, while those with less than high school education earn the least with $30,568. Women with an educational attainment of graduate degree earn the most with the average annual earnings of $85,135, while those with less than high school education have the smallest earnings of $11,375.
| Educational Attainment | Male Income | Female Income |
| Less than High School | $30,568 | $11,375 |
| High School Diploma | $34,946 | $24,423 |
| College or Associate's Degree | $48,125 | $34,740 |
| Bachelor's Degree | $56,151 | $48,000 |
| Graduate Degree | $103,750 | $85,135 |
| Total | $38,438 | $28,415 |
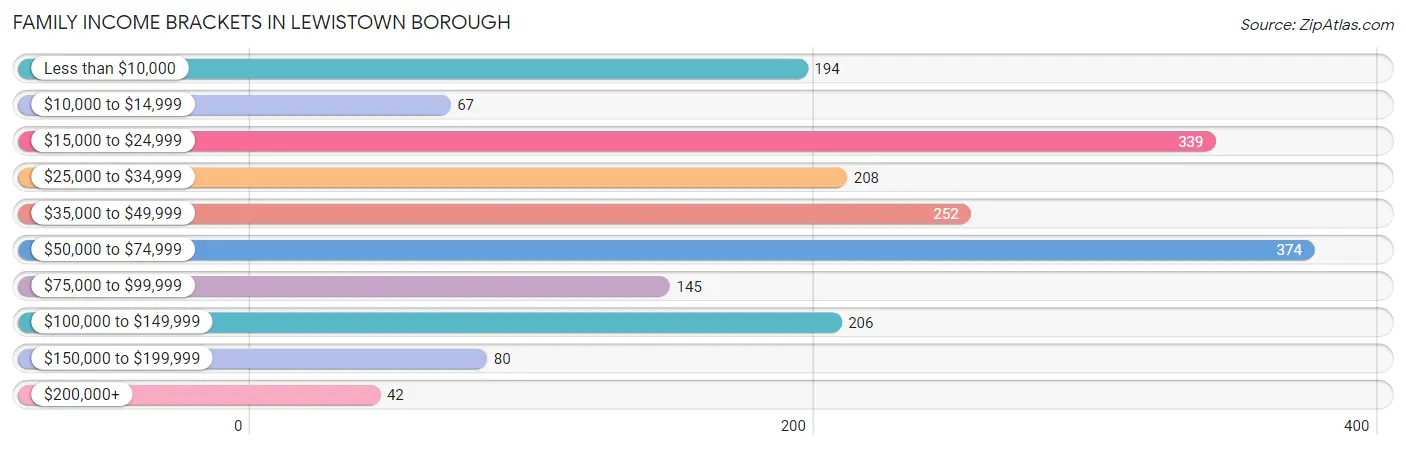
Family Income in Lewistown borough
Family Income Brackets in Lewistown borough
According to the Lewistown borough family income data, there are 374 families falling into the $50,000 to $74,999 income range, which is the most common income bracket and makes up 19.6% of all families. Conversely, the $200,000+ income bracket is the least frequent group with only 42 families (2.2%) belonging to this category.
| Income Bracket | # Families | % Families |
| Less than $10,000 | 194 | 10.2% |
| $10,000 to $14,999 | 67 | 3.5% |
| $15,000 to $24,999 | 339 | 17.8% |
| $25,000 to $34,999 | 208 | 10.9% |
| $35,000 to $49,999 | 252 | 13.2% |
| $50,000 to $74,999 | 374 | 19.6% |
| $75,000 to $99,999 | 145 | 7.6% |
| $100,000 to $149,999 | 206 | 10.8% |
| $150,000 to $199,999 | 80 | 4.2% |
| $200,000+ | 42 | 2.2% |
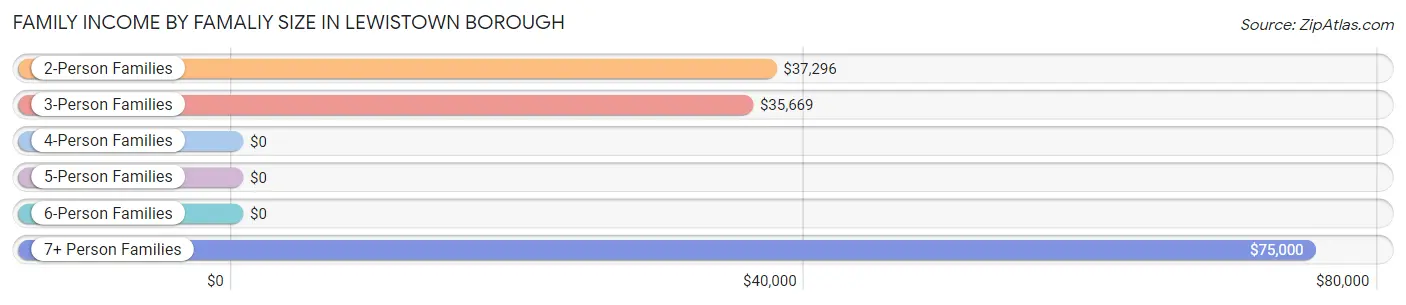
Family Income by Famaliy Size in Lewistown borough
7+ person families (40 | 2.1%) account for the highest median family income in Lewistown borough with $75,000 per family, while 2-person families (1,007 | 52.8%) have the highest median income of $18,648 per family member.
| Income Bracket | # Families | Median Income |
| 2-Person Families | 1,007 (52.8%) | $37,296 |
| 3-Person Families | 337 (17.7%) | $35,669 |
| 4-Person Families | 412 (21.6%) | $0 |
| 5-Person Families | 69 (3.6%) | $0 |
| 6-Person Families | 41 (2.1%) | $0 |
| 7+ Person Families | 40 (2.1%) | $75,000 |
| Total | 1,906 (100.0%) | $37,014 |
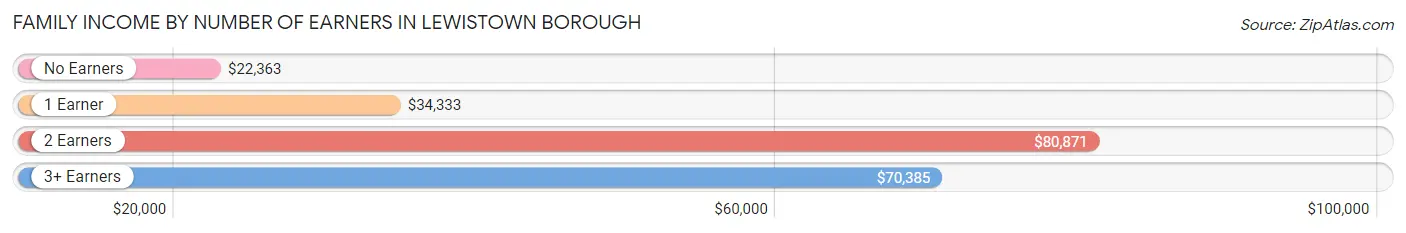
Family Income by Number of Earners in Lewistown borough
The median family income in Lewistown borough is $37,014, with families comprising 2 earners (565) having the highest median family income of $80,871, while families with no earners (539) have the lowest median family income of $22,363, accounting for 29.6% and 28.3% of families, respectively.
| Number of Earners | # Families | Median Income |
| No Earners | 539 (28.3%) | $22,363 |
| 1 Earner | 734 (38.5%) | $34,333 |
| 2 Earners | 565 (29.6%) | $80,871 |
| 3+ Earners | 68 (3.6%) | $70,385 |
| Total | 1,906 (100.0%) | $37,014 |
Household Income in Lewistown borough
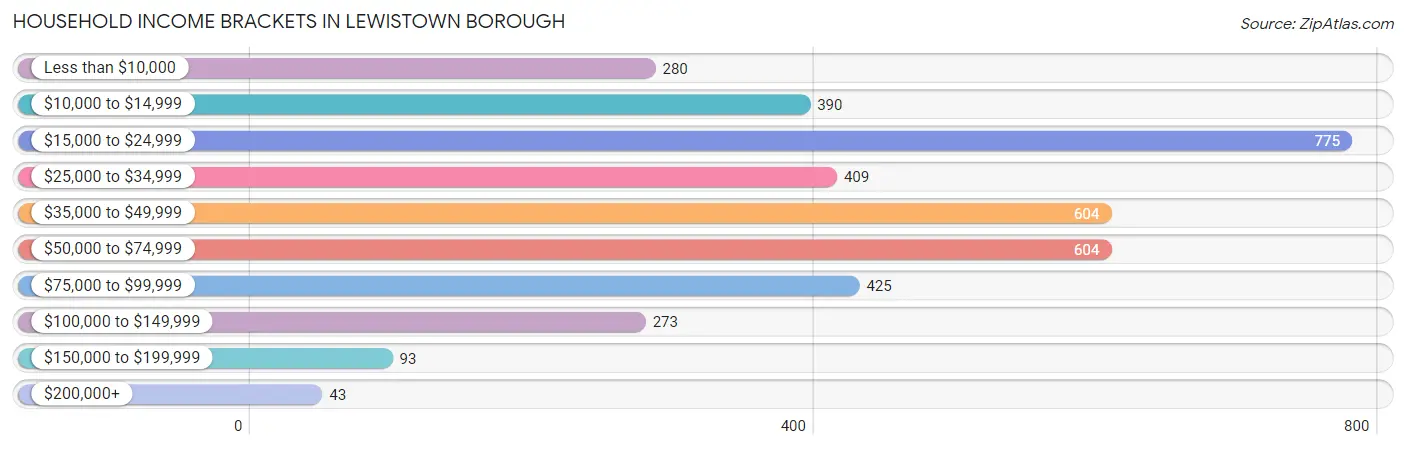
Household Income Brackets in Lewistown borough
With 775 households falling in the category, the $15,000 to $24,999 income range is the most frequent in Lewistown borough, accounting for 19.9% of all households. In contrast, only 43 households (1.1%) fall into the $200,000+ income bracket, making it the least populous group.
| Income Bracket | # Households | % Households |
| Less than $10,000 | 280 | 7.2% |
| $10,000 to $14,999 | 390 | 10.0% |
| $15,000 to $24,999 | 775 | 19.9% |
| $25,000 to $34,999 | 409 | 10.5% |
| $35,000 to $49,999 | 604 | 15.5% |
| $50,000 to $74,999 | 604 | 15.5% |
| $75,000 to $99,999 | 425 | 10.9% |
| $100,000 to $149,999 | 273 | 7.0% |
| $150,000 to $199,999 | 93 | 2.4% |
| $200,000+ | 43 | 1.1% |
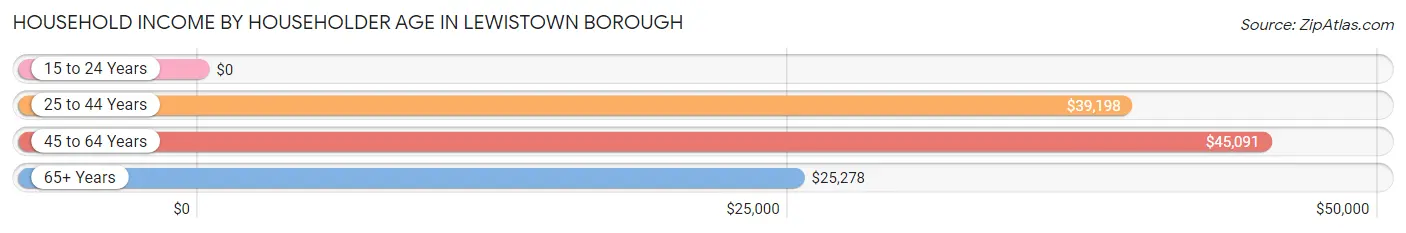
Household Income by Householder Age in Lewistown borough
The median household income in Lewistown borough is $36,166, with the highest median household income of $45,091 found in the 45 to 64 years age bracket for the primary householder. A total of 1,243 households (31.9%) fall into this category. Meanwhile, the 15 to 24 years age bracket for the primary householder has the lowest median household income of $0, with 284 households (7.3%) in this group.
| Income Bracket | # Households | Median Income |
| 15 to 24 Years | 284 (7.3%) | $0 |
| 25 to 44 Years | 1,398 (35.9%) | $39,198 |
| 45 to 64 Years | 1,243 (31.9%) | $45,091 |
| 65+ Years | 970 (24.9%) | $25,278 |
| Total | 3,895 (100.0%) | $36,166 |
Poverty in Lewistown borough
Income Below Poverty by Sex and Age in Lewistown borough
With 25.6% poverty level for males and 35.7% for females among the residents of Lewistown borough, 15 year old males and 18 to 24 year old females are the most vulnerable to poverty, with 43 males (82.7%) and 326 females (72.4%) in their respective age groups living below the poverty level.
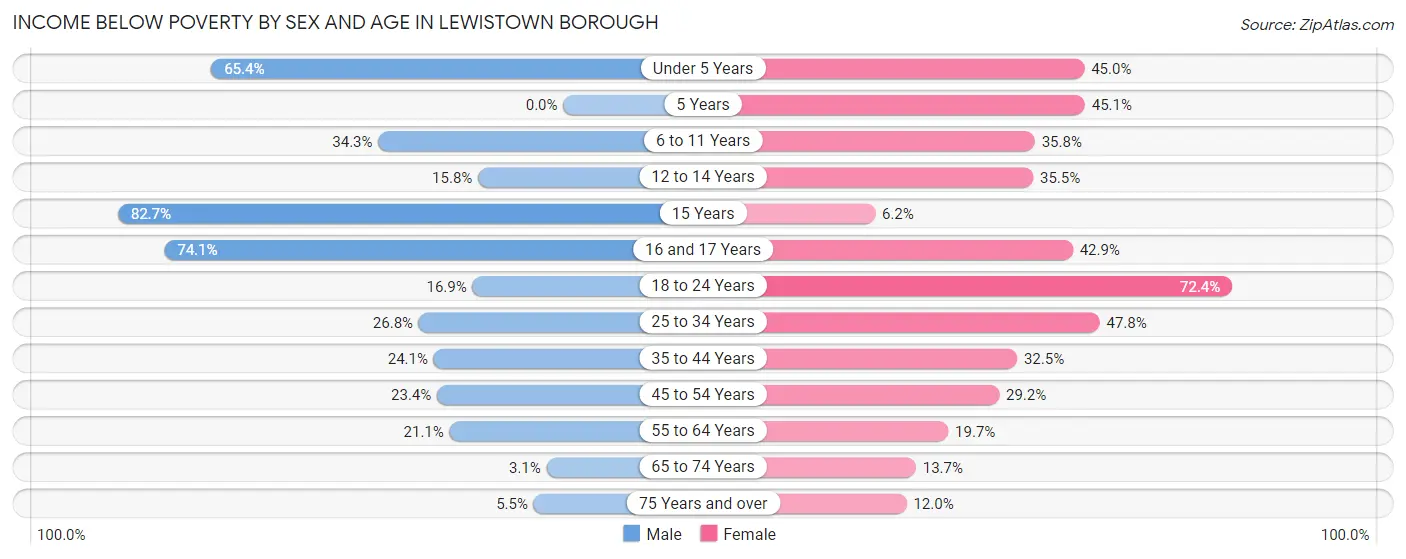
| Age Bracket | Male | Female |
| Under 5 Years | 166 (65.3%) | 225 (45.0%) |
| 5 Years | 0 (0.0%) | 46 (45.1%) |
| 6 to 11 Years | 102 (34.3%) | 106 (35.8%) |
| 12 to 14 Years | 34 (15.8%) | 82 (35.5%) |
| 15 Years | 43 (82.7%) | 4 (6.1%) |
| 16 and 17 Years | 60 (74.1%) | 27 (42.9%) |
| 18 to 24 Years | 43 (16.9%) | 326 (72.4%) |
| 25 to 34 Years | 159 (26.8%) | 355 (47.8%) |
| 35 to 44 Years | 127 (24.0%) | 146 (32.5%) |
| 45 to 54 Years | 127 (23.4%) | 89 (29.2%) |
| 55 to 64 Years | 80 (21.1%) | 121 (19.7%) |
| 65 to 74 Years | 12 (3.1%) | 58 (13.7%) |
| 75 Years and over | 10 (5.5%) | 37 (12.0%) |
| Total | 963 (25.6%) | 1,622 (35.7%) |
Income Above Poverty by Sex and Age in Lewistown borough
According to the poverty statistics in Lewistown borough, males aged 65 to 74 years and females aged 15 years are the age groups that are most secure financially, with 96.9% of males and 93.9% of females in these age groups living above the poverty line.
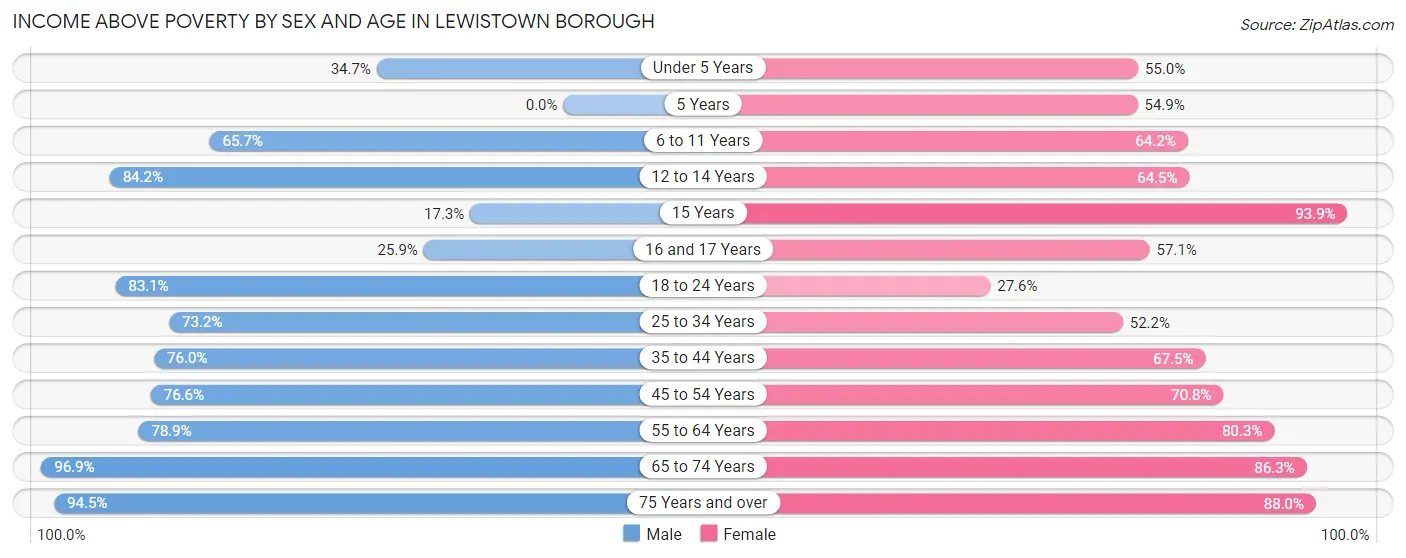
| Age Bracket | Male | Female |
| Under 5 Years | 88 (34.6%) | 275 (55.0%) |
| 5 Years | 0 (0.0%) | 56 (54.9%) |
| 6 to 11 Years | 195 (65.7%) | 190 (64.2%) |
| 12 to 14 Years | 181 (84.2%) | 149 (64.5%) |
| 15 Years | 9 (17.3%) | 61 (93.9%) |
| 16 and 17 Years | 21 (25.9%) | 36 (57.1%) |
| 18 to 24 Years | 212 (83.1%) | 124 (27.6%) |
| 25 to 34 Years | 434 (73.2%) | 387 (52.2%) |
| 35 to 44 Years | 401 (75.9%) | 303 (67.5%) |
| 45 to 54 Years | 415 (76.6%) | 216 (70.8%) |
| 55 to 64 Years | 299 (78.9%) | 492 (80.3%) |
| 65 to 74 Years | 374 (96.9%) | 364 (86.3%) |
| 75 Years and over | 172 (94.5%) | 271 (88.0%) |
| Total | 2,801 (74.4%) | 2,924 (64.3%) |
Income Below Poverty Among Married-Couple Families in Lewistown borough
The poverty statistics for married-couple families in Lewistown borough show that 14.5% or 141 of the total 970 families live below the poverty line. Families with 3 or 4 children have the highest poverty rate of 48.4%, comprising of 31 families. On the other hand, families with 5 or more children have the lowest poverty rate of 0.0%, which includes 0 families.
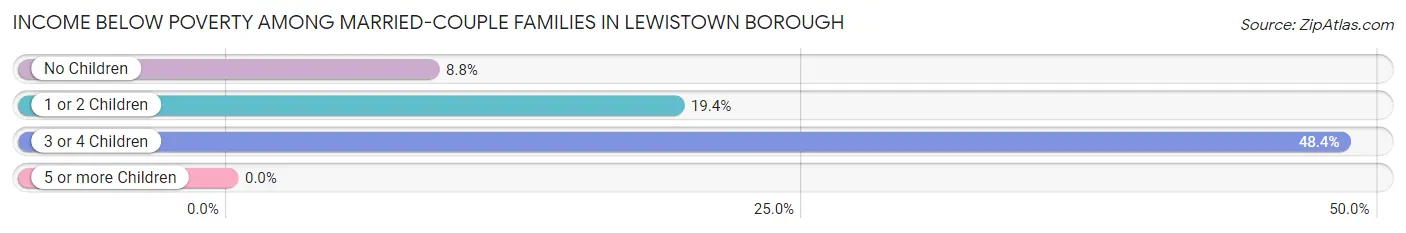
| Children | Above Poverty | Below Poverty |
| No Children | 532 (91.2%) | 51 (8.7%) |
| 1 or 2 Children | 245 (80.6%) | 59 (19.4%) |
| 3 or 4 Children | 33 (51.6%) | 31 (48.4%) |
| 5 or more Children | 19 (100.0%) | 0 (0.0%) |
| Total | 829 (85.5%) | 141 (14.5%) |
Income Below Poverty Among Single-Parent Households in Lewistown borough
According to the poverty data in Lewistown borough, 33.2% or 91 single-father households and 45.9% or 304 single-mother households are living below the poverty line. Among single-father households, those with 1 or 2 children have the highest poverty rate, with 65 households (44.8%) experiencing poverty. Likewise, among single-mother households, those with 5 or more children have the highest poverty rate, with 6 households (100.0%) falling below the poverty line.
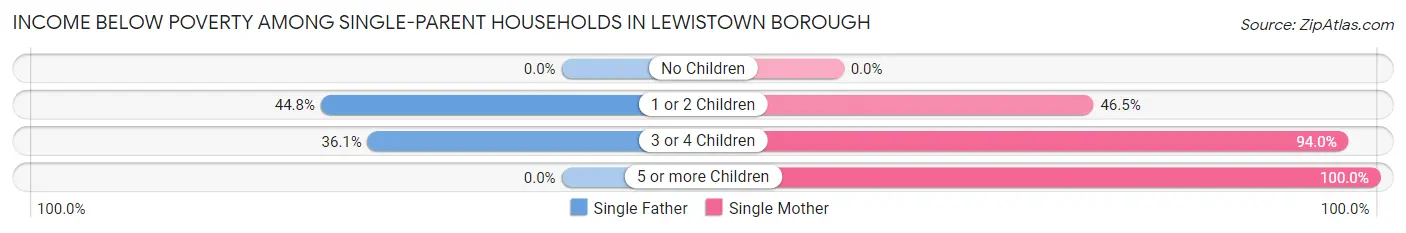
| Children | Single Father | Single Mother |
| No Children | 0 (0.0%) | 0 (0.0%) |
| 1 or 2 Children | 65 (44.8%) | 188 (46.5%) |
| 3 or 4 Children | 26 (36.1%) | 110 (94.0%) |
| 5 or more Children | 0 (0.0%) | 6 (100.0%) |
| Total | 91 (33.2%) | 304 (45.9%) |
Income Below Poverty Among Married-Couple vs Single-Parent Households in Lewistown borough
The poverty data for Lewistown borough shows that 141 of the married-couple family households (14.5%) and 395 of the single-parent households (42.2%) are living below the poverty level. Within the married-couple family households, those with 3 or 4 children have the highest poverty rate, with 31 households (48.4%) falling below the poverty line. Among the single-parent households, those with 5 or more children have the highest poverty rate, with 6 household (100.0%) living below poverty.
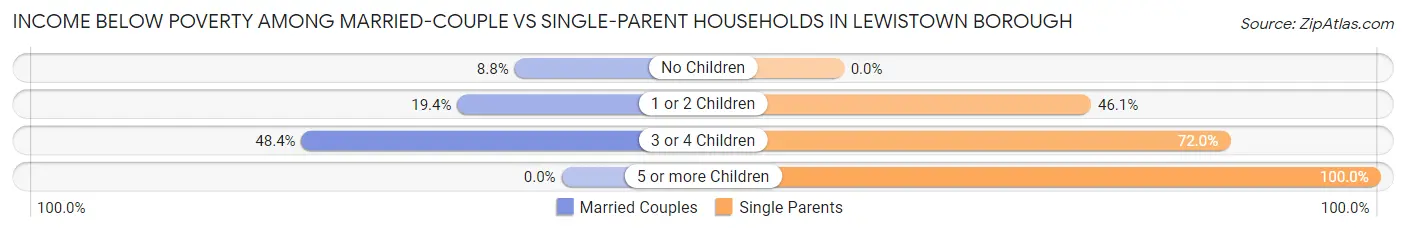
| Children | Married-Couple Families | Single-Parent Households |
| No Children | 51 (8.7%) | 0 (0.0%) |
| 1 or 2 Children | 59 (19.4%) | 253 (46.1%) |
| 3 or 4 Children | 31 (48.4%) | 136 (72.0%) |
| 5 or more Children | 0 (0.0%) | 6 (100.0%) |
| Total | 141 (14.5%) | 395 (42.2%) |
Race in Lewistown borough
The most populous races in Lewistown borough are White / Caucasian (7,361 | 86.4%), Two or more Races (791 | 9.3%), and Hispanic or Latino (441 | 5.2%).
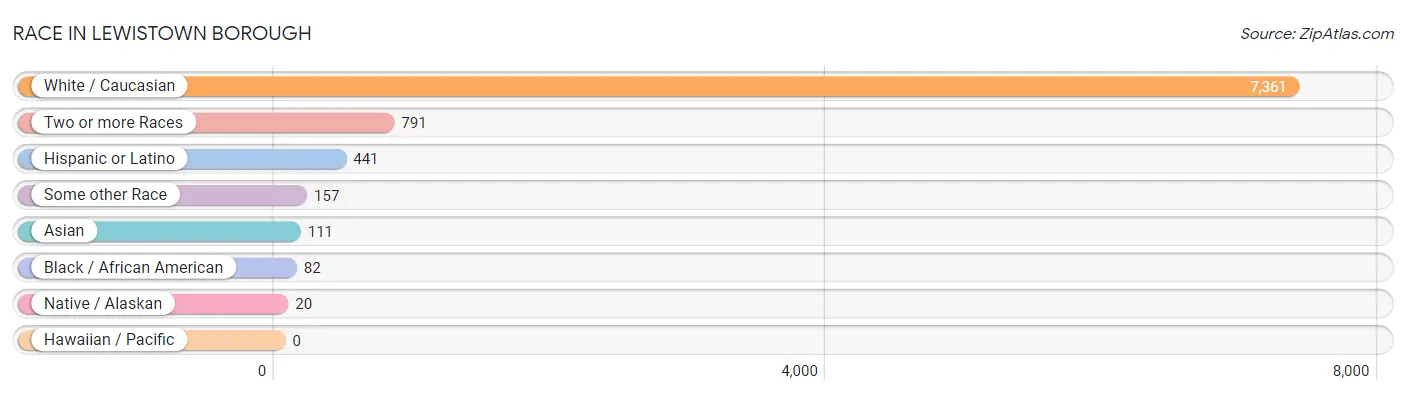
| Race | # Population | % Population |
| Asian | 111 | 1.3% |
| Black / African American | 82 | 1.0% |
| Hawaiian / Pacific | 0 | 0.0% |
| Hispanic or Latino | 441 | 5.2% |
| Native / Alaskan | 20 | 0.2% |
| White / Caucasian | 7,361 | 86.4% |
| Two or more Races | 791 | 9.3% |
| Some other Race | 157 | 1.8% |
| Total | 8,522 | 100.0% |
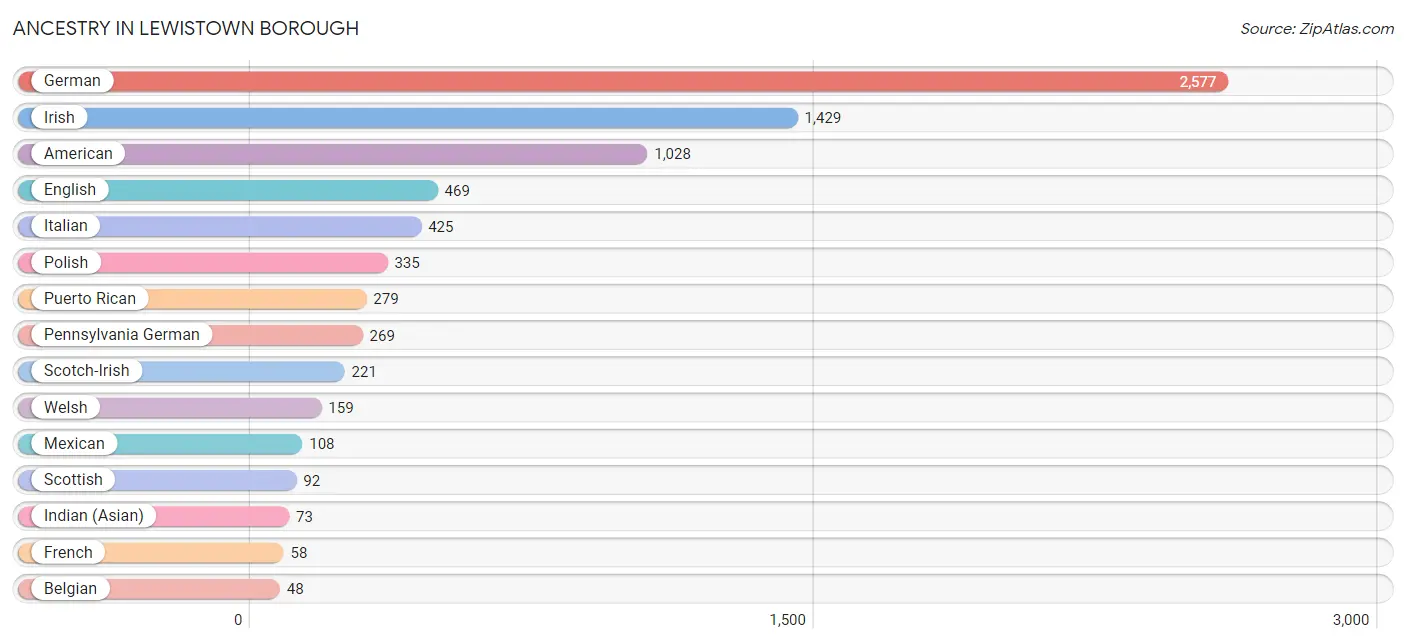
Ancestry in Lewistown borough
The most populous ancestries reported in Lewistown borough are German (2,577 | 30.2%), Irish (1,429 | 16.8%), American (1,028 | 12.1%), English (469 | 5.5%), and Italian (425 | 5.0%), together accounting for 69.6% of all Lewistown borough residents.
| Ancestry | # Population | % Population |
| American | 1,028 | 12.1% |
| Arab | 30 | 0.4% |
| Belgian | 48 | 0.6% |
| Brazilian | 21 | 0.3% |
| British | 23 | 0.3% |
| Central American | 43 | 0.5% |
| Croatian | 7 | 0.1% |
| Dutch | 42 | 0.5% |
| Eastern European | 8 | 0.1% |
| English | 469 | 5.5% |
| European | 30 | 0.4% |
| French | 58 | 0.7% |
| German | 2,577 | 30.2% |
| Greek | 12 | 0.1% |
| Hungarian | 8 | 0.1% |
| Indian (Asian) | 73 | 0.9% |
| Iranian | 6 | 0.1% |
| Irish | 1,429 | 16.8% |
| Israeli | 9 | 0.1% |
| Italian | 425 | 5.0% |
| Korean | 25 | 0.3% |
| Lithuanian | 10 | 0.1% |
| Mexican | 108 | 1.3% |
| Moroccan | 30 | 0.4% |
| Norwegian | 31 | 0.4% |
| Pakistani | 12 | 0.1% |
| Panamanian | 25 | 0.3% |
| Pennsylvania German | 269 | 3.2% |
| Polish | 335 | 3.9% |
| Puerto Rican | 279 | 3.3% |
| Russian | 46 | 0.5% |
| Salvadoran | 18 | 0.2% |
| Scandinavian | 5 | 0.1% |
| Scotch-Irish | 221 | 2.6% |
| Scottish | 92 | 1.1% |
| Sioux | 11 | 0.1% |
| Slavic | 6 | 0.1% |
| Slovak | 2 | 0.0% |
| Spanish | 11 | 0.1% |
| Sri Lankan | 12 | 0.1% |
| Swedish | 31 | 0.4% |
| Swiss | 15 | 0.2% |
| Thai | 37 | 0.4% |
| Ukrainian | 6 | 0.1% |
| Welsh | 159 | 1.9% | View All 45 Rows |
Immigrants in Lewistown borough
The most numerous immigrant groups reported in Lewistown borough came from Asia (105 | 1.2%), Central America (53 | 0.6%), Latin America (53 | 0.6%), Mexico (53 | 0.6%), and South Central Asia (43 | 0.5%), together accounting for 3.6% of all Lewistown borough residents.
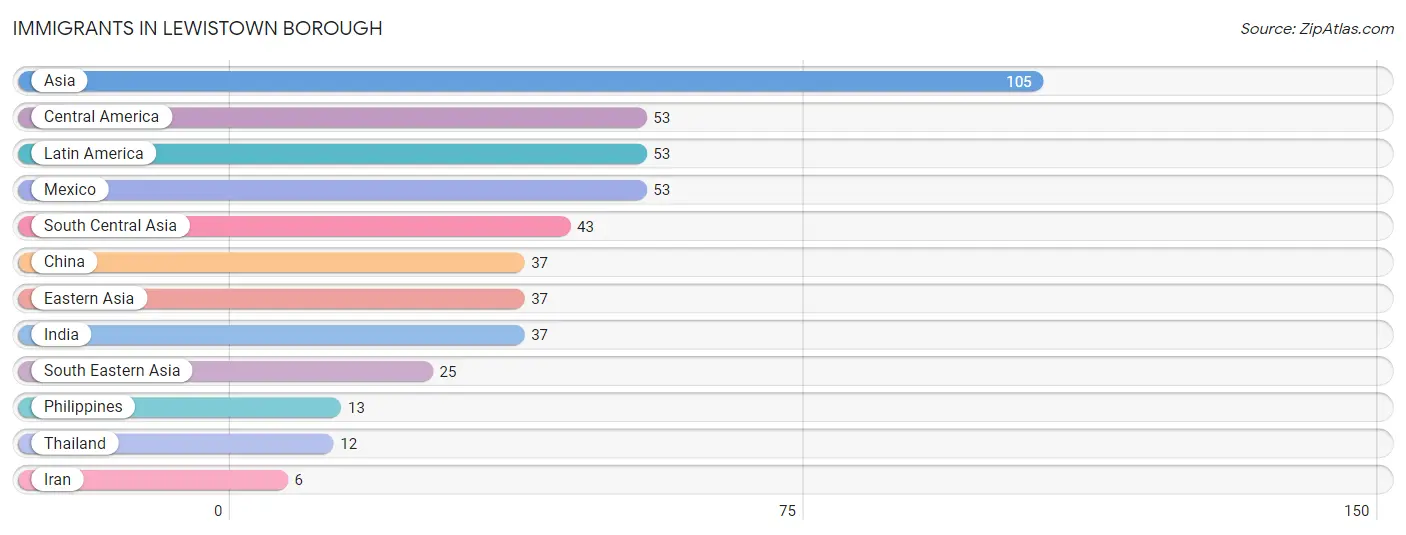
| Immigration Origin | # Population | % Population |
| Asia | 105 | 1.2% |
| Central America | 53 | 0.6% |
| China | 37 | 0.4% |
| Eastern Asia | 37 | 0.4% |
| India | 37 | 0.4% |
| Iran | 6 | 0.1% |
| Latin America | 53 | 0.6% |
| Mexico | 53 | 0.6% |
| Philippines | 13 | 0.2% |
| South Central Asia | 43 | 0.5% |
| South Eastern Asia | 25 | 0.3% |
| Thailand | 12 | 0.1% | View All 12 Rows |
Sex and Age in Lewistown borough
Sex and Age in Lewistown borough
The most populous age groups in Lewistown borough are 30 to 34 Years (344 | 8.7%) for men and Under 5 Years (502 | 11.0%) for women.
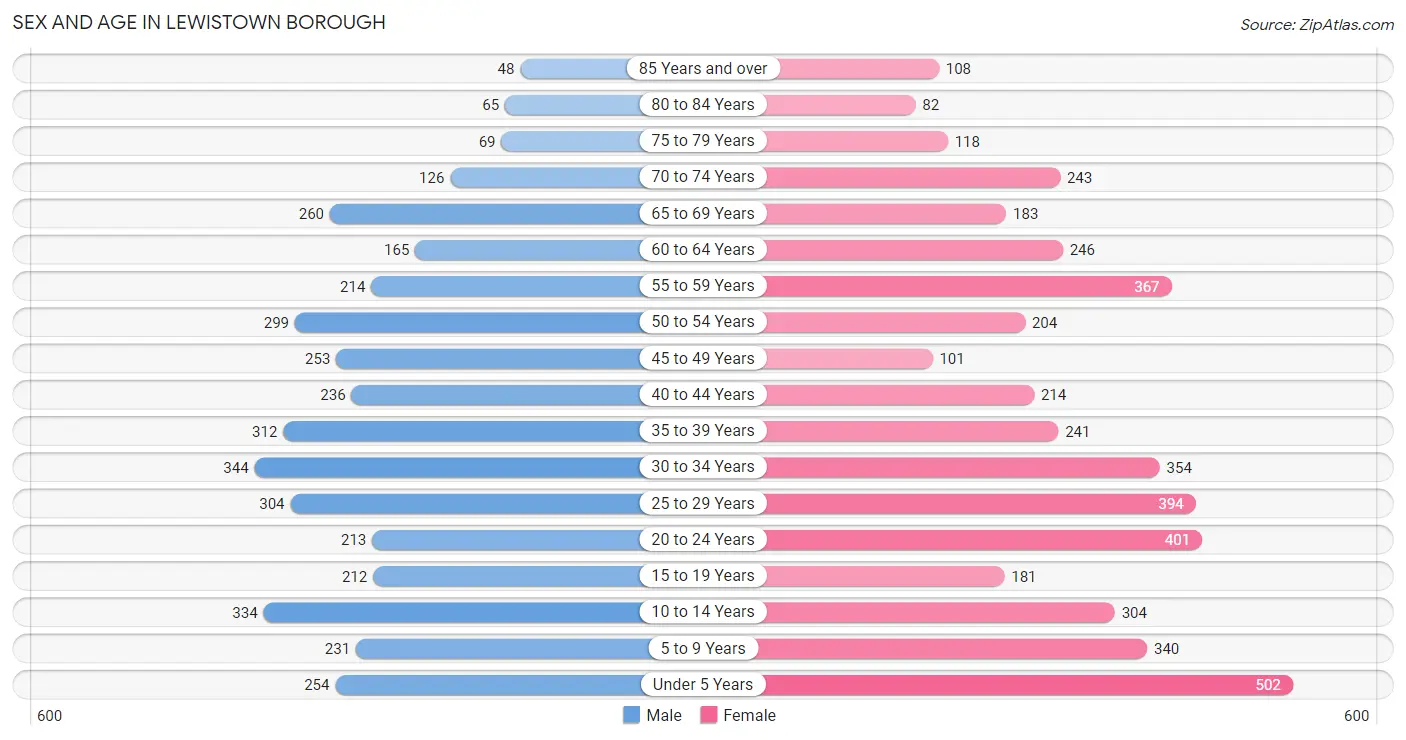
| Age Bracket | Male | Female |
| Under 5 Years | 254 (6.5%) | 502 (11.0%) |
| 5 to 9 Years | 231 (5.9%) | 340 (7.4%) |
| 10 to 14 Years | 334 (8.5%) | 304 (6.6%) |
| 15 to 19 Years | 212 (5.4%) | 181 (4.0%) |
| 20 to 24 Years | 213 (5.4%) | 401 (8.7%) |
| 25 to 29 Years | 304 (7.7%) | 394 (8.6%) |
| 30 to 34 Years | 344 (8.7%) | 354 (7.7%) |
| 35 to 39 Years | 312 (7.9%) | 241 (5.3%) |
| 40 to 44 Years | 236 (6.0%) | 214 (4.7%) |
| 45 to 49 Years | 253 (6.4%) | 101 (2.2%) |
| 50 to 54 Years | 299 (7.6%) | 204 (4.4%) |
| 55 to 59 Years | 214 (5.4%) | 367 (8.0%) |
| 60 to 64 Years | 165 (4.2%) | 246 (5.4%) |
| 65 to 69 Years | 260 (6.6%) | 183 (4.0%) |
| 70 to 74 Years | 126 (3.2%) | 243 (5.3%) |
| 75 to 79 Years | 69 (1.8%) | 118 (2.6%) |
| 80 to 84 Years | 65 (1.7%) | 82 (1.8%) |
| 85 Years and over | 48 (1.2%) | 108 (2.4%) |
| Total | 3,939 (100.0%) | 4,583 (100.0%) |
Families and Households in Lewistown borough
Median Family Size in Lewistown borough
The median family size in Lewistown borough is 2.88 persons per family, with married-couple families (970 | 50.9%) accounting for the largest median family size of 3.09 persons per family. On the other hand, single female/mother families (662 | 34.7%) represent the smallest median family size with 2.58 persons per family.
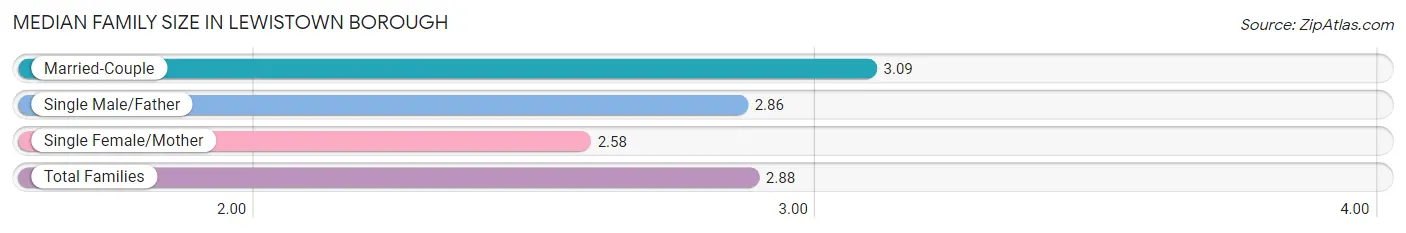
| Family Type | # Families | Family Size |
| Married-Couple | 970 (50.9%) | 3.09 |
| Single Male/Father | 274 (14.4%) | 2.86 |
| Single Female/Mother | 662 (34.7%) | 2.58 |
| Total Families | 1,906 (100.0%) | 2.88 |
Median Household Size in Lewistown borough
The median household size in Lewistown borough is 2.15 persons per household, with single male/father households (274 | 7.0%) accounting for the largest median household size of 3.86 persons per household. non-family households (1,989 | 51.1%) represent the smallest median household size with 1.23 persons per household.
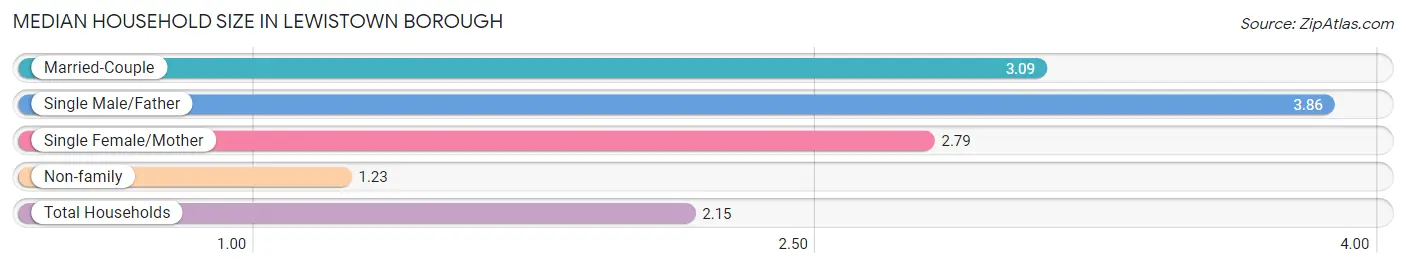
| Household Type | # Households | Household Size |
| Married-Couple | 970 (24.9%) | 3.09 |
| Single Male/Father | 274 (7.0%) | 3.86 |
| Single Female/Mother | 662 (17.0%) | 2.79 |
| Non-family | 1,989 (51.1%) | 1.23 |
| Total Households | 3,895 (100.0%) | 2.15 |
Household Size by Marriage Status in Lewistown borough
Out of a total of 3,895 households in Lewistown borough, 1,906 (48.9%) are family households, while 1,989 (51.1%) are nonfamily households. The most numerous type of family households are 2-person households, comprising 829, and the most common type of nonfamily households are 1-person households, comprising 1,604.
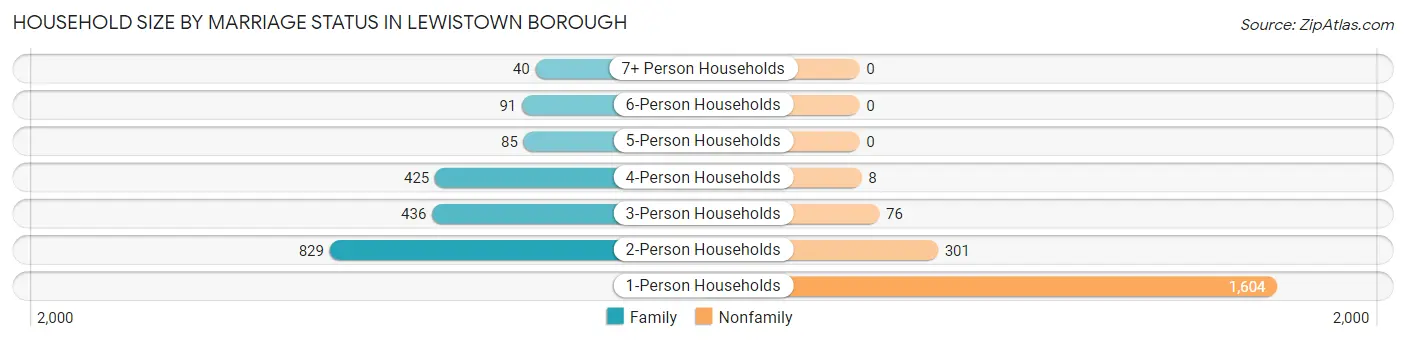
| Household Size | Family Households | Nonfamily Households |
| 1-Person Households | - | 1,604 (41.2%) |
| 2-Person Households | 829 (21.3%) | 301 (7.7%) |
| 3-Person Households | 436 (11.2%) | 76 (1.9%) |
| 4-Person Households | 425 (10.9%) | 8 (0.2%) |
| 5-Person Households | 85 (2.2%) | 0 (0.0%) |
| 6-Person Households | 91 (2.3%) | 0 (0.0%) |
| 7+ Person Households | 40 (1.0%) | 0 (0.0%) |
| Total | 1,906 (48.9%) | 1,989 (51.1%) |
Female Fertility in Lewistown borough
Fertility by Age in Lewistown borough
Average fertility rate in Lewistown borough is 131.0 births per 1,000 women. Women in the age bracket of 20 to 34 years have the highest fertility rate with 200.0 births per 1,000 women. Women in the age bracket of 20 to 34 years acount for 91.6% of all women with births.
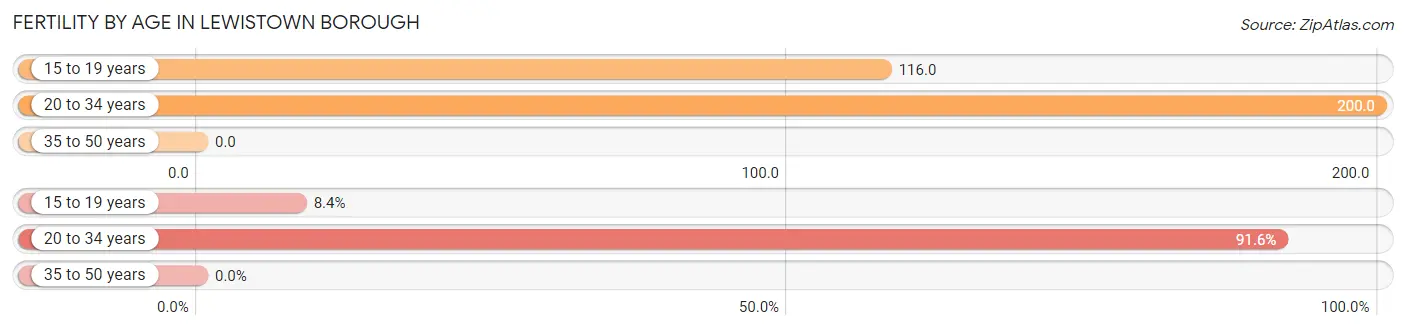
| Age Bracket | Women with Births | Births / 1,000 Women |
| 15 to 19 years | 21 (8.4%) | 116.0 |
| 20 to 34 years | 230 (91.6%) | 200.0 |
| 35 to 50 years | 0 (0.0%) | 0.0 |
| Total | 251 (100.0%) | 131.0 |
Fertility by Age by Marriage Status in Lewistown borough
44.6% of women with births (251) in Lewistown borough are married. The highest percentage of unmarried women with births falls into 15 to 19 years age bracket with 100.0% of them unmarried at the time of birth, while the lowest percentage of unmarried women with births belong to 20 to 34 years age bracket with 51.3% of them unmarried.
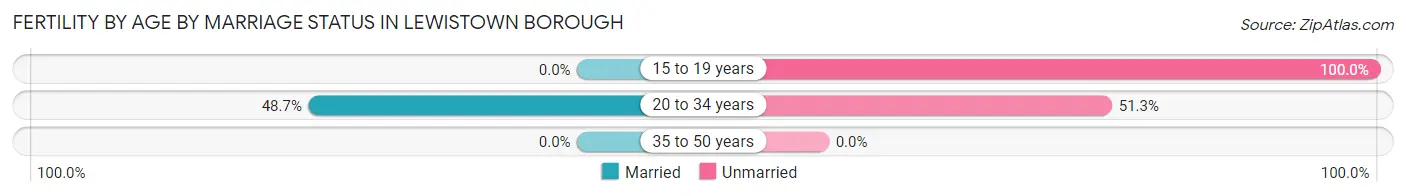
| Age Bracket | Married | Unmarried |
| 15 to 19 years | 0 (0.0%) | 21 (100.0%) |
| 20 to 34 years | 112 (48.7%) | 118 (51.3%) |
| 35 to 50 years | 0 (0.0%) | 0 (0.0%) |
| Total | 112 (44.6%) | 139 (55.4%) |
Fertility by Education in Lewistown borough
Average fertility rate in Lewistown borough is 131.0 births per 1,000 women. Women with the education attainment of high school diploma have the highest fertility rate of 166.0 births per 1,000 women, while women with the education attainment of less than high school have the lowest fertility at 61.0 births per 1,000 women. Women with the education attainment of high school diploma represent 57.4% of all women with births.
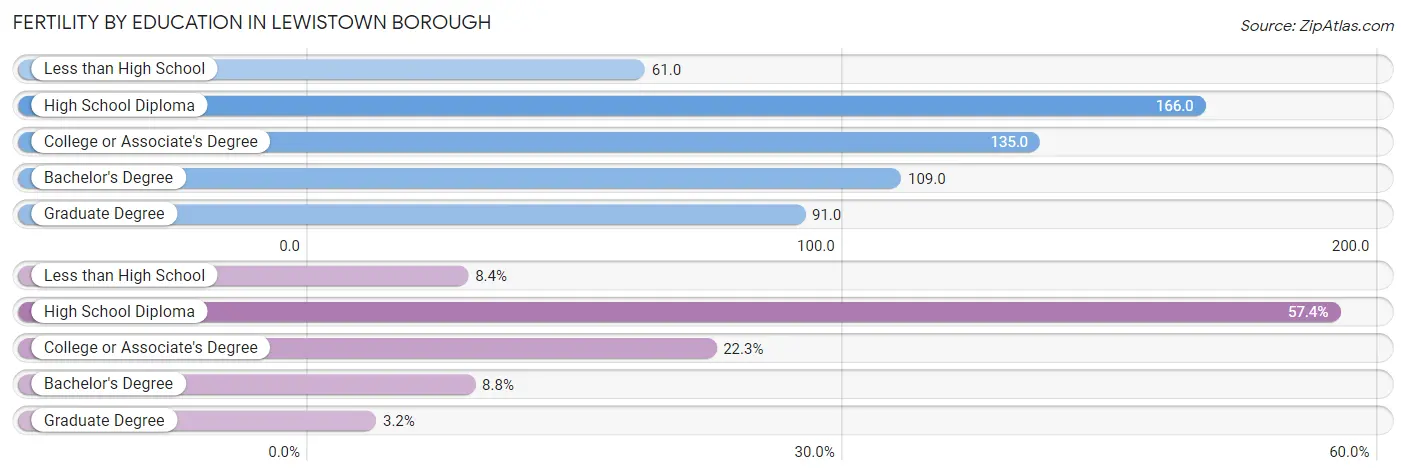
| Educational Attainment | Women with Births | Births / 1,000 Women |
| Less than High School | 21 (8.4%) | 61.0 |
| High School Diploma | 144 (57.4%) | 166.0 |
| College or Associate's Degree | 56 (22.3%) | 135.0 |
| Bachelor's Degree | 22 (8.8%) | 109.0 |
| Graduate Degree | 8 (3.2%) | 91.0 |
| Total | 251 (100.0%) | 131.0 |
Fertility by Education by Marriage Status in Lewistown borough
55.4% of women with births in Lewistown borough are unmarried. Women with the educational attainment of college or associate's degree are most likely to be married with 100.0% of them married at childbirth, while women with the educational attainment of less than high school are least likely to be married with 100.0% of them unmarried at childbirth.
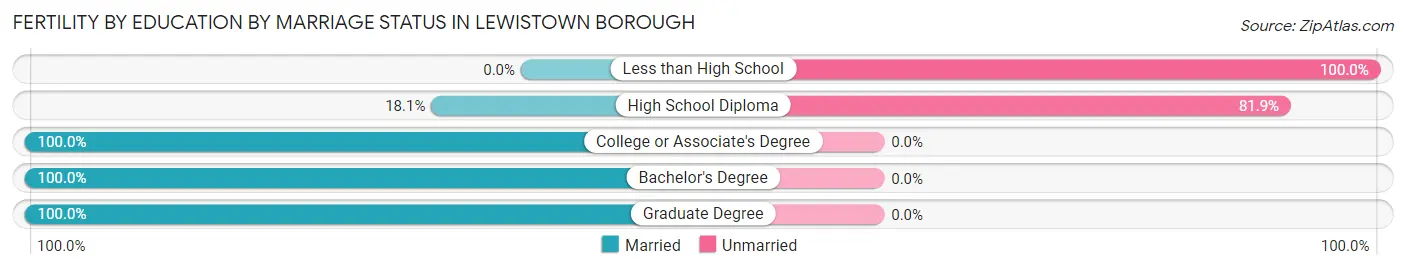
| Educational Attainment | Married | Unmarried |
| Less than High School | 0 (0.0%) | 21 (100.0%) |
| High School Diploma | 26 (18.1%) | 118 (81.9%) |
| College or Associate's Degree | 56 (100.0%) | 0 (0.0%) |
| Bachelor's Degree | 22 (100.0%) | 0 (0.0%) |
| Graduate Degree | 8 (100.0%) | 0 (0.0%) |
| Total | 112 (44.6%) | 139 (55.4%) |
Employment Characteristics in Lewistown borough
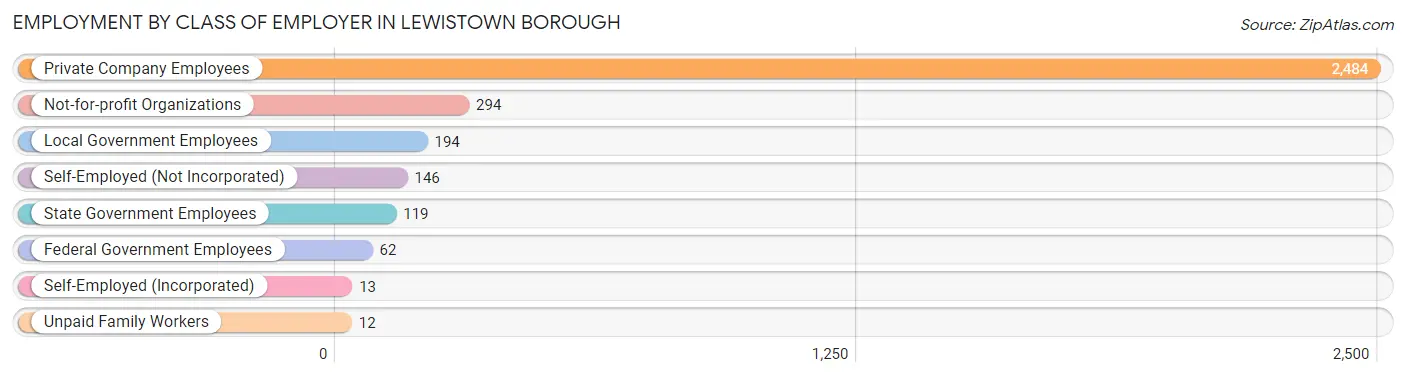
Employment by Class of Employer in Lewistown borough
Among the 3,324 employed individuals in Lewistown borough, private company employees (2,484 | 74.7%), not-for-profit organizations (294 | 8.8%), and local government employees (194 | 5.8%) make up the most common classes of employment.
| Employer Class | # Employees | % Employees |
| Private Company Employees | 2,484 | 74.7% |
| Self-Employed (Incorporated) | 13 | 0.4% |
| Self-Employed (Not Incorporated) | 146 | 4.4% |
| Not-for-profit Organizations | 294 | 8.8% |
| Local Government Employees | 194 | 5.8% |
| State Government Employees | 119 | 3.6% |
| Federal Government Employees | 62 | 1.9% |
| Unpaid Family Workers | 12 | 0.4% |
| Total | 3,324 | 100.0% |
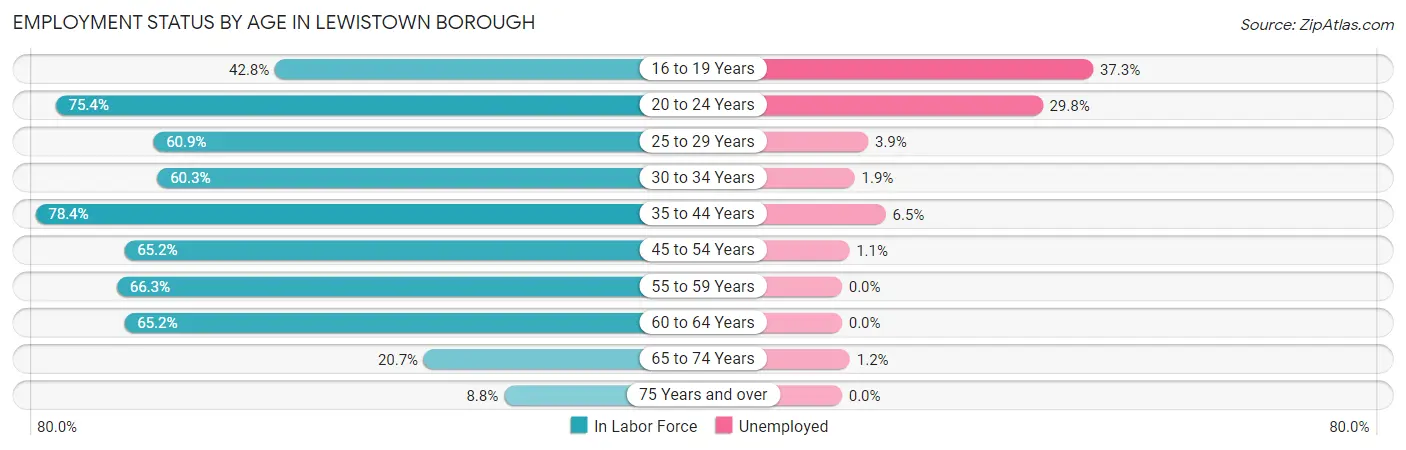
Employment Status by Age in Lewistown borough
According to the labor force statistics for Lewistown borough, out of the total population over 16 years of age (6,440), 56.5% or 3,639 individuals are in the labor force, with 7.3% or 266 of them unemployed. The age group with the highest labor force participation rate is 35 to 44 years, with 78.4% or 786 individuals in the labor force. Within the labor force, the 16 to 19 years age range has the highest percentage of unemployed individuals, with 37.3% or 44 of them being unemployed.
| Age Bracket | In Labor Force | Unemployed |
| 16 to 19 Years | 118 (42.8%) | 44 (37.3%) |
| 20 to 24 Years | 463 (75.4%) | 138 (29.8%) |
| 25 to 29 Years | 425 (60.9%) | 17 (3.9%) |
| 30 to 34 Years | 421 (60.3%) | 8 (1.9%) |
| 35 to 44 Years | 786 (78.4%) | 51 (6.5%) |
| 45 to 54 Years | 559 (65.2%) | 6 (1.1%) |
| 55 to 59 Years | 385 (66.3%) | 0 (0.0%) |
| 60 to 64 Years | 268 (65.2%) | 0 (0.0%) |
| 65 to 74 Years | 168 (20.7%) | 2 (1.2%) |
| 75 Years and over | 43 (8.8%) | 0 (0.0%) |
| Total | 3,639 (56.5%) | 266 (7.3%) |
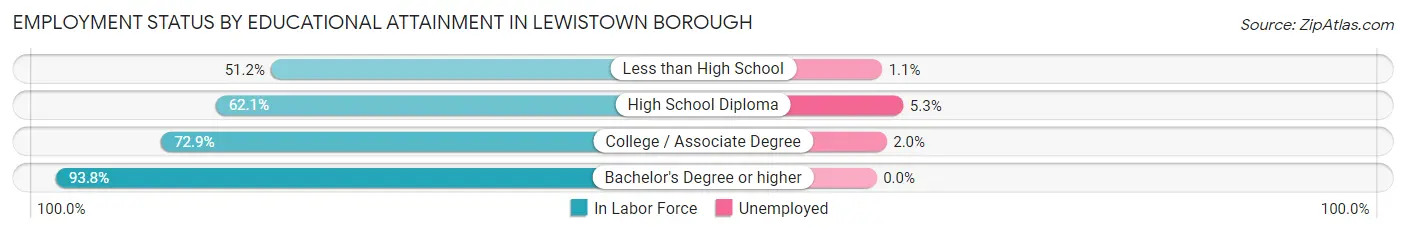
Employment Status by Educational Attainment in Lewistown borough
According to labor force statistics for Lewistown borough, 66.9% of individuals (2,842) out of the total population between 25 and 64 years of age (4,248) are in the labor force, with 2.9% or 82 of them being unemployed. The group with the highest labor force participation rate are those with the educational attainment of bachelor's degree or higher, with 93.8% or 499 individuals in the labor force. Within the labor force, individuals with high school diploma education have the highest percentage of unemployment, with 5.3% or 62 of them being unemployed.
| Educational Attainment | In Labor Force | Unemployed |
| Less than High School | 374 (51.2%) | 8 (1.1%) |
| High School Diploma | 1,175 (62.1%) | 100 (5.3%) |
| College / Associate Degree | 798 (72.9%) | 22 (2.0%) |
| Bachelor's Degree or higher | 499 (93.8%) | 0 (0.0%) |
| Total | 2,842 (66.9%) | 123 (2.9%) |
Employment Occupations by Sex in Lewistown borough
Management, Business, Science and Arts Occupations
The most common Management, Business, Science and Arts occupations in Lewistown borough are Management (307 | 9.1%), Health Diagnosing & Treating (303 | 9.0%), Community & Social Service (229 | 6.8%), Health Technologists (176 | 5.2%), and Education Instruction & Library (94 | 2.8%).

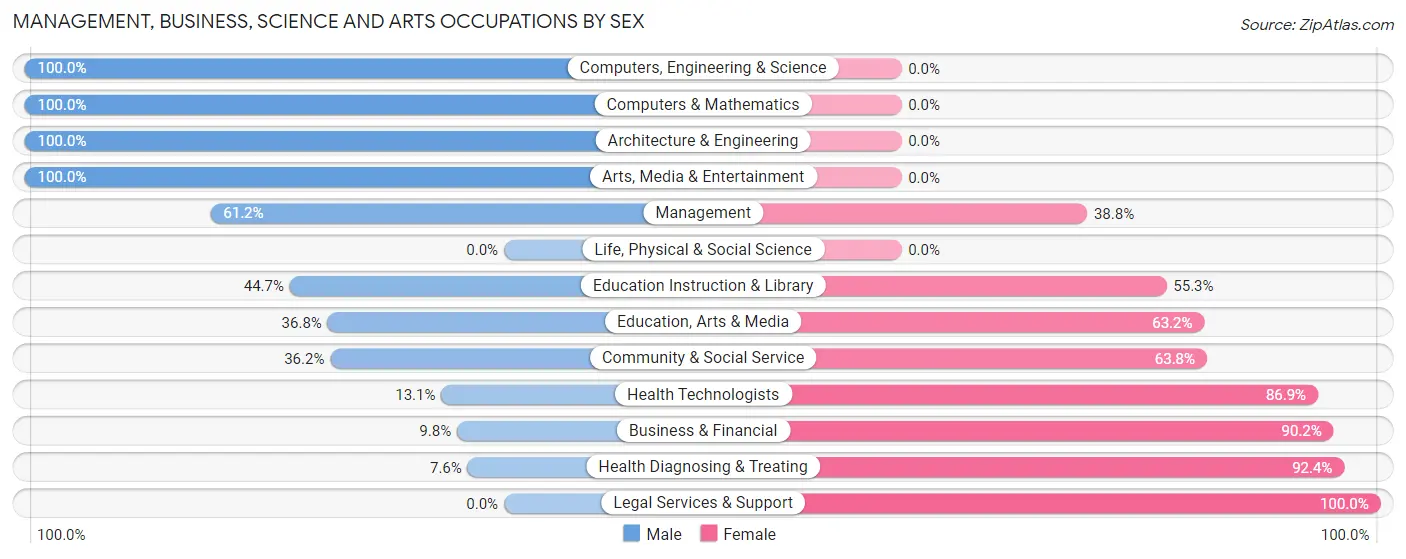
Management, Business, Science and Arts Occupations by Sex
Within the Management, Business, Science and Arts occupations in Lewistown borough, the most male-oriented occupations are Computers, Engineering & Science (100.0%), Computers & Mathematics (100.0%), and Architecture & Engineering (100.0%), while the most female-oriented occupations are Legal Services & Support (100.0%), Health Diagnosing & Treating (92.4%), and Business & Financial (90.2%).
| Occupation | Male | Female |
| Management | 188 (61.2%) | 119 (38.8%) |
| Business & Financial | 5 (9.8%) | 46 (90.2%) |
| Computers, Engineering & Science | 31 (100.0%) | 0 (0.0%) |
| Computers & Mathematics | 20 (100.0%) | 0 (0.0%) |
| Architecture & Engineering | 11 (100.0%) | 0 (0.0%) |
| Life, Physical & Social Science | 0 (0.0%) | 0 (0.0%) |
| Community & Social Service | 83 (36.2%) | 146 (63.8%) |
| Education, Arts & Media | 32 (36.8%) | 55 (63.2%) |
| Legal Services & Support | 0 (0.0%) | 39 (100.0%) |
| Education Instruction & Library | 42 (44.7%) | 52 (55.3%) |
| Arts, Media & Entertainment | 9 (100.0%) | 0 (0.0%) |
| Health Diagnosing & Treating | 23 (7.6%) | 280 (92.4%) |
| Health Technologists | 23 (13.1%) | 153 (86.9%) |
| Total (Category) | 330 (35.8%) | 591 (64.2%) |
| Total (Overall) | 1,716 (51.1%) | 1,642 (48.9%) |
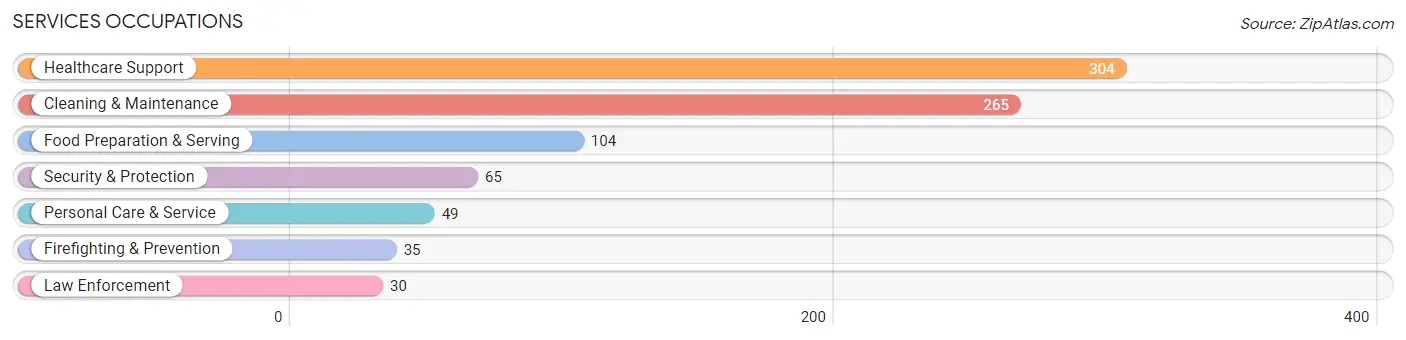
Services Occupations
The most common Services occupations in Lewistown borough are Healthcare Support (304 | 9.0%), Cleaning & Maintenance (265 | 7.9%), Food Preparation & Serving (104 | 3.1%), Security & Protection (65 | 1.9%), and Personal Care & Service (49 | 1.5%).
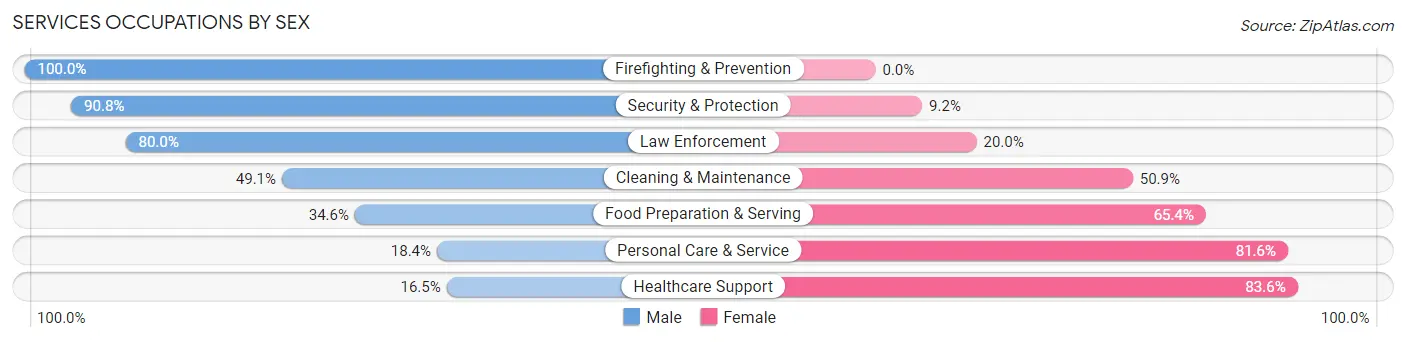
Services Occupations by Sex
Within the Services occupations in Lewistown borough, the most male-oriented occupations are Firefighting & Prevention (100.0%), Security & Protection (90.8%), and Law Enforcement (80.0%), while the most female-oriented occupations are Healthcare Support (83.6%), Personal Care & Service (81.6%), and Food Preparation & Serving (65.4%).
| Occupation | Male | Female |
| Healthcare Support | 50 (16.5%) | 254 (83.6%) |
| Security & Protection | 59 (90.8%) | 6 (9.2%) |
| Firefighting & Prevention | 35 (100.0%) | 0 (0.0%) |
| Law Enforcement | 24 (80.0%) | 6 (20.0%) |
| Food Preparation & Serving | 36 (34.6%) | 68 (65.4%) |
| Cleaning & Maintenance | 130 (49.1%) | 135 (50.9%) |
| Personal Care & Service | 9 (18.4%) | 40 (81.6%) |
| Total (Category) | 284 (36.1%) | 503 (63.9%) |
| Total (Overall) | 1,716 (51.1%) | 1,642 (48.9%) |
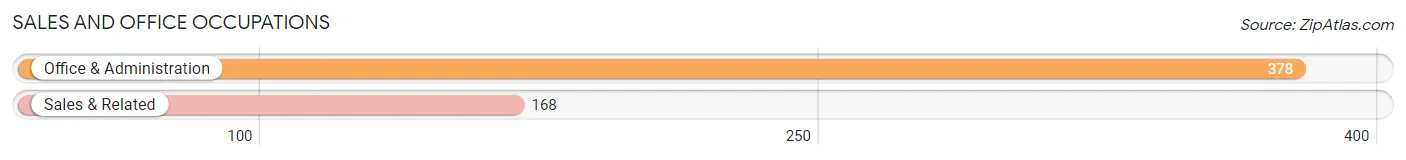
Sales and Office Occupations
The most common Sales and Office occupations in Lewistown borough are Office & Administration (378 | 11.3%), and Sales & Related (168 | 5.0%).
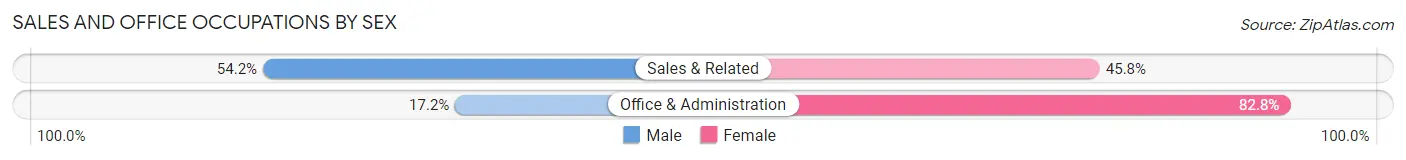
Sales and Office Occupations by Sex
| Occupation | Male | Female |
| Sales & Related | 91 (54.2%) | 77 (45.8%) |
| Office & Administration | 65 (17.2%) | 313 (82.8%) |
| Total (Category) | 156 (28.6%) | 390 (71.4%) |
| Total (Overall) | 1,716 (51.1%) | 1,642 (48.9%) |
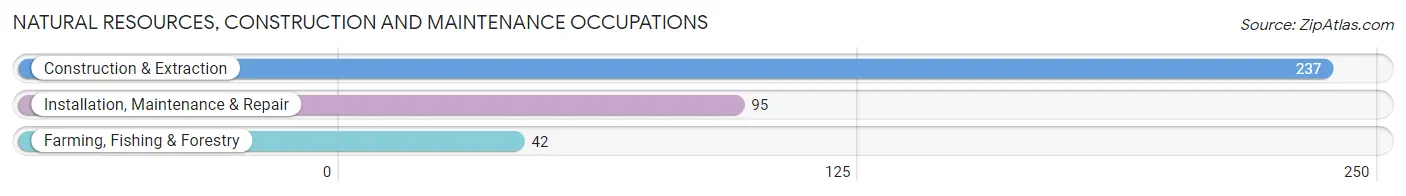
Natural Resources, Construction and Maintenance Occupations
The most common Natural Resources, Construction and Maintenance occupations in Lewistown borough are Construction & Extraction (237 | 7.1%), Installation, Maintenance & Repair (95 | 2.8%), and Farming, Fishing & Forestry (42 | 1.3%).
Natural Resources, Construction and Maintenance Occupations by Sex
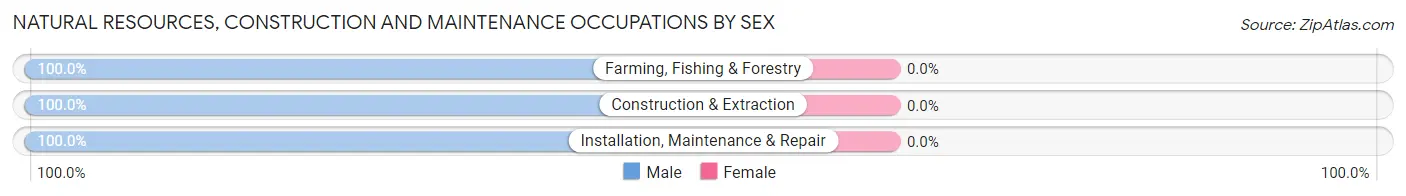
| Occupation | Male | Female |
| Farming, Fishing & Forestry | 42 (100.0%) | 0 (0.0%) |
| Construction & Extraction | 237 (100.0%) | 0 (0.0%) |
| Installation, Maintenance & Repair | 95 (100.0%) | 0 (0.0%) |
| Total (Category) | 374 (100.0%) | 0 (0.0%) |
| Total (Overall) | 1,716 (51.1%) | 1,642 (48.9%) |
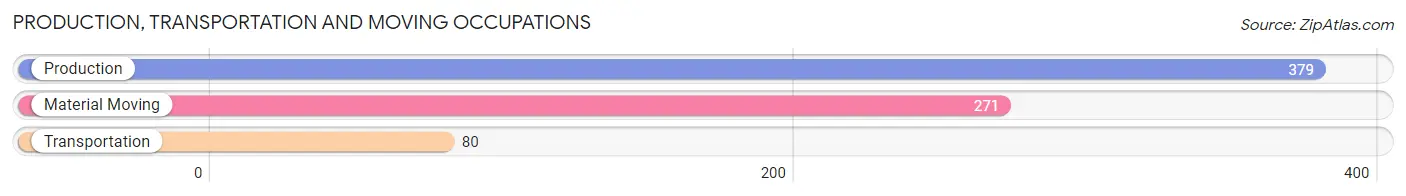
Production, Transportation and Moving Occupations
The most common Production, Transportation and Moving occupations in Lewistown borough are Production (379 | 11.3%), Material Moving (271 | 8.1%), and Transportation (80 | 2.4%).
Production, Transportation and Moving Occupations by Sex
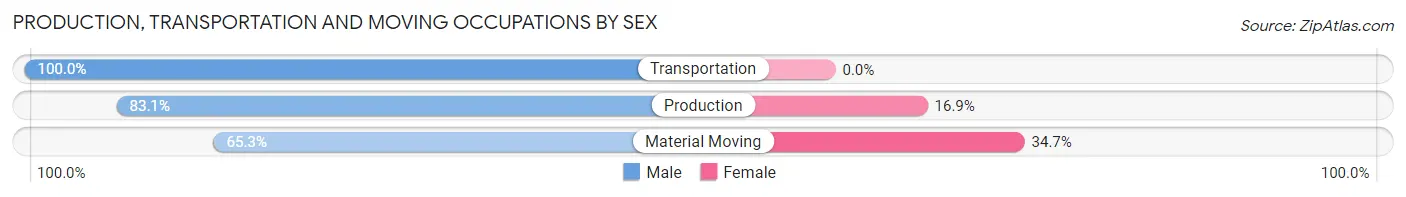
| Occupation | Male | Female |
| Production | 315 (83.1%) | 64 (16.9%) |
| Transportation | 80 (100.0%) | 0 (0.0%) |
| Material Moving | 177 (65.3%) | 94 (34.7%) |
| Total (Category) | 572 (78.4%) | 158 (21.6%) |
| Total (Overall) | 1,716 (51.1%) | 1,642 (48.9%) |
Employment Industries by Sex in Lewistown borough
Employment Industries in Lewistown borough
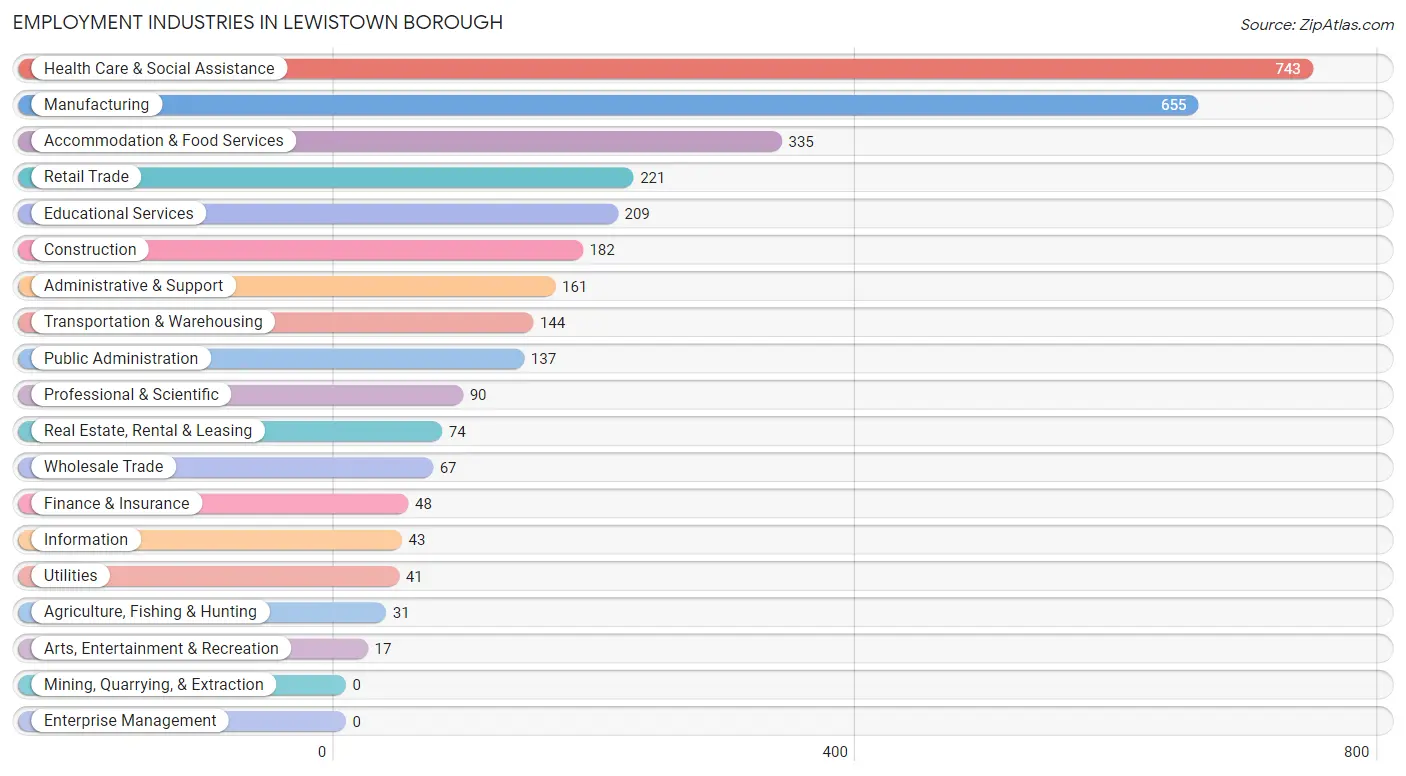
The major employment industries in Lewistown borough include Health Care & Social Assistance (743 | 22.1%), Manufacturing (655 | 19.5%), Accommodation & Food Services (335 | 10.0%), Retail Trade (221 | 6.6%), and Educational Services (209 | 6.2%).
Employment Industries by Sex in Lewistown borough
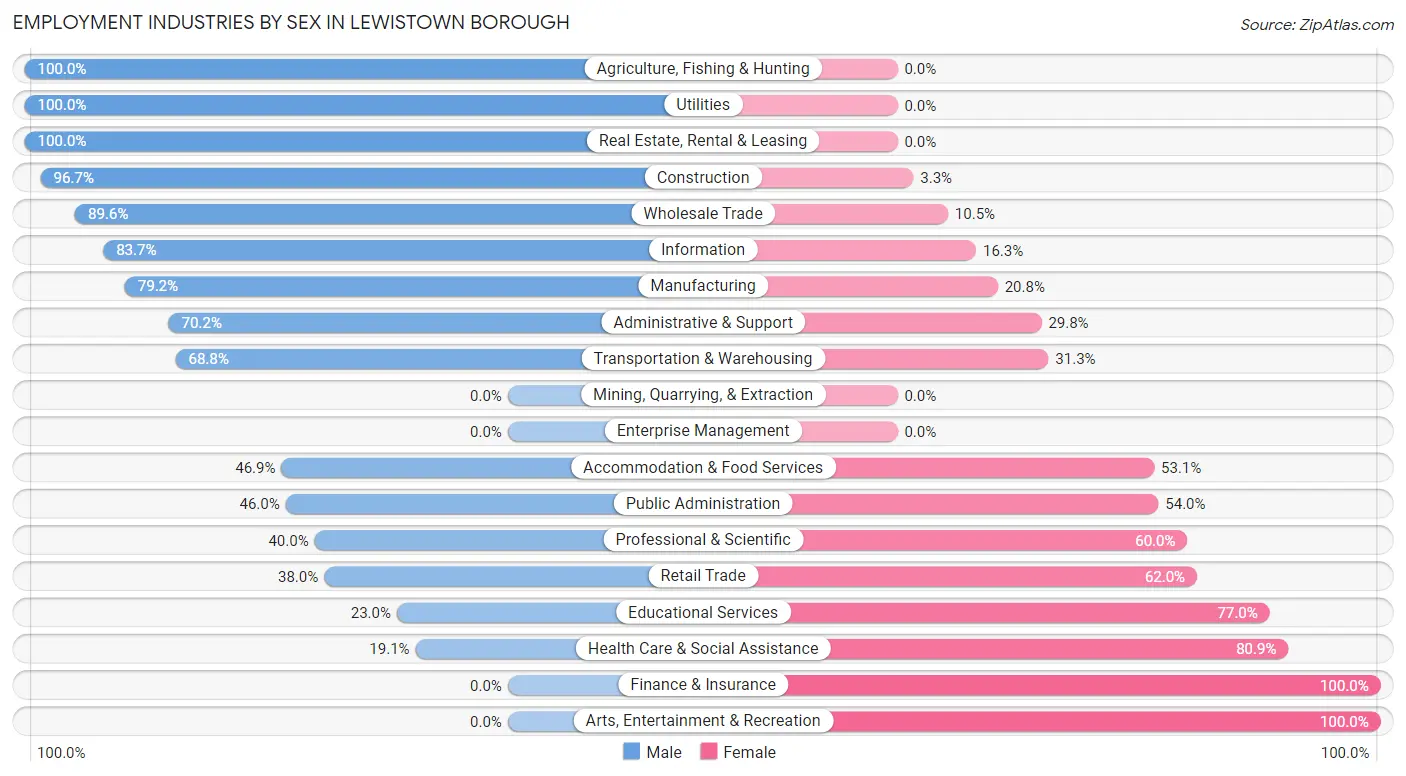
The Lewistown borough industries that see more men than women are Agriculture, Fishing & Hunting (100.0%), Utilities (100.0%), and Real Estate, Rental & Leasing (100.0%), whereas the industries that tend to have a higher number of women are Finance & Insurance (100.0%), Arts, Entertainment & Recreation (100.0%), and Health Care & Social Assistance (80.9%).
| Industry | Male | Female |
| Agriculture, Fishing & Hunting | 31 (100.0%) | 0 (0.0%) |
| Mining, Quarrying, & Extraction | 0 (0.0%) | 0 (0.0%) |
| Construction | 176 (96.7%) | 6 (3.3%) |
| Manufacturing | 519 (79.2%) | 136 (20.8%) |
| Wholesale Trade | 60 (89.5%) | 7 (10.4%) |
| Retail Trade | 84 (38.0%) | 137 (62.0%) |
| Transportation & Warehousing | 99 (68.8%) | 45 (31.2%) |
| Utilities | 41 (100.0%) | 0 (0.0%) |
| Information | 36 (83.7%) | 7 (16.3%) |
| Finance & Insurance | 0 (0.0%) | 48 (100.0%) |
| Real Estate, Rental & Leasing | 74 (100.0%) | 0 (0.0%) |
| Professional & Scientific | 36 (40.0%) | 54 (60.0%) |
| Enterprise Management | 0 (0.0%) | 0 (0.0%) |
| Administrative & Support | 113 (70.2%) | 48 (29.8%) |
| Educational Services | 48 (23.0%) | 161 (77.0%) |
| Health Care & Social Assistance | 142 (19.1%) | 601 (80.9%) |
| Arts, Entertainment & Recreation | 0 (0.0%) | 17 (100.0%) |
| Accommodation & Food Services | 157 (46.9%) | 178 (53.1%) |
| Public Administration | 63 (46.0%) | 74 (54.0%) |
| Total | 1,716 (51.1%) | 1,642 (48.9%) |
Education in Lewistown borough
School Enrollment in Lewistown borough
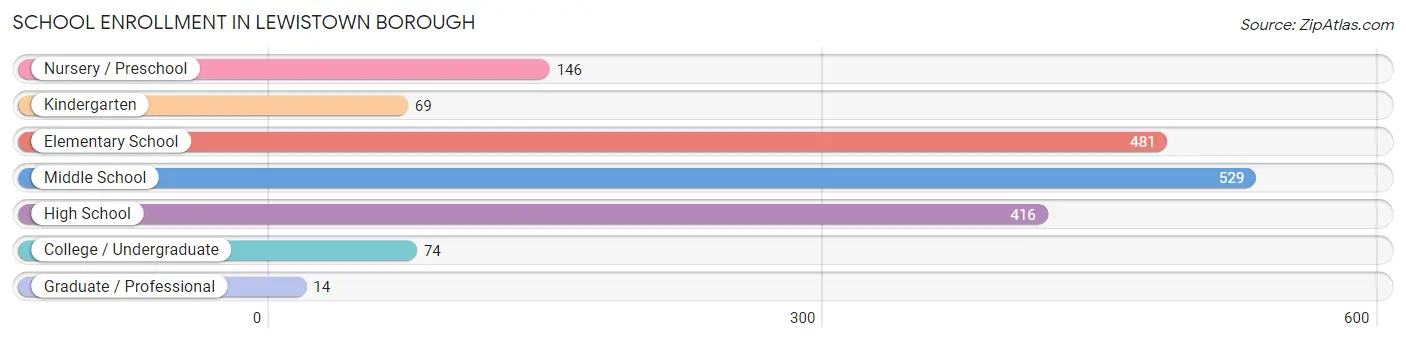
The most common levels of schooling among the 1,729 students in Lewistown borough are middle school (529 | 30.6%), elementary school (481 | 27.8%), and high school (416 | 24.1%).
| School Level | # Students | % Students |
| Nursery / Preschool | 146 | 8.4% |
| Kindergarten | 69 | 4.0% |
| Elementary School | 481 | 27.8% |
| Middle School | 529 | 30.6% |
| High School | 416 | 24.1% |
| College / Undergraduate | 74 | 4.3% |
| Graduate / Professional | 14 | 0.8% |
| Total | 1,729 | 100.0% |
School Enrollment by Age by Funding Source in Lewistown borough
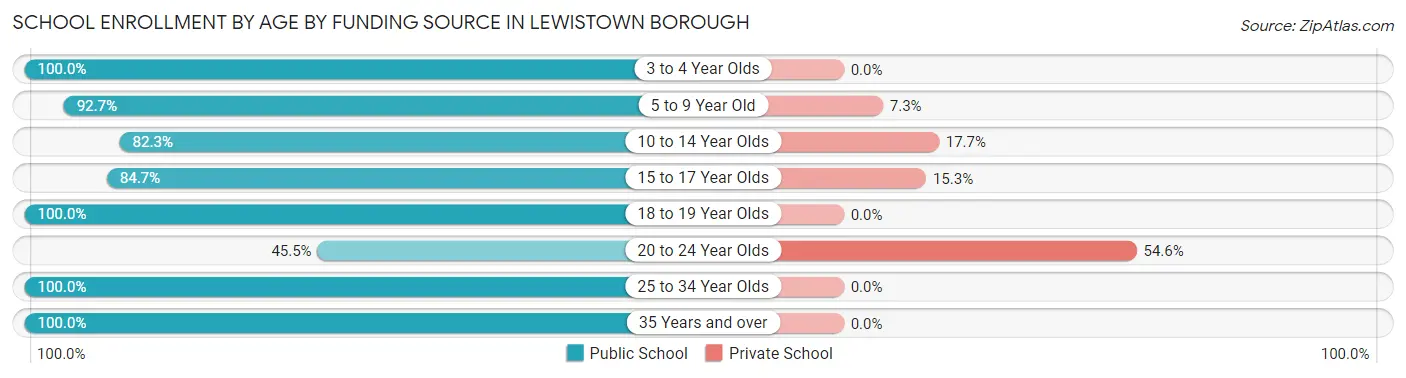
Out of a total of 1,729 students who are enrolled in schools in Lewistown borough, 223 (12.9%) attend a private institution, while the remaining 1,506 (87.1%) are enrolled in public schools. The age group of 20 to 24 year olds has the highest likelihood of being enrolled in private schools, with 30 (54.5% in the age bracket) enrolled. Conversely, the age group of 3 to 4 year olds has the lowest likelihood of being enrolled in a private school, with 102 (100.0% in the age bracket) attending a public institution.
| Age Bracket | Public School | Private School |
| 3 to 4 Year Olds | 102 (100.0%) | 0 (0.0%) |
| 5 to 9 Year Old | 508 (92.7%) | 40 (7.3%) |
| 10 to 14 Year Olds | 525 (82.3%) | 113 (17.7%) |
| 15 to 17 Year Olds | 221 (84.7%) | 40 (15.3%) |
| 18 to 19 Year Olds | 97 (100.0%) | 0 (0.0%) |
| 20 to 24 Year Olds | 25 (45.5%) | 30 (54.5%) |
| 25 to 34 Year Olds | 7 (100.0%) | 0 (0.0%) |
| 35 Years and over | 21 (100.0%) | 0 (0.0%) |
| Total | 1,506 (87.1%) | 223 (12.9%) |
Educational Attainment by Field of Study in Lewistown borough
Science & technology (183 | 26.8%), business (108 | 15.8%), arts & humanities (108 | 15.8%), education (68 | 9.9%), and liberal arts & history (43 | 6.3%) are the most common fields of study among 684 individuals in Lewistown borough who have obtained a bachelor's degree or higher.
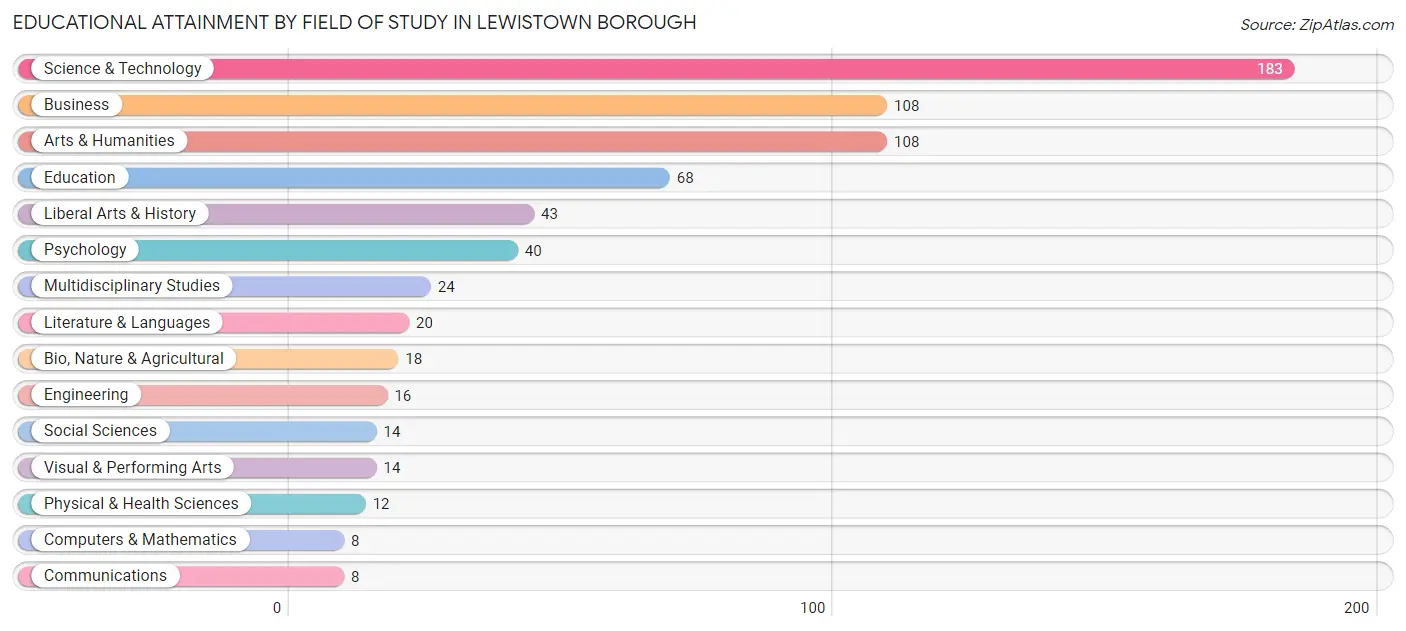
| Field of Study | # Graduates | % Graduates |
| Computers & Mathematics | 8 | 1.2% |
| Bio, Nature & Agricultural | 18 | 2.6% |
| Physical & Health Sciences | 12 | 1.8% |
| Psychology | 40 | 5.9% |
| Social Sciences | 14 | 2.1% |
| Engineering | 16 | 2.3% |
| Multidisciplinary Studies | 24 | 3.5% |
| Science & Technology | 183 | 26.8% |
| Business | 108 | 15.8% |
| Education | 68 | 9.9% |
| Literature & Languages | 20 | 2.9% |
| Liberal Arts & History | 43 | 6.3% |
| Visual & Performing Arts | 14 | 2.1% |
| Communications | 8 | 1.2% |
| Arts & Humanities | 108 | 15.8% |
| Total | 684 | 100.0% |
Transportation & Commute in Lewistown borough
Vehicle Availability by Sex in Lewistown borough
The most prevalent vehicle ownership categories in Lewistown borough are males with 2 vehicles (727, accounting for 42.6%) and females with 2 vehicles (560, making up 44.9%).
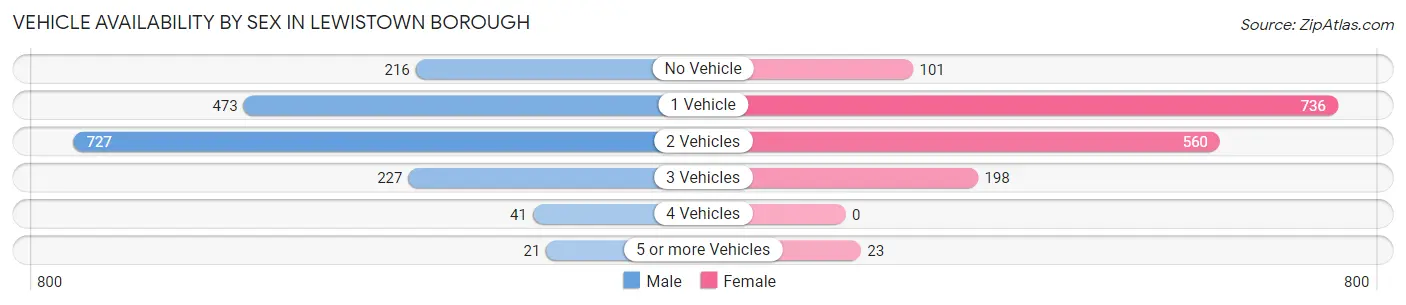
| Vehicles Available | Male | Female |
| No Vehicle | 216 (12.7%) | 101 (6.2%) |
| 1 Vehicle | 473 (27.7%) | 736 (45.5%) |
| 2 Vehicles | 727 (42.6%) | 560 (34.6%) |
| 3 Vehicles | 227 (13.3%) | 198 (12.2%) |
| 4 Vehicles | 41 (2.4%) | 0 (0.0%) |
| 5 or more Vehicles | 21 (1.2%) | 23 (1.4%) |
| Total | 1,705 (100.0%) | 1,618 (100.0%) |
Commute Time in Lewistown borough
The most frequently occuring commute durations in Lewistown borough are 5 to 9 minutes (811 commuters, 25.4%), 10 to 14 minutes (691 commuters, 21.6%), and 15 to 19 minutes (347 commuters, 10.8%).
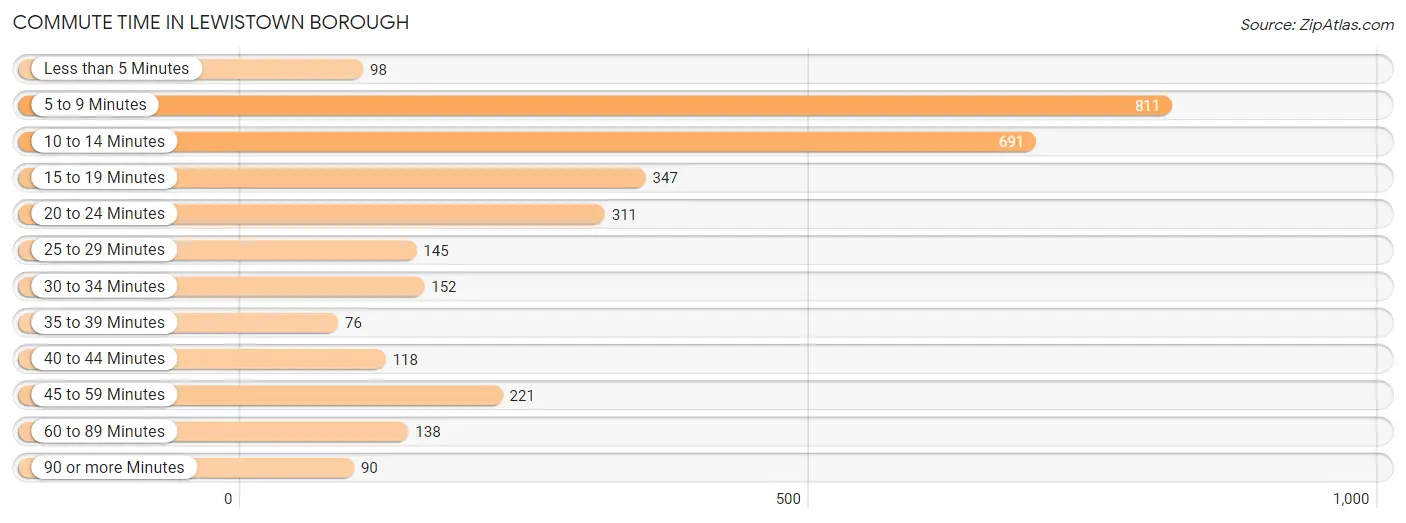
| Commute Time | # Commuters | % Commuters |
| Less than 5 Minutes | 98 | 3.1% |
| 5 to 9 Minutes | 811 | 25.4% |
| 10 to 14 Minutes | 691 | 21.6% |
| 15 to 19 Minutes | 347 | 10.8% |
| 20 to 24 Minutes | 311 | 9.7% |
| 25 to 29 Minutes | 145 | 4.5% |
| 30 to 34 Minutes | 152 | 4.8% |
| 35 to 39 Minutes | 76 | 2.4% |
| 40 to 44 Minutes | 118 | 3.7% |
| 45 to 59 Minutes | 221 | 6.9% |
| 60 to 89 Minutes | 138 | 4.3% |
| 90 or more Minutes | 90 | 2.8% |
Commute Time by Sex in Lewistown borough
The most common commute times in Lewistown borough are 10 to 14 minutes (274 commuters, 16.8%) for males and 5 to 9 minutes (572 commuters, 36.5%) for females.
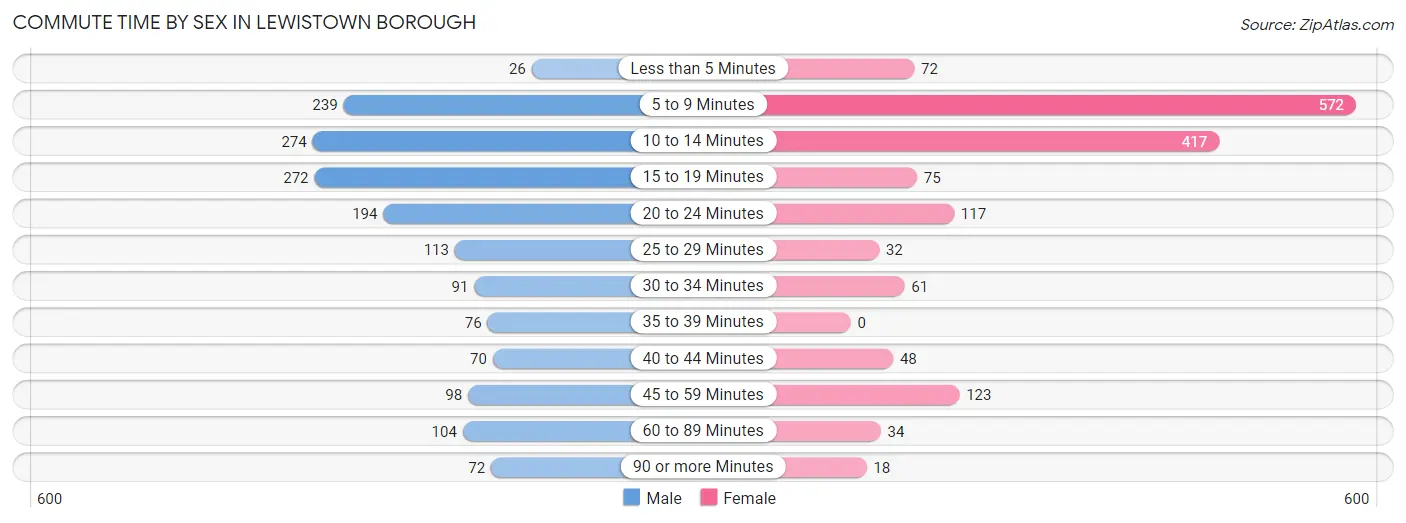
| Commute Time | Male | Female |
| Less than 5 Minutes | 26 (1.6%) | 72 (4.6%) |
| 5 to 9 Minutes | 239 (14.7%) | 572 (36.5%) |
| 10 to 14 Minutes | 274 (16.8%) | 417 (26.6%) |
| 15 to 19 Minutes | 272 (16.7%) | 75 (4.8%) |
| 20 to 24 Minutes | 194 (11.9%) | 117 (7.5%) |
| 25 to 29 Minutes | 113 (6.9%) | 32 (2.0%) |
| 30 to 34 Minutes | 91 (5.6%) | 61 (3.9%) |
| 35 to 39 Minutes | 76 (4.7%) | 0 (0.0%) |
| 40 to 44 Minutes | 70 (4.3%) | 48 (3.1%) |
| 45 to 59 Minutes | 98 (6.0%) | 123 (7.8%) |
| 60 to 89 Minutes | 104 (6.4%) | 34 (2.2%) |
| 90 or more Minutes | 72 (4.4%) | 18 (1.1%) |
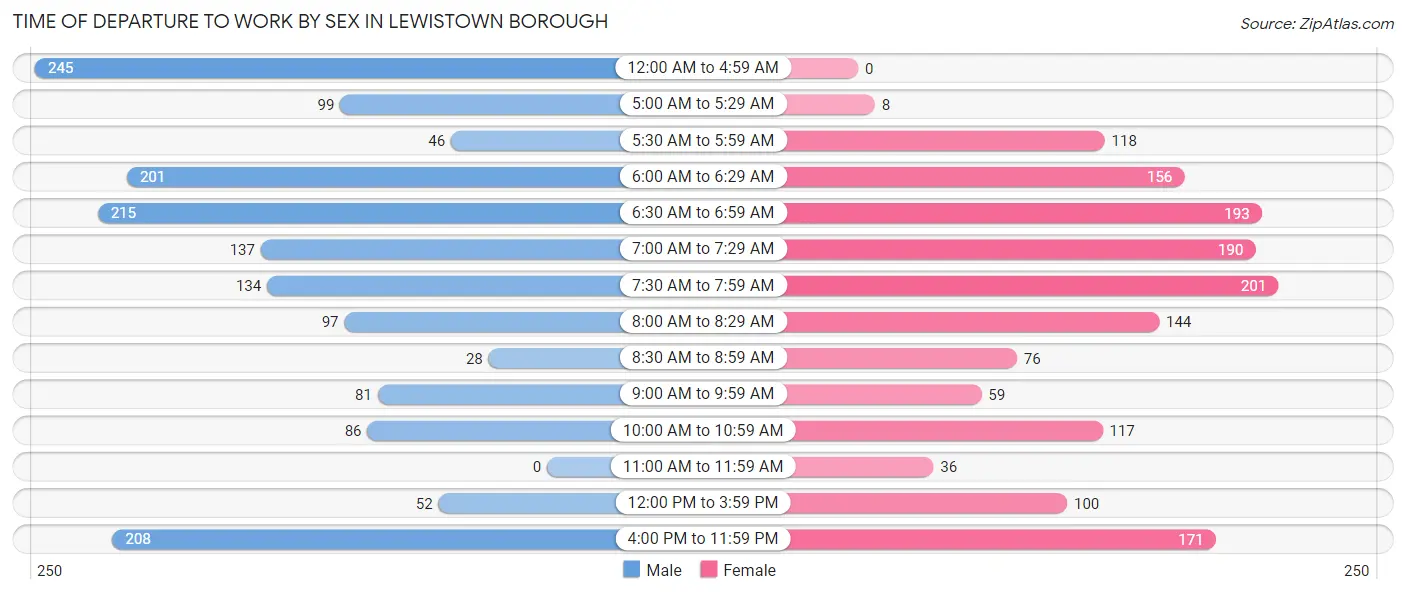
Time of Departure to Work by Sex in Lewistown borough
The most frequent times of departure to work in Lewistown borough are 12:00 AM to 4:59 AM (245, 15.0%) for males and 7:30 AM to 7:59 AM (201, 12.8%) for females.
| Time of Departure | Male | Female |
| 12:00 AM to 4:59 AM | 245 (15.0%) | 0 (0.0%) |
| 5:00 AM to 5:29 AM | 99 (6.1%) | 8 (0.5%) |
| 5:30 AM to 5:59 AM | 46 (2.8%) | 118 (7.5%) |
| 6:00 AM to 6:29 AM | 201 (12.3%) | 156 (9.9%) |
| 6:30 AM to 6:59 AM | 215 (13.2%) | 193 (12.3%) |
| 7:00 AM to 7:29 AM | 137 (8.4%) | 190 (12.1%) |
| 7:30 AM to 7:59 AM | 134 (8.2%) | 201 (12.8%) |
| 8:00 AM to 8:29 AM | 97 (5.9%) | 144 (9.2%) |
| 8:30 AM to 8:59 AM | 28 (1.7%) | 76 (4.8%) |
| 9:00 AM to 9:59 AM | 81 (5.0%) | 59 (3.8%) |
| 10:00 AM to 10:59 AM | 86 (5.3%) | 117 (7.5%) |
| 11:00 AM to 11:59 AM | 0 (0.0%) | 36 (2.3%) |
| 12:00 PM to 3:59 PM | 52 (3.2%) | 100 (6.4%) |
| 4:00 PM to 11:59 PM | 208 (12.8%) | 171 (10.9%) |
| Total | 1,629 (100.0%) | 1,569 (100.0%) |
Housing Occupancy in Lewistown borough
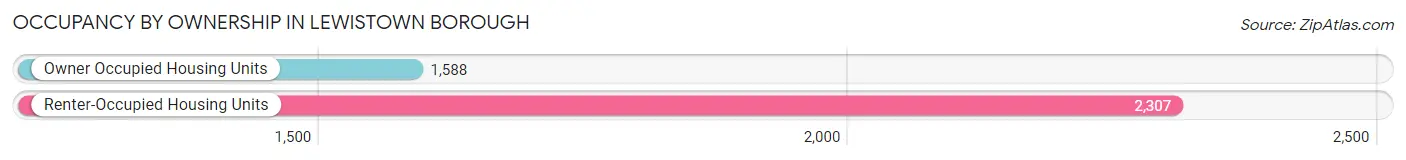
Occupancy by Ownership in Lewistown borough
Of the total 3,895 dwellings in Lewistown borough, owner-occupied units account for 1,588 (40.8%), while renter-occupied units make up 2,307 (59.2%).
| Occupancy | # Housing Units | % Housing Units |
| Owner Occupied Housing Units | 1,588 | 40.8% |
| Renter-Occupied Housing Units | 2,307 | 59.2% |
| Total Occupied Housing Units | 3,895 | 100.0% |
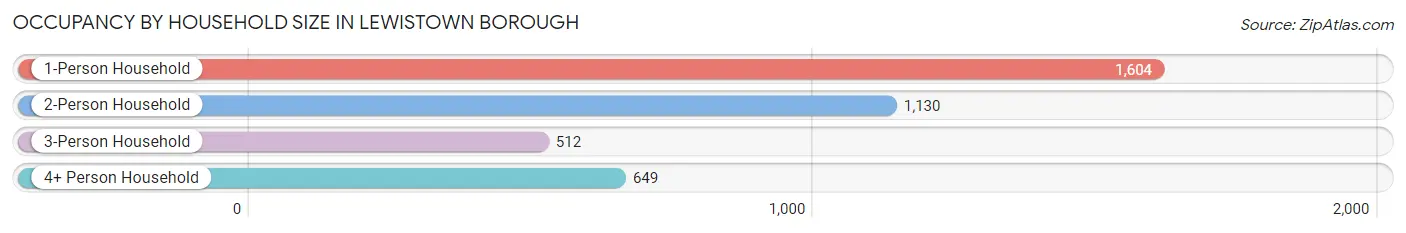
Occupancy by Household Size in Lewistown borough
| Household Size | # Housing Units | % Housing Units |
| 1-Person Household | 1,604 | 41.2% |
| 2-Person Household | 1,130 | 29.0% |
| 3-Person Household | 512 | 13.2% |
| 4+ Person Household | 649 | 16.7% |
| Total Housing Units | 3,895 | 100.0% |
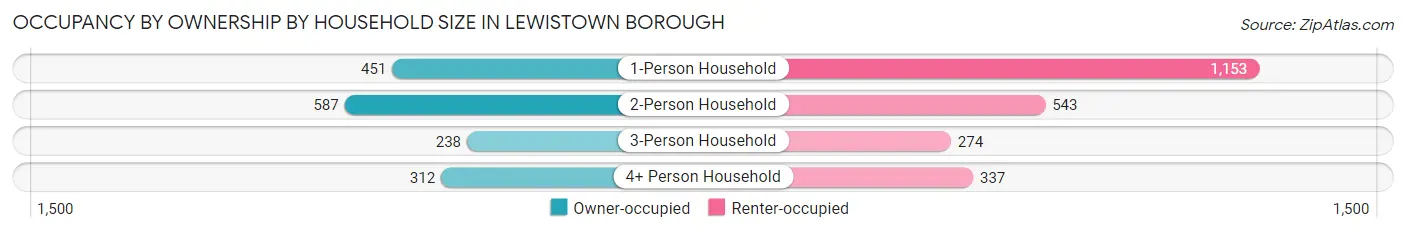
Occupancy by Ownership by Household Size in Lewistown borough
| Household Size | Owner-occupied | Renter-occupied |
| 1-Person Household | 451 (28.1%) | 1,153 (71.9%) |
| 2-Person Household | 587 (51.9%) | 543 (48.0%) |
| 3-Person Household | 238 (46.5%) | 274 (53.5%) |
| 4+ Person Household | 312 (48.1%) | 337 (51.9%) |
| Total Housing Units | 1,588 (40.8%) | 2,307 (59.2%) |
Occupancy by Educational Attainment in Lewistown borough
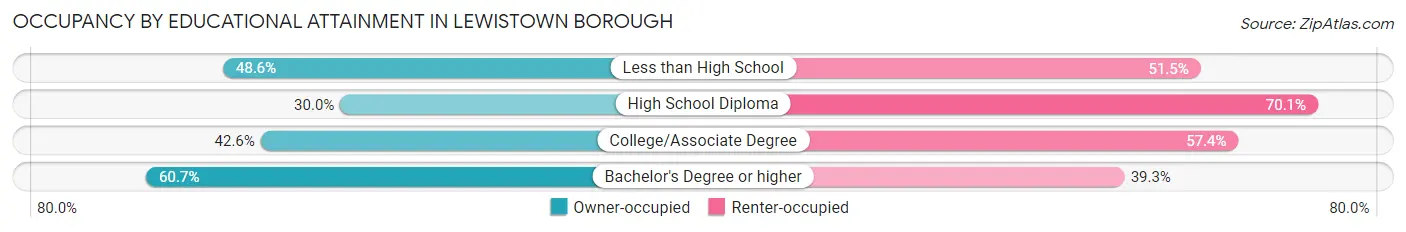
| Household Size | Owner-occupied | Renter-occupied |
| Less than High School | 352 (48.5%) | 373 (51.4%) |
| High School Diploma | 492 (29.9%) | 1,151 (70.1%) |
| College/Associate Degree | 430 (42.6%) | 580 (57.4%) |
| Bachelor's Degree or higher | 314 (60.7%) | 203 (39.3%) |
Occupancy by Age of Householder in Lewistown borough
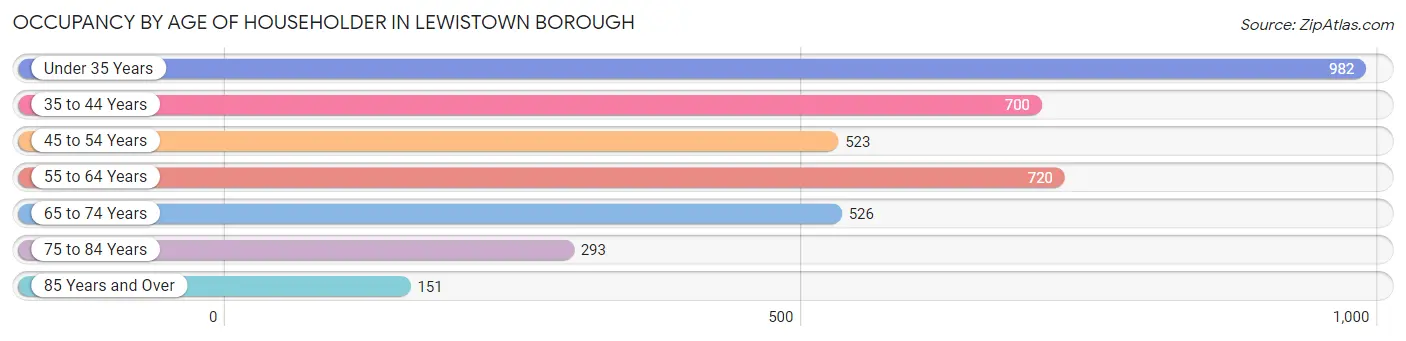
| Age Bracket | # Households | % Households |
| Under 35 Years | 982 | 25.2% |
| 35 to 44 Years | 700 | 18.0% |
| 45 to 54 Years | 523 | 13.4% |
| 55 to 64 Years | 720 | 18.5% |
| 65 to 74 Years | 526 | 13.5% |
| 75 to 84 Years | 293 | 7.5% |
| 85 Years and Over | 151 | 3.9% |
| Total | 3,895 | 100.0% |
Housing Finances in Lewistown borough
Median Income by Occupancy in Lewistown borough
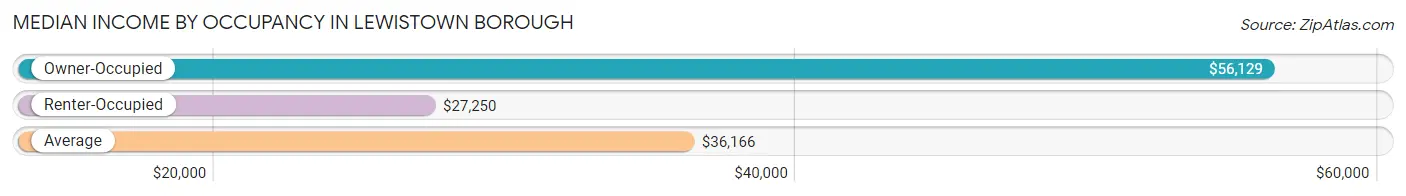
| Occupancy Type | # Households | Median Income |
| Owner-Occupied | 1,588 (40.8%) | $56,129 |
| Renter-Occupied | 2,307 (59.2%) | $27,250 |
| Average | 3,895 (100.0%) | $36,166 |
Occupancy by Householder Income Bracket in Lewistown borough
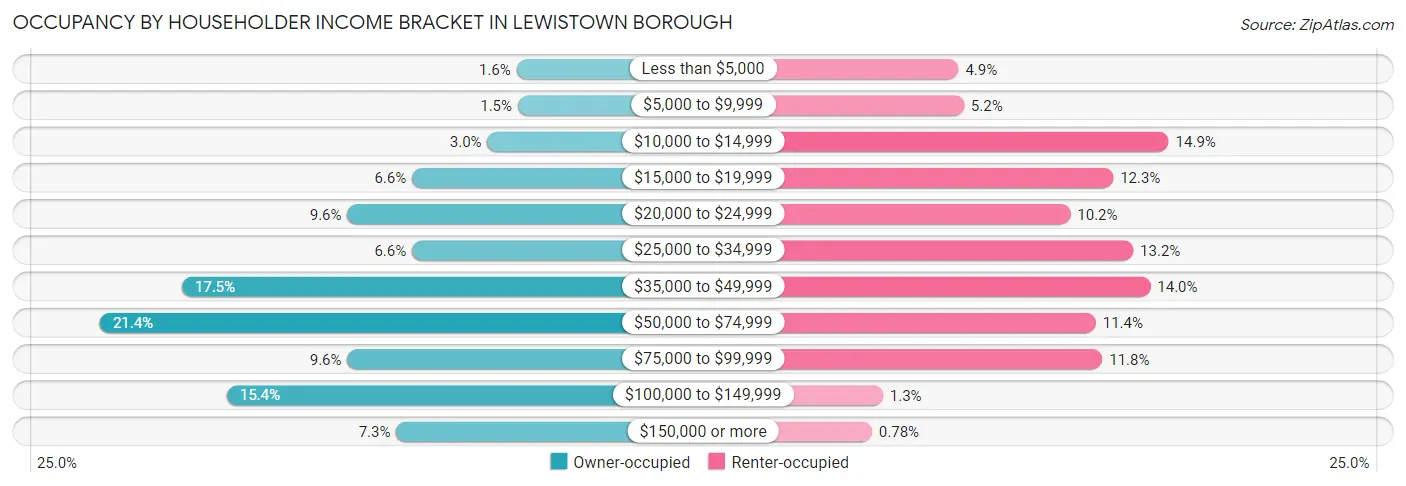
| Income Bracket | Owner-occupied | Renter-occupied |
| Less than $5,000 | 25 (1.6%) | 113 (4.9%) |
| $5,000 to $9,999 | 24 (1.5%) | 119 (5.2%) |
| $10,000 to $14,999 | 47 (3.0%) | 344 (14.9%) |
| $15,000 to $19,999 | 104 (6.6%) | 283 (12.3%) |
| $20,000 to $24,999 | 153 (9.6%) | 236 (10.2%) |
| $25,000 to $34,999 | 104 (6.6%) | 305 (13.2%) |
| $35,000 to $49,999 | 278 (17.5%) | 324 (14.0%) |
| $50,000 to $74,999 | 340 (21.4%) | 264 (11.4%) |
| $75,000 to $99,999 | 153 (9.6%) | 271 (11.7%) |
| $100,000 to $149,999 | 244 (15.4%) | 30 (1.3%) |
| $150,000 or more | 116 (7.3%) | 18 (0.8%) |
| Total | 1,588 (100.0%) | 2,307 (100.0%) |
Monthly Housing Cost Tiers in Lewistown borough
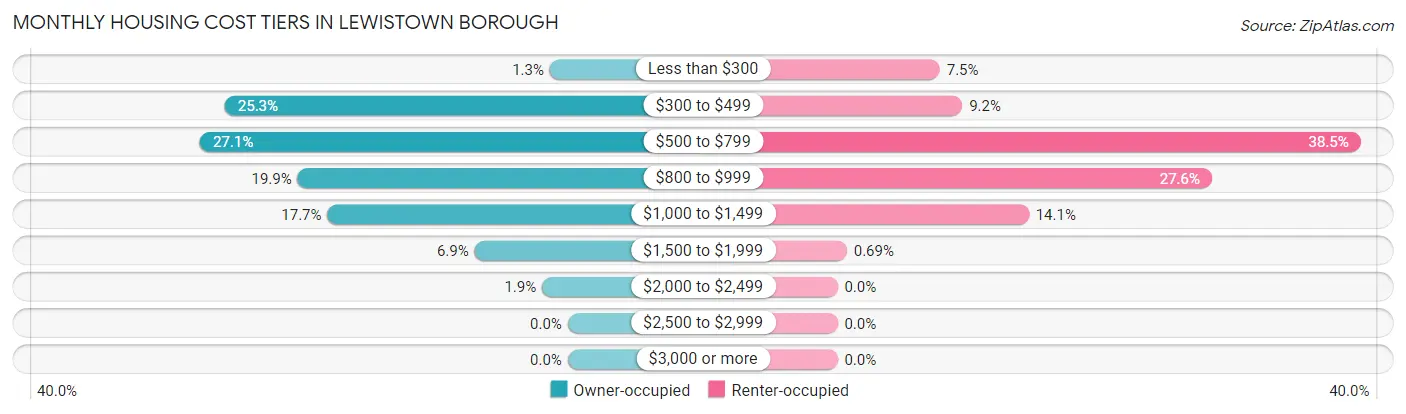
| Monthly Cost | Owner-occupied | Renter-occupied |
| Less than $300 | 21 (1.3%) | 174 (7.5%) |
| $300 to $499 | 401 (25.3%) | 212 (9.2%) |
| $500 to $799 | 430 (27.1%) | 889 (38.5%) |
| $800 to $999 | 316 (19.9%) | 636 (27.6%) |
| $1,000 to $1,499 | 281 (17.7%) | 325 (14.1%) |
| $1,500 to $1,999 | 109 (6.9%) | 16 (0.7%) |
| $2,000 to $2,499 | 30 (1.9%) | 0 (0.0%) |
| $2,500 to $2,999 | 0 (0.0%) | 0 (0.0%) |
| $3,000 or more | 0 (0.0%) | 0 (0.0%) |
| Total | 1,588 (100.0%) | 2,307 (100.0%) |
Physical Housing Characteristics in Lewistown borough
Housing Structures in Lewistown borough
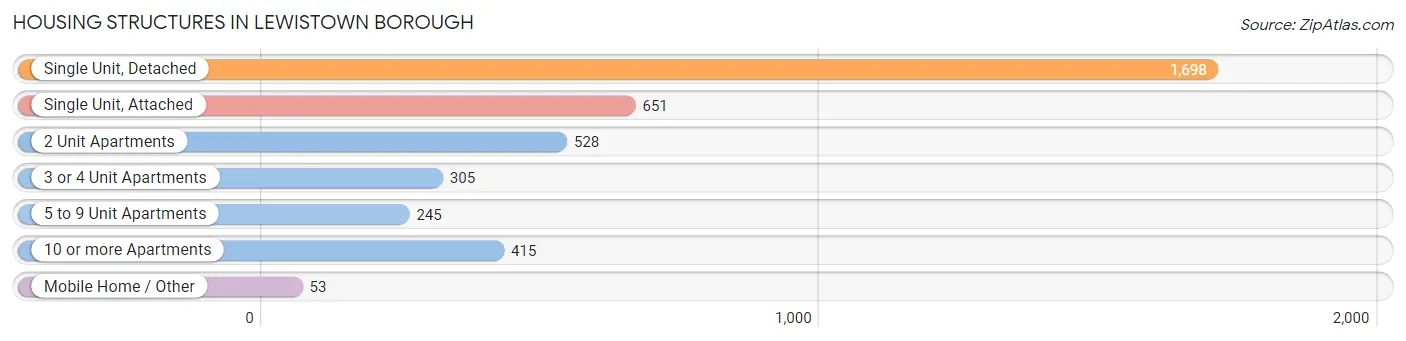
| Structure Type | # Housing Units | % Housing Units |
| Single Unit, Detached | 1,698 | 43.6% |
| Single Unit, Attached | 651 | 16.7% |
| 2 Unit Apartments | 528 | 13.6% |
| 3 or 4 Unit Apartments | 305 | 7.8% |
| 5 to 9 Unit Apartments | 245 | 6.3% |
| 10 or more Apartments | 415 | 10.6% |
| Mobile Home / Other | 53 | 1.4% |
| Total | 3,895 | 100.0% |
Housing Structures by Occupancy in Lewistown borough
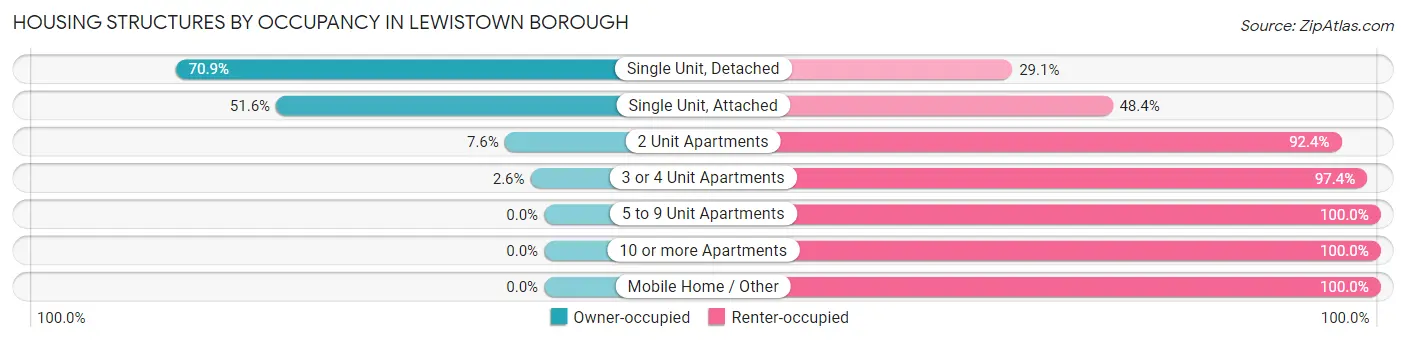
| Structure Type | Owner-occupied | Renter-occupied |
| Single Unit, Detached | 1,204 (70.9%) | 494 (29.1%) |
| Single Unit, Attached | 336 (51.6%) | 315 (48.4%) |
| 2 Unit Apartments | 40 (7.6%) | 488 (92.4%) |
| 3 or 4 Unit Apartments | 8 (2.6%) | 297 (97.4%) |
| 5 to 9 Unit Apartments | 0 (0.0%) | 245 (100.0%) |
| 10 or more Apartments | 0 (0.0%) | 415 (100.0%) |
| Mobile Home / Other | 0 (0.0%) | 53 (100.0%) |
| Total | 1,588 (40.8%) | 2,307 (59.2%) |
Housing Structures by Number of Rooms in Lewistown borough
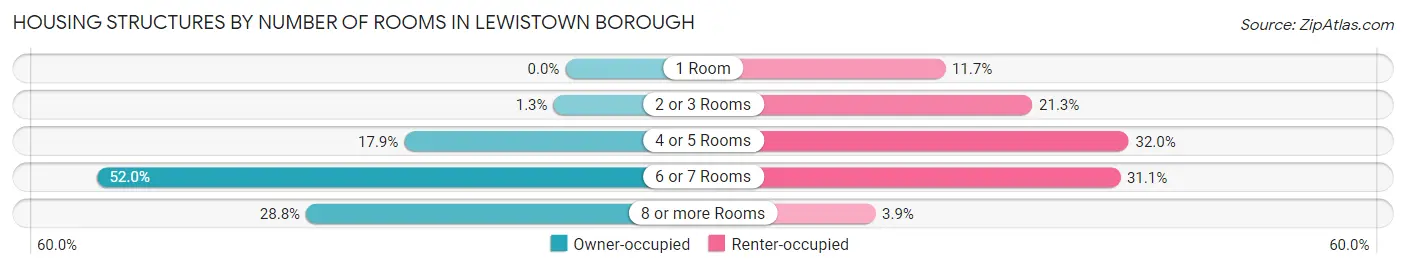
| Number of Rooms | Owner-occupied | Renter-occupied |
| 1 Room | 0 (0.0%) | 269 (11.7%) |
| 2 or 3 Rooms | 21 (1.3%) | 492 (21.3%) |
| 4 or 5 Rooms | 284 (17.9%) | 739 (32.0%) |
| 6 or 7 Rooms | 826 (52.0%) | 717 (31.1%) |
| 8 or more Rooms | 457 (28.8%) | 90 (3.9%) |
| Total | 1,588 (100.0%) | 2,307 (100.0%) |
Housing Structure by Heating Type in Lewistown borough
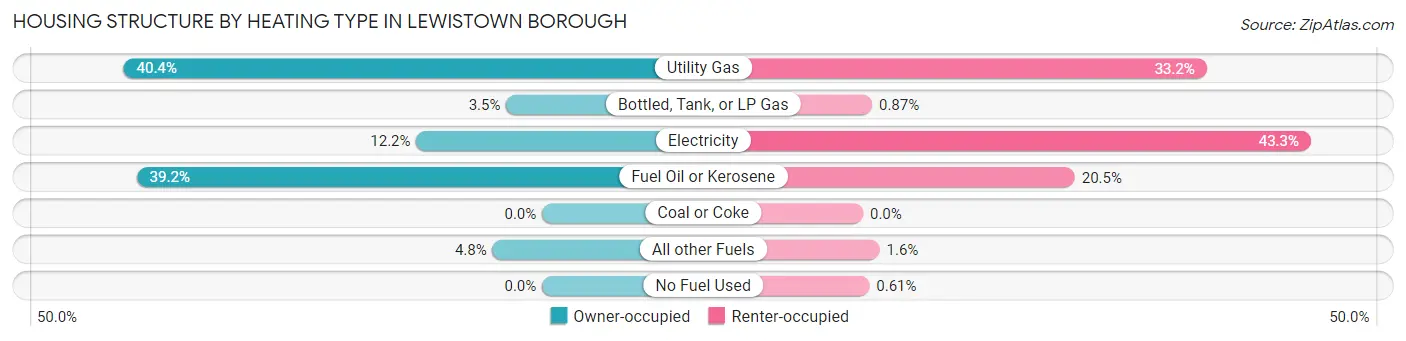
| Heating Type | Owner-occupied | Renter-occupied |
| Utility Gas | 642 (40.4%) | 766 (33.2%) |
| Bottled, Tank, or LP Gas | 55 (3.5%) | 20 (0.9%) |
| Electricity | 193 (12.1%) | 998 (43.3%) |
| Fuel Oil or Kerosene | 622 (39.2%) | 472 (20.5%) |
| Coal or Coke | 0 (0.0%) | 0 (0.0%) |
| All other Fuels | 76 (4.8%) | 37 (1.6%) |
| No Fuel Used | 0 (0.0%) | 14 (0.6%) |
| Total | 1,588 (100.0%) | 2,307 (100.0%) |
Household Vehicle Usage in Lewistown borough
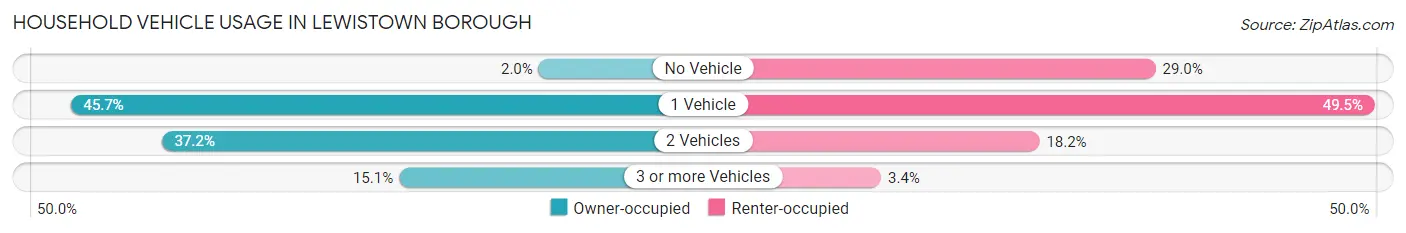
| Vehicles per Household | Owner-occupied | Renter-occupied |
| No Vehicle | 32 (2.0%) | 669 (29.0%) |
| 1 Vehicle | 726 (45.7%) | 1,141 (49.5%) |
| 2 Vehicles | 591 (37.2%) | 419 (18.2%) |
| 3 or more Vehicles | 239 (15.0%) | 78 (3.4%) |
| Total | 1,588 (100.0%) | 2,307 (100.0%) |
Real Estate & Mortgages in Lewistown borough
Real Estate and Mortgage Overview in Lewistown borough
| Characteristic | Without Mortgage | With Mortgage |
| Housing Units | 740 | 848 |
| Median Property Value | $76,700 | $89,700 |
| Median Household Income | $36,731 | $74 |
| Monthly Housing Costs | $484 | $0 |
| Real Estate Taxes | $1,593 | $0 |
Property Value by Mortgage Status in Lewistown borough
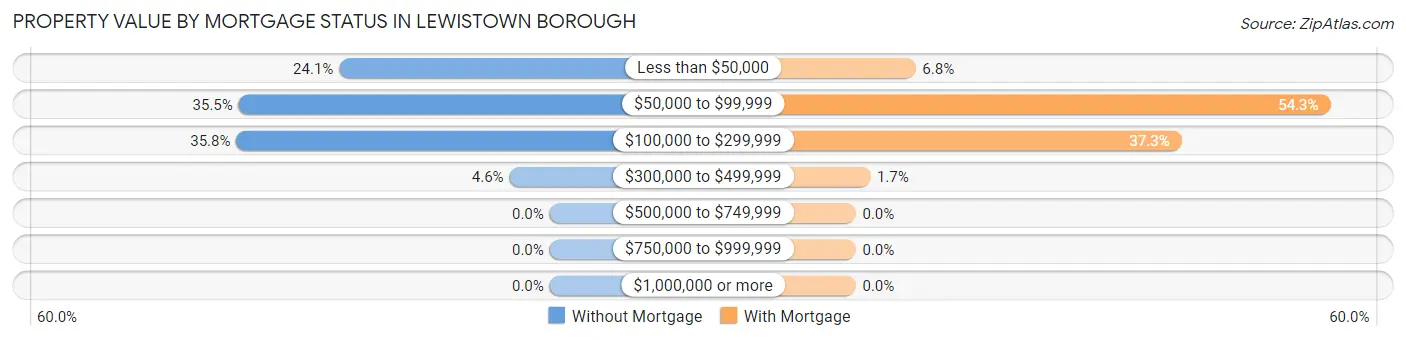
| Property Value | Without Mortgage | With Mortgage |
| Less than $50,000 | 178 (24.0%) | 58 (6.8%) |
| $50,000 to $99,999 | 263 (35.5%) | 460 (54.2%) |
| $100,000 to $299,999 | 265 (35.8%) | 316 (37.3%) |
| $300,000 to $499,999 | 34 (4.6%) | 14 (1.7%) |
| $500,000 to $749,999 | 0 (0.0%) | 0 (0.0%) |
| $750,000 to $999,999 | 0 (0.0%) | 0 (0.0%) |
| $1,000,000 or more | 0 (0.0%) | 0 (0.0%) |
| Total | 740 (100.0%) | 848 (100.0%) |
Household Income by Mortgage Status in Lewistown borough
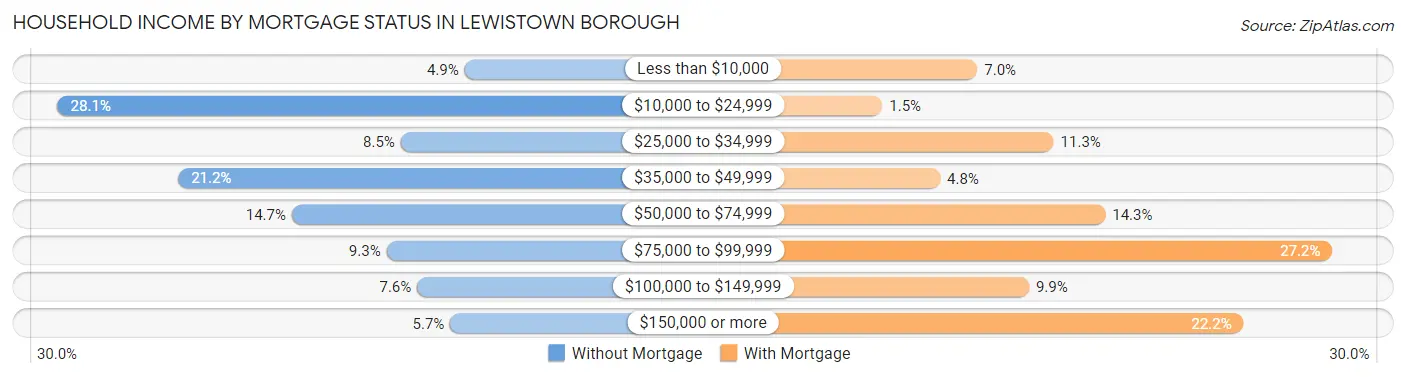
| Household Income | Without Mortgage | With Mortgage |
| Less than $10,000 | 36 (4.9%) | 59 (7.0%) |
| $10,000 to $24,999 | 208 (28.1%) | 13 (1.5%) |
| $25,000 to $34,999 | 63 (8.5%) | 96 (11.3%) |
| $35,000 to $49,999 | 157 (21.2%) | 41 (4.8%) |
| $50,000 to $74,999 | 109 (14.7%) | 121 (14.3%) |
| $75,000 to $99,999 | 69 (9.3%) | 231 (27.2%) |
| $100,000 to $149,999 | 56 (7.6%) | 84 (9.9%) |
| $150,000 or more | 42 (5.7%) | 188 (22.2%) |
| Total | 740 (100.0%) | 848 (100.0%) |
Property Value to Household Income Ratio in Lewistown borough
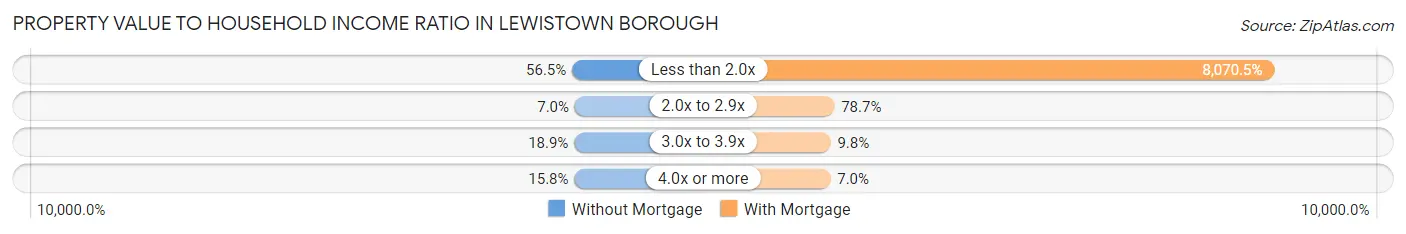
| Value-to-Income Ratio | Without Mortgage | With Mortgage |
| Less than 2.0x | 418 (56.5%) | 68,438 (8,070.5%) |
| 2.0x to 2.9x | 52 (7.0%) | 667 (78.7%) |
| 3.0x to 3.9x | 140 (18.9%) | 83 (9.8%) |
| 4.0x or more | 117 (15.8%) | 59 (7.0%) |
| Total | 740 (100.0%) | 848 (100.0%) |
Real Estate Taxes by Mortgage Status in Lewistown borough
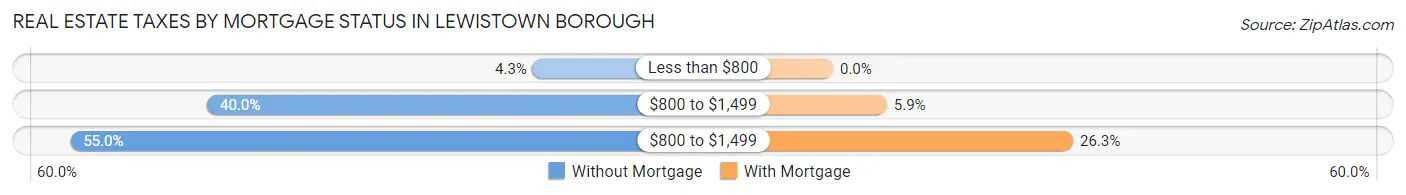
| Property Taxes | Without Mortgage | With Mortgage |
| Less than $800 | 32 (4.3%) | 0 (0.0%) |
| $800 to $1,499 | 296 (40.0%) | 50 (5.9%) |
| $800 to $1,499 | 407 (55.0%) | 223 (26.3%) |
| Total | 740 (100.0%) | 848 (100.0%) |
Health & Disability in Lewistown borough
Health Insurance Coverage by Age in Lewistown borough
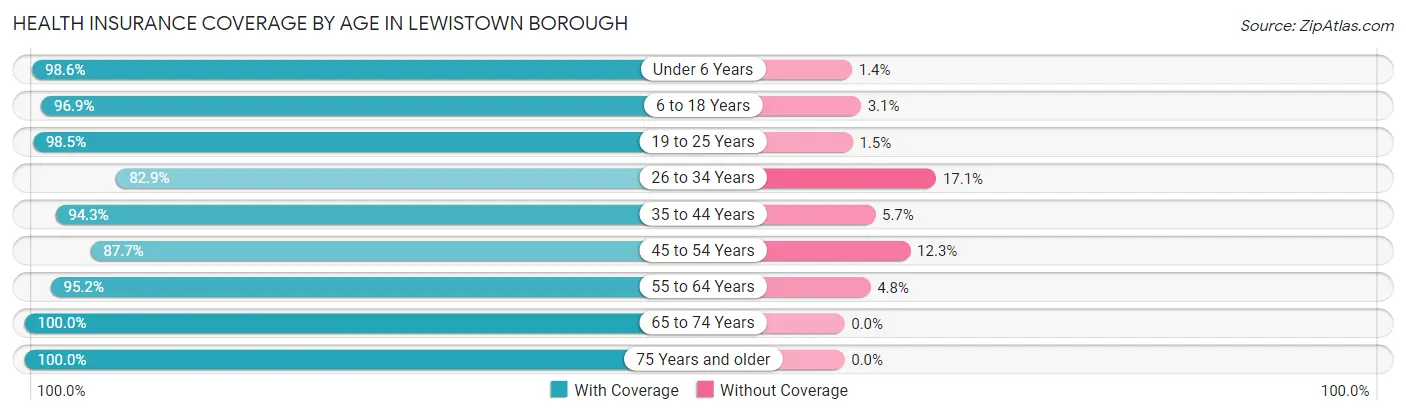
| Age Bracket | With Coverage | Without Coverage |
| Under 6 Years | 846 (98.6%) | 12 (1.4%) |
| 6 to 18 Years | 1,420 (96.9%) | 45 (3.1%) |
| 19 to 25 Years | 777 (98.5%) | 12 (1.5%) |
| 26 to 34 Years | 946 (82.9%) | 195 (17.1%) |
| 35 to 44 Years | 921 (94.3%) | 56 (5.7%) |
| 45 to 54 Years | 743 (87.7%) | 104 (12.3%) |
| 55 to 64 Years | 944 (95.2%) | 48 (4.8%) |
| 65 to 74 Years | 808 (100.0%) | 0 (0.0%) |
| 75 Years and older | 490 (100.0%) | 0 (0.0%) |
| Total | 7,895 (94.4%) | 472 (5.6%) |
Health Insurance Coverage by Citizenship Status in Lewistown borough
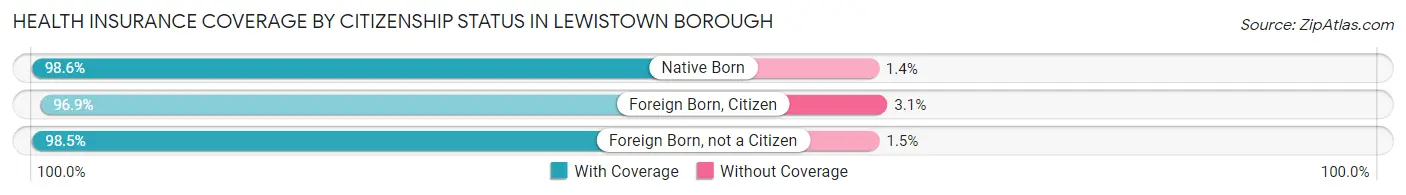
| Citizenship Status | With Coverage | Without Coverage |
| Native Born | 846 (98.6%) | 12 (1.4%) |
| Foreign Born, Citizen | 1,420 (96.9%) | 45 (3.1%) |
| Foreign Born, not a Citizen | 777 (98.5%) | 12 (1.5%) |
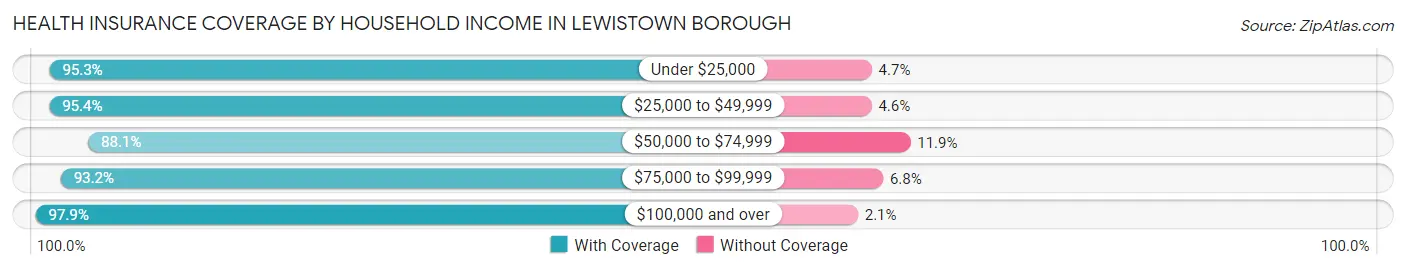
Health Insurance Coverage by Household Income in Lewistown borough
| Household Income | With Coverage | Without Coverage |
| Under $25,000 | 2,514 (95.3%) | 123 (4.7%) |
| $25,000 to $49,999 | 2,043 (95.4%) | 99 (4.6%) |
| $50,000 to $74,999 | 1,155 (88.1%) | 156 (11.9%) |
| $75,000 to $99,999 | 922 (93.2%) | 67 (6.8%) |
| $100,000 and over | 1,238 (97.9%) | 26 (2.1%) |
Public vs Private Health Insurance Coverage by Age in Lewistown borough
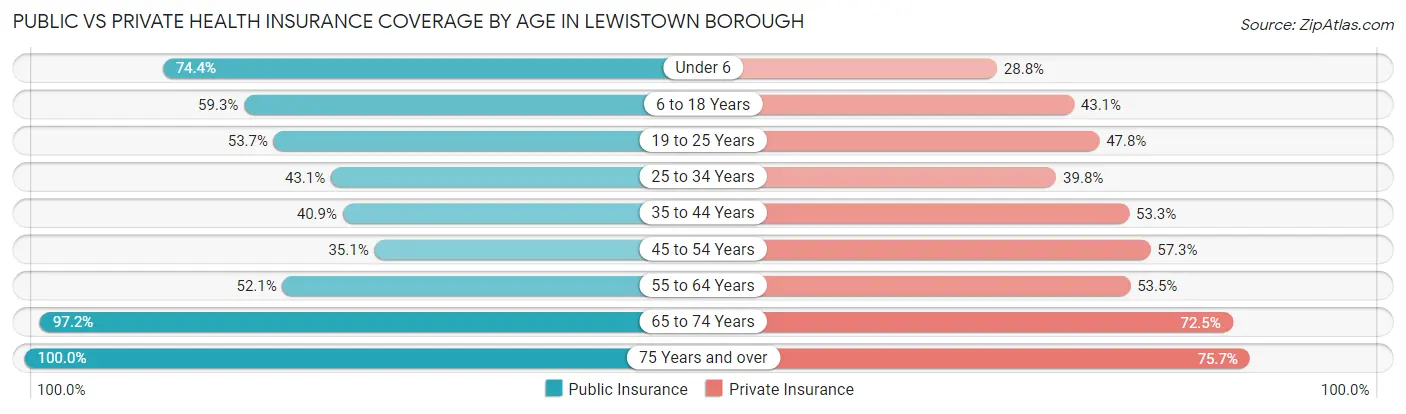
| Age Bracket | Public Insurance | Private Insurance |
| Under 6 | 638 (74.4%) | 247 (28.8%) |
| 6 to 18 Years | 868 (59.3%) | 631 (43.1%) |
| 19 to 25 Years | 424 (53.7%) | 377 (47.8%) |
| 25 to 34 Years | 492 (43.1%) | 454 (39.8%) |
| 35 to 44 Years | 400 (40.9%) | 521 (53.3%) |
| 45 to 54 Years | 297 (35.1%) | 485 (57.3%) |
| 55 to 64 Years | 517 (52.1%) | 531 (53.5%) |
| 65 to 74 Years | 785 (97.2%) | 586 (72.5%) |
| 75 Years and over | 490 (100.0%) | 371 (75.7%) |
| Total | 4,911 (58.7%) | 4,203 (50.2%) |
Disability Status by Sex by Age in Lewistown borough
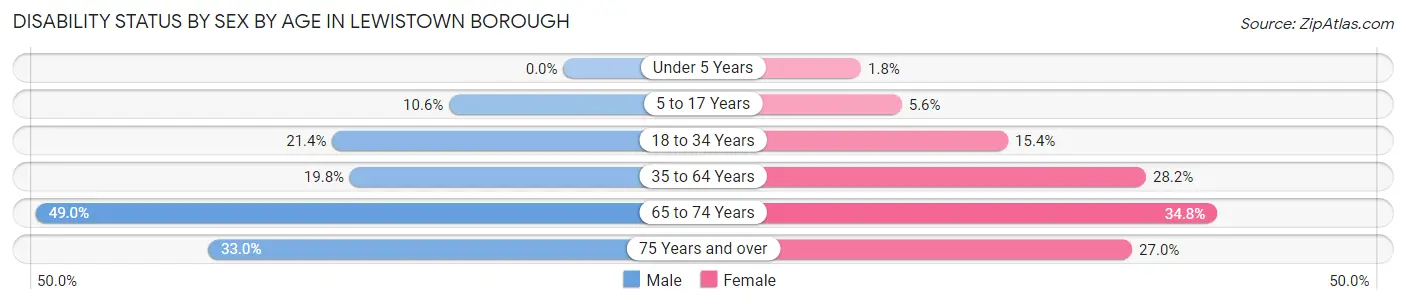
| Age Bracket | Male | Female |
| Under 5 Years | 0 (0.0%) | 9 (1.8%) |
| 5 to 17 Years | 74 (10.6%) | 43 (5.6%) |
| 18 to 34 Years | 179 (21.4%) | 184 (15.4%) |
| 35 to 64 Years | 287 (19.8%) | 386 (28.2%) |
| 65 to 74 Years | 189 (49.0%) | 147 (34.8%) |
| 75 Years and over | 60 (33.0%) | 83 (27.0%) |
Disability Class by Sex by Age in Lewistown borough
Disability Class: Hearing Difficulty
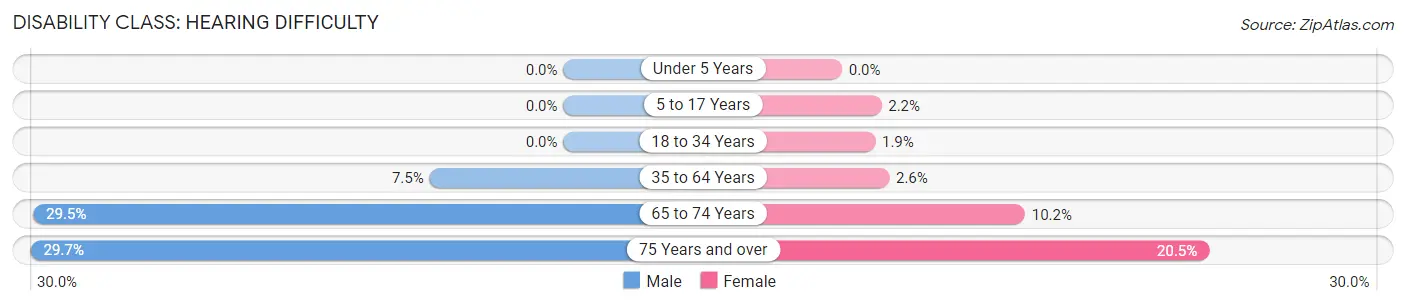
| Age Bracket | Male | Female |
| Under 5 Years | 0 (0.0%) | 0 (0.0%) |
| 5 to 17 Years | 0 (0.0%) | 17 (2.2%) |
| 18 to 34 Years | 0 (0.0%) | 22 (1.8%) |
| 35 to 64 Years | 108 (7.4%) | 36 (2.6%) |
| 65 to 74 Years | 114 (29.5%) | 43 (10.2%) |
| 75 Years and over | 54 (29.7%) | 63 (20.4%) |
Disability Class: Vision Difficulty
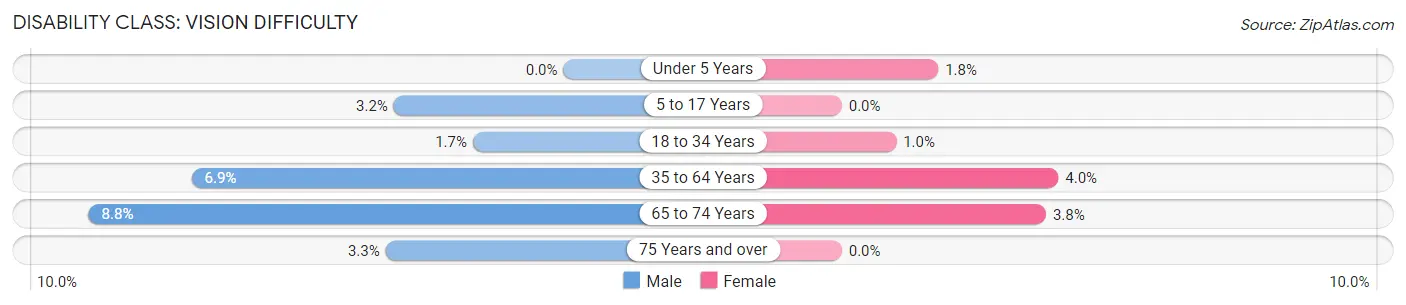
| Age Bracket | Male | Female |
| Under 5 Years | 0 (0.0%) | 9 (1.8%) |
| 5 to 17 Years | 22 (3.2%) | 0 (0.0%) |
| 18 to 34 Years | 14 (1.7%) | 12 (1.0%) |
| 35 to 64 Years | 100 (6.9%) | 55 (4.0%) |
| 65 to 74 Years | 34 (8.8%) | 16 (3.8%) |
| 75 Years and over | 6 (3.3%) | 0 (0.0%) |
Disability Class: Cognitive Difficulty
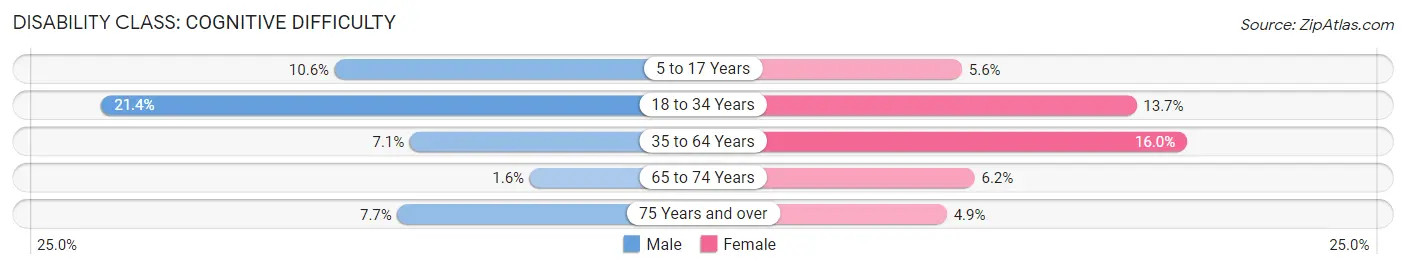
| Age Bracket | Male | Female |
| 5 to 17 Years | 74 (10.6%) | 43 (5.6%) |
| 18 to 34 Years | 179 (21.4%) | 163 (13.7%) |
| 35 to 64 Years | 103 (7.1%) | 219 (16.0%) |
| 65 to 74 Years | 6 (1.5%) | 26 (6.2%) |
| 75 Years and over | 14 (7.7%) | 15 (4.9%) |
Disability Class: Ambulatory Difficulty
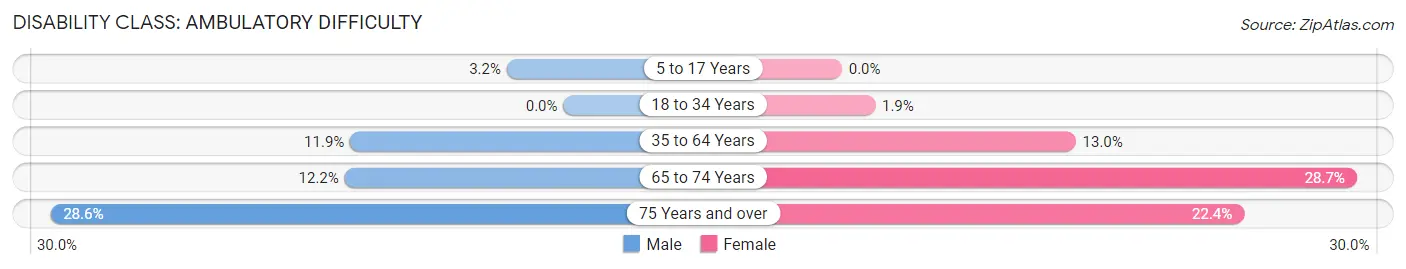
| Age Bracket | Male | Female |
| 5 to 17 Years | 22 (3.2%) | 0 (0.0%) |
| 18 to 34 Years | 0 (0.0%) | 22 (1.8%) |
| 35 to 64 Years | 172 (11.9%) | 178 (13.0%) |
| 65 to 74 Years | 47 (12.2%) | 121 (28.7%) |
| 75 Years and over | 52 (28.6%) | 69 (22.4%) |
Disability Class: Self-Care Difficulty
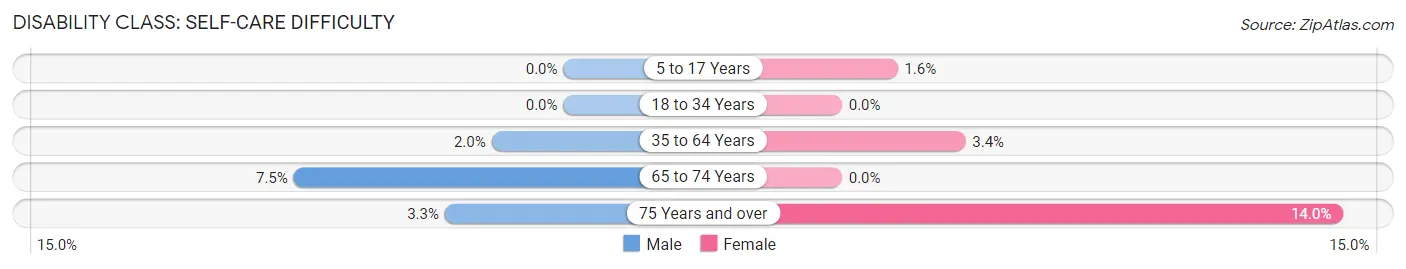
| Age Bracket | Male | Female |
| 5 to 17 Years | 0 (0.0%) | 12 (1.5%) |
| 18 to 34 Years | 0 (0.0%) | 0 (0.0%) |
| 35 to 64 Years | 29 (2.0%) | 47 (3.4%) |
| 65 to 74 Years | 29 (7.5%) | 0 (0.0%) |
| 75 Years and over | 6 (3.3%) | 43 (14.0%) |
Technology Access in Lewistown borough
Computing Device Access in Lewistown borough
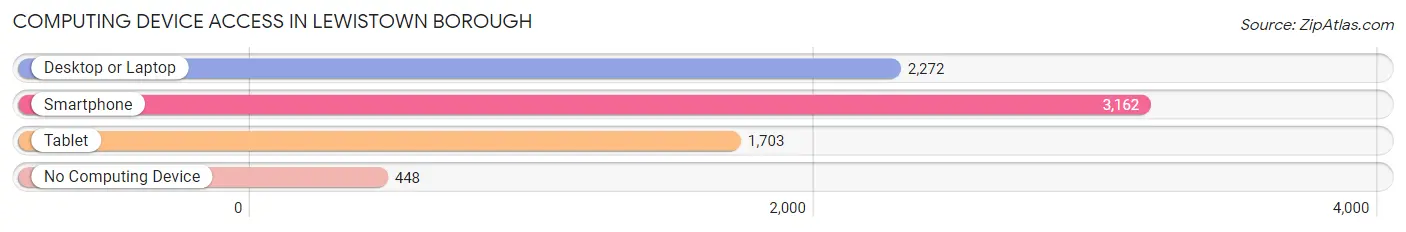
| Device Type | # Households | % Households |
| Desktop or Laptop | 2,272 | 58.3% |
| Smartphone | 3,162 | 81.2% |
| Tablet | 1,703 | 43.7% |
| No Computing Device | 448 | 11.5% |
| Total | 3,895 | 100.0% |
Internet Access in Lewistown borough
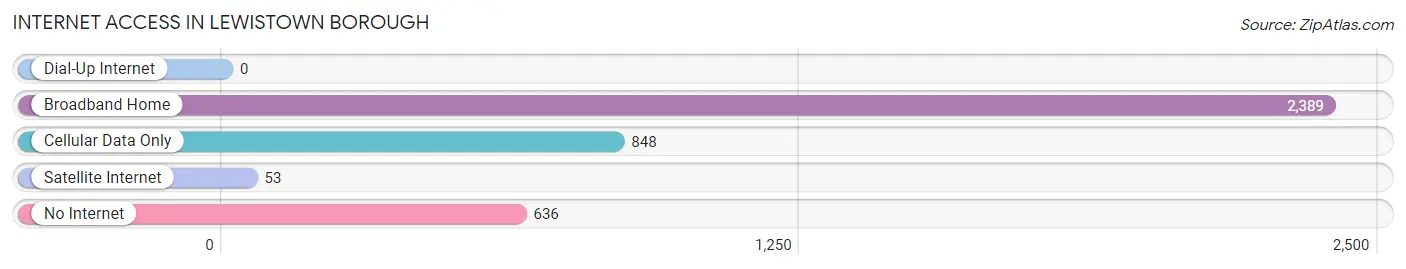
| Internet Type | # Households | % Households |
| Dial-Up Internet | 0 | 0.0% |
| Broadband Home | 2,389 | 61.3% |
| Cellular Data Only | 848 | 21.8% |
| Satellite Internet | 53 | 1.4% |
| No Internet | 636 | 16.3% |
| Total | 3,895 | 100.0% |
Lewistown borough Summary
Lewistown Borough is a borough located in Mifflin County, Pennsylvania. It is the county seat of Mifflin County and is located in the Juniata River Valley. The population of Lewistown Borough was 8,338 at the 2010 census.
History
The area that is now Lewistown Borough was first settled in 1755 by a group of Scots-Irish immigrants led by William Maclay. The settlement was originally known as Chincleclamousche, a Native American word meaning “stony creek”. The settlement was later renamed Lewistown after the Maclay family’s ancestral home in Scotland.
Lewistown was officially incorporated as a borough in 1837. The borough was an important center of commerce and industry in the 19th century. The Juniata Valley Railroad was built in 1851, connecting Lewistown to the Pennsylvania Railroad. The railroad allowed Lewistown to become a major hub for the transportation of coal, lumber, and other goods.
In the late 19th century, Lewistown was home to several large industries, including the Lewistown Iron Works, the Lewistown Foundry, and the Lewistown Car Works. The Lewistown Car Works was the largest employer in the borough, employing over 1,000 people at its peak.
Geography
Lewistown Borough is located in the Juniata River Valley in central Pennsylvania. The borough is situated at the confluence of the Juniata and Kishacoquillas Creeks. The borough is located approximately 50 miles northwest of Harrisburg and 90 miles east of Pittsburgh.
The borough has a total area of 1.3 square miles, all of which is land. The borough is located in a hilly region of central Pennsylvania, with elevations ranging from 500 to 1,000 feet above sea level.
Economy
The economy of Lewistown Borough is largely based on manufacturing and services. The borough is home to several large manufacturing companies, including the Lewistown Foundry, the Lewistown Iron Works, and the Lewistown Car Works. The borough is also home to several service-based businesses, including banks, insurance companies, and medical offices.
The borough is also home to several retail stores, including grocery stores, clothing stores, and specialty shops. The borough is also home to several restaurants, bars, and other entertainment venues.
Demographics
As of the 2010 census, the population of Lewistown Borough was 8,338. The racial makeup of the borough was 95.3% White, 1.2% African American, 0.3% Native American, 0.7% Asian, 0.1% Pacific Islander, 0.7% from other races, and 1.7% from two or more races. Hispanic or Latino of any race were 2.2% of the population.
The median household income in the borough was $37,917, and the median family income was $45,938. The per capita income in the borough was $20,845. About 11.3% of families and 14.2% of the population were below the poverty line, including 19.2% of those under age 18 and 8.2% of those age 65 or over.
Common Questions
What is Per Capita Income in Lewistown borough?
Per Capita income in Lewistown borough is $23,370.
What is the Median Family Income in Lewistown borough?
Median Family Income in Lewistown borough is $37,014.
What is the Median Household income in Lewistown borough?
Median Household Income in Lewistown borough is $36,166.
What is Income or Wage Gap in Lewistown borough?
Income or Wage Gap in Lewistown borough is 28.8%.
Women in Lewistown borough earn 71.2 cents for every dollar earned by a man.
What is Family Income Deficit in Lewistown borough?
Family Income Deficit in Lewistown borough is $10,776.
Families that are below poverty line in Lewistown borough earn $10,776 less on average than the poverty threshold level.
What is Inequality or Gini Index in Lewistown borough?
Inequality or Gini Index in Lewistown borough is 0.45.
What is the Total Population of Lewistown borough?
Total Population of Lewistown borough is 8,522.
What is the Total Male Population of Lewistown borough?
Total Male Population of Lewistown borough is 3,939.
What is the Total Female Population of Lewistown borough?
Total Female Population of Lewistown borough is 4,583.
What is the Ratio of Males per 100 Females in Lewistown borough?
There are 85.95 Males per 100 Females in Lewistown borough.
What is the Ratio of Females per 100 Males in Lewistown borough?
There are 116.35 Females per 100 Males in Lewistown borough.
What is the Median Population Age in Lewistown borough?
Median Population Age in Lewistown borough is 34.3 Years.
What is the Average Family Size in Lewistown borough
Average Family Size in Lewistown borough is 2.9 People.
What is the Average Household Size in Lewistown borough
Average Household Size in Lewistown borough is 2.1 People.
How Large is the Labor Force in Lewistown borough?
There are 3,639 People in the Labor Forcein in Lewistown borough.
What is the Percentage of People in the Labor Force in Lewistown borough?
56.5% of People are in the Labor Force in Lewistown borough.
What is the Unemployment Rate in Lewistown borough?
Unemployment Rate in Lewistown borough is 7.3%.