Level Green, PA Map & Demographics
Level Green Map
Level Green Overview
$45,086
PER CAPITA INCOME
$111,250
AVG FAMILY INCOME
$84,195
AVG HOUSEHOLD INCOME
51.4%
WAGE / INCOME GAP [ % ]
48.6¢/ $1
WAGE / INCOME GAP [ $ ]
0.37
INEQUALITY / GINI INDEX
4,140
TOTAL POPULATION
2,221
MALE POPULATION
1,919
FEMALE POPULATION
115.74
MALES / 100 FEMALES
86.40
FEMALES / 100 MALES
51.6
MEDIAN AGE
3.0
AVG FAMILY SIZE
2.5
AVG HOUSEHOLD SIZE
2,414
LABOR FORCE [ PEOPLE ]
67.3%
PERCENT IN LABOR FORCE
3.2%
UNEMPLOYMENT RATE
Income in Level Green
Income Overview in Level Green
Per Capita Income in Level Green is $45,086, while median incomes of families and households are $111,250 and $84,195 respectively.
| Characteristic | Number | Measure |
| Per Capita Income | 4,140 | $45,086 |
| Median Family Income | 1,220 | $111,250 |
| Mean Family Income | 1,220 | $127,583 |
| Median Household Income | 1,653 | $84,195 |
| Mean Household Income | 1,653 | $112,136 |
| Income Deficit | 1,220 | $0 |
| Wage / Income Gap (%) | 4,140 | 51.35% |
| Wage / Income Gap ($) | 4,140 | 48.65¢ per $1 |
| Gini / Inequality Index | 4,140 | 0.37 |
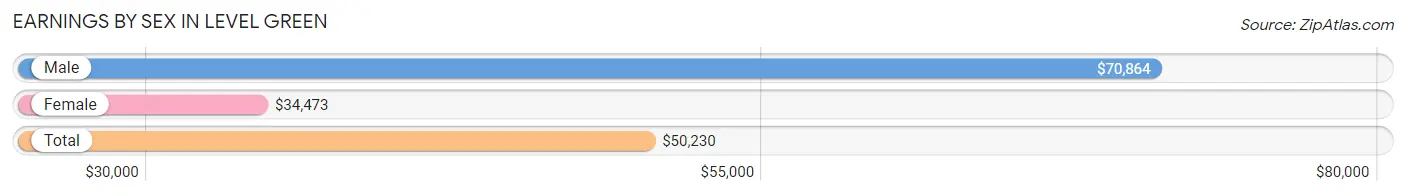
Earnings by Sex in Level Green
Average Earnings in Level Green are $50,230, $70,864 for men and $34,473 for women, a difference of 51.3%.
| Sex | Number | Average Earnings |
| Male | 1,438 (58.8%) | $70,864 |
| Female | 1,007 (41.2%) | $34,473 |
| Total | 2,445 (100.0%) | $50,230 |
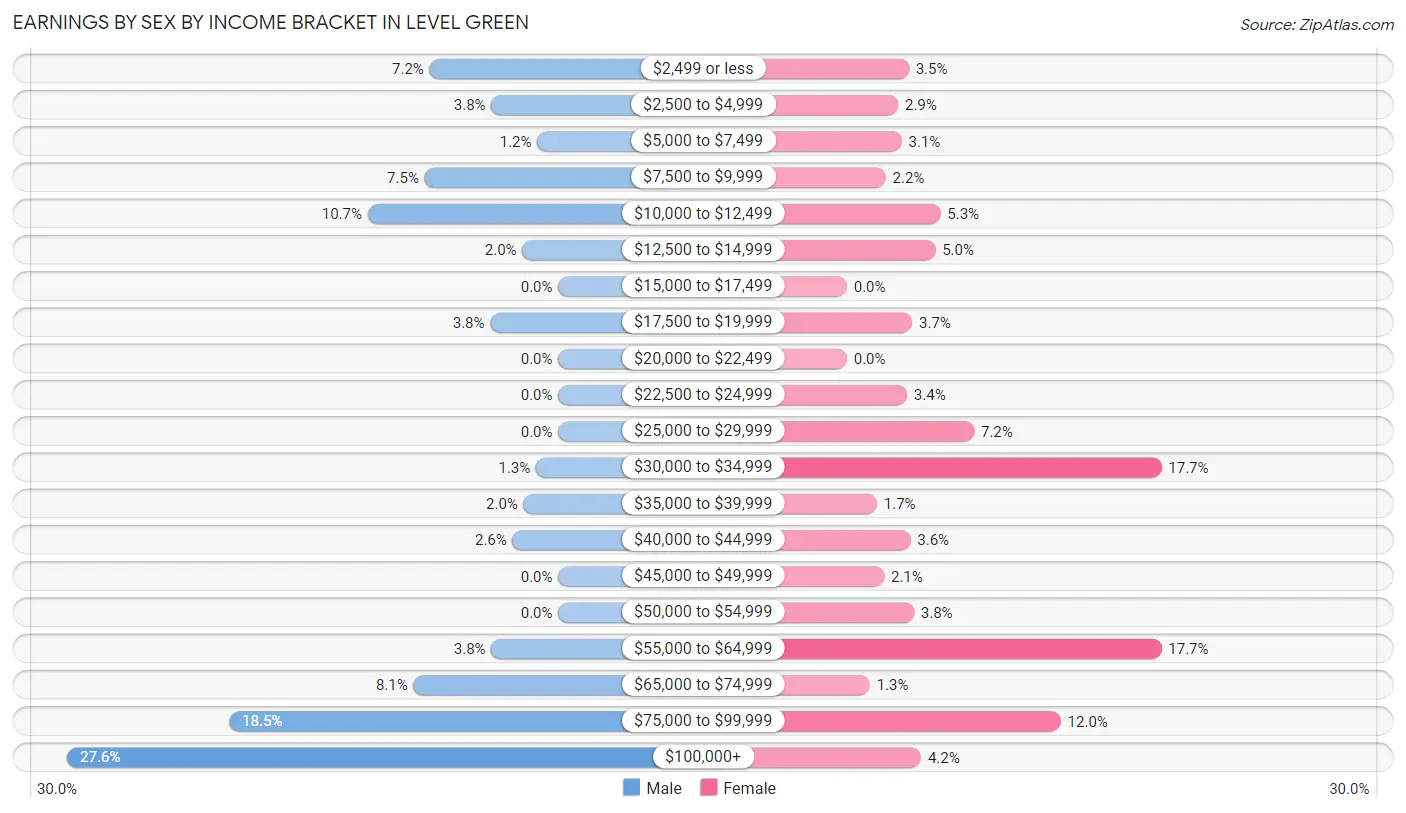
Earnings by Sex by Income Bracket in Level Green
The most common earnings brackets in Level Green are $100,000+ for men (397 | 27.6%) and $30,000 to $34,999 for women (178 | 17.7%).
| Income | Male | Female |
| $2,499 or less | 104 (7.2%) | 35 (3.5%) |
| $2,500 to $4,999 | 54 (3.8%) | 29 (2.9%) |
| $5,000 to $7,499 | 17 (1.2%) | 31 (3.1%) |
| $7,500 to $9,999 | 108 (7.5%) | 22 (2.2%) |
| $10,000 to $12,499 | 154 (10.7%) | 53 (5.3%) |
| $12,500 to $14,999 | 29 (2.0%) | 50 (5.0%) |
| $15,000 to $17,499 | 0 (0.0%) | 0 (0.0%) |
| $17,500 to $19,999 | 55 (3.8%) | 37 (3.7%) |
| $20,000 to $22,499 | 0 (0.0%) | 0 (0.0%) |
| $22,500 to $24,999 | 0 (0.0%) | 34 (3.4%) |
| $25,000 to $29,999 | 0 (0.0%) | 72 (7.1%) |
| $30,000 to $34,999 | 18 (1.3%) | 178 (17.7%) |
| $35,000 to $39,999 | 28 (1.9%) | 17 (1.7%) |
| $40,000 to $44,999 | 37 (2.6%) | 36 (3.6%) |
| $45,000 to $49,999 | 0 (0.0%) | 21 (2.1%) |
| $50,000 to $54,999 | 0 (0.0%) | 38 (3.8%) |
| $55,000 to $64,999 | 54 (3.8%) | 178 (17.7%) |
| $65,000 to $74,999 | 117 (8.1%) | 13 (1.3%) |
| $75,000 to $99,999 | 266 (18.5%) | 121 (12.0%) |
| $100,000+ | 397 (27.6%) | 42 (4.2%) |
| Total | 1,438 (100.0%) | 1,007 (100.0%) |
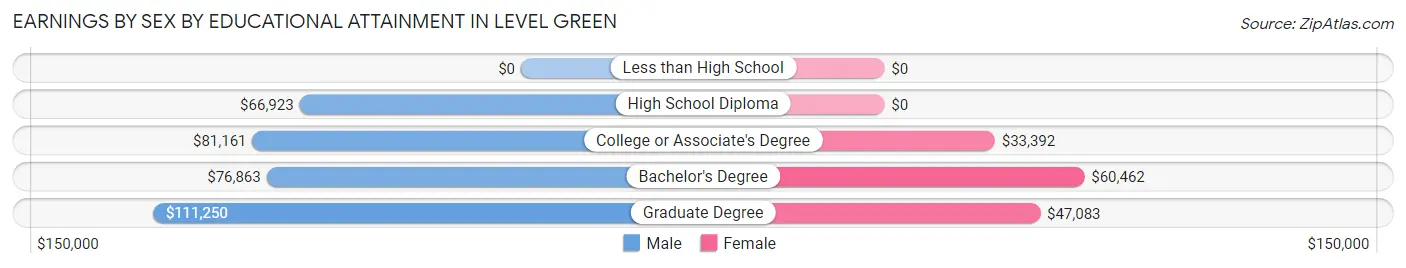
Earnings by Sex by Educational Attainment in Level Green
Average earnings in Level Green are $76,350 for men and $37,794 for women, a difference of 50.5%. Men with an educational attainment of graduate degree enjoy the highest average annual earnings of $111,250, while those with high school diploma education earn the least with $66,923. Women with an educational attainment of bachelor's degree earn the most with the average annual earnings of $60,462, while those with college or associate's degree education have the smallest earnings of $33,392.
| Educational Attainment | Male Income | Female Income |
| Less than High School | - | - |
| High School Diploma | $66,923 | $0 |
| College or Associate's Degree | $81,161 | $33,392 |
| Bachelor's Degree | $76,863 | $60,462 |
| Graduate Degree | $111,250 | $47,083 |
| Total | $76,350 | $37,794 |
Family Income in Level Green
Family Income Brackets in Level Green
According to the Level Green family income data, there are 303 families falling into the $75,000 to $99,999 income range, which is the most common income bracket and makes up 24.8% of all families.
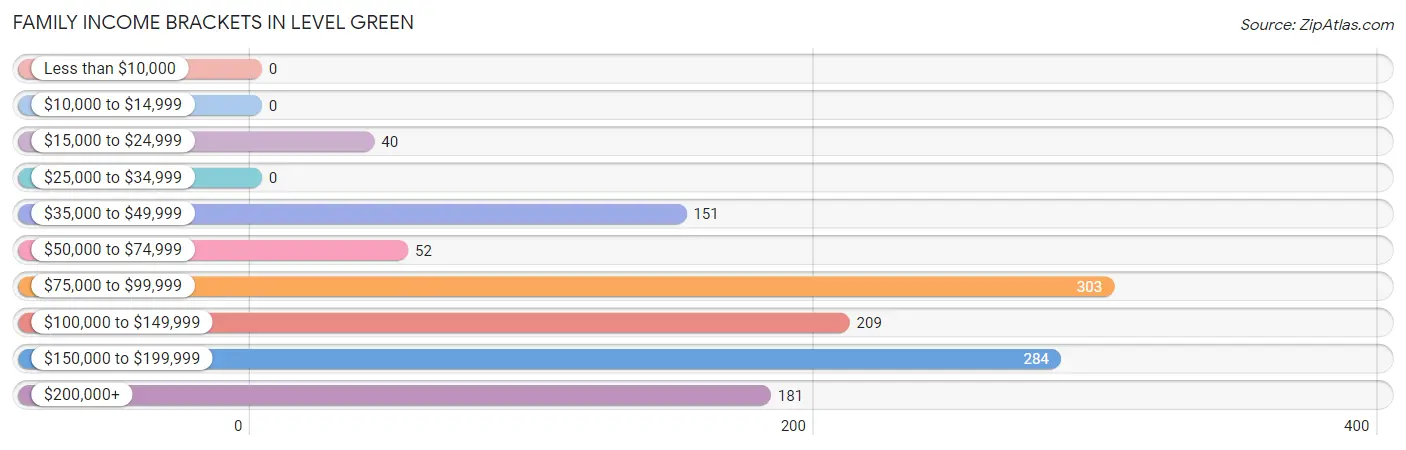
| Income Bracket | # Families | % Families |
| Less than $10,000 | 0 | 0.0% |
| $10,000 to $14,999 | 0 | 0.0% |
| $15,000 to $24,999 | 40 | 3.3% |
| $25,000 to $34,999 | 0 | 0.0% |
| $35,000 to $49,999 | 151 | 12.4% |
| $50,000 to $74,999 | 52 | 4.3% |
| $75,000 to $99,999 | 303 | 24.8% |
| $100,000 to $149,999 | 209 | 17.1% |
| $150,000 to $199,999 | 284 | 23.3% |
| $200,000+ | 181 | 14.8% |
Family Income by Famaliy Size in Level Green
5-person families (69 | 5.7%) account for the highest median family income in Level Green with $159,453 per family, while 3-person families (204 | 16.7%) have the highest median income of $49,940 per family member.
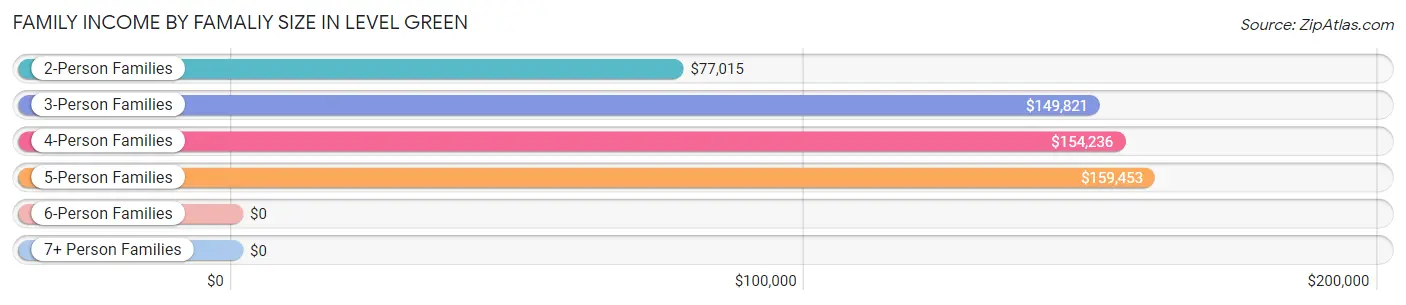
| Income Bracket | # Families | Median Income |
| 2-Person Families | 619 (50.7%) | $77,015 |
| 3-Person Families | 204 (16.7%) | $149,821 |
| 4-Person Families | 311 (25.5%) | $154,236 |
| 5-Person Families | 69 (5.7%) | $159,453 |
| 6-Person Families | 0 (0.0%) | $0 |
| 7+ Person Families | 17 (1.4%) | $0 |
| Total | 1,220 (100.0%) | $111,250 |
Family Income by Number of Earners in Level Green
The median family income in Level Green is $111,250, with families comprising 3+ earners (205) having the highest median family income of $176,865, while families with no earners (188) have the lowest median family income of $48,782, accounting for 16.8% and 15.4% of families, respectively.
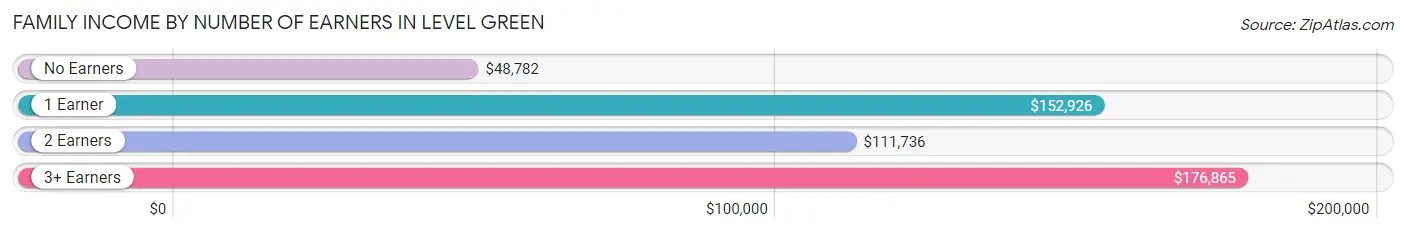
| Number of Earners | # Families | Median Income |
| No Earners | 188 (15.4%) | $48,782 |
| 1 Earner | 130 (10.7%) | $152,926 |
| 2 Earners | 697 (57.1%) | $111,736 |
| 3+ Earners | 205 (16.8%) | $176,865 |
| Total | 1,220 (100.0%) | $111,250 |
Household Income in Level Green
Household Income Brackets in Level Green
With 393 households falling in the category, the $75,000 to $99,999 income range is the most frequent in Level Green, accounting for 23.8% of all households. In contrast, only 15 households (0.9%) fall into the less than $10,000 income bracket, making it the least populous group.
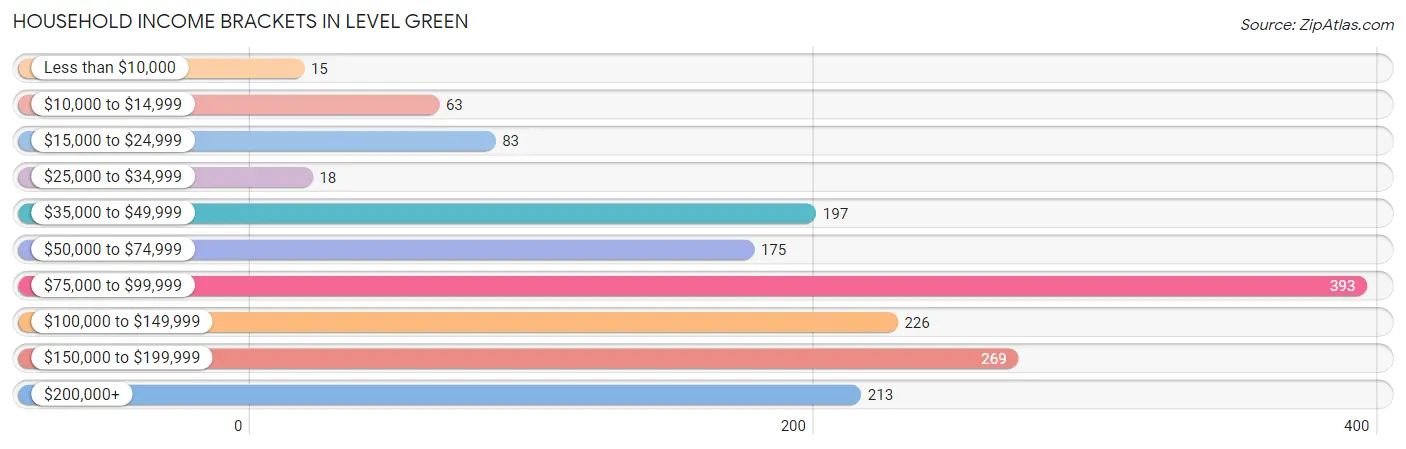
| Income Bracket | # Households | % Households |
| Less than $10,000 | 15 | 0.9% |
| $10,000 to $14,999 | 63 | 3.8% |
| $15,000 to $24,999 | 83 | 5.0% |
| $25,000 to $34,999 | 18 | 1.1% |
| $35,000 to $49,999 | 197 | 11.9% |
| $50,000 to $74,999 | 175 | 10.6% |
| $75,000 to $99,999 | 393 | 23.8% |
| $100,000 to $149,999 | 226 | 13.7% |
| $150,000 to $199,999 | 269 | 16.3% |
| $200,000+ | 213 | 12.9% |
Household Income by Householder Age in Level Green
The median household income in Level Green is $84,195, with the highest median household income of $165,250 found in the 25 to 44 years age bracket for the primary householder. A total of 289 households (17.5%) fall into this category.
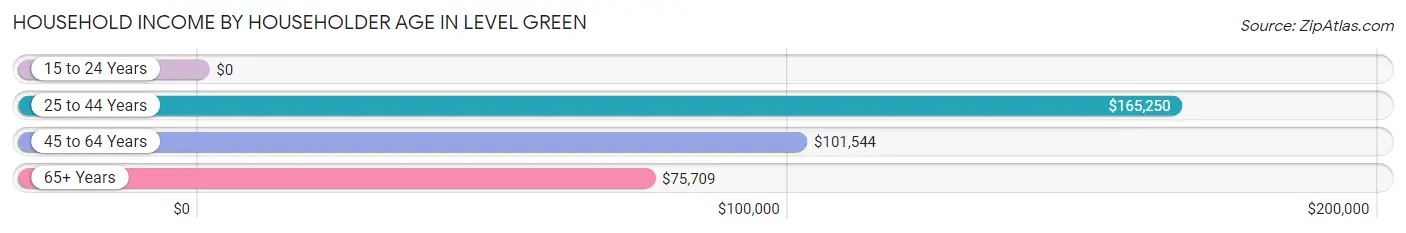
| Income Bracket | # Households | Median Income |
| 15 to 24 Years | 0 (0.0%) | $0 |
| 25 to 44 Years | 289 (17.5%) | $165,250 |
| 45 to 64 Years | 607 (36.7%) | $101,544 |
| 65+ Years | 757 (45.8%) | $75,709 |
| Total | 1,653 (100.0%) | $84,195 |
Poverty in Level Green
Income Below Poverty by Sex and Age in Level Green
With 3.9% poverty level for males and 4.1% for females among the residents of Level Green, 65 to 74 year old males and 55 to 64 year old females are the most vulnerable to poverty, with 61 males (11.1%) and 78 females (26.8%) in their respective age groups living below the poverty level.
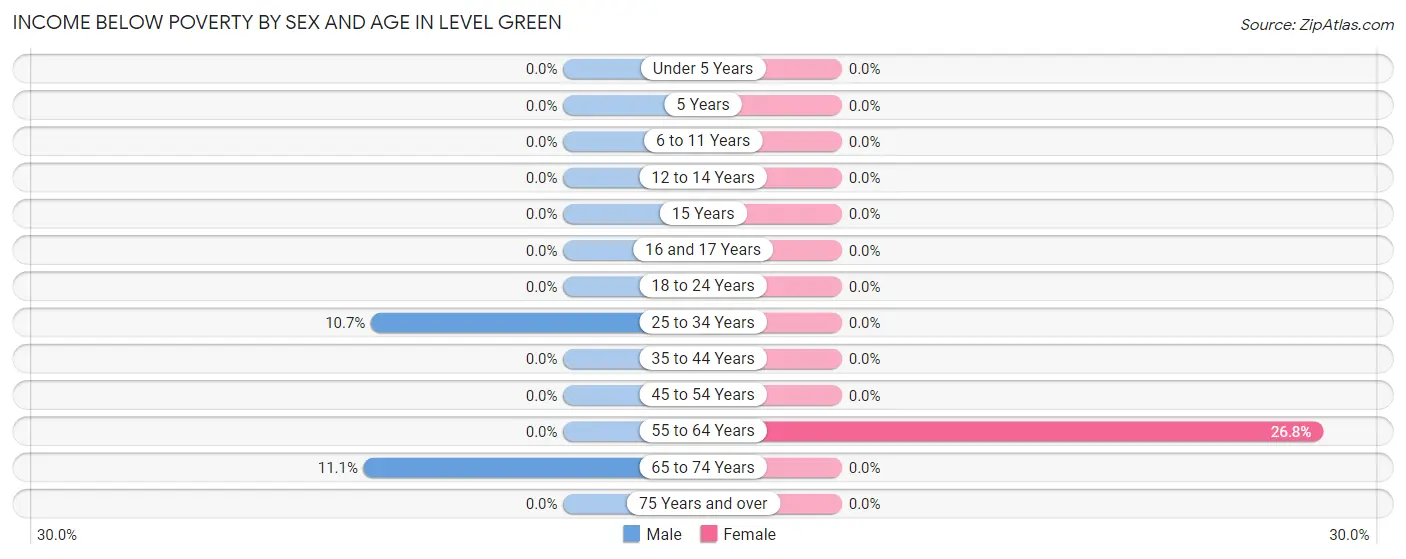
| Age Bracket | Male | Female |
| Under 5 Years | 0 (0.0%) | 0 (0.0%) |
| 5 Years | 0 (0.0%) | 0 (0.0%) |
| 6 to 11 Years | 0 (0.0%) | 0 (0.0%) |
| 12 to 14 Years | 0 (0.0%) | 0 (0.0%) |
| 15 Years | 0 (0.0%) | 0 (0.0%) |
| 16 and 17 Years | 0 (0.0%) | 0 (0.0%) |
| 18 to 24 Years | 0 (0.0%) | 0 (0.0%) |
| 25 to 34 Years | 26 (10.7%) | 0 (0.0%) |
| 35 to 44 Years | 0 (0.0%) | 0 (0.0%) |
| 45 to 54 Years | 0 (0.0%) | 0 (0.0%) |
| 55 to 64 Years | 0 (0.0%) | 78 (26.8%) |
| 65 to 74 Years | 61 (11.1%) | 0 (0.0%) |
| 75 Years and over | 0 (0.0%) | 0 (0.0%) |
| Total | 87 (3.9%) | 78 (4.1%) |
Income Above Poverty by Sex and Age in Level Green
According to the poverty statistics in Level Green, males aged under 5 years and females aged under 5 years are the age groups that are most secure financially, with 100.0% of males and 100.0% of females in these age groups living above the poverty line.
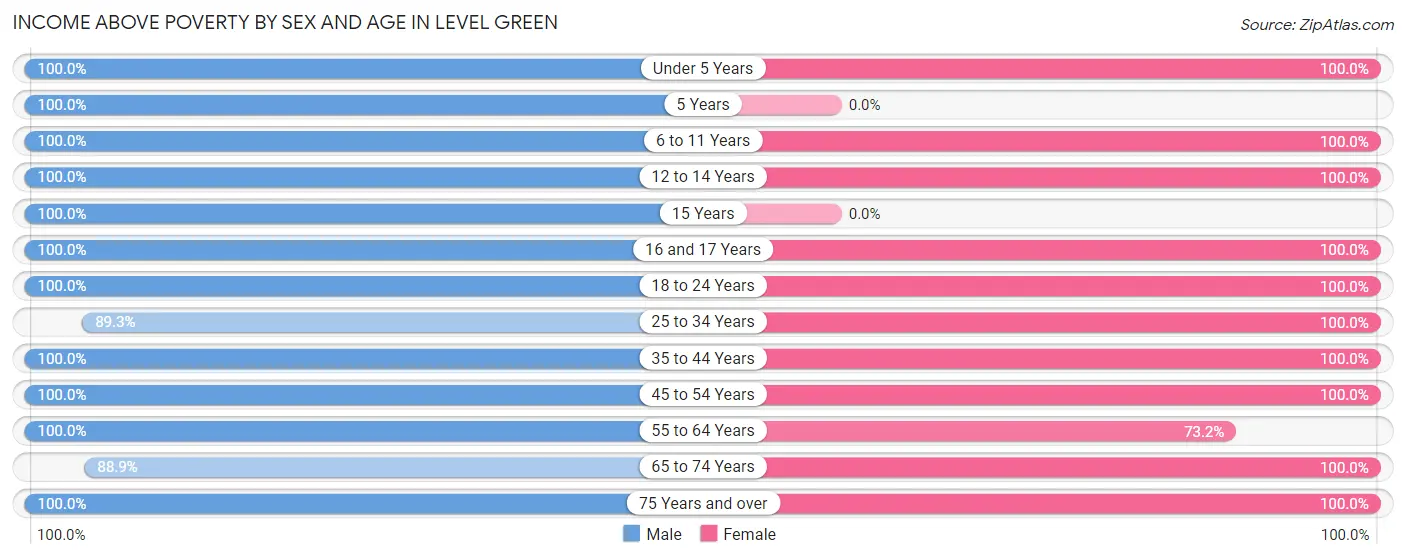
| Age Bracket | Male | Female |
| Under 5 Years | 71 (100.0%) | 128 (100.0%) |
| 5 Years | 15 (100.0%) | 0 (0.0%) |
| 6 to 11 Years | 89 (100.0%) | 59 (100.0%) |
| 12 to 14 Years | 96 (100.0%) | 37 (100.0%) |
| 15 Years | 58 (100.0%) | 0 (0.0%) |
| 16 and 17 Years | 38 (100.0%) | 47 (100.0%) |
| 18 to 24 Years | 257 (100.0%) | 160 (100.0%) |
| 25 to 34 Years | 217 (89.3%) | 197 (100.0%) |
| 35 to 44 Years | 172 (100.0%) | 83 (100.0%) |
| 45 to 54 Years | 270 (100.0%) | 289 (100.0%) |
| 55 to 64 Years | 234 (100.0%) | 213 (73.2%) |
| 65 to 74 Years | 488 (88.9%) | 481 (100.0%) |
| 75 Years and over | 129 (100.0%) | 147 (100.0%) |
| Total | 2,134 (96.1%) | 1,841 (95.9%) |
Income Below Poverty Among Married-Couple Families in Level Green
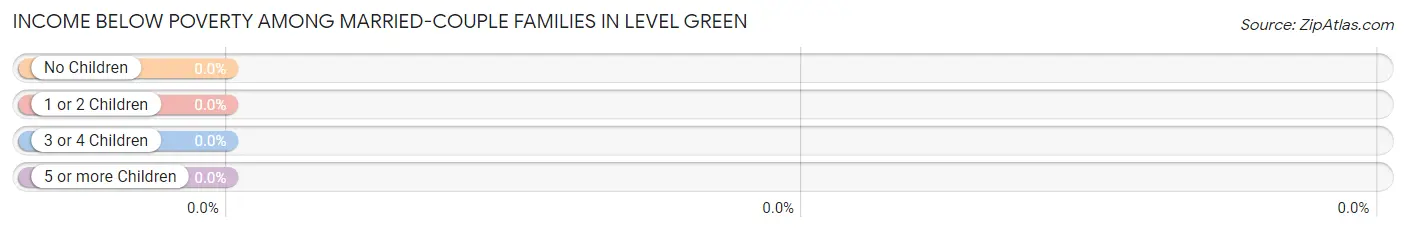
| Children | Above Poverty | Below Poverty |
| No Children | 813 (100.0%) | 0 (0.0%) |
| 1 or 2 Children | 246 (100.0%) | 0 (0.0%) |
| 3 or 4 Children | 71 (100.0%) | 0 (0.0%) |
| 5 or more Children | 0 (0.0%) | 0 (0.0%) |
| Total | 1,130 (100.0%) | 0 (0.0%) |
Income Below Poverty Among Single-Parent Households in Level Green
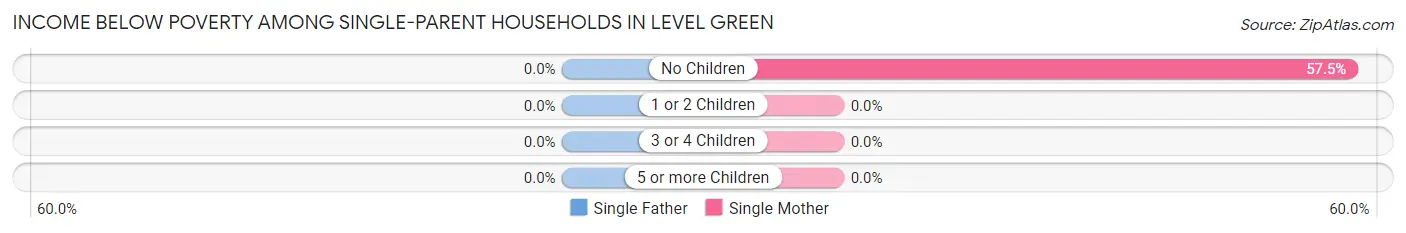
| Children | Single Father | Single Mother |
| No Children | 0 (0.0%) | 23 (57.5%) |
| 1 or 2 Children | 0 (0.0%) | 0 (0.0%) |
| 3 or 4 Children | 0 (0.0%) | 0 (0.0%) |
| 5 or more Children | 0 (0.0%) | 0 (0.0%) |
| Total | 0 (0.0%) | 23 (30.3%) |
Income Below Poverty Among Married-Couple vs Single-Parent Households in Level Green
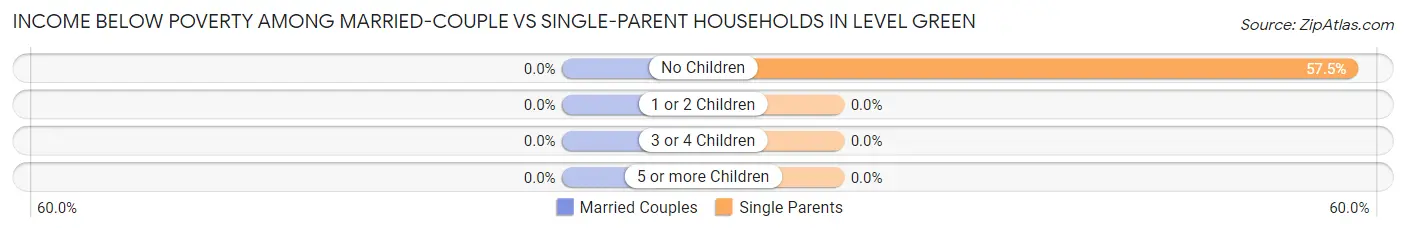
| Children | Married-Couple Families | Single-Parent Households |
| No Children | 0 (0.0%) | 23 (57.5%) |
| 1 or 2 Children | 0 (0.0%) | 0 (0.0%) |
| 3 or 4 Children | 0 (0.0%) | 0 (0.0%) |
| 5 or more Children | 0 (0.0%) | 0 (0.0%) |
| Total | 0 (0.0%) | 23 (25.6%) |
Race in Level Green
The most populous races in Level Green are White / Caucasian (3,749 | 90.6%), Two or more Races (309 | 7.5%), and Asian (82 | 2.0%).
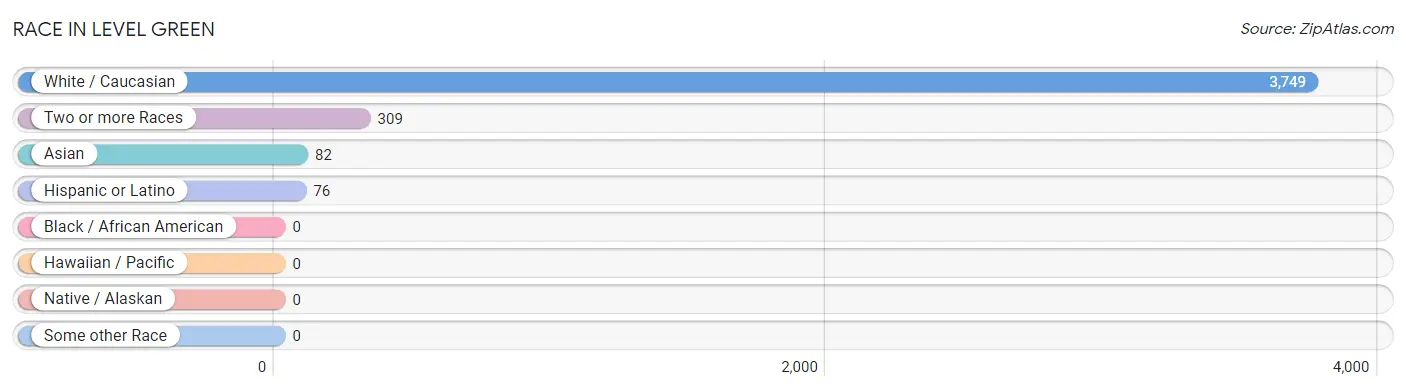
| Race | # Population | % Population |
| Asian | 82 | 2.0% |
| Black / African American | 0 | 0.0% |
| Hawaiian / Pacific | 0 | 0.0% |
| Hispanic or Latino | 76 | 1.8% |
| Native / Alaskan | 0 | 0.0% |
| White / Caucasian | 3,749 | 90.6% |
| Two or more Races | 309 | 7.5% |
| Some other Race | 0 | 0.0% |
| Total | 4,140 | 100.0% |
Ancestry in Level Green
The most populous ancestries reported in Level Green are German (1,250 | 30.2%), Italian (1,029 | 24.9%), Irish (860 | 20.8%), Slovak (379 | 9.1%), and English (367 | 8.9%), together accounting for 93.8% of all Level Green residents.
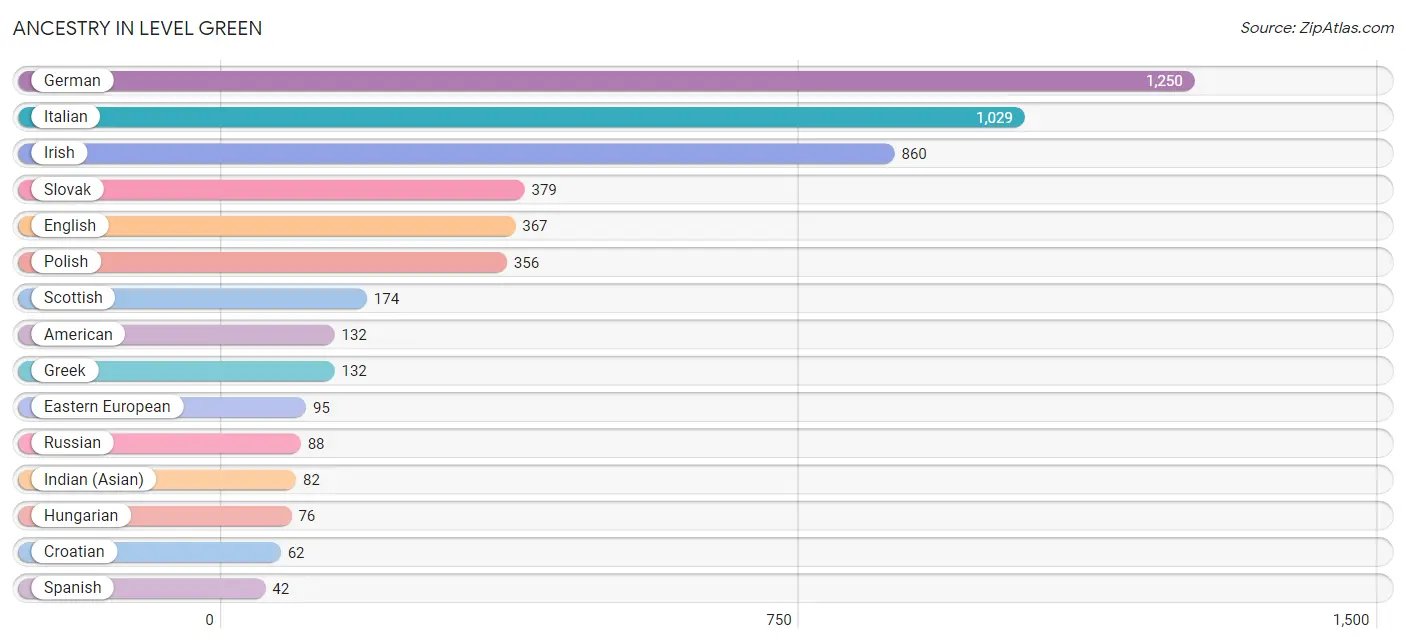
| Ancestry | # Population | % Population |
| American | 132 | 3.2% |
| Canadian | 14 | 0.3% |
| Croatian | 62 | 1.5% |
| Eastern European | 95 | 2.3% |
| English | 367 | 8.9% |
| German | 1,250 | 30.2% |
| Greek | 132 | 3.2% |
| Hungarian | 76 | 1.8% |
| Indian (Asian) | 82 | 2.0% |
| Irish | 860 | 20.8% |
| Italian | 1,029 | 24.9% |
| Lithuanian | 29 | 0.7% |
| Mexican | 34 | 0.8% |
| Norwegian | 18 | 0.4% |
| Pennsylvania German | 15 | 0.4% |
| Polish | 356 | 8.6% |
| Portuguese | 15 | 0.4% |
| Russian | 88 | 2.1% |
| Scotch-Irish | 37 | 0.9% |
| Scottish | 174 | 4.2% |
| Serbian | 17 | 0.4% |
| Slovak | 379 | 9.1% |
| Spanish | 42 | 1.0% |
| Swedish | 16 | 0.4% |
| Ukrainian | 17 | 0.4% | View All 25 Rows |
Immigrants in Level Green
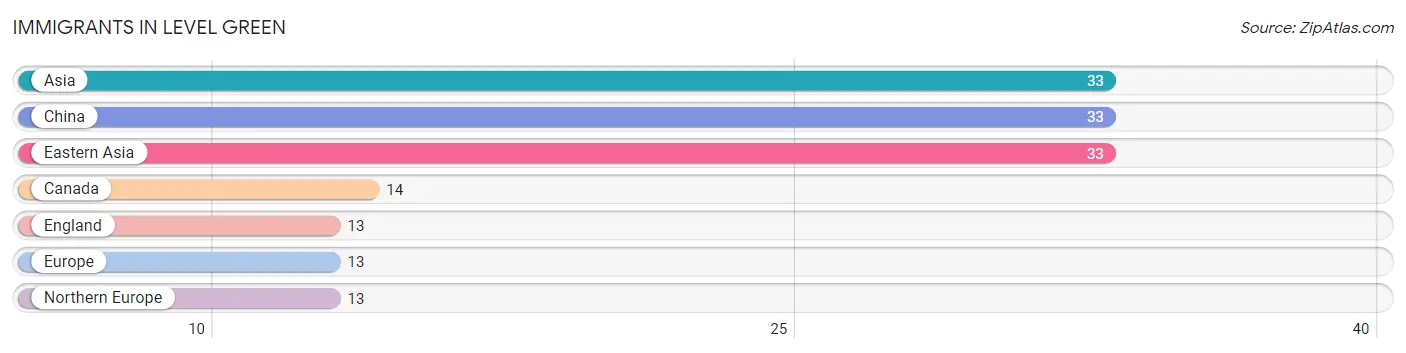
The most numerous immigrant groups reported in Level Green came from Asia (33 | 0.8%), China (33 | 0.8%), Eastern Asia (33 | 0.8%), Canada (14 | 0.3%), and England (13 | 0.3%), together accounting for 3.0% of all Level Green residents.
| Immigration Origin | # Population | % Population |
| Asia | 33 | 0.8% |
| Canada | 14 | 0.3% |
| China | 33 | 0.8% |
| Eastern Asia | 33 | 0.8% |
| England | 13 | 0.3% |
| Europe | 13 | 0.3% |
| Northern Europe | 13 | 0.3% | View All 7 Rows |
Sex and Age in Level Green
Sex and Age in Level Green
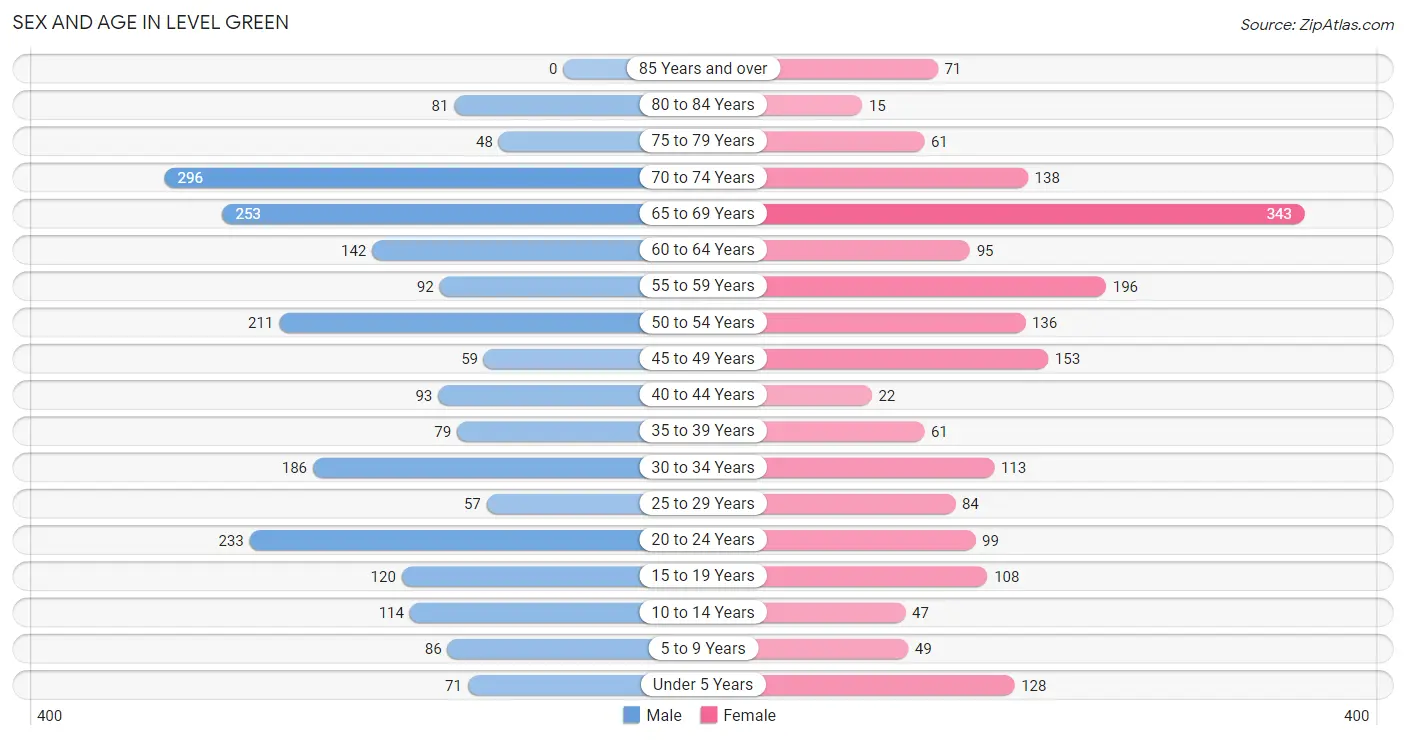
The most populous age groups in Level Green are 70 to 74 Years (296 | 13.3%) for men and 65 to 69 Years (343 | 17.9%) for women.
| Age Bracket | Male | Female |
| Under 5 Years | 71 (3.2%) | 128 (6.7%) |
| 5 to 9 Years | 86 (3.9%) | 49 (2.5%) |
| 10 to 14 Years | 114 (5.1%) | 47 (2.5%) |
| 15 to 19 Years | 120 (5.4%) | 108 (5.6%) |
| 20 to 24 Years | 233 (10.5%) | 99 (5.2%) |
| 25 to 29 Years | 57 (2.6%) | 84 (4.4%) |
| 30 to 34 Years | 186 (8.4%) | 113 (5.9%) |
| 35 to 39 Years | 79 (3.6%) | 61 (3.2%) |
| 40 to 44 Years | 93 (4.2%) | 22 (1.1%) |
| 45 to 49 Years | 59 (2.7%) | 153 (8.0%) |
| 50 to 54 Years | 211 (9.5%) | 136 (7.1%) |
| 55 to 59 Years | 92 (4.1%) | 196 (10.2%) |
| 60 to 64 Years | 142 (6.4%) | 95 (5.0%) |
| 65 to 69 Years | 253 (11.4%) | 343 (17.9%) |
| 70 to 74 Years | 296 (13.3%) | 138 (7.2%) |
| 75 to 79 Years | 48 (2.2%) | 61 (3.2%) |
| 80 to 84 Years | 81 (3.6%) | 15 (0.8%) |
| 85 Years and over | 0 (0.0%) | 71 (3.7%) |
| Total | 2,221 (100.0%) | 1,919 (100.0%) |
Families and Households in Level Green
Median Family Size in Level Green
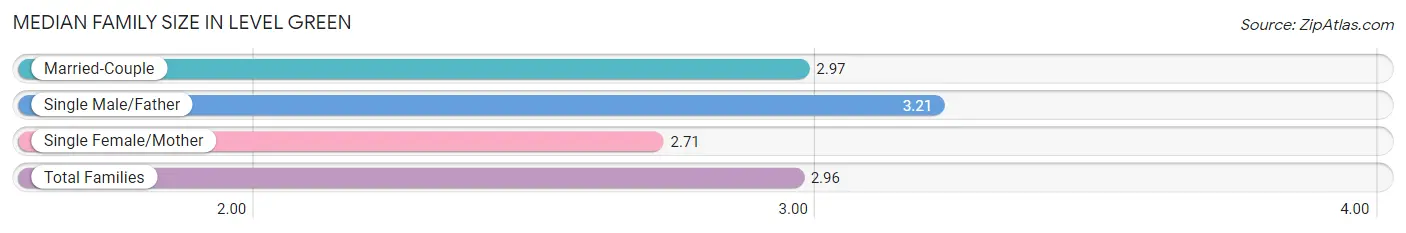
The median family size in Level Green is 2.96 persons per family, with single male/father families (14 | 1.1%) accounting for the largest median family size of 3.21 persons per family. On the other hand, single female/mother families (76 | 6.2%) represent the smallest median family size with 2.71 persons per family.
| Family Type | # Families | Family Size |
| Married-Couple | 1,130 (92.6%) | 2.97 |
| Single Male/Father | 14 (1.1%) | 3.21 |
| Single Female/Mother | 76 (6.2%) | 2.71 |
| Total Families | 1,220 (100.0%) | 2.96 |
Median Household Size in Level Green
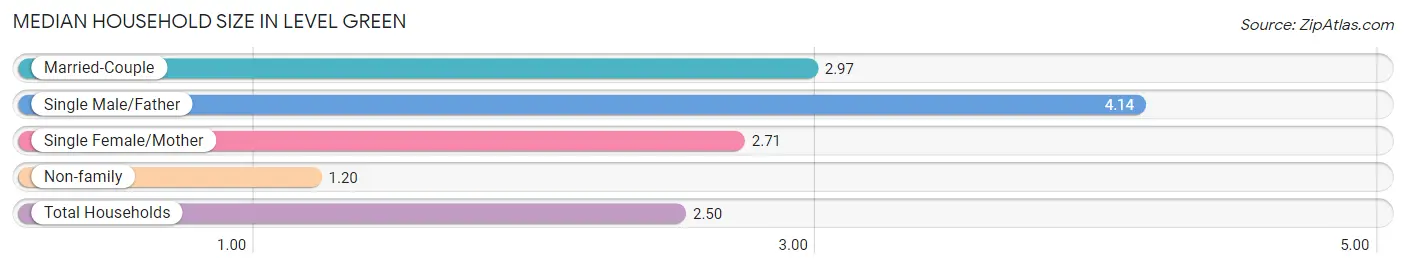
The median household size in Level Green is 2.50 persons per household, with single male/father households (14 | 0.9%) accounting for the largest median household size of 4.14 persons per household. non-family households (433 | 26.2%) represent the smallest median household size with 1.20 persons per household.
| Household Type | # Households | Household Size |
| Married-Couple | 1,130 (68.4%) | 2.97 |
| Single Male/Father | 14 (0.9%) | 4.14 |
| Single Female/Mother | 76 (4.6%) | 2.71 |
| Non-family | 433 (26.2%) | 1.20 |
| Total Households | 1,653 (100.0%) | 2.50 |
Household Size by Marriage Status in Level Green
Out of a total of 1,653 households in Level Green, 1,220 (73.8%) are family households, while 433 (26.2%) are nonfamily households. The most numerous type of family households are 2-person households, comprising 619, and the most common type of nonfamily households are 1-person households, comprising 348.
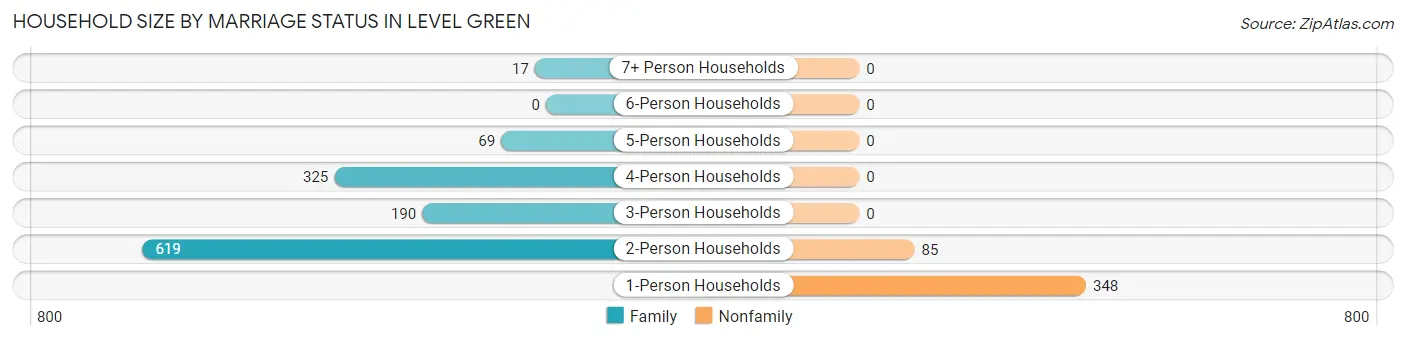
| Household Size | Family Households | Nonfamily Households |
| 1-Person Households | - | 348 (21.0%) |
| 2-Person Households | 619 (37.4%) | 85 (5.1%) |
| 3-Person Households | 190 (11.5%) | 0 (0.0%) |
| 4-Person Households | 325 (19.7%) | 0 (0.0%) |
| 5-Person Households | 69 (4.2%) | 0 (0.0%) |
| 6-Person Households | 0 (0.0%) | 0 (0.0%) |
| 7+ Person Households | 17 (1.0%) | 0 (0.0%) |
| Total | 1,220 (73.8%) | 433 (26.2%) |
Female Fertility in Level Green
Fertility by Age in Level Green
Average fertility rate in Level Green is 49.0 births per 1,000 women. Women in the age bracket of 35 to 50 years have the highest fertility rate with 120.0 births per 1,000 women. Women in the age bracket of 35 to 50 years acount for 100.0% of all women with births.
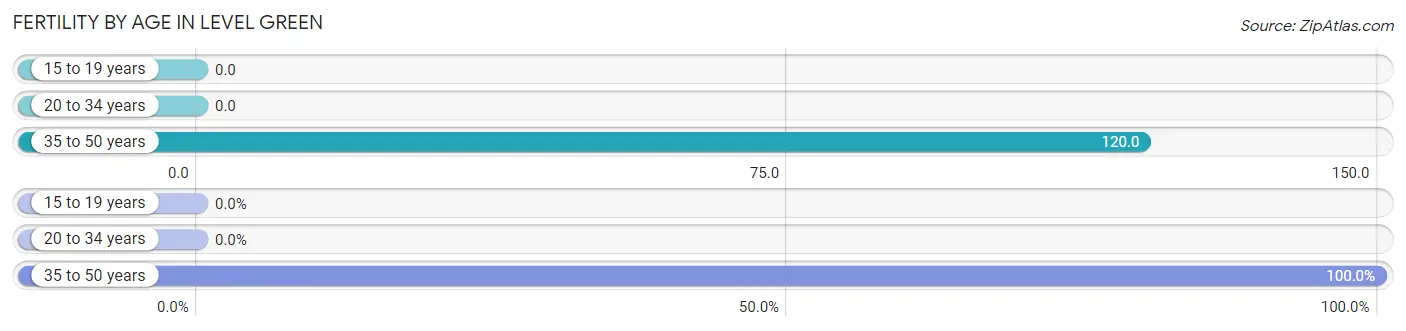
| Age Bracket | Women with Births | Births / 1,000 Women |
| 15 to 19 years | 0 (0.0%) | 0.0 |
| 20 to 34 years | 0 (0.0%) | 0.0 |
| 35 to 50 years | 33 (100.0%) | 120.0 |
| Total | 33 (100.0%) | 49.0 |
Fertility by Age by Marriage Status in Level Green
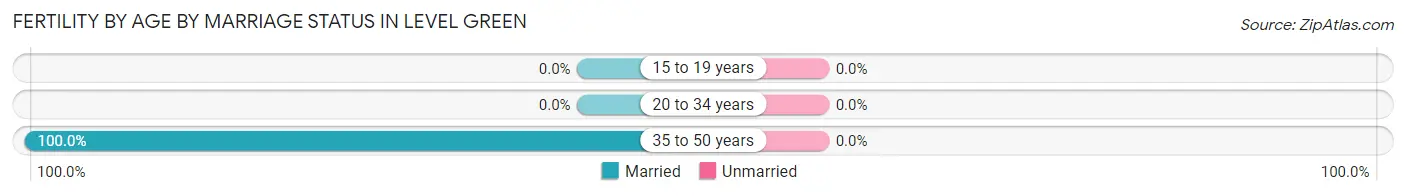
| Age Bracket | Married | Unmarried |
| 15 to 19 years | 0 (0.0%) | 0 (0.0%) |
| 20 to 34 years | 0 (0.0%) | 0 (0.0%) |
| 35 to 50 years | 33 (100.0%) | 0 (0.0%) |
| Total | 33 (100.0%) | 0 (0.0%) |
Fertility by Education in Level Green
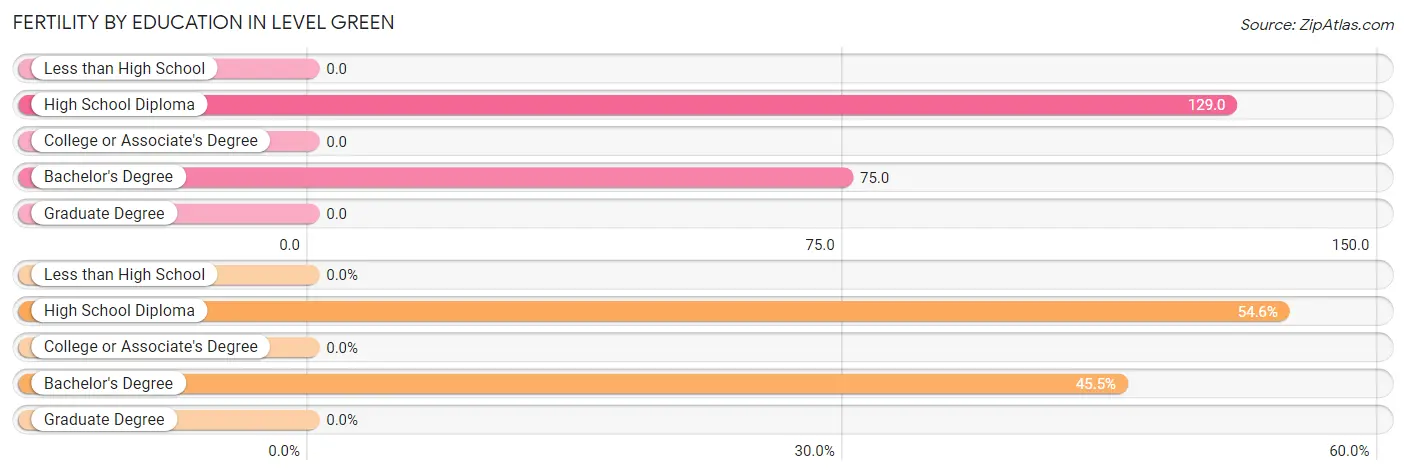
| Educational Attainment | Women with Births | Births / 1,000 Women |
| Less than High School | 0 (0.0%) | 0.0 |
| High School Diploma | 18 (54.5%) | 129.0 |
| College or Associate's Degree | 0 (0.0%) | 0.0 |
| Bachelor's Degree | 15 (45.5%) | 75.0 |
| Graduate Degree | 0 (0.0%) | 0.0 |
| Total | 33 (100.0%) | 49.0 |
Fertility by Education by Marriage Status in Level Green
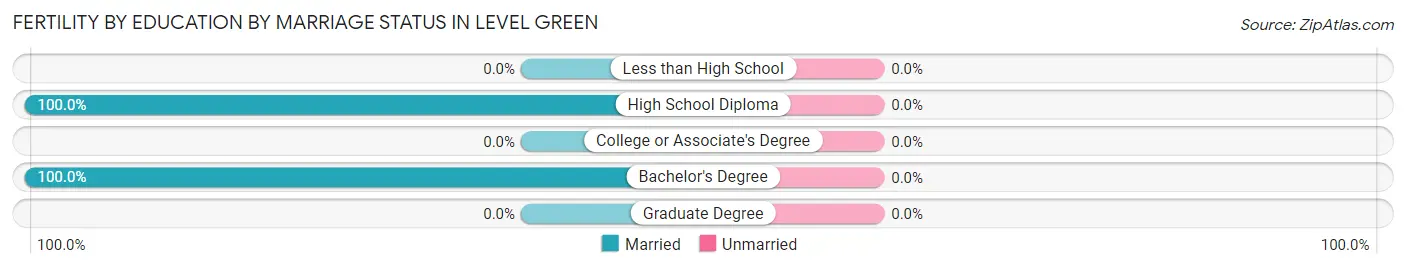
| Educational Attainment | Married | Unmarried |
| Less than High School | 0 (0.0%) | 0 (0.0%) |
| High School Diploma | 18 (100.0%) | 0 (0.0%) |
| College or Associate's Degree | 0 (0.0%) | 0 (0.0%) |
| Bachelor's Degree | 15 (100.0%) | 0 (0.0%) |
| Graduate Degree | 0 (0.0%) | 0 (0.0%) |
| Total | 33 (100.0%) | 0 (0.0%) |
Employment Characteristics in Level Green
Employment by Class of Employer in Level Green
Among the 2,337 employed individuals in Level Green, private company employees (1,770 | 75.7%), state government employees (123 | 5.3%), and self-employed (incorporated) (103 | 4.4%) make up the most common classes of employment.
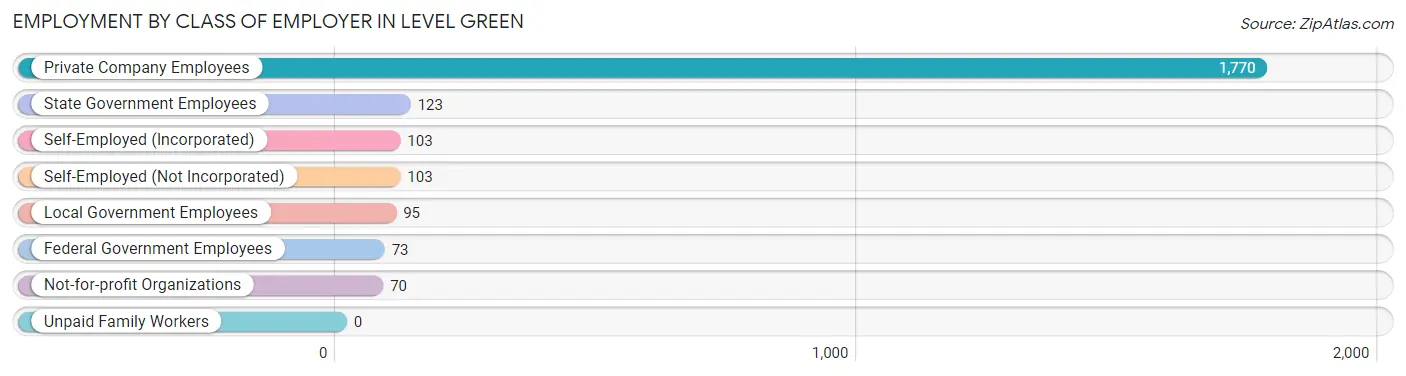
| Employer Class | # Employees | % Employees |
| Private Company Employees | 1,770 | 75.7% |
| Self-Employed (Incorporated) | 103 | 4.4% |
| Self-Employed (Not Incorporated) | 103 | 4.4% |
| Not-for-profit Organizations | 70 | 3.0% |
| Local Government Employees | 95 | 4.1% |
| State Government Employees | 123 | 5.3% |
| Federal Government Employees | 73 | 3.1% |
| Unpaid Family Workers | 0 | 0.0% |
| Total | 2,337 | 100.0% |
Employment Status by Age in Level Green
According to the labor force statistics for Level Green, out of the total population over 16 years of age (3,587), 67.3% or 2,414 individuals are in the labor force, with 3.2% or 77 of them unemployed. The age group with the highest labor force participation rate is 25 to 29 years, with 100.0% or 141 individuals in the labor force. Within the labor force, the 75 years and over age range has the highest percentage of unemployed individuals, with 46.2% or 12 of them being unemployed.
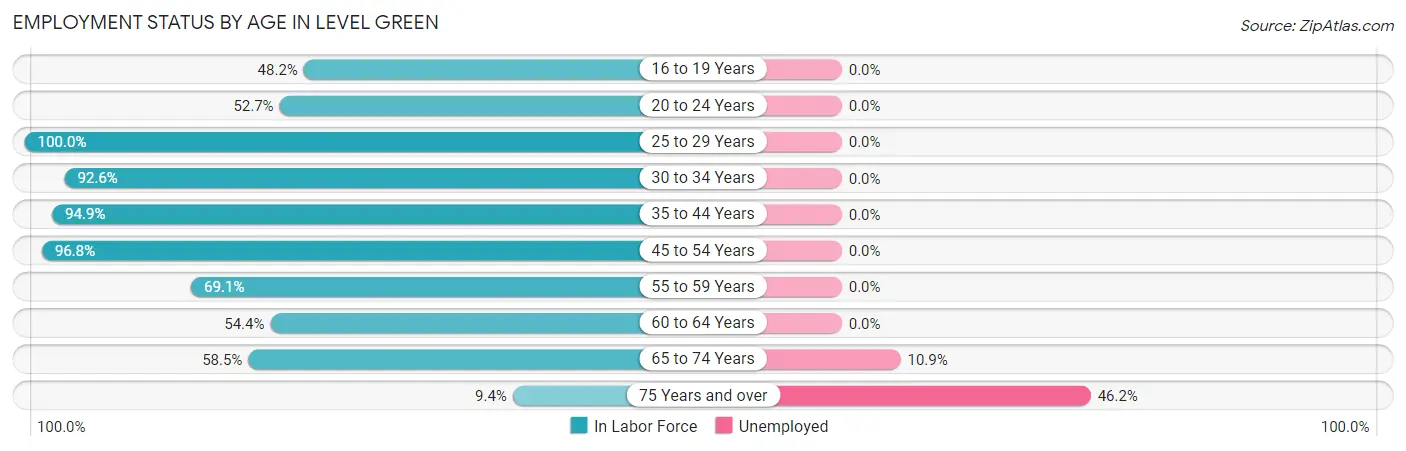
| Age Bracket | In Labor Force | Unemployed |
| 16 to 19 Years | 82 (48.2%) | 0 (0.0%) |
| 20 to 24 Years | 175 (52.7%) | 0 (0.0%) |
| 25 to 29 Years | 141 (100.0%) | 0 (0.0%) |
| 30 to 34 Years | 277 (92.6%) | 0 (0.0%) |
| 35 to 44 Years | 242 (94.9%) | 0 (0.0%) |
| 45 to 54 Years | 541 (96.8%) | 0 (0.0%) |
| 55 to 59 Years | 199 (69.1%) | 0 (0.0%) |
| 60 to 64 Years | 129 (54.4%) | 0 (0.0%) |
| 65 to 74 Years | 603 (58.5%) | 66 (10.9%) |
| 75 Years and over | 26 (9.4%) | 12 (46.2%) |
| Total | 2,414 (67.3%) | 77 (3.2%) |
Employment Status by Educational Attainment in Level Green
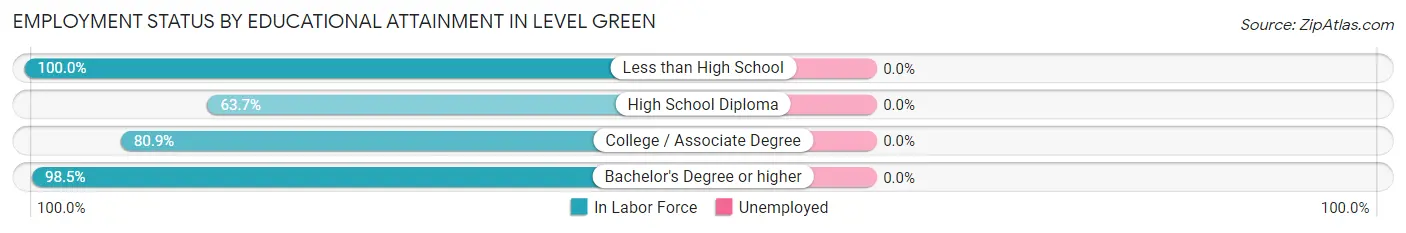
| Educational Attainment | In Labor Force | Unemployed |
| Less than High School | 19 (100.0%) | 0 (0.0%) |
| High School Diploma | 258 (63.7%) | 0 (0.0%) |
| College / Associate Degree | 382 (80.9%) | 0 (0.0%) |
| Bachelor's Degree or higher | 870 (98.5%) | 0 (0.0%) |
| Total | 1,528 (85.9%) | 0 (0.0%) |
Employment Occupations by Sex in Level Green
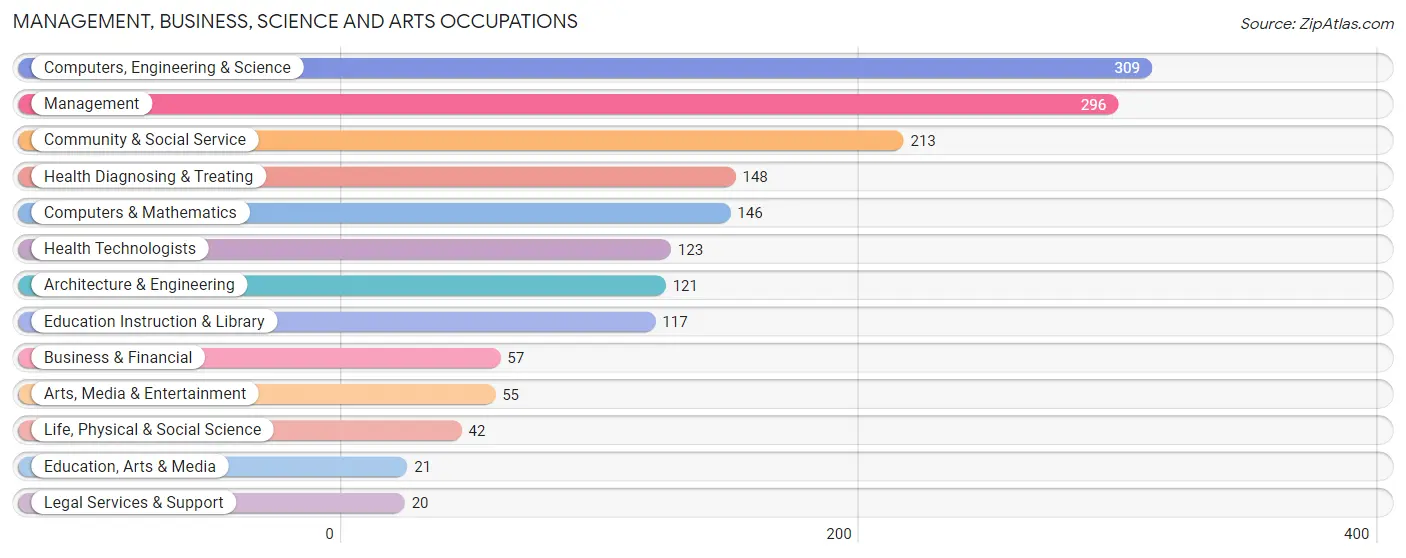
Management, Business, Science and Arts Occupations
The most common Management, Business, Science and Arts occupations in Level Green are Computers, Engineering & Science (309 | 13.2%), Management (296 | 12.7%), Community & Social Service (213 | 9.1%), Health Diagnosing & Treating (148 | 6.3%), and Computers & Mathematics (146 | 6.2%).
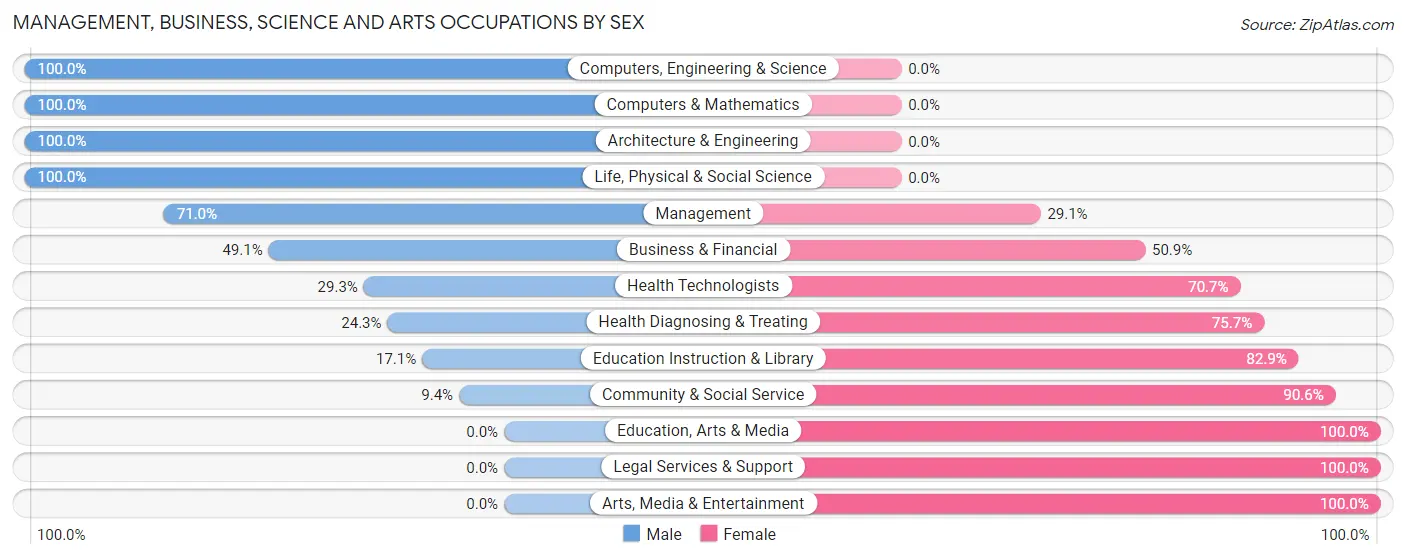
Management, Business, Science and Arts Occupations by Sex
Within the Management, Business, Science and Arts occupations in Level Green, the most male-oriented occupations are Computers, Engineering & Science (100.0%), Computers & Mathematics (100.0%), and Architecture & Engineering (100.0%), while the most female-oriented occupations are Education, Arts & Media (100.0%), Legal Services & Support (100.0%), and Arts, Media & Entertainment (100.0%).
| Occupation | Male | Female |
| Management | 210 (71.0%) | 86 (29.0%) |
| Business & Financial | 28 (49.1%) | 29 (50.9%) |
| Computers, Engineering & Science | 309 (100.0%) | 0 (0.0%) |
| Computers & Mathematics | 146 (100.0%) | 0 (0.0%) |
| Architecture & Engineering | 121 (100.0%) | 0 (0.0%) |
| Life, Physical & Social Science | 42 (100.0%) | 0 (0.0%) |
| Community & Social Service | 20 (9.4%) | 193 (90.6%) |
| Education, Arts & Media | 0 (0.0%) | 21 (100.0%) |
| Legal Services & Support | 0 (0.0%) | 20 (100.0%) |
| Education Instruction & Library | 20 (17.1%) | 97 (82.9%) |
| Arts, Media & Entertainment | 0 (0.0%) | 55 (100.0%) |
| Health Diagnosing & Treating | 36 (24.3%) | 112 (75.7%) |
| Health Technologists | 36 (29.3%) | 87 (70.7%) |
| Total (Category) | 603 (58.9%) | 420 (41.1%) |
| Total (Overall) | 1,330 (56.9%) | 1,007 (43.1%) |
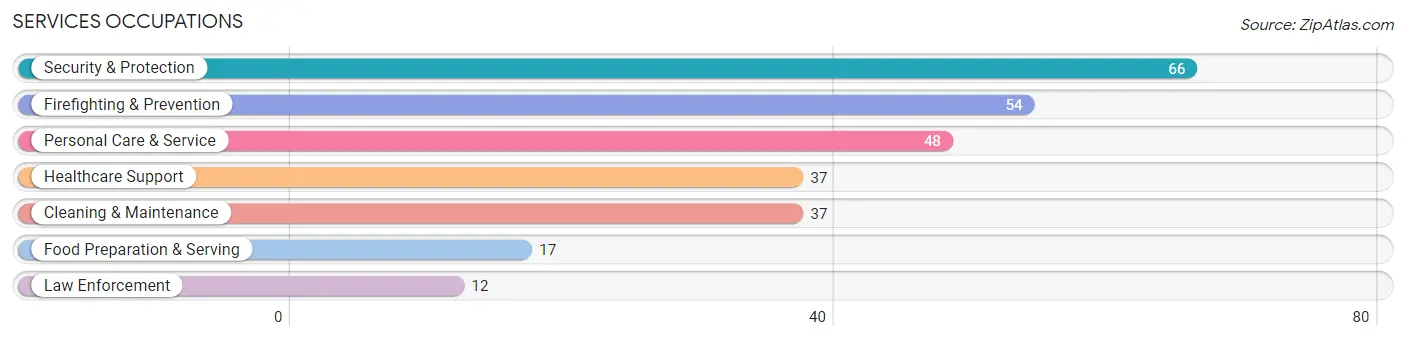
Services Occupations
The most common Services occupations in Level Green are Security & Protection (66 | 2.8%), Firefighting & Prevention (54 | 2.3%), Personal Care & Service (48 | 2.1%), Healthcare Support (37 | 1.6%), and Cleaning & Maintenance (37 | 1.6%).
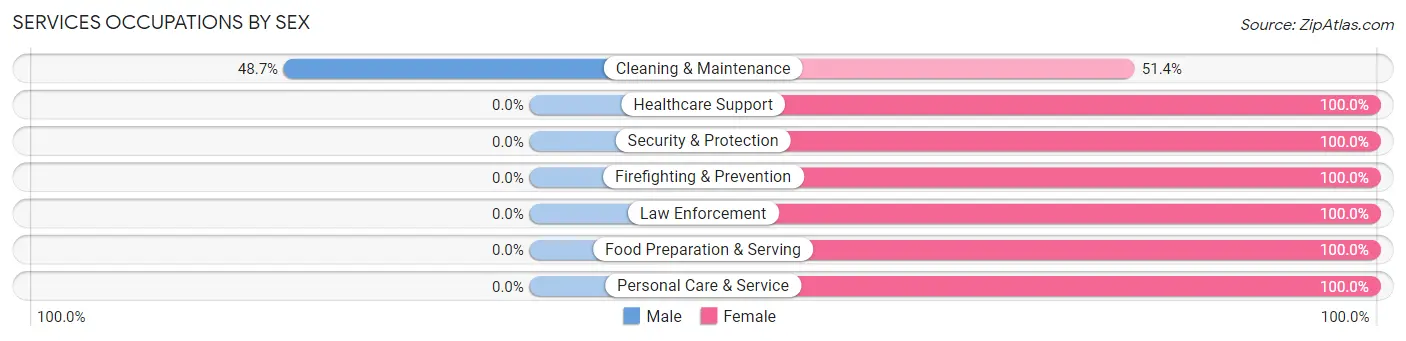
Services Occupations by Sex
| Occupation | Male | Female |
| Healthcare Support | 0 (0.0%) | 37 (100.0%) |
| Security & Protection | 0 (0.0%) | 66 (100.0%) |
| Firefighting & Prevention | 0 (0.0%) | 54 (100.0%) |
| Law Enforcement | 0 (0.0%) | 12 (100.0%) |
| Food Preparation & Serving | 0 (0.0%) | 17 (100.0%) |
| Cleaning & Maintenance | 18 (48.6%) | 19 (51.3%) |
| Personal Care & Service | 0 (0.0%) | 48 (100.0%) |
| Total (Category) | 18 (8.8%) | 187 (91.2%) |
| Total (Overall) | 1,330 (56.9%) | 1,007 (43.1%) |
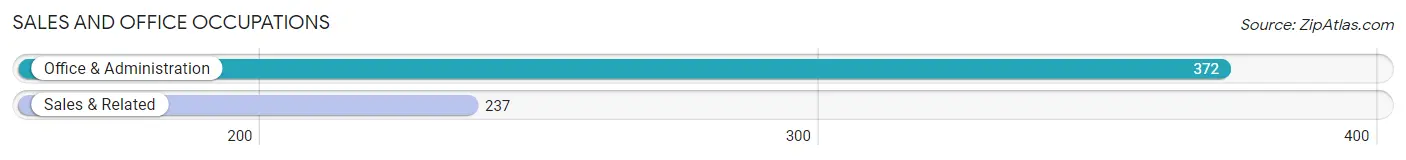
Sales and Office Occupations
The most common Sales and Office occupations in Level Green are Office & Administration (372 | 15.9%), and Sales & Related (237 | 10.1%).
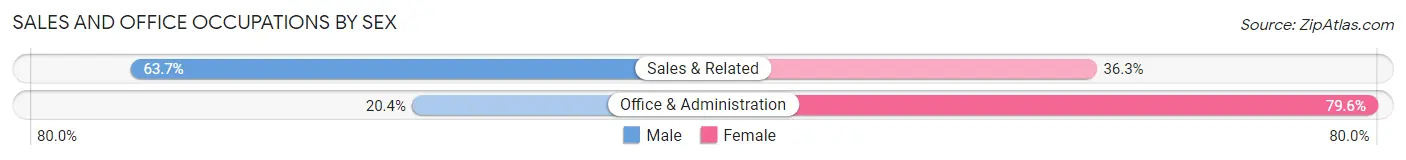
Sales and Office Occupations by Sex
| Occupation | Male | Female |
| Sales & Related | 151 (63.7%) | 86 (36.3%) |
| Office & Administration | 76 (20.4%) | 296 (79.6%) |
| Total (Category) | 227 (37.3%) | 382 (62.7%) |
| Total (Overall) | 1,330 (56.9%) | 1,007 (43.1%) |
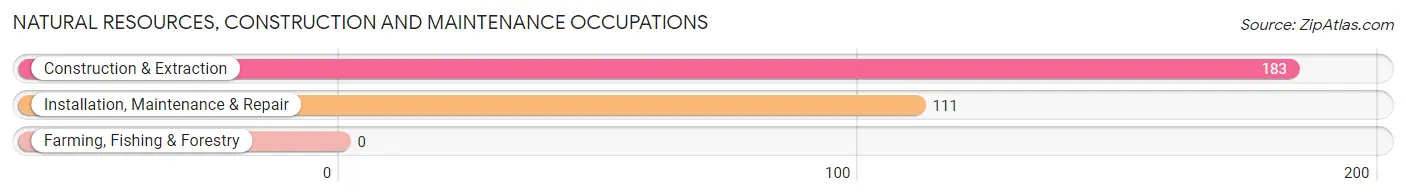
Natural Resources, Construction and Maintenance Occupations
The most common Natural Resources, Construction and Maintenance occupations in Level Green are Construction & Extraction (183 | 7.8%), and Installation, Maintenance & Repair (111 | 4.8%).
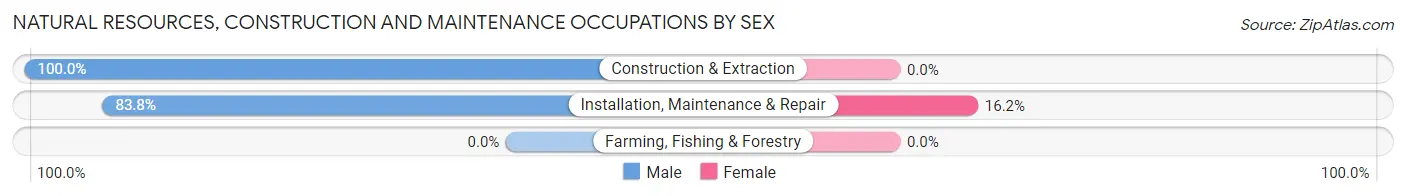
Natural Resources, Construction and Maintenance Occupations by Sex
| Occupation | Male | Female |
| Farming, Fishing & Forestry | 0 (0.0%) | 0 (0.0%) |
| Construction & Extraction | 183 (100.0%) | 0 (0.0%) |
| Installation, Maintenance & Repair | 93 (83.8%) | 18 (16.2%) |
| Total (Category) | 276 (93.9%) | 18 (6.1%) |
| Total (Overall) | 1,330 (56.9%) | 1,007 (43.1%) |
Production, Transportation and Moving Occupations
The most common Production, Transportation and Moving occupations in Level Green are Transportation (170 | 7.3%), and Production (36 | 1.5%).
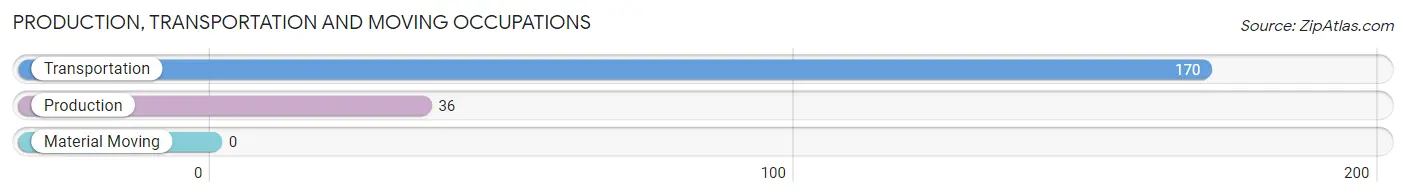
Production, Transportation and Moving Occupations by Sex
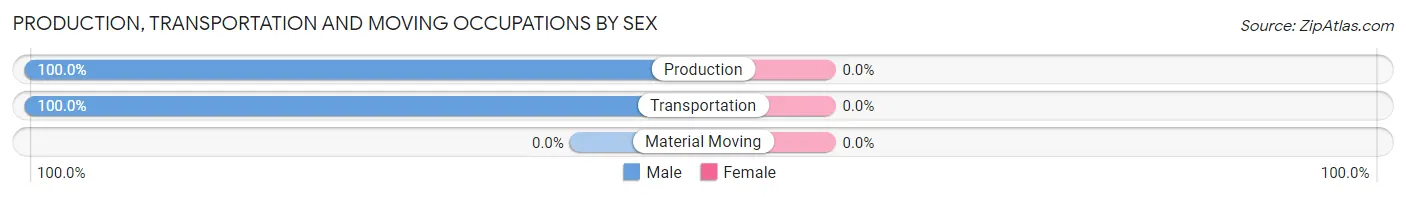
| Occupation | Male | Female |
| Production | 36 (100.0%) | 0 (0.0%) |
| Transportation | 170 (100.0%) | 0 (0.0%) |
| Material Moving | 0 (0.0%) | 0 (0.0%) |
| Total (Category) | 206 (100.0%) | 0 (0.0%) |
| Total (Overall) | 1,330 (56.9%) | 1,007 (43.1%) |
Employment Industries by Sex in Level Green
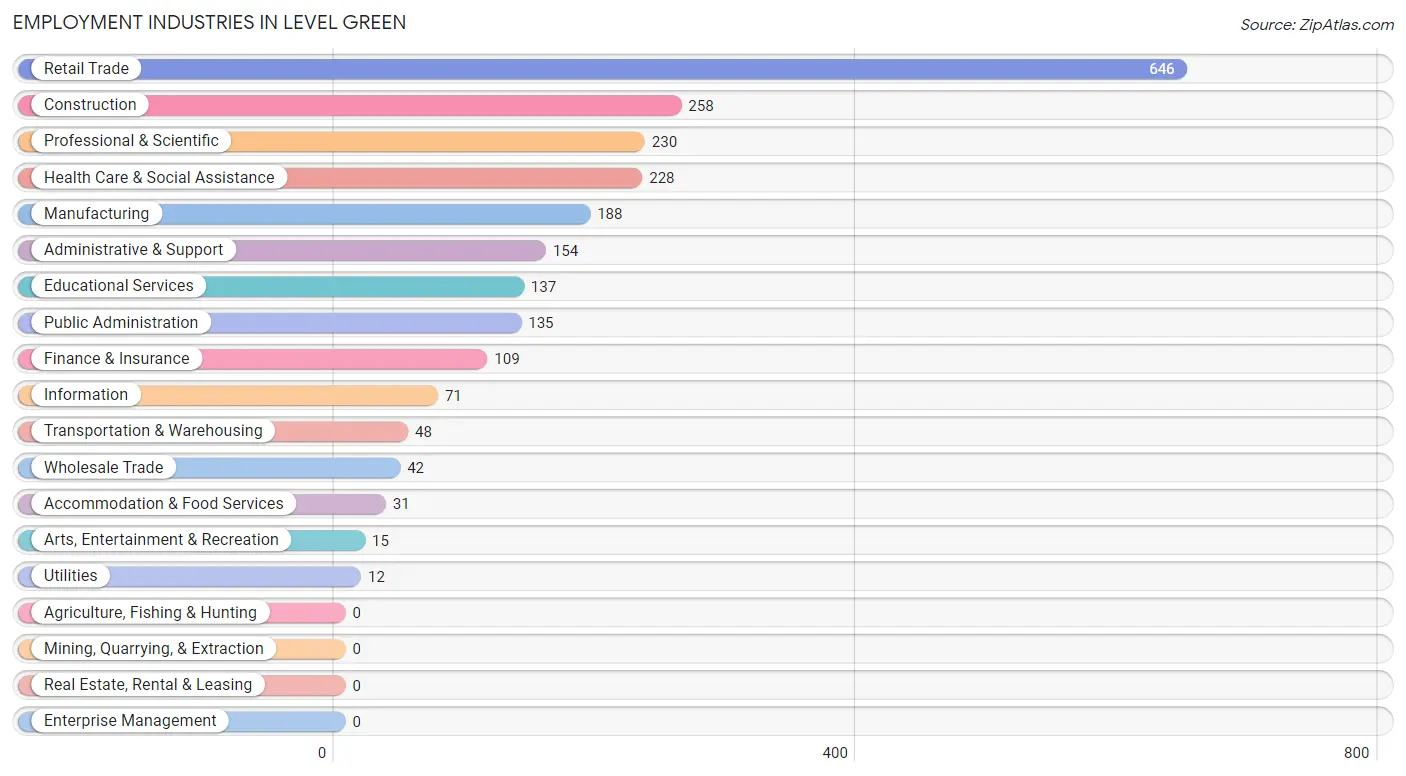
Employment Industries in Level Green
The major employment industries in Level Green include Retail Trade (646 | 27.6%), Construction (258 | 11.0%), Professional & Scientific (230 | 9.8%), Health Care & Social Assistance (228 | 9.8%), and Manufacturing (188 | 8.0%).
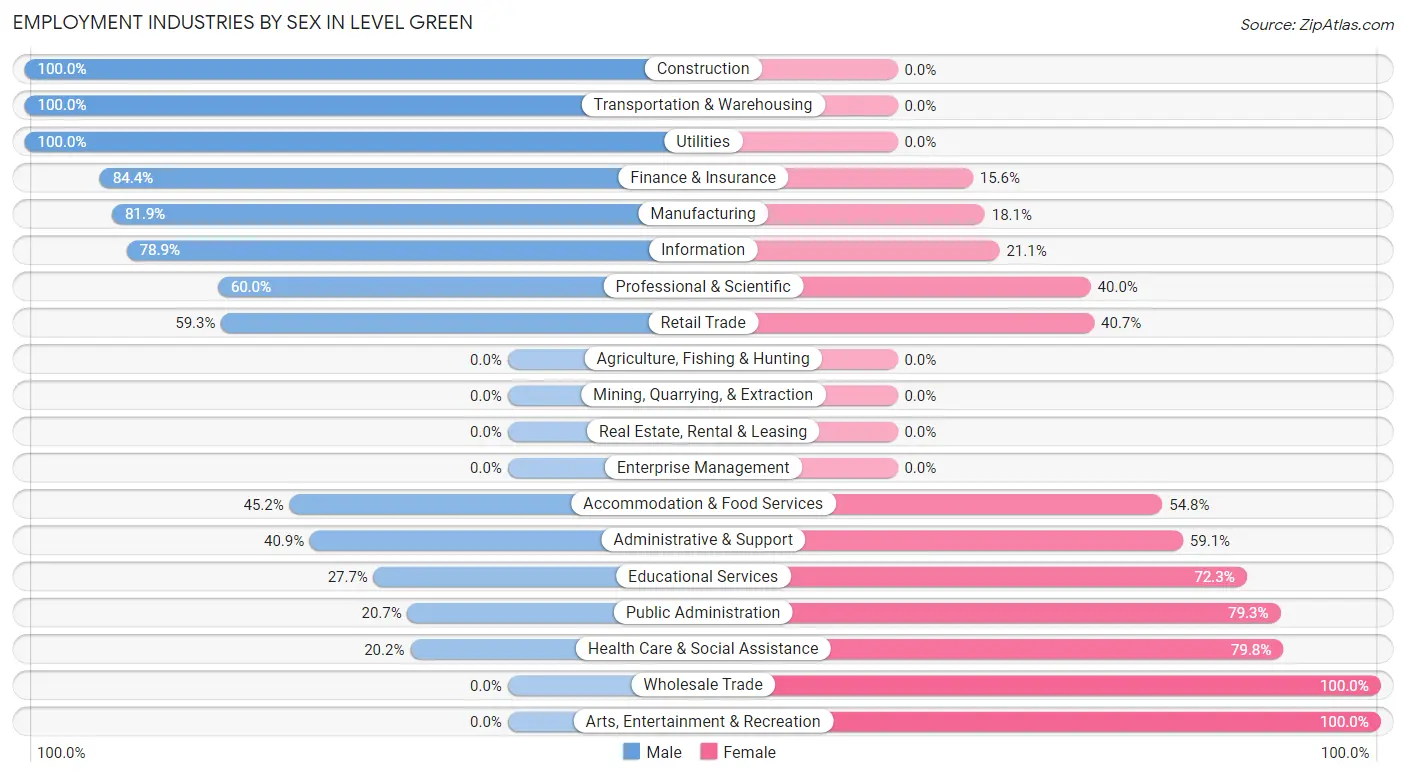
Employment Industries by Sex in Level Green
The Level Green industries that see more men than women are Construction (100.0%), Transportation & Warehousing (100.0%), and Utilities (100.0%), whereas the industries that tend to have a higher number of women are Wholesale Trade (100.0%), Arts, Entertainment & Recreation (100.0%), and Health Care & Social Assistance (79.8%).
| Industry | Male | Female |
| Agriculture, Fishing & Hunting | 0 (0.0%) | 0 (0.0%) |
| Mining, Quarrying, & Extraction | 0 (0.0%) | 0 (0.0%) |
| Construction | 258 (100.0%) | 0 (0.0%) |
| Manufacturing | 154 (81.9%) | 34 (18.1%) |
| Wholesale Trade | 0 (0.0%) | 42 (100.0%) |
| Retail Trade | 383 (59.3%) | 263 (40.7%) |
| Transportation & Warehousing | 48 (100.0%) | 0 (0.0%) |
| Utilities | 12 (100.0%) | 0 (0.0%) |
| Information | 56 (78.9%) | 15 (21.1%) |
| Finance & Insurance | 92 (84.4%) | 17 (15.6%) |
| Real Estate, Rental & Leasing | 0 (0.0%) | 0 (0.0%) |
| Professional & Scientific | 138 (60.0%) | 92 (40.0%) |
| Enterprise Management | 0 (0.0%) | 0 (0.0%) |
| Administrative & Support | 63 (40.9%) | 91 (59.1%) |
| Educational Services | 38 (27.7%) | 99 (72.3%) |
| Health Care & Social Assistance | 46 (20.2%) | 182 (79.8%) |
| Arts, Entertainment & Recreation | 0 (0.0%) | 15 (100.0%) |
| Accommodation & Food Services | 14 (45.2%) | 17 (54.8%) |
| Public Administration | 28 (20.7%) | 107 (79.3%) |
| Total | 1,330 (56.9%) | 1,007 (43.1%) |
Education in Level Green
School Enrollment in Level Green
The most common levels of schooling among the 809 students in Level Green are college / undergraduate (270 | 33.4%), high school (173 | 21.4%), and middle school (143 | 17.7%).
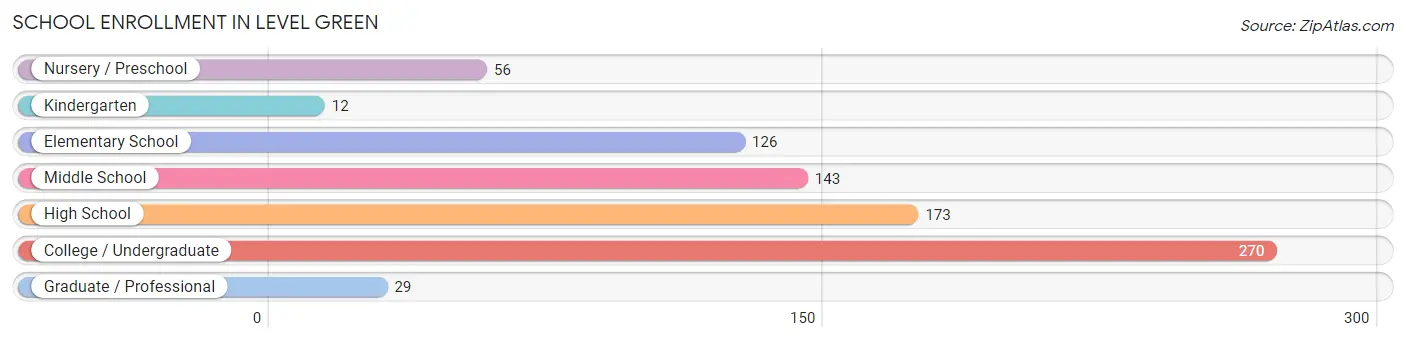
| School Level | # Students | % Students |
| Nursery / Preschool | 56 | 6.9% |
| Kindergarten | 12 | 1.5% |
| Elementary School | 126 | 15.6% |
| Middle School | 143 | 17.7% |
| High School | 173 | 21.4% |
| College / Undergraduate | 270 | 33.4% |
| Graduate / Professional | 29 | 3.6% |
| Total | 809 | 100.0% |
School Enrollment by Age by Funding Source in Level Green
Out of a total of 809 students who are enrolled in schools in Level Green, 144 (17.8%) attend a private institution, while the remaining 665 (82.2%) are enrolled in public schools. The age group of 3 to 4 year olds has the highest likelihood of being enrolled in private schools, with 40 (71.4% in the age bracket) enrolled. Conversely, the age group of 10 to 14 year olds has the lowest likelihood of being enrolled in a private school, with 161 (100.0% in the age bracket) attending a public institution.
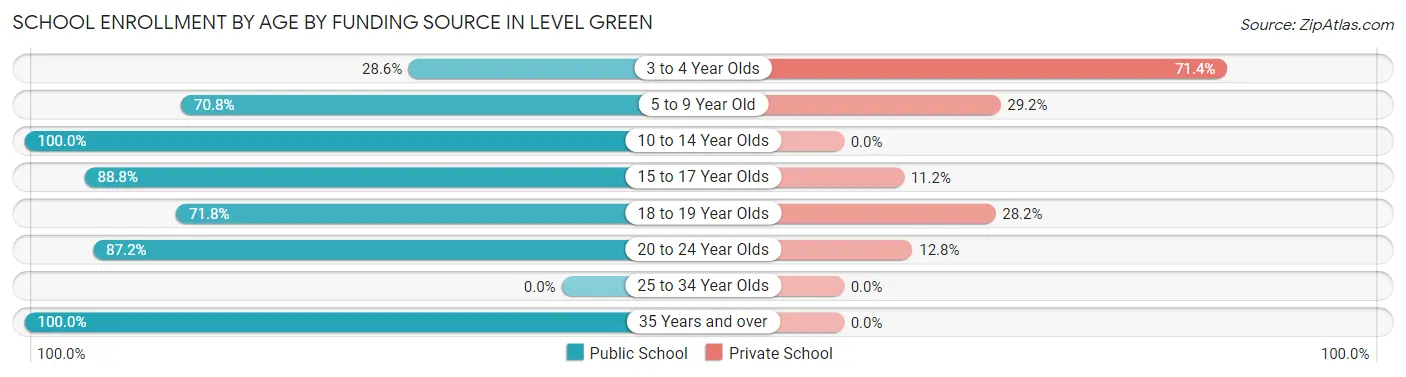
| Age Bracket | Public School | Private School |
| 3 to 4 Year Olds | 16 (28.6%) | 40 (71.4%) |
| 5 to 9 Year Old | 85 (70.8%) | 35 (29.2%) |
| 10 to 14 Year Olds | 161 (100.0%) | 0 (0.0%) |
| 15 to 17 Year Olds | 127 (88.8%) | 16 (11.2%) |
| 18 to 19 Year Olds | 61 (71.8%) | 24 (28.2%) |
| 20 to 24 Year Olds | 198 (87.2%) | 29 (12.8%) |
| 25 to 34 Year Olds | 0 (0.0%) | 0 (0.0%) |
| 35 Years and over | 17 (100.0%) | 0 (0.0%) |
| Total | 665 (82.2%) | 144 (17.8%) |
Educational Attainment by Field of Study in Level Green
Business (192 | 13.3%), education (177 | 12.3%), visual & performing arts (163 | 11.3%), engineering (134 | 9.3%), and science & technology (123 | 8.6%) are the most common fields of study among 1,439 individuals in Level Green who have obtained a bachelor's degree or higher.
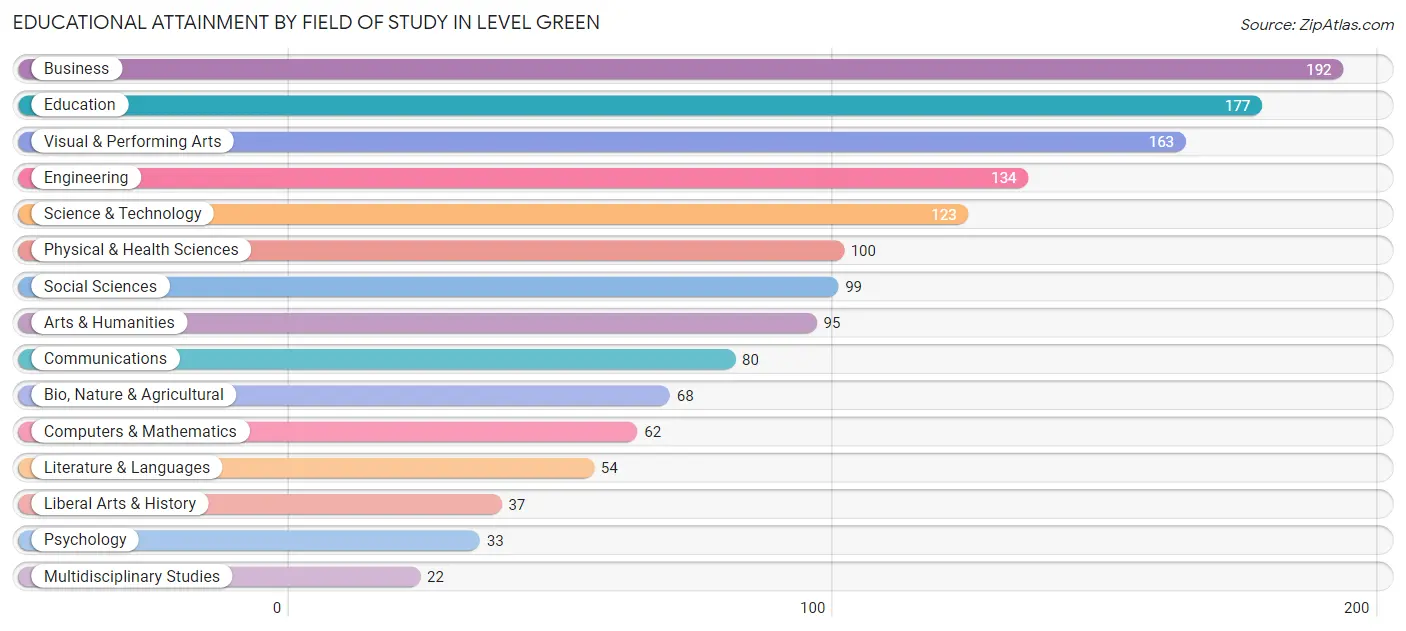
| Field of Study | # Graduates | % Graduates |
| Computers & Mathematics | 62 | 4.3% |
| Bio, Nature & Agricultural | 68 | 4.7% |
| Physical & Health Sciences | 100 | 7.0% |
| Psychology | 33 | 2.3% |
| Social Sciences | 99 | 6.9% |
| Engineering | 134 | 9.3% |
| Multidisciplinary Studies | 22 | 1.5% |
| Science & Technology | 123 | 8.6% |
| Business | 192 | 13.3% |
| Education | 177 | 12.3% |
| Literature & Languages | 54 | 3.7% |
| Liberal Arts & History | 37 | 2.6% |
| Visual & Performing Arts | 163 | 11.3% |
| Communications | 80 | 5.6% |
| Arts & Humanities | 95 | 6.6% |
| Total | 1,439 | 100.0% |
Transportation & Commute in Level Green
Vehicle Availability by Sex in Level Green
The most prevalent vehicle ownership categories in Level Green are males with 3 vehicles (622, accounting for 46.8%) and females with 3 vehicles (587, making up 61.8%).
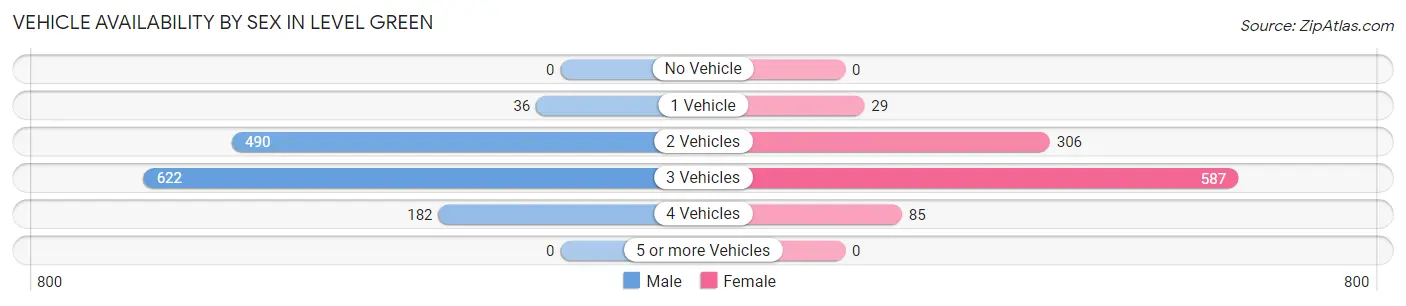
| Vehicles Available | Male | Female |
| No Vehicle | 0 (0.0%) | 0 (0.0%) |
| 1 Vehicle | 36 (2.7%) | 29 (2.9%) |
| 2 Vehicles | 490 (36.8%) | 306 (30.4%) |
| 3 Vehicles | 622 (46.8%) | 587 (58.3%) |
| 4 Vehicles | 182 (13.7%) | 85 (8.4%) |
| 5 or more Vehicles | 0 (0.0%) | 0 (0.0%) |
| Total | 1,330 (100.0%) | 1,007 (100.0%) |
Commute Time in Level Green
The most frequently occuring commute durations in Level Green are 45 to 59 minutes (378 commuters, 17.2%), 15 to 19 minutes (365 commuters, 16.6%), and 20 to 24 minutes (334 commuters, 15.2%).
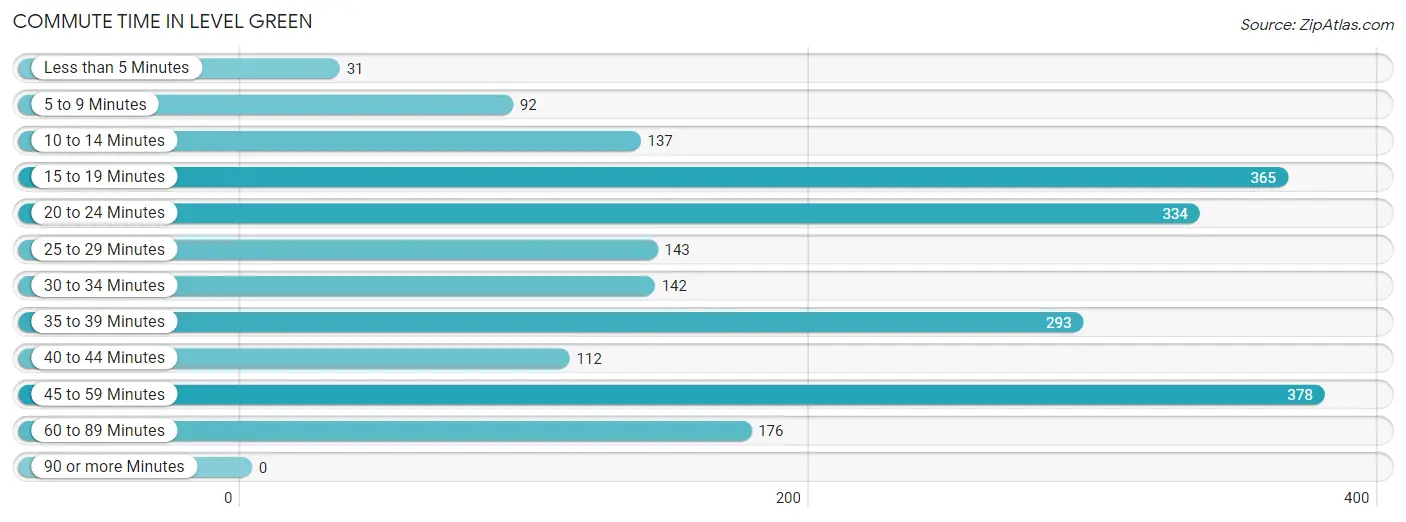
| Commute Time | # Commuters | % Commuters |
| Less than 5 Minutes | 31 | 1.4% |
| 5 to 9 Minutes | 92 | 4.2% |
| 10 to 14 Minutes | 137 | 6.2% |
| 15 to 19 Minutes | 365 | 16.6% |
| 20 to 24 Minutes | 334 | 15.2% |
| 25 to 29 Minutes | 143 | 6.5% |
| 30 to 34 Minutes | 142 | 6.5% |
| 35 to 39 Minutes | 293 | 13.3% |
| 40 to 44 Minutes | 112 | 5.1% |
| 45 to 59 Minutes | 378 | 17.2% |
| 60 to 89 Minutes | 176 | 8.0% |
| 90 or more Minutes | 0 | 0.0% |
Commute Time by Sex in Level Green
The most common commute times in Level Green are 45 to 59 minutes (295 commuters, 23.2%) for males and 35 to 39 minutes (251 commuters, 26.9%) for females.
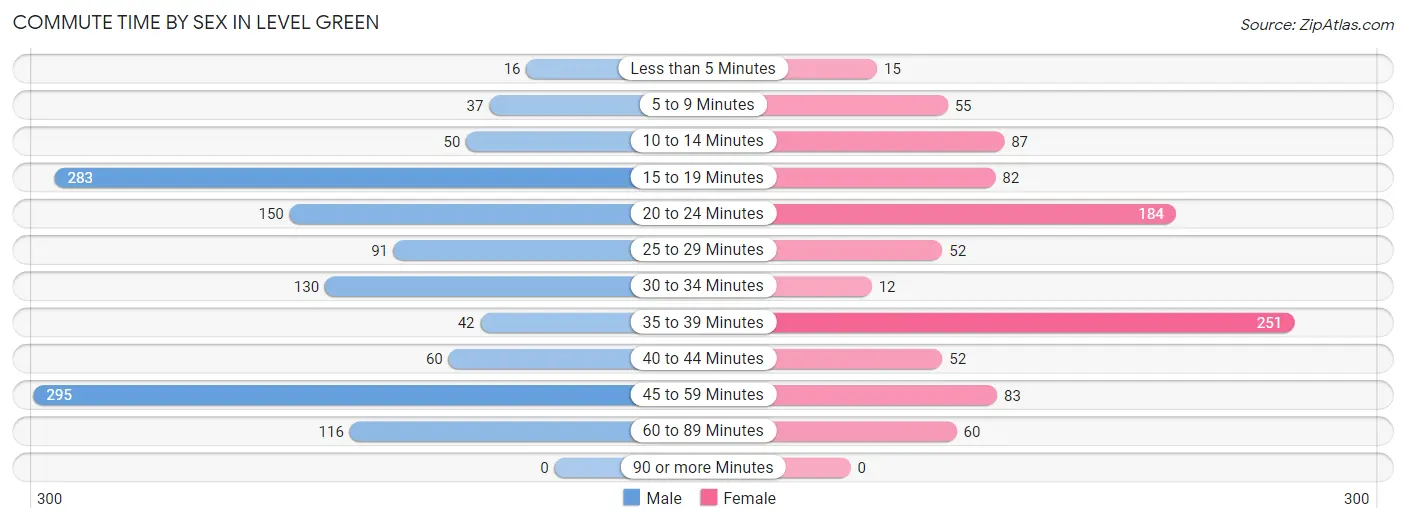
| Commute Time | Male | Female |
| Less than 5 Minutes | 16 (1.3%) | 15 (1.6%) |
| 5 to 9 Minutes | 37 (2.9%) | 55 (5.9%) |
| 10 to 14 Minutes | 50 (3.9%) | 87 (9.3%) |
| 15 to 19 Minutes | 283 (22.3%) | 82 (8.8%) |
| 20 to 24 Minutes | 150 (11.8%) | 184 (19.7%) |
| 25 to 29 Minutes | 91 (7.2%) | 52 (5.6%) |
| 30 to 34 Minutes | 130 (10.2%) | 12 (1.3%) |
| 35 to 39 Minutes | 42 (3.3%) | 251 (26.9%) |
| 40 to 44 Minutes | 60 (4.7%) | 52 (5.6%) |
| 45 to 59 Minutes | 295 (23.2%) | 83 (8.9%) |
| 60 to 89 Minutes | 116 (9.1%) | 60 (6.4%) |
| 90 or more Minutes | 0 (0.0%) | 0 (0.0%) |
Time of Departure to Work by Sex in Level Green
The most frequent times of departure to work in Level Green are 6:00 AM to 6:29 AM (228, 17.9%) for males and 7:00 AM to 7:29 AM (246, 26.4%) for females.
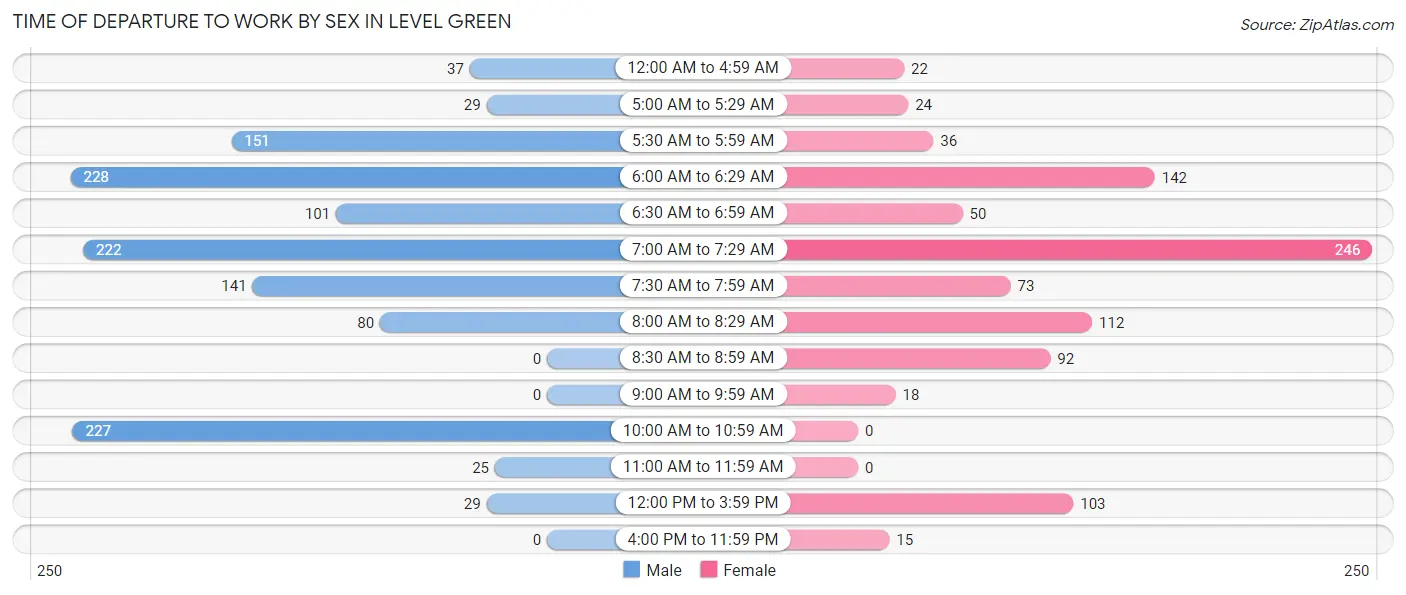
| Time of Departure | Male | Female |
| 12:00 AM to 4:59 AM | 37 (2.9%) | 22 (2.4%) |
| 5:00 AM to 5:29 AM | 29 (2.3%) | 24 (2.6%) |
| 5:30 AM to 5:59 AM | 151 (11.9%) | 36 (3.9%) |
| 6:00 AM to 6:29 AM | 228 (17.9%) | 142 (15.2%) |
| 6:30 AM to 6:59 AM | 101 (8.0%) | 50 (5.4%) |
| 7:00 AM to 7:29 AM | 222 (17.5%) | 246 (26.4%) |
| 7:30 AM to 7:59 AM | 141 (11.1%) | 73 (7.8%) |
| 8:00 AM to 8:29 AM | 80 (6.3%) | 112 (12.0%) |
| 8:30 AM to 8:59 AM | 0 (0.0%) | 92 (9.9%) |
| 9:00 AM to 9:59 AM | 0 (0.0%) | 18 (1.9%) |
| 10:00 AM to 10:59 AM | 227 (17.9%) | 0 (0.0%) |
| 11:00 AM to 11:59 AM | 25 (2.0%) | 0 (0.0%) |
| 12:00 PM to 3:59 PM | 29 (2.3%) | 103 (11.0%) |
| 4:00 PM to 11:59 PM | 0 (0.0%) | 15 (1.6%) |
| Total | 1,270 (100.0%) | 933 (100.0%) |
Housing Occupancy in Level Green
Occupancy by Ownership in Level Green
Of the total 1,653 dwellings in Level Green, owner-occupied units account for 1,618 (97.9%), while renter-occupied units make up 35 (2.1%).
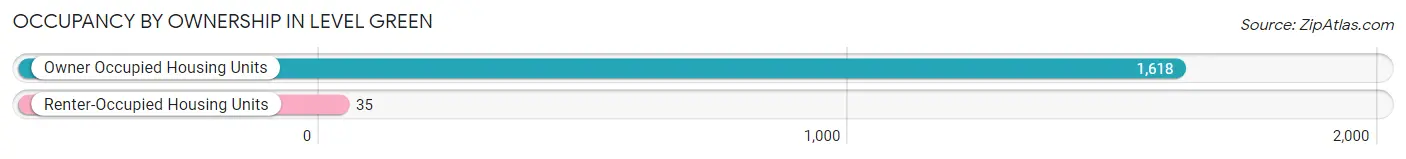
| Occupancy | # Housing Units | % Housing Units |
| Owner Occupied Housing Units | 1,618 | 97.9% |
| Renter-Occupied Housing Units | 35 | 2.1% |
| Total Occupied Housing Units | 1,653 | 100.0% |
Occupancy by Household Size in Level Green
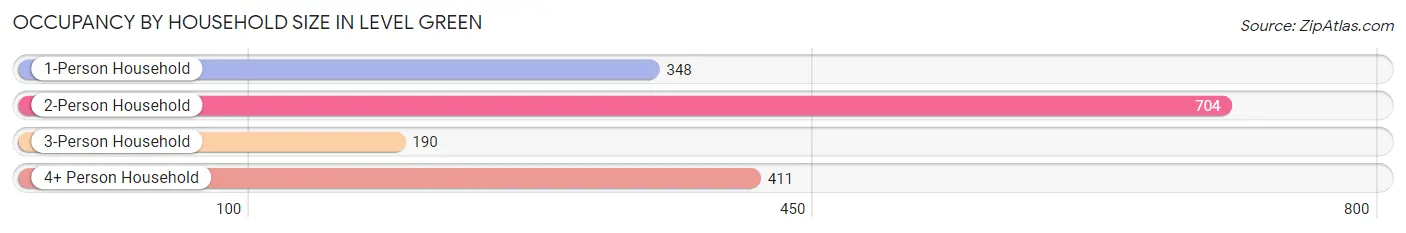
| Household Size | # Housing Units | % Housing Units |
| 1-Person Household | 348 | 21.0% |
| 2-Person Household | 704 | 42.6% |
| 3-Person Household | 190 | 11.5% |
| 4+ Person Household | 411 | 24.9% |
| Total Housing Units | 1,653 | 100.0% |
Occupancy by Ownership by Household Size in Level Green
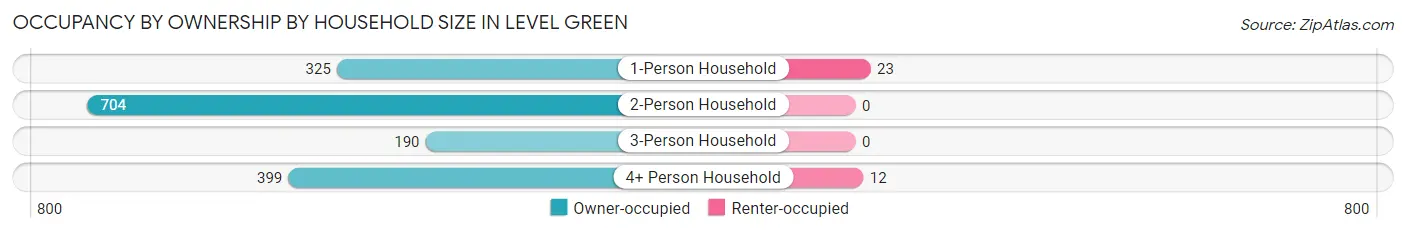
| Household Size | Owner-occupied | Renter-occupied |
| 1-Person Household | 325 (93.4%) | 23 (6.6%) |
| 2-Person Household | 704 (100.0%) | 0 (0.0%) |
| 3-Person Household | 190 (100.0%) | 0 (0.0%) |
| 4+ Person Household | 399 (97.1%) | 12 (2.9%) |
| Total Housing Units | 1,618 (97.9%) | 35 (2.1%) |
Occupancy by Educational Attainment in Level Green
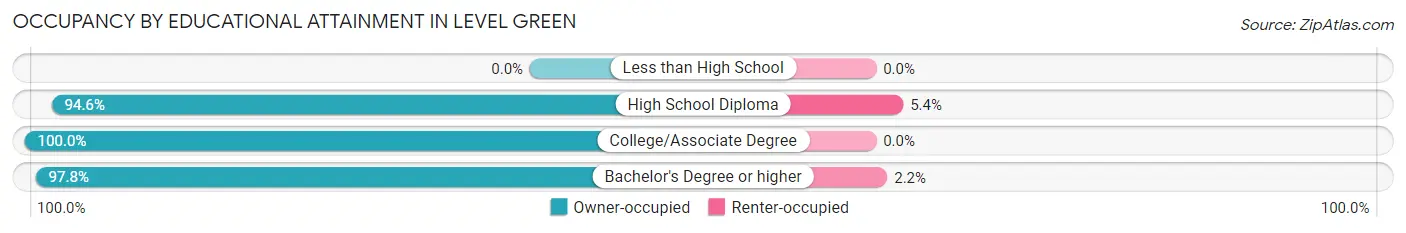
| Household Size | Owner-occupied | Renter-occupied |
| Less than High School | 0 (0.0%) | 0 (0.0%) |
| High School Diploma | 406 (94.6%) | 23 (5.4%) |
| College/Associate Degree | 678 (100.0%) | 0 (0.0%) |
| Bachelor's Degree or higher | 534 (97.8%) | 12 (2.2%) |
Occupancy by Age of Householder in Level Green
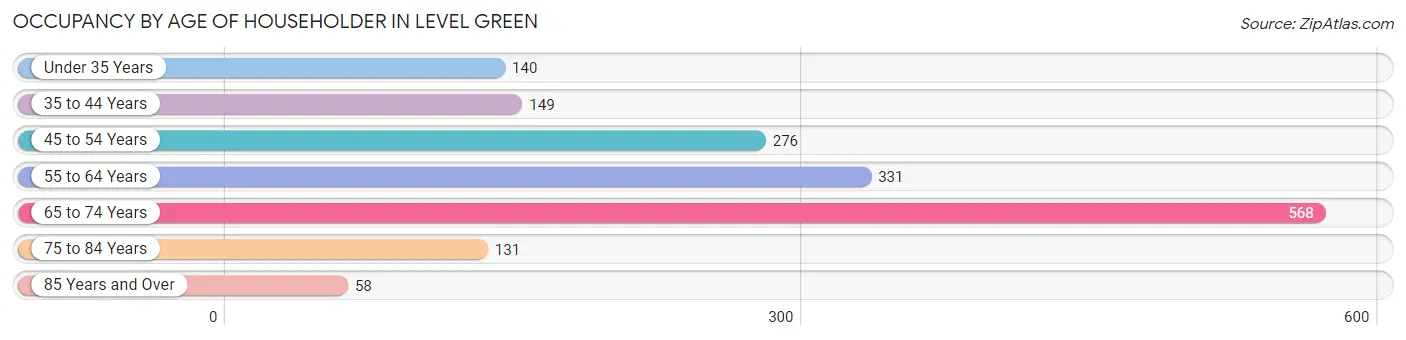
| Age Bracket | # Households | % Households |
| Under 35 Years | 140 | 8.5% |
| 35 to 44 Years | 149 | 9.0% |
| 45 to 54 Years | 276 | 16.7% |
| 55 to 64 Years | 331 | 20.0% |
| 65 to 74 Years | 568 | 34.4% |
| 75 to 84 Years | 131 | 7.9% |
| 85 Years and Over | 58 | 3.5% |
| Total | 1,653 | 100.0% |
Housing Finances in Level Green
Median Income by Occupancy in Level Green
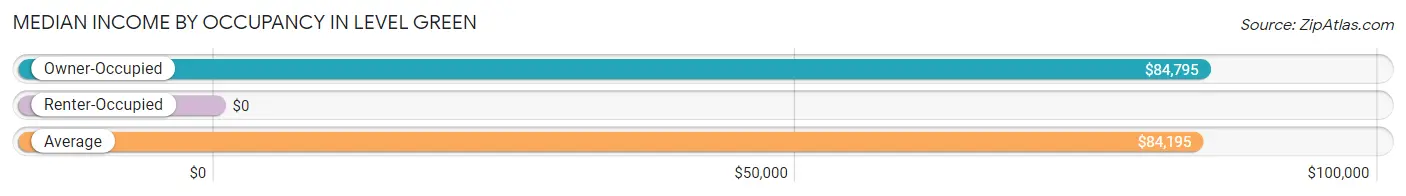
| Occupancy Type | # Households | Median Income |
| Owner-Occupied | 1,618 (97.9%) | $84,795 |
| Renter-Occupied | 35 (2.1%) | $0 |
| Average | 1,653 (100.0%) | $84,195 |
Occupancy by Householder Income Bracket in Level Green
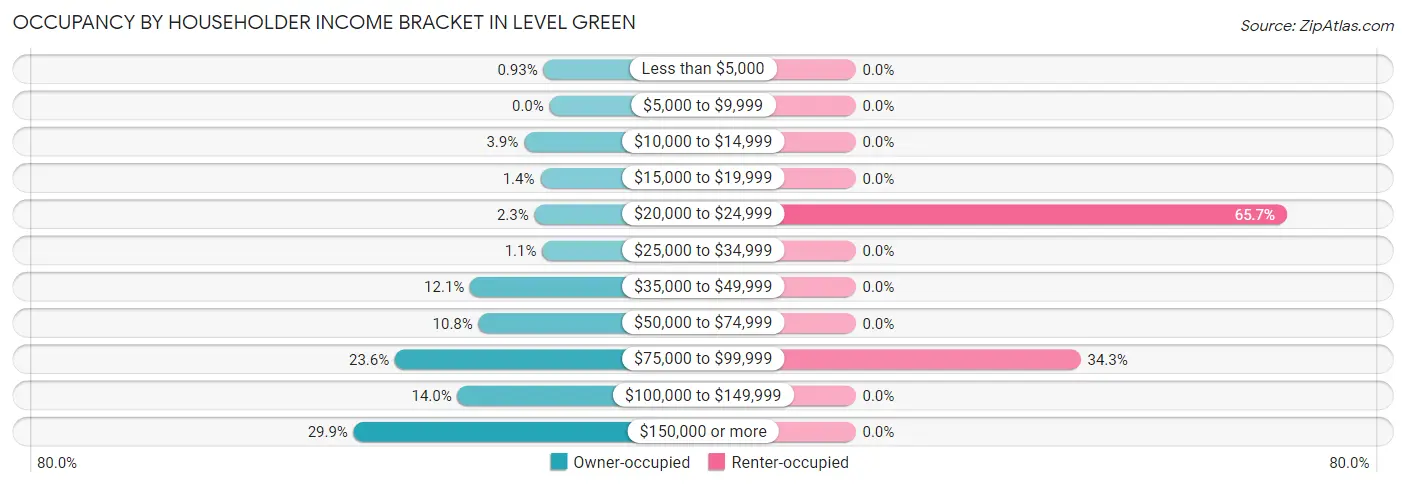
| Income Bracket | Owner-occupied | Renter-occupied |
| Less than $5,000 | 15 (0.9%) | 0 (0.0%) |
| $5,000 to $9,999 | 0 (0.0%) | 0 (0.0%) |
| $10,000 to $14,999 | 63 (3.9%) | 0 (0.0%) |
| $15,000 to $19,999 | 23 (1.4%) | 0 (0.0%) |
| $20,000 to $24,999 | 37 (2.3%) | 23 (65.7%) |
| $25,000 to $34,999 | 18 (1.1%) | 0 (0.0%) |
| $35,000 to $49,999 | 196 (12.1%) | 0 (0.0%) |
| $50,000 to $74,999 | 175 (10.8%) | 0 (0.0%) |
| $75,000 to $99,999 | 381 (23.5%) | 12 (34.3%) |
| $100,000 to $149,999 | 227 (14.0%) | 0 (0.0%) |
| $150,000 or more | 483 (29.8%) | 0 (0.0%) |
| Total | 1,618 (100.0%) | 35 (100.0%) |
Monthly Housing Cost Tiers in Level Green
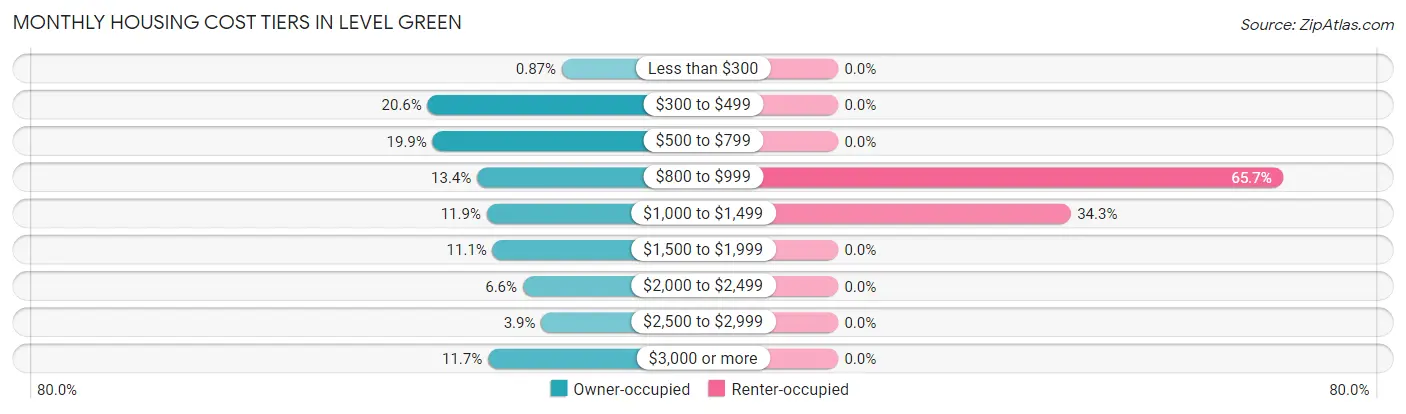
| Monthly Cost | Owner-occupied | Renter-occupied |
| Less than $300 | 14 (0.9%) | 0 (0.0%) |
| $300 to $499 | 334 (20.6%) | 0 (0.0%) |
| $500 to $799 | 322 (19.9%) | 0 (0.0%) |
| $800 to $999 | 216 (13.4%) | 23 (65.7%) |
| $1,000 to $1,499 | 193 (11.9%) | 12 (34.3%) |
| $1,500 to $1,999 | 179 (11.1%) | 0 (0.0%) |
| $2,000 to $2,499 | 107 (6.6%) | 0 (0.0%) |
| $2,500 to $2,999 | 63 (3.9%) | 0 (0.0%) |
| $3,000 or more | 190 (11.7%) | 0 (0.0%) |
| Total | 1,618 (100.0%) | 35 (100.0%) |
Physical Housing Characteristics in Level Green
Housing Structures in Level Green
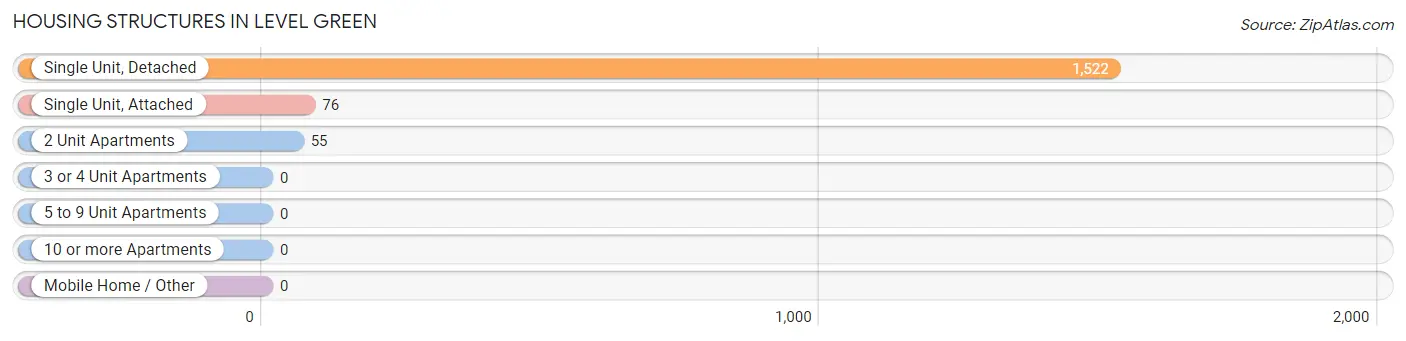
| Structure Type | # Housing Units | % Housing Units |
| Single Unit, Detached | 1,522 | 92.1% |
| Single Unit, Attached | 76 | 4.6% |
| 2 Unit Apartments | 55 | 3.3% |
| 3 or 4 Unit Apartments | 0 | 0.0% |
| 5 to 9 Unit Apartments | 0 | 0.0% |
| 10 or more Apartments | 0 | 0.0% |
| Mobile Home / Other | 0 | 0.0% |
| Total | 1,653 | 100.0% |
Housing Structures by Occupancy in Level Green
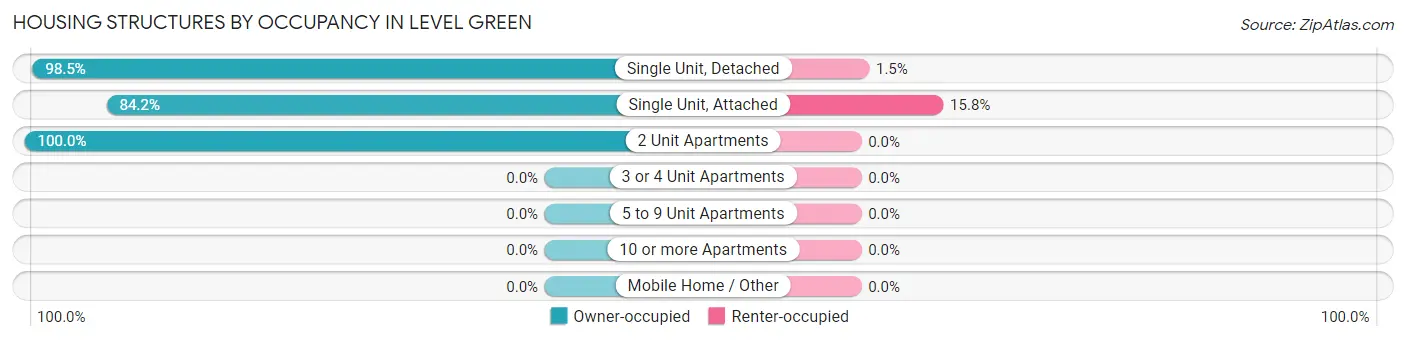
| Structure Type | Owner-occupied | Renter-occupied |
| Single Unit, Detached | 1,499 (98.5%) | 23 (1.5%) |
| Single Unit, Attached | 64 (84.2%) | 12 (15.8%) |
| 2 Unit Apartments | 55 (100.0%) | 0 (0.0%) |
| 3 or 4 Unit Apartments | 0 (0.0%) | 0 (0.0%) |
| 5 to 9 Unit Apartments | 0 (0.0%) | 0 (0.0%) |
| 10 or more Apartments | 0 (0.0%) | 0 (0.0%) |
| Mobile Home / Other | 0 (0.0%) | 0 (0.0%) |
| Total | 1,618 (97.9%) | 35 (2.1%) |
Housing Structures by Number of Rooms in Level Green
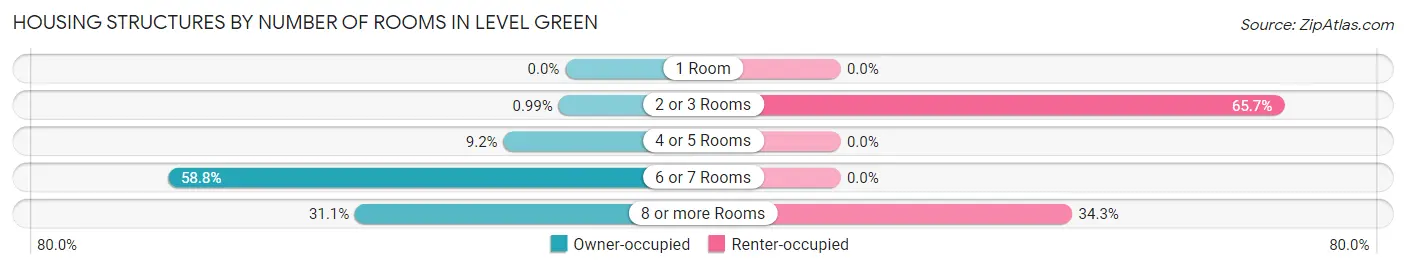
| Number of Rooms | Owner-occupied | Renter-occupied |
| 1 Room | 0 (0.0%) | 0 (0.0%) |
| 2 or 3 Rooms | 16 (1.0%) | 23 (65.7%) |
| 4 or 5 Rooms | 148 (9.1%) | 0 (0.0%) |
| 6 or 7 Rooms | 951 (58.8%) | 0 (0.0%) |
| 8 or more Rooms | 503 (31.1%) | 12 (34.3%) |
| Total | 1,618 (100.0%) | 35 (100.0%) |
Housing Structure by Heating Type in Level Green
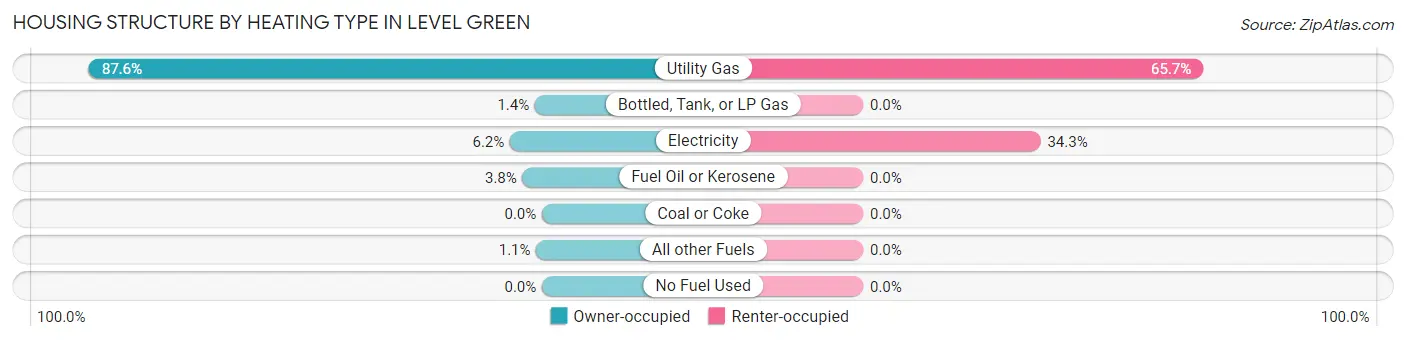
| Heating Type | Owner-occupied | Renter-occupied |
| Utility Gas | 1,417 (87.6%) | 23 (65.7%) |
| Bottled, Tank, or LP Gas | 22 (1.4%) | 0 (0.0%) |
| Electricity | 100 (6.2%) | 12 (34.3%) |
| Fuel Oil or Kerosene | 61 (3.8%) | 0 (0.0%) |
| Coal or Coke | 0 (0.0%) | 0 (0.0%) |
| All other Fuels | 18 (1.1%) | 0 (0.0%) |
| No Fuel Used | 0 (0.0%) | 0 (0.0%) |
| Total | 1,618 (100.0%) | 35 (100.0%) |
Household Vehicle Usage in Level Green
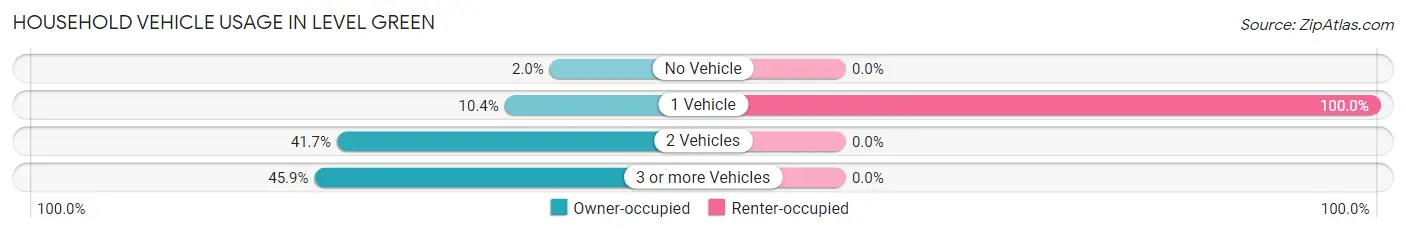
| Vehicles per Household | Owner-occupied | Renter-occupied |
| No Vehicle | 32 (2.0%) | 0 (0.0%) |
| 1 Vehicle | 168 (10.4%) | 35 (100.0%) |
| 2 Vehicles | 675 (41.7%) | 0 (0.0%) |
| 3 or more Vehicles | 743 (45.9%) | 0 (0.0%) |
| Total | 1,618 (100.0%) | 35 (100.0%) |
Real Estate & Mortgages in Level Green
Real Estate and Mortgage Overview in Level Green
| Characteristic | Without Mortgage | With Mortgage |
| Housing Units | 678 | 940 |
| Median Property Value | $224,800 | $225,900 |
| Median Household Income | $70,955 | $372 |
| Monthly Housing Costs | $496 | $190 |
| Real Estate Taxes | $2,445 | $17 |
Property Value by Mortgage Status in Level Green
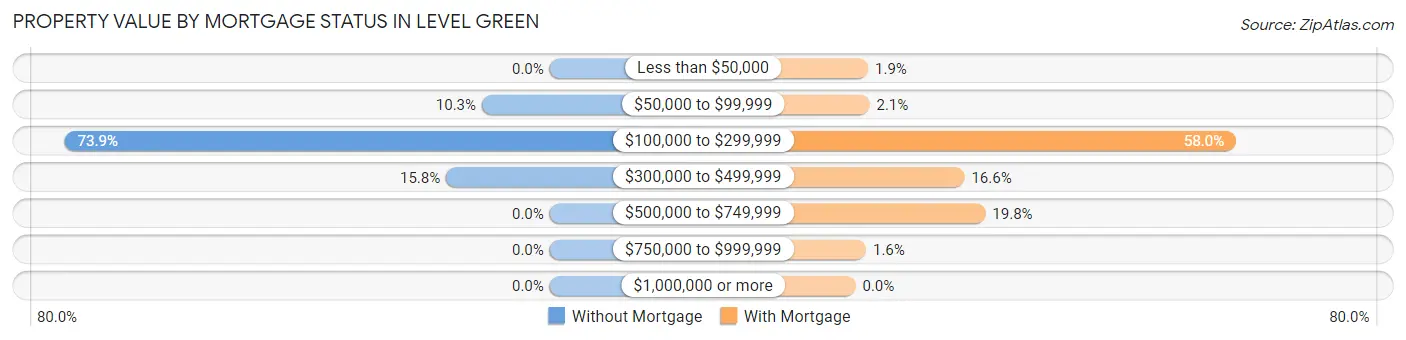
| Property Value | Without Mortgage | With Mortgage |
| Less than $50,000 | 0 (0.0%) | 18 (1.9%) |
| $50,000 to $99,999 | 70 (10.3%) | 20 (2.1%) |
| $100,000 to $299,999 | 501 (73.9%) | 545 (58.0%) |
| $300,000 to $499,999 | 107 (15.8%) | 156 (16.6%) |
| $500,000 to $749,999 | 0 (0.0%) | 186 (19.8%) |
| $750,000 to $999,999 | 0 (0.0%) | 15 (1.6%) |
| $1,000,000 or more | 0 (0.0%) | 0 (0.0%) |
| Total | 678 (100.0%) | 940 (100.0%) |
Household Income by Mortgage Status in Level Green
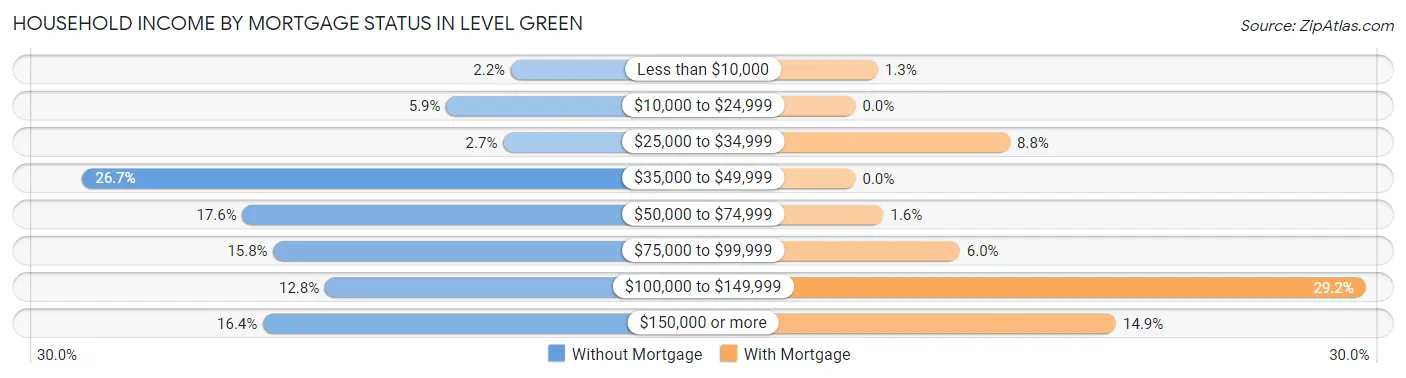
| Household Income | Without Mortgage | With Mortgage |
| Less than $10,000 | 15 (2.2%) | 12 (1.3%) |
| $10,000 to $24,999 | 40 (5.9%) | 0 (0.0%) |
| $25,000 to $34,999 | 18 (2.6%) | 83 (8.8%) |
| $35,000 to $49,999 | 181 (26.7%) | 0 (0.0%) |
| $50,000 to $74,999 | 119 (17.5%) | 15 (1.6%) |
| $75,000 to $99,999 | 107 (15.8%) | 56 (6.0%) |
| $100,000 to $149,999 | 87 (12.8%) | 274 (29.1%) |
| $150,000 or more | 111 (16.4%) | 140 (14.9%) |
| Total | 678 (100.0%) | 940 (100.0%) |
Property Value to Household Income Ratio in Level Green
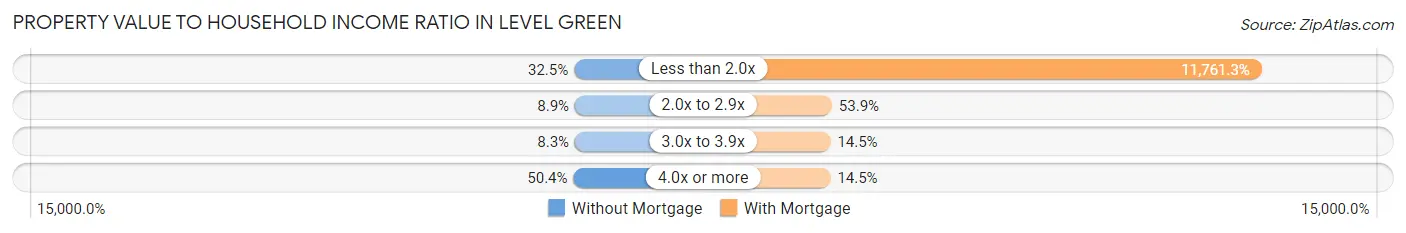
| Value-to-Income Ratio | Without Mortgage | With Mortgage |
| Less than 2.0x | 220 (32.5%) | 110,556 (11,761.3%) |
| 2.0x to 2.9x | 60 (8.8%) | 507 (53.9%) |
| 3.0x to 3.9x | 56 (8.3%) | 136 (14.5%) |
| 4.0x or more | 342 (50.4%) | 136 (14.5%) |
| Total | 678 (100.0%) | 940 (100.0%) |
Real Estate Taxes by Mortgage Status in Level Green
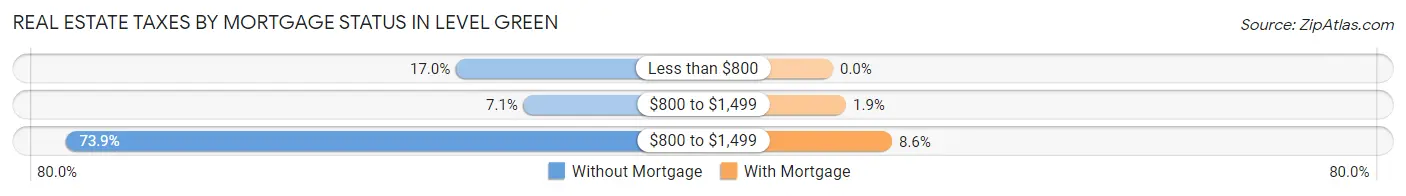
| Property Taxes | Without Mortgage | With Mortgage |
| Less than $800 | 115 (17.0%) | 0 (0.0%) |
| $800 to $1,499 | 48 (7.1%) | 18 (1.9%) |
| $800 to $1,499 | 501 (73.9%) | 81 (8.6%) |
| Total | 678 (100.0%) | 940 (100.0%) |
Health & Disability in Level Green
Health Insurance Coverage by Age in Level Green
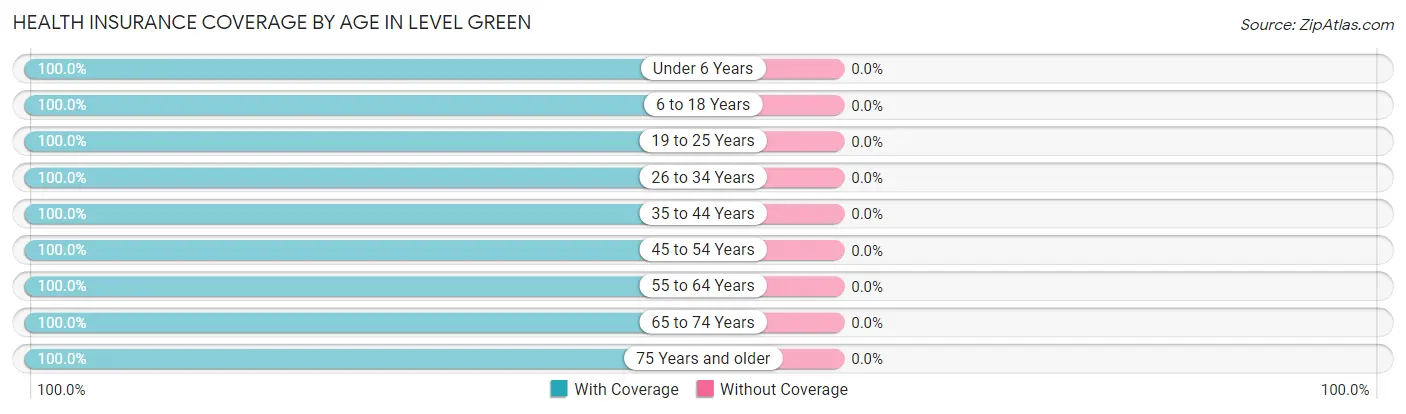
| Age Bracket | With Coverage | Without Coverage |
| Under 6 Years | 214 (100.0%) | 0 (0.0%) |
| 6 to 18 Years | 478 (100.0%) | 0 (0.0%) |
| 19 to 25 Years | 363 (100.0%) | 0 (0.0%) |
| 26 to 34 Years | 440 (100.0%) | 0 (0.0%) |
| 35 to 44 Years | 255 (100.0%) | 0 (0.0%) |
| 45 to 54 Years | 559 (100.0%) | 0 (0.0%) |
| 55 to 64 Years | 525 (100.0%) | 0 (0.0%) |
| 65 to 74 Years | 1,030 (100.0%) | 0 (0.0%) |
| 75 Years and older | 276 (100.0%) | 0 (0.0%) |
| Total | 4,140 (100.0%) | 0 (0.0%) |
Health Insurance Coverage by Citizenship Status in Level Green
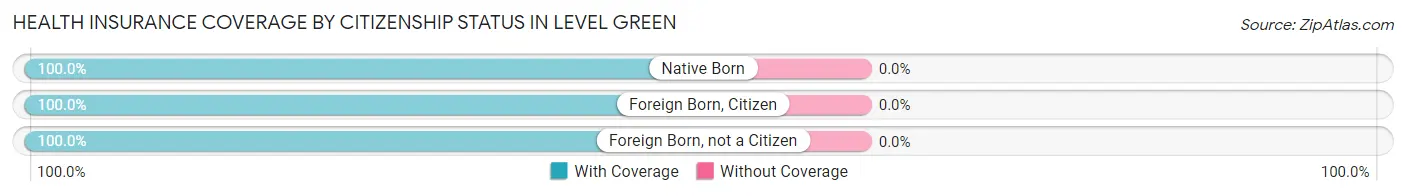
| Citizenship Status | With Coverage | Without Coverage |
| Native Born | 214 (100.0%) | 0 (0.0%) |
| Foreign Born, Citizen | 478 (100.0%) | 0 (0.0%) |
| Foreign Born, not a Citizen | 363 (100.0%) | 0 (0.0%) |
Health Insurance Coverage by Household Income in Level Green
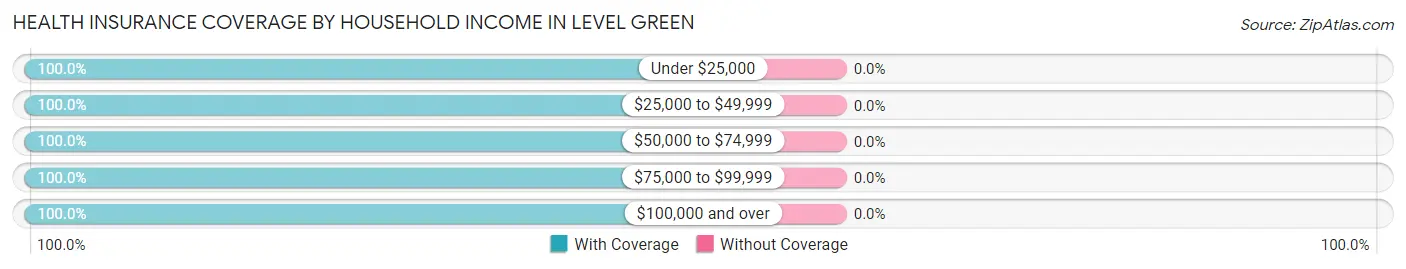
| Household Income | With Coverage | Without Coverage |
| Under $25,000 | 203 (100.0%) | 0 (0.0%) |
| $25,000 to $49,999 | 505 (100.0%) | 0 (0.0%) |
| $50,000 to $74,999 | 336 (100.0%) | 0 (0.0%) |
| $75,000 to $99,999 | 785 (100.0%) | 0 (0.0%) |
| $100,000 and over | 2,311 (100.0%) | 0 (0.0%) |
Public vs Private Health Insurance Coverage by Age in Level Green
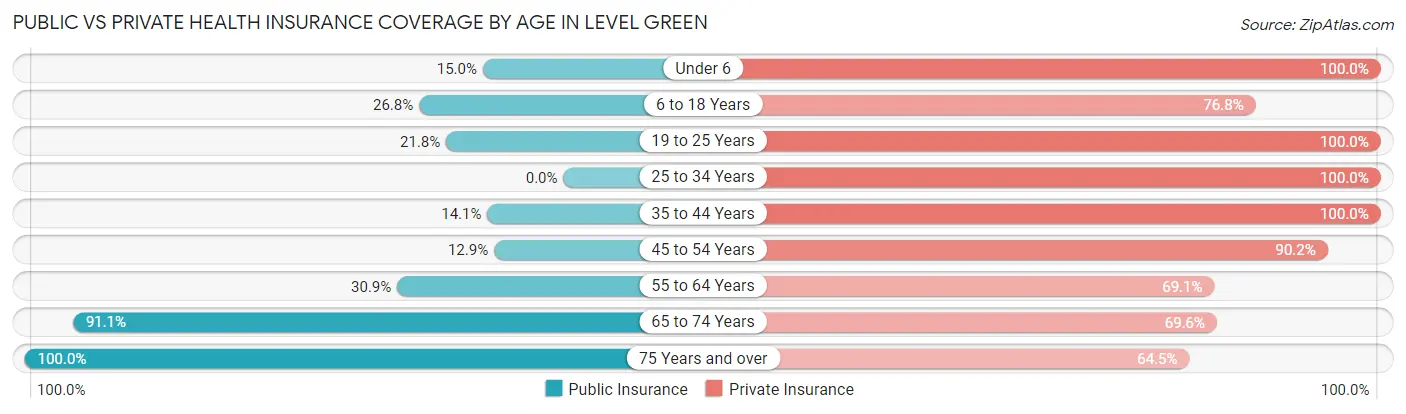
| Age Bracket | Public Insurance | Private Insurance |
| Under 6 | 32 (14.9%) | 214 (100.0%) |
| 6 to 18 Years | 128 (26.8%) | 367 (76.8%) |
| 19 to 25 Years | 79 (21.8%) | 363 (100.0%) |
| 25 to 34 Years | 0 (0.0%) | 440 (100.0%) |
| 35 to 44 Years | 36 (14.1%) | 255 (100.0%) |
| 45 to 54 Years | 72 (12.9%) | 504 (90.2%) |
| 55 to 64 Years | 162 (30.9%) | 363 (69.1%) |
| 65 to 74 Years | 938 (91.1%) | 717 (69.6%) |
| 75 Years and over | 276 (100.0%) | 178 (64.5%) |
| Total | 1,723 (41.6%) | 3,401 (82.2%) |
Disability Status by Sex by Age in Level Green
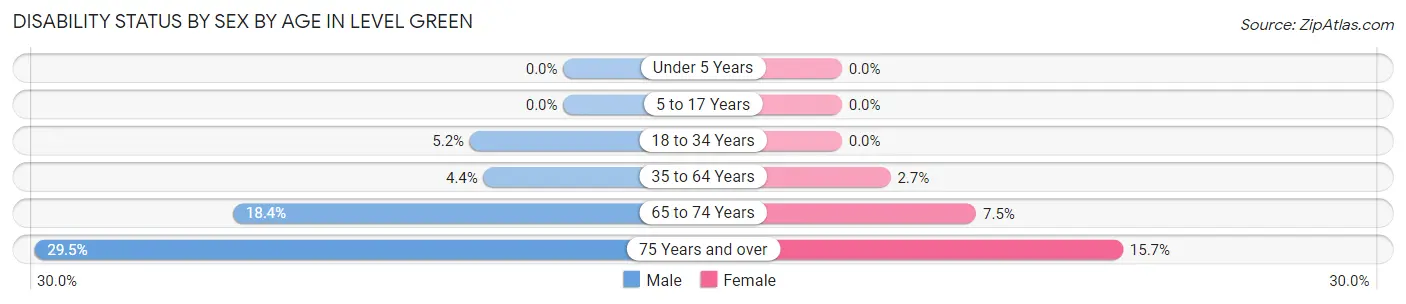
| Age Bracket | Male | Female |
| Under 5 Years | 0 (0.0%) | 0 (0.0%) |
| 5 to 17 Years | 0 (0.0%) | 0 (0.0%) |
| 18 to 34 Years | 26 (5.2%) | 0 (0.0%) |
| 35 to 64 Years | 30 (4.4%) | 18 (2.7%) |
| 65 to 74 Years | 101 (18.4%) | 36 (7.5%) |
| 75 Years and over | 38 (29.5%) | 23 (15.7%) |
Disability Class by Sex by Age in Level Green
Disability Class: Hearing Difficulty
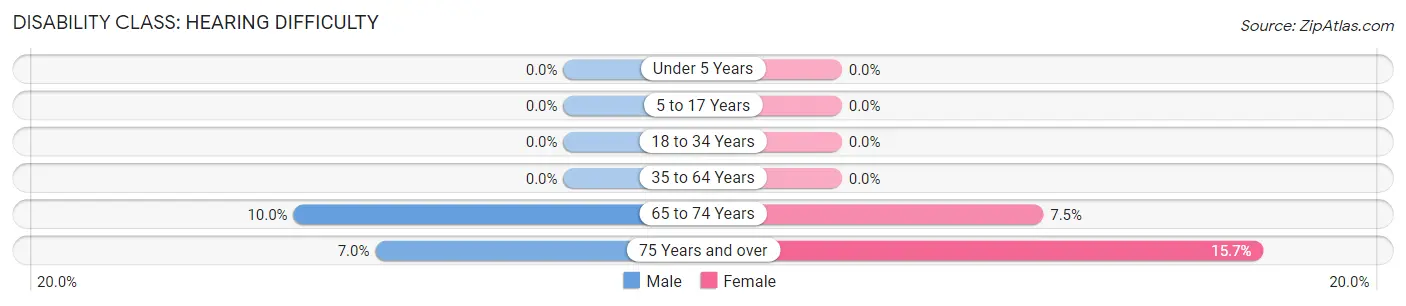
| Age Bracket | Male | Female |
| Under 5 Years | 0 (0.0%) | 0 (0.0%) |
| 5 to 17 Years | 0 (0.0%) | 0 (0.0%) |
| 18 to 34 Years | 0 (0.0%) | 0 (0.0%) |
| 35 to 64 Years | 0 (0.0%) | 0 (0.0%) |
| 65 to 74 Years | 55 (10.0%) | 36 (7.5%) |
| 75 Years and over | 9 (7.0%) | 23 (15.7%) |
Disability Class: Vision Difficulty
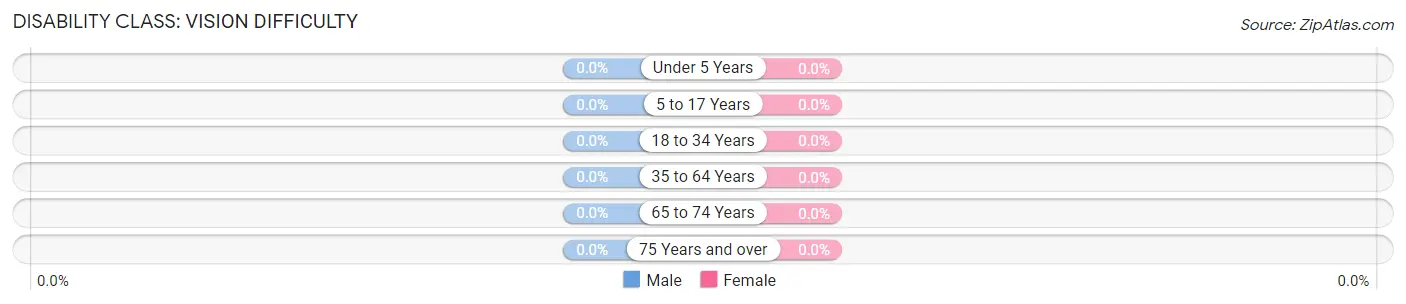
| Age Bracket | Male | Female |
| Under 5 Years | 0 (0.0%) | 0 (0.0%) |
| 5 to 17 Years | 0 (0.0%) | 0 (0.0%) |
| 18 to 34 Years | 0 (0.0%) | 0 (0.0%) |
| 35 to 64 Years | 0 (0.0%) | 0 (0.0%) |
| 65 to 74 Years | 0 (0.0%) | 0 (0.0%) |
| 75 Years and over | 0 (0.0%) | 0 (0.0%) |
Disability Class: Cognitive Difficulty
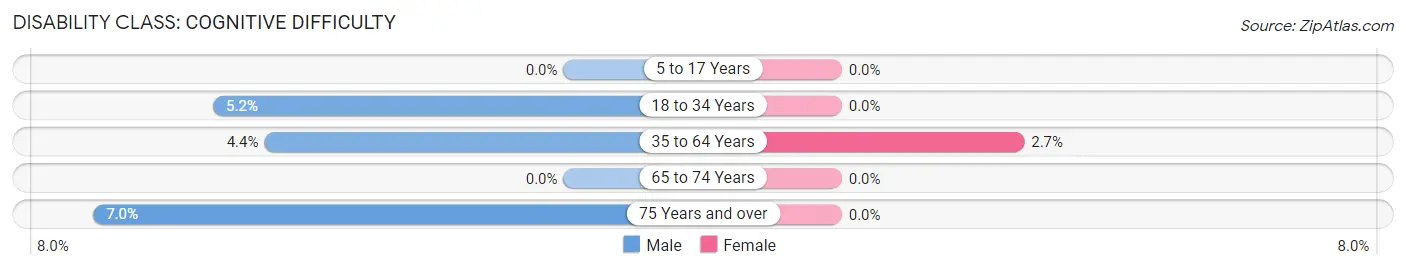
| Age Bracket | Male | Female |
| 5 to 17 Years | 0 (0.0%) | 0 (0.0%) |
| 18 to 34 Years | 26 (5.2%) | 0 (0.0%) |
| 35 to 64 Years | 30 (4.4%) | 18 (2.7%) |
| 65 to 74 Years | 0 (0.0%) | 0 (0.0%) |
| 75 Years and over | 9 (7.0%) | 0 (0.0%) |
Disability Class: Ambulatory Difficulty
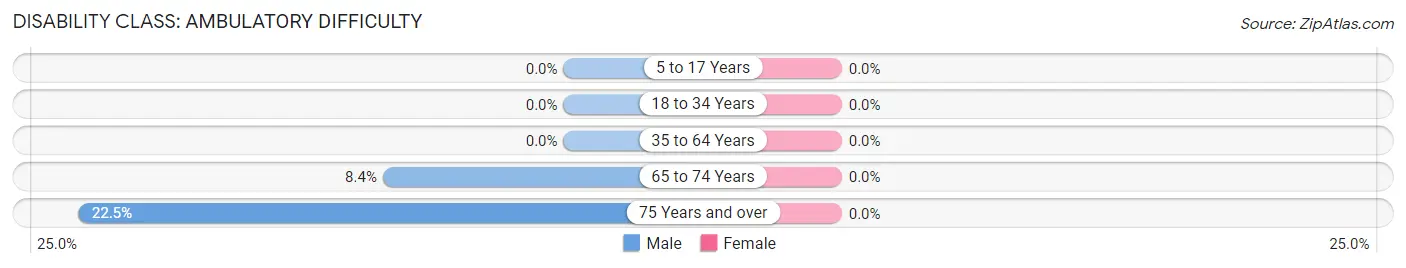
| Age Bracket | Male | Female |
| 5 to 17 Years | 0 (0.0%) | 0 (0.0%) |
| 18 to 34 Years | 0 (0.0%) | 0 (0.0%) |
| 35 to 64 Years | 0 (0.0%) | 0 (0.0%) |
| 65 to 74 Years | 46 (8.4%) | 0 (0.0%) |
| 75 Years and over | 29 (22.5%) | 0 (0.0%) |
Disability Class: Self-Care Difficulty
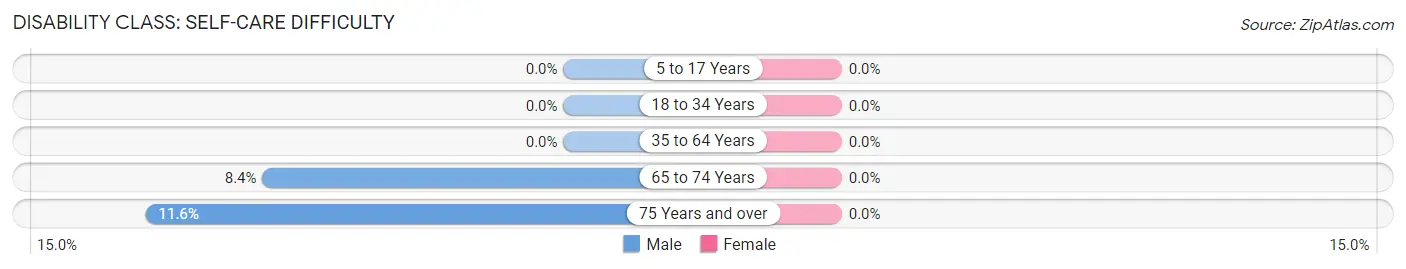
| Age Bracket | Male | Female |
| 5 to 17 Years | 0 (0.0%) | 0 (0.0%) |
| 18 to 34 Years | 0 (0.0%) | 0 (0.0%) |
| 35 to 64 Years | 0 (0.0%) | 0 (0.0%) |
| 65 to 74 Years | 46 (8.4%) | 0 (0.0%) |
| 75 Years and over | 15 (11.6%) | 0 (0.0%) |
Technology Access in Level Green
Computing Device Access in Level Green
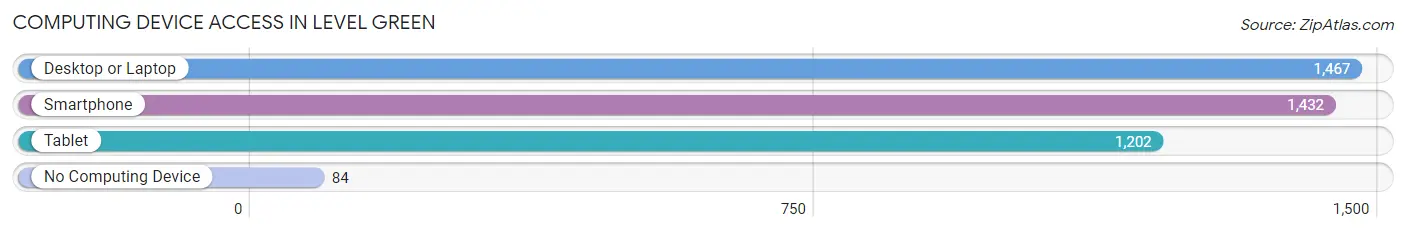
| Device Type | # Households | % Households |
| Desktop or Laptop | 1,467 | 88.7% |
| Smartphone | 1,432 | 86.6% |
| Tablet | 1,202 | 72.7% |
| No Computing Device | 84 | 5.1% |
| Total | 1,653 | 100.0% |
Internet Access in Level Green
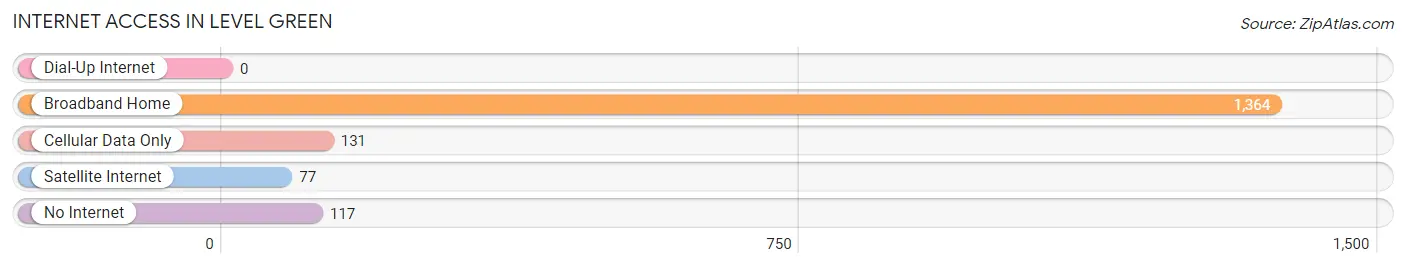
| Internet Type | # Households | % Households |
| Dial-Up Internet | 0 | 0.0% |
| Broadband Home | 1,364 | 82.5% |
| Cellular Data Only | 131 | 7.9% |
| Satellite Internet | 77 | 4.7% |
| No Internet | 117 | 7.1% |
| Total | 1,653 | 100.0% |
Level Green Summary
Green, Pennsylvania is a small borough located in Westmoreland County, Pennsylvania. It is situated in the foothills of the Allegheny Mountains, approximately 30 miles southeast of Pittsburgh. The borough was founded in 1845 and is home to a population of approximately 1,400 people.
History
Green, Pennsylvania was founded in 1845 by a group of settlers from the nearby town of Greensburg. The settlers were looking for a place to build a new community and chose the area due to its proximity to the Youghiogheny River. The town was named after the Green family, who were among the first settlers.
The town grew slowly but steadily over the years, and by the early 1900s, it had become a thriving community. The town was home to several businesses, including a sawmill, a gristmill, a blacksmith shop, and a general store. The town also had a post office, a school, and a church.
In the early 1900s, the town was connected to the outside world by the Pennsylvania Railroad. This allowed the town to become more connected to the outside world and allowed for the growth of the town.
Geography
Green, Pennsylvania is located in the foothills of the Allegheny Mountains in Westmoreland County. The borough is situated on the banks of the Youghiogheny River, which flows through the town. The town is surrounded by rolling hills and forests, making it a picturesque location.
The town is located approximately 30 miles southeast of Pittsburgh and is accessible by the Pennsylvania Turnpike. The town is also located near the Pennsylvania-West Virginia border, making it a convenient location for travelers.
Economy
Green, Pennsylvania is a small town with a limited economy. The town is home to several small businesses, including a general store, a gas station, and a few restaurants. The town also has a few small manufacturing companies, which produce a variety of products.
The town is also home to a few farms, which produce a variety of crops, including corn, wheat, and hay. The town is also home to a few small wineries, which produce a variety of wines.
Demographics
As of the 2010 census, Green, Pennsylvania had a population of 1,400 people. The town is predominantly white, with approximately 95% of the population being white. The town also has a small Hispanic population, with approximately 4% of the population being Hispanic.
The town has a median household income of $41,000, which is slightly lower than the national average. The town also has a poverty rate of approximately 10%, which is slightly higher than the national average.
Conclusion
Green, Pennsylvania is a small borough located in Westmoreland County, Pennsylvania. The town was founded in 1845 and is home to a population of approximately 1,400 people. The town is situated in the foothills of the Allegheny Mountains and is located near the Pennsylvania-West Virginia border. The town has a limited economy, with a few small businesses and farms. The town is predominantly white, with a small Hispanic population. The town has a median household income of $41,000 and a poverty rate of approximately 10%.
Common Questions
What is Per Capita Income in Level Green?
Per Capita income in Level Green is $45,086.
What is the Median Family Income in Level Green?
Median Family Income in Level Green is $111,250.
What is the Median Household income in Level Green?
Median Household Income in Level Green is $84,195.
What is Income or Wage Gap in Level Green?
Income or Wage Gap in Level Green is 51.4%.
Women in Level Green earn 48.6 cents for every dollar earned by a man.
What is Inequality or Gini Index in Level Green?
Inequality or Gini Index in Level Green is 0.37.
What is the Total Population of Level Green?
Total Population of Level Green is 4,140.
What is the Total Male Population of Level Green?
Total Male Population of Level Green is 2,221.
What is the Total Female Population of Level Green?
Total Female Population of Level Green is 1,919.
What is the Ratio of Males per 100 Females in Level Green?
There are 115.74 Males per 100 Females in Level Green.
What is the Ratio of Females per 100 Males in Level Green?
There are 86.40 Females per 100 Males in Level Green.
What is the Median Population Age in Level Green?
Median Population Age in Level Green is 51.6 Years.
What is the Average Family Size in Level Green
Average Family Size in Level Green is 3.0 People.
What is the Average Household Size in Level Green
Average Household Size in Level Green is 2.5 People.
How Large is the Labor Force in Level Green?
There are 2,414 People in the Labor Forcein in Level Green.
What is the Percentage of People in the Labor Force in Level Green?
67.3% of People are in the Labor Force in Level Green.
What is the Unemployment Rate in Level Green?
Unemployment Rate in Level Green is 3.2%.