Lenape Heights, PA Map & Demographics
Lenape Heights Map
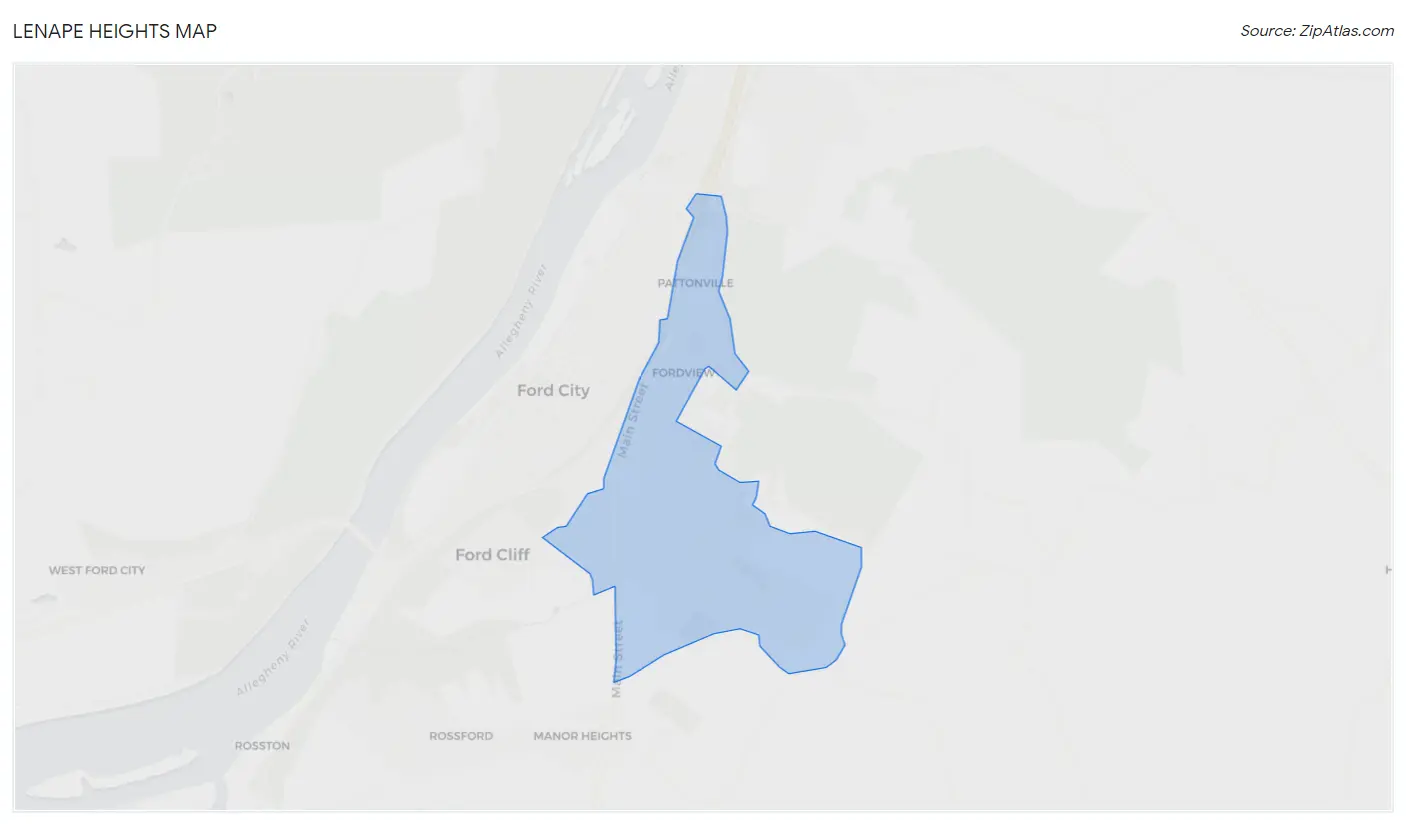
Lenape Heights Overview
$43,673
PER CAPITA INCOME
$98,313
AVG FAMILY INCOME
$70,700
AVG HOUSEHOLD INCOME
0.34
INEQUALITY / GINI INDEX
1,321
TOTAL POPULATION
781
MALE POPULATION
540
FEMALE POPULATION
144.63
MALES / 100 FEMALES
69.14
FEMALES / 100 MALES
48.5
MEDIAN AGE
2.5
AVG FAMILY SIZE
2.2
AVG HOUSEHOLD SIZE
752
LABOR FORCE [ PEOPLE ]
64.0%
PERCENT IN LABOR FORCE
2.1%
UNEMPLOYMENT RATE
Income in Lenape Heights
Income Overview in Lenape Heights
Per Capita Income in Lenape Heights is $43,673, while median incomes of families and households are $98,313 and $70,700 respectively.
| Characteristic | Number | Measure |
| Per Capita Income | 1,321 | $43,673 |
| Median Family Income | 397 | $98,313 |
| Mean Family Income | 397 | $102,672 |
| Median Household Income | 608 | $70,700 |
| Mean Household Income | 608 | $91,159 |
| Income Deficit | 397 | $0 |
| Wage / Income Gap (%) | 1,321 | 0.00% |
| Wage / Income Gap ($) | 1,321 | 100.00¢ per $1 |
| Gini / Inequality Index | 1,321 | 0.34 |
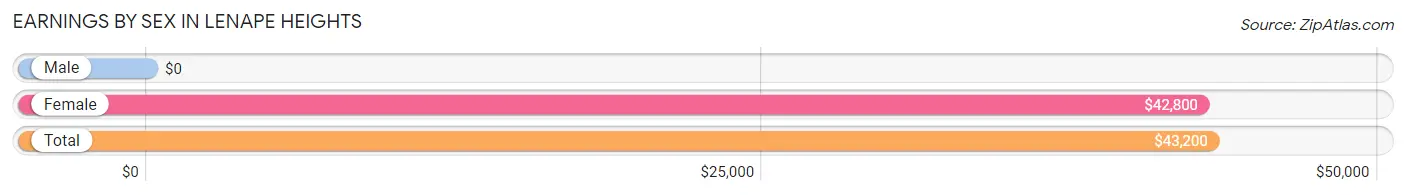
Earnings by Sex in Lenape Heights
| Sex | Number | Average Earnings |
| Male | 470 (62.5%) | $0 |
| Female | 282 (37.5%) | $42,800 |
| Total | 752 (100.0%) | $43,200 |
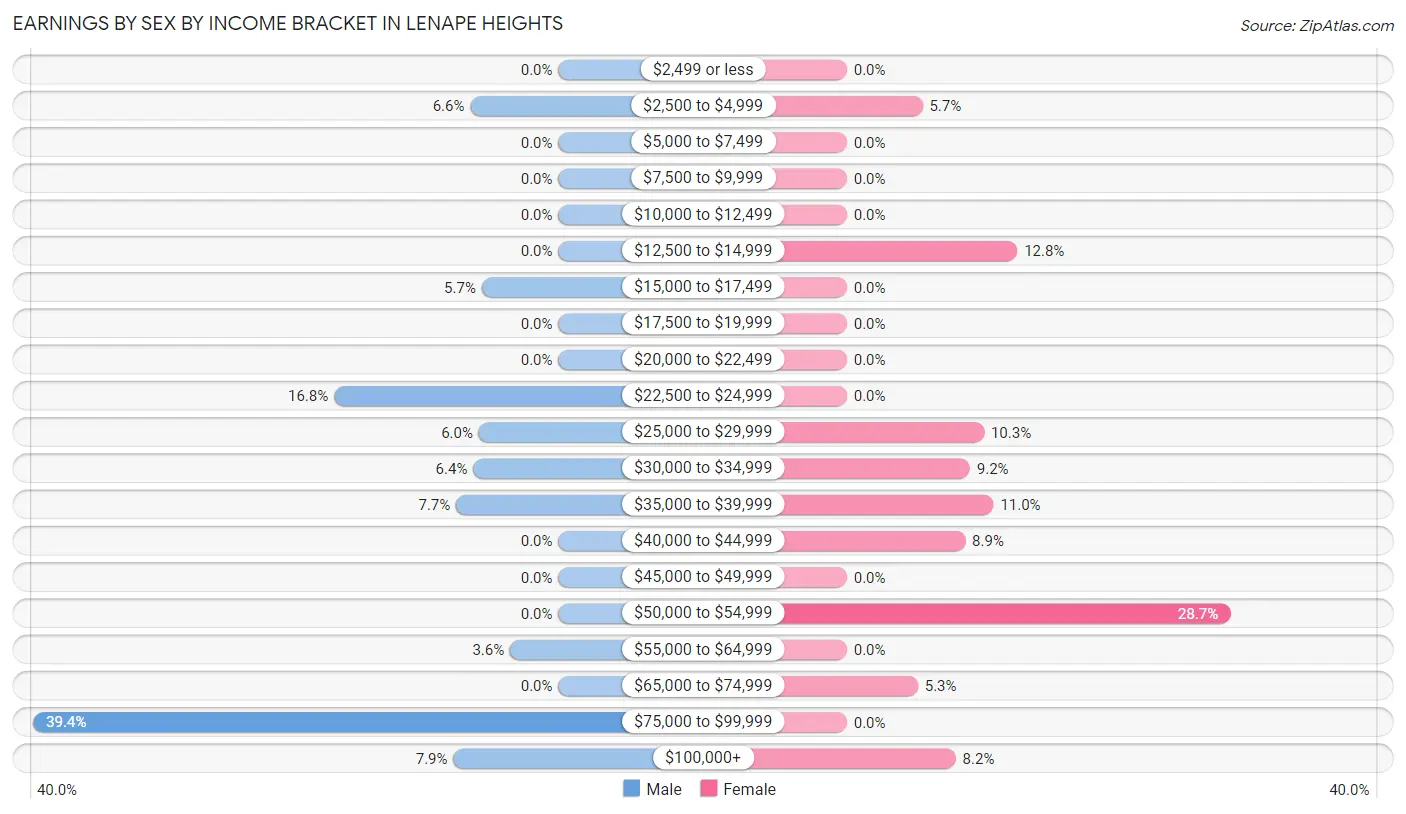
Earnings by Sex by Income Bracket in Lenape Heights
The most common earnings brackets in Lenape Heights are $75,000 to $99,999 for men (185 | 39.4%) and $50,000 to $54,999 for women (81 | 28.7%).
| Income | Male | Female |
| $2,499 or less | 0 (0.0%) | 0 (0.0%) |
| $2,500 to $4,999 | 31 (6.6%) | 16 (5.7%) |
| $5,000 to $7,499 | 0 (0.0%) | 0 (0.0%) |
| $7,500 to $9,999 | 0 (0.0%) | 0 (0.0%) |
| $10,000 to $12,499 | 0 (0.0%) | 0 (0.0%) |
| $12,500 to $14,999 | 0 (0.0%) | 36 (12.8%) |
| $15,000 to $17,499 | 27 (5.7%) | 0 (0.0%) |
| $17,500 to $19,999 | 0 (0.0%) | 0 (0.0%) |
| $20,000 to $22,499 | 0 (0.0%) | 0 (0.0%) |
| $22,500 to $24,999 | 79 (16.8%) | 0 (0.0%) |
| $25,000 to $29,999 | 28 (6.0%) | 29 (10.3%) |
| $30,000 to $34,999 | 30 (6.4%) | 26 (9.2%) |
| $35,000 to $39,999 | 36 (7.7%) | 31 (11.0%) |
| $40,000 to $44,999 | 0 (0.0%) | 25 (8.9%) |
| $45,000 to $49,999 | 0 (0.0%) | 0 (0.0%) |
| $50,000 to $54,999 | 0 (0.0%) | 81 (28.7%) |
| $55,000 to $64,999 | 17 (3.6%) | 0 (0.0%) |
| $65,000 to $74,999 | 0 (0.0%) | 15 (5.3%) |
| $75,000 to $99,999 | 185 (39.4%) | 0 (0.0%) |
| $100,000+ | 37 (7.9%) | 23 (8.2%) |
| Total | 470 (100.0%) | 282 (100.0%) |
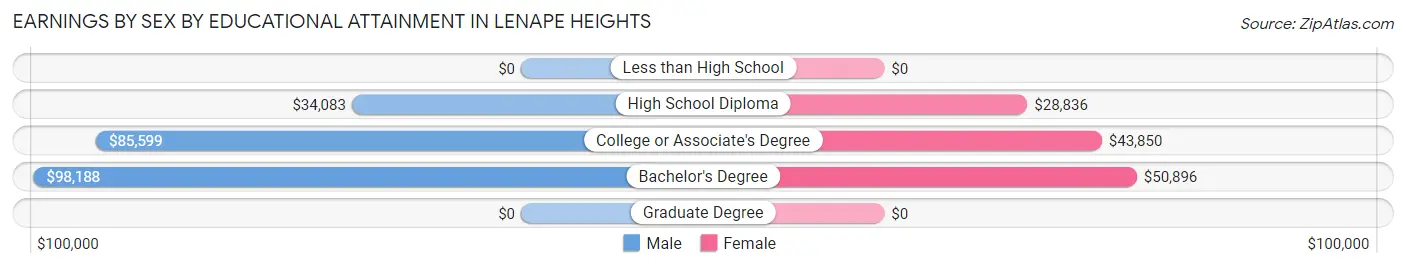
Earnings by Sex by Educational Attainment in Lenape Heights
Average earnings in Lenape Heights are $85,833 for men and $44,350 for women, a difference of 48.3%. Men with an educational attainment of bachelor's degree enjoy the highest average annual earnings of $98,188, while those with high school diploma education earn the least with $34,083. Women with an educational attainment of bachelor's degree earn the most with the average annual earnings of $50,896, while those with high school diploma education have the smallest earnings of $28,836.
| Educational Attainment | Male Income | Female Income |
| Less than High School | - | - |
| High School Diploma | $34,083 | $28,836 |
| College or Associate's Degree | $85,599 | $43,850 |
| Bachelor's Degree | $98,188 | $50,896 |
| Graduate Degree | - | - |
| Total | $85,833 | $44,350 |
Family Income in Lenape Heights
Family Income Brackets in Lenape Heights
According to the Lenape Heights family income data, there are 150 families falling into the $150,000 to $199,999 income range, which is the most common income bracket and makes up 37.8% of all families.
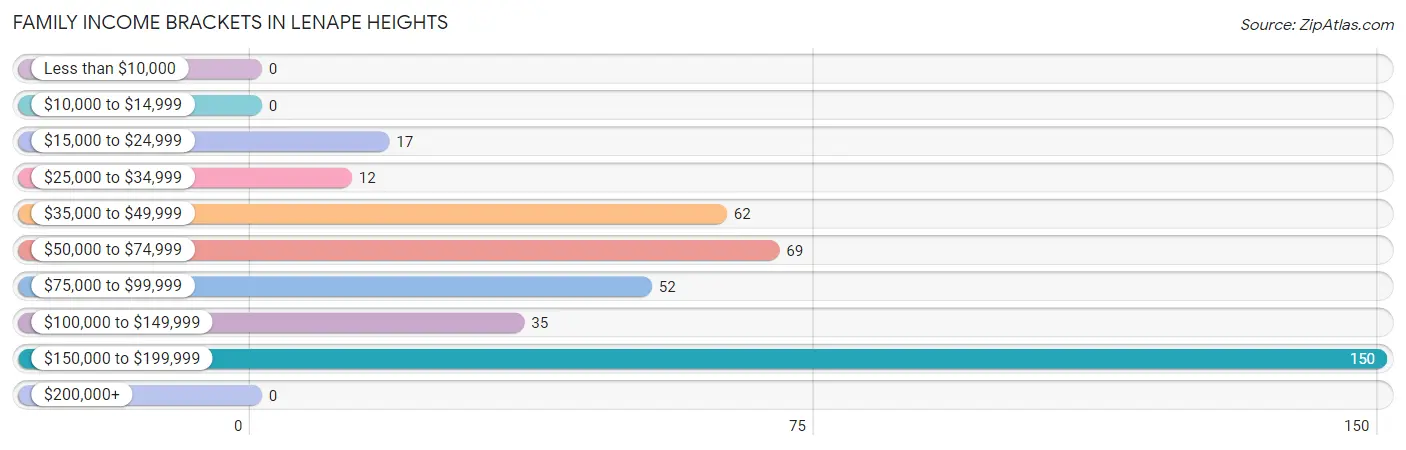
| Income Bracket | # Families | % Families |
| Less than $10,000 | 0 | 0.0% |
| $10,000 to $14,999 | 0 | 0.0% |
| $15,000 to $24,999 | 17 | 4.3% |
| $25,000 to $34,999 | 12 | 3.0% |
| $35,000 to $49,999 | 62 | 15.6% |
| $50,000 to $74,999 | 69 | 17.4% |
| $75,000 to $99,999 | 52 | 13.1% |
| $100,000 to $149,999 | 35 | 8.8% |
| $150,000 to $199,999 | 150 | 37.8% |
| $200,000+ | 0 | 0.0% |
Family Income by Famaliy Size in Lenape Heights
2-person families (283 | 71.3%) account for the highest median family income in Lenape Heights with $143,938 per family, while 2-person families (283 | 71.3%) have the highest median income of $71,969 per family member.
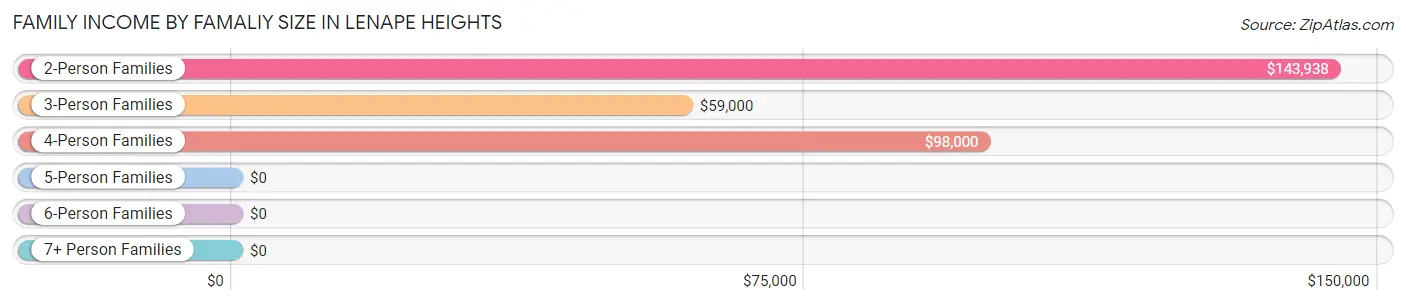
| Income Bracket | # Families | Median Income |
| 2-Person Families | 283 (71.3%) | $143,938 |
| 3-Person Families | 48 (12.1%) | $59,000 |
| 4-Person Families | 66 (16.6%) | $98,000 |
| 5-Person Families | 0 (0.0%) | $0 |
| 6-Person Families | 0 (0.0%) | $0 |
| 7+ Person Families | 0 (0.0%) | $0 |
| Total | 397 (100.0%) | $98,313 |
Family Income by Number of Earners in Lenape Heights
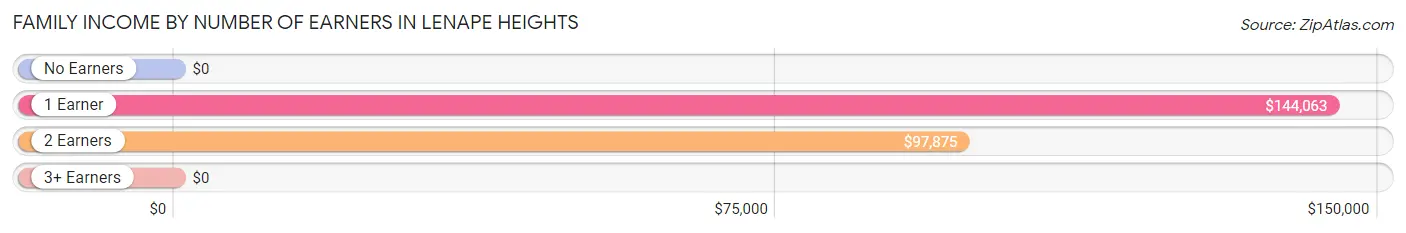
| Number of Earners | # Families | Median Income |
| No Earners | 65 (16.4%) | $0 |
| 1 Earner | 147 (37.0%) | $144,063 |
| 2 Earners | 168 (42.3%) | $97,875 |
| 3+ Earners | 17 (4.3%) | $0 |
| Total | 397 (100.0%) | $98,313 |
Household Income in Lenape Heights
Household Income Brackets in Lenape Heights
With 169 households falling in the category, the $50,000 to $74,999 income range is the most frequent in Lenape Heights, accounting for 27.8% of all households.
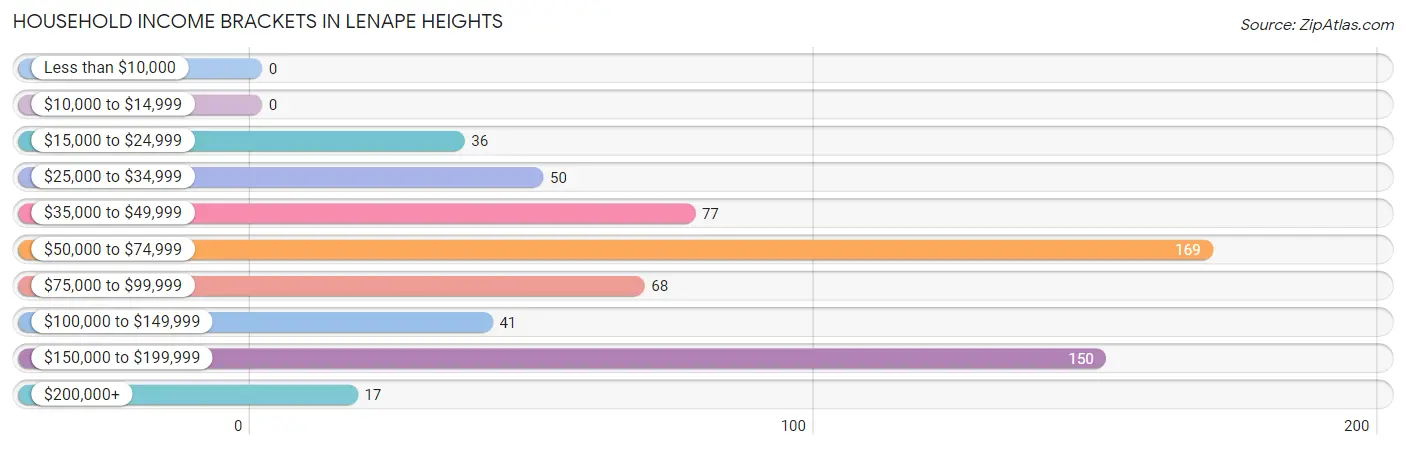
| Income Bracket | # Households | % Households |
| Less than $10,000 | 0 | 0.0% |
| $10,000 to $14,999 | 0 | 0.0% |
| $15,000 to $24,999 | 36 | 5.9% |
| $25,000 to $34,999 | 50 | 8.2% |
| $35,000 to $49,999 | 77 | 12.7% |
| $50,000 to $74,999 | 169 | 27.8% |
| $75,000 to $99,999 | 68 | 11.2% |
| $100,000 to $149,999 | 41 | 6.7% |
| $150,000 to $199,999 | 150 | 24.7% |
| $200,000+ | 17 | 2.8% |
Household Income by Householder Age in Lenape Heights
The median household income in Lenape Heights is $70,700, with the highest median household income of $144,188 found in the 45 to 64 years age bracket for the primary householder. A total of 255 households (41.9%) fall into this category. Meanwhile, the 15 to 24 years age bracket for the primary householder has the lowest median household income of $0, with 15 households (2.5%) in this group.
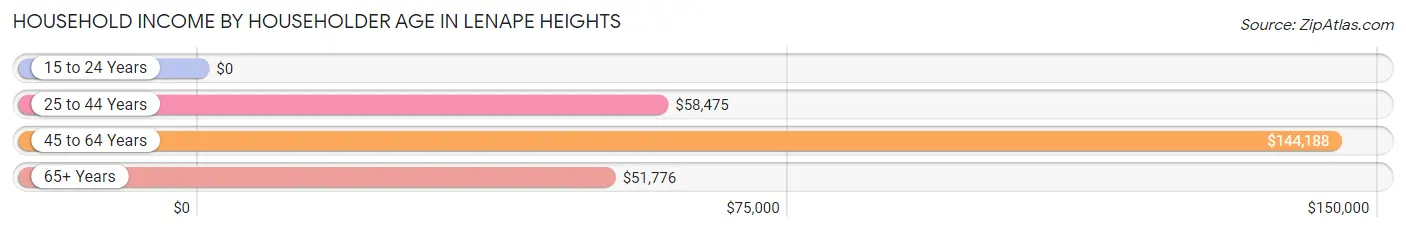
| Income Bracket | # Households | Median Income |
| 15 to 24 Years | 15 (2.5%) | $0 |
| 25 to 44 Years | 131 (21.5%) | $58,475 |
| 45 to 64 Years | 255 (41.9%) | $144,188 |
| 65+ Years | 207 (34.1%) | $51,776 |
| Total | 608 (100.0%) | $70,700 |
Poverty in Lenape Heights
Income Below Poverty by Sex and Age in Lenape Heights
| Age Bracket | Male | Female |
| Under 5 Years | 0 (0.0%) | 0 (0.0%) |
| 5 Years | 0 (0.0%) | 0 (0.0%) |
| 6 to 11 Years | 0 (0.0%) | 0 (0.0%) |
| 12 to 14 Years | 0 (0.0%) | 0 (0.0%) |
| 15 Years | 0 (0.0%) | 0 (0.0%) |
| 16 and 17 Years | 0 (0.0%) | 0 (0.0%) |
| 18 to 24 Years | 0 (0.0%) | 0 (0.0%) |
| 25 to 34 Years | 0 (0.0%) | 0 (0.0%) |
| 35 to 44 Years | 0 (0.0%) | 0 (0.0%) |
| 45 to 54 Years | 0 (0.0%) | 0 (0.0%) |
| 55 to 64 Years | 0 (0.0%) | 0 (0.0%) |
| 65 to 74 Years | 0 (0.0%) | 0 (0.0%) |
| 75 Years and over | 0 (0.0%) | 0 (0.0%) |
| Total | 0 (0.0%) | 0 (0.0%) |
Income Above Poverty by Sex and Age in Lenape Heights
According to the poverty statistics in Lenape Heights, males aged under 5 years and females aged 5 years are the age groups that are most secure financially, with 100.0% of males and 100.0% of females in these age groups living above the poverty line.
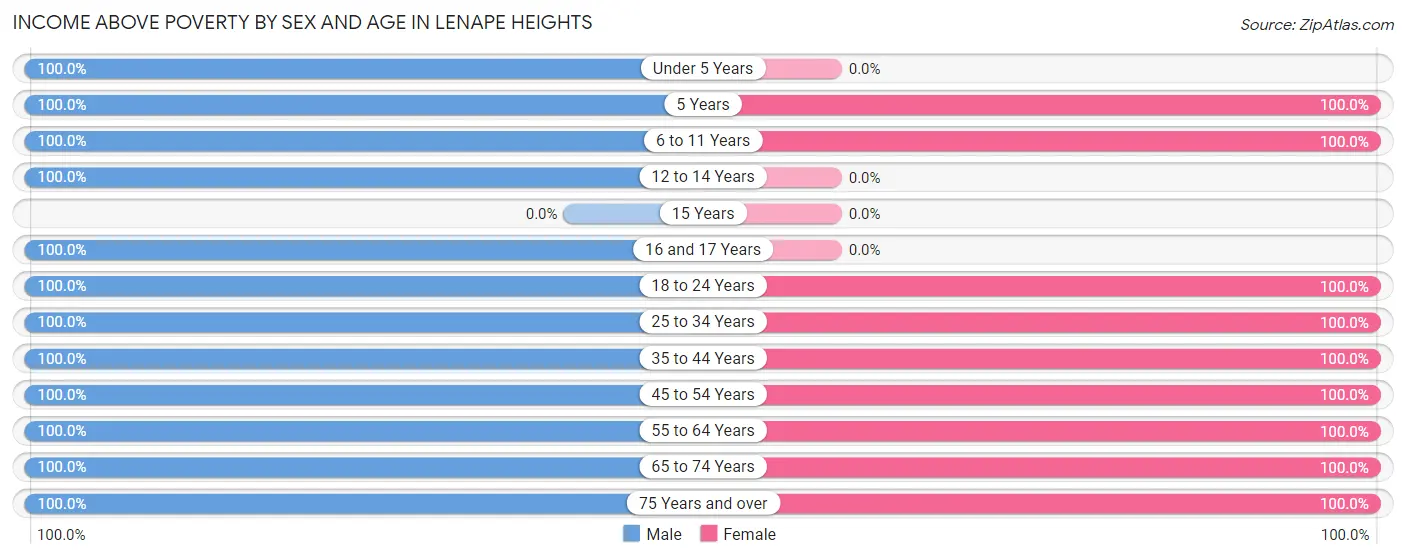
| Age Bracket | Male | Female |
| Under 5 Years | 14 (100.0%) | 0 (0.0%) |
| 5 Years | 17 (100.0%) | 32 (100.0%) |
| 6 to 11 Years | 15 (100.0%) | 15 (100.0%) |
| 12 to 14 Years | 53 (100.0%) | 0 (0.0%) |
| 15 Years | 0 (0.0%) | 0 (0.0%) |
| 16 and 17 Years | 71 (100.0%) | 0 (0.0%) |
| 18 to 24 Years | 31 (100.0%) | 31 (100.0%) |
| 25 to 34 Years | 124 (100.0%) | 32 (100.0%) |
| 35 to 44 Years | 85 (100.0%) | 59 (100.0%) |
| 45 to 54 Years | 194 (100.0%) | 173 (100.0%) |
| 55 to 64 Years | 43 (100.0%) | 57 (100.0%) |
| 65 to 74 Years | 62 (100.0%) | 47 (100.0%) |
| 75 Years and over | 72 (100.0%) | 94 (100.0%) |
| Total | 781 (100.0%) | 540 (100.0%) |
Income Below Poverty Among Married-Couple Families in Lenape Heights
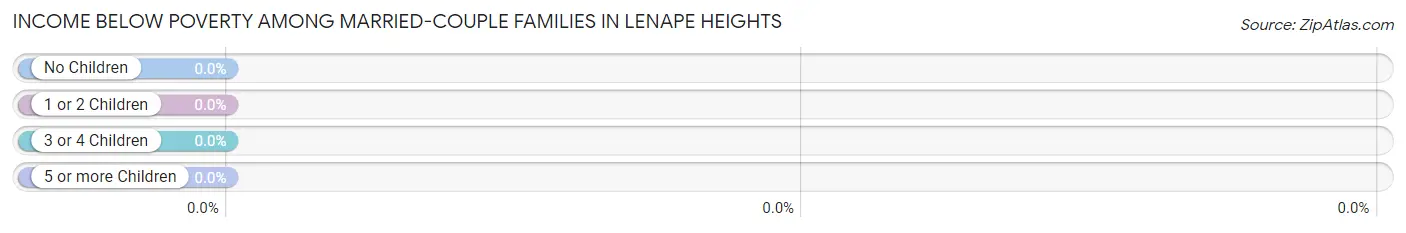
| Children | Above Poverty | Below Poverty |
| No Children | 197 (100.0%) | 0 (0.0%) |
| 1 or 2 Children | 37 (100.0%) | 0 (0.0%) |
| 3 or 4 Children | 0 (0.0%) | 0 (0.0%) |
| 5 or more Children | 0 (0.0%) | 0 (0.0%) |
| Total | 234 (100.0%) | 0 (0.0%) |
Income Below Poverty Among Single-Parent Households in Lenape Heights
| Children | Single Father | Single Mother |
| No Children | 0 (0.0%) | 0 (0.0%) |
| 1 or 2 Children | 0 (0.0%) | 0 (0.0%) |
| 3 or 4 Children | 0 (0.0%) | 0 (0.0%) |
| 5 or more Children | 0 (0.0%) | 0 (0.0%) |
| Total | 0 (0.0%) | 0 (0.0%) |
Income Below Poverty Among Married-Couple vs Single-Parent Households in Lenape Heights
| Children | Married-Couple Families | Single-Parent Households |
| No Children | 0 (0.0%) | 0 (0.0%) |
| 1 or 2 Children | 0 (0.0%) | 0 (0.0%) |
| 3 or 4 Children | 0 (0.0%) | 0 (0.0%) |
| 5 or more Children | 0 (0.0%) | 0 (0.0%) |
| Total | 0 (0.0%) | 0 (0.0%) |
Race in Lenape Heights
The most populous races in Lenape Heights are White / Caucasian (1,259 | 95.3%), Black / African American (56 | 4.2%), and Asian (6 | 0.4%).
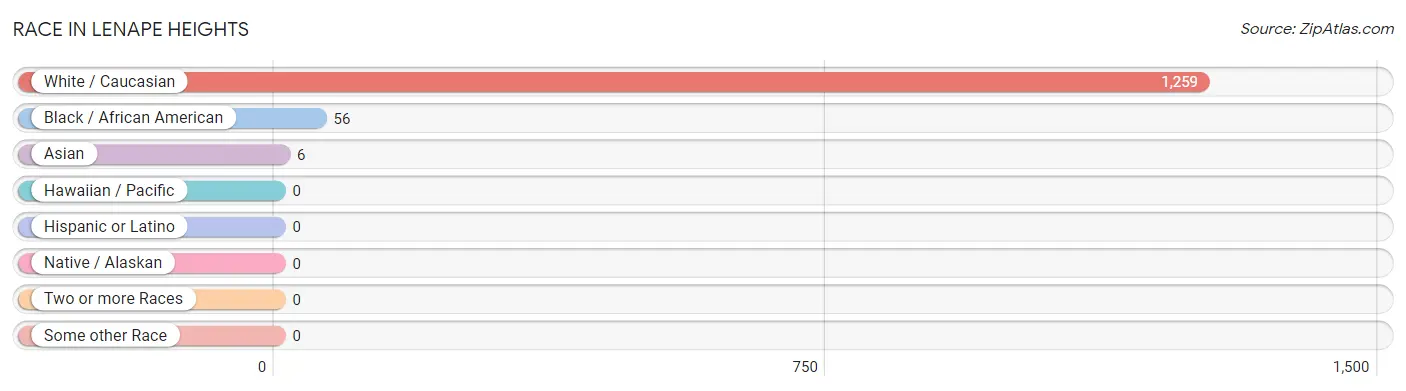
| Race | # Population | % Population |
| Asian | 6 | 0.4% |
| Black / African American | 56 | 4.2% |
| Hawaiian / Pacific | 0 | 0.0% |
| Hispanic or Latino | 0 | 0.0% |
| Native / Alaskan | 0 | 0.0% |
| White / Caucasian | 1,259 | 95.3% |
| Two or more Races | 0 | 0.0% |
| Some other Race | 0 | 0.0% |
| Total | 1,321 | 100.0% |
Ancestry in Lenape Heights
The most populous ancestries reported in Lenape Heights are German (237 | 17.9%), Irish (184 | 13.9%), English (142 | 10.7%), Italian (140 | 10.6%), and Scotch-Irish (85 | 6.4%), together accounting for 59.7% of all Lenape Heights residents.
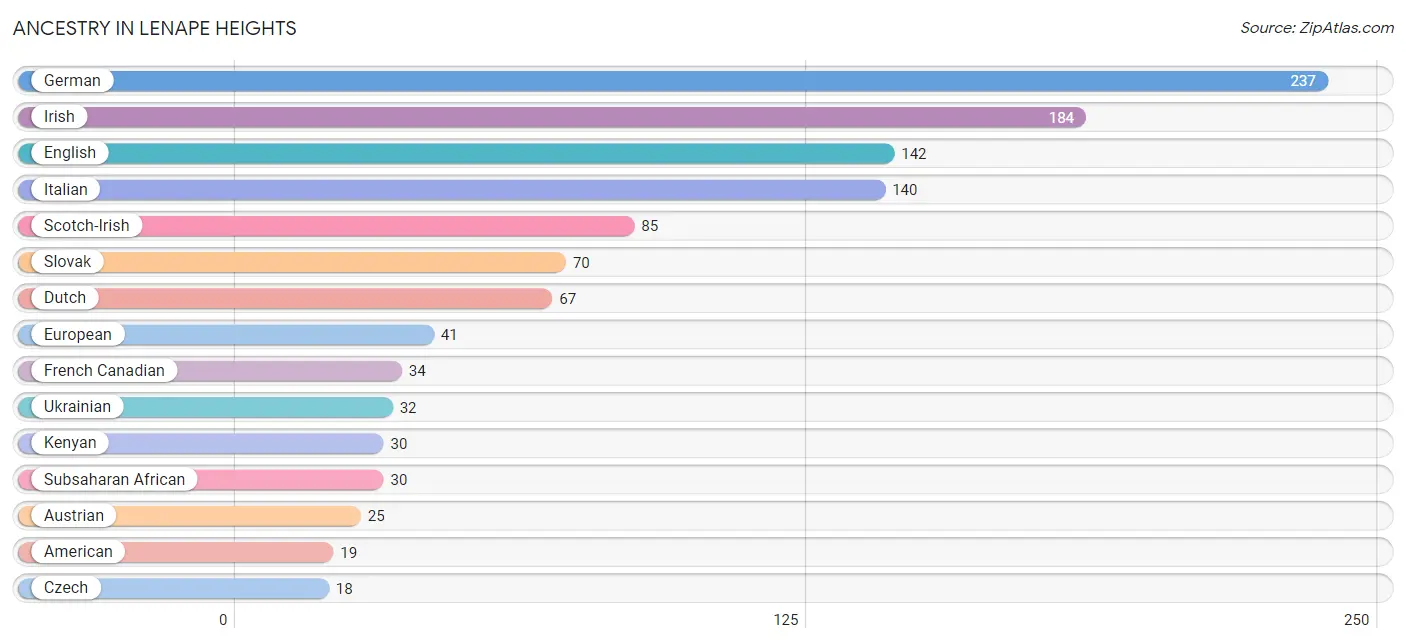
| Ancestry | # Population | % Population |
| American | 19 | 1.4% |
| Austrian | 25 | 1.9% |
| Czech | 18 | 1.4% |
| Dutch | 67 | 5.1% |
| Eastern European | 17 | 1.3% |
| English | 142 | 10.7% |
| European | 41 | 3.1% |
| French Canadian | 34 | 2.6% |
| German | 237 | 17.9% |
| Indian (Asian) | 6 | 0.4% |
| Irish | 184 | 13.9% |
| Italian | 140 | 10.6% |
| Kenyan | 30 | 2.3% |
| Scotch-Irish | 85 | 6.4% |
| Slovak | 70 | 5.3% |
| Subsaharan African | 30 | 2.3% |
| Ukrainian | 32 | 2.4% | View All 17 Rows |
Immigrants in Lenape Heights
The most numerous immigrant groups reported in Lenape Heights came from Asia (6 | 0.4%), China (6 | 0.4%), and Eastern Asia (6 | 0.4%), together accounting for 1.3% of all Lenape Heights residents.
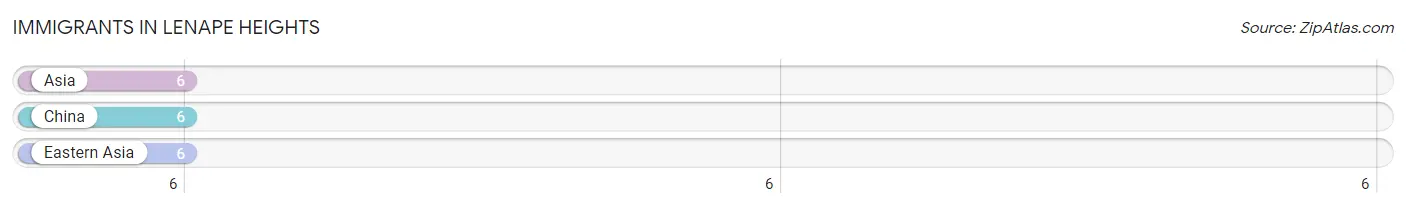
| Immigration Origin | # Population | % Population |
| Asia | 6 | 0.4% |
| China | 6 | 0.4% |
| Eastern Asia | 6 | 0.4% | View All 3 Rows |
Sex and Age in Lenape Heights
Sex and Age in Lenape Heights
The most populous age groups in Lenape Heights are 50 to 54 Years (149 | 19.1%) for men and 45 to 49 Years (92 | 17.0%) for women.
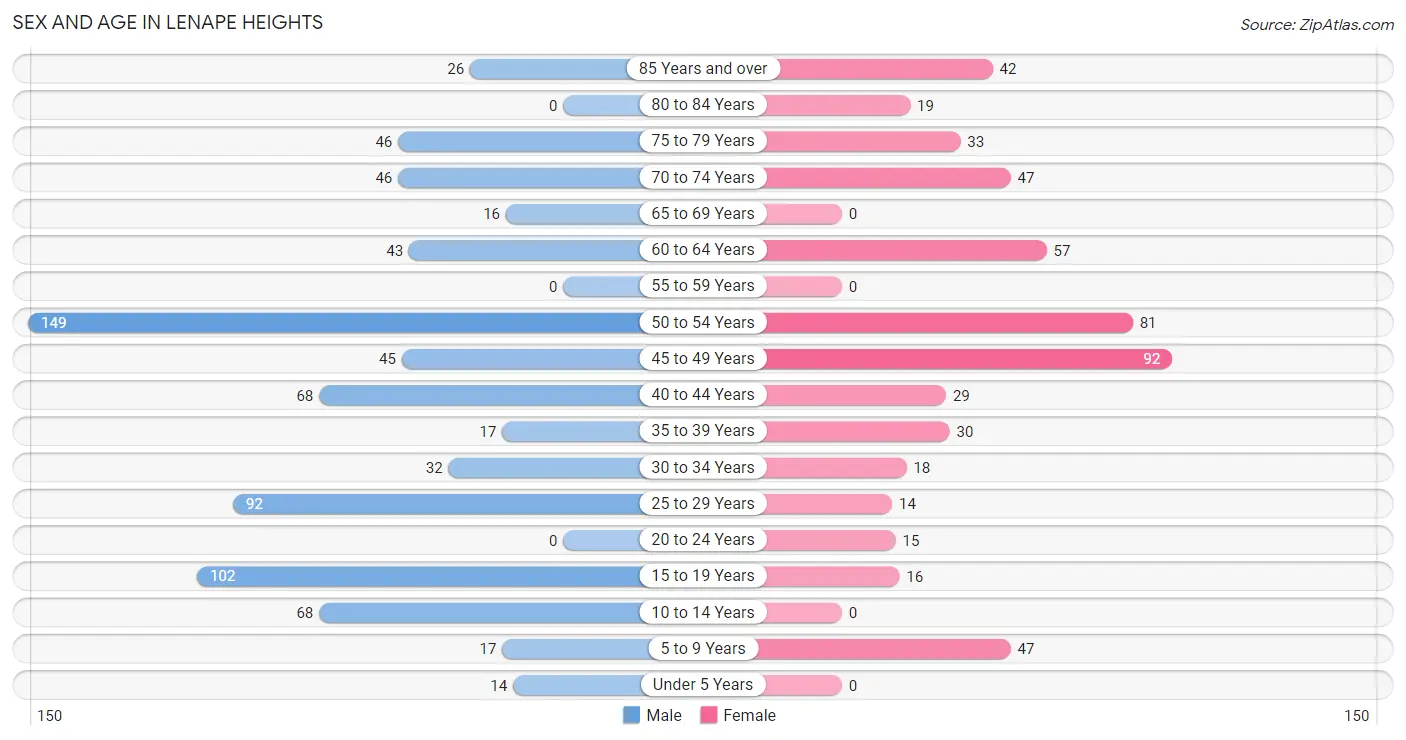
| Age Bracket | Male | Female |
| Under 5 Years | 14 (1.8%) | 0 (0.0%) |
| 5 to 9 Years | 17 (2.2%) | 47 (8.7%) |
| 10 to 14 Years | 68 (8.7%) | 0 (0.0%) |
| 15 to 19 Years | 102 (13.1%) | 16 (3.0%) |
| 20 to 24 Years | 0 (0.0%) | 15 (2.8%) |
| 25 to 29 Years | 92 (11.8%) | 14 (2.6%) |
| 30 to 34 Years | 32 (4.1%) | 18 (3.3%) |
| 35 to 39 Years | 17 (2.2%) | 30 (5.6%) |
| 40 to 44 Years | 68 (8.7%) | 29 (5.4%) |
| 45 to 49 Years | 45 (5.8%) | 92 (17.0%) |
| 50 to 54 Years | 149 (19.1%) | 81 (15.0%) |
| 55 to 59 Years | 0 (0.0%) | 0 (0.0%) |
| 60 to 64 Years | 43 (5.5%) | 57 (10.6%) |
| 65 to 69 Years | 16 (2.1%) | 0 (0.0%) |
| 70 to 74 Years | 46 (5.9%) | 47 (8.7%) |
| 75 to 79 Years | 46 (5.9%) | 33 (6.1%) |
| 80 to 84 Years | 0 (0.0%) | 19 (3.5%) |
| 85 Years and over | 26 (3.3%) | 42 (7.8%) |
| Total | 781 (100.0%) | 540 (100.0%) |
Families and Households in Lenape Heights
Median Family Size in Lenape Heights
The median family size in Lenape Heights is 2.53 persons per family, with single female/mother families (41 | 10.3%) accounting for the largest median family size of 3.71 persons per family. On the other hand, married-couple families (234 | 58.9%) represent the smallest median family size with 2.31 persons per family.
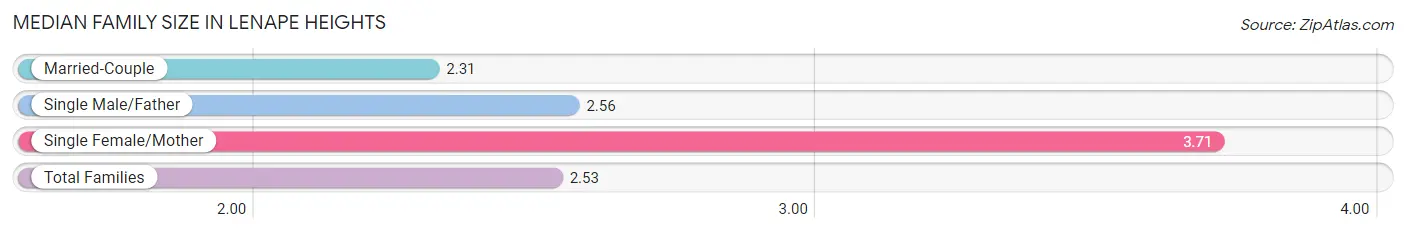
| Family Type | # Families | Family Size |
| Married-Couple | 234 (58.9%) | 2.31 |
| Single Male/Father | 122 (30.7%) | 2.56 |
| Single Female/Mother | 41 (10.3%) | 3.71 |
| Total Families | 397 (100.0%) | 2.53 |
Median Household Size in Lenape Heights
The median household size in Lenape Heights is 2.17 persons per household, with single female/mother households (41 | 6.7%) accounting for the largest median household size of 3.71 persons per household. non-family households (211 | 34.7%) represent the smallest median household size with 1.50 persons per household.
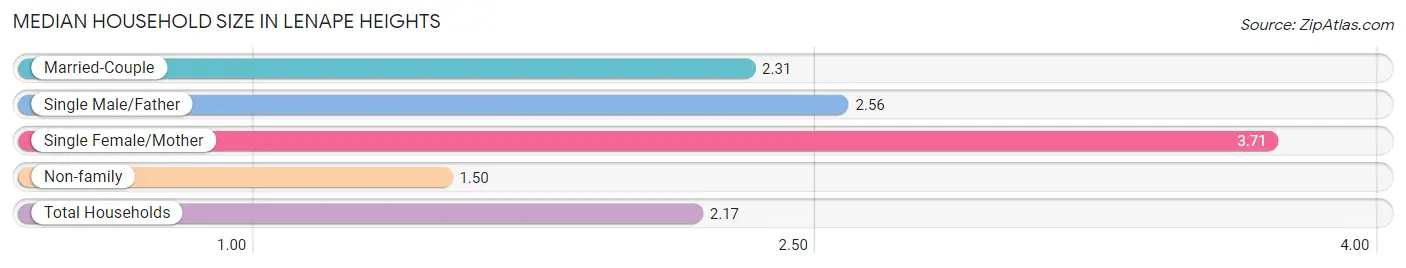
| Household Type | # Households | Household Size |
| Married-Couple | 234 (38.5%) | 2.31 |
| Single Male/Father | 122 (20.1%) | 2.56 |
| Single Female/Mother | 41 (6.7%) | 3.71 |
| Non-family | 211 (34.7%) | 1.50 |
| Total Households | 608 (100.0%) | 2.17 |
Household Size by Marriage Status in Lenape Heights
Out of a total of 608 households in Lenape Heights, 397 (65.3%) are family households, while 211 (34.7%) are nonfamily households. The most numerous type of family households are 2-person households, comprising 283, and the most common type of nonfamily households are 1-person households, comprising 140.
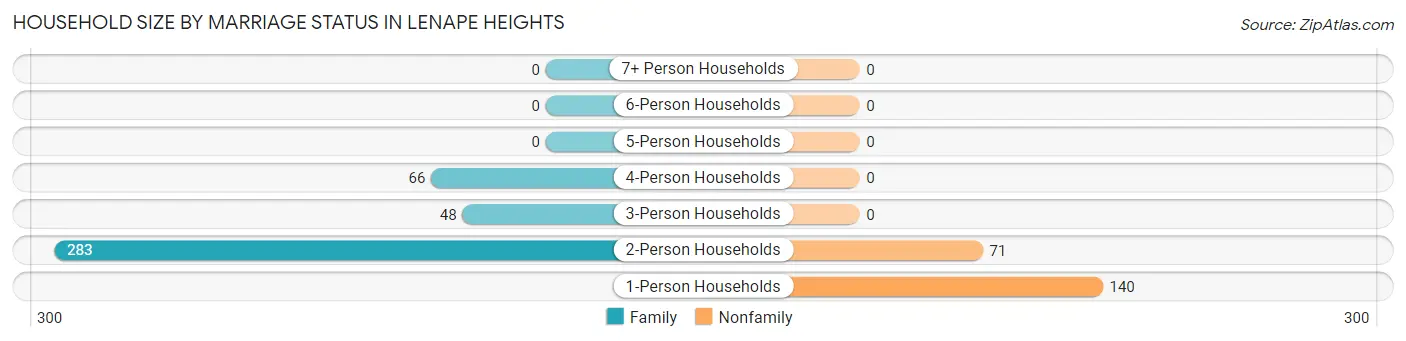
| Household Size | Family Households | Nonfamily Households |
| 1-Person Households | - | 140 (23.0%) |
| 2-Person Households | 283 (46.6%) | 71 (11.7%) |
| 3-Person Households | 48 (7.9%) | 0 (0.0%) |
| 4-Person Households | 66 (10.9%) | 0 (0.0%) |
| 5-Person Households | 0 (0.0%) | 0 (0.0%) |
| 6-Person Households | 0 (0.0%) | 0 (0.0%) |
| 7+ Person Households | 0 (0.0%) | 0 (0.0%) |
| Total | 397 (65.3%) | 211 (34.7%) |
Female Fertility in Lenape Heights
Fertility by Age in Lenape Heights
Average fertility rate in Lenape Heights is 79.0 births per 1,000 women. Women in the age bracket of 20 to 34 years have the highest fertility rate with 383.0 births per 1,000 women. Women in the age bracket of 20 to 34 years acount for 100.0% of all women with births.
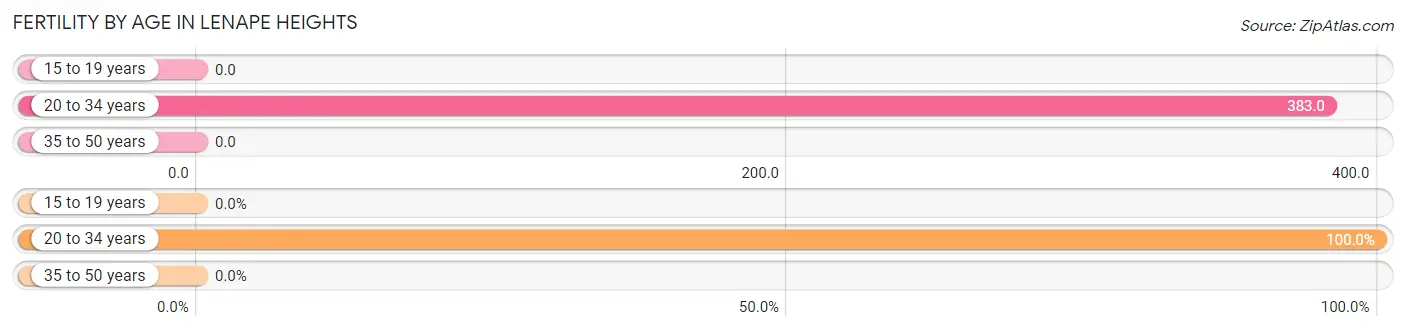
| Age Bracket | Women with Births | Births / 1,000 Women |
| 15 to 19 years | 0 (0.0%) | 0.0 |
| 20 to 34 years | 18 (100.0%) | 383.0 |
| 35 to 50 years | 0 (0.0%) | 0.0 |
| Total | 18 (100.0%) | 79.0 |
Fertility by Age by Marriage Status in Lenape Heights
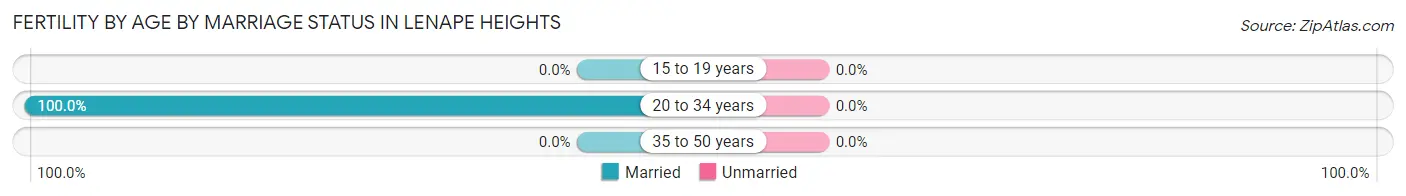
| Age Bracket | Married | Unmarried |
| 15 to 19 years | 0 (0.0%) | 0 (0.0%) |
| 20 to 34 years | 18 (100.0%) | 0 (0.0%) |
| 35 to 50 years | 0 (0.0%) | 0 (0.0%) |
| Total | 18 (100.0%) | 0 (0.0%) |
Fertility by Education in Lenape Heights
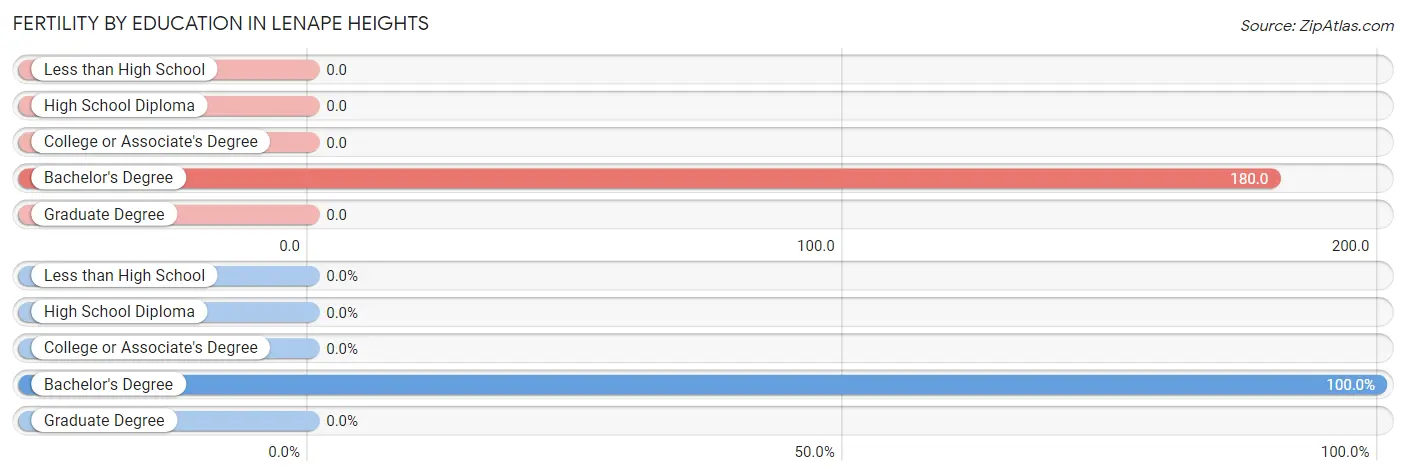
| Educational Attainment | Women with Births | Births / 1,000 Women |
| Less than High School | 0 (0.0%) | 0.0 |
| High School Diploma | 0 (0.0%) | 0.0 |
| College or Associate's Degree | 0 (0.0%) | 0.0 |
| Bachelor's Degree | 18 (100.0%) | 180.0 |
| Graduate Degree | 0 (0.0%) | 0.0 |
| Total | 18 (100.0%) | 79.0 |
Fertility by Education by Marriage Status in Lenape Heights
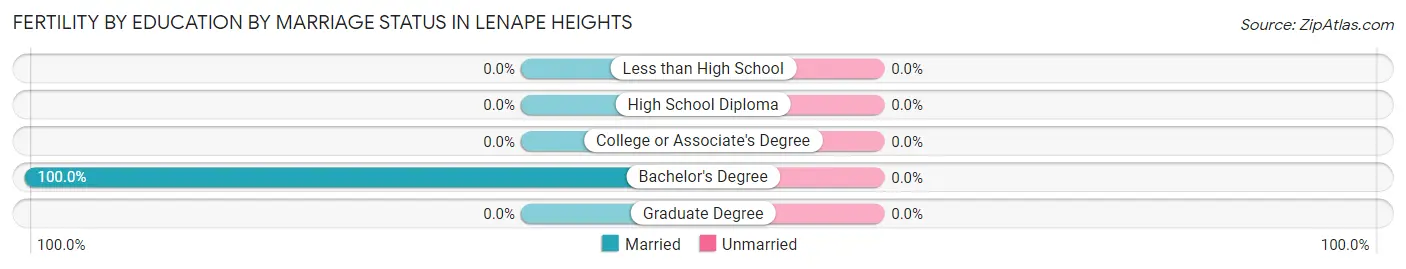
| Educational Attainment | Married | Unmarried |
| Less than High School | 0 (0.0%) | 0 (0.0%) |
| High School Diploma | 0 (0.0%) | 0 (0.0%) |
| College or Associate's Degree | 0 (0.0%) | 0 (0.0%) |
| Bachelor's Degree | 18 (100.0%) | 0 (0.0%) |
| Graduate Degree | 0 (0.0%) | 0 (0.0%) |
| Total | 18 (100.0%) | 0 (0.0%) |
Employment Characteristics in Lenape Heights
Employment by Class of Employer in Lenape Heights
Among the 736 employed individuals in Lenape Heights, private company employees (540 | 73.4%), not-for-profit organizations (115 | 15.6%), and self-employed (not incorporated) (48 | 6.5%) make up the most common classes of employment.
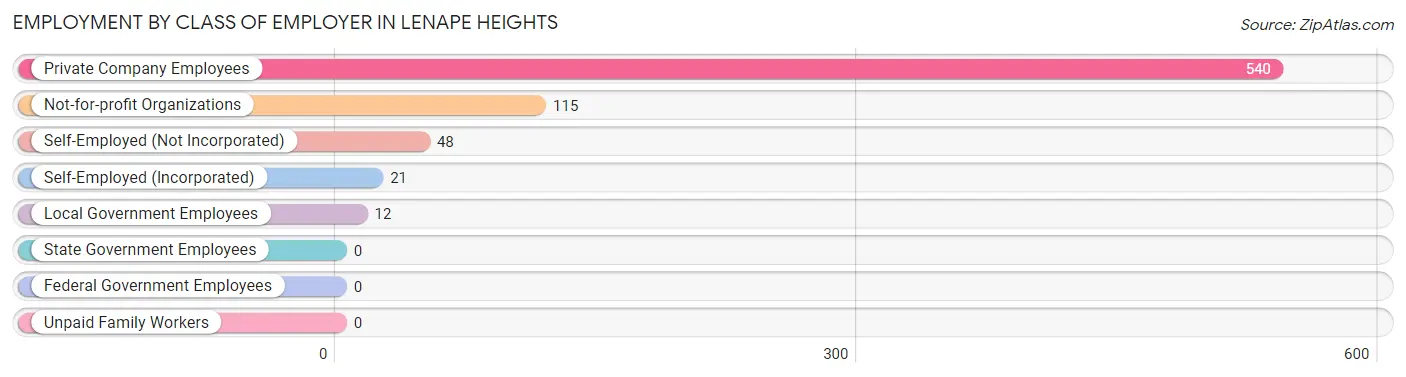
| Employer Class | # Employees | % Employees |
| Private Company Employees | 540 | 73.4% |
| Self-Employed (Incorporated) | 21 | 2.9% |
| Self-Employed (Not Incorporated) | 48 | 6.5% |
| Not-for-profit Organizations | 115 | 15.6% |
| Local Government Employees | 12 | 1.6% |
| State Government Employees | 0 | 0.0% |
| Federal Government Employees | 0 | 0.0% |
| Unpaid Family Workers | 0 | 0.0% |
| Total | 736 | 100.0% |
Employment Status by Age in Lenape Heights
According to the labor force statistics for Lenape Heights, out of the total population over 16 years of age (1,175), 64.0% or 752 individuals are in the labor force, with 2.1% or 16 of them unemployed. The age group with the highest labor force participation rate is 20 to 24 years, with 100.0% or 15 individuals in the labor force. Within the labor force, the 16 to 19 years age range has the highest percentage of unemployed individuals, with 21.6% or 16 of them being unemployed.
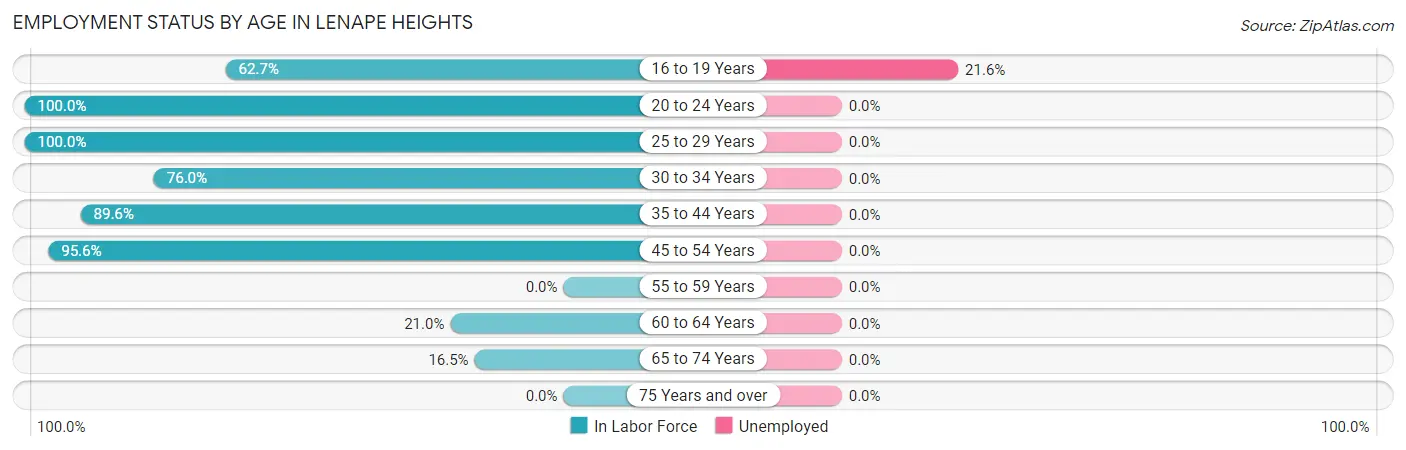
| Age Bracket | In Labor Force | Unemployed |
| 16 to 19 Years | 74 (62.7%) | 16 (21.6%) |
| 20 to 24 Years | 15 (100.0%) | 0 (0.0%) |
| 25 to 29 Years | 106 (100.0%) | 0 (0.0%) |
| 30 to 34 Years | 38 (76.0%) | 0 (0.0%) |
| 35 to 44 Years | 129 (89.6%) | 0 (0.0%) |
| 45 to 54 Years | 351 (95.6%) | 0 (0.0%) |
| 55 to 59 Years | 0 (0.0%) | 0 (0.0%) |
| 60 to 64 Years | 21 (21.0%) | 0 (0.0%) |
| 65 to 74 Years | 18 (16.5%) | 0 (0.0%) |
| 75 Years and over | 0 (0.0%) | 0 (0.0%) |
| Total | 752 (64.0%) | 16 (2.1%) |
Employment Status by Educational Attainment in Lenape Heights
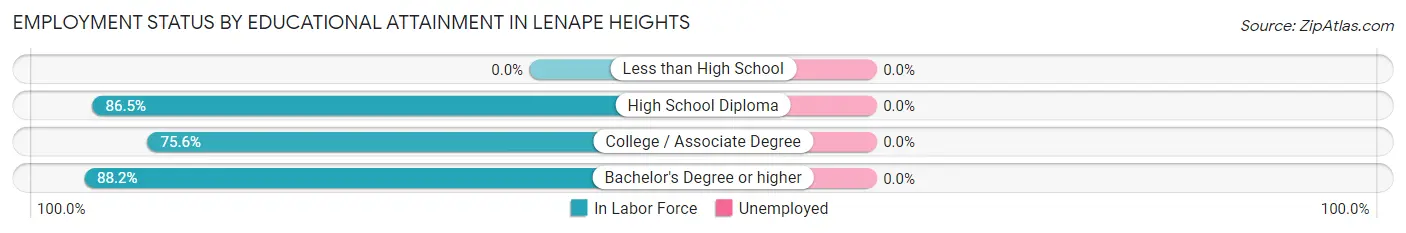
| Educational Attainment | In Labor Force | Unemployed |
| Less than High School | 0 (0.0%) | 0 (0.0%) |
| High School Diploma | 211 (86.5%) | 0 (0.0%) |
| College / Associate Degree | 164 (75.6%) | 0 (0.0%) |
| Bachelor's Degree or higher | 270 (88.2%) | 0 (0.0%) |
| Total | 645 (84.1%) | 0 (0.0%) |
Employment Occupations by Sex in Lenape Heights
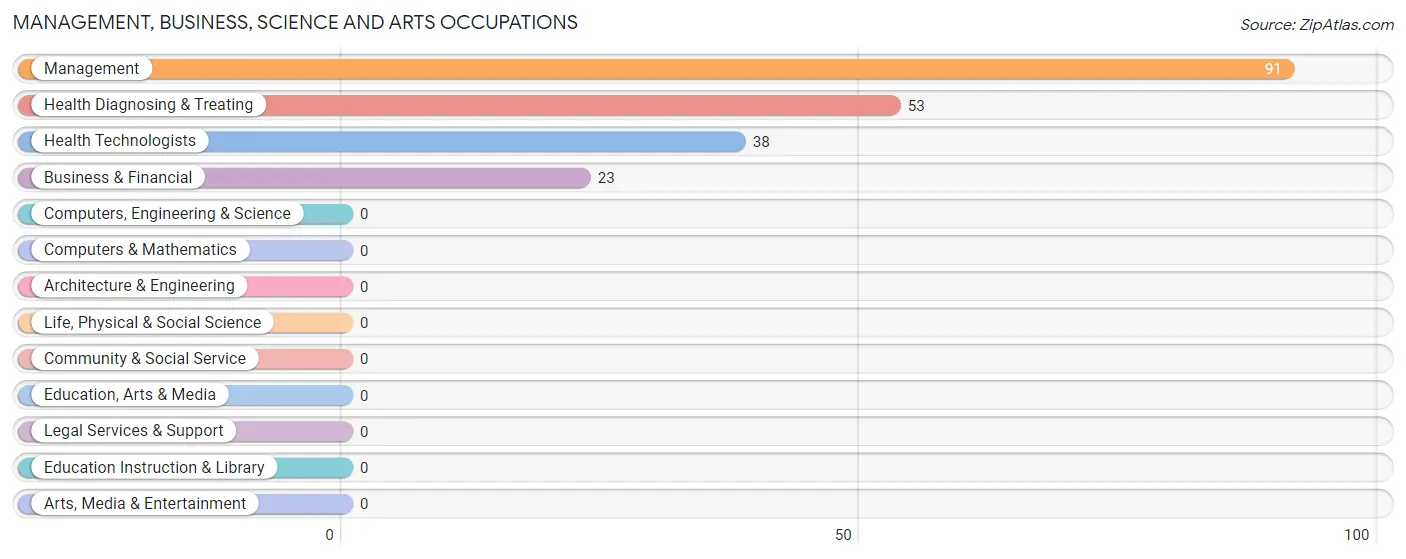
Management, Business, Science and Arts Occupations
The most common Management, Business, Science and Arts occupations in Lenape Heights are Management (91 | 12.4%), Health Diagnosing & Treating (53 | 7.2%), Health Technologists (38 | 5.2%), and Business & Financial (23 | 3.1%).
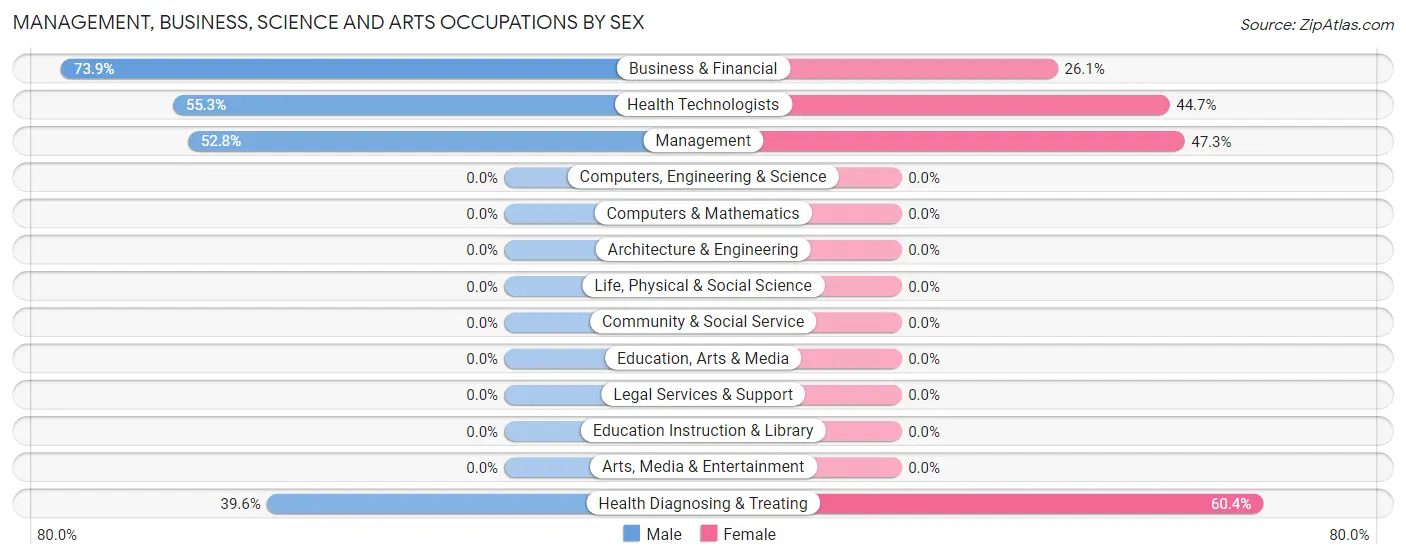
Management, Business, Science and Arts Occupations by Sex
Within the Management, Business, Science and Arts occupations in Lenape Heights, the most male-oriented occupations are Business & Financial (73.9%), Health Technologists (55.3%), and Management (52.7%), while the most female-oriented occupations are Health Diagnosing & Treating (60.4%), Management (47.2%), and Health Technologists (44.7%).
| Occupation | Male | Female |
| Management | 48 (52.7%) | 43 (47.2%) |
| Business & Financial | 17 (73.9%) | 6 (26.1%) |
| Computers, Engineering & Science | 0 (0.0%) | 0 (0.0%) |
| Computers & Mathematics | 0 (0.0%) | 0 (0.0%) |
| Architecture & Engineering | 0 (0.0%) | 0 (0.0%) |
| Life, Physical & Social Science | 0 (0.0%) | 0 (0.0%) |
| Community & Social Service | 0 (0.0%) | 0 (0.0%) |
| Education, Arts & Media | 0 (0.0%) | 0 (0.0%) |
| Legal Services & Support | 0 (0.0%) | 0 (0.0%) |
| Education Instruction & Library | 0 (0.0%) | 0 (0.0%) |
| Arts, Media & Entertainment | 0 (0.0%) | 0 (0.0%) |
| Health Diagnosing & Treating | 21 (39.6%) | 32 (60.4%) |
| Health Technologists | 21 (55.3%) | 17 (44.7%) |
| Total (Category) | 86 (51.5%) | 81 (48.5%) |
| Total (Overall) | 470 (63.9%) | 266 (36.1%) |
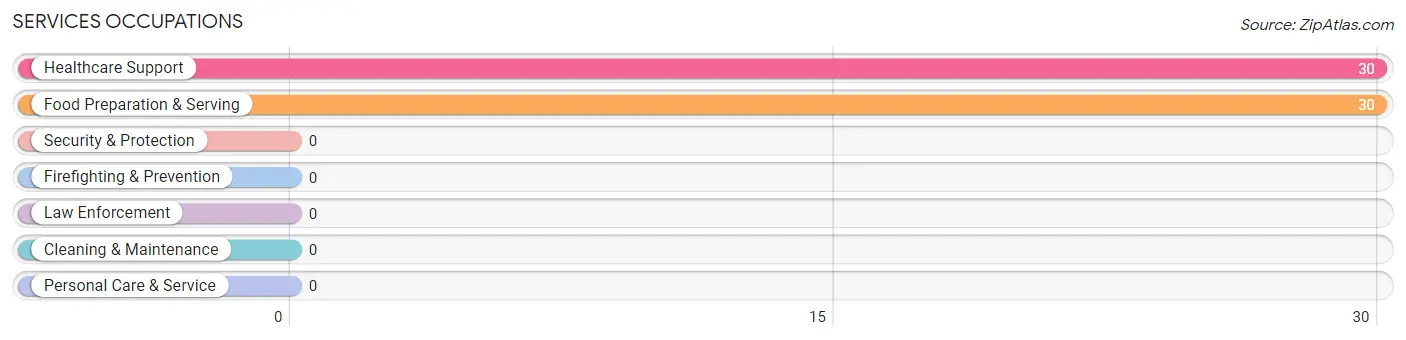
Services Occupations
The most common Services occupations in Lenape Heights are Healthcare Support (30 | 4.1%), and Food Preparation & Serving (30 | 4.1%).
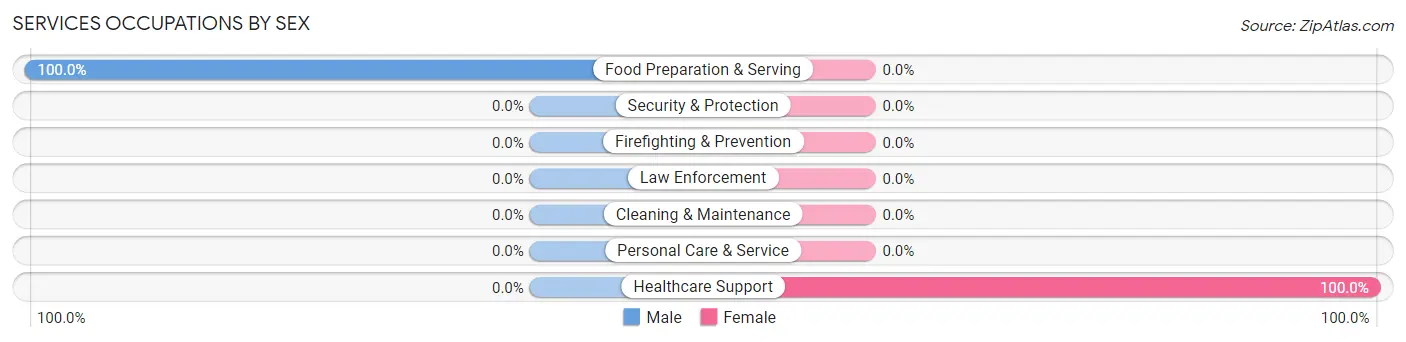
Services Occupations by Sex
| Occupation | Male | Female |
| Healthcare Support | 0 (0.0%) | 30 (100.0%) |
| Security & Protection | 0 (0.0%) | 0 (0.0%) |
| Firefighting & Prevention | 0 (0.0%) | 0 (0.0%) |
| Law Enforcement | 0 (0.0%) | 0 (0.0%) |
| Food Preparation & Serving | 30 (100.0%) | 0 (0.0%) |
| Cleaning & Maintenance | 0 (0.0%) | 0 (0.0%) |
| Personal Care & Service | 0 (0.0%) | 0 (0.0%) |
| Total (Category) | 30 (50.0%) | 30 (50.0%) |
| Total (Overall) | 470 (63.9%) | 266 (36.1%) |
Sales and Office Occupations
The most common Sales and Office occupations in Lenape Heights are , and Office & Administration (176 | 23.9%).
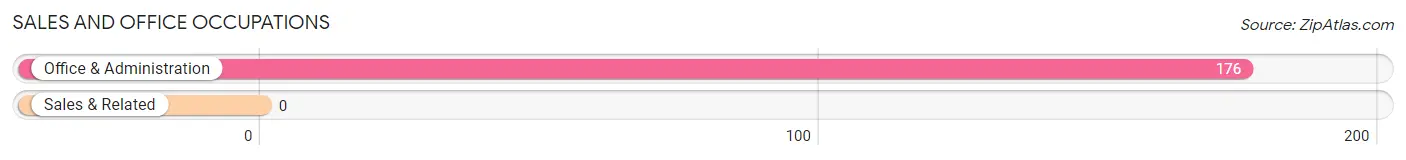
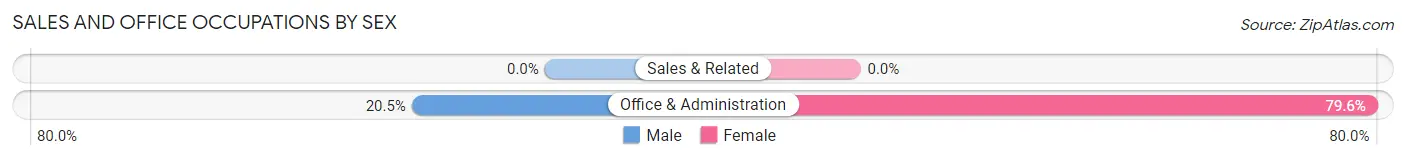
Sales and Office Occupations by Sex
| Occupation | Male | Female |
| Sales & Related | 0 (0.0%) | 0 (0.0%) |
| Office & Administration | 36 (20.4%) | 140 (79.5%) |
| Total (Category) | 36 (20.4%) | 140 (79.5%) |
| Total (Overall) | 470 (63.9%) | 266 (36.1%) |
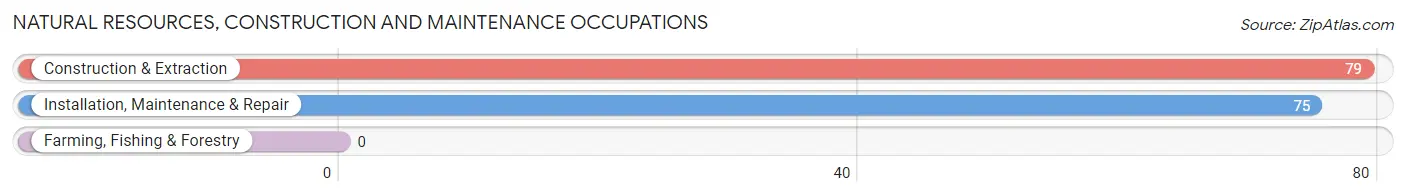
Natural Resources, Construction and Maintenance Occupations
The most common Natural Resources, Construction and Maintenance occupations in Lenape Heights are Construction & Extraction (79 | 10.7%), and Installation, Maintenance & Repair (75 | 10.2%).
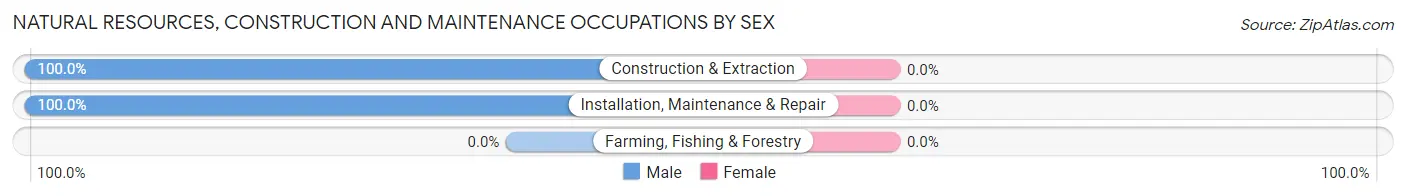
Natural Resources, Construction and Maintenance Occupations by Sex
| Occupation | Male | Female |
| Farming, Fishing & Forestry | 0 (0.0%) | 0 (0.0%) |
| Construction & Extraction | 79 (100.0%) | 0 (0.0%) |
| Installation, Maintenance & Repair | 75 (100.0%) | 0 (0.0%) |
| Total (Category) | 154 (100.0%) | 0 (0.0%) |
| Total (Overall) | 470 (63.9%) | 266 (36.1%) |
Production, Transportation and Moving Occupations
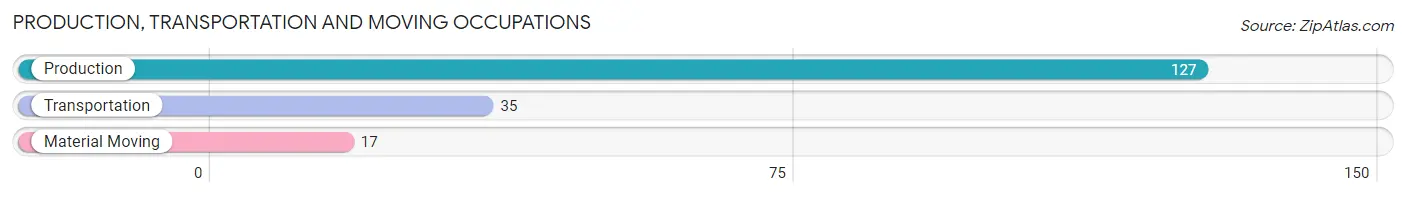
The most common Production, Transportation and Moving occupations in Lenape Heights are Production (127 | 17.3%), Transportation (35 | 4.8%), and Material Moving (17 | 2.3%).
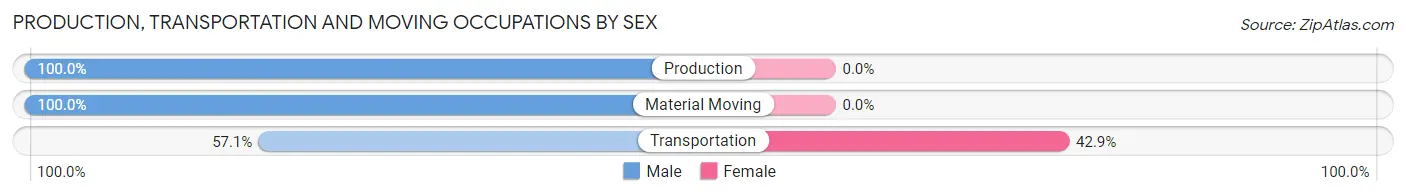
Production, Transportation and Moving Occupations by Sex
| Occupation | Male | Female |
| Production | 127 (100.0%) | 0 (0.0%) |
| Transportation | 20 (57.1%) | 15 (42.9%) |
| Material Moving | 17 (100.0%) | 0 (0.0%) |
| Total (Category) | 164 (91.6%) | 15 (8.4%) |
| Total (Overall) | 470 (63.9%) | 266 (36.1%) |
Employment Industries by Sex in Lenape Heights
Employment Industries in Lenape Heights
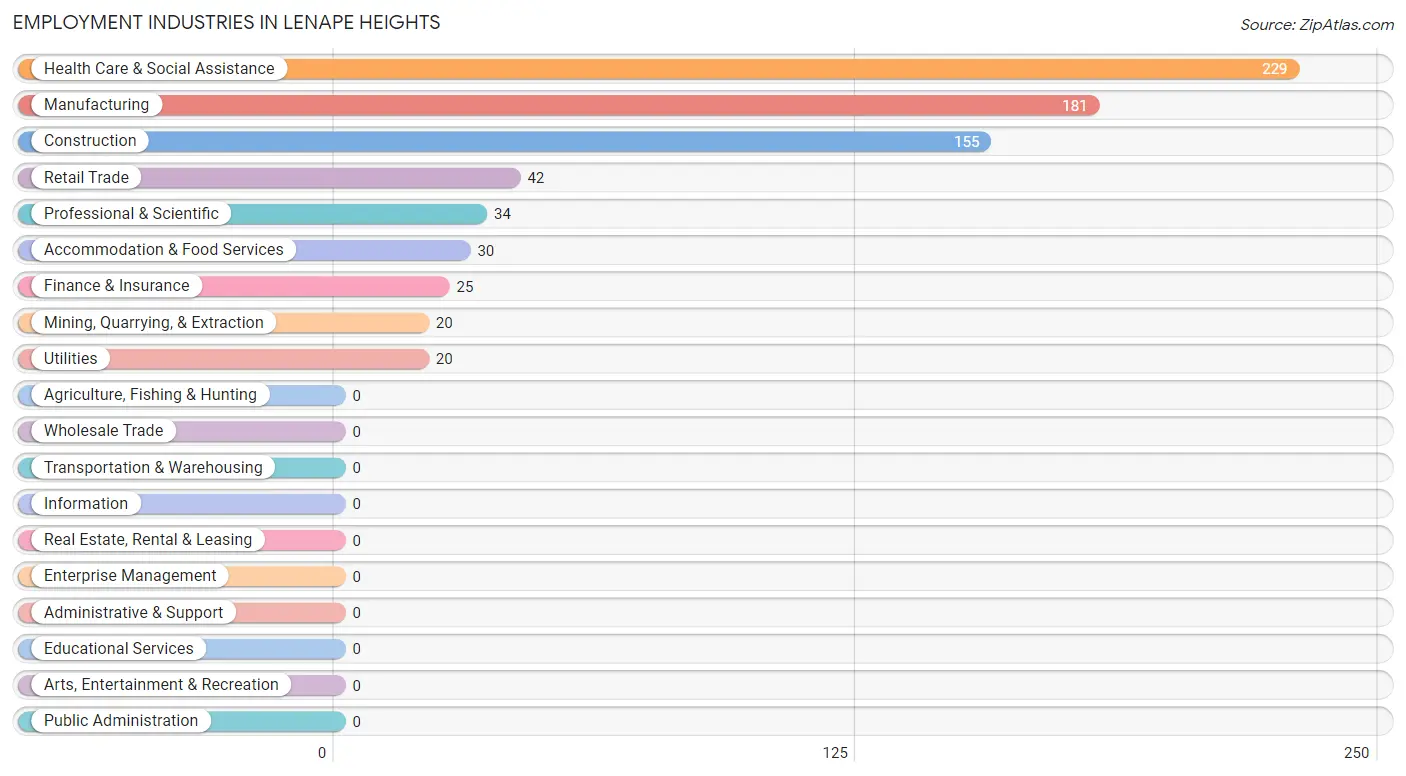
The major employment industries in Lenape Heights include Health Care & Social Assistance (229 | 31.1%), Manufacturing (181 | 24.6%), Construction (155 | 21.1%), Retail Trade (42 | 5.7%), and Professional & Scientific (34 | 4.6%).
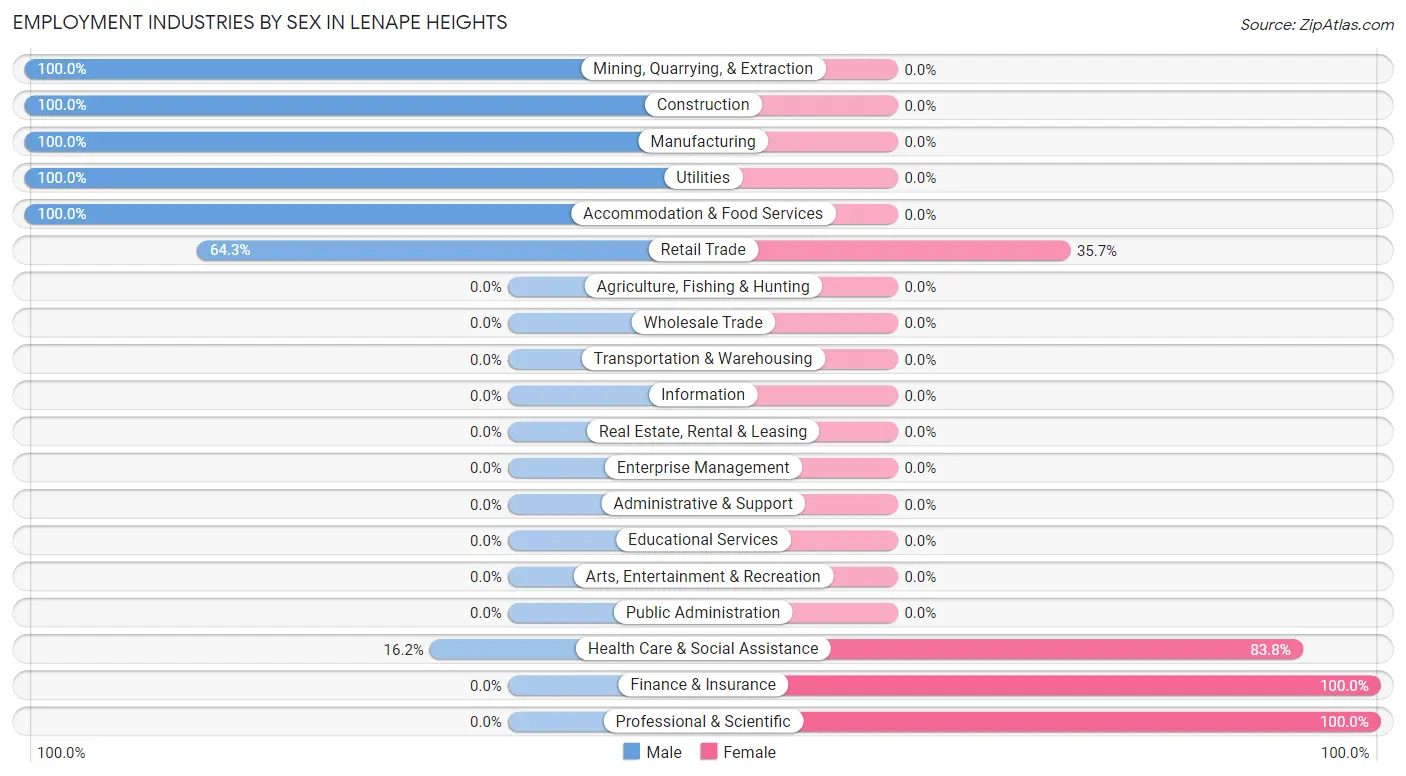
Employment Industries by Sex in Lenape Heights
The Lenape Heights industries that see more men than women are Mining, Quarrying, & Extraction (100.0%), Construction (100.0%), and Manufacturing (100.0%), whereas the industries that tend to have a higher number of women are Finance & Insurance (100.0%), Professional & Scientific (100.0%), and Health Care & Social Assistance (83.8%).
| Industry | Male | Female |
| Agriculture, Fishing & Hunting | 0 (0.0%) | 0 (0.0%) |
| Mining, Quarrying, & Extraction | 20 (100.0%) | 0 (0.0%) |
| Construction | 155 (100.0%) | 0 (0.0%) |
| Manufacturing | 181 (100.0%) | 0 (0.0%) |
| Wholesale Trade | 0 (0.0%) | 0 (0.0%) |
| Retail Trade | 27 (64.3%) | 15 (35.7%) |
| Transportation & Warehousing | 0 (0.0%) | 0 (0.0%) |
| Utilities | 20 (100.0%) | 0 (0.0%) |
| Information | 0 (0.0%) | 0 (0.0%) |
| Finance & Insurance | 0 (0.0%) | 25 (100.0%) |
| Real Estate, Rental & Leasing | 0 (0.0%) | 0 (0.0%) |
| Professional & Scientific | 0 (0.0%) | 34 (100.0%) |
| Enterprise Management | 0 (0.0%) | 0 (0.0%) |
| Administrative & Support | 0 (0.0%) | 0 (0.0%) |
| Educational Services | 0 (0.0%) | 0 (0.0%) |
| Health Care & Social Assistance | 37 (16.2%) | 192 (83.8%) |
| Arts, Entertainment & Recreation | 0 (0.0%) | 0 (0.0%) |
| Accommodation & Food Services | 30 (100.0%) | 0 (0.0%) |
| Public Administration | 0 (0.0%) | 0 (0.0%) |
| Total | 470 (63.9%) | 266 (36.1%) |
Education in Lenape Heights
School Enrollment in Lenape Heights
The most common levels of schooling among the 270 students in Lenape Heights are high school (102 | 37.8%), middle school (68 | 25.2%), and kindergarten (49 | 18.1%).
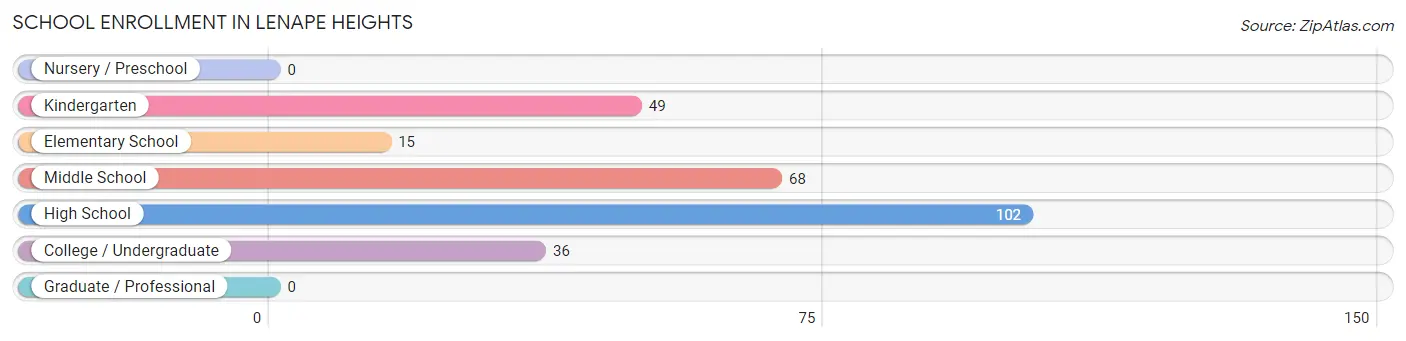
| School Level | # Students | % Students |
| Nursery / Preschool | 0 | 0.0% |
| Kindergarten | 49 | 18.1% |
| Elementary School | 15 | 5.6% |
| Middle School | 68 | 25.2% |
| High School | 102 | 37.8% |
| College / Undergraduate | 36 | 13.3% |
| Graduate / Professional | 0 | 0.0% |
| Total | 270 | 100.0% |
School Enrollment by Age by Funding Source in Lenape Heights
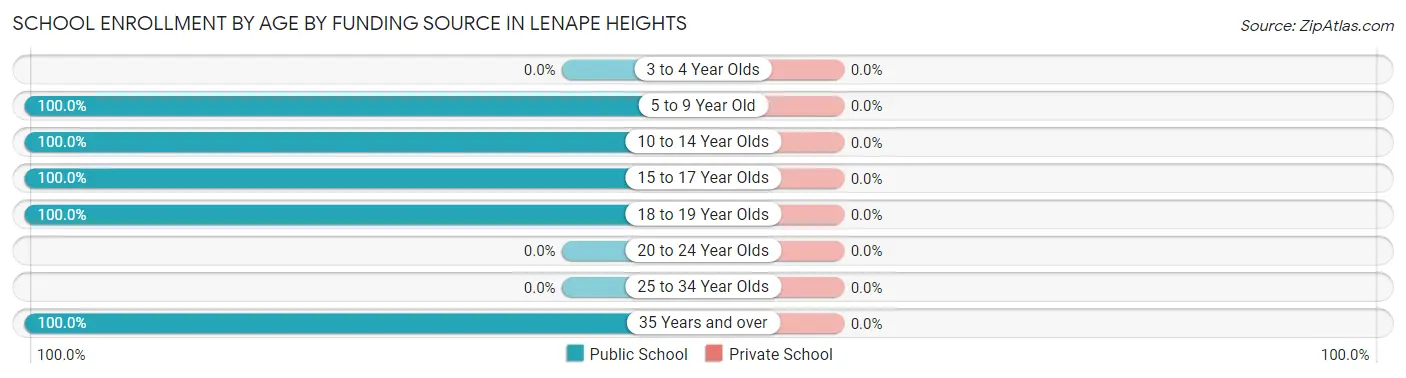
| Age Bracket | Public School | Private School |
| 3 to 4 Year Olds | 0 (0.0%) | 0 (0.0%) |
| 5 to 9 Year Old | 64 (100.0%) | 0 (0.0%) |
| 10 to 14 Year Olds | 68 (100.0%) | 0 (0.0%) |
| 15 to 17 Year Olds | 71 (100.0%) | 0 (0.0%) |
| 18 to 19 Year Olds | 47 (100.0%) | 0 (0.0%) |
| 20 to 24 Year Olds | 0 (0.0%) | 0 (0.0%) |
| 25 to 34 Year Olds | 0 (0.0%) | 0 (0.0%) |
| 35 Years and over | 20 (100.0%) | 0 (0.0%) |
| Total | 270 (100.0%) | 0 (0.0%) |
Educational Attainment by Field of Study in Lenape Heights
Science & technology (87 | 23.3%), business (82 | 22.0%), engineering (80 | 21.4%), bio, nature & agricultural (54 | 14.5%), and arts & humanities (38 | 10.2%) are the most common fields of study among 373 individuals in Lenape Heights who have obtained a bachelor's degree or higher.
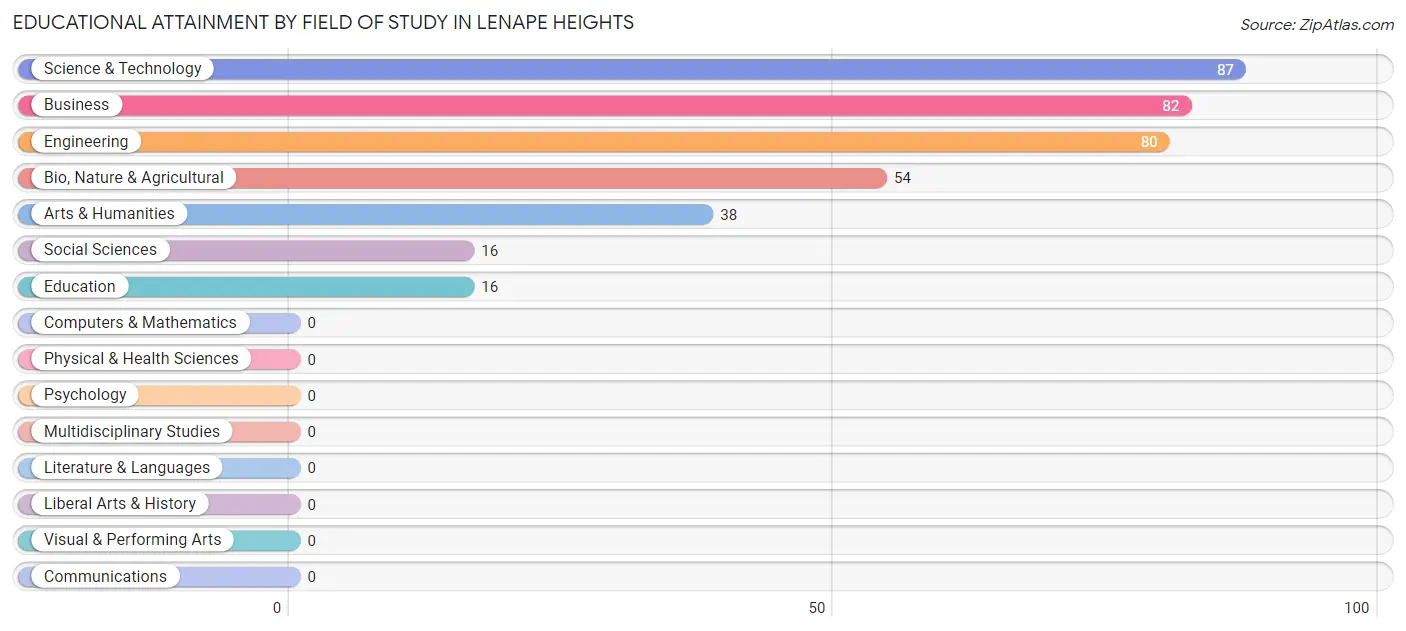
| Field of Study | # Graduates | % Graduates |
| Computers & Mathematics | 0 | 0.0% |
| Bio, Nature & Agricultural | 54 | 14.5% |
| Physical & Health Sciences | 0 | 0.0% |
| Psychology | 0 | 0.0% |
| Social Sciences | 16 | 4.3% |
| Engineering | 80 | 21.4% |
| Multidisciplinary Studies | 0 | 0.0% |
| Science & Technology | 87 | 23.3% |
| Business | 82 | 22.0% |
| Education | 16 | 4.3% |
| Literature & Languages | 0 | 0.0% |
| Liberal Arts & History | 0 | 0.0% |
| Visual & Performing Arts | 0 | 0.0% |
| Communications | 0 | 0.0% |
| Arts & Humanities | 38 | 10.2% |
| Total | 373 | 100.0% |
Transportation & Commute in Lenape Heights
Vehicle Availability by Sex in Lenape Heights
The most prevalent vehicle ownership categories in Lenape Heights are males with 3 vehicles (166, accounting for 35.3%) and females with 3 vehicles (95, making up 62.4%).
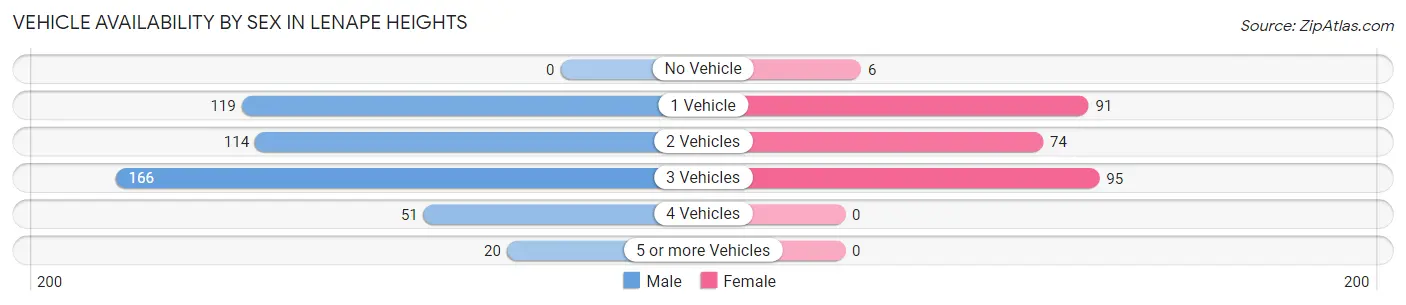
| Vehicles Available | Male | Female |
| No Vehicle | 0 (0.0%) | 6 (2.3%) |
| 1 Vehicle | 119 (25.3%) | 91 (34.2%) |
| 2 Vehicles | 114 (24.3%) | 74 (27.8%) |
| 3 Vehicles | 166 (35.3%) | 95 (35.7%) |
| 4 Vehicles | 51 (10.8%) | 0 (0.0%) |
| 5 or more Vehicles | 20 (4.3%) | 0 (0.0%) |
| Total | 470 (100.0%) | 266 (100.0%) |
Commute Time in Lenape Heights
The most frequently occuring commute durations in Lenape Heights are 10 to 14 minutes (192 commuters, 29.0%), 60 to 89 minutes (112 commuters, 16.9%), and 30 to 34 minutes (87 commuters, 13.2%).
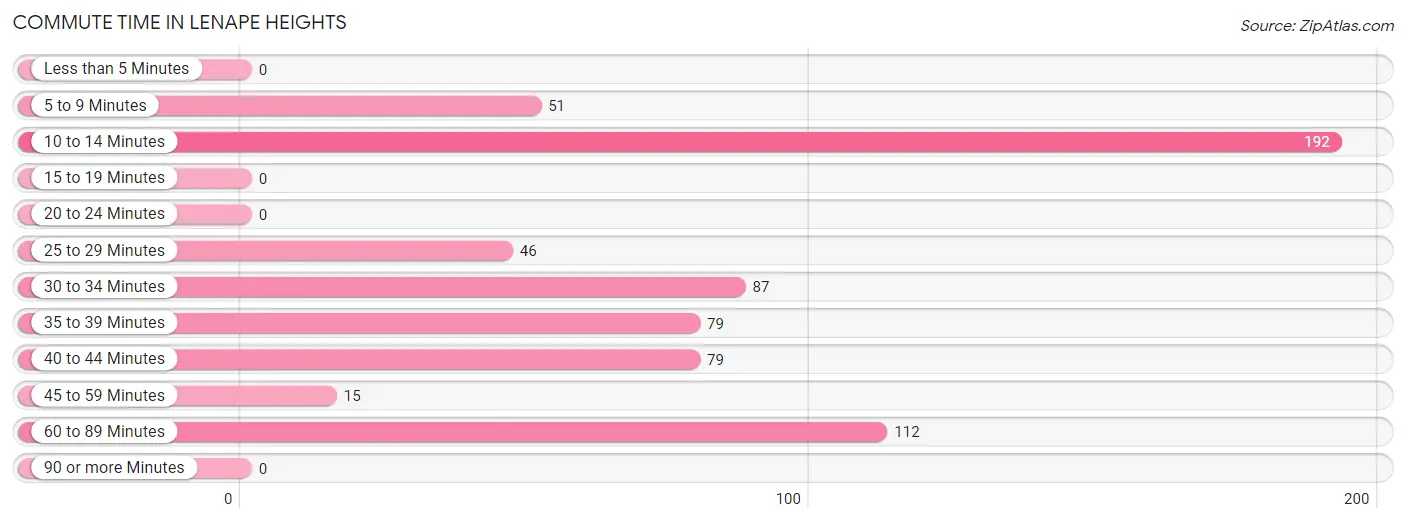
| Commute Time | # Commuters | % Commuters |
| Less than 5 Minutes | 0 | 0.0% |
| 5 to 9 Minutes | 51 | 7.7% |
| 10 to 14 Minutes | 192 | 29.0% |
| 15 to 19 Minutes | 0 | 0.0% |
| 20 to 24 Minutes | 0 | 0.0% |
| 25 to 29 Minutes | 46 | 7.0% |
| 30 to 34 Minutes | 87 | 13.2% |
| 35 to 39 Minutes | 79 | 11.9% |
| 40 to 44 Minutes | 79 | 11.9% |
| 45 to 59 Minutes | 15 | 2.3% |
| 60 to 89 Minutes | 112 | 16.9% |
| 90 or more Minutes | 0 | 0.0% |
Commute Time by Sex in Lenape Heights
The most common commute times in Lenape Heights are 10 to 14 minutes (165 commuters, 37.3%) for males and 30 to 34 minutes (67 commuters, 30.6%) for females.
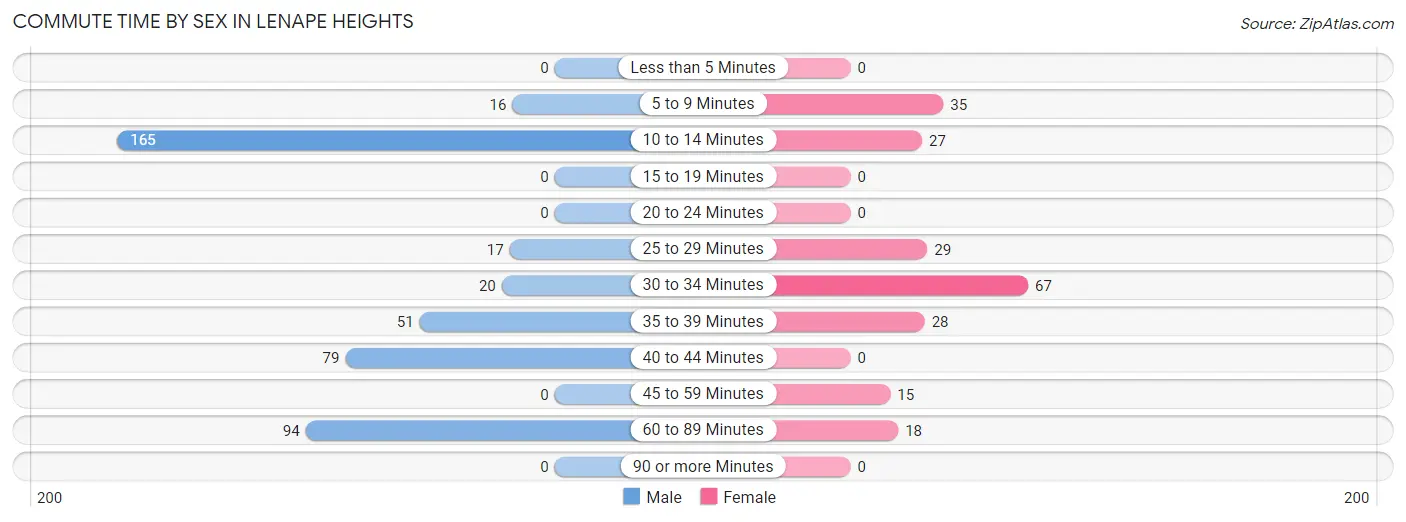
| Commute Time | Male | Female |
| Less than 5 Minutes | 0 (0.0%) | 0 (0.0%) |
| 5 to 9 Minutes | 16 (3.6%) | 35 (16.0%) |
| 10 to 14 Minutes | 165 (37.3%) | 27 (12.3%) |
| 15 to 19 Minutes | 0 (0.0%) | 0 (0.0%) |
| 20 to 24 Minutes | 0 (0.0%) | 0 (0.0%) |
| 25 to 29 Minutes | 17 (3.8%) | 29 (13.2%) |
| 30 to 34 Minutes | 20 (4.5%) | 67 (30.6%) |
| 35 to 39 Minutes | 51 (11.5%) | 28 (12.8%) |
| 40 to 44 Minutes | 79 (17.9%) | 0 (0.0%) |
| 45 to 59 Minutes | 0 (0.0%) | 15 (6.9%) |
| 60 to 89 Minutes | 94 (21.3%) | 18 (8.2%) |
| 90 or more Minutes | 0 (0.0%) | 0 (0.0%) |
Time of Departure to Work by Sex in Lenape Heights
The most frequent times of departure to work in Lenape Heights are 6:00 AM to 6:29 AM (109, 24.7%) for males and 7:30 AM to 7:59 AM (81, 37.0%) for females.
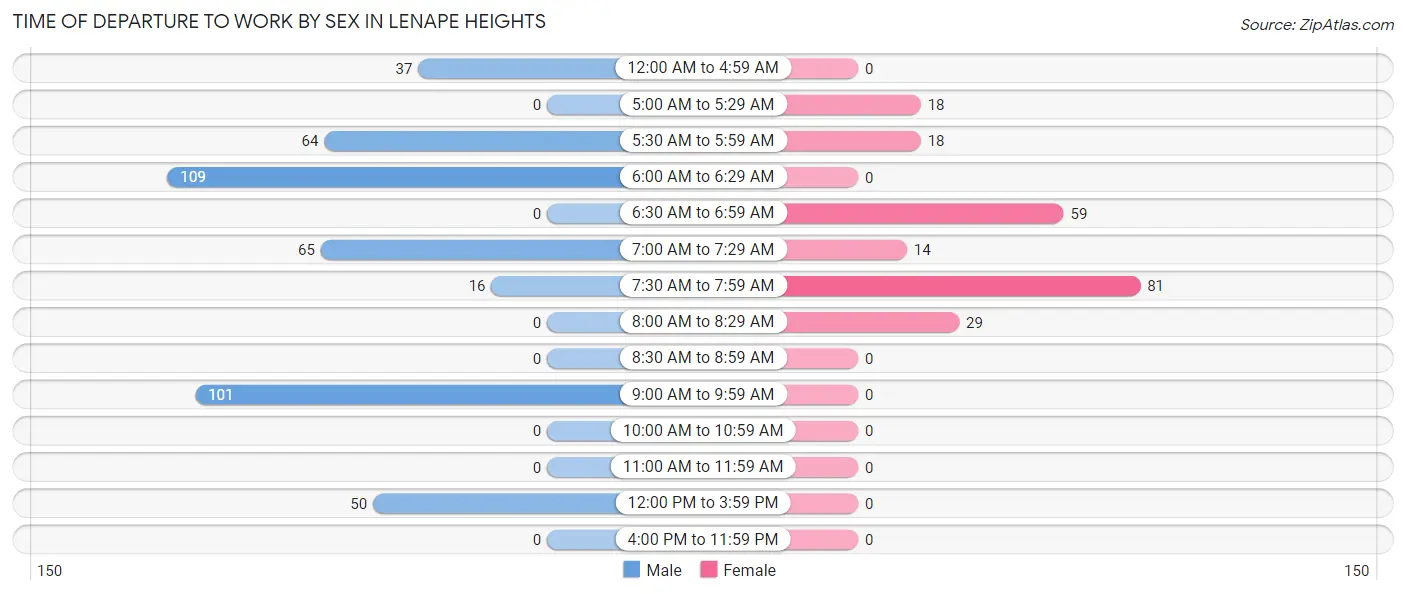
| Time of Departure | Male | Female |
| 12:00 AM to 4:59 AM | 37 (8.4%) | 0 (0.0%) |
| 5:00 AM to 5:29 AM | 0 (0.0%) | 18 (8.2%) |
| 5:30 AM to 5:59 AM | 64 (14.5%) | 18 (8.2%) |
| 6:00 AM to 6:29 AM | 109 (24.7%) | 0 (0.0%) |
| 6:30 AM to 6:59 AM | 0 (0.0%) | 59 (26.9%) |
| 7:00 AM to 7:29 AM | 65 (14.7%) | 14 (6.4%) |
| 7:30 AM to 7:59 AM | 16 (3.6%) | 81 (37.0%) |
| 8:00 AM to 8:29 AM | 0 (0.0%) | 29 (13.2%) |
| 8:30 AM to 8:59 AM | 0 (0.0%) | 0 (0.0%) |
| 9:00 AM to 9:59 AM | 101 (22.9%) | 0 (0.0%) |
| 10:00 AM to 10:59 AM | 0 (0.0%) | 0 (0.0%) |
| 11:00 AM to 11:59 AM | 0 (0.0%) | 0 (0.0%) |
| 12:00 PM to 3:59 PM | 50 (11.3%) | 0 (0.0%) |
| 4:00 PM to 11:59 PM | 0 (0.0%) | 0 (0.0%) |
| Total | 442 (100.0%) | 219 (100.0%) |
Housing Occupancy in Lenape Heights
Occupancy by Ownership in Lenape Heights
Of the total 608 dwellings in Lenape Heights, owner-occupied units account for 486 (79.9%), while renter-occupied units make up 122 (20.1%).
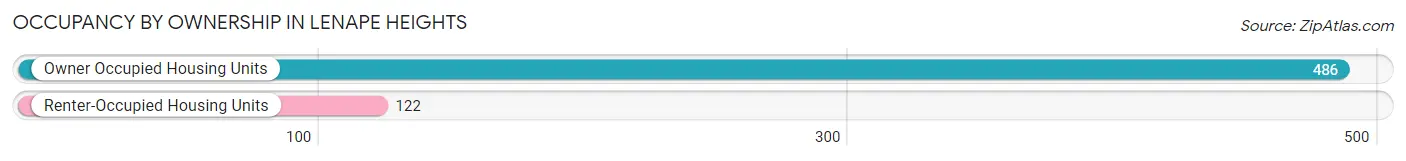
| Occupancy | # Housing Units | % Housing Units |
| Owner Occupied Housing Units | 486 | 79.9% |
| Renter-Occupied Housing Units | 122 | 20.1% |
| Total Occupied Housing Units | 608 | 100.0% |
Occupancy by Household Size in Lenape Heights
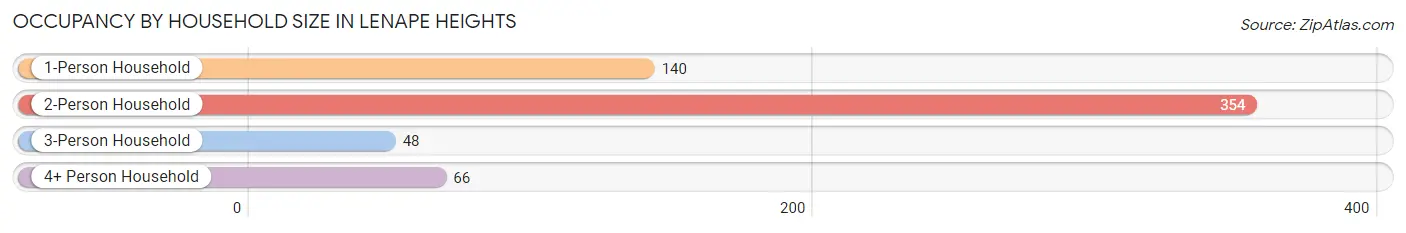
| Household Size | # Housing Units | % Housing Units |
| 1-Person Household | 140 | 23.0% |
| 2-Person Household | 354 | 58.2% |
| 3-Person Household | 48 | 7.9% |
| 4+ Person Household | 66 | 10.9% |
| Total Housing Units | 608 | 100.0% |
Occupancy by Ownership by Household Size in Lenape Heights
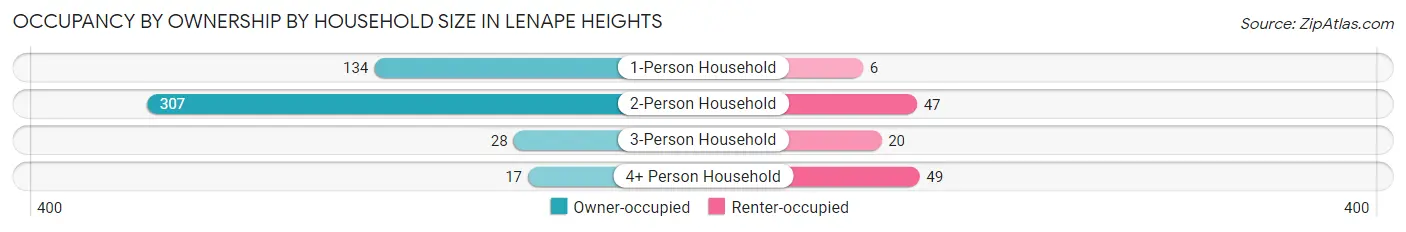
| Household Size | Owner-occupied | Renter-occupied |
| 1-Person Household | 134 (95.7%) | 6 (4.3%) |
| 2-Person Household | 307 (86.7%) | 47 (13.3%) |
| 3-Person Household | 28 (58.3%) | 20 (41.7%) |
| 4+ Person Household | 17 (25.8%) | 49 (74.2%) |
| Total Housing Units | 486 (79.9%) | 122 (20.1%) |
Occupancy by Educational Attainment in Lenape Heights
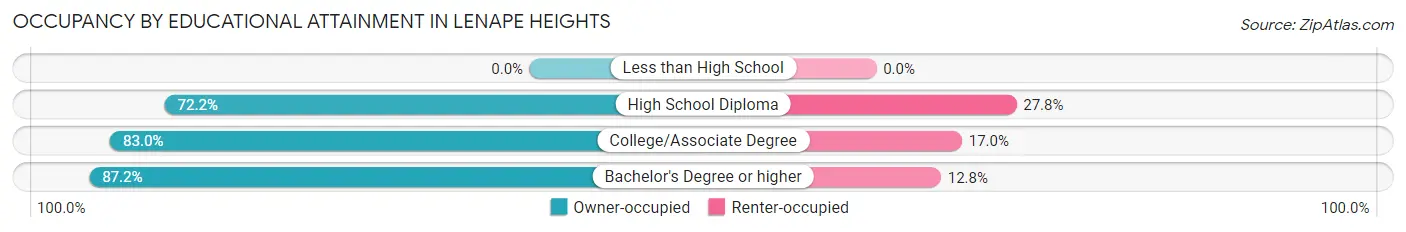
| Household Size | Owner-occupied | Renter-occupied |
| Less than High School | 0 (0.0%) | 0 (0.0%) |
| High School Diploma | 169 (72.2%) | 65 (27.8%) |
| College/Associate Degree | 181 (83.0%) | 37 (17.0%) |
| Bachelor's Degree or higher | 136 (87.2%) | 20 (12.8%) |
Occupancy by Age of Householder in Lenape Heights
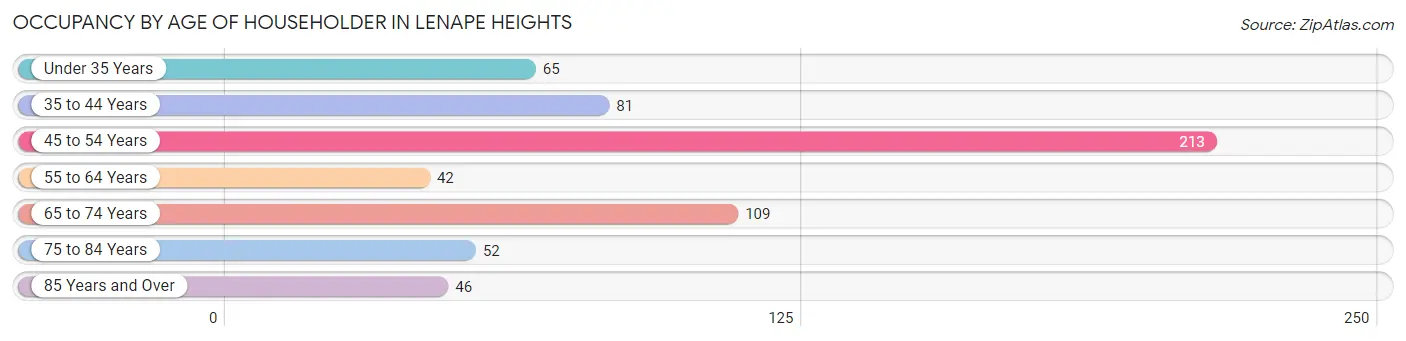
| Age Bracket | # Households | % Households |
| Under 35 Years | 65 | 10.7% |
| 35 to 44 Years | 81 | 13.3% |
| 45 to 54 Years | 213 | 35.0% |
| 55 to 64 Years | 42 | 6.9% |
| 65 to 74 Years | 109 | 17.9% |
| 75 to 84 Years | 52 | 8.6% |
| 85 Years and Over | 46 | 7.6% |
| Total | 608 | 100.0% |
Housing Finances in Lenape Heights
Median Income by Occupancy in Lenape Heights
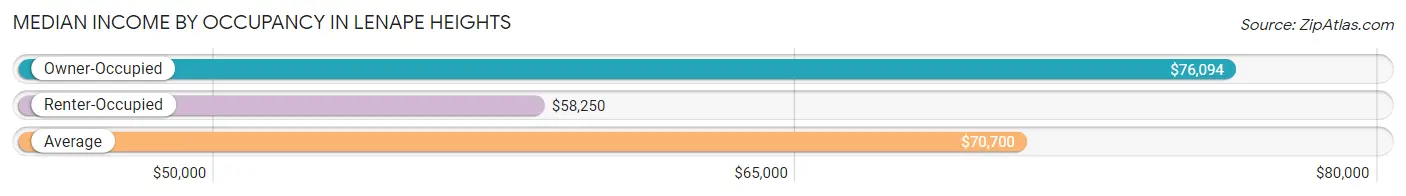
| Occupancy Type | # Households | Median Income |
| Owner-Occupied | 486 (79.9%) | $76,094 |
| Renter-Occupied | 122 (20.1%) | $58,250 |
| Average | 608 (100.0%) | $70,700 |
Occupancy by Householder Income Bracket in Lenape Heights
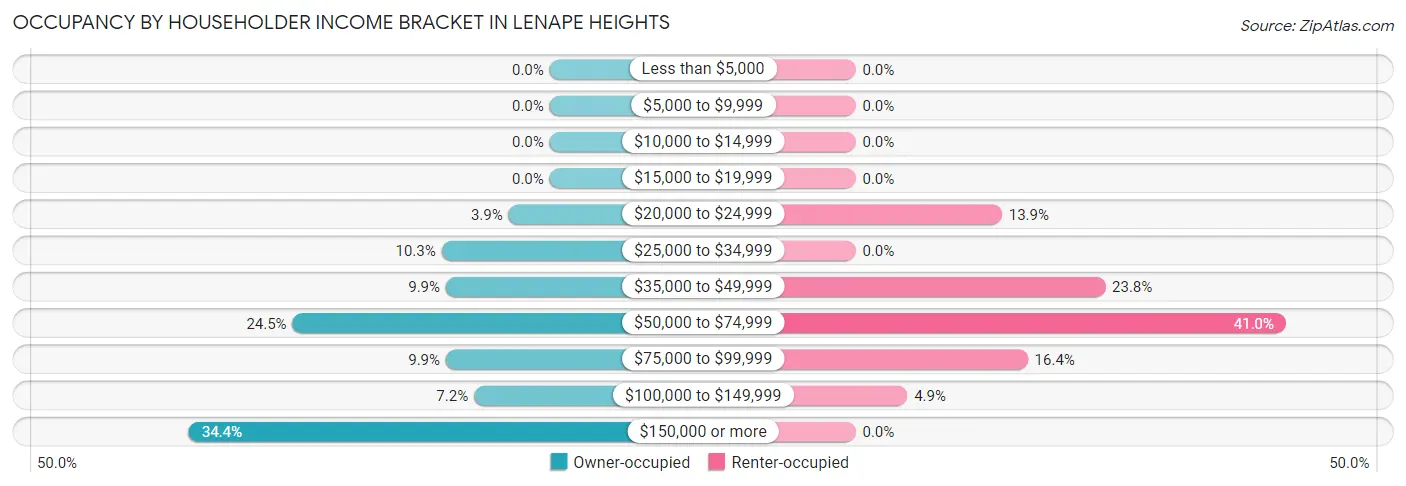
| Income Bracket | Owner-occupied | Renter-occupied |
| Less than $5,000 | 0 (0.0%) | 0 (0.0%) |
| $5,000 to $9,999 | 0 (0.0%) | 0 (0.0%) |
| $10,000 to $14,999 | 0 (0.0%) | 0 (0.0%) |
| $15,000 to $19,999 | 0 (0.0%) | 0 (0.0%) |
| $20,000 to $24,999 | 19 (3.9%) | 17 (13.9%) |
| $25,000 to $34,999 | 50 (10.3%) | 0 (0.0%) |
| $35,000 to $49,999 | 48 (9.9%) | 29 (23.8%) |
| $50,000 to $74,999 | 119 (24.5%) | 50 (41.0%) |
| $75,000 to $99,999 | 48 (9.9%) | 20 (16.4%) |
| $100,000 to $149,999 | 35 (7.2%) | 6 (4.9%) |
| $150,000 or more | 167 (34.4%) | 0 (0.0%) |
| Total | 486 (100.0%) | 122 (100.0%) |
Monthly Housing Cost Tiers in Lenape Heights
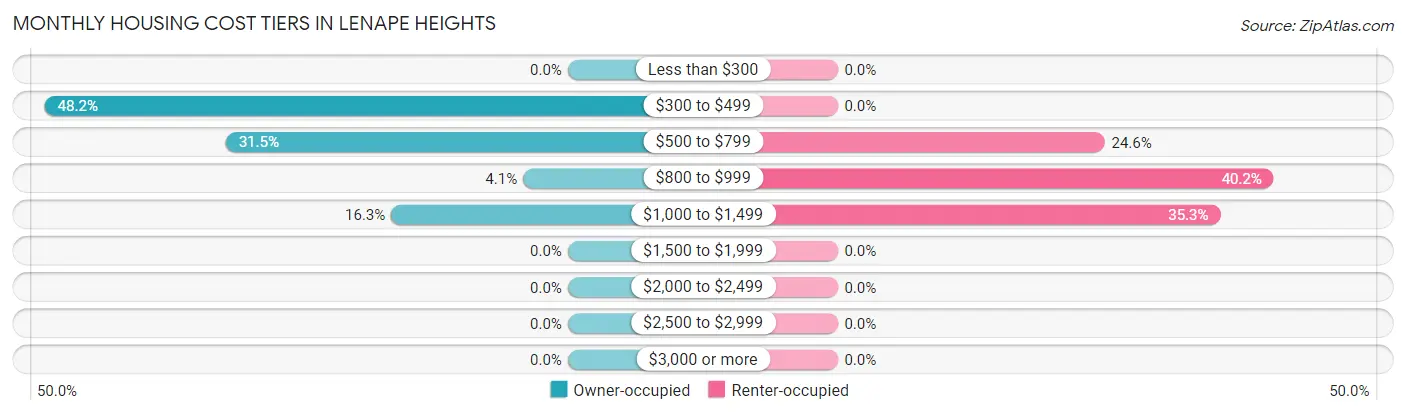
| Monthly Cost | Owner-occupied | Renter-occupied |
| Less than $300 | 0 (0.0%) | 0 (0.0%) |
| $300 to $499 | 234 (48.1%) | 0 (0.0%) |
| $500 to $799 | 153 (31.5%) | 30 (24.6%) |
| $800 to $999 | 20 (4.1%) | 49 (40.2%) |
| $1,000 to $1,499 | 79 (16.3%) | 43 (35.2%) |
| $1,500 to $1,999 | 0 (0.0%) | 0 (0.0%) |
| $2,000 to $2,499 | 0 (0.0%) | 0 (0.0%) |
| $2,500 to $2,999 | 0 (0.0%) | 0 (0.0%) |
| $3,000 or more | 0 (0.0%) | 0 (0.0%) |
| Total | 486 (100.0%) | 122 (100.0%) |
Physical Housing Characteristics in Lenape Heights
Housing Structures in Lenape Heights
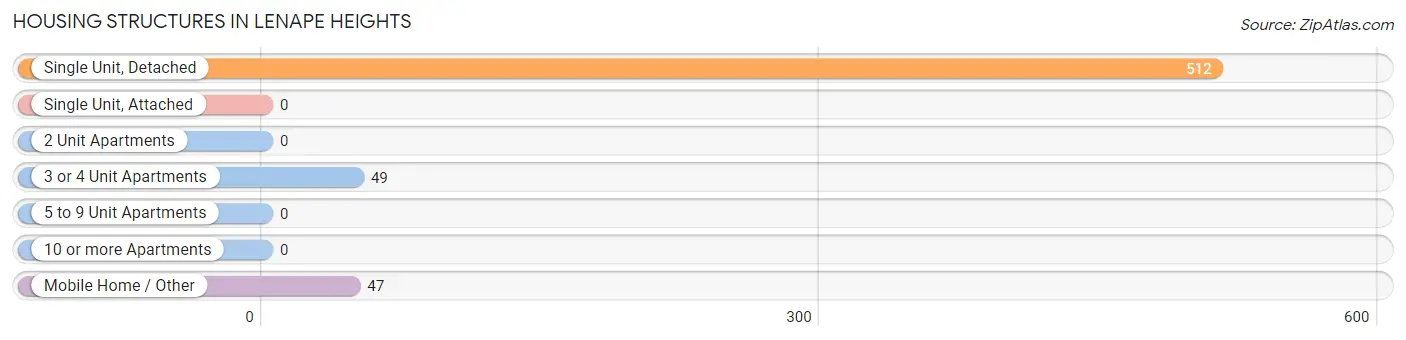
| Structure Type | # Housing Units | % Housing Units |
| Single Unit, Detached | 512 | 84.2% |
| Single Unit, Attached | 0 | 0.0% |
| 2 Unit Apartments | 0 | 0.0% |
| 3 or 4 Unit Apartments | 49 | 8.1% |
| 5 to 9 Unit Apartments | 0 | 0.0% |
| 10 or more Apartments | 0 | 0.0% |
| Mobile Home / Other | 47 | 7.7% |
| Total | 608 | 100.0% |
Housing Structures by Occupancy in Lenape Heights
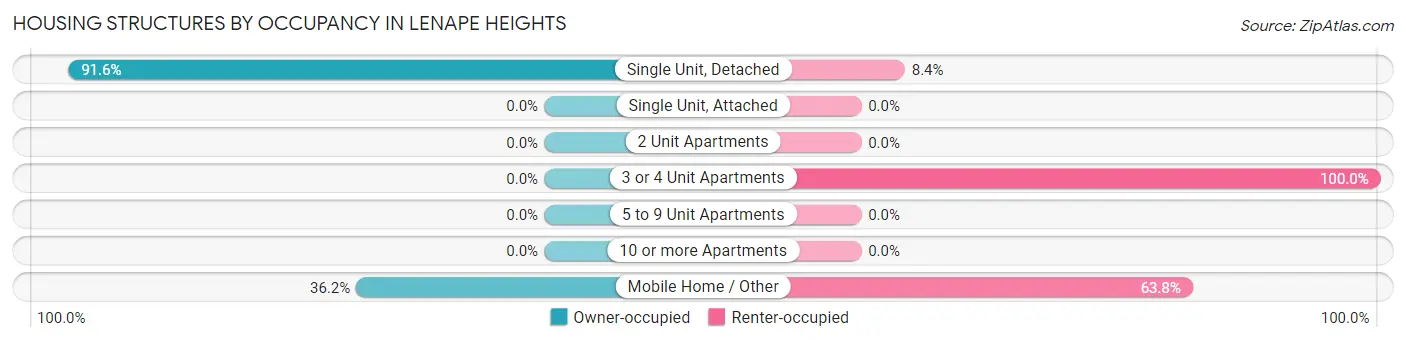
| Structure Type | Owner-occupied | Renter-occupied |
| Single Unit, Detached | 469 (91.6%) | 43 (8.4%) |
| Single Unit, Attached | 0 (0.0%) | 0 (0.0%) |
| 2 Unit Apartments | 0 (0.0%) | 0 (0.0%) |
| 3 or 4 Unit Apartments | 0 (0.0%) | 49 (100.0%) |
| 5 to 9 Unit Apartments | 0 (0.0%) | 0 (0.0%) |
| 10 or more Apartments | 0 (0.0%) | 0 (0.0%) |
| Mobile Home / Other | 17 (36.2%) | 30 (63.8%) |
| Total | 486 (79.9%) | 122 (20.1%) |
Housing Structures by Number of Rooms in Lenape Heights
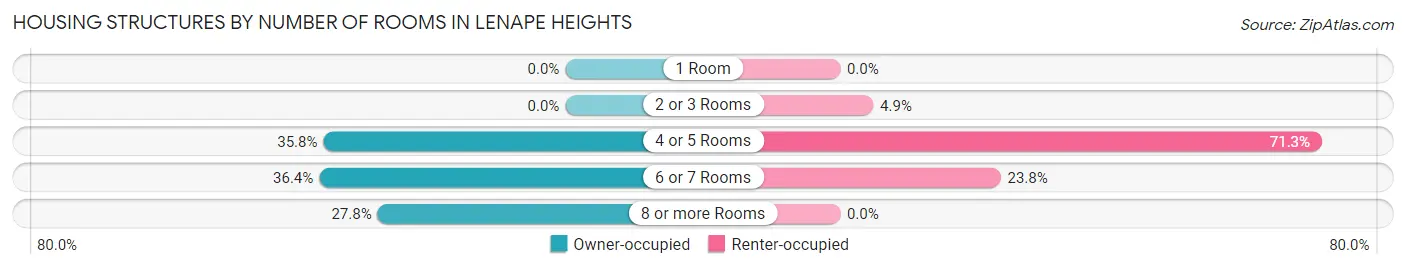
| Number of Rooms | Owner-occupied | Renter-occupied |
| 1 Room | 0 (0.0%) | 0 (0.0%) |
| 2 or 3 Rooms | 0 (0.0%) | 6 (4.9%) |
| 4 or 5 Rooms | 174 (35.8%) | 87 (71.3%) |
| 6 or 7 Rooms | 177 (36.4%) | 29 (23.8%) |
| 8 or more Rooms | 135 (27.8%) | 0 (0.0%) |
| Total | 486 (100.0%) | 122 (100.0%) |
Housing Structure by Heating Type in Lenape Heights
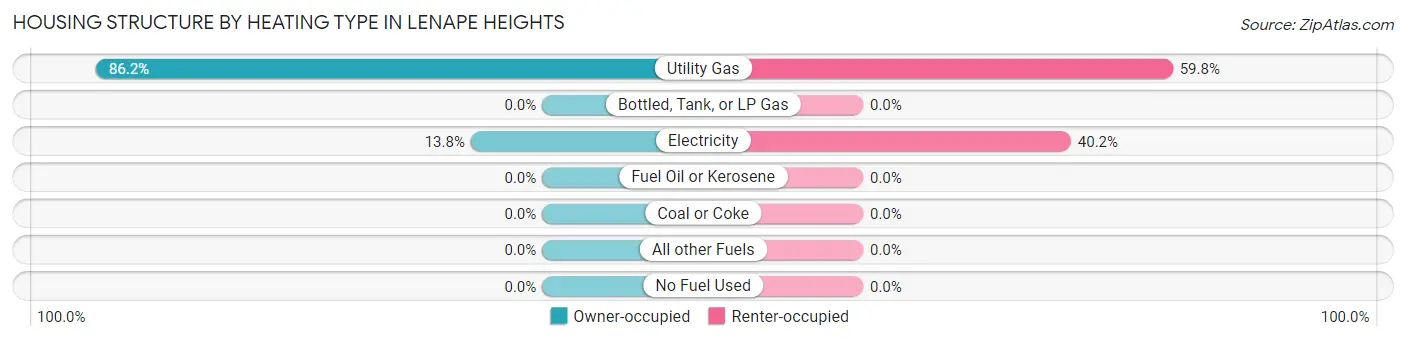
| Heating Type | Owner-occupied | Renter-occupied |
| Utility Gas | 419 (86.2%) | 73 (59.8%) |
| Bottled, Tank, or LP Gas | 0 (0.0%) | 0 (0.0%) |
| Electricity | 67 (13.8%) | 49 (40.2%) |
| Fuel Oil or Kerosene | 0 (0.0%) | 0 (0.0%) |
| Coal or Coke | 0 (0.0%) | 0 (0.0%) |
| All other Fuels | 0 (0.0%) | 0 (0.0%) |
| No Fuel Used | 0 (0.0%) | 0 (0.0%) |
| Total | 486 (100.0%) | 122 (100.0%) |
Household Vehicle Usage in Lenape Heights
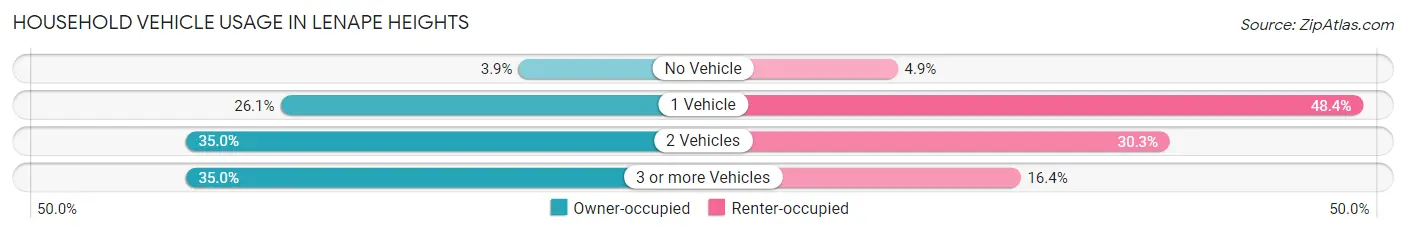
| Vehicles per Household | Owner-occupied | Renter-occupied |
| No Vehicle | 19 (3.9%) | 6 (4.9%) |
| 1 Vehicle | 127 (26.1%) | 59 (48.4%) |
| 2 Vehicles | 170 (35.0%) | 37 (30.3%) |
| 3 or more Vehicles | 170 (35.0%) | 20 (16.4%) |
| Total | 486 (100.0%) | 122 (100.0%) |
Real Estate & Mortgages in Lenape Heights
Real Estate and Mortgage Overview in Lenape Heights
| Characteristic | Without Mortgage | With Mortgage |
| Housing Units | 372 | 114 |
| Median Property Value | $164,100 | $139,400 |
| Median Household Income | $76,875 | $17 |
| Monthly Housing Costs | $397 | $0 |
| Real Estate Taxes | $1,645 | $0 |
Property Value by Mortgage Status in Lenape Heights
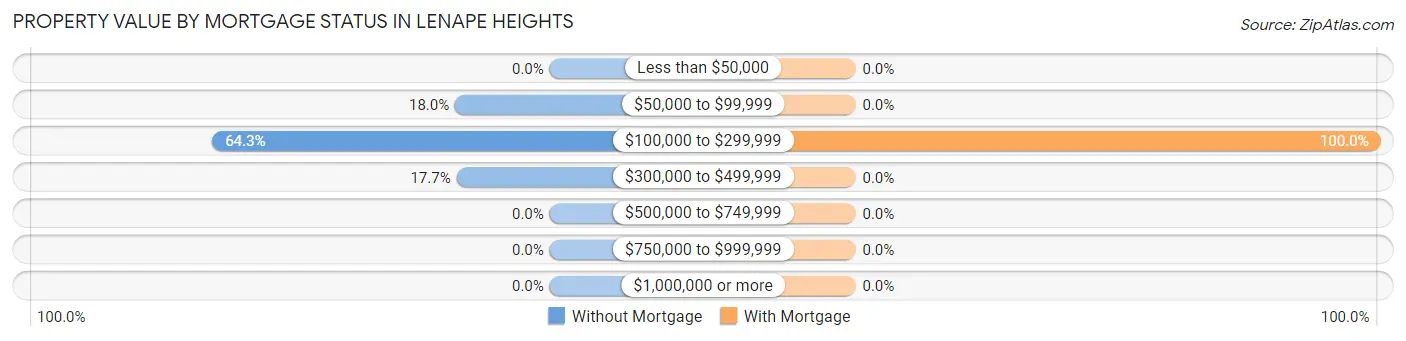
| Property Value | Without Mortgage | With Mortgage |
| Less than $50,000 | 0 (0.0%) | 0 (0.0%) |
| $50,000 to $99,999 | 67 (18.0%) | 0 (0.0%) |
| $100,000 to $299,999 | 239 (64.2%) | 114 (100.0%) |
| $300,000 to $499,999 | 66 (17.7%) | 0 (0.0%) |
| $500,000 to $749,999 | 0 (0.0%) | 0 (0.0%) |
| $750,000 to $999,999 | 0 (0.0%) | 0 (0.0%) |
| $1,000,000 or more | 0 (0.0%) | 0 (0.0%) |
| Total | 372 (100.0%) | 114 (100.0%) |
Household Income by Mortgage Status in Lenape Heights
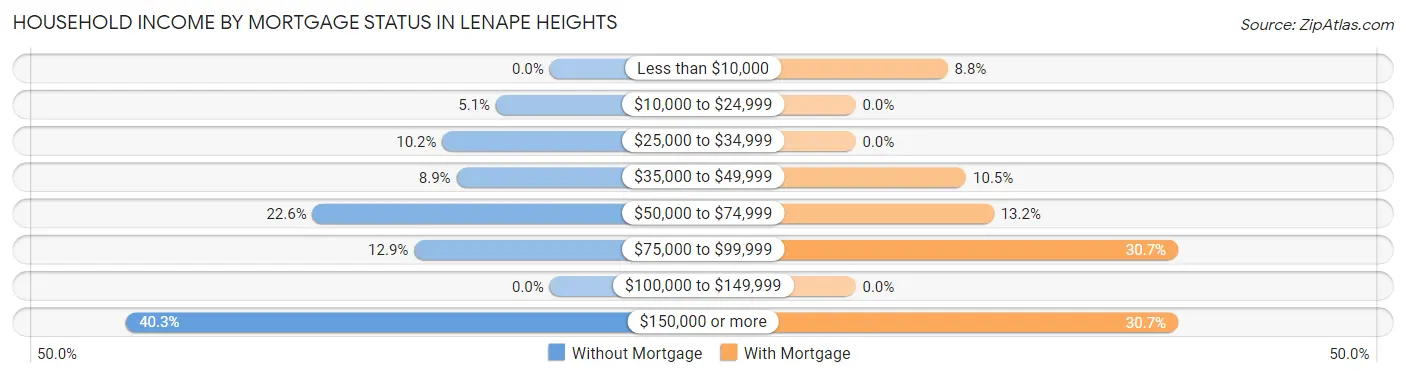
| Household Income | Without Mortgage | With Mortgage |
| Less than $10,000 | 0 (0.0%) | 10 (8.8%) |
| $10,000 to $24,999 | 19 (5.1%) | 0 (0.0%) |
| $25,000 to $34,999 | 38 (10.2%) | 0 (0.0%) |
| $35,000 to $49,999 | 33 (8.9%) | 12 (10.5%) |
| $50,000 to $74,999 | 84 (22.6%) | 15 (13.2%) |
| $75,000 to $99,999 | 48 (12.9%) | 35 (30.7%) |
| $100,000 to $149,999 | 0 (0.0%) | 0 (0.0%) |
| $150,000 or more | 150 (40.3%) | 35 (30.7%) |
| Total | 372 (100.0%) | 114 (100.0%) |
Property Value to Household Income Ratio in Lenape Heights
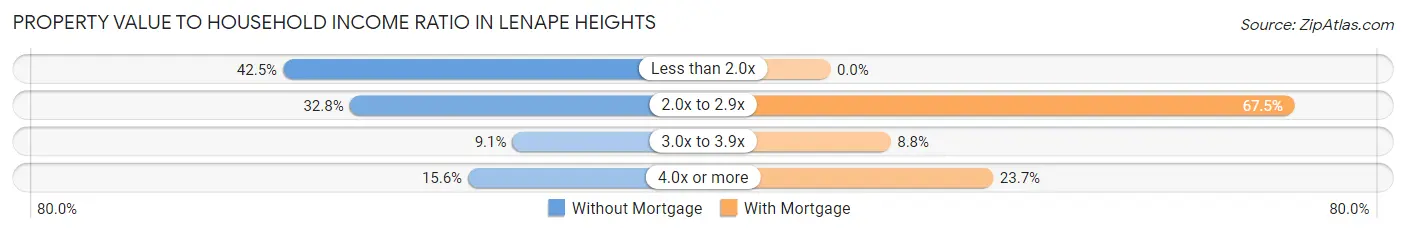
| Value-to-Income Ratio | Without Mortgage | With Mortgage |
| Less than 2.0x | 158 (42.5%) | 0 (0.0%) |
| 2.0x to 2.9x | 122 (32.8%) | 77 (67.5%) |
| 3.0x to 3.9x | 34 (9.1%) | 10 (8.8%) |
| 4.0x or more | 58 (15.6%) | 27 (23.7%) |
| Total | 372 (100.0%) | 114 (100.0%) |
Real Estate Taxes by Mortgage Status in Lenape Heights
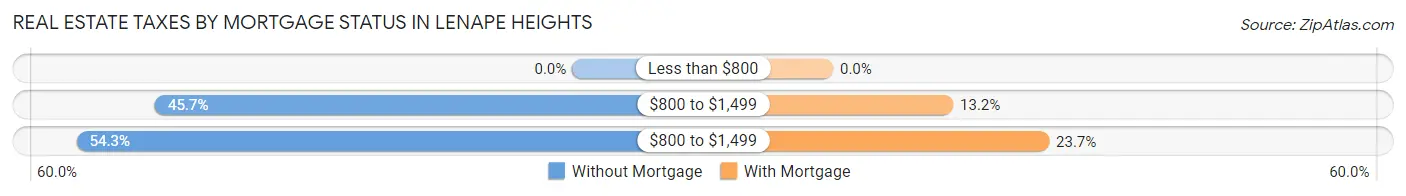
| Property Taxes | Without Mortgage | With Mortgage |
| Less than $800 | 0 (0.0%) | 0 (0.0%) |
| $800 to $1,499 | 170 (45.7%) | 15 (13.2%) |
| $800 to $1,499 | 202 (54.3%) | 27 (23.7%) |
| Total | 372 (100.0%) | 114 (100.0%) |
Health & Disability in Lenape Heights
Health Insurance Coverage by Age in Lenape Heights
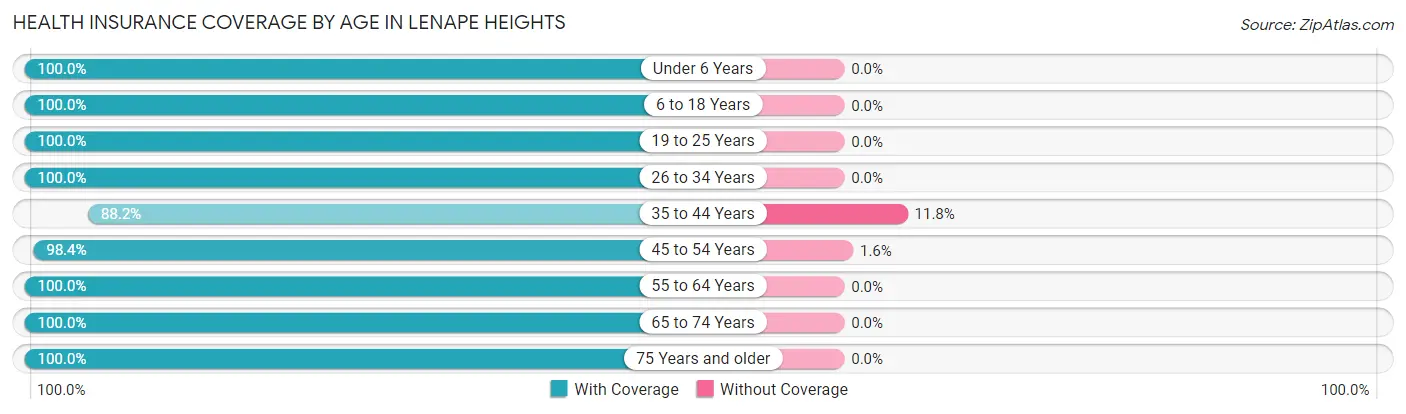
| Age Bracket | With Coverage | Without Coverage |
| Under 6 Years | 63 (100.0%) | 0 (0.0%) |
| 6 to 18 Years | 185 (100.0%) | 0 (0.0%) |
| 19 to 25 Years | 31 (100.0%) | 0 (0.0%) |
| 26 to 34 Years | 156 (100.0%) | 0 (0.0%) |
| 35 to 44 Years | 127 (88.2%) | 17 (11.8%) |
| 45 to 54 Years | 361 (98.4%) | 6 (1.6%) |
| 55 to 64 Years | 100 (100.0%) | 0 (0.0%) |
| 65 to 74 Years | 109 (100.0%) | 0 (0.0%) |
| 75 Years and older | 166 (100.0%) | 0 (0.0%) |
| Total | 1,298 (98.3%) | 23 (1.7%) |
Health Insurance Coverage by Citizenship Status in Lenape Heights
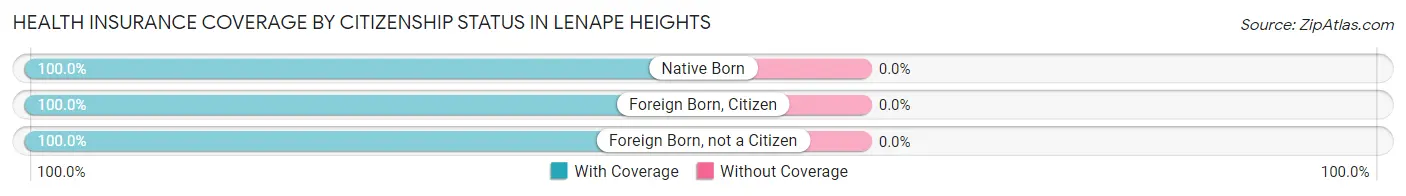
| Citizenship Status | With Coverage | Without Coverage |
| Native Born | 63 (100.0%) | 0 (0.0%) |
| Foreign Born, Citizen | 185 (100.0%) | 0 (0.0%) |
| Foreign Born, not a Citizen | 31 (100.0%) | 0 (0.0%) |
Health Insurance Coverage by Household Income in Lenape Heights
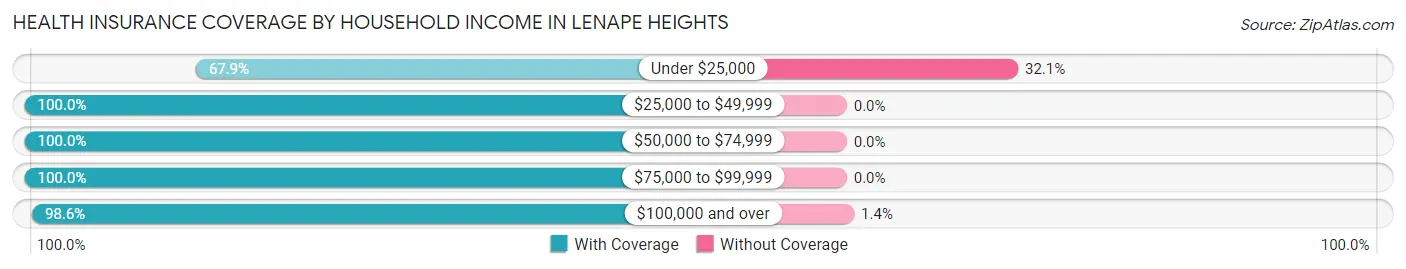
| Household Income | With Coverage | Without Coverage |
| Under $25,000 | 36 (67.9%) | 17 (32.1%) |
| $25,000 to $49,999 | 270 (100.0%) | 0 (0.0%) |
| $50,000 to $74,999 | 345 (100.0%) | 0 (0.0%) |
| $75,000 to $99,999 | 217 (100.0%) | 0 (0.0%) |
| $100,000 and over | 430 (98.6%) | 6 (1.4%) |
Public vs Private Health Insurance Coverage by Age in Lenape Heights
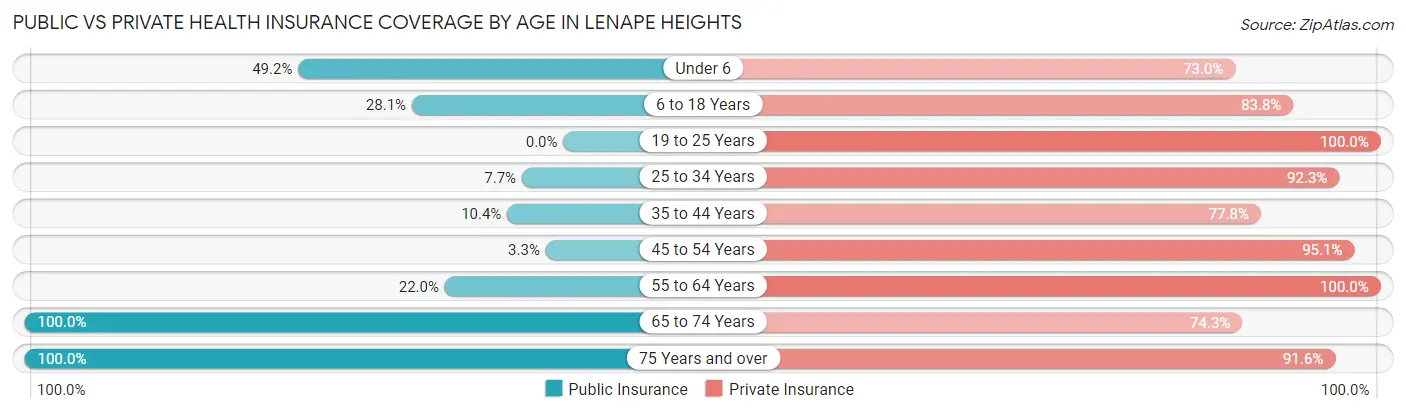
| Age Bracket | Public Insurance | Private Insurance |
| Under 6 | 31 (49.2%) | 46 (73.0%) |
| 6 to 18 Years | 52 (28.1%) | 155 (83.8%) |
| 19 to 25 Years | 0 (0.0%) | 31 (100.0%) |
| 25 to 34 Years | 12 (7.7%) | 144 (92.3%) |
| 35 to 44 Years | 15 (10.4%) | 112 (77.8%) |
| 45 to 54 Years | 12 (3.3%) | 349 (95.1%) |
| 55 to 64 Years | 22 (22.0%) | 100 (100.0%) |
| 65 to 74 Years | 109 (100.0%) | 81 (74.3%) |
| 75 Years and over | 166 (100.0%) | 152 (91.6%) |
| Total | 419 (31.7%) | 1,170 (88.6%) |
Disability Status by Sex by Age in Lenape Heights
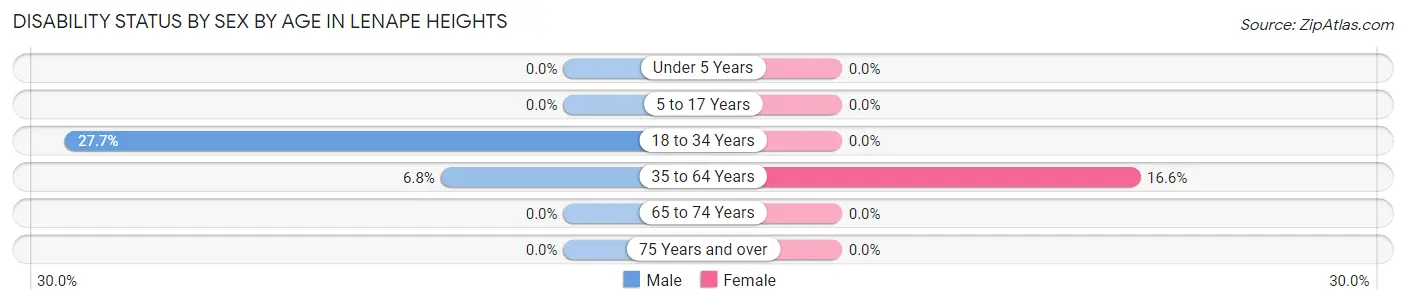
| Age Bracket | Male | Female |
| Under 5 Years | 0 (0.0%) | 0 (0.0%) |
| 5 to 17 Years | 0 (0.0%) | 0 (0.0%) |
| 18 to 34 Years | 43 (27.7%) | 0 (0.0%) |
| 35 to 64 Years | 22 (6.8%) | 48 (16.6%) |
| 65 to 74 Years | 0 (0.0%) | 0 (0.0%) |
| 75 Years and over | 0 (0.0%) | 0 (0.0%) |
Disability Class by Sex by Age in Lenape Heights
Disability Class: Hearing Difficulty
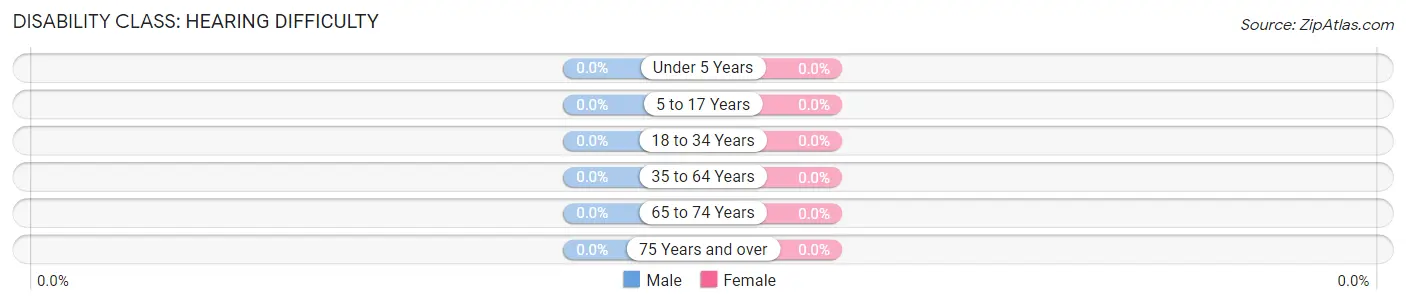
| Age Bracket | Male | Female |
| Under 5 Years | 0 (0.0%) | 0 (0.0%) |
| 5 to 17 Years | 0 (0.0%) | 0 (0.0%) |
| 18 to 34 Years | 0 (0.0%) | 0 (0.0%) |
| 35 to 64 Years | 0 (0.0%) | 0 (0.0%) |
| 65 to 74 Years | 0 (0.0%) | 0 (0.0%) |
| 75 Years and over | 0 (0.0%) | 0 (0.0%) |
Disability Class: Vision Difficulty
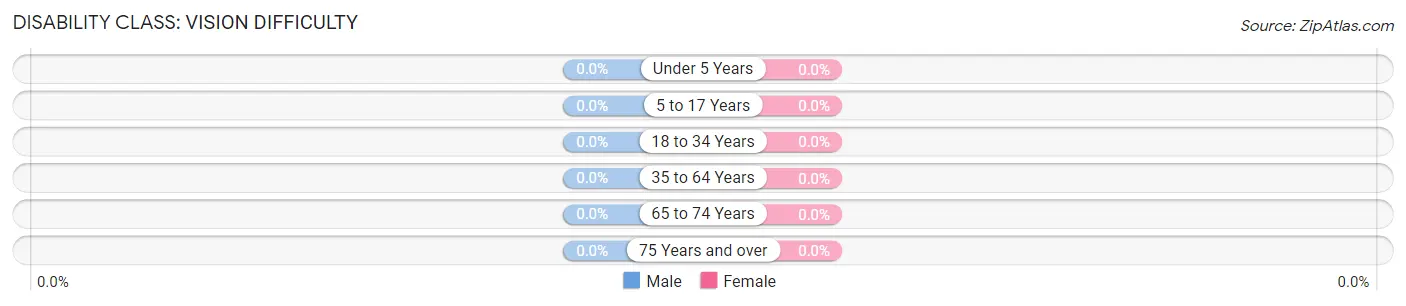
| Age Bracket | Male | Female |
| Under 5 Years | 0 (0.0%) | 0 (0.0%) |
| 5 to 17 Years | 0 (0.0%) | 0 (0.0%) |
| 18 to 34 Years | 0 (0.0%) | 0 (0.0%) |
| 35 to 64 Years | 0 (0.0%) | 0 (0.0%) |
| 65 to 74 Years | 0 (0.0%) | 0 (0.0%) |
| 75 Years and over | 0 (0.0%) | 0 (0.0%) |
Disability Class: Cognitive Difficulty
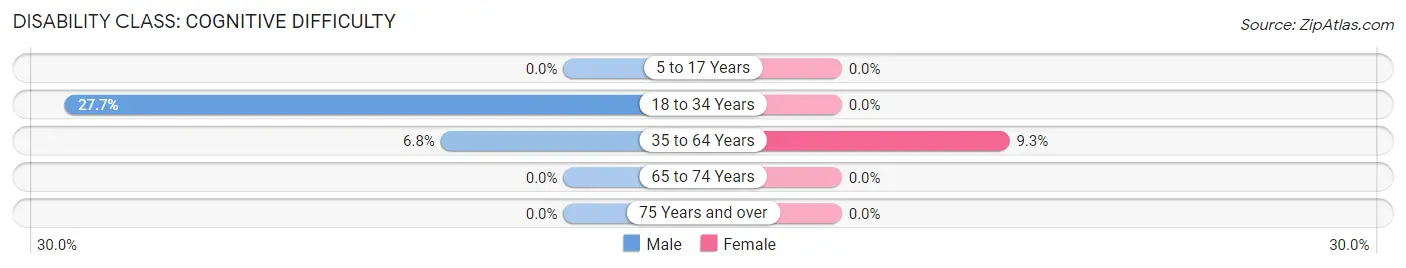
| Age Bracket | Male | Female |
| 5 to 17 Years | 0 (0.0%) | 0 (0.0%) |
| 18 to 34 Years | 43 (27.7%) | 0 (0.0%) |
| 35 to 64 Years | 22 (6.8%) | 27 (9.3%) |
| 65 to 74 Years | 0 (0.0%) | 0 (0.0%) |
| 75 Years and over | 0 (0.0%) | 0 (0.0%) |
Disability Class: Ambulatory Difficulty
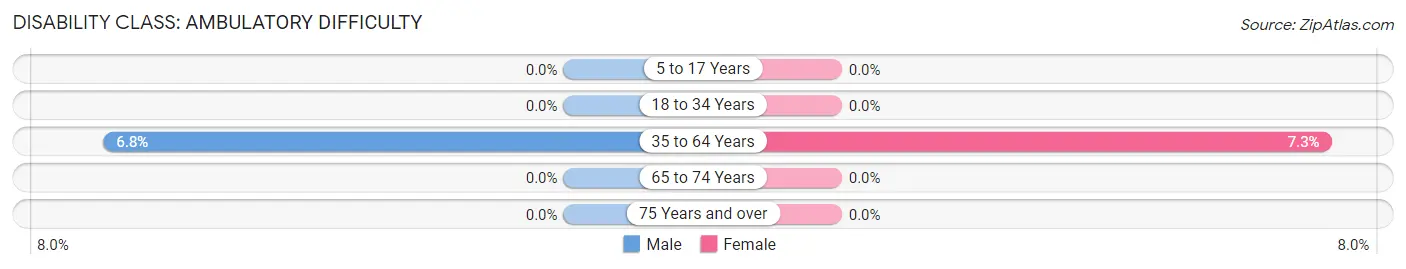
| Age Bracket | Male | Female |
| 5 to 17 Years | 0 (0.0%) | 0 (0.0%) |
| 18 to 34 Years | 0 (0.0%) | 0 (0.0%) |
| 35 to 64 Years | 22 (6.8%) | 21 (7.3%) |
| 65 to 74 Years | 0 (0.0%) | 0 (0.0%) |
| 75 Years and over | 0 (0.0%) | 0 (0.0%) |
Disability Class: Self-Care Difficulty
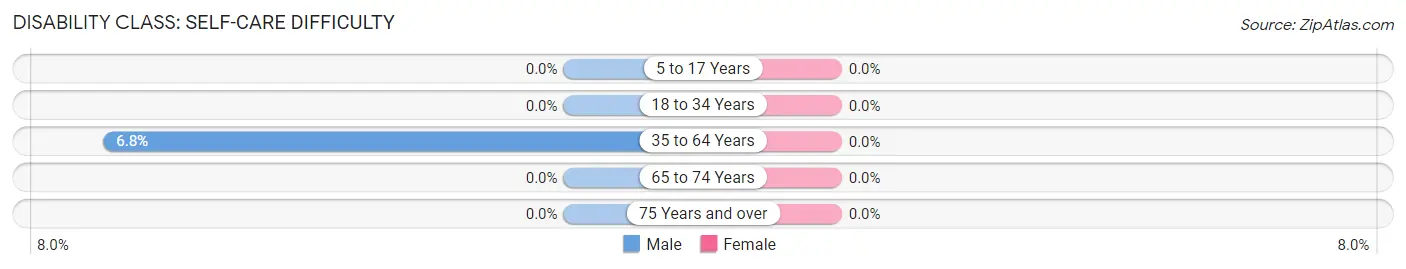
| Age Bracket | Male | Female |
| 5 to 17 Years | 0 (0.0%) | 0 (0.0%) |
| 18 to 34 Years | 0 (0.0%) | 0 (0.0%) |
| 35 to 64 Years | 22 (6.8%) | 0 (0.0%) |
| 65 to 74 Years | 0 (0.0%) | 0 (0.0%) |
| 75 Years and over | 0 (0.0%) | 0 (0.0%) |
Technology Access in Lenape Heights
Computing Device Access in Lenape Heights
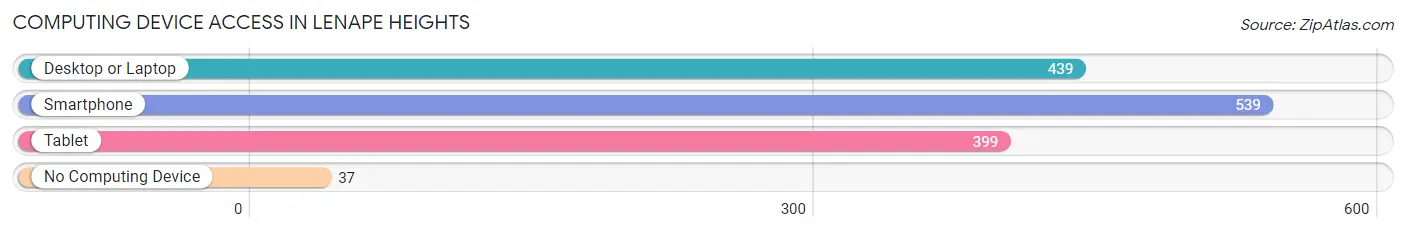
| Device Type | # Households | % Households |
| Desktop or Laptop | 439 | 72.2% |
| Smartphone | 539 | 88.6% |
| Tablet | 399 | 65.6% |
| No Computing Device | 37 | 6.1% |
| Total | 608 | 100.0% |
Internet Access in Lenape Heights
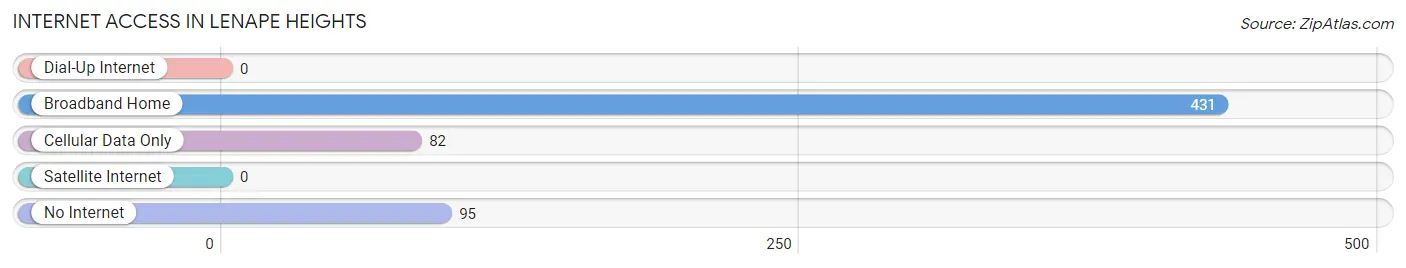
| Internet Type | # Households | % Households |
| Dial-Up Internet | 0 | 0.0% |
| Broadband Home | 431 | 70.9% |
| Cellular Data Only | 82 | 13.5% |
| Satellite Internet | 0 | 0.0% |
| No Internet | 95 | 15.6% |
| Total | 608 | 100.0% |
Lenape Heights Summary
History
The area now known as Lenape Heights, Pennsylvania was originally inhabited by the Lenape Native American tribe. The Lenape were a peaceful tribe that lived in the area for centuries before the arrival of European settlers. The first Europeans to settle in the area were Dutch and Swedish settlers in the late 1600s. The area was then part of the Province of Pennsylvania, which was established by William Penn in 1682.
The area was first known as "Lenape Heights" in 1790, when the first post office was established in the area. The name was chosen to honor the Lenape tribe that had once inhabited the area.
In the early 1800s, the area was primarily agricultural, with small farms and orchards. The area was also home to several small businesses, including a sawmill, a gristmill, and a tannery.
In the late 1800s, the area began to experience rapid growth and development. The Pennsylvania Railroad was built through the area in 1871, connecting Lenape Heights to the larger cities of Pittsburgh and Philadelphia. This allowed for increased trade and commerce in the area, and the population began to grow.
In the early 1900s, the area experienced a boom in industry. Several coal mines were opened in the area, and the population continued to grow. The area also became home to several small businesses, including a brickyard, a furniture factory, and a canning factory.
In the mid-1900s, the area began to experience a decline in industry. The coal mines closed, and the population began to decline. However, the area remained a popular tourist destination, and several resorts were built in the area.
Geography
Lenape Heights is located in western Pennsylvania, in the Allegheny Mountains. The area is approximately 25 miles east of Pittsburgh and 50 miles west of Philadelphia. The area is mostly rural, with rolling hills and forests. The area is also home to several small lakes and streams.
The climate in Lenape Heights is temperate, with cold winters and warm summers. The average annual temperature is around 50 degrees Fahrenheit. The area receives an average of 40 inches of precipitation per year.
Economy
The economy of Lenape Heights is primarily based on tourism. The area is home to several resorts and recreational activities, including skiing, hiking, and fishing. The area is also home to several small businesses, including restaurants, retail stores, and service providers.
The area is also home to several small farms, which produce a variety of crops, including corn, soybeans, and hay. The area is also home to several wineries, which produce a variety of wines.
Demographics
As of the 2010 census, the population of Lenape Heights was 1,845. The population is primarily white (97.2%), with a small percentage of African Americans (1.2%) and Hispanics (1.6%). The median household income is $45,000, and the median home value is $150,000. The area is home to several small towns, including Lenape Heights, New Florence, and Stahlstown.
Common Questions
What is Per Capita Income in Lenape Heights?
Per Capita income in Lenape Heights is $43,673.
What is the Median Family Income in Lenape Heights?
Median Family Income in Lenape Heights is $98,313.
What is the Median Household income in Lenape Heights?
Median Household Income in Lenape Heights is $70,700.
What is Inequality or Gini Index in Lenape Heights?
Inequality or Gini Index in Lenape Heights is 0.34.
What is the Total Population of Lenape Heights?
Total Population of Lenape Heights is 1,321.
What is the Total Male Population of Lenape Heights?
Total Male Population of Lenape Heights is 781.
What is the Total Female Population of Lenape Heights?
Total Female Population of Lenape Heights is 540.
What is the Ratio of Males per 100 Females in Lenape Heights?
There are 144.63 Males per 100 Females in Lenape Heights.
What is the Ratio of Females per 100 Males in Lenape Heights?
There are 69.14 Females per 100 Males in Lenape Heights.
What is the Median Population Age in Lenape Heights?
Median Population Age in Lenape Heights is 48.5 Years.
What is the Average Family Size in Lenape Heights
Average Family Size in Lenape Heights is 2.5 People.
What is the Average Household Size in Lenape Heights
Average Household Size in Lenape Heights is 2.2 People.
How Large is the Labor Force in Lenape Heights?
There are 752 People in the Labor Forcein in Lenape Heights.
What is the Percentage of People in the Labor Force in Lenape Heights?
64.0% of People are in the Labor Force in Lenape Heights.
What is the Unemployment Rate in Lenape Heights?
Unemployment Rate in Lenape Heights is 2.1%.