Leesport borough, PA Map & Demographics
Leesport borough Overview
$37,474
PER CAPITA INCOME
$99,554
AVG FAMILY INCOME
$91,417
AVG HOUSEHOLD INCOME
18.5%
WAGE / INCOME GAP [ % ]
81.5¢/ $1
WAGE / INCOME GAP [ $ ]
0.41
INEQUALITY / GINI INDEX
2,139
TOTAL POPULATION
1,205
MALE POPULATION
934
FEMALE POPULATION
129.01
MALES / 100 FEMALES
77.51
FEMALES / 100 MALES
37.9
MEDIAN AGE
3.4
AVG FAMILY SIZE
2.9
AVG HOUSEHOLD SIZE
1,246
LABOR FORCE [ PEOPLE ]
70.1%
PERCENT IN LABOR FORCE
6.2%
UNEMPLOYMENT RATE
Income in Leesport borough
Income Overview in Leesport borough
Per Capita Income in Leesport borough is $37,474, while median incomes of families and households are $99,554 and $91,417 respectively.
| Characteristic | Number | Measure |
| Per Capita Income | 2,139 | $37,474 |
| Median Family Income | 533 | $99,554 |
| Mean Family Income | 533 | $120,194 |
| Median Household Income | 736 | $91,417 |
| Mean Household Income | 736 | $104,262 |
| Income Deficit | 533 | $0 |
| Wage / Income Gap (%) | 2,139 | 18.52% |
| Wage / Income Gap ($) | 2,139 | 81.48¢ per $1 |
| Gini / Inequality Index | 2,139 | 0.41 |
Earnings by Sex in Leesport borough
Average Earnings in Leesport borough are $45,390, $47,471 for men and $38,681 for women, a difference of 18.5%.
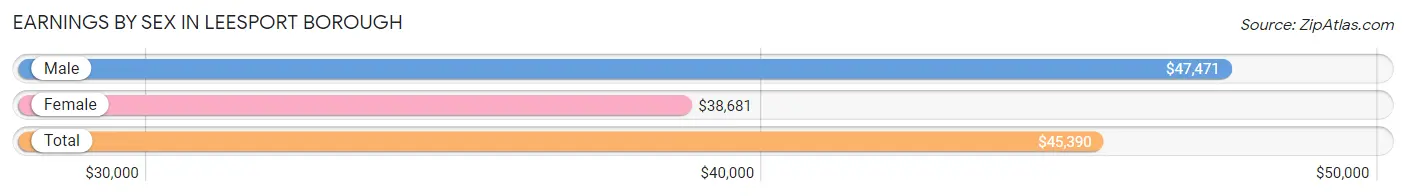
| Sex | Number | Average Earnings |
| Male | 768 (56.4%) | $47,471 |
| Female | 593 (43.6%) | $38,681 |
| Total | 1,361 (100.0%) | $45,390 |
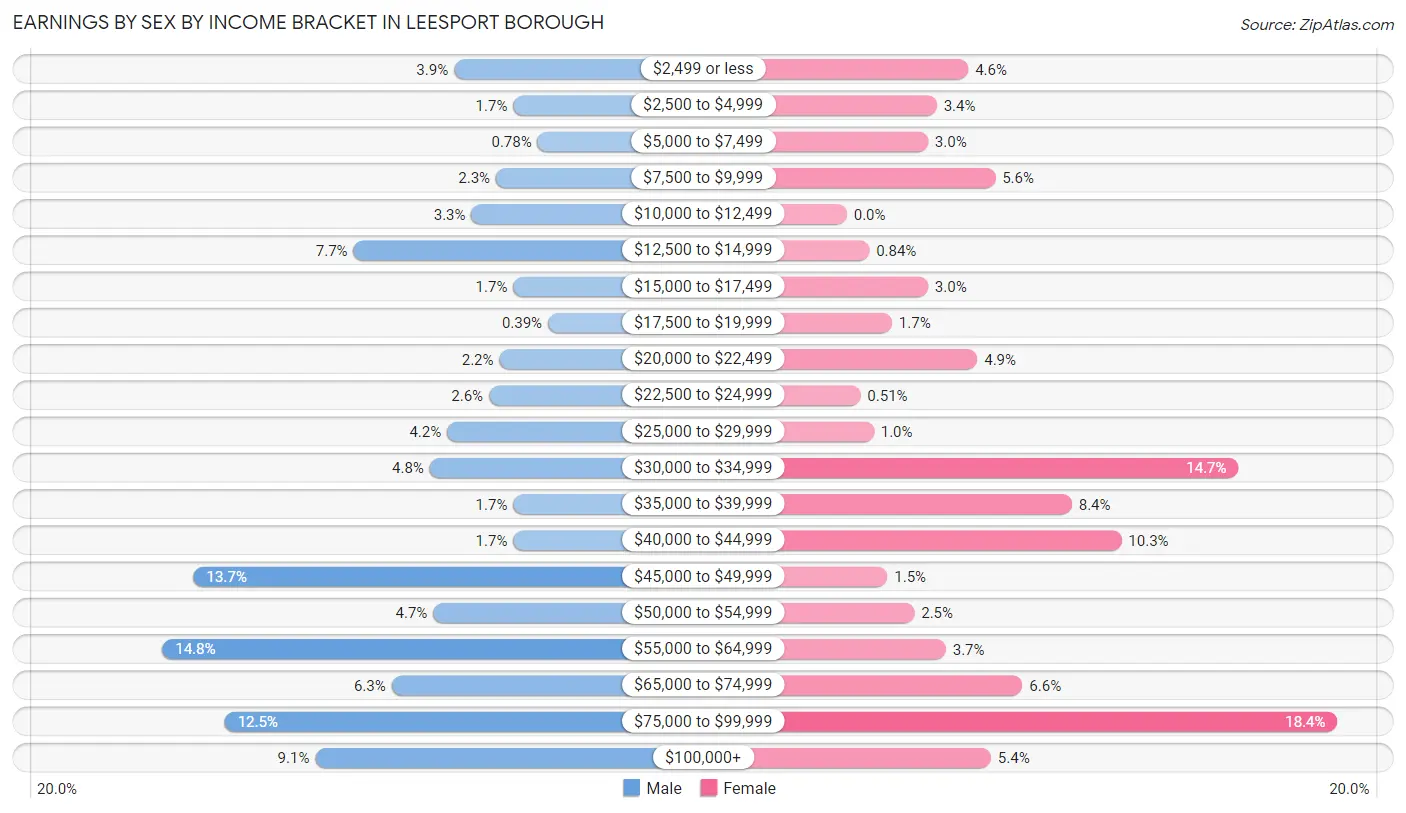
Earnings by Sex by Income Bracket in Leesport borough
The most common earnings brackets in Leesport borough are $55,000 to $64,999 for men (114 | 14.8%) and $75,000 to $99,999 for women (109 | 18.4%).
| Income | Male | Female |
| $2,499 or less | 30 (3.9%) | 27 (4.5%) |
| $2,500 to $4,999 | 13 (1.7%) | 20 (3.4%) |
| $5,000 to $7,499 | 6 (0.8%) | 18 (3.0%) |
| $7,500 to $9,999 | 18 (2.3%) | 33 (5.6%) |
| $10,000 to $12,499 | 25 (3.3%) | 0 (0.0%) |
| $12,500 to $14,999 | 59 (7.7%) | 5 (0.8%) |
| $15,000 to $17,499 | 13 (1.7%) | 18 (3.0%) |
| $17,500 to $19,999 | 3 (0.4%) | 10 (1.7%) |
| $20,000 to $22,499 | 17 (2.2%) | 29 (4.9%) |
| $22,500 to $24,999 | 20 (2.6%) | 3 (0.5%) |
| $25,000 to $29,999 | 32 (4.2%) | 6 (1.0%) |
| $30,000 to $34,999 | 37 (4.8%) | 87 (14.7%) |
| $35,000 to $39,999 | 13 (1.7%) | 50 (8.4%) |
| $40,000 to $44,999 | 13 (1.7%) | 61 (10.3%) |
| $45,000 to $49,999 | 105 (13.7%) | 9 (1.5%) |
| $50,000 to $54,999 | 36 (4.7%) | 15 (2.5%) |
| $55,000 to $64,999 | 114 (14.8%) | 22 (3.7%) |
| $65,000 to $74,999 | 48 (6.2%) | 39 (6.6%) |
| $75,000 to $99,999 | 96 (12.5%) | 109 (18.4%) |
| $100,000+ | 70 (9.1%) | 32 (5.4%) |
| Total | 768 (100.0%) | 593 (100.0%) |
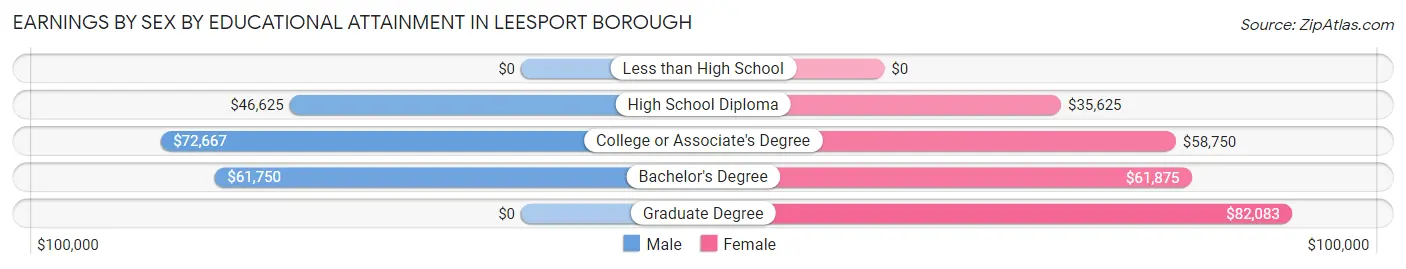
Earnings by Sex by Educational Attainment in Leesport borough
Average earnings in Leesport borough are $56,685 for men and $44,570 for women, a difference of 21.4%. Men with an educational attainment of college or associate's degree enjoy the highest average annual earnings of $72,667, while those with high school diploma education earn the least with $46,625. Women with an educational attainment of graduate degree earn the most with the average annual earnings of $82,083, while those with high school diploma education have the smallest earnings of $35,625.
| Educational Attainment | Male Income | Female Income |
| Less than High School | - | - |
| High School Diploma | $46,625 | $35,625 |
| College or Associate's Degree | $72,667 | $58,750 |
| Bachelor's Degree | $61,750 | $61,875 |
| Graduate Degree | - | - |
| Total | $56,685 | $44,570 |
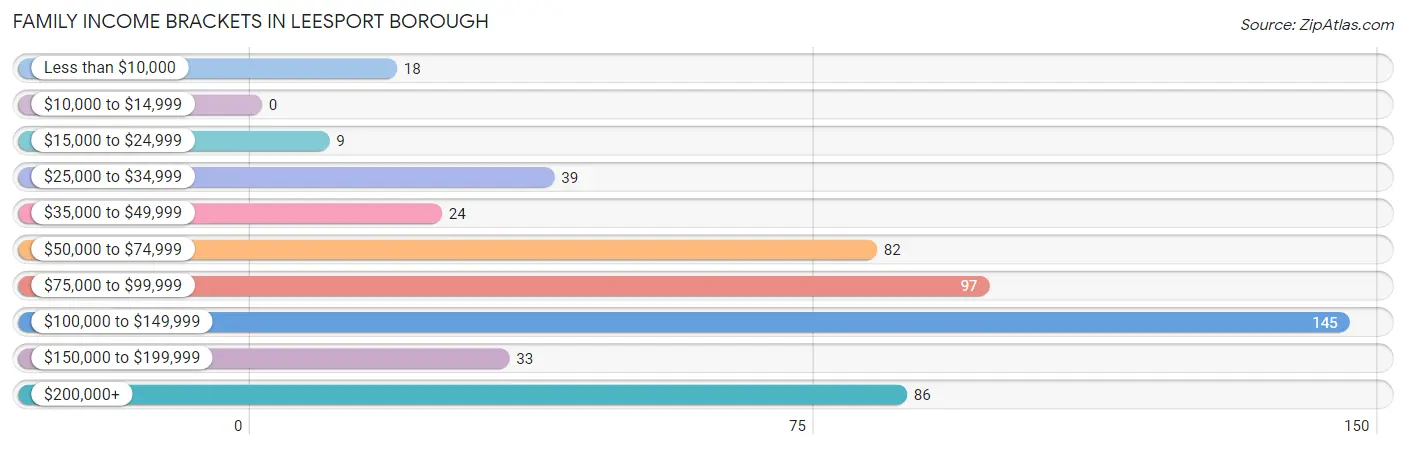
Family Income in Leesport borough
Family Income Brackets in Leesport borough
According to the Leesport borough family income data, there are 145 families falling into the $100,000 to $149,999 income range, which is the most common income bracket and makes up 27.2% of all families.
| Income Bracket | # Families | % Families |
| Less than $10,000 | 18 | 3.4% |
| $10,000 to $14,999 | 0 | 0.0% |
| $15,000 to $24,999 | 9 | 1.7% |
| $25,000 to $34,999 | 39 | 7.3% |
| $35,000 to $49,999 | 24 | 4.5% |
| $50,000 to $74,999 | 82 | 15.4% |
| $75,000 to $99,999 | 97 | 18.2% |
| $100,000 to $149,999 | 145 | 27.2% |
| $150,000 to $199,999 | 33 | 6.2% |
| $200,000+ | 86 | 16.1% |
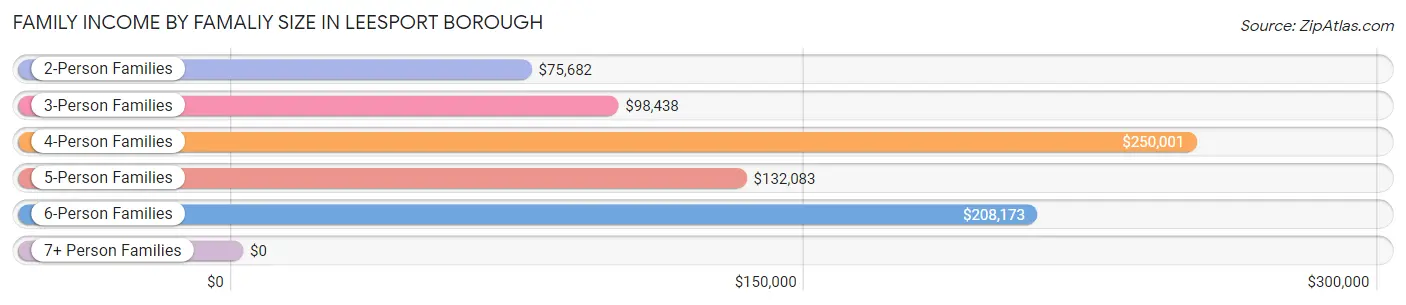
Family Income by Famaliy Size in Leesport borough
4-person families (89 | 16.7%) account for the highest median family income in Leesport borough with $250,001 per family, while 4-person families (89 | 16.7%) have the highest median income of $62,500 per family member.
| Income Bracket | # Families | Median Income |
| 2-Person Families | 218 (40.9%) | $75,682 |
| 3-Person Families | 159 (29.8%) | $98,438 |
| 4-Person Families | 89 (16.7%) | $250,001 |
| 5-Person Families | 25 (4.7%) | $132,083 |
| 6-Person Families | 27 (5.1%) | $208,173 |
| 7+ Person Families | 15 (2.8%) | $0 |
| Total | 533 (100.0%) | $99,554 |
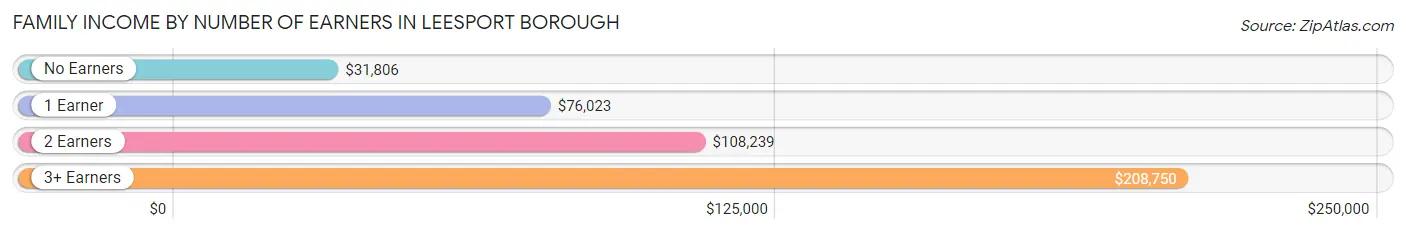
Family Income by Number of Earners in Leesport borough
The median family income in Leesport borough is $99,554, with families comprising 3+ earners (133) having the highest median family income of $208,750, while families with no earners (60) have the lowest median family income of $31,806, accounting for 24.9% and 11.3% of families, respectively.
| Number of Earners | # Families | Median Income |
| No Earners | 60 (11.3%) | $31,806 |
| 1 Earner | 157 (29.5%) | $76,023 |
| 2 Earners | 183 (34.3%) | $108,239 |
| 3+ Earners | 133 (24.9%) | $208,750 |
| Total | 533 (100.0%) | $99,554 |
Household Income in Leesport borough
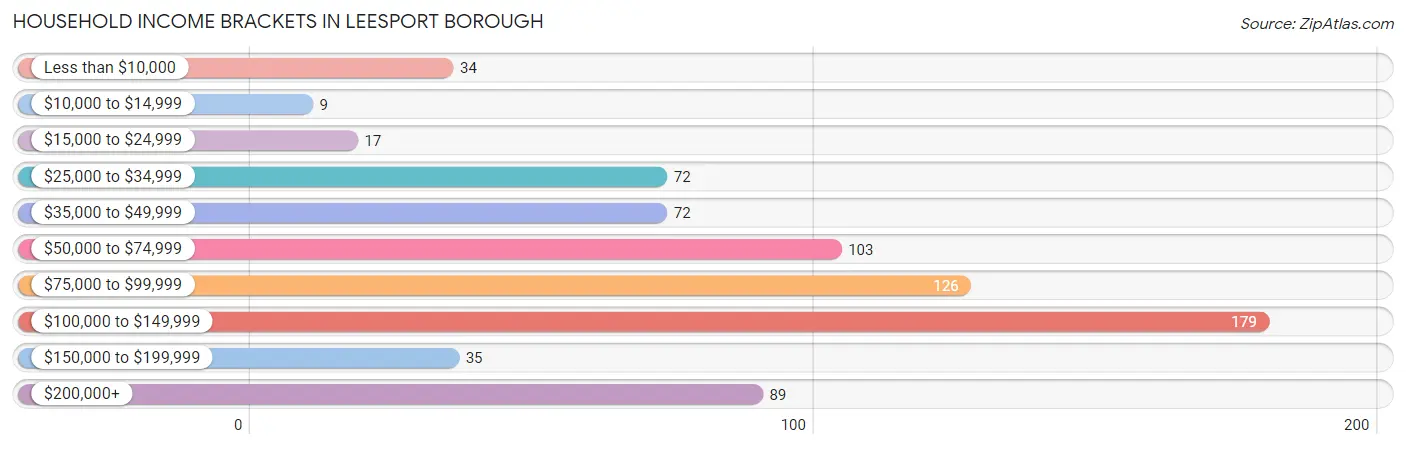
Household Income Brackets in Leesport borough
With 179 households falling in the category, the $100,000 to $149,999 income range is the most frequent in Leesport borough, accounting for 24.3% of all households. In contrast, only 9 households (1.2%) fall into the $10,000 to $14,999 income bracket, making it the least populous group.
| Income Bracket | # Households | % Households |
| Less than $10,000 | 34 | 4.6% |
| $10,000 to $14,999 | 9 | 1.2% |
| $15,000 to $24,999 | 17 | 2.3% |
| $25,000 to $34,999 | 72 | 9.8% |
| $35,000 to $49,999 | 72 | 9.8% |
| $50,000 to $74,999 | 103 | 14.0% |
| $75,000 to $99,999 | 126 | 17.1% |
| $100,000 to $149,999 | 179 | 24.3% |
| $150,000 to $199,999 | 35 | 4.8% |
| $200,000+ | 89 | 12.1% |
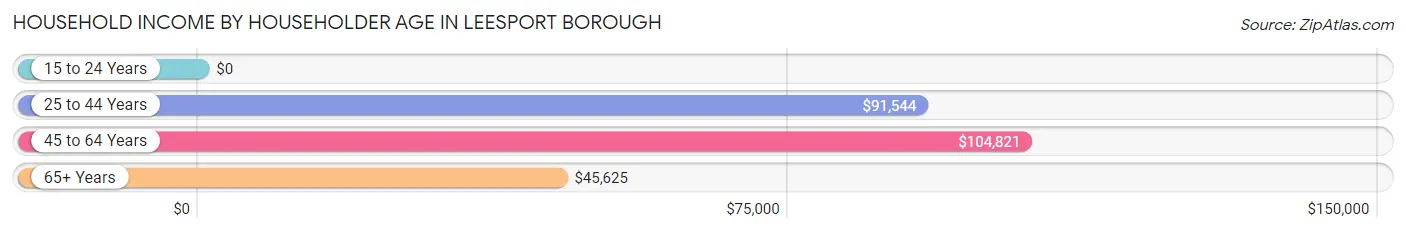
Household Income by Householder Age in Leesport borough
The median household income in Leesport borough is $91,417, with the highest median household income of $104,821 found in the 45 to 64 years age bracket for the primary householder. A total of 344 households (46.7%) fall into this category. Meanwhile, the 15 to 24 years age bracket for the primary householder has the lowest median household income of $0, with 6 households (0.8%) in this group.
| Income Bracket | # Households | Median Income |
| 15 to 24 Years | 6 (0.8%) | $0 |
| 25 to 44 Years | 261 (35.5%) | $91,544 |
| 45 to 64 Years | 344 (46.7%) | $104,821 |
| 65+ Years | 125 (17.0%) | $45,625 |
| Total | 736 (100.0%) | $91,417 |
Poverty in Leesport borough
Income Below Poverty by Sex and Age in Leesport borough
With 6.6% poverty level for males and 5.1% for females among the residents of Leesport borough, 15 year old males and 75 year old and over females are the most vulnerable to poverty, with 3 males (23.1%) and 16 females (25.0%) in their respective age groups living below the poverty level.
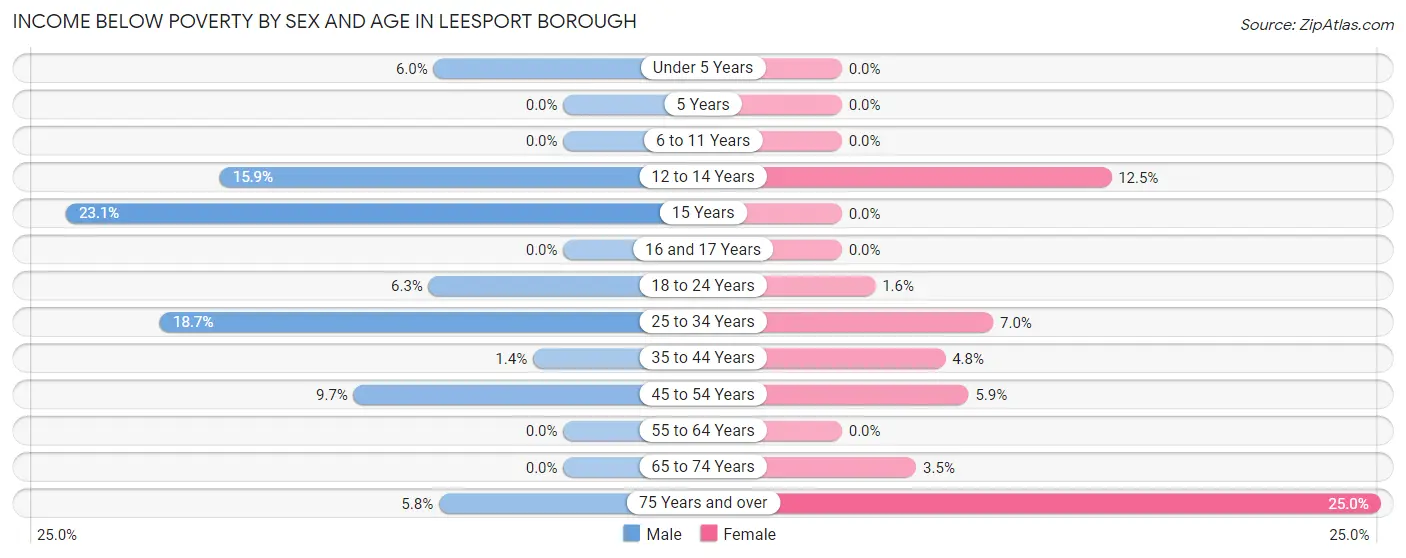
| Age Bracket | Male | Female |
| Under 5 Years | 5 (6.0%) | 0 (0.0%) |
| 5 Years | 0 (0.0%) | 0 (0.0%) |
| 6 to 11 Years | 0 (0.0%) | 0 (0.0%) |
| 12 to 14 Years | 11 (15.9%) | 3 (12.5%) |
| 15 Years | 3 (23.1%) | 0 (0.0%) |
| 16 and 17 Years | 0 (0.0%) | 0 (0.0%) |
| 18 to 24 Years | 13 (6.2%) | 2 (1.5%) |
| 25 to 34 Years | 32 (18.7%) | 8 (7.0%) |
| 35 to 44 Years | 2 (1.4%) | 6 (4.8%) |
| 45 to 54 Years | 11 (9.7%) | 10 (5.9%) |
| 55 to 64 Years | 0 (0.0%) | 0 (0.0%) |
| 65 to 74 Years | 0 (0.0%) | 2 (3.5%) |
| 75 Years and over | 3 (5.8%) | 16 (25.0%) |
| Total | 80 (6.6%) | 47 (5.1%) |
Income Above Poverty by Sex and Age in Leesport borough
According to the poverty statistics in Leesport borough, males aged 5 years and females aged under 5 years are the age groups that are most secure financially, with 100.0% of males and 100.0% of females in these age groups living above the poverty line.
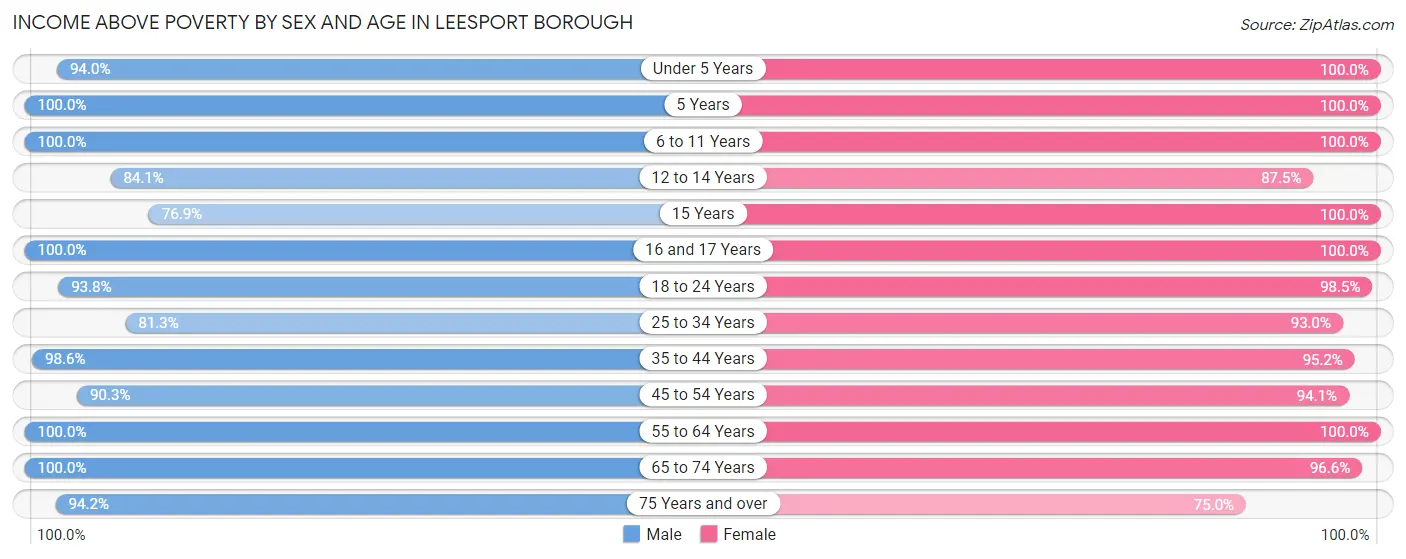
| Age Bracket | Male | Female |
| Under 5 Years | 78 (94.0%) | 22 (100.0%) |
| 5 Years | 15 (100.0%) | 7 (100.0%) |
| 6 to 11 Years | 65 (100.0%) | 54 (100.0%) |
| 12 to 14 Years | 58 (84.1%) | 21 (87.5%) |
| 15 Years | 10 (76.9%) | 5 (100.0%) |
| 16 and 17 Years | 17 (100.0%) | 16 (100.0%) |
| 18 to 24 Years | 195 (93.8%) | 127 (98.5%) |
| 25 to 34 Years | 139 (81.3%) | 106 (93.0%) |
| 35 to 44 Years | 140 (98.6%) | 119 (95.2%) |
| 45 to 54 Years | 102 (90.3%) | 160 (94.1%) |
| 55 to 64 Years | 221 (100.0%) | 142 (100.0%) |
| 65 to 74 Years | 36 (100.0%) | 56 (96.6%) |
| 75 Years and over | 49 (94.2%) | 48 (75.0%) |
| Total | 1,125 (93.4%) | 883 (95.0%) |
Income Below Poverty Among Married-Couple Families in Leesport borough
The poverty statistics for married-couple families in Leesport borough show that 1.3% or 5 of the total 400 families live below the poverty line. Families with no children have the highest poverty rate of 1.9%, comprising of 5 families. On the other hand, families with 1 or 2 children have the lowest poverty rate of 0.0%, which includes 0 families.
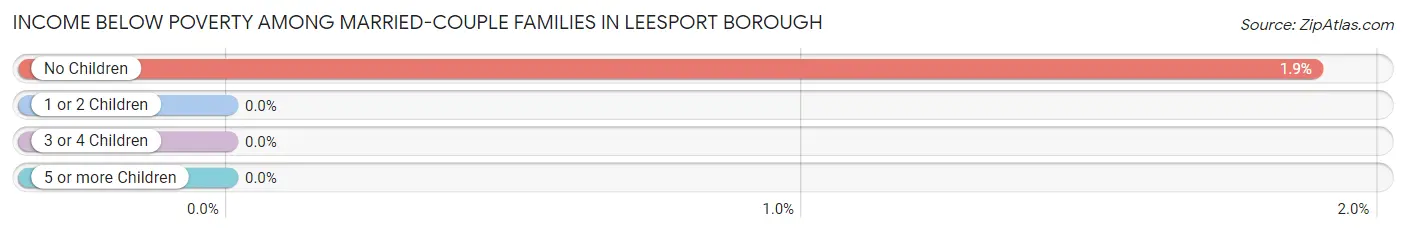
| Children | Above Poverty | Below Poverty |
| No Children | 259 (98.1%) | 5 (1.9%) |
| 1 or 2 Children | 106 (100.0%) | 0 (0.0%) |
| 3 or 4 Children | 30 (100.0%) | 0 (0.0%) |
| 5 or more Children | 0 (0.0%) | 0 (0.0%) |
| Total | 395 (98.8%) | 5 (1.3%) |
Income Below Poverty Among Single-Parent Households in Leesport borough
According to the poverty data in Leesport borough, 11.6% or 5 single-father households and 12.2% or 11 single-mother households are living below the poverty line. Among single-father households, those with 1 or 2 children have the highest poverty rate, with 5 households (22.7%) experiencing poverty. Likewise, among single-mother households, those with 1 or 2 children have the highest poverty rate, with 11 households (16.4%) falling below the poverty line.
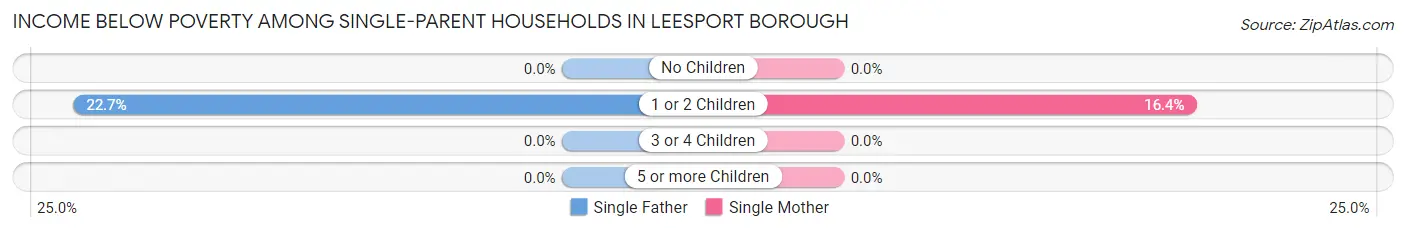
| Children | Single Father | Single Mother |
| No Children | 0 (0.0%) | 0 (0.0%) |
| 1 or 2 Children | 5 (22.7%) | 11 (16.4%) |
| 3 or 4 Children | 0 (0.0%) | 0 (0.0%) |
| 5 or more Children | 0 (0.0%) | 0 (0.0%) |
| Total | 5 (11.6%) | 11 (12.2%) |
Income Below Poverty Among Married-Couple vs Single-Parent Households in Leesport borough
The poverty data for Leesport borough shows that 5 of the married-couple family households (1.3%) and 16 of the single-parent households (12.0%) are living below the poverty level. Within the married-couple family households, those with no children have the highest poverty rate, with 5 households (1.9%) falling below the poverty line. Among the single-parent households, those with 1 or 2 children have the highest poverty rate, with 16 household (18.0%) living below poverty.
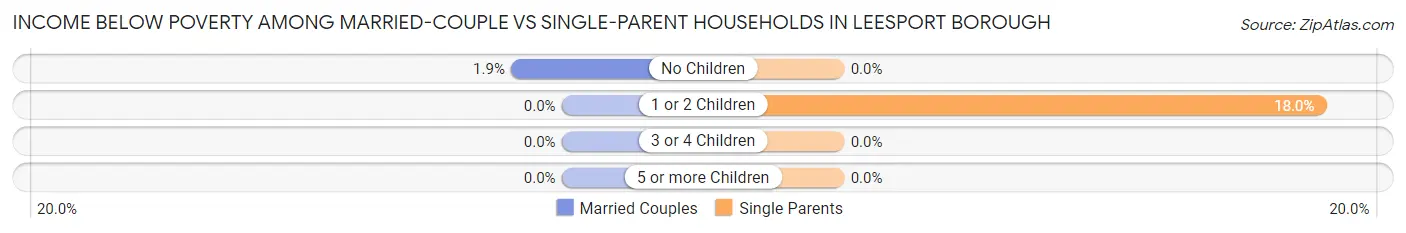
| Children | Married-Couple Families | Single-Parent Households |
| No Children | 5 (1.9%) | 0 (0.0%) |
| 1 or 2 Children | 0 (0.0%) | 16 (18.0%) |
| 3 or 4 Children | 0 (0.0%) | 0 (0.0%) |
| 5 or more Children | 0 (0.0%) | 0 (0.0%) |
| Total | 5 (1.3%) | 16 (12.0%) |
Race in Leesport borough
The most populous races in Leesport borough are White / Caucasian (1,915 | 89.5%), Hispanic or Latino (140 | 6.6%), and Two or more Races (128 | 6.0%).
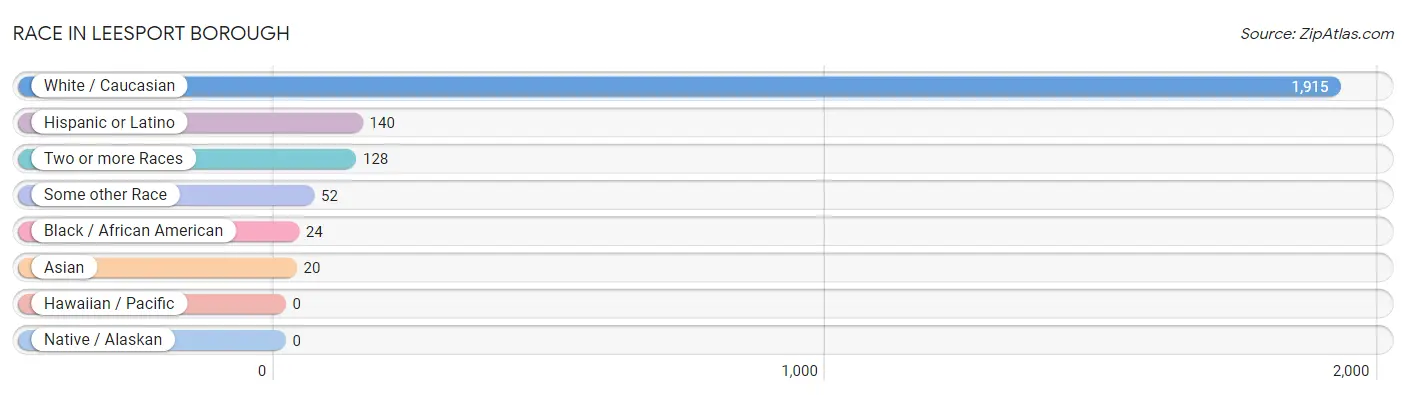
| Race | # Population | % Population |
| Asian | 20 | 0.9% |
| Black / African American | 24 | 1.1% |
| Hawaiian / Pacific | 0 | 0.0% |
| Hispanic or Latino | 140 | 6.6% |
| Native / Alaskan | 0 | 0.0% |
| White / Caucasian | 1,915 | 89.5% |
| Two or more Races | 128 | 6.0% |
| Some other Race | 52 | 2.4% |
| Total | 2,139 | 100.0% |
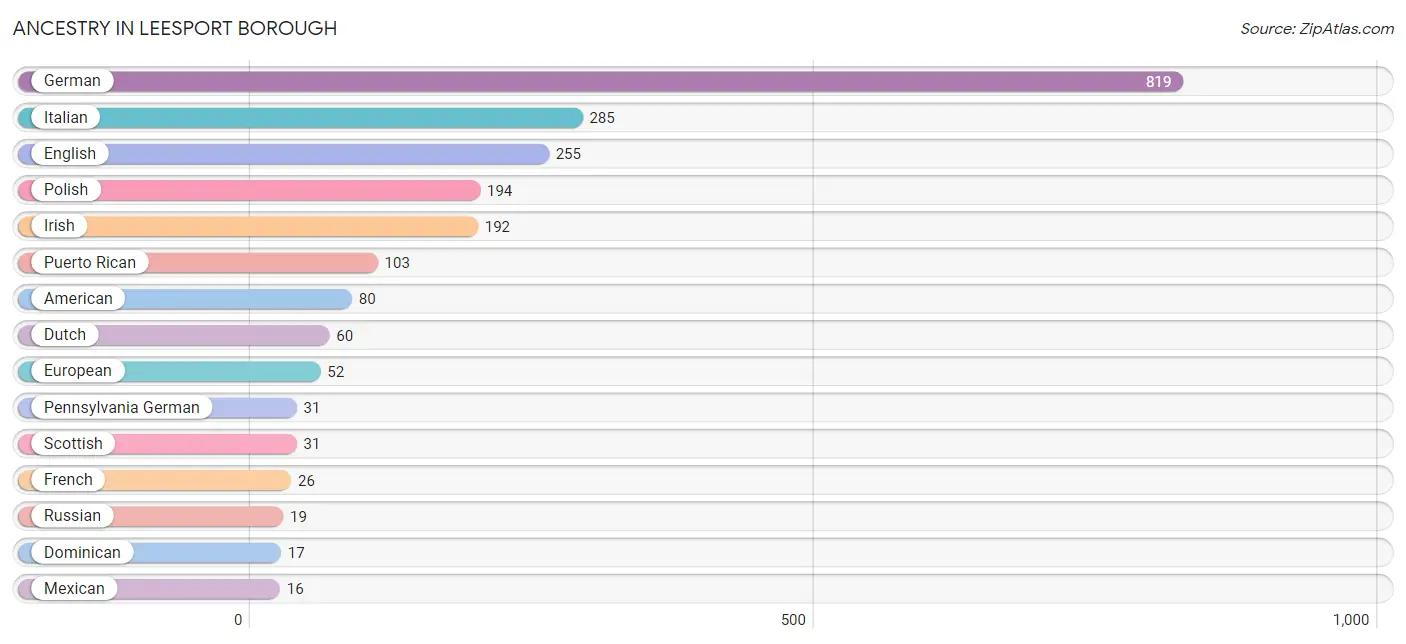
Ancestry in Leesport borough
The most populous ancestries reported in Leesport borough are German (819 | 38.3%), Italian (285 | 13.3%), English (255 | 11.9%), Polish (194 | 9.1%), and Irish (192 | 9.0%), together accounting for 81.6% of all Leesport borough residents.
| Ancestry | # Population | % Population |
| African | 5 | 0.2% |
| American | 80 | 3.7% |
| Arab | 5 | 0.2% |
| Austrian | 7 | 0.3% |
| Blackfeet | 13 | 0.6% |
| British | 10 | 0.5% |
| Burmese | 6 | 0.3% |
| Czech | 6 | 0.3% |
| Czechoslovakian | 3 | 0.1% |
| Dominican | 17 | 0.8% |
| Dutch | 60 | 2.8% |
| English | 255 | 11.9% |
| European | 52 | 2.4% |
| French | 26 | 1.2% |
| French Canadian | 11 | 0.5% |
| German | 819 | 38.3% |
| Greek | 12 | 0.6% |
| Hungarian | 10 | 0.5% |
| Indonesian | 12 | 0.6% |
| Irish | 192 | 9.0% |
| Italian | 285 | 13.3% |
| Lithuanian | 3 | 0.1% |
| Mexican | 16 | 0.7% |
| Norwegian | 9 | 0.4% |
| Pennsylvania German | 31 | 1.5% |
| Polish | 194 | 9.1% |
| Puerto Rican | 103 | 4.8% |
| Russian | 19 | 0.9% |
| Scandinavian | 2 | 0.1% |
| Scotch-Irish | 4 | 0.2% |
| Scottish | 31 | 1.5% |
| Slovak | 8 | 0.4% |
| Spanish | 4 | 0.2% |
| Sri Lankan | 2 | 0.1% |
| Subsaharan African | 5 | 0.2% |
| Swiss | 7 | 0.3% |
| Syrian | 5 | 0.2% |
| Ukrainian | 6 | 0.3% |
| Welsh | 14 | 0.6% | View All 39 Rows |
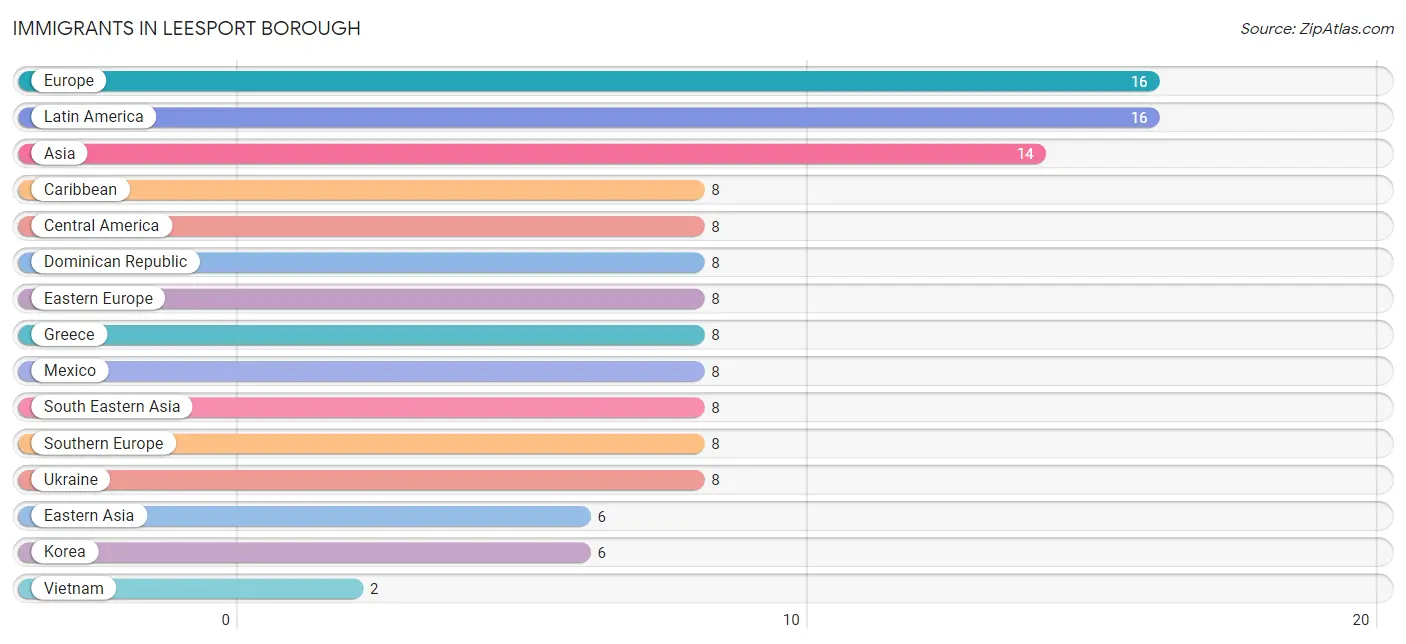
Immigrants in Leesport borough
The most numerous immigrant groups reported in Leesport borough came from Europe (16 | 0.7%), Latin America (16 | 0.7%), Asia (14 | 0.6%), Caribbean (8 | 0.4%), and Central America (8 | 0.4%), together accounting for 2.9% of all Leesport borough residents.
| Immigration Origin | # Population | % Population |
| Asia | 14 | 0.6% |
| Caribbean | 8 | 0.4% |
| Central America | 8 | 0.4% |
| Dominican Republic | 8 | 0.4% |
| Eastern Asia | 6 | 0.3% |
| Eastern Europe | 8 | 0.4% |
| Europe | 16 | 0.7% |
| Greece | 8 | 0.4% |
| Korea | 6 | 0.3% |
| Latin America | 16 | 0.7% |
| Mexico | 8 | 0.4% |
| South Eastern Asia | 8 | 0.4% |
| Southern Europe | 8 | 0.4% |
| Ukraine | 8 | 0.4% |
| Vietnam | 2 | 0.1% | View All 15 Rows |
Sex and Age in Leesport borough
Sex and Age in Leesport borough
The most populous age groups in Leesport borough are 20 to 24 Years (155 | 12.9%) for men and 20 to 24 Years (112 | 12.0%) for women.
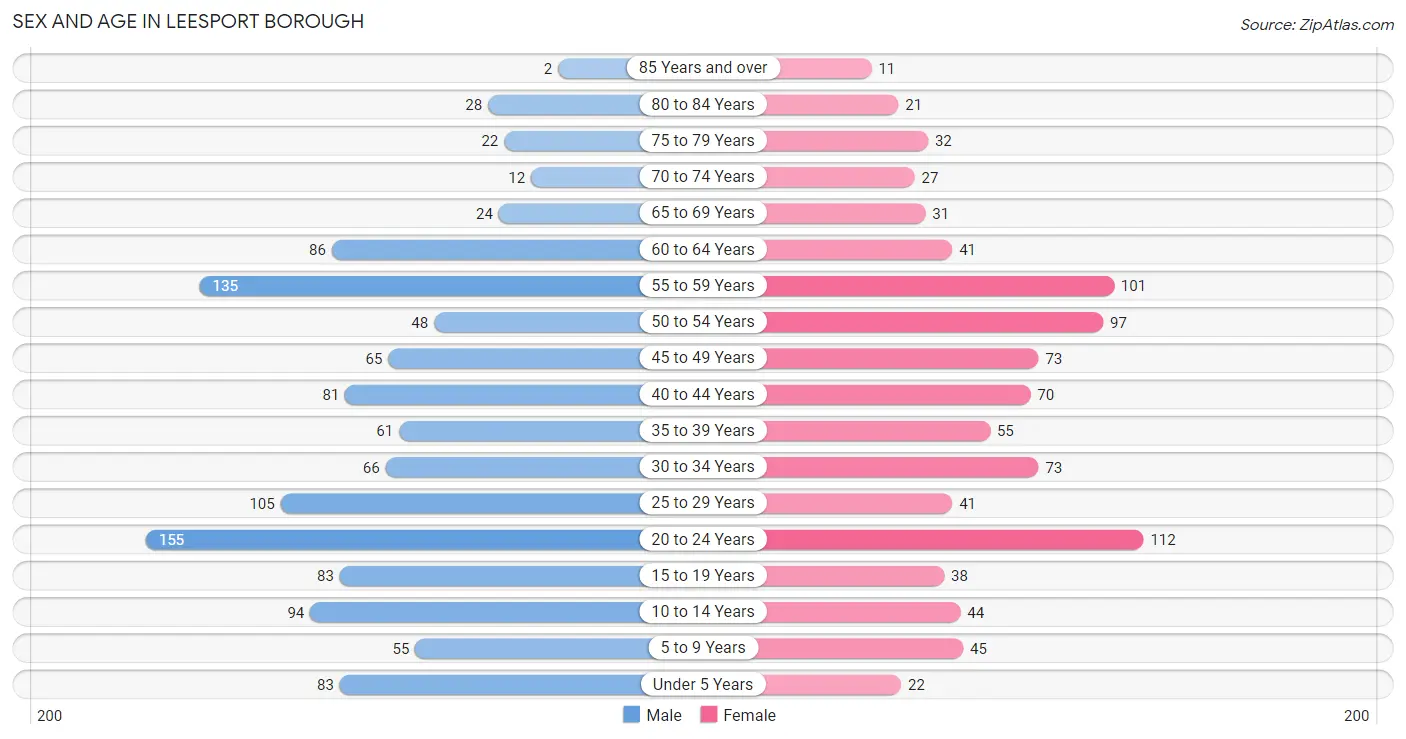
| Age Bracket | Male | Female |
| Under 5 Years | 83 (6.9%) | 22 (2.4%) |
| 5 to 9 Years | 55 (4.6%) | 45 (4.8%) |
| 10 to 14 Years | 94 (7.8%) | 44 (4.7%) |
| 15 to 19 Years | 83 (6.9%) | 38 (4.1%) |
| 20 to 24 Years | 155 (12.9%) | 112 (12.0%) |
| 25 to 29 Years | 105 (8.7%) | 41 (4.4%) |
| 30 to 34 Years | 66 (5.5%) | 73 (7.8%) |
| 35 to 39 Years | 61 (5.1%) | 55 (5.9%) |
| 40 to 44 Years | 81 (6.7%) | 70 (7.5%) |
| 45 to 49 Years | 65 (5.4%) | 73 (7.8%) |
| 50 to 54 Years | 48 (4.0%) | 97 (10.4%) |
| 55 to 59 Years | 135 (11.2%) | 101 (10.8%) |
| 60 to 64 Years | 86 (7.1%) | 41 (4.4%) |
| 65 to 69 Years | 24 (2.0%) | 31 (3.3%) |
| 70 to 74 Years | 12 (1.0%) | 27 (2.9%) |
| 75 to 79 Years | 22 (1.8%) | 32 (3.4%) |
| 80 to 84 Years | 28 (2.3%) | 21 (2.2%) |
| 85 Years and over | 2 (0.2%) | 11 (1.2%) |
| Total | 1,205 (100.0%) | 934 (100.0%) |
Families and Households in Leesport borough
Median Family Size in Leesport borough
The median family size in Leesport borough is 3.40 persons per family, with married-couple families (400 | 75.0%) accounting for the largest median family size of 3.65 persons per family. On the other hand, single female/mother families (90 | 16.9%) represent the smallest median family size with 2.60 persons per family.
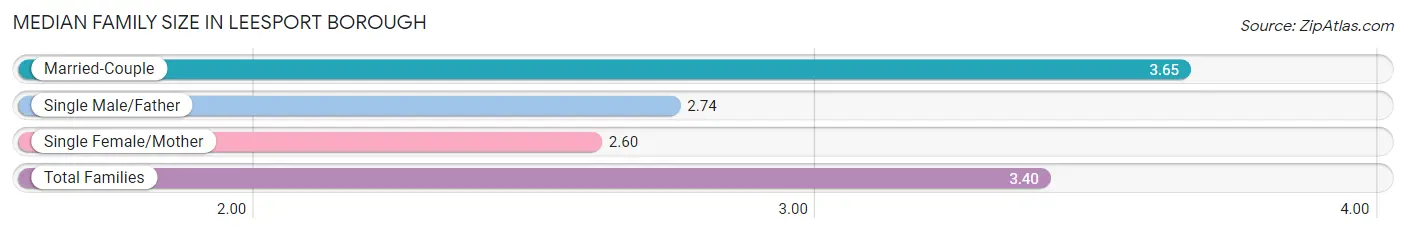
| Family Type | # Families | Family Size |
| Married-Couple | 400 (75.0%) | 3.65 |
| Single Male/Father | 43 (8.1%) | 2.74 |
| Single Female/Mother | 90 (16.9%) | 2.60 |
| Total Families | 533 (100.0%) | 3.40 |
Median Household Size in Leesport borough
The median household size in Leesport borough is 2.91 persons per household, with married-couple households (400 | 54.3%) accounting for the largest median household size of 3.65 persons per household. non-family households (203 | 27.6%) represent the smallest median household size with 1.31 persons per household.
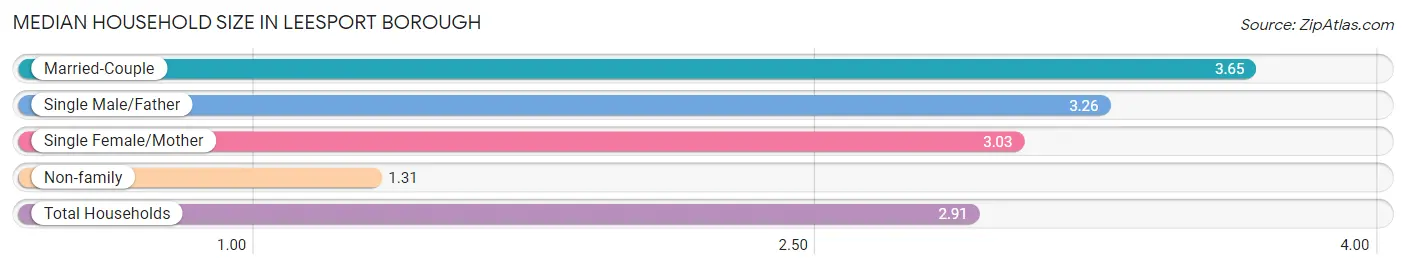
| Household Type | # Households | Household Size |
| Married-Couple | 400 (54.3%) | 3.65 |
| Single Male/Father | 43 (5.8%) | 3.26 |
| Single Female/Mother | 90 (12.2%) | 3.03 |
| Non-family | 203 (27.6%) | 1.31 |
| Total Households | 736 (100.0%) | 2.91 |
Household Size by Marriage Status in Leesport borough
Out of a total of 736 households in Leesport borough, 533 (72.4%) are family households, while 203 (27.6%) are nonfamily households. The most numerous type of family households are 3-person households, comprising 195, and the most common type of nonfamily households are 1-person households, comprising 146.
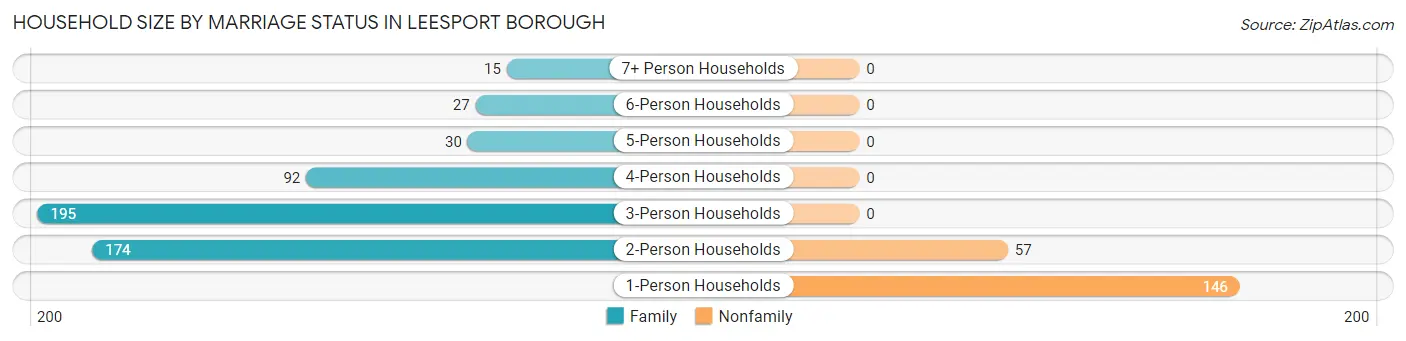
| Household Size | Family Households | Nonfamily Households |
| 1-Person Households | - | 146 (19.8%) |
| 2-Person Households | 174 (23.6%) | 57 (7.7%) |
| 3-Person Households | 195 (26.5%) | 0 (0.0%) |
| 4-Person Households | 92 (12.5%) | 0 (0.0%) |
| 5-Person Households | 30 (4.1%) | 0 (0.0%) |
| 6-Person Households | 27 (3.7%) | 0 (0.0%) |
| 7+ Person Households | 15 (2.0%) | 0 (0.0%) |
| Total | 533 (72.4%) | 203 (27.6%) |
Female Fertility in Leesport borough
Fertility by Age in Leesport borough
Average fertility rate in Leesport borough is 40.0 births per 1,000 women. Women in the age bracket of 20 to 34 years have the highest fertility rate with 84.0 births per 1,000 women. Women in the age bracket of 20 to 34 years acount for 100.0% of all women with births.
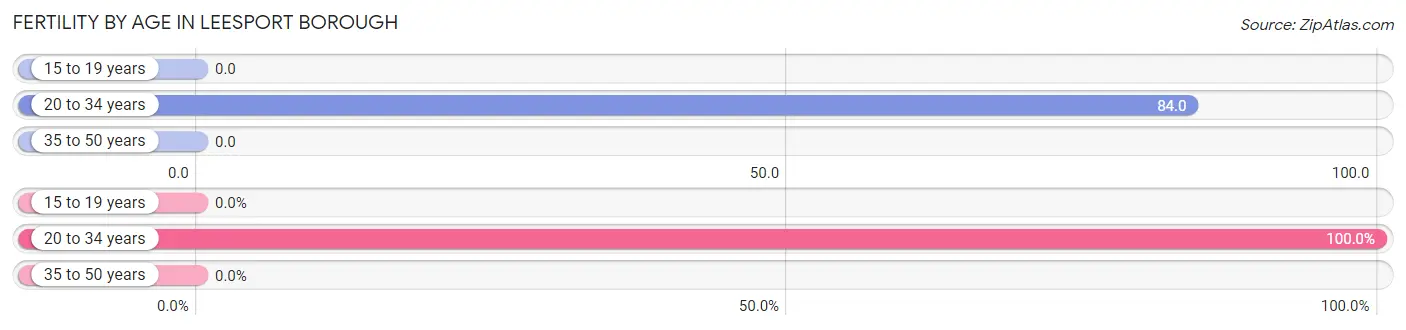
| Age Bracket | Women with Births | Births / 1,000 Women |
| 15 to 19 years | 0 (0.0%) | 0.0 |
| 20 to 34 years | 19 (100.0%) | 84.0 |
| 35 to 50 years | 0 (0.0%) | 0.0 |
| Total | 19 (100.0%) | 40.0 |
Fertility by Age by Marriage Status in Leesport borough
57.9% of women with births (19) in Leesport borough are married. The highest percentage of unmarried women with births falls into 20 to 34 years age bracket with 42.1% of them unmarried at the time of birth, while the lowest percentage of unmarried women with births belong to 20 to 34 years age bracket with 42.1% of them unmarried.
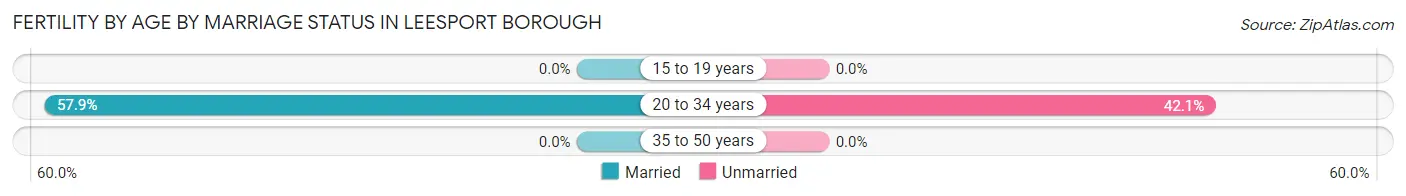
| Age Bracket | Married | Unmarried |
| 15 to 19 years | 0 (0.0%) | 0 (0.0%) |
| 20 to 34 years | 11 (57.9%) | 8 (42.1%) |
| 35 to 50 years | 0 (0.0%) | 0 (0.0%) |
| Total | 11 (57.9%) | 8 (42.1%) |
Fertility by Education in Leesport borough
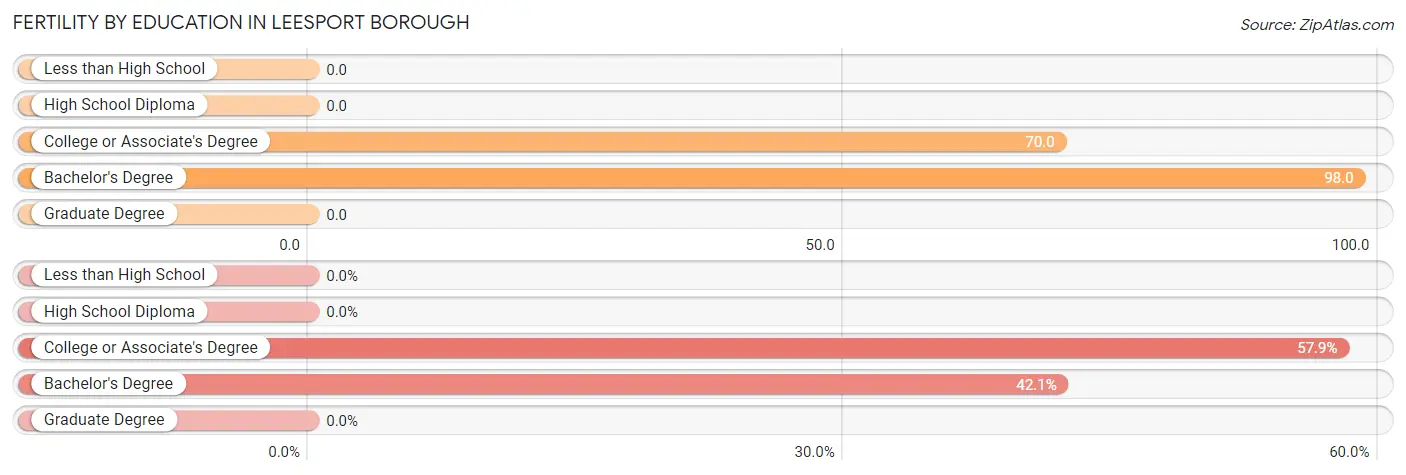
| Educational Attainment | Women with Births | Births / 1,000 Women |
| Less than High School | 0 (0.0%) | 0.0 |
| High School Diploma | 0 (0.0%) | 0.0 |
| College or Associate's Degree | 11 (57.9%) | 70.0 |
| Bachelor's Degree | 8 (42.1%) | 98.0 |
| Graduate Degree | 0 (0.0%) | 0.0 |
| Total | 19 (100.0%) | 40.0 |
Fertility by Education by Marriage Status in Leesport borough
42.1% of women with births in Leesport borough are unmarried. Women with the educational attainment of bachelor's degree are most likely to be married with 100.0% of them married at childbirth, while women with the educational attainment of college or associate's degree are least likely to be married with 72.7% of them unmarried at childbirth.
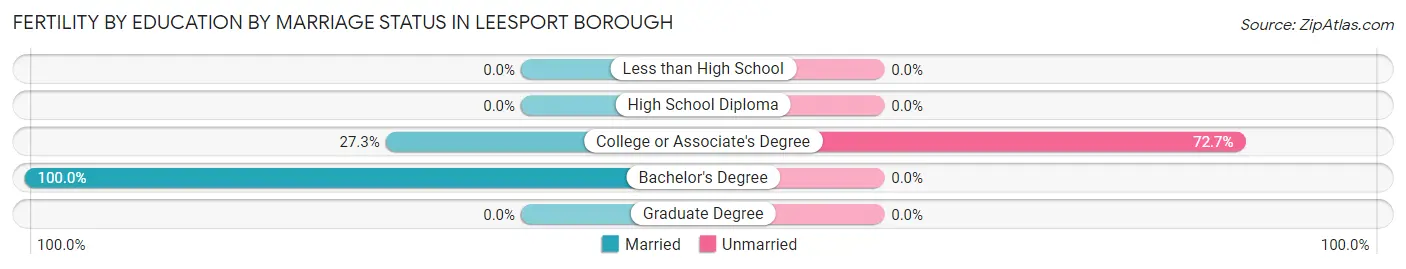
| Educational Attainment | Married | Unmarried |
| Less than High School | 0 (0.0%) | 0 (0.0%) |
| High School Diploma | 0 (0.0%) | 0 (0.0%) |
| College or Associate's Degree | 3 (27.3%) | 8 (72.7%) |
| Bachelor's Degree | 8 (100.0%) | 0 (0.0%) |
| Graduate Degree | 0 (0.0%) | 0 (0.0%) |
| Total | 11 (57.9%) | 8 (42.1%) |
Employment Characteristics in Leesport borough
Employment by Class of Employer in Leesport borough
Among the 1,147 employed individuals in Leesport borough, private company employees (767 | 66.9%), not-for-profit organizations (167 | 14.6%), and self-employed (not incorporated) (78 | 6.8%) make up the most common classes of employment.
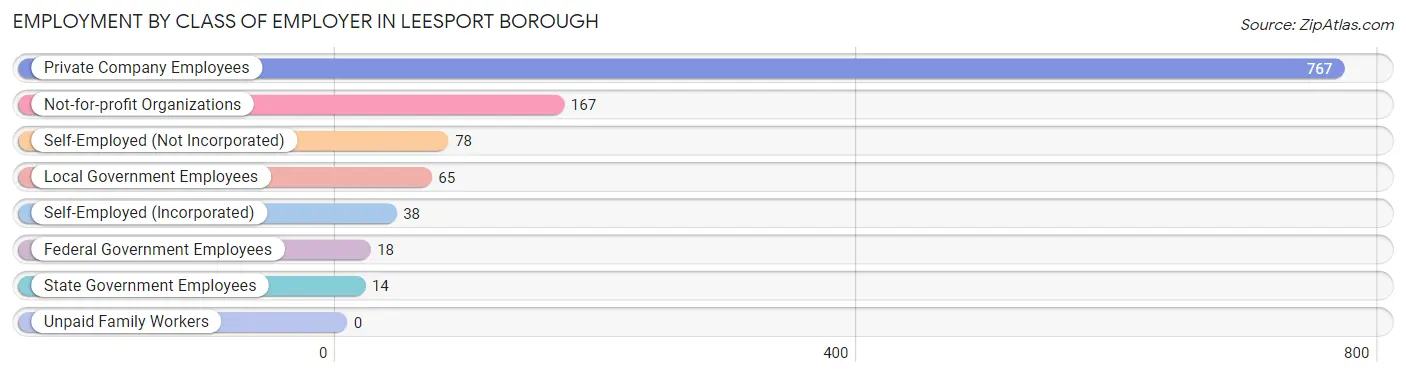
| Employer Class | # Employees | % Employees |
| Private Company Employees | 767 | 66.9% |
| Self-Employed (Incorporated) | 38 | 3.3% |
| Self-Employed (Not Incorporated) | 78 | 6.8% |
| Not-for-profit Organizations | 167 | 14.6% |
| Local Government Employees | 65 | 5.7% |
| State Government Employees | 14 | 1.2% |
| Federal Government Employees | 18 | 1.6% |
| Unpaid Family Workers | 0 | 0.0% |
| Total | 1,147 | 100.0% |
Employment Status by Age in Leesport borough
According to the labor force statistics for Leesport borough, out of the total population over 16 years of age (1,778), 70.1% or 1,246 individuals are in the labor force, with 6.2% or 77 of them unemployed. The age group with the highest labor force participation rate is 25 to 29 years, with 98.6% or 144 individuals in the labor force. Within the labor force, the 25 to 29 years age range has the highest percentage of unemployed individuals, with 18.8% or 27 of them being unemployed.
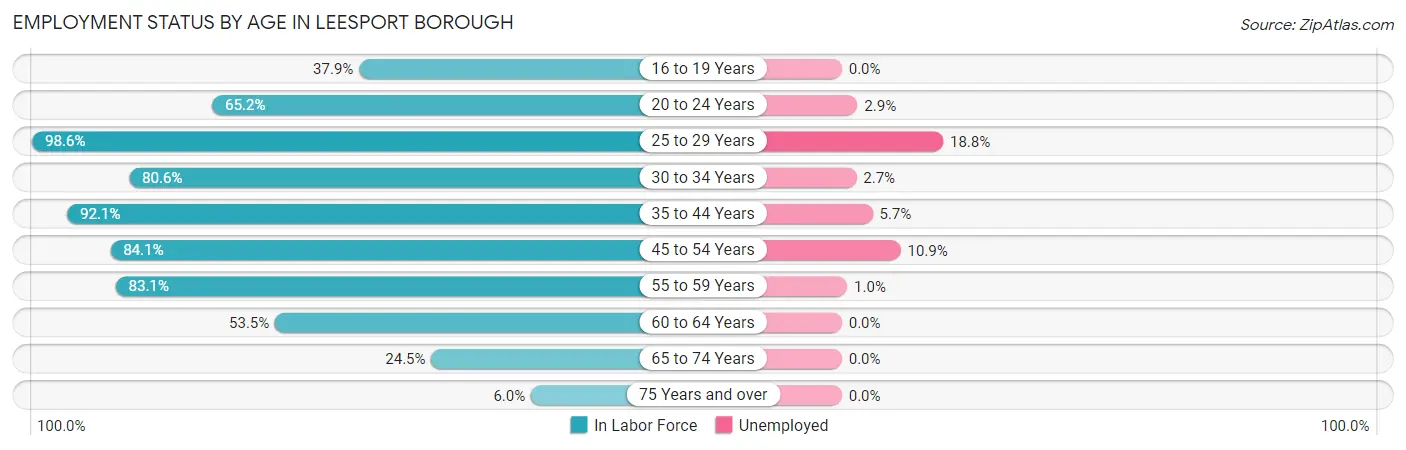
| Age Bracket | In Labor Force | Unemployed |
| 16 to 19 Years | 39 (37.9%) | 0 (0.0%) |
| 20 to 24 Years | 174 (65.2%) | 5 (2.9%) |
| 25 to 29 Years | 144 (98.6%) | 27 (18.8%) |
| 30 to 34 Years | 112 (80.6%) | 3 (2.7%) |
| 35 to 44 Years | 246 (92.1%) | 14 (5.7%) |
| 45 to 54 Years | 238 (84.1%) | 26 (10.9%) |
| 55 to 59 Years | 196 (83.1%) | 2 (1.0%) |
| 60 to 64 Years | 68 (53.5%) | 0 (0.0%) |
| 65 to 74 Years | 23 (24.5%) | 0 (0.0%) |
| 75 Years and over | 7 (6.0%) | 0 (0.0%) |
| Total | 1,246 (70.1%) | 77 (6.2%) |
Employment Status by Educational Attainment in Leesport borough
According to labor force statistics for Leesport borough, 83.8% of individuals (1,004) out of the total population between 25 and 64 years of age (1,198) are in the labor force, with 7.2% or 72 of them being unemployed. The group with the highest labor force participation rate are those with the educational attainment of bachelor's degree or higher, with 95.5% or 276 individuals in the labor force. Within the labor force, individuals with less than high school education have the highest percentage of unemployment, with 44.4% or 16 of them being unemployed.
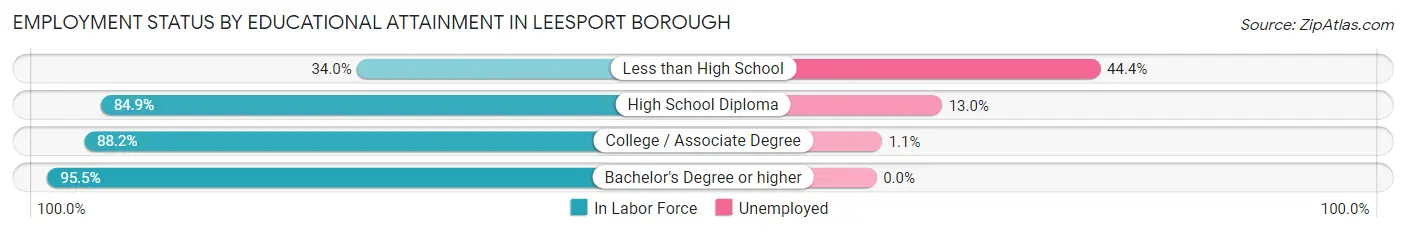
| Educational Attainment | In Labor Force | Unemployed |
| Less than High School | 36 (34.0%) | 47 (44.4%) |
| High School Diploma | 409 (84.9%) | 63 (13.0%) |
| College / Associate Degree | 283 (88.2%) | 4 (1.1%) |
| Bachelor's Degree or higher | 276 (95.5%) | 0 (0.0%) |
| Total | 1,004 (83.8%) | 86 (7.2%) |
Employment Occupations by Sex in Leesport borough
Management, Business, Science and Arts Occupations
The most common Management, Business, Science and Arts occupations in Leesport borough are Management (81 | 7.0%), Business & Financial (69 | 5.9%), Health Diagnosing & Treating (61 | 5.2%), Computers, Engineering & Science (43 | 3.7%), and Health Technologists (33 | 2.8%).
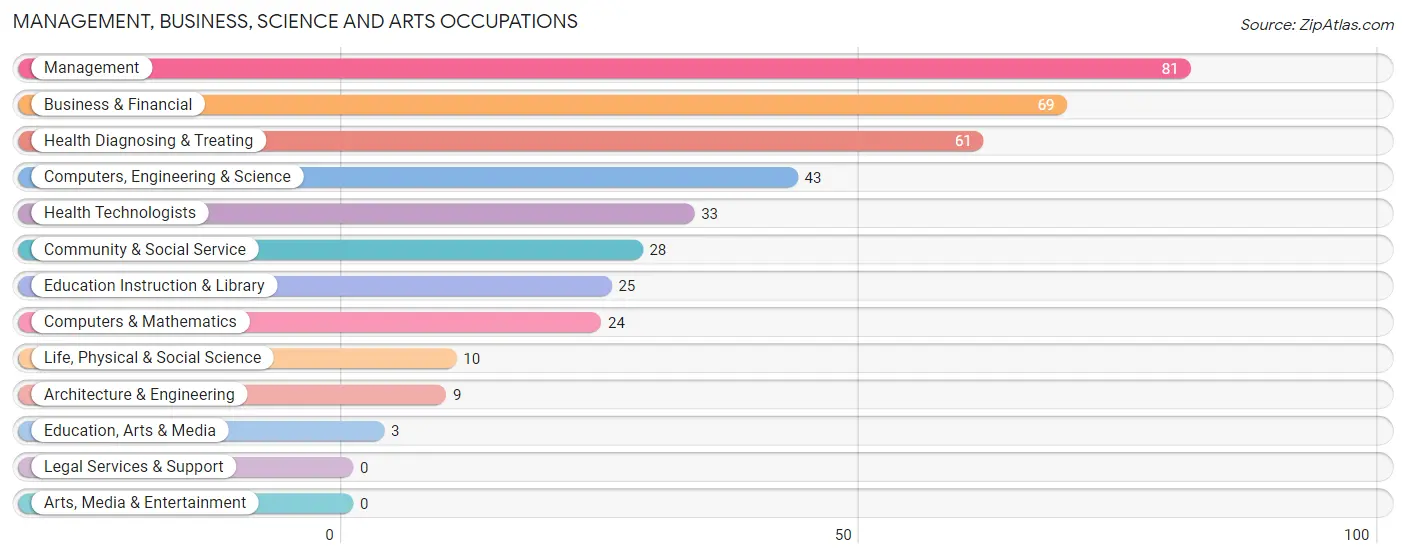
Management, Business, Science and Arts Occupations by Sex
Within the Management, Business, Science and Arts occupations in Leesport borough, the most male-oriented occupations are Architecture & Engineering (100.0%), Management (86.4%), and Computers, Engineering & Science (46.5%), while the most female-oriented occupations are Life, Physical & Social Science (100.0%), Health Diagnosing & Treating (100.0%), and Health Technologists (100.0%).
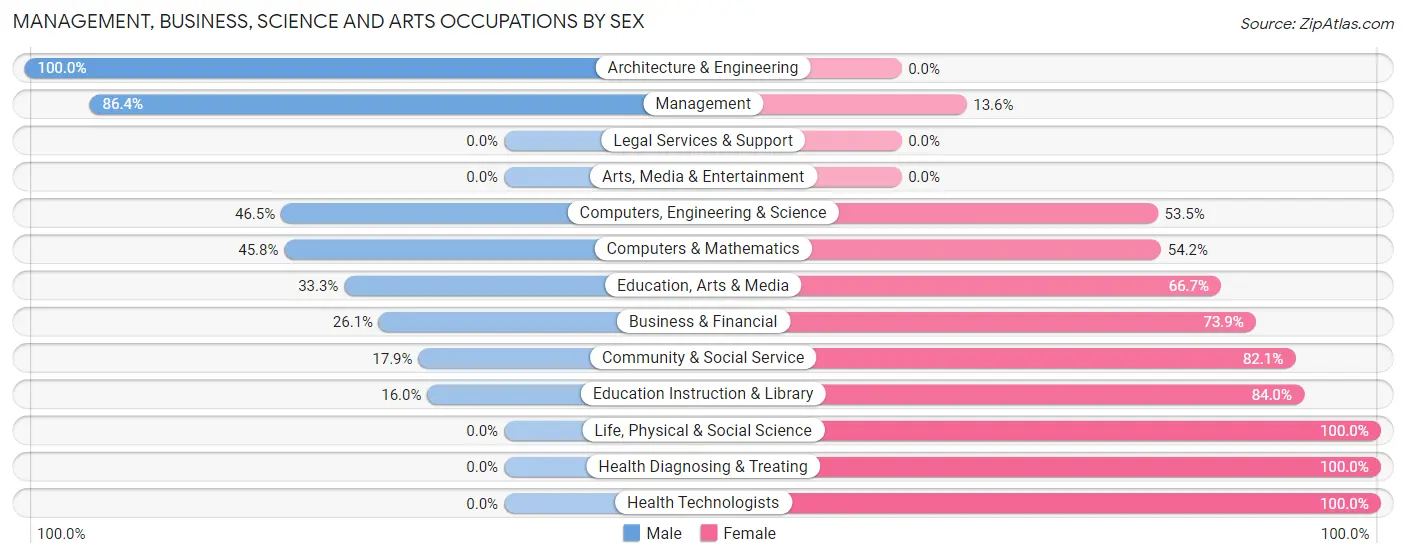
| Occupation | Male | Female |
| Management | 70 (86.4%) | 11 (13.6%) |
| Business & Financial | 18 (26.1%) | 51 (73.9%) |
| Computers, Engineering & Science | 20 (46.5%) | 23 (53.5%) |
| Computers & Mathematics | 11 (45.8%) | 13 (54.2%) |
| Architecture & Engineering | 9 (100.0%) | 0 (0.0%) |
| Life, Physical & Social Science | 0 (0.0%) | 10 (100.0%) |
| Community & Social Service | 5 (17.9%) | 23 (82.1%) |
| Education, Arts & Media | 1 (33.3%) | 2 (66.7%) |
| Legal Services & Support | 0 (0.0%) | 0 (0.0%) |
| Education Instruction & Library | 4 (16.0%) | 21 (84.0%) |
| Arts, Media & Entertainment | 0 (0.0%) | 0 (0.0%) |
| Health Diagnosing & Treating | 0 (0.0%) | 61 (100.0%) |
| Health Technologists | 0 (0.0%) | 33 (100.0%) |
| Total (Category) | 113 (40.1%) | 169 (59.9%) |
| Total (Overall) | 652 (55.9%) | 514 (44.1%) |
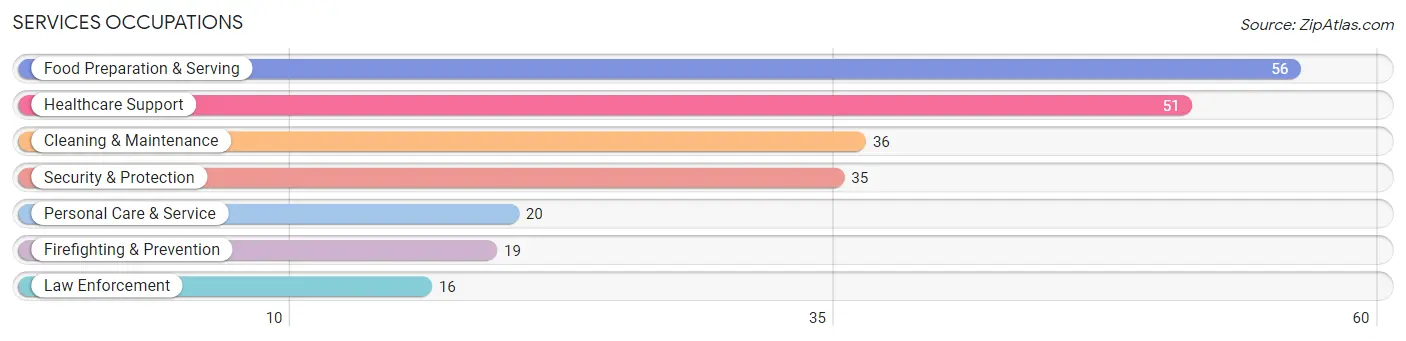
Services Occupations
The most common Services occupations in Leesport borough are Food Preparation & Serving (56 | 4.8%), Healthcare Support (51 | 4.4%), Cleaning & Maintenance (36 | 3.1%), Security & Protection (35 | 3.0%), and Personal Care & Service (20 | 1.7%).
Services Occupations by Sex
Within the Services occupations in Leesport borough, the most male-oriented occupations are Law Enforcement (100.0%), Security & Protection (91.4%), and Firefighting & Prevention (84.2%), while the most female-oriented occupations are Healthcare Support (100.0%), Food Preparation & Serving (71.4%), and Personal Care & Service (60.0%).
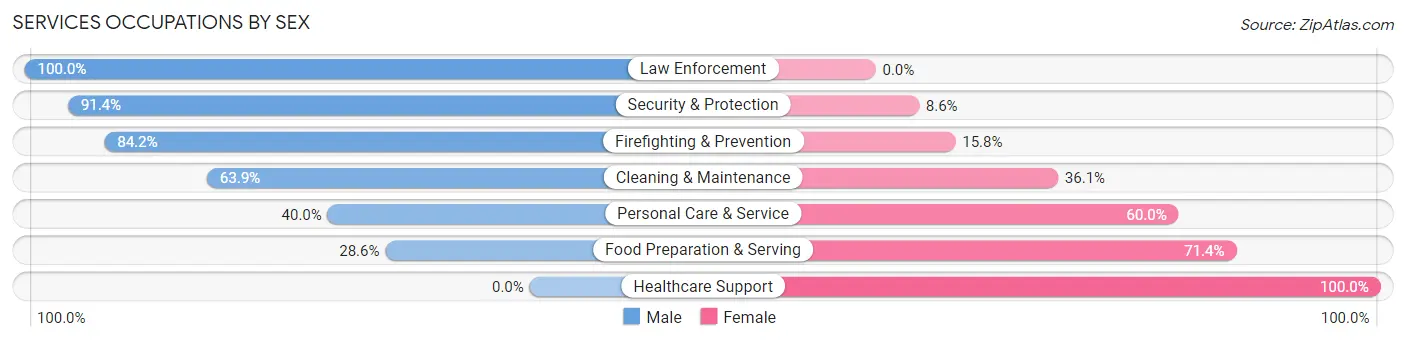
| Occupation | Male | Female |
| Healthcare Support | 0 (0.0%) | 51 (100.0%) |
| Security & Protection | 32 (91.4%) | 3 (8.6%) |
| Firefighting & Prevention | 16 (84.2%) | 3 (15.8%) |
| Law Enforcement | 16 (100.0%) | 0 (0.0%) |
| Food Preparation & Serving | 16 (28.6%) | 40 (71.4%) |
| Cleaning & Maintenance | 23 (63.9%) | 13 (36.1%) |
| Personal Care & Service | 8 (40.0%) | 12 (60.0%) |
| Total (Category) | 79 (39.9%) | 119 (60.1%) |
| Total (Overall) | 652 (55.9%) | 514 (44.1%) |
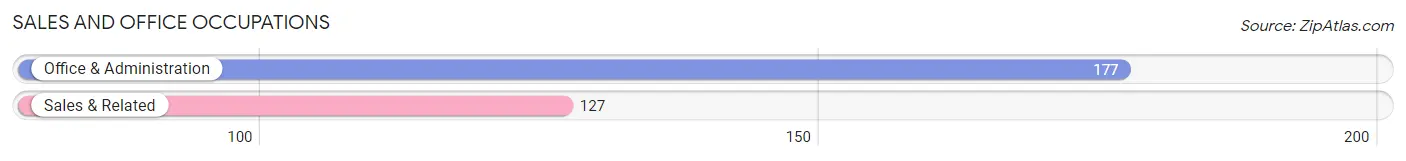
Sales and Office Occupations
The most common Sales and Office occupations in Leesport borough are Office & Administration (177 | 15.2%), and Sales & Related (127 | 10.9%).
Sales and Office Occupations by Sex
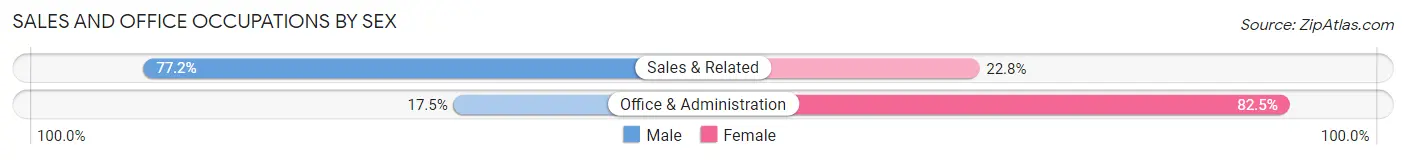
| Occupation | Male | Female |
| Sales & Related | 98 (77.2%) | 29 (22.8%) |
| Office & Administration | 31 (17.5%) | 146 (82.5%) |
| Total (Category) | 129 (42.4%) | 175 (57.6%) |
| Total (Overall) | 652 (55.9%) | 514 (44.1%) |
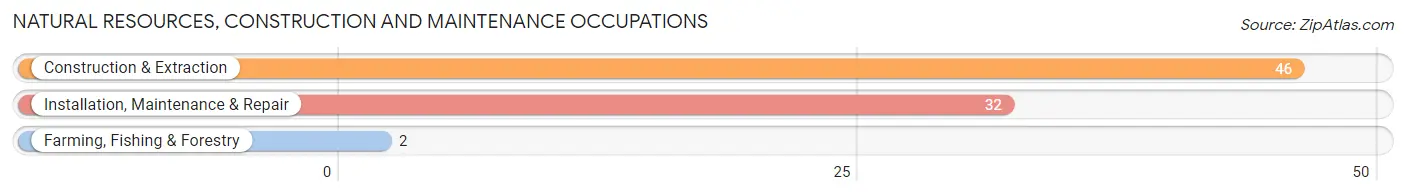
Natural Resources, Construction and Maintenance Occupations
The most common Natural Resources, Construction and Maintenance occupations in Leesport borough are Construction & Extraction (46 | 4.0%), Installation, Maintenance & Repair (32 | 2.7%), and Farming, Fishing & Forestry (2 | 0.2%).
Natural Resources, Construction and Maintenance Occupations by Sex
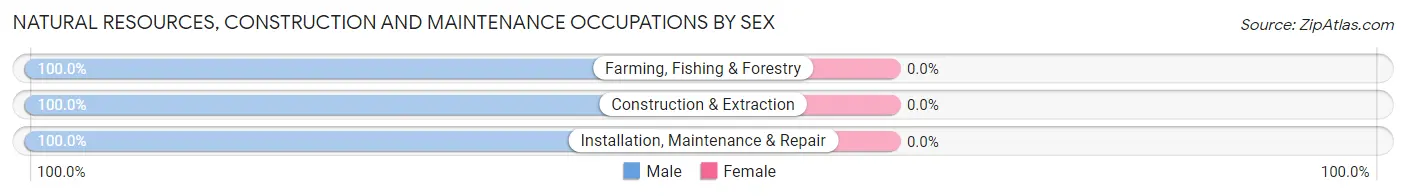
| Occupation | Male | Female |
| Farming, Fishing & Forestry | 2 (100.0%) | 0 (0.0%) |
| Construction & Extraction | 46 (100.0%) | 0 (0.0%) |
| Installation, Maintenance & Repair | 32 (100.0%) | 0 (0.0%) |
| Total (Category) | 80 (100.0%) | 0 (0.0%) |
| Total (Overall) | 652 (55.9%) | 514 (44.1%) |
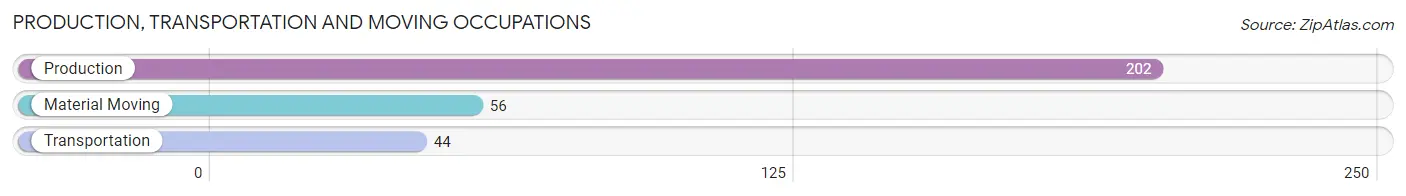
Production, Transportation and Moving Occupations
The most common Production, Transportation and Moving occupations in Leesport borough are Production (202 | 17.3%), Material Moving (56 | 4.8%), and Transportation (44 | 3.8%).
Production, Transportation and Moving Occupations by Sex
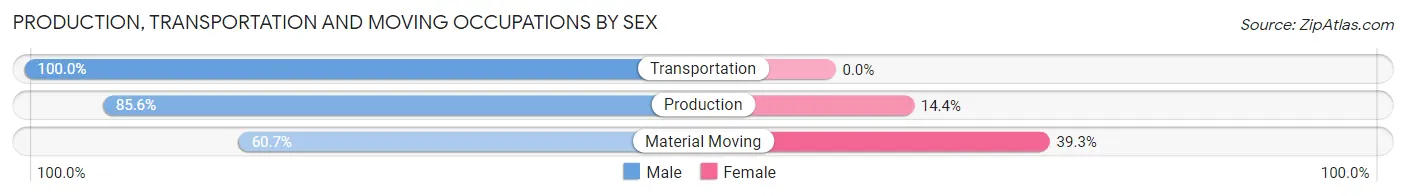
| Occupation | Male | Female |
| Production | 173 (85.6%) | 29 (14.4%) |
| Transportation | 44 (100.0%) | 0 (0.0%) |
| Material Moving | 34 (60.7%) | 22 (39.3%) |
| Total (Category) | 251 (83.1%) | 51 (16.9%) |
| Total (Overall) | 652 (55.9%) | 514 (44.1%) |
Employment Industries by Sex in Leesport borough
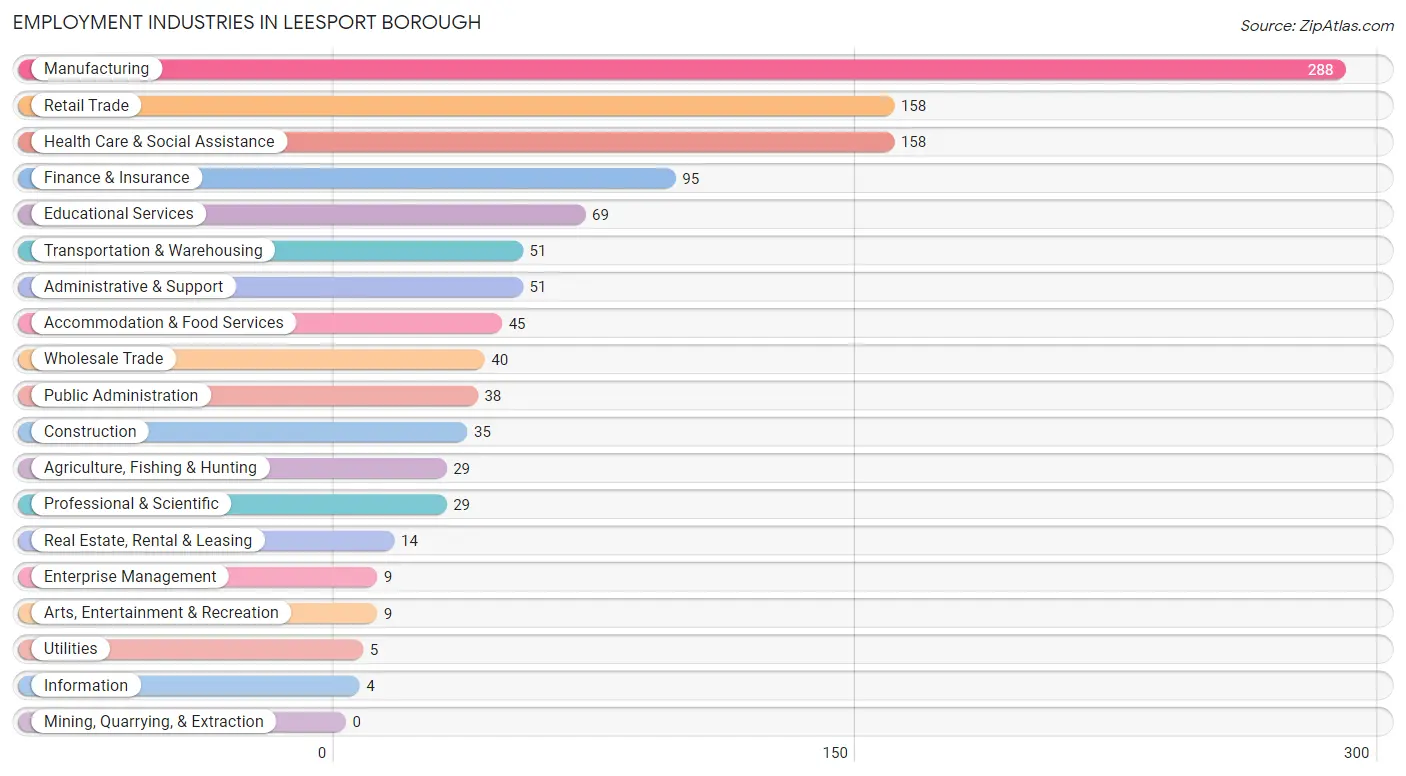
Employment Industries in Leesport borough
The major employment industries in Leesport borough include Manufacturing (288 | 24.7%), Retail Trade (158 | 13.6%), Health Care & Social Assistance (158 | 13.6%), Finance & Insurance (95 | 8.2%), and Educational Services (69 | 5.9%).
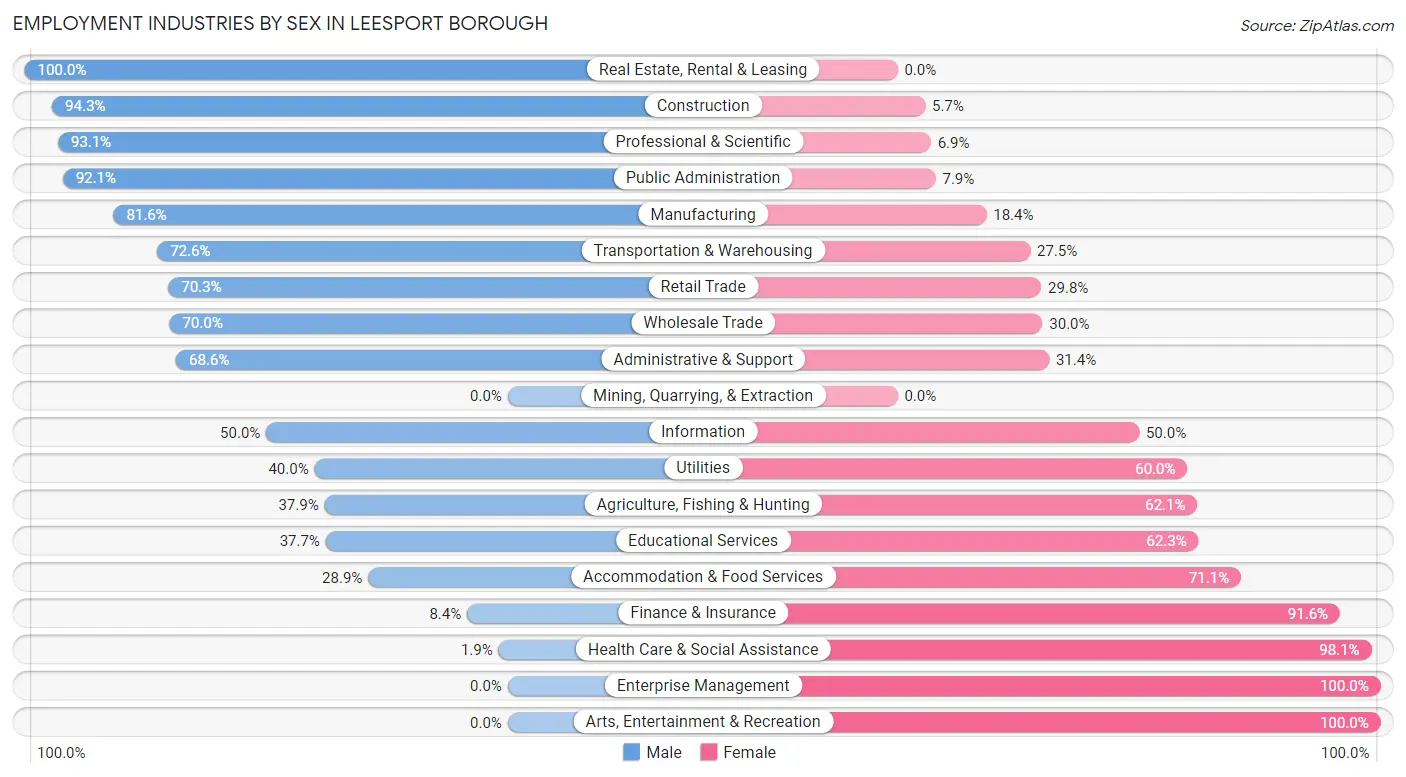
Employment Industries by Sex in Leesport borough
The Leesport borough industries that see more men than women are Real Estate, Rental & Leasing (100.0%), Construction (94.3%), and Professional & Scientific (93.1%), whereas the industries that tend to have a higher number of women are Enterprise Management (100.0%), Arts, Entertainment & Recreation (100.0%), and Health Care & Social Assistance (98.1%).
| Industry | Male | Female |
| Agriculture, Fishing & Hunting | 11 (37.9%) | 18 (62.1%) |
| Mining, Quarrying, & Extraction | 0 (0.0%) | 0 (0.0%) |
| Construction | 33 (94.3%) | 2 (5.7%) |
| Manufacturing | 235 (81.6%) | 53 (18.4%) |
| Wholesale Trade | 28 (70.0%) | 12 (30.0%) |
| Retail Trade | 111 (70.3%) | 47 (29.7%) |
| Transportation & Warehousing | 37 (72.6%) | 14 (27.5%) |
| Utilities | 2 (40.0%) | 3 (60.0%) |
| Information | 2 (50.0%) | 2 (50.0%) |
| Finance & Insurance | 8 (8.4%) | 87 (91.6%) |
| Real Estate, Rental & Leasing | 14 (100.0%) | 0 (0.0%) |
| Professional & Scientific | 27 (93.1%) | 2 (6.9%) |
| Enterprise Management | 0 (0.0%) | 9 (100.0%) |
| Administrative & Support | 35 (68.6%) | 16 (31.4%) |
| Educational Services | 26 (37.7%) | 43 (62.3%) |
| Health Care & Social Assistance | 3 (1.9%) | 155 (98.1%) |
| Arts, Entertainment & Recreation | 0 (0.0%) | 9 (100.0%) |
| Accommodation & Food Services | 13 (28.9%) | 32 (71.1%) |
| Public Administration | 35 (92.1%) | 3 (7.9%) |
| Total | 652 (55.9%) | 514 (44.1%) |
Education in Leesport borough
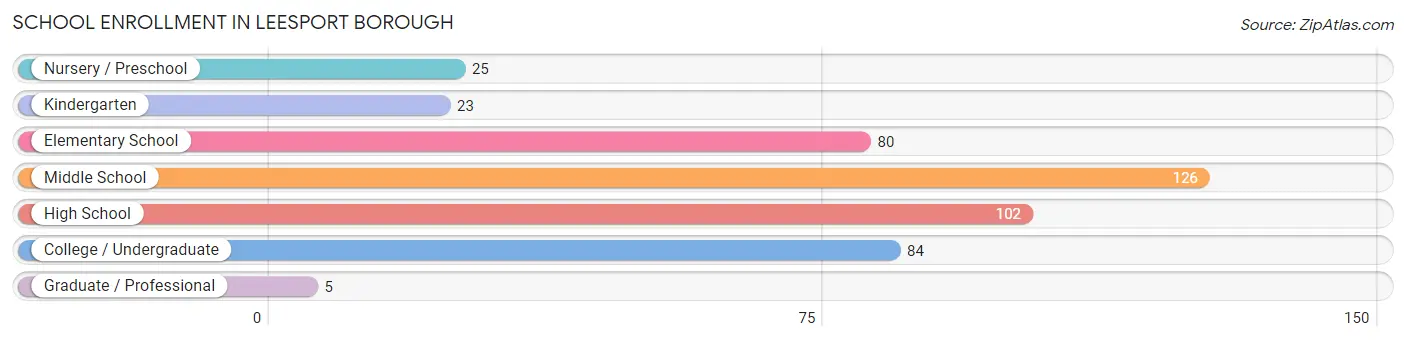
School Enrollment in Leesport borough
The most common levels of schooling among the 445 students in Leesport borough are middle school (126 | 28.3%), high school (102 | 22.9%), and college / undergraduate (84 | 18.9%).
| School Level | # Students | % Students |
| Nursery / Preschool | 25 | 5.6% |
| Kindergarten | 23 | 5.2% |
| Elementary School | 80 | 18.0% |
| Middle School | 126 | 28.3% |
| High School | 102 | 22.9% |
| College / Undergraduate | 84 | 18.9% |
| Graduate / Professional | 5 | 1.1% |
| Total | 445 | 100.0% |
School Enrollment by Age by Funding Source in Leesport borough
Out of a total of 445 students who are enrolled in schools in Leesport borough, 54 (12.1%) attend a private institution, while the remaining 391 (87.9%) are enrolled in public schools. The age group of 25 to 34 year olds has the highest likelihood of being enrolled in private schools, with 7 (70.0% in the age bracket) enrolled. Conversely, the age group of 10 to 14 year olds has the lowest likelihood of being enrolled in a private school, with 138 (100.0% in the age bracket) attending a public institution.
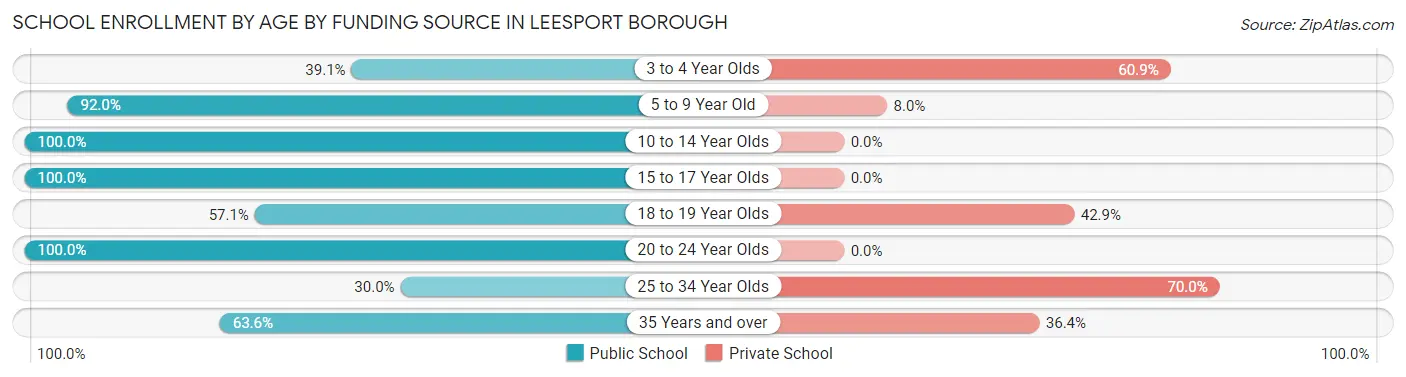
| Age Bracket | Public School | Private School |
| 3 to 4 Year Olds | 9 (39.1%) | 14 (60.9%) |
| 5 to 9 Year Old | 92 (92.0%) | 8 (8.0%) |
| 10 to 14 Year Olds | 138 (100.0%) | 0 (0.0%) |
| 15 to 17 Year Olds | 51 (100.0%) | 0 (0.0%) |
| 18 to 19 Year Olds | 28 (57.1%) | 21 (42.9%) |
| 20 to 24 Year Olds | 63 (100.0%) | 0 (0.0%) |
| 25 to 34 Year Olds | 3 (30.0%) | 7 (70.0%) |
| 35 Years and over | 7 (63.6%) | 4 (36.4%) |
| Total | 391 (87.9%) | 54 (12.1%) |
Educational Attainment by Field of Study in Leesport borough
Engineering (88 | 28.5%), business (44 | 14.2%), education (43 | 13.9%), science & technology (31 | 10.0%), and bio, nature & agricultural (19 | 6.1%) are the most common fields of study among 309 individuals in Leesport borough who have obtained a bachelor's degree or higher.
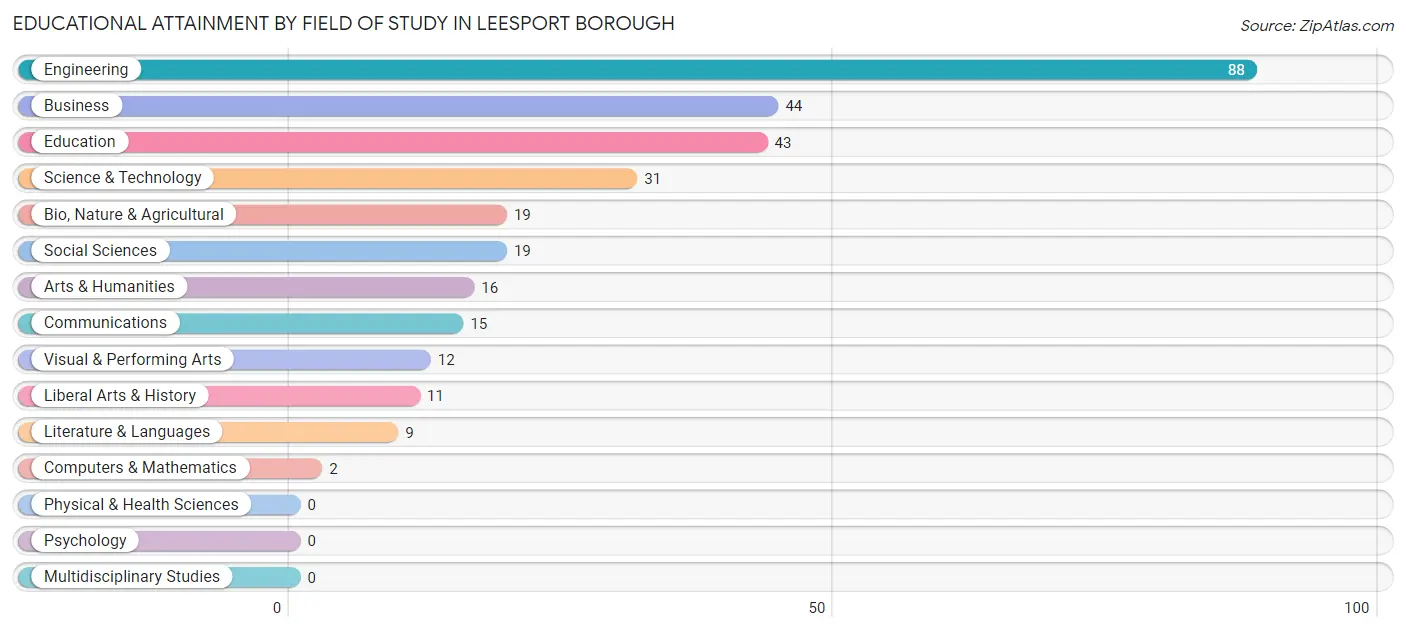
| Field of Study | # Graduates | % Graduates |
| Computers & Mathematics | 2 | 0.6% |
| Bio, Nature & Agricultural | 19 | 6.1% |
| Physical & Health Sciences | 0 | 0.0% |
| Psychology | 0 | 0.0% |
| Social Sciences | 19 | 6.1% |
| Engineering | 88 | 28.5% |
| Multidisciplinary Studies | 0 | 0.0% |
| Science & Technology | 31 | 10.0% |
| Business | 44 | 14.2% |
| Education | 43 | 13.9% |
| Literature & Languages | 9 | 2.9% |
| Liberal Arts & History | 11 | 3.6% |
| Visual & Performing Arts | 12 | 3.9% |
| Communications | 15 | 4.9% |
| Arts & Humanities | 16 | 5.2% |
| Total | 309 | 100.0% |
Transportation & Commute in Leesport borough
Vehicle Availability by Sex in Leesport borough
The most prevalent vehicle ownership categories in Leesport borough are males with 2 vehicles (206, accounting for 31.7%) and females with 2 vehicles (196, making up 41.4%).
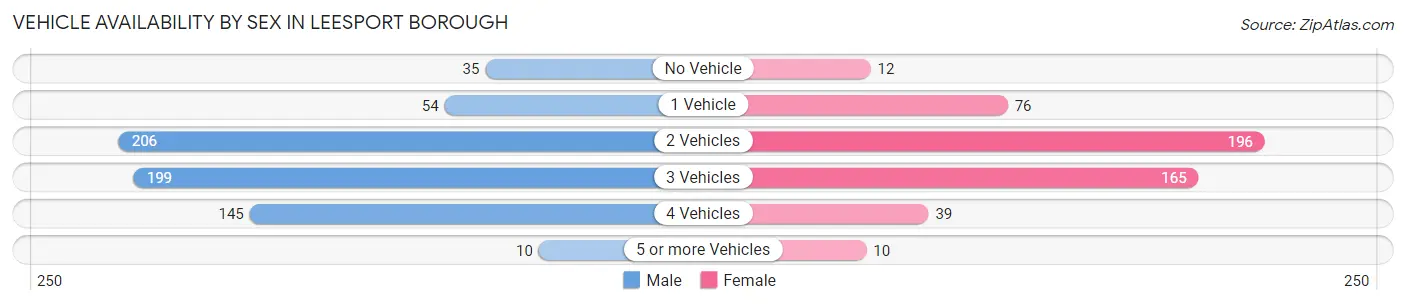
| Vehicles Available | Male | Female |
| No Vehicle | 35 (5.4%) | 12 (2.4%) |
| 1 Vehicle | 54 (8.3%) | 76 (15.3%) |
| 2 Vehicles | 206 (31.7%) | 196 (39.4%) |
| 3 Vehicles | 199 (30.7%) | 165 (33.1%) |
| 4 Vehicles | 145 (22.3%) | 39 (7.8%) |
| 5 or more Vehicles | 10 (1.5%) | 10 (2.0%) |
| Total | 649 (100.0%) | 498 (100.0%) |
Commute Time in Leesport borough
The most frequently occuring commute durations in Leesport borough are 5 to 9 minutes (210 commuters, 20.5%), 15 to 19 minutes (198 commuters, 19.4%), and 20 to 24 minutes (194 commuters, 19.0%).
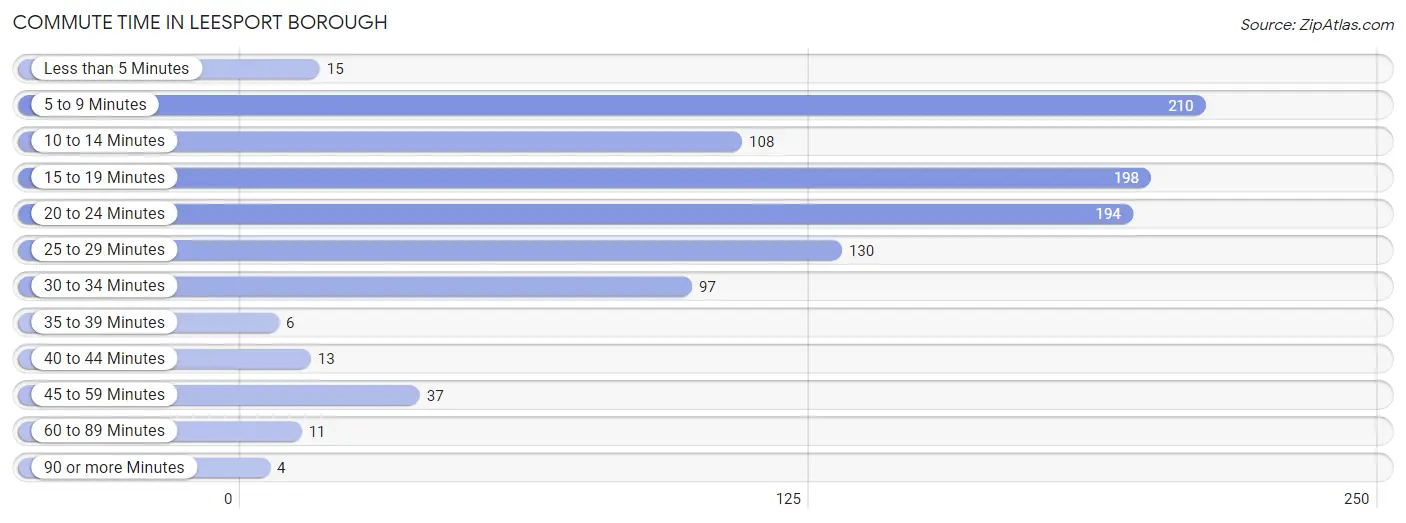
| Commute Time | # Commuters | % Commuters |
| Less than 5 Minutes | 15 | 1.5% |
| 5 to 9 Minutes | 210 | 20.5% |
| 10 to 14 Minutes | 108 | 10.6% |
| 15 to 19 Minutes | 198 | 19.4% |
| 20 to 24 Minutes | 194 | 19.0% |
| 25 to 29 Minutes | 130 | 12.7% |
| 30 to 34 Minutes | 97 | 9.5% |
| 35 to 39 Minutes | 6 | 0.6% |
| 40 to 44 Minutes | 13 | 1.3% |
| 45 to 59 Minutes | 37 | 3.6% |
| 60 to 89 Minutes | 11 | 1.1% |
| 90 or more Minutes | 4 | 0.4% |
Commute Time by Sex in Leesport borough
The most common commute times in Leesport borough are 5 to 9 minutes (164 commuters, 28.3%) for males and 15 to 19 minutes (100 commuters, 22.5%) for females.
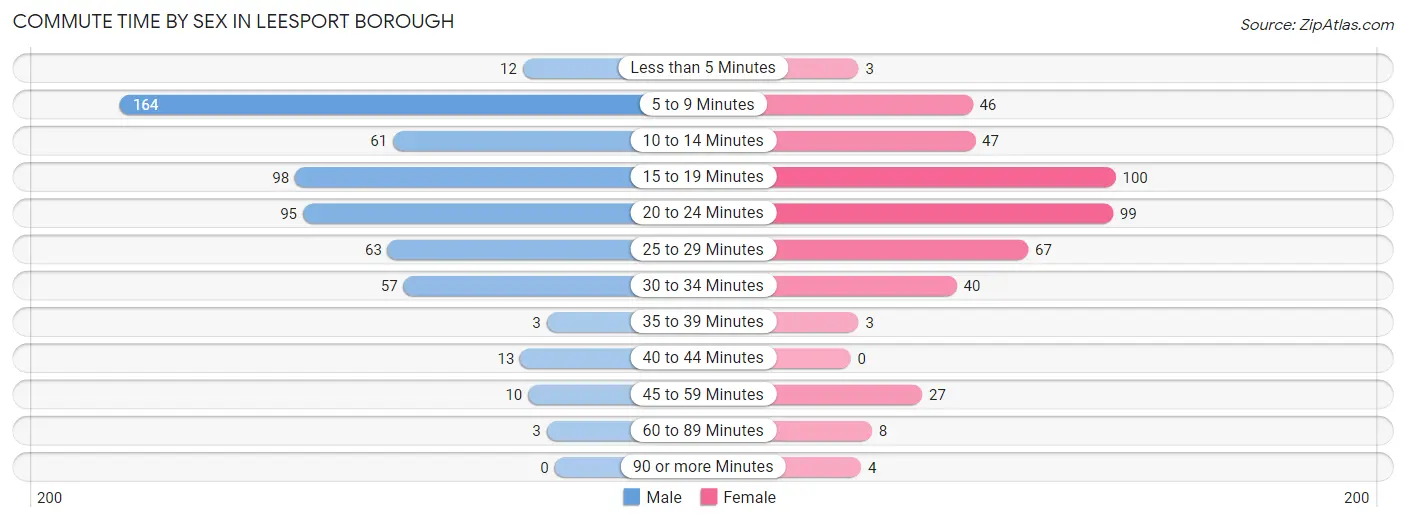
| Commute Time | Male | Female |
| Less than 5 Minutes | 12 (2.1%) | 3 (0.7%) |
| 5 to 9 Minutes | 164 (28.3%) | 46 (10.4%) |
| 10 to 14 Minutes | 61 (10.5%) | 47 (10.6%) |
| 15 to 19 Minutes | 98 (16.9%) | 100 (22.5%) |
| 20 to 24 Minutes | 95 (16.4%) | 99 (22.3%) |
| 25 to 29 Minutes | 63 (10.9%) | 67 (15.1%) |
| 30 to 34 Minutes | 57 (9.8%) | 40 (9.0%) |
| 35 to 39 Minutes | 3 (0.5%) | 3 (0.7%) |
| 40 to 44 Minutes | 13 (2.2%) | 0 (0.0%) |
| 45 to 59 Minutes | 10 (1.7%) | 27 (6.1%) |
| 60 to 89 Minutes | 3 (0.5%) | 8 (1.8%) |
| 90 or more Minutes | 0 (0.0%) | 4 (0.9%) |
Time of Departure to Work by Sex in Leesport borough
The most frequent times of departure to work in Leesport borough are 7:00 AM to 7:29 AM (127, 21.9%) for males and 6:30 AM to 6:59 AM (105, 23.6%) for females.
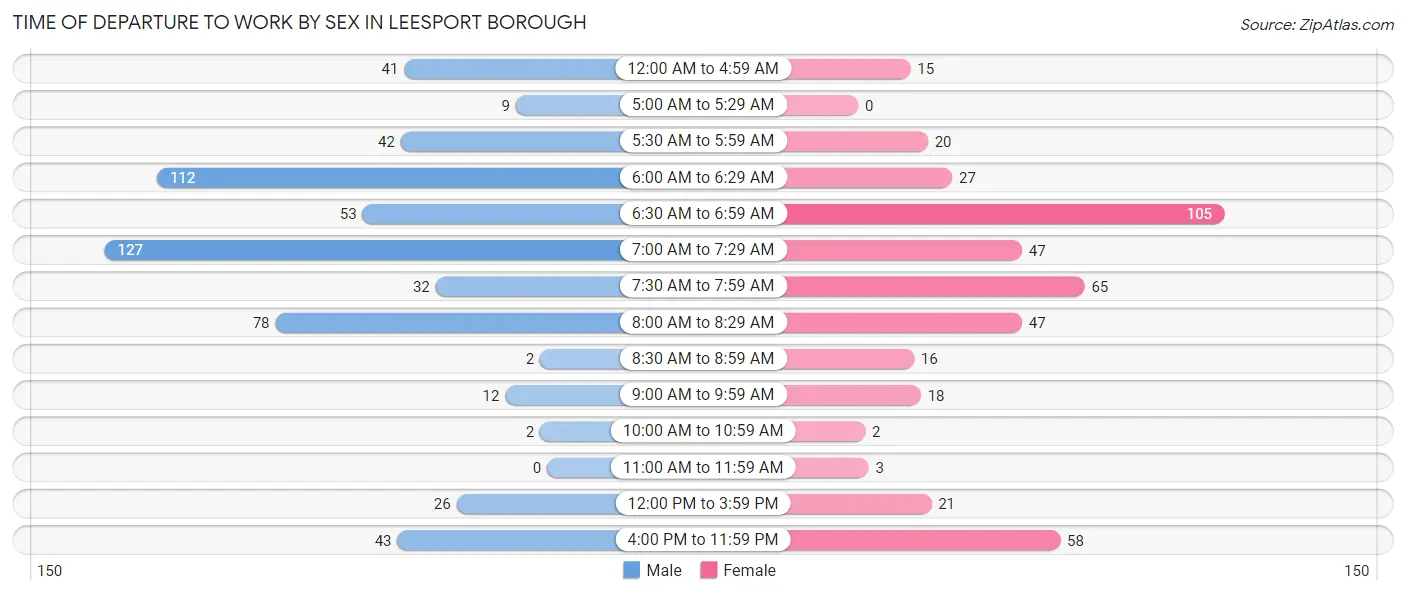
| Time of Departure | Male | Female |
| 12:00 AM to 4:59 AM | 41 (7.1%) | 15 (3.4%) |
| 5:00 AM to 5:29 AM | 9 (1.5%) | 0 (0.0%) |
| 5:30 AM to 5:59 AM | 42 (7.2%) | 20 (4.5%) |
| 6:00 AM to 6:29 AM | 112 (19.3%) | 27 (6.1%) |
| 6:30 AM to 6:59 AM | 53 (9.1%) | 105 (23.6%) |
| 7:00 AM to 7:29 AM | 127 (21.9%) | 47 (10.6%) |
| 7:30 AM to 7:59 AM | 32 (5.5%) | 65 (14.6%) |
| 8:00 AM to 8:29 AM | 78 (13.5%) | 47 (10.6%) |
| 8:30 AM to 8:59 AM | 2 (0.4%) | 16 (3.6%) |
| 9:00 AM to 9:59 AM | 12 (2.1%) | 18 (4.1%) |
| 10:00 AM to 10:59 AM | 2 (0.4%) | 2 (0.4%) |
| 11:00 AM to 11:59 AM | 0 (0.0%) | 3 (0.7%) |
| 12:00 PM to 3:59 PM | 26 (4.5%) | 21 (4.7%) |
| 4:00 PM to 11:59 PM | 43 (7.4%) | 58 (13.1%) |
| Total | 579 (100.0%) | 444 (100.0%) |
Housing Occupancy in Leesport borough
Occupancy by Ownership in Leesport borough
Of the total 736 dwellings in Leesport borough, owner-occupied units account for 584 (79.3%), while renter-occupied units make up 152 (20.6%).
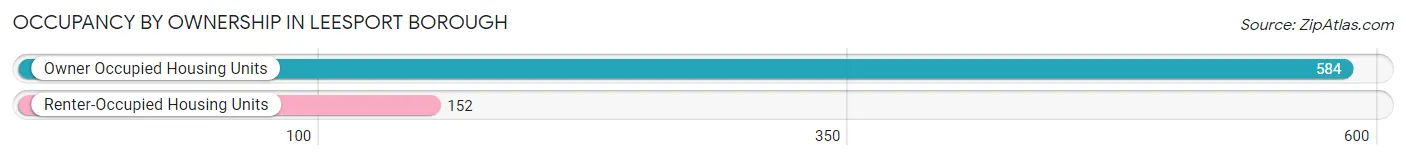
| Occupancy | # Housing Units | % Housing Units |
| Owner Occupied Housing Units | 584 | 79.3% |
| Renter-Occupied Housing Units | 152 | 20.6% |
| Total Occupied Housing Units | 736 | 100.0% |
Occupancy by Household Size in Leesport borough
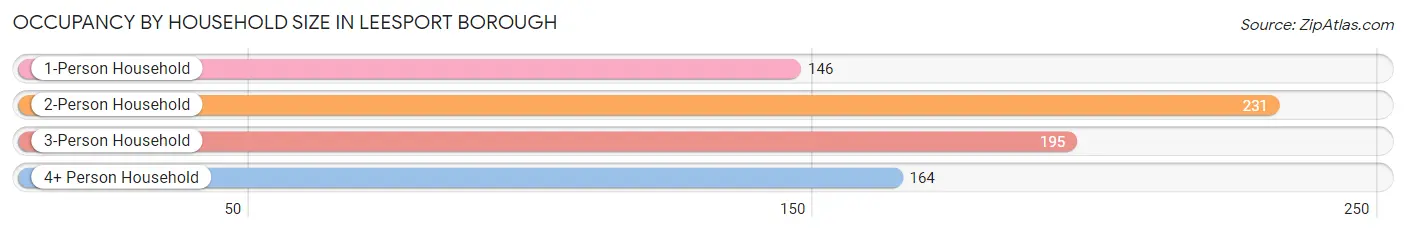
| Household Size | # Housing Units | % Housing Units |
| 1-Person Household | 146 | 19.8% |
| 2-Person Household | 231 | 31.4% |
| 3-Person Household | 195 | 26.5% |
| 4+ Person Household | 164 | 22.3% |
| Total Housing Units | 736 | 100.0% |
Occupancy by Ownership by Household Size in Leesport borough
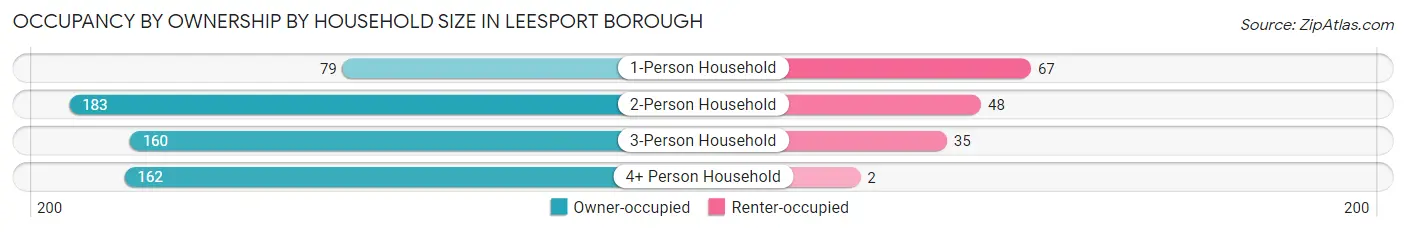
| Household Size | Owner-occupied | Renter-occupied |
| 1-Person Household | 79 (54.1%) | 67 (45.9%) |
| 2-Person Household | 183 (79.2%) | 48 (20.8%) |
| 3-Person Household | 160 (82.1%) | 35 (17.9%) |
| 4+ Person Household | 162 (98.8%) | 2 (1.2%) |
| Total Housing Units | 584 (79.3%) | 152 (20.6%) |
Occupancy by Educational Attainment in Leesport borough
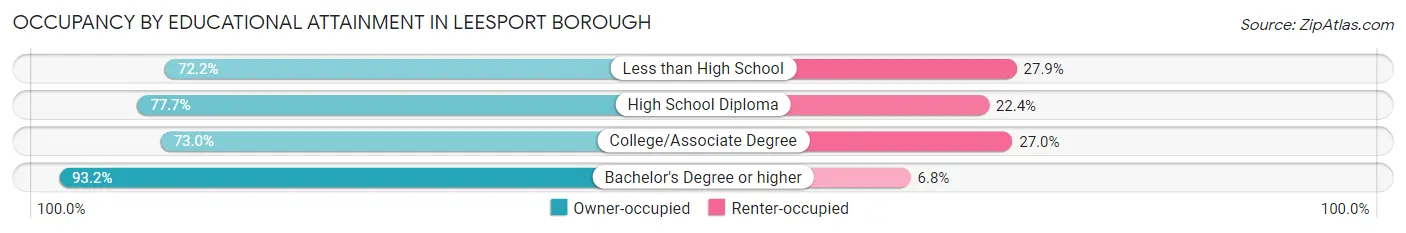
| Household Size | Owner-occupied | Renter-occupied |
| Less than High School | 57 (72.2%) | 22 (27.9%) |
| High School Diploma | 198 (77.6%) | 57 (22.4%) |
| College/Associate Degree | 165 (73.0%) | 61 (27.0%) |
| Bachelor's Degree or higher | 164 (93.2%) | 12 (6.8%) |
Occupancy by Age of Householder in Leesport borough
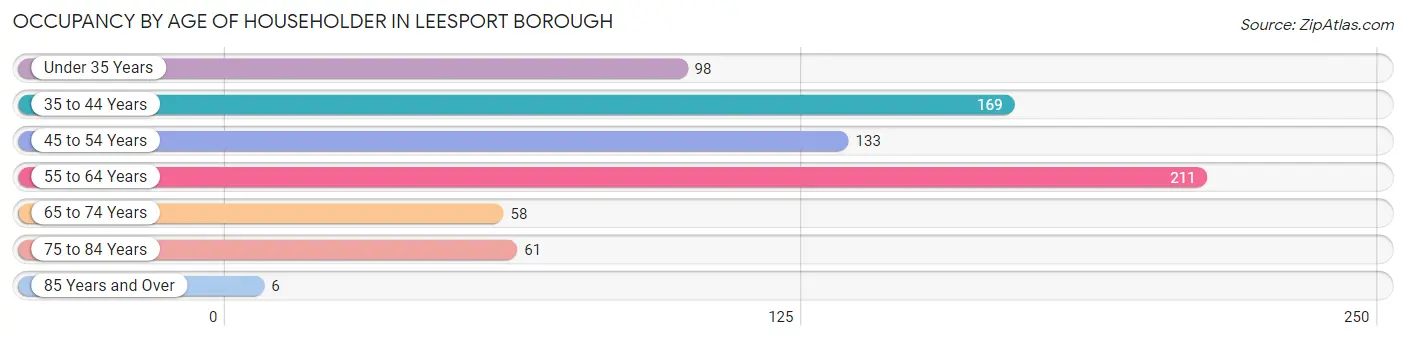
| Age Bracket | # Households | % Households |
| Under 35 Years | 98 | 13.3% |
| 35 to 44 Years | 169 | 23.0% |
| 45 to 54 Years | 133 | 18.1% |
| 55 to 64 Years | 211 | 28.7% |
| 65 to 74 Years | 58 | 7.9% |
| 75 to 84 Years | 61 | 8.3% |
| 85 Years and Over | 6 | 0.8% |
| Total | 736 | 100.0% |
Housing Finances in Leesport borough
Median Income by Occupancy in Leesport borough
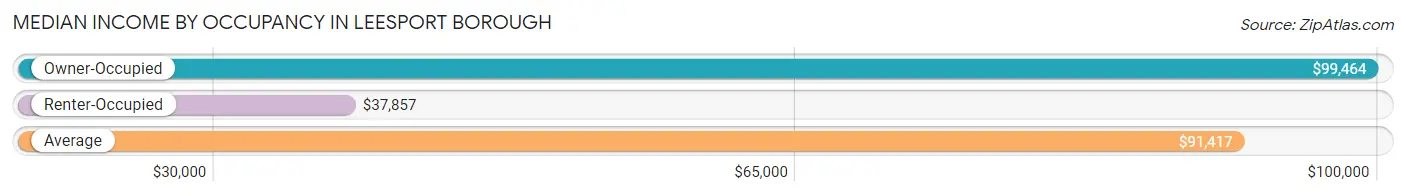
| Occupancy Type | # Households | Median Income |
| Owner-Occupied | 584 (79.3%) | $99,464 |
| Renter-Occupied | 152 (20.6%) | $37,857 |
| Average | 736 (100.0%) | $91,417 |
Occupancy by Householder Income Bracket in Leesport borough
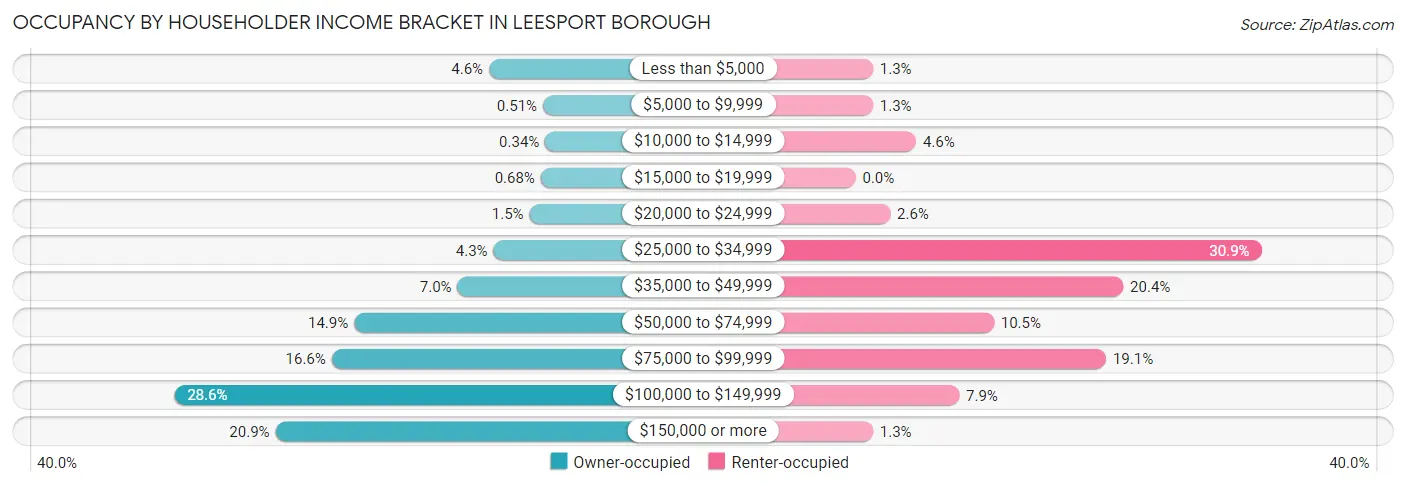
| Income Bracket | Owner-occupied | Renter-occupied |
| Less than $5,000 | 27 (4.6%) | 2 (1.3%) |
| $5,000 to $9,999 | 3 (0.5%) | 2 (1.3%) |
| $10,000 to $14,999 | 2 (0.3%) | 7 (4.6%) |
| $15,000 to $19,999 | 4 (0.7%) | 0 (0.0%) |
| $20,000 to $24,999 | 9 (1.5%) | 4 (2.6%) |
| $25,000 to $34,999 | 25 (4.3%) | 47 (30.9%) |
| $35,000 to $49,999 | 41 (7.0%) | 31 (20.4%) |
| $50,000 to $74,999 | 87 (14.9%) | 16 (10.5%) |
| $75,000 to $99,999 | 97 (16.6%) | 29 (19.1%) |
| $100,000 to $149,999 | 167 (28.6%) | 12 (7.9%) |
| $150,000 or more | 122 (20.9%) | 2 (1.3%) |
| Total | 584 (100.0%) | 152 (100.0%) |
Monthly Housing Cost Tiers in Leesport borough
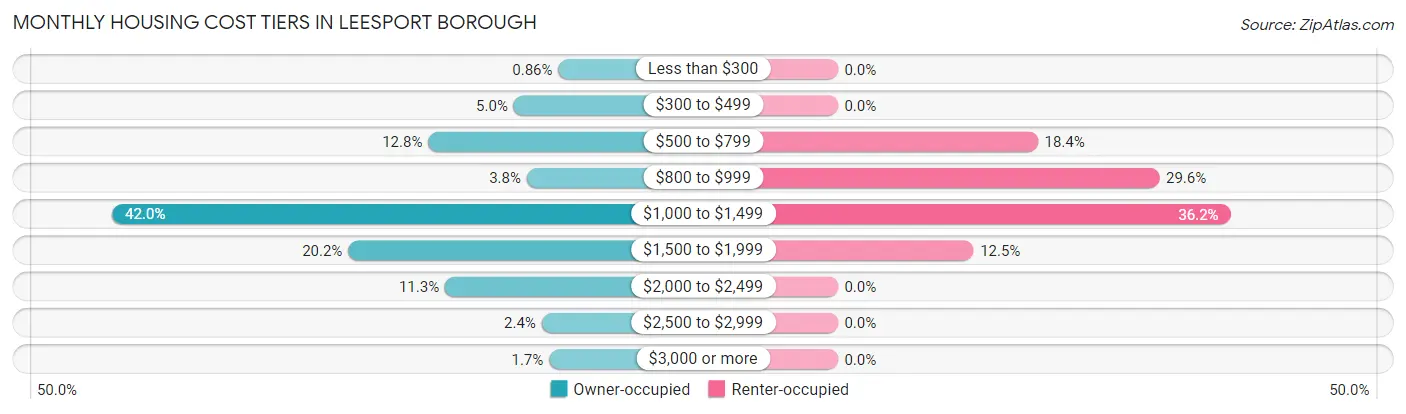
| Monthly Cost | Owner-occupied | Renter-occupied |
| Less than $300 | 5 (0.9%) | 0 (0.0%) |
| $300 to $499 | 29 (5.0%) | 0 (0.0%) |
| $500 to $799 | 75 (12.8%) | 28 (18.4%) |
| $800 to $999 | 22 (3.8%) | 45 (29.6%) |
| $1,000 to $1,499 | 245 (41.9%) | 55 (36.2%) |
| $1,500 to $1,999 | 118 (20.2%) | 19 (12.5%) |
| $2,000 to $2,499 | 66 (11.3%) | 0 (0.0%) |
| $2,500 to $2,999 | 14 (2.4%) | 0 (0.0%) |
| $3,000 or more | 10 (1.7%) | 0 (0.0%) |
| Total | 584 (100.0%) | 152 (100.0%) |
Physical Housing Characteristics in Leesport borough
Housing Structures in Leesport borough
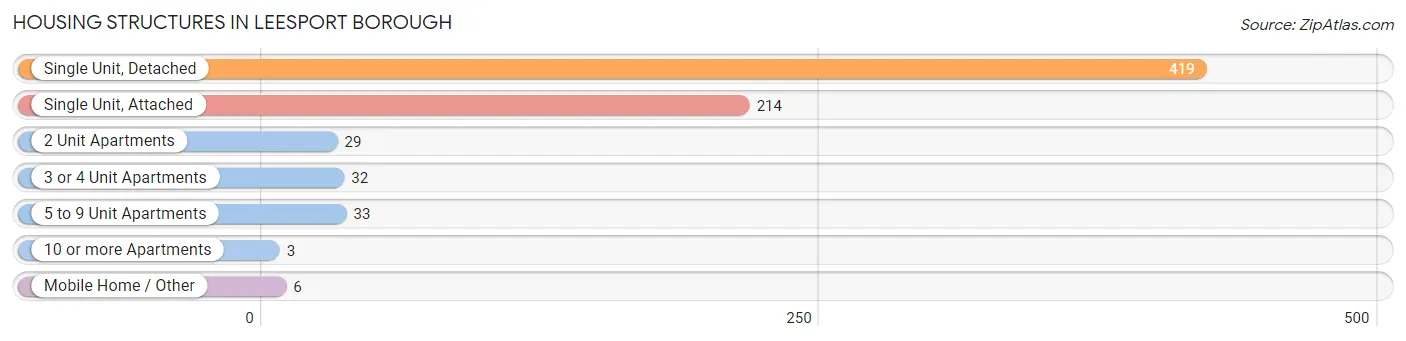
| Structure Type | # Housing Units | % Housing Units |
| Single Unit, Detached | 419 | 56.9% |
| Single Unit, Attached | 214 | 29.1% |
| 2 Unit Apartments | 29 | 3.9% |
| 3 or 4 Unit Apartments | 32 | 4.3% |
| 5 to 9 Unit Apartments | 33 | 4.5% |
| 10 or more Apartments | 3 | 0.4% |
| Mobile Home / Other | 6 | 0.8% |
| Total | 736 | 100.0% |
Housing Structures by Occupancy in Leesport borough
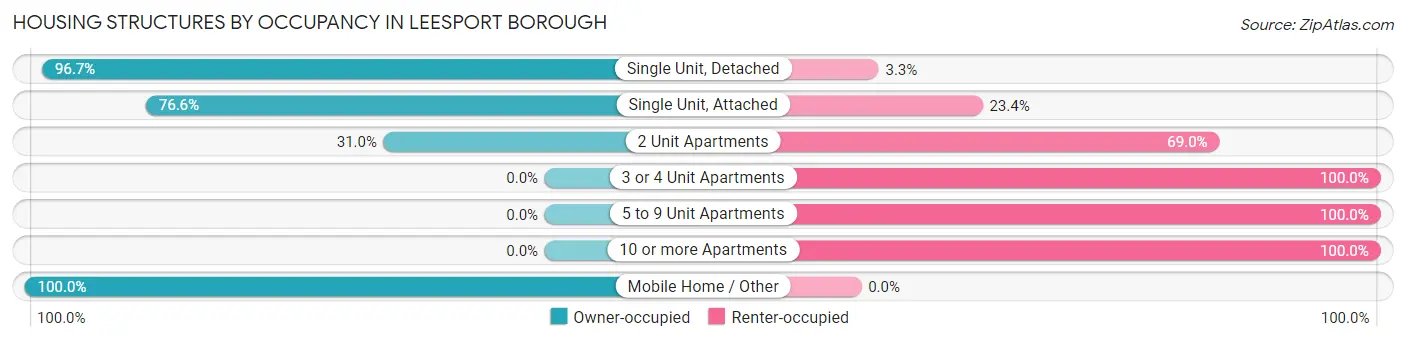
| Structure Type | Owner-occupied | Renter-occupied |
| Single Unit, Detached | 405 (96.7%) | 14 (3.3%) |
| Single Unit, Attached | 164 (76.6%) | 50 (23.4%) |
| 2 Unit Apartments | 9 (31.0%) | 20 (69.0%) |
| 3 or 4 Unit Apartments | 0 (0.0%) | 32 (100.0%) |
| 5 to 9 Unit Apartments | 0 (0.0%) | 33 (100.0%) |
| 10 or more Apartments | 0 (0.0%) | 3 (100.0%) |
| Mobile Home / Other | 6 (100.0%) | 0 (0.0%) |
| Total | 584 (79.3%) | 152 (20.6%) |
Housing Structures by Number of Rooms in Leesport borough
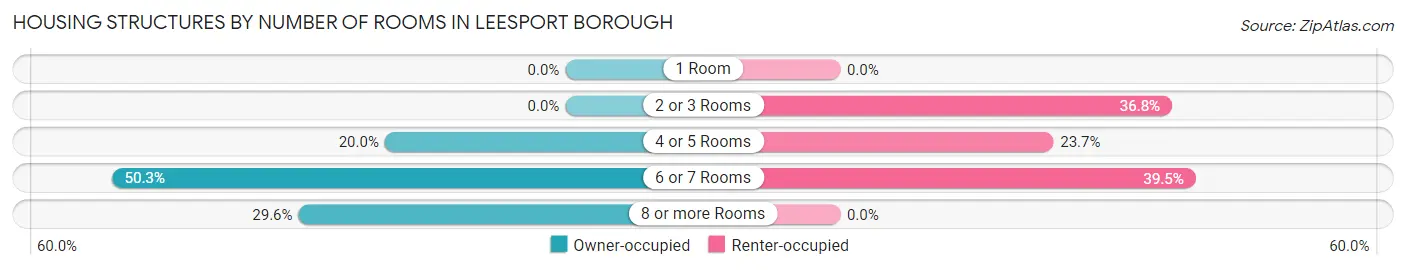
| Number of Rooms | Owner-occupied | Renter-occupied |
| 1 Room | 0 (0.0%) | 0 (0.0%) |
| 2 or 3 Rooms | 0 (0.0%) | 56 (36.8%) |
| 4 or 5 Rooms | 117 (20.0%) | 36 (23.7%) |
| 6 or 7 Rooms | 294 (50.3%) | 60 (39.5%) |
| 8 or more Rooms | 173 (29.6%) | 0 (0.0%) |
| Total | 584 (100.0%) | 152 (100.0%) |
Housing Structure by Heating Type in Leesport borough
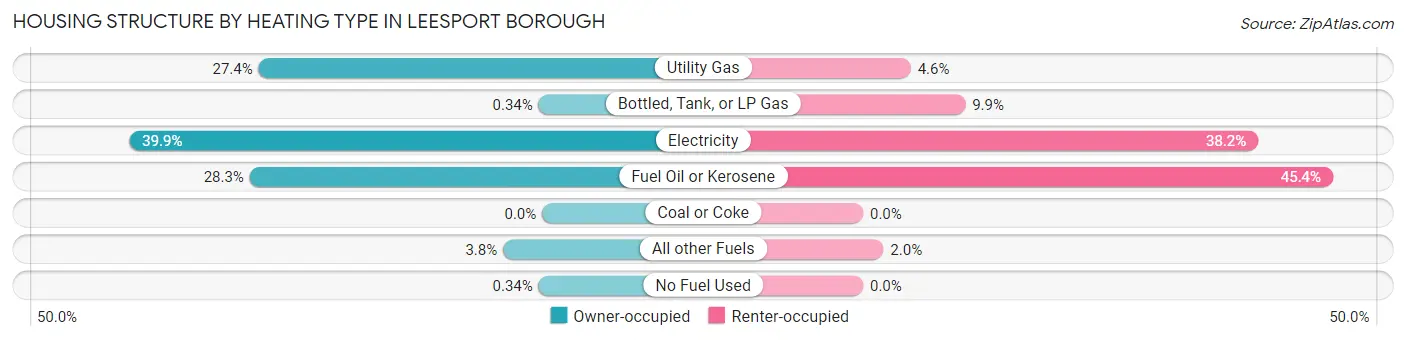
| Heating Type | Owner-occupied | Renter-occupied |
| Utility Gas | 160 (27.4%) | 7 (4.6%) |
| Bottled, Tank, or LP Gas | 2 (0.3%) | 15 (9.9%) |
| Electricity | 233 (39.9%) | 58 (38.2%) |
| Fuel Oil or Kerosene | 165 (28.2%) | 69 (45.4%) |
| Coal or Coke | 0 (0.0%) | 0 (0.0%) |
| All other Fuels | 22 (3.8%) | 3 (2.0%) |
| No Fuel Used | 2 (0.3%) | 0 (0.0%) |
| Total | 584 (100.0%) | 152 (100.0%) |
Household Vehicle Usage in Leesport borough
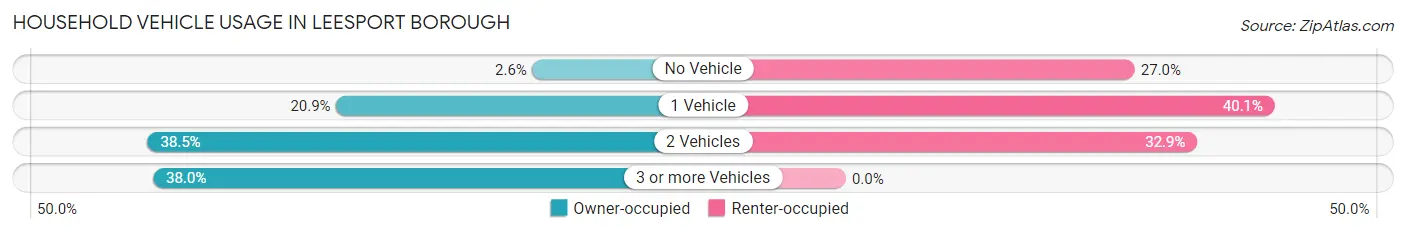
| Vehicles per Household | Owner-occupied | Renter-occupied |
| No Vehicle | 15 (2.6%) | 41 (27.0%) |
| 1 Vehicle | 122 (20.9%) | 61 (40.1%) |
| 2 Vehicles | 225 (38.5%) | 50 (32.9%) |
| 3 or more Vehicles | 222 (38.0%) | 0 (0.0%) |
| Total | 584 (100.0%) | 152 (100.0%) |
Real Estate & Mortgages in Leesport borough
Real Estate and Mortgage Overview in Leesport borough
| Characteristic | Without Mortgage | With Mortgage |
| Housing Units | 138 | 446 |
| Median Property Value | $175,000 | $190,800 |
| Median Household Income | $58,750 | $117 |
| Monthly Housing Costs | $615 | $10 |
| Real Estate Taxes | $3,435 | $2 |
Property Value by Mortgage Status in Leesport borough
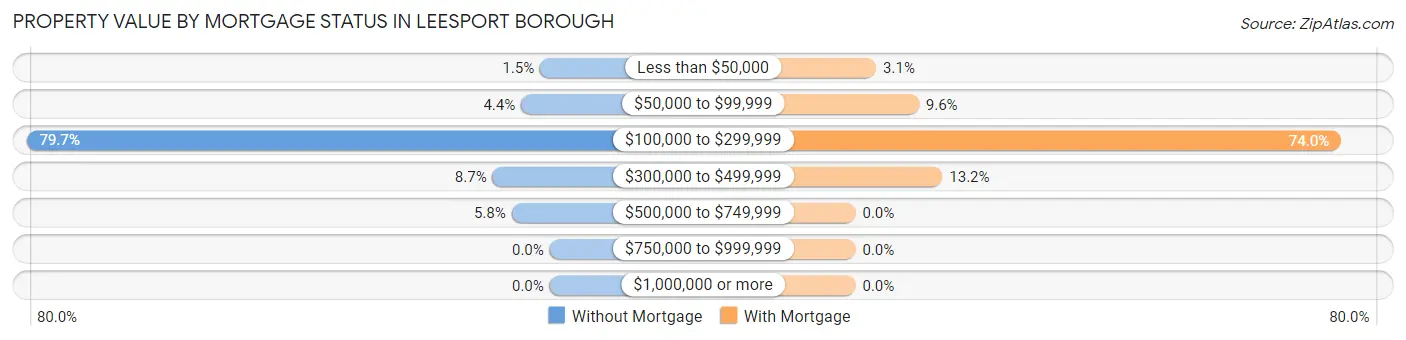
| Property Value | Without Mortgage | With Mortgage |
| Less than $50,000 | 2 (1.5%) | 14 (3.1%) |
| $50,000 to $99,999 | 6 (4.3%) | 43 (9.6%) |
| $100,000 to $299,999 | 110 (79.7%) | 330 (74.0%) |
| $300,000 to $499,999 | 12 (8.7%) | 59 (13.2%) |
| $500,000 to $749,999 | 8 (5.8%) | 0 (0.0%) |
| $750,000 to $999,999 | 0 (0.0%) | 0 (0.0%) |
| $1,000,000 or more | 0 (0.0%) | 0 (0.0%) |
| Total | 138 (100.0%) | 446 (100.0%) |
Household Income by Mortgage Status in Leesport borough
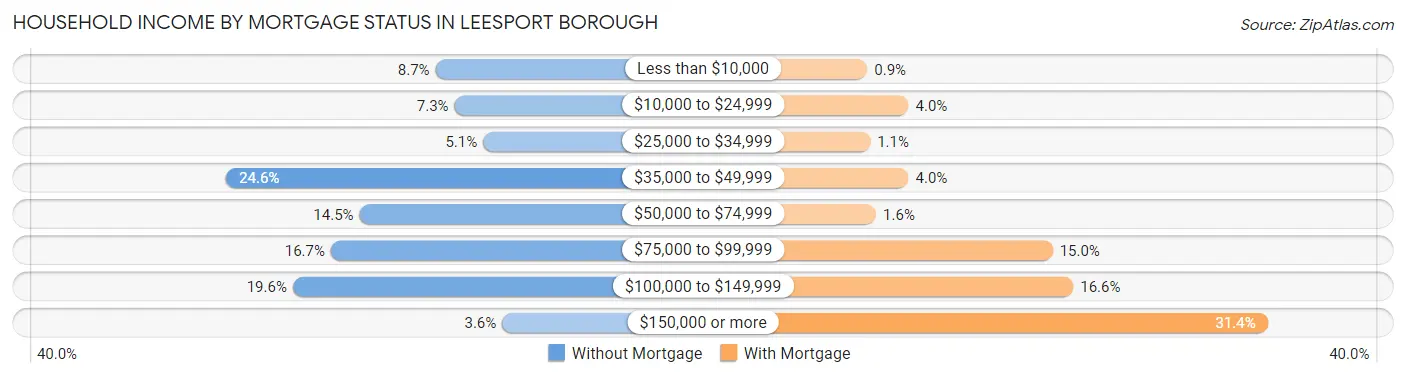
| Household Income | Without Mortgage | With Mortgage |
| Less than $10,000 | 12 (8.7%) | 4 (0.9%) |
| $10,000 to $24,999 | 10 (7.2%) | 18 (4.0%) |
| $25,000 to $34,999 | 7 (5.1%) | 5 (1.1%) |
| $35,000 to $49,999 | 34 (24.6%) | 18 (4.0%) |
| $50,000 to $74,999 | 20 (14.5%) | 7 (1.6%) |
| $75,000 to $99,999 | 23 (16.7%) | 67 (15.0%) |
| $100,000 to $149,999 | 27 (19.6%) | 74 (16.6%) |
| $150,000 or more | 5 (3.6%) | 140 (31.4%) |
| Total | 138 (100.0%) | 446 (100.0%) |
Property Value to Household Income Ratio in Leesport borough
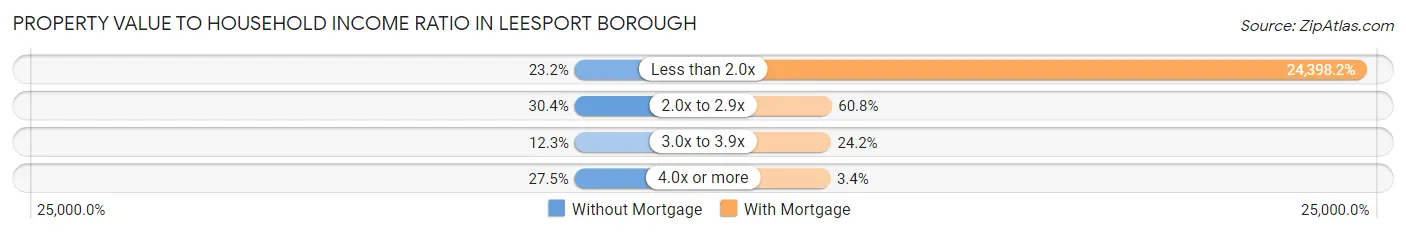
| Value-to-Income Ratio | Without Mortgage | With Mortgage |
| Less than 2.0x | 32 (23.2%) | 108,816 (24,398.2%) |
| 2.0x to 2.9x | 42 (30.4%) | 271 (60.8%) |
| 3.0x to 3.9x | 17 (12.3%) | 108 (24.2%) |
| 4.0x or more | 38 (27.5%) | 15 (3.4%) |
| Total | 138 (100.0%) | 446 (100.0%) |
Real Estate Taxes by Mortgage Status in Leesport borough
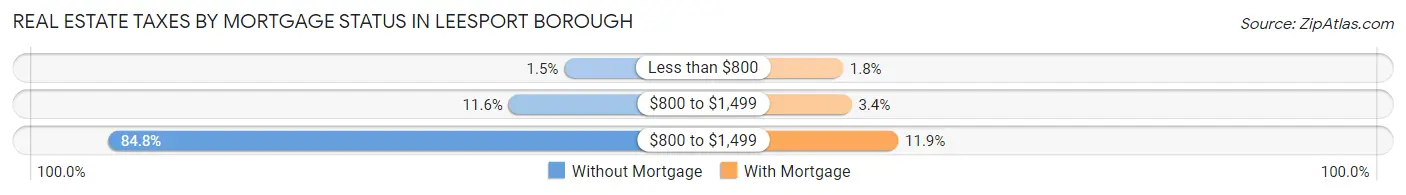
| Property Taxes | Without Mortgage | With Mortgage |
| Less than $800 | 2 (1.5%) | 8 (1.8%) |
| $800 to $1,499 | 16 (11.6%) | 15 (3.4%) |
| $800 to $1,499 | 117 (84.8%) | 53 (11.9%) |
| Total | 138 (100.0%) | 446 (100.0%) |
Health & Disability in Leesport borough
Health Insurance Coverage by Age in Leesport borough
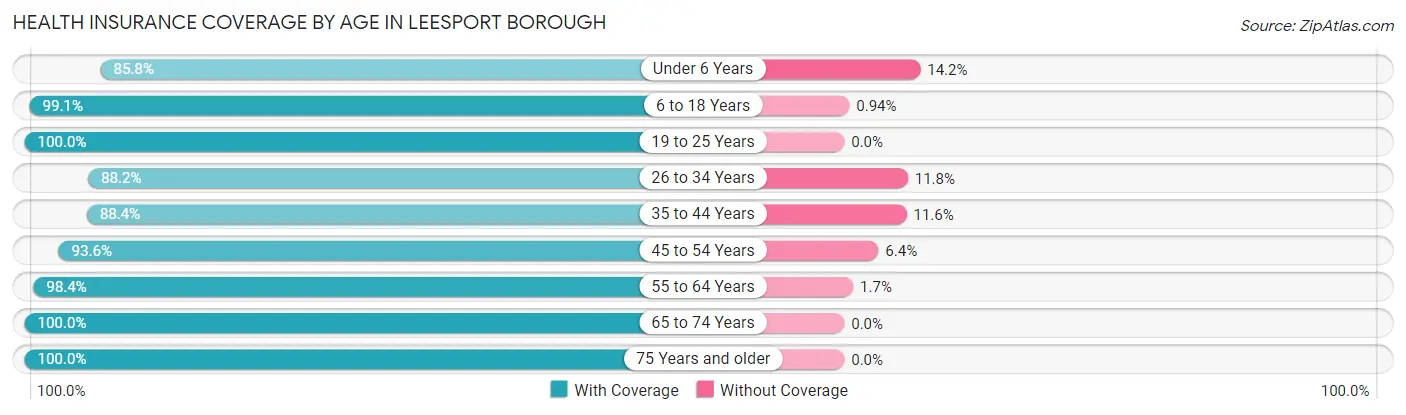
| Age Bracket | With Coverage | Without Coverage |
| Under 6 Years | 109 (85.8%) | 18 (14.2%) |
| 6 to 18 Years | 316 (99.1%) | 3 (0.9%) |
| 19 to 25 Years | 321 (100.0%) | 0 (0.0%) |
| 26 to 34 Years | 216 (88.2%) | 29 (11.8%) |
| 35 to 44 Years | 236 (88.4%) | 31 (11.6%) |
| 45 to 54 Years | 265 (93.6%) | 18 (6.4%) |
| 55 to 64 Years | 357 (98.4%) | 6 (1.7%) |
| 65 to 74 Years | 94 (100.0%) | 0 (0.0%) |
| 75 Years and older | 116 (100.0%) | 0 (0.0%) |
| Total | 2,030 (95.1%) | 105 (4.9%) |
Health Insurance Coverage by Citizenship Status in Leesport borough
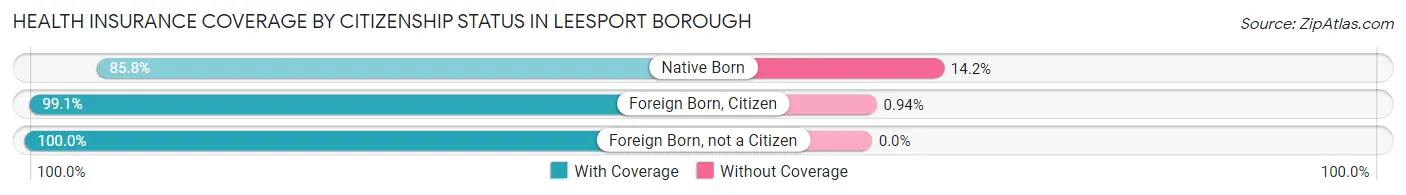
| Citizenship Status | With Coverage | Without Coverage |
| Native Born | 109 (85.8%) | 18 (14.2%) |
| Foreign Born, Citizen | 316 (99.1%) | 3 (0.9%) |
| Foreign Born, not a Citizen | 321 (100.0%) | 0 (0.0%) |
Health Insurance Coverage by Household Income in Leesport borough
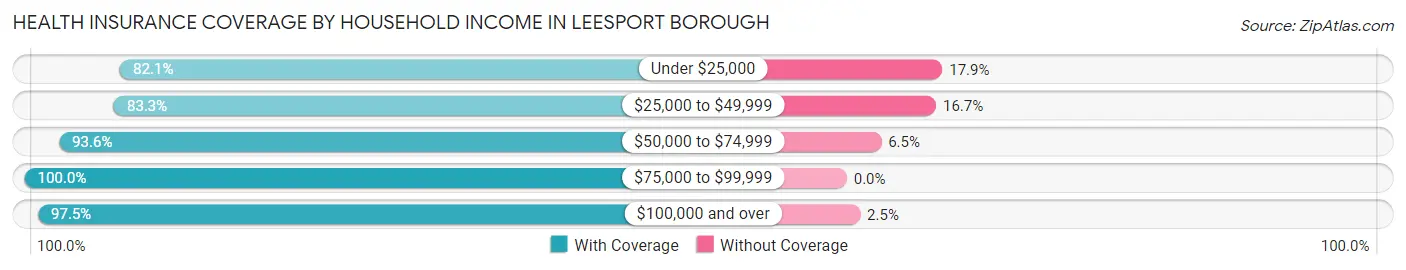
| Household Income | With Coverage | Without Coverage |
| Under $25,000 | 78 (82.1%) | 17 (17.9%) |
| $25,000 to $49,999 | 214 (83.3%) | 43 (16.7%) |
| $50,000 to $74,999 | 232 (93.5%) | 16 (6.5%) |
| $75,000 to $99,999 | 374 (100.0%) | 0 (0.0%) |
| $100,000 and over | 1,132 (97.5%) | 29 (2.5%) |
Public vs Private Health Insurance Coverage by Age in Leesport borough
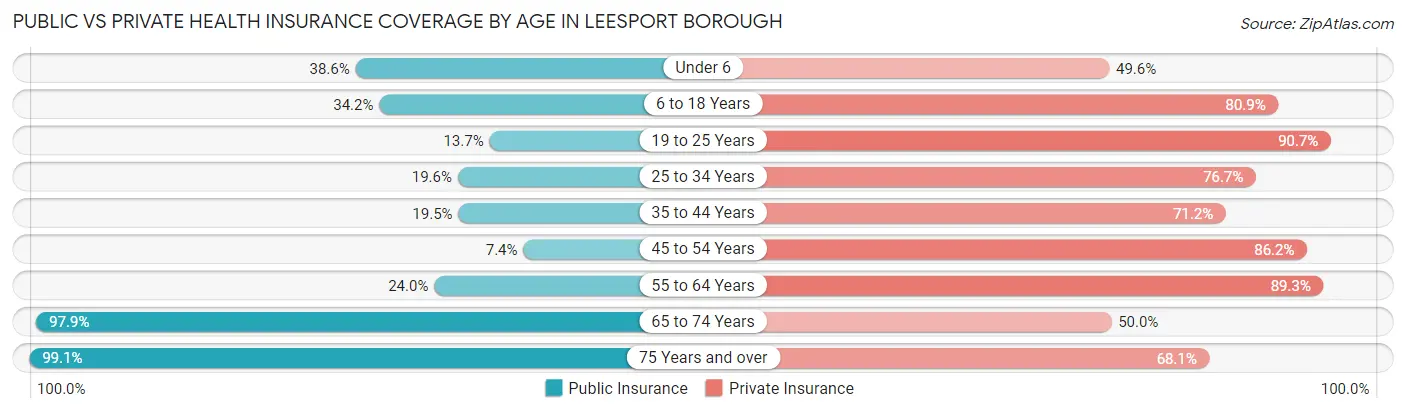
| Age Bracket | Public Insurance | Private Insurance |
| Under 6 | 49 (38.6%) | 63 (49.6%) |
| 6 to 18 Years | 109 (34.2%) | 258 (80.9%) |
| 19 to 25 Years | 44 (13.7%) | 291 (90.6%) |
| 25 to 34 Years | 48 (19.6%) | 188 (76.7%) |
| 35 to 44 Years | 52 (19.5%) | 190 (71.2%) |
| 45 to 54 Years | 21 (7.4%) | 244 (86.2%) |
| 55 to 64 Years | 87 (24.0%) | 324 (89.3%) |
| 65 to 74 Years | 92 (97.9%) | 47 (50.0%) |
| 75 Years and over | 115 (99.1%) | 79 (68.1%) |
| Total | 617 (28.9%) | 1,684 (78.9%) |
Disability Status by Sex by Age in Leesport borough
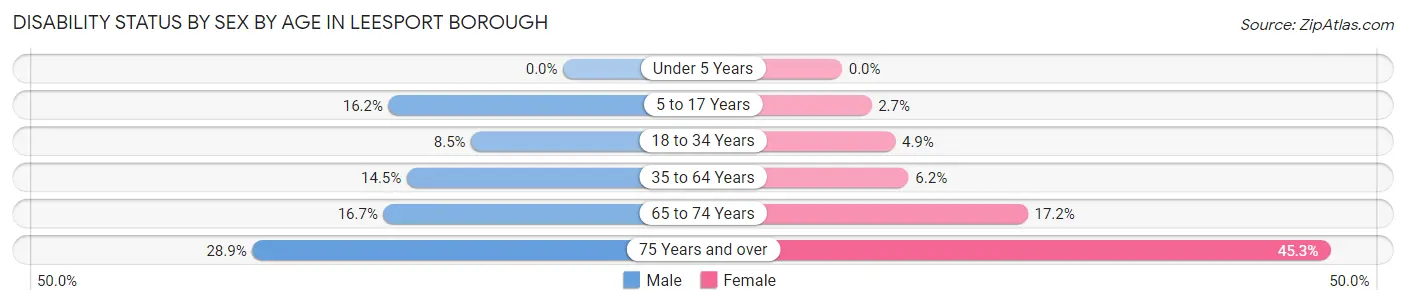
| Age Bracket | Male | Female |
| Under 5 Years | 0 (0.0%) | 0 (0.0%) |
| 5 to 17 Years | 29 (16.2%) | 3 (2.7%) |
| 18 to 34 Years | 32 (8.5%) | 12 (4.9%) |
| 35 to 64 Years | 69 (14.5%) | 27 (6.2%) |
| 65 to 74 Years | 6 (16.7%) | 10 (17.2%) |
| 75 Years and over | 15 (28.8%) | 29 (45.3%) |
Disability Class by Sex by Age in Leesport borough
Disability Class: Hearing Difficulty
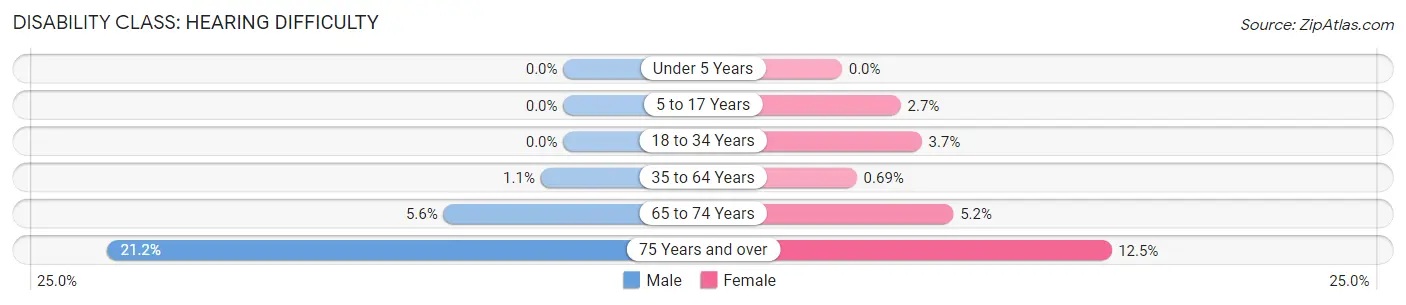
| Age Bracket | Male | Female |
| Under 5 Years | 0 (0.0%) | 0 (0.0%) |
| 5 to 17 Years | 0 (0.0%) | 3 (2.7%) |
| 18 to 34 Years | 0 (0.0%) | 9 (3.7%) |
| 35 to 64 Years | 5 (1.1%) | 3 (0.7%) |
| 65 to 74 Years | 2 (5.6%) | 3 (5.2%) |
| 75 Years and over | 11 (21.1%) | 8 (12.5%) |
Disability Class: Vision Difficulty
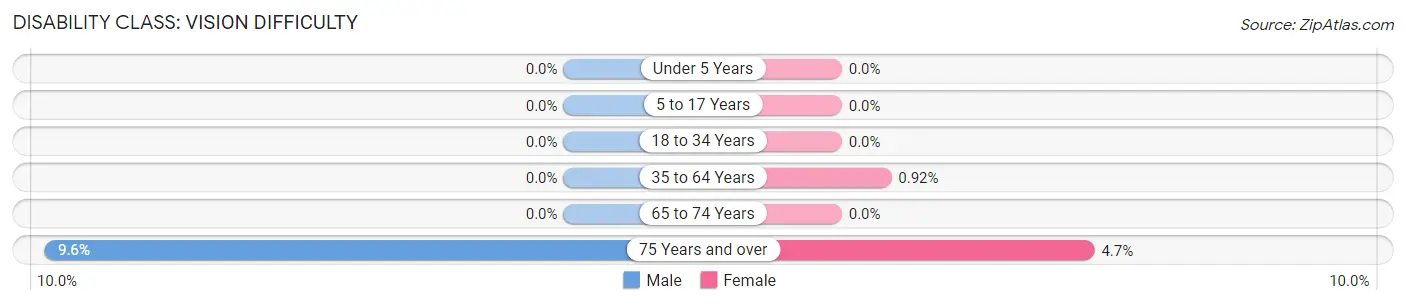
| Age Bracket | Male | Female |
| Under 5 Years | 0 (0.0%) | 0 (0.0%) |
| 5 to 17 Years | 0 (0.0%) | 0 (0.0%) |
| 18 to 34 Years | 0 (0.0%) | 0 (0.0%) |
| 35 to 64 Years | 0 (0.0%) | 4 (0.9%) |
| 65 to 74 Years | 0 (0.0%) | 0 (0.0%) |
| 75 Years and over | 5 (9.6%) | 3 (4.7%) |
Disability Class: Cognitive Difficulty
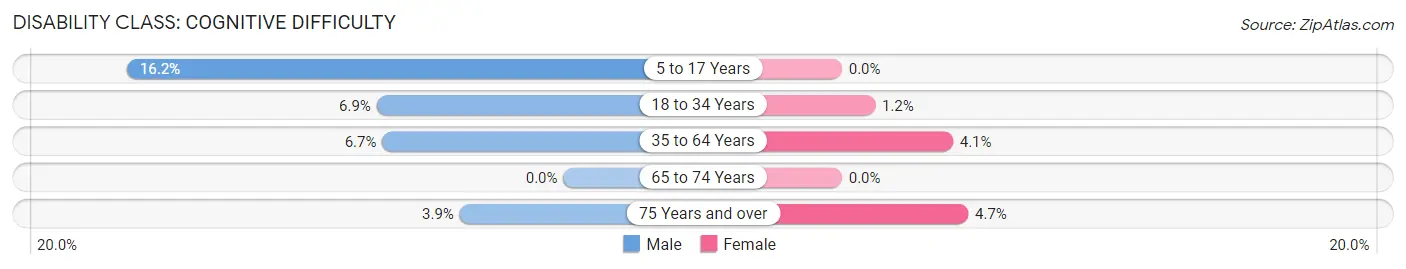
| Age Bracket | Male | Female |
| 5 to 17 Years | 29 (16.2%) | 0 (0.0%) |
| 18 to 34 Years | 26 (6.9%) | 3 (1.2%) |
| 35 to 64 Years | 32 (6.7%) | 18 (4.1%) |
| 65 to 74 Years | 0 (0.0%) | 0 (0.0%) |
| 75 Years and over | 2 (3.8%) | 3 (4.7%) |
Disability Class: Ambulatory Difficulty
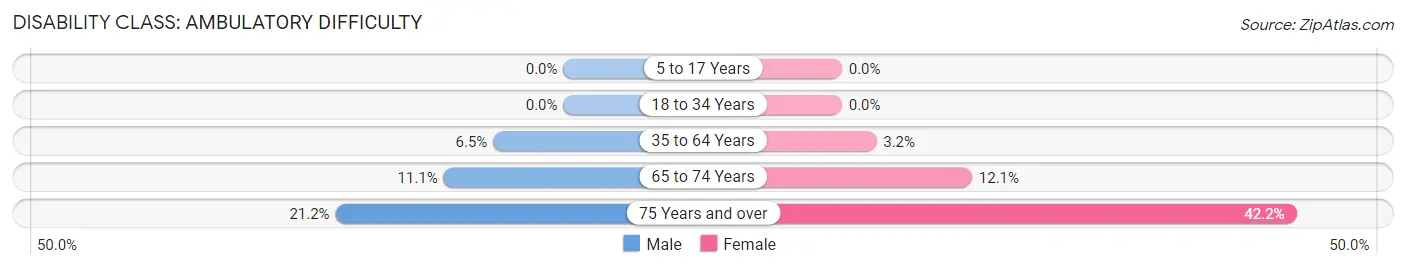
| Age Bracket | Male | Female |
| 5 to 17 Years | 0 (0.0%) | 0 (0.0%) |
| 18 to 34 Years | 0 (0.0%) | 0 (0.0%) |
| 35 to 64 Years | 31 (6.5%) | 14 (3.2%) |
| 65 to 74 Years | 4 (11.1%) | 7 (12.1%) |
| 75 Years and over | 11 (21.1%) | 27 (42.2%) |
Disability Class: Self-Care Difficulty
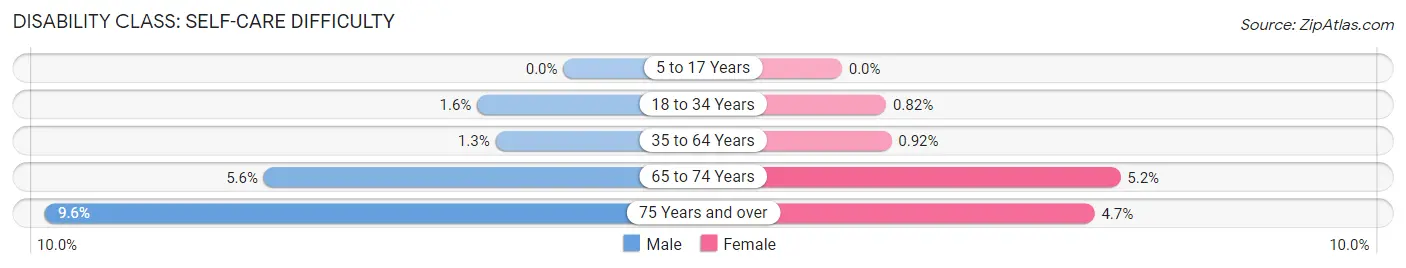
| Age Bracket | Male | Female |
| 5 to 17 Years | 0 (0.0%) | 0 (0.0%) |
| 18 to 34 Years | 6 (1.6%) | 2 (0.8%) |
| 35 to 64 Years | 6 (1.3%) | 4 (0.9%) |
| 65 to 74 Years | 2 (5.6%) | 3 (5.2%) |
| 75 Years and over | 5 (9.6%) | 3 (4.7%) |
Technology Access in Leesport borough
Computing Device Access in Leesport borough
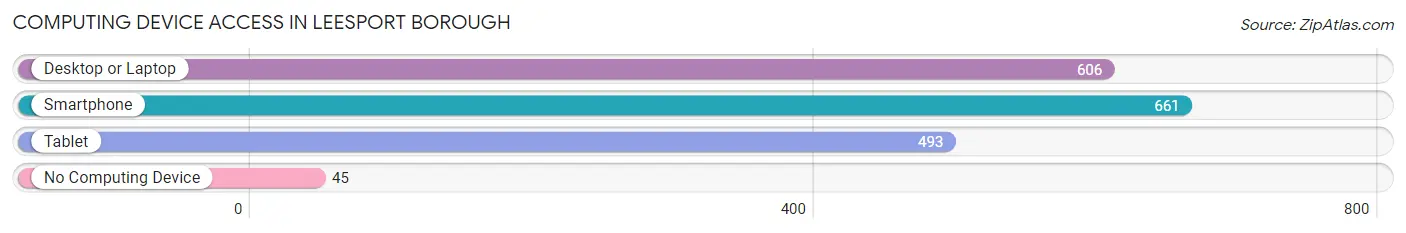
| Device Type | # Households | % Households |
| Desktop or Laptop | 606 | 82.3% |
| Smartphone | 661 | 89.8% |
| Tablet | 493 | 67.0% |
| No Computing Device | 45 | 6.1% |
| Total | 736 | 100.0% |
Internet Access in Leesport borough
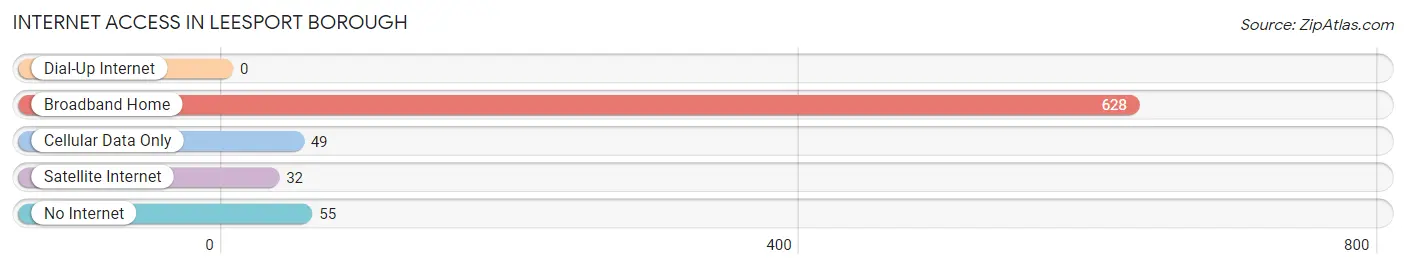
| Internet Type | # Households | % Households |
| Dial-Up Internet | 0 | 0.0% |
| Broadband Home | 628 | 85.3% |
| Cellular Data Only | 49 | 6.7% |
| Satellite Internet | 32 | 4.3% |
| No Internet | 55 | 7.5% |
| Total | 736 | 100.0% |
Leesport borough Summary
Leesport Borough is a small borough located in Berks County, Pennsylvania. It is situated in the Schuylkill River Valley, approximately 10 miles northwest of Reading. The borough was incorporated in 1891 and has a population of 1,845 as of the 2010 census.
History
Leesport Borough was founded in 1891 by a group of local businessmen who wanted to create a new town in the Schuylkill River Valley. The town was named after the Lees family, who had owned the land since the late 1700s. The Lees family had a long history in the area, having been among the first settlers in the region.
The town was originally a farming community, but it soon developed into a small industrial center. The first industry in the area was a flour mill, which was built in 1892. This was followed by a sawmill, a brickyard, and a tannery. The town also had a number of small businesses, including a general store, a blacksmith shop, and a hotel.
In the early 1900s, the town began to grow rapidly. The population increased from just over 500 in 1900 to over 1,000 by 1910. This growth was due in part to the construction of the Reading and Northern Railroad, which connected Leesport to Reading and other nearby towns.
Geography
Leesport Borough is located in the Schuylkill River Valley, approximately 10 miles northwest of Reading. The borough is situated on the east bank of the Schuylkill River, and is bordered by Ontelaunee Township to the north, Perry Township to the east, and Muhlenberg Township to the south. The borough covers an area of 1.2 square miles, and has a total population of 1,845 as of the 2010 census.
The borough is located in a rural area, and is surrounded by farmland and woodlands. The terrain is mostly flat, with some rolling hills in the northern part of the borough. The climate is humid continental, with hot summers and cold winters.
Economy
Leesport Borough has a small but diverse economy. The largest employers in the borough are the Leesport Market, a grocery store, and the Leesport Foundry, a metal fabrication plant. Other businesses in the borough include a number of small retail stores, restaurants, and professional services.
The borough also has a number of small manufacturing businesses, including a furniture factory, a printing company, and a plastics factory. The borough is also home to a number of farms, which produce a variety of crops, including corn, soybeans, and hay.
Demographics
As of the 2010 census, the population of Leesport Borough was 1,845. The racial makeup of the borough was 95.3% White, 1.2% African American, 0.3% Native American, 0.7% Asian, 0.1% Pacific Islander, 0.7% from other races, and 1.7% from two or more races. Hispanic or Latino of any race were 2.2% of the population.
The median household income in the borough was $45,938, and the median family income was $54,375. The per capita income was $21,945. About 8.3% of families and 10.2% of the population were below the poverty line, including 14.2% of those under age 18 and 5.2% of those age 65 or over.
Common Questions
What is Per Capita Income in Leesport borough?
Per Capita income in Leesport borough is $37,474.
What is the Median Family Income in Leesport borough?
Median Family Income in Leesport borough is $99,554.
What is the Median Household income in Leesport borough?
Median Household Income in Leesport borough is $91,417.
What is Income or Wage Gap in Leesport borough?
Income or Wage Gap in Leesport borough is 18.5%.
Women in Leesport borough earn 81.5 cents for every dollar earned by a man.
What is Inequality or Gini Index in Leesport borough?
Inequality or Gini Index in Leesport borough is 0.41.
What is the Total Population of Leesport borough?
Total Population of Leesport borough is 2,139.
What is the Total Male Population of Leesport borough?
Total Male Population of Leesport borough is 1,205.
What is the Total Female Population of Leesport borough?
Total Female Population of Leesport borough is 934.
What is the Ratio of Males per 100 Females in Leesport borough?
There are 129.01 Males per 100 Females in Leesport borough.
What is the Ratio of Females per 100 Males in Leesport borough?
There are 77.51 Females per 100 Males in Leesport borough.
What is the Median Population Age in Leesport borough?
Median Population Age in Leesport borough is 37.9 Years.
What is the Average Family Size in Leesport borough
Average Family Size in Leesport borough is 3.4 People.
What is the Average Household Size in Leesport borough
Average Household Size in Leesport borough is 2.9 People.
How Large is the Labor Force in Leesport borough?
There are 1,246 People in the Labor Forcein in Leesport borough.
What is the Percentage of People in the Labor Force in Leesport borough?
70.1% of People are in the Labor Force in Leesport borough.
What is the Unemployment Rate in Leesport borough?
Unemployment Rate in Leesport borough is 6.2%.