Kingston borough, PA Map & Demographics
Kingston borough Overview
$35,136
PER CAPITA INCOME
$80,804
AVG FAMILY INCOME
$52,253
AVG HOUSEHOLD INCOME
29.2%
WAGE / INCOME GAP [ % ]
70.8¢/ $1
WAGE / INCOME GAP [ $ ]
$11,084
FAMILY INCOME DEFICIT
0.51
INEQUALITY / GINI INDEX
13,317
TOTAL POPULATION
6,276
MALE POPULATION
7,041
FEMALE POPULATION
89.14
MALES / 100 FEMALES
112.19
FEMALES / 100 MALES
37.6
MEDIAN AGE
3.2
AVG FAMILY SIZE
2.2
AVG HOUSEHOLD SIZE
6,931
LABOR FORCE [ PEOPLE ]
65.3%
PERCENT IN LABOR FORCE
5.3%
UNEMPLOYMENT RATE
Income in Kingston borough
Income Overview in Kingston borough
Per Capita Income in Kingston borough is $35,136, while median incomes of families and households are $80,804 and $52,253 respectively.
| Characteristic | Number | Measure |
| Per Capita Income | 13,317 | $35,136 |
| Median Family Income | 2,898 | $80,804 |
| Mean Family Income | 2,898 | $103,719 |
| Median Household Income | 5,895 | $52,253 |
| Mean Household Income | 5,895 | $77,196 |
| Income Deficit | 2,898 | $11,084 |
| Wage / Income Gap (%) | 13,317 | 29.16% |
| Wage / Income Gap ($) | 13,317 | 70.84¢ per $1 |
| Gini / Inequality Index | 13,317 | 0.51 |
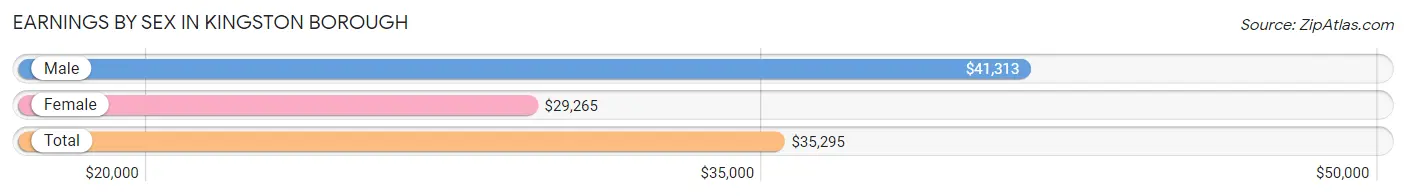
Earnings by Sex in Kingston borough
Average Earnings in Kingston borough are $35,295, $41,313 for men and $29,265 for women, a difference of 29.2%.
| Sex | Number | Average Earnings |
| Male | 3,668 (51.4%) | $41,313 |
| Female | 3,467 (48.6%) | $29,265 |
| Total | 7,135 (100.0%) | $35,295 |
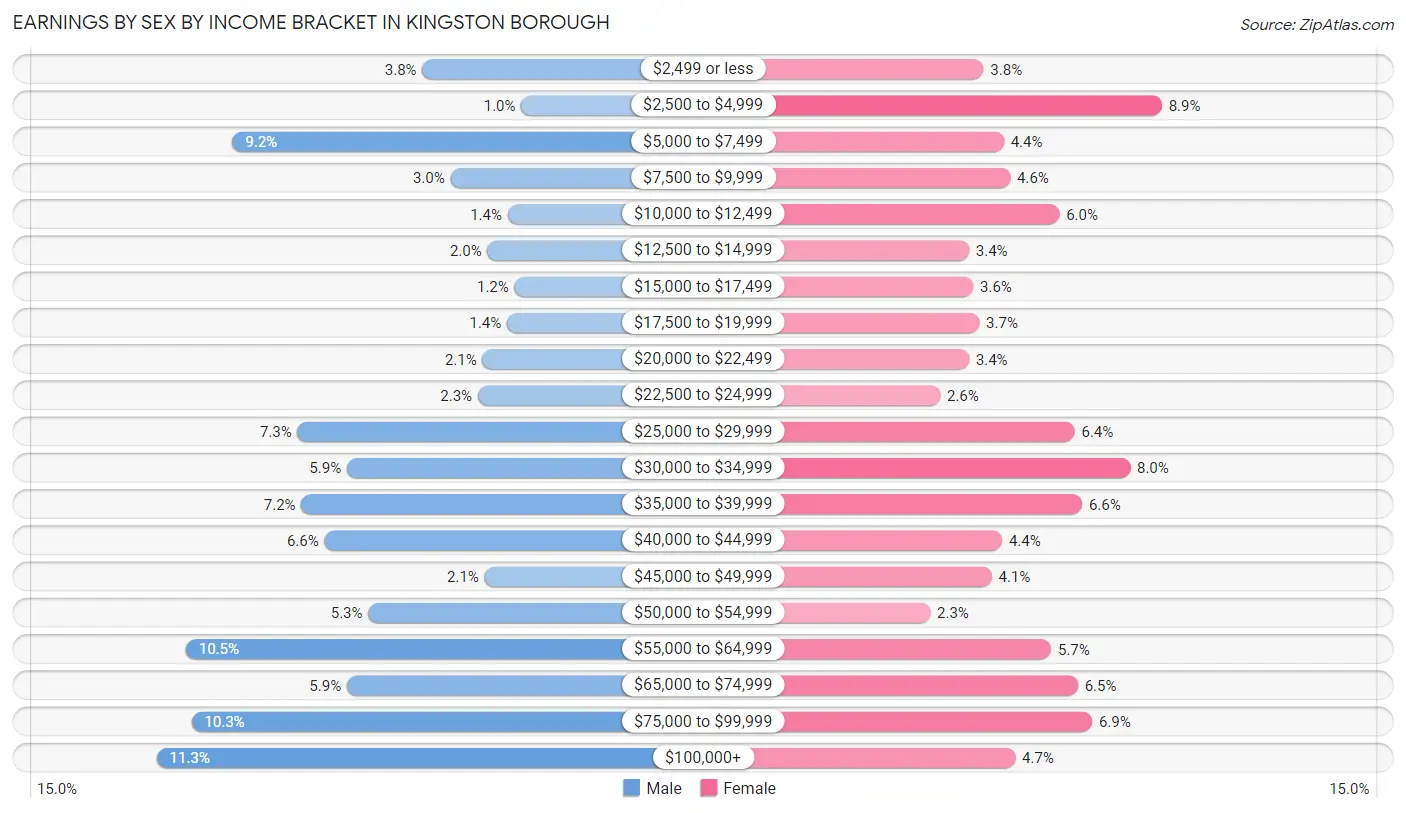
Earnings by Sex by Income Bracket in Kingston borough
The most common earnings brackets in Kingston borough are $100,000+ for men (414 | 11.3%) and $2,500 to $4,999 for women (307 | 8.8%).
| Income | Male | Female |
| $2,499 or less | 140 (3.8%) | 133 (3.8%) |
| $2,500 to $4,999 | 38 (1.0%) | 307 (8.8%) |
| $5,000 to $7,499 | 336 (9.2%) | 153 (4.4%) |
| $7,500 to $9,999 | 111 (3.0%) | 159 (4.6%) |
| $10,000 to $12,499 | 52 (1.4%) | 207 (6.0%) |
| $12,500 to $14,999 | 73 (2.0%) | 119 (3.4%) |
| $15,000 to $17,499 | 45 (1.2%) | 123 (3.5%) |
| $17,500 to $19,999 | 53 (1.4%) | 129 (3.7%) |
| $20,000 to $22,499 | 78 (2.1%) | 119 (3.4%) |
| $22,500 to $24,999 | 83 (2.3%) | 91 (2.6%) |
| $25,000 to $29,999 | 269 (7.3%) | 222 (6.4%) |
| $30,000 to $34,999 | 218 (5.9%) | 276 (8.0%) |
| $35,000 to $39,999 | 265 (7.2%) | 229 (6.6%) |
| $40,000 to $44,999 | 241 (6.6%) | 151 (4.4%) |
| $45,000 to $49,999 | 76 (2.1%) | 141 (4.1%) |
| $50,000 to $54,999 | 196 (5.3%) | 81 (2.3%) |
| $55,000 to $64,999 | 384 (10.5%) | 199 (5.7%) |
| $65,000 to $74,999 | 218 (5.9%) | 225 (6.5%) |
| $75,000 to $99,999 | 378 (10.3%) | 239 (6.9%) |
| $100,000+ | 414 (11.3%) | 164 (4.7%) |
| Total | 3,668 (100.0%) | 3,467 (100.0%) |
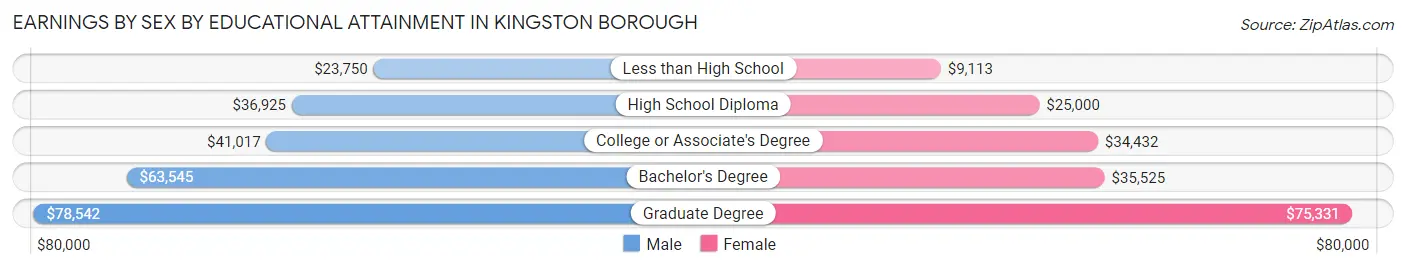
Earnings by Sex by Educational Attainment in Kingston borough
Average earnings in Kingston borough are $46,310 for men and $34,589 for women, a difference of 25.3%. Men with an educational attainment of graduate degree enjoy the highest average annual earnings of $78,542, while those with less than high school education earn the least with $23,750. Women with an educational attainment of graduate degree earn the most with the average annual earnings of $75,331, while those with less than high school education have the smallest earnings of $9,113.
| Educational Attainment | Male Income | Female Income |
| Less than High School | $23,750 | $9,113 |
| High School Diploma | $36,925 | $25,000 |
| College or Associate's Degree | $41,017 | $34,432 |
| Bachelor's Degree | $63,545 | $35,525 |
| Graduate Degree | $78,542 | $75,331 |
| Total | $46,310 | $34,589 |
Family Income in Kingston borough
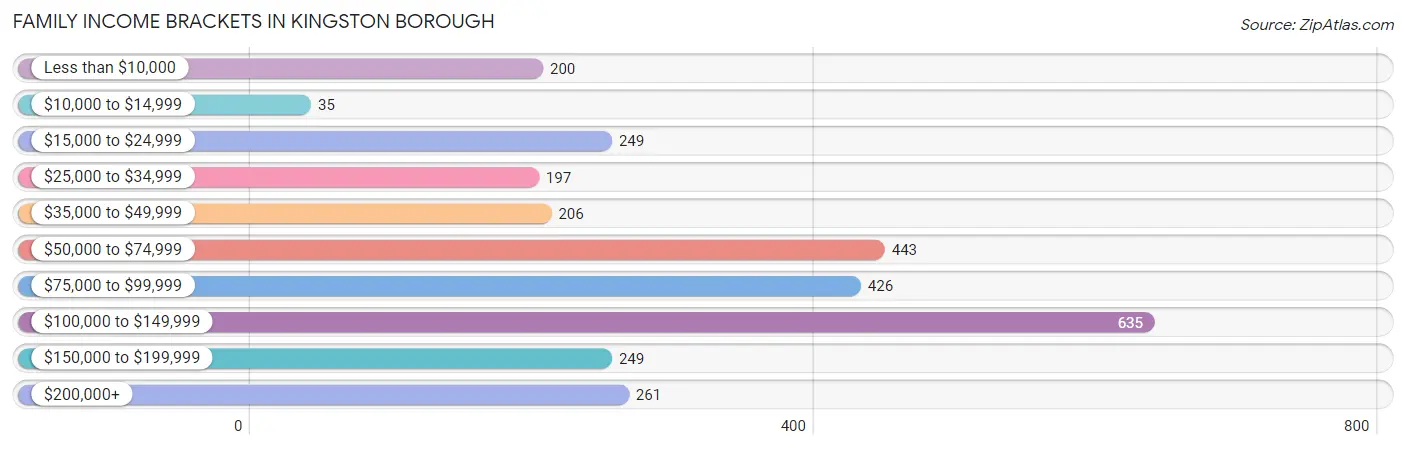
Family Income Brackets in Kingston borough
According to the Kingston borough family income data, there are 635 families falling into the $100,000 to $149,999 income range, which is the most common income bracket and makes up 21.9% of all families. Conversely, the $10,000 to $14,999 income bracket is the least frequent group with only 35 families (1.2%) belonging to this category.
| Income Bracket | # Families | % Families |
| Less than $10,000 | 200 | 6.9% |
| $10,000 to $14,999 | 35 | 1.2% |
| $15,000 to $24,999 | 249 | 8.6% |
| $25,000 to $34,999 | 197 | 6.8% |
| $35,000 to $49,999 | 206 | 7.1% |
| $50,000 to $74,999 | 443 | 15.3% |
| $75,000 to $99,999 | 426 | 14.7% |
| $100,000 to $149,999 | 635 | 21.9% |
| $150,000 to $199,999 | 249 | 8.6% |
| $200,000+ | 261 | 9.0% |
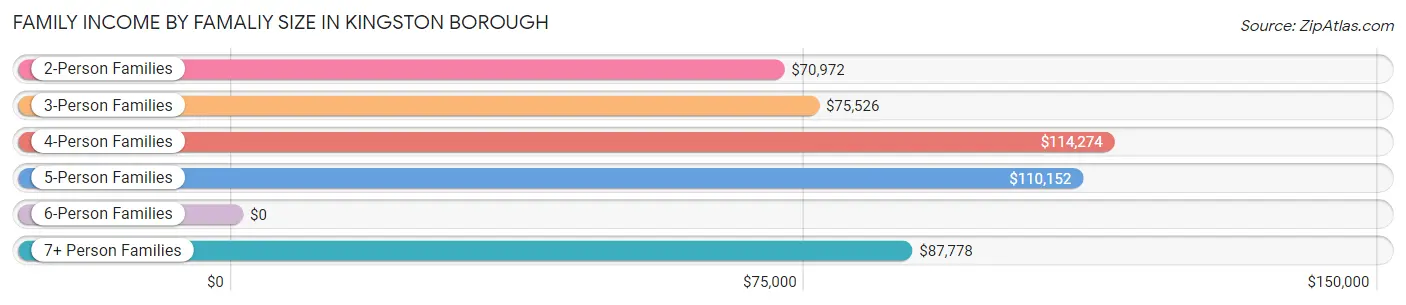
Family Income by Famaliy Size in Kingston borough
4-person families (570 | 19.7%) account for the highest median family income in Kingston borough with $114,274 per family, while 2-person families (1,417 | 48.9%) have the highest median income of $35,486 per family member.
| Income Bracket | # Families | Median Income |
| 2-Person Families | 1,417 (48.9%) | $70,972 |
| 3-Person Families | 588 (20.3%) | $75,526 |
| 4-Person Families | 570 (19.7%) | $114,274 |
| 5-Person Families | 254 (8.8%) | $110,152 |
| 6-Person Families | 23 (0.8%) | $0 |
| 7+ Person Families | 46 (1.6%) | $87,778 |
| Total | 2,898 (100.0%) | $80,804 |
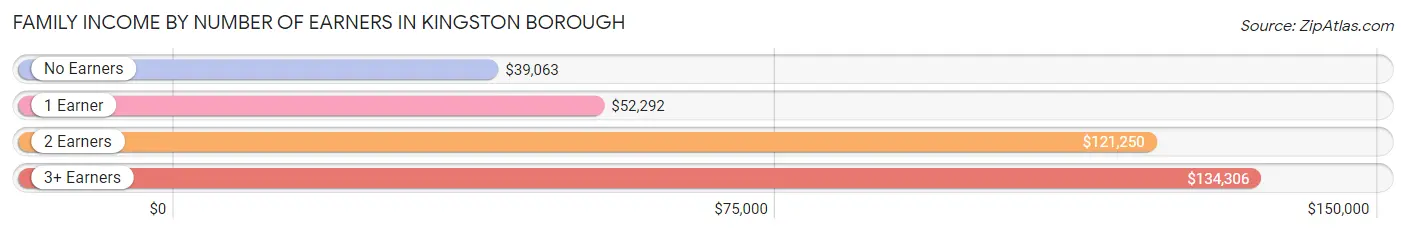
Family Income by Number of Earners in Kingston borough
The median family income in Kingston borough is $80,804, with families comprising 3+ earners (309) having the highest median family income of $134,306, while families with no earners (315) have the lowest median family income of $39,063, accounting for 10.7% and 10.9% of families, respectively.
| Number of Earners | # Families | Median Income |
| No Earners | 315 (10.9%) | $39,063 |
| 1 Earner | 1,089 (37.6%) | $52,292 |
| 2 Earners | 1,185 (40.9%) | $121,250 |
| 3+ Earners | 309 (10.7%) | $134,306 |
| Total | 2,898 (100.0%) | $80,804 |
Household Income in Kingston borough
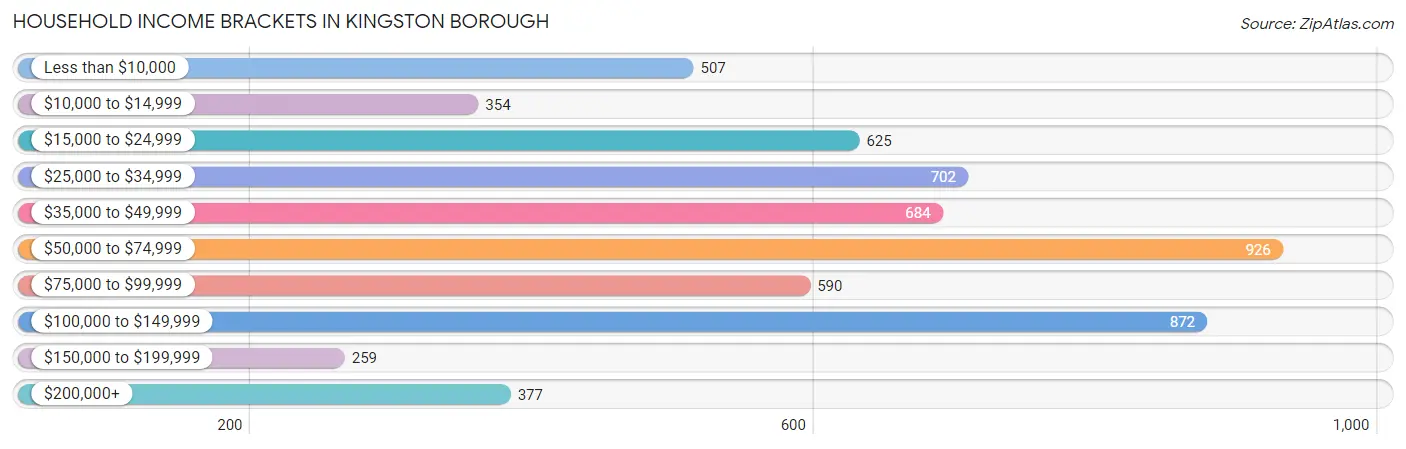
Household Income Brackets in Kingston borough
With 926 households falling in the category, the $50,000 to $74,999 income range is the most frequent in Kingston borough, accounting for 15.7% of all households. In contrast, only 259 households (4.4%) fall into the $150,000 to $199,999 income bracket, making it the least populous group.
| Income Bracket | # Households | % Households |
| Less than $10,000 | 507 | 8.6% |
| $10,000 to $14,999 | 354 | 6.0% |
| $15,000 to $24,999 | 625 | 10.6% |
| $25,000 to $34,999 | 702 | 11.9% |
| $35,000 to $49,999 | 684 | 11.6% |
| $50,000 to $74,999 | 926 | 15.7% |
| $75,000 to $99,999 | 590 | 10.0% |
| $100,000 to $149,999 | 872 | 14.8% |
| $150,000 to $199,999 | 259 | 4.4% |
| $200,000+ | 377 | 6.4% |
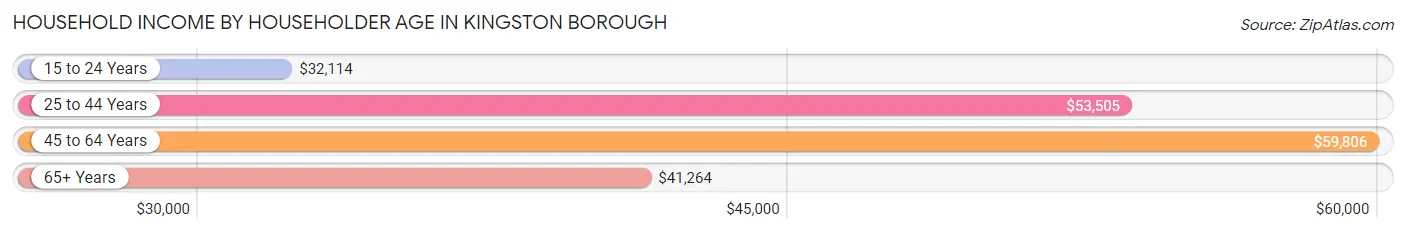
Household Income by Householder Age in Kingston borough
The median household income in Kingston borough is $52,253, with the highest median household income of $59,806 found in the 45 to 64 years age bracket for the primary householder. A total of 1,909 households (32.4%) fall into this category. Meanwhile, the 15 to 24 years age bracket for the primary householder has the lowest median household income of $32,114, with 143 households (2.4%) in this group.
| Income Bracket | # Households | Median Income |
| 15 to 24 Years | 143 (2.4%) | $32,114 |
| 25 to 44 Years | 2,238 (38.0%) | $53,505 |
| 45 to 64 Years | 1,909 (32.4%) | $59,806 |
| 65+ Years | 1,605 (27.2%) | $41,264 |
| Total | 5,895 (100.0%) | $52,253 |
Poverty in Kingston borough
Income Below Poverty by Sex and Age in Kingston borough
With 17.9% poverty level for males and 19.6% for females among the residents of Kingston borough, 5 year old males and 6 to 11 year old females are the most vulnerable to poverty, with 31 males (50.8%) and 216 females (34.3%) in their respective age groups living below the poverty level.
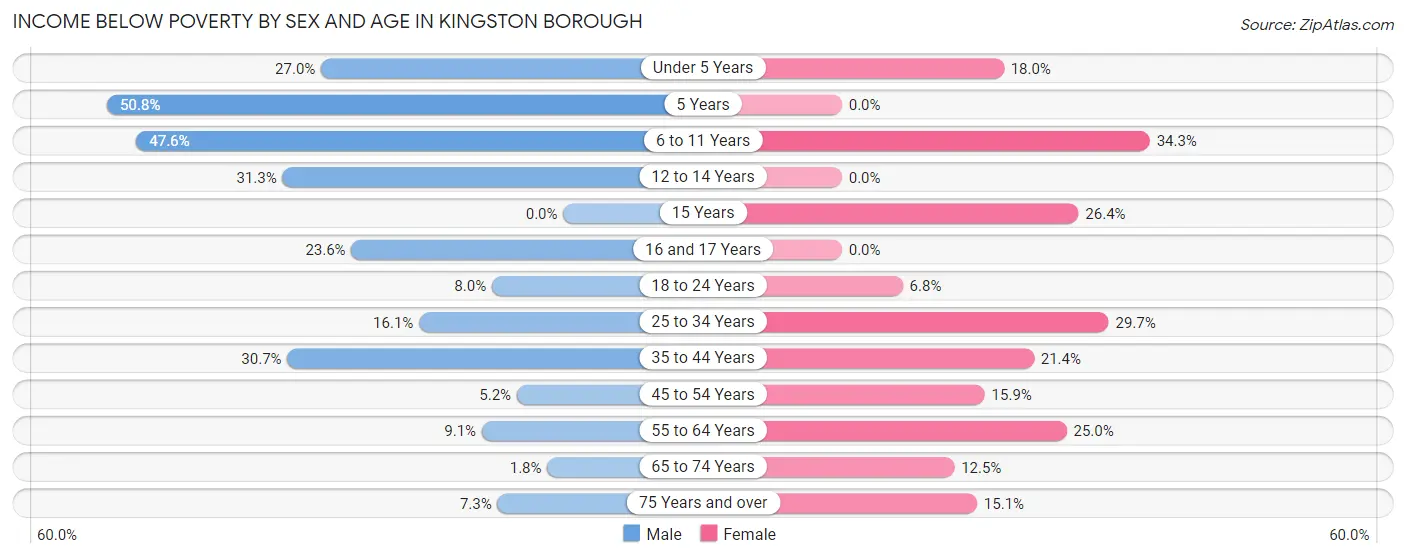
| Age Bracket | Male | Female |
| Under 5 Years | 130 (27.0%) | 55 (18.0%) |
| 5 Years | 31 (50.8%) | 0 (0.0%) |
| 6 to 11 Years | 233 (47.5%) | 216 (34.3%) |
| 12 to 14 Years | 91 (31.3%) | 0 (0.0%) |
| 15 Years | 0 (0.0%) | 39 (26.4%) |
| 16 and 17 Years | 21 (23.6%) | 0 (0.0%) |
| 18 to 24 Years | 36 (8.0%) | 45 (6.8%) |
| 25 to 34 Years | 189 (16.1%) | 309 (29.7%) |
| 35 to 44 Years | 228 (30.7%) | 174 (21.4%) |
| 45 to 54 Years | 36 (5.2%) | 119 (15.9%) |
| 55 to 64 Years | 67 (9.1%) | 185 (25.0%) |
| 65 to 74 Years | 10 (1.8%) | 99 (12.5%) |
| 75 Years and over | 22 (7.3%) | 96 (15.0%) |
| Total | 1,094 (17.9%) | 1,337 (19.6%) |
Income Above Poverty by Sex and Age in Kingston borough
According to the poverty statistics in Kingston borough, males aged 15 years and females aged 5 years are the age groups that are most secure financially, with 100.0% of males and 100.0% of females in these age groups living above the poverty line.
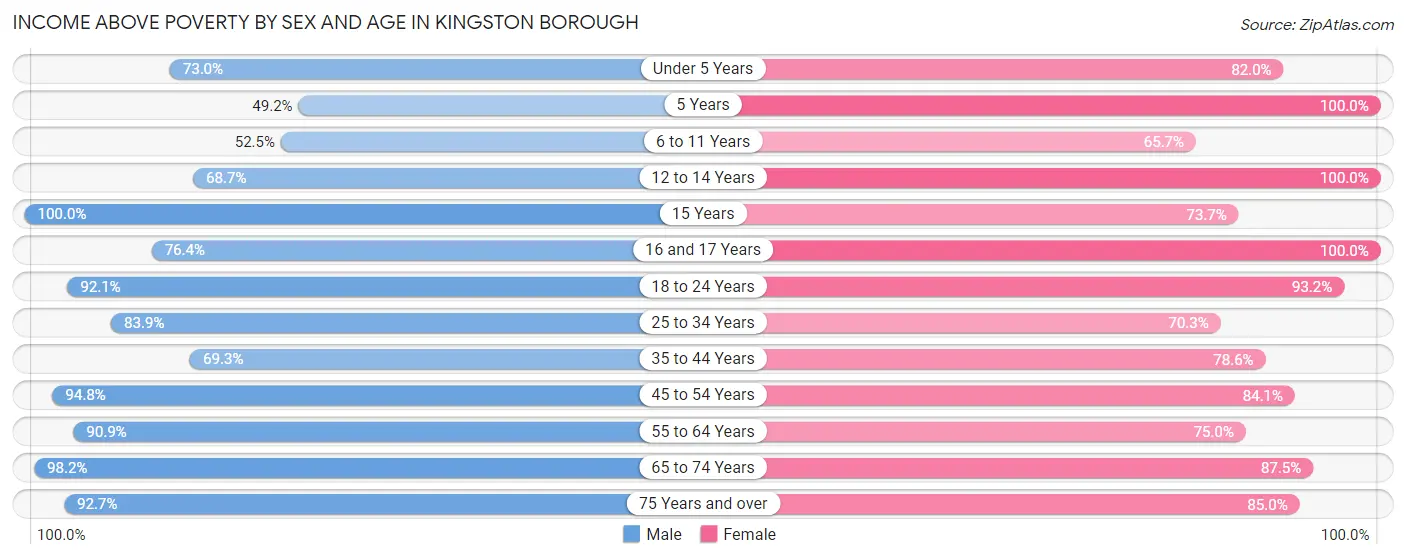
| Age Bracket | Male | Female |
| Under 5 Years | 352 (73.0%) | 250 (82.0%) |
| 5 Years | 30 (49.2%) | 50 (100.0%) |
| 6 to 11 Years | 257 (52.4%) | 414 (65.7%) |
| 12 to 14 Years | 200 (68.7%) | 157 (100.0%) |
| 15 Years | 44 (100.0%) | 109 (73.7%) |
| 16 and 17 Years | 68 (76.4%) | 89 (100.0%) |
| 18 to 24 Years | 417 (92.0%) | 619 (93.2%) |
| 25 to 34 Years | 988 (83.9%) | 731 (70.3%) |
| 35 to 44 Years | 514 (69.3%) | 640 (78.6%) |
| 45 to 54 Years | 660 (94.8%) | 629 (84.1%) |
| 55 to 64 Years | 672 (90.9%) | 554 (75.0%) |
| 65 to 74 Years | 553 (98.2%) | 692 (87.5%) |
| 75 Years and over | 278 (92.7%) | 542 (85.0%) |
| Total | 5,033 (82.1%) | 5,476 (80.4%) |
Income Below Poverty Among Married-Couple Families in Kingston borough
The poverty statistics for married-couple families in Kingston borough show that 6.8% or 126 of the total 1,853 families live below the poverty line. Families with 3 or 4 children have the highest poverty rate of 22.5%, comprising of 31 families. On the other hand, families with 5 or more children have the lowest poverty rate of 0.0%, which includes 0 families.
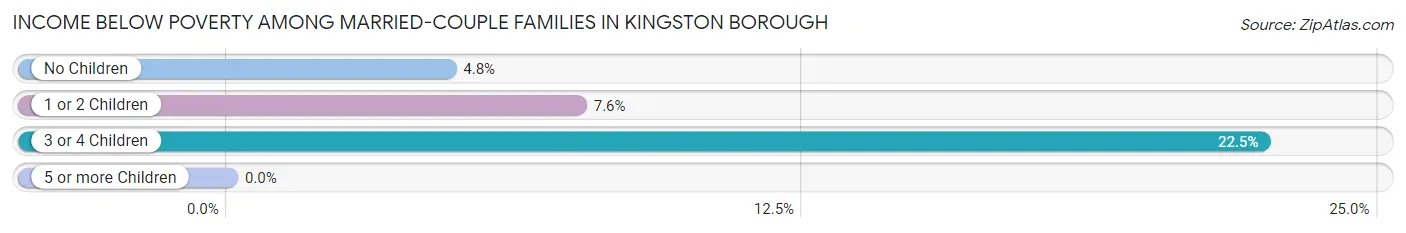
| Children | Above Poverty | Below Poverty |
| No Children | 1,104 (95.3%) | 55 (4.8%) |
| 1 or 2 Children | 487 (92.4%) | 40 (7.6%) |
| 3 or 4 Children | 107 (77.5%) | 31 (22.5%) |
| 5 or more Children | 29 (100.0%) | 0 (0.0%) |
| Total | 1,727 (93.2%) | 126 (6.8%) |
Income Below Poverty Among Single-Parent Households in Kingston borough
According to the poverty data in Kingston borough, 30.7% or 73 single-father households and 31.4% or 253 single-mother households are living below the poverty line. Among single-father households, those with 3 or 4 children have the highest poverty rate, with 58 households (65.2%) experiencing poverty. Likewise, among single-mother households, those with 3 or 4 children have the highest poverty rate, with 40 households (80.0%) falling below the poverty line.
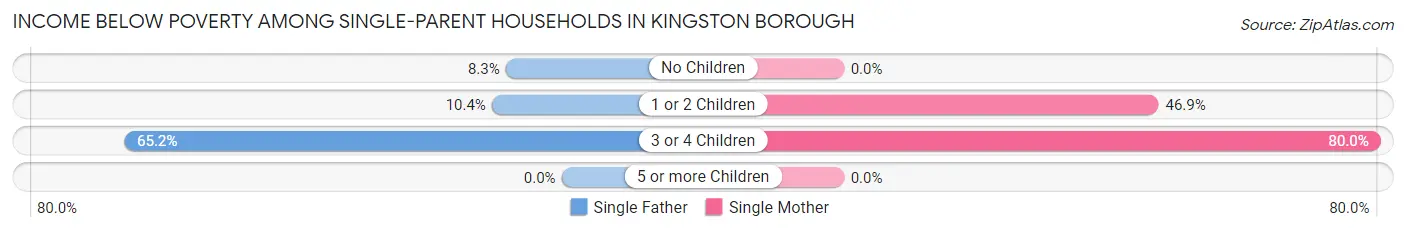
| Children | Single Father | Single Mother |
| No Children | 2 (8.3%) | 0 (0.0%) |
| 1 or 2 Children | 13 (10.4%) | 213 (46.9%) |
| 3 or 4 Children | 58 (65.2%) | 40 (80.0%) |
| 5 or more Children | 0 (0.0%) | 0 (0.0%) |
| Total | 73 (30.7%) | 253 (31.4%) |
Income Below Poverty Among Married-Couple vs Single-Parent Households in Kingston borough
The poverty data for Kingston borough shows that 126 of the married-couple family households (6.8%) and 326 of the single-parent households (31.2%) are living below the poverty level. Within the married-couple family households, those with 3 or 4 children have the highest poverty rate, with 31 households (22.5%) falling below the poverty line. Among the single-parent households, those with 3 or 4 children have the highest poverty rate, with 98 household (70.5%) living below poverty.
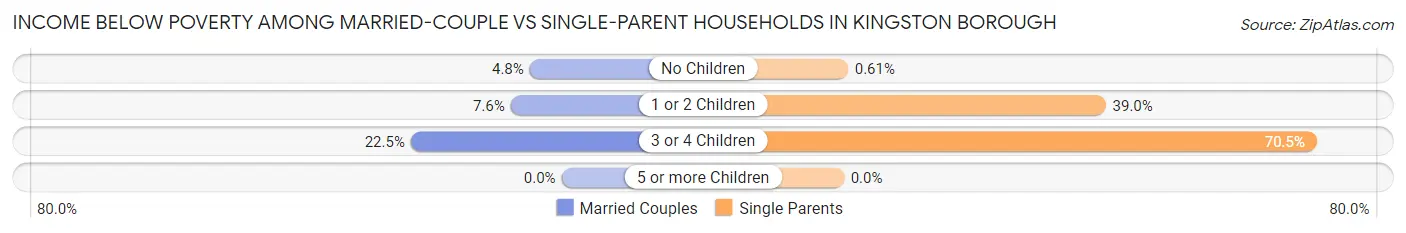
| Children | Married-Couple Families | Single-Parent Households |
| No Children | 55 (4.8%) | 2 (0.6%) |
| 1 or 2 Children | 40 (7.6%) | 226 (39.0%) |
| 3 or 4 Children | 31 (22.5%) | 98 (70.5%) |
| 5 or more Children | 0 (0.0%) | 0 (0.0%) |
| Total | 126 (6.8%) | 326 (31.2%) |
Race in Kingston borough
The most populous races in Kingston borough are White / Caucasian (11,796 | 88.6%), Hispanic or Latino (618 | 4.6%), and Black / African American (569 | 4.3%).
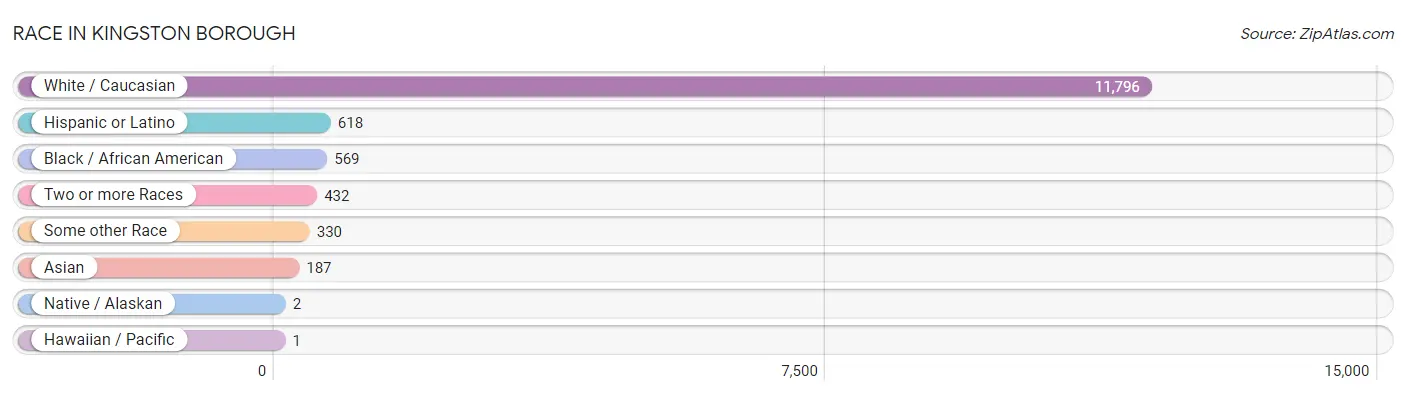
| Race | # Population | % Population |
| Asian | 187 | 1.4% |
| Black / African American | 569 | 4.3% |
| Hawaiian / Pacific | 1 | 0.0% |
| Hispanic or Latino | 618 | 4.6% |
| Native / Alaskan | 2 | 0.0% |
| White / Caucasian | 11,796 | 88.6% |
| Two or more Races | 432 | 3.2% |
| Some other Race | 330 | 2.5% |
| Total | 13,317 | 100.0% |
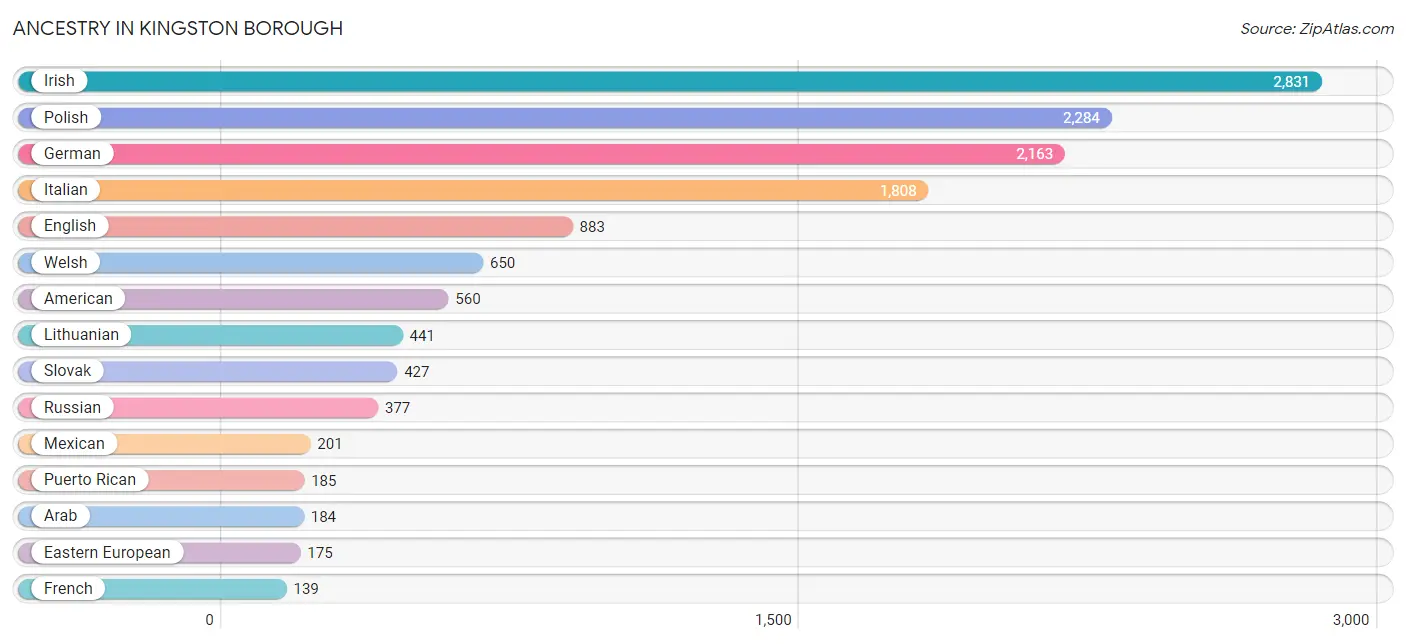
Ancestry in Kingston borough
The most populous ancestries reported in Kingston borough are Irish (2,831 | 21.3%), Polish (2,284 | 17.2%), German (2,163 | 16.2%), Italian (1,808 | 13.6%), and English (883 | 6.6%), together accounting for 74.9% of all Kingston borough residents.
| Ancestry | # Population | % Population |
| African | 23 | 0.2% |
| American | 560 | 4.2% |
| Arab | 184 | 1.4% |
| Austrian | 10 | 0.1% |
| Bhutanese | 33 | 0.3% |
| British | 86 | 0.6% |
| Canadian | 52 | 0.4% |
| Carpatho Rusyn | 10 | 0.1% |
| Central American | 130 | 1.0% |
| Cherokee | 3 | 0.0% |
| Colombian | 3 | 0.0% |
| Cuban | 44 | 0.3% |
| Czech | 19 | 0.1% |
| Czechoslovakian | 18 | 0.1% |
| Dominican | 7 | 0.1% |
| Dutch | 92 | 0.7% |
| Eastern European | 175 | 1.3% |
| Ecuadorian | 13 | 0.1% |
| Egyptian | 8 | 0.1% |
| English | 883 | 6.6% |
| European | 133 | 1.0% |
| French | 139 | 1.0% |
| French Canadian | 36 | 0.3% |
| German | 2,163 | 16.2% |
| Greek | 57 | 0.4% |
| Hungarian | 83 | 0.6% |
| Indian (Asian) | 15 | 0.1% |
| Iranian | 22 | 0.2% |
| Irish | 2,831 | 21.3% |
| Iroquois | 1 | 0.0% |
| Israeli | 7 | 0.1% |
| Italian | 1,808 | 13.6% |
| Jamaican | 18 | 0.1% |
| Jordanian | 6 | 0.1% |
| Korean | 17 | 0.1% |
| Lebanese | 55 | 0.4% |
| Lithuanian | 441 | 3.3% |
| Mexican | 201 | 1.5% |
| Moroccan | 22 | 0.2% |
| Norwegian | 50 | 0.4% |
| Pennsylvania German | 85 | 0.6% |
| Polish | 2,284 | 17.2% |
| Portuguese | 53 | 0.4% |
| Puerto Rican | 185 | 1.4% |
| Romanian | 13 | 0.1% |
| Russian | 377 | 2.8% |
| Salvadoran | 130 | 1.0% |
| Scandinavian | 6 | 0.1% |
| Scotch-Irish | 136 | 1.0% |
| Scottish | 96 | 0.7% |
| Serbian | 46 | 0.4% |
| Slavic | 6 | 0.1% |
| Slovak | 427 | 3.2% |
| South American | 16 | 0.1% |
| Soviet Union | 16 | 0.1% |
| Spanish | 14 | 0.1% |
| Sri Lankan | 7 | 0.1% |
| Subsaharan African | 23 | 0.2% |
| Swedish | 40 | 0.3% |
| Swiss | 47 | 0.4% |
| Syrian | 34 | 0.3% |
| Thai | 74 | 0.6% |
| Tongan | 1 | 0.0% |
| Ukrainian | 113 | 0.9% |
| Welsh | 650 | 4.9% |
| Yugoslavian | 7 | 0.1% | View All 66 Rows |
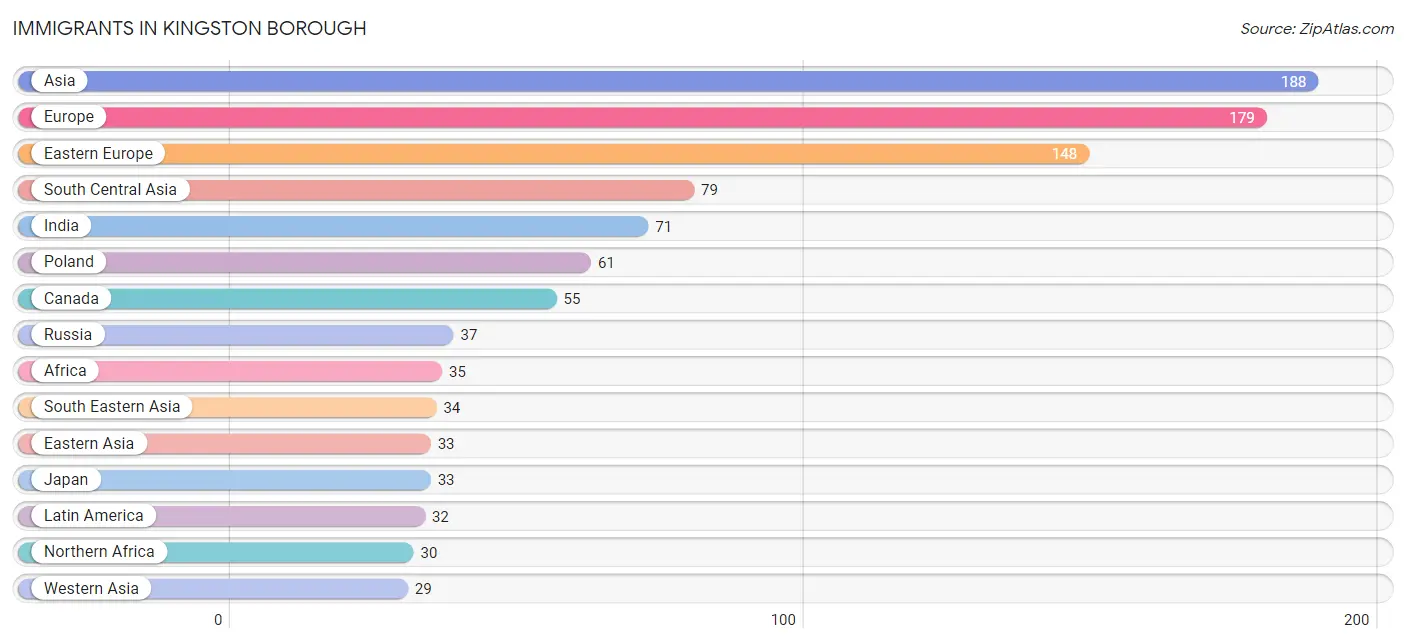
Immigrants in Kingston borough
The most numerous immigrant groups reported in Kingston borough came from Asia (188 | 1.4%), Europe (179 | 1.3%), Eastern Europe (148 | 1.1%), South Central Asia (79 | 0.6%), and India (71 | 0.5%), together accounting for 5.0% of all Kingston borough residents.
| Immigration Origin | # Population | % Population |
| Africa | 35 | 0.3% |
| Asia | 188 | 1.4% |
| Belarus | 12 | 0.1% |
| Canada | 55 | 0.4% |
| Caribbean | 10 | 0.1% |
| Central America | 6 | 0.1% |
| Colombia | 3 | 0.0% |
| Dominican Republic | 1 | 0.0% |
| Eastern Asia | 33 | 0.3% |
| Eastern Europe | 148 | 1.1% |
| Egypt | 8 | 0.1% |
| Europe | 179 | 1.3% |
| Germany | 15 | 0.1% |
| Guyana | 7 | 0.1% |
| India | 71 | 0.5% |
| Iran | 8 | 0.1% |
| Italy | 11 | 0.1% |
| Jamaica | 9 | 0.1% |
| Japan | 33 | 0.3% |
| Latin America | 32 | 0.2% |
| Latvia | 5 | 0.0% |
| Lithuania | 6 | 0.1% |
| Mexico | 6 | 0.1% |
| Morocco | 22 | 0.2% |
| Northern Africa | 30 | 0.2% |
| Northern Europe | 5 | 0.0% |
| Norway | 5 | 0.0% |
| Oceania | 1 | 0.0% |
| Philippines | 27 | 0.2% |
| Poland | 61 | 0.5% |
| Russia | 37 | 0.3% |
| South America | 16 | 0.1% |
| South Central Asia | 79 | 0.6% |
| South Eastern Asia | 34 | 0.3% |
| Southern Europe | 11 | 0.1% |
| Ukraine | 12 | 0.1% |
| Uruguay | 6 | 0.1% |
| Vietnam | 7 | 0.1% |
| Western Africa | 5 | 0.0% |
| Western Asia | 29 | 0.2% |
| Western Europe | 15 | 0.1% | View All 41 Rows |
Sex and Age in Kingston borough
Sex and Age in Kingston borough
The most populous age groups in Kingston borough are 30 to 34 Years (622 | 9.9%) for men and 30 to 34 Years (577 | 8.2%) for women.
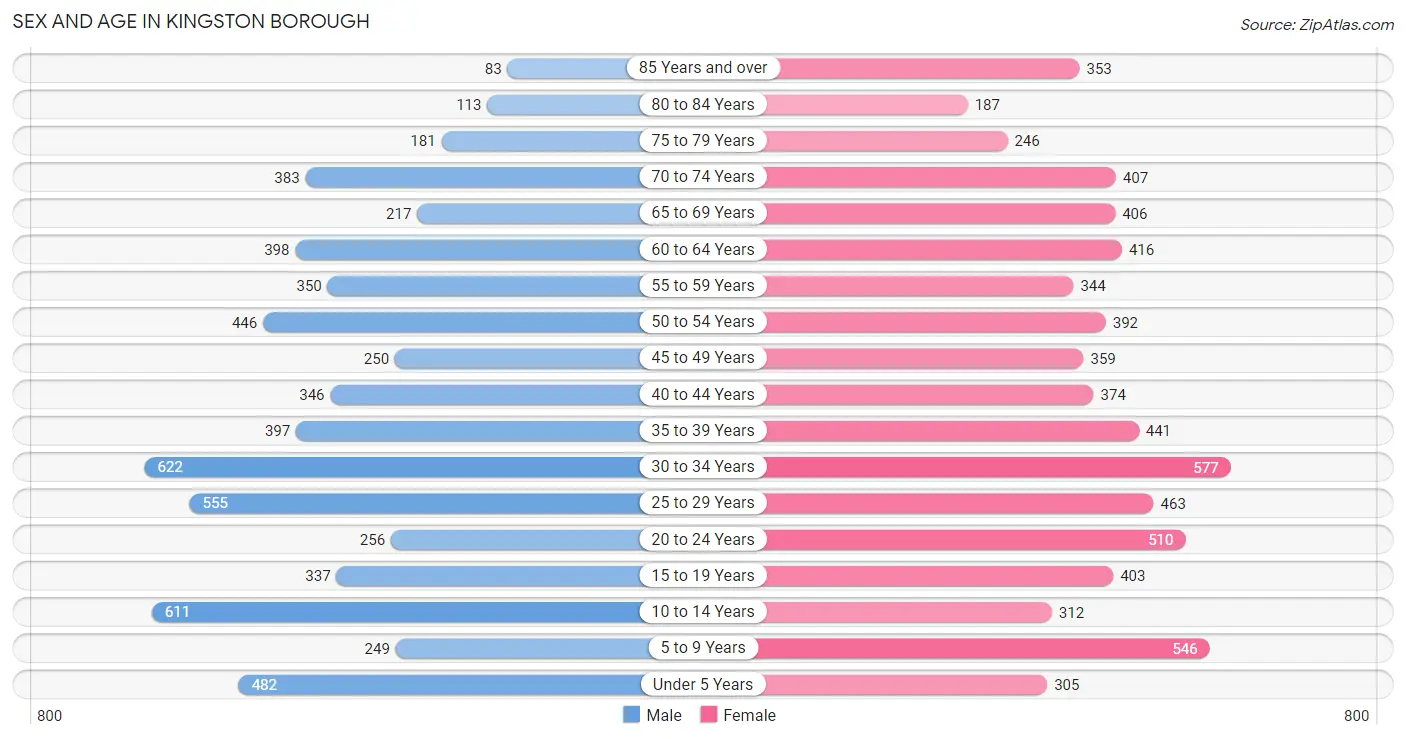
| Age Bracket | Male | Female |
| Under 5 Years | 482 (7.7%) | 305 (4.3%) |
| 5 to 9 Years | 249 (4.0%) | 546 (7.7%) |
| 10 to 14 Years | 611 (9.7%) | 312 (4.4%) |
| 15 to 19 Years | 337 (5.4%) | 403 (5.7%) |
| 20 to 24 Years | 256 (4.1%) | 510 (7.2%) |
| 25 to 29 Years | 555 (8.8%) | 463 (6.6%) |
| 30 to 34 Years | 622 (9.9%) | 577 (8.2%) |
| 35 to 39 Years | 397 (6.3%) | 441 (6.3%) |
| 40 to 44 Years | 346 (5.5%) | 374 (5.3%) |
| 45 to 49 Years | 250 (4.0%) | 359 (5.1%) |
| 50 to 54 Years | 446 (7.1%) | 392 (5.6%) |
| 55 to 59 Years | 350 (5.6%) | 344 (4.9%) |
| 60 to 64 Years | 398 (6.3%) | 416 (5.9%) |
| 65 to 69 Years | 217 (3.5%) | 406 (5.8%) |
| 70 to 74 Years | 383 (6.1%) | 407 (5.8%) |
| 75 to 79 Years | 181 (2.9%) | 246 (3.5%) |
| 80 to 84 Years | 113 (1.8%) | 187 (2.7%) |
| 85 Years and over | 83 (1.3%) | 353 (5.0%) |
| Total | 6,276 (100.0%) | 7,041 (100.0%) |
Families and Households in Kingston borough
Median Family Size in Kingston borough
The median family size in Kingston borough is 3.16 persons per family, with married-couple families (1,853 | 63.9%) accounting for the largest median family size of 3.23 persons per family. On the other hand, single female/mother families (807 | 27.9%) represent the smallest median family size with 3.00 persons per family.
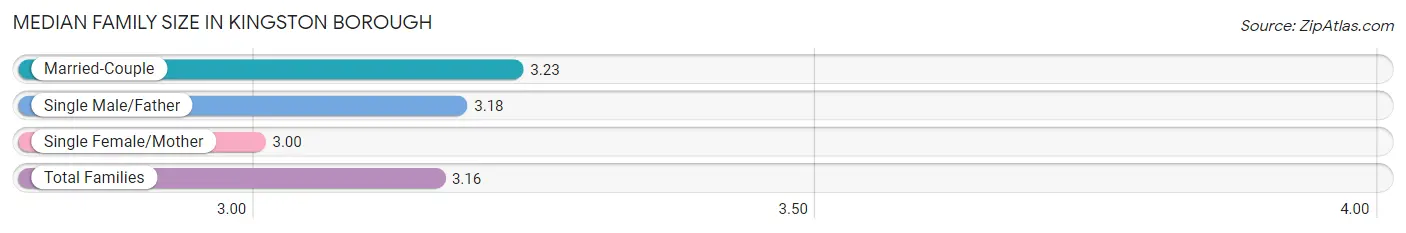
| Family Type | # Families | Family Size |
| Married-Couple | 1,853 (63.9%) | 3.23 |
| Single Male/Father | 238 (8.2%) | 3.18 |
| Single Female/Mother | 807 (27.9%) | 3.00 |
| Total Families | 2,898 (100.0%) | 3.16 |
Median Household Size in Kingston borough
The median household size in Kingston borough is 2.19 persons per household, with single male/father households (238 | 4.0%) accounting for the largest median household size of 3.55 persons per household. non-family households (2,997 | 50.8%) represent the smallest median household size with 1.18 persons per household.
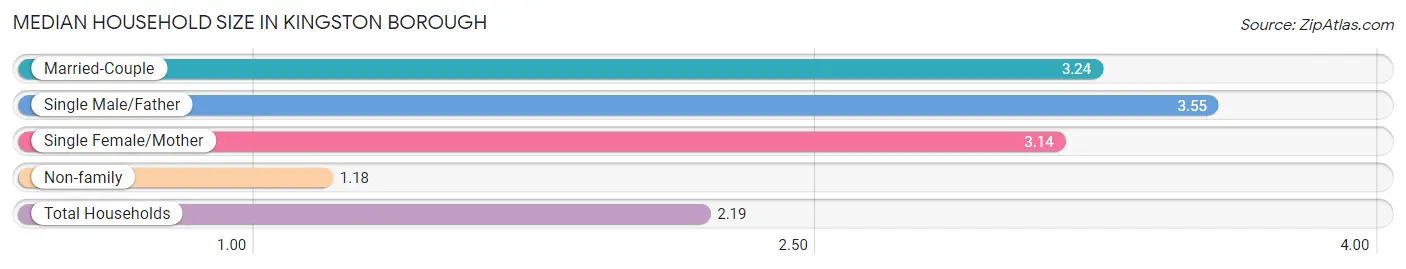
| Household Type | # Households | Household Size |
| Married-Couple | 1,853 (31.4%) | 3.24 |
| Single Male/Father | 238 (4.0%) | 3.55 |
| Single Female/Mother | 807 (13.7%) | 3.14 |
| Non-family | 2,997 (50.8%) | 1.18 |
| Total Households | 5,895 (100.0%) | 2.19 |
Household Size by Marriage Status in Kingston borough
Out of a total of 5,895 households in Kingston borough, 2,898 (49.2%) are family households, while 2,997 (50.8%) are nonfamily households. The most numerous type of family households are 2-person households, comprising 1,363, and the most common type of nonfamily households are 1-person households, comprising 2,616.
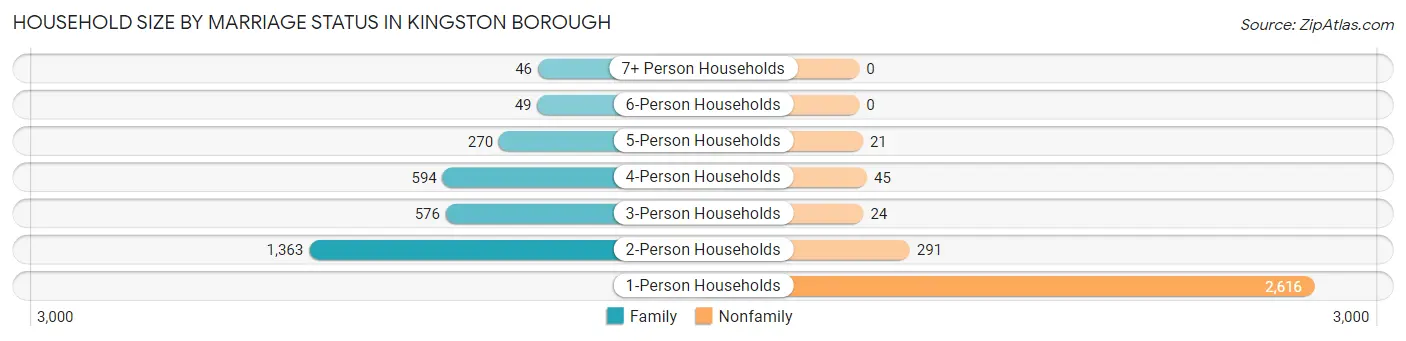
| Household Size | Family Households | Nonfamily Households |
| 1-Person Households | - | 2,616 (44.4%) |
| 2-Person Households | 1,363 (23.1%) | 291 (4.9%) |
| 3-Person Households | 576 (9.8%) | 24 (0.4%) |
| 4-Person Households | 594 (10.1%) | 45 (0.8%) |
| 5-Person Households | 270 (4.6%) | 21 (0.4%) |
| 6-Person Households | 49 (0.8%) | 0 (0.0%) |
| 7+ Person Households | 46 (0.8%) | 0 (0.0%) |
| Total | 2,898 (49.2%) | 2,997 (50.8%) |
Female Fertility in Kingston borough
Fertility by Age in Kingston borough
Average fertility rate in Kingston borough is 39.0 births per 1,000 women. Women in the age bracket of 35 to 50 years have the highest fertility rate with 45.0 births per 1,000 women. Women in the age bracket of 20 to 34 years acount for 53.6% of all women with births.
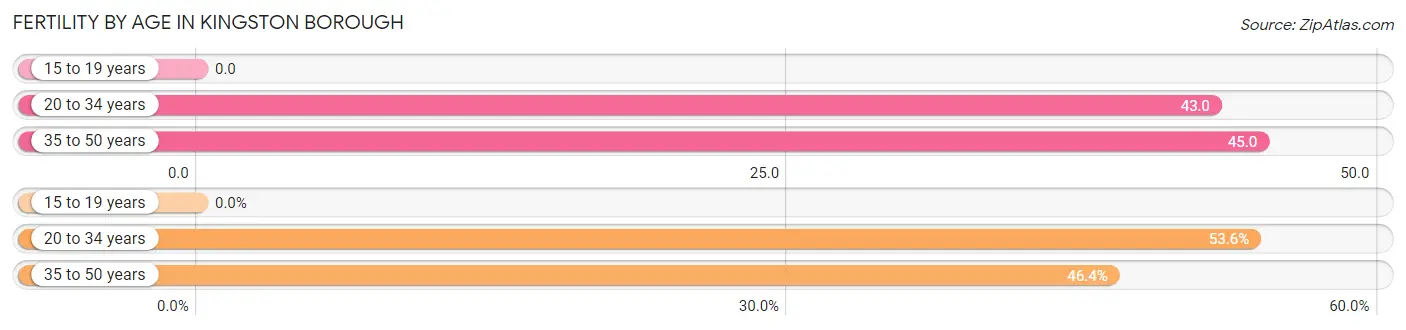
| Age Bracket | Women with Births | Births / 1,000 Women |
| 15 to 19 years | 0 (0.0%) | 0.0 |
| 20 to 34 years | 67 (53.6%) | 43.0 |
| 35 to 50 years | 58 (46.4%) | 45.0 |
| Total | 125 (100.0%) | 39.0 |
Fertility by Age by Marriage Status in Kingston borough
95.2% of women with births (125) in Kingston borough are married. The highest percentage of unmarried women with births falls into 20 to 34 years age bracket with 7.5% of them unmarried at the time of birth, while the lowest percentage of unmarried women with births belong to 35 to 50 years age bracket with 1.7% of them unmarried.
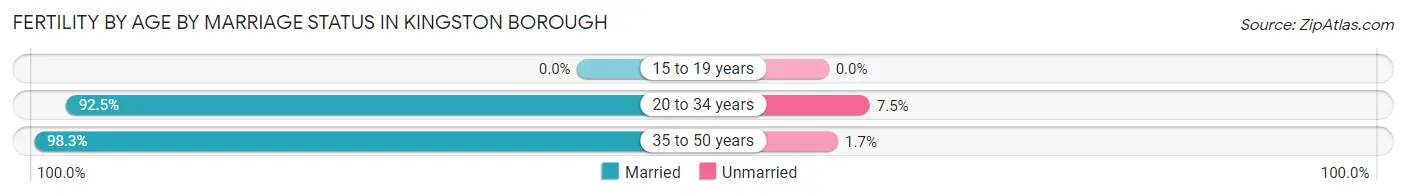
| Age Bracket | Married | Unmarried |
| 15 to 19 years | 0 (0.0%) | 0 (0.0%) |
| 20 to 34 years | 62 (92.5%) | 5 (7.5%) |
| 35 to 50 years | 57 (98.3%) | 1 (1.7%) |
| Total | 119 (95.2%) | 6 (4.8%) |
Fertility by Education in Kingston borough
Average fertility rate in Kingston borough is 39.0 births per 1,000 women. Women with the education attainment of graduate degree have the highest fertility rate of 85.0 births per 1,000 women, while women with the education attainment of less than high school have the lowest fertility at 2.0 births per 1,000 women. Women with the education attainment of bachelor's degree represent 30.4% of all women with births.
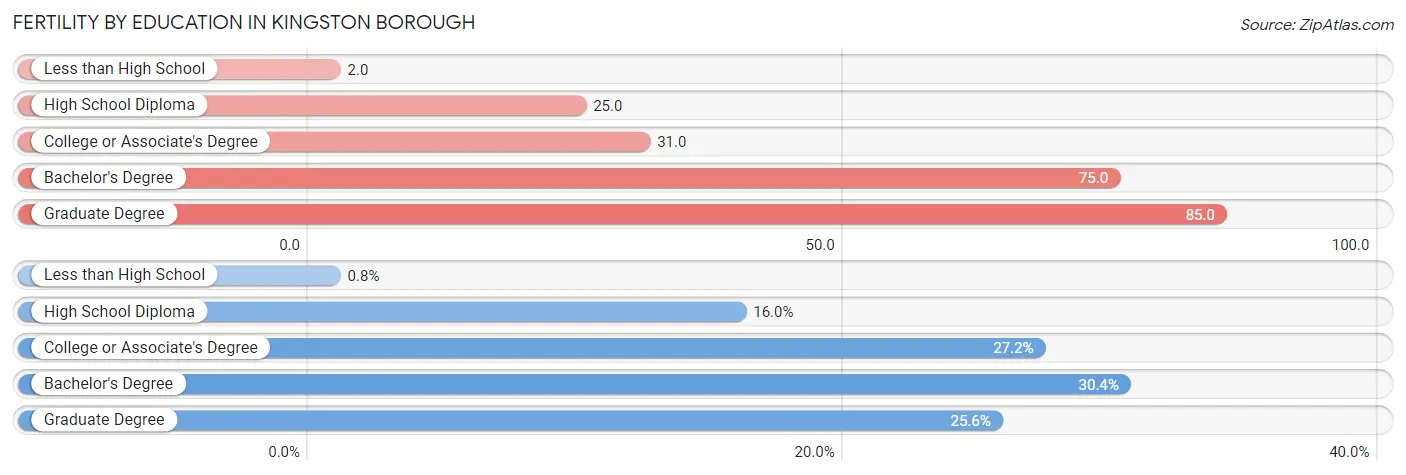
| Educational Attainment | Women with Births | Births / 1,000 Women |
| Less than High School | 1 (0.8%) | 2.0 |
| High School Diploma | 20 (16.0%) | 25.0 |
| College or Associate's Degree | 34 (27.2%) | 31.0 |
| Bachelor's Degree | 38 (30.4%) | 75.0 |
| Graduate Degree | 32 (25.6%) | 85.0 |
| Total | 125 (100.0%) | 39.0 |
Fertility by Education by Marriage Status in Kingston borough
4.8% of women with births in Kingston borough are unmarried. Women with the educational attainment of high school diploma are most likely to be married with 100.0% of them married at childbirth, while women with the educational attainment of less than high school are least likely to be married with 100.0% of them unmarried at childbirth.
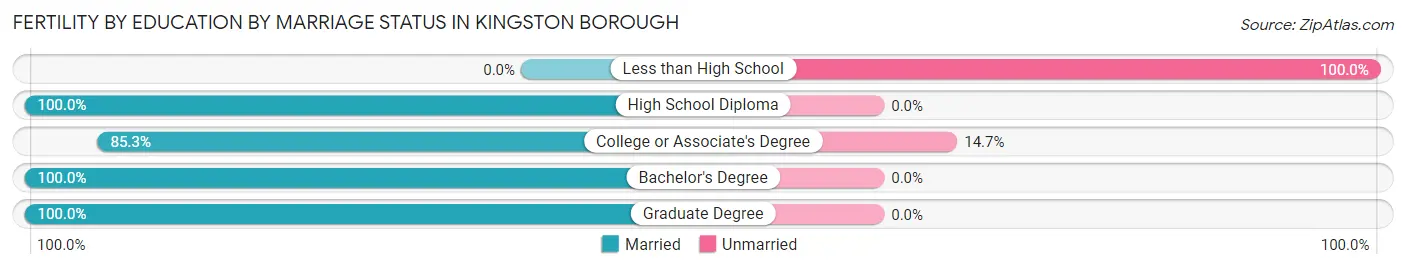
| Educational Attainment | Married | Unmarried |
| Less than High School | 0 (0.0%) | 1 (100.0%) |
| High School Diploma | 20 (100.0%) | 0 (0.0%) |
| College or Associate's Degree | 29 (85.3%) | 5 (14.7%) |
| Bachelor's Degree | 38 (100.0%) | 0 (0.0%) |
| Graduate Degree | 32 (100.0%) | 0 (0.0%) |
| Total | 119 (95.2%) | 6 (4.8%) |
Employment Characteristics in Kingston borough
Employment by Class of Employer in Kingston borough
Among the 6,483 employed individuals in Kingston borough, private company employees (4,541 | 70.0%), not-for-profit organizations (668 | 10.3%), and federal government employees (405 | 6.2%) make up the most common classes of employment.
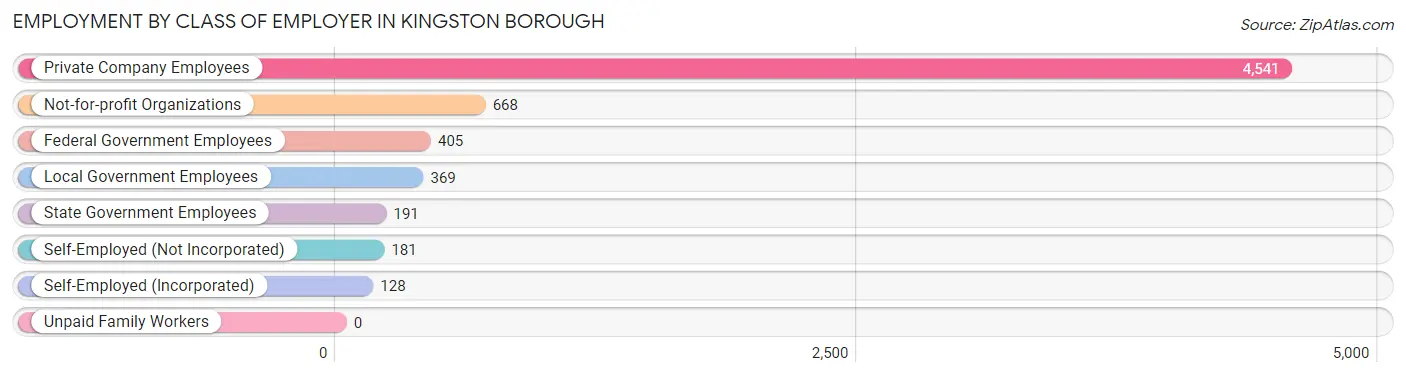
| Employer Class | # Employees | % Employees |
| Private Company Employees | 4,541 | 70.0% |
| Self-Employed (Incorporated) | 128 | 2.0% |
| Self-Employed (Not Incorporated) | 181 | 2.8% |
| Not-for-profit Organizations | 668 | 10.3% |
| Local Government Employees | 369 | 5.7% |
| State Government Employees | 191 | 2.9% |
| Federal Government Employees | 405 | 6.2% |
| Unpaid Family Workers | 0 | 0.0% |
| Total | 6,483 | 100.0% |
Employment Status by Age in Kingston borough
According to the labor force statistics for Kingston borough, out of the total population over 16 years of age (10,614), 65.3% or 6,931 individuals are in the labor force, with 5.3% or 367 of them unemployed. The age group with the highest labor force participation rate is 25 to 29 years, with 87.5% or 891 individuals in the labor force. Within the labor force, the 75 years and over age range has the highest percentage of unemployed individuals, with 18.9% or 21 of them being unemployed.
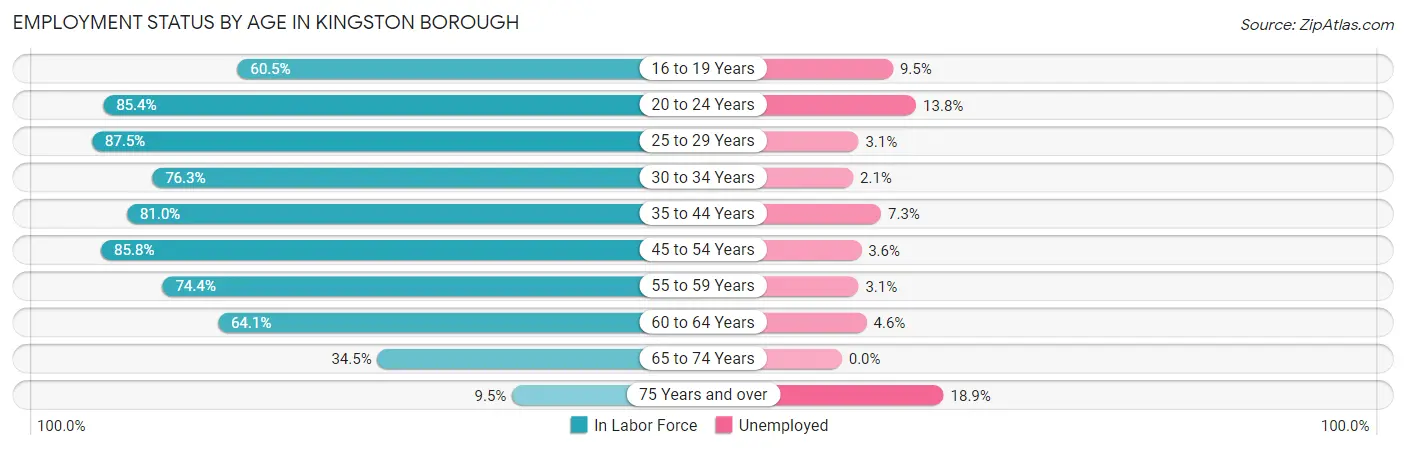
| Age Bracket | In Labor Force | Unemployed |
| 16 to 19 Years | 328 (60.5%) | 31 (9.5%) |
| 20 to 24 Years | 654 (85.4%) | 90 (13.8%) |
| 25 to 29 Years | 891 (87.5%) | 28 (3.1%) |
| 30 to 34 Years | 915 (76.3%) | 19 (2.1%) |
| 35 to 44 Years | 1,262 (81.0%) | 92 (7.3%) |
| 45 to 54 Years | 1,242 (85.8%) | 45 (3.6%) |
| 55 to 59 Years | 516 (74.4%) | 16 (3.1%) |
| 60 to 64 Years | 522 (64.1%) | 24 (4.6%) |
| 65 to 74 Years | 487 (34.5%) | 0 (0.0%) |
| 75 Years and over | 110 (9.5%) | 21 (18.9%) |
| Total | 6,931 (65.3%) | 367 (5.3%) |
Employment Status by Educational Attainment in Kingston borough
According to labor force statistics for Kingston borough, 79.5% of individuals (5,350) out of the total population between 25 and 64 years of age (6,730) are in the labor force, with 4.2% or 225 of them being unemployed. The group with the highest labor force participation rate are those with the educational attainment of bachelor's degree or higher, with 85.6% or 1,994 individuals in the labor force. Within the labor force, individuals with college / associate degree education have the highest percentage of unemployment, with 5.8% or 102 of them being unemployed.
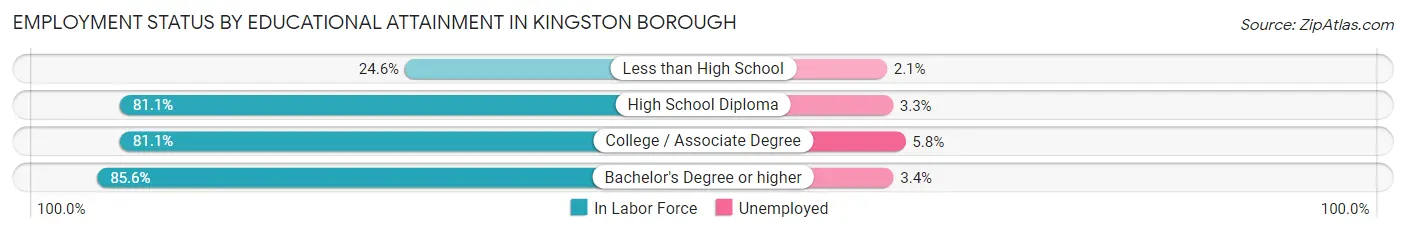
| Educational Attainment | In Labor Force | Unemployed |
| Less than High School | 94 (24.6%) | 8 (2.1%) |
| High School Diploma | 1,506 (81.1%) | 61 (3.3%) |
| College / Associate Degree | 1,753 (81.1%) | 125 (5.8%) |
| Bachelor's Degree or higher | 1,994 (85.6%) | 79 (3.4%) |
| Total | 5,350 (79.5%) | 283 (4.2%) |
Employment Occupations by Sex in Kingston borough
Management, Business, Science and Arts Occupations
The most common Management, Business, Science and Arts occupations in Kingston borough are Community & Social Service (695 | 10.6%), Health Diagnosing & Treating (690 | 10.5%), Management (539 | 8.2%), Health Technologists (518 | 7.9%), and Education Instruction & Library (415 | 6.3%).
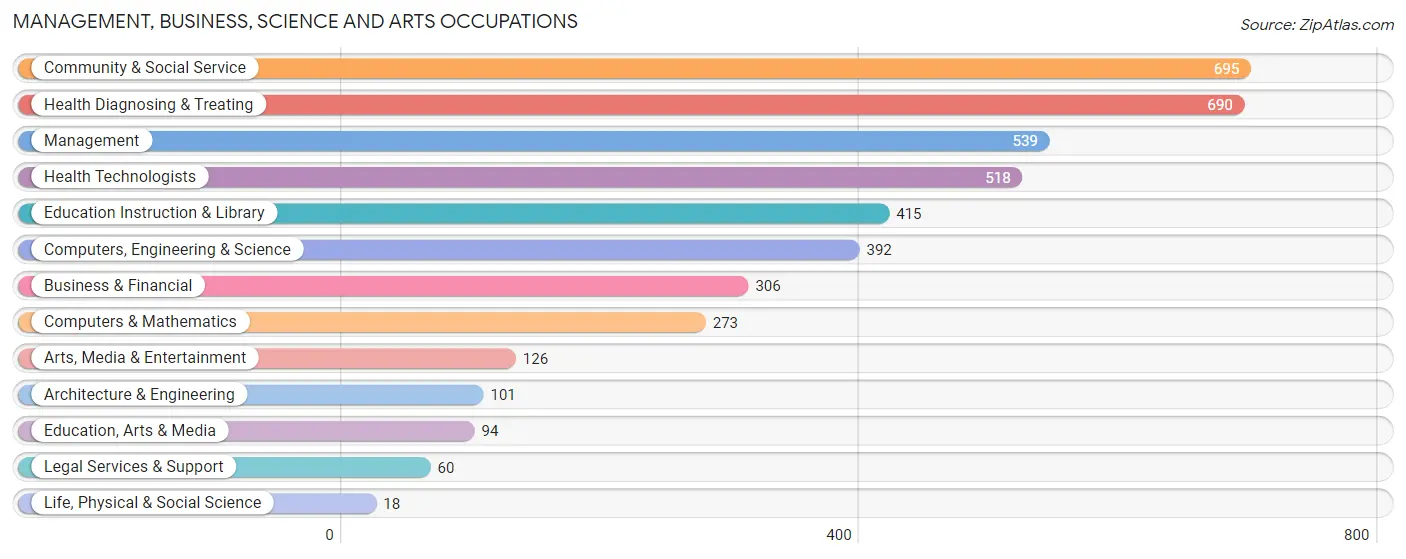
Management, Business, Science and Arts Occupations by Sex
Within the Management, Business, Science and Arts occupations in Kingston borough, the most male-oriented occupations are Life, Physical & Social Science (100.0%), Architecture & Engineering (92.1%), and Computers, Engineering & Science (83.4%), while the most female-oriented occupations are Education, Arts & Media (74.5%), Health Diagnosing & Treating (71.3%), and Education Instruction & Library (66.0%).
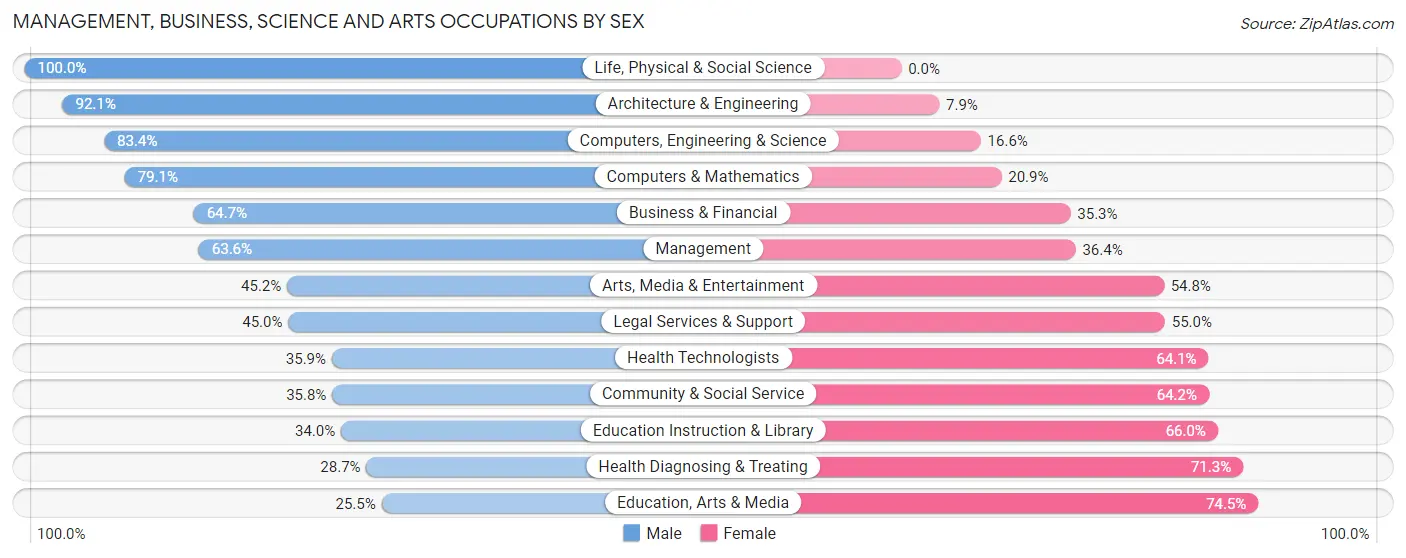
| Occupation | Male | Female |
| Management | 343 (63.6%) | 196 (36.4%) |
| Business & Financial | 198 (64.7%) | 108 (35.3%) |
| Computers, Engineering & Science | 327 (83.4%) | 65 (16.6%) |
| Computers & Mathematics | 216 (79.1%) | 57 (20.9%) |
| Architecture & Engineering | 93 (92.1%) | 8 (7.9%) |
| Life, Physical & Social Science | 18 (100.0%) | 0 (0.0%) |
| Community & Social Service | 249 (35.8%) | 446 (64.2%) |
| Education, Arts & Media | 24 (25.5%) | 70 (74.5%) |
| Legal Services & Support | 27 (45.0%) | 33 (55.0%) |
| Education Instruction & Library | 141 (34.0%) | 274 (66.0%) |
| Arts, Media & Entertainment | 57 (45.2%) | 69 (54.8%) |
| Health Diagnosing & Treating | 198 (28.7%) | 492 (71.3%) |
| Health Technologists | 186 (35.9%) | 332 (64.1%) |
| Total (Category) | 1,315 (50.1%) | 1,307 (49.8%) |
| Total (Overall) | 3,432 (52.4%) | 3,113 (47.6%) |
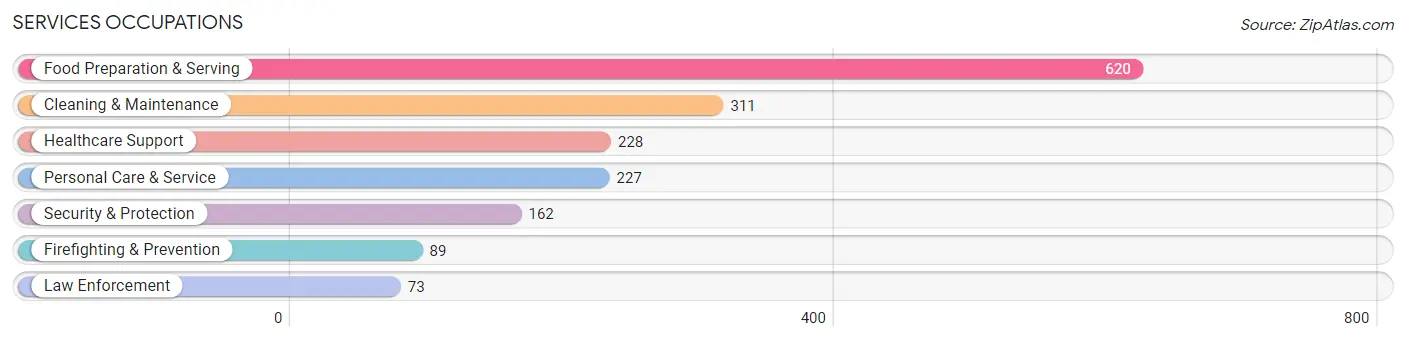
Services Occupations
The most common Services occupations in Kingston borough are Food Preparation & Serving (620 | 9.5%), Cleaning & Maintenance (311 | 4.8%), Healthcare Support (228 | 3.5%), Personal Care & Service (227 | 3.5%), and Security & Protection (162 | 2.5%).
Services Occupations by Sex
Within the Services occupations in Kingston borough, the most male-oriented occupations are Law Enforcement (100.0%), Cleaning & Maintenance (84.6%), and Security & Protection (77.8%), while the most female-oriented occupations are Healthcare Support (95.6%), Food Preparation & Serving (56.5%), and Personal Care & Service (51.1%).
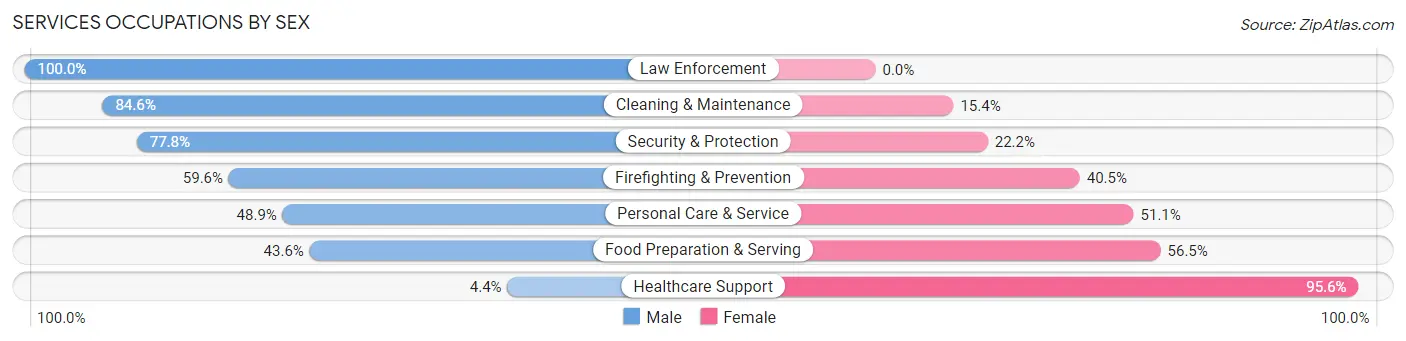
| Occupation | Male | Female |
| Healthcare Support | 10 (4.4%) | 218 (95.6%) |
| Security & Protection | 126 (77.8%) | 36 (22.2%) |
| Firefighting & Prevention | 53 (59.6%) | 36 (40.5%) |
| Law Enforcement | 73 (100.0%) | 0 (0.0%) |
| Food Preparation & Serving | 270 (43.5%) | 350 (56.5%) |
| Cleaning & Maintenance | 263 (84.6%) | 48 (15.4%) |
| Personal Care & Service | 111 (48.9%) | 116 (51.1%) |
| Total (Category) | 780 (50.4%) | 768 (49.6%) |
| Total (Overall) | 3,432 (52.4%) | 3,113 (47.6%) |
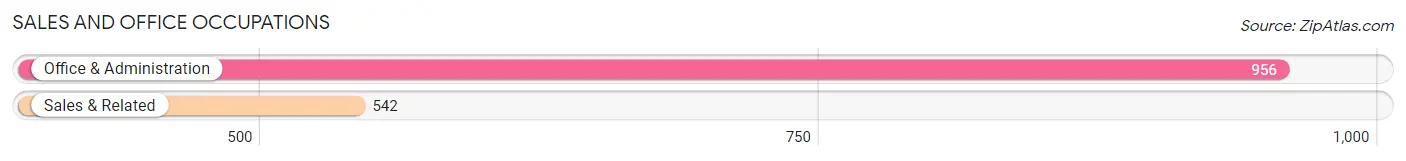
Sales and Office Occupations
The most common Sales and Office occupations in Kingston borough are Office & Administration (956 | 14.6%), and Sales & Related (542 | 8.3%).
Sales and Office Occupations by Sex
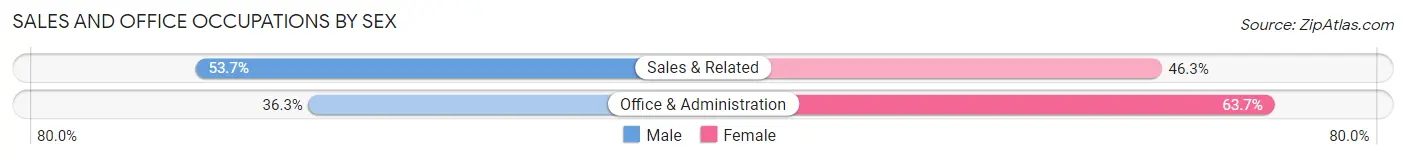
| Occupation | Male | Female |
| Sales & Related | 291 (53.7%) | 251 (46.3%) |
| Office & Administration | 347 (36.3%) | 609 (63.7%) |
| Total (Category) | 638 (42.6%) | 860 (57.4%) |
| Total (Overall) | 3,432 (52.4%) | 3,113 (47.6%) |
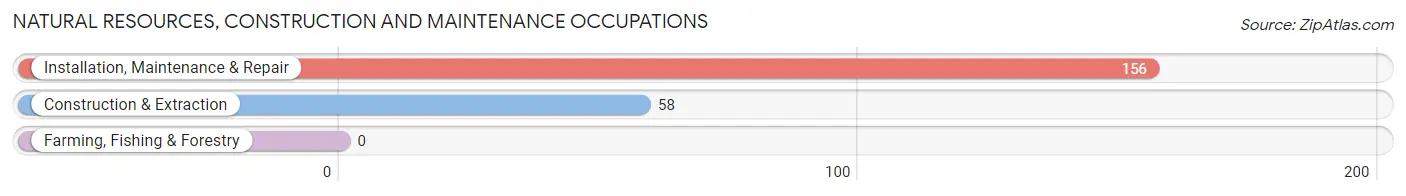
Natural Resources, Construction and Maintenance Occupations
The most common Natural Resources, Construction and Maintenance occupations in Kingston borough are Installation, Maintenance & Repair (156 | 2.4%), and Construction & Extraction (58 | 0.9%).
Natural Resources, Construction and Maintenance Occupations by Sex
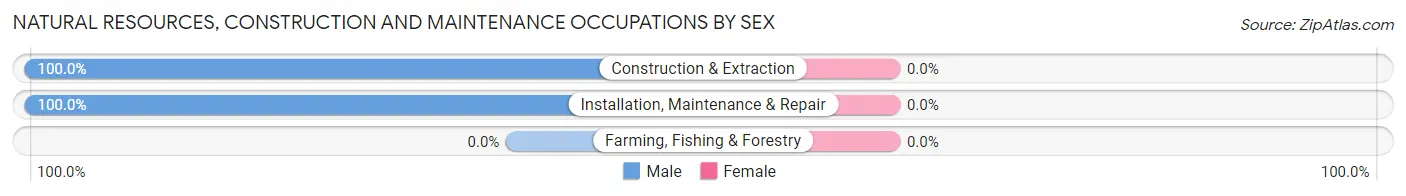
| Occupation | Male | Female |
| Farming, Fishing & Forestry | 0 (0.0%) | 0 (0.0%) |
| Construction & Extraction | 58 (100.0%) | 0 (0.0%) |
| Installation, Maintenance & Repair | 156 (100.0%) | 0 (0.0%) |
| Total (Category) | 214 (100.0%) | 0 (0.0%) |
| Total (Overall) | 3,432 (52.4%) | 3,113 (47.6%) |
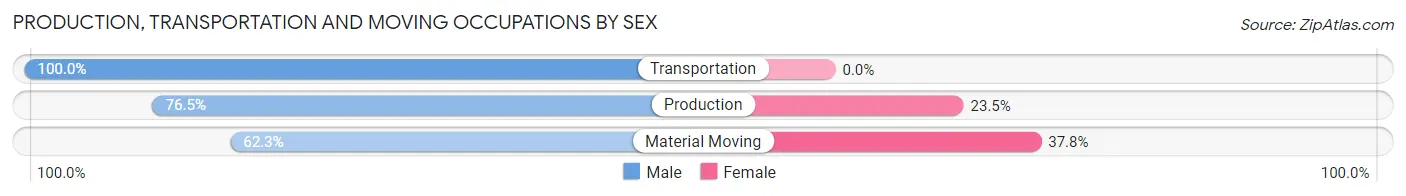
Production, Transportation and Moving Occupations
The most common Production, Transportation and Moving occupations in Kingston borough are Material Moving (347 | 5.3%), Production (200 | 3.1%), and Transportation (116 | 1.8%).
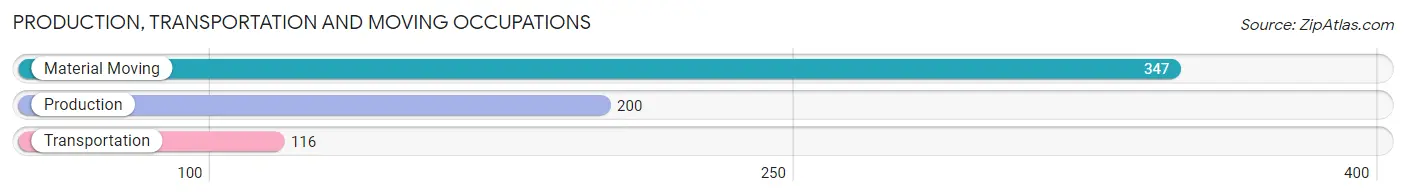
Production, Transportation and Moving Occupations by Sex
| Occupation | Male | Female |
| Production | 153 (76.5%) | 47 (23.5%) |
| Transportation | 116 (100.0%) | 0 (0.0%) |
| Material Moving | 216 (62.3%) | 131 (37.8%) |
| Total (Category) | 485 (73.2%) | 178 (26.9%) |
| Total (Overall) | 3,432 (52.4%) | 3,113 (47.6%) |
Employment Industries by Sex in Kingston borough
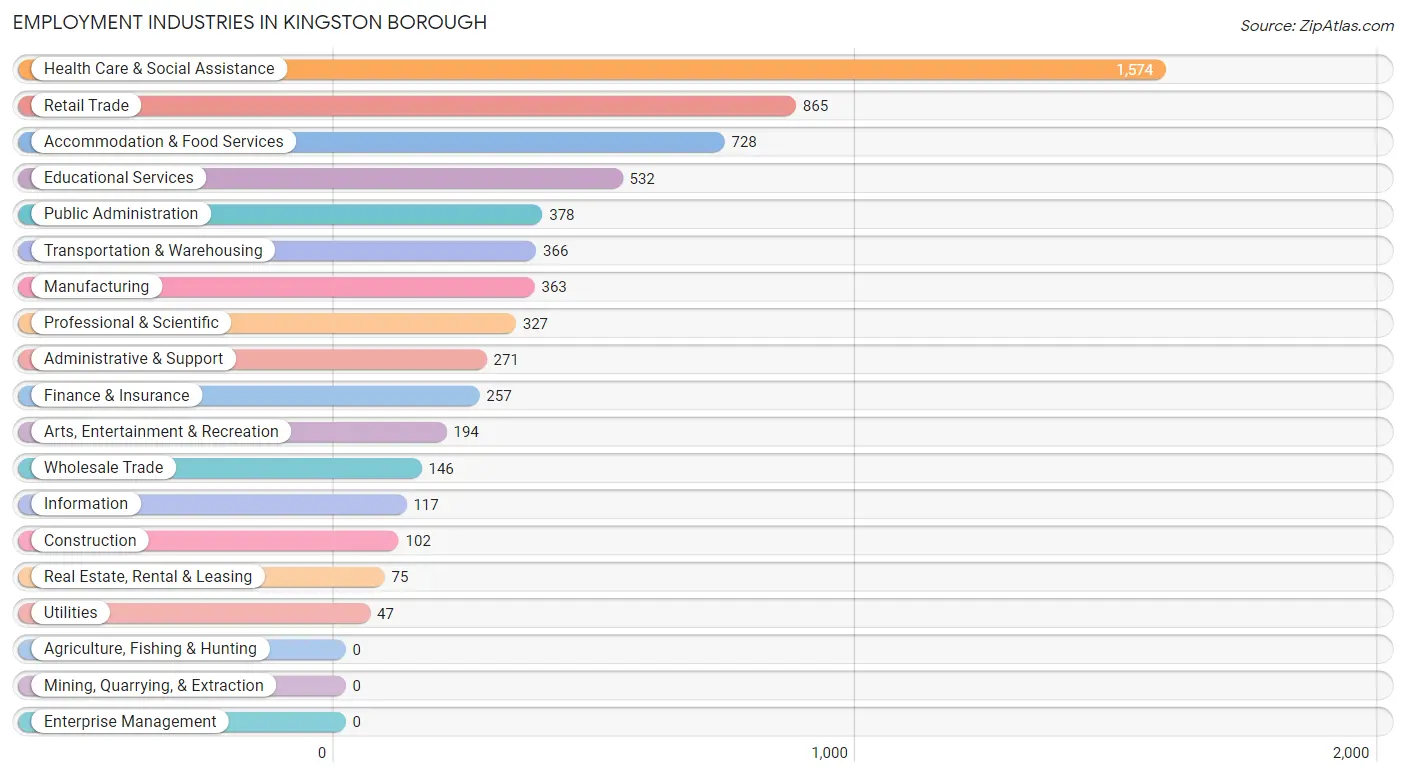
Employment Industries in Kingston borough
The major employment industries in Kingston borough include Health Care & Social Assistance (1,574 | 24.0%), Retail Trade (865 | 13.2%), Accommodation & Food Services (728 | 11.1%), Educational Services (532 | 8.1%), and Public Administration (378 | 5.8%).
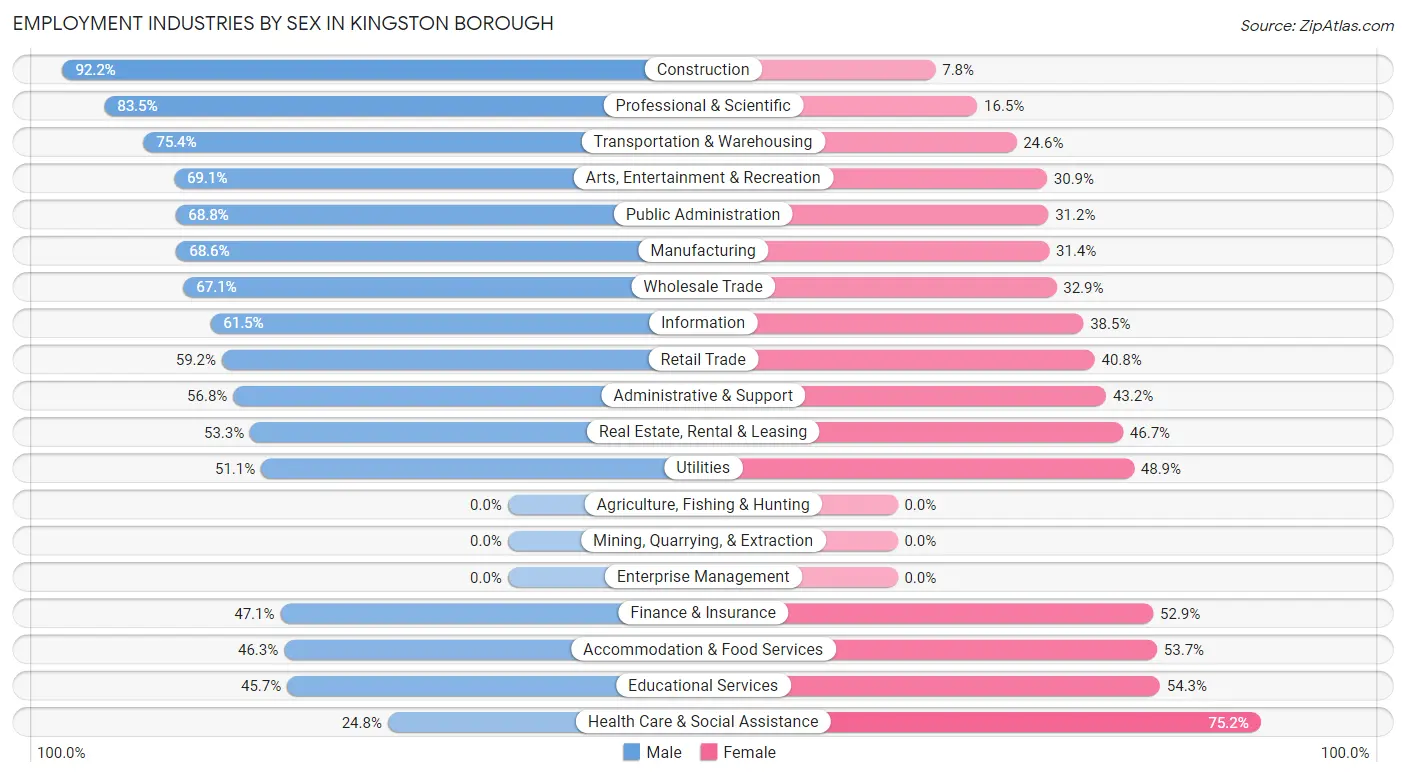
Employment Industries by Sex in Kingston borough
The Kingston borough industries that see more men than women are Construction (92.2%), Professional & Scientific (83.5%), and Transportation & Warehousing (75.4%), whereas the industries that tend to have a higher number of women are Health Care & Social Assistance (75.2%), Educational Services (54.3%), and Accommodation & Food Services (53.7%).
| Industry | Male | Female |
| Agriculture, Fishing & Hunting | 0 (0.0%) | 0 (0.0%) |
| Mining, Quarrying, & Extraction | 0 (0.0%) | 0 (0.0%) |
| Construction | 94 (92.2%) | 8 (7.8%) |
| Manufacturing | 249 (68.6%) | 114 (31.4%) |
| Wholesale Trade | 98 (67.1%) | 48 (32.9%) |
| Retail Trade | 512 (59.2%) | 353 (40.8%) |
| Transportation & Warehousing | 276 (75.4%) | 90 (24.6%) |
| Utilities | 24 (51.1%) | 23 (48.9%) |
| Information | 72 (61.5%) | 45 (38.5%) |
| Finance & Insurance | 121 (47.1%) | 136 (52.9%) |
| Real Estate, Rental & Leasing | 40 (53.3%) | 35 (46.7%) |
| Professional & Scientific | 273 (83.5%) | 54 (16.5%) |
| Enterprise Management | 0 (0.0%) | 0 (0.0%) |
| Administrative & Support | 154 (56.8%) | 117 (43.2%) |
| Educational Services | 243 (45.7%) | 289 (54.3%) |
| Health Care & Social Assistance | 391 (24.8%) | 1,183 (75.2%) |
| Arts, Entertainment & Recreation | 134 (69.1%) | 60 (30.9%) |
| Accommodation & Food Services | 337 (46.3%) | 391 (53.7%) |
| Public Administration | 260 (68.8%) | 118 (31.2%) |
| Total | 3,432 (52.4%) | 3,113 (47.6%) |
Education in Kingston borough
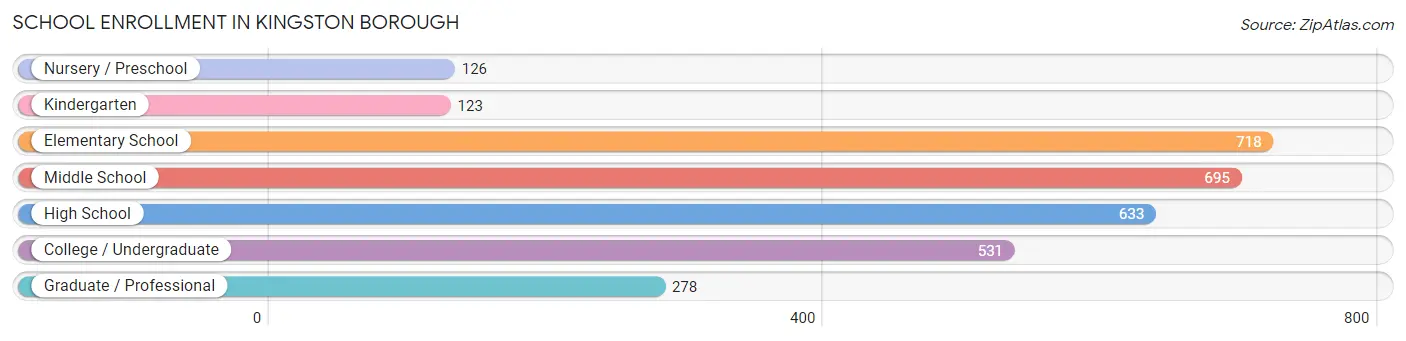
School Enrollment in Kingston borough
The most common levels of schooling among the 3,104 students in Kingston borough are elementary school (718 | 23.1%), middle school (695 | 22.4%), and high school (633 | 20.4%).
| School Level | # Students | % Students |
| Nursery / Preschool | 126 | 4.1% |
| Kindergarten | 123 | 4.0% |
| Elementary School | 718 | 23.1% |
| Middle School | 695 | 22.4% |
| High School | 633 | 20.4% |
| College / Undergraduate | 531 | 17.1% |
| Graduate / Professional | 278 | 9.0% |
| Total | 3,104 | 100.0% |
School Enrollment by Age by Funding Source in Kingston borough
Out of a total of 3,104 students who are enrolled in schools in Kingston borough, 866 (27.9%) attend a private institution, while the remaining 2,238 (72.1%) are enrolled in public schools. The age group of 25 to 34 year olds has the highest likelihood of being enrolled in private schools, with 187 (67.5% in the age bracket) enrolled. Conversely, the age group of 5 to 9 year old has the lowest likelihood of being enrolled in a private school, with 639 (85.0% in the age bracket) attending a public institution.
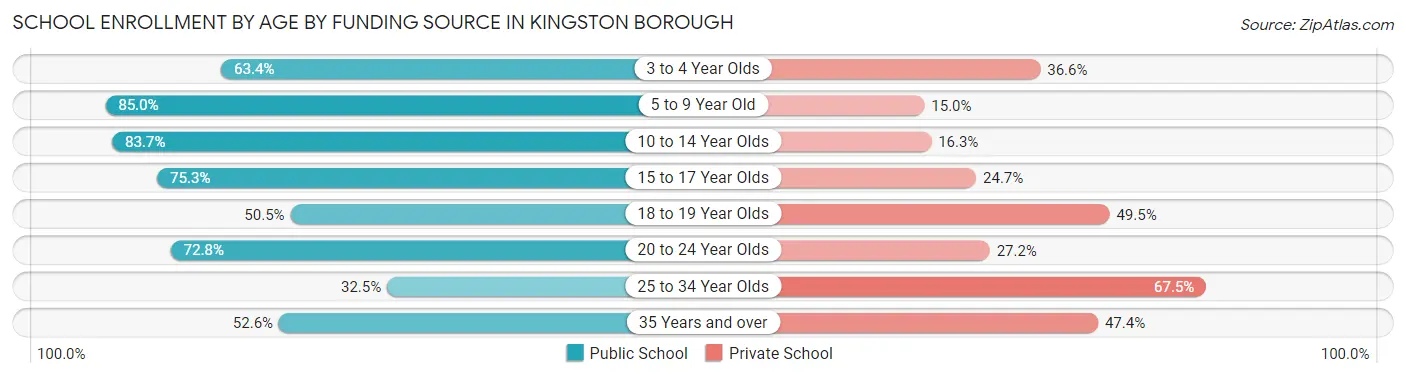
| Age Bracket | Public School | Private School |
| 3 to 4 Year Olds | 45 (63.4%) | 26 (36.6%) |
| 5 to 9 Year Old | 639 (85.0%) | 113 (15.0%) |
| 10 to 14 Year Olds | 760 (83.7%) | 148 (16.3%) |
| 15 to 17 Year Olds | 284 (75.3%) | 93 (24.7%) |
| 18 to 19 Year Olds | 156 (50.5%) | 153 (49.5%) |
| 20 to 24 Year Olds | 174 (72.8%) | 65 (27.2%) |
| 25 to 34 Year Olds | 90 (32.5%) | 187 (67.5%) |
| 35 Years and over | 90 (52.6%) | 81 (47.4%) |
| Total | 2,238 (72.1%) | 866 (27.9%) |
Educational Attainment by Field of Study in Kingston borough
Business (525 | 16.0%), education (440 | 13.4%), science & technology (413 | 12.6%), social sciences (263 | 8.0%), and bio, nature & agricultural (247 | 7.5%) are the most common fields of study among 3,274 individuals in Kingston borough who have obtained a bachelor's degree or higher.
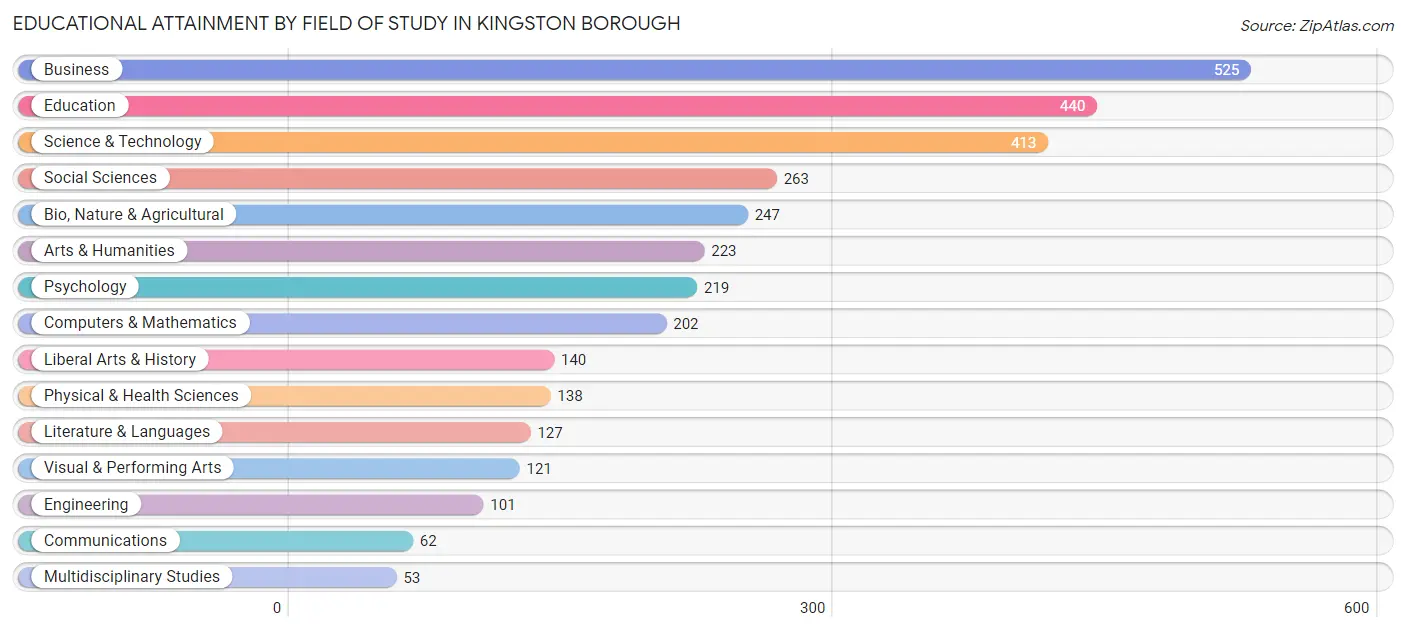
| Field of Study | # Graduates | % Graduates |
| Computers & Mathematics | 202 | 6.2% |
| Bio, Nature & Agricultural | 247 | 7.5% |
| Physical & Health Sciences | 138 | 4.2% |
| Psychology | 219 | 6.7% |
| Social Sciences | 263 | 8.0% |
| Engineering | 101 | 3.1% |
| Multidisciplinary Studies | 53 | 1.6% |
| Science & Technology | 413 | 12.6% |
| Business | 525 | 16.0% |
| Education | 440 | 13.4% |
| Literature & Languages | 127 | 3.9% |
| Liberal Arts & History | 140 | 4.3% |
| Visual & Performing Arts | 121 | 3.7% |
| Communications | 62 | 1.9% |
| Arts & Humanities | 223 | 6.8% |
| Total | 3,274 | 100.0% |
Transportation & Commute in Kingston borough
Vehicle Availability by Sex in Kingston borough
The most prevalent vehicle ownership categories in Kingston borough are males with 2 vehicles (1,205, accounting for 35.2%) and females with 2 vehicles (1,291, making up 39.5%).
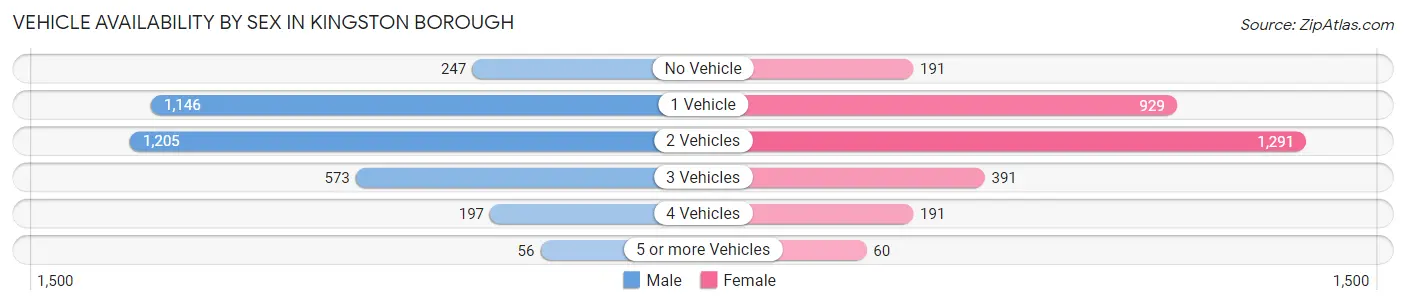
| Vehicles Available | Male | Female |
| No Vehicle | 247 (7.2%) | 191 (6.3%) |
| 1 Vehicle | 1,146 (33.5%) | 929 (30.4%) |
| 2 Vehicles | 1,205 (35.2%) | 1,291 (42.3%) |
| 3 Vehicles | 573 (16.7%) | 391 (12.8%) |
| 4 Vehicles | 197 (5.8%) | 191 (6.3%) |
| 5 or more Vehicles | 56 (1.6%) | 60 (2.0%) |
| Total | 3,424 (100.0%) | 3,053 (100.0%) |
Commute Time in Kingston borough
The most frequently occuring commute durations in Kingston borough are 10 to 14 minutes (1,449 commuters, 25.0%), 15 to 19 minutes (1,167 commuters, 20.2%), and 5 to 9 minutes (1,082 commuters, 18.7%).
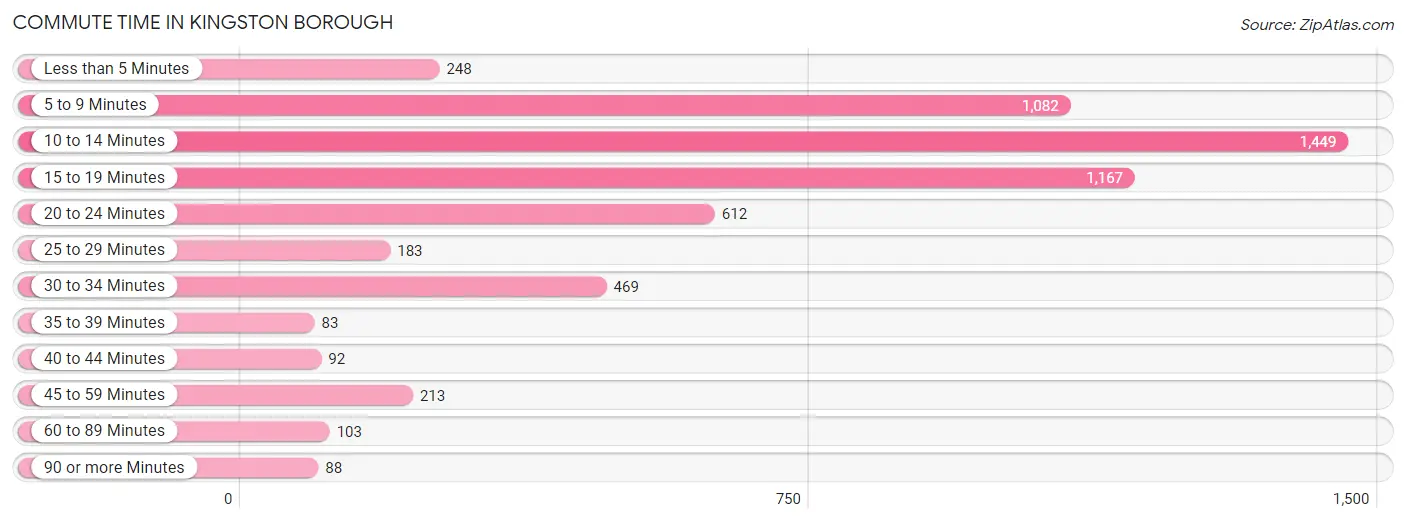
| Commute Time | # Commuters | % Commuters |
| Less than 5 Minutes | 248 | 4.3% |
| 5 to 9 Minutes | 1,082 | 18.7% |
| 10 to 14 Minutes | 1,449 | 25.0% |
| 15 to 19 Minutes | 1,167 | 20.2% |
| 20 to 24 Minutes | 612 | 10.6% |
| 25 to 29 Minutes | 183 | 3.2% |
| 30 to 34 Minutes | 469 | 8.1% |
| 35 to 39 Minutes | 83 | 1.4% |
| 40 to 44 Minutes | 92 | 1.6% |
| 45 to 59 Minutes | 213 | 3.7% |
| 60 to 89 Minutes | 103 | 1.8% |
| 90 or more Minutes | 88 | 1.5% |
Commute Time by Sex in Kingston borough
The most common commute times in Kingston borough are 10 to 14 minutes (680 commuters, 21.9%) for males and 10 to 14 minutes (769 commuters, 28.6%) for females.
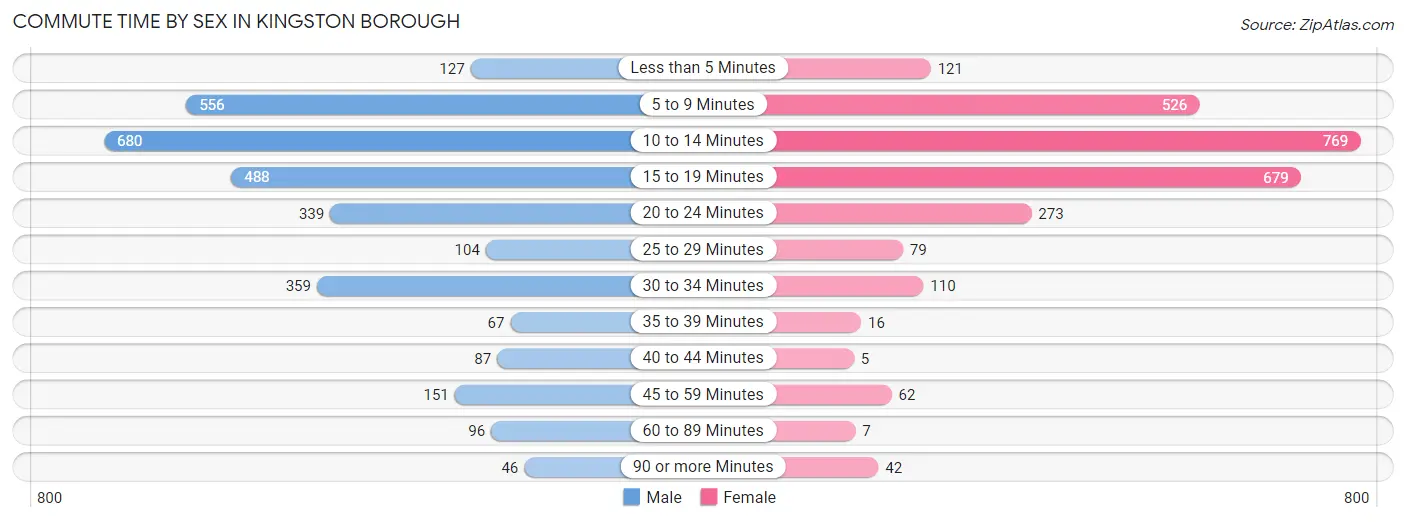
| Commute Time | Male | Female |
| Less than 5 Minutes | 127 (4.1%) | 121 (4.5%) |
| 5 to 9 Minutes | 556 (17.9%) | 526 (19.6%) |
| 10 to 14 Minutes | 680 (21.9%) | 769 (28.6%) |
| 15 to 19 Minutes | 488 (15.7%) | 679 (25.3%) |
| 20 to 24 Minutes | 339 (10.9%) | 273 (10.2%) |
| 25 to 29 Minutes | 104 (3.4%) | 79 (2.9%) |
| 30 to 34 Minutes | 359 (11.6%) | 110 (4.1%) |
| 35 to 39 Minutes | 67 (2.2%) | 16 (0.6%) |
| 40 to 44 Minutes | 87 (2.8%) | 5 (0.2%) |
| 45 to 59 Minutes | 151 (4.9%) | 62 (2.3%) |
| 60 to 89 Minutes | 96 (3.1%) | 7 (0.3%) |
| 90 or more Minutes | 46 (1.5%) | 42 (1.6%) |
Time of Departure to Work by Sex in Kingston borough
The most frequent times of departure to work in Kingston borough are 12:00 PM to 3:59 PM (382, 12.3%) for males and 8:00 AM to 8:29 AM (475, 17.7%) for females.
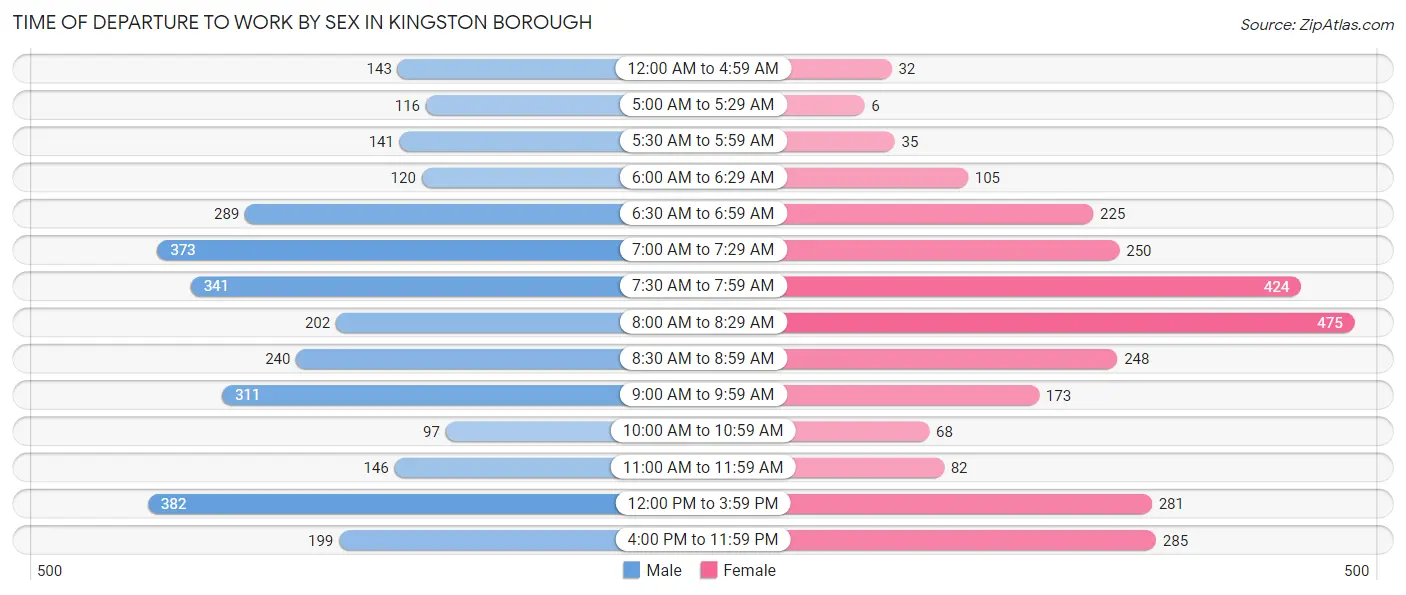
| Time of Departure | Male | Female |
| 12:00 AM to 4:59 AM | 143 (4.6%) | 32 (1.2%) |
| 5:00 AM to 5:29 AM | 116 (3.7%) | 6 (0.2%) |
| 5:30 AM to 5:59 AM | 141 (4.5%) | 35 (1.3%) |
| 6:00 AM to 6:29 AM | 120 (3.9%) | 105 (3.9%) |
| 6:30 AM to 6:59 AM | 289 (9.3%) | 225 (8.4%) |
| 7:00 AM to 7:29 AM | 373 (12.0%) | 250 (9.3%) |
| 7:30 AM to 7:59 AM | 341 (11.0%) | 424 (15.8%) |
| 8:00 AM to 8:29 AM | 202 (6.5%) | 475 (17.7%) |
| 8:30 AM to 8:59 AM | 240 (7.7%) | 248 (9.2%) |
| 9:00 AM to 9:59 AM | 311 (10.0%) | 173 (6.4%) |
| 10:00 AM to 10:59 AM | 97 (3.1%) | 68 (2.5%) |
| 11:00 AM to 11:59 AM | 146 (4.7%) | 82 (3.0%) |
| 12:00 PM to 3:59 PM | 382 (12.3%) | 281 (10.4%) |
| 4:00 PM to 11:59 PM | 199 (6.4%) | 285 (10.6%) |
| Total | 3,100 (100.0%) | 2,689 (100.0%) |
Housing Occupancy in Kingston borough
Occupancy by Ownership in Kingston borough
Of the total 5,895 dwellings in Kingston borough, owner-occupied units account for 2,753 (46.7%), while renter-occupied units make up 3,142 (53.3%).
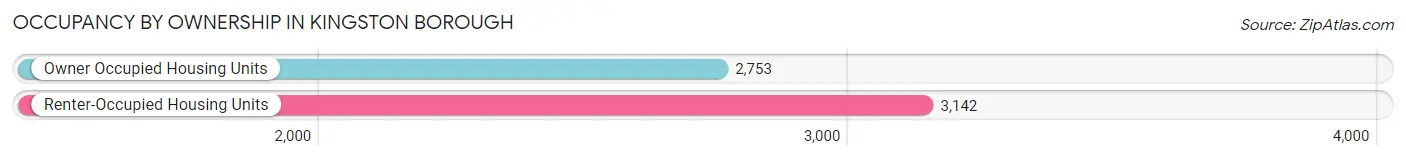
| Occupancy | # Housing Units | % Housing Units |
| Owner Occupied Housing Units | 2,753 | 46.7% |
| Renter-Occupied Housing Units | 3,142 | 53.3% |
| Total Occupied Housing Units | 5,895 | 100.0% |
Occupancy by Household Size in Kingston borough
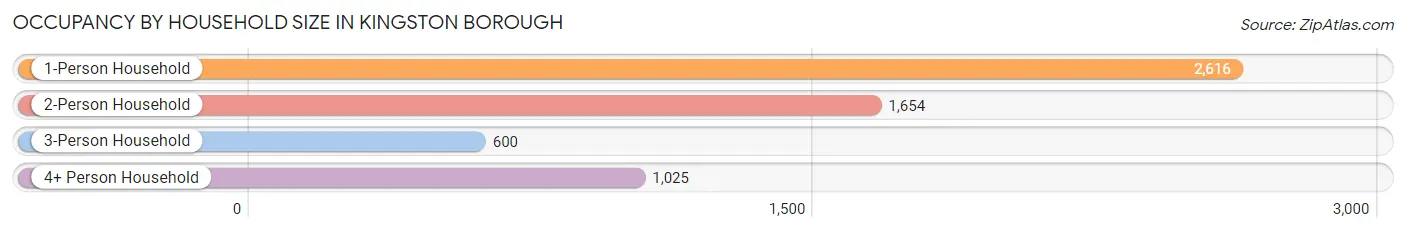
| Household Size | # Housing Units | % Housing Units |
| 1-Person Household | 2,616 | 44.4% |
| 2-Person Household | 1,654 | 28.1% |
| 3-Person Household | 600 | 10.2% |
| 4+ Person Household | 1,025 | 17.4% |
| Total Housing Units | 5,895 | 100.0% |
Occupancy by Ownership by Household Size in Kingston borough
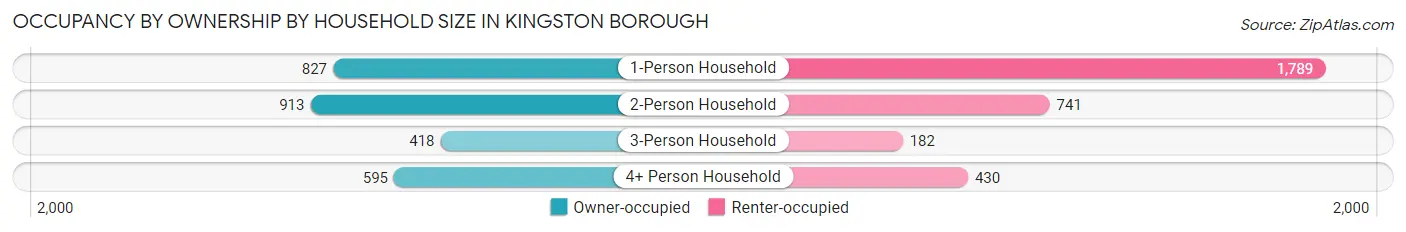
| Household Size | Owner-occupied | Renter-occupied |
| 1-Person Household | 827 (31.6%) | 1,789 (68.4%) |
| 2-Person Household | 913 (55.2%) | 741 (44.8%) |
| 3-Person Household | 418 (69.7%) | 182 (30.3%) |
| 4+ Person Household | 595 (58.1%) | 430 (41.9%) |
| Total Housing Units | 2,753 (46.7%) | 3,142 (53.3%) |
Occupancy by Educational Attainment in Kingston borough
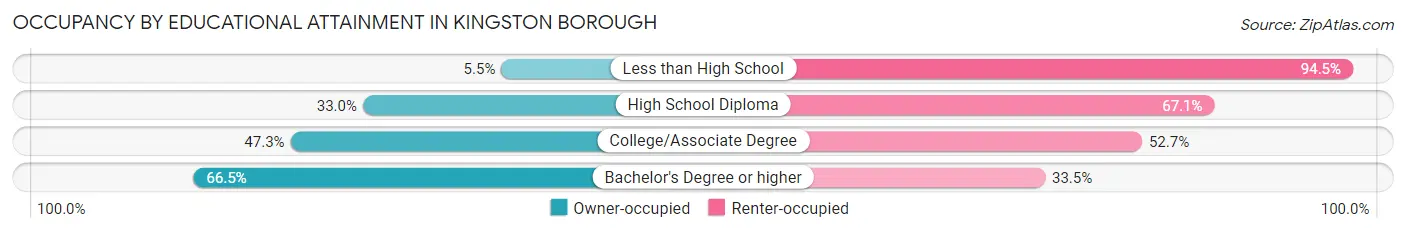
| Household Size | Owner-occupied | Renter-occupied |
| Less than High School | 18 (5.5%) | 309 (94.5%) |
| High School Diploma | 598 (33.0%) | 1,217 (67.0%) |
| College/Associate Degree | 885 (47.3%) | 986 (52.7%) |
| Bachelor's Degree or higher | 1,252 (66.5%) | 630 (33.5%) |
Occupancy by Age of Householder in Kingston borough
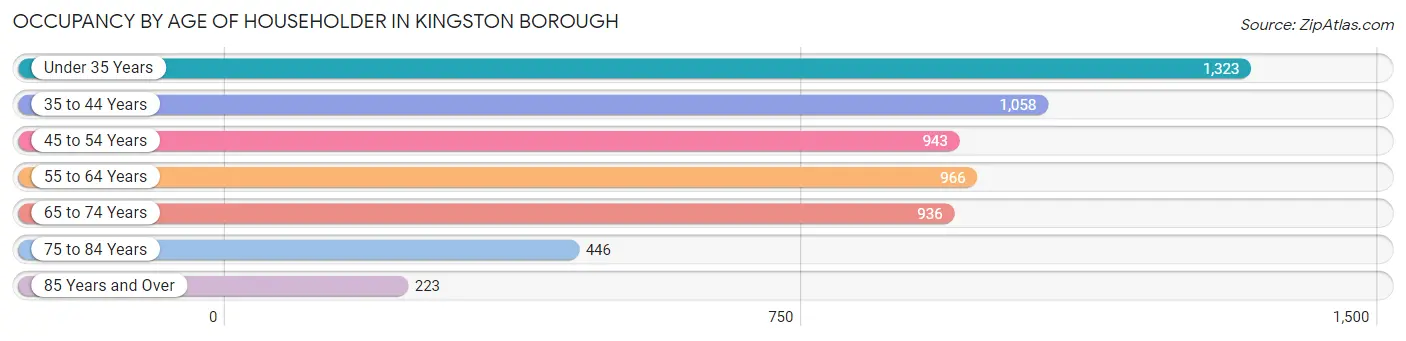
| Age Bracket | # Households | % Households |
| Under 35 Years | 1,323 | 22.4% |
| 35 to 44 Years | 1,058 | 17.9% |
| 45 to 54 Years | 943 | 16.0% |
| 55 to 64 Years | 966 | 16.4% |
| 65 to 74 Years | 936 | 15.9% |
| 75 to 84 Years | 446 | 7.6% |
| 85 Years and Over | 223 | 3.8% |
| Total | 5,895 | 100.0% |
Housing Finances in Kingston borough
Median Income by Occupancy in Kingston borough
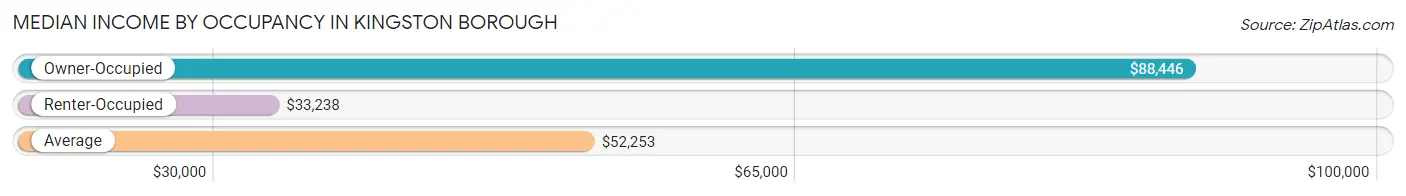
| Occupancy Type | # Households | Median Income |
| Owner-Occupied | 2,753 (46.7%) | $88,446 |
| Renter-Occupied | 3,142 (53.3%) | $33,238 |
| Average | 5,895 (100.0%) | $52,253 |
Occupancy by Householder Income Bracket in Kingston borough
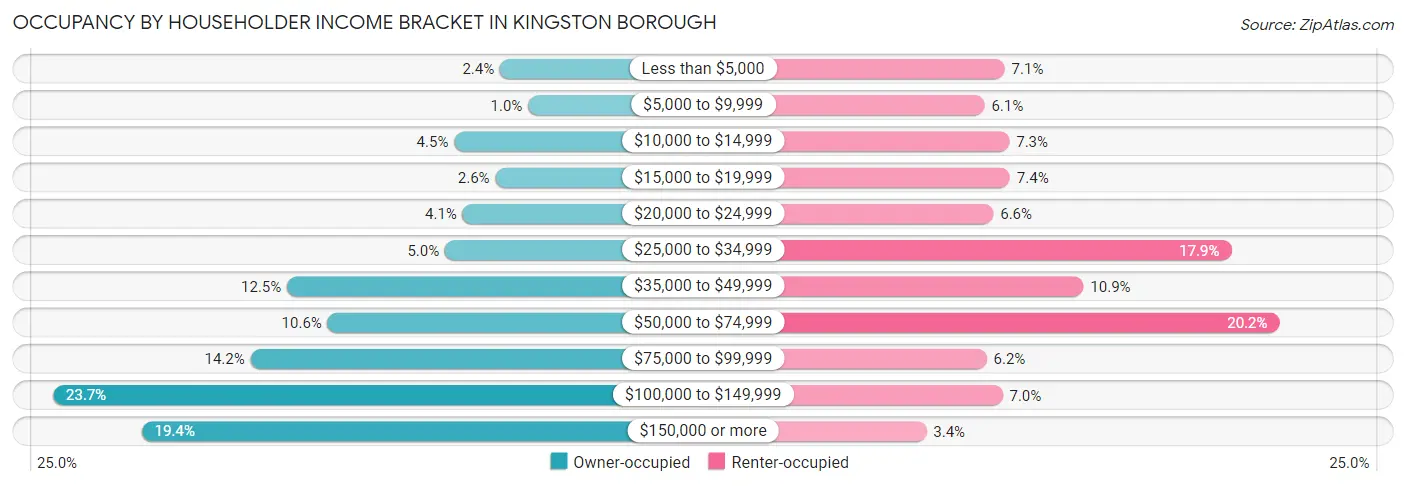
| Income Bracket | Owner-occupied | Renter-occupied |
| Less than $5,000 | 65 (2.4%) | 223 (7.1%) |
| $5,000 to $9,999 | 28 (1.0%) | 193 (6.1%) |
| $10,000 to $14,999 | 125 (4.5%) | 230 (7.3%) |
| $15,000 to $19,999 | 71 (2.6%) | 231 (7.3%) |
| $20,000 to $24,999 | 114 (4.1%) | 206 (6.6%) |
| $25,000 to $34,999 | 137 (5.0%) | 562 (17.9%) |
| $35,000 to $49,999 | 344 (12.5%) | 341 (10.8%) |
| $50,000 to $74,999 | 291 (10.6%) | 634 (20.2%) |
| $75,000 to $99,999 | 392 (14.2%) | 196 (6.2%) |
| $100,000 to $149,999 | 651 (23.6%) | 220 (7.0%) |
| $150,000 or more | 535 (19.4%) | 106 (3.4%) |
| Total | 2,753 (100.0%) | 3,142 (100.0%) |
Monthly Housing Cost Tiers in Kingston borough
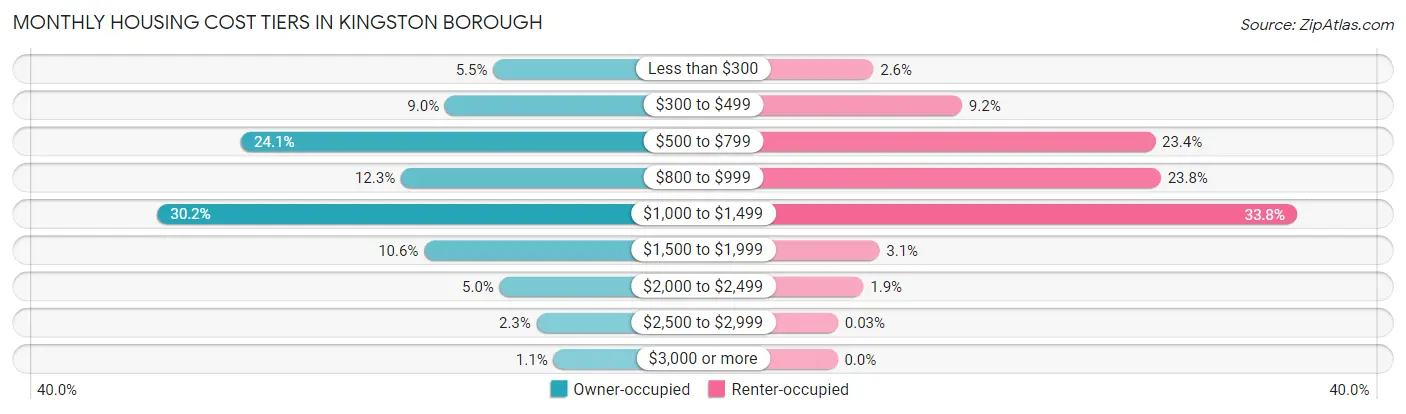
| Monthly Cost | Owner-occupied | Renter-occupied |
| Less than $300 | 151 (5.5%) | 83 (2.6%) |
| $300 to $499 | 249 (9.0%) | 288 (9.2%) |
| $500 to $799 | 662 (24.0%) | 735 (23.4%) |
| $800 to $999 | 338 (12.3%) | 748 (23.8%) |
| $1,000 to $1,499 | 832 (30.2%) | 1,063 (33.8%) |
| $1,500 to $1,999 | 291 (10.6%) | 97 (3.1%) |
| $2,000 to $2,499 | 138 (5.0%) | 60 (1.9%) |
| $2,500 to $2,999 | 63 (2.3%) | 1 (0.0%) |
| $3,000 or more | 29 (1.1%) | 0 (0.0%) |
| Total | 2,753 (100.0%) | 3,142 (100.0%) |
Physical Housing Characteristics in Kingston borough
Housing Structures in Kingston borough
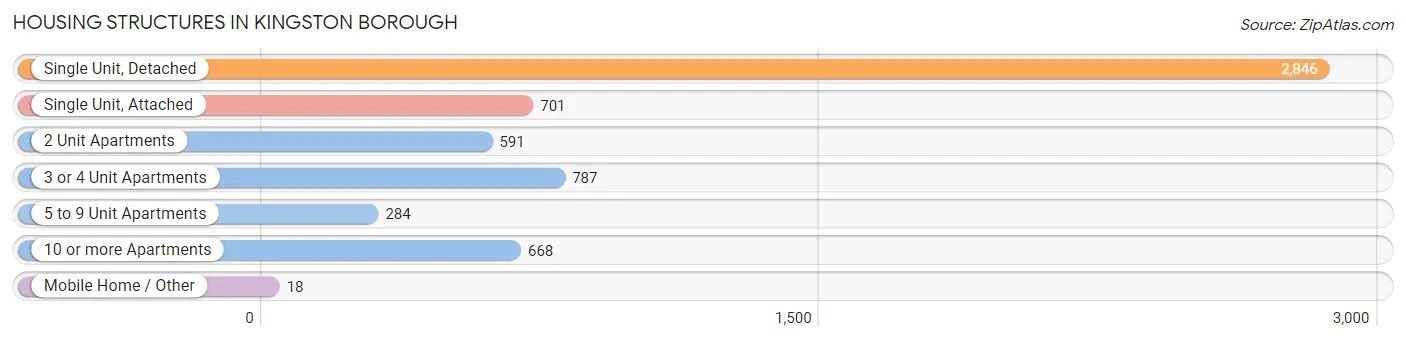
| Structure Type | # Housing Units | % Housing Units |
| Single Unit, Detached | 2,846 | 48.3% |
| Single Unit, Attached | 701 | 11.9% |
| 2 Unit Apartments | 591 | 10.0% |
| 3 or 4 Unit Apartments | 787 | 13.4% |
| 5 to 9 Unit Apartments | 284 | 4.8% |
| 10 or more Apartments | 668 | 11.3% |
| Mobile Home / Other | 18 | 0.3% |
| Total | 5,895 | 100.0% |
Housing Structures by Occupancy in Kingston borough
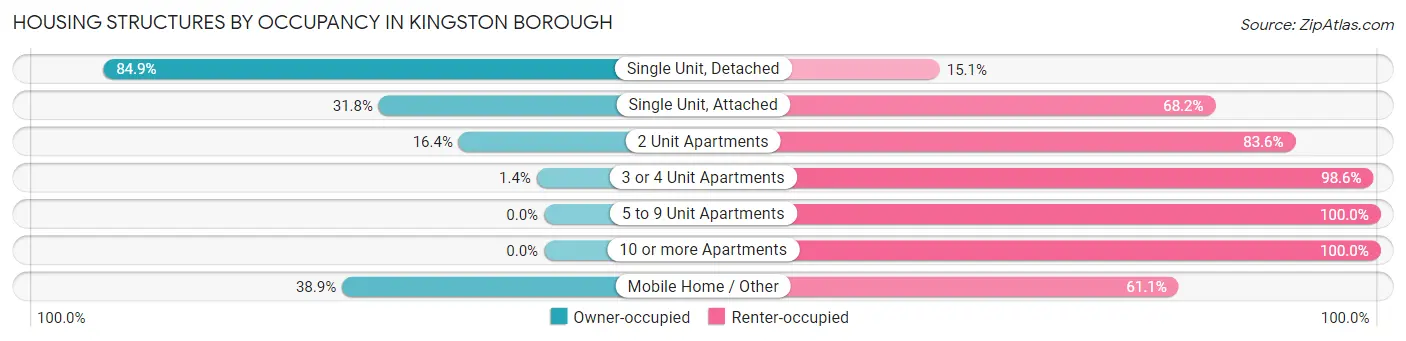
| Structure Type | Owner-occupied | Renter-occupied |
| Single Unit, Detached | 2,415 (84.9%) | 431 (15.1%) |
| Single Unit, Attached | 223 (31.8%) | 478 (68.2%) |
| 2 Unit Apartments | 97 (16.4%) | 494 (83.6%) |
| 3 or 4 Unit Apartments | 11 (1.4%) | 776 (98.6%) |
| 5 to 9 Unit Apartments | 0 (0.0%) | 284 (100.0%) |
| 10 or more Apartments | 0 (0.0%) | 668 (100.0%) |
| Mobile Home / Other | 7 (38.9%) | 11 (61.1%) |
| Total | 2,753 (46.7%) | 3,142 (53.3%) |
Housing Structures by Number of Rooms in Kingston borough
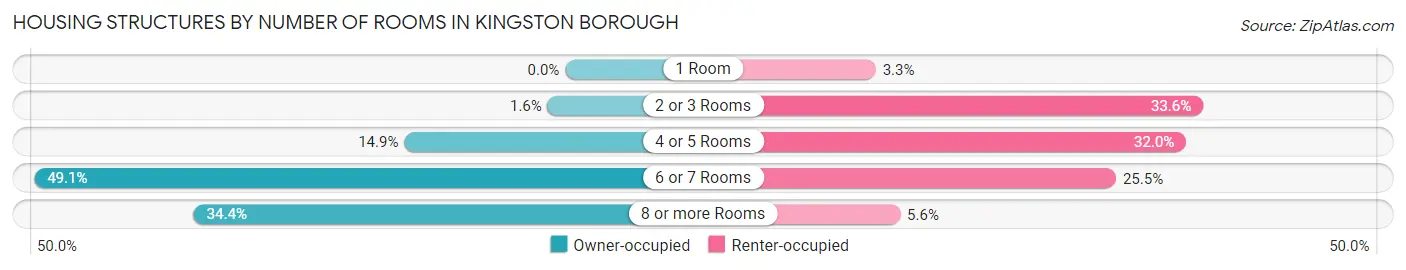
| Number of Rooms | Owner-occupied | Renter-occupied |
| 1 Room | 0 (0.0%) | 104 (3.3%) |
| 2 or 3 Rooms | 45 (1.6%) | 1,055 (33.6%) |
| 4 or 5 Rooms | 410 (14.9%) | 1,006 (32.0%) |
| 6 or 7 Rooms | 1,352 (49.1%) | 802 (25.5%) |
| 8 or more Rooms | 946 (34.4%) | 175 (5.6%) |
| Total | 2,753 (100.0%) | 3,142 (100.0%) |
Housing Structure by Heating Type in Kingston borough
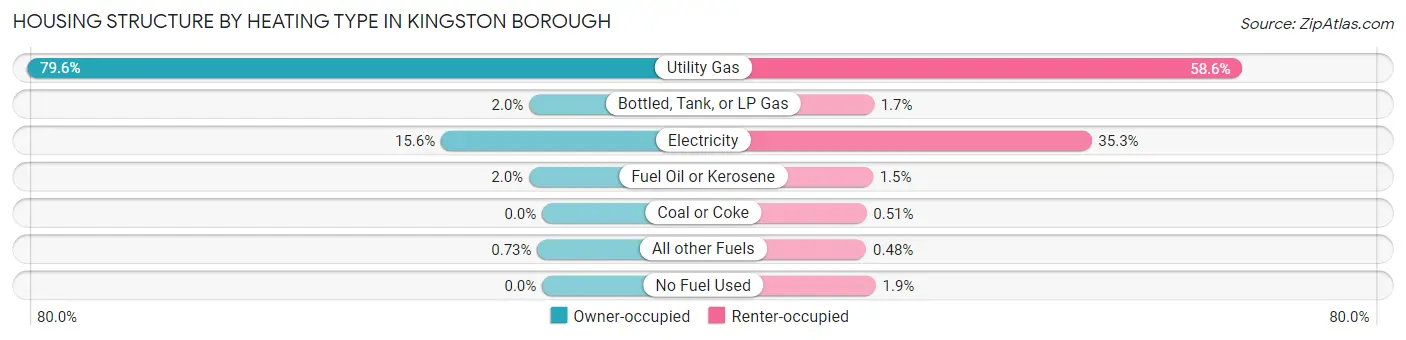
| Heating Type | Owner-occupied | Renter-occupied |
| Utility Gas | 2,192 (79.6%) | 1,842 (58.6%) |
| Bottled, Tank, or LP Gas | 55 (2.0%) | 52 (1.7%) |
| Electricity | 430 (15.6%) | 1,109 (35.3%) |
| Fuel Oil or Kerosene | 56 (2.0%) | 47 (1.5%) |
| Coal or Coke | 0 (0.0%) | 16 (0.5%) |
| All other Fuels | 20 (0.7%) | 15 (0.5%) |
| No Fuel Used | 0 (0.0%) | 61 (1.9%) |
| Total | 2,753 (100.0%) | 3,142 (100.0%) |
Household Vehicle Usage in Kingston borough
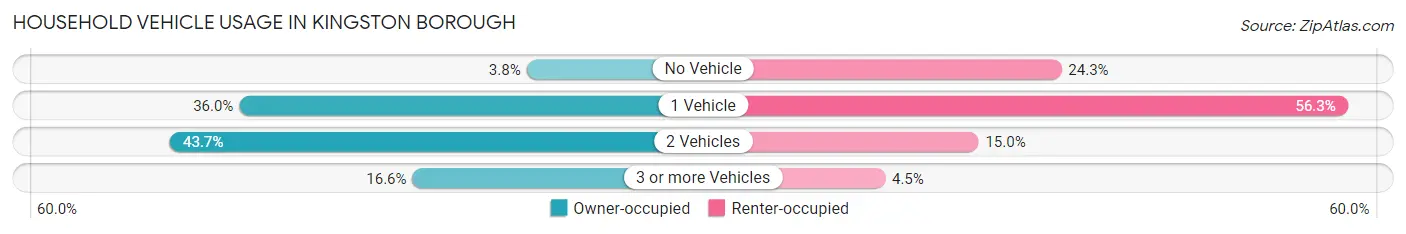
| Vehicles per Household | Owner-occupied | Renter-occupied |
| No Vehicle | 104 (3.8%) | 762 (24.2%) |
| 1 Vehicle | 990 (36.0%) | 1,769 (56.3%) |
| 2 Vehicles | 1,203 (43.7%) | 470 (15.0%) |
| 3 or more Vehicles | 456 (16.6%) | 141 (4.5%) |
| Total | 2,753 (100.0%) | 3,142 (100.0%) |
Real Estate & Mortgages in Kingston borough
Real Estate and Mortgage Overview in Kingston borough
| Characteristic | Without Mortgage | With Mortgage |
| Housing Units | 1,225 | 1,528 |
| Median Property Value | $154,500 | $143,600 |
| Median Household Income | $57,165 | $386 |
| Monthly Housing Costs | $608 | $29 |
| Real Estate Taxes | $2,600 | $8 |
Property Value by Mortgage Status in Kingston borough
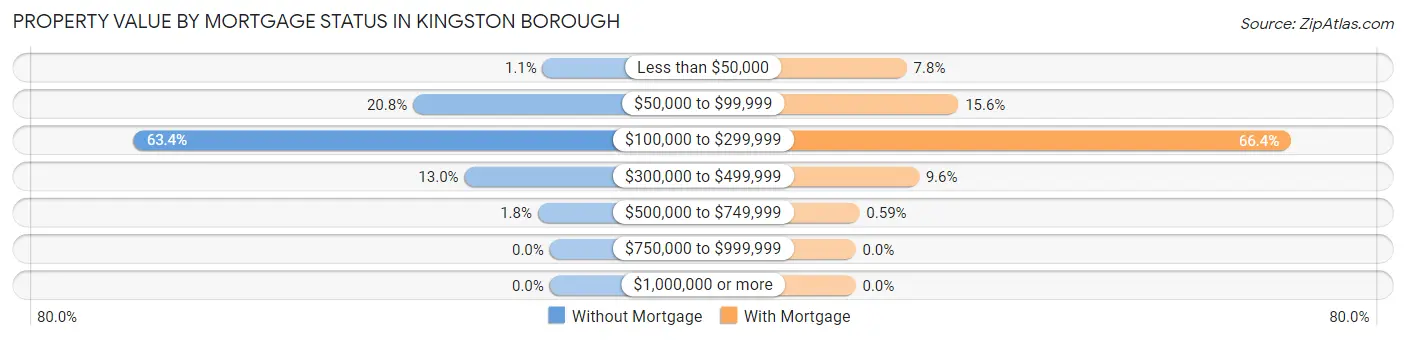
| Property Value | Without Mortgage | With Mortgage |
| Less than $50,000 | 13 (1.1%) | 119 (7.8%) |
| $50,000 to $99,999 | 255 (20.8%) | 239 (15.6%) |
| $100,000 to $299,999 | 776 (63.3%) | 1,014 (66.4%) |
| $300,000 to $499,999 | 159 (13.0%) | 147 (9.6%) |
| $500,000 to $749,999 | 22 (1.8%) | 9 (0.6%) |
| $750,000 to $999,999 | 0 (0.0%) | 0 (0.0%) |
| $1,000,000 or more | 0 (0.0%) | 0 (0.0%) |
| Total | 1,225 (100.0%) | 1,528 (100.0%) |
Household Income by Mortgage Status in Kingston borough

| Household Income | Without Mortgage | With Mortgage |
| Less than $10,000 | 76 (6.2%) | 62 (4.1%) |
| $10,000 to $24,999 | 171 (14.0%) | 17 (1.1%) |
| $25,000 to $34,999 | 36 (2.9%) | 139 (9.1%) |
| $35,000 to $49,999 | 249 (20.3%) | 101 (6.6%) |
| $50,000 to $74,999 | 152 (12.4%) | 95 (6.2%) |
| $75,000 to $99,999 | 126 (10.3%) | 139 (9.1%) |
| $100,000 to $149,999 | 266 (21.7%) | 266 (17.4%) |
| $150,000 or more | 149 (12.2%) | 385 (25.2%) |
| Total | 1,225 (100.0%) | 1,528 (100.0%) |
Property Value to Household Income Ratio in Kingston borough
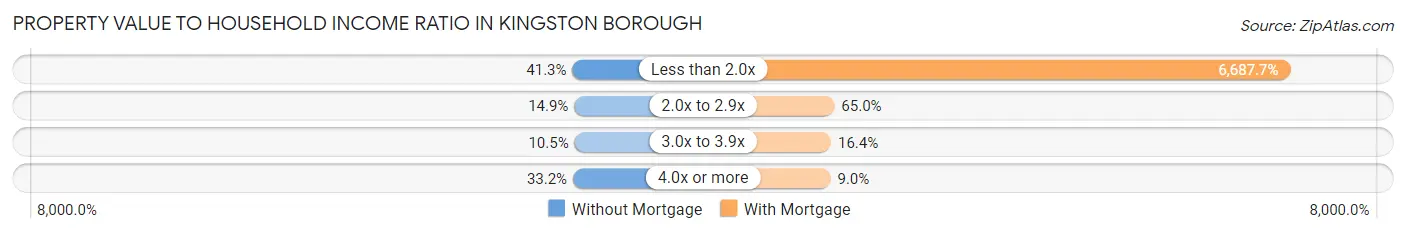
| Value-to-Income Ratio | Without Mortgage | With Mortgage |
| Less than 2.0x | 506 (41.3%) | 102,188 (6,687.7%) |
| 2.0x to 2.9x | 183 (14.9%) | 993 (65.0%) |
| 3.0x to 3.9x | 129 (10.5%) | 251 (16.4%) |
| 4.0x or more | 407 (33.2%) | 138 (9.0%) |
| Total | 1,225 (100.0%) | 1,528 (100.0%) |
Real Estate Taxes by Mortgage Status in Kingston borough
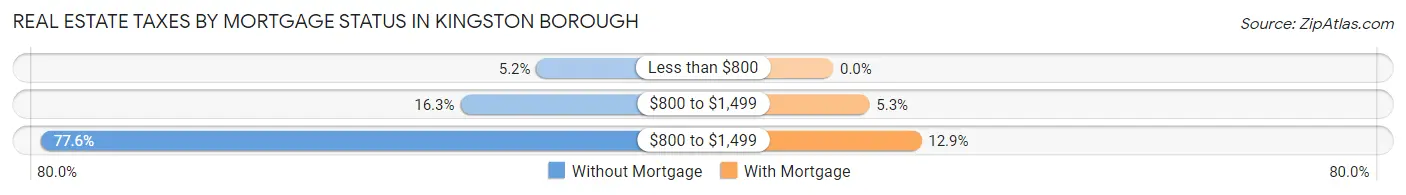
| Property Taxes | Without Mortgage | With Mortgage |
| Less than $800 | 64 (5.2%) | 0 (0.0%) |
| $800 to $1,499 | 200 (16.3%) | 81 (5.3%) |
| $800 to $1,499 | 951 (77.6%) | 197 (12.9%) |
| Total | 1,225 (100.0%) | 1,528 (100.0%) |
Health & Disability in Kingston borough
Health Insurance Coverage by Age in Kingston borough
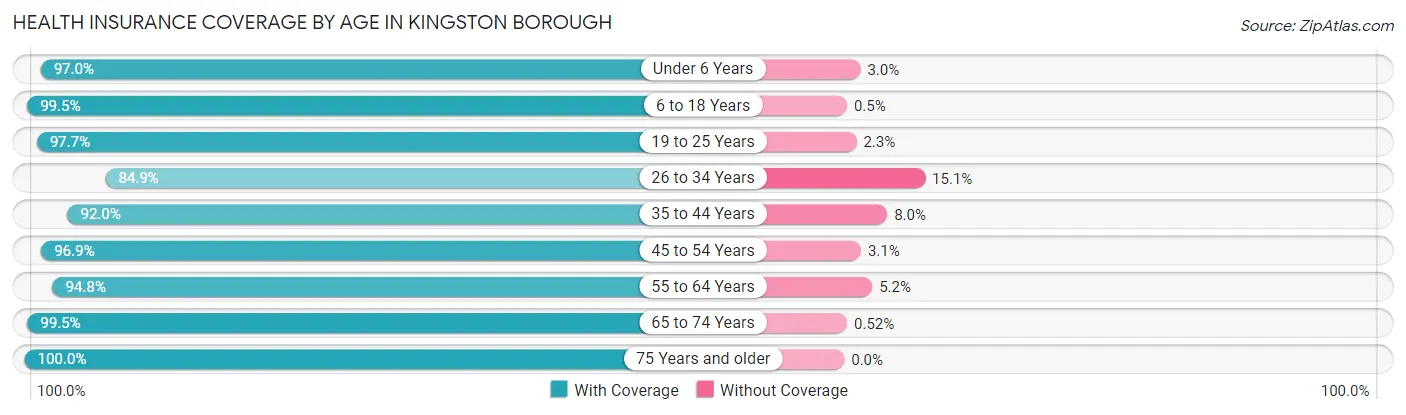
| Age Bracket | With Coverage | Without Coverage |
| Under 6 Years | 871 (97.0%) | 27 (3.0%) |
| 6 to 18 Years | 2,179 (99.5%) | 11 (0.5%) |
| 19 to 25 Years | 990 (97.7%) | 23 (2.3%) |
| 26 to 34 Years | 1,785 (84.9%) | 317 (15.1%) |
| 35 to 44 Years | 1,425 (92.0%) | 124 (8.0%) |
| 45 to 54 Years | 1,402 (96.9%) | 45 (3.1%) |
| 55 to 64 Years | 1,401 (94.8%) | 77 (5.2%) |
| 65 to 74 Years | 1,347 (99.5%) | 7 (0.5%) |
| 75 Years and older | 938 (100.0%) | 0 (0.0%) |
| Total | 12,338 (95.1%) | 631 (4.9%) |
Health Insurance Coverage by Citizenship Status in Kingston borough
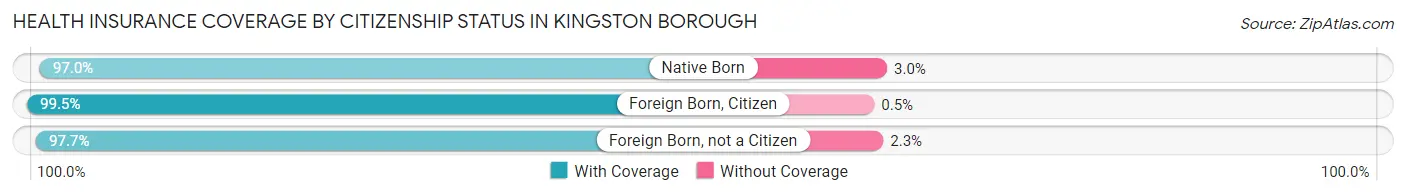
| Citizenship Status | With Coverage | Without Coverage |
| Native Born | 871 (97.0%) | 27 (3.0%) |
| Foreign Born, Citizen | 2,179 (99.5%) | 11 (0.5%) |
| Foreign Born, not a Citizen | 990 (97.7%) | 23 (2.3%) |
Health Insurance Coverage by Household Income in Kingston borough
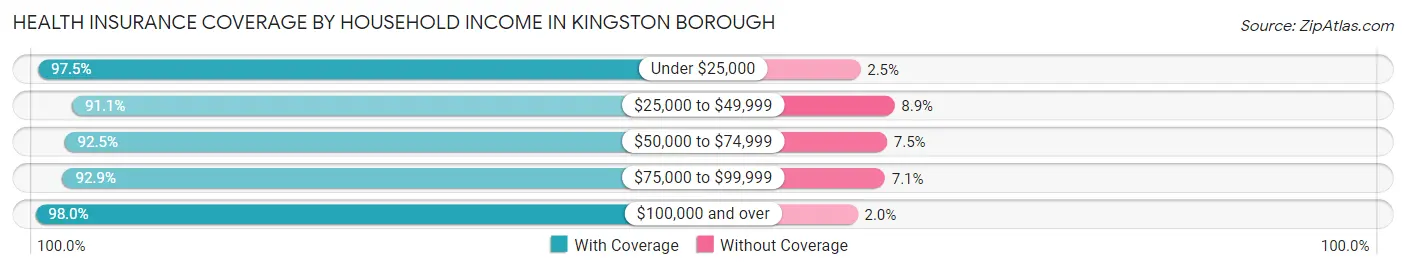
| Household Income | With Coverage | Without Coverage |
| Under $25,000 | 2,232 (97.5%) | 58 (2.5%) |
| $25,000 to $49,999 | 2,116 (91.1%) | 207 (8.9%) |
| $50,000 to $74,999 | 1,950 (92.5%) | 158 (7.5%) |
| $75,000 to $99,999 | 1,527 (92.9%) | 117 (7.1%) |
| $100,000 and over | 4,443 (98.0%) | 91 (2.0%) |
Public vs Private Health Insurance Coverage by Age in Kingston borough
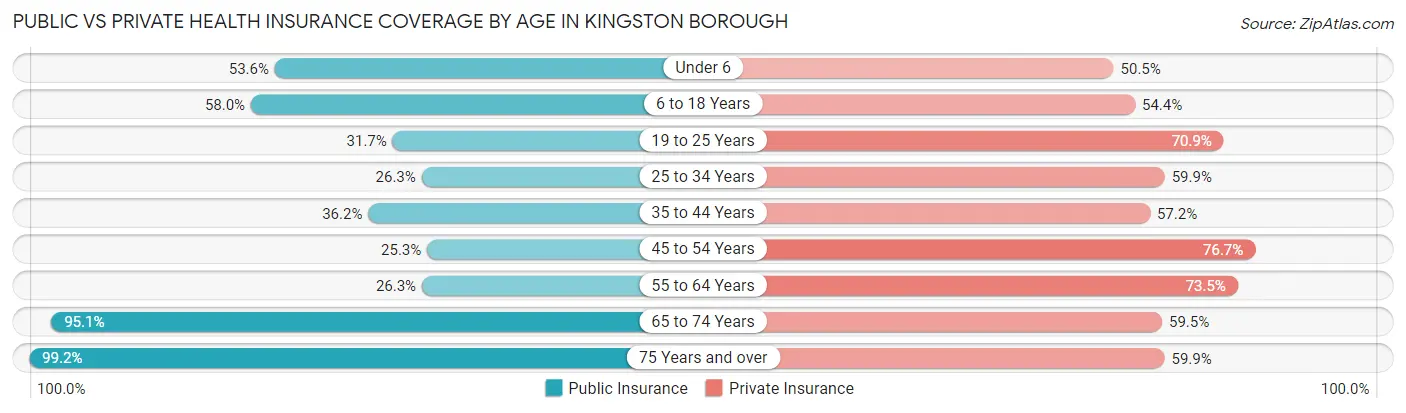
| Age Bracket | Public Insurance | Private Insurance |
| Under 6 | 481 (53.6%) | 453 (50.4%) |
| 6 to 18 Years | 1,270 (58.0%) | 1,192 (54.4%) |
| 19 to 25 Years | 321 (31.7%) | 718 (70.9%) |
| 25 to 34 Years | 553 (26.3%) | 1,260 (59.9%) |
| 35 to 44 Years | 561 (36.2%) | 886 (57.2%) |
| 45 to 54 Years | 366 (25.3%) | 1,110 (76.7%) |
| 55 to 64 Years | 388 (26.3%) | 1,086 (73.5%) |
| 65 to 74 Years | 1,287 (95.1%) | 805 (59.5%) |
| 75 Years and over | 930 (99.2%) | 562 (59.9%) |
| Total | 6,157 (47.5%) | 8,072 (62.2%) |
Disability Status by Sex by Age in Kingston borough
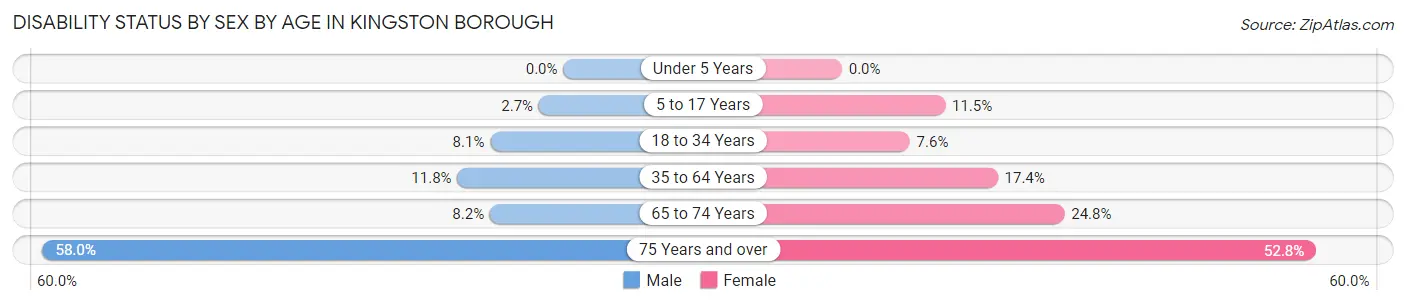
| Age Bracket | Male | Female |
| Under 5 Years | 0 (0.0%) | 0 (0.0%) |
| 5 to 17 Years | 27 (2.7%) | 126 (11.5%) |
| 18 to 34 Years | 132 (8.1%) | 129 (7.6%) |
| 35 to 64 Years | 256 (11.8%) | 400 (17.3%) |
| 65 to 74 Years | 46 (8.2%) | 196 (24.8%) |
| 75 Years and over | 174 (58.0%) | 337 (52.8%) |
Disability Class by Sex by Age in Kingston borough
Disability Class: Hearing Difficulty
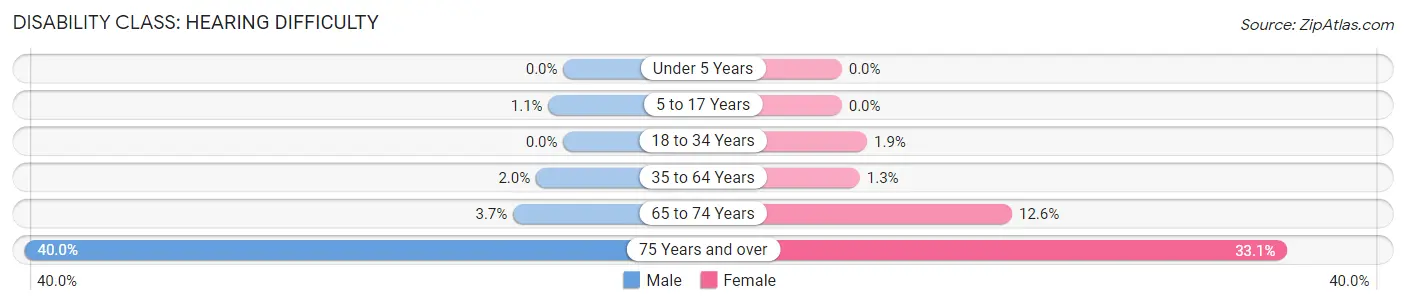
| Age Bracket | Male | Female |
| Under 5 Years | 0 (0.0%) | 0 (0.0%) |
| 5 to 17 Years | 11 (1.1%) | 0 (0.0%) |
| 18 to 34 Years | 0 (0.0%) | 32 (1.9%) |
| 35 to 64 Years | 44 (2.0%) | 31 (1.3%) |
| 65 to 74 Years | 21 (3.7%) | 100 (12.6%) |
| 75 Years and over | 120 (40.0%) | 211 (33.1%) |
Disability Class: Vision Difficulty
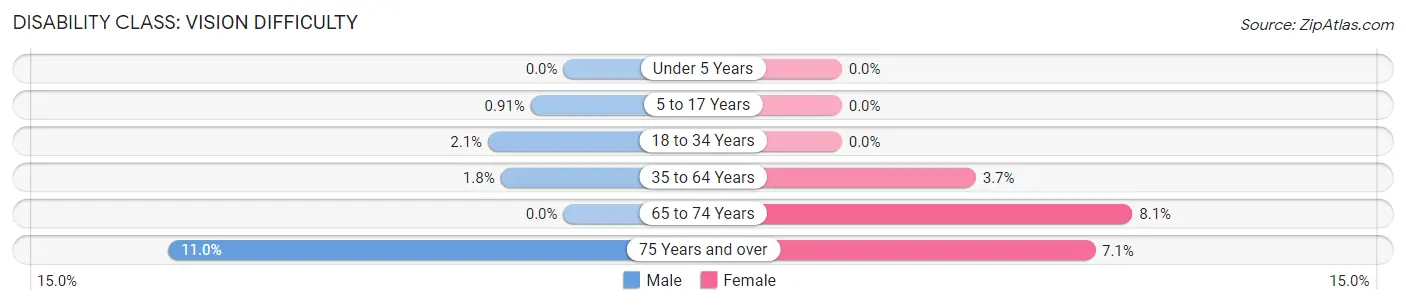
| Age Bracket | Male | Female |
| Under 5 Years | 0 (0.0%) | 0 (0.0%) |
| 5 to 17 Years | 9 (0.9%) | 0 (0.0%) |
| 18 to 34 Years | 34 (2.1%) | 0 (0.0%) |
| 35 to 64 Years | 38 (1.8%) | 86 (3.7%) |
| 65 to 74 Years | 0 (0.0%) | 64 (8.1%) |
| 75 Years and over | 33 (11.0%) | 45 (7.0%) |
Disability Class: Cognitive Difficulty
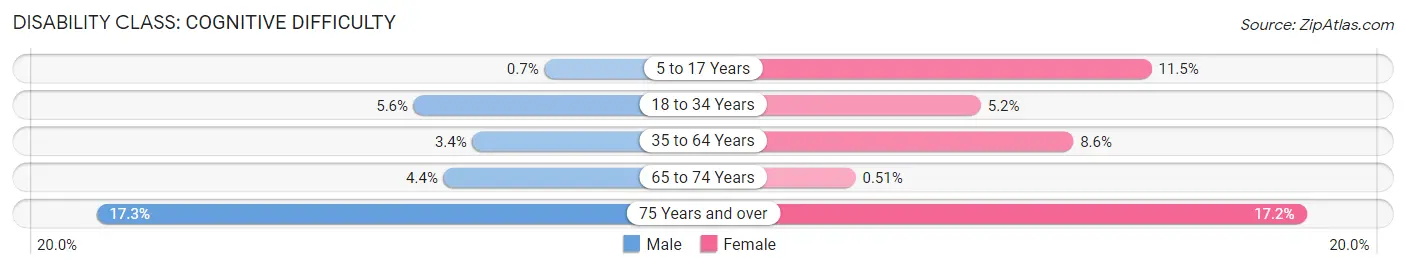
| Age Bracket | Male | Female |
| 5 to 17 Years | 7 (0.7%) | 126 (11.5%) |
| 18 to 34 Years | 90 (5.6%) | 88 (5.2%) |
| 35 to 64 Years | 73 (3.4%) | 198 (8.6%) |
| 65 to 74 Years | 25 (4.4%) | 4 (0.5%) |
| 75 Years and over | 52 (17.3%) | 110 (17.2%) |
Disability Class: Ambulatory Difficulty
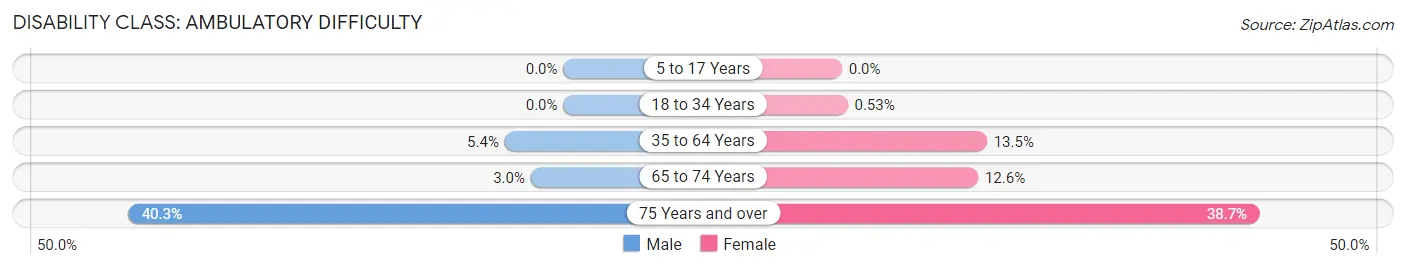
| Age Bracket | Male | Female |
| 5 to 17 Years | 0 (0.0%) | 0 (0.0%) |
| 18 to 34 Years | 0 (0.0%) | 9 (0.5%) |
| 35 to 64 Years | 118 (5.4%) | 310 (13.5%) |
| 65 to 74 Years | 17 (3.0%) | 100 (12.6%) |
| 75 Years and over | 121 (40.3%) | 247 (38.7%) |
Disability Class: Self-Care Difficulty
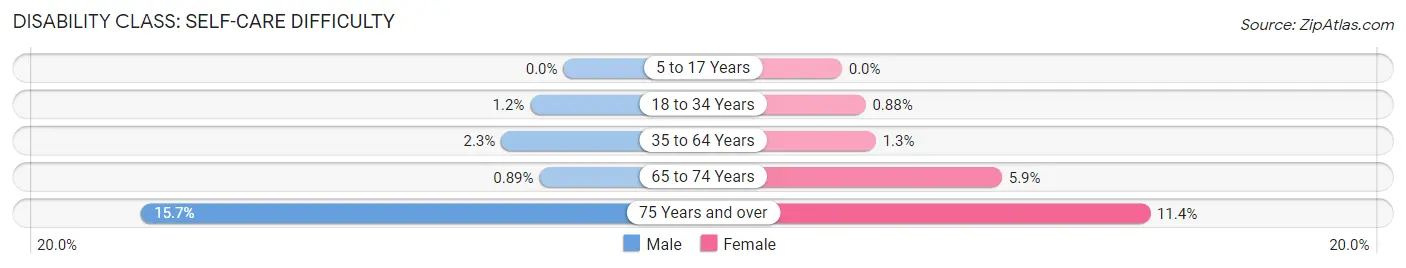
| Age Bracket | Male | Female |
| 5 to 17 Years | 0 (0.0%) | 0 (0.0%) |
| 18 to 34 Years | 20 (1.2%) | 15 (0.9%) |
| 35 to 64 Years | 50 (2.3%) | 29 (1.3%) |
| 65 to 74 Years | 5 (0.9%) | 47 (5.9%) |
| 75 Years and over | 47 (15.7%) | 73 (11.4%) |
Technology Access in Kingston borough
Computing Device Access in Kingston borough
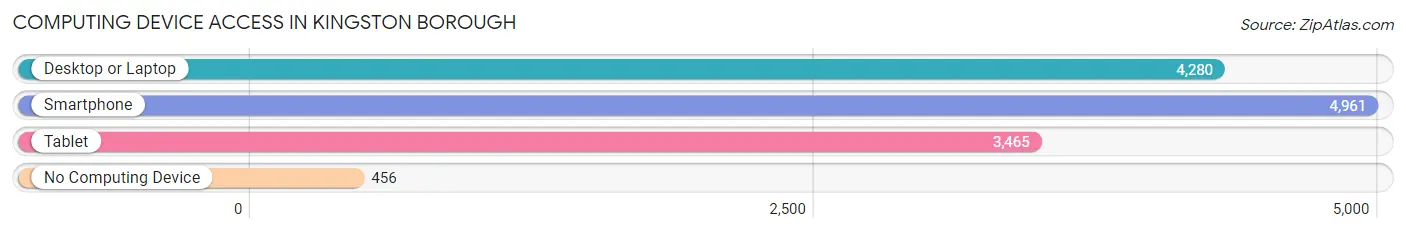
| Device Type | # Households | % Households |
| Desktop or Laptop | 4,280 | 72.6% |
| Smartphone | 4,961 | 84.2% |
| Tablet | 3,465 | 58.8% |
| No Computing Device | 456 | 7.7% |
| Total | 5,895 | 100.0% |
Internet Access in Kingston borough
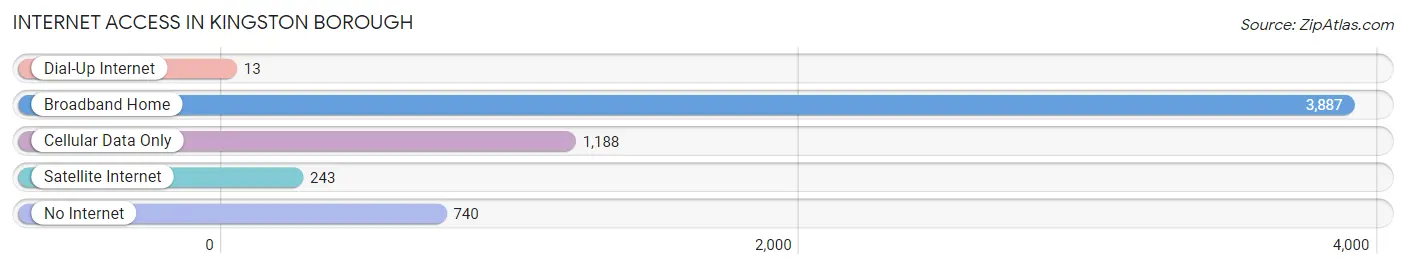
| Internet Type | # Households | % Households |
| Dial-Up Internet | 13 | 0.2% |
| Broadband Home | 3,887 | 65.9% |
| Cellular Data Only | 1,188 | 20.2% |
| Satellite Internet | 243 | 4.1% |
| No Internet | 740 | 12.6% |
| Total | 5,895 | 100.0% |
Kingston borough Summary
Kingston Borough is a borough located in Luzerne County, Pennsylvania, United States. It is located in the Wyoming Valley, a region of the Northeastern United States. The population of Kingston Borough was 13,182 at the 2010 census.
History
The area that is now Kingston Borough was first settled in 1769 by a group of Welsh immigrants. The town was originally known as "Wyoming," but was later renamed "Kingston" in honor of King George III of England. The town was incorporated as a borough in 1857.
In the late 19th century, Kingston was a major coal mining center. The coal industry was the main source of employment for the town's residents. The coal industry declined in the early 20th century, and the town's economy shifted to manufacturing.
Geography
Kingston Borough is located in the Wyoming Valley of Northeastern Pennsylvania. It is bordered by the Susquehanna River to the north, the city of Wilkes-Barre to the east, the borough of Forty Fort to the south, and the borough of Swoyersville to the west.
The borough has a total area of 2.2 square miles, all of which is land. The terrain is mostly flat, with some hills in the northern part of the borough.
Economy
The economy of Kingston Borough is largely based on manufacturing. The borough is home to several factories, including a paper mill, a plastics factory, and a metal fabrication plant.
The borough also has a number of retail stores, restaurants, and other businesses. The downtown area is home to a variety of shops and restaurants.
Demographics
As of the 2010 census, the population of Kingston Borough was 13,182. The racial makeup of the borough was 94.3% White, 2.3% African American, 0.4% Native American, 0.7% Asian, 0.1% Pacific Islander, 0.9% from other races, and 1.3% from two or more races. Hispanic or Latino of any race were 3.2% of the population.
The median household income in Kingston Borough was $37,917, and the median family income was $45,917. The per capita income was $19,945. About 11.3% of families and 14.2% of the population were below the poverty line, including 22.2% of those under age 18 and 8.2% of those age 65 or over.
The population of Kingston Borough is largely Catholic, with a small number of other religious affiliations. The borough is served by several churches, including St. Mary's Church, St. John's Church, and St. Joseph's Church.
Common Questions
What is Per Capita Income in Kingston borough?
Per Capita income in Kingston borough is $35,136.
What is the Median Family Income in Kingston borough?
Median Family Income in Kingston borough is $80,804.
What is the Median Household income in Kingston borough?
Median Household Income in Kingston borough is $52,253.
What is Income or Wage Gap in Kingston borough?
Income or Wage Gap in Kingston borough is 29.2%.
Women in Kingston borough earn 70.8 cents for every dollar earned by a man.
What is Family Income Deficit in Kingston borough?
Family Income Deficit in Kingston borough is $11,084.
Families that are below poverty line in Kingston borough earn $11,084 less on average than the poverty threshold level.
What is Inequality or Gini Index in Kingston borough?
Inequality or Gini Index in Kingston borough is 0.51.
What is the Total Population of Kingston borough?
Total Population of Kingston borough is 13,317.
What is the Total Male Population of Kingston borough?
Total Male Population of Kingston borough is 6,276.
What is the Total Female Population of Kingston borough?
Total Female Population of Kingston borough is 7,041.
What is the Ratio of Males per 100 Females in Kingston borough?
There are 89.14 Males per 100 Females in Kingston borough.
What is the Ratio of Females per 100 Males in Kingston borough?
There are 112.19 Females per 100 Males in Kingston borough.
What is the Median Population Age in Kingston borough?
Median Population Age in Kingston borough is 37.6 Years.
What is the Average Family Size in Kingston borough
Average Family Size in Kingston borough is 3.2 People.
What is the Average Household Size in Kingston borough
Average Household Size in Kingston borough is 2.2 People.
How Large is the Labor Force in Kingston borough?
There are 6,931 People in the Labor Forcein in Kingston borough.
What is the Percentage of People in the Labor Force in Kingston borough?
65.3% of People are in the Labor Force in Kingston borough.
What is the Unemployment Rate in Kingston borough?
Unemployment Rate in Kingston borough is 5.3%.