Kennerdell, PA Map & Demographics
Kennerdell Map
Kennerdell Overview
$40,485
PER CAPITA INCOME
$76,696
AVG FAMILY INCOME
$55,909
AVG HOUSEHOLD INCOME
10.3%
WAGE / INCOME GAP [ % ]
89.7¢/ $1
WAGE / INCOME GAP [ $ ]
0.31
INEQUALITY / GINI INDEX
172
TOTAL POPULATION
91
MALE POPULATION
81
FEMALE POPULATION
112.35
MALES / 100 FEMALES
89.01
FEMALES / 100 MALES
64.2
MEDIAN AGE
2.0
AVG FAMILY SIZE
1.6
AVG HOUSEHOLD SIZE
94
LABOR FORCE [ PEOPLE ]
55.6%
PERCENT IN LABOR FORCE
Kennerdell Zip Codes
Kennerdell Area Codes
Income in Kennerdell
Income Overview in Kennerdell
Per Capita Income in Kennerdell is $40,485, while median incomes of families and households are $76,696 and $55,909 respectively.
| Characteristic | Number | Measure |
| Per Capita Income | 172 | $40,485 |
| Median Family Income | 65 | $76,696 |
| Mean Family Income | 65 | $85,998 |
| Median Household Income | 104 | $55,909 |
| Mean Household Income | 104 | $67,024 |
| Income Deficit | 65 | $0 |
| Wage / Income Gap (%) | 172 | 10.29% |
| Wage / Income Gap ($) | 172 | 89.71¢ per $1 |
| Gini / Inequality Index | 172 | 0.31 |
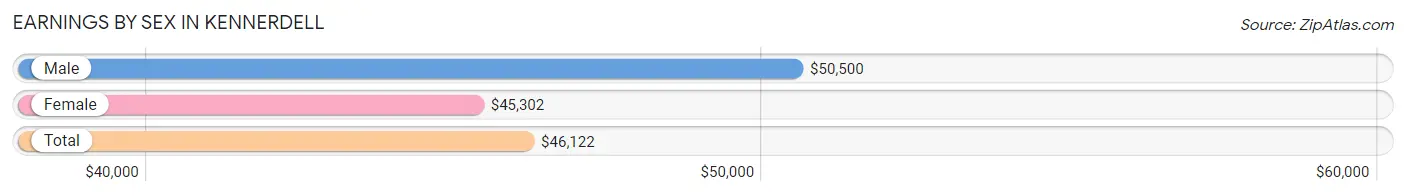
Earnings by Sex in Kennerdell
Average Earnings in Kennerdell are $46,122, $50,500 for men and $45,302 for women, a difference of 10.3%.
| Sex | Number | Average Earnings |
| Male | 38 (37.6%) | $50,500 |
| Female | 63 (62.4%) | $45,302 |
| Total | 101 (100.0%) | $46,122 |
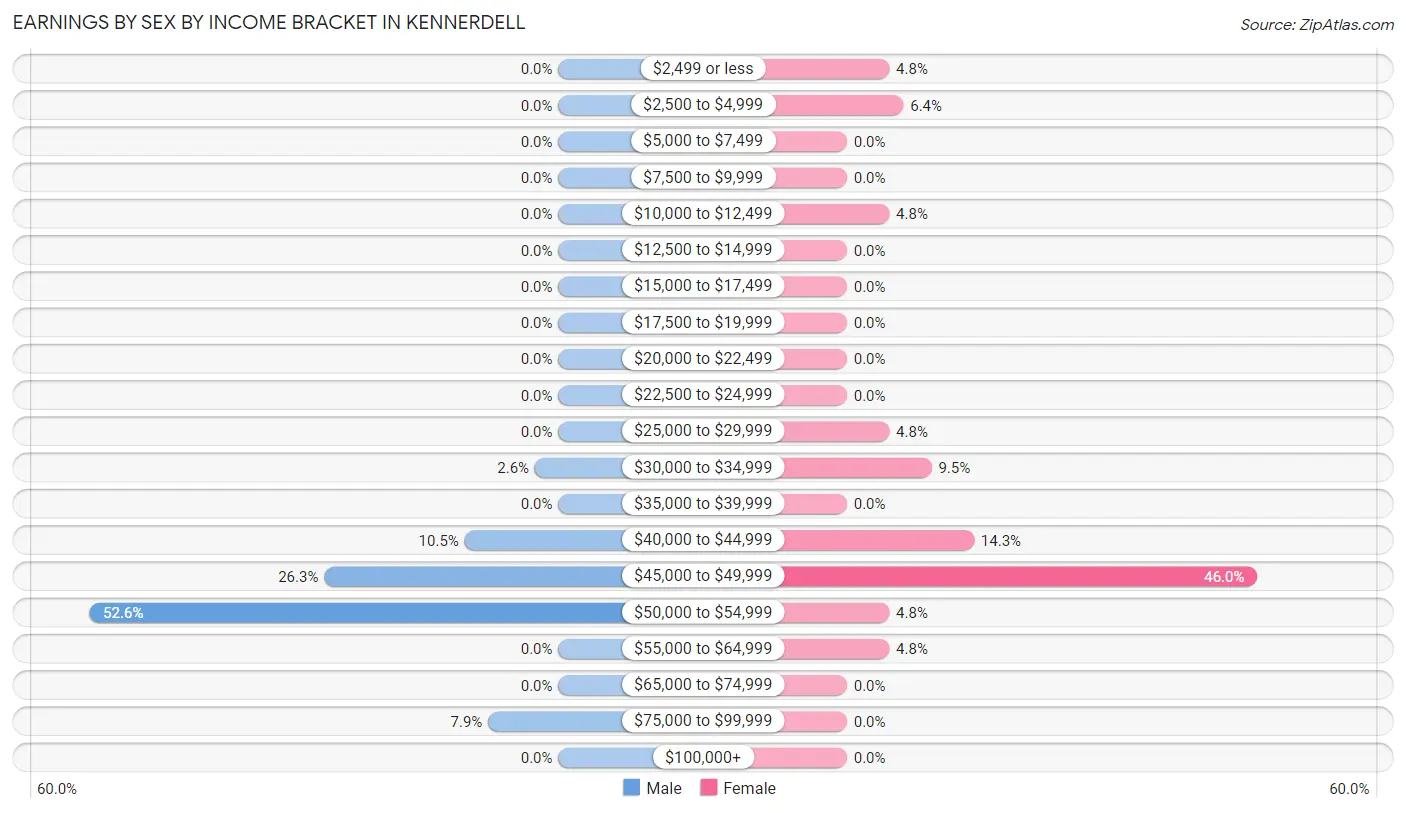
Earnings by Sex by Income Bracket in Kennerdell
The most common earnings brackets in Kennerdell are $50,000 to $54,999 for men (20 | 52.6%) and $45,000 to $49,999 for women (29 | 46.0%).
| Income | Male | Female |
| $2,499 or less | 0 (0.0%) | 3 (4.8%) |
| $2,500 to $4,999 | 0 (0.0%) | 4 (6.4%) |
| $5,000 to $7,499 | 0 (0.0%) | 0 (0.0%) |
| $7,500 to $9,999 | 0 (0.0%) | 0 (0.0%) |
| $10,000 to $12,499 | 0 (0.0%) | 3 (4.8%) |
| $12,500 to $14,999 | 0 (0.0%) | 0 (0.0%) |
| $15,000 to $17,499 | 0 (0.0%) | 0 (0.0%) |
| $17,500 to $19,999 | 0 (0.0%) | 0 (0.0%) |
| $20,000 to $22,499 | 0 (0.0%) | 0 (0.0%) |
| $22,500 to $24,999 | 0 (0.0%) | 0 (0.0%) |
| $25,000 to $29,999 | 0 (0.0%) | 3 (4.8%) |
| $30,000 to $34,999 | 1 (2.6%) | 6 (9.5%) |
| $35,000 to $39,999 | 0 (0.0%) | 0 (0.0%) |
| $40,000 to $44,999 | 4 (10.5%) | 9 (14.3%) |
| $45,000 to $49,999 | 10 (26.3%) | 29 (46.0%) |
| $50,000 to $54,999 | 20 (52.6%) | 3 (4.8%) |
| $55,000 to $64,999 | 0 (0.0%) | 3 (4.8%) |
| $65,000 to $74,999 | 0 (0.0%) | 0 (0.0%) |
| $75,000 to $99,999 | 3 (7.9%) | 0 (0.0%) |
| $100,000+ | 0 (0.0%) | 0 (0.0%) |
| Total | 38 (100.0%) | 63 (100.0%) |
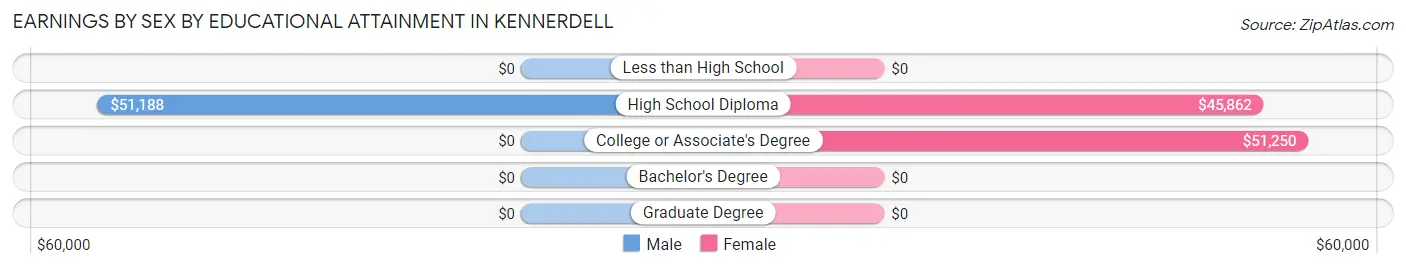
Earnings by Sex by Educational Attainment in Kennerdell
Average earnings in Kennerdell are $50,500 for men and $45,302 for women, a difference of 10.3%. Men with an educational attainment of high school diploma enjoy the highest average annual earnings of $51,188, while those with high school diploma education earn the least with $51,188. Women with an educational attainment of college or associate's degree earn the most with the average annual earnings of $51,250, while those with high school diploma education have the smallest earnings of $45,862.
| Educational Attainment | Male Income | Female Income |
| Less than High School | - | - |
| High School Diploma | $51,188 | $45,862 |
| College or Associate's Degree | - | - |
| Bachelor's Degree | - | - |
| Graduate Degree | - | - |
| Total | $50,500 | $45,302 |
Family Income in Kennerdell
Family Income Brackets in Kennerdell
According to the Kennerdell family income data, there are 20 families falling into the $100,000 to $149,999 income range, which is the most common income bracket and makes up 30.8% of all families.
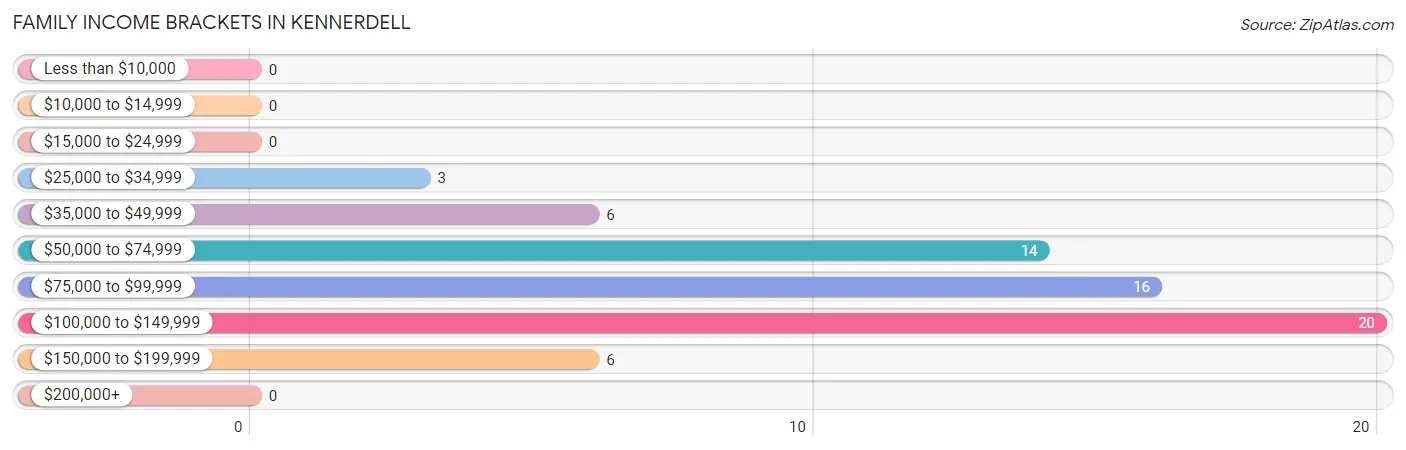
| Income Bracket | # Families | % Families |
| Less than $10,000 | 0 | 0.0% |
| $10,000 to $14,999 | 0 | 0.0% |
| $15,000 to $24,999 | 0 | 0.0% |
| $25,000 to $34,999 | 3 | 4.6% |
| $35,000 to $49,999 | 6 | 9.2% |
| $50,000 to $74,999 | 14 | 21.5% |
| $75,000 to $99,999 | 16 | 24.6% |
| $100,000 to $149,999 | 20 | 30.8% |
| $150,000 to $199,999 | 6 | 9.2% |
| $200,000+ | 0 | 0.0% |
Family Income by Famaliy Size in Kennerdell
2-person families (62 | 95.4%) account for the highest median family income in Kennerdell with $76,964 per family, while 2-person families (62 | 95.4%) have the highest median income of $38,482 per family member.
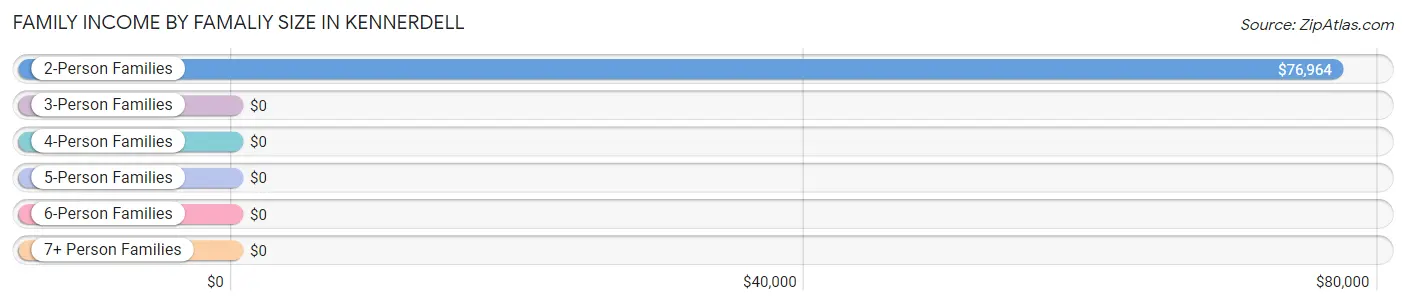
| Income Bracket | # Families | Median Income |
| 2-Person Families | 62 (95.4%) | $76,964 |
| 3-Person Families | 3 (4.6%) | $0 |
| 4-Person Families | 0 (0.0%) | $0 |
| 5-Person Families | 0 (0.0%) | $0 |
| 6-Person Families | 0 (0.0%) | $0 |
| 7+ Person Families | 0 (0.0%) | $0 |
| Total | 65 (100.0%) | $76,696 |
Family Income by Number of Earners in Kennerdell
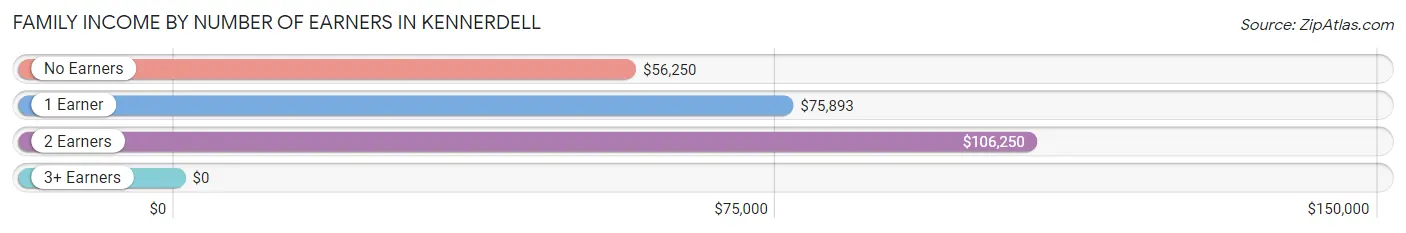
| Number of Earners | # Families | Median Income |
| No Earners | 12 (18.5%) | $56,250 |
| 1 Earner | 30 (46.2%) | $75,893 |
| 2 Earners | 23 (35.4%) | $106,250 |
| 3+ Earners | 0 (0.0%) | $0 |
| Total | 65 (100.0%) | $76,696 |
Household Income in Kennerdell
Household Income Brackets in Kennerdell
With 27 households falling in the category, the $35,000 to $49,999 income range is the most frequent in Kennerdell, accounting for 26.0% of all households.
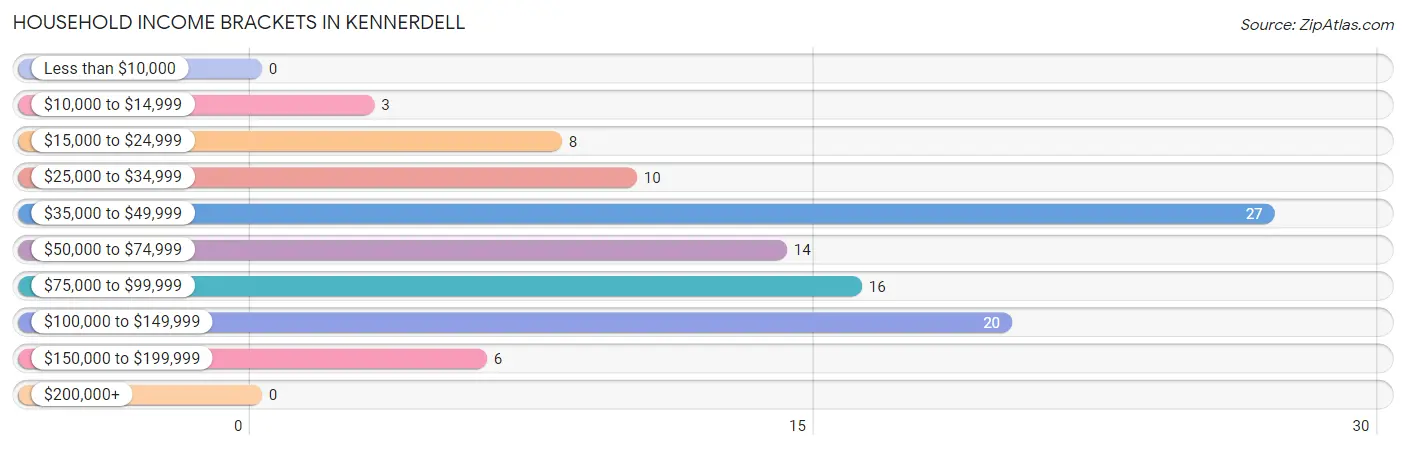
| Income Bracket | # Households | % Households |
| Less than $10,000 | 0 | 0.0% |
| $10,000 to $14,999 | 3 | 2.9% |
| $15,000 to $24,999 | 8 | 7.7% |
| $25,000 to $34,999 | 10 | 9.6% |
| $35,000 to $49,999 | 27 | 26.0% |
| $50,000 to $74,999 | 14 | 13.5% |
| $75,000 to $99,999 | 16 | 15.4% |
| $100,000 to $149,999 | 20 | 19.2% |
| $150,000 to $199,999 | 6 | 5.8% |
| $200,000+ | 0 | 0.0% |
Household Income by Householder Age in Kennerdell
The median household income in Kennerdell is $55,909, with the highest median household income of $76,696 found in the 45 to 64 years age bracket for the primary householder. A total of 55 households (52.9%) fall into this category.
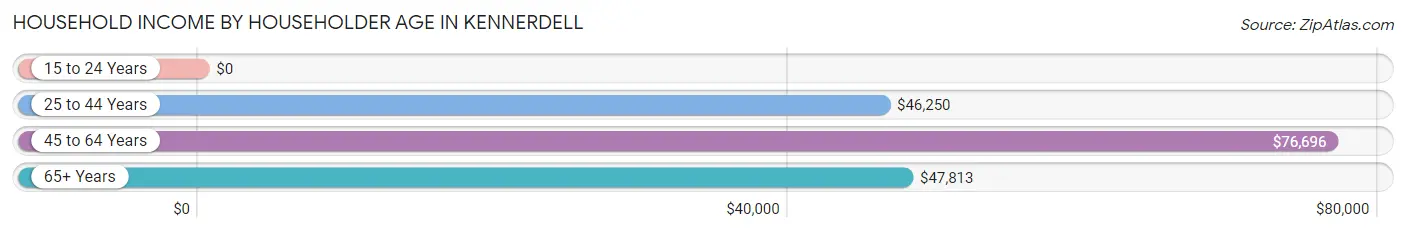
| Income Bracket | # Households | Median Income |
| 15 to 24 Years | 0 (0.0%) | $0 |
| 25 to 44 Years | 16 (15.4%) | $46,250 |
| 45 to 64 Years | 55 (52.9%) | $76,696 |
| 65+ Years | 33 (31.7%) | $47,813 |
| Total | 104 (100.0%) | $55,909 |
Poverty in Kennerdell
Income Below Poverty by Sex and Age in Kennerdell
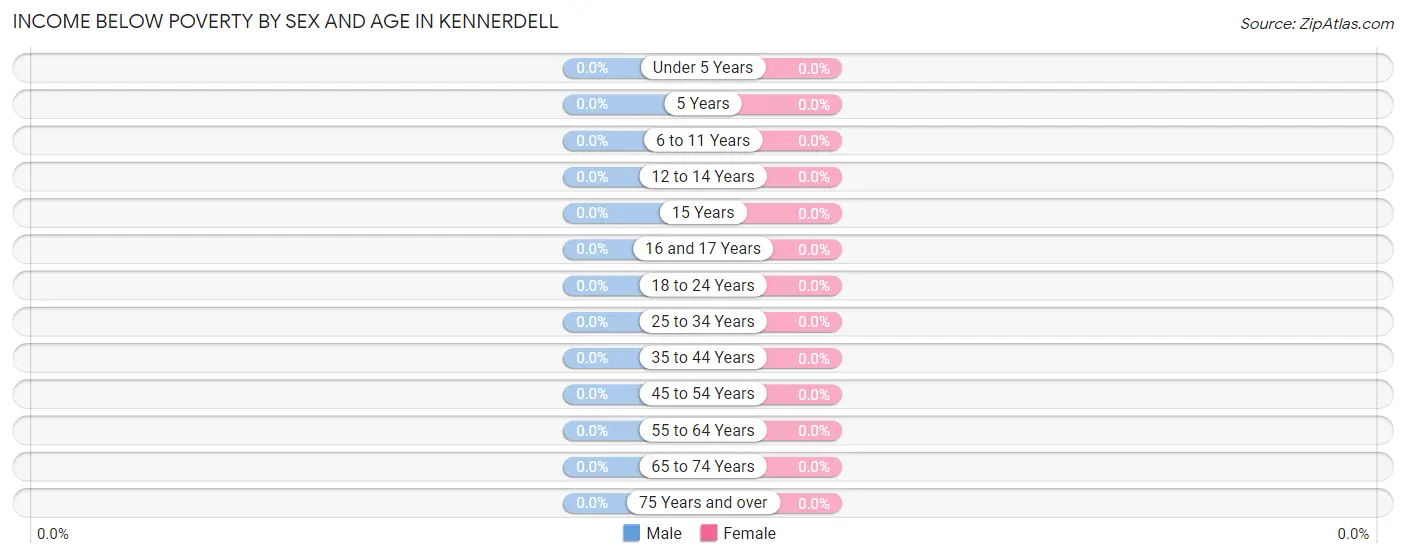
| Age Bracket | Male | Female |
| Under 5 Years | 0 (0.0%) | 0 (0.0%) |
| 5 Years | 0 (0.0%) | 0 (0.0%) |
| 6 to 11 Years | 0 (0.0%) | 0 (0.0%) |
| 12 to 14 Years | 0 (0.0%) | 0 (0.0%) |
| 15 Years | 0 (0.0%) | 0 (0.0%) |
| 16 and 17 Years | 0 (0.0%) | 0 (0.0%) |
| 18 to 24 Years | 0 (0.0%) | 0 (0.0%) |
| 25 to 34 Years | 0 (0.0%) | 0 (0.0%) |
| 35 to 44 Years | 0 (0.0%) | 0 (0.0%) |
| 45 to 54 Years | 0 (0.0%) | 0 (0.0%) |
| 55 to 64 Years | 0 (0.0%) | 0 (0.0%) |
| 65 to 74 Years | 0 (0.0%) | 0 (0.0%) |
| 75 Years and over | 0 (0.0%) | 0 (0.0%) |
| Total | 0 (0.0%) | 0 (0.0%) |
Income Above Poverty by Sex and Age in Kennerdell
According to the poverty statistics in Kennerdell, males aged 16 and 17 years and females aged 12 to 14 years are the age groups that are most secure financially, with 100.0% of males and 100.0% of females in these age groups living above the poverty line.
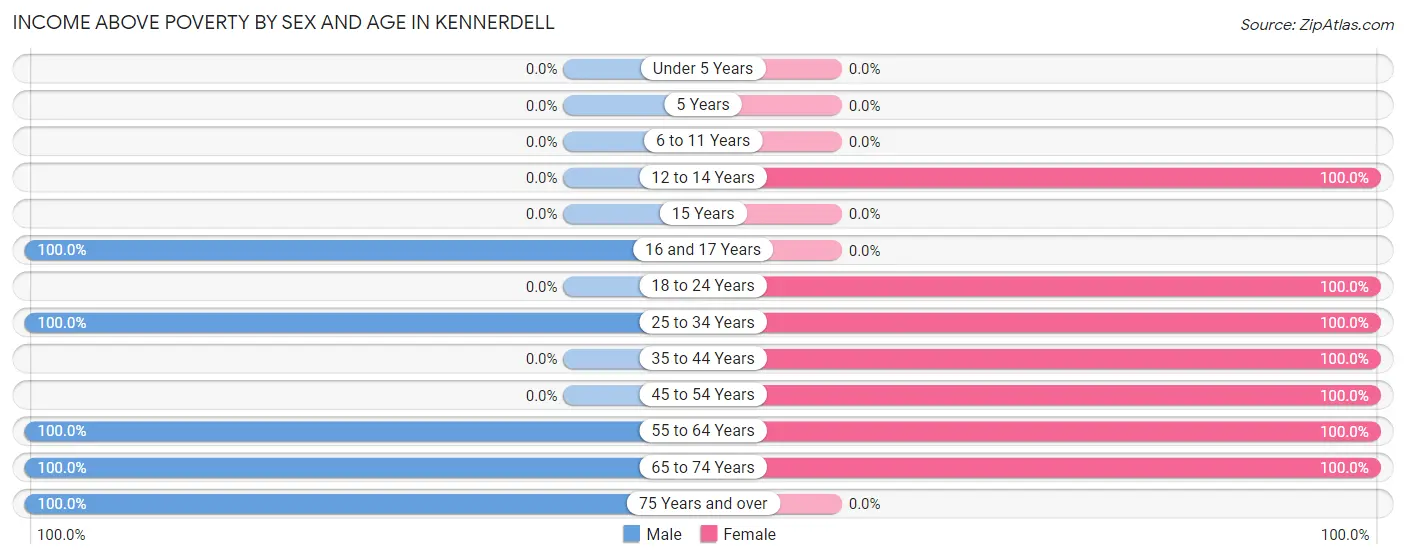
| Age Bracket | Male | Female |
| Under 5 Years | 0 (0.0%) | 0 (0.0%) |
| 5 Years | 0 (0.0%) | 0 (0.0%) |
| 6 to 11 Years | 0 (0.0%) | 0 (0.0%) |
| 12 to 14 Years | 0 (0.0%) | 3 (100.0%) |
| 15 Years | 0 (0.0%) | 0 (0.0%) |
| 16 and 17 Years | 3 (100.0%) | 0 (0.0%) |
| 18 to 24 Years | 0 (0.0%) | 2 (100.0%) |
| 25 to 34 Years | 10 (100.0%) | 6 (100.0%) |
| 35 to 44 Years | 0 (0.0%) | 3 (100.0%) |
| 45 to 54 Years | 0 (0.0%) | 3 (100.0%) |
| 55 to 64 Years | 51 (100.0%) | 36 (100.0%) |
| 65 to 74 Years | 21 (100.0%) | 28 (100.0%) |
| 75 Years and over | 6 (100.0%) | 0 (0.0%) |
| Total | 91 (100.0%) | 81 (100.0%) |
Income Below Poverty Among Married-Couple Families in Kennerdell
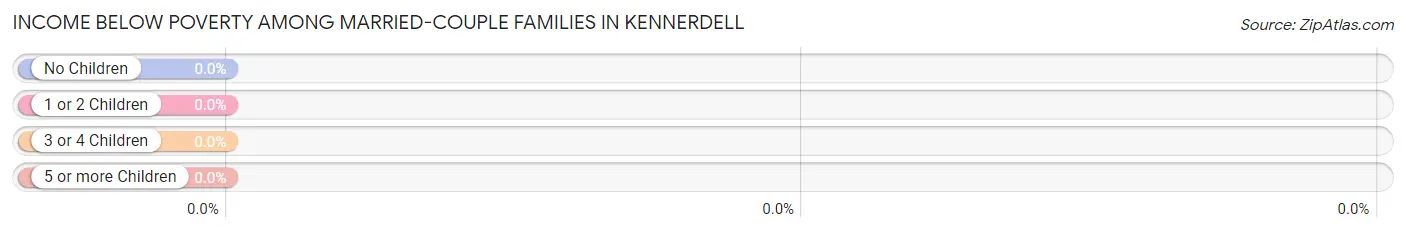
| Children | Above Poverty | Below Poverty |
| No Children | 59 (100.0%) | 0 (0.0%) |
| 1 or 2 Children | 0 (0.0%) | 0 (0.0%) |
| 3 or 4 Children | 0 (0.0%) | 0 (0.0%) |
| 5 or more Children | 0 (0.0%) | 0 (0.0%) |
| Total | 59 (100.0%) | 0 (0.0%) |
Income Below Poverty Among Single-Parent Households in Kennerdell
| Children | Single Father | Single Mother |
| No Children | 0 (0.0%) | 0 (0.0%) |
| 1 or 2 Children | 0 (0.0%) | 0 (0.0%) |
| 3 or 4 Children | 0 (0.0%) | 0 (0.0%) |
| 5 or more Children | 0 (0.0%) | 0 (0.0%) |
| Total | 0 (0.0%) | 0 (0.0%) |
Income Below Poverty Among Married-Couple vs Single-Parent Households in Kennerdell
| Children | Married-Couple Families | Single-Parent Households |
| No Children | 0 (0.0%) | 0 (0.0%) |
| 1 or 2 Children | 0 (0.0%) | 0 (0.0%) |
| 3 or 4 Children | 0 (0.0%) | 0 (0.0%) |
| 5 or more Children | 0 (0.0%) | 0 (0.0%) |
| Total | 0 (0.0%) | 0 (0.0%) |
Race in Kennerdell
The most populous races in Kennerdell are White / Caucasian (165 | 95.9%), and Two or more Races (7 | 4.1%).
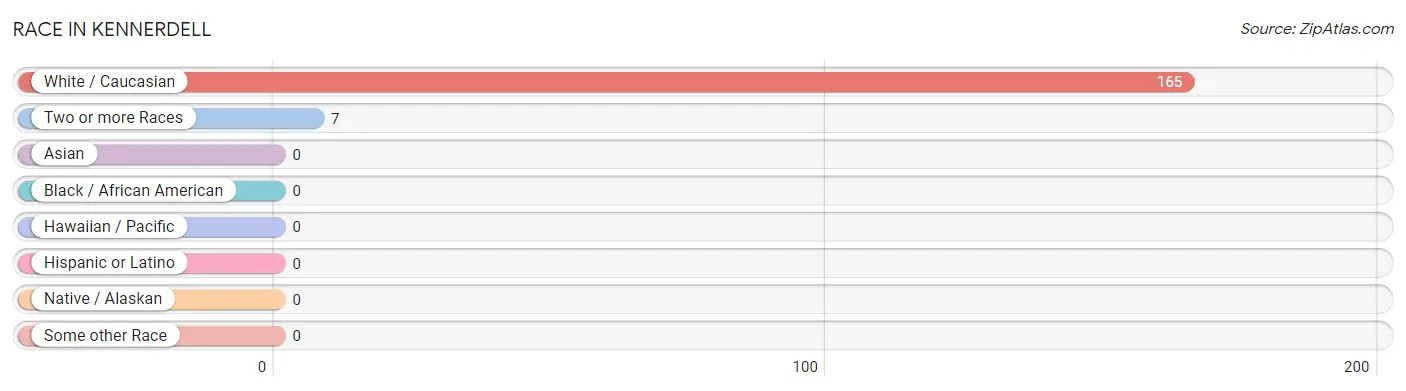
| Race | # Population | % Population |
| Asian | 0 | 0.0% |
| Black / African American | 0 | 0.0% |
| Hawaiian / Pacific | 0 | 0.0% |
| Hispanic or Latino | 0 | 0.0% |
| Native / Alaskan | 0 | 0.0% |
| White / Caucasian | 165 | 95.9% |
| Two or more Races | 7 | 4.1% |
| Some other Race | 0 | 0.0% |
| Total | 172 | 100.0% |
Ancestry in Kennerdell
The most populous ancestries reported in Kennerdell are German (68 | 39.5%), Irish (50 | 29.1%), English (31 | 18.0%), French (15 | 8.7%), and Belgian (14 | 8.1%), together accounting for 103.5% of all Kennerdell residents.
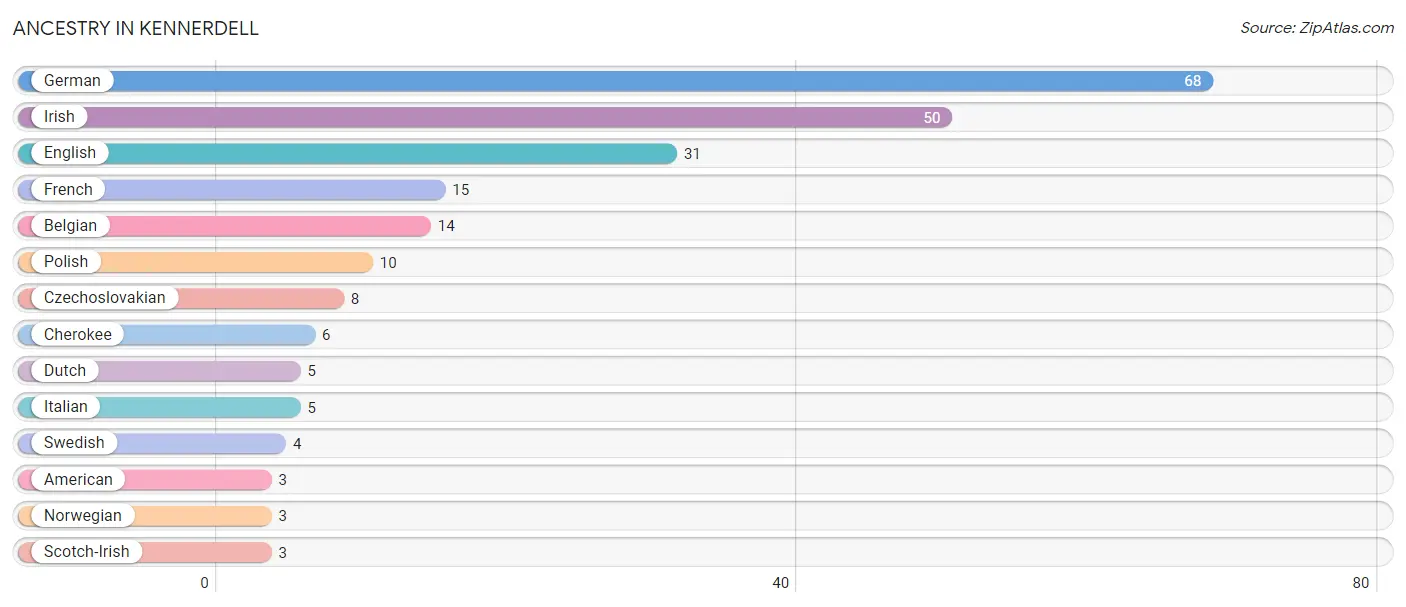
| Ancestry | # Population | % Population |
| American | 3 | 1.7% |
| Belgian | 14 | 8.1% |
| Cherokee | 6 | 3.5% |
| Czechoslovakian | 8 | 4.6% |
| Dutch | 5 | 2.9% |
| English | 31 | 18.0% |
| French | 15 | 8.7% |
| German | 68 | 39.5% |
| Irish | 50 | 29.1% |
| Italian | 5 | 2.9% |
| Norwegian | 3 | 1.7% |
| Polish | 10 | 5.8% |
| Scotch-Irish | 3 | 1.7% |
| Swedish | 4 | 2.3% | View All 14 Rows |
Immigrants in Kennerdell

| Immigration Origin | # Population | % Population | View All 0 Rows |
Sex and Age in Kennerdell
Sex and Age in Kennerdell
The most populous age groups in Kennerdell are 60 to 64 Years (42 | 46.2%) for men and 65 to 69 Years (23 | 28.4%) for women.
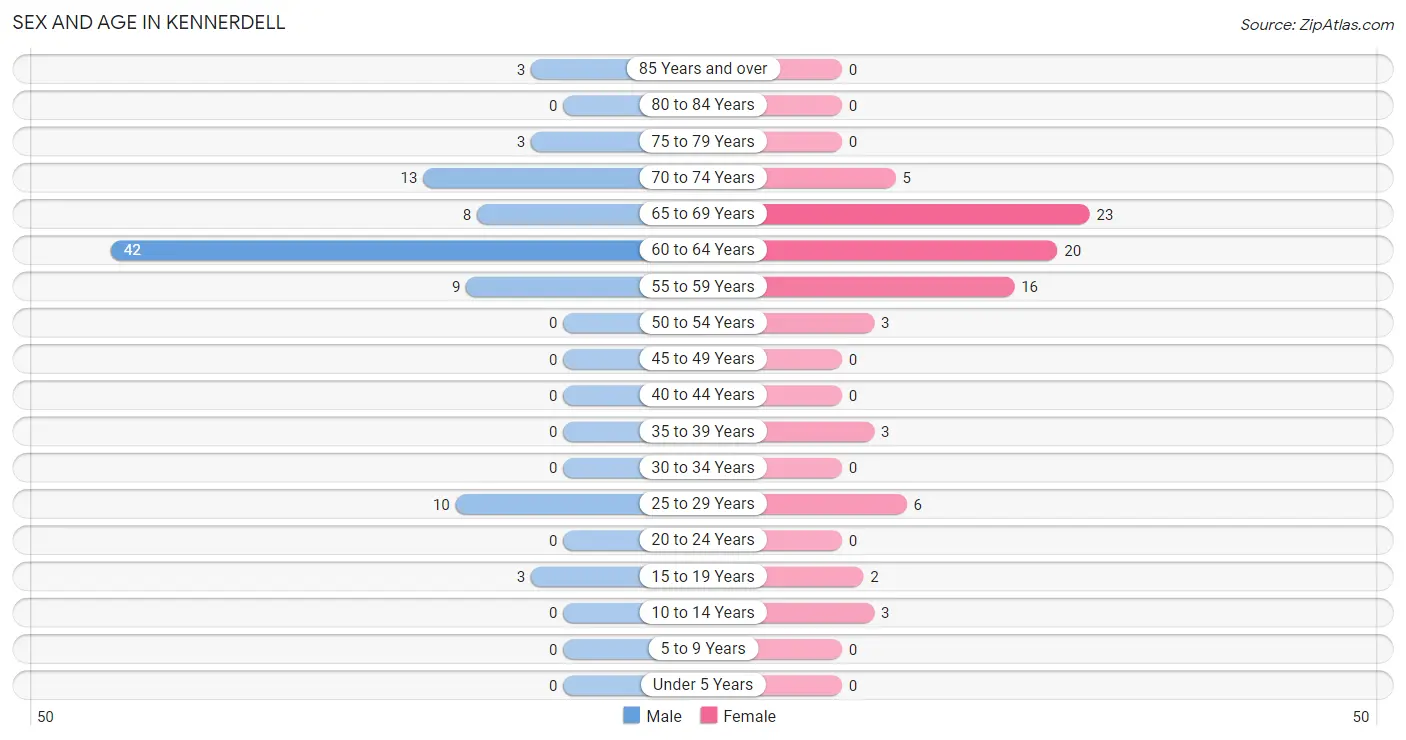
| Age Bracket | Male | Female |
| Under 5 Years | 0 (0.0%) | 0 (0.0%) |
| 5 to 9 Years | 0 (0.0%) | 0 (0.0%) |
| 10 to 14 Years | 0 (0.0%) | 3 (3.7%) |
| 15 to 19 Years | 3 (3.3%) | 2 (2.5%) |
| 20 to 24 Years | 0 (0.0%) | 0 (0.0%) |
| 25 to 29 Years | 10 (11.0%) | 6 (7.4%) |
| 30 to 34 Years | 0 (0.0%) | 0 (0.0%) |
| 35 to 39 Years | 0 (0.0%) | 3 (3.7%) |
| 40 to 44 Years | 0 (0.0%) | 0 (0.0%) |
| 45 to 49 Years | 0 (0.0%) | 0 (0.0%) |
| 50 to 54 Years | 0 (0.0%) | 3 (3.7%) |
| 55 to 59 Years | 9 (9.9%) | 16 (19.8%) |
| 60 to 64 Years | 42 (46.2%) | 20 (24.7%) |
| 65 to 69 Years | 8 (8.8%) | 23 (28.4%) |
| 70 to 74 Years | 13 (14.3%) | 5 (6.2%) |
| 75 to 79 Years | 3 (3.3%) | 0 (0.0%) |
| 80 to 84 Years | 0 (0.0%) | 0 (0.0%) |
| 85 Years and over | 3 (3.3%) | 0 (0.0%) |
| Total | 91 (100.0%) | 81 (100.0%) |
Families and Households in Kennerdell
Median Family Size in Kennerdell
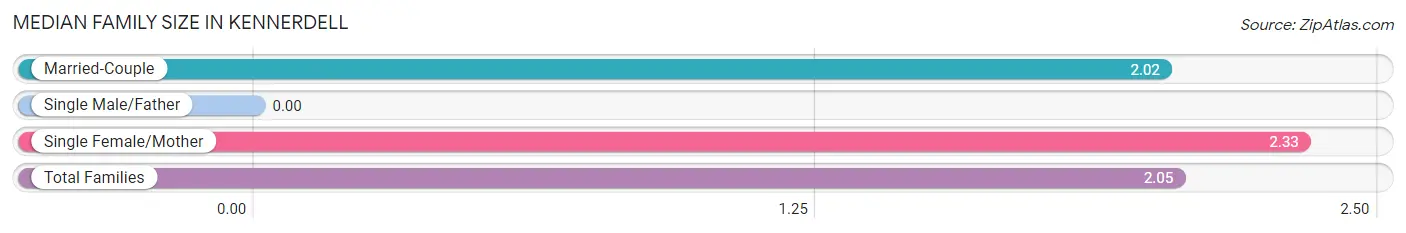
| Family Type | # Families | Family Size |
| Married-Couple | 59 (90.8%) | 2.02 |
| Single Male/Father | 0 (0.0%) | - |
| Single Female/Mother | 6 (9.2%) | 2.33 |
| Total Families | 65 (100.0%) | 2.05 |
Median Household Size in Kennerdell
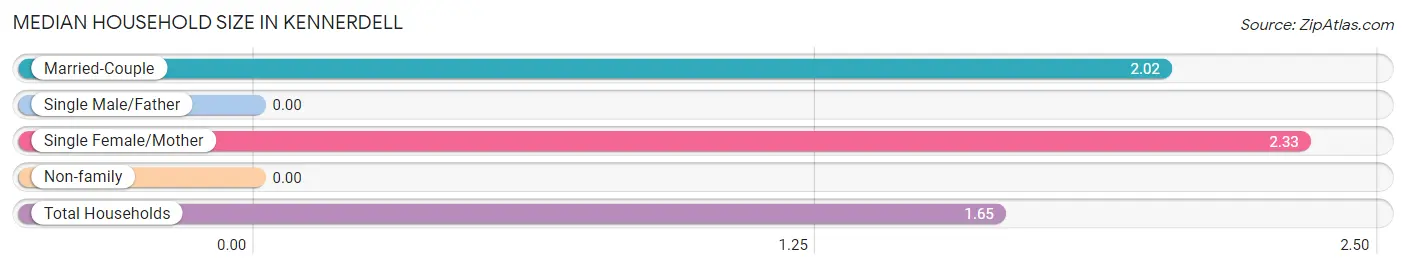
| Household Type | # Households | Household Size |
| Married-Couple | 59 (56.7%) | 2.02 |
| Single Male/Father | 0 (0.0%) | - |
| Single Female/Mother | 6 (5.8%) | 2.33 |
| Non-family | 39 (37.5%) | - |
| Total Households | 104 (100.0%) | 1.65 |
Household Size by Marriage Status in Kennerdell
Out of a total of 104 households in Kennerdell, 65 (62.5%) are family households, while 39 (37.5%) are nonfamily households. The most numerous type of family households are 2-person households, comprising 62, and the most common type of nonfamily households are 1-person households, comprising 39.
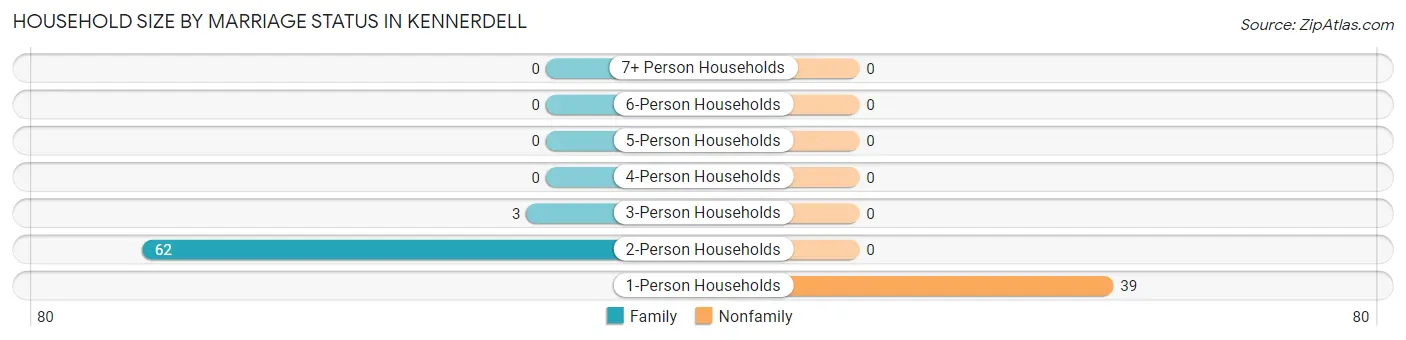
| Household Size | Family Households | Nonfamily Households |
| 1-Person Households | - | 39 (37.5%) |
| 2-Person Households | 62 (59.6%) | 0 (0.0%) |
| 3-Person Households | 3 (2.9%) | 0 (0.0%) |
| 4-Person Households | 0 (0.0%) | 0 (0.0%) |
| 5-Person Households | 0 (0.0%) | 0 (0.0%) |
| 6-Person Households | 0 (0.0%) | 0 (0.0%) |
| 7+ Person Households | 0 (0.0%) | 0 (0.0%) |
| Total | 65 (62.5%) | 39 (37.5%) |
Female Fertility in Kennerdell
Fertility by Age in Kennerdell
| Age Bracket | Women with Births | Births / 1,000 Women |
| 15 to 19 years | 0 (0.0%) | 0.0 |
| 20 to 34 years | 0 (0.0%) | 0.0 |
| 35 to 50 years | 0 (0.0%) | 0.0 |
| Total | 0 (0.0%) | 0.0 |
Fertility by Age by Marriage Status in Kennerdell
| Age Bracket | Married | Unmarried |
| 15 to 19 years | 0 (0.0%) | 0 (0.0%) |
| 20 to 34 years | 0 (0.0%) | 0 (0.0%) |
| 35 to 50 years | 0 (0.0%) | 0 (0.0%) |
| Total | 0 (0.0%) | 0 (0.0%) |
Fertility by Education in Kennerdell
| Educational Attainment | Women with Births | Births / 1,000 Women |
| Less than High School | 0 (0.0%) | 0.0 |
| High School Diploma | 0 (0.0%) | 0.0 |
| College or Associate's Degree | 0 (0.0%) | 0.0 |
| Bachelor's Degree | 0 (0.0%) | 0.0 |
| Graduate Degree | 0 (0.0%) | 0.0 |
| Total | 0 (0.0%) | 0.0 |
Fertility by Education by Marriage Status in Kennerdell
| Educational Attainment | Married | Unmarried |
| Less than High School | 0 (0.0%) | 0 (0.0%) |
| High School Diploma | 0 (0.0%) | 0 (0.0%) |
| College or Associate's Degree | 0 (0.0%) | 0 (0.0%) |
| Bachelor's Degree | 0 (0.0%) | 0 (0.0%) |
| Graduate Degree | 0 (0.0%) | 0 (0.0%) |
| Total | 0 (0.0%) | 0 (0.0%) |
Employment Characteristics in Kennerdell
Employment by Class of Employer in Kennerdell
Among the 94 employed individuals in Kennerdell, private company employees (43 | 45.7%), self-employed (incorporated) (20 | 21.3%), and federal government employees (15 | 16.0%) make up the most common classes of employment.
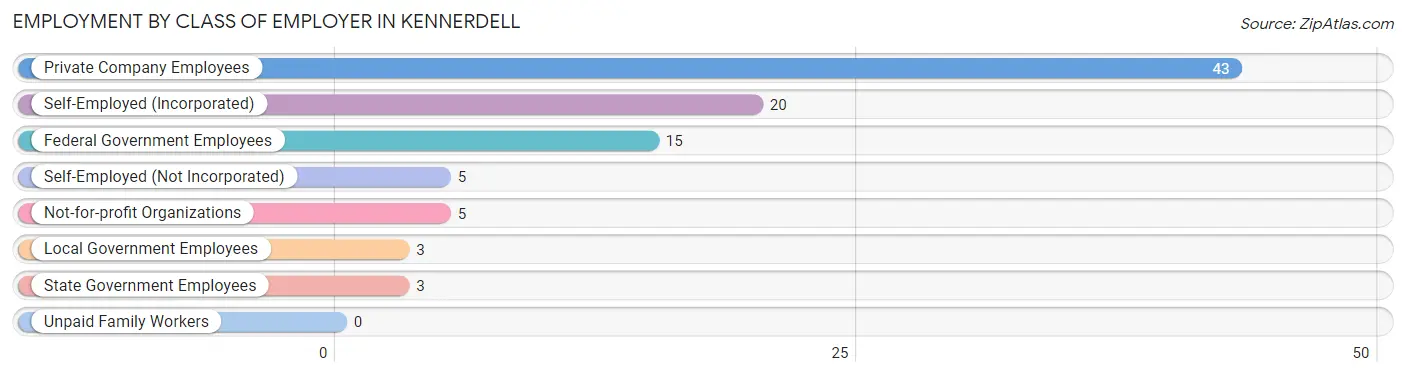
| Employer Class | # Employees | % Employees |
| Private Company Employees | 43 | 45.7% |
| Self-Employed (Incorporated) | 20 | 21.3% |
| Self-Employed (Not Incorporated) | 5 | 5.3% |
| Not-for-profit Organizations | 5 | 5.3% |
| Local Government Employees | 3 | 3.2% |
| State Government Employees | 3 | 3.2% |
| Federal Government Employees | 15 | 16.0% |
| Unpaid Family Workers | 0 | 0.0% |
| Total | 94 | 100.0% |
Employment Status by Age in Kennerdell
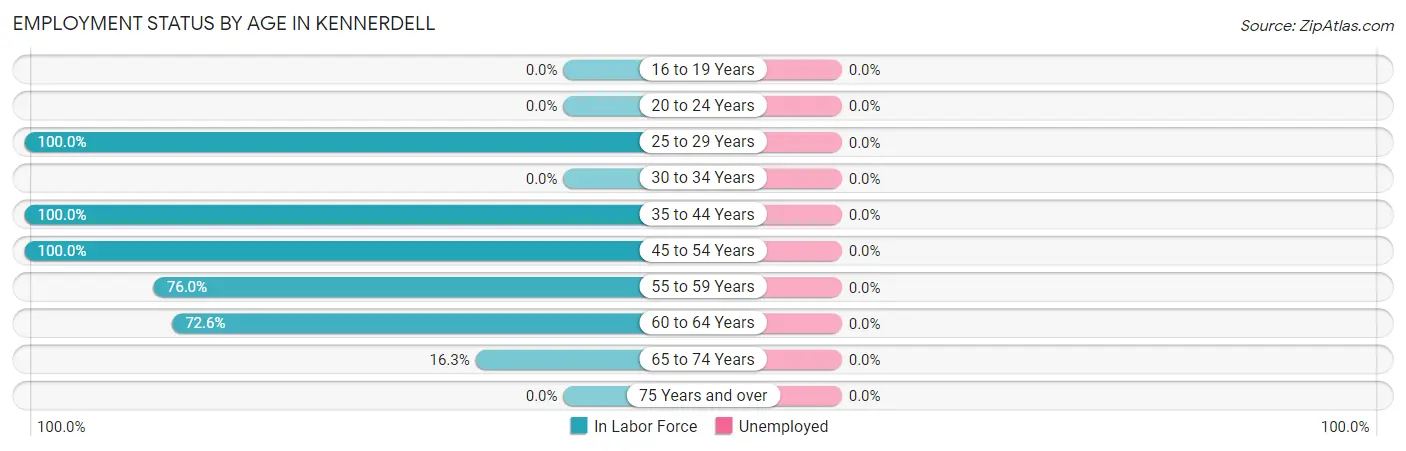
| Age Bracket | In Labor Force | Unemployed |
| 16 to 19 Years | 0 (0.0%) | 0 (0.0%) |
| 20 to 24 Years | 0 (0.0%) | 0 (0.0%) |
| 25 to 29 Years | 16 (100.0%) | 0 (0.0%) |
| 30 to 34 Years | 0 (0.0%) | 0 (0.0%) |
| 35 to 44 Years | 3 (100.0%) | 0 (0.0%) |
| 45 to 54 Years | 3 (100.0%) | 0 (0.0%) |
| 55 to 59 Years | 19 (76.0%) | 0 (0.0%) |
| 60 to 64 Years | 45 (72.6%) | 0 (0.0%) |
| 65 to 74 Years | 8 (16.3%) | 0 (0.0%) |
| 75 Years and over | 0 (0.0%) | 0 (0.0%) |
| Total | 94 (55.6%) | 0 (0.0%) |
Employment Status by Educational Attainment in Kennerdell
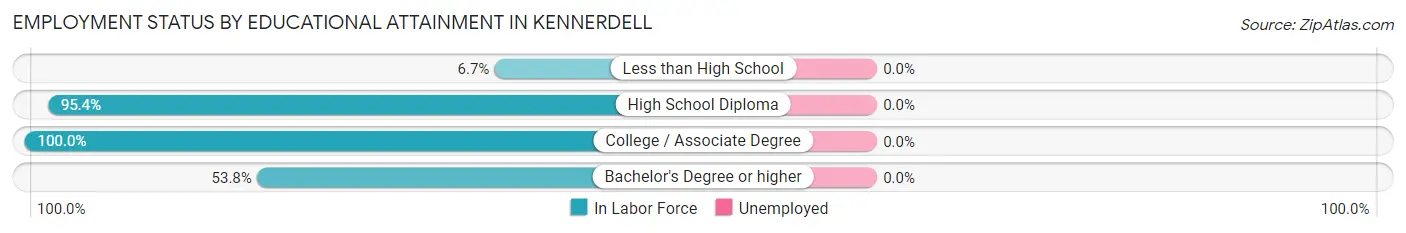
| Educational Attainment | In Labor Force | Unemployed |
| Less than High School | 1 (6.7%) | 0 (0.0%) |
| High School Diploma | 62 (95.4%) | 0 (0.0%) |
| College / Associate Degree | 16 (100.0%) | 0 (0.0%) |
| Bachelor's Degree or higher | 7 (53.8%) | 0 (0.0%) |
| Total | 86 (78.9%) | 0 (0.0%) |
Employment Occupations by Sex in Kennerdell
Management, Business, Science and Arts Occupations
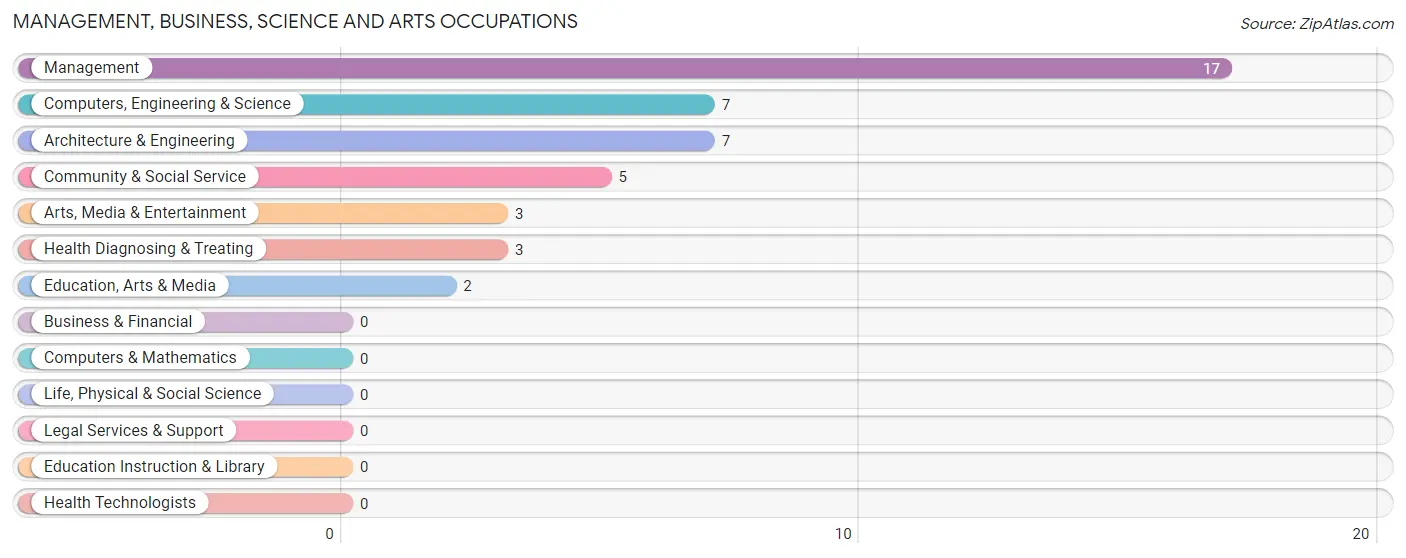
The most common Management, Business, Science and Arts occupations in Kennerdell are Management (17 | 18.1%), Computers, Engineering & Science (7 | 7.4%), Architecture & Engineering (7 | 7.4%), Community & Social Service (5 | 5.3%), and Arts, Media & Entertainment (3 | 3.2%).
Management, Business, Science and Arts Occupations by Sex
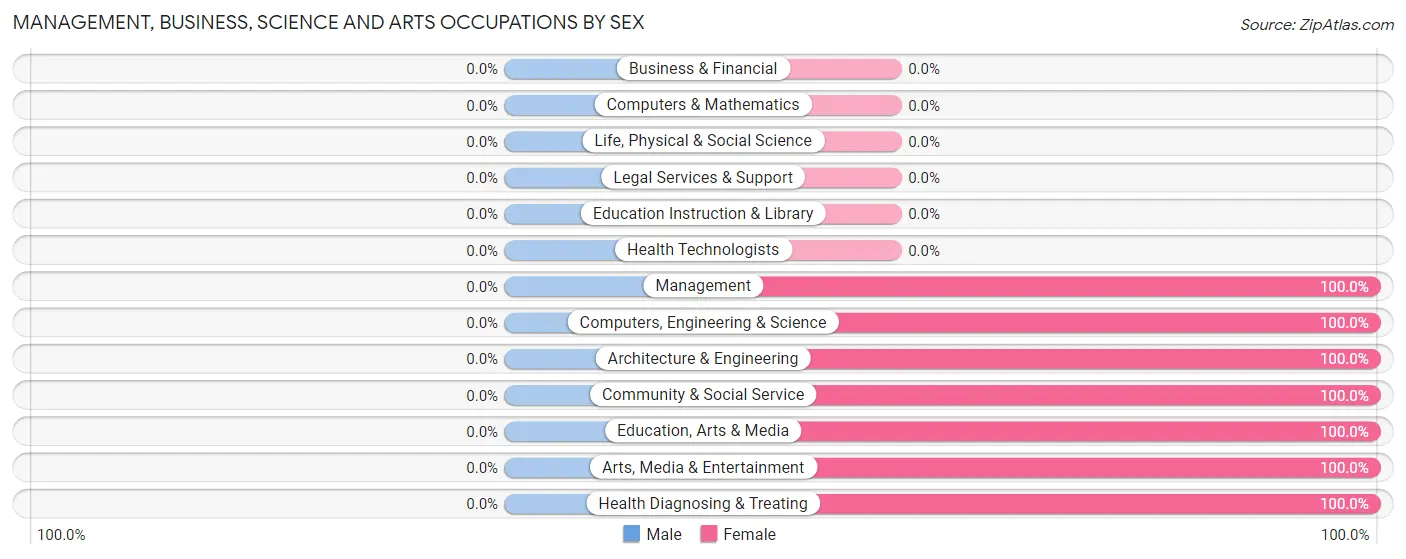
| Occupation | Male | Female |
| Management | 0 (0.0%) | 17 (100.0%) |
| Business & Financial | 0 (0.0%) | 0 (0.0%) |
| Computers, Engineering & Science | 0 (0.0%) | 7 (100.0%) |
| Computers & Mathematics | 0 (0.0%) | 0 (0.0%) |
| Architecture & Engineering | 0 (0.0%) | 7 (100.0%) |
| Life, Physical & Social Science | 0 (0.0%) | 0 (0.0%) |
| Community & Social Service | 0 (0.0%) | 5 (100.0%) |
| Education, Arts & Media | 0 (0.0%) | 2 (100.0%) |
| Legal Services & Support | 0 (0.0%) | 0 (0.0%) |
| Education Instruction & Library | 0 (0.0%) | 0 (0.0%) |
| Arts, Media & Entertainment | 0 (0.0%) | 3 (100.0%) |
| Health Diagnosing & Treating | 0 (0.0%) | 3 (100.0%) |
| Health Technologists | 0 (0.0%) | 0 (0.0%) |
| Total (Category) | 0 (0.0%) | 32 (100.0%) |
| Total (Overall) | 38 (40.4%) | 56 (59.6%) |
Services Occupations
The most common Services occupations in Kennerdell are Healthcare Support (3 | 3.2%), and Food Preparation & Serving (3 | 3.2%).
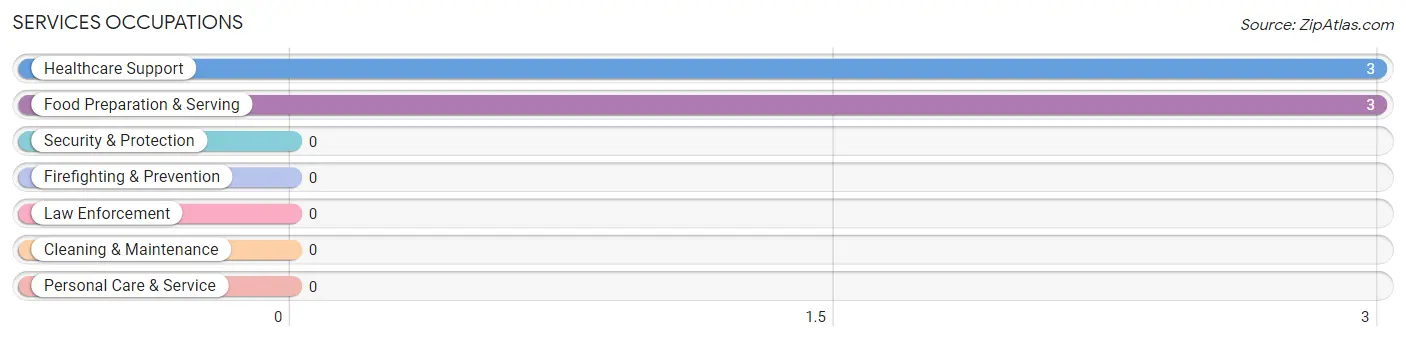
Services Occupations by Sex
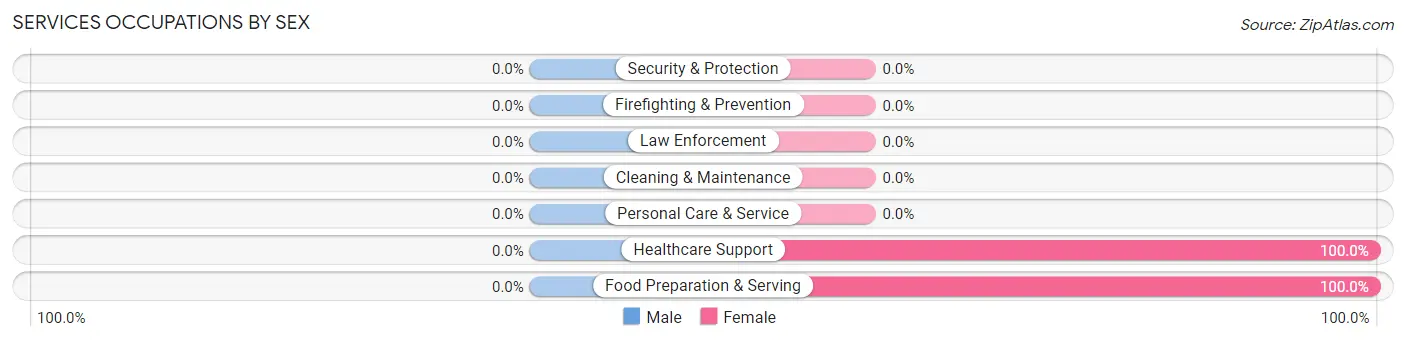
| Occupation | Male | Female |
| Healthcare Support | 0 (0.0%) | 3 (100.0%) |
| Security & Protection | 0 (0.0%) | 0 (0.0%) |
| Firefighting & Prevention | 0 (0.0%) | 0 (0.0%) |
| Law Enforcement | 0 (0.0%) | 0 (0.0%) |
| Food Preparation & Serving | 0 (0.0%) | 3 (100.0%) |
| Cleaning & Maintenance | 0 (0.0%) | 0 (0.0%) |
| Personal Care & Service | 0 (0.0%) | 0 (0.0%) |
| Total (Category) | 0 (0.0%) | 6 (100.0%) |
| Total (Overall) | 38 (40.4%) | 56 (59.6%) |
Sales and Office Occupations
The most common Sales and Office occupations in Kennerdell are , and Office & Administration (15 | 16.0%).
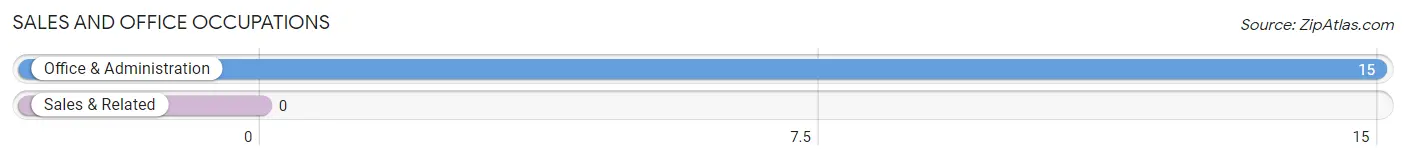
Sales and Office Occupations by Sex
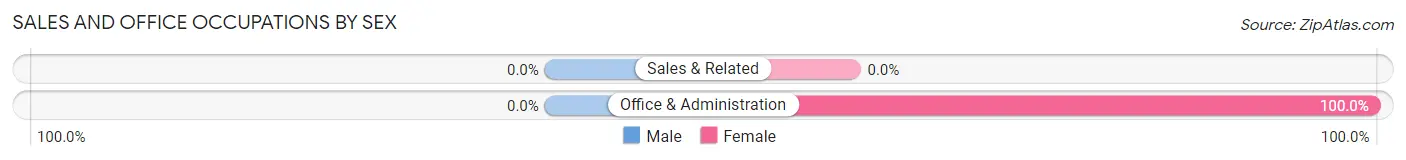
| Occupation | Male | Female |
| Sales & Related | 0 (0.0%) | 0 (0.0%) |
| Office & Administration | 0 (0.0%) | 15 (100.0%) |
| Total (Category) | 0 (0.0%) | 15 (100.0%) |
| Total (Overall) | 38 (40.4%) | 56 (59.6%) |
Natural Resources, Construction and Maintenance Occupations
The most common Natural Resources, Construction and Maintenance occupations in Kennerdell are Construction & Extraction (24 | 25.5%), and Farming, Fishing & Forestry (1 | 1.1%).
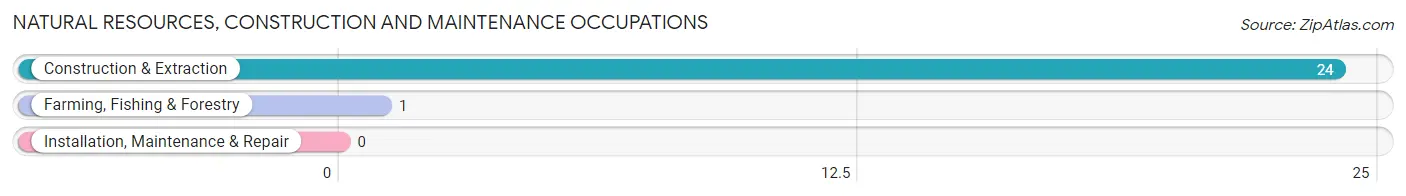
Natural Resources, Construction and Maintenance Occupations by Sex
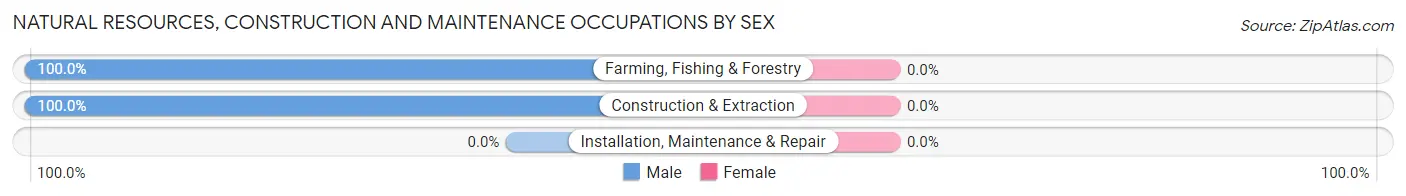
| Occupation | Male | Female |
| Farming, Fishing & Forestry | 1 (100.0%) | 0 (0.0%) |
| Construction & Extraction | 24 (100.0%) | 0 (0.0%) |
| Installation, Maintenance & Repair | 0 (0.0%) | 0 (0.0%) |
| Total (Category) | 25 (100.0%) | 0 (0.0%) |
| Total (Overall) | 38 (40.4%) | 56 (59.6%) |
Production, Transportation and Moving Occupations
The most common Production, Transportation and Moving occupations in Kennerdell are Production (10 | 10.6%), Transportation (3 | 3.2%), and Material Moving (3 | 3.2%).
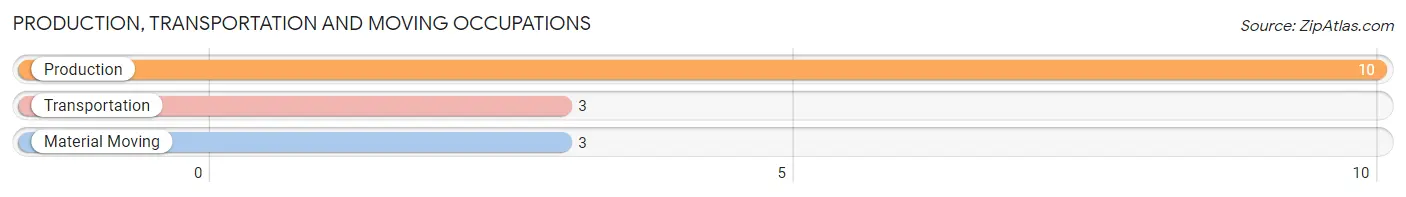
Production, Transportation and Moving Occupations by Sex
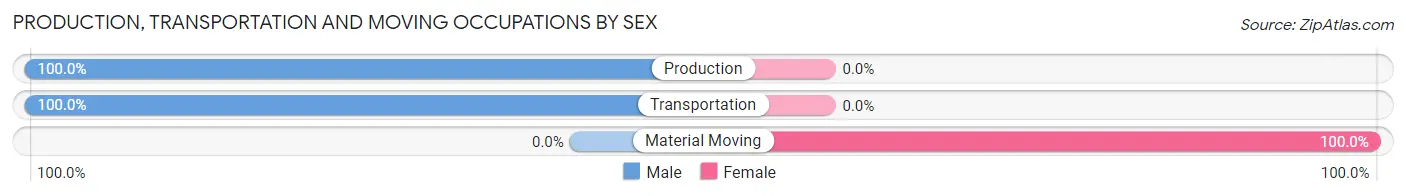
| Occupation | Male | Female |
| Production | 10 (100.0%) | 0 (0.0%) |
| Transportation | 3 (100.0%) | 0 (0.0%) |
| Material Moving | 0 (0.0%) | 3 (100.0%) |
| Total (Category) | 13 (81.2%) | 3 (18.8%) |
| Total (Overall) | 38 (40.4%) | 56 (59.6%) |
Employment Industries by Sex in Kennerdell
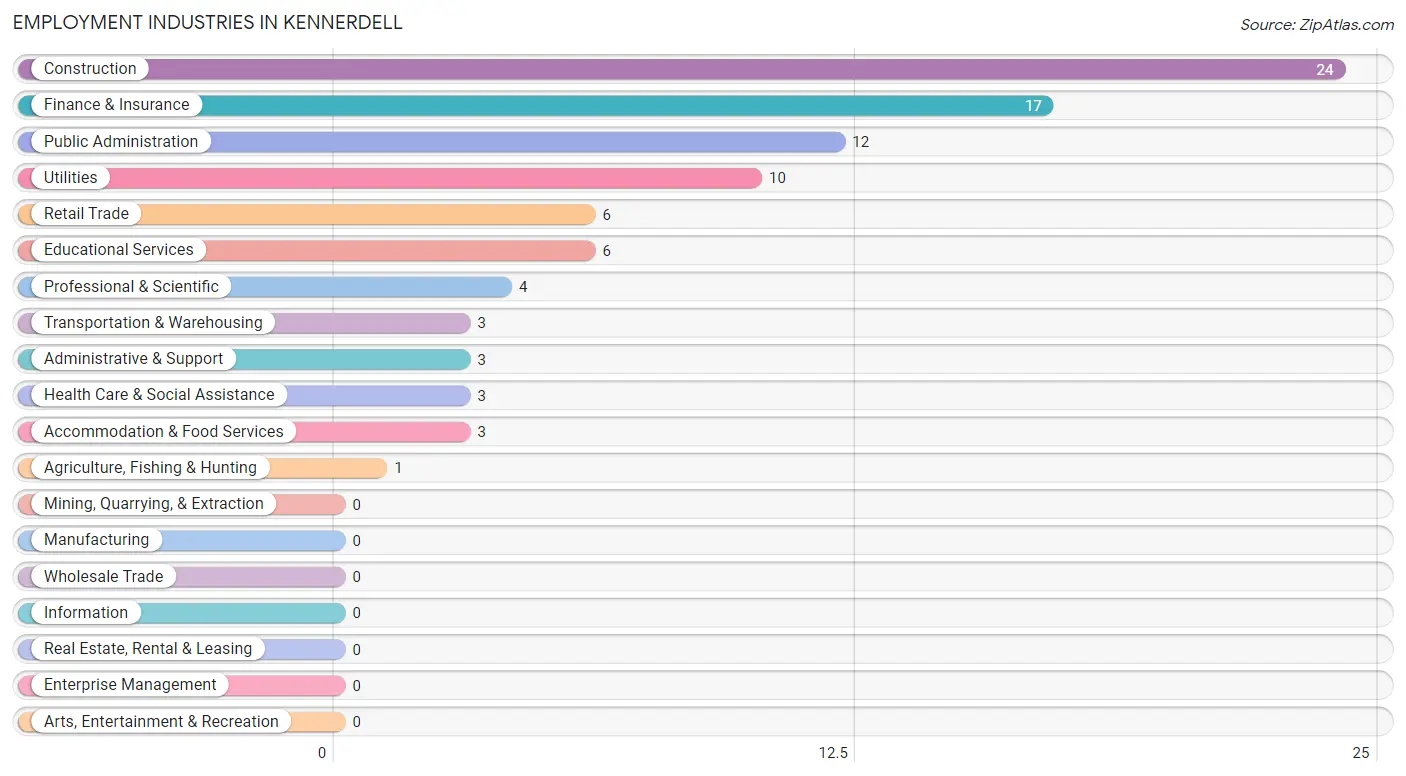
Employment Industries in Kennerdell
The major employment industries in Kennerdell include Construction (24 | 25.5%), Finance & Insurance (17 | 18.1%), Public Administration (12 | 12.8%), Utilities (10 | 10.6%), and Retail Trade (6 | 6.4%).
Employment Industries by Sex in Kennerdell
The Kennerdell industries that see more men than women are Agriculture, Fishing & Hunting (100.0%), Construction (100.0%), and Transportation & Warehousing (100.0%), whereas the industries that tend to have a higher number of women are Retail Trade (100.0%), Finance & Insurance (100.0%), and Professional & Scientific (100.0%).
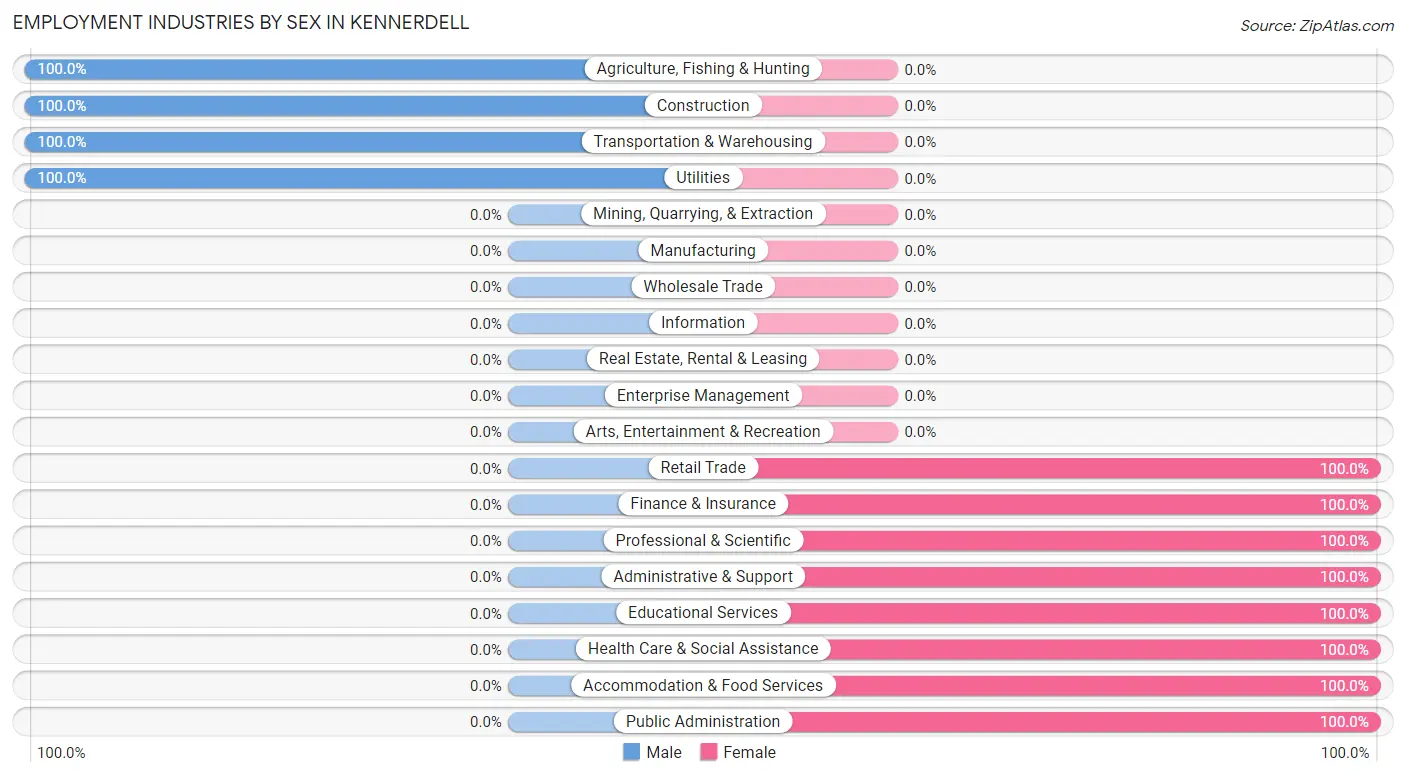
| Industry | Male | Female |
| Agriculture, Fishing & Hunting | 1 (100.0%) | 0 (0.0%) |
| Mining, Quarrying, & Extraction | 0 (0.0%) | 0 (0.0%) |
| Construction | 24 (100.0%) | 0 (0.0%) |
| Manufacturing | 0 (0.0%) | 0 (0.0%) |
| Wholesale Trade | 0 (0.0%) | 0 (0.0%) |
| Retail Trade | 0 (0.0%) | 6 (100.0%) |
| Transportation & Warehousing | 3 (100.0%) | 0 (0.0%) |
| Utilities | 10 (100.0%) | 0 (0.0%) |
| Information | 0 (0.0%) | 0 (0.0%) |
| Finance & Insurance | 0 (0.0%) | 17 (100.0%) |
| Real Estate, Rental & Leasing | 0 (0.0%) | 0 (0.0%) |
| Professional & Scientific | 0 (0.0%) | 4 (100.0%) |
| Enterprise Management | 0 (0.0%) | 0 (0.0%) |
| Administrative & Support | 0 (0.0%) | 3 (100.0%) |
| Educational Services | 0 (0.0%) | 6 (100.0%) |
| Health Care & Social Assistance | 0 (0.0%) | 3 (100.0%) |
| Arts, Entertainment & Recreation | 0 (0.0%) | 0 (0.0%) |
| Accommodation & Food Services | 0 (0.0%) | 3 (100.0%) |
| Public Administration | 0 (0.0%) | 12 (100.0%) |
| Total | 38 (40.4%) | 56 (59.6%) |
Education in Kennerdell
School Enrollment in Kennerdell
The most common levels of schooling among the 8 students in Kennerdell are middle school (3 | 37.5%), high school (3 | 37.5%), and college / undergraduate (2 | 25.0%).
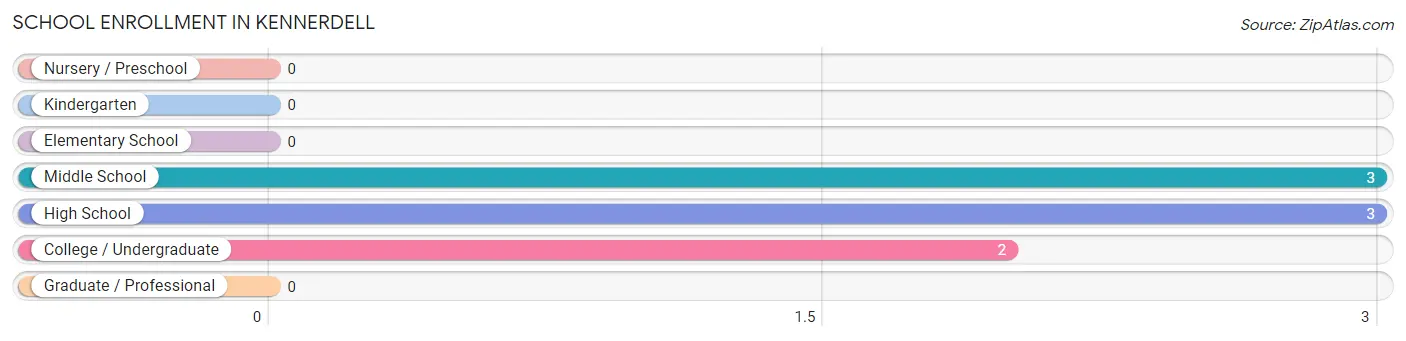
| School Level | # Students | % Students |
| Nursery / Preschool | 0 | 0.0% |
| Kindergarten | 0 | 0.0% |
| Elementary School | 0 | 0.0% |
| Middle School | 3 | 37.5% |
| High School | 3 | 37.5% |
| College / Undergraduate | 2 | 25.0% |
| Graduate / Professional | 0 | 0.0% |
| Total | 8 | 100.0% |
School Enrollment by Age by Funding Source in Kennerdell
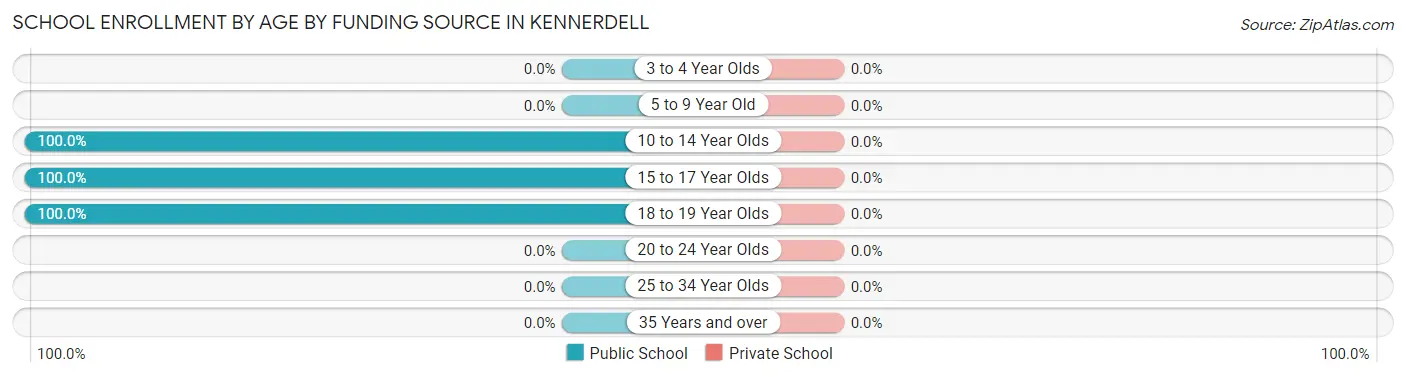
| Age Bracket | Public School | Private School |
| 3 to 4 Year Olds | 0 (0.0%) | 0 (0.0%) |
| 5 to 9 Year Old | 0 (0.0%) | 0 (0.0%) |
| 10 to 14 Year Olds | 3 (100.0%) | 0 (0.0%) |
| 15 to 17 Year Olds | 3 (100.0%) | 0 (0.0%) |
| 18 to 19 Year Olds | 2 (100.0%) | 0 (0.0%) |
| 20 to 24 Year Olds | 0 (0.0%) | 0 (0.0%) |
| 25 to 34 Year Olds | 0 (0.0%) | 0 (0.0%) |
| 35 Years and over | 0 (0.0%) | 0 (0.0%) |
| Total | 8 (100.0%) | 0 (0.0%) |
Educational Attainment by Field of Study in Kennerdell
Education (10 | 32.3%), liberal arts & history (8 | 25.8%), bio, nature & agricultural (6 | 19.4%), science & technology (4 | 12.9%), and visual & performing arts (3 | 9.7%) are the most common fields of study among 31 individuals in Kennerdell who have obtained a bachelor's degree or higher.
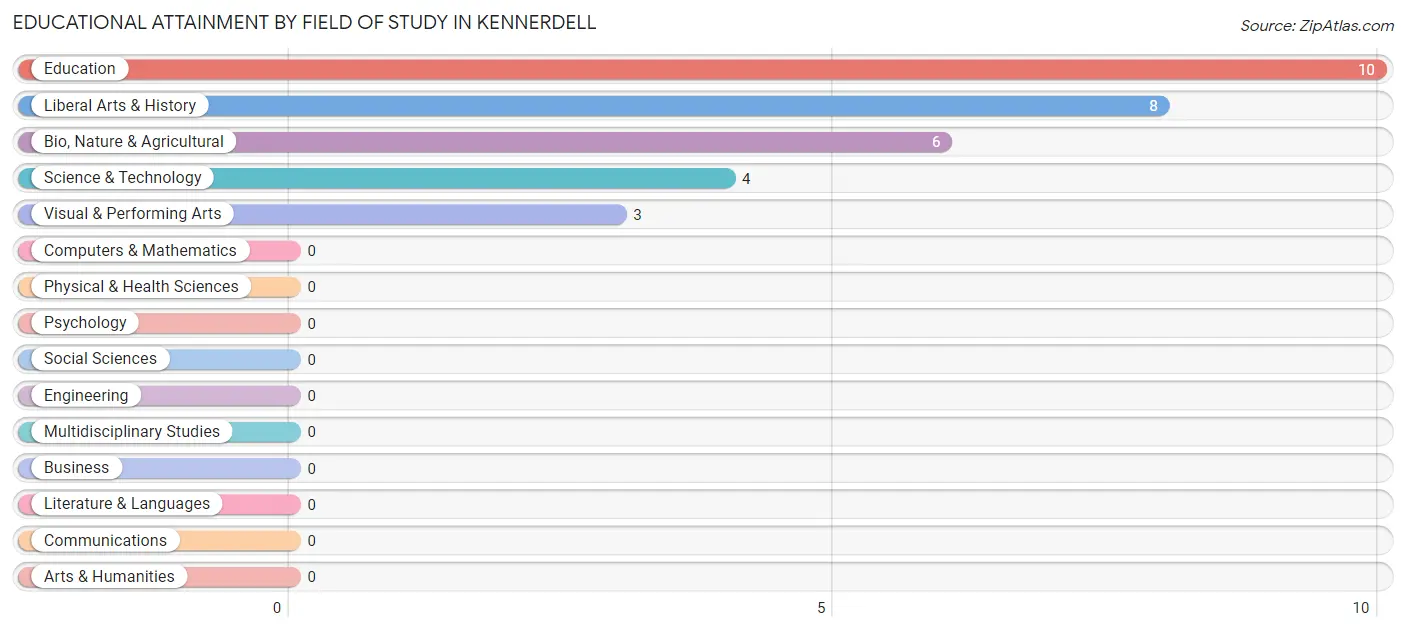
| Field of Study | # Graduates | % Graduates |
| Computers & Mathematics | 0 | 0.0% |
| Bio, Nature & Agricultural | 6 | 19.4% |
| Physical & Health Sciences | 0 | 0.0% |
| Psychology | 0 | 0.0% |
| Social Sciences | 0 | 0.0% |
| Engineering | 0 | 0.0% |
| Multidisciplinary Studies | 0 | 0.0% |
| Science & Technology | 4 | 12.9% |
| Business | 0 | 0.0% |
| Education | 10 | 32.3% |
| Literature & Languages | 0 | 0.0% |
| Liberal Arts & History | 8 | 25.8% |
| Visual & Performing Arts | 3 | 9.7% |
| Communications | 0 | 0.0% |
| Arts & Humanities | 0 | 0.0% |
| Total | 31 | 100.0% |
Transportation & Commute in Kennerdell
Vehicle Availability by Sex in Kennerdell
The most prevalent vehicle ownership categories in Kennerdell are males with 2 vehicles (37, accounting for 97.4%) and females with 2 vehicles (38, making up 66.1%).
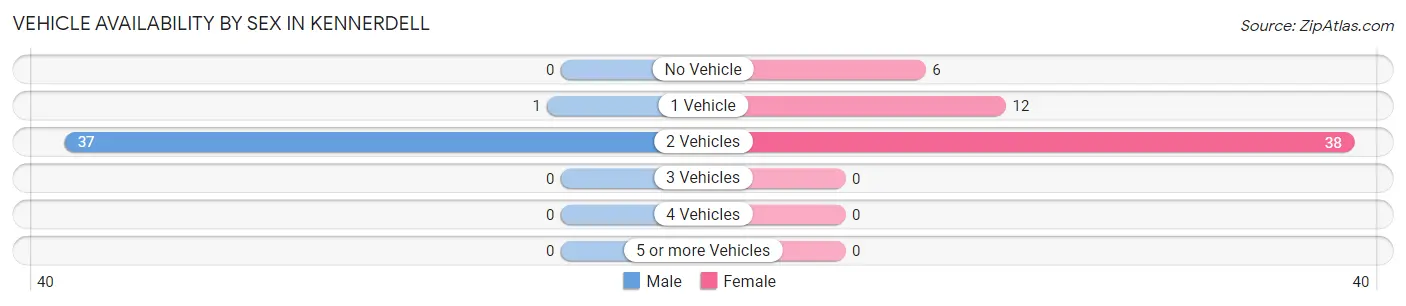
| Vehicles Available | Male | Female |
| No Vehicle | 0 (0.0%) | 6 (10.7%) |
| 1 Vehicle | 1 (2.6%) | 12 (21.4%) |
| 2 Vehicles | 37 (97.4%) | 38 (67.9%) |
| 3 Vehicles | 0 (0.0%) | 0 (0.0%) |
| 4 Vehicles | 0 (0.0%) | 0 (0.0%) |
| 5 or more Vehicles | 0 (0.0%) | 0 (0.0%) |
| Total | 38 (100.0%) | 56 (100.0%) |
Commute Time in Kennerdell
The most frequently occuring commute durations in Kennerdell are 25 to 29 minutes (40 commuters, 44.0%), 5 to 9 minutes (13 commuters, 14.3%), and 20 to 24 minutes (13 commuters, 14.3%).
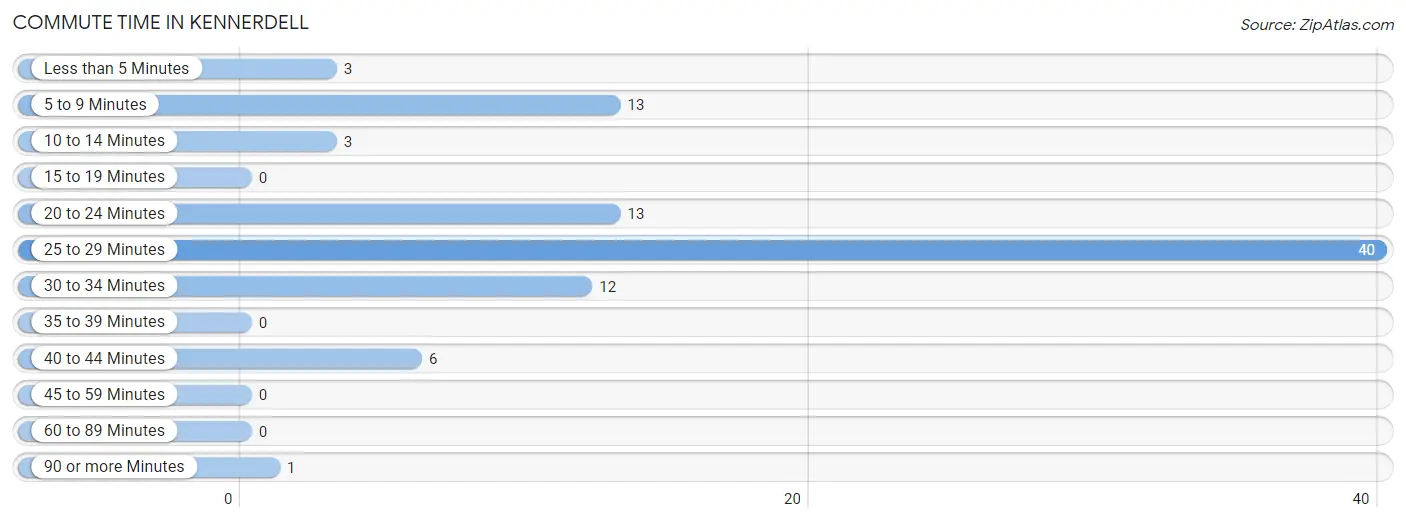
| Commute Time | # Commuters | % Commuters |
| Less than 5 Minutes | 3 | 3.3% |
| 5 to 9 Minutes | 13 | 14.3% |
| 10 to 14 Minutes | 3 | 3.3% |
| 15 to 19 Minutes | 0 | 0.0% |
| 20 to 24 Minutes | 13 | 14.3% |
| 25 to 29 Minutes | 40 | 44.0% |
| 30 to 34 Minutes | 12 | 13.2% |
| 35 to 39 Minutes | 0 | 0.0% |
| 40 to 44 Minutes | 6 | 6.6% |
| 45 to 59 Minutes | 0 | 0.0% |
| 60 to 89 Minutes | 0 | 0.0% |
| 90 or more Minutes | 1 | 1.1% |
Commute Time by Sex in Kennerdell
The most common commute times in Kennerdell are 25 to 29 minutes (20 commuters, 52.6%) for males and 25 to 29 minutes (20 commuters, 37.7%) for females.
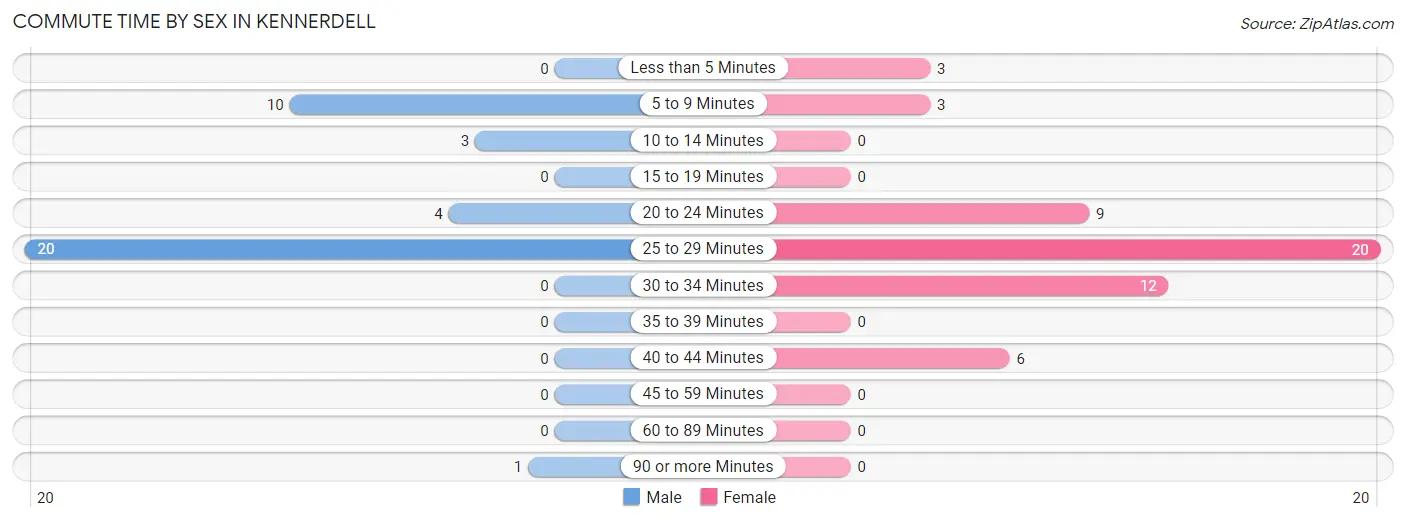
| Commute Time | Male | Female |
| Less than 5 Minutes | 0 (0.0%) | 3 (5.7%) |
| 5 to 9 Minutes | 10 (26.3%) | 3 (5.7%) |
| 10 to 14 Minutes | 3 (7.9%) | 0 (0.0%) |
| 15 to 19 Minutes | 0 (0.0%) | 0 (0.0%) |
| 20 to 24 Minutes | 4 (10.5%) | 9 (17.0%) |
| 25 to 29 Minutes | 20 (52.6%) | 20 (37.7%) |
| 30 to 34 Minutes | 0 (0.0%) | 12 (22.6%) |
| 35 to 39 Minutes | 0 (0.0%) | 0 (0.0%) |
| 40 to 44 Minutes | 0 (0.0%) | 6 (11.3%) |
| 45 to 59 Minutes | 0 (0.0%) | 0 (0.0%) |
| 60 to 89 Minutes | 0 (0.0%) | 0 (0.0%) |
| 90 or more Minutes | 1 (2.6%) | 0 (0.0%) |
Time of Departure to Work by Sex in Kennerdell
The most frequent times of departure to work in Kennerdell are 6:00 AM to 6:29 AM (24, 63.2%) for males and 7:30 AM to 7:59 AM (21, 39.6%) for females.
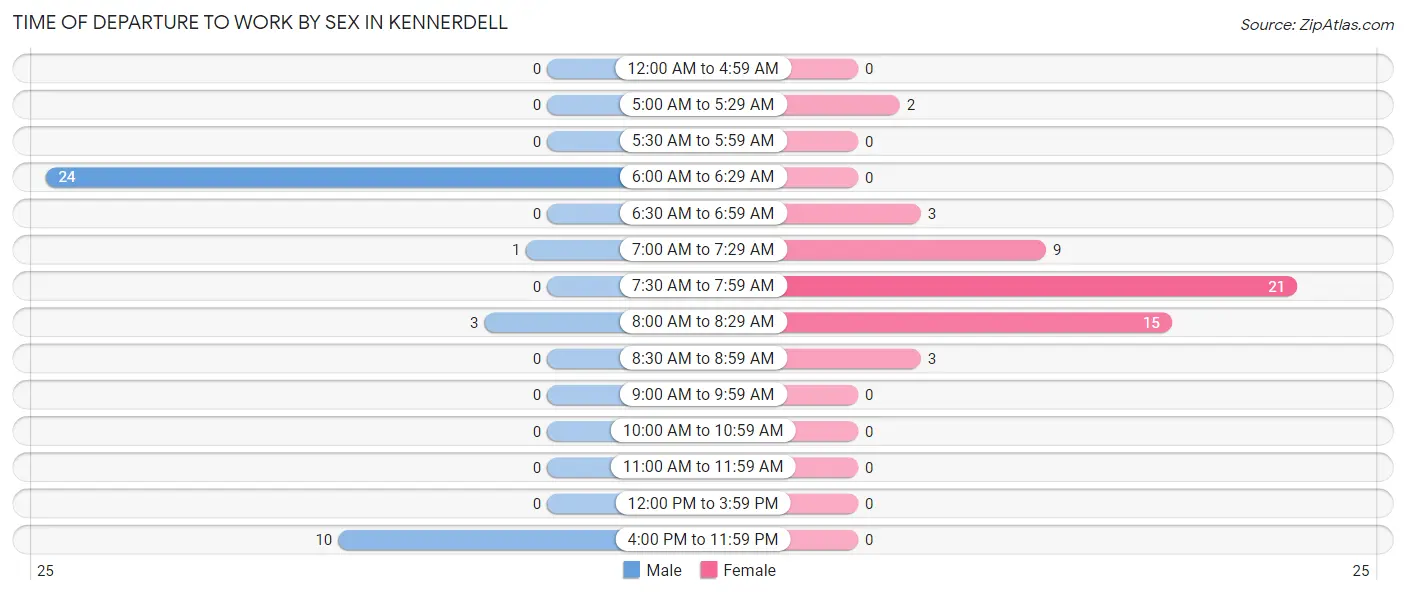
| Time of Departure | Male | Female |
| 12:00 AM to 4:59 AM | 0 (0.0%) | 0 (0.0%) |
| 5:00 AM to 5:29 AM | 0 (0.0%) | 2 (3.8%) |
| 5:30 AM to 5:59 AM | 0 (0.0%) | 0 (0.0%) |
| 6:00 AM to 6:29 AM | 24 (63.2%) | 0 (0.0%) |
| 6:30 AM to 6:59 AM | 0 (0.0%) | 3 (5.7%) |
| 7:00 AM to 7:29 AM | 1 (2.6%) | 9 (17.0%) |
| 7:30 AM to 7:59 AM | 0 (0.0%) | 21 (39.6%) |
| 8:00 AM to 8:29 AM | 3 (7.9%) | 15 (28.3%) |
| 8:30 AM to 8:59 AM | 0 (0.0%) | 3 (5.7%) |
| 9:00 AM to 9:59 AM | 0 (0.0%) | 0 (0.0%) |
| 10:00 AM to 10:59 AM | 0 (0.0%) | 0 (0.0%) |
| 11:00 AM to 11:59 AM | 0 (0.0%) | 0 (0.0%) |
| 12:00 PM to 3:59 PM | 0 (0.0%) | 0 (0.0%) |
| 4:00 PM to 11:59 PM | 10 (26.3%) | 0 (0.0%) |
| Total | 38 (100.0%) | 53 (100.0%) |
Housing Occupancy in Kennerdell
Occupancy by Ownership in Kennerdell
Of the total 104 dwellings in Kennerdell, owner-occupied units account for 84 (80.8%), while renter-occupied units make up 20 (19.2%).
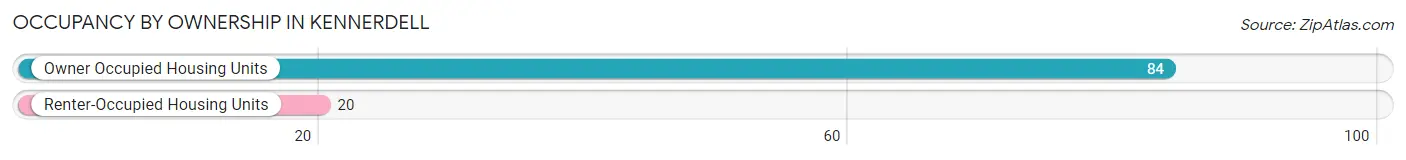
| Occupancy | # Housing Units | % Housing Units |
| Owner Occupied Housing Units | 84 | 80.8% |
| Renter-Occupied Housing Units | 20 | 19.2% |
| Total Occupied Housing Units | 104 | 100.0% |
Occupancy by Household Size in Kennerdell
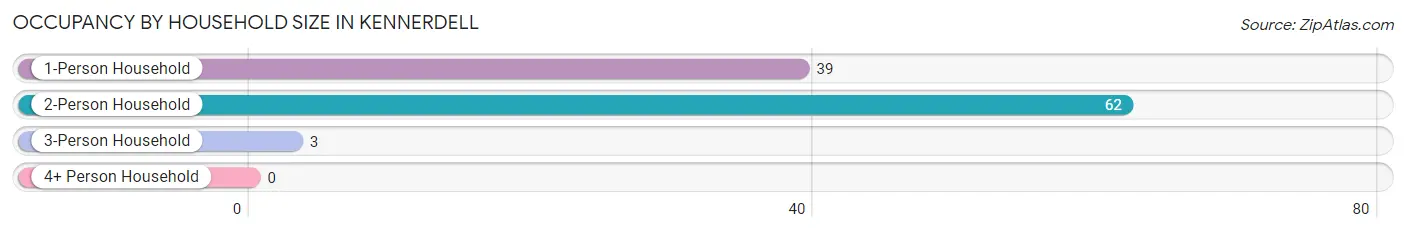
| Household Size | # Housing Units | % Housing Units |
| 1-Person Household | 39 | 37.5% |
| 2-Person Household | 62 | 59.6% |
| 3-Person Household | 3 | 2.9% |
| 4+ Person Household | 0 | 0.0% |
| Total Housing Units | 104 | 100.0% |
Occupancy by Ownership by Household Size in Kennerdell
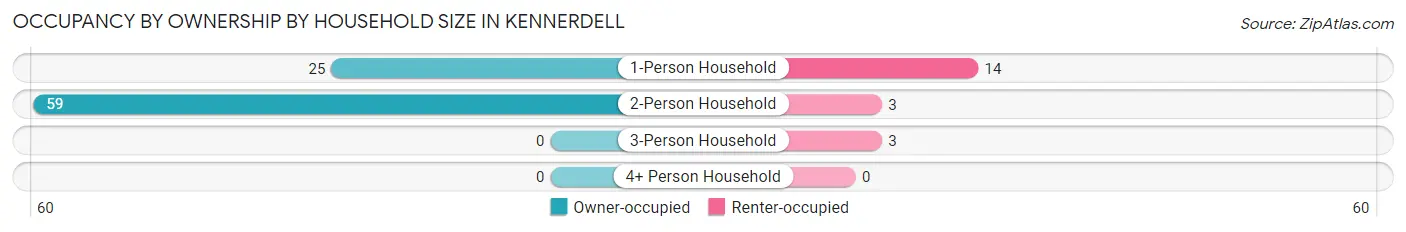
| Household Size | Owner-occupied | Renter-occupied |
| 1-Person Household | 25 (64.1%) | 14 (35.9%) |
| 2-Person Household | 59 (95.2%) | 3 (4.8%) |
| 3-Person Household | 0 (0.0%) | 3 (100.0%) |
| 4+ Person Household | 0 (0.0%) | 0 (0.0%) |
| Total Housing Units | 84 (80.8%) | 20 (19.2%) |
Occupancy by Educational Attainment in Kennerdell
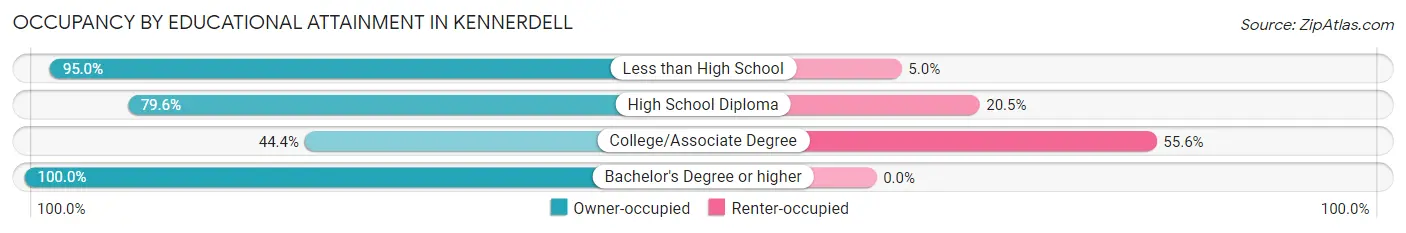
| Household Size | Owner-occupied | Renter-occupied |
| Less than High School | 19 (95.0%) | 1 (5.0%) |
| High School Diploma | 35 (79.5%) | 9 (20.4%) |
| College/Associate Degree | 8 (44.4%) | 10 (55.6%) |
| Bachelor's Degree or higher | 22 (100.0%) | 0 (0.0%) |
Occupancy by Age of Householder in Kennerdell
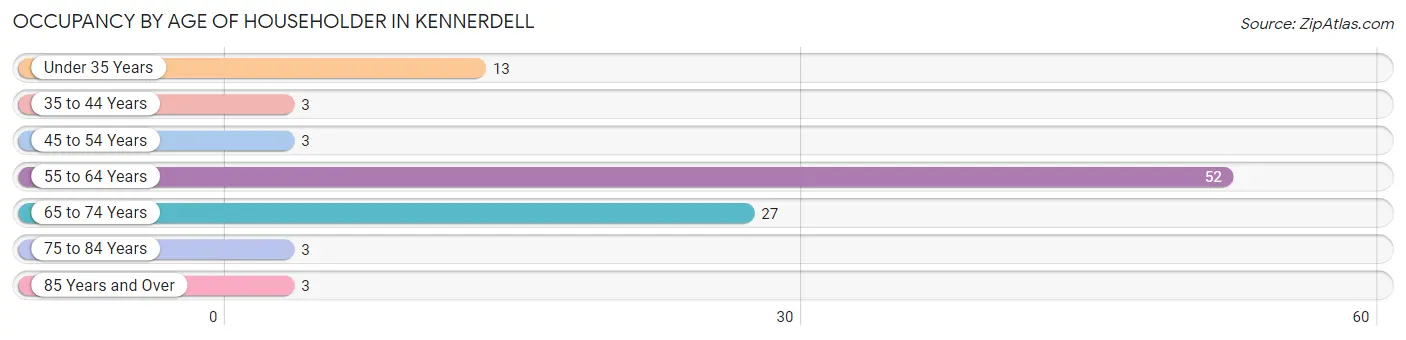
| Age Bracket | # Households | % Households |
| Under 35 Years | 13 | 12.5% |
| 35 to 44 Years | 3 | 2.9% |
| 45 to 54 Years | 3 | 2.9% |
| 55 to 64 Years | 52 | 50.0% |
| 65 to 74 Years | 27 | 26.0% |
| 75 to 84 Years | 3 | 2.9% |
| 85 Years and Over | 3 | 2.9% |
| Total | 104 | 100.0% |
Housing Finances in Kennerdell
Median Income by Occupancy in Kennerdell
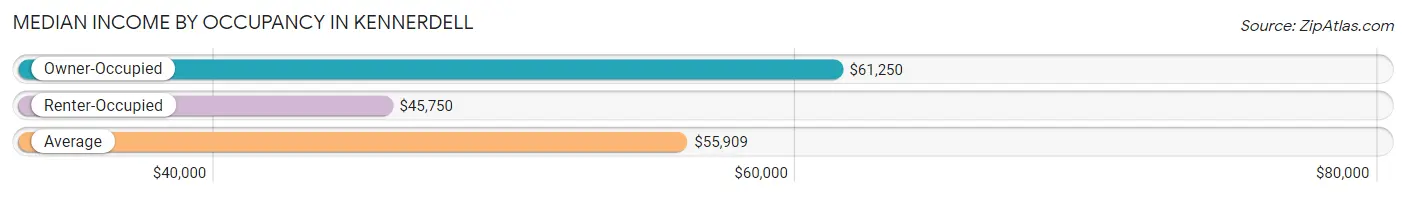
| Occupancy Type | # Households | Median Income |
| Owner-Occupied | 84 (80.8%) | $61,250 |
| Renter-Occupied | 20 (19.2%) | $45,750 |
| Average | 104 (100.0%) | $55,909 |
Occupancy by Householder Income Bracket in Kennerdell
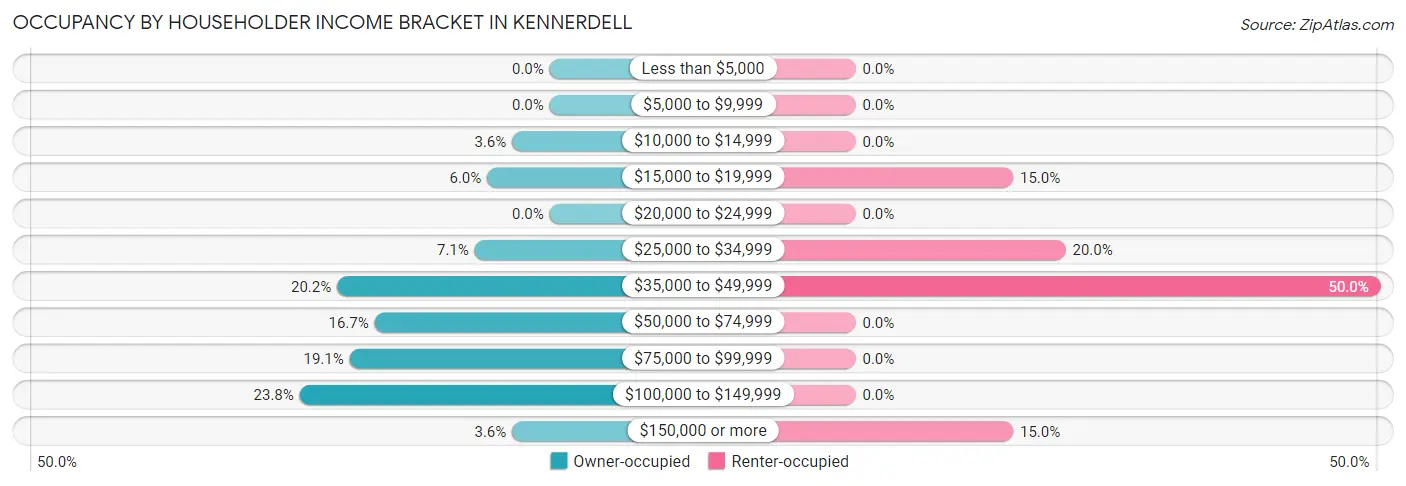
| Income Bracket | Owner-occupied | Renter-occupied |
| Less than $5,000 | 0 (0.0%) | 0 (0.0%) |
| $5,000 to $9,999 | 0 (0.0%) | 0 (0.0%) |
| $10,000 to $14,999 | 3 (3.6%) | 0 (0.0%) |
| $15,000 to $19,999 | 5 (5.9%) | 3 (15.0%) |
| $20,000 to $24,999 | 0 (0.0%) | 0 (0.0%) |
| $25,000 to $34,999 | 6 (7.1%) | 4 (20.0%) |
| $35,000 to $49,999 | 17 (20.2%) | 10 (50.0%) |
| $50,000 to $74,999 | 14 (16.7%) | 0 (0.0%) |
| $75,000 to $99,999 | 16 (19.1%) | 0 (0.0%) |
| $100,000 to $149,999 | 20 (23.8%) | 0 (0.0%) |
| $150,000 or more | 3 (3.6%) | 3 (15.0%) |
| Total | 84 (100.0%) | 20 (100.0%) |
Monthly Housing Cost Tiers in Kennerdell
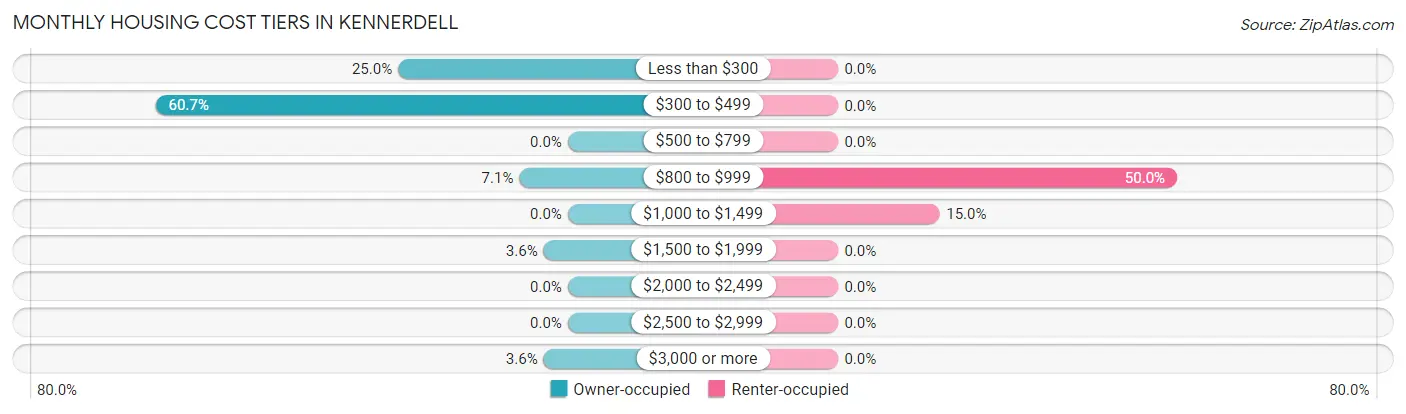
| Monthly Cost | Owner-occupied | Renter-occupied |
| Less than $300 | 21 (25.0%) | 0 (0.0%) |
| $300 to $499 | 51 (60.7%) | 0 (0.0%) |
| $500 to $799 | 0 (0.0%) | 0 (0.0%) |
| $800 to $999 | 6 (7.1%) | 10 (50.0%) |
| $1,000 to $1,499 | 0 (0.0%) | 3 (15.0%) |
| $1,500 to $1,999 | 3 (3.6%) | 0 (0.0%) |
| $2,000 to $2,499 | 0 (0.0%) | 0 (0.0%) |
| $2,500 to $2,999 | 0 (0.0%) | 0 (0.0%) |
| $3,000 or more | 3 (3.6%) | 0 (0.0%) |
| Total | 84 (100.0%) | 20 (100.0%) |
Physical Housing Characteristics in Kennerdell
Housing Structures in Kennerdell
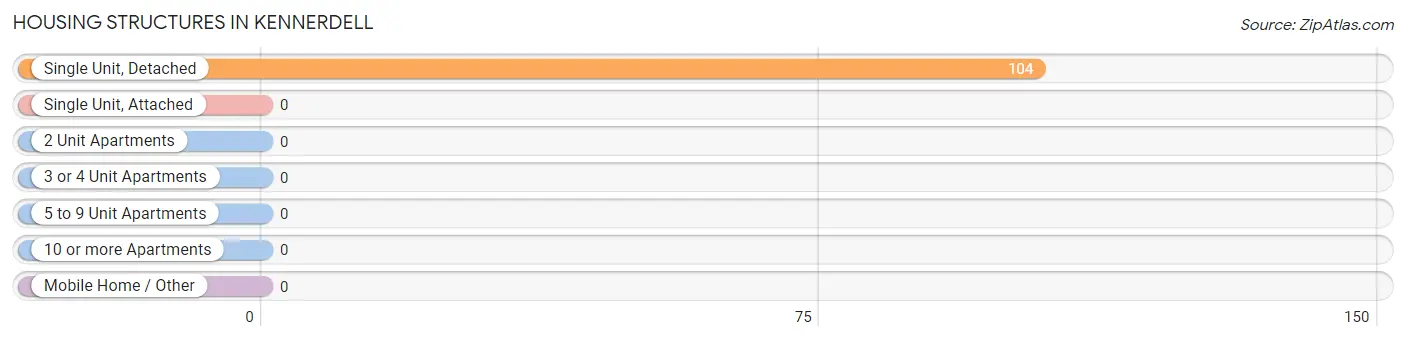
| Structure Type | # Housing Units | % Housing Units |
| Single Unit, Detached | 104 | 100.0% |
| Single Unit, Attached | 0 | 0.0% |
| 2 Unit Apartments | 0 | 0.0% |
| 3 or 4 Unit Apartments | 0 | 0.0% |
| 5 to 9 Unit Apartments | 0 | 0.0% |
| 10 or more Apartments | 0 | 0.0% |
| Mobile Home / Other | 0 | 0.0% |
| Total | 104 | 100.0% |
Housing Structures by Occupancy in Kennerdell
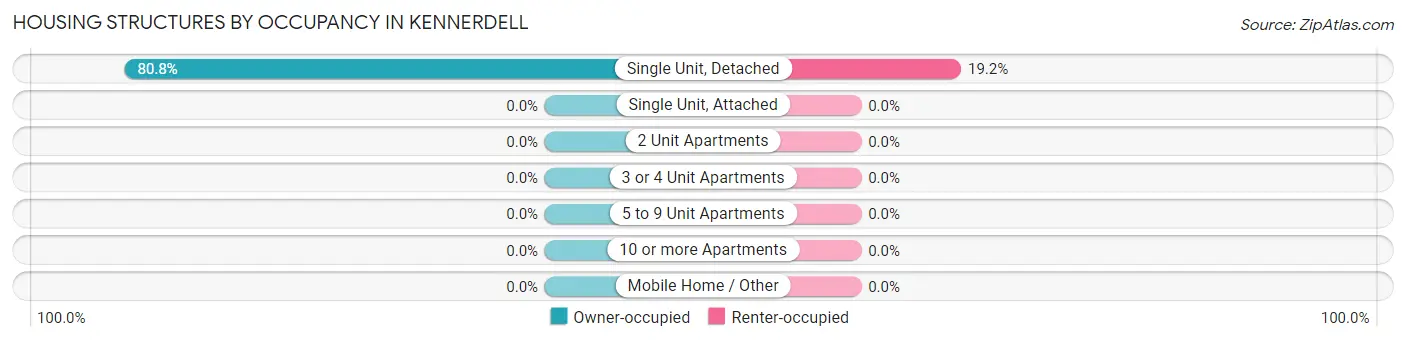
| Structure Type | Owner-occupied | Renter-occupied |
| Single Unit, Detached | 84 (80.8%) | 20 (19.2%) |
| Single Unit, Attached | 0 (0.0%) | 0 (0.0%) |
| 2 Unit Apartments | 0 (0.0%) | 0 (0.0%) |
| 3 or 4 Unit Apartments | 0 (0.0%) | 0 (0.0%) |
| 5 to 9 Unit Apartments | 0 (0.0%) | 0 (0.0%) |
| 10 or more Apartments | 0 (0.0%) | 0 (0.0%) |
| Mobile Home / Other | 0 (0.0%) | 0 (0.0%) |
| Total | 84 (80.8%) | 20 (19.2%) |
Housing Structures by Number of Rooms in Kennerdell
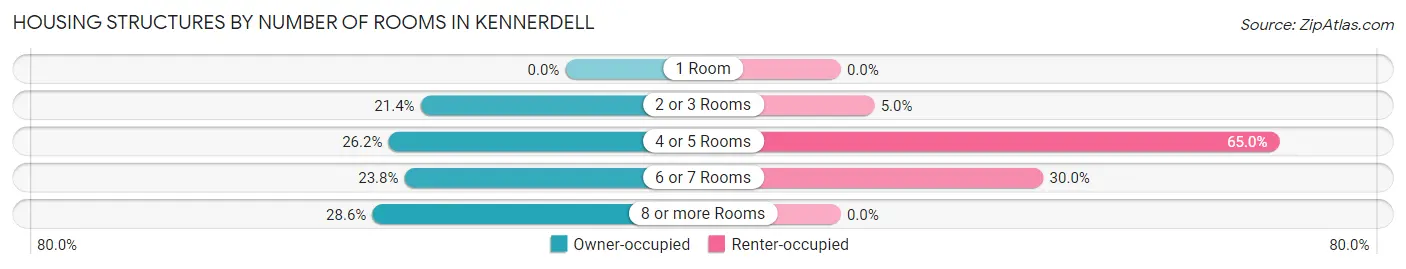
| Number of Rooms | Owner-occupied | Renter-occupied |
| 1 Room | 0 (0.0%) | 0 (0.0%) |
| 2 or 3 Rooms | 18 (21.4%) | 1 (5.0%) |
| 4 or 5 Rooms | 22 (26.2%) | 13 (65.0%) |
| 6 or 7 Rooms | 20 (23.8%) | 6 (30.0%) |
| 8 or more Rooms | 24 (28.6%) | 0 (0.0%) |
| Total | 84 (100.0%) | 20 (100.0%) |
Housing Structure by Heating Type in Kennerdell
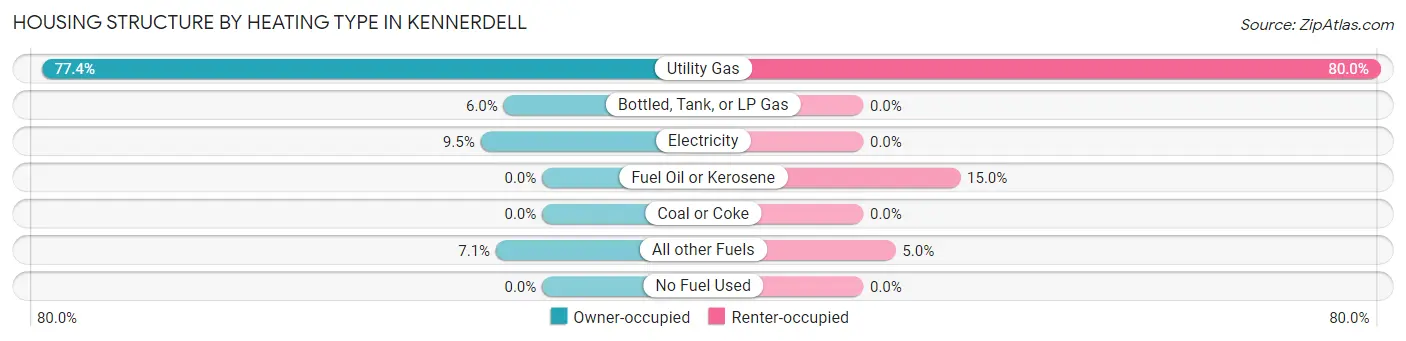
| Heating Type | Owner-occupied | Renter-occupied |
| Utility Gas | 65 (77.4%) | 16 (80.0%) |
| Bottled, Tank, or LP Gas | 5 (5.9%) | 0 (0.0%) |
| Electricity | 8 (9.5%) | 0 (0.0%) |
| Fuel Oil or Kerosene | 0 (0.0%) | 3 (15.0%) |
| Coal or Coke | 0 (0.0%) | 0 (0.0%) |
| All other Fuels | 6 (7.1%) | 1 (5.0%) |
| No Fuel Used | 0 (0.0%) | 0 (0.0%) |
| Total | 84 (100.0%) | 20 (100.0%) |
Household Vehicle Usage in Kennerdell
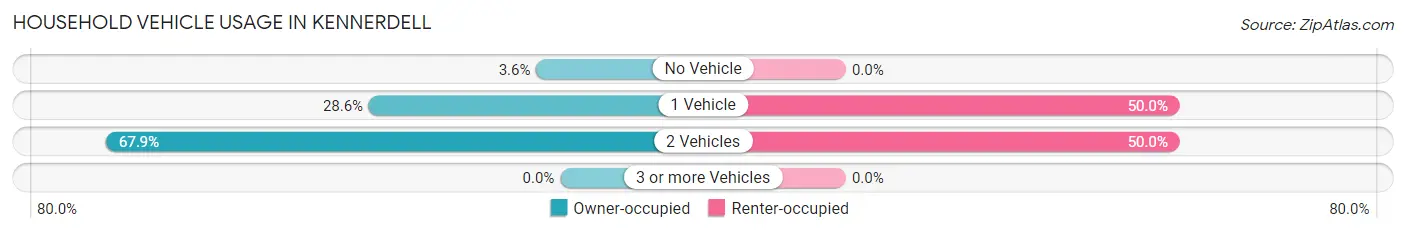
| Vehicles per Household | Owner-occupied | Renter-occupied |
| No Vehicle | 3 (3.6%) | 0 (0.0%) |
| 1 Vehicle | 24 (28.6%) | 10 (50.0%) |
| 2 Vehicles | 57 (67.9%) | 10 (50.0%) |
| 3 or more Vehicles | 0 (0.0%) | 0 (0.0%) |
| Total | 84 (100.0%) | 20 (100.0%) |
Real Estate & Mortgages in Kennerdell
Real Estate and Mortgage Overview in Kennerdell
| Characteristic | Without Mortgage | With Mortgage |
| Housing Units | 58 | 26 |
| Median Property Value | $167,100 | $114,700 |
| Median Household Income | $48,750 | $3 |
| Monthly Housing Costs | $359 | $0 |
| Real Estate Taxes | $1,407 | $0 |
Property Value by Mortgage Status in Kennerdell
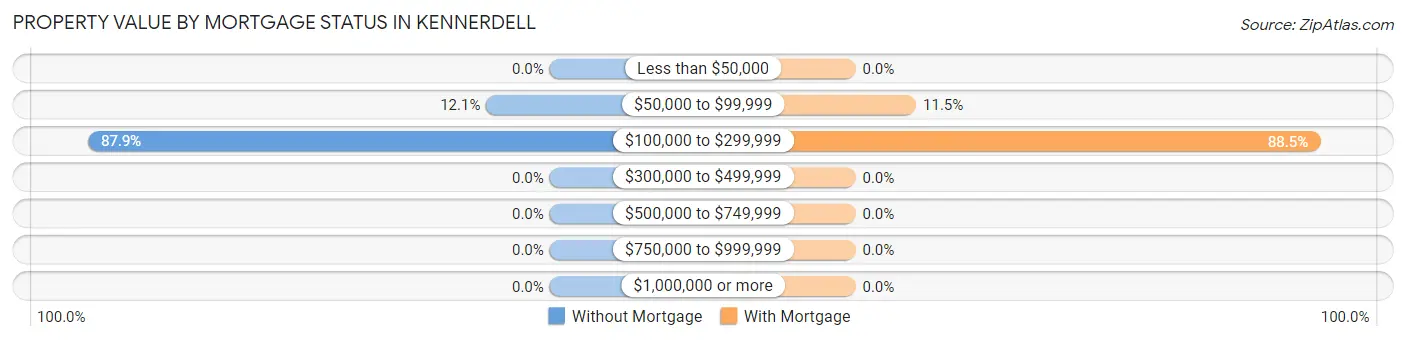
| Property Value | Without Mortgage | With Mortgage |
| Less than $50,000 | 0 (0.0%) | 0 (0.0%) |
| $50,000 to $99,999 | 7 (12.1%) | 3 (11.5%) |
| $100,000 to $299,999 | 51 (87.9%) | 23 (88.5%) |
| $300,000 to $499,999 | 0 (0.0%) | 0 (0.0%) |
| $500,000 to $749,999 | 0 (0.0%) | 0 (0.0%) |
| $750,000 to $999,999 | 0 (0.0%) | 0 (0.0%) |
| $1,000,000 or more | 0 (0.0%) | 0 (0.0%) |
| Total | 58 (100.0%) | 26 (100.0%) |
Household Income by Mortgage Status in Kennerdell
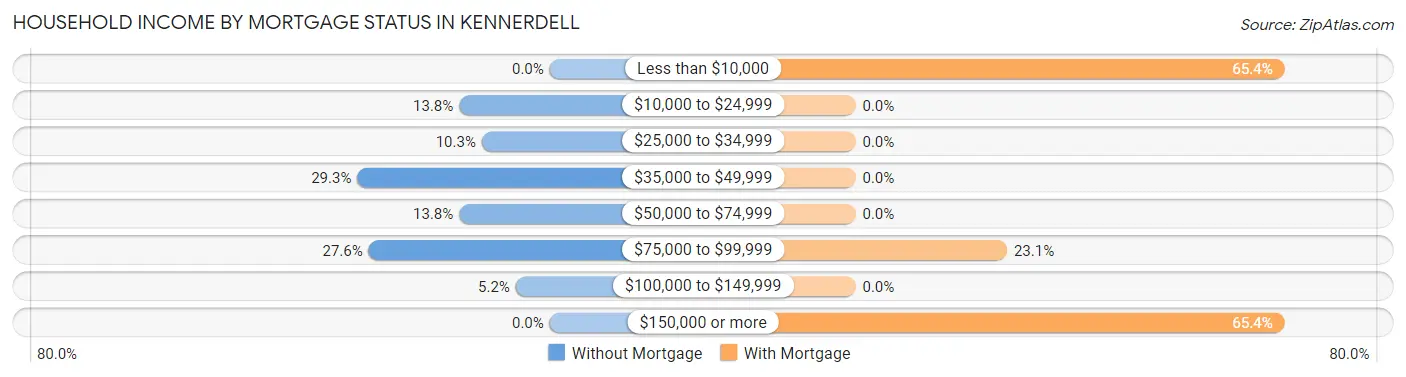
| Household Income | Without Mortgage | With Mortgage |
| Less than $10,000 | 0 (0.0%) | 17 (65.4%) |
| $10,000 to $24,999 | 8 (13.8%) | 0 (0.0%) |
| $25,000 to $34,999 | 6 (10.3%) | 0 (0.0%) |
| $35,000 to $49,999 | 17 (29.3%) | 0 (0.0%) |
| $50,000 to $74,999 | 8 (13.8%) | 0 (0.0%) |
| $75,000 to $99,999 | 16 (27.6%) | 6 (23.1%) |
| $100,000 to $149,999 | 3 (5.2%) | 0 (0.0%) |
| $150,000 or more | 0 (0.0%) | 17 (65.4%) |
| Total | 58 (100.0%) | 26 (100.0%) |
Property Value to Household Income Ratio in Kennerdell
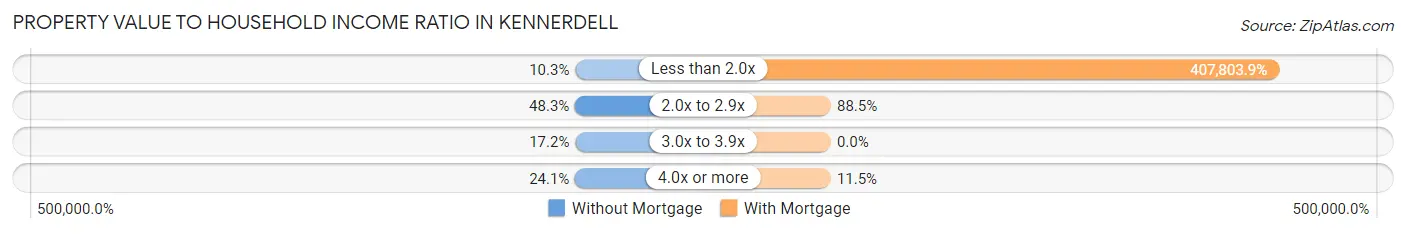
| Value-to-Income Ratio | Without Mortgage | With Mortgage |
| Less than 2.0x | 6 (10.3%) | 106,029 (407,803.9%) |
| 2.0x to 2.9x | 28 (48.3%) | 23 (88.5%) |
| 3.0x to 3.9x | 10 (17.2%) | 0 (0.0%) |
| 4.0x or more | 14 (24.1%) | 3 (11.5%) |
| Total | 58 (100.0%) | 26 (100.0%) |
Real Estate Taxes by Mortgage Status in Kennerdell
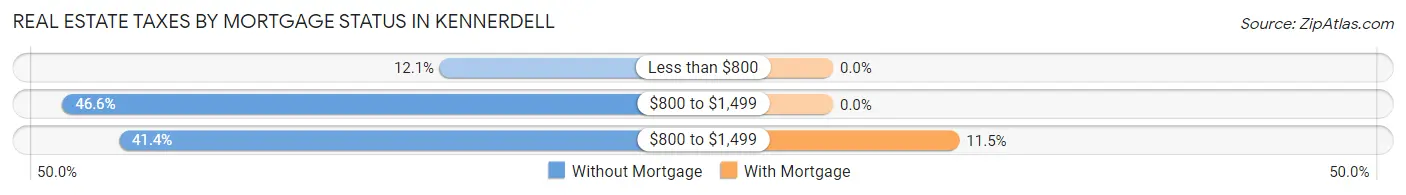
| Property Taxes | Without Mortgage | With Mortgage |
| Less than $800 | 7 (12.1%) | 0 (0.0%) |
| $800 to $1,499 | 27 (46.6%) | 0 (0.0%) |
| $800 to $1,499 | 24 (41.4%) | 3 (11.5%) |
| Total | 58 (100.0%) | 26 (100.0%) |
Health & Disability in Kennerdell
Health Insurance Coverage by Age in Kennerdell
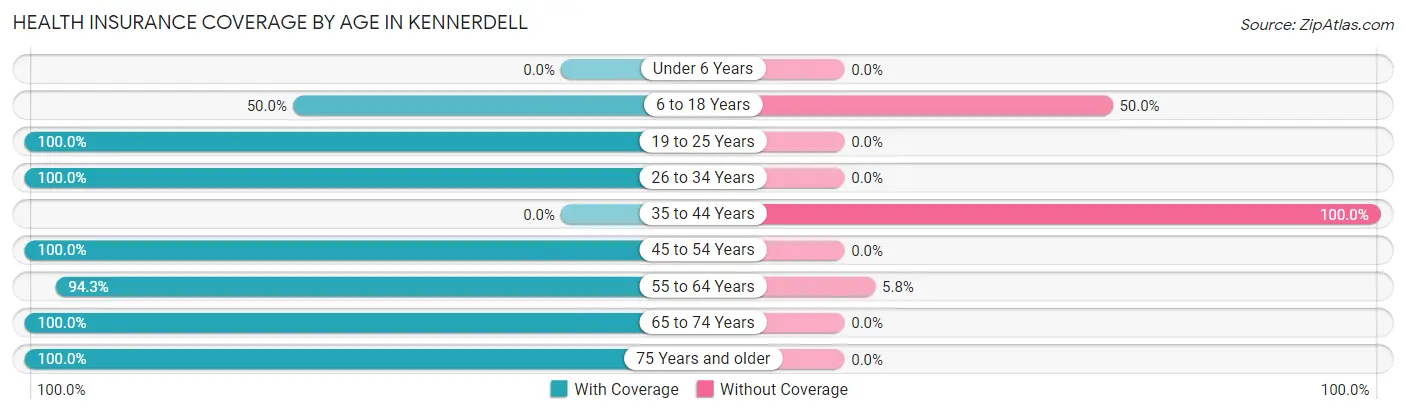
| Age Bracket | With Coverage | Without Coverage |
| Under 6 Years | 0 (0.0%) | 0 (0.0%) |
| 6 to 18 Years | 3 (50.0%) | 3 (50.0%) |
| 19 to 25 Years | 5 (100.0%) | 0 (0.0%) |
| 26 to 34 Years | 13 (100.0%) | 0 (0.0%) |
| 35 to 44 Years | 0 (0.0%) | 3 (100.0%) |
| 45 to 54 Years | 3 (100.0%) | 0 (0.0%) |
| 55 to 64 Years | 82 (94.3%) | 5 (5.8%) |
| 65 to 74 Years | 49 (100.0%) | 0 (0.0%) |
| 75 Years and older | 6 (100.0%) | 0 (0.0%) |
| Total | 161 (93.6%) | 11 (6.4%) |
Health Insurance Coverage by Citizenship Status in Kennerdell
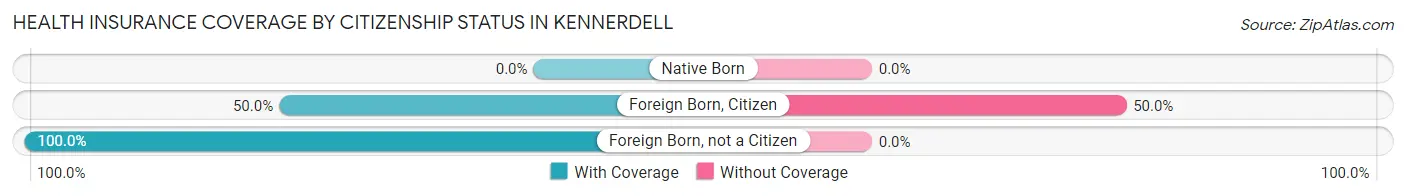
| Citizenship Status | With Coverage | Without Coverage |
| Native Born | 0 (0.0%) | 0 (0.0%) |
| Foreign Born, Citizen | 3 (50.0%) | 3 (50.0%) |
| Foreign Born, not a Citizen | 5 (100.0%) | 0 (0.0%) |
Health Insurance Coverage by Household Income in Kennerdell
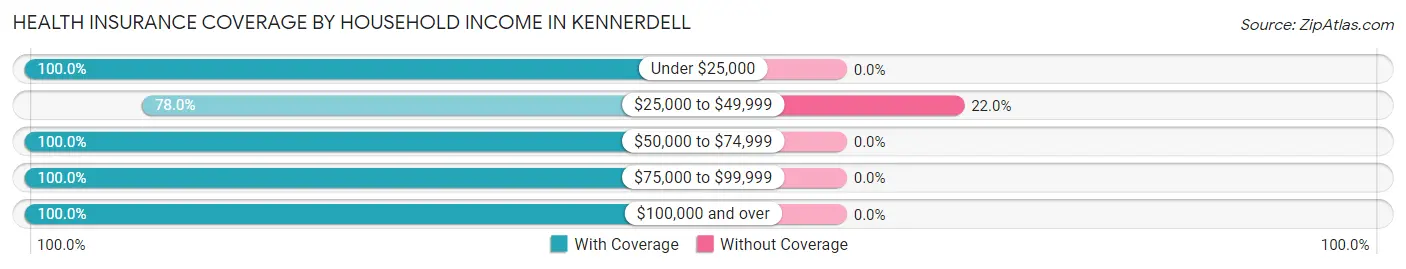
| Household Income | With Coverage | Without Coverage |
| Under $25,000 | 11 (100.0%) | 0 (0.0%) |
| $25,000 to $49,999 | 39 (78.0%) | 11 (22.0%) |
| $50,000 to $74,999 | 27 (100.0%) | 0 (0.0%) |
| $75,000 to $99,999 | 30 (100.0%) | 0 (0.0%) |
| $100,000 and over | 54 (100.0%) | 0 (0.0%) |
Public vs Private Health Insurance Coverage by Age in Kennerdell
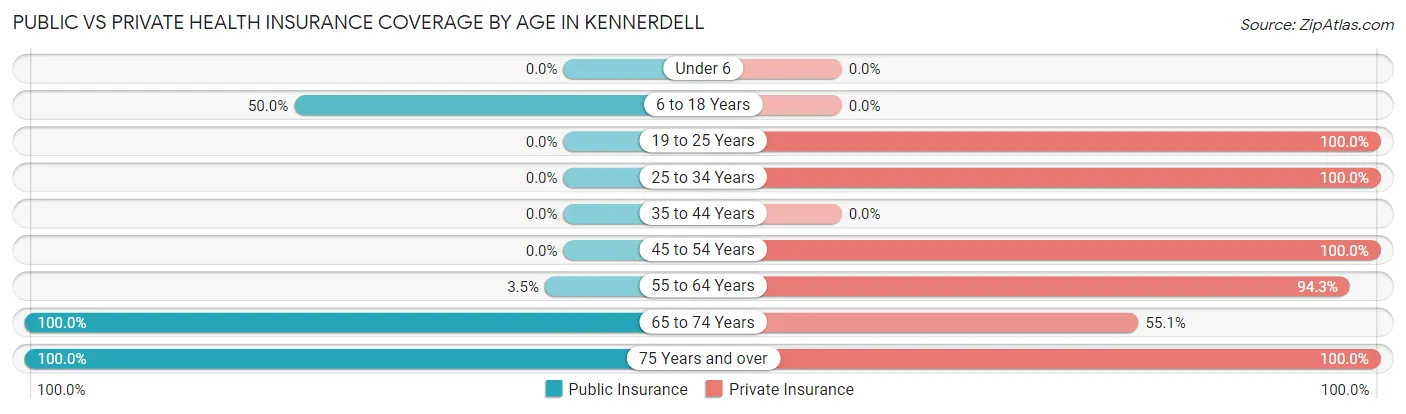
| Age Bracket | Public Insurance | Private Insurance |
| Under 6 | 0 (0.0%) | 0 (0.0%) |
| 6 to 18 Years | 3 (50.0%) | 0 (0.0%) |
| 19 to 25 Years | 0 (0.0%) | 5 (100.0%) |
| 25 to 34 Years | 0 (0.0%) | 13 (100.0%) |
| 35 to 44 Years | 0 (0.0%) | 0 (0.0%) |
| 45 to 54 Years | 0 (0.0%) | 3 (100.0%) |
| 55 to 64 Years | 3 (3.5%) | 82 (94.3%) |
| 65 to 74 Years | 49 (100.0%) | 27 (55.1%) |
| 75 Years and over | 6 (100.0%) | 6 (100.0%) |
| Total | 61 (35.5%) | 136 (79.1%) |
Disability Status by Sex by Age in Kennerdell
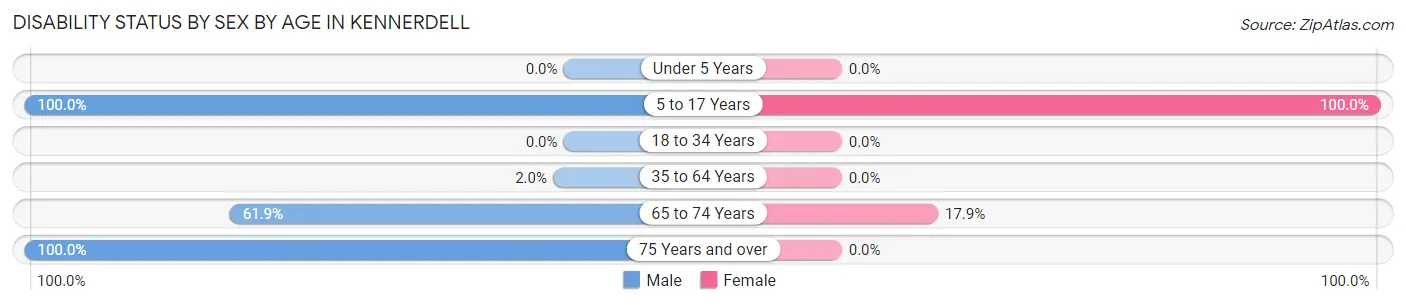
| Age Bracket | Male | Female |
| Under 5 Years | 0 (0.0%) | 0 (0.0%) |
| 5 to 17 Years | 3 (100.0%) | 3 (100.0%) |
| 18 to 34 Years | 0 (0.0%) | 0 (0.0%) |
| 35 to 64 Years | 1 (2.0%) | 0 (0.0%) |
| 65 to 74 Years | 13 (61.9%) | 5 (17.9%) |
| 75 Years and over | 6 (100.0%) | 0 (0.0%) |
Disability Class by Sex by Age in Kennerdell
Disability Class: Hearing Difficulty
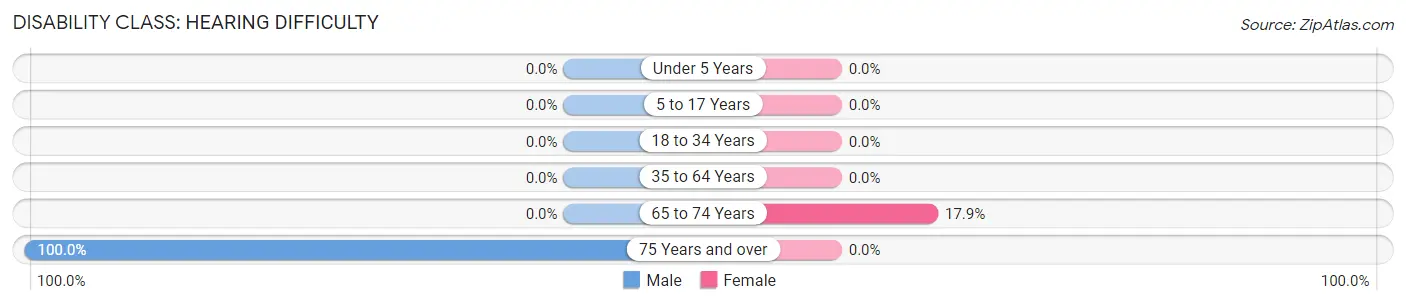
| Age Bracket | Male | Female |
| Under 5 Years | 0 (0.0%) | 0 (0.0%) |
| 5 to 17 Years | 0 (0.0%) | 0 (0.0%) |
| 18 to 34 Years | 0 (0.0%) | 0 (0.0%) |
| 35 to 64 Years | 0 (0.0%) | 0 (0.0%) |
| 65 to 74 Years | 0 (0.0%) | 5 (17.9%) |
| 75 Years and over | 6 (100.0%) | 0 (0.0%) |
Disability Class: Vision Difficulty
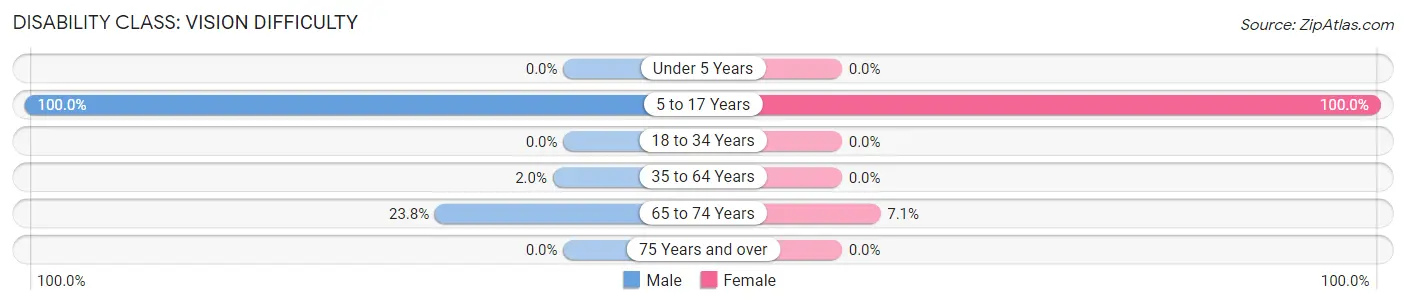
| Age Bracket | Male | Female |
| Under 5 Years | 0 (0.0%) | 0 (0.0%) |
| 5 to 17 Years | 3 (100.0%) | 3 (100.0%) |
| 18 to 34 Years | 0 (0.0%) | 0 (0.0%) |
| 35 to 64 Years | 1 (2.0%) | 0 (0.0%) |
| 65 to 74 Years | 5 (23.8%) | 2 (7.1%) |
| 75 Years and over | 0 (0.0%) | 0 (0.0%) |
Disability Class: Cognitive Difficulty
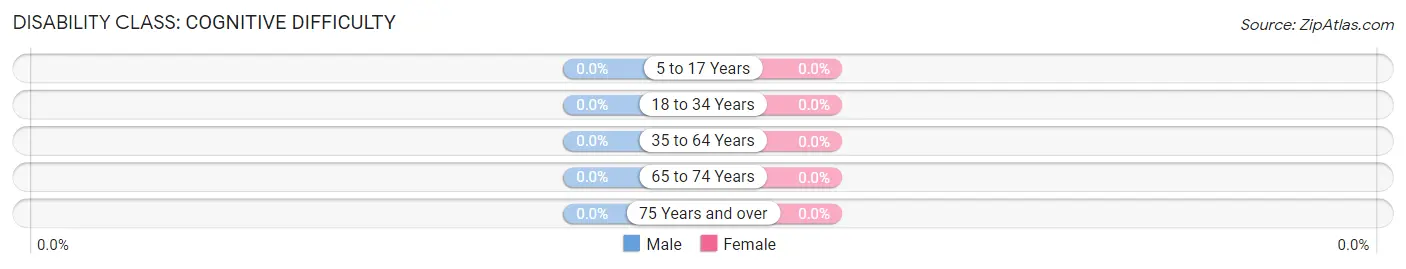
| Age Bracket | Male | Female |
| 5 to 17 Years | 0 (0.0%) | 0 (0.0%) |
| 18 to 34 Years | 0 (0.0%) | 0 (0.0%) |
| 35 to 64 Years | 0 (0.0%) | 0 (0.0%) |
| 65 to 74 Years | 0 (0.0%) | 0 (0.0%) |
| 75 Years and over | 0 (0.0%) | 0 (0.0%) |
Disability Class: Ambulatory Difficulty
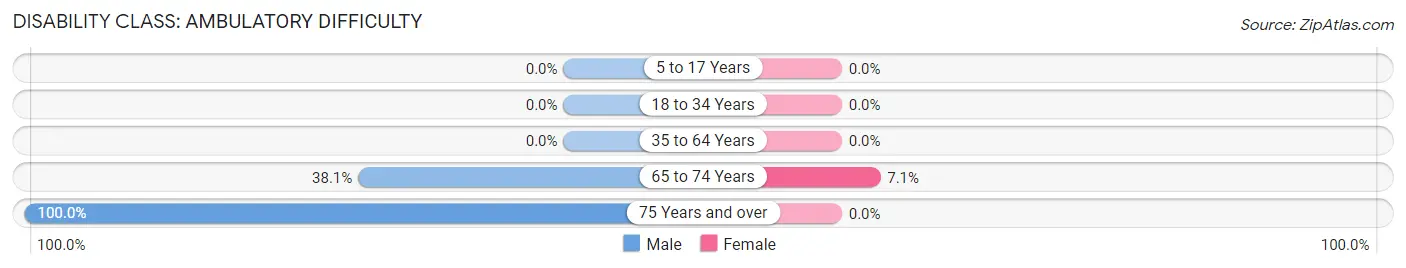
| Age Bracket | Male | Female |
| 5 to 17 Years | 0 (0.0%) | 0 (0.0%) |
| 18 to 34 Years | 0 (0.0%) | 0 (0.0%) |
| 35 to 64 Years | 0 (0.0%) | 0 (0.0%) |
| 65 to 74 Years | 8 (38.1%) | 2 (7.1%) |
| 75 Years and over | 6 (100.0%) | 0 (0.0%) |
Disability Class: Self-Care Difficulty
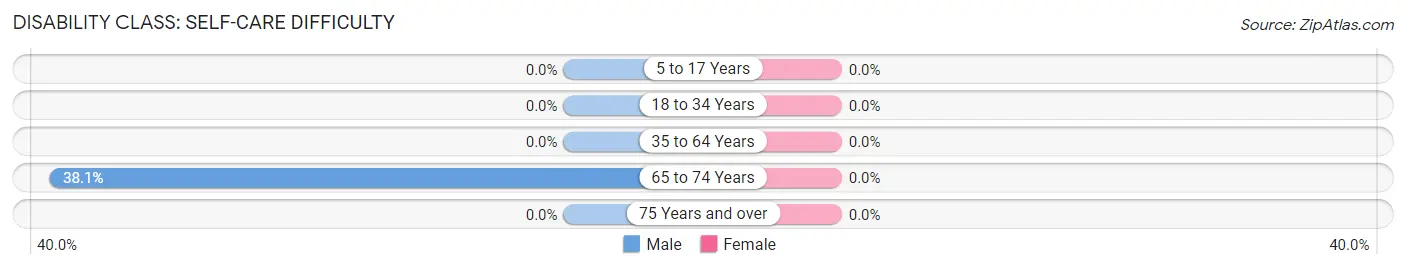
| Age Bracket | Male | Female |
| 5 to 17 Years | 0 (0.0%) | 0 (0.0%) |
| 18 to 34 Years | 0 (0.0%) | 0 (0.0%) |
| 35 to 64 Years | 0 (0.0%) | 0 (0.0%) |
| 65 to 74 Years | 8 (38.1%) | 0 (0.0%) |
| 75 Years and over | 0 (0.0%) | 0 (0.0%) |
Technology Access in Kennerdell
Computing Device Access in Kennerdell
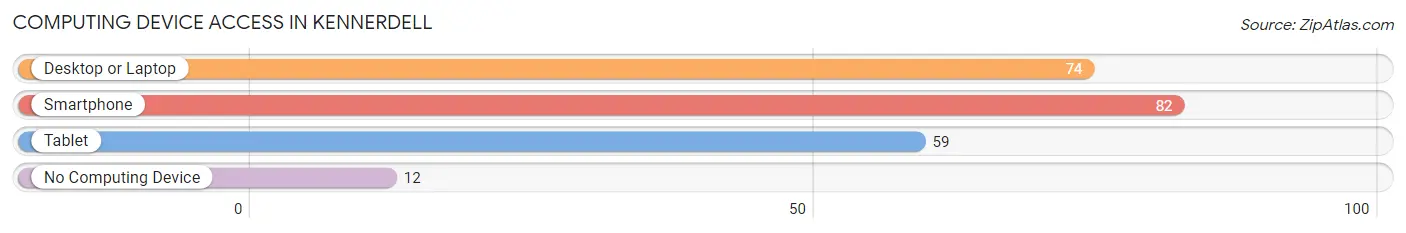
| Device Type | # Households | % Households |
| Desktop or Laptop | 74 | 71.2% |
| Smartphone | 82 | 78.8% |
| Tablet | 59 | 56.7% |
| No Computing Device | 12 | 11.5% |
| Total | 104 | 100.0% |
Internet Access in Kennerdell
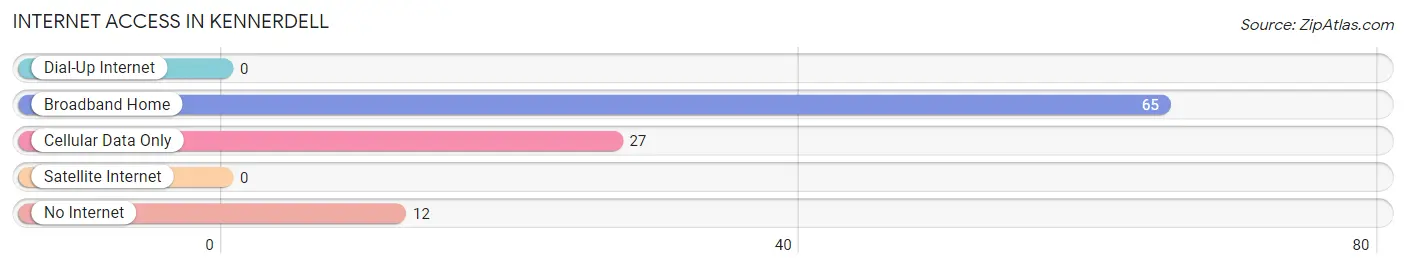
| Internet Type | # Households | % Households |
| Dial-Up Internet | 0 | 0.0% |
| Broadband Home | 65 | 62.5% |
| Cellular Data Only | 27 | 26.0% |
| Satellite Internet | 0 | 0.0% |
| No Internet | 12 | 11.5% |
| Total | 104 | 100.0% |
Kennerdell Summary
Kennerdell is a small borough located in Venango County, Pennsylvania. It is situated in the northwestern part of the state, approximately 60 miles north of Pittsburgh. The borough is bordered by the Allegheny National Forest to the north and east, and the Clarion River to the south. As of the 2010 census, the population of Kennerdell was 545.
History
Kennerdell was founded in 1832 by William Kennerdell, a local landowner. The borough was originally known as Kennerdell’s Mills, and was incorporated in 1867. The town was named after William Kennerdell, who was a prominent local businessman and landowner.
The borough was originally a small farming community, but in the late 19th century, the lumber industry began to take off in the area. The lumber industry was a major source of employment for the residents of Kennerdell, and the town grew rapidly. By the early 20th century, the town had become a bustling center of commerce and industry.
Geography
Kennerdell is located at 41°25'N 79°45'W (41.4167, -79.7500). According to the United States Census Bureau, the borough has a total area of 0.7 square miles (1.8 km2), all of it land.
The borough is located in the Allegheny Plateau region of Pennsylvania. The terrain is mostly hilly, with some flat areas. The Clarion River runs through the borough, and there are several small creeks and streams in the area.
Economy
The economy of Kennerdell is largely based on the lumber industry. The borough is home to several sawmills and woodworking shops, as well as a few small businesses. The town also has a few retail stores, restaurants, and other services.
The borough is also home to a few small manufacturing companies, including a plastics factory and a metal fabrication shop. The borough is also home to a few small farms, which produce a variety of crops.
Demographics
As of the 2010 census, there were 545 people, 221 households, and 149 families residing in the borough. The population density was 776.4 people per square mile (300.2/km2). There were 241 housing units at an average density of 343.3 per square mile (132.6/km2). The racial makeup of the borough was 97.3% White, 0.2% African American, 0.2% Native American, 0.2% Asian, 0.4% from other races, and 1.5% from two or more races. Hispanic or Latino of any race were 1.1% of the population.
There were 221 households, out of which 28.4% had children under the age of 18 living with them, 51.6% were married couples living together, 9.5% had a female householder with no husband present, and 33.9% were non-families. 29.7% of all households were made up of individuals, and 14.9% had someone living alone who was 65 years of age or older. The average household size was 2.47 and the average family size was 3.06.
In the borough, the population was spread out, with 24.2% under the age of 18, 7.3% from 18 to 24, 25.2% from 25 to 44, 25.2% from 45 to 64, and 18.1% who were 65 years of age or older. The median age was 40 years. For every 100 females, there were 97.3 males. For every 100 females age 18 and over, there were 94.3 males.
The median income for a household in the borough was $35,000, and the median income for a family was $41,250. Males had a median income of $30,000 versus $21,250 for females. The per capita income for the borough was $17,845. About 8.3% of families and 10.2% of the population were below the poverty line, including 14.3% of those under age 18 and 8.3% of those age 65 or over.
Common Questions
What is Per Capita Income in Kennerdell?
Per Capita income in Kennerdell is $40,485.
What is the Median Family Income in Kennerdell?
Median Family Income in Kennerdell is $76,696.
What is the Median Household income in Kennerdell?
Median Household Income in Kennerdell is $55,909.
What is Income or Wage Gap in Kennerdell?
Income or Wage Gap in Kennerdell is 10.3%.
Women in Kennerdell earn 89.7 cents for every dollar earned by a man.
What is Inequality or Gini Index in Kennerdell?
Inequality or Gini Index in Kennerdell is 0.31.
What is the Total Population of Kennerdell?
Total Population of Kennerdell is 172.
What is the Total Male Population of Kennerdell?
Total Male Population of Kennerdell is 91.
What is the Total Female Population of Kennerdell?
Total Female Population of Kennerdell is 81.
What is the Ratio of Males per 100 Females in Kennerdell?
There are 112.35 Males per 100 Females in Kennerdell.
What is the Ratio of Females per 100 Males in Kennerdell?
There are 89.01 Females per 100 Males in Kennerdell.
What is the Median Population Age in Kennerdell?
Median Population Age in Kennerdell is 64.2 Years.
What is the Average Family Size in Kennerdell
Average Family Size in Kennerdell is 2.0 People.
What is the Average Household Size in Kennerdell
Average Household Size in Kennerdell is 1.6 People.
How Large is the Labor Force in Kennerdell?
There are 94 People in the Labor Forcein in Kennerdell.
What is the Percentage of People in the Labor Force in Kennerdell?
55.6% of People are in the Labor Force in Kennerdell.