Jonestown, PA Map & Demographics
Jonestown Map
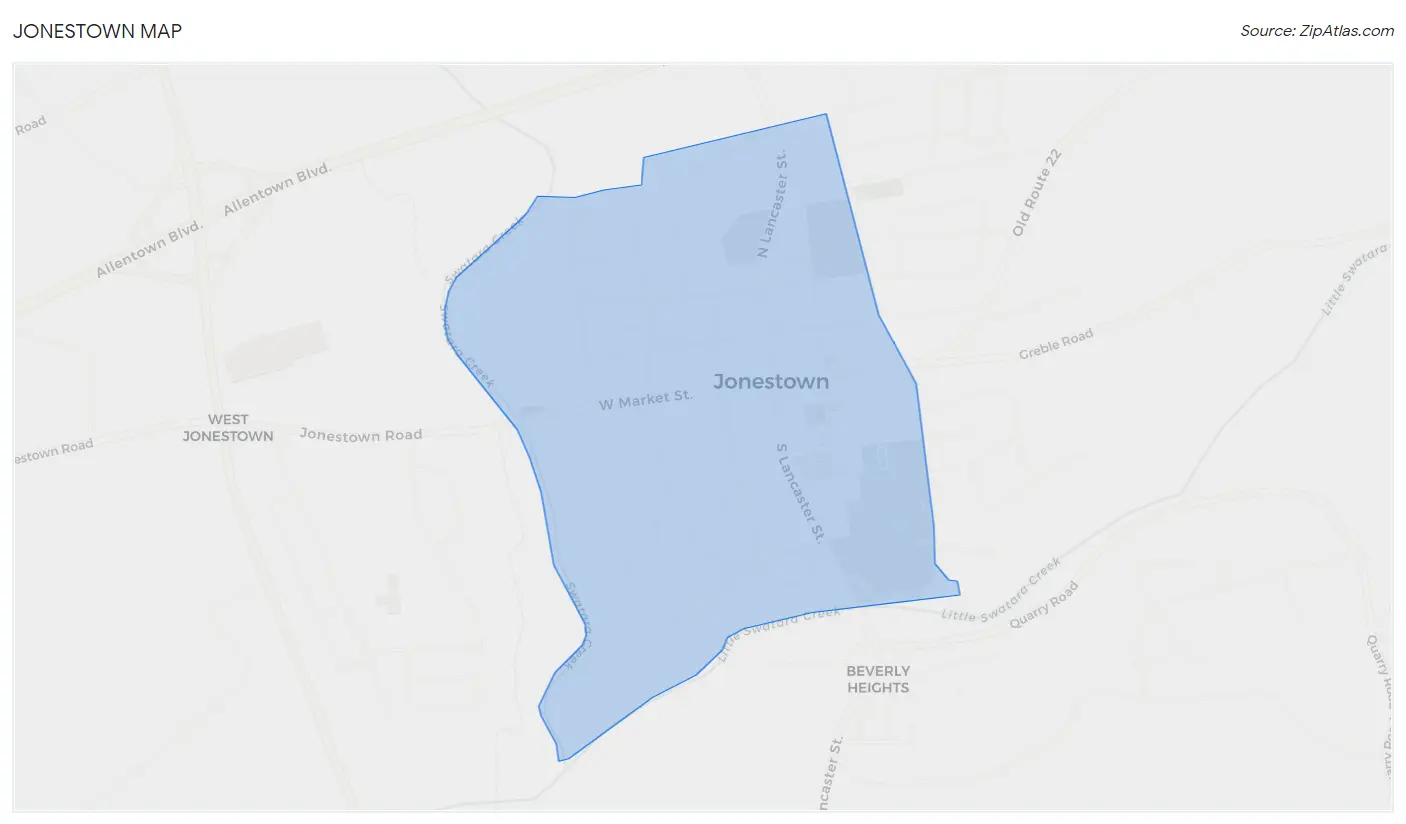
Jonestown Overview
$31,036
PER CAPITA INCOME
$70,833
AVG FAMILY INCOME
$65,000
AVG HOUSEHOLD INCOME
0.35
INEQUALITY / GINI INDEX
64
TOTAL POPULATION
33
MALE POPULATION
31
FEMALE POPULATION
106.45
MALES / 100 FEMALES
93.94
FEMALES / 100 MALES
57.3
MEDIAN AGE
2.8
AVG FAMILY SIZE
2.7
AVG HOUSEHOLD SIZE
21
LABOR FORCE [ PEOPLE ]
39.6%
PERCENT IN LABOR FORCE
Jonestown Zip Codes
Jonestown Area Codes
Income in Jonestown
Income Overview in Jonestown
Per Capita Income in Jonestown is $31,036, while median incomes of families and households are $70,833 and $65,000 respectively.
| Characteristic | Number | Measure |
| Per Capita Income | 64 | $31,036 |
| Median Family Income | 22 | $70,833 |
| Mean Family Income | 22 | $77,323 |
| Median Household Income | 24 | $65,000 |
| Mean Household Income | 24 | $75,846 |
| Income Deficit | 22 | $0 |
| Wage / Income Gap (%) | 64 | 0.00% |
| Wage / Income Gap ($) | 64 | 100.00¢ per $1 |
| Gini / Inequality Index | 64 | 0.35 |
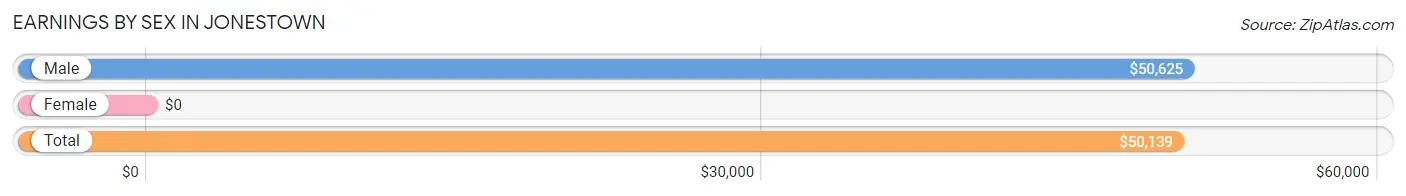
Earnings by Sex in Jonestown
| Sex | Number | Average Earnings |
| Male | 13 (61.9%) | $50,625 |
| Female | 8 (38.1%) | $0 |
| Total | 21 (100.0%) | $50,139 |
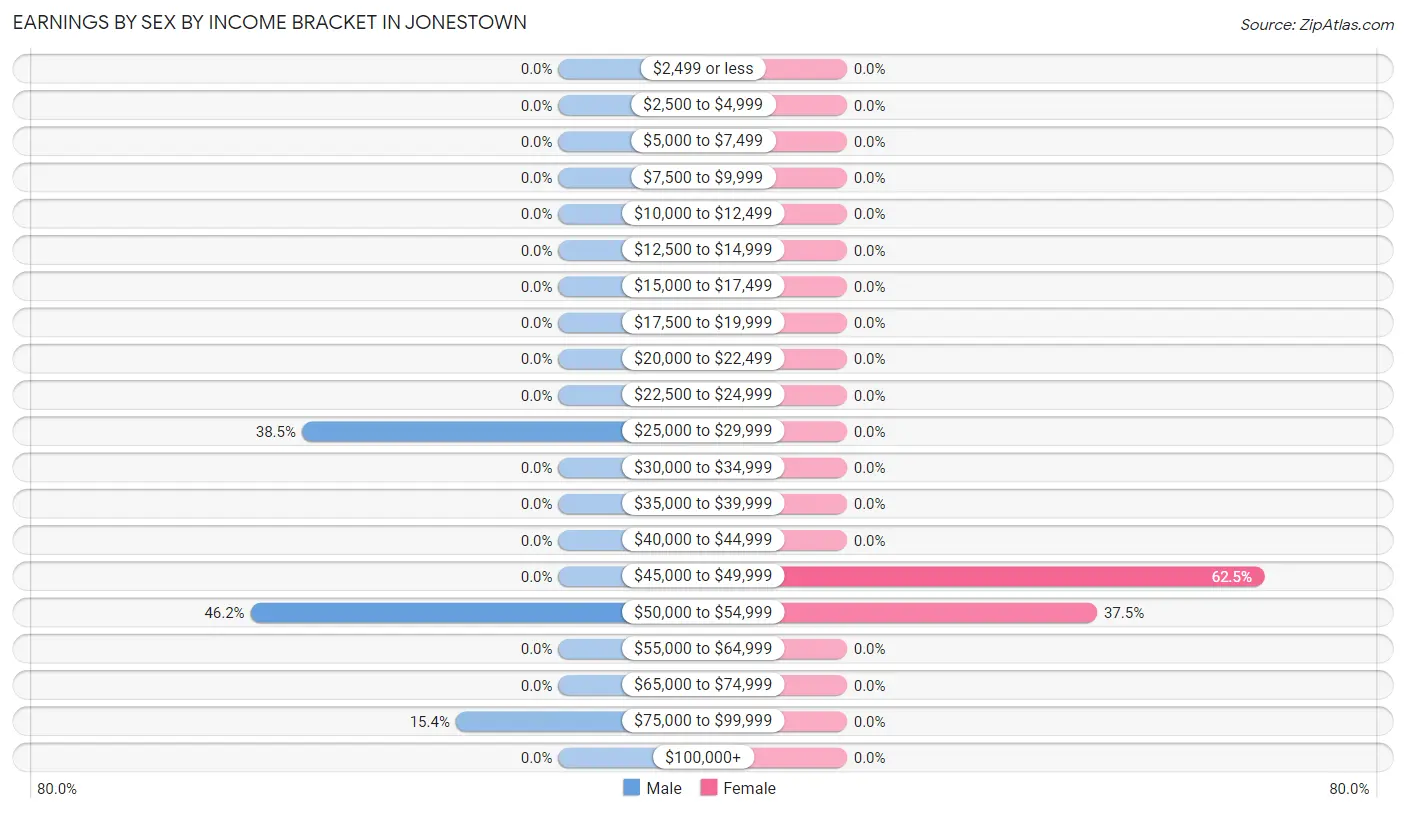
Earnings by Sex by Income Bracket in Jonestown
The most common earnings brackets in Jonestown are $50,000 to $54,999 for men (6 | 46.2%) and $45,000 to $49,999 for women (5 | 62.5%).
| Income | Male | Female |
| $2,499 or less | 0 (0.0%) | 0 (0.0%) |
| $2,500 to $4,999 | 0 (0.0%) | 0 (0.0%) |
| $5,000 to $7,499 | 0 (0.0%) | 0 (0.0%) |
| $7,500 to $9,999 | 0 (0.0%) | 0 (0.0%) |
| $10,000 to $12,499 | 0 (0.0%) | 0 (0.0%) |
| $12,500 to $14,999 | 0 (0.0%) | 0 (0.0%) |
| $15,000 to $17,499 | 0 (0.0%) | 0 (0.0%) |
| $17,500 to $19,999 | 0 (0.0%) | 0 (0.0%) |
| $20,000 to $22,499 | 0 (0.0%) | 0 (0.0%) |
| $22,500 to $24,999 | 0 (0.0%) | 0 (0.0%) |
| $25,000 to $29,999 | 5 (38.5%) | 0 (0.0%) |
| $30,000 to $34,999 | 0 (0.0%) | 0 (0.0%) |
| $35,000 to $39,999 | 0 (0.0%) | 0 (0.0%) |
| $40,000 to $44,999 | 0 (0.0%) | 0 (0.0%) |
| $45,000 to $49,999 | 0 (0.0%) | 5 (62.5%) |
| $50,000 to $54,999 | 6 (46.2%) | 3 (37.5%) |
| $55,000 to $64,999 | 0 (0.0%) | 0 (0.0%) |
| $65,000 to $74,999 | 0 (0.0%) | 0 (0.0%) |
| $75,000 to $99,999 | 2 (15.4%) | 0 (0.0%) |
| $100,000+ | 0 (0.0%) | 0 (0.0%) |
| Total | 13 (100.0%) | 8 (100.0%) |
Earnings by Sex by Educational Attainment in Jonestown
| Educational Attainment | Male Income | Female Income |
| Less than High School | - | - |
| High School Diploma | - | - |
| College or Associate's Degree | - | - |
| Bachelor's Degree | - | - |
| Graduate Degree | - | - |
| Total | - | - |
Family Income in Jonestown
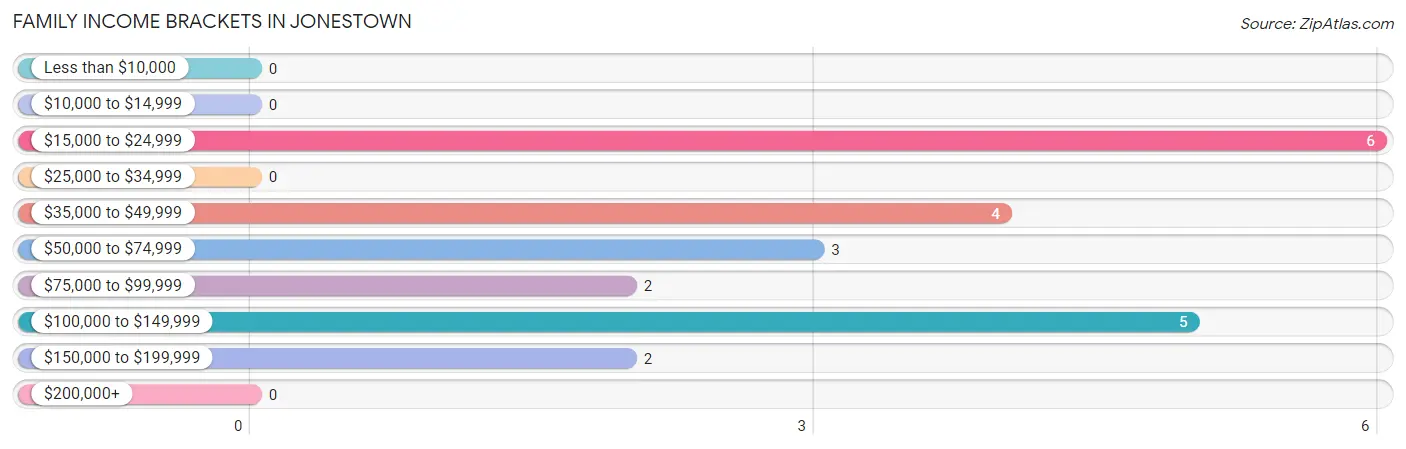
Family Income Brackets in Jonestown
According to the Jonestown family income data, there are 6 families falling into the $15,000 to $24,999 income range, which is the most common income bracket and makes up 27.3% of all families.
| Income Bracket | # Families | % Families |
| Less than $10,000 | 0 | 0.0% |
| $10,000 to $14,999 | 0 | 0.0% |
| $15,000 to $24,999 | 6 | 27.3% |
| $25,000 to $34,999 | 0 | 0.0% |
| $35,000 to $49,999 | 4 | 18.2% |
| $50,000 to $74,999 | 3 | 13.6% |
| $75,000 to $99,999 | 2 | 9.1% |
| $100,000 to $149,999 | 5 | 22.7% |
| $150,000 to $199,999 | 2 | 9.1% |
| $200,000+ | 0 | 0.0% |
Family Income by Famaliy Size in Jonestown
| Income Bracket | # Families | Median Income |
| 2-Person Families | 17 (77.3%) | $0 |
| 3-Person Families | 0 (0.0%) | $0 |
| 4-Person Families | 0 (0.0%) | $0 |
| 5-Person Families | 5 (22.7%) | $0 |
| 6-Person Families | 0 (0.0%) | $0 |
| 7+ Person Families | 0 (0.0%) | $0 |
| Total | 22 (100.0%) | $70,833 |
Family Income by Number of Earners in Jonestown
| Number of Earners | # Families | Median Income |
| No Earners | 11 (50.0%) | $0 |
| 1 Earner | 4 (18.2%) | $0 |
| 2 Earners | 7 (31.8%) | $0 |
| 3+ Earners | 0 (0.0%) | $0 |
| Total | 22 (100.0%) | $70,833 |
Household Income in Jonestown
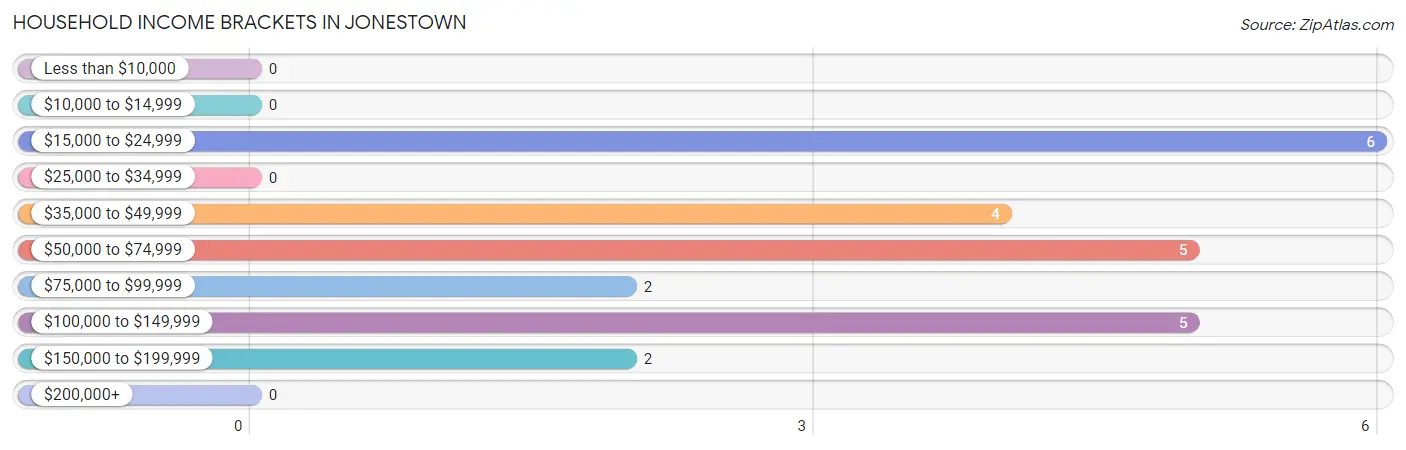
Household Income Brackets in Jonestown
With 6 households falling in the category, the $15,000 to $24,999 income range is the most frequent in Jonestown, accounting for 25.0% of all households.
| Income Bracket | # Households | % Households |
| Less than $10,000 | 0 | 0.0% |
| $10,000 to $14,999 | 0 | 0.0% |
| $15,000 to $24,999 | 6 | 25.0% |
| $25,000 to $34,999 | 0 | 0.0% |
| $35,000 to $49,999 | 4 | 16.7% |
| $50,000 to $74,999 | 5 | 20.8% |
| $75,000 to $99,999 | 2 | 8.3% |
| $100,000 to $149,999 | 5 | 20.8% |
| $150,000 to $199,999 | 2 | 8.3% |
| $200,000+ | 0 | 0.0% |
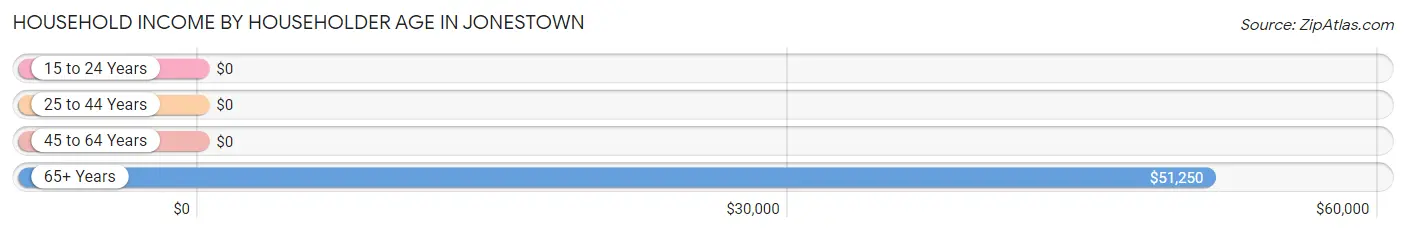
Household Income by Householder Age in Jonestown
The median household income in Jonestown is $65,000, with the highest median household income of $51,250 found in the 65+ years age bracket for the primary householder. A total of 8 households (33.3%) fall into this category.
| Income Bracket | # Households | Median Income |
| 15 to 24 Years | 0 (0.0%) | $0 |
| 25 to 44 Years | 0 (0.0%) | $0 |
| 45 to 64 Years | 16 (66.7%) | $0 |
| 65+ Years | 8 (33.3%) | $51,250 |
| Total | 24 (100.0%) | $65,000 |
Poverty in Jonestown
Income Below Poverty by Sex and Age in Jonestown
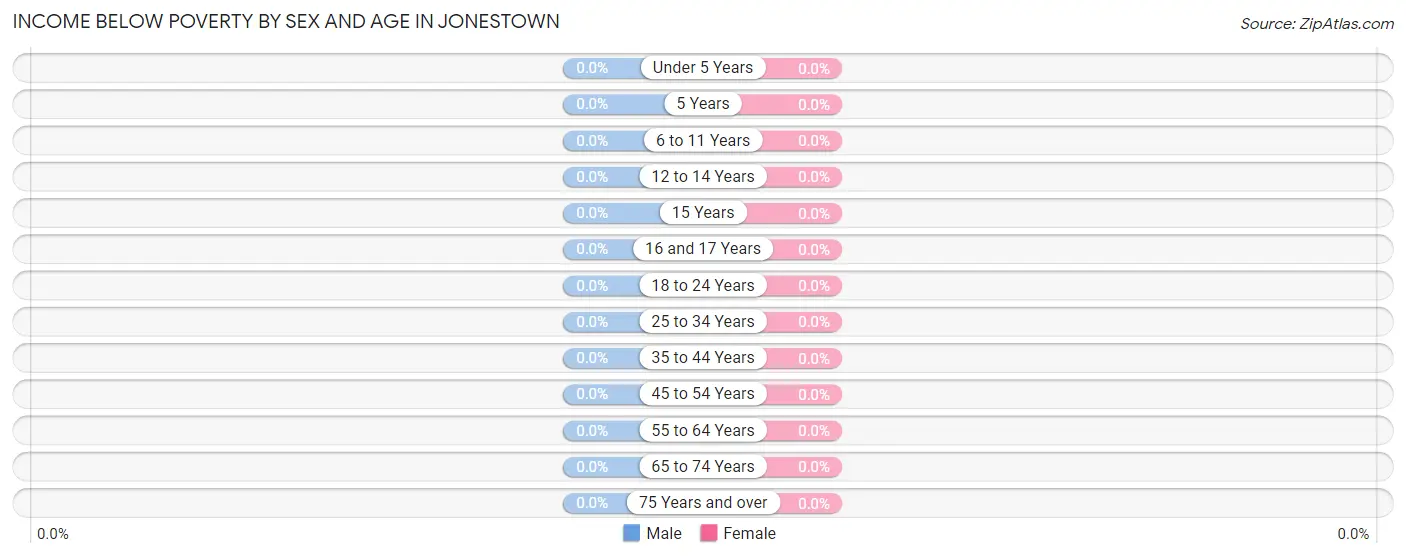
| Age Bracket | Male | Female |
| Under 5 Years | 0 (0.0%) | 0 (0.0%) |
| 5 Years | 0 (0.0%) | 0 (0.0%) |
| 6 to 11 Years | 0 (0.0%) | 0 (0.0%) |
| 12 to 14 Years | 0 (0.0%) | 0 (0.0%) |
| 15 Years | 0 (0.0%) | 0 (0.0%) |
| 16 and 17 Years | 0 (0.0%) | 0 (0.0%) |
| 18 to 24 Years | 0 (0.0%) | 0 (0.0%) |
| 25 to 34 Years | 0 (0.0%) | 0 (0.0%) |
| 35 to 44 Years | 0 (0.0%) | 0 (0.0%) |
| 45 to 54 Years | 0 (0.0%) | 0 (0.0%) |
| 55 to 64 Years | 0 (0.0%) | 0 (0.0%) |
| 65 to 74 Years | 0 (0.0%) | 0 (0.0%) |
| 75 Years and over | 0 (0.0%) | 0 (0.0%) |
| Total | 0 (0.0%) | 0 (0.0%) |
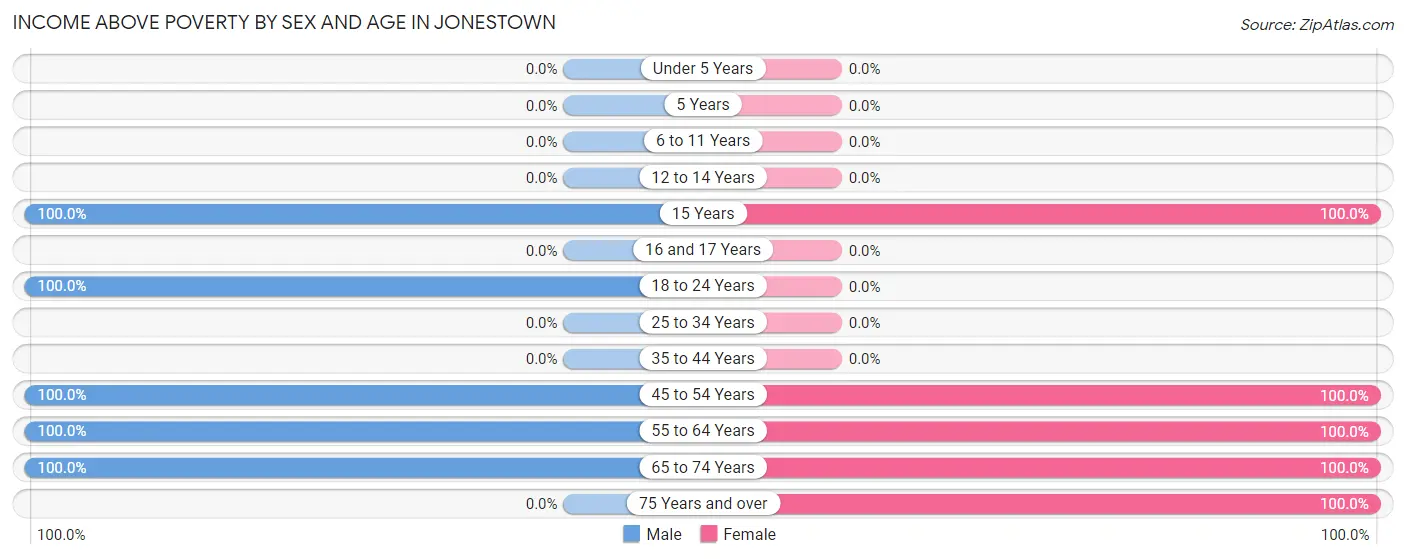
Income Above Poverty by Sex and Age in Jonestown
According to the poverty statistics in Jonestown, males aged 15 years and females aged 15 years are the age groups that are most secure financially, with 100.0% of males and 100.0% of females in these age groups living above the poverty line.
| Age Bracket | Male | Female |
| Under 5 Years | 0 (0.0%) | 0 (0.0%) |
| 5 Years | 0 (0.0%) | 0 (0.0%) |
| 6 to 11 Years | 0 (0.0%) | 0 (0.0%) |
| 12 to 14 Years | 0 (0.0%) | 0 (0.0%) |
| 15 Years | 5 (100.0%) | 6 (100.0%) |
| 16 and 17 Years | 0 (0.0%) | 0 (0.0%) |
| 18 to 24 Years | 6 (100.0%) | 0 (0.0%) |
| 25 to 34 Years | 0 (0.0%) | 0 (0.0%) |
| 35 to 44 Years | 0 (0.0%) | 0 (0.0%) |
| 45 to 54 Years | 5 (100.0%) | 8 (100.0%) |
| 55 to 64 Years | 7 (100.0%) | 9 (100.0%) |
| 65 to 74 Years | 10 (100.0%) | 6 (100.0%) |
| 75 Years and over | 0 (0.0%) | 2 (100.0%) |
| Total | 33 (100.0%) | 31 (100.0%) |
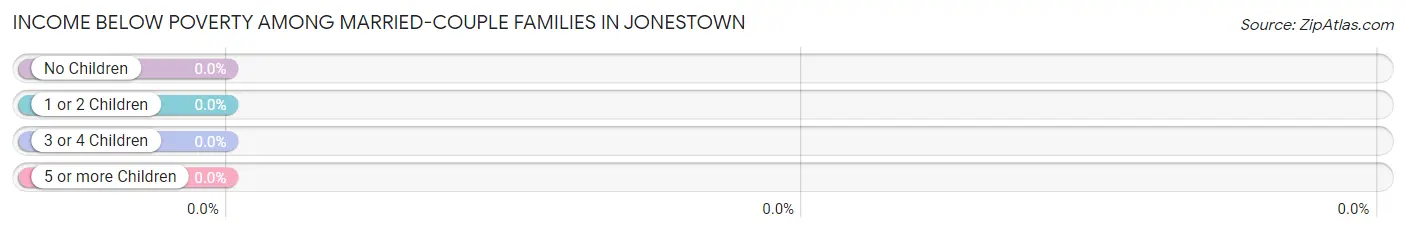
Income Below Poverty Among Married-Couple Families in Jonestown
| Children | Above Poverty | Below Poverty |
| No Children | 17 (100.0%) | 0 (0.0%) |
| 1 or 2 Children | 5 (100.0%) | 0 (0.0%) |
| 3 or 4 Children | 0 (0.0%) | 0 (0.0%) |
| 5 or more Children | 0 (0.0%) | 0 (0.0%) |
| Total | 22 (100.0%) | 0 (0.0%) |
Income Below Poverty Among Single-Parent Households in Jonestown
| Children | Single Father | Single Mother |
| No Children | 0 (0.0%) | 0 (0.0%) |
| 1 or 2 Children | 0 (0.0%) | 0 (0.0%) |
| 3 or 4 Children | 0 (0.0%) | 0 (0.0%) |
| 5 or more Children | 0 (0.0%) | 0 (0.0%) |
| Total | 0 (0.0%) | 0 (0.0%) |
Income Below Poverty Among Married-Couple vs Single-Parent Households in Jonestown
| Children | Married-Couple Families | Single-Parent Households |
| No Children | 0 (0.0%) | 0 (0.0%) |
| 1 or 2 Children | 0 (0.0%) | 0 (0.0%) |
| 3 or 4 Children | 0 (0.0%) | 0 (0.0%) |
| 5 or more Children | 0 (0.0%) | 0 (0.0%) |
| Total | 0 (0.0%) | 0 (0.0%) |
Race in Jonestown
The most populous races in Jonestown are , and White / Caucasian (64 | 100.0%).
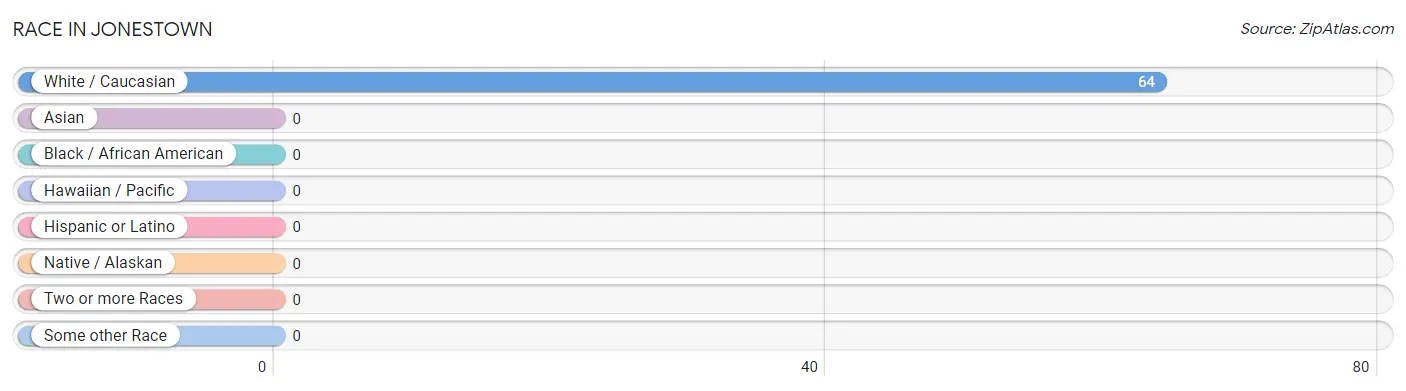
| Race | # Population | % Population |
| Asian | 0 | 0.0% |
| Black / African American | 0 | 0.0% |
| Hawaiian / Pacific | 0 | 0.0% |
| Hispanic or Latino | 0 | 0.0% |
| Native / Alaskan | 0 | 0.0% |
| White / Caucasian | 64 | 100.0% |
| Two or more Races | 0 | 0.0% |
| Some other Race | 0 | 0.0% |
| Total | 64 | 100.0% |
Ancestry in Jonestown
The most populous ancestries reported in Jonestown are German (33 | 51.6%), Ukrainian (22 | 34.4%), Italian (15 | 23.4%), English (9 | 14.1%), and Dutch (6 | 9.4%), together accounting for 132.8% of all Jonestown residents.
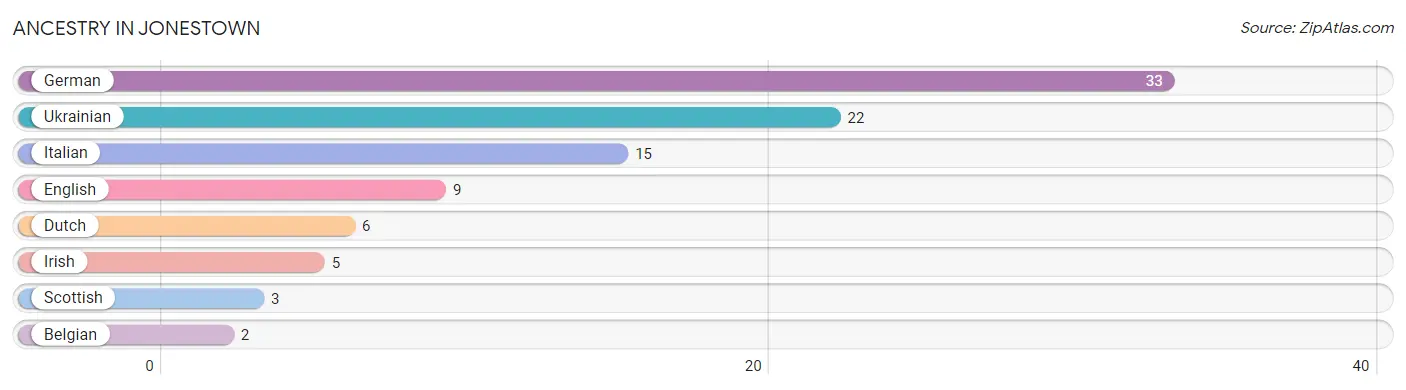
| Ancestry | # Population | % Population |
| Belgian | 2 | 3.1% |
| Dutch | 6 | 9.4% |
| English | 9 | 14.1% |
| German | 33 | 51.6% |
| Irish | 5 | 7.8% |
| Italian | 15 | 23.4% |
| Scottish | 3 | 4.7% |
| Ukrainian | 22 | 34.4% | View All 8 Rows |
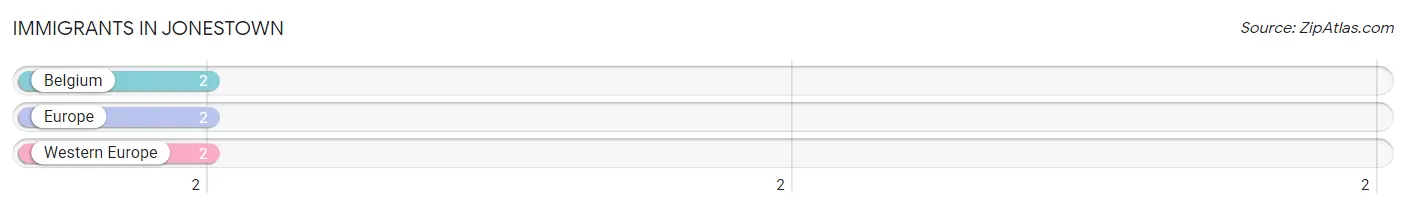
Immigrants in Jonestown
The most numerous immigrant groups reported in Jonestown came from Belgium (2 | 3.1%), Europe (2 | 3.1%), and Western Europe (2 | 3.1%), together accounting for 9.4% of all Jonestown residents.
| Immigration Origin | # Population | % Population |
| Belgium | 2 | 3.1% |
| Europe | 2 | 3.1% |
| Western Europe | 2 | 3.1% | View All 3 Rows |
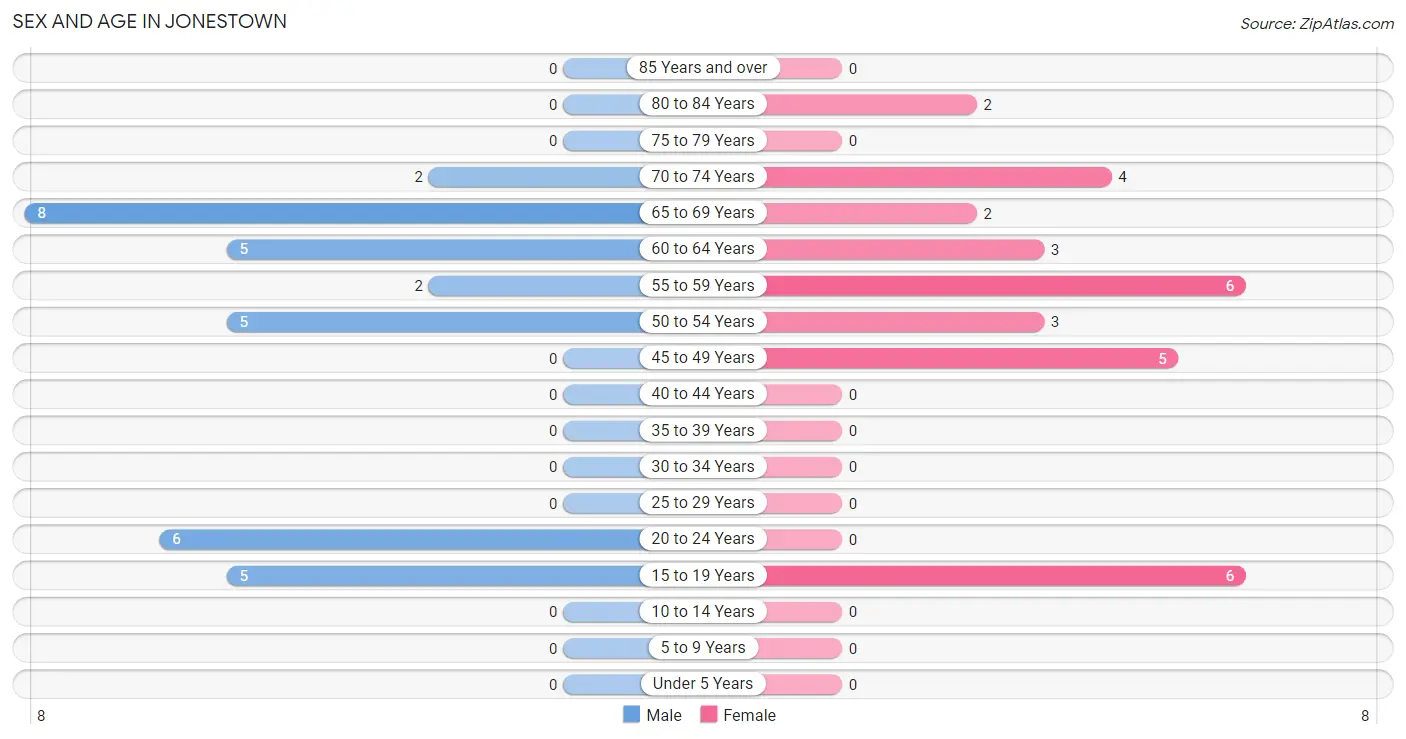
Sex and Age in Jonestown
Sex and Age in Jonestown
The most populous age groups in Jonestown are 65 to 69 Years (8 | 24.2%) for men and 15 to 19 Years (6 | 19.4%) for women.
| Age Bracket | Male | Female |
| Under 5 Years | 0 (0.0%) | 0 (0.0%) |
| 5 to 9 Years | 0 (0.0%) | 0 (0.0%) |
| 10 to 14 Years | 0 (0.0%) | 0 (0.0%) |
| 15 to 19 Years | 5 (15.1%) | 6 (19.4%) |
| 20 to 24 Years | 6 (18.2%) | 0 (0.0%) |
| 25 to 29 Years | 0 (0.0%) | 0 (0.0%) |
| 30 to 34 Years | 0 (0.0%) | 0 (0.0%) |
| 35 to 39 Years | 0 (0.0%) | 0 (0.0%) |
| 40 to 44 Years | 0 (0.0%) | 0 (0.0%) |
| 45 to 49 Years | 0 (0.0%) | 5 (16.1%) |
| 50 to 54 Years | 5 (15.1%) | 3 (9.7%) |
| 55 to 59 Years | 2 (6.1%) | 6 (19.4%) |
| 60 to 64 Years | 5 (15.1%) | 3 (9.7%) |
| 65 to 69 Years | 8 (24.2%) | 2 (6.5%) |
| 70 to 74 Years | 2 (6.1%) | 4 (12.9%) |
| 75 to 79 Years | 0 (0.0%) | 0 (0.0%) |
| 80 to 84 Years | 0 (0.0%) | 2 (6.5%) |
| 85 Years and over | 0 (0.0%) | 0 (0.0%) |
| Total | 33 (100.0%) | 31 (100.0%) |
Families and Households in Jonestown
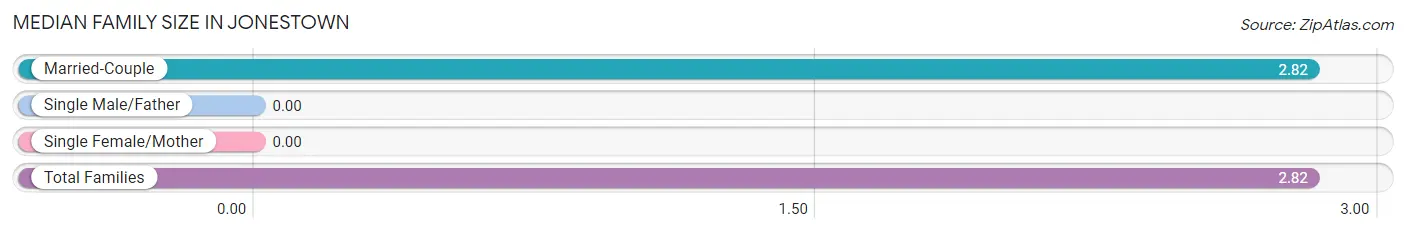
Median Family Size in Jonestown
| Family Type | # Families | Family Size |
| Married-Couple | 22 (100.0%) | 2.82 |
| Single Male/Father | 0 (0.0%) | - |
| Single Female/Mother | 0 (0.0%) | - |
| Total Families | 22 (100.0%) | 2.82 |
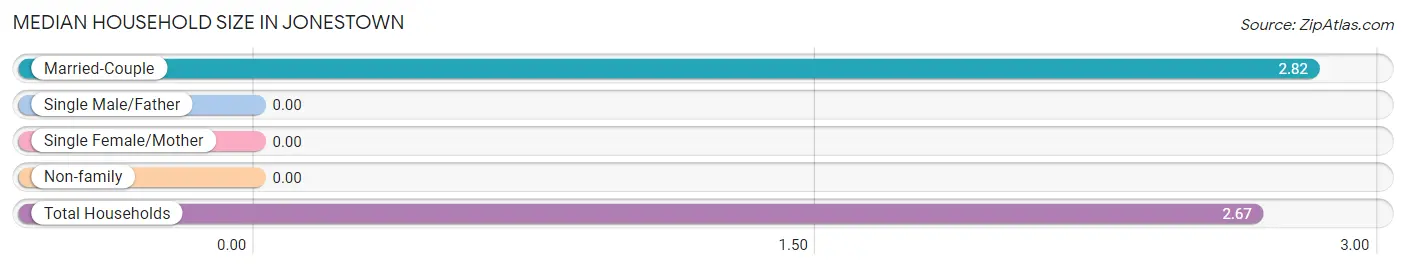
Median Household Size in Jonestown
| Household Type | # Households | Household Size |
| Married-Couple | 22 (91.7%) | 2.82 |
| Single Male/Father | 0 (0.0%) | - |
| Single Female/Mother | 0 (0.0%) | - |
| Non-family | 2 (8.3%) | - |
| Total Households | 24 (100.0%) | 2.67 |
Household Size by Marriage Status in Jonestown
Out of a total of 24 households in Jonestown, 22 (91.7%) are family households, while 2 (8.3%) are nonfamily households. The most numerous type of family households are 2-person households, comprising 17, and the most common type of nonfamily households are 1-person households, comprising 2.
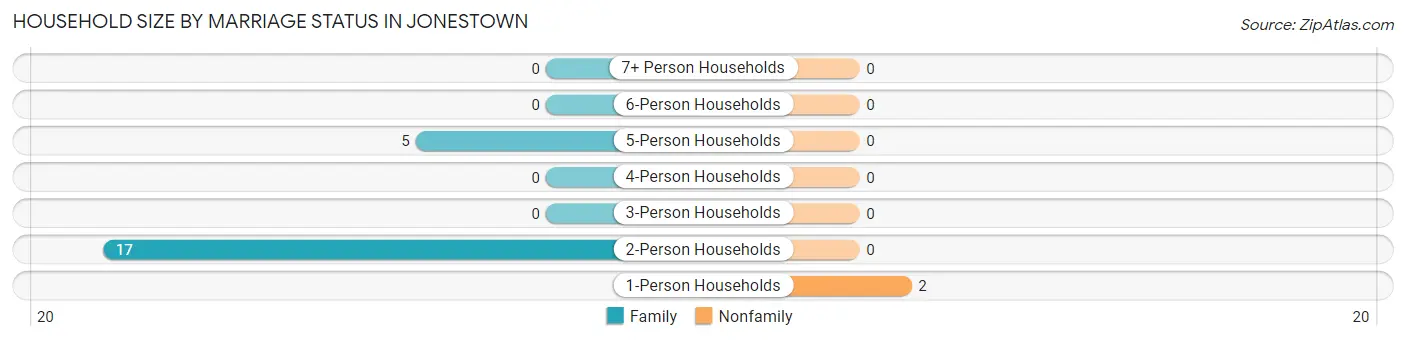
| Household Size | Family Households | Nonfamily Households |
| 1-Person Households | - | 2 (8.3%) |
| 2-Person Households | 17 (70.8%) | 0 (0.0%) |
| 3-Person Households | 0 (0.0%) | 0 (0.0%) |
| 4-Person Households | 0 (0.0%) | 0 (0.0%) |
| 5-Person Households | 5 (20.8%) | 0 (0.0%) |
| 6-Person Households | 0 (0.0%) | 0 (0.0%) |
| 7+ Person Households | 0 (0.0%) | 0 (0.0%) |
| Total | 22 (91.7%) | 2 (8.3%) |
Female Fertility in Jonestown
Fertility by Age in Jonestown
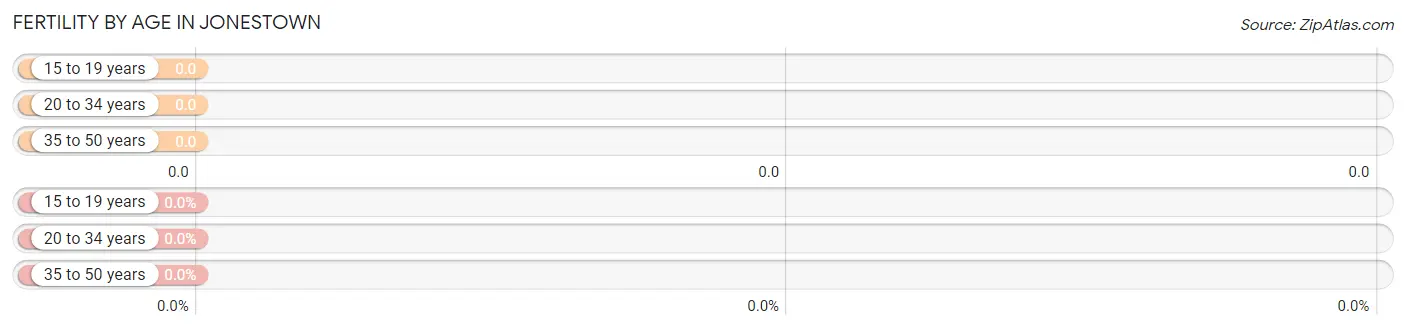
| Age Bracket | Women with Births | Births / 1,000 Women |
| 15 to 19 years | 0 (0.0%) | 0.0 |
| 20 to 34 years | 0 (0.0%) | 0.0 |
| 35 to 50 years | 0 (0.0%) | 0.0 |
| Total | 0 (0.0%) | 0.0 |
Fertility by Age by Marriage Status in Jonestown
| Age Bracket | Married | Unmarried |
| 15 to 19 years | 0 (0.0%) | 0 (0.0%) |
| 20 to 34 years | 0 (0.0%) | 0 (0.0%) |
| 35 to 50 years | 0 (0.0%) | 0 (0.0%) |
| Total | 0 (0.0%) | 0 (0.0%) |
Fertility by Education in Jonestown
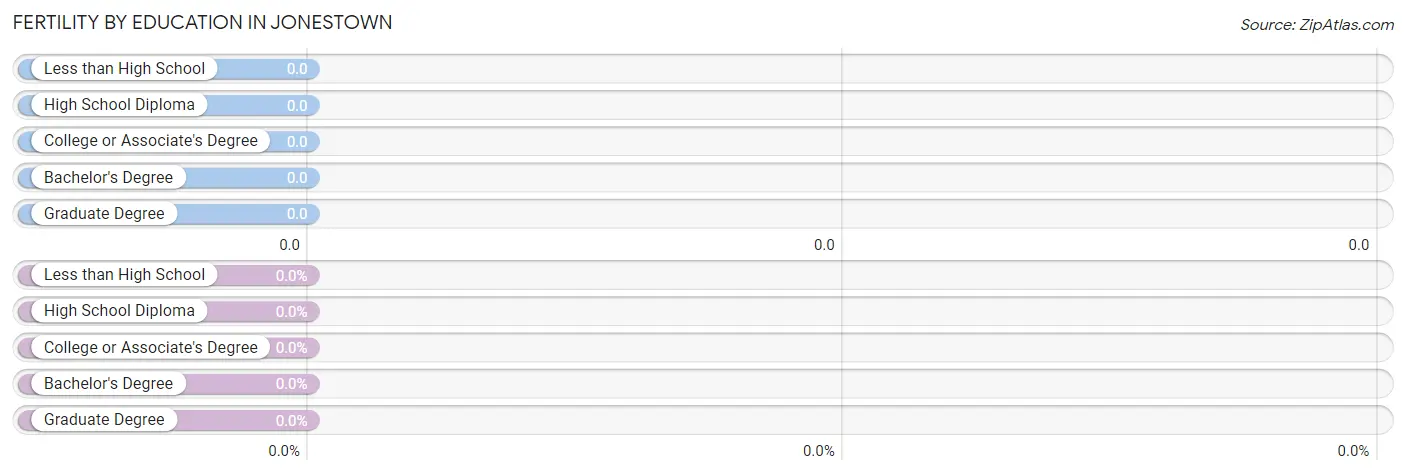
| Educational Attainment | Women with Births | Births / 1,000 Women |
| Less than High School | 0 (0.0%) | 0.0 |
| High School Diploma | 0 (0.0%) | 0.0 |
| College or Associate's Degree | 0 (0.0%) | 0.0 |
| Bachelor's Degree | 0 (0.0%) | 0.0 |
| Graduate Degree | 0 (0.0%) | 0.0 |
| Total | 0 (0.0%) | 0.0 |
Fertility by Education by Marriage Status in Jonestown
| Educational Attainment | Married | Unmarried |
| Less than High School | 0 (0.0%) | 0 (0.0%) |
| High School Diploma | 0 (0.0%) | 0 (0.0%) |
| College or Associate's Degree | 0 (0.0%) | 0 (0.0%) |
| Bachelor's Degree | 0 (0.0%) | 0 (0.0%) |
| Graduate Degree | 0 (0.0%) | 0 (0.0%) |
| Total | 0 (0.0%) | 0 (0.0%) |
Employment Characteristics in Jonestown
Employment by Class of Employer in Jonestown
Among the 18 employed individuals in Jonestown, private company employees (7 | 38.9%), federal government employees (6 | 33.3%), and self-employed (not incorporated) (5 | 27.8%) make up the most common classes of employment.
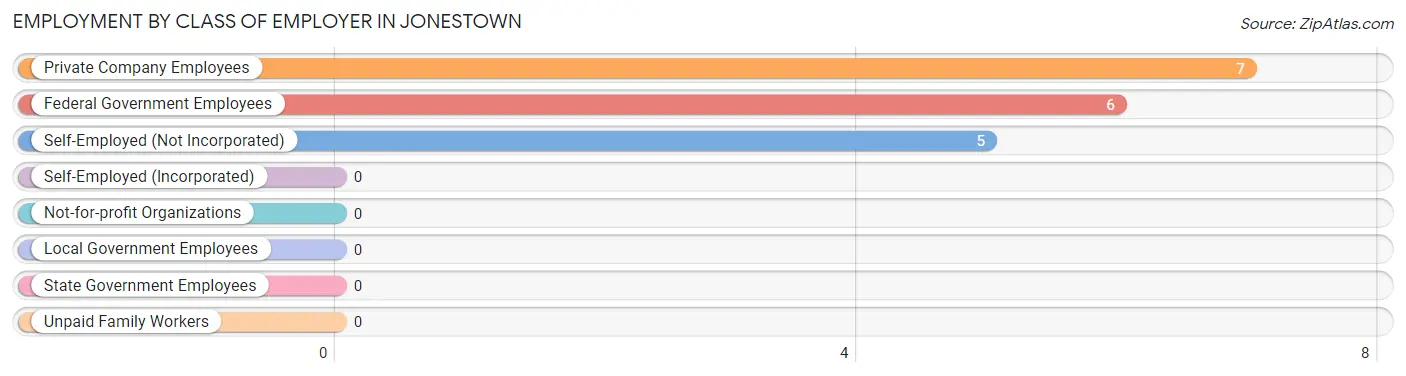
| Employer Class | # Employees | % Employees |
| Private Company Employees | 7 | 38.9% |
| Self-Employed (Incorporated) | 0 | 0.0% |
| Self-Employed (Not Incorporated) | 5 | 27.8% |
| Not-for-profit Organizations | 0 | 0.0% |
| Local Government Employees | 0 | 0.0% |
| State Government Employees | 0 | 0.0% |
| Federal Government Employees | 6 | 33.3% |
| Unpaid Family Workers | 0 | 0.0% |
| Total | 18 | 100.0% |
Employment Status by Age in Jonestown
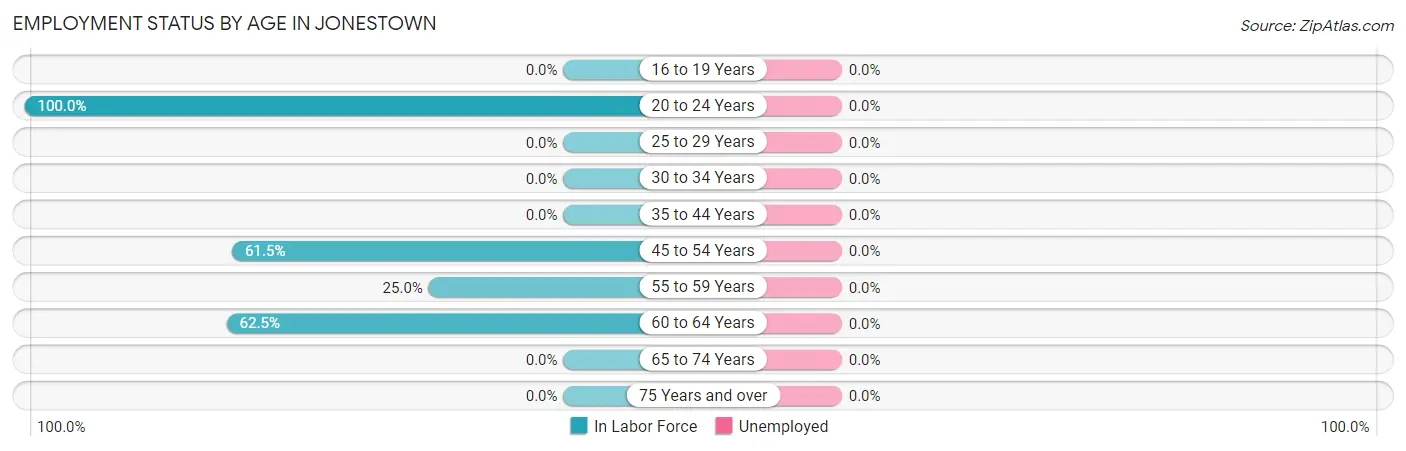
| Age Bracket | In Labor Force | Unemployed |
| 16 to 19 Years | 0 (0.0%) | 0 (0.0%) |
| 20 to 24 Years | 6 (100.0%) | 0 (0.0%) |
| 25 to 29 Years | 0 (0.0%) | 0 (0.0%) |
| 30 to 34 Years | 0 (0.0%) | 0 (0.0%) |
| 35 to 44 Years | 0 (0.0%) | 0 (0.0%) |
| 45 to 54 Years | 8 (61.5%) | 0 (0.0%) |
| 55 to 59 Years | 2 (25.0%) | 0 (0.0%) |
| 60 to 64 Years | 5 (62.5%) | 0 (0.0%) |
| 65 to 74 Years | 0 (0.0%) | 0 (0.0%) |
| 75 Years and over | 0 (0.0%) | 0 (0.0%) |
| Total | 21 (39.6%) | 0 (0.0%) |
Employment Status by Educational Attainment in Jonestown
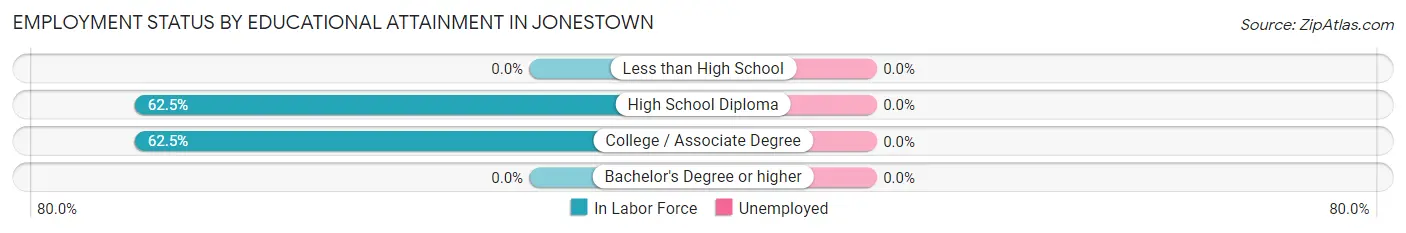
| Educational Attainment | In Labor Force | Unemployed |
| Less than High School | 0 (0.0%) | 0 (0.0%) |
| High School Diploma | 10 (62.5%) | 0 (0.0%) |
| College / Associate Degree | 5 (62.5%) | 0 (0.0%) |
| Bachelor's Degree or higher | 0 (0.0%) | 0 (0.0%) |
| Total | 15 (51.7%) | 0 (0.0%) |
Employment Occupations by Sex in Jonestown
Management, Business, Science and Arts Occupations
The most common Management, Business, Science and Arts occupations in Jonestown are , and Management (10 | 47.6%).
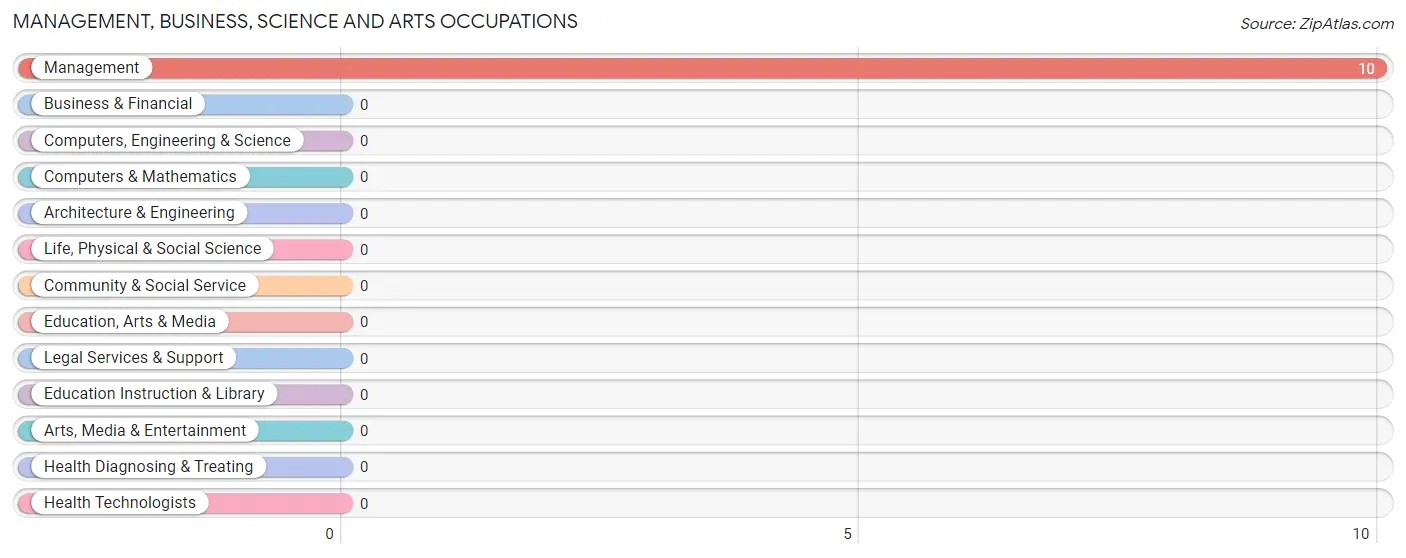
Management, Business, Science and Arts Occupations by Sex
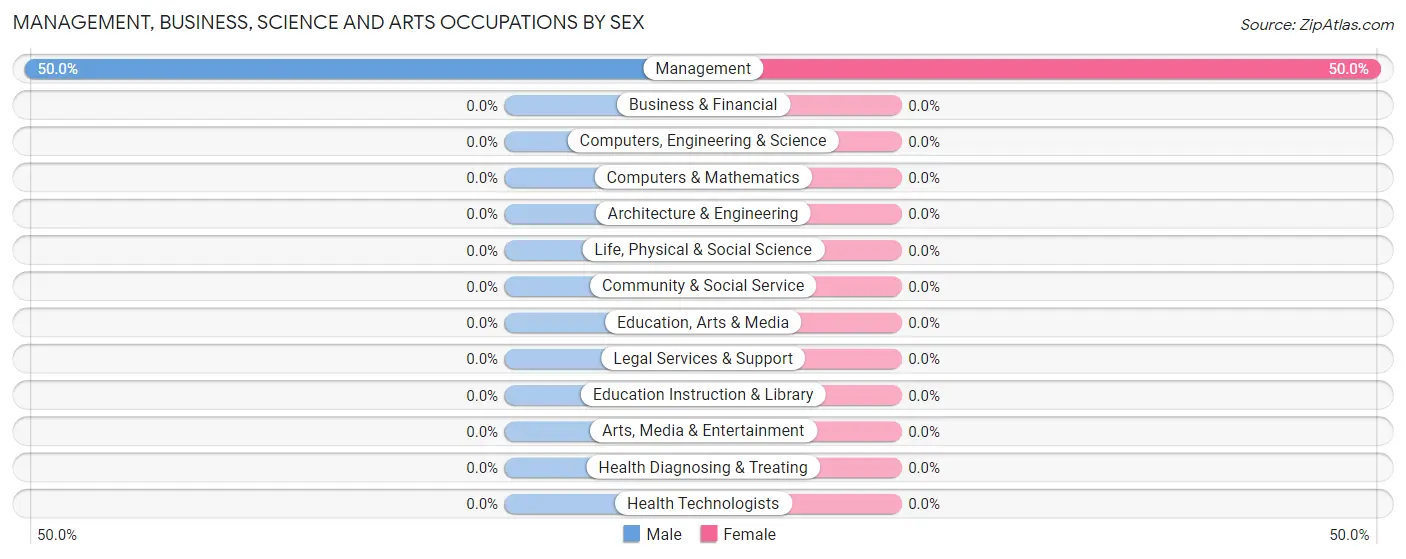
| Occupation | Male | Female |
| Management | 5 (50.0%) | 5 (50.0%) |
| Business & Financial | 0 (0.0%) | 0 (0.0%) |
| Computers, Engineering & Science | 0 (0.0%) | 0 (0.0%) |
| Computers & Mathematics | 0 (0.0%) | 0 (0.0%) |
| Architecture & Engineering | 0 (0.0%) | 0 (0.0%) |
| Life, Physical & Social Science | 0 (0.0%) | 0 (0.0%) |
| Community & Social Service | 0 (0.0%) | 0 (0.0%) |
| Education, Arts & Media | 0 (0.0%) | 0 (0.0%) |
| Legal Services & Support | 0 (0.0%) | 0 (0.0%) |
| Education Instruction & Library | 0 (0.0%) | 0 (0.0%) |
| Arts, Media & Entertainment | 0 (0.0%) | 0 (0.0%) |
| Health Diagnosing & Treating | 0 (0.0%) | 0 (0.0%) |
| Health Technologists | 0 (0.0%) | 0 (0.0%) |
| Total (Category) | 5 (50.0%) | 5 (50.0%) |
| Total (Overall) | 13 (61.9%) | 8 (38.1%) |
Services Occupations
The most common Services occupations in Jonestown are , and Healthcare Support (3 | 14.3%).
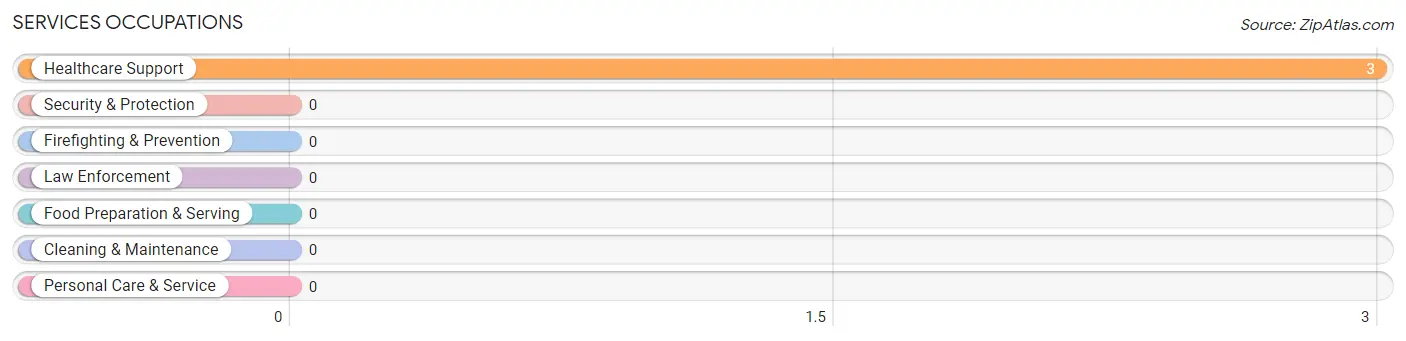
Services Occupations by Sex
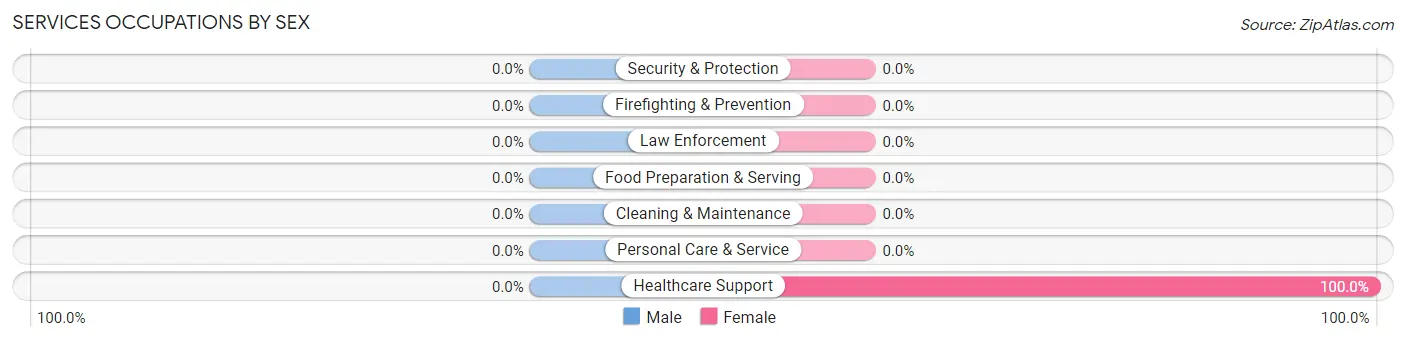
| Occupation | Male | Female |
| Healthcare Support | 0 (0.0%) | 3 (100.0%) |
| Security & Protection | 0 (0.0%) | 0 (0.0%) |
| Firefighting & Prevention | 0 (0.0%) | 0 (0.0%) |
| Law Enforcement | 0 (0.0%) | 0 (0.0%) |
| Food Preparation & Serving | 0 (0.0%) | 0 (0.0%) |
| Cleaning & Maintenance | 0 (0.0%) | 0 (0.0%) |
| Personal Care & Service | 0 (0.0%) | 0 (0.0%) |
| Total (Category) | 0 (0.0%) | 3 (100.0%) |
| Total (Overall) | 13 (61.9%) | 8 (38.1%) |
Sales and Office Occupations
Sales and Office Occupations by Sex
| Occupation | Male | Female |
| Sales & Related | 0 (0.0%) | 0 (0.0%) |
| Office & Administration | 0 (0.0%) | 0 (0.0%) |
| Total (Category) | 0 (0.0%) | 0 (0.0%) |
| Total (Overall) | 13 (61.9%) | 8 (38.1%) |
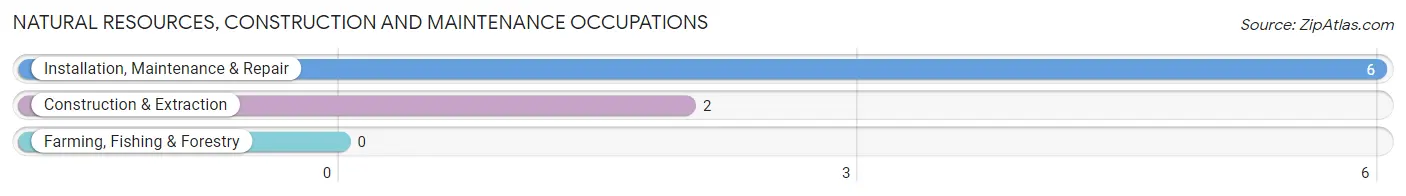
Natural Resources, Construction and Maintenance Occupations
The most common Natural Resources, Construction and Maintenance occupations in Jonestown are Installation, Maintenance & Repair (6 | 28.6%), and Construction & Extraction (2 | 9.5%).
Natural Resources, Construction and Maintenance Occupations by Sex
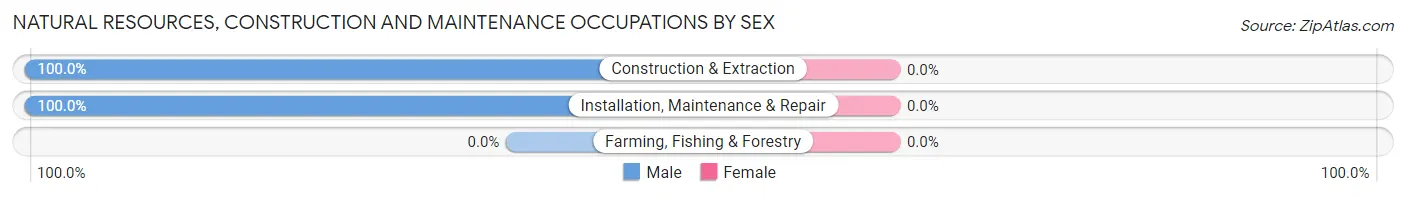
| Occupation | Male | Female |
| Farming, Fishing & Forestry | 0 (0.0%) | 0 (0.0%) |
| Construction & Extraction | 2 (100.0%) | 0 (0.0%) |
| Installation, Maintenance & Repair | 6 (100.0%) | 0 (0.0%) |
| Total (Category) | 8 (100.0%) | 0 (0.0%) |
| Total (Overall) | 13 (61.9%) | 8 (38.1%) |
Production, Transportation and Moving Occupations
Production, Transportation and Moving Occupations by Sex
| Occupation | Male | Female |
| Production | 0 (0.0%) | 0 (0.0%) |
| Transportation | 0 (0.0%) | 0 (0.0%) |
| Material Moving | 0 (0.0%) | 0 (0.0%) |
| Total (Category) | 0 (0.0%) | 0 (0.0%) |
| Total (Overall) | 13 (61.9%) | 8 (38.1%) |
Employment Industries by Sex in Jonestown
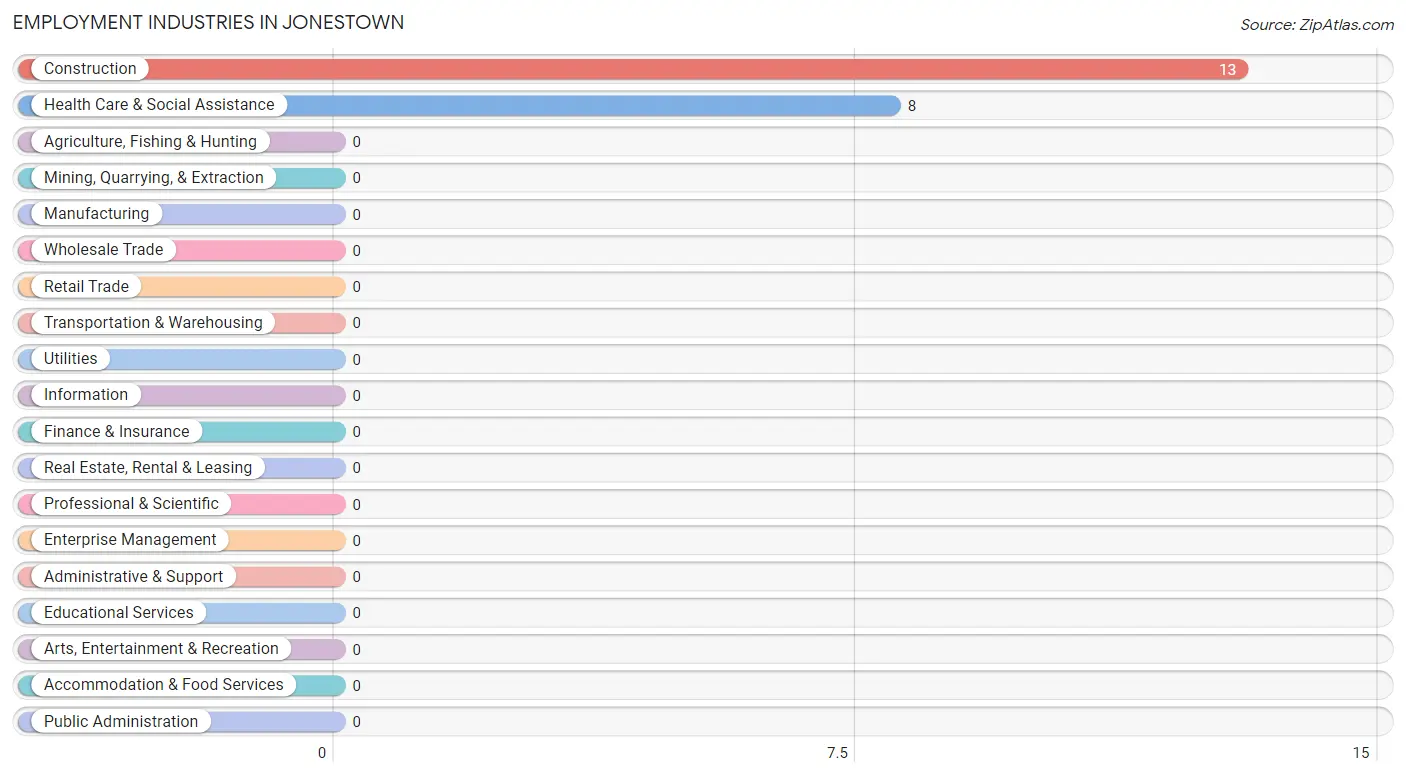
Employment Industries in Jonestown
The major employment industries in Jonestown include Construction (13 | 61.9%), and Health Care & Social Assistance (8 | 38.1%).
Employment Industries by Sex in Jonestown
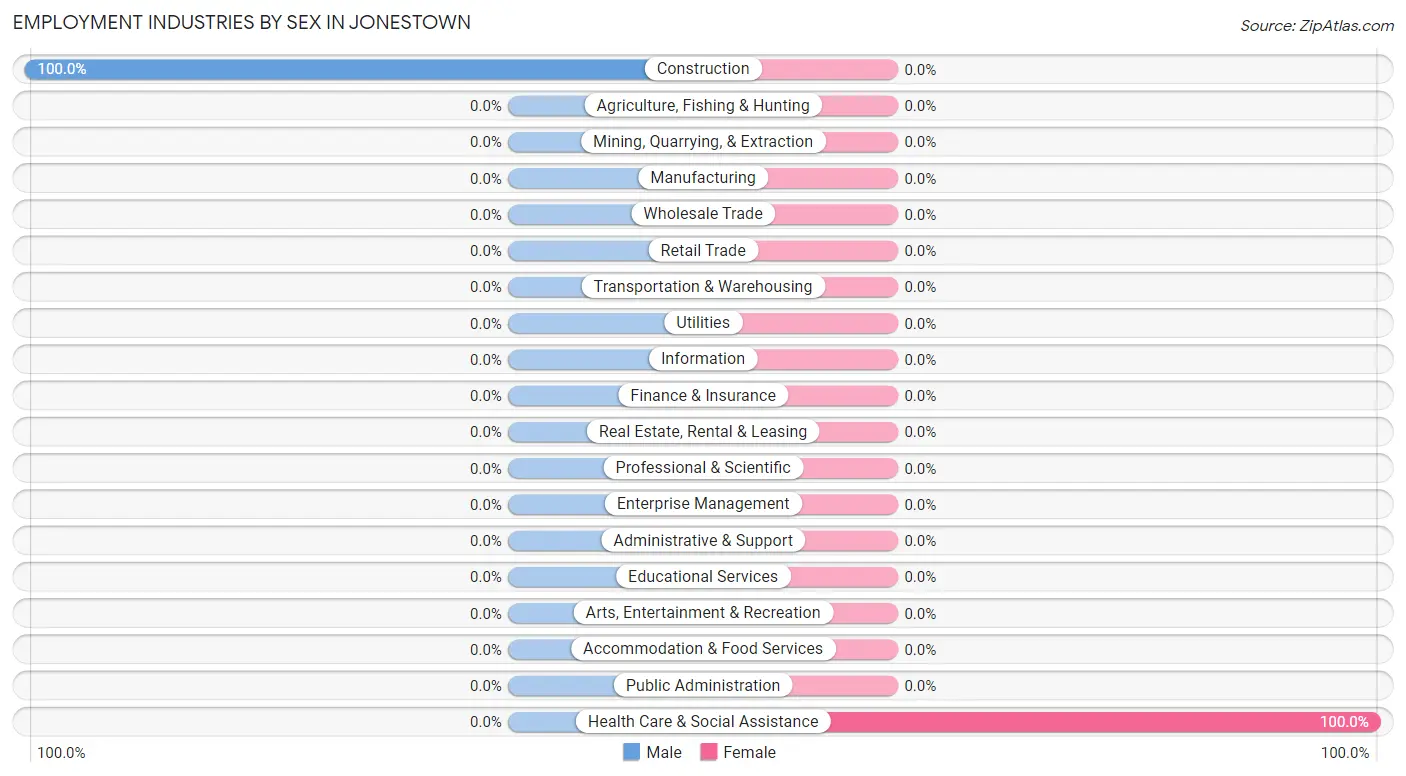
| Industry | Male | Female |
| Agriculture, Fishing & Hunting | 0 (0.0%) | 0 (0.0%) |
| Mining, Quarrying, & Extraction | 0 (0.0%) | 0 (0.0%) |
| Construction | 13 (100.0%) | 0 (0.0%) |
| Manufacturing | 0 (0.0%) | 0 (0.0%) |
| Wholesale Trade | 0 (0.0%) | 0 (0.0%) |
| Retail Trade | 0 (0.0%) | 0 (0.0%) |
| Transportation & Warehousing | 0 (0.0%) | 0 (0.0%) |
| Utilities | 0 (0.0%) | 0 (0.0%) |
| Information | 0 (0.0%) | 0 (0.0%) |
| Finance & Insurance | 0 (0.0%) | 0 (0.0%) |
| Real Estate, Rental & Leasing | 0 (0.0%) | 0 (0.0%) |
| Professional & Scientific | 0 (0.0%) | 0 (0.0%) |
| Enterprise Management | 0 (0.0%) | 0 (0.0%) |
| Administrative & Support | 0 (0.0%) | 0 (0.0%) |
| Educational Services | 0 (0.0%) | 0 (0.0%) |
| Health Care & Social Assistance | 0 (0.0%) | 8 (100.0%) |
| Arts, Entertainment & Recreation | 0 (0.0%) | 0 (0.0%) |
| Accommodation & Food Services | 0 (0.0%) | 0 (0.0%) |
| Public Administration | 0 (0.0%) | 0 (0.0%) |
| Total | 13 (61.9%) | 8 (38.1%) |
Education in Jonestown
School Enrollment in Jonestown
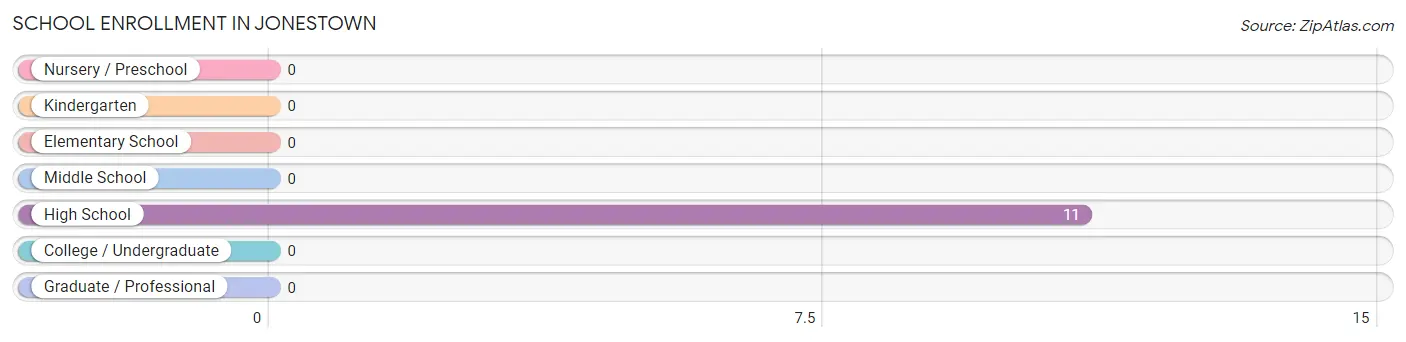
| School Level | # Students | % Students |
| Nursery / Preschool | 0 | 0.0% |
| Kindergarten | 0 | 0.0% |
| Elementary School | 0 | 0.0% |
| Middle School | 0 | 0.0% |
| High School | 11 | 100.0% |
| College / Undergraduate | 0 | 0.0% |
| Graduate / Professional | 0 | 0.0% |
| Total | 11 | 100.0% |
School Enrollment by Age by Funding Source in Jonestown
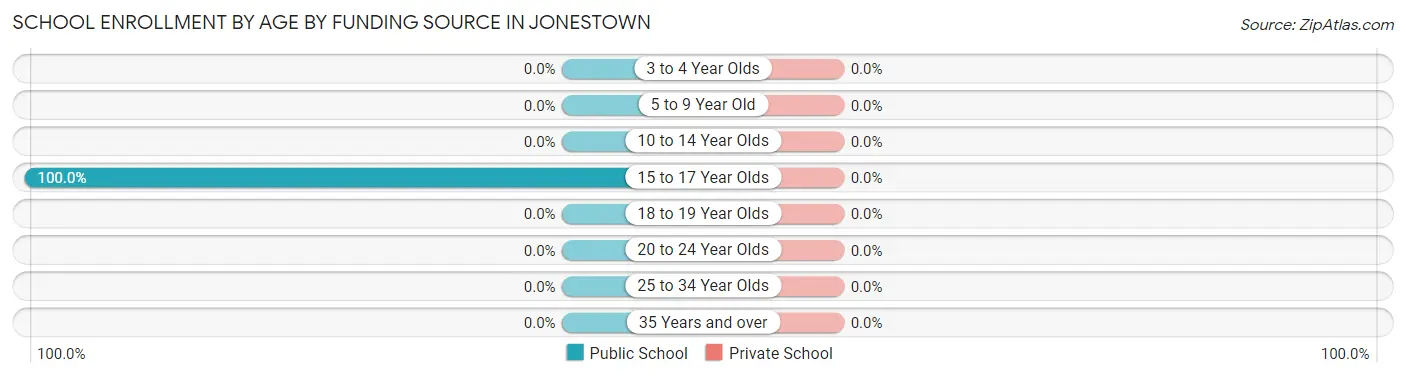
| Age Bracket | Public School | Private School |
| 3 to 4 Year Olds | 0 (0.0%) | 0 (0.0%) |
| 5 to 9 Year Old | 0 (0.0%) | 0 (0.0%) |
| 10 to 14 Year Olds | 0 (0.0%) | 0 (0.0%) |
| 15 to 17 Year Olds | 11 (100.0%) | 0 (0.0%) |
| 18 to 19 Year Olds | 0 (0.0%) | 0 (0.0%) |
| 20 to 24 Year Olds | 0 (0.0%) | 0 (0.0%) |
| 25 to 34 Year Olds | 0 (0.0%) | 0 (0.0%) |
| 35 Years and over | 0 (0.0%) | 0 (0.0%) |
| Total | 11 (100.0%) | 0 (0.0%) |
Educational Attainment by Field of Study in Jonestown
Education (2 | 50.0%), and visual & performing arts (2 | 50.0%) are the most common fields of study among 4 individuals in Jonestown who have obtained a bachelor's degree or higher.
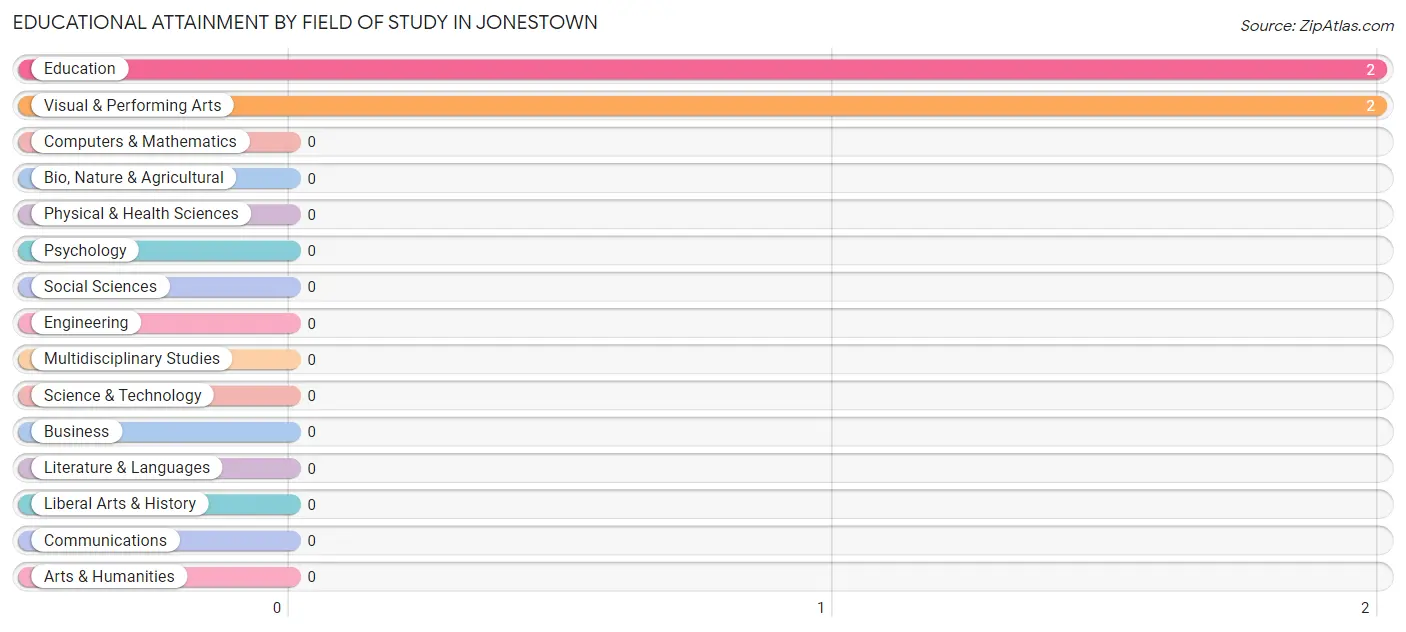
| Field of Study | # Graduates | % Graduates |
| Computers & Mathematics | 0 | 0.0% |
| Bio, Nature & Agricultural | 0 | 0.0% |
| Physical & Health Sciences | 0 | 0.0% |
| Psychology | 0 | 0.0% |
| Social Sciences | 0 | 0.0% |
| Engineering | 0 | 0.0% |
| Multidisciplinary Studies | 0 | 0.0% |
| Science & Technology | 0 | 0.0% |
| Business | 0 | 0.0% |
| Education | 2 | 50.0% |
| Literature & Languages | 0 | 0.0% |
| Liberal Arts & History | 0 | 0.0% |
| Visual & Performing Arts | 2 | 50.0% |
| Communications | 0 | 0.0% |
| Arts & Humanities | 0 | 0.0% |
| Total | 4 | 100.0% |
Transportation & Commute in Jonestown
Vehicle Availability by Sex in Jonestown
The most prevalent vehicle ownership categories in Jonestown are males with 3 vehicles (13, accounting for 100.0%) and females with 3 vehicles (5, making up 260.0%).
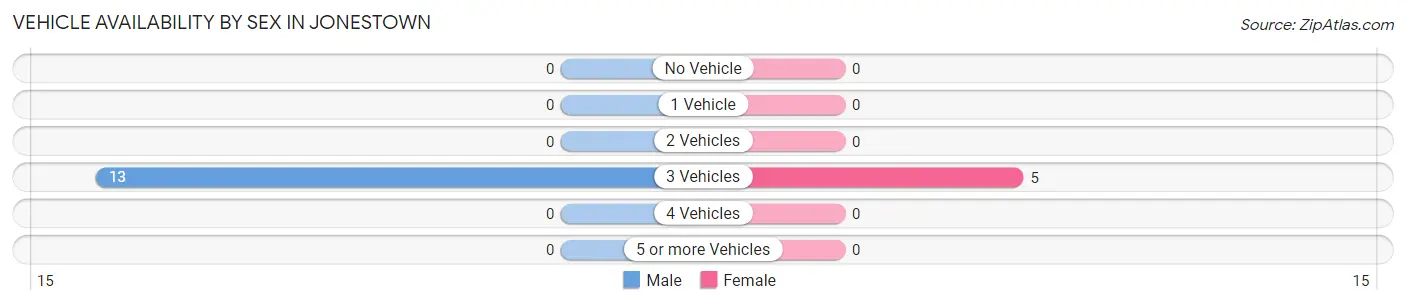
| Vehicles Available | Male | Female |
| No Vehicle | 0 (0.0%) | 0 (0.0%) |
| 1 Vehicle | 0 (0.0%) | 0 (0.0%) |
| 2 Vehicles | 0 (0.0%) | 0 (0.0%) |
| 3 Vehicles | 13 (100.0%) | 5 (100.0%) |
| 4 Vehicles | 0 (0.0%) | 0 (0.0%) |
| 5 or more Vehicles | 0 (0.0%) | 0 (0.0%) |
| Total | 13 (100.0%) | 5 (100.0%) |
Commute Time in Jonestown
The most frequently occuring commute durations in Jonestown are 20 to 24 minutes (11 commuters, 61.1%), 25 to 29 minutes (5 commuters, 27.8%), and 90 or more minutes (2 commuters, 11.1%).
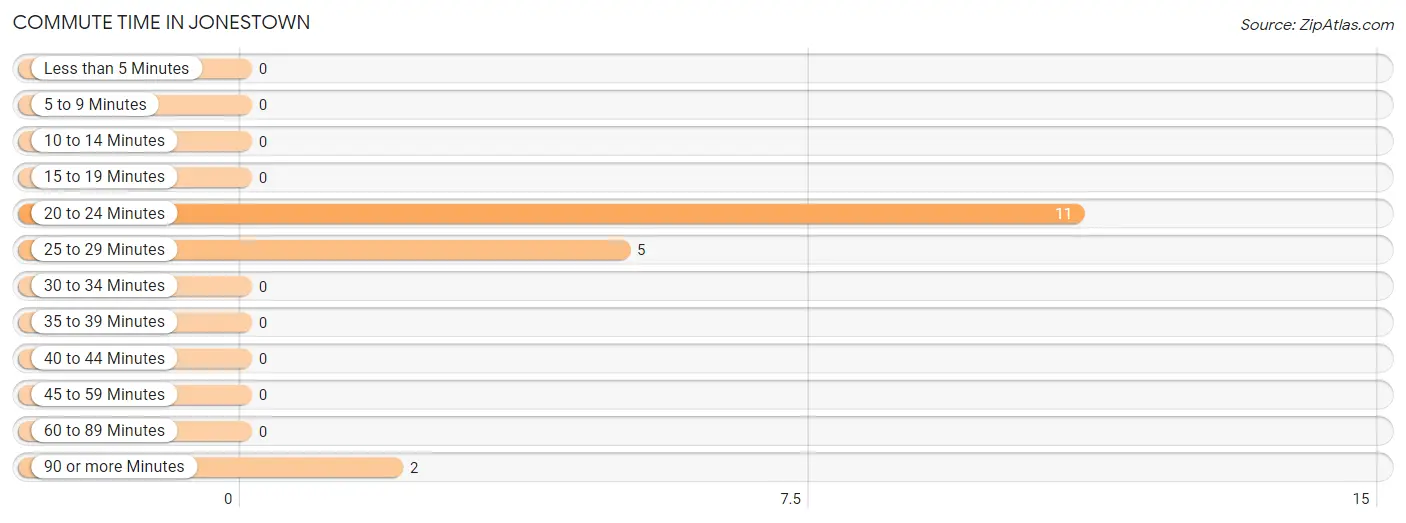
| Commute Time | # Commuters | % Commuters |
| Less than 5 Minutes | 0 | 0.0% |
| 5 to 9 Minutes | 0 | 0.0% |
| 10 to 14 Minutes | 0 | 0.0% |
| 15 to 19 Minutes | 0 | 0.0% |
| 20 to 24 Minutes | 11 | 61.1% |
| 25 to 29 Minutes | 5 | 27.8% |
| 30 to 34 Minutes | 0 | 0.0% |
| 35 to 39 Minutes | 0 | 0.0% |
| 40 to 44 Minutes | 0 | 0.0% |
| 45 to 59 Minutes | 0 | 0.0% |
| 60 to 89 Minutes | 0 | 0.0% |
| 90 or more Minutes | 2 | 11.1% |
Commute Time by Sex in Jonestown
The most common commute times in Jonestown are 20 to 24 minutes (11 commuters, 84.6%) for males and 25 to 29 minutes (5 commuters, 100.0%) for females.
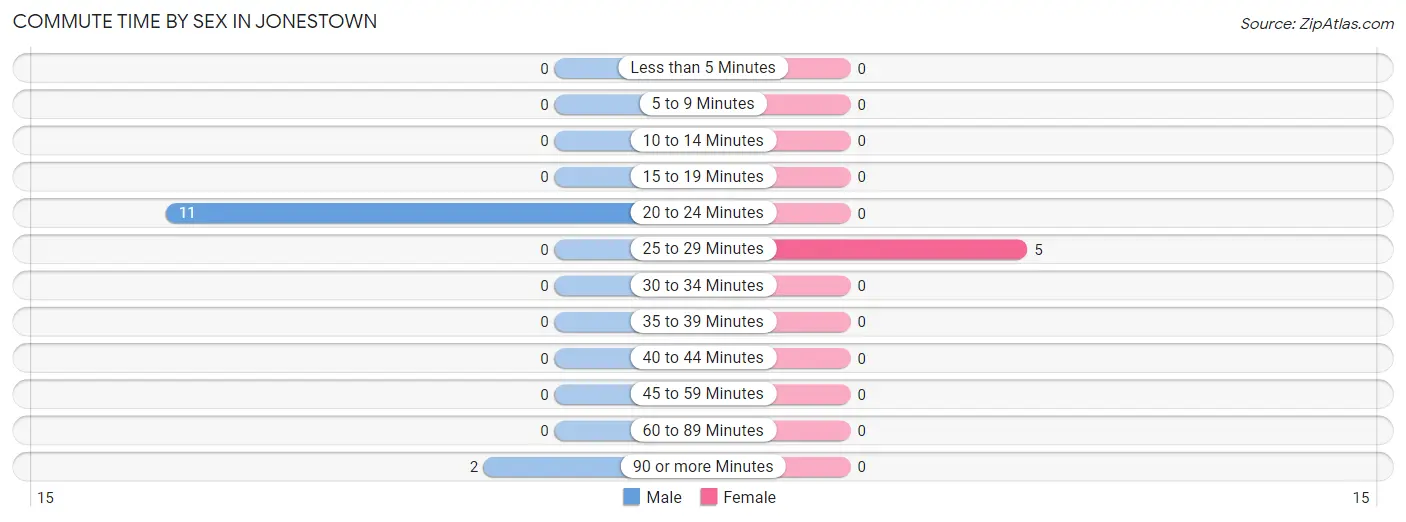
| Commute Time | Male | Female |
| Less than 5 Minutes | 0 (0.0%) | 0 (0.0%) |
| 5 to 9 Minutes | 0 (0.0%) | 0 (0.0%) |
| 10 to 14 Minutes | 0 (0.0%) | 0 (0.0%) |
| 15 to 19 Minutes | 0 (0.0%) | 0 (0.0%) |
| 20 to 24 Minutes | 11 (84.6%) | 0 (0.0%) |
| 25 to 29 Minutes | 0 (0.0%) | 5 (100.0%) |
| 30 to 34 Minutes | 0 (0.0%) | 0 (0.0%) |
| 35 to 39 Minutes | 0 (0.0%) | 0 (0.0%) |
| 40 to 44 Minutes | 0 (0.0%) | 0 (0.0%) |
| 45 to 59 Minutes | 0 (0.0%) | 0 (0.0%) |
| 60 to 89 Minutes | 0 (0.0%) | 0 (0.0%) |
| 90 or more Minutes | 2 (15.4%) | 0 (0.0%) |
Time of Departure to Work by Sex in Jonestown
The most frequent times of departure to work in Jonestown are 4:00 PM to 11:59 PM (6, 46.2%) for males and 7:30 AM to 7:59 AM (5, 100.0%) for females.
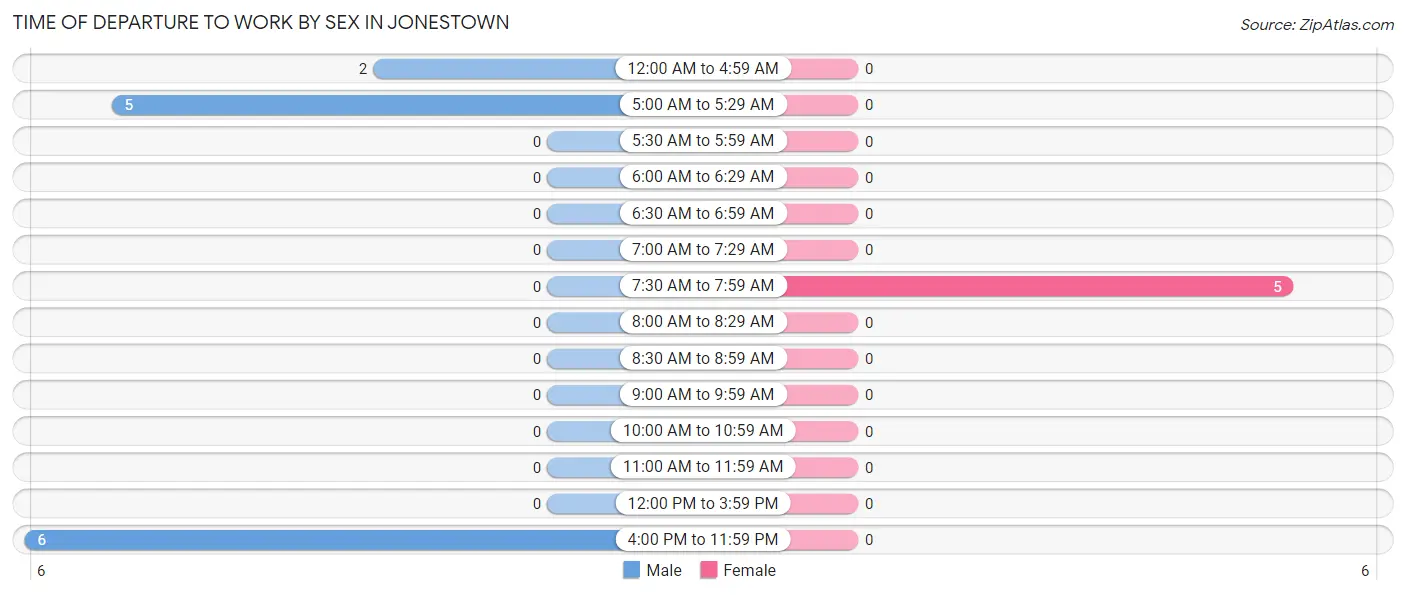
| Time of Departure | Male | Female |
| 12:00 AM to 4:59 AM | 2 (15.4%) | 0 (0.0%) |
| 5:00 AM to 5:29 AM | 5 (38.5%) | 0 (0.0%) |
| 5:30 AM to 5:59 AM | 0 (0.0%) | 0 (0.0%) |
| 6:00 AM to 6:29 AM | 0 (0.0%) | 0 (0.0%) |
| 6:30 AM to 6:59 AM | 0 (0.0%) | 0 (0.0%) |
| 7:00 AM to 7:29 AM | 0 (0.0%) | 0 (0.0%) |
| 7:30 AM to 7:59 AM | 0 (0.0%) | 5 (100.0%) |
| 8:00 AM to 8:29 AM | 0 (0.0%) | 0 (0.0%) |
| 8:30 AM to 8:59 AM | 0 (0.0%) | 0 (0.0%) |
| 9:00 AM to 9:59 AM | 0 (0.0%) | 0 (0.0%) |
| 10:00 AM to 10:59 AM | 0 (0.0%) | 0 (0.0%) |
| 11:00 AM to 11:59 AM | 0 (0.0%) | 0 (0.0%) |
| 12:00 PM to 3:59 PM | 0 (0.0%) | 0 (0.0%) |
| 4:00 PM to 11:59 PM | 6 (46.2%) | 0 (0.0%) |
| Total | 13 (100.0%) | 5 (100.0%) |
Housing Occupancy in Jonestown
Occupancy by Ownership in Jonestown
Of the total 24 dwellings in Jonestown, owner-occupied units account for 24 (100.0%), while renter-occupied units make up 0 (0.0%).
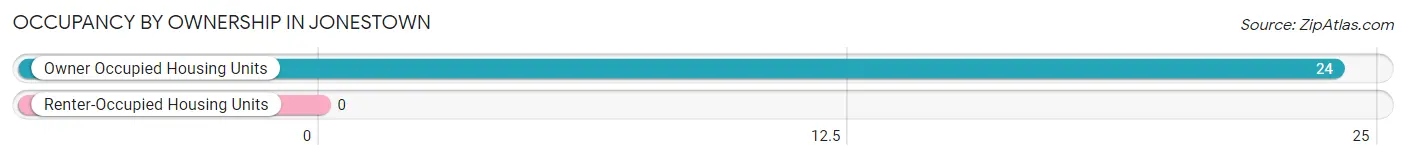
| Occupancy | # Housing Units | % Housing Units |
| Owner Occupied Housing Units | 24 | 100.0% |
| Renter-Occupied Housing Units | 0 | 0.0% |
| Total Occupied Housing Units | 24 | 100.0% |
Occupancy by Household Size in Jonestown
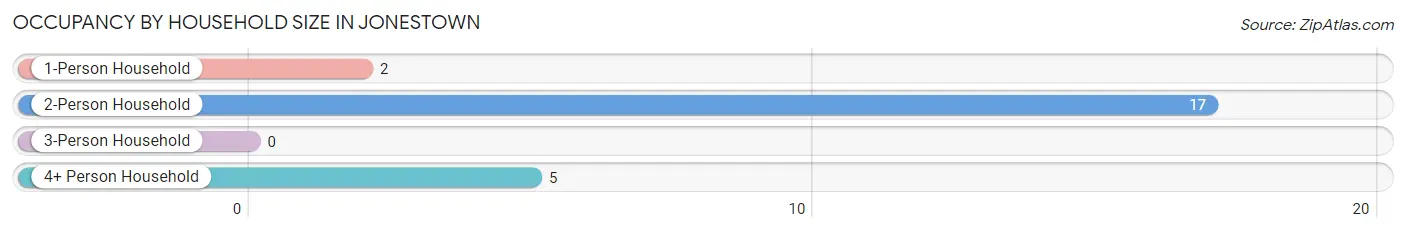
| Household Size | # Housing Units | % Housing Units |
| 1-Person Household | 2 | 8.3% |
| 2-Person Household | 17 | 70.8% |
| 3-Person Household | 0 | 0.0% |
| 4+ Person Household | 5 | 20.8% |
| Total Housing Units | 24 | 100.0% |
Occupancy by Ownership by Household Size in Jonestown
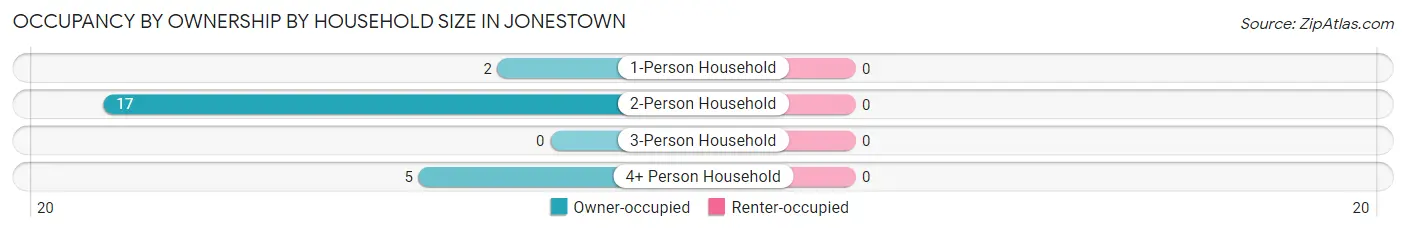
| Household Size | Owner-occupied | Renter-occupied |
| 1-Person Household | 2 (100.0%) | 0 (0.0%) |
| 2-Person Household | 17 (100.0%) | 0 (0.0%) |
| 3-Person Household | 0 (0.0%) | 0 (0.0%) |
| 4+ Person Household | 5 (100.0%) | 0 (0.0%) |
| Total Housing Units | 24 (100.0%) | 0 (0.0%) |
Occupancy by Educational Attainment in Jonestown
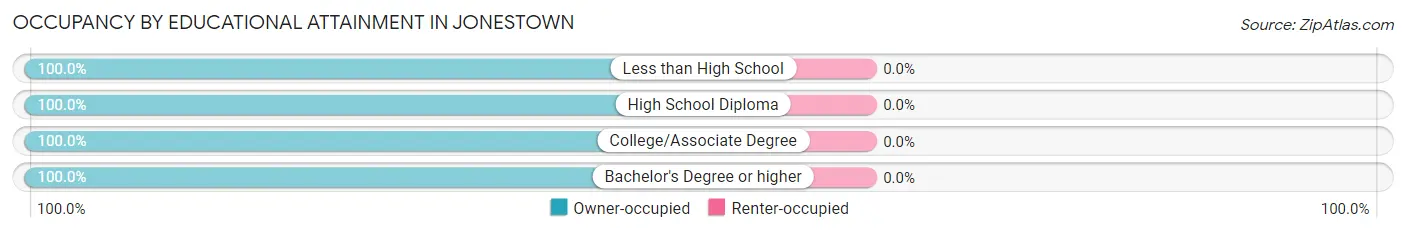
| Household Size | Owner-occupied | Renter-occupied |
| Less than High School | 5 (100.0%) | 0 (0.0%) |
| High School Diploma | 12 (100.0%) | 0 (0.0%) |
| College/Associate Degree | 5 (100.0%) | 0 (0.0%) |
| Bachelor's Degree or higher | 2 (100.0%) | 0 (0.0%) |
Occupancy by Age of Householder in Jonestown
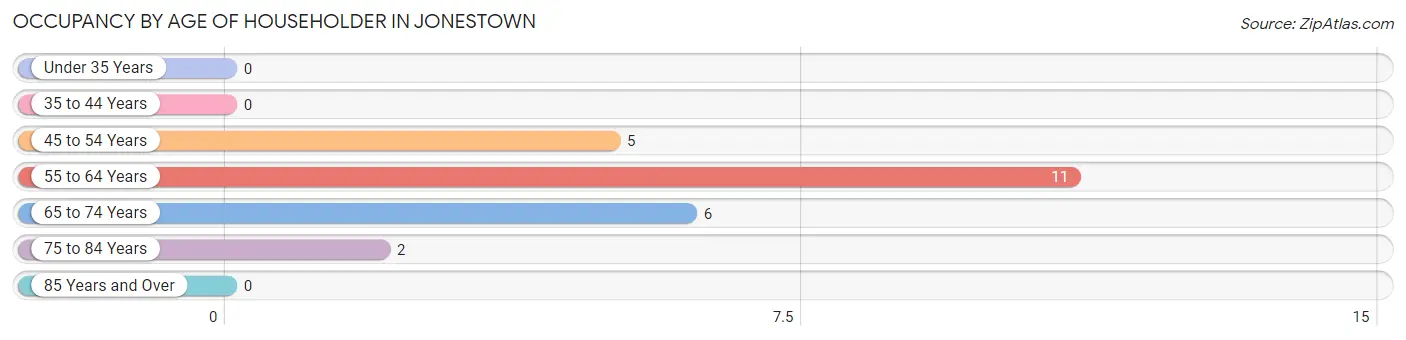
| Age Bracket | # Households | % Households |
| Under 35 Years | 0 | 0.0% |
| 35 to 44 Years | 0 | 0.0% |
| 45 to 54 Years | 5 | 20.8% |
| 55 to 64 Years | 11 | 45.8% |
| 65 to 74 Years | 6 | 25.0% |
| 75 to 84 Years | 2 | 8.3% |
| 85 Years and Over | 0 | 0.0% |
| Total | 24 | 100.0% |
Housing Finances in Jonestown
Median Income by Occupancy in Jonestown
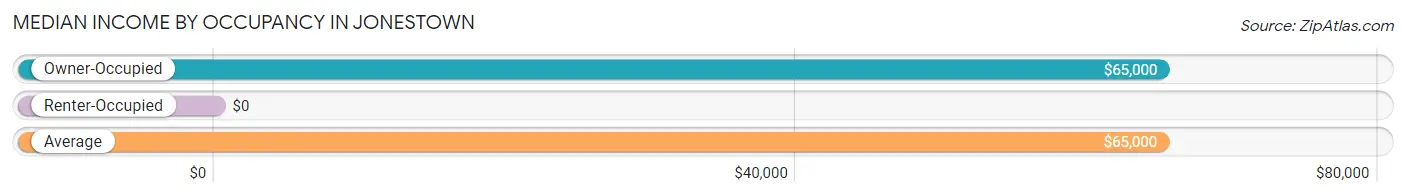
| Occupancy Type | # Households | Median Income |
| Owner-Occupied | 24 (100.0%) | $65,000 |
| Renter-Occupied | 0 (0.0%) | $0 |
| Average | 24 (100.0%) | $65,000 |
Occupancy by Householder Income Bracket in Jonestown
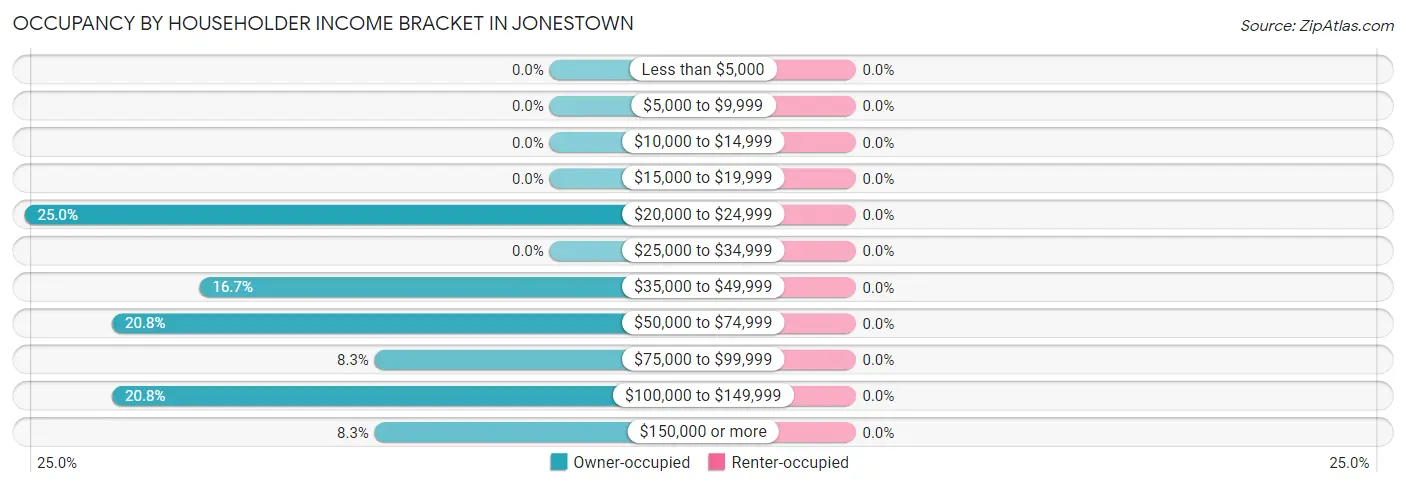
| Income Bracket | Owner-occupied | Renter-occupied |
| Less than $5,000 | 0 (0.0%) | 0 (0.0%) |
| $5,000 to $9,999 | 0 (0.0%) | 0 (0.0%) |
| $10,000 to $14,999 | 0 (0.0%) | 0 (0.0%) |
| $15,000 to $19,999 | 0 (0.0%) | 0 (0.0%) |
| $20,000 to $24,999 | 6 (25.0%) | 0 (0.0%) |
| $25,000 to $34,999 | 0 (0.0%) | 0 (0.0%) |
| $35,000 to $49,999 | 4 (16.7%) | 0 (0.0%) |
| $50,000 to $74,999 | 5 (20.8%) | 0 (0.0%) |
| $75,000 to $99,999 | 2 (8.3%) | 0 (0.0%) |
| $100,000 to $149,999 | 5 (20.8%) | 0 (0.0%) |
| $150,000 or more | 2 (8.3%) | 0 (0.0%) |
| Total | 24 (100.0%) | 0 (0.0%) |
Monthly Housing Cost Tiers in Jonestown
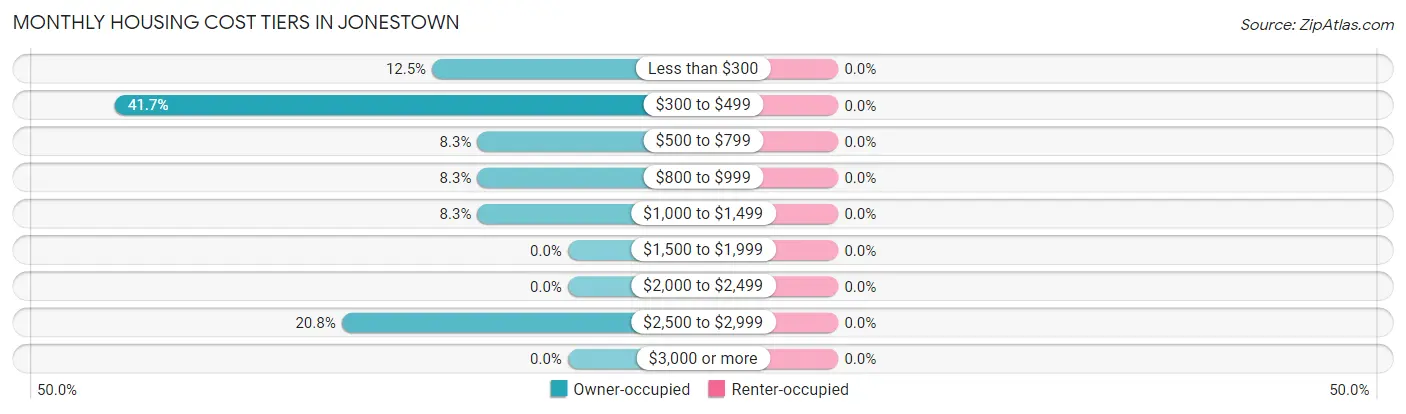
| Monthly Cost | Owner-occupied | Renter-occupied |
| Less than $300 | 3 (12.5%) | 0 (0.0%) |
| $300 to $499 | 10 (41.7%) | 0 (0.0%) |
| $500 to $799 | 2 (8.3%) | 0 (0.0%) |
| $800 to $999 | 2 (8.3%) | 0 (0.0%) |
| $1,000 to $1,499 | 2 (8.3%) | 0 (0.0%) |
| $1,500 to $1,999 | 0 (0.0%) | 0 (0.0%) |
| $2,000 to $2,499 | 0 (0.0%) | 0 (0.0%) |
| $2,500 to $2,999 | 5 (20.8%) | 0 (0.0%) |
| $3,000 or more | 0 (0.0%) | 0 (0.0%) |
| Total | 24 (100.0%) | 0 (0.0%) |
Physical Housing Characteristics in Jonestown
Housing Structures in Jonestown
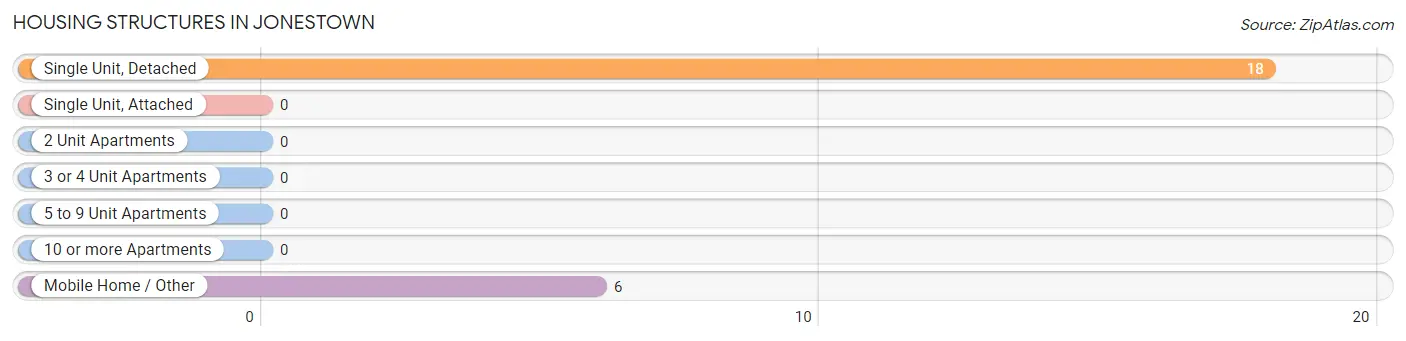
| Structure Type | # Housing Units | % Housing Units |
| Single Unit, Detached | 18 | 75.0% |
| Single Unit, Attached | 0 | 0.0% |
| 2 Unit Apartments | 0 | 0.0% |
| 3 or 4 Unit Apartments | 0 | 0.0% |
| 5 to 9 Unit Apartments | 0 | 0.0% |
| 10 or more Apartments | 0 | 0.0% |
| Mobile Home / Other | 6 | 25.0% |
| Total | 24 | 100.0% |
Housing Structures by Occupancy in Jonestown
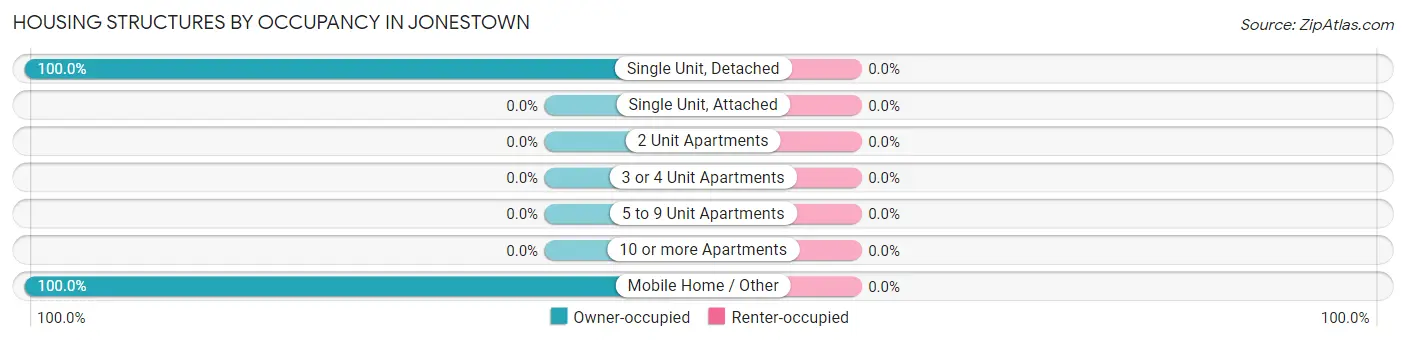
| Structure Type | Owner-occupied | Renter-occupied |
| Single Unit, Detached | 18 (100.0%) | 0 (0.0%) |
| Single Unit, Attached | 0 (0.0%) | 0 (0.0%) |
| 2 Unit Apartments | 0 (0.0%) | 0 (0.0%) |
| 3 or 4 Unit Apartments | 0 (0.0%) | 0 (0.0%) |
| 5 to 9 Unit Apartments | 0 (0.0%) | 0 (0.0%) |
| 10 or more Apartments | 0 (0.0%) | 0 (0.0%) |
| Mobile Home / Other | 6 (100.0%) | 0 (0.0%) |
| Total | 24 (100.0%) | 0 (0.0%) |
Housing Structures by Number of Rooms in Jonestown
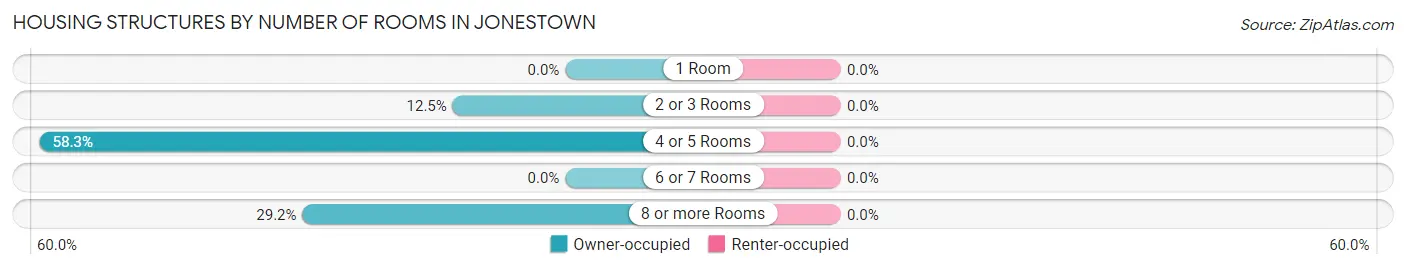
| Number of Rooms | Owner-occupied | Renter-occupied |
| 1 Room | 0 (0.0%) | 0 (0.0%) |
| 2 or 3 Rooms | 3 (12.5%) | 0 (0.0%) |
| 4 or 5 Rooms | 14 (58.3%) | 0 (0.0%) |
| 6 or 7 Rooms | 0 (0.0%) | 0 (0.0%) |
| 8 or more Rooms | 7 (29.2%) | 0 (0.0%) |
| Total | 24 (100.0%) | 0 (0.0%) |
Housing Structure by Heating Type in Jonestown
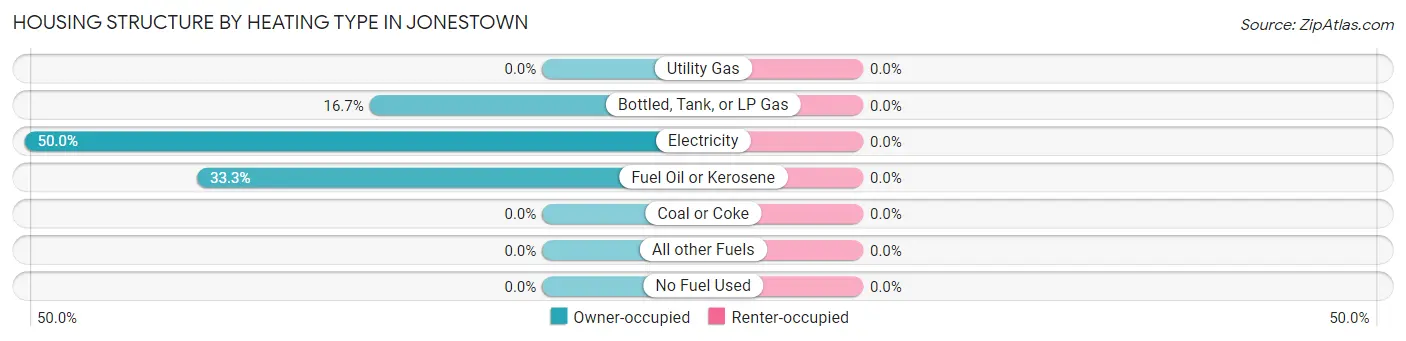
| Heating Type | Owner-occupied | Renter-occupied |
| Utility Gas | 0 (0.0%) | 0 (0.0%) |
| Bottled, Tank, or LP Gas | 4 (16.7%) | 0 (0.0%) |
| Electricity | 12 (50.0%) | 0 (0.0%) |
| Fuel Oil or Kerosene | 8 (33.3%) | 0 (0.0%) |
| Coal or Coke | 0 (0.0%) | 0 (0.0%) |
| All other Fuels | 0 (0.0%) | 0 (0.0%) |
| No Fuel Used | 0 (0.0%) | 0 (0.0%) |
| Total | 24 (100.0%) | 0 (0.0%) |
Household Vehicle Usage in Jonestown
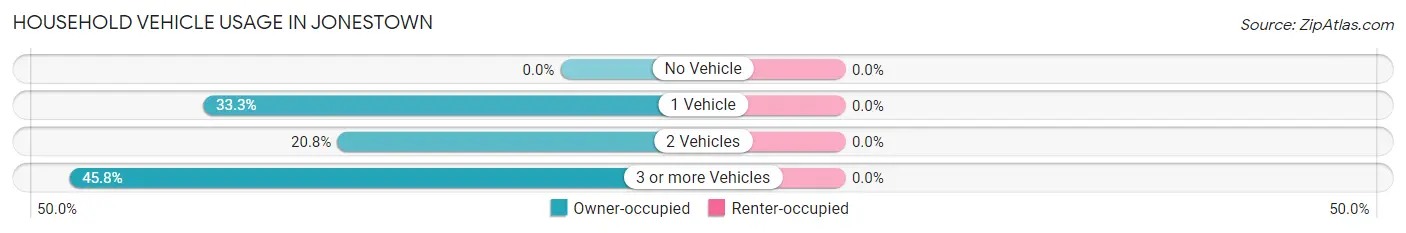
| Vehicles per Household | Owner-occupied | Renter-occupied |
| No Vehicle | 0 (0.0%) | 0 (0.0%) |
| 1 Vehicle | 8 (33.3%) | 0 (0.0%) |
| 2 Vehicles | 5 (20.8%) | 0 (0.0%) |
| 3 or more Vehicles | 11 (45.8%) | 0 (0.0%) |
| Total | 24 (100.0%) | 0 (0.0%) |
Real Estate & Mortgages in Jonestown
Real Estate and Mortgage Overview in Jonestown
| Characteristic | Without Mortgage | With Mortgage |
| Housing Units | 11 | 13 |
| Median Property Value | - | - |
| Median Household Income | $59,375 | $2 |
| Monthly Housing Costs | $463 | $0 |
| Real Estate Taxes | $2,625 | $0 |
Property Value by Mortgage Status in Jonestown
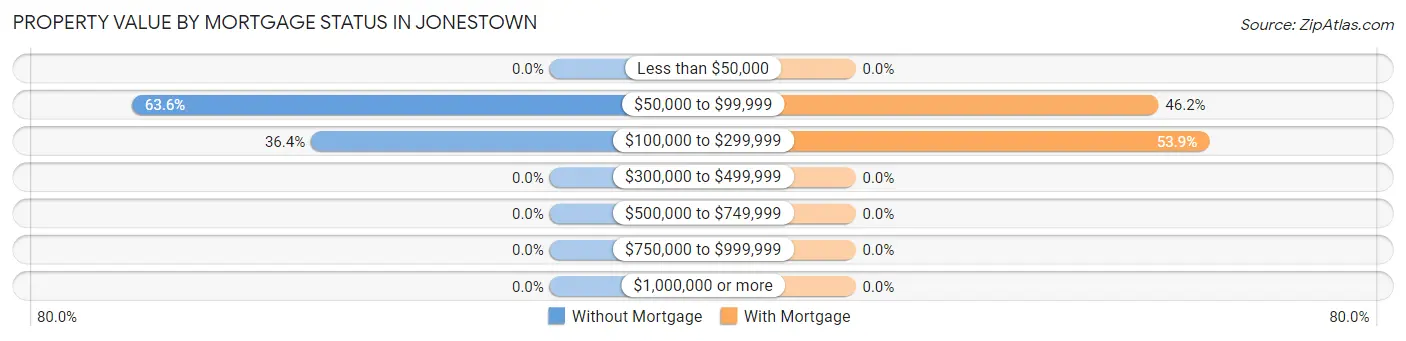
| Property Value | Without Mortgage | With Mortgage |
| Less than $50,000 | 0 (0.0%) | 0 (0.0%) |
| $50,000 to $99,999 | 7 (63.6%) | 6 (46.2%) |
| $100,000 to $299,999 | 4 (36.4%) | 7 (53.8%) |
| $300,000 to $499,999 | 0 (0.0%) | 0 (0.0%) |
| $500,000 to $749,999 | 0 (0.0%) | 0 (0.0%) |
| $750,000 to $999,999 | 0 (0.0%) | 0 (0.0%) |
| $1,000,000 or more | 0 (0.0%) | 0 (0.0%) |
| Total | 11 (100.0%) | 13 (100.0%) |
Household Income by Mortgage Status in Jonestown
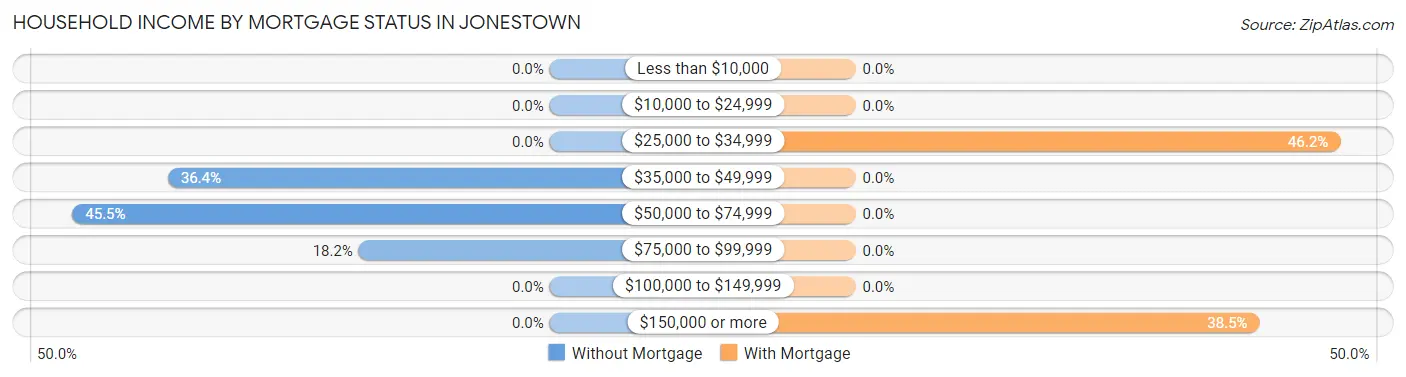
| Household Income | Without Mortgage | With Mortgage |
| Less than $10,000 | 0 (0.0%) | 0 (0.0%) |
| $10,000 to $24,999 | 0 (0.0%) | 0 (0.0%) |
| $25,000 to $34,999 | 0 (0.0%) | 6 (46.2%) |
| $35,000 to $49,999 | 4 (36.4%) | 0 (0.0%) |
| $50,000 to $74,999 | 5 (45.5%) | 0 (0.0%) |
| $75,000 to $99,999 | 2 (18.2%) | 0 (0.0%) |
| $100,000 to $149,999 | 0 (0.0%) | 0 (0.0%) |
| $150,000 or more | 0 (0.0%) | 5 (38.5%) |
| Total | 11 (100.0%) | 13 (100.0%) |
Property Value to Household Income Ratio in Jonestown
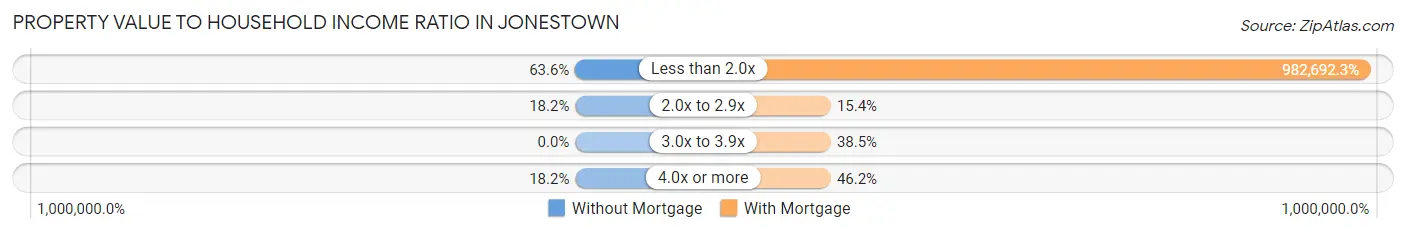
| Value-to-Income Ratio | Without Mortgage | With Mortgage |
| Less than 2.0x | 7 (63.6%) | 127,750 (982,692.3%) |
| 2.0x to 2.9x | 2 (18.2%) | 2 (15.4%) |
| 3.0x to 3.9x | 0 (0.0%) | 5 (38.5%) |
| 4.0x or more | 2 (18.2%) | 6 (46.2%) |
| Total | 11 (100.0%) | 13 (100.0%) |
Real Estate Taxes by Mortgage Status in Jonestown
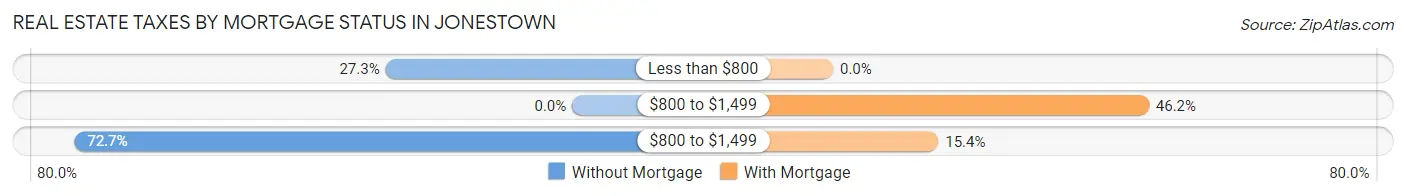
| Property Taxes | Without Mortgage | With Mortgage |
| Less than $800 | 3 (27.3%) | 0 (0.0%) |
| $800 to $1,499 | 0 (0.0%) | 6 (46.2%) |
| $800 to $1,499 | 8 (72.7%) | 2 (15.4%) |
| Total | 11 (100.0%) | 13 (100.0%) |
Health & Disability in Jonestown
Health Insurance Coverage by Age in Jonestown
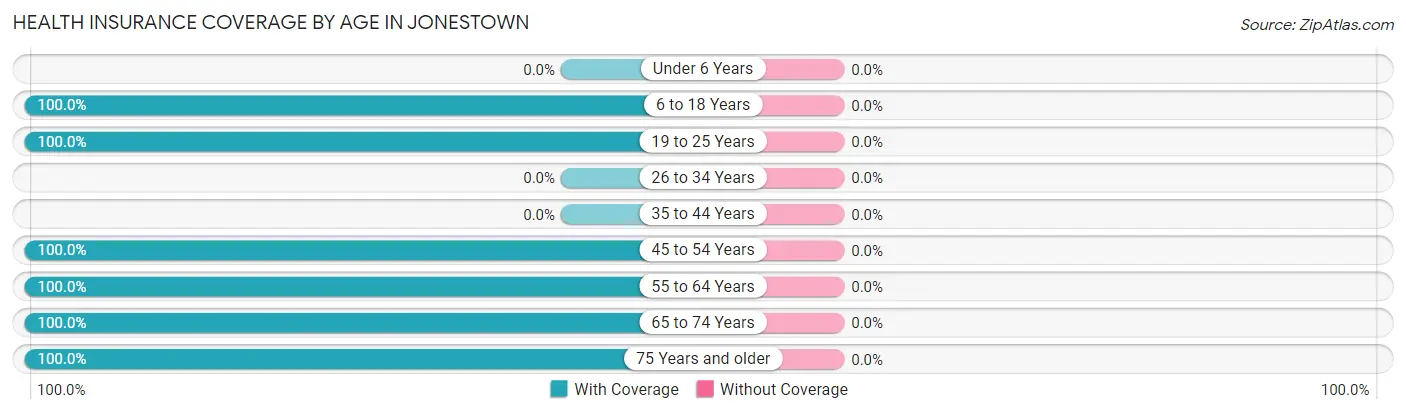
| Age Bracket | With Coverage | Without Coverage |
| Under 6 Years | 0 (0.0%) | 0 (0.0%) |
| 6 to 18 Years | 11 (100.0%) | 0 (0.0%) |
| 19 to 25 Years | 6 (100.0%) | 0 (0.0%) |
| 26 to 34 Years | 0 (0.0%) | 0 (0.0%) |
| 35 to 44 Years | 0 (0.0%) | 0 (0.0%) |
| 45 to 54 Years | 13 (100.0%) | 0 (0.0%) |
| 55 to 64 Years | 16 (100.0%) | 0 (0.0%) |
| 65 to 74 Years | 16 (100.0%) | 0 (0.0%) |
| 75 Years and older | 2 (100.0%) | 0 (0.0%) |
| Total | 64 (100.0%) | 0 (0.0%) |
Health Insurance Coverage by Citizenship Status in Jonestown
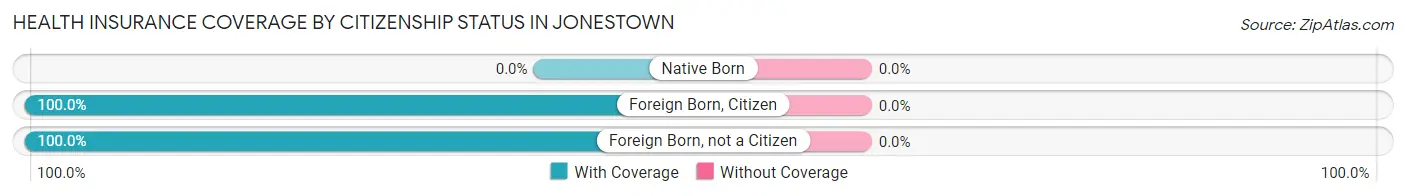
| Citizenship Status | With Coverage | Without Coverage |
| Native Born | 0 (0.0%) | 0 (0.0%) |
| Foreign Born, Citizen | 11 (100.0%) | 0 (0.0%) |
| Foreign Born, not a Citizen | 6 (100.0%) | 0 (0.0%) |
Health Insurance Coverage by Household Income in Jonestown
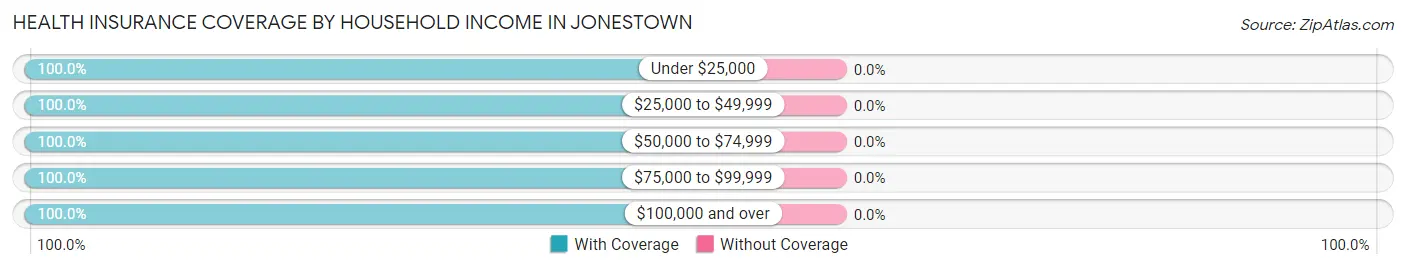
| Household Income | With Coverage | Without Coverage |
| Under $25,000 | 11 (100.0%) | 0 (0.0%) |
| $25,000 to $49,999 | 9 (100.0%) | 0 (0.0%) |
| $50,000 to $74,999 | 8 (100.0%) | 0 (0.0%) |
| $75,000 to $99,999 | 4 (100.0%) | 0 (0.0%) |
| $100,000 and over | 32 (100.0%) | 0 (0.0%) |
Public vs Private Health Insurance Coverage by Age in Jonestown
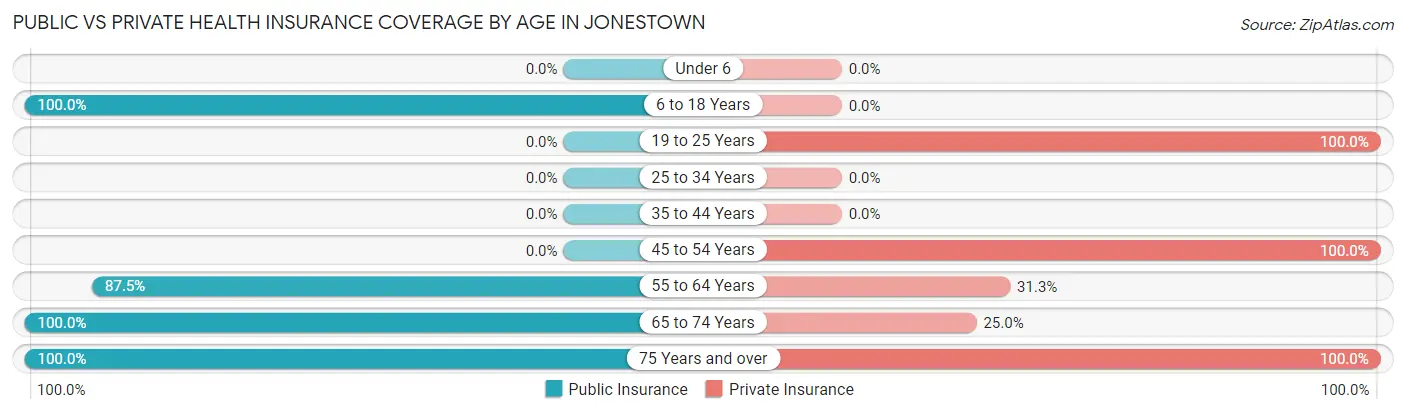
| Age Bracket | Public Insurance | Private Insurance |
| Under 6 | 0 (0.0%) | 0 (0.0%) |
| 6 to 18 Years | 11 (100.0%) | 0 (0.0%) |
| 19 to 25 Years | 0 (0.0%) | 6 (100.0%) |
| 25 to 34 Years | 0 (0.0%) | 0 (0.0%) |
| 35 to 44 Years | 0 (0.0%) | 0 (0.0%) |
| 45 to 54 Years | 0 (0.0%) | 13 (100.0%) |
| 55 to 64 Years | 14 (87.5%) | 5 (31.2%) |
| 65 to 74 Years | 16 (100.0%) | 4 (25.0%) |
| 75 Years and over | 2 (100.0%) | 2 (100.0%) |
| Total | 43 (67.2%) | 30 (46.9%) |
Disability Status by Sex by Age in Jonestown
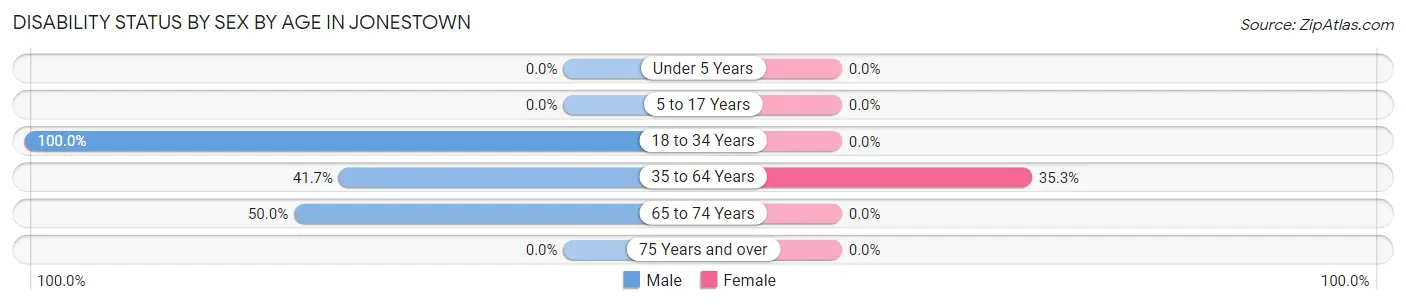
| Age Bracket | Male | Female |
| Under 5 Years | 0 (0.0%) | 0 (0.0%) |
| 5 to 17 Years | 0 (0.0%) | 0 (0.0%) |
| 18 to 34 Years | 6 (100.0%) | 0 (0.0%) |
| 35 to 64 Years | 5 (41.7%) | 6 (35.3%) |
| 65 to 74 Years | 5 (50.0%) | 0 (0.0%) |
| 75 Years and over | 0 (0.0%) | 0 (0.0%) |
Disability Class by Sex by Age in Jonestown
Disability Class: Hearing Difficulty
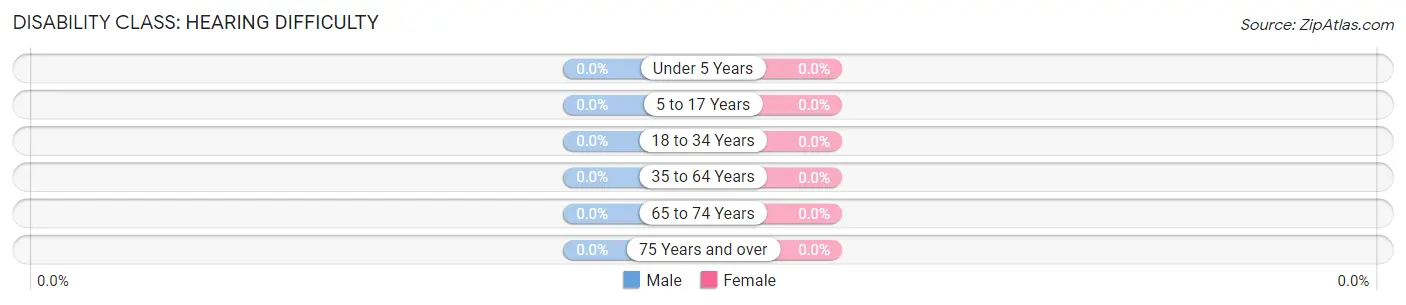
| Age Bracket | Male | Female |
| Under 5 Years | 0 (0.0%) | 0 (0.0%) |
| 5 to 17 Years | 0 (0.0%) | 0 (0.0%) |
| 18 to 34 Years | 0 (0.0%) | 0 (0.0%) |
| 35 to 64 Years | 0 (0.0%) | 0 (0.0%) |
| 65 to 74 Years | 0 (0.0%) | 0 (0.0%) |
| 75 Years and over | 0 (0.0%) | 0 (0.0%) |
Disability Class: Vision Difficulty
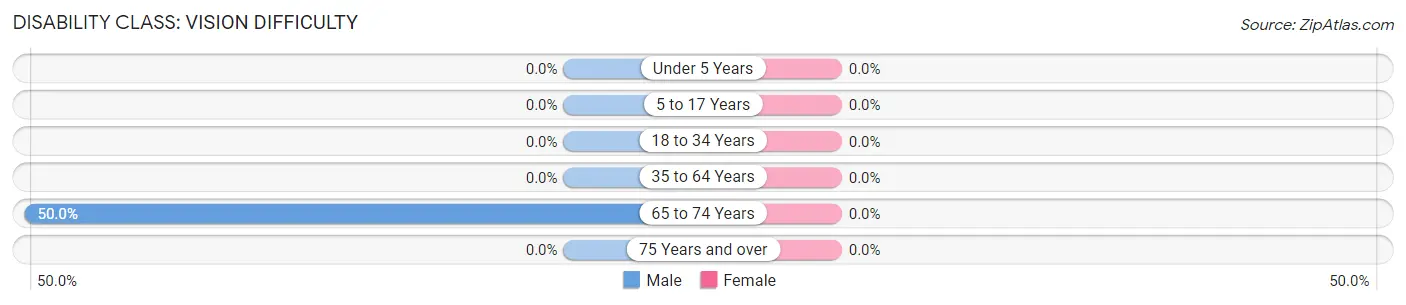
| Age Bracket | Male | Female |
| Under 5 Years | 0 (0.0%) | 0 (0.0%) |
| 5 to 17 Years | 0 (0.0%) | 0 (0.0%) |
| 18 to 34 Years | 0 (0.0%) | 0 (0.0%) |
| 35 to 64 Years | 0 (0.0%) | 0 (0.0%) |
| 65 to 74 Years | 5 (50.0%) | 0 (0.0%) |
| 75 Years and over | 0 (0.0%) | 0 (0.0%) |
Disability Class: Cognitive Difficulty
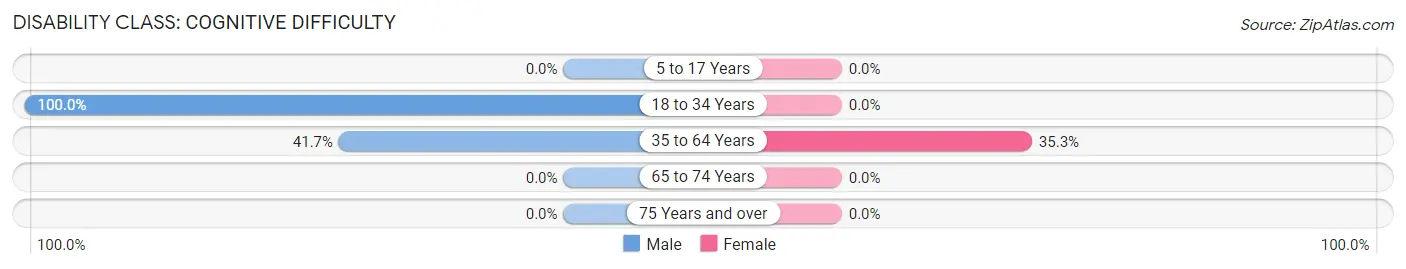
| Age Bracket | Male | Female |
| 5 to 17 Years | 0 (0.0%) | 0 (0.0%) |
| 18 to 34 Years | 6 (100.0%) | 0 (0.0%) |
| 35 to 64 Years | 5 (41.7%) | 6 (35.3%) |
| 65 to 74 Years | 0 (0.0%) | 0 (0.0%) |
| 75 Years and over | 0 (0.0%) | 0 (0.0%) |
Disability Class: Ambulatory Difficulty
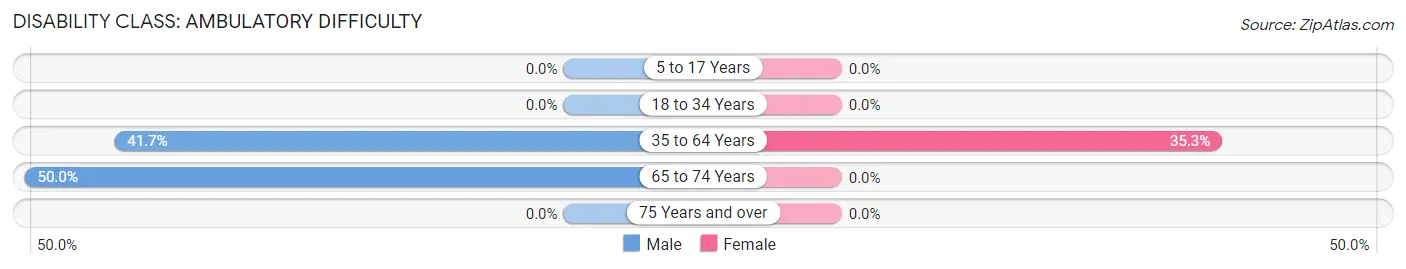
| Age Bracket | Male | Female |
| 5 to 17 Years | 0 (0.0%) | 0 (0.0%) |
| 18 to 34 Years | 0 (0.0%) | 0 (0.0%) |
| 35 to 64 Years | 5 (41.7%) | 6 (35.3%) |
| 65 to 74 Years | 5 (50.0%) | 0 (0.0%) |
| 75 Years and over | 0 (0.0%) | 0 (0.0%) |
Disability Class: Self-Care Difficulty
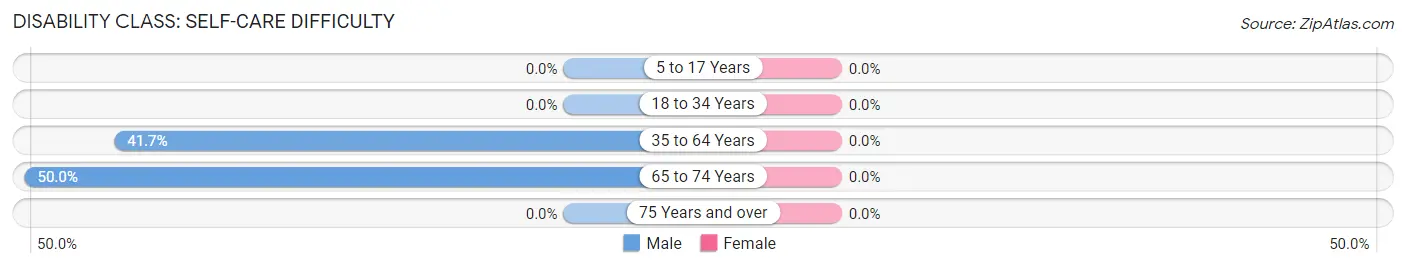
| Age Bracket | Male | Female |
| 5 to 17 Years | 0 (0.0%) | 0 (0.0%) |
| 18 to 34 Years | 0 (0.0%) | 0 (0.0%) |
| 35 to 64 Years | 5 (41.7%) | 0 (0.0%) |
| 65 to 74 Years | 5 (50.0%) | 0 (0.0%) |
| 75 Years and over | 0 (0.0%) | 0 (0.0%) |
Technology Access in Jonestown
Computing Device Access in Jonestown
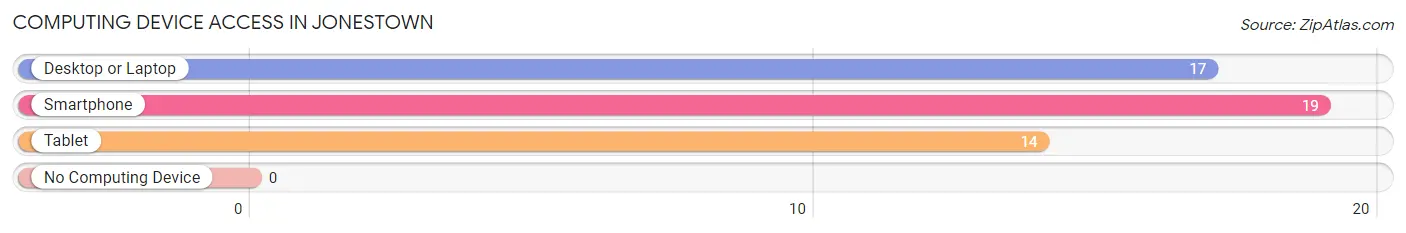
| Device Type | # Households | % Households |
| Desktop or Laptop | 17 | 70.8% |
| Smartphone | 19 | 79.2% |
| Tablet | 14 | 58.3% |
| No Computing Device | 0 | 0.0% |
| Total | 24 | 100.0% |
Internet Access in Jonestown
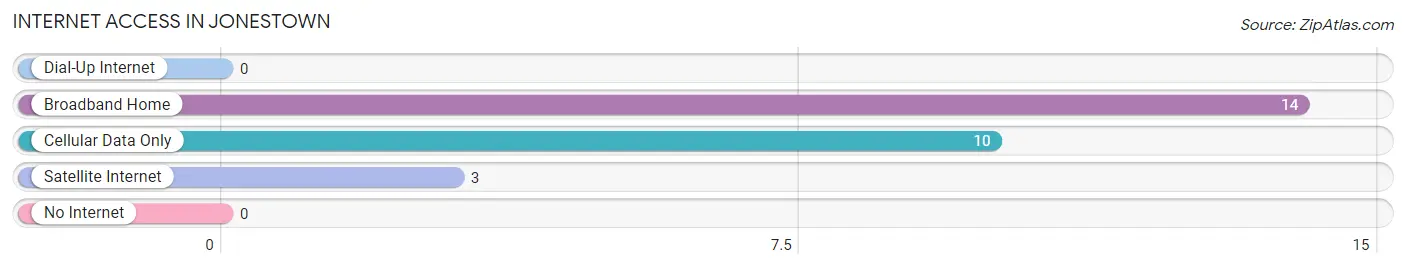
| Internet Type | # Households | % Households |
| Dial-Up Internet | 0 | 0.0% |
| Broadband Home | 14 | 58.3% |
| Cellular Data Only | 10 | 41.7% |
| Satellite Internet | 3 | 12.5% |
| No Internet | 0 | 0.0% |
| Total | 24 | 100.0% |
Jonestown Summary
Jonestown, Pennsylvania is a small borough located in Lebanon County, Pennsylvania. It is situated in the southeastern part of the state, about 10 miles north of the state capital of Harrisburg. The population of Jonestown was 2,845 as of the 2010 census.
History
Jonestown was founded in 1755 by John Jones, a Welsh immigrant who had settled in the area. The town was originally known as Jones' Town, and was later shortened to Jonestown. The town was incorporated in 1845.
Jonestown was an important stop on the Underground Railroad, with many of the town's residents helping to hide and transport escaped slaves. During the Civil War, the town was a major supplier of food and supplies to the Union Army.
Geography
Jonestown is located in the southeastern part of Lebanon County, Pennsylvania. It is situated in the Appalachian Mountains, and is surrounded by rolling hills and farmland. The town is located along the Swatara Creek, which flows through the center of town.
The climate in Jonestown is humid continental, with hot summers and cold winters. The average annual temperature is around 50 degrees Fahrenheit.
Economy
The economy of Jonestown is largely based on agriculture and tourism. The town is home to several farms, which produce a variety of crops, including corn, soybeans, wheat, and hay. The town is also home to several wineries, which produce a variety of wines.
Tourism is an important part of the local economy, with many visitors coming to the area to enjoy the scenic views and outdoor activities. The town is home to several parks, including the Swatara State Park, which offers camping, fishing, and hiking.
Demographics
As of the 2010 census, the population of Jonestown was 2,845. The racial makeup of the town was 97.3% White, 0.7% African American, 0.2% Native American, 0.3% Asian, 0.1% Pacific Islander, 0.7% from other races, and 0.9% from two or more races. Hispanic or Latino of any race were 1.7% of the population.
The median household income in Jonestown was $45,938, and the median family income was $51,938. The per capita income was $20,938. About 8.3% of families and 10.2% of the population were below the poverty line, including 14.2% of those under age 18 and 8.2% of those age 65 or over.
The population of Jonestown is largely Christian, with the majority of residents belonging to the Lutheran, Methodist, and Catholic denominations. The town is also home to a small Jewish community.
Common Questions
What is Per Capita Income in Jonestown?
Per Capita income in Jonestown is $31,036.
What is the Median Family Income in Jonestown?
Median Family Income in Jonestown is $70,833.
What is the Median Household income in Jonestown?
Median Household Income in Jonestown is $65,000.
What is Inequality or Gini Index in Jonestown?
Inequality or Gini Index in Jonestown is 0.35.
What is the Total Population of Jonestown?
Total Population of Jonestown is 64.
What is the Total Male Population of Jonestown?
Total Male Population of Jonestown is 33.
What is the Total Female Population of Jonestown?
Total Female Population of Jonestown is 31.
What is the Ratio of Males per 100 Females in Jonestown?
There are 106.45 Males per 100 Females in Jonestown.
What is the Ratio of Females per 100 Males in Jonestown?
There are 93.94 Females per 100 Males in Jonestown.
What is the Median Population Age in Jonestown?
Median Population Age in Jonestown is 57.3 Years.
What is the Average Family Size in Jonestown
Average Family Size in Jonestown is 2.8 People.
What is the Average Household Size in Jonestown
Average Household Size in Jonestown is 2.7 People.
How Large is the Labor Force in Jonestown?
There are 21 People in the Labor Forcein in Jonestown.
What is the Percentage of People in the Labor Force in Jonestown?
39.6% of People are in the Labor Force in Jonestown.