James City, PA Map & Demographics
James City Map
James City Overview
$31,448
PER CAPITA INCOME
$59,286
AVG FAMILY INCOME
$59,643
AVG HOUSEHOLD INCOME
40.2%
WAGE / INCOME GAP [ % ]
59.8¢/ $1
WAGE / INCOME GAP [ $ ]
0.31
INEQUALITY / GINI INDEX
194
TOTAL POPULATION
105
MALE POPULATION
89
FEMALE POPULATION
117.98
MALES / 100 FEMALES
84.76
FEMALES / 100 MALES
48.1
MEDIAN AGE
2.7
AVG FAMILY SIZE
2.1
AVG HOUSEHOLD SIZE
107
LABOR FORCE [ PEOPLE ]
59.8%
PERCENT IN LABOR FORCE
4.7%
UNEMPLOYMENT RATE
James City Zip Codes
James City Area Codes
Income in James City
Income Overview in James City
Per Capita Income in James City is $31,448, while median incomes of families and households are $59,286 and $59,643 respectively.
| Characteristic | Number | Measure |
| Per Capita Income | 194 | $31,448 |
| Median Family Income | 50 | $59,286 |
| Mean Family Income | 50 | $75,544 |
| Median Household Income | 94 | $59,643 |
| Mean Household Income | 94 | $63,767 |
| Income Deficit | 50 | $0 |
| Wage / Income Gap (%) | 194 | 40.16% |
| Wage / Income Gap ($) | 194 | 59.84¢ per $1 |
| Gini / Inequality Index | 194 | 0.31 |
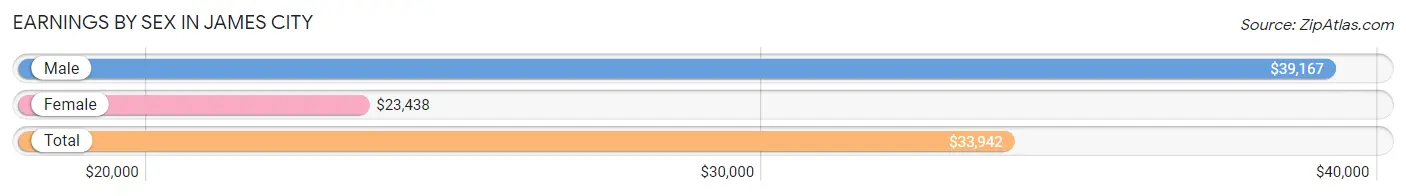
Earnings by Sex in James City
Average Earnings in James City are $33,942, $39,167 for men and $23,438 for women, a difference of 40.2%.
| Sex | Number | Average Earnings |
| Male | 74 (69.2%) | $39,167 |
| Female | 33 (30.8%) | $23,438 |
| Total | 107 (100.0%) | $33,942 |
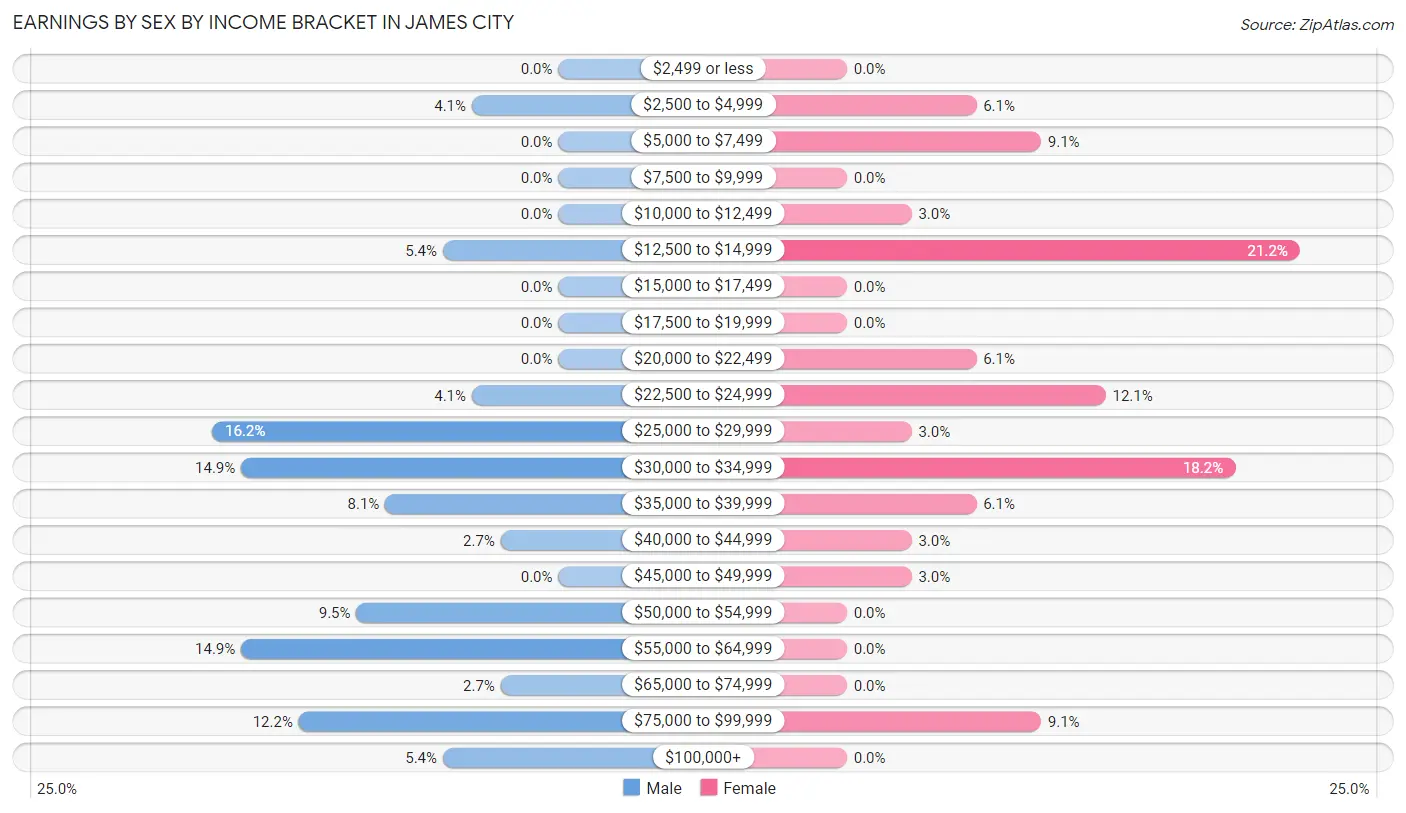
Earnings by Sex by Income Bracket in James City
The most common earnings brackets in James City are $25,000 to $29,999 for men (12 | 16.2%) and $12,500 to $14,999 for women (7 | 21.2%).
| Income | Male | Female |
| $2,499 or less | 0 (0.0%) | 0 (0.0%) |
| $2,500 to $4,999 | 3 (4.1%) | 2 (6.1%) |
| $5,000 to $7,499 | 0 (0.0%) | 3 (9.1%) |
| $7,500 to $9,999 | 0 (0.0%) | 0 (0.0%) |
| $10,000 to $12,499 | 0 (0.0%) | 1 (3.0%) |
| $12,500 to $14,999 | 4 (5.4%) | 7 (21.2%) |
| $15,000 to $17,499 | 0 (0.0%) | 0 (0.0%) |
| $17,500 to $19,999 | 0 (0.0%) | 0 (0.0%) |
| $20,000 to $22,499 | 0 (0.0%) | 2 (6.1%) |
| $22,500 to $24,999 | 3 (4.1%) | 4 (12.1%) |
| $25,000 to $29,999 | 12 (16.2%) | 1 (3.0%) |
| $30,000 to $34,999 | 11 (14.9%) | 6 (18.2%) |
| $35,000 to $39,999 | 6 (8.1%) | 2 (6.1%) |
| $40,000 to $44,999 | 2 (2.7%) | 1 (3.0%) |
| $45,000 to $49,999 | 0 (0.0%) | 1 (3.0%) |
| $50,000 to $54,999 | 7 (9.5%) | 0 (0.0%) |
| $55,000 to $64,999 | 11 (14.9%) | 0 (0.0%) |
| $65,000 to $74,999 | 2 (2.7%) | 0 (0.0%) |
| $75,000 to $99,999 | 9 (12.2%) | 3 (9.1%) |
| $100,000+ | 4 (5.4%) | 0 (0.0%) |
| Total | 74 (100.0%) | 33 (100.0%) |
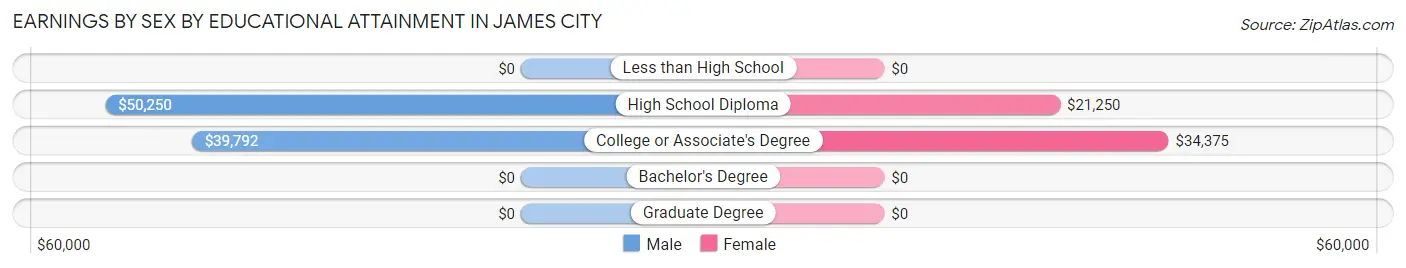
Earnings by Sex by Educational Attainment in James City
Average earnings in James City are $43,750 for men and $24,375 for women, a difference of 44.3%. Men with an educational attainment of high school diploma enjoy the highest average annual earnings of $50,250, while those with college or associate's degree education earn the least with $39,792. Women with an educational attainment of college or associate's degree earn the most with the average annual earnings of $34,375, while those with high school diploma education have the smallest earnings of $21,250.
| Educational Attainment | Male Income | Female Income |
| Less than High School | - | - |
| High School Diploma | $50,250 | $21,250 |
| College or Associate's Degree | $39,792 | $34,375 |
| Bachelor's Degree | - | - |
| Graduate Degree | - | - |
| Total | $43,750 | $24,375 |
Family Income in James City
Family Income Brackets in James City
According to the James City family income data, there are 13 families falling into the $100,000 to $149,999 income range, which is the most common income bracket and makes up 26.0% of all families.
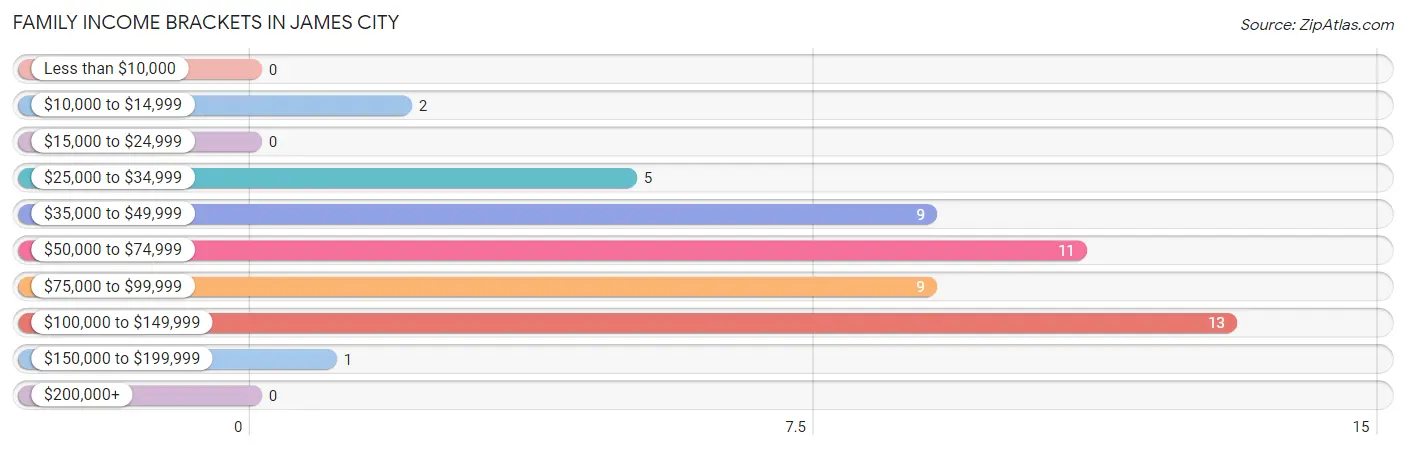
| Income Bracket | # Families | % Families |
| Less than $10,000 | 0 | 0.0% |
| $10,000 to $14,999 | 2 | 4.0% |
| $15,000 to $24,999 | 0 | 0.0% |
| $25,000 to $34,999 | 5 | 10.0% |
| $35,000 to $49,999 | 9 | 18.0% |
| $50,000 to $74,999 | 11 | 22.0% |
| $75,000 to $99,999 | 9 | 18.0% |
| $100,000 to $149,999 | 13 | 26.0% |
| $150,000 to $199,999 | 1 | 2.0% |
| $200,000+ | 0 | 0.0% |
Family Income by Famaliy Size in James City
4-person families (5 | 10.0%) account for the highest median family income in James City with $106,250 per family, while 2-person families (29 | 58.0%) have the highest median income of $28,958 per family member.
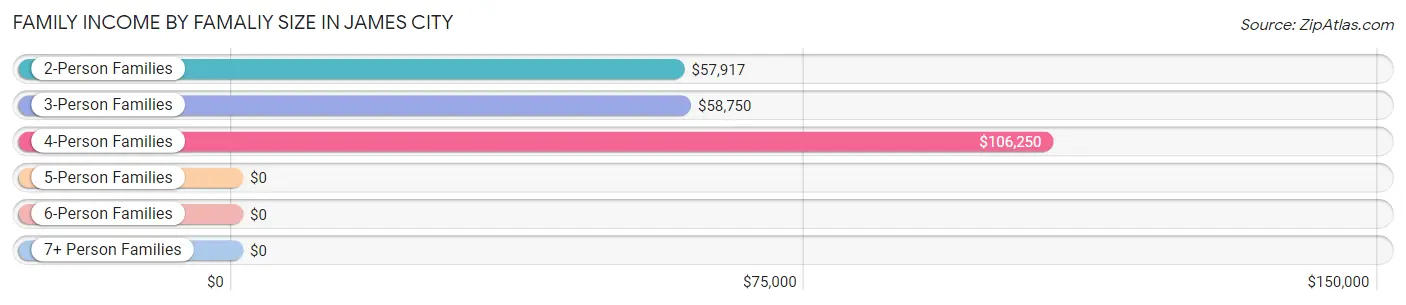
| Income Bracket | # Families | Median Income |
| 2-Person Families | 29 (58.0%) | $57,917 |
| 3-Person Families | 16 (32.0%) | $58,750 |
| 4-Person Families | 5 (10.0%) | $106,250 |
| 5-Person Families | 0 (0.0%) | $0 |
| 6-Person Families | 0 (0.0%) | $0 |
| 7+ Person Families | 0 (0.0%) | $0 |
| Total | 50 (100.0%) | $59,286 |
Family Income by Number of Earners in James City
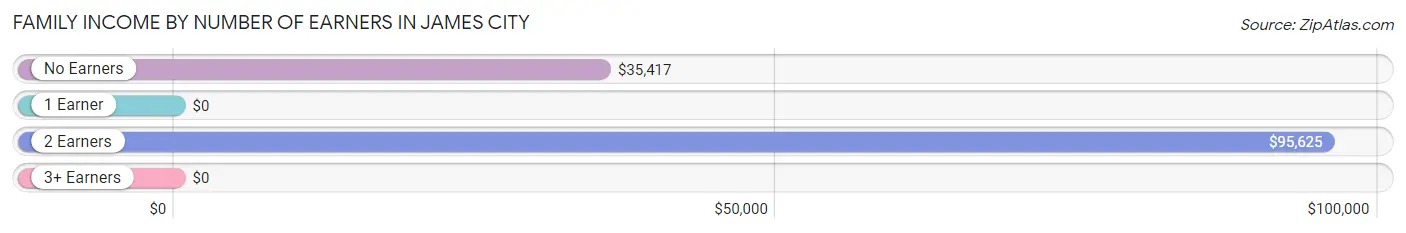
| Number of Earners | # Families | Median Income |
| No Earners | 9 (18.0%) | $35,417 |
| 1 Earner | 25 (50.0%) | $0 |
| 2 Earners | 9 (18.0%) | $95,625 |
| 3+ Earners | 7 (14.0%) | $0 |
| Total | 50 (100.0%) | $59,286 |
Household Income in James City
Household Income Brackets in James City
With 32 households falling in the category, the $50,000 to $74,999 income range is the most frequent in James City, accounting for 34.0% of all households.
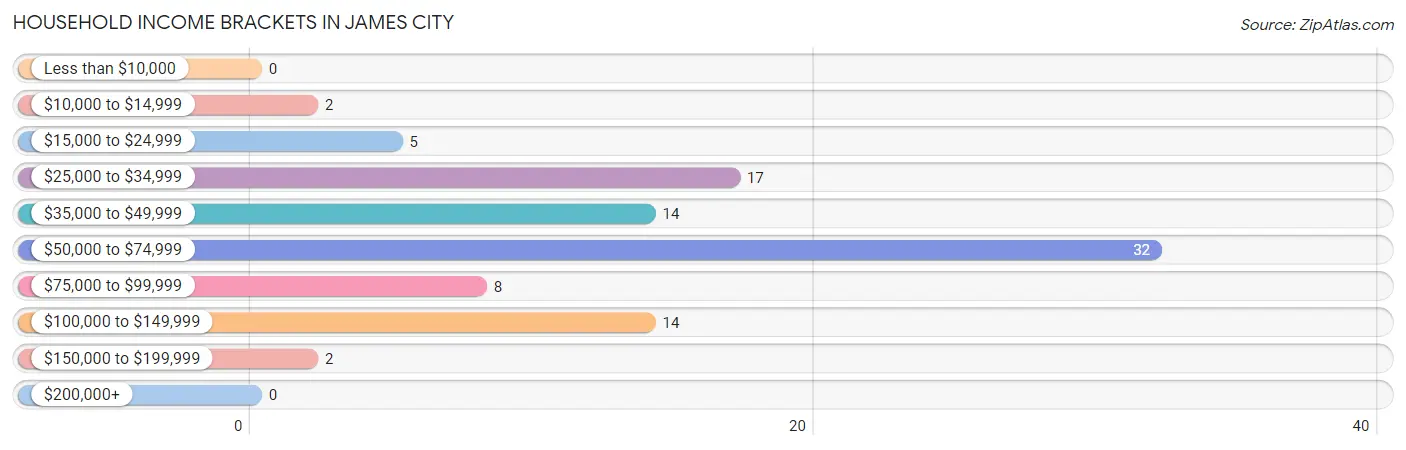
| Income Bracket | # Households | % Households |
| Less than $10,000 | 0 | 0.0% |
| $10,000 to $14,999 | 2 | 2.1% |
| $15,000 to $24,999 | 5 | 5.3% |
| $25,000 to $34,999 | 17 | 18.1% |
| $35,000 to $49,999 | 14 | 14.9% |
| $50,000 to $74,999 | 32 | 34.0% |
| $75,000 to $99,999 | 8 | 8.5% |
| $100,000 to $149,999 | 14 | 14.9% |
| $150,000 to $199,999 | 2 | 2.1% |
| $200,000+ | 0 | 0.0% |
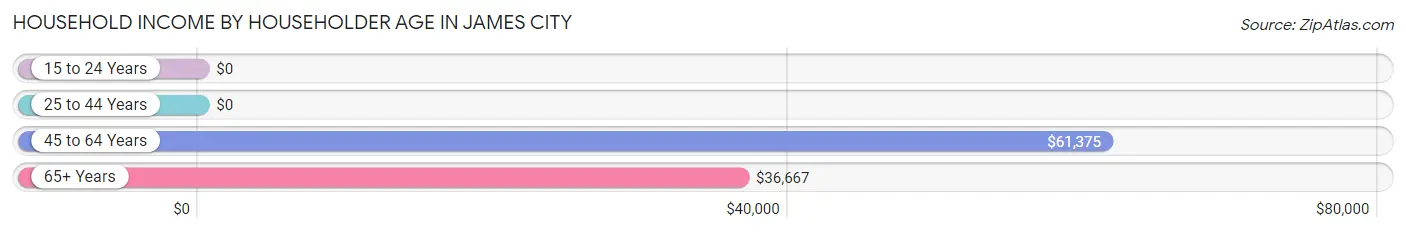
Household Income by Householder Age in James City
The median household income in James City is $59,643, with the highest median household income of $61,375 found in the 45 to 64 years age bracket for the primary householder. A total of 54 households (57.5%) fall into this category.
| Income Bracket | # Households | Median Income |
| 15 to 24 Years | 0 (0.0%) | $0 |
| 25 to 44 Years | 12 (12.8%) | $0 |
| 45 to 64 Years | 54 (57.5%) | $61,375 |
| 65+ Years | 28 (29.8%) | $36,667 |
| Total | 94 (100.0%) | $59,643 |
Poverty in James City
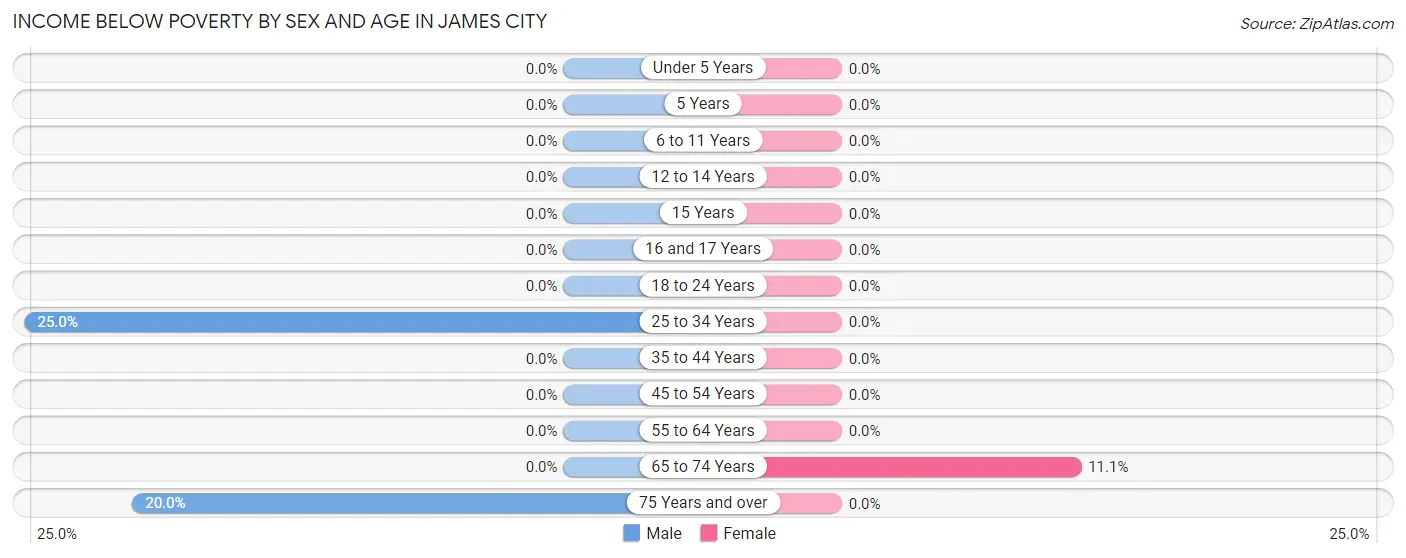
Income Below Poverty by Sex and Age in James City
With 2.9% poverty level for males and 2.2% for females among the residents of James City, 25 to 34 year old males and 65 to 74 year old females are the most vulnerable to poverty, with 2 males (25.0%) and 2 females (11.1%) in their respective age groups living below the poverty level.
| Age Bracket | Male | Female |
| Under 5 Years | 0 (0.0%) | 0 (0.0%) |
| 5 Years | 0 (0.0%) | 0 (0.0%) |
| 6 to 11 Years | 0 (0.0%) | 0 (0.0%) |
| 12 to 14 Years | 0 (0.0%) | 0 (0.0%) |
| 15 Years | 0 (0.0%) | 0 (0.0%) |
| 16 and 17 Years | 0 (0.0%) | 0 (0.0%) |
| 18 to 24 Years | 0 (0.0%) | 0 (0.0%) |
| 25 to 34 Years | 2 (25.0%) | 0 (0.0%) |
| 35 to 44 Years | 0 (0.0%) | 0 (0.0%) |
| 45 to 54 Years | 0 (0.0%) | 0 (0.0%) |
| 55 to 64 Years | 0 (0.0%) | 0 (0.0%) |
| 65 to 74 Years | 0 (0.0%) | 2 (11.1%) |
| 75 Years and over | 1 (20.0%) | 0 (0.0%) |
| Total | 3 (2.9%) | 2 (2.2%) |
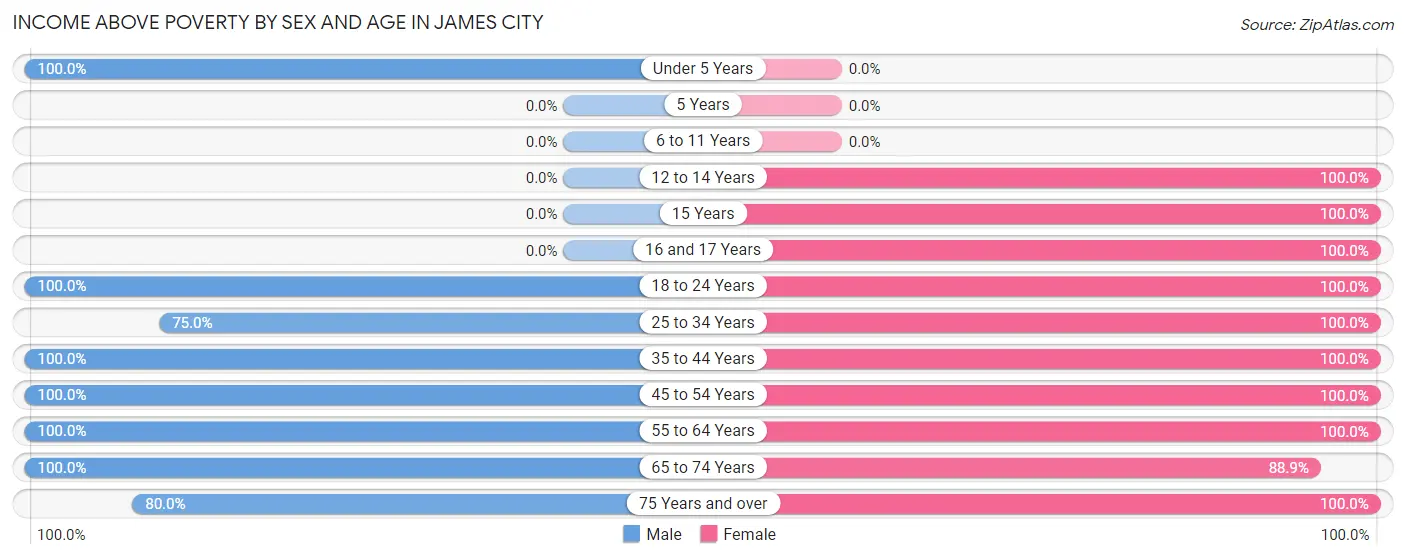
Income Above Poverty by Sex and Age in James City
According to the poverty statistics in James City, males aged under 5 years and females aged 12 to 14 years are the age groups that are most secure financially, with 100.0% of males and 100.0% of females in these age groups living above the poverty line.
| Age Bracket | Male | Female |
| Under 5 Years | 2 (100.0%) | 0 (0.0%) |
| 5 Years | 0 (0.0%) | 0 (0.0%) |
| 6 to 11 Years | 0 (0.0%) | 0 (0.0%) |
| 12 to 14 Years | 0 (0.0%) | 4 (100.0%) |
| 15 Years | 0 (0.0%) | 6 (100.0%) |
| 16 and 17 Years | 0 (0.0%) | 9 (100.0%) |
| 18 to 24 Years | 7 (100.0%) | 3 (100.0%) |
| 25 to 34 Years | 6 (75.0%) | 8 (100.0%) |
| 35 to 44 Years | 6 (100.0%) | 5 (100.0%) |
| 45 to 54 Years | 44 (100.0%) | 13 (100.0%) |
| 55 to 64 Years | 21 (100.0%) | 16 (100.0%) |
| 65 to 74 Years | 9 (100.0%) | 16 (88.9%) |
| 75 Years and over | 4 (80.0%) | 7 (100.0%) |
| Total | 99 (97.1%) | 87 (97.8%) |
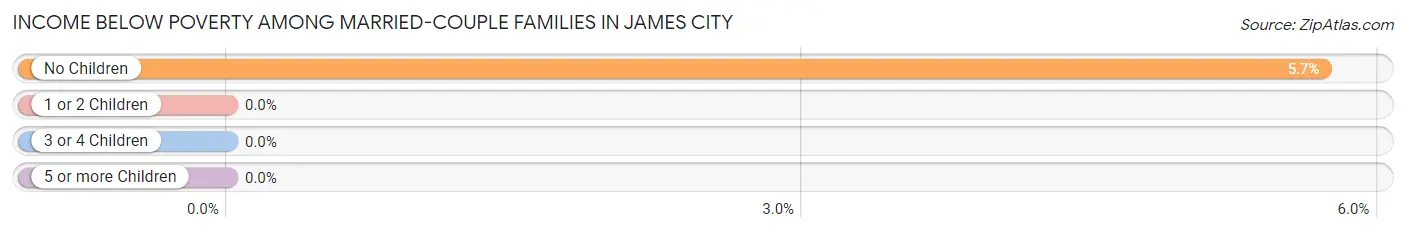
Income Below Poverty Among Married-Couple Families in James City
The poverty statistics for married-couple families in James City show that 5.0% or 2 of the total 40 families live below the poverty line. Families with no children have the highest poverty rate of 5.7%, comprising of 2 families. On the other hand, families with 1 or 2 children have the lowest poverty rate of 0.0%, which includes 0 families.
| Children | Above Poverty | Below Poverty |
| No Children | 33 (94.3%) | 2 (5.7%) |
| 1 or 2 Children | 5 (100.0%) | 0 (0.0%) |
| 3 or 4 Children | 0 (0.0%) | 0 (0.0%) |
| 5 or more Children | 0 (0.0%) | 0 (0.0%) |
| Total | 38 (95.0%) | 2 (5.0%) |
Income Below Poverty Among Single-Parent Households in James City
| Children | Single Father | Single Mother |
| No Children | 0 (0.0%) | 0 (0.0%) |
| 1 or 2 Children | 0 (0.0%) | 0 (0.0%) |
| 3 or 4 Children | 0 (0.0%) | 0 (0.0%) |
| 5 or more Children | 0 (0.0%) | 0 (0.0%) |
| Total | 0 (0.0%) | 0 (0.0%) |
Income Below Poverty Among Married-Couple vs Single-Parent Households in James City
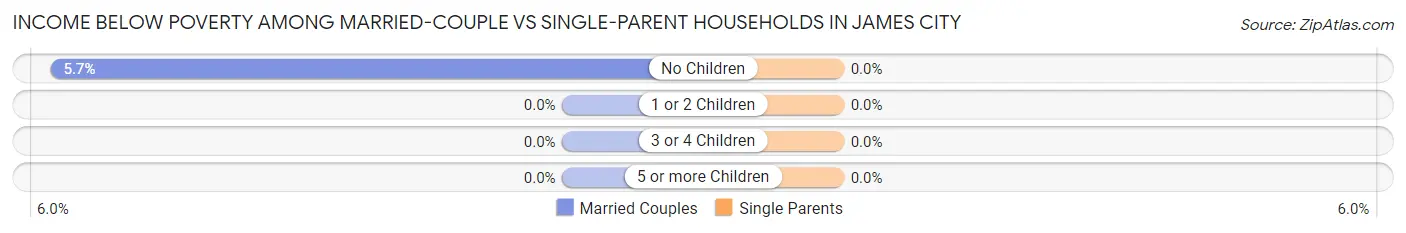
| Children | Married-Couple Families | Single-Parent Households |
| No Children | 2 (5.7%) | 0 (0.0%) |
| 1 or 2 Children | 0 (0.0%) | 0 (0.0%) |
| 3 or 4 Children | 0 (0.0%) | 0 (0.0%) |
| 5 or more Children | 0 (0.0%) | 0 (0.0%) |
| Total | 2 (5.0%) | 0 (0.0%) |
Race in James City
The most populous races in James City are White / Caucasian (189 | 97.4%), and Two or more Races (5 | 2.6%).
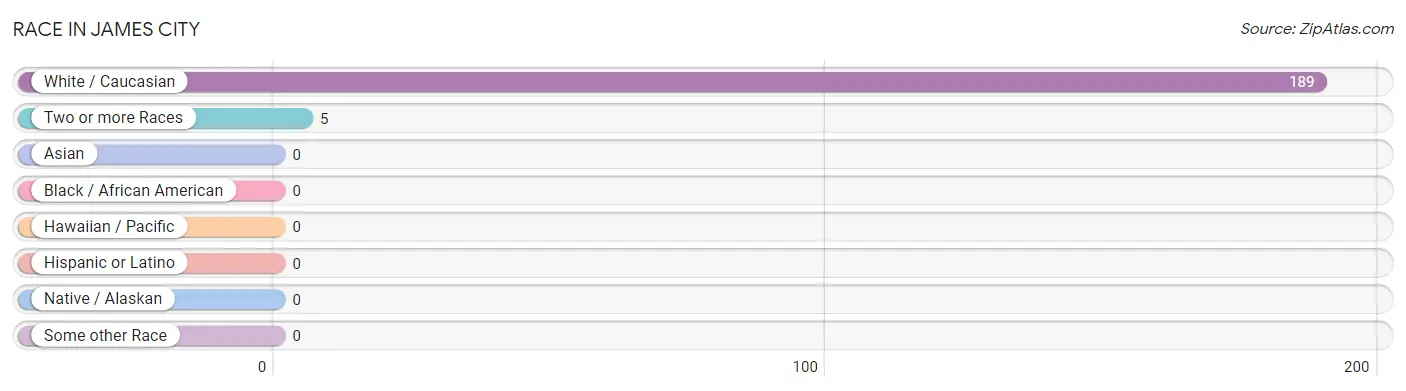
| Race | # Population | % Population |
| Asian | 0 | 0.0% |
| Black / African American | 0 | 0.0% |
| Hawaiian / Pacific | 0 | 0.0% |
| Hispanic or Latino | 0 | 0.0% |
| Native / Alaskan | 0 | 0.0% |
| White / Caucasian | 189 | 97.4% |
| Two or more Races | 5 | 2.6% |
| Some other Race | 0 | 0.0% |
| Total | 194 | 100.0% |
Ancestry in James City
The most populous ancestries reported in James City are Irish (42 | 21.6%), English (25 | 12.9%), German (25 | 12.9%), Swedish (24 | 12.4%), and American (16 | 8.3%), together accounting for 68.0% of all James City residents.
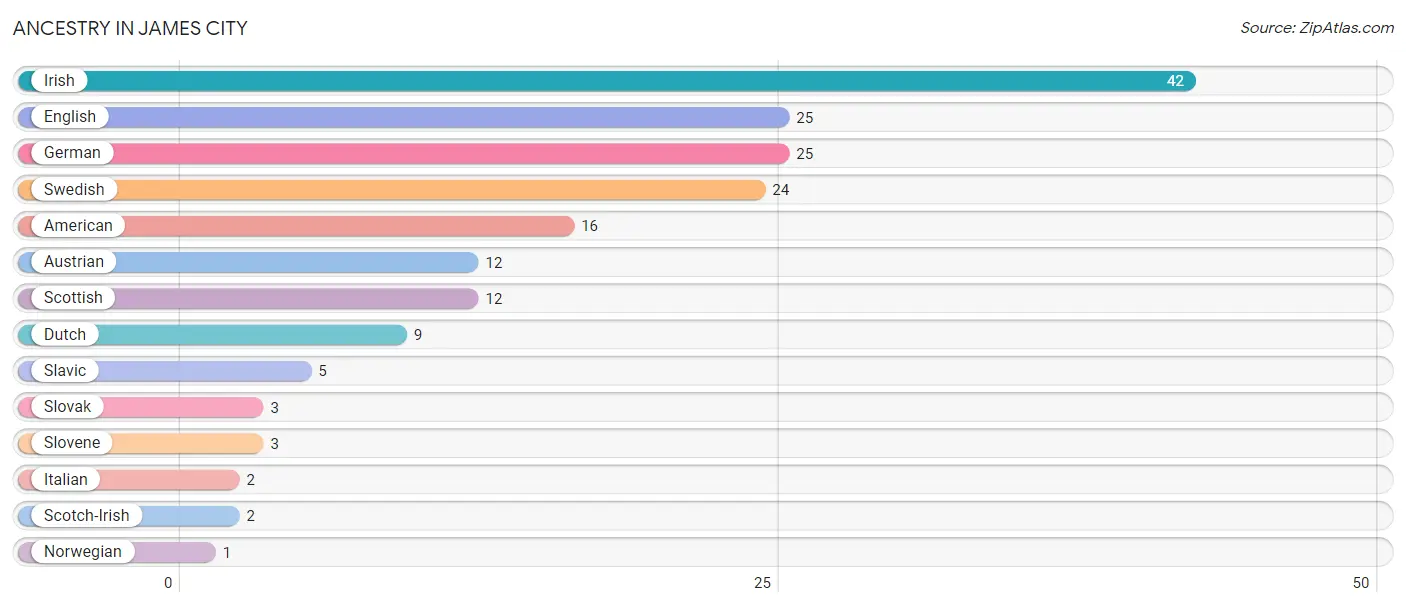
| Ancestry | # Population | % Population |
| American | 16 | 8.3% |
| Austrian | 12 | 6.2% |
| Dutch | 9 | 4.6% |
| English | 25 | 12.9% |
| German | 25 | 12.9% |
| Irish | 42 | 21.6% |
| Italian | 2 | 1.0% |
| Norwegian | 1 | 0.5% |
| Scotch-Irish | 2 | 1.0% |
| Scottish | 12 | 6.2% |
| Slavic | 5 | 2.6% |
| Slovak | 3 | 1.5% |
| Slovene | 3 | 1.5% |
| Swedish | 24 | 12.4% | View All 14 Rows |
Immigrants in James City

| Immigration Origin | # Population | % Population | View All 0 Rows |
Sex and Age in James City
Sex and Age in James City
The most populous age groups in James City are 45 to 49 Years (38 | 36.2%) for men and 15 to 19 Years (18 | 20.2%) for women.
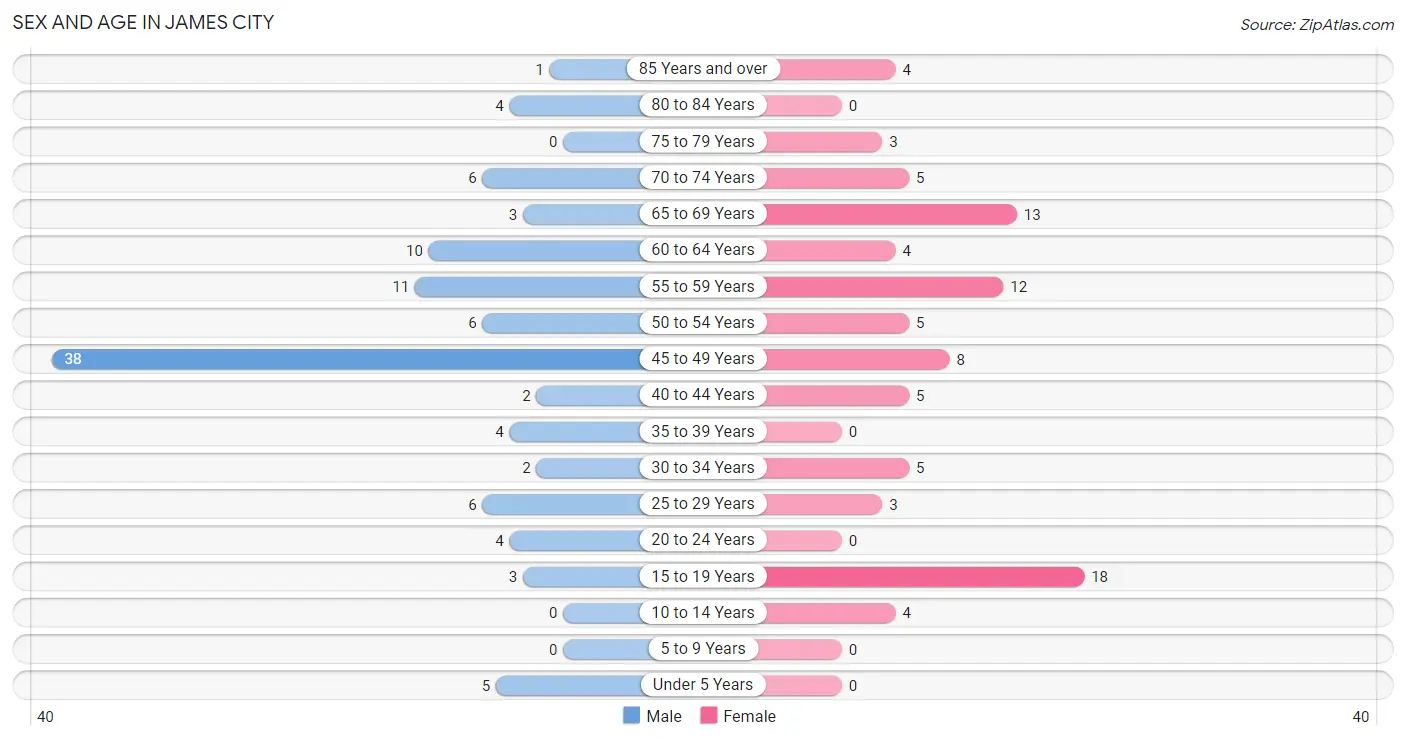
| Age Bracket | Male | Female |
| Under 5 Years | 5 (4.8%) | 0 (0.0%) |
| 5 to 9 Years | 0 (0.0%) | 0 (0.0%) |
| 10 to 14 Years | 0 (0.0%) | 4 (4.5%) |
| 15 to 19 Years | 3 (2.9%) | 18 (20.2%) |
| 20 to 24 Years | 4 (3.8%) | 0 (0.0%) |
| 25 to 29 Years | 6 (5.7%) | 3 (3.4%) |
| 30 to 34 Years | 2 (1.9%) | 5 (5.6%) |
| 35 to 39 Years | 4 (3.8%) | 0 (0.0%) |
| 40 to 44 Years | 2 (1.9%) | 5 (5.6%) |
| 45 to 49 Years | 38 (36.2%) | 8 (9.0%) |
| 50 to 54 Years | 6 (5.7%) | 5 (5.6%) |
| 55 to 59 Years | 11 (10.5%) | 12 (13.5%) |
| 60 to 64 Years | 10 (9.5%) | 4 (4.5%) |
| 65 to 69 Years | 3 (2.9%) | 13 (14.6%) |
| 70 to 74 Years | 6 (5.7%) | 5 (5.6%) |
| 75 to 79 Years | 0 (0.0%) | 3 (3.4%) |
| 80 to 84 Years | 4 (3.8%) | 0 (0.0%) |
| 85 Years and over | 1 (0.9%) | 4 (4.5%) |
| Total | 105 (100.0%) | 89 (100.0%) |
Families and Households in James City
Median Family Size in James City
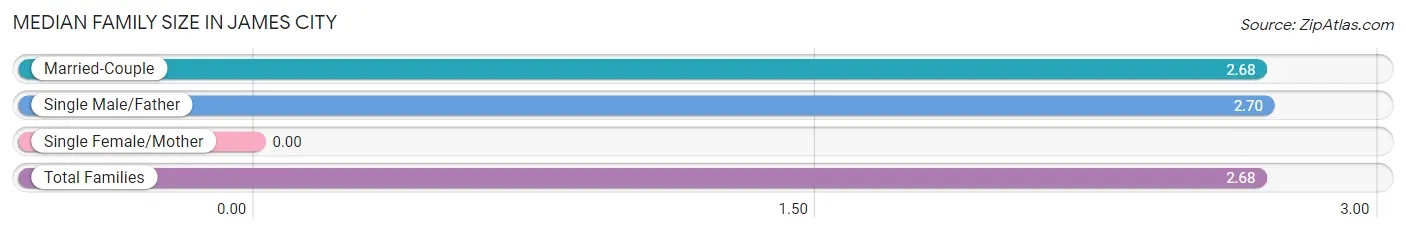
| Family Type | # Families | Family Size |
| Married-Couple | 40 (80.0%) | 2.68 |
| Single Male/Father | 10 (20.0%) | 2.70 |
| Single Female/Mother | 0 (0.0%) | - |
| Total Families | 50 (100.0%) | 2.68 |
Median Household Size in James City
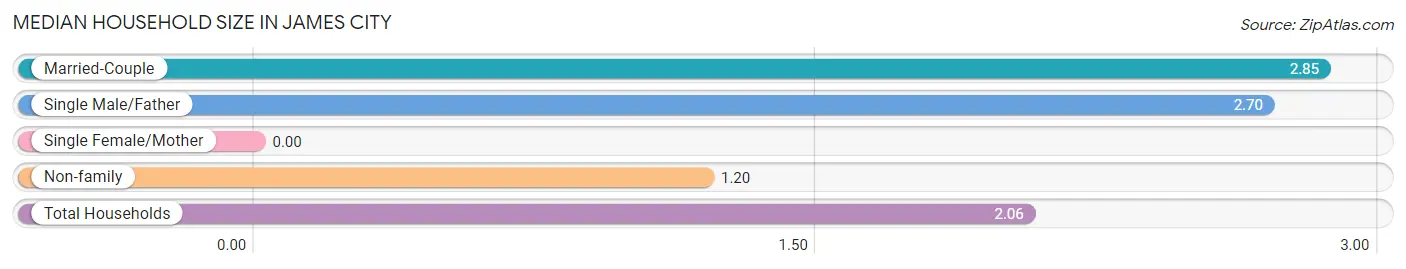
| Household Type | # Households | Household Size |
| Married-Couple | 40 (42.5%) | 2.85 |
| Single Male/Father | 10 (10.6%) | 2.70 |
| Single Female/Mother | 0 (0.0%) | - |
| Non-family | 44 (46.8%) | 1.20 |
| Total Households | 94 (100.0%) | 2.06 |
Household Size by Marriage Status in James City
Out of a total of 94 households in James City, 50 (53.2%) are family households, while 44 (46.8%) are nonfamily households. The most numerous type of family households are 2-person households, comprising 27, and the most common type of nonfamily households are 1-person households, comprising 31.
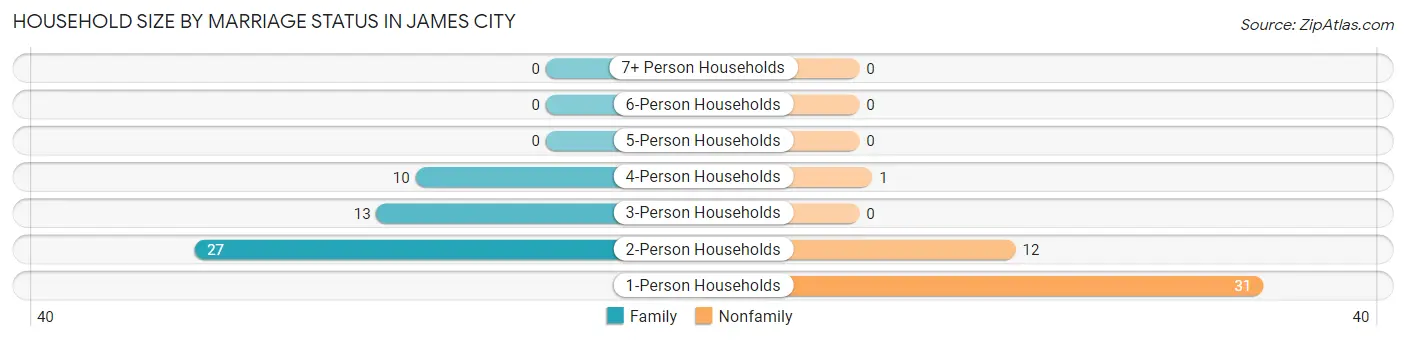
| Household Size | Family Households | Nonfamily Households |
| 1-Person Households | - | 31 (33.0%) |
| 2-Person Households | 27 (28.7%) | 12 (12.8%) |
| 3-Person Households | 13 (13.8%) | 0 (0.0%) |
| 4-Person Households | 10 (10.6%) | 1 (1.1%) |
| 5-Person Households | 0 (0.0%) | 0 (0.0%) |
| 6-Person Households | 0 (0.0%) | 0 (0.0%) |
| 7+ Person Households | 0 (0.0%) | 0 (0.0%) |
| Total | 50 (53.2%) | 44 (46.8%) |
Female Fertility in James City
Fertility by Age in James City
| Age Bracket | Women with Births | Births / 1,000 Women |
| 15 to 19 years | 0 (0.0%) | 0.0 |
| 20 to 34 years | 0 (0.0%) | 0.0 |
| 35 to 50 years | 0 (0.0%) | 0.0 |
| Total | 0 (0.0%) | 0.0 |
Fertility by Age by Marriage Status in James City
| Age Bracket | Married | Unmarried |
| 15 to 19 years | 0 (0.0%) | 0 (0.0%) |
| 20 to 34 years | 0 (0.0%) | 0 (0.0%) |
| 35 to 50 years | 0 (0.0%) | 0 (0.0%) |
| Total | 0 (0.0%) | 0 (0.0%) |
Fertility by Education in James City
| Educational Attainment | Women with Births | Births / 1,000 Women |
| Less than High School | 0 (0.0%) | 0.0 |
| High School Diploma | 0 (0.0%) | 0.0 |
| College or Associate's Degree | 0 (0.0%) | 0.0 |
| Bachelor's Degree | 0 (0.0%) | 0.0 |
| Graduate Degree | 0 (0.0%) | 0.0 |
| Total | 0 (0.0%) | 0.0 |
Fertility by Education by Marriage Status in James City
| Educational Attainment | Married | Unmarried |
| Less than High School | 0 (0.0%) | 0 (0.0%) |
| High School Diploma | 0 (0.0%) | 0 (0.0%) |
| College or Associate's Degree | 0 (0.0%) | 0 (0.0%) |
| Bachelor's Degree | 0 (0.0%) | 0 (0.0%) |
| Graduate Degree | 0 (0.0%) | 0 (0.0%) |
| Total | 0 (0.0%) | 0 (0.0%) |
Employment Characteristics in James City
Employment by Class of Employer in James City
Among the 97 employed individuals in James City, private company employees (86 | 88.7%), local government employees (4 | 4.1%), and not-for-profit organizations (3 | 3.1%) make up the most common classes of employment.
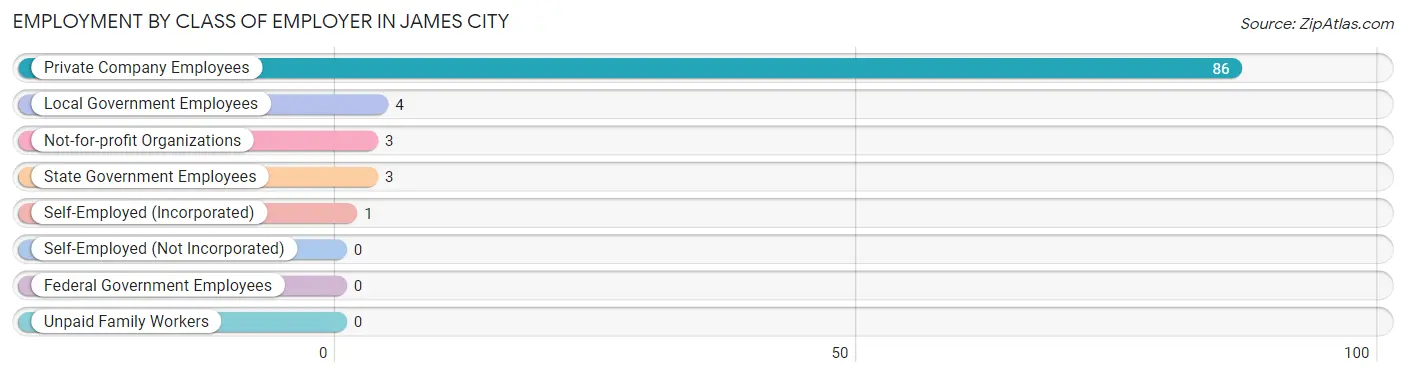
| Employer Class | # Employees | % Employees |
| Private Company Employees | 86 | 88.7% |
| Self-Employed (Incorporated) | 1 | 1.0% |
| Self-Employed (Not Incorporated) | 0 | 0.0% |
| Not-for-profit Organizations | 3 | 3.1% |
| Local Government Employees | 4 | 4.1% |
| State Government Employees | 3 | 3.1% |
| Federal Government Employees | 0 | 0.0% |
| Unpaid Family Workers | 0 | 0.0% |
| Total | 97 | 100.0% |
Employment Status by Age in James City
According to the labor force statistics for James City, out of the total population over 16 years of age (179), 59.8% or 107 individuals are in the labor force, with 4.7% or 5 of them unemployed. The age group with the highest labor force participation rate is 20 to 24 years, with 100.0% or 4 individuals in the labor force. Within the labor force, the 30 to 34 years age range has the highest percentage of unemployed individuals, with 71.4% or 5 of them being unemployed.
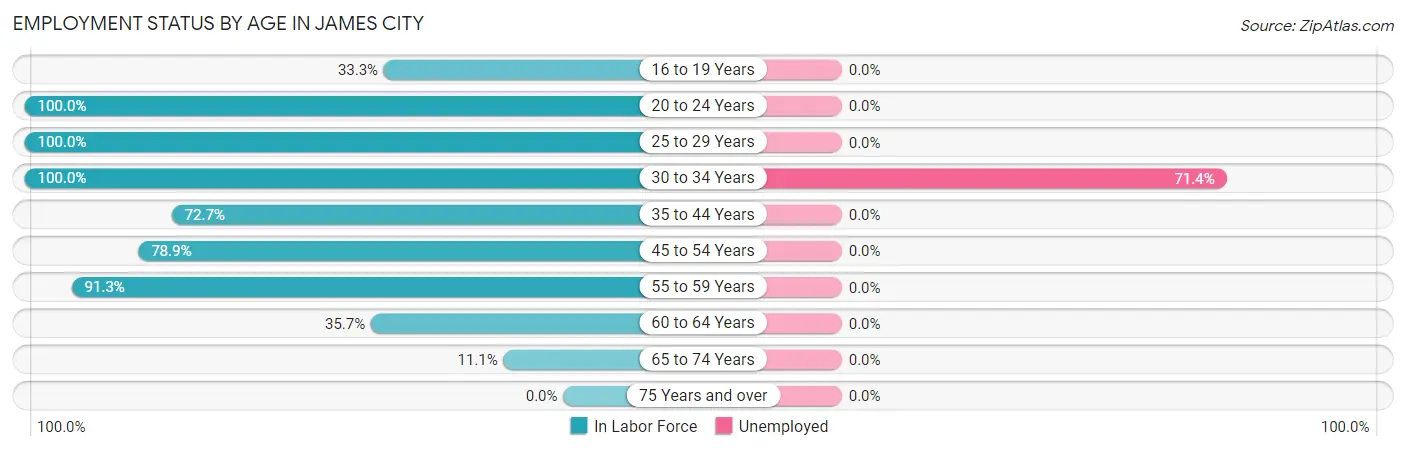
| Age Bracket | In Labor Force | Unemployed |
| 16 to 19 Years | 5 (33.3%) | 0 (0.0%) |
| 20 to 24 Years | 4 (100.0%) | 0 (0.0%) |
| 25 to 29 Years | 9 (100.0%) | 0 (0.0%) |
| 30 to 34 Years | 7 (100.0%) | 5 (71.4%) |
| 35 to 44 Years | 8 (72.7%) | 0 (0.0%) |
| 45 to 54 Years | 45 (78.9%) | 0 (0.0%) |
| 55 to 59 Years | 21 (91.3%) | 0 (0.0%) |
| 60 to 64 Years | 5 (35.7%) | 0 (0.0%) |
| 65 to 74 Years | 3 (11.1%) | 0 (0.0%) |
| 75 Years and over | 0 (0.0%) | 0 (0.0%) |
| Total | 107 (59.8%) | 5 (4.7%) |
Employment Status by Educational Attainment in James City
According to labor force statistics for James City, 78.5% of individuals (95) out of the total population between 25 and 64 years of age (121) are in the labor force, with 5.3% or 5 of them being unemployed. The group with the highest labor force participation rate are those with the educational attainment of less than high school, with 100.0% or 2 individuals in the labor force. Within the labor force, individuals with high school diploma education have the highest percentage of unemployment, with 7.2% or 5 of them being unemployed.
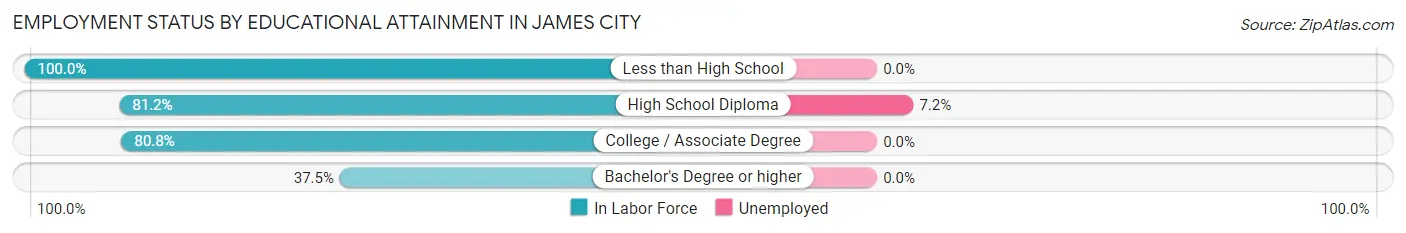
| Educational Attainment | In Labor Force | Unemployed |
| Less than High School | 2 (100.0%) | 0 (0.0%) |
| High School Diploma | 69 (81.2%) | 6 (7.2%) |
| College / Associate Degree | 21 (80.8%) | 0 (0.0%) |
| Bachelor's Degree or higher | 3 (37.5%) | 0 (0.0%) |
| Total | 95 (78.5%) | 6 (5.3%) |
Employment Occupations by Sex in James City
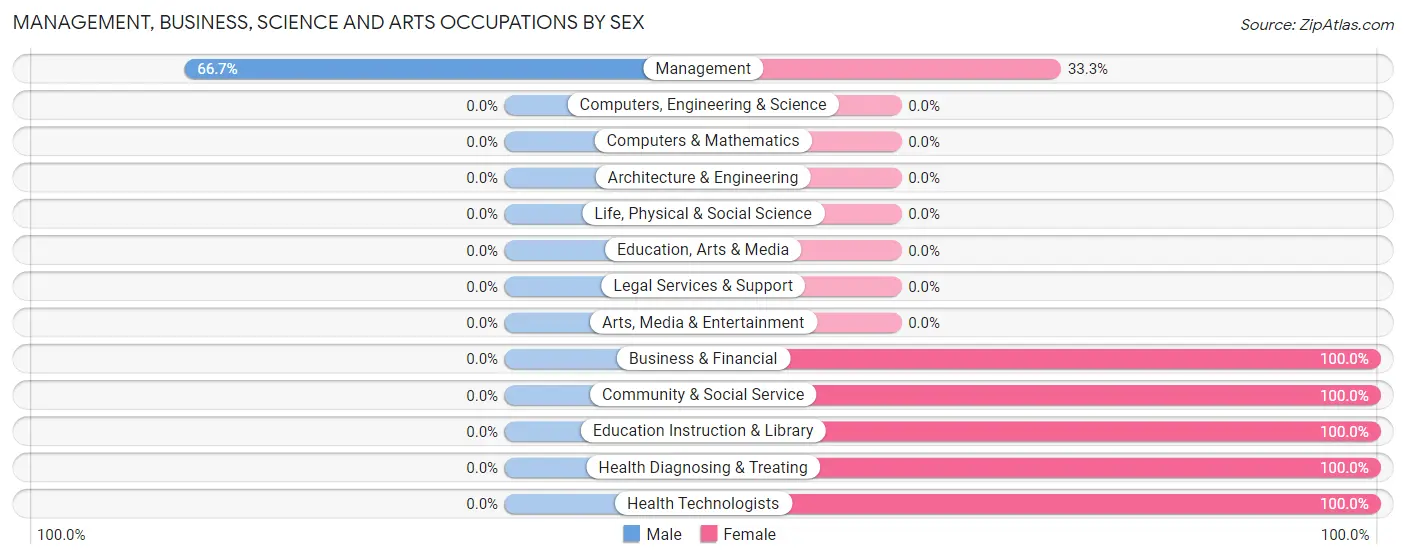
Management, Business, Science and Arts Occupations
The most common Management, Business, Science and Arts occupations in James City are Management (9 | 8.8%), Business & Financial (5 | 4.9%), Health Diagnosing & Treating (5 | 4.9%), Health Technologists (5 | 4.9%), and Community & Social Service (1 | 1.0%).
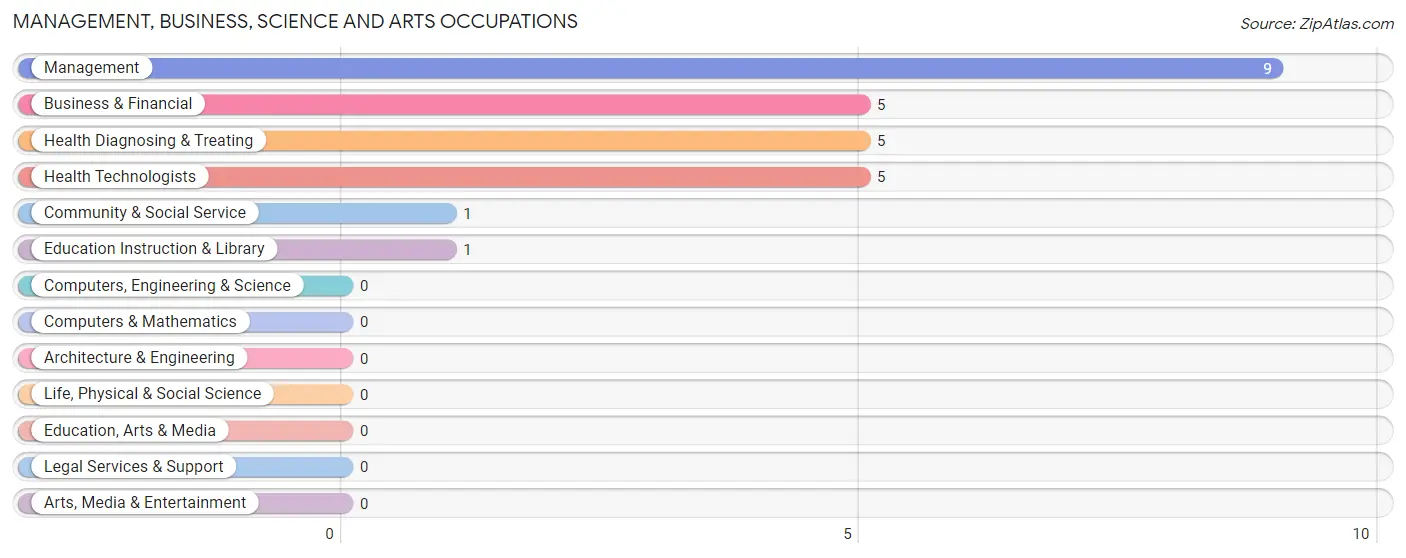
Management, Business, Science and Arts Occupations by Sex
| Occupation | Male | Female |
| Management | 6 (66.7%) | 3 (33.3%) |
| Business & Financial | 0 (0.0%) | 5 (100.0%) |
| Computers, Engineering & Science | 0 (0.0%) | 0 (0.0%) |
| Computers & Mathematics | 0 (0.0%) | 0 (0.0%) |
| Architecture & Engineering | 0 (0.0%) | 0 (0.0%) |
| Life, Physical & Social Science | 0 (0.0%) | 0 (0.0%) |
| Community & Social Service | 0 (0.0%) | 1 (100.0%) |
| Education, Arts & Media | 0 (0.0%) | 0 (0.0%) |
| Legal Services & Support | 0 (0.0%) | 0 (0.0%) |
| Education Instruction & Library | 0 (0.0%) | 1 (100.0%) |
| Arts, Media & Entertainment | 0 (0.0%) | 0 (0.0%) |
| Health Diagnosing & Treating | 0 (0.0%) | 5 (100.0%) |
| Health Technologists | 0 (0.0%) | 5 (100.0%) |
| Total (Category) | 6 (30.0%) | 14 (70.0%) |
| Total (Overall) | 74 (72.6%) | 28 (27.5%) |
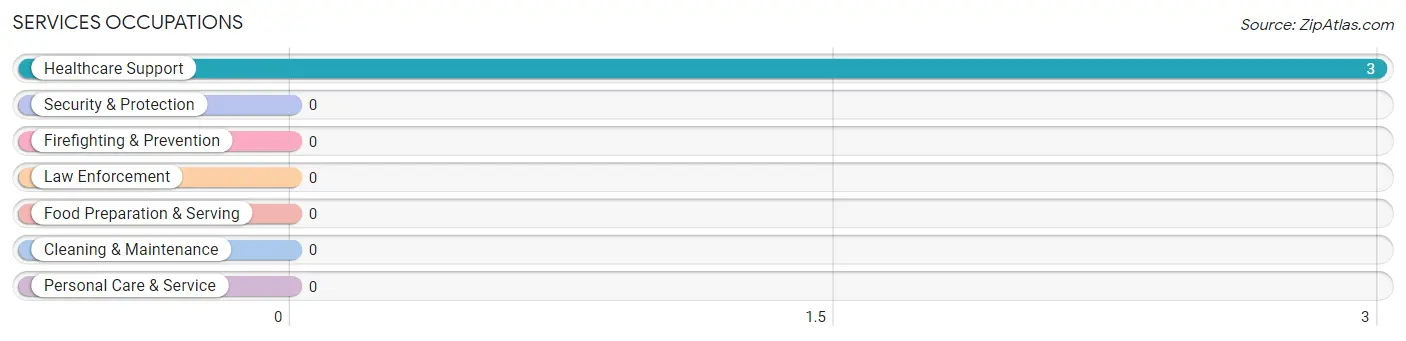
Services Occupations
The most common Services occupations in James City are , and Healthcare Support (3 | 2.9%).
Services Occupations by Sex
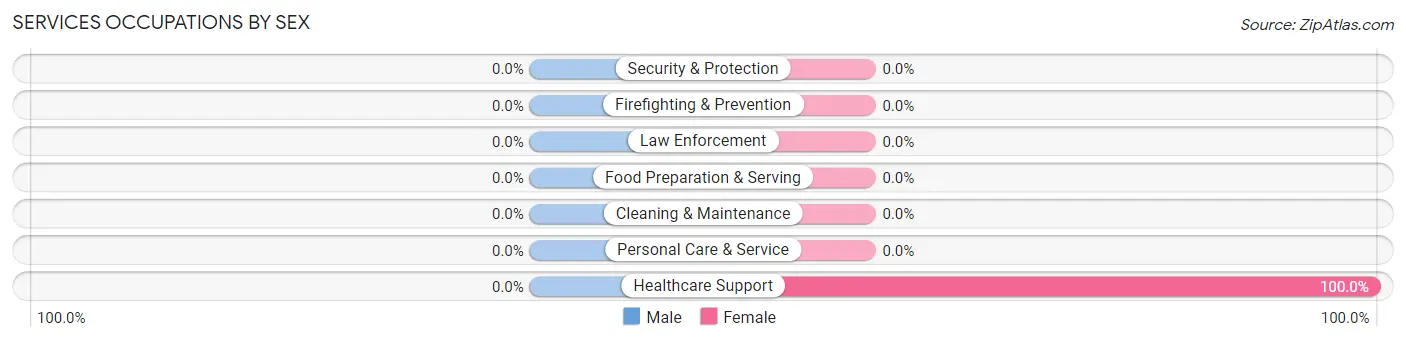
| Occupation | Male | Female |
| Healthcare Support | 0 (0.0%) | 3 (100.0%) |
| Security & Protection | 0 (0.0%) | 0 (0.0%) |
| Firefighting & Prevention | 0 (0.0%) | 0 (0.0%) |
| Law Enforcement | 0 (0.0%) | 0 (0.0%) |
| Food Preparation & Serving | 0 (0.0%) | 0 (0.0%) |
| Cleaning & Maintenance | 0 (0.0%) | 0 (0.0%) |
| Personal Care & Service | 0 (0.0%) | 0 (0.0%) |
| Total (Category) | 0 (0.0%) | 3 (100.0%) |
| Total (Overall) | 74 (72.6%) | 28 (27.5%) |
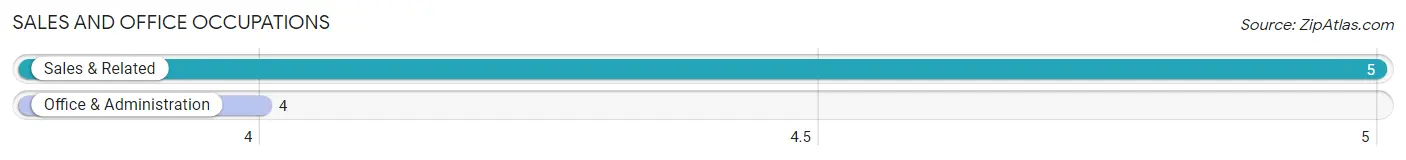
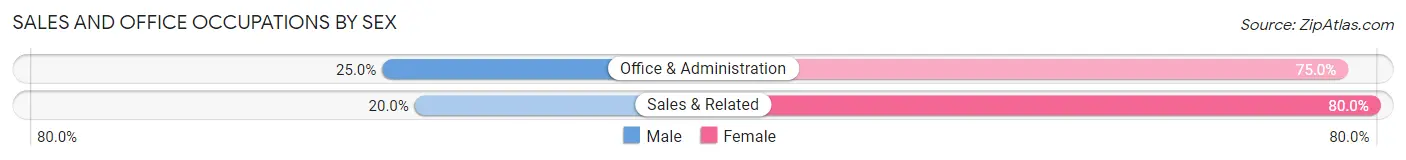
Sales and Office Occupations
The most common Sales and Office occupations in James City are Sales & Related (5 | 4.9%), and Office & Administration (4 | 3.9%).
Sales and Office Occupations by Sex
| Occupation | Male | Female |
| Sales & Related | 1 (20.0%) | 4 (80.0%) |
| Office & Administration | 1 (25.0%) | 3 (75.0%) |
| Total (Category) | 2 (22.2%) | 7 (77.8%) |
| Total (Overall) | 74 (72.6%) | 28 (27.5%) |
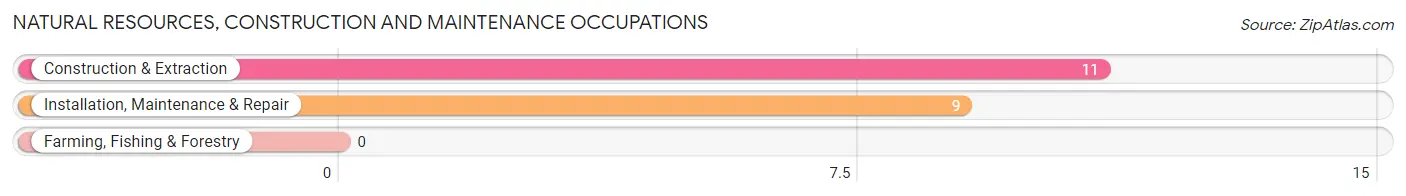
Natural Resources, Construction and Maintenance Occupations
The most common Natural Resources, Construction and Maintenance occupations in James City are Construction & Extraction (11 | 10.8%), and Installation, Maintenance & Repair (9 | 8.8%).
Natural Resources, Construction and Maintenance Occupations by Sex
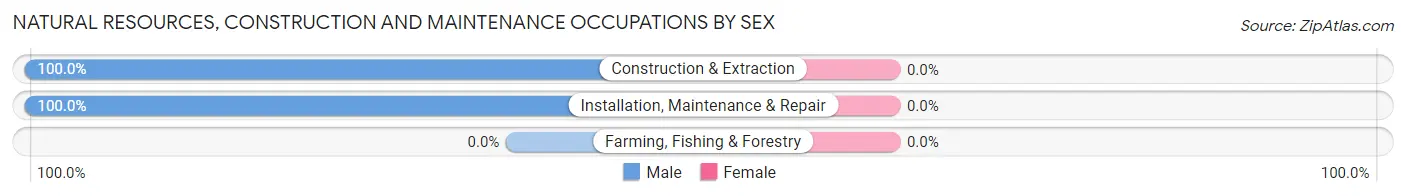
| Occupation | Male | Female |
| Farming, Fishing & Forestry | 0 (0.0%) | 0 (0.0%) |
| Construction & Extraction | 11 (100.0%) | 0 (0.0%) |
| Installation, Maintenance & Repair | 9 (100.0%) | 0 (0.0%) |
| Total (Category) | 20 (100.0%) | 0 (0.0%) |
| Total (Overall) | 74 (72.6%) | 28 (27.5%) |
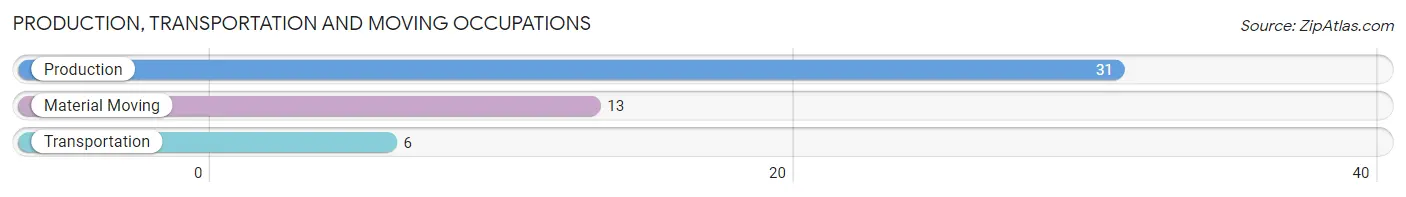
Production, Transportation and Moving Occupations
The most common Production, Transportation and Moving occupations in James City are Production (31 | 30.4%), Material Moving (13 | 12.8%), and Transportation (6 | 5.9%).
Production, Transportation and Moving Occupations by Sex
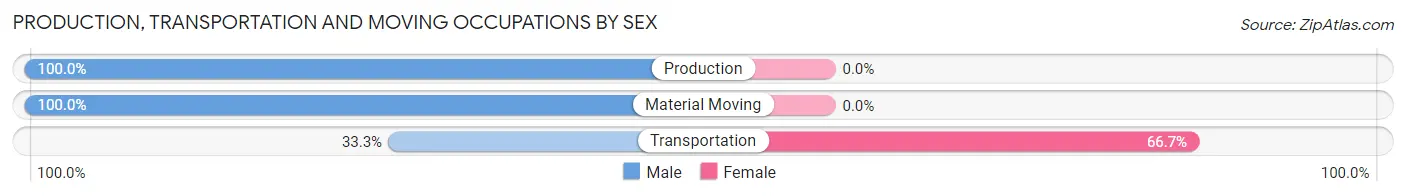
| Occupation | Male | Female |
| Production | 31 (100.0%) | 0 (0.0%) |
| Transportation | 2 (33.3%) | 4 (66.7%) |
| Material Moving | 13 (100.0%) | 0 (0.0%) |
| Total (Category) | 46 (92.0%) | 4 (8.0%) |
| Total (Overall) | 74 (72.6%) | 28 (27.5%) |
Employment Industries by Sex in James City
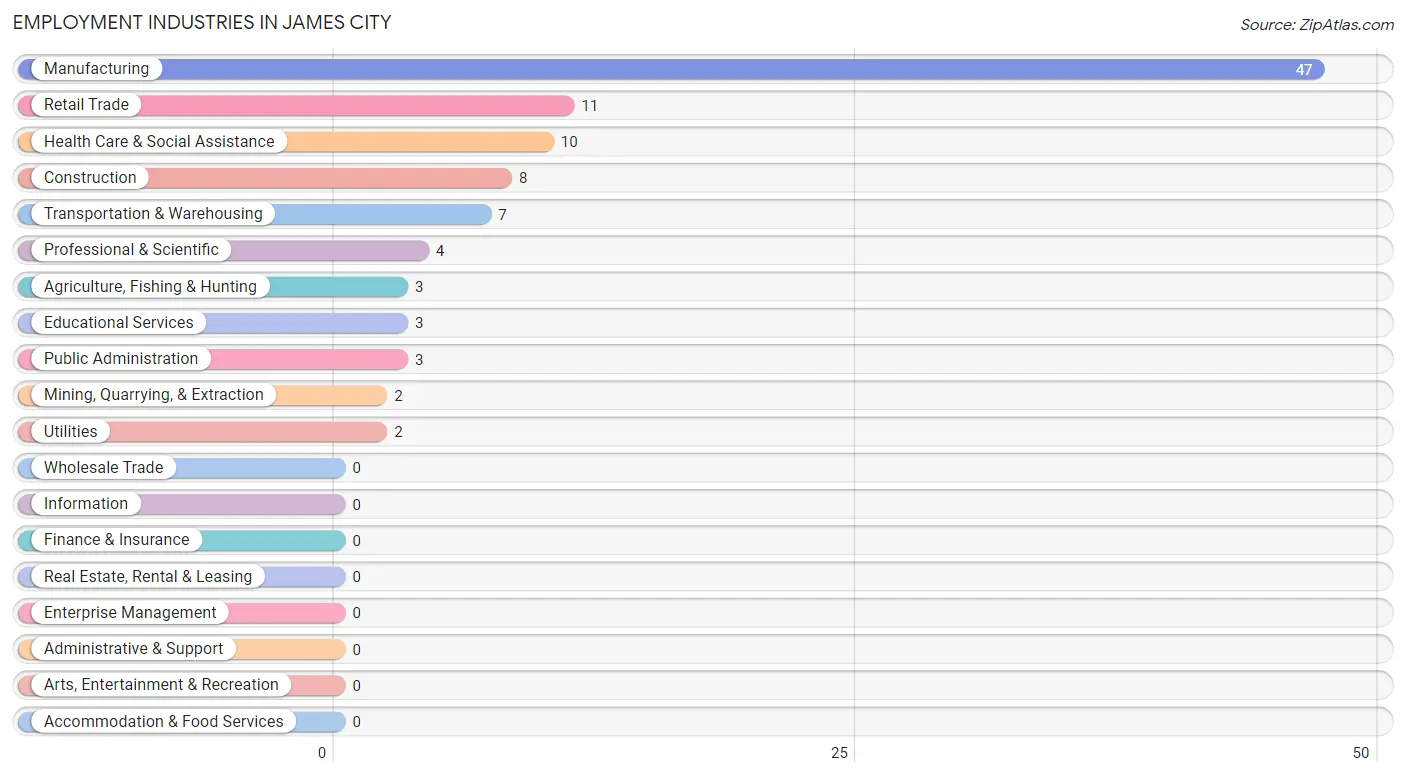
Employment Industries in James City
The major employment industries in James City include Manufacturing (47 | 46.1%), Retail Trade (11 | 10.8%), Health Care & Social Assistance (10 | 9.8%), Construction (8 | 7.8%), and Transportation & Warehousing (7 | 6.9%).
Employment Industries by Sex in James City
The James City industries that see more men than women are Agriculture, Fishing & Hunting (100.0%), Mining, Quarrying, & Extraction (100.0%), and Construction (100.0%), whereas the industries that tend to have a higher number of women are Utilities (100.0%), Educational Services (100.0%), and Health Care & Social Assistance (100.0%).
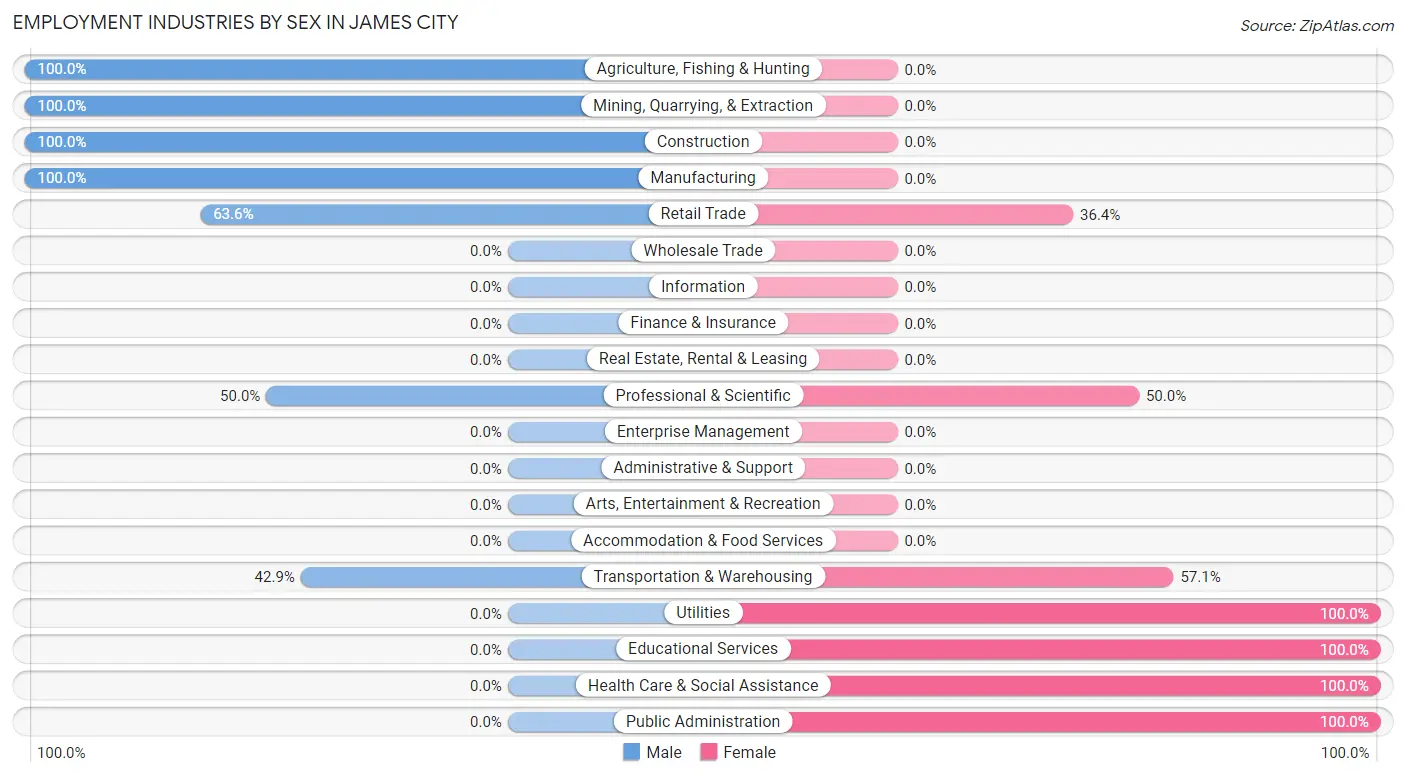
| Industry | Male | Female |
| Agriculture, Fishing & Hunting | 3 (100.0%) | 0 (0.0%) |
| Mining, Quarrying, & Extraction | 2 (100.0%) | 0 (0.0%) |
| Construction | 8 (100.0%) | 0 (0.0%) |
| Manufacturing | 47 (100.0%) | 0 (0.0%) |
| Wholesale Trade | 0 (0.0%) | 0 (0.0%) |
| Retail Trade | 7 (63.6%) | 4 (36.4%) |
| Transportation & Warehousing | 3 (42.9%) | 4 (57.1%) |
| Utilities | 0 (0.0%) | 2 (100.0%) |
| Information | 0 (0.0%) | 0 (0.0%) |
| Finance & Insurance | 0 (0.0%) | 0 (0.0%) |
| Real Estate, Rental & Leasing | 0 (0.0%) | 0 (0.0%) |
| Professional & Scientific | 2 (50.0%) | 2 (50.0%) |
| Enterprise Management | 0 (0.0%) | 0 (0.0%) |
| Administrative & Support | 0 (0.0%) | 0 (0.0%) |
| Educational Services | 0 (0.0%) | 3 (100.0%) |
| Health Care & Social Assistance | 0 (0.0%) | 10 (100.0%) |
| Arts, Entertainment & Recreation | 0 (0.0%) | 0 (0.0%) |
| Accommodation & Food Services | 0 (0.0%) | 0 (0.0%) |
| Public Administration | 0 (0.0%) | 3 (100.0%) |
| Total | 74 (72.6%) | 28 (27.5%) |
Education in James City
School Enrollment in James City
The most common levels of schooling among the 32 students in James City are high school (16 | 50.0%), college / undergraduate (7 | 21.9%), and nursery / preschool (5 | 15.6%).
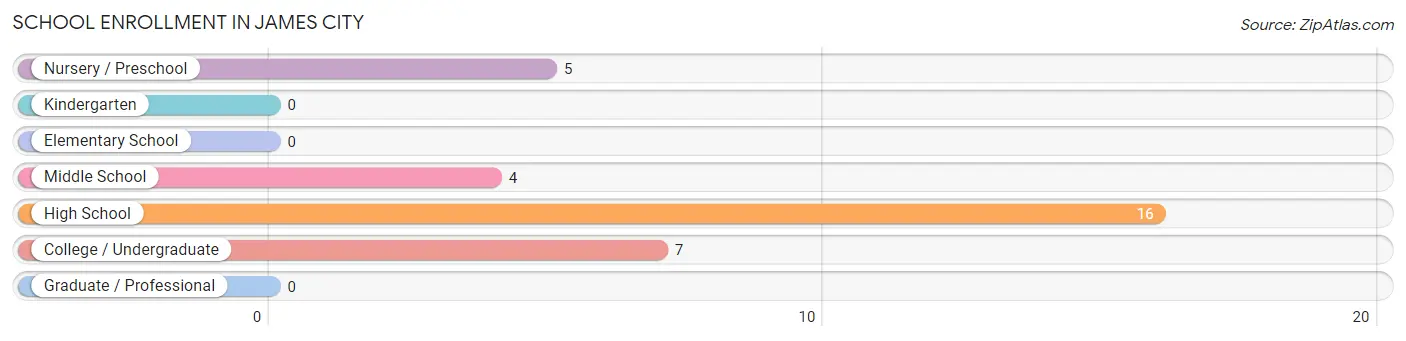
| School Level | # Students | % Students |
| Nursery / Preschool | 5 | 15.6% |
| Kindergarten | 0 | 0.0% |
| Elementary School | 0 | 0.0% |
| Middle School | 4 | 12.5% |
| High School | 16 | 50.0% |
| College / Undergraduate | 7 | 21.9% |
| Graduate / Professional | 0 | 0.0% |
| Total | 32 | 100.0% |
School Enrollment by Age by Funding Source in James City
Out of a total of 32 students who are enrolled in schools in James City, 3 (9.4%) attend a private institution, while the remaining 29 (90.6%) are enrolled in public schools. The age group of 3 to 4 year olds has the highest likelihood of being enrolled in private schools, with 2 (40.0% in the age bracket) enrolled. Conversely, the age group of 10 to 14 year olds has the lowest likelihood of being enrolled in a private school, with 4 (100.0% in the age bracket) attending a public institution.
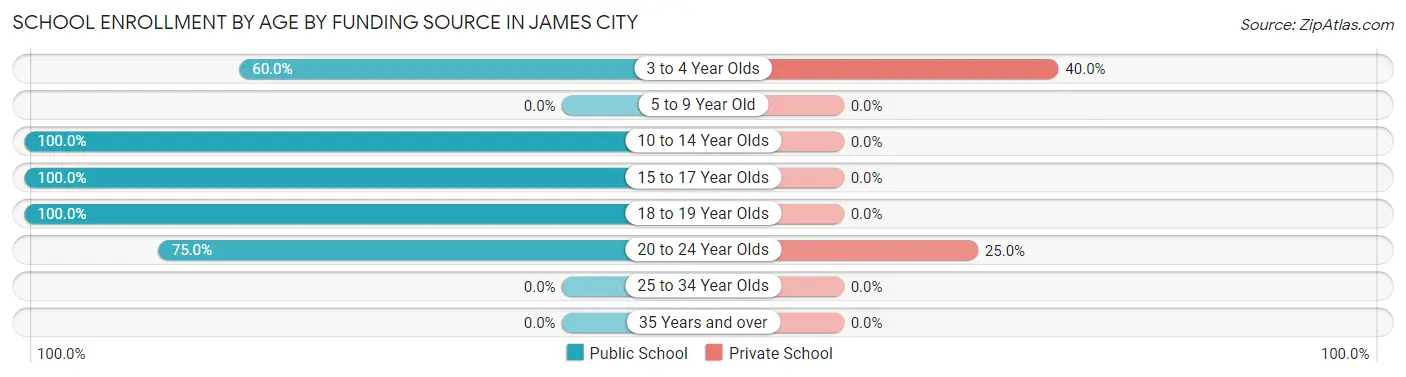
| Age Bracket | Public School | Private School |
| 3 to 4 Year Olds | 3 (60.0%) | 2 (40.0%) |
| 5 to 9 Year Old | 0 (0.0%) | 0 (0.0%) |
| 10 to 14 Year Olds | 4 (100.0%) | 0 (0.0%) |
| 15 to 17 Year Olds | 15 (100.0%) | 0 (0.0%) |
| 18 to 19 Year Olds | 4 (100.0%) | 0 (0.0%) |
| 20 to 24 Year Olds | 3 (75.0%) | 1 (25.0%) |
| 25 to 34 Year Olds | 0 (0.0%) | 0 (0.0%) |
| 35 Years and over | 0 (0.0%) | 0 (0.0%) |
| Total | 29 (90.6%) | 3 (9.4%) |
Educational Attainment by Field of Study in James City
Science & technology (3 | 37.5%), education (3 | 37.5%), and arts & humanities (2 | 25.0%) are the most common fields of study among 8 individuals in James City who have obtained a bachelor's degree or higher.
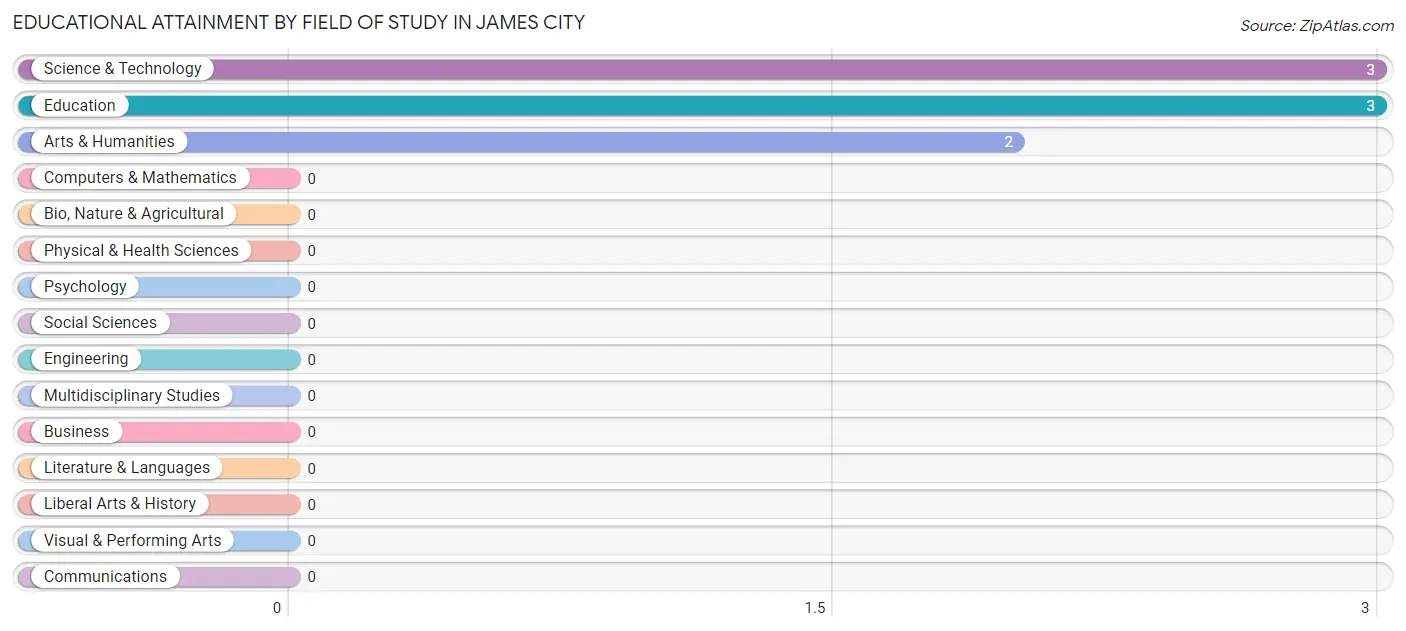
| Field of Study | # Graduates | % Graduates |
| Computers & Mathematics | 0 | 0.0% |
| Bio, Nature & Agricultural | 0 | 0.0% |
| Physical & Health Sciences | 0 | 0.0% |
| Psychology | 0 | 0.0% |
| Social Sciences | 0 | 0.0% |
| Engineering | 0 | 0.0% |
| Multidisciplinary Studies | 0 | 0.0% |
| Science & Technology | 3 | 37.5% |
| Business | 0 | 0.0% |
| Education | 3 | 37.5% |
| Literature & Languages | 0 | 0.0% |
| Liberal Arts & History | 0 | 0.0% |
| Visual & Performing Arts | 0 | 0.0% |
| Communications | 0 | 0.0% |
| Arts & Humanities | 2 | 25.0% |
| Total | 8 | 100.0% |
Transportation & Commute in James City
Vehicle Availability by Sex in James City
The most prevalent vehicle ownership categories in James City are males with 2 vehicles (40, accounting for 54.0%) and females with 2 vehicles (6, making up 173.9%).
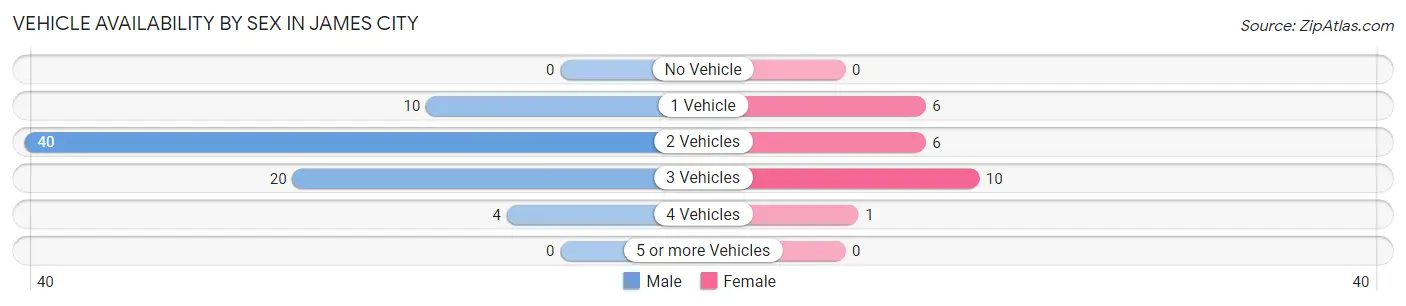
| Vehicles Available | Male | Female |
| No Vehicle | 0 (0.0%) | 0 (0.0%) |
| 1 Vehicle | 10 (13.5%) | 6 (26.1%) |
| 2 Vehicles | 40 (54.0%) | 6 (26.1%) |
| 3 Vehicles | 20 (27.0%) | 10 (43.5%) |
| 4 Vehicles | 4 (5.4%) | 1 (4.3%) |
| 5 or more Vehicles | 0 (0.0%) | 0 (0.0%) |
| Total | 74 (100.0%) | 23 (100.0%) |
Commute Time in James City
The most frequently occuring commute durations in James City are 15 to 19 minutes (18 commuters, 19.2%), 45 to 59 minutes (18 commuters, 19.2%), and 30 to 34 minutes (11 commuters, 11.7%).
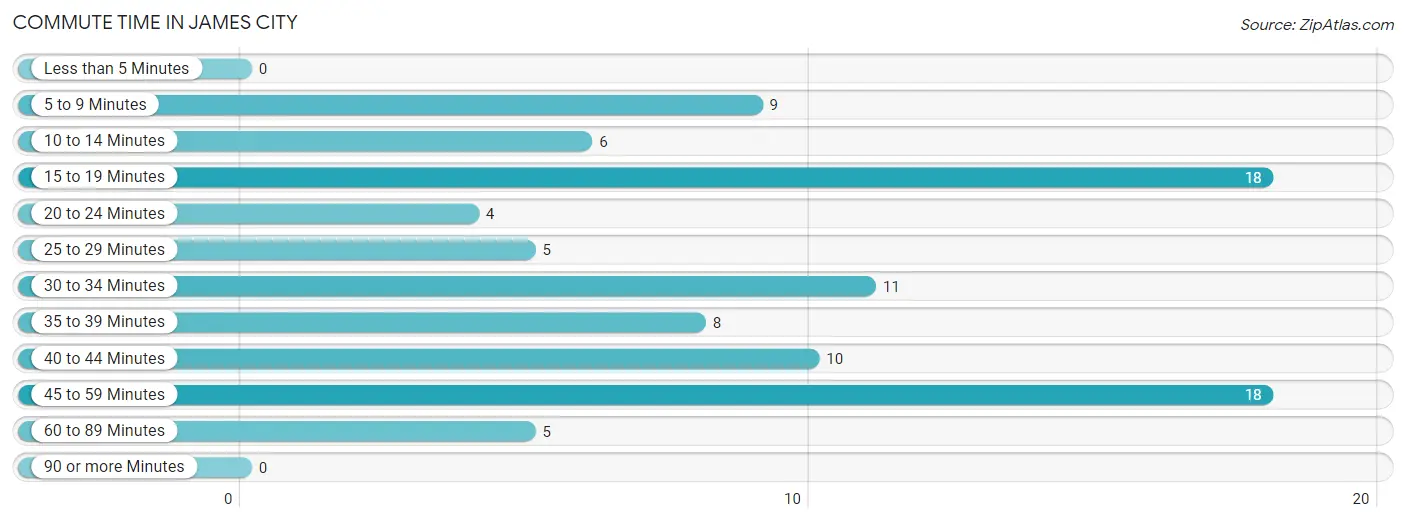
| Commute Time | # Commuters | % Commuters |
| Less than 5 Minutes | 0 | 0.0% |
| 5 to 9 Minutes | 9 | 9.6% |
| 10 to 14 Minutes | 6 | 6.4% |
| 15 to 19 Minutes | 18 | 19.2% |
| 20 to 24 Minutes | 4 | 4.3% |
| 25 to 29 Minutes | 5 | 5.3% |
| 30 to 34 Minutes | 11 | 11.7% |
| 35 to 39 Minutes | 8 | 8.5% |
| 40 to 44 Minutes | 10 | 10.6% |
| 45 to 59 Minutes | 18 | 19.2% |
| 60 to 89 Minutes | 5 | 5.3% |
| 90 or more Minutes | 0 | 0.0% |
Commute Time by Sex in James City
The most common commute times in James City are 45 to 59 minutes (16 commuters, 21.6%) for males and 10 to 14 minutes (6 commuters, 30.0%) for females.
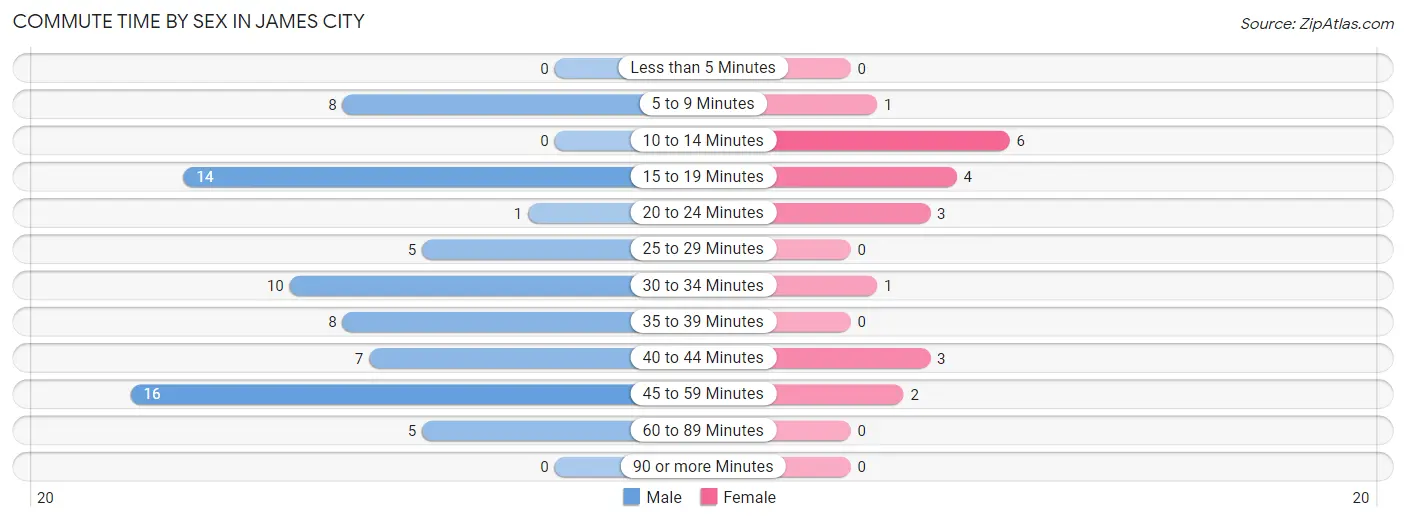
| Commute Time | Male | Female |
| Less than 5 Minutes | 0 (0.0%) | 0 (0.0%) |
| 5 to 9 Minutes | 8 (10.8%) | 1 (5.0%) |
| 10 to 14 Minutes | 0 (0.0%) | 6 (30.0%) |
| 15 to 19 Minutes | 14 (18.9%) | 4 (20.0%) |
| 20 to 24 Minutes | 1 (1.3%) | 3 (15.0%) |
| 25 to 29 Minutes | 5 (6.8%) | 0 (0.0%) |
| 30 to 34 Minutes | 10 (13.5%) | 1 (5.0%) |
| 35 to 39 Minutes | 8 (10.8%) | 0 (0.0%) |
| 40 to 44 Minutes | 7 (9.5%) | 3 (15.0%) |
| 45 to 59 Minutes | 16 (21.6%) | 2 (10.0%) |
| 60 to 89 Minutes | 5 (6.8%) | 0 (0.0%) |
| 90 or more Minutes | 0 (0.0%) | 0 (0.0%) |
Time of Departure to Work by Sex in James City
The most frequent times of departure to work in James City are 5:30 AM to 5:59 AM (16, 21.6%) for males and 7:00 AM to 7:29 AM (12, 60.0%) for females.
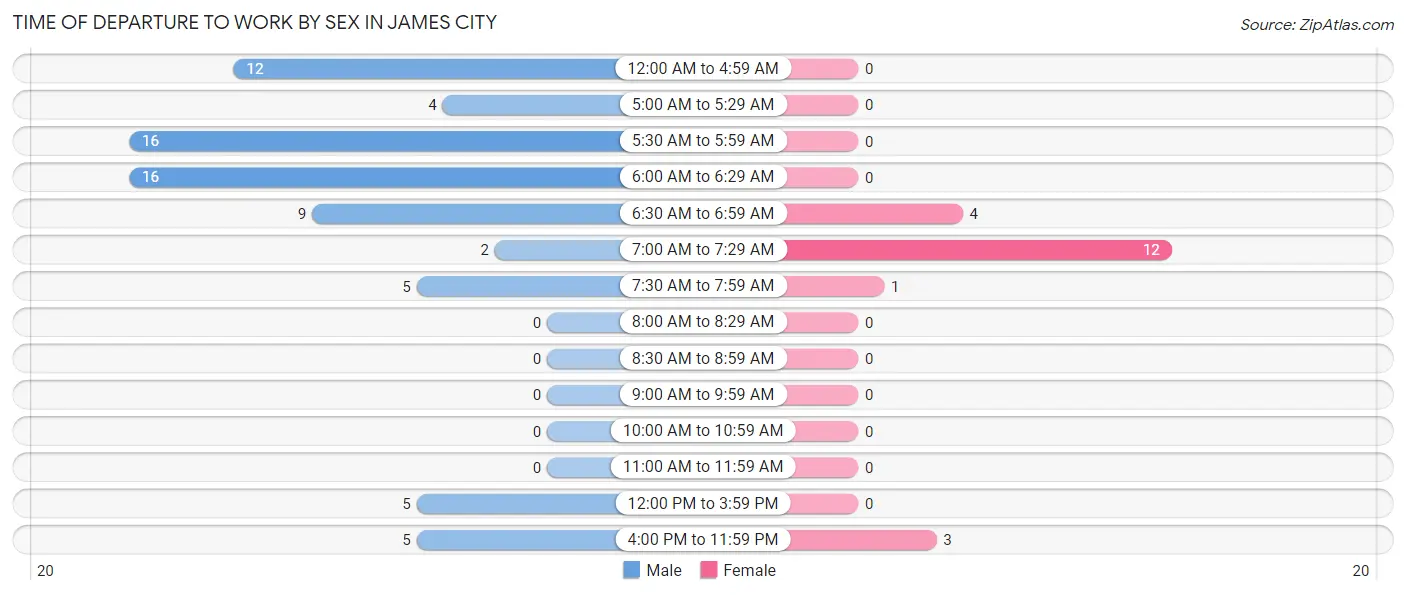
| Time of Departure | Male | Female |
| 12:00 AM to 4:59 AM | 12 (16.2%) | 0 (0.0%) |
| 5:00 AM to 5:29 AM | 4 (5.4%) | 0 (0.0%) |
| 5:30 AM to 5:59 AM | 16 (21.6%) | 0 (0.0%) |
| 6:00 AM to 6:29 AM | 16 (21.6%) | 0 (0.0%) |
| 6:30 AM to 6:59 AM | 9 (12.2%) | 4 (20.0%) |
| 7:00 AM to 7:29 AM | 2 (2.7%) | 12 (60.0%) |
| 7:30 AM to 7:59 AM | 5 (6.8%) | 1 (5.0%) |
| 8:00 AM to 8:29 AM | 0 (0.0%) | 0 (0.0%) |
| 8:30 AM to 8:59 AM | 0 (0.0%) | 0 (0.0%) |
| 9:00 AM to 9:59 AM | 0 (0.0%) | 0 (0.0%) |
| 10:00 AM to 10:59 AM | 0 (0.0%) | 0 (0.0%) |
| 11:00 AM to 11:59 AM | 0 (0.0%) | 0 (0.0%) |
| 12:00 PM to 3:59 PM | 5 (6.8%) | 0 (0.0%) |
| 4:00 PM to 11:59 PM | 5 (6.8%) | 3 (15.0%) |
| Total | 74 (100.0%) | 20 (100.0%) |
Housing Occupancy in James City
Occupancy by Ownership in James City
Of the total 94 dwellings in James City, owner-occupied units account for 67 (71.3%), while renter-occupied units make up 27 (28.7%).
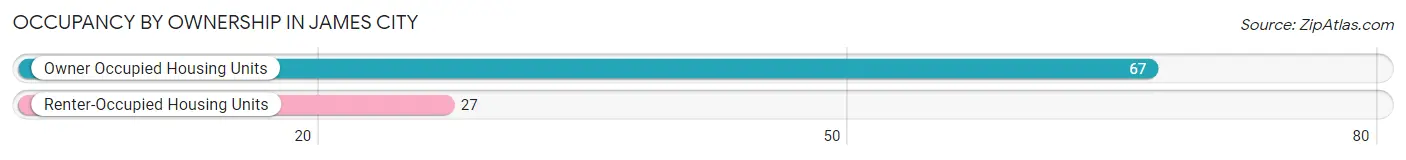
| Occupancy | # Housing Units | % Housing Units |
| Owner Occupied Housing Units | 67 | 71.3% |
| Renter-Occupied Housing Units | 27 | 28.7% |
| Total Occupied Housing Units | 94 | 100.0% |
Occupancy by Household Size in James City
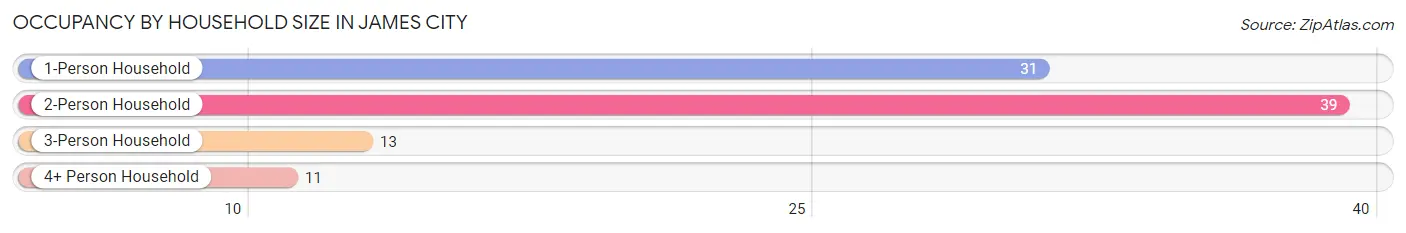
| Household Size | # Housing Units | % Housing Units |
| 1-Person Household | 31 | 33.0% |
| 2-Person Household | 39 | 41.5% |
| 3-Person Household | 13 | 13.8% |
| 4+ Person Household | 11 | 11.7% |
| Total Housing Units | 94 | 100.0% |
Occupancy by Ownership by Household Size in James City
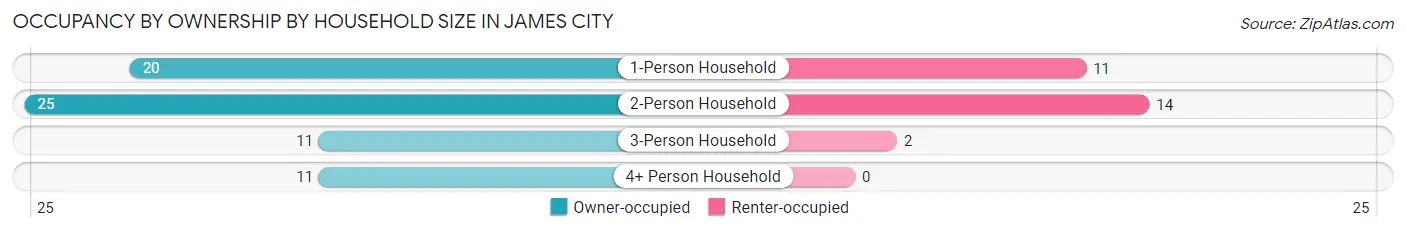
| Household Size | Owner-occupied | Renter-occupied |
| 1-Person Household | 20 (64.5%) | 11 (35.5%) |
| 2-Person Household | 25 (64.1%) | 14 (35.9%) |
| 3-Person Household | 11 (84.6%) | 2 (15.4%) |
| 4+ Person Household | 11 (100.0%) | 0 (0.0%) |
| Total Housing Units | 67 (71.3%) | 27 (28.7%) |
Occupancy by Educational Attainment in James City
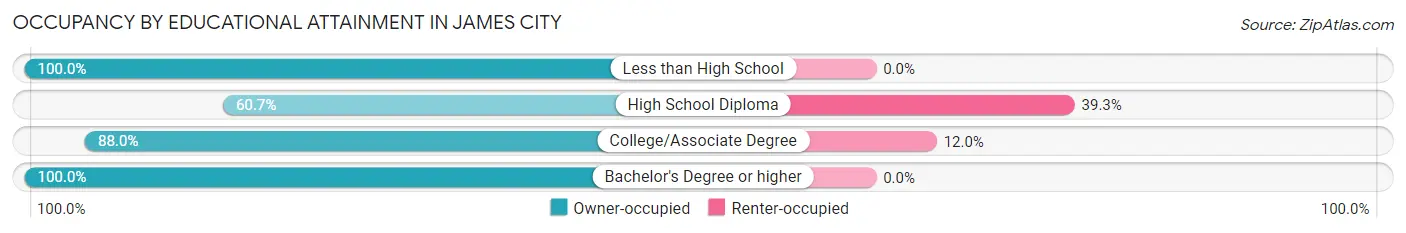
| Household Size | Owner-occupied | Renter-occupied |
| Less than High School | 2 (100.0%) | 0 (0.0%) |
| High School Diploma | 37 (60.7%) | 24 (39.3%) |
| College/Associate Degree | 22 (88.0%) | 3 (12.0%) |
| Bachelor's Degree or higher | 6 (100.0%) | 0 (0.0%) |
Occupancy by Age of Householder in James City
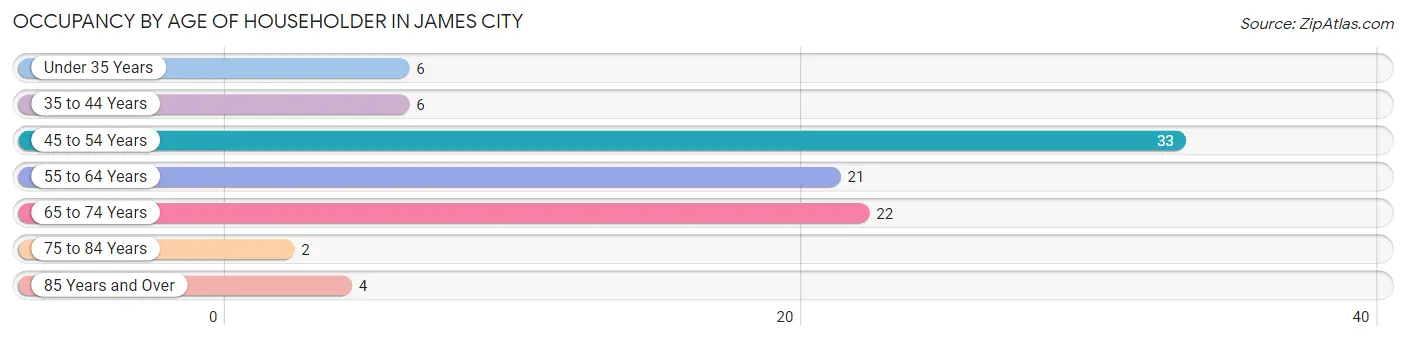
| Age Bracket | # Households | % Households |
| Under 35 Years | 6 | 6.4% |
| 35 to 44 Years | 6 | 6.4% |
| 45 to 54 Years | 33 | 35.1% |
| 55 to 64 Years | 21 | 22.3% |
| 65 to 74 Years | 22 | 23.4% |
| 75 to 84 Years | 2 | 2.1% |
| 85 Years and Over | 4 | 4.3% |
| Total | 94 | 100.0% |
Housing Finances in James City
Median Income by Occupancy in James City
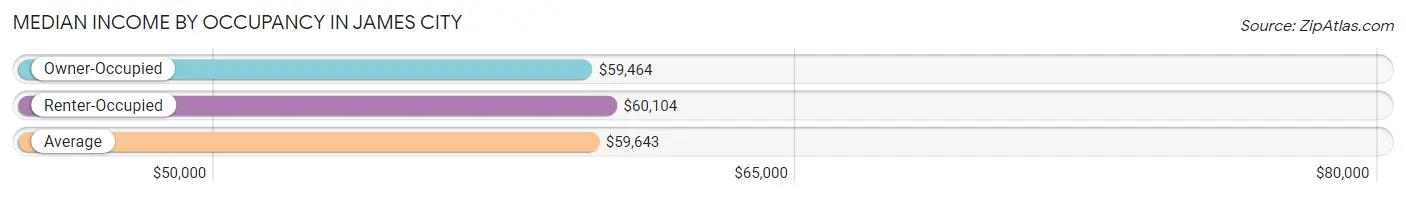
| Occupancy Type | # Households | Median Income |
| Owner-Occupied | 67 (71.3%) | $59,464 |
| Renter-Occupied | 27 (28.7%) | $60,104 |
| Average | 94 (100.0%) | $59,643 |
Occupancy by Householder Income Bracket in James City
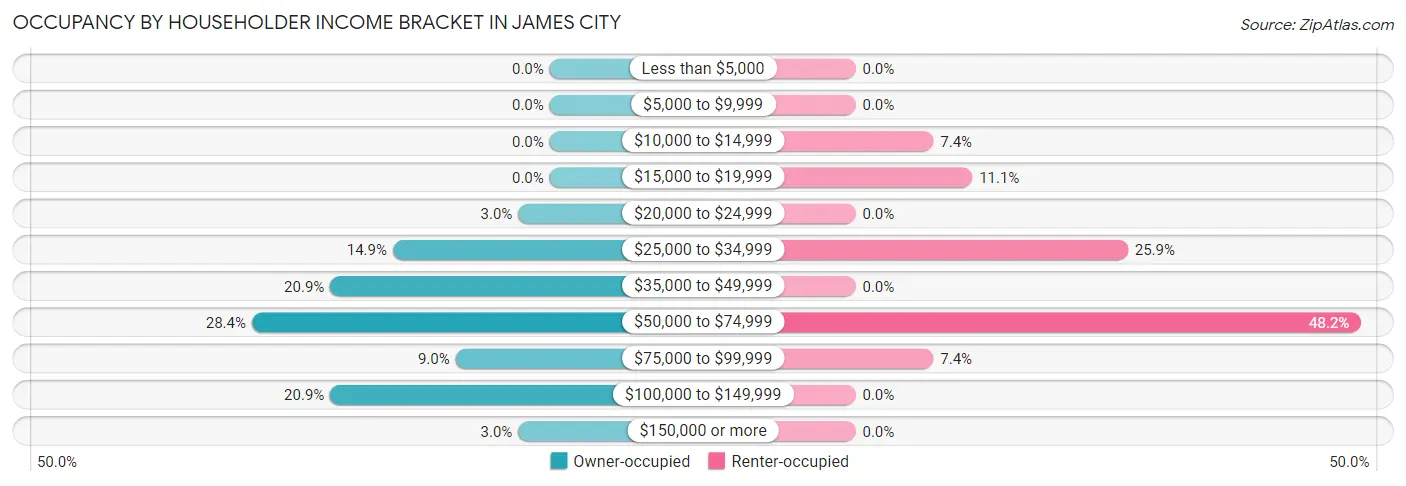
| Income Bracket | Owner-occupied | Renter-occupied |
| Less than $5,000 | 0 (0.0%) | 0 (0.0%) |
| $5,000 to $9,999 | 0 (0.0%) | 0 (0.0%) |
| $10,000 to $14,999 | 0 (0.0%) | 2 (7.4%) |
| $15,000 to $19,999 | 0 (0.0%) | 3 (11.1%) |
| $20,000 to $24,999 | 2 (3.0%) | 0 (0.0%) |
| $25,000 to $34,999 | 10 (14.9%) | 7 (25.9%) |
| $35,000 to $49,999 | 14 (20.9%) | 0 (0.0%) |
| $50,000 to $74,999 | 19 (28.4%) | 13 (48.1%) |
| $75,000 to $99,999 | 6 (9.0%) | 2 (7.4%) |
| $100,000 to $149,999 | 14 (20.9%) | 0 (0.0%) |
| $150,000 or more | 2 (3.0%) | 0 (0.0%) |
| Total | 67 (100.0%) | 27 (100.0%) |
Monthly Housing Cost Tiers in James City
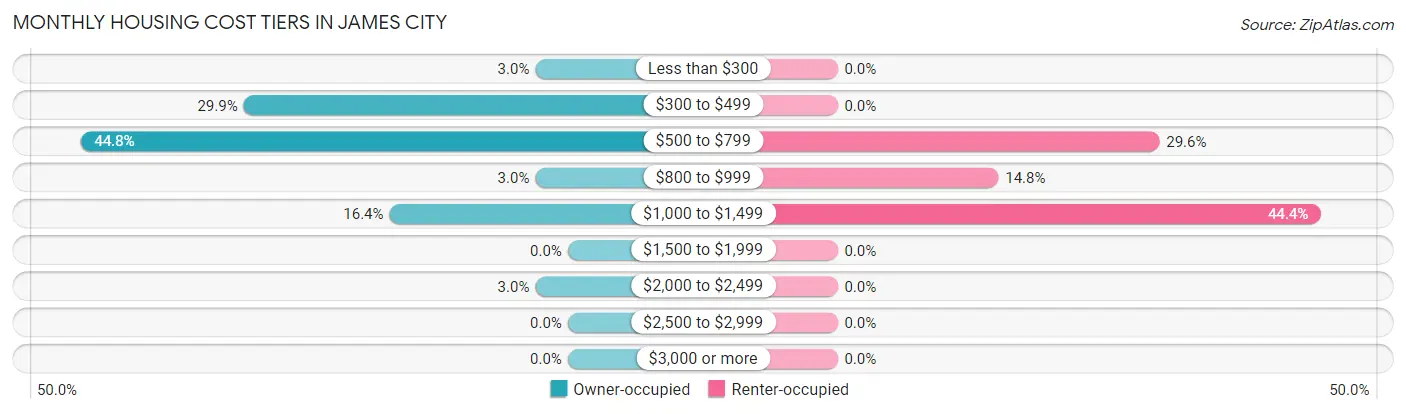
| Monthly Cost | Owner-occupied | Renter-occupied |
| Less than $300 | 2 (3.0%) | 0 (0.0%) |
| $300 to $499 | 20 (29.8%) | 0 (0.0%) |
| $500 to $799 | 30 (44.8%) | 8 (29.6%) |
| $800 to $999 | 2 (3.0%) | 4 (14.8%) |
| $1,000 to $1,499 | 11 (16.4%) | 12 (44.4%) |
| $1,500 to $1,999 | 0 (0.0%) | 0 (0.0%) |
| $2,000 to $2,499 | 2 (3.0%) | 0 (0.0%) |
| $2,500 to $2,999 | 0 (0.0%) | 0 (0.0%) |
| $3,000 or more | 0 (0.0%) | 0 (0.0%) |
| Total | 67 (100.0%) | 27 (100.0%) |
Physical Housing Characteristics in James City
Housing Structures in James City
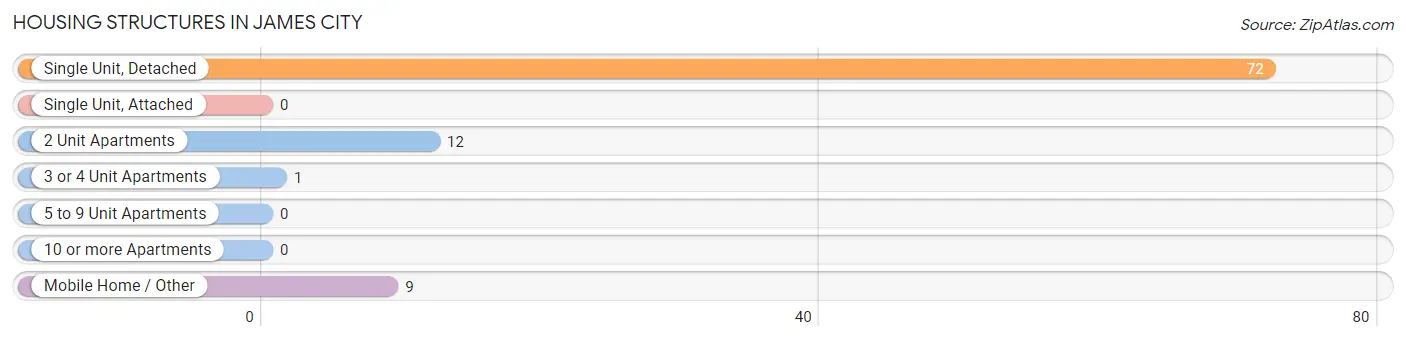
| Structure Type | # Housing Units | % Housing Units |
| Single Unit, Detached | 72 | 76.6% |
| Single Unit, Attached | 0 | 0.0% |
| 2 Unit Apartments | 12 | 12.8% |
| 3 or 4 Unit Apartments | 1 | 1.1% |
| 5 to 9 Unit Apartments | 0 | 0.0% |
| 10 or more Apartments | 0 | 0.0% |
| Mobile Home / Other | 9 | 9.6% |
| Total | 94 | 100.0% |
Housing Structures by Occupancy in James City
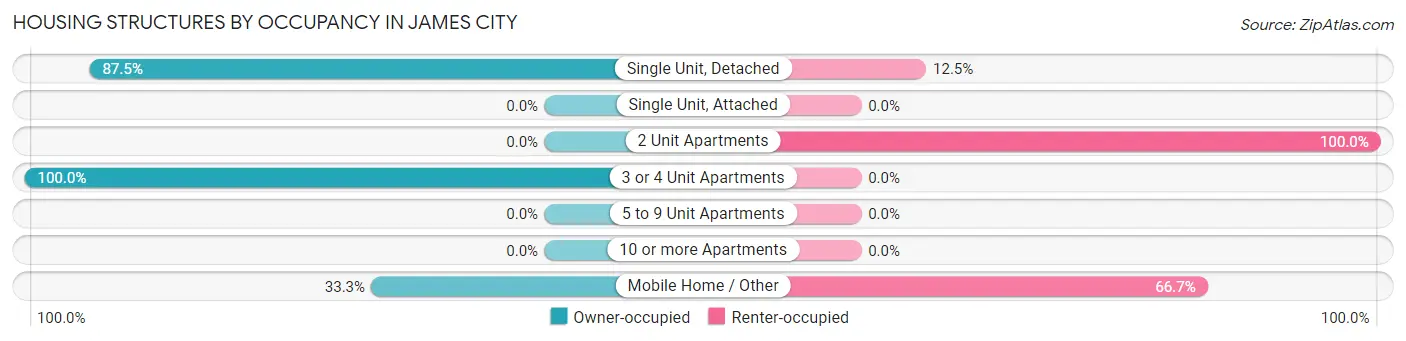
| Structure Type | Owner-occupied | Renter-occupied |
| Single Unit, Detached | 63 (87.5%) | 9 (12.5%) |
| Single Unit, Attached | 0 (0.0%) | 0 (0.0%) |
| 2 Unit Apartments | 0 (0.0%) | 12 (100.0%) |
| 3 or 4 Unit Apartments | 1 (100.0%) | 0 (0.0%) |
| 5 to 9 Unit Apartments | 0 (0.0%) | 0 (0.0%) |
| 10 or more Apartments | 0 (0.0%) | 0 (0.0%) |
| Mobile Home / Other | 3 (33.3%) | 6 (66.7%) |
| Total | 67 (71.3%) | 27 (28.7%) |
Housing Structures by Number of Rooms in James City
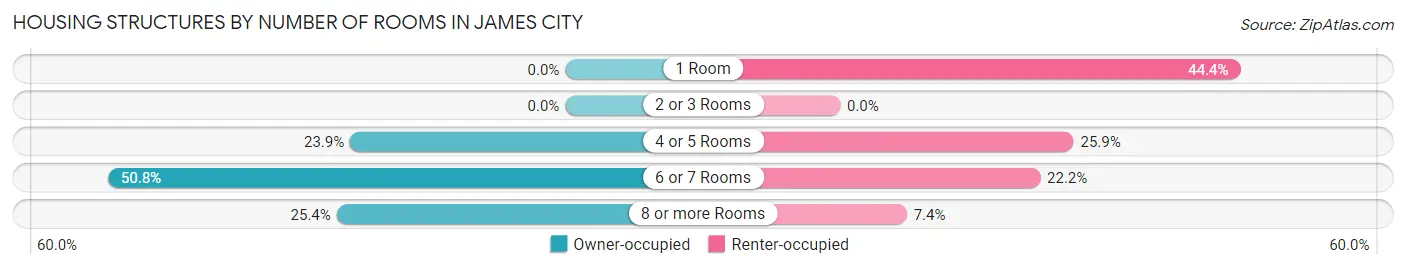
| Number of Rooms | Owner-occupied | Renter-occupied |
| 1 Room | 0 (0.0%) | 12 (44.4%) |
| 2 or 3 Rooms | 0 (0.0%) | 0 (0.0%) |
| 4 or 5 Rooms | 16 (23.9%) | 7 (25.9%) |
| 6 or 7 Rooms | 34 (50.7%) | 6 (22.2%) |
| 8 or more Rooms | 17 (25.4%) | 2 (7.4%) |
| Total | 67 (100.0%) | 27 (100.0%) |
Housing Structure by Heating Type in James City
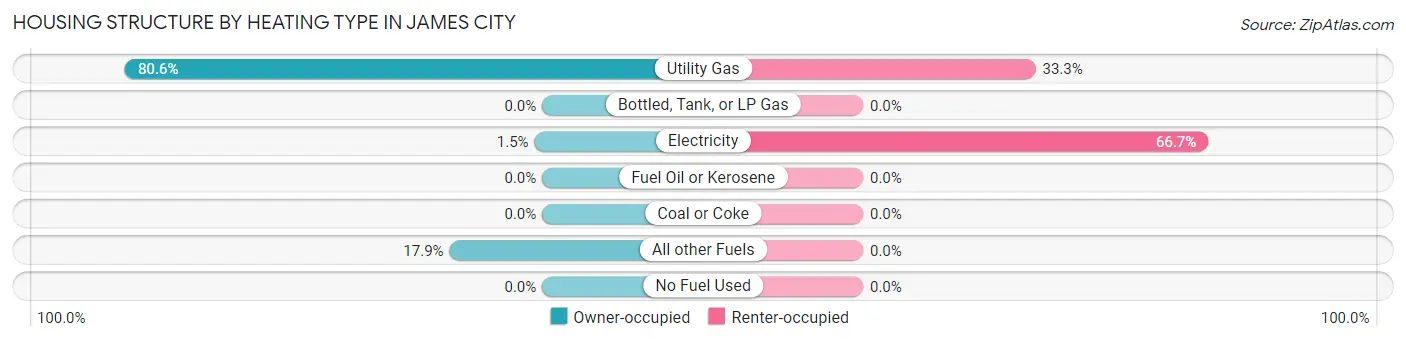
| Heating Type | Owner-occupied | Renter-occupied |
| Utility Gas | 54 (80.6%) | 9 (33.3%) |
| Bottled, Tank, or LP Gas | 0 (0.0%) | 0 (0.0%) |
| Electricity | 1 (1.5%) | 18 (66.7%) |
| Fuel Oil or Kerosene | 0 (0.0%) | 0 (0.0%) |
| Coal or Coke | 0 (0.0%) | 0 (0.0%) |
| All other Fuels | 12 (17.9%) | 0 (0.0%) |
| No Fuel Used | 0 (0.0%) | 0 (0.0%) |
| Total | 67 (100.0%) | 27 (100.0%) |
Household Vehicle Usage in James City
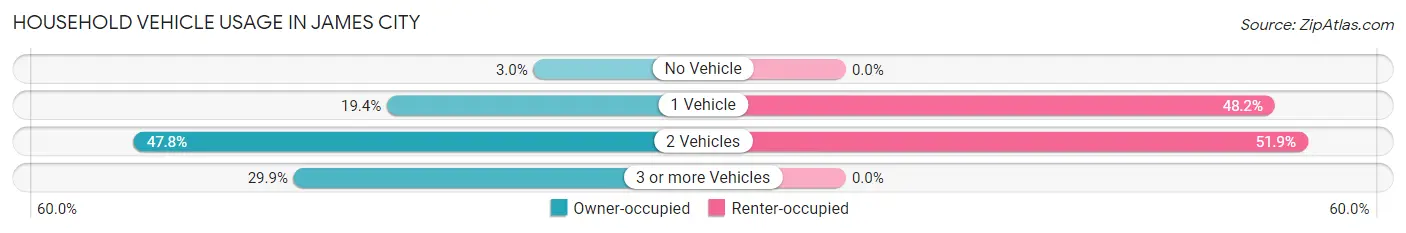
| Vehicles per Household | Owner-occupied | Renter-occupied |
| No Vehicle | 2 (3.0%) | 0 (0.0%) |
| 1 Vehicle | 13 (19.4%) | 13 (48.1%) |
| 2 Vehicles | 32 (47.8%) | 14 (51.8%) |
| 3 or more Vehicles | 20 (29.8%) | 0 (0.0%) |
| Total | 67 (100.0%) | 27 (100.0%) |
Real Estate & Mortgages in James City
Real Estate and Mortgage Overview in James City
| Characteristic | Without Mortgage | With Mortgage |
| Housing Units | 47 | 20 |
| Median Property Value | $55,800 | $0 |
| Median Household Income | $59,250 | $0 |
| Monthly Housing Costs | $529 | $0 |
| Real Estate Taxes | $1,485 | $0 |
Property Value by Mortgage Status in James City
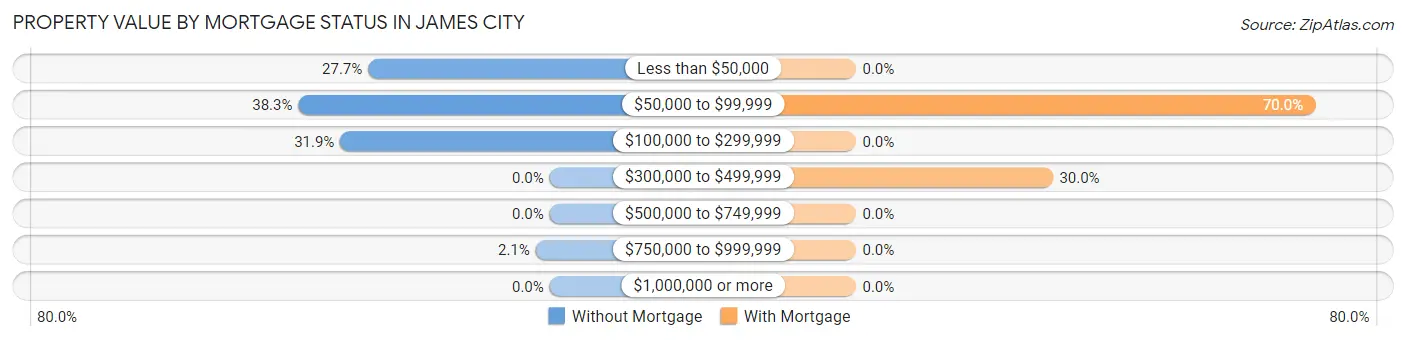
| Property Value | Without Mortgage | With Mortgage |
| Less than $50,000 | 13 (27.7%) | 0 (0.0%) |
| $50,000 to $99,999 | 18 (38.3%) | 14 (70.0%) |
| $100,000 to $299,999 | 15 (31.9%) | 0 (0.0%) |
| $300,000 to $499,999 | 0 (0.0%) | 6 (30.0%) |
| $500,000 to $749,999 | 0 (0.0%) | 0 (0.0%) |
| $750,000 to $999,999 | 1 (2.1%) | 0 (0.0%) |
| $1,000,000 or more | 0 (0.0%) | 0 (0.0%) |
| Total | 47 (100.0%) | 20 (100.0%) |
Household Income by Mortgage Status in James City
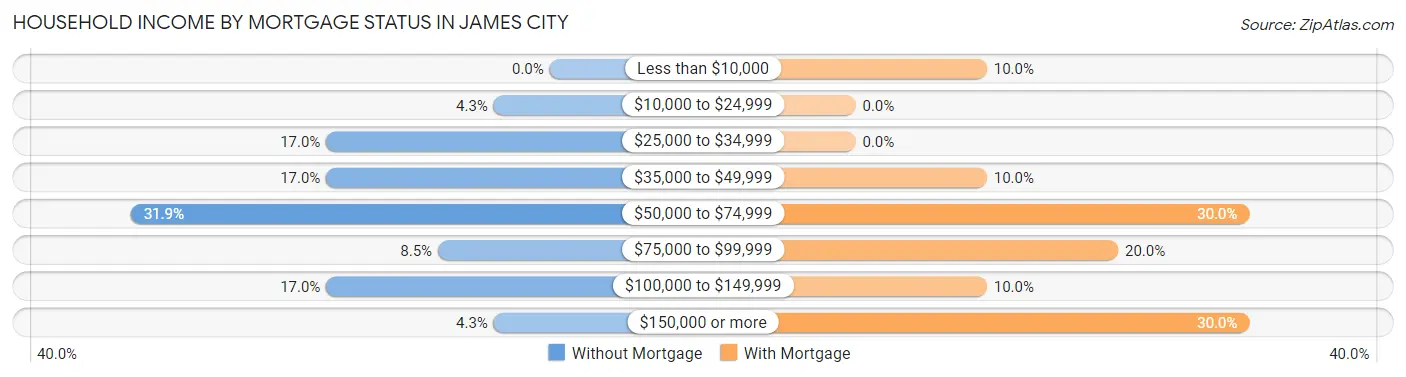
| Household Income | Without Mortgage | With Mortgage |
| Less than $10,000 | 0 (0.0%) | 2 (10.0%) |
| $10,000 to $24,999 | 2 (4.3%) | 0 (0.0%) |
| $25,000 to $34,999 | 8 (17.0%) | 0 (0.0%) |
| $35,000 to $49,999 | 8 (17.0%) | 2 (10.0%) |
| $50,000 to $74,999 | 15 (31.9%) | 6 (30.0%) |
| $75,000 to $99,999 | 4 (8.5%) | 4 (20.0%) |
| $100,000 to $149,999 | 8 (17.0%) | 2 (10.0%) |
| $150,000 or more | 2 (4.3%) | 6 (30.0%) |
| Total | 47 (100.0%) | 20 (100.0%) |
Property Value to Household Income Ratio in James City
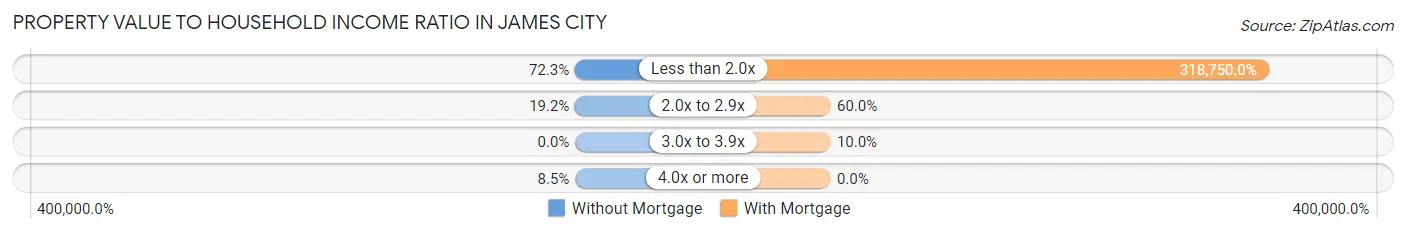
| Value-to-Income Ratio | Without Mortgage | With Mortgage |
| Less than 2.0x | 34 (72.3%) | 63,750 (318,750.0%) |
| 2.0x to 2.9x | 9 (19.2%) | 12 (60.0%) |
| 3.0x to 3.9x | 0 (0.0%) | 2 (10.0%) |
| 4.0x or more | 4 (8.5%) | 0 (0.0%) |
| Total | 47 (100.0%) | 20 (100.0%) |
Real Estate Taxes by Mortgage Status in James City
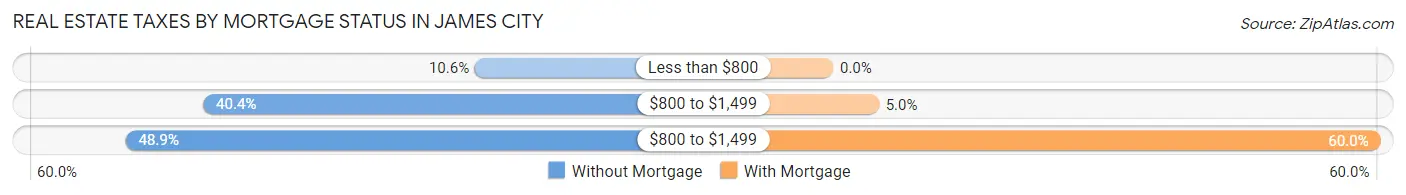
| Property Taxes | Without Mortgage | With Mortgage |
| Less than $800 | 5 (10.6%) | 0 (0.0%) |
| $800 to $1,499 | 19 (40.4%) | 1 (5.0%) |
| $800 to $1,499 | 23 (48.9%) | 12 (60.0%) |
| Total | 47 (100.0%) | 20 (100.0%) |
Health & Disability in James City
Health Insurance Coverage by Age in James City
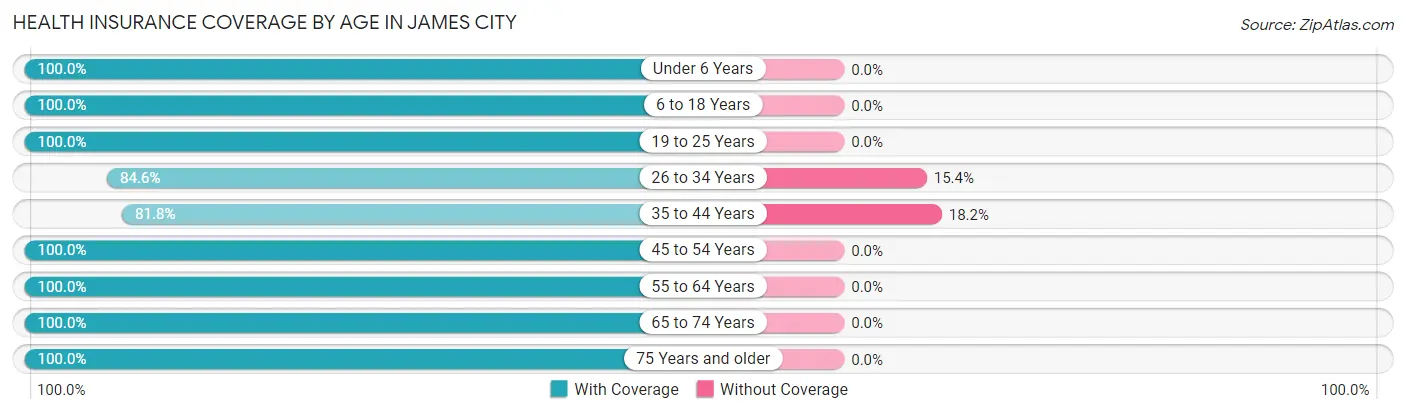
| Age Bracket | With Coverage | Without Coverage |
| Under 6 Years | 5 (100.0%) | 0 (0.0%) |
| 6 to 18 Years | 23 (100.0%) | 0 (0.0%) |
| 19 to 25 Years | 9 (100.0%) | 0 (0.0%) |
| 26 to 34 Years | 11 (84.6%) | 2 (15.4%) |
| 35 to 44 Years | 9 (81.8%) | 2 (18.2%) |
| 45 to 54 Years | 57 (100.0%) | 0 (0.0%) |
| 55 to 64 Years | 37 (100.0%) | 0 (0.0%) |
| 65 to 74 Years | 27 (100.0%) | 0 (0.0%) |
| 75 Years and older | 12 (100.0%) | 0 (0.0%) |
| Total | 190 (97.9%) | 4 (2.1%) |
Health Insurance Coverage by Citizenship Status in James City
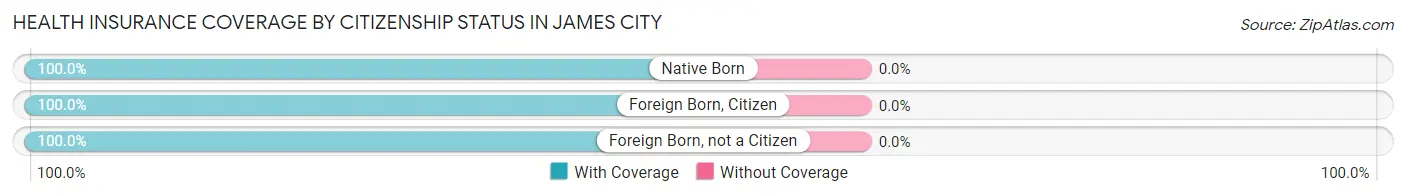
| Citizenship Status | With Coverage | Without Coverage |
| Native Born | 5 (100.0%) | 0 (0.0%) |
| Foreign Born, Citizen | 23 (100.0%) | 0 (0.0%) |
| Foreign Born, not a Citizen | 9 (100.0%) | 0 (0.0%) |
Health Insurance Coverage by Household Income in James City
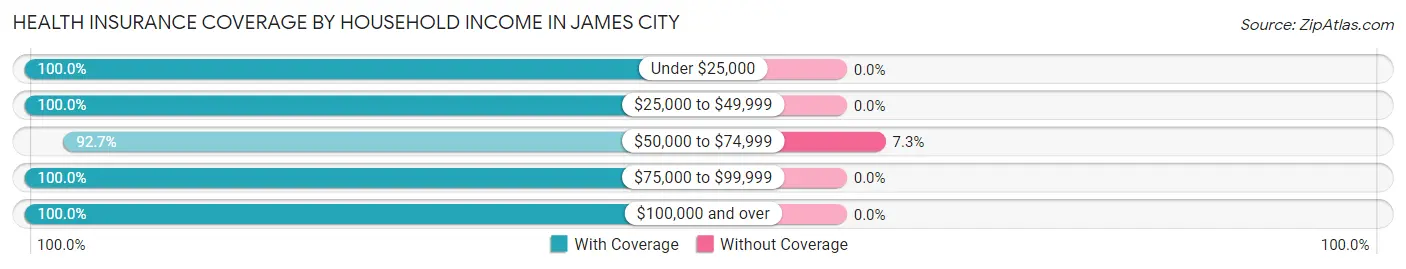
| Household Income | With Coverage | Without Coverage |
| Under $25,000 | 8 (100.0%) | 0 (0.0%) |
| $25,000 to $49,999 | 50 (100.0%) | 0 (0.0%) |
| $50,000 to $74,999 | 51 (92.7%) | 4 (7.3%) |
| $75,000 to $99,999 | 22 (100.0%) | 0 (0.0%) |
| $100,000 and over | 59 (100.0%) | 0 (0.0%) |
Public vs Private Health Insurance Coverage by Age in James City
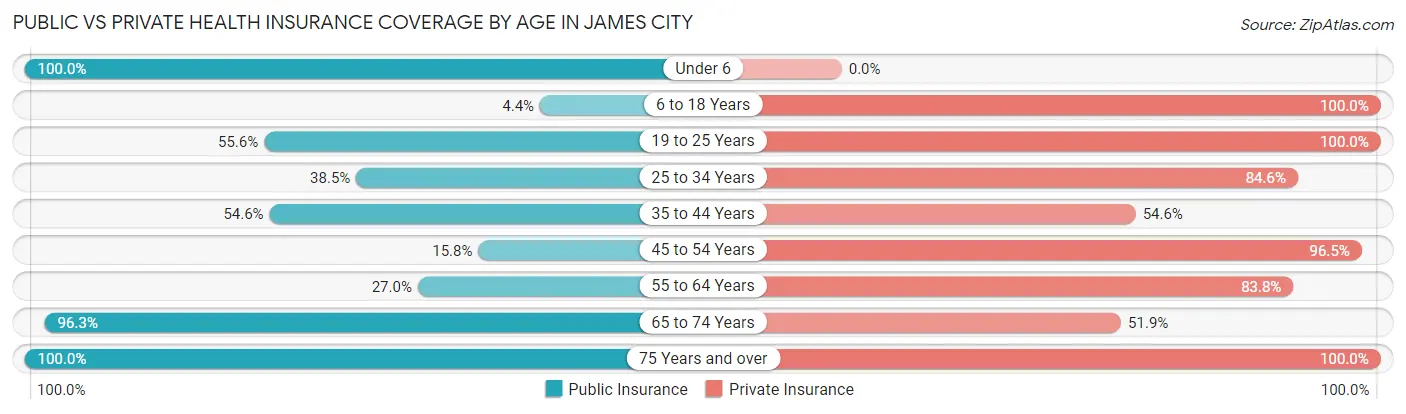
| Age Bracket | Public Insurance | Private Insurance |
| Under 6 | 5 (100.0%) | 0 (0.0%) |
| 6 to 18 Years | 1 (4.3%) | 23 (100.0%) |
| 19 to 25 Years | 5 (55.6%) | 9 (100.0%) |
| 25 to 34 Years | 5 (38.5%) | 11 (84.6%) |
| 35 to 44 Years | 6 (54.5%) | 6 (54.5%) |
| 45 to 54 Years | 9 (15.8%) | 55 (96.5%) |
| 55 to 64 Years | 10 (27.0%) | 31 (83.8%) |
| 65 to 74 Years | 26 (96.3%) | 14 (51.8%) |
| 75 Years and over | 12 (100.0%) | 12 (100.0%) |
| Total | 79 (40.7%) | 161 (83.0%) |
Disability Status by Sex by Age in James City
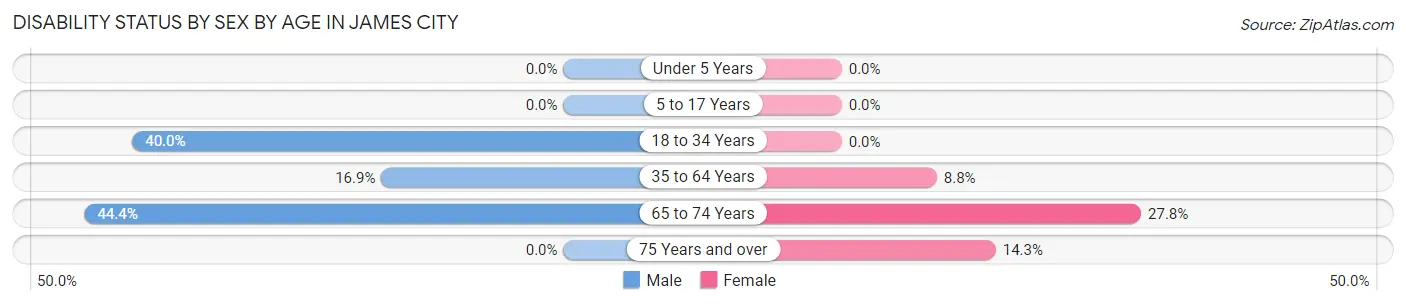
| Age Bracket | Male | Female |
| Under 5 Years | 0 (0.0%) | 0 (0.0%) |
| 5 to 17 Years | 0 (0.0%) | 0 (0.0%) |
| 18 to 34 Years | 6 (40.0%) | 0 (0.0%) |
| 35 to 64 Years | 12 (16.9%) | 3 (8.8%) |
| 65 to 74 Years | 4 (44.4%) | 5 (27.8%) |
| 75 Years and over | 0 (0.0%) | 1 (14.3%) |
Disability Class by Sex by Age in James City
Disability Class: Hearing Difficulty
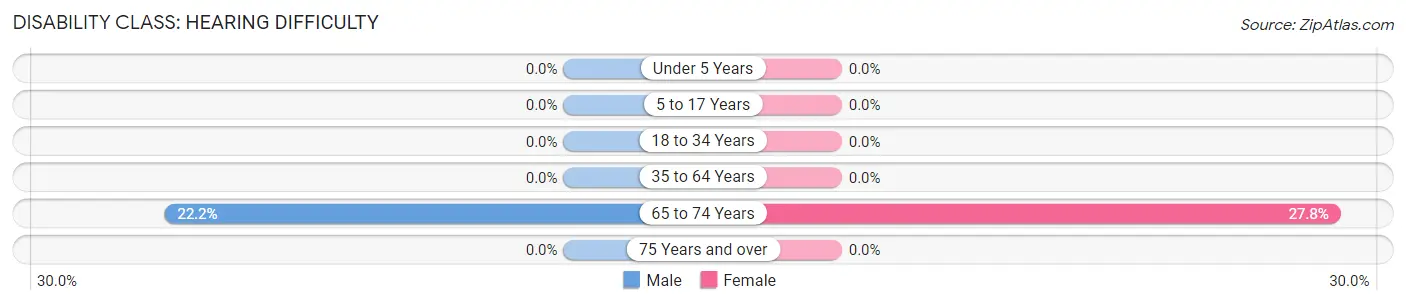
| Age Bracket | Male | Female |
| Under 5 Years | 0 (0.0%) | 0 (0.0%) |
| 5 to 17 Years | 0 (0.0%) | 0 (0.0%) |
| 18 to 34 Years | 0 (0.0%) | 0 (0.0%) |
| 35 to 64 Years | 0 (0.0%) | 0 (0.0%) |
| 65 to 74 Years | 2 (22.2%) | 5 (27.8%) |
| 75 Years and over | 0 (0.0%) | 0 (0.0%) |
Disability Class: Vision Difficulty
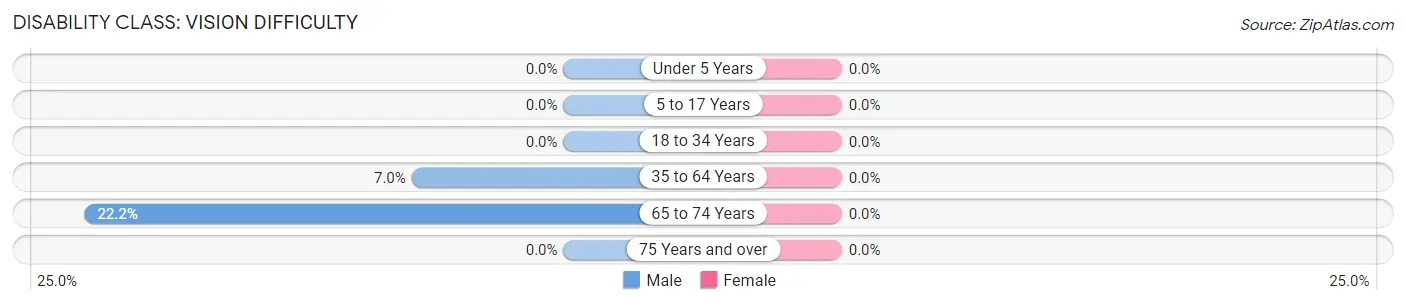
| Age Bracket | Male | Female |
| Under 5 Years | 0 (0.0%) | 0 (0.0%) |
| 5 to 17 Years | 0 (0.0%) | 0 (0.0%) |
| 18 to 34 Years | 0 (0.0%) | 0 (0.0%) |
| 35 to 64 Years | 5 (7.0%) | 0 (0.0%) |
| 65 to 74 Years | 2 (22.2%) | 0 (0.0%) |
| 75 Years and over | 0 (0.0%) | 0 (0.0%) |
Disability Class: Cognitive Difficulty
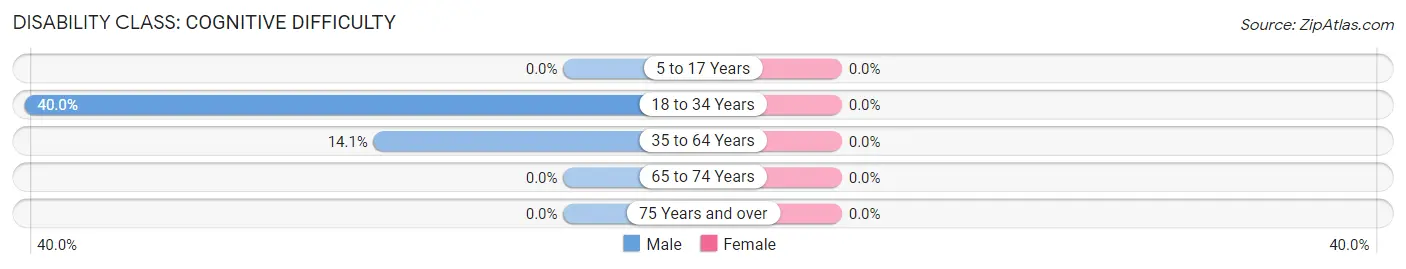
| Age Bracket | Male | Female |
| 5 to 17 Years | 0 (0.0%) | 0 (0.0%) |
| 18 to 34 Years | 6 (40.0%) | 0 (0.0%) |
| 35 to 64 Years | 10 (14.1%) | 0 (0.0%) |
| 65 to 74 Years | 0 (0.0%) | 0 (0.0%) |
| 75 Years and over | 0 (0.0%) | 0 (0.0%) |
Disability Class: Ambulatory Difficulty
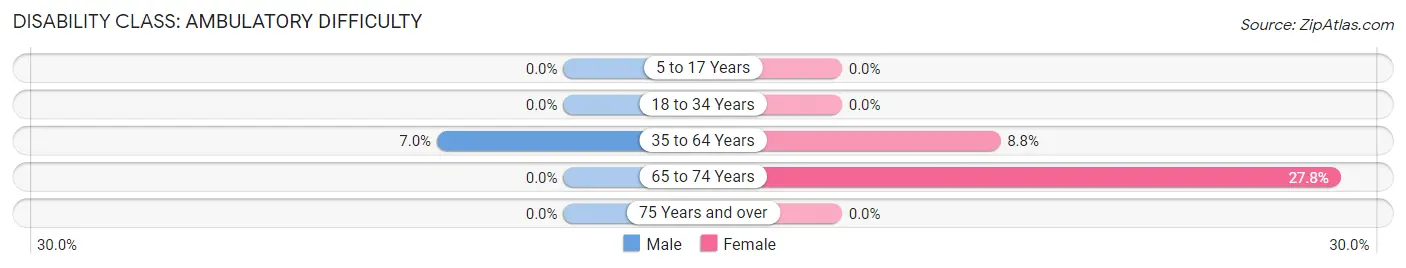
| Age Bracket | Male | Female |
| 5 to 17 Years | 0 (0.0%) | 0 (0.0%) |
| 18 to 34 Years | 0 (0.0%) | 0 (0.0%) |
| 35 to 64 Years | 5 (7.0%) | 3 (8.8%) |
| 65 to 74 Years | 0 (0.0%) | 5 (27.8%) |
| 75 Years and over | 0 (0.0%) | 0 (0.0%) |
Disability Class: Self-Care Difficulty
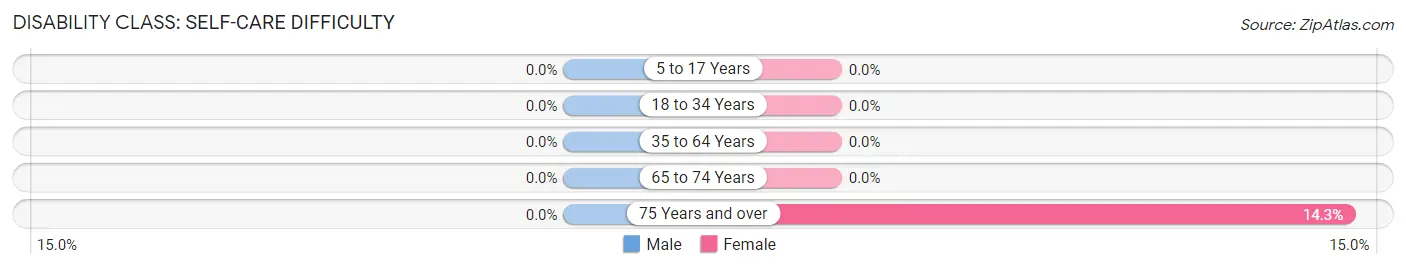
| Age Bracket | Male | Female |
| 5 to 17 Years | 0 (0.0%) | 0 (0.0%) |
| 18 to 34 Years | 0 (0.0%) | 0 (0.0%) |
| 35 to 64 Years | 0 (0.0%) | 0 (0.0%) |
| 65 to 74 Years | 0 (0.0%) | 0 (0.0%) |
| 75 Years and over | 0 (0.0%) | 1 (14.3%) |
Technology Access in James City
Computing Device Access in James City
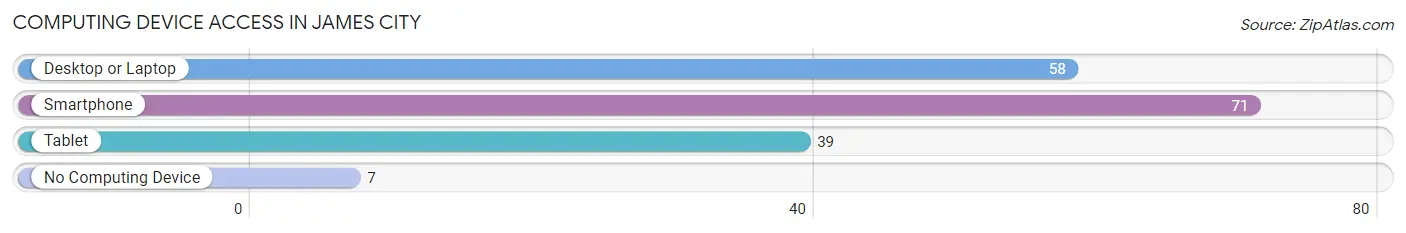
| Device Type | # Households | % Households |
| Desktop or Laptop | 58 | 61.7% |
| Smartphone | 71 | 75.5% |
| Tablet | 39 | 41.5% |
| No Computing Device | 7 | 7.4% |
| Total | 94 | 100.0% |
Internet Access in James City
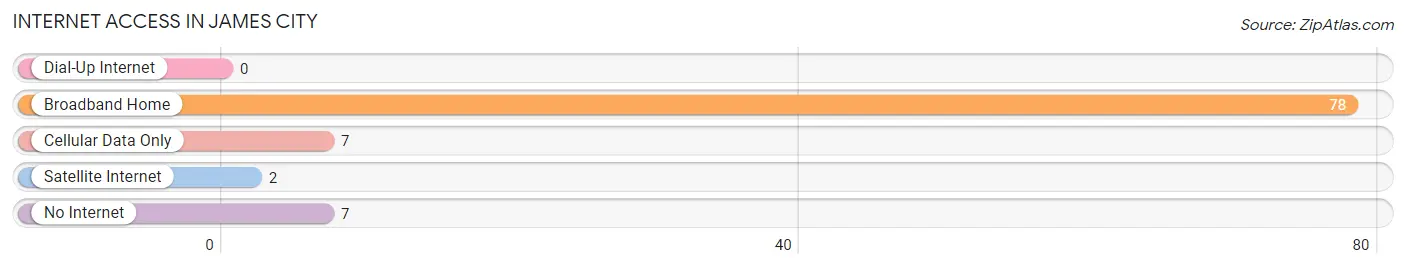
| Internet Type | # Households | % Households |
| Dial-Up Internet | 0 | 0.0% |
| Broadband Home | 78 | 83.0% |
| Cellular Data Only | 7 | 7.4% |
| Satellite Internet | 2 | 2.1% |
| No Internet | 7 | 7.4% |
| Total | 94 | 100.0% |
James City Summary
James City is a small borough located in the northwestern corner of Pennsylvania in the United States. It is situated in the foothills of the Allegheny Mountains and is part of the greater Pittsburgh metropolitan area. The borough is home to a population of approximately 1,500 people and is known for its rural charm and small-town atmosphere.
History
James City was founded in 1817 by James and Mary Ann Smith, who purchased the land from the Commonwealth of Pennsylvania. The Smiths named the town after themselves and it quickly grew into a thriving community. The town was incorporated in 1845 and was home to a variety of businesses, including a sawmill, a gristmill, a tannery, and a blacksmith shop.
In the late 19th century, James City was a popular destination for wealthy Pittsburgh residents who wanted to escape the hustle and bustle of the city. The town was home to several large estates, including the historic Smith Estate, which is now a museum.
Geography
James City is located in the northwestern corner of Pennsylvania, in the foothills of the Allegheny Mountains. The borough is situated on the banks of the Allegheny River and is bordered by the towns of Butler, Zelienople, and Harmony. The borough is approximately 25 miles north of Pittsburgh and is part of the greater Pittsburgh metropolitan area.
The borough has a total area of 1.2 square miles, all of which is land. The terrain is mostly flat, with some rolling hills. The climate is humid continental, with cold winters and hot, humid summers.
Economy
The economy of James City is largely based on tourism and small businesses. The borough is home to several small businesses, including restaurants, shops, and galleries. The town is also home to several historic sites, including the Smith Estate, which is now a museum.
The borough is also home to several large employers, including the Butler County Airport, which is located just outside of town. The airport is a major employer in the area and provides jobs for hundreds of people.
Demographics
As of the 2010 census, the population of James City was 1,500. The racial makeup of the borough was 97.3% White, 0.7% African American, 0.3% Native American, 0.3% Asian, and 1.3% from other races. The median household income was $45,000 and the median family income was $50,000.
The population of James City is largely made up of families, with the majority of households having children under the age of 18. The town is also home to a large elderly population, with nearly 20% of the population over the age of 65.
Conclusion
James City is a small borough located in the northwestern corner of Pennsylvania. It is situated in the foothills of the Allegheny Mountains and is part of the greater Pittsburgh metropolitan area. The borough is home to a population of approximately 1,500 people and is known for its rural charm and small-town atmosphere. The economy of James City is largely based on tourism and small businesses, and the population is largely made up of families. The town is also home to several historic sites, including the Smith Estate, which is now a museum.
Common Questions
What is Per Capita Income in James City?
Per Capita income in James City is $31,448.
What is the Median Family Income in James City?
Median Family Income in James City is $59,286.
What is the Median Household income in James City?
Median Household Income in James City is $59,643.
What is Income or Wage Gap in James City?
Income or Wage Gap in James City is 40.2%.
Women in James City earn 59.8 cents for every dollar earned by a man.
What is Inequality or Gini Index in James City?
Inequality or Gini Index in James City is 0.31.
What is the Total Population of James City?
Total Population of James City is 194.
What is the Total Male Population of James City?
Total Male Population of James City is 105.
What is the Total Female Population of James City?
Total Female Population of James City is 89.
What is the Ratio of Males per 100 Females in James City?
There are 117.98 Males per 100 Females in James City.
What is the Ratio of Females per 100 Males in James City?
There are 84.76 Females per 100 Males in James City.
What is the Median Population Age in James City?
Median Population Age in James City is 48.1 Years.
What is the Average Family Size in James City
Average Family Size in James City is 2.7 People.
What is the Average Household Size in James City
Average Household Size in James City is 2.1 People.
How Large is the Labor Force in James City?
There are 107 People in the Labor Forcein in James City.
What is the Percentage of People in the Labor Force in James City?
59.8% of People are in the Labor Force in James City.
What is the Unemployment Rate in James City?
Unemployment Rate in James City is 4.7%.