Homeacre Lyndora, PA Map & Demographics
Homeacre Lyndora Map
Homeacre Lyndora Overview
$40,136
PER CAPITA INCOME
$99,063
AVG FAMILY INCOME
$67,645
AVG HOUSEHOLD INCOME
35.8%
WAGE / INCOME GAP [ % ]
64.2¢/ $1
WAGE / INCOME GAP [ $ ]
0.41
INEQUALITY / GINI INDEX
6,750
TOTAL POPULATION
3,261
MALE POPULATION
3,489
FEMALE POPULATION
93.47
MALES / 100 FEMALES
106.99
FEMALES / 100 MALES
48.5
MEDIAN AGE
2.8
AVG FAMILY SIZE
2.2
AVG HOUSEHOLD SIZE
3,916
LABOR FORCE [ PEOPLE ]
66.2%
PERCENT IN LABOR FORCE
4.4%
UNEMPLOYMENT RATE
Income in Homeacre Lyndora
Income Overview in Homeacre Lyndora
Per Capita Income in Homeacre Lyndora is $40,136, while median incomes of families and households are $99,063 and $67,645 respectively.
| Characteristic | Number | Measure |
| Per Capita Income | 6,750 | $40,136 |
| Median Family Income | 1,791 | $99,063 |
| Mean Family Income | 1,791 | $112,019 |
| Median Household Income | 3,074 | $67,645 |
| Mean Household Income | 3,074 | $85,857 |
| Income Deficit | 1,791 | $0 |
| Wage / Income Gap (%) | 6,750 | 35.75% |
| Wage / Income Gap ($) | 6,750 | 64.25¢ per $1 |
| Gini / Inequality Index | 6,750 | 0.41 |
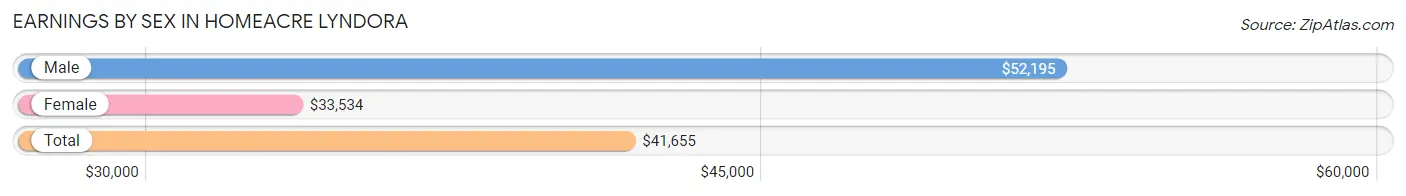
Earnings by Sex in Homeacre Lyndora
Average Earnings in Homeacre Lyndora are $41,655, $52,195 for men and $33,534 for women, a difference of 35.7%.
| Sex | Number | Average Earnings |
| Male | 2,170 (53.6%) | $52,195 |
| Female | 1,876 (46.4%) | $33,534 |
| Total | 4,046 (100.0%) | $41,655 |
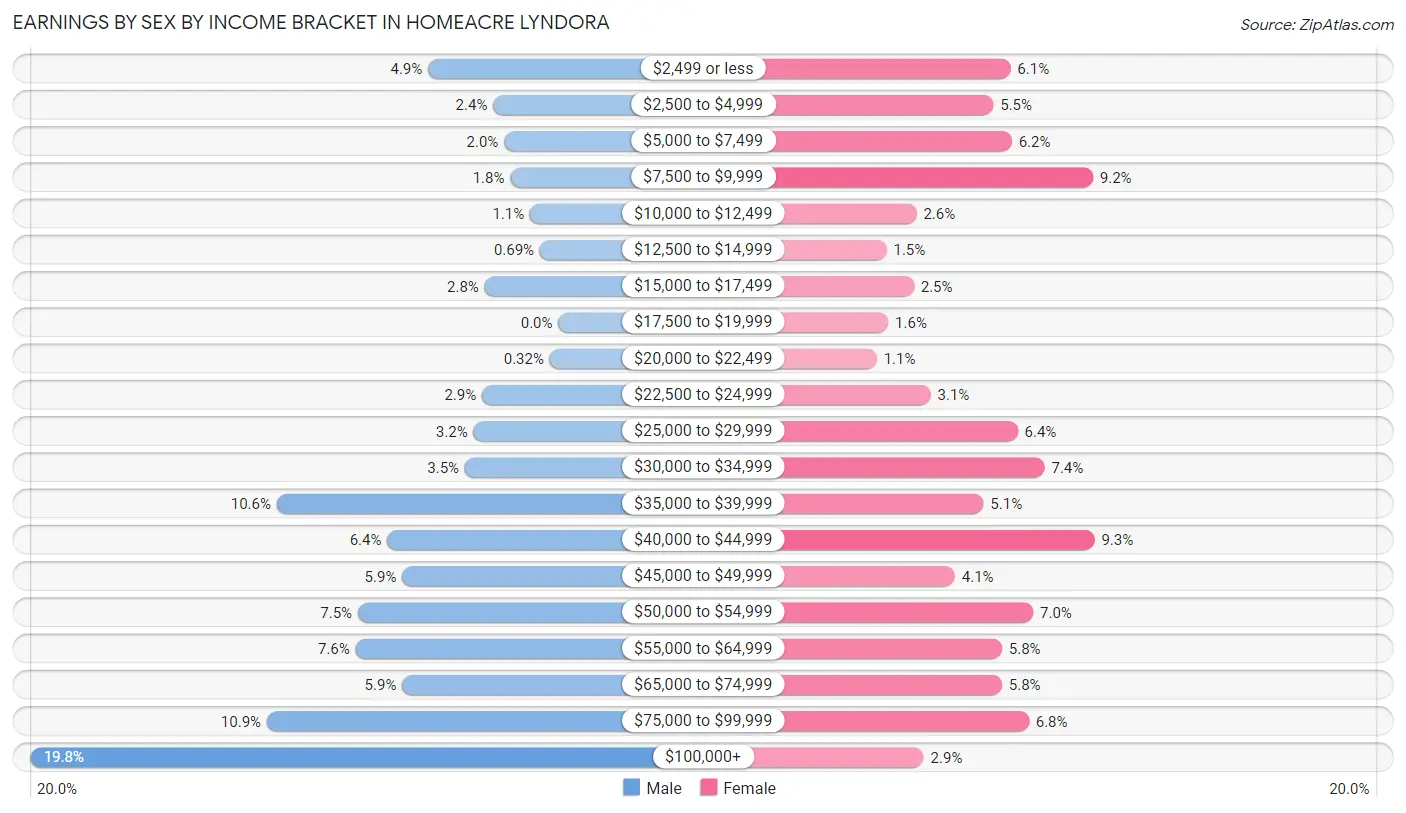
Earnings by Sex by Income Bracket in Homeacre Lyndora
The most common earnings brackets in Homeacre Lyndora are $100,000+ for men (429 | 19.8%) and $40,000 to $44,999 for women (174 | 9.3%).
| Income | Male | Female |
| $2,499 or less | 106 (4.9%) | 115 (6.1%) |
| $2,500 to $4,999 | 53 (2.4%) | 103 (5.5%) |
| $5,000 to $7,499 | 44 (2.0%) | 116 (6.2%) |
| $7,500 to $9,999 | 39 (1.8%) | 173 (9.2%) |
| $10,000 to $12,499 | 23 (1.1%) | 49 (2.6%) |
| $12,500 to $14,999 | 15 (0.7%) | 28 (1.5%) |
| $15,000 to $17,499 | 60 (2.8%) | 47 (2.5%) |
| $17,500 to $19,999 | 0 (0.0%) | 29 (1.5%) |
| $20,000 to $22,499 | 7 (0.3%) | 21 (1.1%) |
| $22,500 to $24,999 | 62 (2.9%) | 59 (3.1%) |
| $25,000 to $29,999 | 69 (3.2%) | 120 (6.4%) |
| $30,000 to $34,999 | 76 (3.5%) | 139 (7.4%) |
| $35,000 to $39,999 | 229 (10.5%) | 96 (5.1%) |
| $40,000 to $44,999 | 139 (6.4%) | 174 (9.3%) |
| $45,000 to $49,999 | 127 (5.9%) | 76 (4.1%) |
| $50,000 to $54,999 | 163 (7.5%) | 131 (7.0%) |
| $55,000 to $64,999 | 165 (7.6%) | 109 (5.8%) |
| $65,000 to $74,999 | 127 (5.9%) | 109 (5.8%) |
| $75,000 to $99,999 | 237 (10.9%) | 128 (6.8%) |
| $100,000+ | 429 (19.8%) | 54 (2.9%) |
| Total | 2,170 (100.0%) | 1,876 (100.0%) |
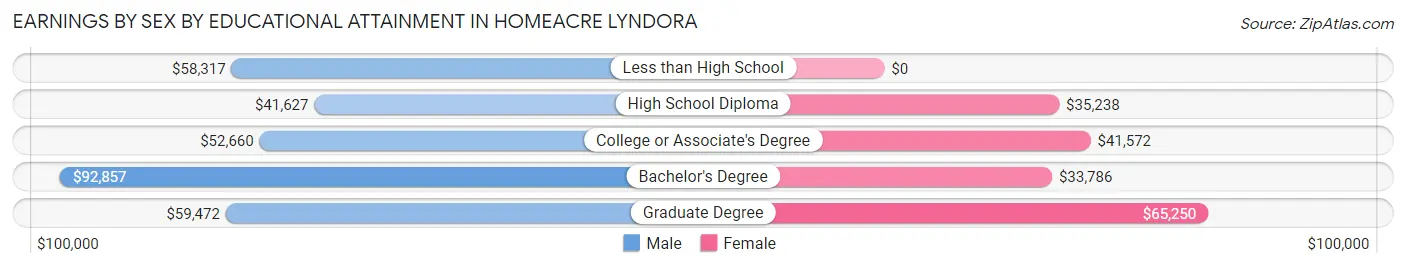
Earnings by Sex by Educational Attainment in Homeacre Lyndora
Average earnings in Homeacre Lyndora are $54,572 for men and $38,727 for women, a difference of 29.0%. Men with an educational attainment of bachelor's degree enjoy the highest average annual earnings of $92,857, while those with high school diploma education earn the least with $41,627. Women with an educational attainment of graduate degree earn the most with the average annual earnings of $65,250, while those with bachelor's degree education have the smallest earnings of $33,786.
| Educational Attainment | Male Income | Female Income |
| Less than High School | $58,317 | $0 |
| High School Diploma | $41,627 | $35,238 |
| College or Associate's Degree | $52,660 | $41,572 |
| Bachelor's Degree | $92,857 | $33,786 |
| Graduate Degree | $59,472 | $65,250 |
| Total | $54,572 | $38,727 |
Family Income in Homeacre Lyndora
Family Income Brackets in Homeacre Lyndora
According to the Homeacre Lyndora family income data, there are 448 families falling into the $100,000 to $149,999 income range, which is the most common income bracket and makes up 25.0% of all families. Conversely, the $10,000 to $14,999 income bracket is the least frequent group with only 14 families (0.8%) belonging to this category.
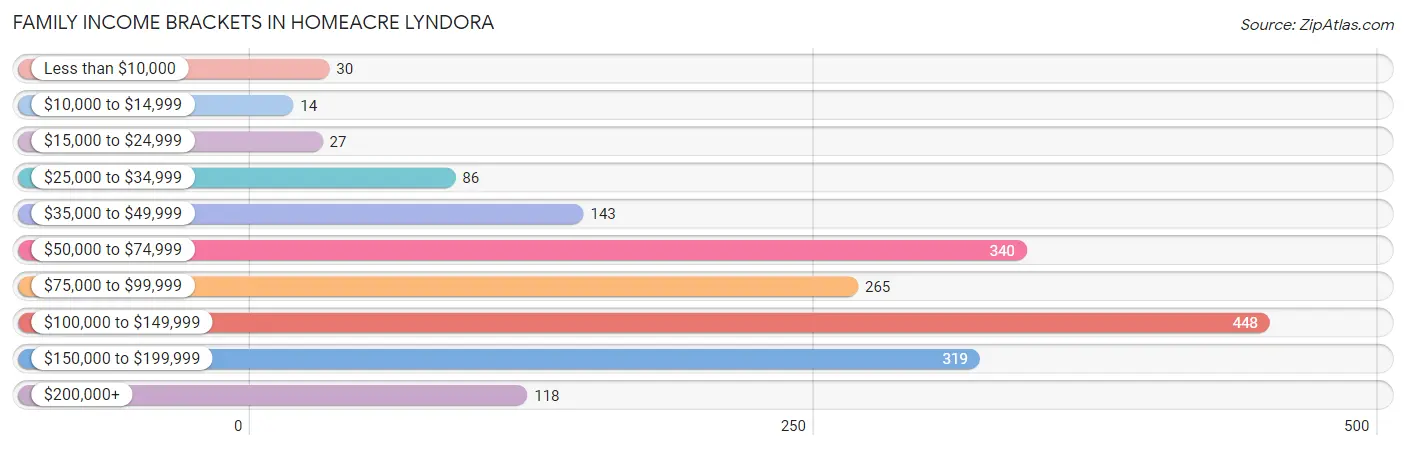
| Income Bracket | # Families | % Families |
| Less than $10,000 | 30 | 1.7% |
| $10,000 to $14,999 | 14 | 0.8% |
| $15,000 to $24,999 | 27 | 1.5% |
| $25,000 to $34,999 | 86 | 4.8% |
| $35,000 to $49,999 | 143 | 8.0% |
| $50,000 to $74,999 | 340 | 19.0% |
| $75,000 to $99,999 | 265 | 14.8% |
| $100,000 to $149,999 | 448 | 25.0% |
| $150,000 to $199,999 | 319 | 17.8% |
| $200,000+ | 118 | 6.6% |
Family Income by Famaliy Size in Homeacre Lyndora
4-person families (333 | 18.6%) account for the highest median family income in Homeacre Lyndora with $149,292 per family, while 3-person families (501 | 28.0%) have the highest median income of $41,642 per family member.
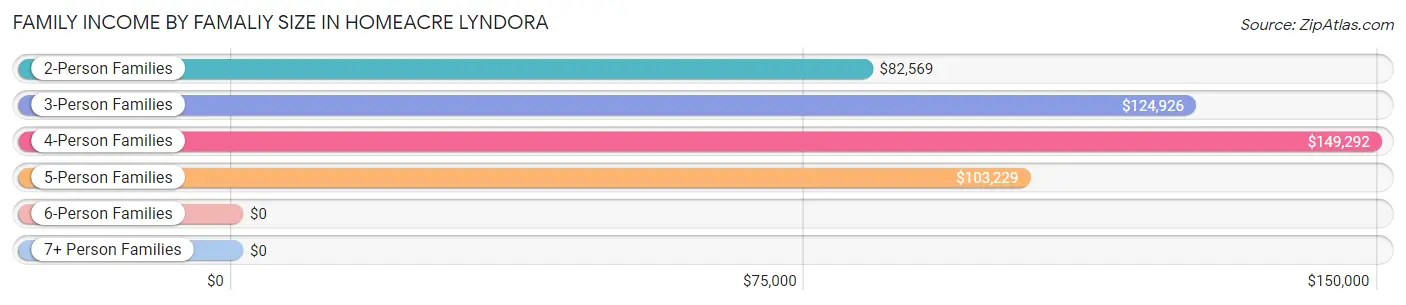
| Income Bracket | # Families | Median Income |
| 2-Person Families | 896 (50.0%) | $82,569 |
| 3-Person Families | 501 (28.0%) | $124,926 |
| 4-Person Families | 333 (18.6%) | $149,292 |
| 5-Person Families | 43 (2.4%) | $103,229 |
| 6-Person Families | 18 (1.0%) | $0 |
| 7+ Person Families | 0 (0.0%) | $0 |
| Total | 1,791 (100.0%) | $99,063 |
Family Income by Number of Earners in Homeacre Lyndora
The median family income in Homeacre Lyndora is $99,063, with families comprising 3+ earners (335) having the highest median family income of $156,947, while families with no earners (208) have the lowest median family income of $53,500, accounting for 18.7% and 11.6% of families, respectively.
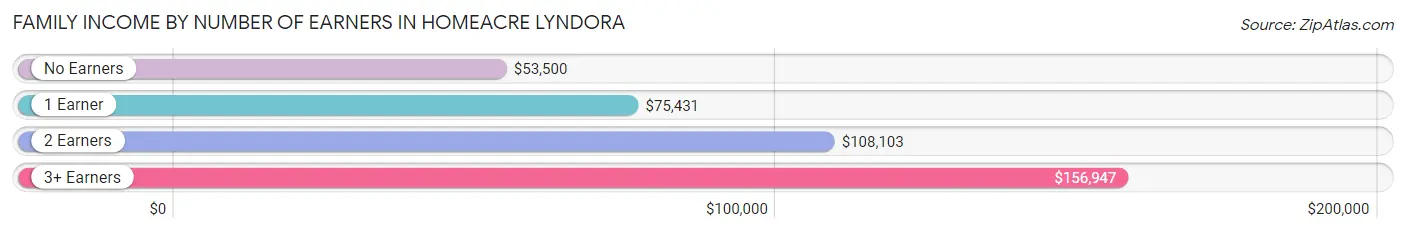
| Number of Earners | # Families | Median Income |
| No Earners | 208 (11.6%) | $53,500 |
| 1 Earner | 584 (32.6%) | $75,431 |
| 2 Earners | 664 (37.1%) | $108,103 |
| 3+ Earners | 335 (18.7%) | $156,947 |
| Total | 1,791 (100.0%) | $99,063 |
Household Income in Homeacre Lyndora
Household Income Brackets in Homeacre Lyndora
With 572 households falling in the category, the $50,000 to $74,999 income range is the most frequent in Homeacre Lyndora, accounting for 18.6% of all households. In contrast, only 92 households (3.0%) fall into the less than $10,000 income bracket, making it the least populous group.
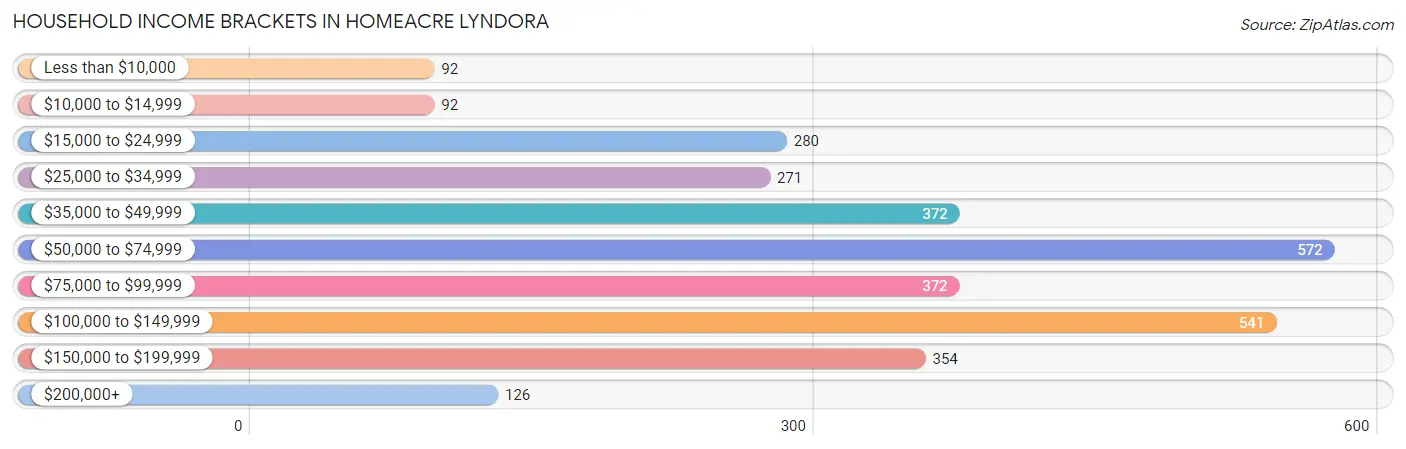
| Income Bracket | # Households | % Households |
| Less than $10,000 | 92 | 3.0% |
| $10,000 to $14,999 | 92 | 3.0% |
| $15,000 to $24,999 | 280 | 9.1% |
| $25,000 to $34,999 | 271 | 8.8% |
| $35,000 to $49,999 | 372 | 12.1% |
| $50,000 to $74,999 | 572 | 18.6% |
| $75,000 to $99,999 | 372 | 12.1% |
| $100,000 to $149,999 | 541 | 17.6% |
| $150,000 to $199,999 | 354 | 11.5% |
| $200,000+ | 126 | 4.1% |
Household Income by Householder Age in Homeacre Lyndora
The median household income in Homeacre Lyndora is $67,645, with the highest median household income of $87,198 found in the 45 to 64 years age bracket for the primary householder. A total of 1,313 households (42.7%) fall into this category. Meanwhile, the 15 to 24 years age bracket for the primary householder has the lowest median household income of $0, with 37 households (1.2%) in this group.
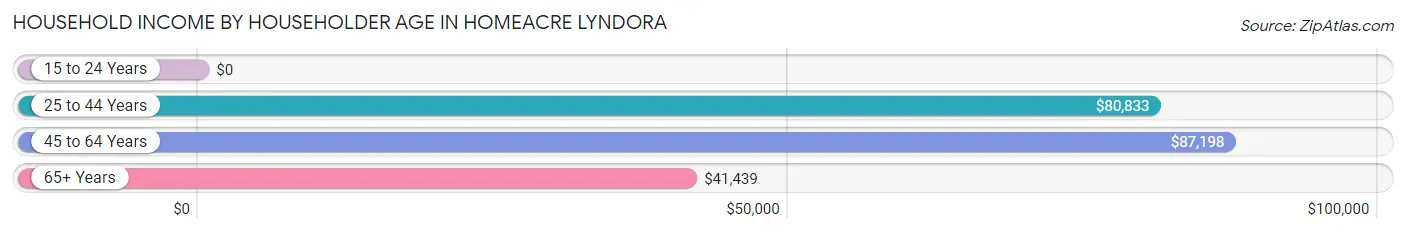
| Income Bracket | # Households | Median Income |
| 15 to 24 Years | 37 (1.2%) | $0 |
| 25 to 44 Years | 784 (25.5%) | $80,833 |
| 45 to 64 Years | 1,313 (42.7%) | $87,198 |
| 65+ Years | 940 (30.6%) | $41,439 |
| Total | 3,074 (100.0%) | $67,645 |
Poverty in Homeacre Lyndora
Income Below Poverty by Sex and Age in Homeacre Lyndora
With 7.6% poverty level for males and 8.3% for females among the residents of Homeacre Lyndora, 12 to 14 year old males and under 5 year old females are the most vulnerable to poverty, with 11 males (28.2%) and 17 females (19.3%) in their respective age groups living below the poverty level.
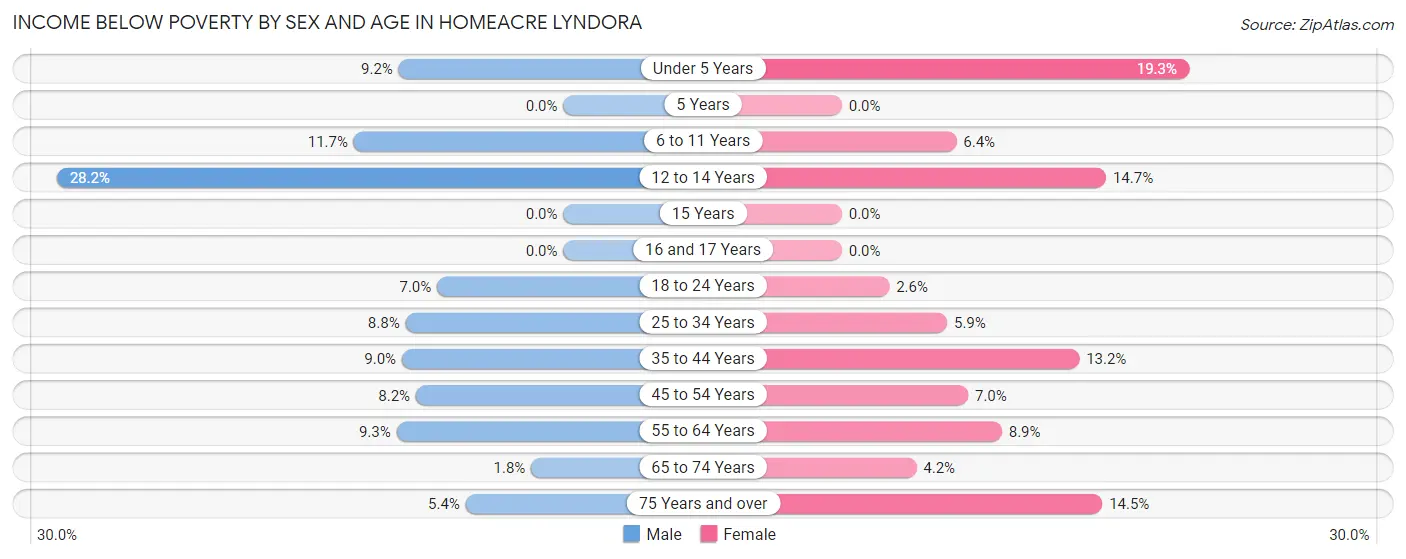
| Age Bracket | Male | Female |
| Under 5 Years | 11 (9.2%) | 17 (19.3%) |
| 5 Years | 0 (0.0%) | 0 (0.0%) |
| 6 to 11 Years | 21 (11.7%) | 12 (6.4%) |
| 12 to 14 Years | 11 (28.2%) | 10 (14.7%) |
| 15 Years | 0 (0.0%) | 0 (0.0%) |
| 16 and 17 Years | 0 (0.0%) | 0 (0.0%) |
| 18 to 24 Years | 13 (7.0%) | 6 (2.6%) |
| 25 to 34 Years | 37 (8.8%) | 18 (5.9%) |
| 35 to 44 Years | 41 (9.0%) | 62 (13.2%) |
| 45 to 54 Years | 45 (8.2%) | 41 (7.0%) |
| 55 to 64 Years | 54 (9.3%) | 44 (8.9%) |
| 65 to 74 Years | 7 (1.8%) | 21 (4.2%) |
| 75 Years and over | 8 (5.4%) | 59 (14.5%) |
| Total | 248 (7.6%) | 290 (8.3%) |
Income Above Poverty by Sex and Age in Homeacre Lyndora
According to the poverty statistics in Homeacre Lyndora, males aged 5 years and females aged 5 years are the age groups that are most secure financially, with 100.0% of males and 100.0% of females in these age groups living above the poverty line.
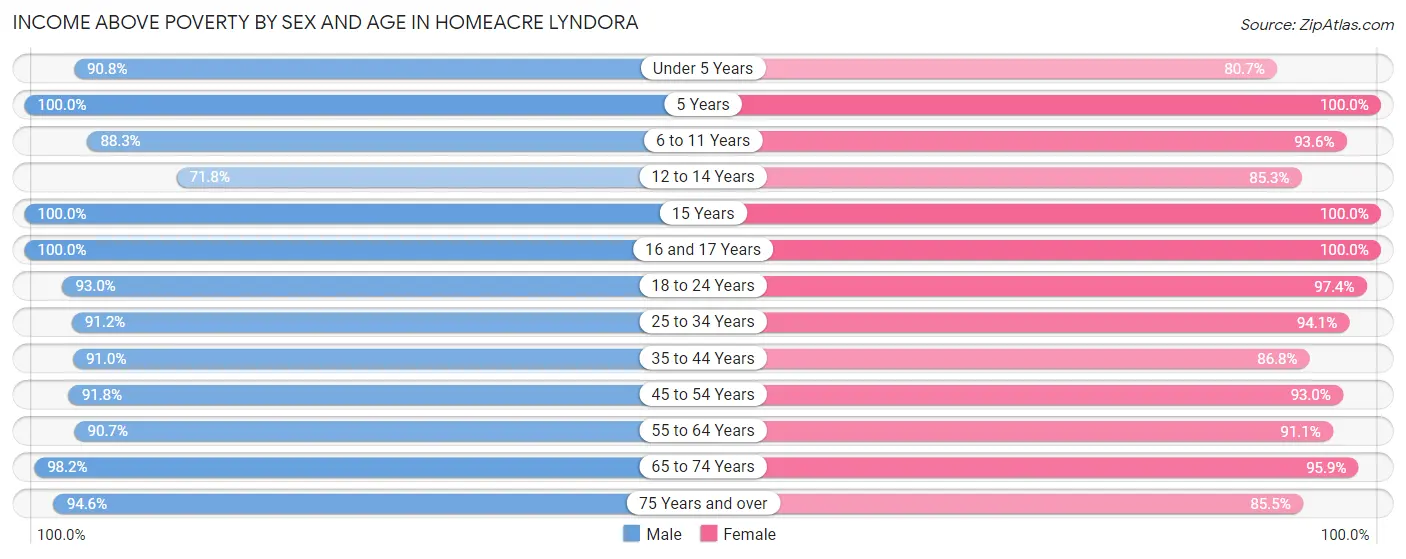
| Age Bracket | Male | Female |
| Under 5 Years | 109 (90.8%) | 71 (80.7%) |
| 5 Years | 71 (100.0%) | 17 (100.0%) |
| 6 to 11 Years | 159 (88.3%) | 176 (93.6%) |
| 12 to 14 Years | 28 (71.8%) | 58 (85.3%) |
| 15 Years | 5 (100.0%) | 52 (100.0%) |
| 16 and 17 Years | 111 (100.0%) | 80 (100.0%) |
| 18 to 24 Years | 172 (93.0%) | 221 (97.4%) |
| 25 to 34 Years | 384 (91.2%) | 289 (94.1%) |
| 35 to 44 Years | 415 (91.0%) | 407 (86.8%) |
| 45 to 54 Years | 503 (91.8%) | 542 (93.0%) |
| 55 to 64 Years | 527 (90.7%) | 450 (91.1%) |
| 65 to 74 Years | 385 (98.2%) | 485 (95.9%) |
| 75 Years and over | 139 (94.6%) | 348 (85.5%) |
| Total | 3,008 (92.4%) | 3,196 (91.7%) |
Income Below Poverty Among Married-Couple Families in Homeacre Lyndora
The poverty statistics for married-couple families in Homeacre Lyndora show that 2.2% or 30 of the total 1,352 families live below the poverty line. Families with 3 or 4 children have the highest poverty rate of 19.1%, comprising of 8 families. On the other hand, families with no children have the lowest poverty rate of 1.1%, which includes 10 families.
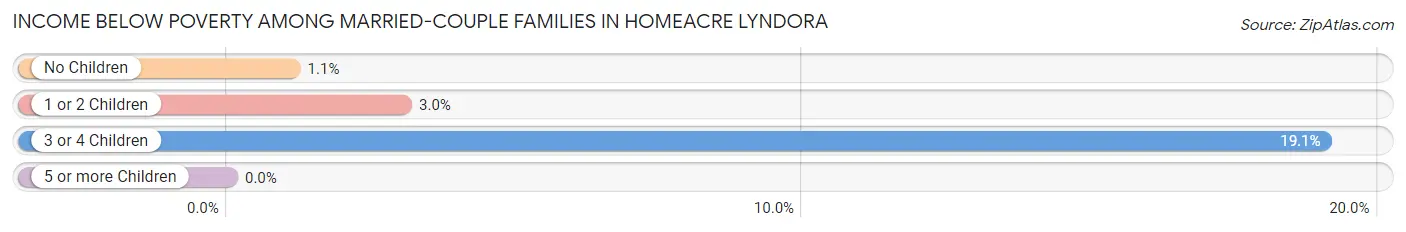
| Children | Above Poverty | Below Poverty |
| No Children | 904 (98.9%) | 10 (1.1%) |
| 1 or 2 Children | 384 (97.0%) | 12 (3.0%) |
| 3 or 4 Children | 34 (80.9%) | 8 (19.1%) |
| 5 or more Children | 0 (0.0%) | 0 (0.0%) |
| Total | 1,322 (97.8%) | 30 (2.2%) |
Income Below Poverty Among Single-Parent Households in Homeacre Lyndora
According to the poverty data in Homeacre Lyndora, 8.4% or 17 single-father households and 8.4% or 20 single-mother households are living below the poverty line. Among single-father households, those with no children have the highest poverty rate, with 11 households (11.7%) experiencing poverty. Likewise, among single-mother households, those with 5 or more children have the highest poverty rate, with 4 households (100.0%) falling below the poverty line.
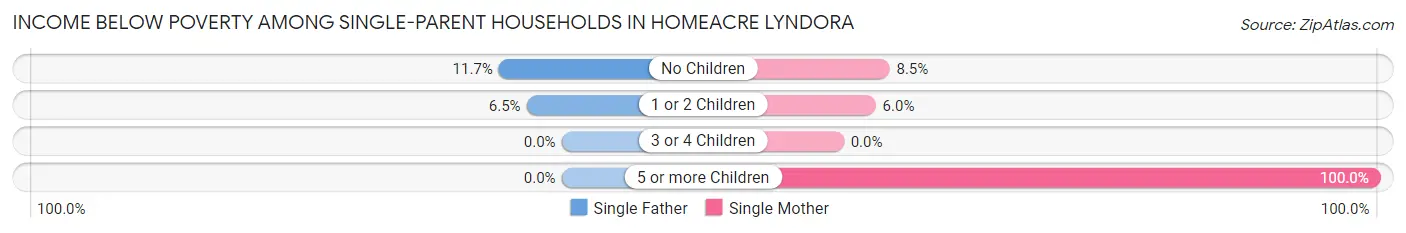
| Children | Single Father | Single Mother |
| No Children | 11 (11.7%) | 7 (8.5%) |
| 1 or 2 Children | 6 (6.5%) | 9 (6.0%) |
| 3 or 4 Children | 0 (0.0%) | 0 (0.0%) |
| 5 or more Children | 0 (0.0%) | 4 (100.0%) |
| Total | 17 (8.4%) | 20 (8.4%) |
Income Below Poverty Among Married-Couple vs Single-Parent Households in Homeacre Lyndora
The poverty data for Homeacre Lyndora shows that 30 of the married-couple family households (2.2%) and 37 of the single-parent households (8.4%) are living below the poverty level. Within the married-couple family households, those with 3 or 4 children have the highest poverty rate, with 8 households (19.1%) falling below the poverty line. Among the single-parent households, those with 5 or more children have the highest poverty rate, with 4 household (100.0%) living below poverty.
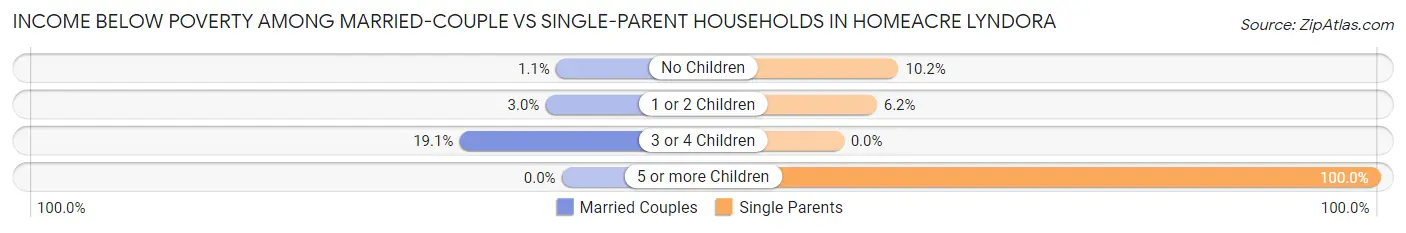
| Children | Married-Couple Families | Single-Parent Households |
| No Children | 10 (1.1%) | 18 (10.2%) |
| 1 or 2 Children | 12 (3.0%) | 15 (6.2%) |
| 3 or 4 Children | 8 (19.1%) | 0 (0.0%) |
| 5 or more Children | 0 (0.0%) | 4 (100.0%) |
| Total | 30 (2.2%) | 37 (8.4%) |
Race in Homeacre Lyndora
The most populous races in Homeacre Lyndora are White / Caucasian (6,325 | 93.7%), Hispanic or Latino (211 | 3.1%), and Two or more Races (141 | 2.1%).
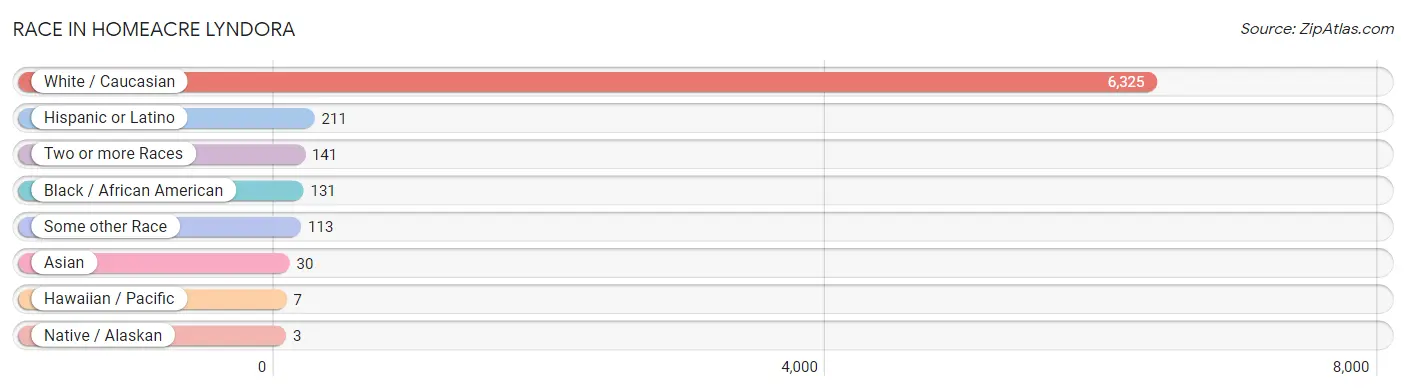
| Race | # Population | % Population |
| Asian | 30 | 0.4% |
| Black / African American | 131 | 1.9% |
| Hawaiian / Pacific | 7 | 0.1% |
| Hispanic or Latino | 211 | 3.1% |
| Native / Alaskan | 3 | 0.0% |
| White / Caucasian | 6,325 | 93.7% |
| Two or more Races | 141 | 2.1% |
| Some other Race | 113 | 1.7% |
| Total | 6,750 | 100.0% |
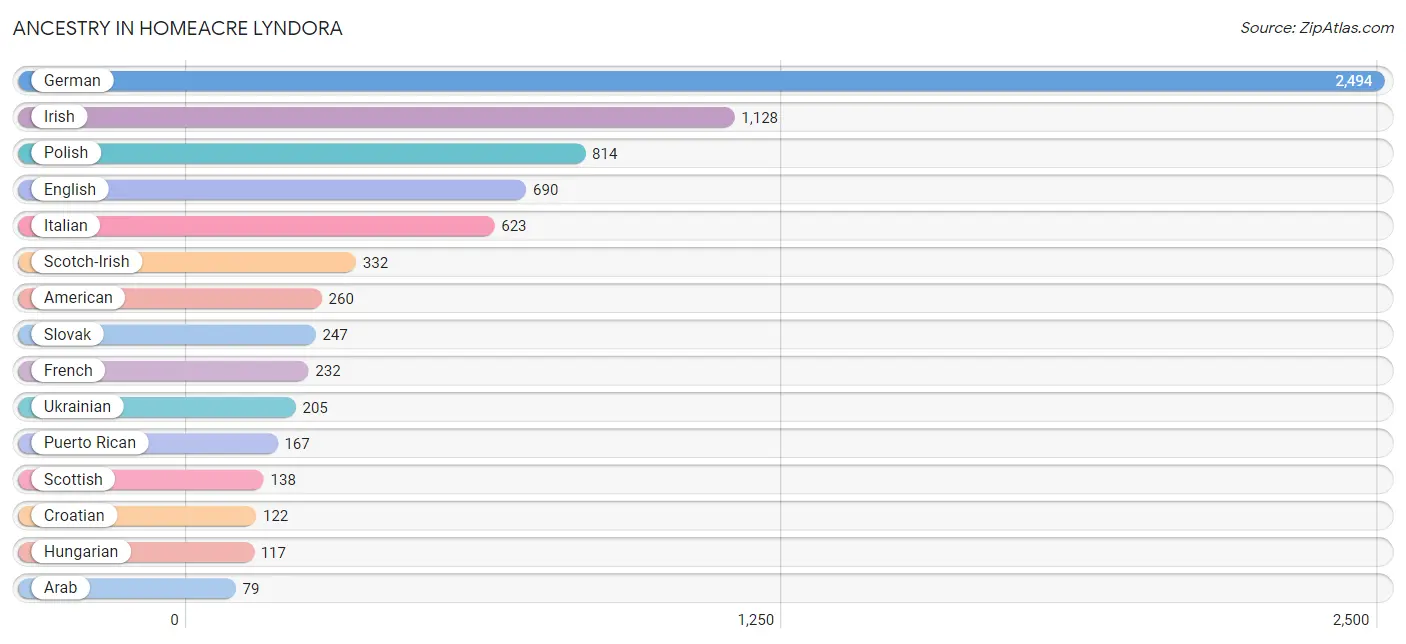
Ancestry in Homeacre Lyndora
The most populous ancestries reported in Homeacre Lyndora are German (2,494 | 36.9%), Irish (1,128 | 16.7%), Polish (814 | 12.1%), English (690 | 10.2%), and Italian (623 | 9.2%), together accounting for 85.2% of all Homeacre Lyndora residents.
| Ancestry | # Population | % Population |
| African | 8 | 0.1% |
| American | 260 | 3.8% |
| Arab | 79 | 1.2% |
| Armenian | 6 | 0.1% |
| Austrian | 30 | 0.4% |
| Belgian | 11 | 0.2% |
| Bhutanese | 16 | 0.2% |
| Blackfeet | 4 | 0.1% |
| British | 38 | 0.6% |
| Canadian | 9 | 0.1% |
| Cherokee | 13 | 0.2% |
| Croatian | 122 | 1.8% |
| Cuban | 8 | 0.1% |
| Czech | 45 | 0.7% |
| Czechoslovakian | 7 | 0.1% |
| Danish | 2 | 0.0% |
| Dominican | 2 | 0.0% |
| Dutch | 28 | 0.4% |
| Eastern European | 11 | 0.2% |
| English | 690 | 10.2% |
| European | 32 | 0.5% |
| Finnish | 8 | 0.1% |
| French | 232 | 3.4% |
| French Canadian | 15 | 0.2% |
| German | 2,494 | 36.9% |
| Greek | 39 | 0.6% |
| Hungarian | 117 | 1.7% |
| Indian (Asian) | 30 | 0.4% |
| Irish | 1,128 | 16.7% |
| Iroquois | 29 | 0.4% |
| Italian | 623 | 9.2% |
| Lithuanian | 17 | 0.3% |
| Mexican | 34 | 0.5% |
| Norwegian | 6 | 0.1% |
| Pennsylvania German | 14 | 0.2% |
| Polish | 814 | 12.1% |
| Puerto Rican | 167 | 2.5% |
| Romanian | 14 | 0.2% |
| Russian | 75 | 1.1% |
| Samoan | 26 | 0.4% |
| Scotch-Irish | 332 | 4.9% |
| Scottish | 138 | 2.0% |
| Slavic | 18 | 0.3% |
| Slovak | 247 | 3.7% |
| Slovene | 5 | 0.1% |
| Subsaharan African | 8 | 0.1% |
| Swedish | 52 | 0.8% |
| Swiss | 10 | 0.2% |
| Syrian | 79 | 1.2% |
| Ukrainian | 205 | 3.0% |
| Welsh | 47 | 0.7% | View All 51 Rows |
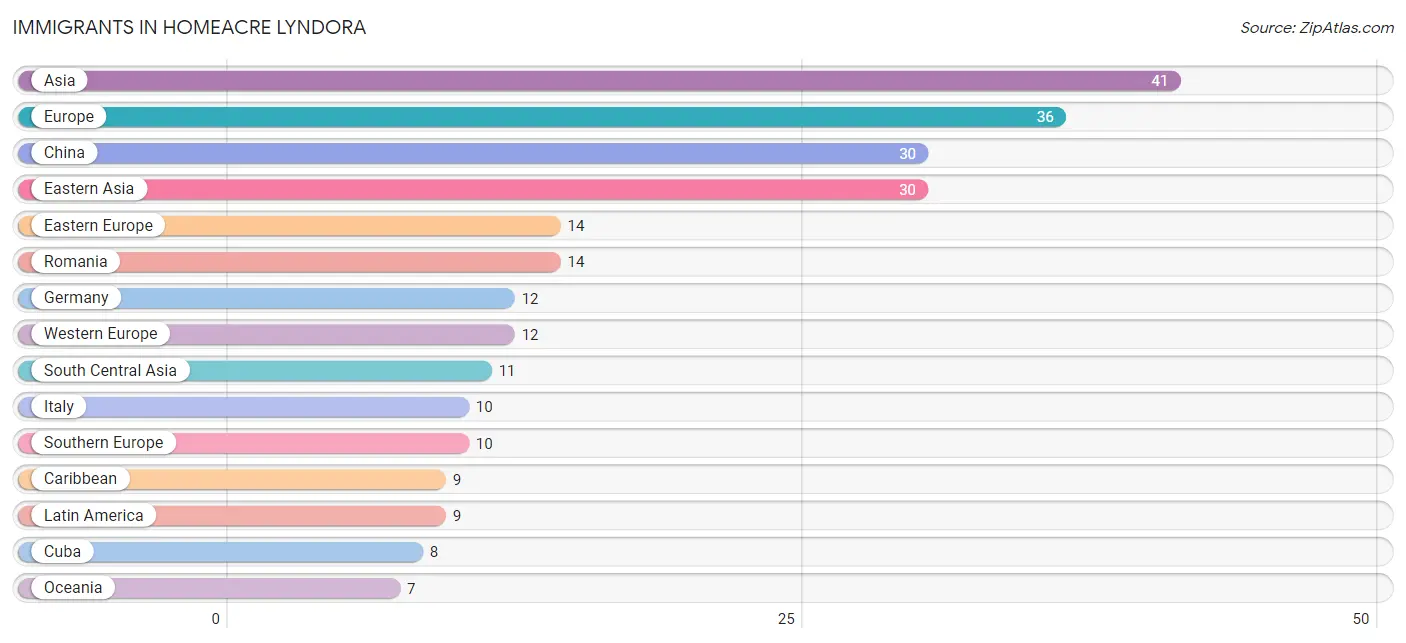
Immigrants in Homeacre Lyndora
The most numerous immigrant groups reported in Homeacre Lyndora came from Asia (41 | 0.6%), Europe (36 | 0.5%), China (30 | 0.4%), Eastern Asia (30 | 0.4%), and Eastern Europe (14 | 0.2%), together accounting for 2.2% of all Homeacre Lyndora residents.
| Immigration Origin | # Population | % Population |
| Asia | 41 | 0.6% |
| Caribbean | 9 | 0.1% |
| China | 30 | 0.4% |
| Cuba | 8 | 0.1% |
| Dominican Republic | 1 | 0.0% |
| Eastern Asia | 30 | 0.4% |
| Eastern Europe | 14 | 0.2% |
| Europe | 36 | 0.5% |
| Germany | 12 | 0.2% |
| Italy | 10 | 0.2% |
| Latin America | 9 | 0.1% |
| Oceania | 7 | 0.1% |
| Romania | 14 | 0.2% |
| South Central Asia | 11 | 0.2% |
| Southern Europe | 10 | 0.2% |
| Western Europe | 12 | 0.2% | View All 16 Rows |
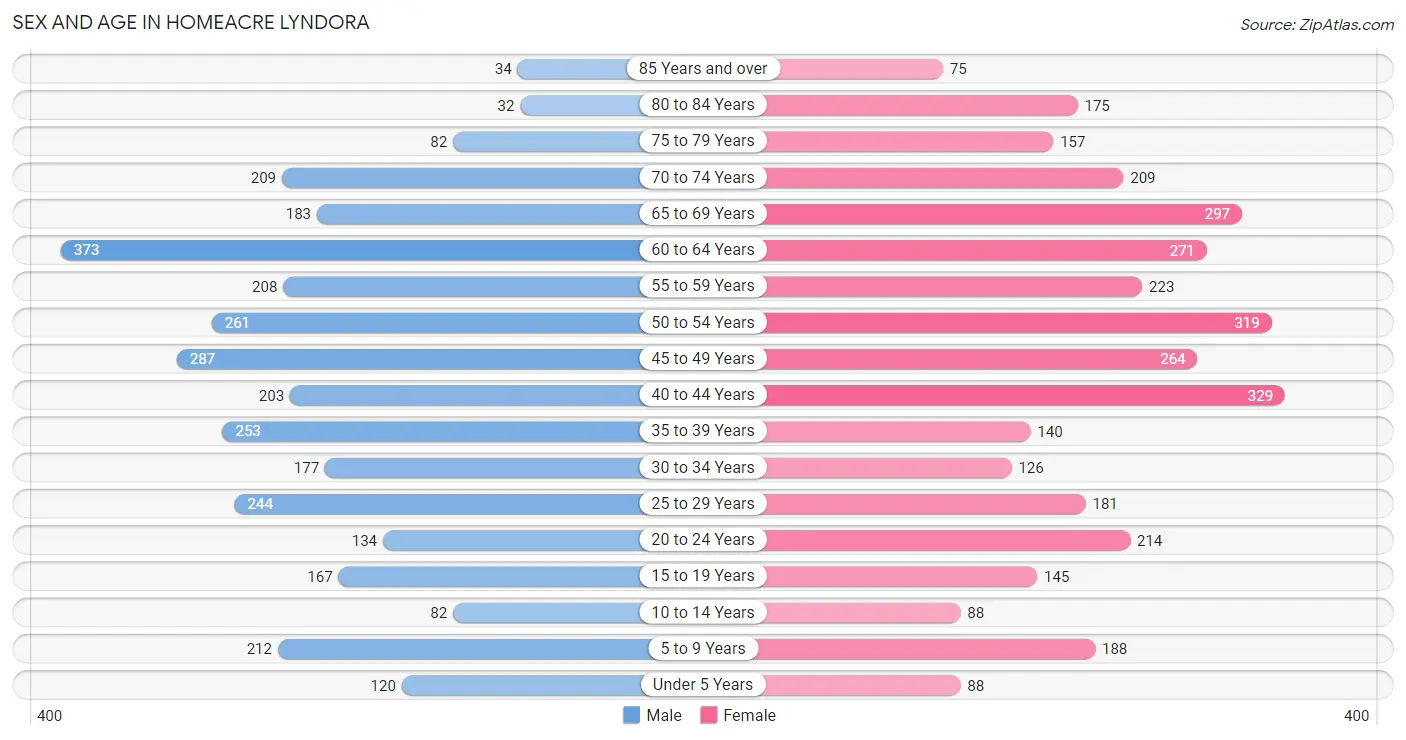
Sex and Age in Homeacre Lyndora
Sex and Age in Homeacre Lyndora
The most populous age groups in Homeacre Lyndora are 60 to 64 Years (373 | 11.4%) for men and 40 to 44 Years (329 | 9.4%) for women.
| Age Bracket | Male | Female |
| Under 5 Years | 120 (3.7%) | 88 (2.5%) |
| 5 to 9 Years | 212 (6.5%) | 188 (5.4%) |
| 10 to 14 Years | 82 (2.5%) | 88 (2.5%) |
| 15 to 19 Years | 167 (5.1%) | 145 (4.2%) |
| 20 to 24 Years | 134 (4.1%) | 214 (6.1%) |
| 25 to 29 Years | 244 (7.5%) | 181 (5.2%) |
| 30 to 34 Years | 177 (5.4%) | 126 (3.6%) |
| 35 to 39 Years | 253 (7.8%) | 140 (4.0%) |
| 40 to 44 Years | 203 (6.2%) | 329 (9.4%) |
| 45 to 49 Years | 287 (8.8%) | 264 (7.6%) |
| 50 to 54 Years | 261 (8.0%) | 319 (9.1%) |
| 55 to 59 Years | 208 (6.4%) | 223 (6.4%) |
| 60 to 64 Years | 373 (11.4%) | 271 (7.8%) |
| 65 to 69 Years | 183 (5.6%) | 297 (8.5%) |
| 70 to 74 Years | 209 (6.4%) | 209 (6.0%) |
| 75 to 79 Years | 82 (2.5%) | 157 (4.5%) |
| 80 to 84 Years | 32 (1.0%) | 175 (5.0%) |
| 85 Years and over | 34 (1.0%) | 75 (2.1%) |
| Total | 3,261 (100.0%) | 3,489 (100.0%) |
Families and Households in Homeacre Lyndora
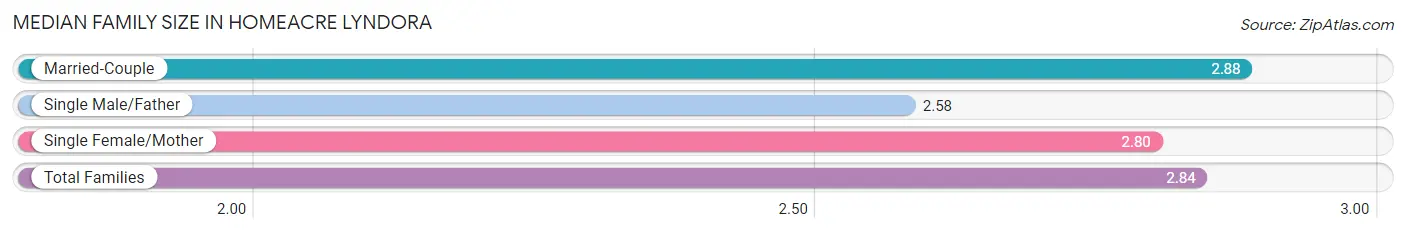
Median Family Size in Homeacre Lyndora
The median family size in Homeacre Lyndora is 2.84 persons per family, with married-couple families (1,352 | 75.5%) accounting for the largest median family size of 2.88 persons per family. On the other hand, single male/father families (202 | 11.3%) represent the smallest median family size with 2.58 persons per family.
| Family Type | # Families | Family Size |
| Married-Couple | 1,352 (75.5%) | 2.88 |
| Single Male/Father | 202 (11.3%) | 2.58 |
| Single Female/Mother | 237 (13.2%) | 2.80 |
| Total Families | 1,791 (100.0%) | 2.84 |
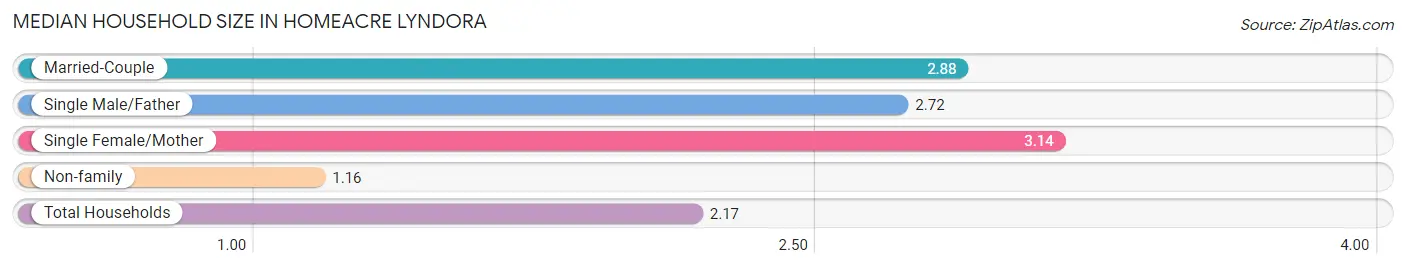
Median Household Size in Homeacre Lyndora
The median household size in Homeacre Lyndora is 2.17 persons per household, with single female/mother households (237 | 7.7%) accounting for the largest median household size of 3.14 persons per household. non-family households (1,283 | 41.7%) represent the smallest median household size with 1.16 persons per household.
| Household Type | # Households | Household Size |
| Married-Couple | 1,352 (44.0%) | 2.88 |
| Single Male/Father | 202 (6.6%) | 2.72 |
| Single Female/Mother | 237 (7.7%) | 3.14 |
| Non-family | 1,283 (41.7%) | 1.16 |
| Total Households | 3,074 (100.0%) | 2.17 |
Household Size by Marriage Status in Homeacre Lyndora
Out of a total of 3,074 households in Homeacre Lyndora, 1,791 (58.3%) are family households, while 1,283 (41.7%) are nonfamily households. The most numerous type of family households are 2-person households, comprising 848, and the most common type of nonfamily households are 1-person households, comprising 1,132.
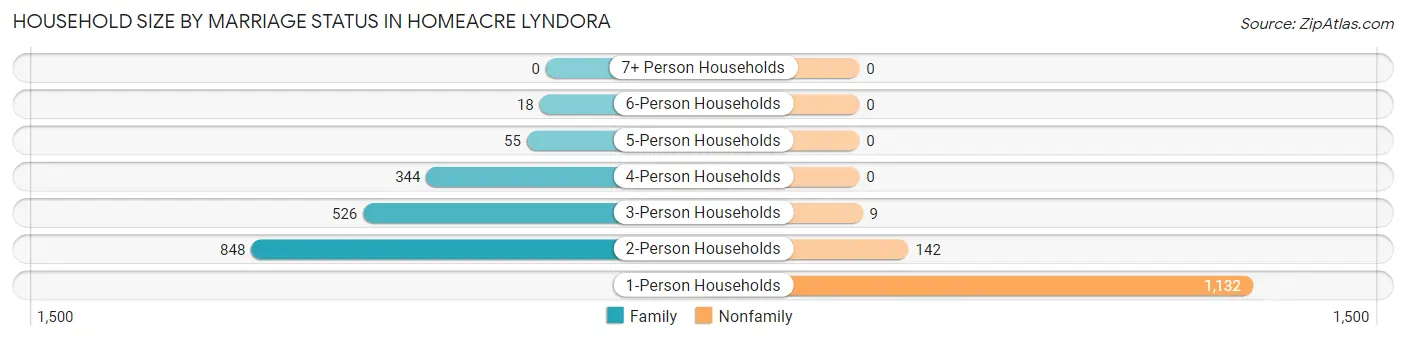
| Household Size | Family Households | Nonfamily Households |
| 1-Person Households | - | 1,132 (36.8%) |
| 2-Person Households | 848 (27.6%) | 142 (4.6%) |
| 3-Person Households | 526 (17.1%) | 9 (0.3%) |
| 4-Person Households | 344 (11.2%) | 0 (0.0%) |
| 5-Person Households | 55 (1.8%) | 0 (0.0%) |
| 6-Person Households | 18 (0.6%) | 0 (0.0%) |
| 7+ Person Households | 0 (0.0%) | 0 (0.0%) |
| Total | 1,791 (58.3%) | 1,283 (41.7%) |
Female Fertility in Homeacre Lyndora
Fertility by Age in Homeacre Lyndora
Average fertility rate in Homeacre Lyndora is 22.0 births per 1,000 women. Women in the age bracket of 20 to 34 years have the highest fertility rate with 60.0 births per 1,000 women. Women in the age bracket of 20 to 34 years acount for 100.0% of all women with births.
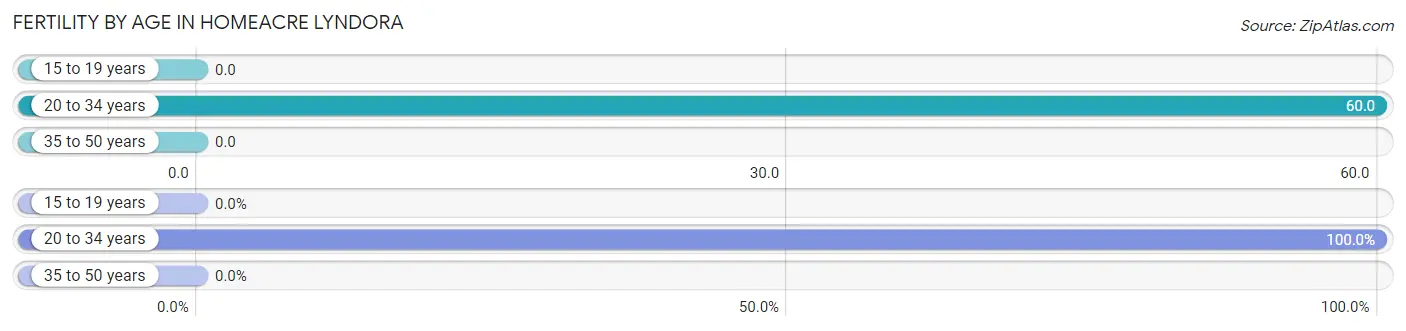
| Age Bracket | Women with Births | Births / 1,000 Women |
| 15 to 19 years | 0 (0.0%) | 0.0 |
| 20 to 34 years | 31 (100.0%) | 60.0 |
| 35 to 50 years | 0 (0.0%) | 0.0 |
| Total | 31 (100.0%) | 22.0 |
Fertility by Age by Marriage Status in Homeacre Lyndora
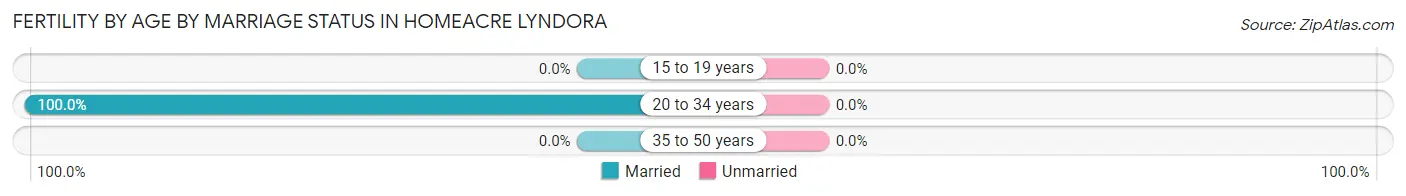
| Age Bracket | Married | Unmarried |
| 15 to 19 years | 0 (0.0%) | 0 (0.0%) |
| 20 to 34 years | 31 (100.0%) | 0 (0.0%) |
| 35 to 50 years | 0 (0.0%) | 0 (0.0%) |
| Total | 31 (100.0%) | 0 (0.0%) |
Fertility by Education in Homeacre Lyndora
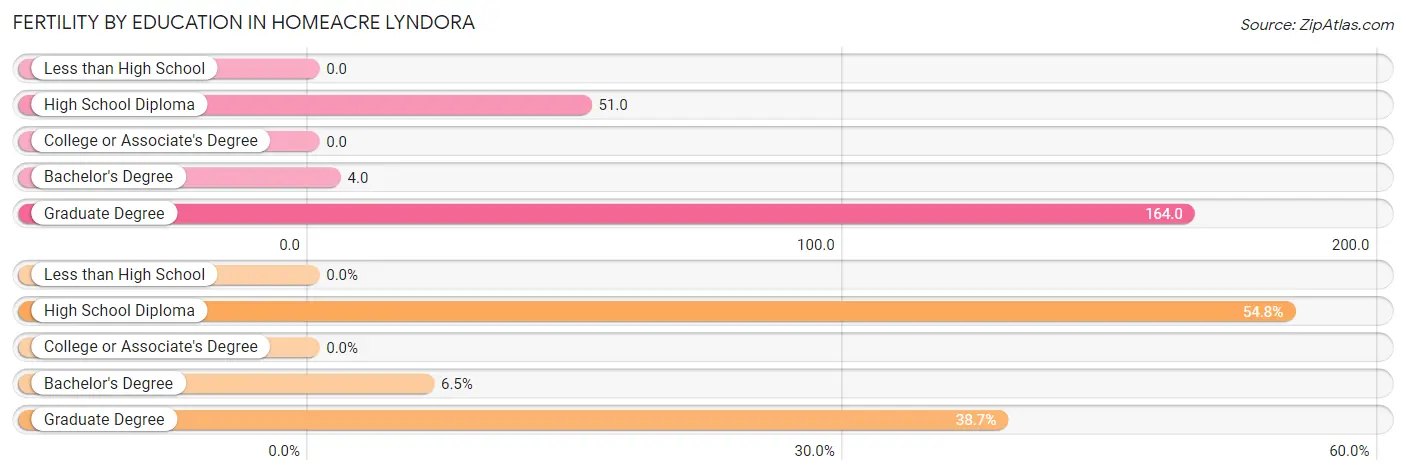
| Educational Attainment | Women with Births | Births / 1,000 Women |
| Less than High School | 0 (0.0%) | 0.0 |
| High School Diploma | 17 (54.8%) | 51.0 |
| College or Associate's Degree | 0 (0.0%) | 0.0 |
| Bachelor's Degree | 2 (6.5%) | 4.0 |
| Graduate Degree | 12 (38.7%) | 164.0 |
| Total | 31 (100.0%) | 22.0 |
Fertility by Education by Marriage Status in Homeacre Lyndora
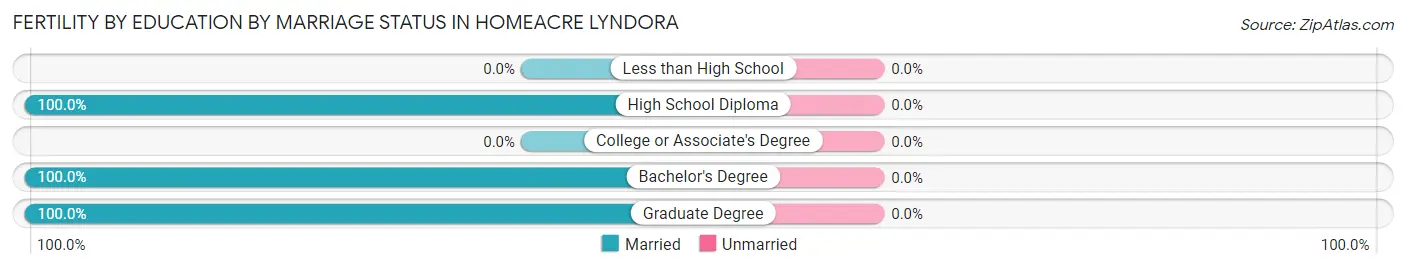
| Educational Attainment | Married | Unmarried |
| Less than High School | 0 (0.0%) | 0 (0.0%) |
| High School Diploma | 17 (100.0%) | 0 (0.0%) |
| College or Associate's Degree | 0 (0.0%) | 0 (0.0%) |
| Bachelor's Degree | 2 (100.0%) | 0 (0.0%) |
| Graduate Degree | 12 (100.0%) | 0 (0.0%) |
| Total | 31 (100.0%) | 0 (0.0%) |
Employment Characteristics in Homeacre Lyndora
Employment by Class of Employer in Homeacre Lyndora
Among the 3,690 employed individuals in Homeacre Lyndora, private company employees (2,496 | 67.6%), not-for-profit organizations (482 | 13.1%), and local government employees (237 | 6.4%) make up the most common classes of employment.
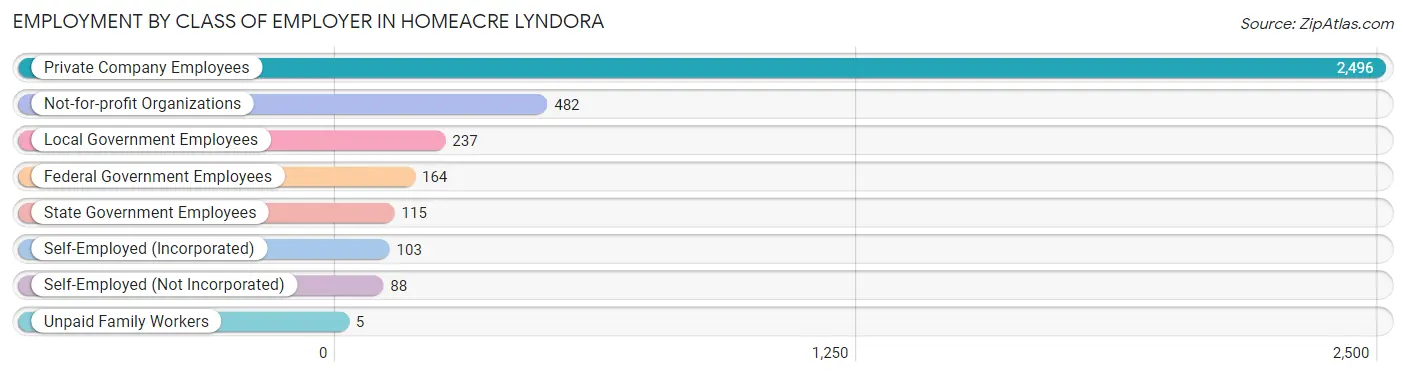
| Employer Class | # Employees | % Employees |
| Private Company Employees | 2,496 | 67.6% |
| Self-Employed (Incorporated) | 103 | 2.8% |
| Self-Employed (Not Incorporated) | 88 | 2.4% |
| Not-for-profit Organizations | 482 | 13.1% |
| Local Government Employees | 237 | 6.4% |
| State Government Employees | 115 | 3.1% |
| Federal Government Employees | 164 | 4.4% |
| Unpaid Family Workers | 5 | 0.1% |
| Total | 3,690 | 100.0% |
Employment Status by Age in Homeacre Lyndora
According to the labor force statistics for Homeacre Lyndora, out of the total population over 16 years of age (5,915), 66.2% or 3,916 individuals are in the labor force, with 4.4% or 172 of them unemployed. The age group with the highest labor force participation rate is 25 to 29 years, with 96.0% or 408 individuals in the labor force. Within the labor force, the 25 to 29 years age range has the highest percentage of unemployed individuals, with 12.0% or 49 of them being unemployed.
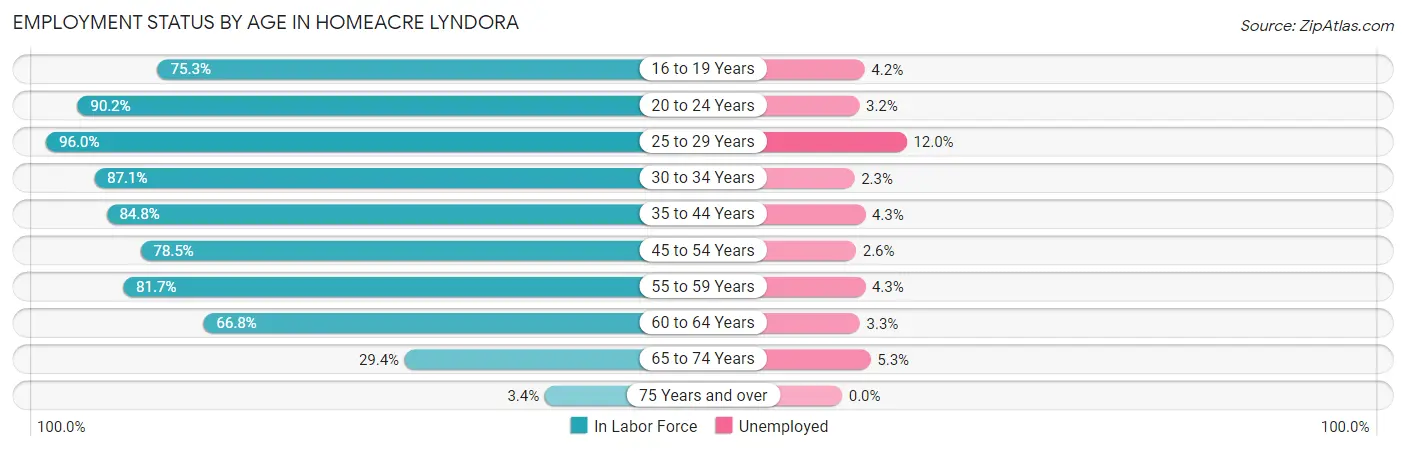
| Age Bracket | In Labor Force | Unemployed |
| 16 to 19 Years | 192 (75.3%) | 8 (4.2%) |
| 20 to 24 Years | 314 (90.2%) | 10 (3.2%) |
| 25 to 29 Years | 408 (96.0%) | 49 (12.0%) |
| 30 to 34 Years | 264 (87.1%) | 6 (2.3%) |
| 35 to 44 Years | 784 (84.8%) | 34 (4.3%) |
| 45 to 54 Years | 888 (78.5%) | 23 (2.6%) |
| 55 to 59 Years | 352 (81.7%) | 15 (4.3%) |
| 60 to 64 Years | 430 (66.8%) | 14 (3.3%) |
| 65 to 74 Years | 264 (29.4%) | 14 (5.3%) |
| 75 Years and over | 19 (3.4%) | 0 (0.0%) |
| Total | 3,916 (66.2%) | 172 (4.4%) |
Employment Status by Educational Attainment in Homeacre Lyndora
According to labor force statistics for Homeacre Lyndora, 81.0% of individuals (3,126) out of the total population between 25 and 64 years of age (3,859) are in the labor force, with 4.5% or 141 of them being unemployed. The group with the highest labor force participation rate are those with the educational attainment of college / associate degree, with 86.5% or 1,049 individuals in the labor force. Within the labor force, individuals with college / associate degree education have the highest percentage of unemployment, with 8.4% or 88 of them being unemployed.
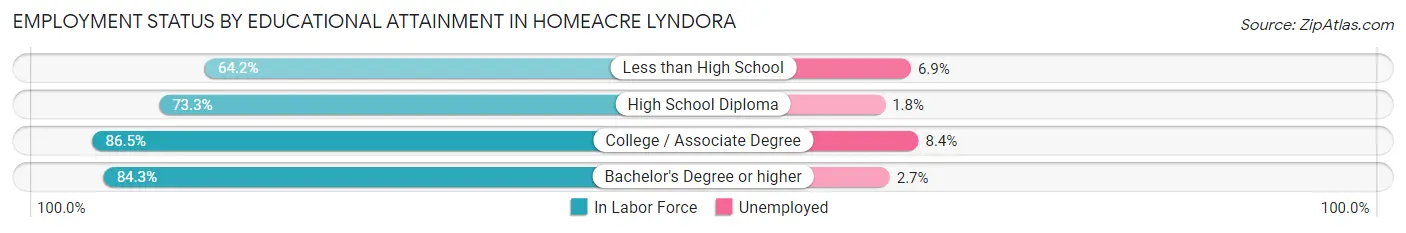
| Educational Attainment | In Labor Force | Unemployed |
| Less than High School | 102 (64.2%) | 11 (6.9%) |
| High School Diploma | 811 (73.3%) | 20 (1.8%) |
| College / Associate Degree | 1,049 (86.5%) | 102 (8.4%) |
| Bachelor's Degree or higher | 1,163 (84.3%) | 37 (2.7%) |
| Total | 3,126 (81.0%) | 174 (4.5%) |
Employment Occupations by Sex in Homeacre Lyndora
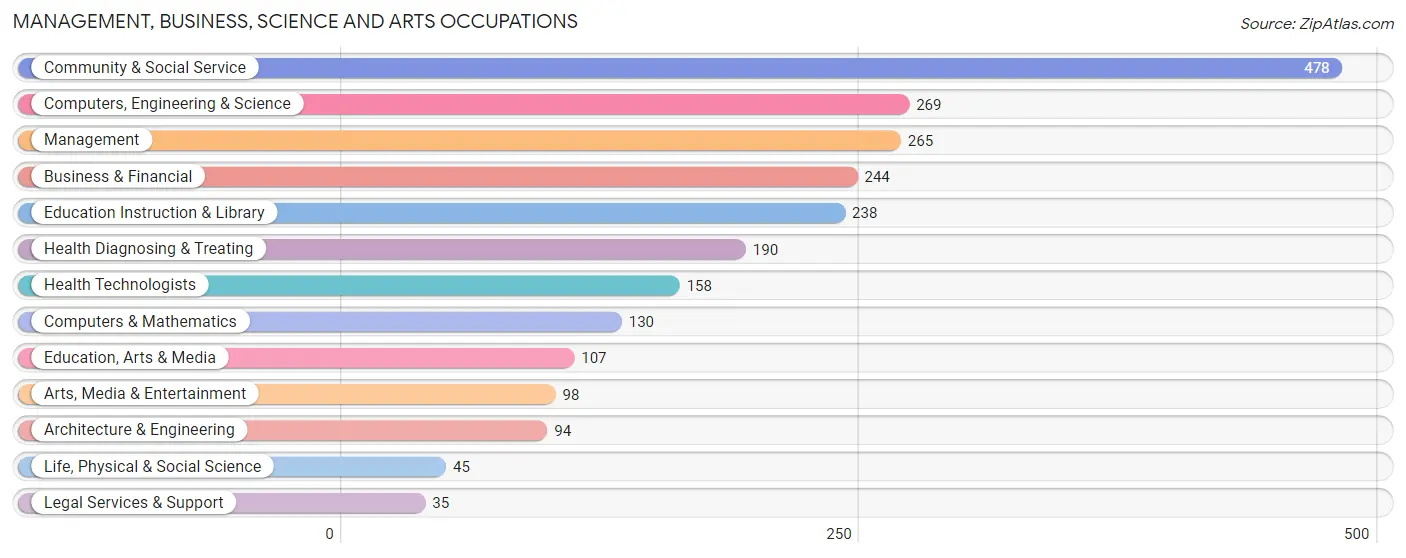
Management, Business, Science and Arts Occupations
The most common Management, Business, Science and Arts occupations in Homeacre Lyndora are Community & Social Service (478 | 12.8%), Computers, Engineering & Science (269 | 7.2%), Management (265 | 7.1%), Business & Financial (244 | 6.5%), and Education Instruction & Library (238 | 6.4%).
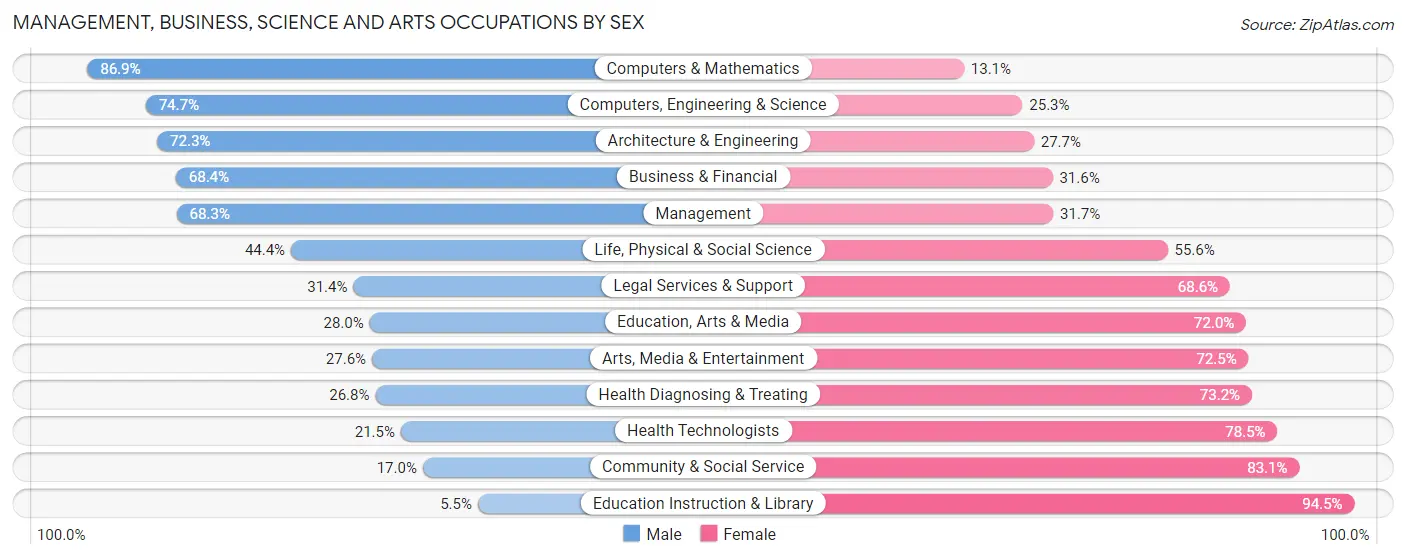
Management, Business, Science and Arts Occupations by Sex
Within the Management, Business, Science and Arts occupations in Homeacre Lyndora, the most male-oriented occupations are Computers & Mathematics (86.9%), Computers, Engineering & Science (74.7%), and Architecture & Engineering (72.3%), while the most female-oriented occupations are Education Instruction & Library (94.5%), Community & Social Service (83.1%), and Health Technologists (78.5%).
| Occupation | Male | Female |
| Management | 181 (68.3%) | 84 (31.7%) |
| Business & Financial | 167 (68.4%) | 77 (31.6%) |
| Computers, Engineering & Science | 201 (74.7%) | 68 (25.3%) |
| Computers & Mathematics | 113 (86.9%) | 17 (13.1%) |
| Architecture & Engineering | 68 (72.3%) | 26 (27.7%) |
| Life, Physical & Social Science | 20 (44.4%) | 25 (55.6%) |
| Community & Social Service | 81 (17.0%) | 397 (83.1%) |
| Education, Arts & Media | 30 (28.0%) | 77 (72.0%) |
| Legal Services & Support | 11 (31.4%) | 24 (68.6%) |
| Education Instruction & Library | 13 (5.5%) | 225 (94.5%) |
| Arts, Media & Entertainment | 27 (27.6%) | 71 (72.5%) |
| Health Diagnosing & Treating | 51 (26.8%) | 139 (73.2%) |
| Health Technologists | 34 (21.5%) | 124 (78.5%) |
| Total (Category) | 681 (47.1%) | 765 (52.9%) |
| Total (Overall) | 1,998 (53.4%) | 1,744 (46.6%) |
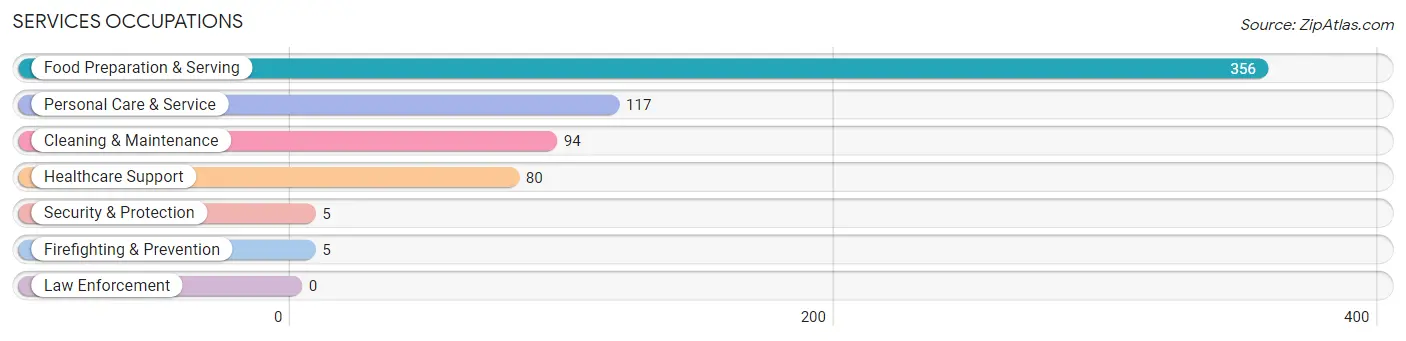
Services Occupations
The most common Services occupations in Homeacre Lyndora are Food Preparation & Serving (356 | 9.5%), Personal Care & Service (117 | 3.1%), Cleaning & Maintenance (94 | 2.5%), Healthcare Support (80 | 2.1%), and Security & Protection (5 | 0.1%).
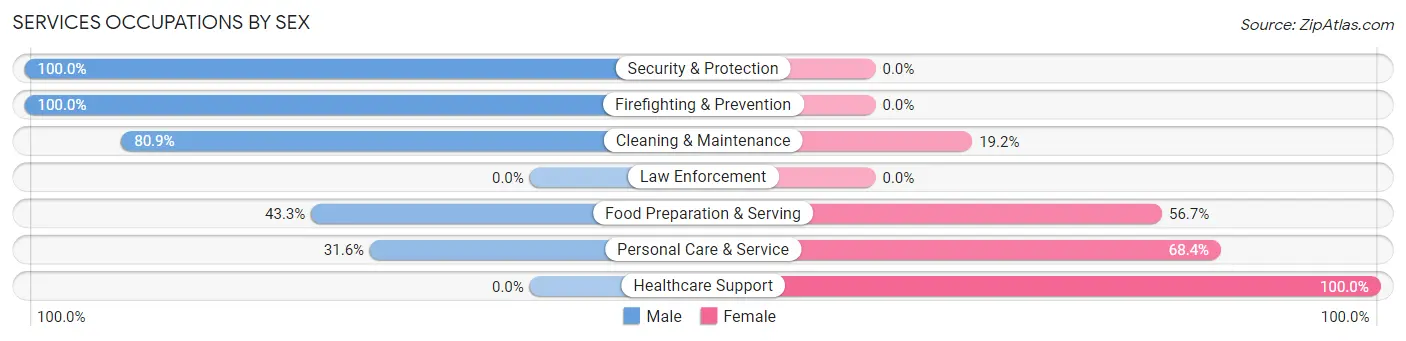
Services Occupations by Sex
Within the Services occupations in Homeacre Lyndora, the most male-oriented occupations are Security & Protection (100.0%), Firefighting & Prevention (100.0%), and Cleaning & Maintenance (80.8%), while the most female-oriented occupations are Healthcare Support (100.0%), Personal Care & Service (68.4%), and Food Preparation & Serving (56.7%).
| Occupation | Male | Female |
| Healthcare Support | 0 (0.0%) | 80 (100.0%) |
| Security & Protection | 5 (100.0%) | 0 (0.0%) |
| Firefighting & Prevention | 5 (100.0%) | 0 (0.0%) |
| Law Enforcement | 0 (0.0%) | 0 (0.0%) |
| Food Preparation & Serving | 154 (43.3%) | 202 (56.7%) |
| Cleaning & Maintenance | 76 (80.8%) | 18 (19.2%) |
| Personal Care & Service | 37 (31.6%) | 80 (68.4%) |
| Total (Category) | 272 (41.7%) | 380 (58.3%) |
| Total (Overall) | 1,998 (53.4%) | 1,744 (46.6%) |
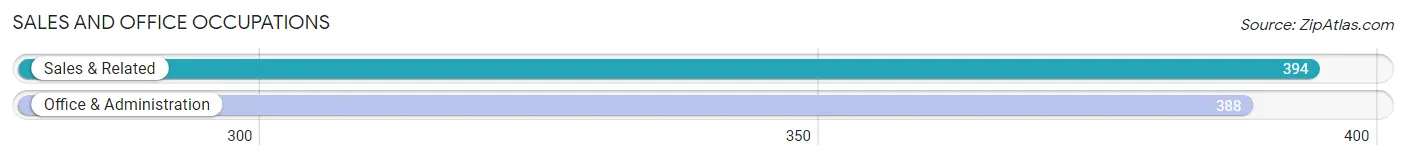
Sales and Office Occupations
The most common Sales and Office occupations in Homeacre Lyndora are Sales & Related (394 | 10.5%), and Office & Administration (388 | 10.4%).
Sales and Office Occupations by Sex
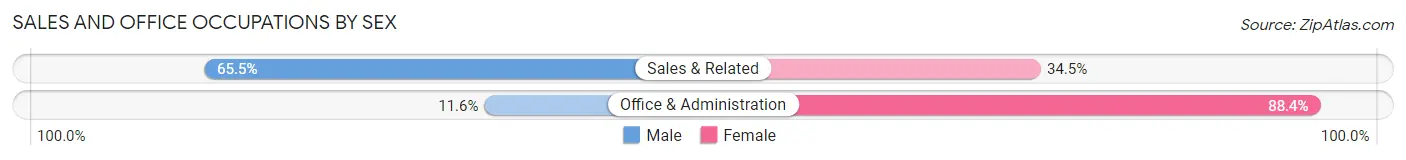
| Occupation | Male | Female |
| Sales & Related | 258 (65.5%) | 136 (34.5%) |
| Office & Administration | 45 (11.6%) | 343 (88.4%) |
| Total (Category) | 303 (38.8%) | 479 (61.3%) |
| Total (Overall) | 1,998 (53.4%) | 1,744 (46.6%) |
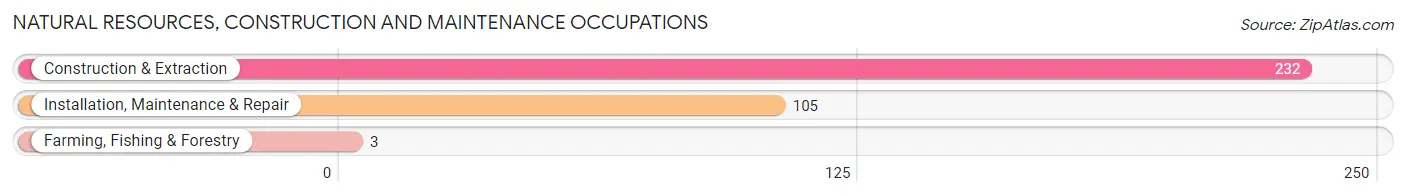
Natural Resources, Construction and Maintenance Occupations
The most common Natural Resources, Construction and Maintenance occupations in Homeacre Lyndora are Construction & Extraction (232 | 6.2%), Installation, Maintenance & Repair (105 | 2.8%), and Farming, Fishing & Forestry (3 | 0.1%).
Natural Resources, Construction and Maintenance Occupations by Sex
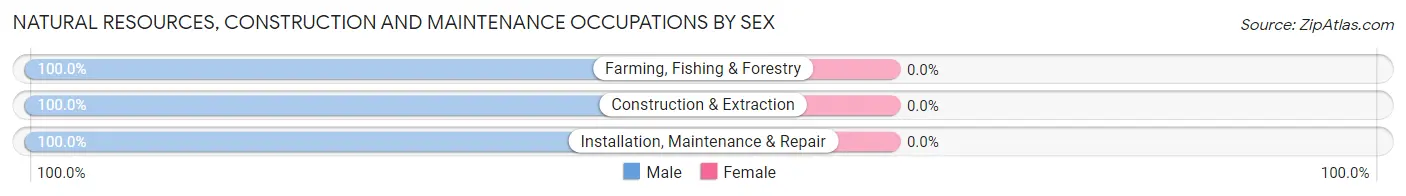
| Occupation | Male | Female |
| Farming, Fishing & Forestry | 3 (100.0%) | 0 (0.0%) |
| Construction & Extraction | 232 (100.0%) | 0 (0.0%) |
| Installation, Maintenance & Repair | 105 (100.0%) | 0 (0.0%) |
| Total (Category) | 340 (100.0%) | 0 (0.0%) |
| Total (Overall) | 1,998 (53.4%) | 1,744 (46.6%) |
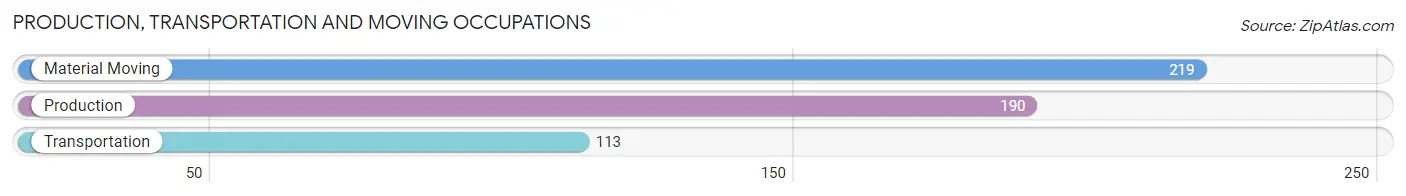
Production, Transportation and Moving Occupations
The most common Production, Transportation and Moving occupations in Homeacre Lyndora are Material Moving (219 | 5.9%), Production (190 | 5.1%), and Transportation (113 | 3.0%).
Production, Transportation and Moving Occupations by Sex
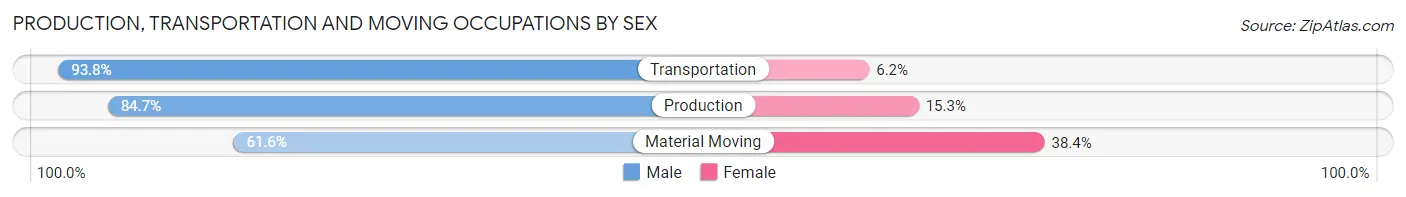
| Occupation | Male | Female |
| Production | 161 (84.7%) | 29 (15.3%) |
| Transportation | 106 (93.8%) | 7 (6.2%) |
| Material Moving | 135 (61.6%) | 84 (38.4%) |
| Total (Category) | 402 (77.0%) | 120 (23.0%) |
| Total (Overall) | 1,998 (53.4%) | 1,744 (46.6%) |
Employment Industries by Sex in Homeacre Lyndora
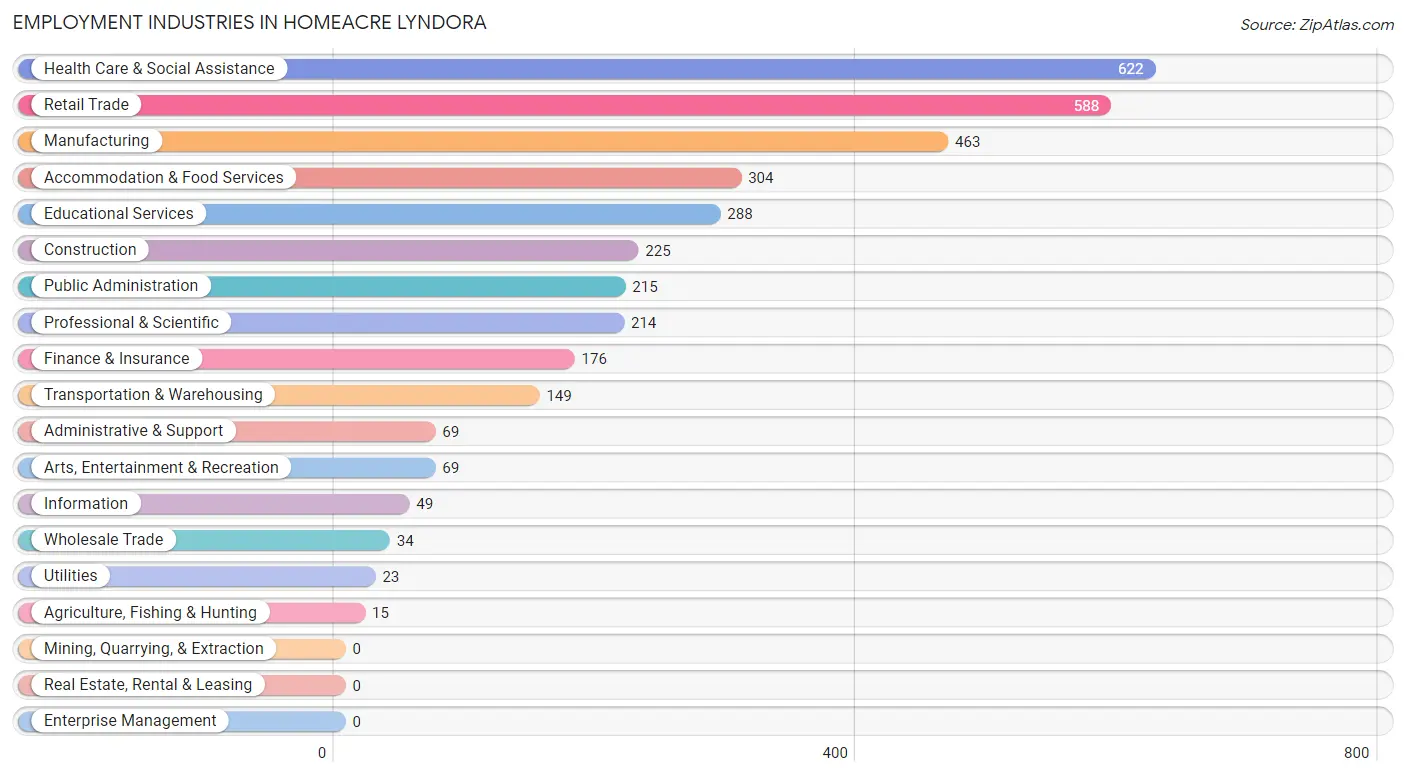
Employment Industries in Homeacre Lyndora
The major employment industries in Homeacre Lyndora include Health Care & Social Assistance (622 | 16.6%), Retail Trade (588 | 15.7%), Manufacturing (463 | 12.4%), Accommodation & Food Services (304 | 8.1%), and Educational Services (288 | 7.7%).
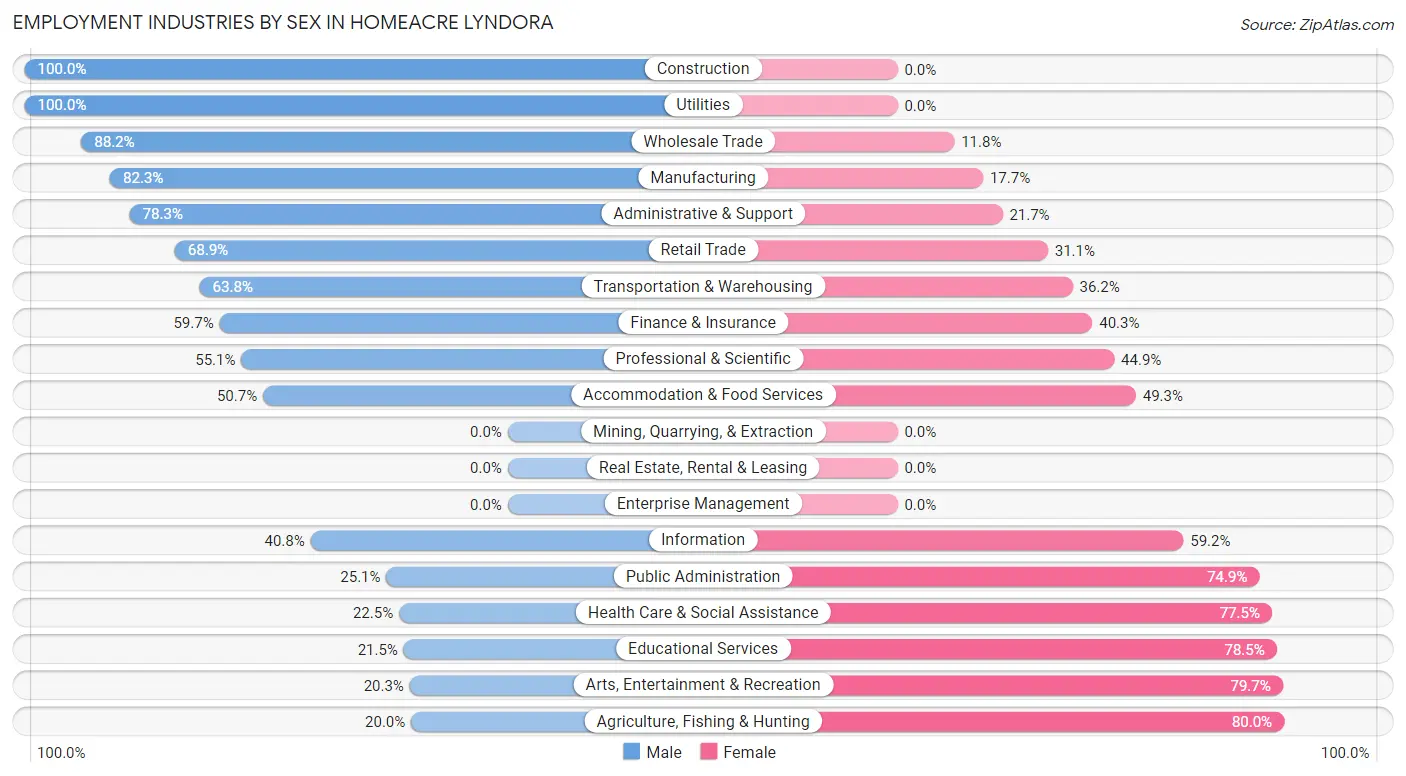
Employment Industries by Sex in Homeacre Lyndora
The Homeacre Lyndora industries that see more men than women are Construction (100.0%), Utilities (100.0%), and Wholesale Trade (88.2%), whereas the industries that tend to have a higher number of women are Agriculture, Fishing & Hunting (80.0%), Arts, Entertainment & Recreation (79.7%), and Educational Services (78.5%).
| Industry | Male | Female |
| Agriculture, Fishing & Hunting | 3 (20.0%) | 12 (80.0%) |
| Mining, Quarrying, & Extraction | 0 (0.0%) | 0 (0.0%) |
| Construction | 225 (100.0%) | 0 (0.0%) |
| Manufacturing | 381 (82.3%) | 82 (17.7%) |
| Wholesale Trade | 30 (88.2%) | 4 (11.8%) |
| Retail Trade | 405 (68.9%) | 183 (31.1%) |
| Transportation & Warehousing | 95 (63.8%) | 54 (36.2%) |
| Utilities | 23 (100.0%) | 0 (0.0%) |
| Information | 20 (40.8%) | 29 (59.2%) |
| Finance & Insurance | 105 (59.7%) | 71 (40.3%) |
| Real Estate, Rental & Leasing | 0 (0.0%) | 0 (0.0%) |
| Professional & Scientific | 118 (55.1%) | 96 (44.9%) |
| Enterprise Management | 0 (0.0%) | 0 (0.0%) |
| Administrative & Support | 54 (78.3%) | 15 (21.7%) |
| Educational Services | 62 (21.5%) | 226 (78.5%) |
| Health Care & Social Assistance | 140 (22.5%) | 482 (77.5%) |
| Arts, Entertainment & Recreation | 14 (20.3%) | 55 (79.7%) |
| Accommodation & Food Services | 154 (50.7%) | 150 (49.3%) |
| Public Administration | 54 (25.1%) | 161 (74.9%) |
| Total | 1,998 (53.4%) | 1,744 (46.6%) |
Education in Homeacre Lyndora
School Enrollment in Homeacre Lyndora
The most common levels of schooling among the 1,128 students in Homeacre Lyndora are elementary school (330 | 29.3%), high school (295 | 26.2%), and college / undergraduate (252 | 22.3%).
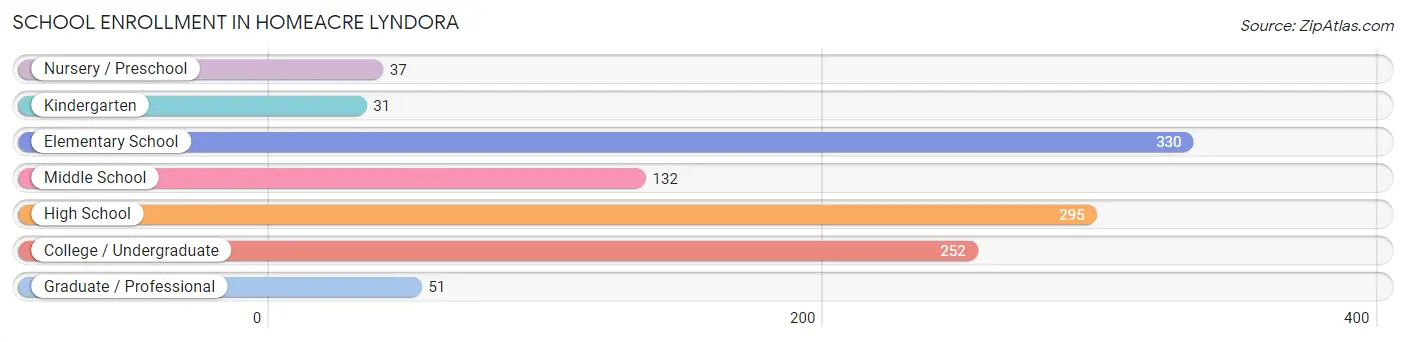
| School Level | # Students | % Students |
| Nursery / Preschool | 37 | 3.3% |
| Kindergarten | 31 | 2.8% |
| Elementary School | 330 | 29.3% |
| Middle School | 132 | 11.7% |
| High School | 295 | 26.2% |
| College / Undergraduate | 252 | 22.3% |
| Graduate / Professional | 51 | 4.5% |
| Total | 1,128 | 100.0% |
School Enrollment by Age by Funding Source in Homeacre Lyndora
Out of a total of 1,128 students who are enrolled in schools in Homeacre Lyndora, 120 (10.6%) attend a private institution, while the remaining 1,008 (89.4%) are enrolled in public schools. The age group of 3 to 4 year olds has the highest likelihood of being enrolled in private schools, with 21 (56.8% in the age bracket) enrolled. Conversely, the age group of 15 to 17 year olds has the lowest likelihood of being enrolled in a private school, with 248 (100.0% in the age bracket) attending a public institution.
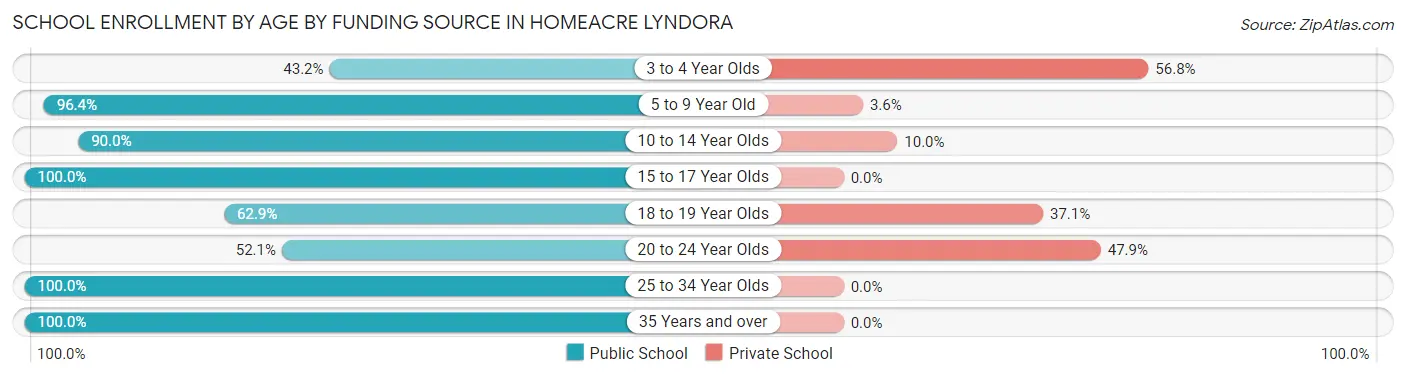
| Age Bracket | Public School | Private School |
| 3 to 4 Year Olds | 16 (43.2%) | 21 (56.8%) |
| 5 to 9 Year Old | 322 (96.4%) | 12 (3.6%) |
| 10 to 14 Year Olds | 153 (90.0%) | 17 (10.0%) |
| 15 to 17 Year Olds | 248 (100.0%) | 0 (0.0%) |
| 18 to 19 Year Olds | 22 (62.9%) | 13 (37.1%) |
| 20 to 24 Year Olds | 62 (52.1%) | 57 (47.9%) |
| 25 to 34 Year Olds | 91 (100.0%) | 0 (0.0%) |
| 35 Years and over | 94 (100.0%) | 0 (0.0%) |
| Total | 1,008 (89.4%) | 120 (10.6%) |
Educational Attainment by Field of Study in Homeacre Lyndora
Business (498 | 27.6%), education (188 | 10.4%), bio, nature & agricultural (154 | 8.5%), social sciences (119 | 6.6%), and arts & humanities (118 | 6.5%) are the most common fields of study among 1,807 individuals in Homeacre Lyndora who have obtained a bachelor's degree or higher.
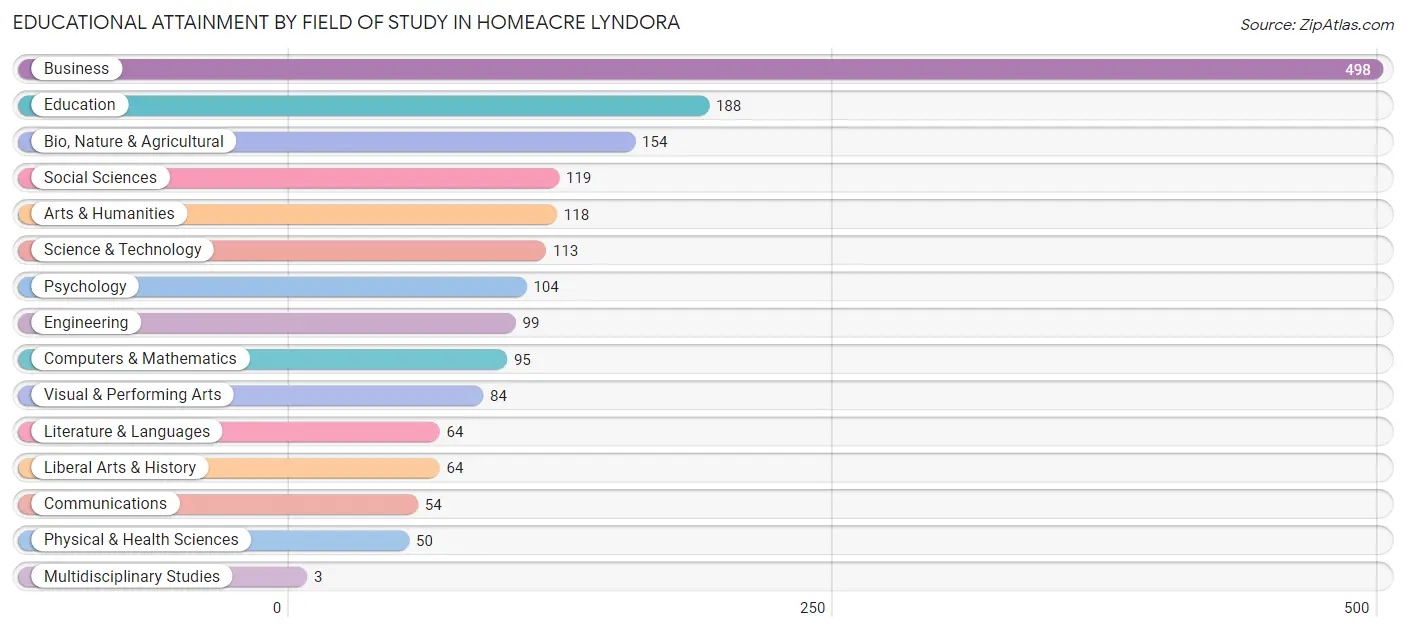
| Field of Study | # Graduates | % Graduates |
| Computers & Mathematics | 95 | 5.3% |
| Bio, Nature & Agricultural | 154 | 8.5% |
| Physical & Health Sciences | 50 | 2.8% |
| Psychology | 104 | 5.8% |
| Social Sciences | 119 | 6.6% |
| Engineering | 99 | 5.5% |
| Multidisciplinary Studies | 3 | 0.2% |
| Science & Technology | 113 | 6.2% |
| Business | 498 | 27.6% |
| Education | 188 | 10.4% |
| Literature & Languages | 64 | 3.5% |
| Liberal Arts & History | 64 | 3.5% |
| Visual & Performing Arts | 84 | 4.6% |
| Communications | 54 | 3.0% |
| Arts & Humanities | 118 | 6.5% |
| Total | 1,807 | 100.0% |
Transportation & Commute in Homeacre Lyndora
Vehicle Availability by Sex in Homeacre Lyndora
The most prevalent vehicle ownership categories in Homeacre Lyndora are males with 2 vehicles (771, accounting for 39.5%) and females with 2 vehicles (751, making up 44.7%).
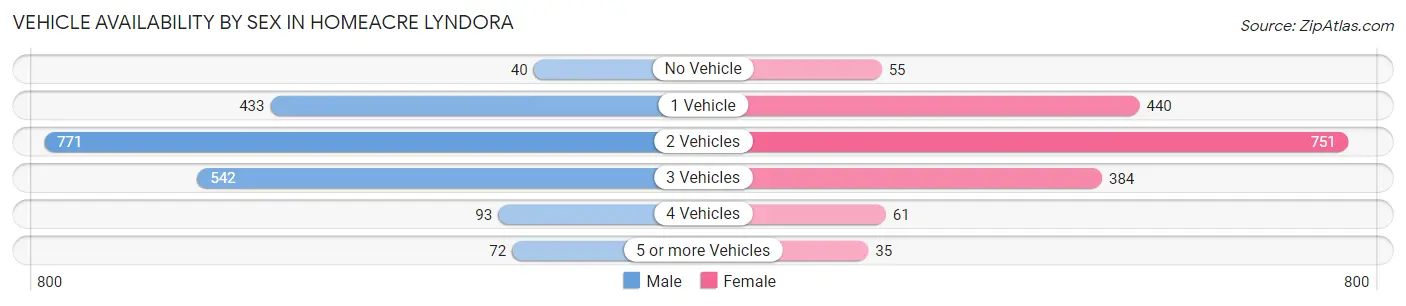
| Vehicles Available | Male | Female |
| No Vehicle | 40 (2.1%) | 55 (3.2%) |
| 1 Vehicle | 433 (22.2%) | 440 (25.5%) |
| 2 Vehicles | 771 (39.5%) | 751 (43.5%) |
| 3 Vehicles | 542 (27.8%) | 384 (22.3%) |
| 4 Vehicles | 93 (4.8%) | 61 (3.5%) |
| 5 or more Vehicles | 72 (3.7%) | 35 (2.0%) |
| Total | 1,951 (100.0%) | 1,726 (100.0%) |
Commute Time in Homeacre Lyndora
The most frequently occuring commute durations in Homeacre Lyndora are 10 to 14 minutes (709 commuters, 21.4%), 15 to 19 minutes (509 commuters, 15.4%), and 5 to 9 minutes (502 commuters, 15.2%).
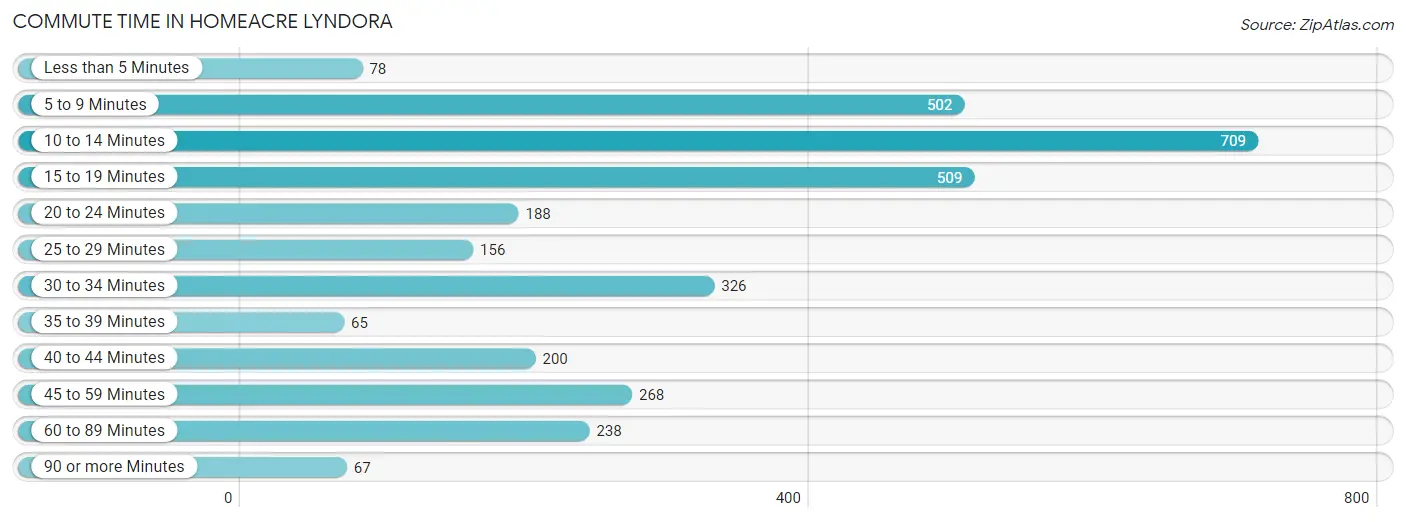
| Commute Time | # Commuters | % Commuters |
| Less than 5 Minutes | 78 | 2.4% |
| 5 to 9 Minutes | 502 | 15.2% |
| 10 to 14 Minutes | 709 | 21.4% |
| 15 to 19 Minutes | 509 | 15.4% |
| 20 to 24 Minutes | 188 | 5.7% |
| 25 to 29 Minutes | 156 | 4.7% |
| 30 to 34 Minutes | 326 | 9.9% |
| 35 to 39 Minutes | 65 | 2.0% |
| 40 to 44 Minutes | 200 | 6.0% |
| 45 to 59 Minutes | 268 | 8.1% |
| 60 to 89 Minutes | 238 | 7.2% |
| 90 or more Minutes | 67 | 2.0% |
Commute Time by Sex in Homeacre Lyndora
The most common commute times in Homeacre Lyndora are 10 to 14 minutes (379 commuters, 20.9%) for males and 15 to 19 minutes (354 commuters, 23.7%) for females.
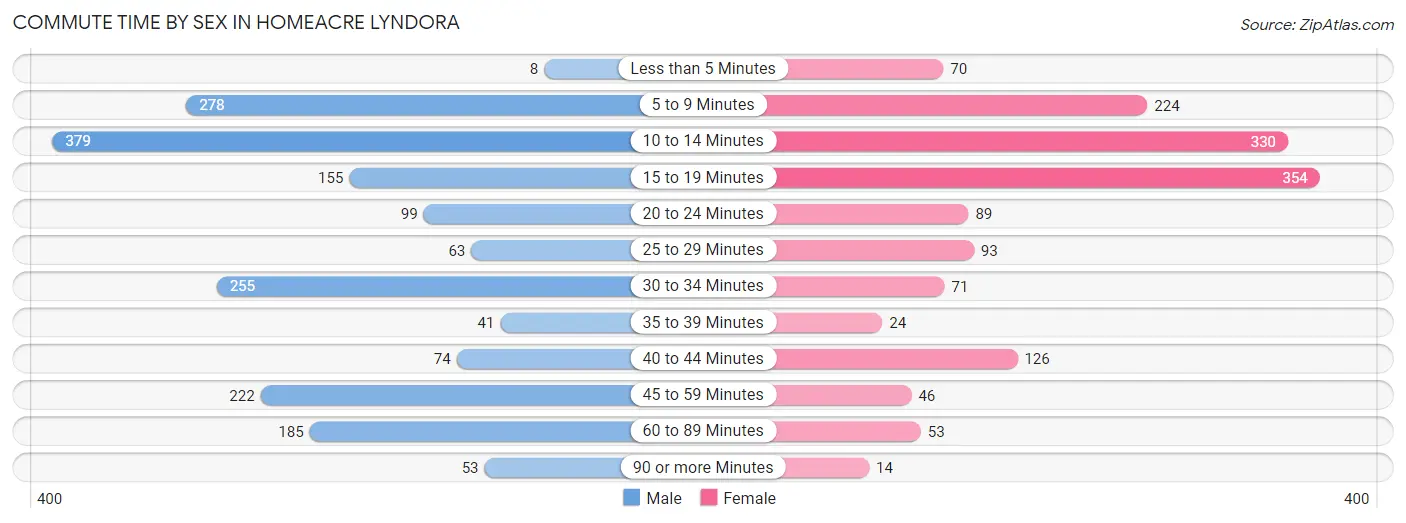
| Commute Time | Male | Female |
| Less than 5 Minutes | 8 (0.4%) | 70 (4.7%) |
| 5 to 9 Minutes | 278 (15.3%) | 224 (15.0%) |
| 10 to 14 Minutes | 379 (20.9%) | 330 (22.1%) |
| 15 to 19 Minutes | 155 (8.6%) | 354 (23.7%) |
| 20 to 24 Minutes | 99 (5.5%) | 89 (6.0%) |
| 25 to 29 Minutes | 63 (3.5%) | 93 (6.2%) |
| 30 to 34 Minutes | 255 (14.1%) | 71 (4.8%) |
| 35 to 39 Minutes | 41 (2.3%) | 24 (1.6%) |
| 40 to 44 Minutes | 74 (4.1%) | 126 (8.4%) |
| 45 to 59 Minutes | 222 (12.2%) | 46 (3.1%) |
| 60 to 89 Minutes | 185 (10.2%) | 53 (3.5%) |
| 90 or more Minutes | 53 (2.9%) | 14 (0.9%) |
Time of Departure to Work by Sex in Homeacre Lyndora
The most frequent times of departure to work in Homeacre Lyndora are 6:00 AM to 6:29 AM (243, 13.4%) for males and 8:00 AM to 8:29 AM (271, 18.1%) for females.
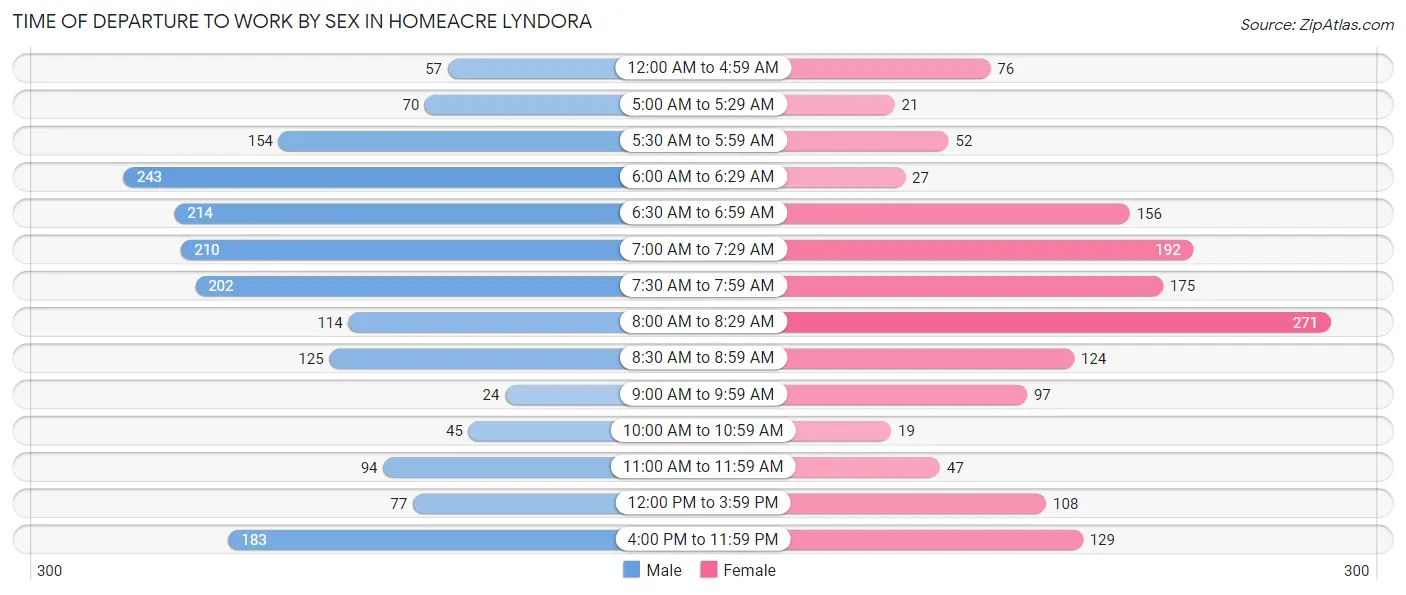
| Time of Departure | Male | Female |
| 12:00 AM to 4:59 AM | 57 (3.2%) | 76 (5.1%) |
| 5:00 AM to 5:29 AM | 70 (3.9%) | 21 (1.4%) |
| 5:30 AM to 5:59 AM | 154 (8.5%) | 52 (3.5%) |
| 6:00 AM to 6:29 AM | 243 (13.4%) | 27 (1.8%) |
| 6:30 AM to 6:59 AM | 214 (11.8%) | 156 (10.4%) |
| 7:00 AM to 7:29 AM | 210 (11.6%) | 192 (12.9%) |
| 7:30 AM to 7:59 AM | 202 (11.2%) | 175 (11.7%) |
| 8:00 AM to 8:29 AM | 114 (6.3%) | 271 (18.1%) |
| 8:30 AM to 8:59 AM | 125 (6.9%) | 124 (8.3%) |
| 9:00 AM to 9:59 AM | 24 (1.3%) | 97 (6.5%) |
| 10:00 AM to 10:59 AM | 45 (2.5%) | 19 (1.3%) |
| 11:00 AM to 11:59 AM | 94 (5.2%) | 47 (3.2%) |
| 12:00 PM to 3:59 PM | 77 (4.3%) | 108 (7.2%) |
| 4:00 PM to 11:59 PM | 183 (10.1%) | 129 (8.6%) |
| Total | 1,812 (100.0%) | 1,494 (100.0%) |
Housing Occupancy in Homeacre Lyndora
Occupancy by Ownership in Homeacre Lyndora
Of the total 3,074 dwellings in Homeacre Lyndora, owner-occupied units account for 2,172 (70.7%), while renter-occupied units make up 902 (29.3%).
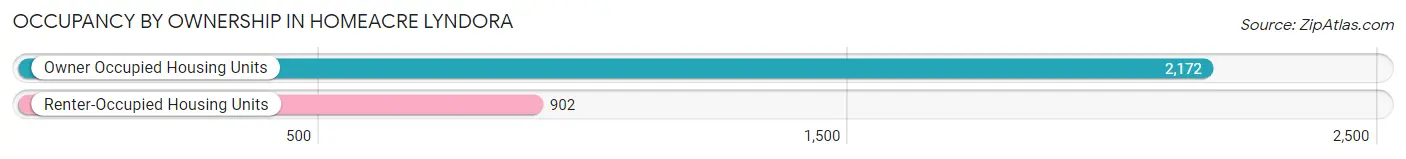
| Occupancy | # Housing Units | % Housing Units |
| Owner Occupied Housing Units | 2,172 | 70.7% |
| Renter-Occupied Housing Units | 902 | 29.3% |
| Total Occupied Housing Units | 3,074 | 100.0% |
Occupancy by Household Size in Homeacre Lyndora
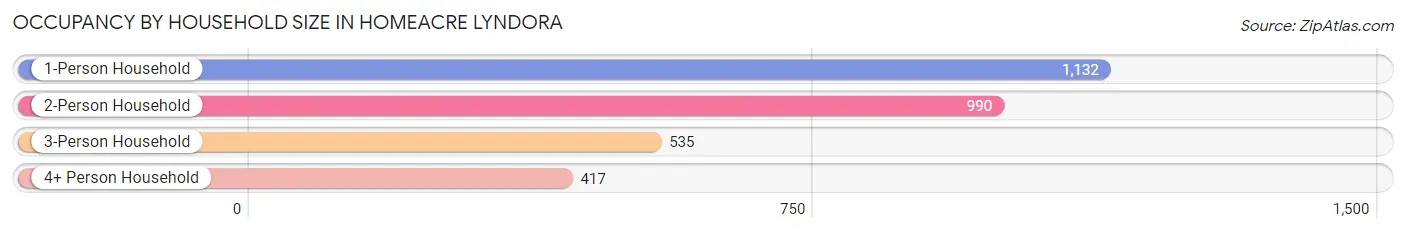
| Household Size | # Housing Units | % Housing Units |
| 1-Person Household | 1,132 | 36.8% |
| 2-Person Household | 990 | 32.2% |
| 3-Person Household | 535 | 17.4% |
| 4+ Person Household | 417 | 13.6% |
| Total Housing Units | 3,074 | 100.0% |
Occupancy by Ownership by Household Size in Homeacre Lyndora
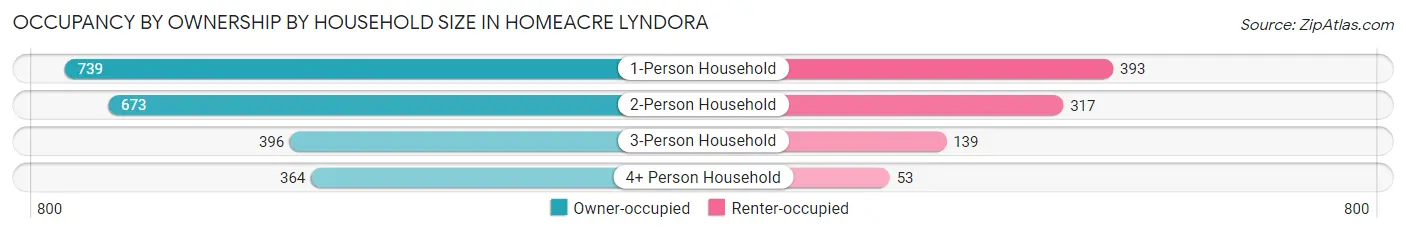
| Household Size | Owner-occupied | Renter-occupied |
| 1-Person Household | 739 (65.3%) | 393 (34.7%) |
| 2-Person Household | 673 (68.0%) | 317 (32.0%) |
| 3-Person Household | 396 (74.0%) | 139 (26.0%) |
| 4+ Person Household | 364 (87.3%) | 53 (12.7%) |
| Total Housing Units | 2,172 (70.7%) | 902 (29.3%) |
Occupancy by Educational Attainment in Homeacre Lyndora
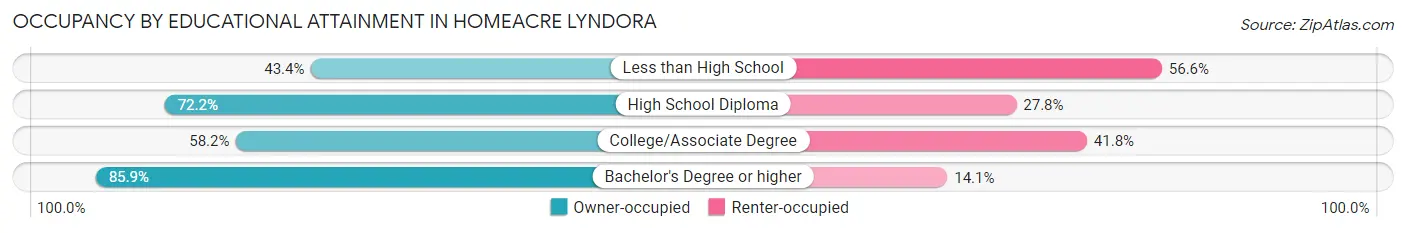
| Household Size | Owner-occupied | Renter-occupied |
| Less than High School | 62 (43.4%) | 81 (56.6%) |
| High School Diploma | 756 (72.2%) | 291 (27.8%) |
| College/Associate Degree | 556 (58.2%) | 399 (41.8%) |
| Bachelor's Degree or higher | 798 (85.9%) | 131 (14.1%) |
Occupancy by Age of Householder in Homeacre Lyndora
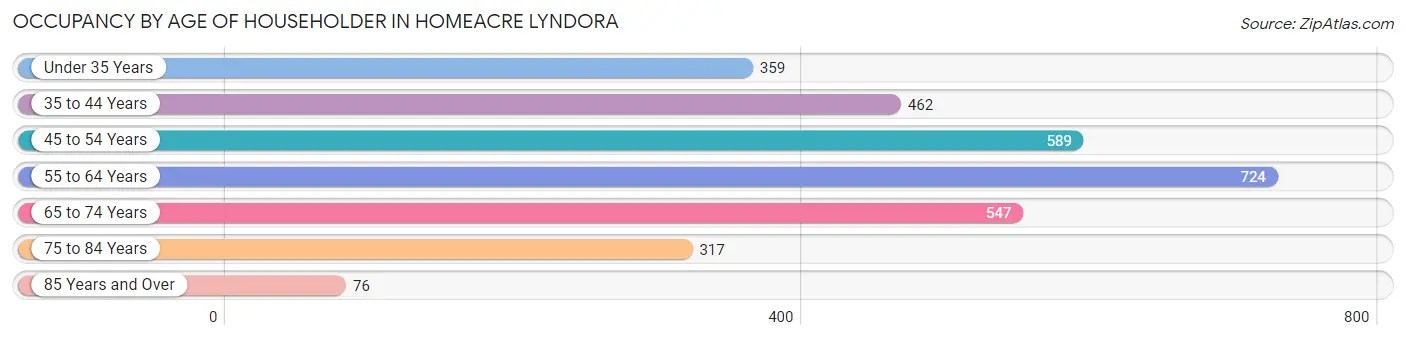
| Age Bracket | # Households | % Households |
| Under 35 Years | 359 | 11.7% |
| 35 to 44 Years | 462 | 15.0% |
| 45 to 54 Years | 589 | 19.2% |
| 55 to 64 Years | 724 | 23.5% |
| 65 to 74 Years | 547 | 17.8% |
| 75 to 84 Years | 317 | 10.3% |
| 85 Years and Over | 76 | 2.5% |
| Total | 3,074 | 100.0% |
Housing Finances in Homeacre Lyndora
Median Income by Occupancy in Homeacre Lyndora
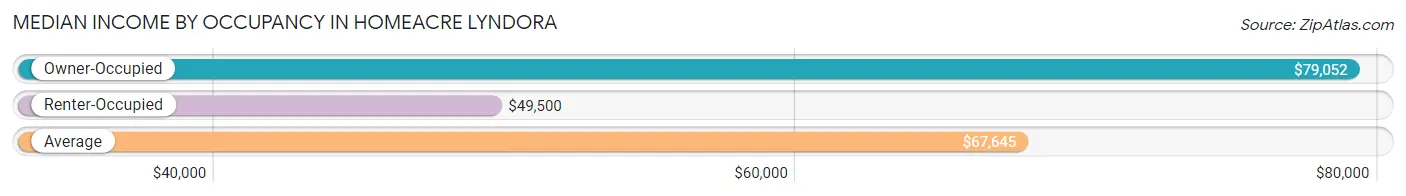
| Occupancy Type | # Households | Median Income |
| Owner-Occupied | 2,172 (70.7%) | $79,052 |
| Renter-Occupied | 902 (29.3%) | $49,500 |
| Average | 3,074 (100.0%) | $67,645 |
Occupancy by Householder Income Bracket in Homeacre Lyndora
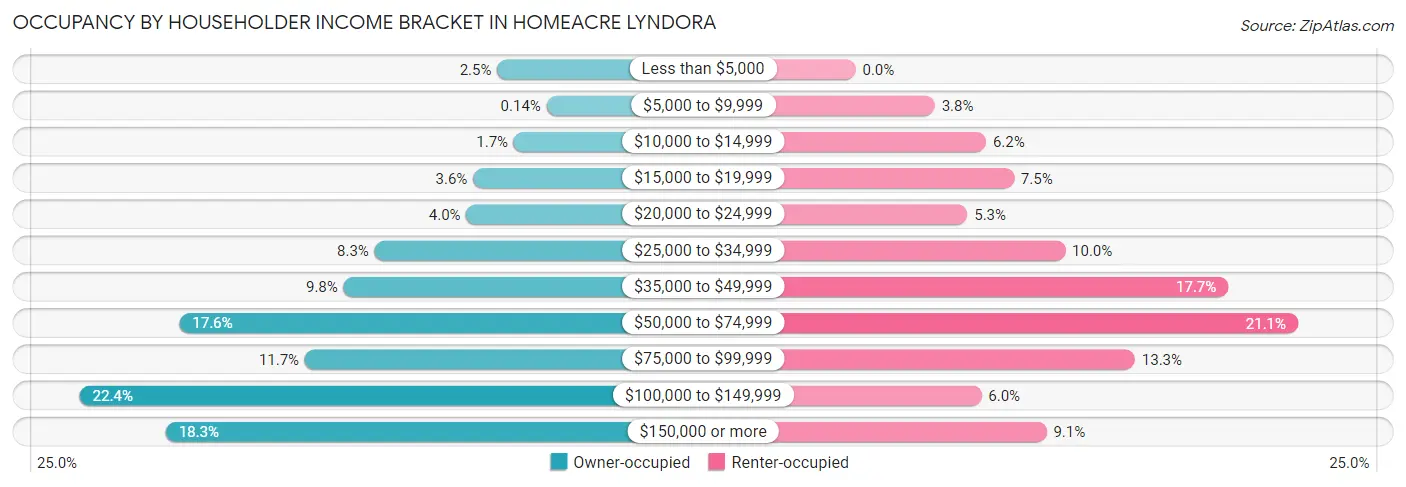
| Income Bracket | Owner-occupied | Renter-occupied |
| Less than $5,000 | 54 (2.5%) | 0 (0.0%) |
| $5,000 to $9,999 | 3 (0.1%) | 34 (3.8%) |
| $10,000 to $14,999 | 37 (1.7%) | 56 (6.2%) |
| $15,000 to $19,999 | 79 (3.6%) | 68 (7.5%) |
| $20,000 to $24,999 | 86 (4.0%) | 48 (5.3%) |
| $25,000 to $34,999 | 181 (8.3%) | 90 (10.0%) |
| $35,000 to $49,999 | 213 (9.8%) | 160 (17.7%) |
| $50,000 to $74,999 | 383 (17.6%) | 190 (21.1%) |
| $75,000 to $99,999 | 253 (11.7%) | 120 (13.3%) |
| $100,000 to $149,999 | 486 (22.4%) | 54 (6.0%) |
| $150,000 or more | 397 (18.3%) | 82 (9.1%) |
| Total | 2,172 (100.0%) | 902 (100.0%) |
Monthly Housing Cost Tiers in Homeacre Lyndora
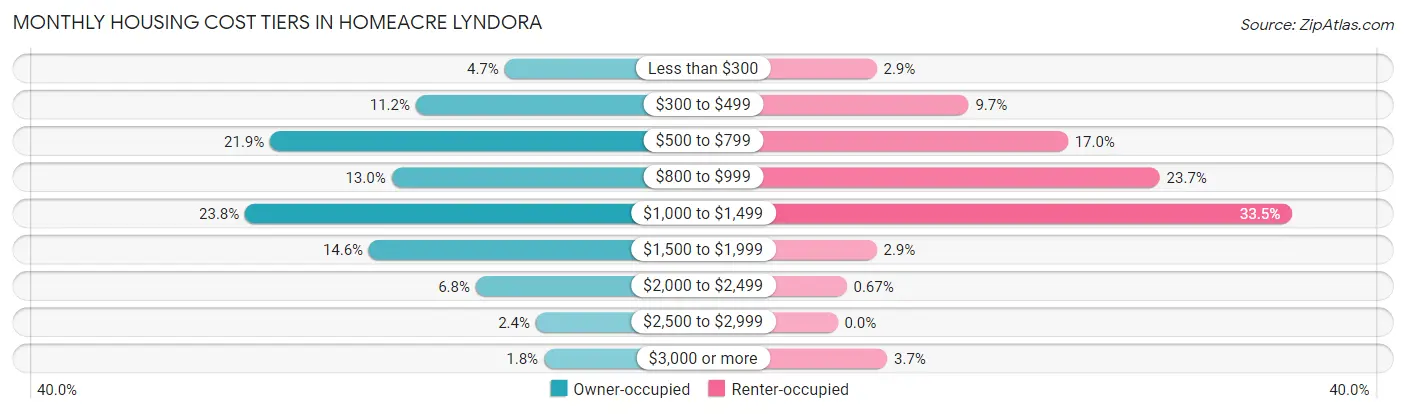
| Monthly Cost | Owner-occupied | Renter-occupied |
| Less than $300 | 101 (4.6%) | 26 (2.9%) |
| $300 to $499 | 243 (11.2%) | 87 (9.7%) |
| $500 to $799 | 476 (21.9%) | 153 (17.0%) |
| $800 to $999 | 282 (13.0%) | 214 (23.7%) |
| $1,000 to $1,499 | 516 (23.8%) | 302 (33.5%) |
| $1,500 to $1,999 | 318 (14.6%) | 26 (2.9%) |
| $2,000 to $2,499 | 147 (6.8%) | 6 (0.7%) |
| $2,500 to $2,999 | 51 (2.4%) | 0 (0.0%) |
| $3,000 or more | 38 (1.8%) | 33 (3.7%) |
| Total | 2,172 (100.0%) | 902 (100.0%) |
Physical Housing Characteristics in Homeacre Lyndora
Housing Structures in Homeacre Lyndora
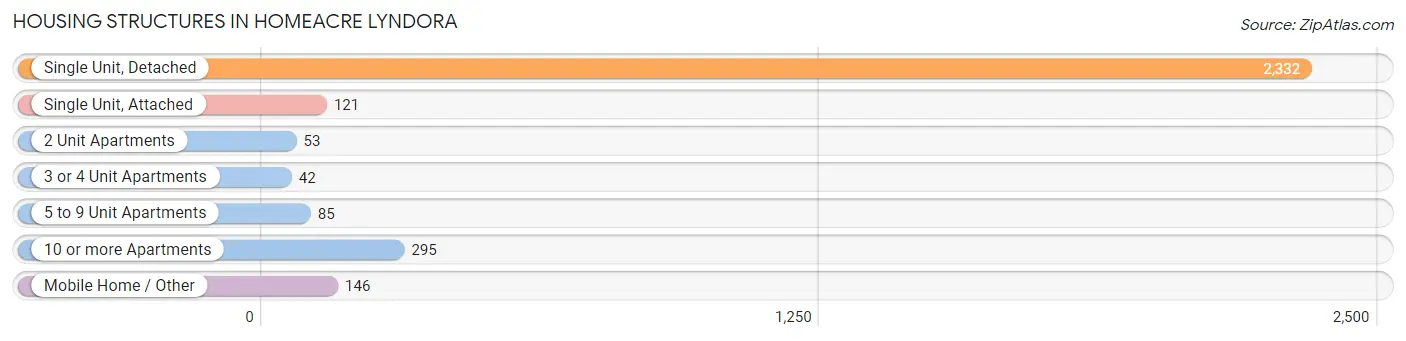
| Structure Type | # Housing Units | % Housing Units |
| Single Unit, Detached | 2,332 | 75.9% |
| Single Unit, Attached | 121 | 3.9% |
| 2 Unit Apartments | 53 | 1.7% |
| 3 or 4 Unit Apartments | 42 | 1.4% |
| 5 to 9 Unit Apartments | 85 | 2.8% |
| 10 or more Apartments | 295 | 9.6% |
| Mobile Home / Other | 146 | 4.8% |
| Total | 3,074 | 100.0% |
Housing Structures by Occupancy in Homeacre Lyndora
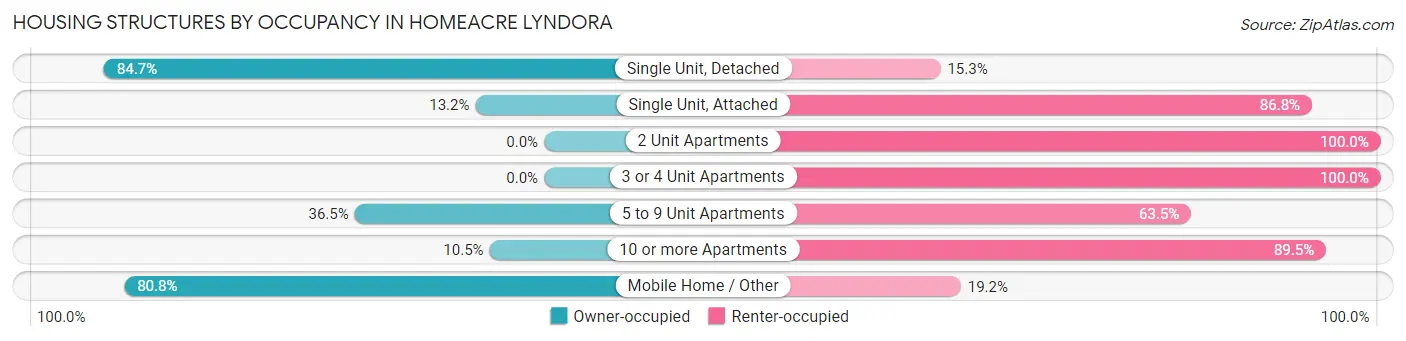
| Structure Type | Owner-occupied | Renter-occupied |
| Single Unit, Detached | 1,976 (84.7%) | 356 (15.3%) |
| Single Unit, Attached | 16 (13.2%) | 105 (86.8%) |
| 2 Unit Apartments | 0 (0.0%) | 53 (100.0%) |
| 3 or 4 Unit Apartments | 0 (0.0%) | 42 (100.0%) |
| 5 to 9 Unit Apartments | 31 (36.5%) | 54 (63.5%) |
| 10 or more Apartments | 31 (10.5%) | 264 (89.5%) |
| Mobile Home / Other | 118 (80.8%) | 28 (19.2%) |
| Total | 2,172 (70.7%) | 902 (29.3%) |
Housing Structures by Number of Rooms in Homeacre Lyndora
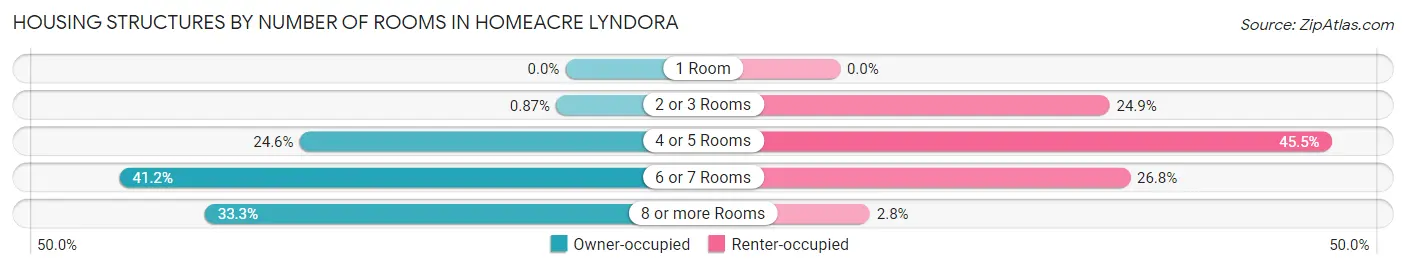
| Number of Rooms | Owner-occupied | Renter-occupied |
| 1 Room | 0 (0.0%) | 0 (0.0%) |
| 2 or 3 Rooms | 19 (0.9%) | 225 (24.9%) |
| 4 or 5 Rooms | 534 (24.6%) | 410 (45.5%) |
| 6 or 7 Rooms | 895 (41.2%) | 242 (26.8%) |
| 8 or more Rooms | 724 (33.3%) | 25 (2.8%) |
| Total | 2,172 (100.0%) | 902 (100.0%) |
Housing Structure by Heating Type in Homeacre Lyndora
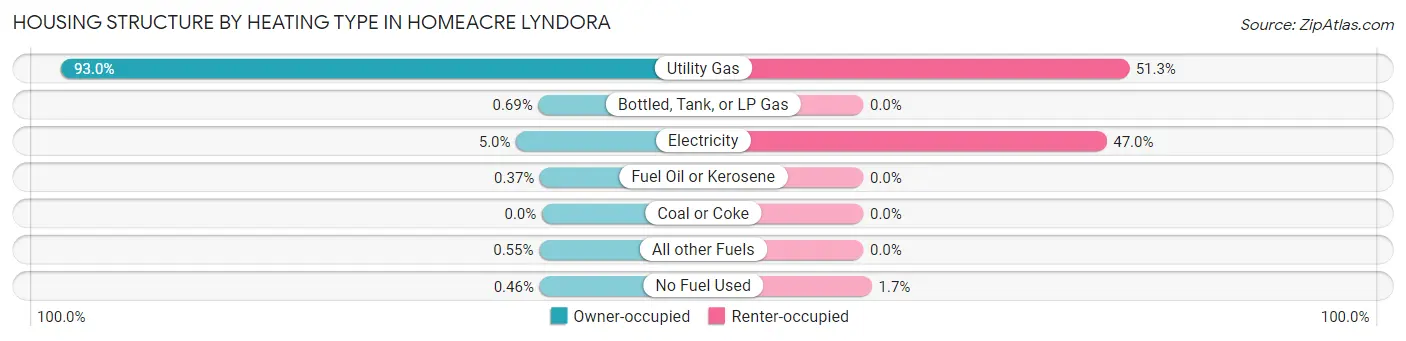
| Heating Type | Owner-occupied | Renter-occupied |
| Utility Gas | 2,019 (93.0%) | 463 (51.3%) |
| Bottled, Tank, or LP Gas | 15 (0.7%) | 0 (0.0%) |
| Electricity | 108 (5.0%) | 424 (47.0%) |
| Fuel Oil or Kerosene | 8 (0.4%) | 0 (0.0%) |
| Coal or Coke | 0 (0.0%) | 0 (0.0%) |
| All other Fuels | 12 (0.5%) | 0 (0.0%) |
| No Fuel Used | 10 (0.5%) | 15 (1.7%) |
| Total | 2,172 (100.0%) | 902 (100.0%) |
Household Vehicle Usage in Homeacre Lyndora
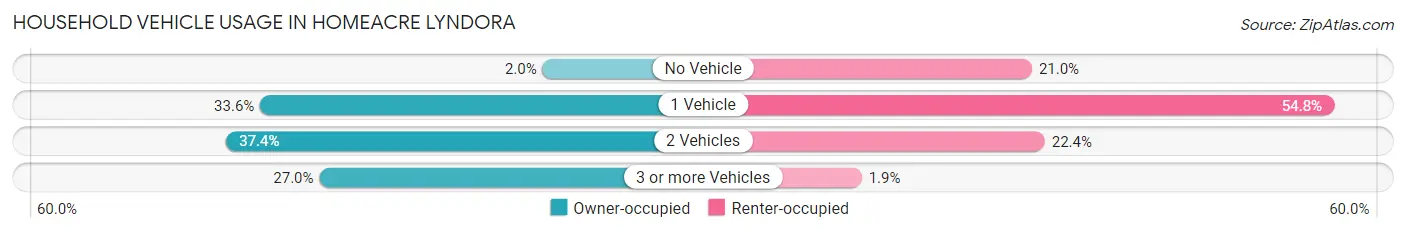
| Vehicles per Household | Owner-occupied | Renter-occupied |
| No Vehicle | 43 (2.0%) | 189 (20.9%) |
| 1 Vehicle | 730 (33.6%) | 494 (54.8%) |
| 2 Vehicles | 813 (37.4%) | 202 (22.4%) |
| 3 or more Vehicles | 586 (27.0%) | 17 (1.9%) |
| Total | 2,172 (100.0%) | 902 (100.0%) |
Real Estate & Mortgages in Homeacre Lyndora
Real Estate and Mortgage Overview in Homeacre Lyndora
| Characteristic | Without Mortgage | With Mortgage |
| Housing Units | 802 | 1,370 |
| Median Property Value | $166,100 | $184,500 |
| Median Household Income | $55,500 | $329 |
| Monthly Housing Costs | $536 | $38 |
| Real Estate Taxes | $2,131 | $24 |
Property Value by Mortgage Status in Homeacre Lyndora
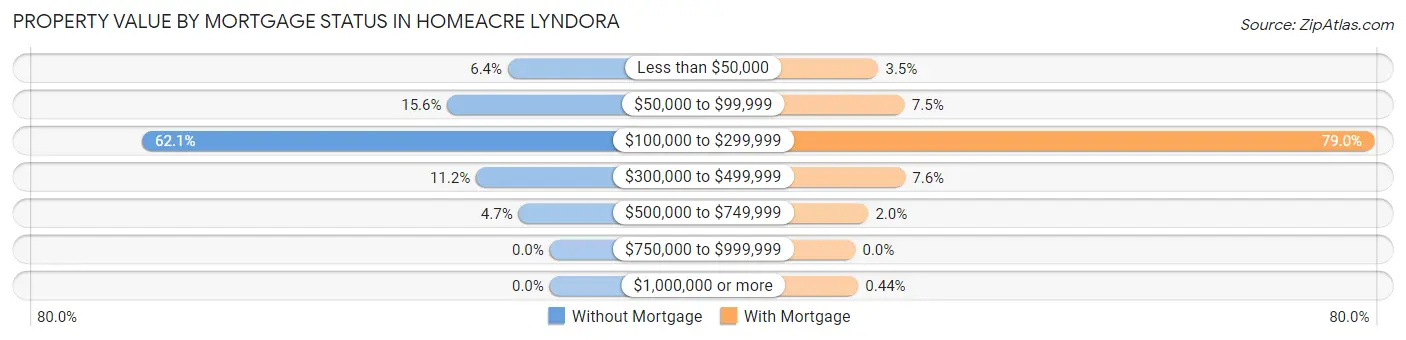
| Property Value | Without Mortgage | With Mortgage |
| Less than $50,000 | 51 (6.4%) | 48 (3.5%) |
| $50,000 to $99,999 | 125 (15.6%) | 103 (7.5%) |
| $100,000 to $299,999 | 498 (62.1%) | 1,082 (79.0%) |
| $300,000 to $499,999 | 90 (11.2%) | 104 (7.6%) |
| $500,000 to $749,999 | 38 (4.7%) | 27 (2.0%) |
| $750,000 to $999,999 | 0 (0.0%) | 0 (0.0%) |
| $1,000,000 or more | 0 (0.0%) | 6 (0.4%) |
| Total | 802 (100.0%) | 1,370 (100.0%) |
Household Income by Mortgage Status in Homeacre Lyndora
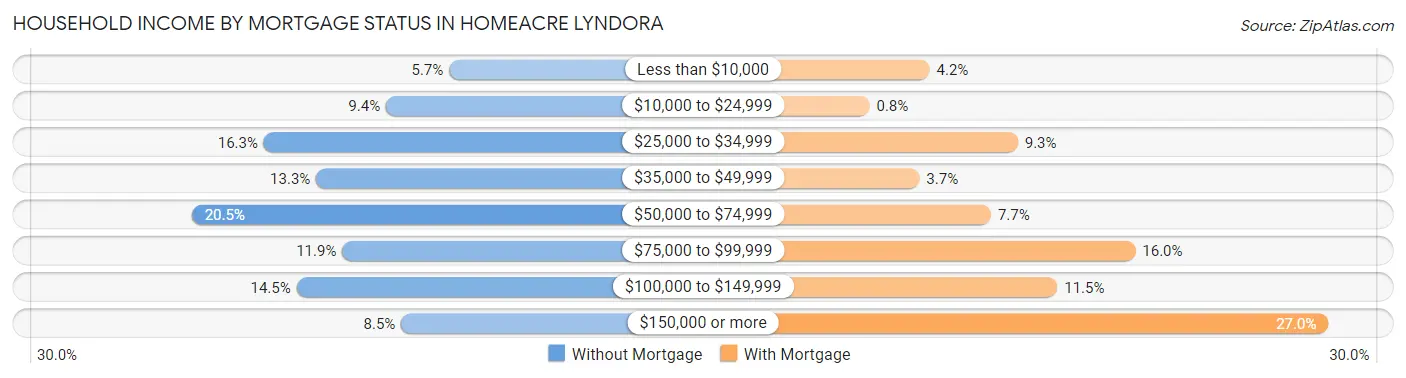
| Household Income | Without Mortgage | With Mortgage |
| Less than $10,000 | 46 (5.7%) | 58 (4.2%) |
| $10,000 to $24,999 | 75 (9.3%) | 11 (0.8%) |
| $25,000 to $34,999 | 131 (16.3%) | 127 (9.3%) |
| $35,000 to $49,999 | 107 (13.3%) | 50 (3.6%) |
| $50,000 to $74,999 | 164 (20.4%) | 106 (7.7%) |
| $75,000 to $99,999 | 95 (11.8%) | 219 (16.0%) |
| $100,000 to $149,999 | 116 (14.5%) | 158 (11.5%) |
| $150,000 or more | 68 (8.5%) | 370 (27.0%) |
| Total | 802 (100.0%) | 1,370 (100.0%) |
Property Value to Household Income Ratio in Homeacre Lyndora
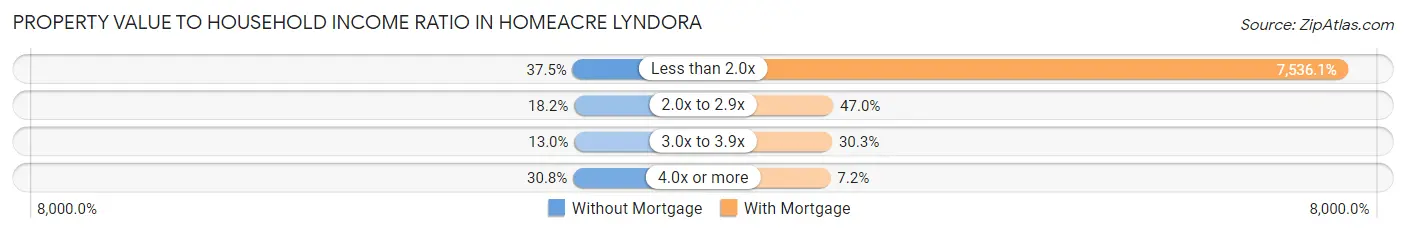
| Value-to-Income Ratio | Without Mortgage | With Mortgage |
| Less than 2.0x | 301 (37.5%) | 103,245 (7,536.1%) |
| 2.0x to 2.9x | 146 (18.2%) | 644 (47.0%) |
| 3.0x to 3.9x | 104 (13.0%) | 415 (30.3%) |
| 4.0x or more | 247 (30.8%) | 99 (7.2%) |
| Total | 802 (100.0%) | 1,370 (100.0%) |
Real Estate Taxes by Mortgage Status in Homeacre Lyndora
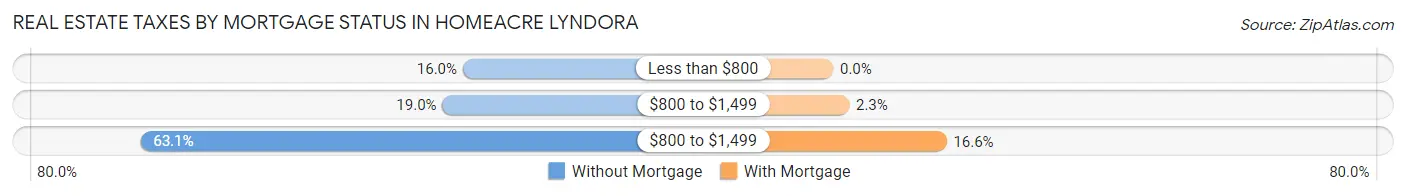
| Property Taxes | Without Mortgage | With Mortgage |
| Less than $800 | 128 (16.0%) | 0 (0.0%) |
| $800 to $1,499 | 152 (19.0%) | 32 (2.3%) |
| $800 to $1,499 | 506 (63.1%) | 227 (16.6%) |
| Total | 802 (100.0%) | 1,370 (100.0%) |
Health & Disability in Homeacre Lyndora
Health Insurance Coverage by Age in Homeacre Lyndora
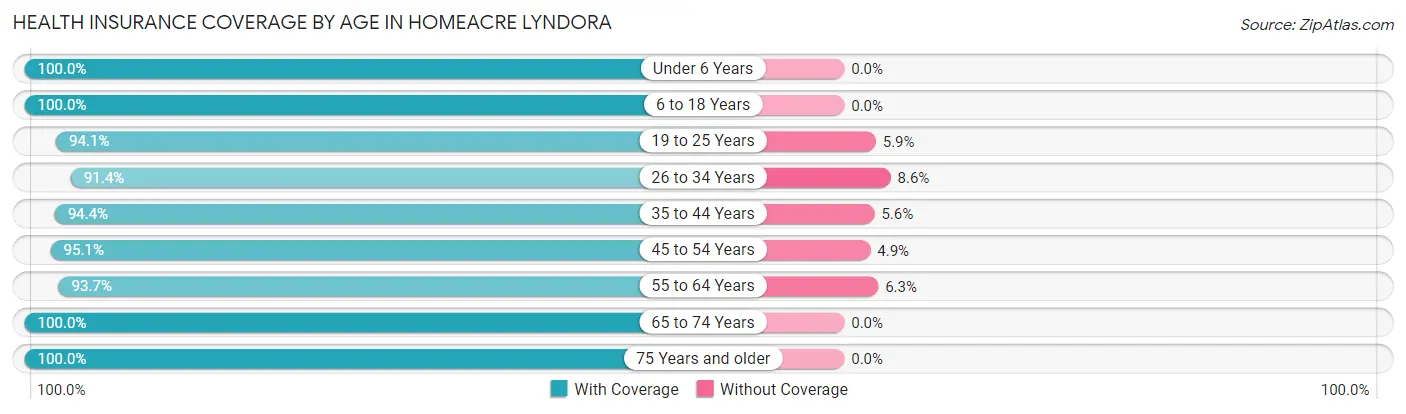
| Age Bracket | With Coverage | Without Coverage |
| Under 6 Years | 296 (100.0%) | 0 (0.0%) |
| 6 to 18 Years | 767 (100.0%) | 0 (0.0%) |
| 19 to 25 Years | 417 (94.1%) | 26 (5.9%) |
| 26 to 34 Years | 603 (91.4%) | 57 (8.6%) |
| 35 to 44 Years | 873 (94.4%) | 52 (5.6%) |
| 45 to 54 Years | 1,076 (95.1%) | 55 (4.9%) |
| 55 to 64 Years | 1,007 (93.7%) | 68 (6.3%) |
| 65 to 74 Years | 898 (100.0%) | 0 (0.0%) |
| 75 Years and older | 554 (100.0%) | 0 (0.0%) |
| Total | 6,491 (96.2%) | 258 (3.8%) |
Health Insurance Coverage by Citizenship Status in Homeacre Lyndora

| Citizenship Status | With Coverage | Without Coverage |
| Native Born | 296 (100.0%) | 0 (0.0%) |
| Foreign Born, Citizen | 767 (100.0%) | 0 (0.0%) |
| Foreign Born, not a Citizen | 417 (94.1%) | 26 (5.9%) |
Health Insurance Coverage by Household Income in Homeacre Lyndora
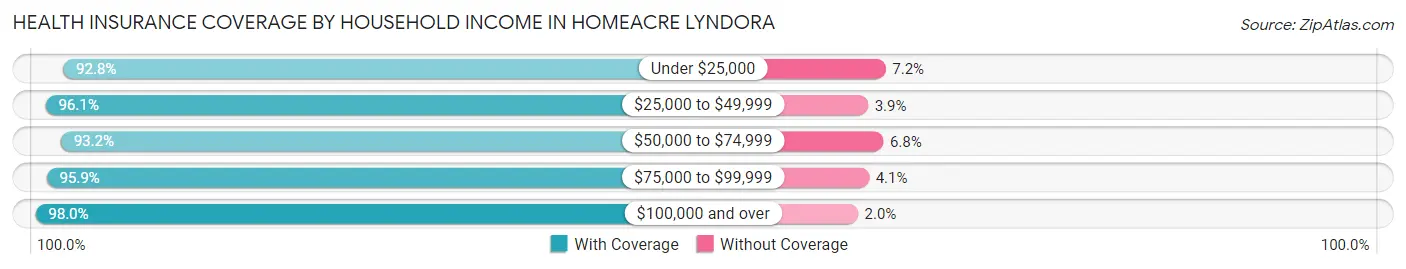
| Household Income | With Coverage | Without Coverage |
| Under $25,000 | 617 (92.8%) | 48 (7.2%) |
| $25,000 to $49,999 | 1,006 (96.1%) | 41 (3.9%) |
| $50,000 to $74,999 | 990 (93.2%) | 72 (6.8%) |
| $75,000 to $99,999 | 842 (95.9%) | 36 (4.1%) |
| $100,000 and over | 2,966 (98.0%) | 61 (2.0%) |
Public vs Private Health Insurance Coverage by Age in Homeacre Lyndora
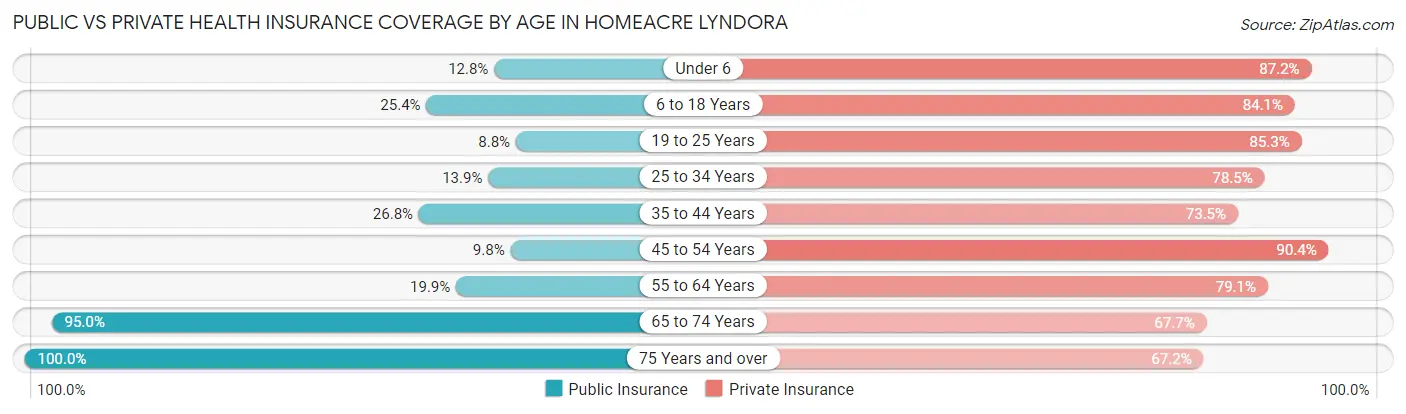
| Age Bracket | Public Insurance | Private Insurance |
| Under 6 | 38 (12.8%) | 258 (87.2%) |
| 6 to 18 Years | 195 (25.4%) | 645 (84.1%) |
| 19 to 25 Years | 39 (8.8%) | 378 (85.3%) |
| 25 to 34 Years | 92 (13.9%) | 518 (78.5%) |
| 35 to 44 Years | 248 (26.8%) | 680 (73.5%) |
| 45 to 54 Years | 111 (9.8%) | 1,022 (90.4%) |
| 55 to 64 Years | 214 (19.9%) | 850 (79.1%) |
| 65 to 74 Years | 853 (95.0%) | 608 (67.7%) |
| 75 Years and over | 554 (100.0%) | 372 (67.1%) |
| Total | 2,344 (34.7%) | 5,331 (79.0%) |
Disability Status by Sex by Age in Homeacre Lyndora
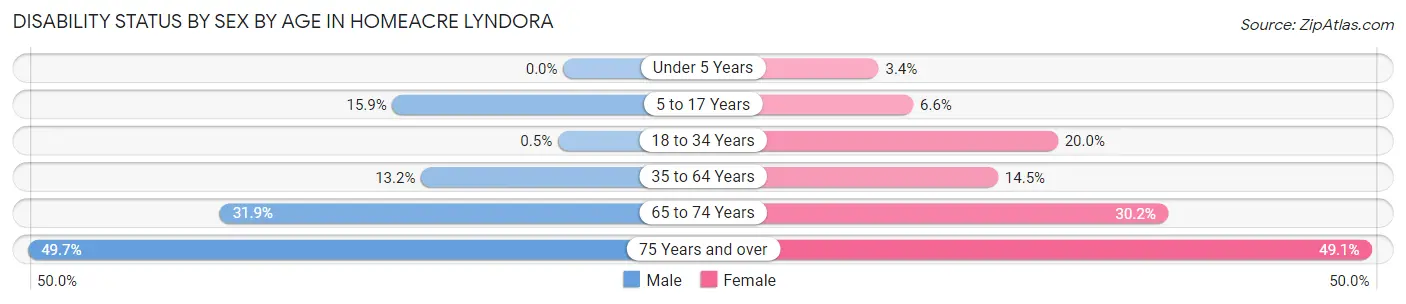
| Age Bracket | Male | Female |
| Under 5 Years | 0 (0.0%) | 3 (3.4%) |
| 5 to 17 Years | 65 (15.9%) | 27 (6.6%) |
| 18 to 34 Years | 3 (0.5%) | 107 (20.0%) |
| 35 to 64 Years | 209 (13.2%) | 224 (14.5%) |
| 65 to 74 Years | 125 (31.9%) | 153 (30.2%) |
| 75 Years and over | 73 (49.7%) | 200 (49.1%) |
Disability Class by Sex by Age in Homeacre Lyndora
Disability Class: Hearing Difficulty
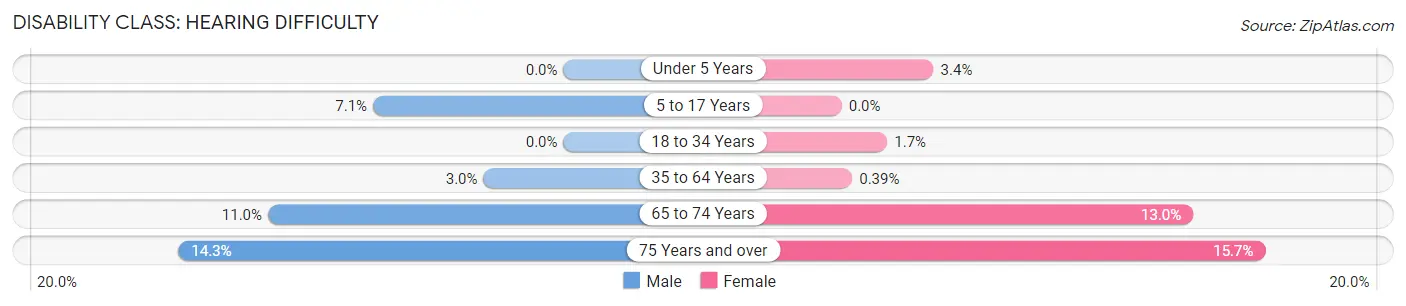
| Age Bracket | Male | Female |
| Under 5 Years | 0 (0.0%) | 3 (3.4%) |
| 5 to 17 Years | 29 (7.1%) | 0 (0.0%) |
| 18 to 34 Years | 0 (0.0%) | 9 (1.7%) |
| 35 to 64 Years | 47 (3.0%) | 6 (0.4%) |
| 65 to 74 Years | 43 (11.0%) | 66 (13.0%) |
| 75 Years and over | 21 (14.3%) | 64 (15.7%) |
Disability Class: Vision Difficulty
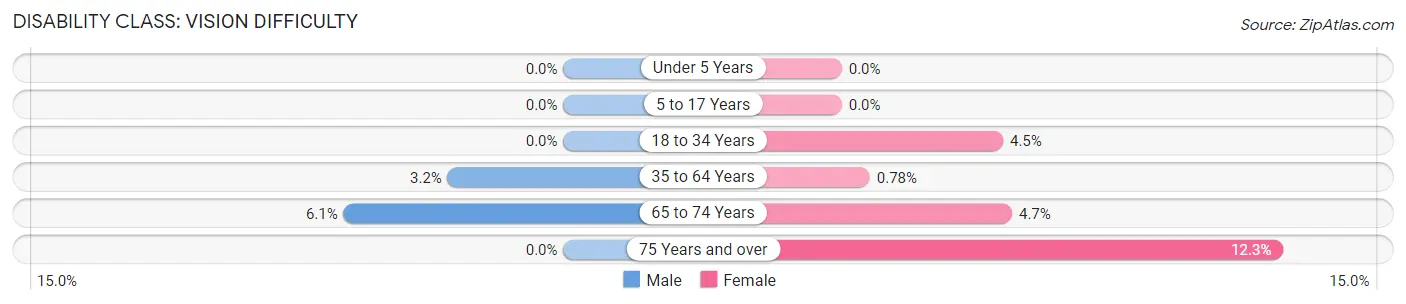
| Age Bracket | Male | Female |
| Under 5 Years | 0 (0.0%) | 0 (0.0%) |
| 5 to 17 Years | 0 (0.0%) | 0 (0.0%) |
| 18 to 34 Years | 0 (0.0%) | 24 (4.5%) |
| 35 to 64 Years | 51 (3.2%) | 12 (0.8%) |
| 65 to 74 Years | 24 (6.1%) | 24 (4.7%) |
| 75 Years and over | 0 (0.0%) | 50 (12.3%) |
Disability Class: Cognitive Difficulty
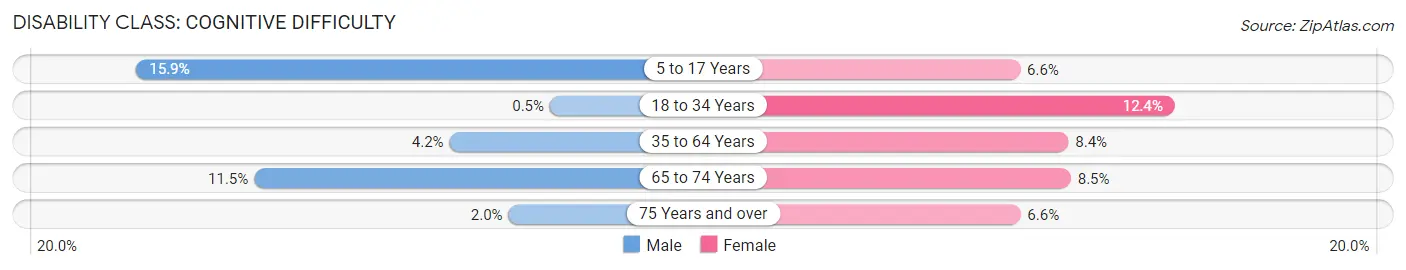
| Age Bracket | Male | Female |
| 5 to 17 Years | 65 (15.9%) | 27 (6.6%) |
| 18 to 34 Years | 3 (0.5%) | 66 (12.4%) |
| 35 to 64 Years | 67 (4.2%) | 130 (8.4%) |
| 65 to 74 Years | 45 (11.5%) | 43 (8.5%) |
| 75 Years and over | 3 (2.0%) | 27 (6.6%) |
Disability Class: Ambulatory Difficulty
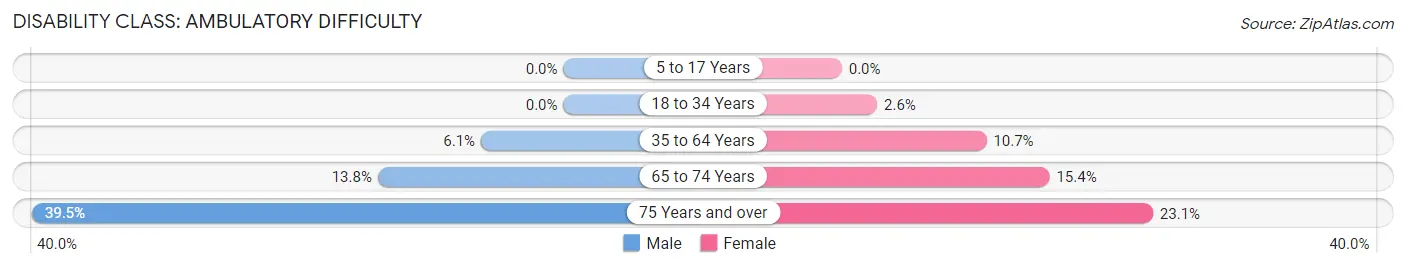
| Age Bracket | Male | Female |
| 5 to 17 Years | 0 (0.0%) | 0 (0.0%) |
| 18 to 34 Years | 0 (0.0%) | 14 (2.6%) |
| 35 to 64 Years | 97 (6.1%) | 166 (10.7%) |
| 65 to 74 Years | 54 (13.8%) | 78 (15.4%) |
| 75 Years and over | 58 (39.5%) | 94 (23.1%) |
Disability Class: Self-Care Difficulty
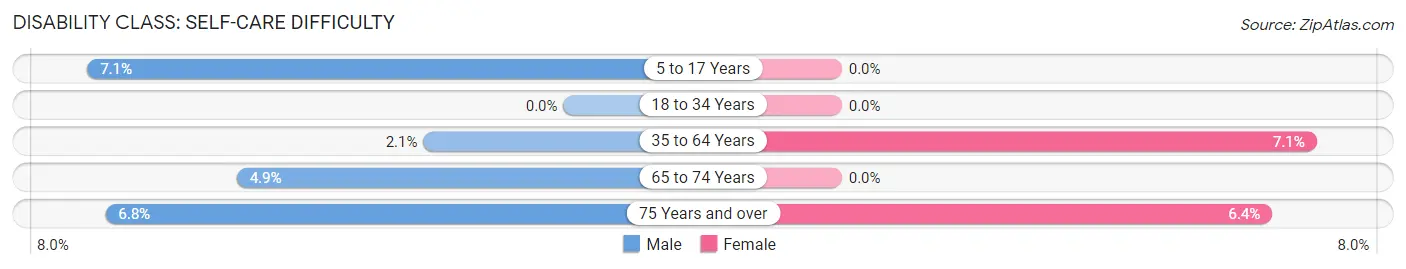
| Age Bracket | Male | Female |
| 5 to 17 Years | 29 (7.1%) | 0 (0.0%) |
| 18 to 34 Years | 0 (0.0%) | 0 (0.0%) |
| 35 to 64 Years | 33 (2.1%) | 109 (7.0%) |
| 65 to 74 Years | 19 (4.9%) | 0 (0.0%) |
| 75 Years and over | 10 (6.8%) | 26 (6.4%) |
Technology Access in Homeacre Lyndora
Computing Device Access in Homeacre Lyndora
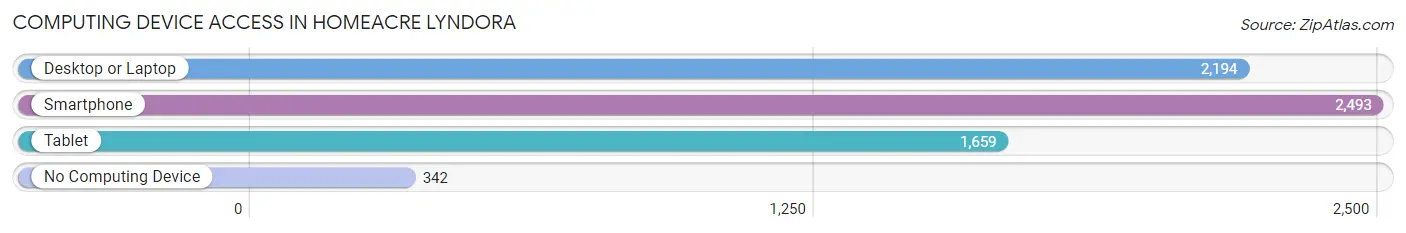
| Device Type | # Households | % Households |
| Desktop or Laptop | 2,194 | 71.4% |
| Smartphone | 2,493 | 81.1% |
| Tablet | 1,659 | 54.0% |
| No Computing Device | 342 | 11.1% |
| Total | 3,074 | 100.0% |
Internet Access in Homeacre Lyndora
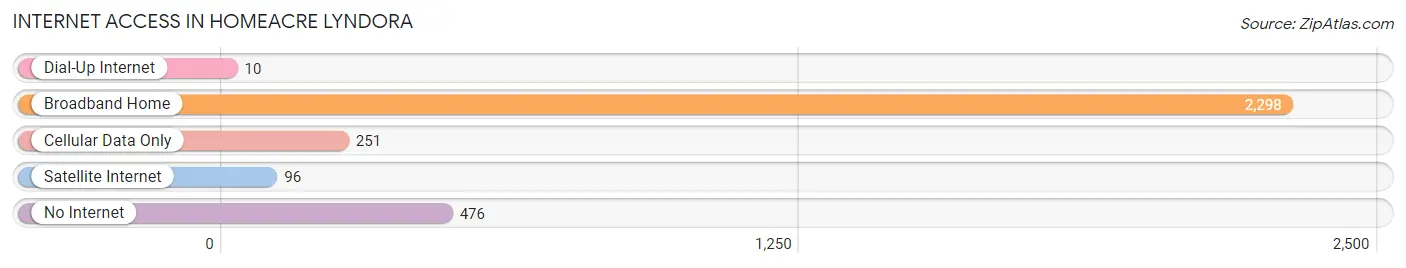
| Internet Type | # Households | % Households |
| Dial-Up Internet | 10 | 0.3% |
| Broadband Home | 2,298 | 74.8% |
| Cellular Data Only | 251 | 8.2% |
| Satellite Internet | 96 | 3.1% |
| No Internet | 476 | 15.5% |
| Total | 3,074 | 100.0% |
Homeacre Lyndora Summary
History
Homeacre Lyndora is a small borough located in Butler County, Pennsylvania. It is situated in the western part of the state, about 25 miles north of Pittsburgh. The borough was founded in 1876 and was originally known as Homeacre. It was named after the Homeacre family, who were early settlers in the area. The name was changed to Homeacre Lyndora in 1891 when the Lyndora post office was established.
The area was originally inhabited by Native Americans, and the first European settlers arrived in the late 1700s. The area was primarily agricultural, with many farms and small businesses. The first industry in the area was a sawmill, which was built in 1820. This was followed by a gristmill, a tannery, and a woolen mill.
The borough was incorporated in 1876 and the first mayor was elected in 1877. The population of the borough was around 500 at the time. The population grew steadily over the next few decades, reaching 1,000 by 1900.
Geography
Homeacre Lyndora is located in western Pennsylvania, about 25 miles north of Pittsburgh. It is situated in Butler County, which is part of the Pittsburgh metropolitan area. The borough is located in a rural area, with rolling hills and forests. The borough is bordered by the boroughs of Lyndora and Saxonburg to the north, and by the townships of Brady and Winfield to the south.
The borough covers an area of 1.2 square miles, with a population of 1,845 as of the 2010 census. The terrain is mostly flat, with some hills in the northern part of the borough. The climate is humid continental, with cold winters and hot summers.
Economy
Homeacre Lyndora is a small, rural borough with a primarily agricultural economy. The main industries in the area are farming, forestry, and light manufacturing. The borough is home to several small businesses, including a sawmill, a gristmill, a tannery, and a woolen mill.
The borough also has a few retail stores, including a grocery store, a hardware store, and a few restaurants. The borough is served by the Butler County Transit Authority, which provides public transportation to the surrounding area.
Demographics
As of the 2010 census, the population of Homeacre Lyndora was 1,845. The racial makeup of the borough was 97.3% White, 0.9% African American, 0.3% Native American, 0.2% Asian, and 0.3% from other races. Hispanic or Latino of any race were 0.7% of the population.
The median household income in the borough was $41,250, and the median family income was $50,000. The per capita income was $20,845. About 8.3% of families and 10.2% of the population were below the poverty line, including 14.2% of those under age 18 and 6.2% of those age 65 or over.
Common Questions
What is Per Capita Income in Homeacre Lyndora?
Per Capita income in Homeacre Lyndora is $40,136.
What is the Median Family Income in Homeacre Lyndora?
Median Family Income in Homeacre Lyndora is $99,063.
What is the Median Household income in Homeacre Lyndora?
Median Household Income in Homeacre Lyndora is $67,645.
What is Income or Wage Gap in Homeacre Lyndora?
Income or Wage Gap in Homeacre Lyndora is 35.8%.
Women in Homeacre Lyndora earn 64.2 cents for every dollar earned by a man.
What is Inequality or Gini Index in Homeacre Lyndora?
Inequality or Gini Index in Homeacre Lyndora is 0.41.
What is the Total Population of Homeacre Lyndora?
Total Population of Homeacre Lyndora is 6,750.
What is the Total Male Population of Homeacre Lyndora?
Total Male Population of Homeacre Lyndora is 3,261.
What is the Total Female Population of Homeacre Lyndora?
Total Female Population of Homeacre Lyndora is 3,489.
What is the Ratio of Males per 100 Females in Homeacre Lyndora?
There are 93.47 Males per 100 Females in Homeacre Lyndora.
What is the Ratio of Females per 100 Males in Homeacre Lyndora?
There are 106.99 Females per 100 Males in Homeacre Lyndora.
What is the Median Population Age in Homeacre Lyndora?
Median Population Age in Homeacre Lyndora is 48.5 Years.
What is the Average Family Size in Homeacre Lyndora
Average Family Size in Homeacre Lyndora is 2.8 People.
What is the Average Household Size in Homeacre Lyndora
Average Household Size in Homeacre Lyndora is 2.2 People.
How Large is the Labor Force in Homeacre Lyndora?
There are 3,916 People in the Labor Forcein in Homeacre Lyndora.
What is the Percentage of People in the Labor Force in Homeacre Lyndora?
66.2% of People are in the Labor Force in Homeacre Lyndora.
What is the Unemployment Rate in Homeacre Lyndora?
Unemployment Rate in Homeacre Lyndora is 4.4%.