Hereford, PA Map & Demographics
Hereford Map
Hereford Overview
$19,248
PER CAPITA INCOME
$90,042
AVG FAMILY INCOME
$59,926
AVG HOUSEHOLD INCOME
56.3%
WAGE / INCOME GAP [ % ]
43.7¢/ $1
WAGE / INCOME GAP [ $ ]
0.34
INEQUALITY / GINI INDEX
1,549
TOTAL POPULATION
974
MALE POPULATION
575
FEMALE POPULATION
169.39
MALES / 100 FEMALES
59.03
FEMALES / 100 MALES
27.5
MEDIAN AGE
4.5
AVG FAMILY SIZE
4.0
AVG HOUSEHOLD SIZE
774
LABOR FORCE [ PEOPLE ]
58.0%
PERCENT IN LABOR FORCE
2.5%
UNEMPLOYMENT RATE
Hereford Zip Codes
Income in Hereford
Income Overview in Hereford
Per Capita Income in Hereford is $19,248, while median incomes of families and households are $90,042 and $59,926 respectively.
| Characteristic | Number | Measure |
| Per Capita Income | 1,549 | $19,248 |
| Median Family Income | 307 | $90,042 |
| Mean Family Income | 307 | $79,022 |
| Median Household Income | 391 | $59,926 |
| Mean Household Income | 391 | $72,660 |
| Income Deficit | 307 | $0 |
| Wage / Income Gap (%) | 1,549 | 56.32% |
| Wage / Income Gap ($) | 1,549 | 43.68¢ per $1 |
| Gini / Inequality Index | 1,549 | 0.34 |
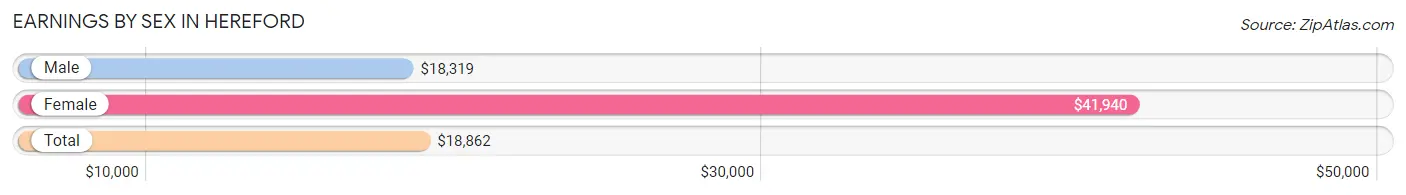
Earnings by Sex in Hereford
Average Earnings in Hereford are $18,862, $18,319 for men and $41,940 for women, a difference of 56.3%.
| Sex | Number | Average Earnings |
| Male | 561 (70.1%) | $18,319 |
| Female | 239 (29.9%) | $41,940 |
| Total | 800 (100.0%) | $18,862 |
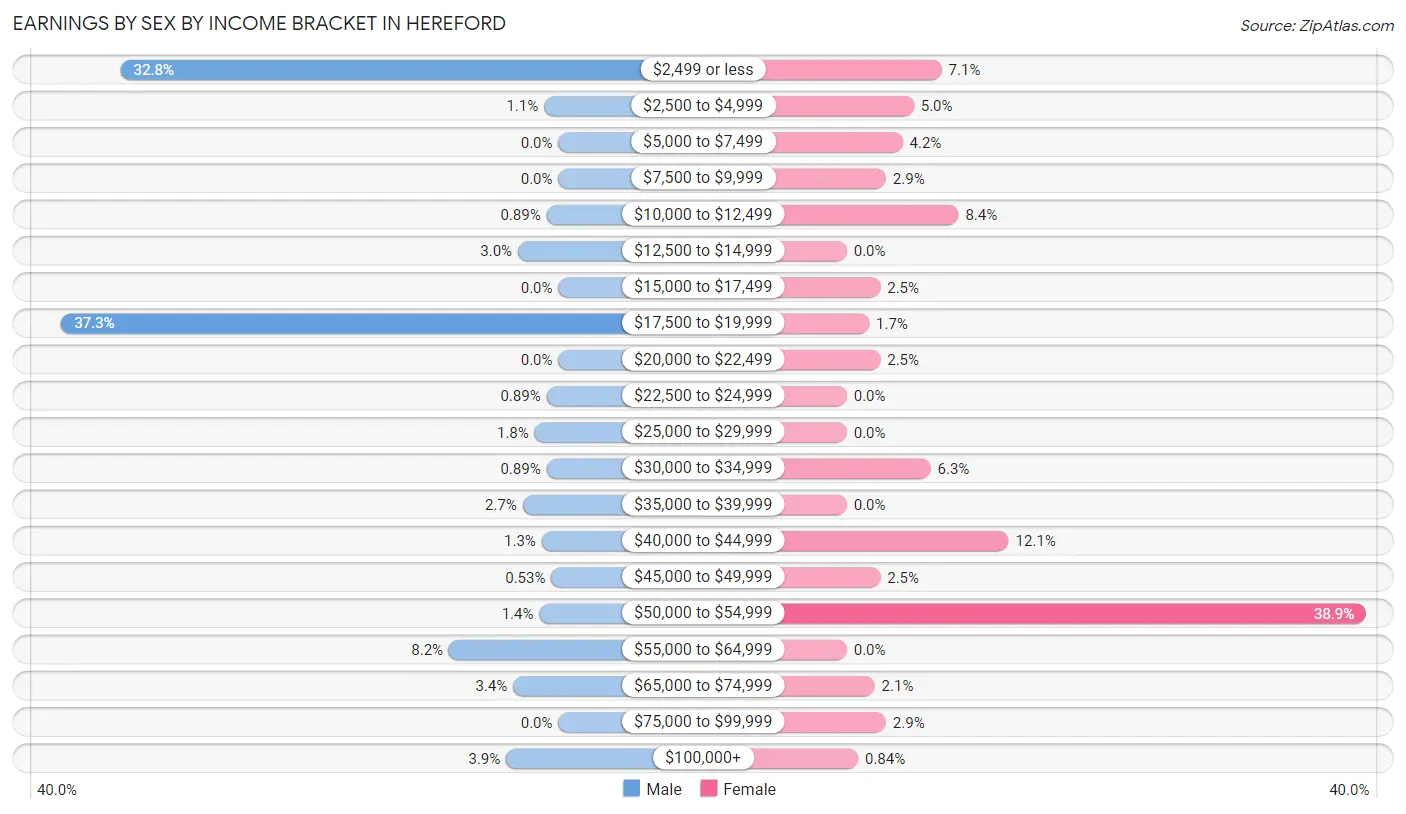
Earnings by Sex by Income Bracket in Hereford
The most common earnings brackets in Hereford are $17,500 to $19,999 for men (209 | 37.2%) and $50,000 to $54,999 for women (93 | 38.9%).
| Income | Male | Female |
| $2,499 or less | 184 (32.8%) | 17 (7.1%) |
| $2,500 to $4,999 | 6 (1.1%) | 12 (5.0%) |
| $5,000 to $7,499 | 0 (0.0%) | 10 (4.2%) |
| $7,500 to $9,999 | 0 (0.0%) | 7 (2.9%) |
| $10,000 to $12,499 | 5 (0.9%) | 20 (8.4%) |
| $12,500 to $14,999 | 17 (3.0%) | 0 (0.0%) |
| $15,000 to $17,499 | 0 (0.0%) | 6 (2.5%) |
| $17,500 to $19,999 | 209 (37.2%) | 4 (1.7%) |
| $20,000 to $22,499 | 0 (0.0%) | 6 (2.5%) |
| $22,500 to $24,999 | 5 (0.9%) | 0 (0.0%) |
| $25,000 to $29,999 | 10 (1.8%) | 0 (0.0%) |
| $30,000 to $34,999 | 5 (0.9%) | 15 (6.3%) |
| $35,000 to $39,999 | 15 (2.7%) | 0 (0.0%) |
| $40,000 to $44,999 | 7 (1.3%) | 29 (12.1%) |
| $45,000 to $49,999 | 3 (0.5%) | 6 (2.5%) |
| $50,000 to $54,999 | 8 (1.4%) | 93 (38.9%) |
| $55,000 to $64,999 | 46 (8.2%) | 0 (0.0%) |
| $65,000 to $74,999 | 19 (3.4%) | 5 (2.1%) |
| $75,000 to $99,999 | 0 (0.0%) | 7 (2.9%) |
| $100,000+ | 22 (3.9%) | 2 (0.8%) |
| Total | 561 (100.0%) | 239 (100.0%) |
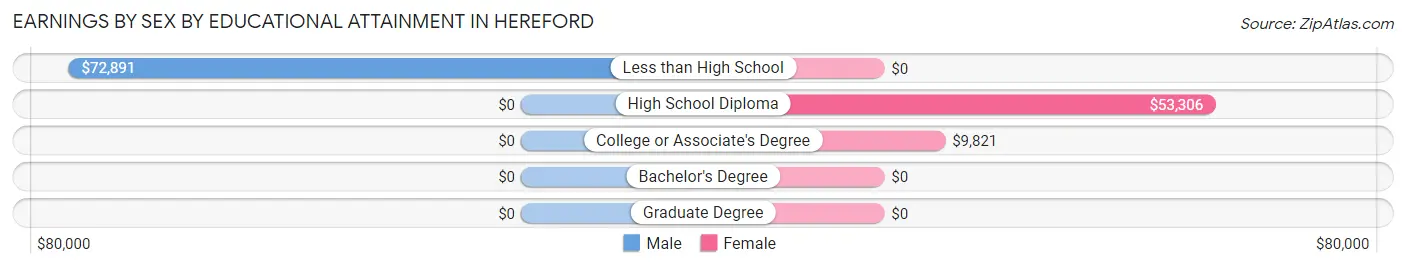
Earnings by Sex by Educational Attainment in Hereford
| Educational Attainment | Male Income | Female Income |
| Less than High School | $72,891 | $0 |
| High School Diploma | - | - |
| College or Associate's Degree | - | - |
| Bachelor's Degree | - | - |
| Graduate Degree | - | - |
| Total | - | - |
Family Income in Hereford
Family Income Brackets in Hereford
According to the Hereford family income data, there are 102 families falling into the $75,000 to $99,999 income range, which is the most common income bracket and makes up 33.2% of all families.
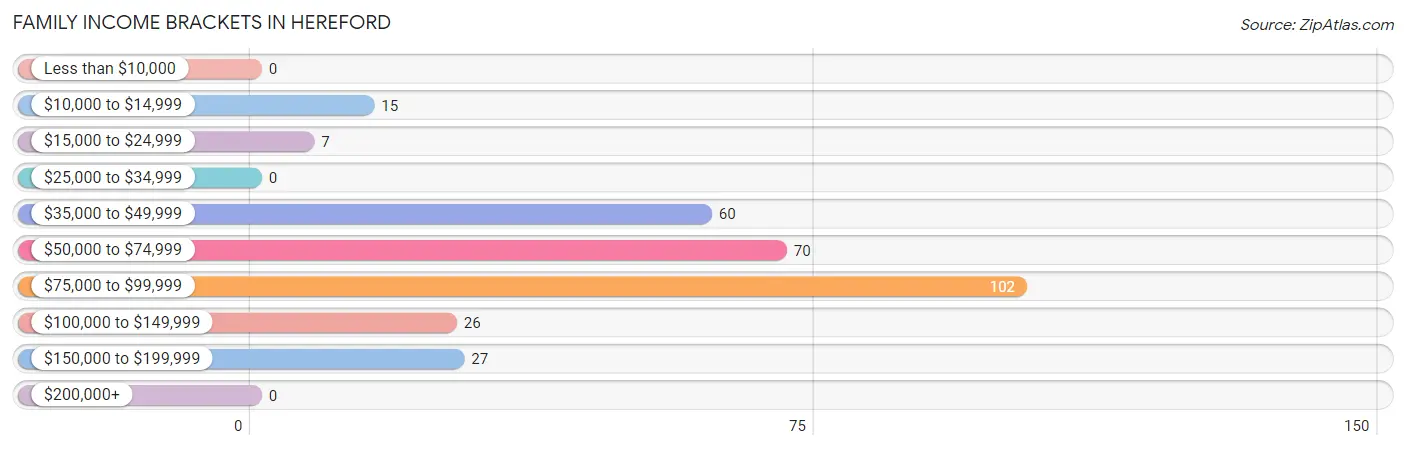
| Income Bracket | # Families | % Families |
| Less than $10,000 | 0 | 0.0% |
| $10,000 to $14,999 | 15 | 4.9% |
| $15,000 to $24,999 | 7 | 2.3% |
| $25,000 to $34,999 | 0 | 0.0% |
| $35,000 to $49,999 | 60 | 19.5% |
| $50,000 to $74,999 | 70 | 22.8% |
| $75,000 to $99,999 | 102 | 33.2% |
| $100,000 to $149,999 | 26 | 8.5% |
| $150,000 to $199,999 | 27 | 8.8% |
| $200,000+ | 0 | 0.0% |
Family Income by Famaliy Size in Hereford
2-person families (127 | 41.4%) account for the highest median family income in Hereford with $62,868 per family, while 2-person families (127 | 41.4%) have the highest median income of $31,434 per family member.
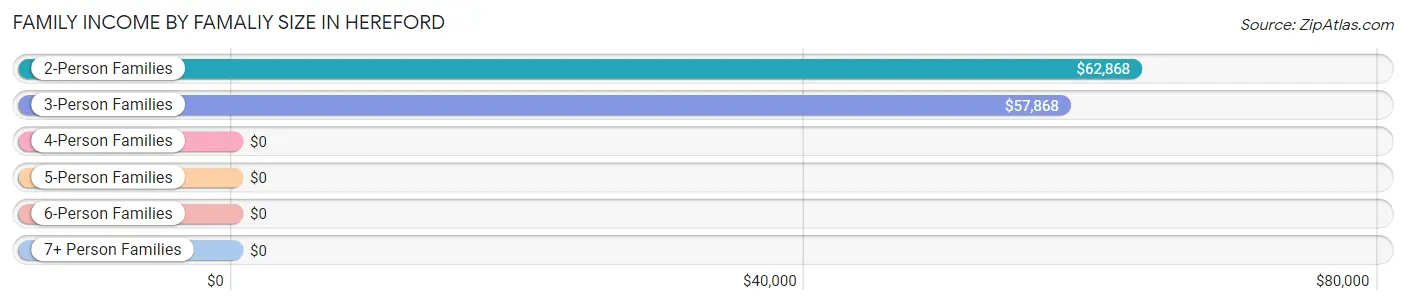
| Income Bracket | # Families | Median Income |
| 2-Person Families | 127 (41.4%) | $62,868 |
| 3-Person Families | 63 (20.5%) | $57,868 |
| 4-Person Families | 0 (0.0%) | $0 |
| 5-Person Families | 0 (0.0%) | $0 |
| 6-Person Families | 100 (32.6%) | $0 |
| 7+ Person Families | 17 (5.5%) | $0 |
| Total | 307 (100.0%) | $90,042 |
Family Income by Number of Earners in Hereford
The median family income in Hereford is $90,042, with families comprising 2 earners (88) having the highest median family income of $99,643, while families with no earners (72) have the lowest median family income of $37,019, accounting for 28.7% and 23.4% of families, respectively.
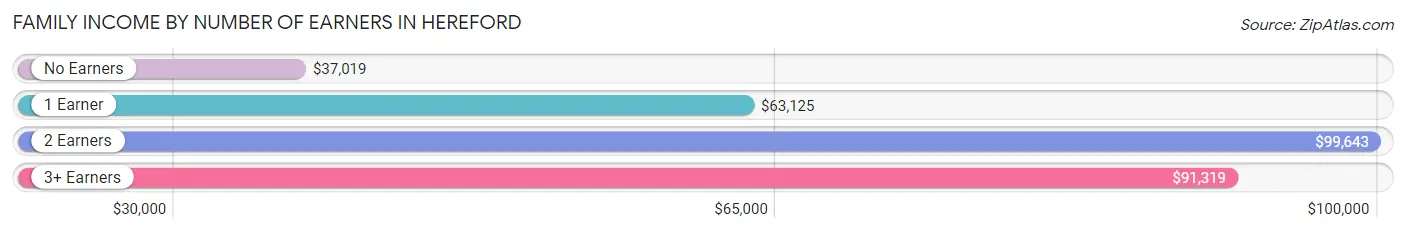
| Number of Earners | # Families | Median Income |
| No Earners | 72 (23.4%) | $37,019 |
| 1 Earner | 42 (13.7%) | $63,125 |
| 2 Earners | 88 (28.7%) | $99,643 |
| 3+ Earners | 105 (34.2%) | $91,319 |
| Total | 307 (100.0%) | $90,042 |
Household Income in Hereford
Household Income Brackets in Hereford
With 116 households falling in the category, the $100,000 to $149,999 income range is the most frequent in Hereford, accounting for 29.7% of all households.
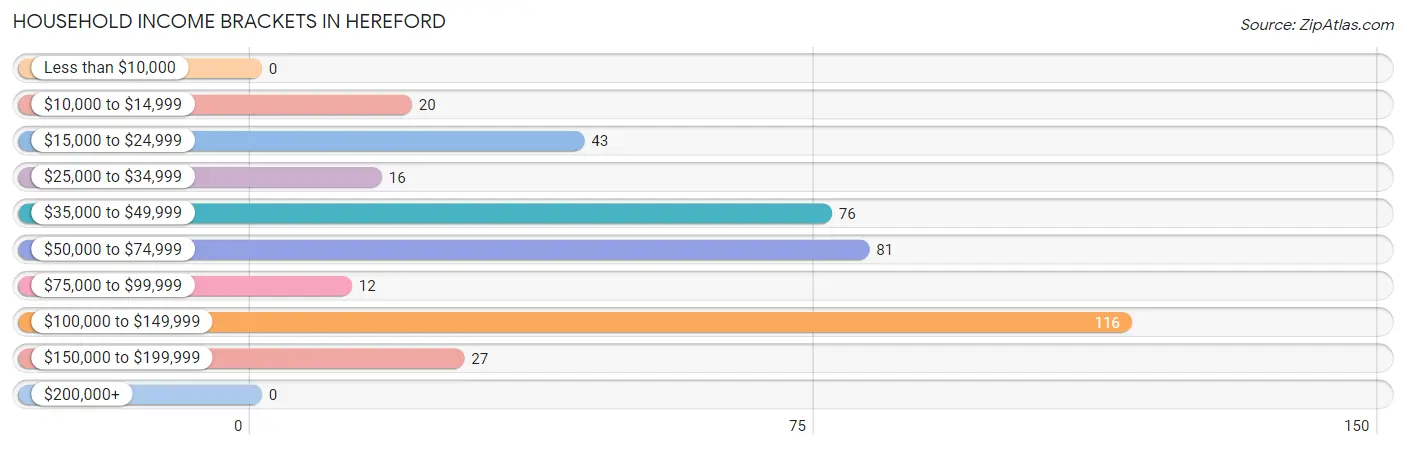
| Income Bracket | # Households | % Households |
| Less than $10,000 | 0 | 0.0% |
| $10,000 to $14,999 | 20 | 5.1% |
| $15,000 to $24,999 | 43 | 11.0% |
| $25,000 to $34,999 | 16 | 4.1% |
| $35,000 to $49,999 | 76 | 19.4% |
| $50,000 to $74,999 | 81 | 20.7% |
| $75,000 to $99,999 | 12 | 3.1% |
| $100,000 to $149,999 | 116 | 29.7% |
| $150,000 to $199,999 | 27 | 6.9% |
| $200,000+ | 0 | 0.0% |
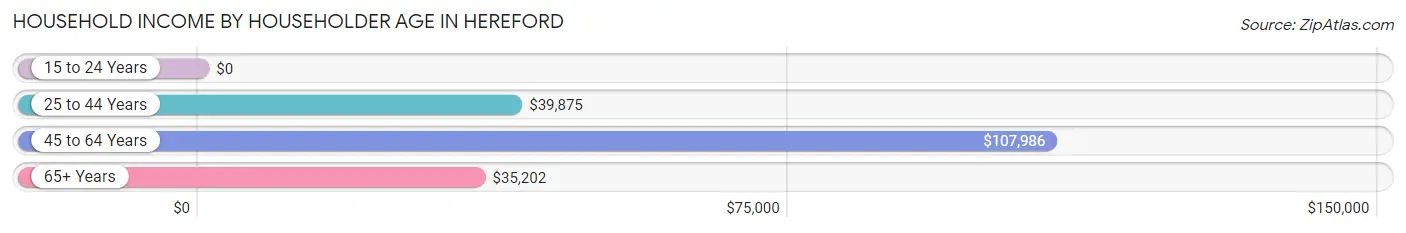
Household Income by Householder Age in Hereford
The median household income in Hereford is $59,926, with the highest median household income of $107,986 found in the 45 to 64 years age bracket for the primary householder. A total of 245 households (62.7%) fall into this category.
| Income Bracket | # Households | Median Income |
| 15 to 24 Years | 0 (0.0%) | $0 |
| 25 to 44 Years | 29 (7.4%) | $39,875 |
| 45 to 64 Years | 245 (62.7%) | $107,986 |
| 65+ Years | 117 (29.9%) | $35,202 |
| Total | 391 (100.0%) | $59,926 |
Poverty in Hereford
Income Below Poverty by Sex and Age in Hereford
With 4.5% poverty level for males and 11.1% for females among the residents of Hereford, 6 to 11 year old males and 25 to 34 year old females are the most vulnerable to poverty, with 9 males (100.0%) and 10 females (100.0%) in their respective age groups living below the poverty level.
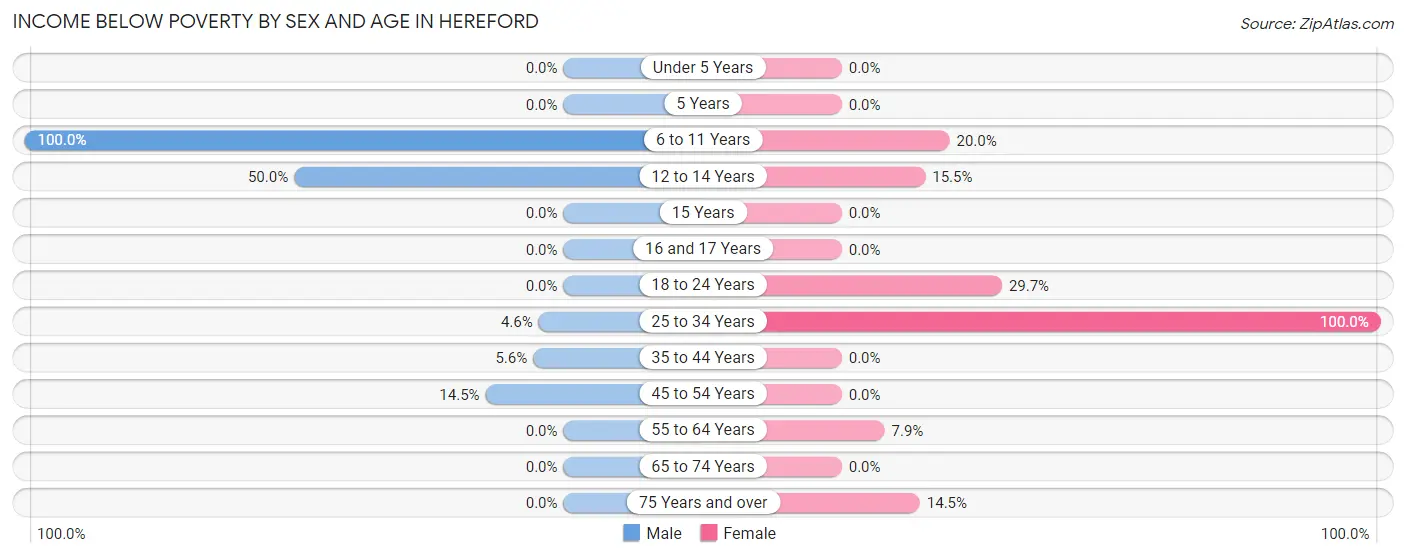
| Age Bracket | Male | Female |
| Under 5 Years | 0 (0.0%) | 0 (0.0%) |
| 5 Years | 0 (0.0%) | 0 (0.0%) |
| 6 to 11 Years | 9 (100.0%) | 8 (20.0%) |
| 12 to 14 Years | 9 (50.0%) | 20 (15.5%) |
| 15 Years | 0 (0.0%) | 0 (0.0%) |
| 16 and 17 Years | 0 (0.0%) | 0 (0.0%) |
| 18 to 24 Years | 0 (0.0%) | 11 (29.7%) |
| 25 to 34 Years | 10 (4.6%) | 10 (100.0%) |
| 35 to 44 Years | 5 (5.6%) | 0 (0.0%) |
| 45 to 54 Years | 11 (14.5%) | 0 (0.0%) |
| 55 to 64 Years | 0 (0.0%) | 5 (7.9%) |
| 65 to 74 Years | 0 (0.0%) | 0 (0.0%) |
| 75 Years and over | 0 (0.0%) | 10 (14.5%) |
| Total | 44 (4.5%) | 64 (11.1%) |
Income Above Poverty by Sex and Age in Hereford
According to the poverty statistics in Hereford, males aged 15 years and females aged 35 to 44 years are the age groups that are most secure financially, with 100.0% of males and 100.0% of females in these age groups living above the poverty line.
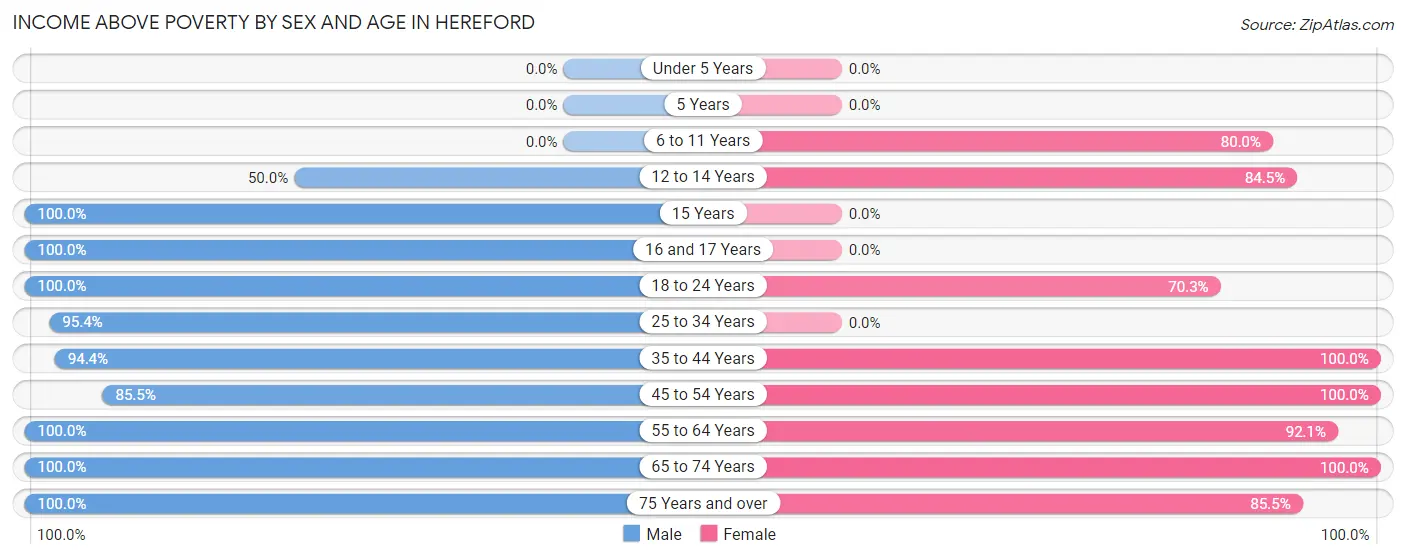
| Age Bracket | Male | Female |
| Under 5 Years | 0 (0.0%) | 0 (0.0%) |
| 5 Years | 0 (0.0%) | 0 (0.0%) |
| 6 to 11 Years | 0 (0.0%) | 32 (80.0%) |
| 12 to 14 Years | 9 (50.0%) | 109 (84.5%) |
| 15 Years | 18 (100.0%) | 0 (0.0%) |
| 16 and 17 Years | 142 (100.0%) | 0 (0.0%) |
| 18 to 24 Years | 271 (100.0%) | 26 (70.3%) |
| 25 to 34 Years | 207 (95.4%) | 0 (0.0%) |
| 35 to 44 Years | 84 (94.4%) | 23 (100.0%) |
| 45 to 54 Years | 65 (85.5%) | 151 (100.0%) |
| 55 to 64 Years | 73 (100.0%) | 58 (92.1%) |
| 65 to 74 Years | 24 (100.0%) | 53 (100.0%) |
| 75 Years and over | 37 (100.0%) | 59 (85.5%) |
| Total | 930 (95.5%) | 511 (88.9%) |
Income Below Poverty Among Married-Couple Families in Hereford
The poverty statistics for married-couple families in Hereford show that 5.4% or 10 of the total 184 families live below the poverty line. Families with 3 or 4 children have the highest poverty rate of 100.0%, comprising of 10 families. On the other hand, families with no children have the lowest poverty rate of 0.0%, which includes 0 families.
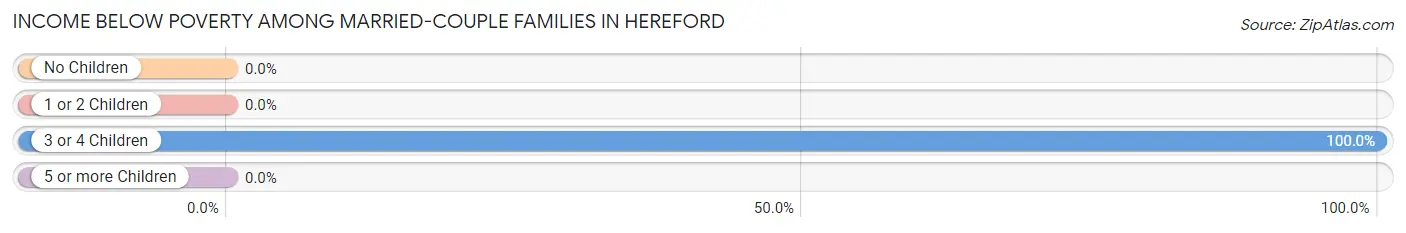
| Children | Above Poverty | Below Poverty |
| No Children | 143 (100.0%) | 0 (0.0%) |
| 1 or 2 Children | 14 (100.0%) | 0 (0.0%) |
| 3 or 4 Children | 0 (0.0%) | 10 (100.0%) |
| 5 or more Children | 17 (100.0%) | 0 (0.0%) |
| Total | 174 (94.6%) | 10 (5.4%) |
Income Below Poverty Among Single-Parent Households in Hereford
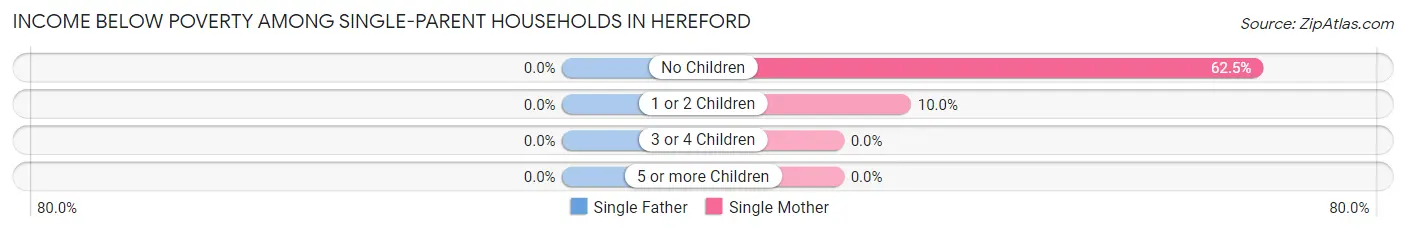
| Children | Single Father | Single Mother |
| No Children | 0 (0.0%) | 5 (62.5%) |
| 1 or 2 Children | 0 (0.0%) | 10 (10.0%) |
| 3 or 4 Children | 0 (0.0%) | 0 (0.0%) |
| 5 or more Children | 0 (0.0%) | 0 (0.0%) |
| Total | 0 (0.0%) | 15 (13.9%) |
Income Below Poverty Among Married-Couple vs Single-Parent Households in Hereford
The poverty data for Hereford shows that 10 of the married-couple family households (5.4%) and 15 of the single-parent households (12.2%) are living below the poverty level. Within the married-couple family households, those with 3 or 4 children have the highest poverty rate, with 10 households (100.0%) falling below the poverty line. Among the single-parent households, those with no children have the highest poverty rate, with 5 household (21.7%) living below poverty.
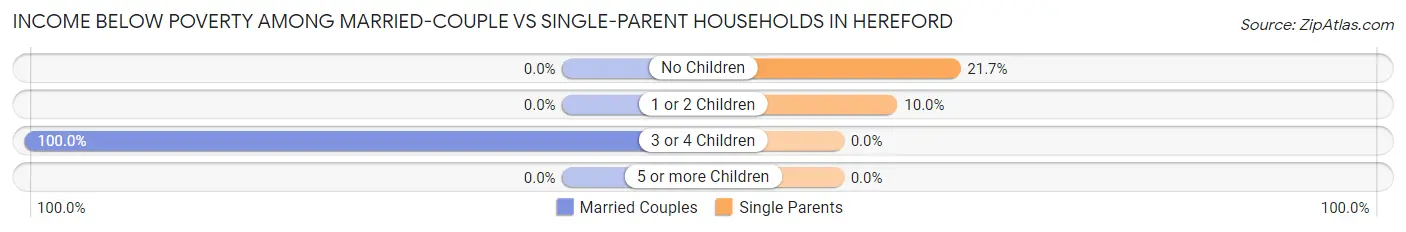
| Children | Married-Couple Families | Single-Parent Households |
| No Children | 0 (0.0%) | 5 (21.7%) |
| 1 or 2 Children | 0 (0.0%) | 10 (10.0%) |
| 3 or 4 Children | 10 (100.0%) | 0 (0.0%) |
| 5 or more Children | 0 (0.0%) | 0 (0.0%) |
| Total | 10 (5.4%) | 15 (12.2%) |
Race in Hereford
The most populous races in Hereford are White / Caucasian (867 | 56.0%), Hispanic or Latino (776 | 50.1%), and Two or more Races (671 | 43.3%).
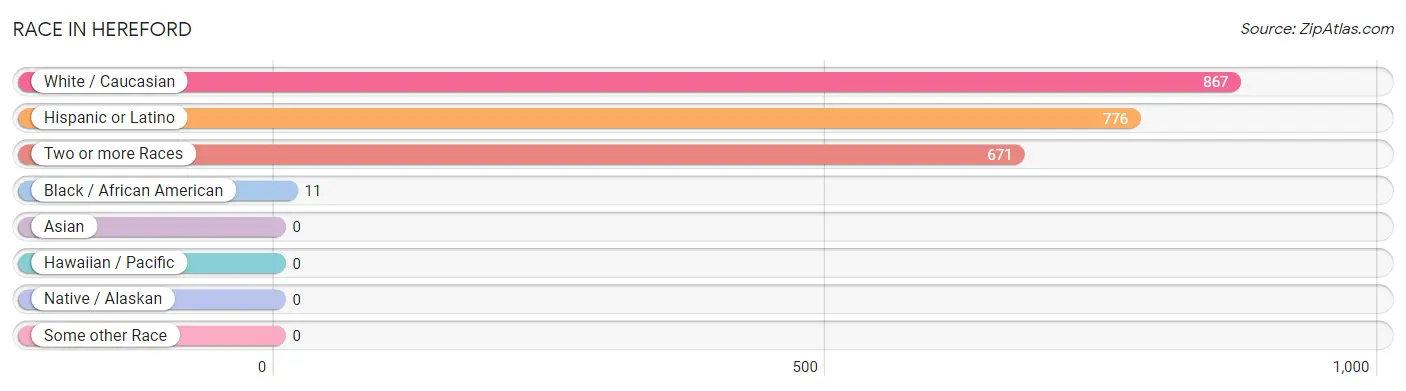
| Race | # Population | % Population |
| Asian | 0 | 0.0% |
| Black / African American | 11 | 0.7% |
| Hawaiian / Pacific | 0 | 0.0% |
| Hispanic or Latino | 776 | 50.1% |
| Native / Alaskan | 0 | 0.0% |
| White / Caucasian | 867 | 56.0% |
| Two or more Races | 671 | 43.3% |
| Some other Race | 0 | 0.0% |
| Total | 1,549 | 100.0% |
Ancestry in Hereford
The most populous ancestries reported in Hereford are Spaniard (731 | 47.2%), German (479 | 30.9%), Irish (212 | 13.7%), American (92 | 5.9%), and Polish (47 | 3.0%), together accounting for 100.8% of all Hereford residents.
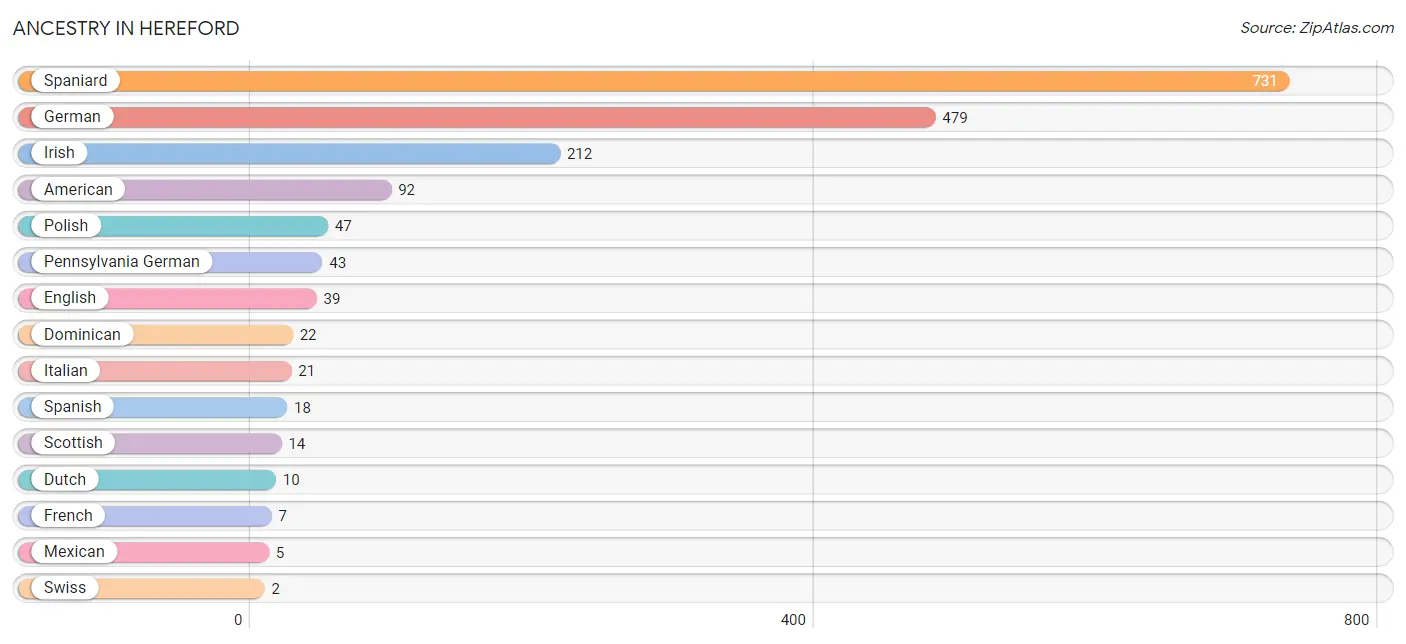
| Ancestry | # Population | % Population |
| American | 92 | 5.9% |
| Dominican | 22 | 1.4% |
| Dutch | 10 | 0.6% |
| English | 39 | 2.5% |
| French | 7 | 0.4% |
| German | 479 | 30.9% |
| Irish | 212 | 13.7% |
| Italian | 21 | 1.4% |
| Mexican | 5 | 0.3% |
| Pennsylvania German | 43 | 2.8% |
| Polish | 47 | 3.0% |
| Scottish | 14 | 0.9% |
| Spaniard | 731 | 47.2% |
| Spanish | 18 | 1.2% |
| Swiss | 2 | 0.1% | View All 15 Rows |
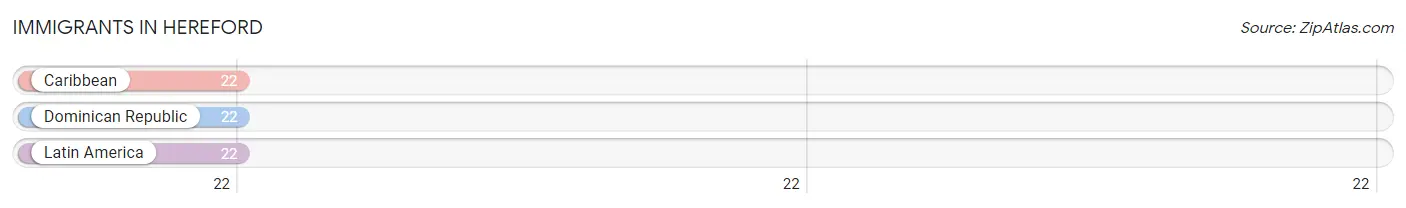
Immigrants in Hereford
The most numerous immigrant groups reported in Hereford came from Caribbean (22 | 1.4%), Dominican Republic (22 | 1.4%), and Latin America (22 | 1.4%), together accounting for 4.3% of all Hereford residents.
| Immigration Origin | # Population | % Population |
| Caribbean | 22 | 1.4% |
| Dominican Republic | 22 | 1.4% |
| Latin America | 22 | 1.4% | View All 3 Rows |
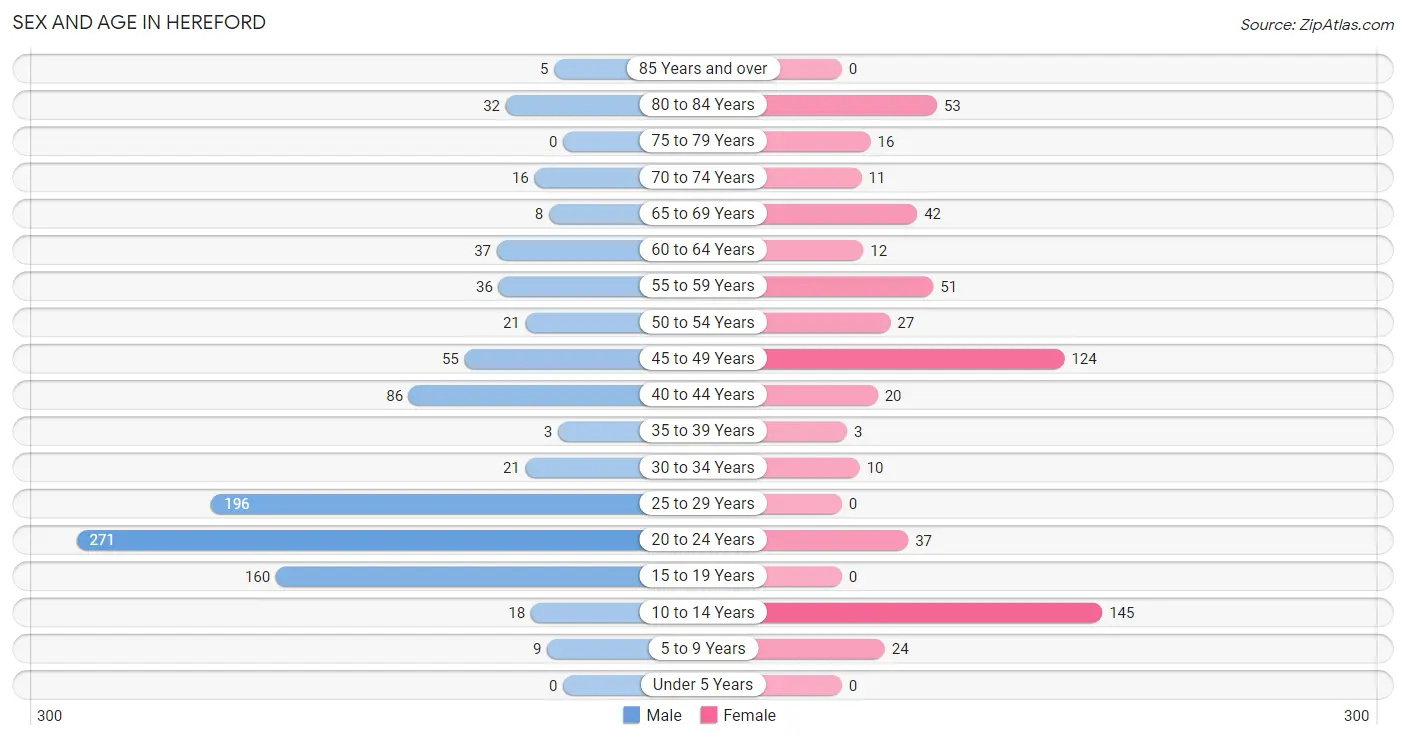
Sex and Age in Hereford
Sex and Age in Hereford
The most populous age groups in Hereford are 20 to 24 Years (271 | 27.8%) for men and 10 to 14 Years (145 | 25.2%) for women.
| Age Bracket | Male | Female |
| Under 5 Years | 0 (0.0%) | 0 (0.0%) |
| 5 to 9 Years | 9 (0.9%) | 24 (4.2%) |
| 10 to 14 Years | 18 (1.8%) | 145 (25.2%) |
| 15 to 19 Years | 160 (16.4%) | 0 (0.0%) |
| 20 to 24 Years | 271 (27.8%) | 37 (6.4%) |
| 25 to 29 Years | 196 (20.1%) | 0 (0.0%) |
| 30 to 34 Years | 21 (2.2%) | 10 (1.7%) |
| 35 to 39 Years | 3 (0.3%) | 3 (0.5%) |
| 40 to 44 Years | 86 (8.8%) | 20 (3.5%) |
| 45 to 49 Years | 55 (5.7%) | 124 (21.6%) |
| 50 to 54 Years | 21 (2.2%) | 27 (4.7%) |
| 55 to 59 Years | 36 (3.7%) | 51 (8.9%) |
| 60 to 64 Years | 37 (3.8%) | 12 (2.1%) |
| 65 to 69 Years | 8 (0.8%) | 42 (7.3%) |
| 70 to 74 Years | 16 (1.6%) | 11 (1.9%) |
| 75 to 79 Years | 0 (0.0%) | 16 (2.8%) |
| 80 to 84 Years | 32 (3.3%) | 53 (9.2%) |
| 85 Years and over | 5 (0.5%) | 0 (0.0%) |
| Total | 974 (100.0%) | 575 (100.0%) |
Families and Households in Hereford
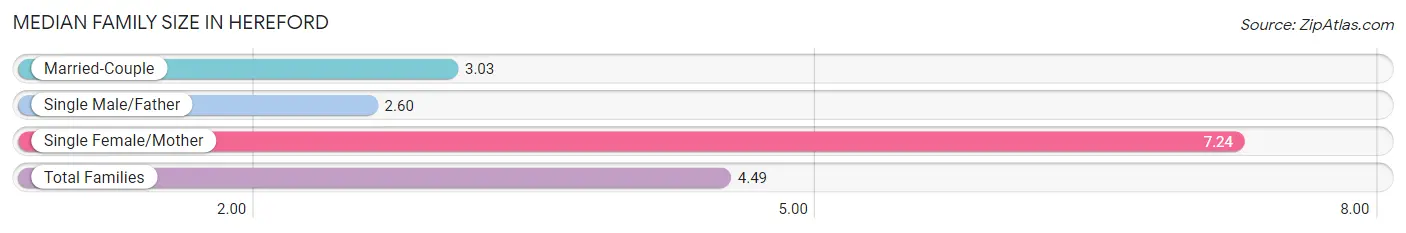
Median Family Size in Hereford
The median family size in Hereford is 4.49 persons per family, with single female/mother families (108 | 35.2%) accounting for the largest median family size of 7.24 persons per family. On the other hand, single male/father families (15 | 4.9%) represent the smallest median family size with 2.60 persons per family.
| Family Type | # Families | Family Size |
| Married-Couple | 184 (59.9%) | 3.03 |
| Single Male/Father | 15 (4.9%) | 2.60 |
| Single Female/Mother | 108 (35.2%) | 7.24 |
| Total Families | 307 (100.0%) | 4.49 |
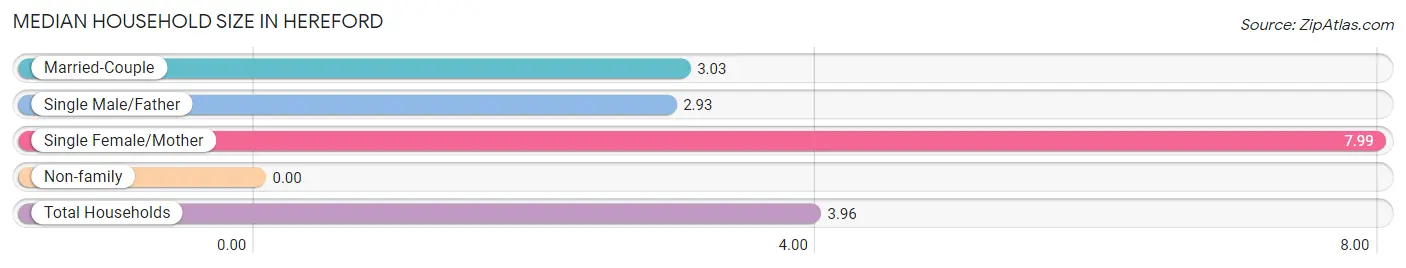
Median Household Size in Hereford
| Household Type | # Households | Household Size |
| Married-Couple | 184 (47.1%) | 3.03 |
| Single Male/Father | 15 (3.8%) | 2.93 |
| Single Female/Mother | 108 (27.6%) | 7.99 |
| Non-family | 84 (21.5%) | - |
| Total Households | 391 (100.0%) | 3.96 |
Household Size by Marriage Status in Hereford
Out of a total of 391 households in Hereford, 307 (78.5%) are family households, while 84 (21.5%) are nonfamily households. The most numerous type of family households are 2-person households, comprising 127, and the most common type of nonfamily households are 1-person households, comprising 84.
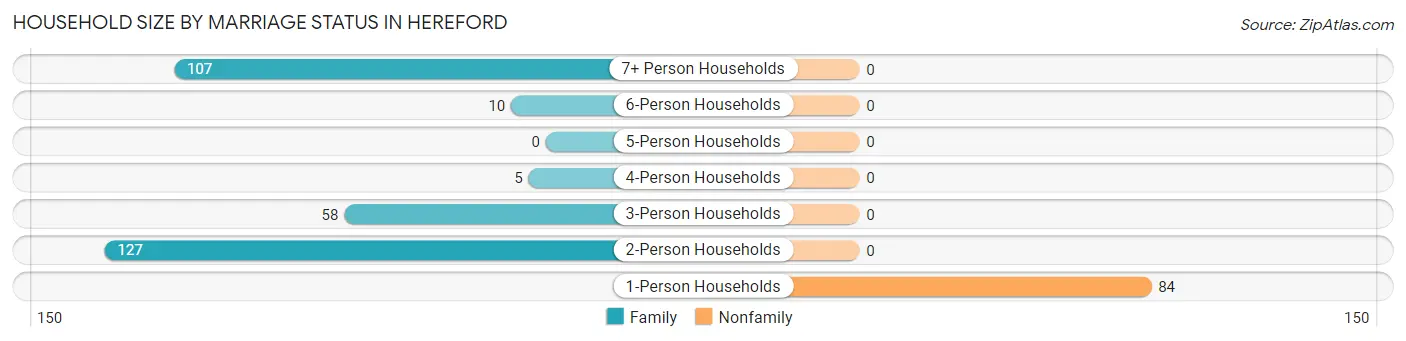
| Household Size | Family Households | Nonfamily Households |
| 1-Person Households | - | 84 (21.5%) |
| 2-Person Households | 127 (32.5%) | 0 (0.0%) |
| 3-Person Households | 58 (14.8%) | 0 (0.0%) |
| 4-Person Households | 5 (1.3%) | 0 (0.0%) |
| 5-Person Households | 0 (0.0%) | 0 (0.0%) |
| 6-Person Households | 10 (2.6%) | 0 (0.0%) |
| 7+ Person Households | 107 (27.4%) | 0 (0.0%) |
| Total | 307 (78.5%) | 84 (21.5%) |
Female Fertility in Hereford
Fertility by Age in Hereford
| Age Bracket | Women with Births | Births / 1,000 Women |
| 15 to 19 years | 0 (0.0%) | 0.0 |
| 20 to 34 years | 0 (0.0%) | 0.0 |
| 35 to 50 years | 0 (0.0%) | 0.0 |
| Total | 0 (0.0%) | 0.0 |
Fertility by Age by Marriage Status in Hereford
| Age Bracket | Married | Unmarried |
| 15 to 19 years | 0 (0.0%) | 0 (0.0%) |
| 20 to 34 years | 0 (0.0%) | 0 (0.0%) |
| 35 to 50 years | 0 (0.0%) | 0 (0.0%) |
| Total | 0 (0.0%) | 0 (0.0%) |
Fertility by Education in Hereford
| Educational Attainment | Women with Births | Births / 1,000 Women |
| Less than High School | 0 (0.0%) | 0.0 |
| High School Diploma | 0 (0.0%) | 0.0 |
| College or Associate's Degree | 0 (0.0%) | 0.0 |
| Bachelor's Degree | 0 (0.0%) | 0.0 |
| Graduate Degree | 0 (0.0%) | 0.0 |
| Total | 0 (0.0%) | 0.0 |
Fertility by Education by Marriage Status in Hereford
| Educational Attainment | Married | Unmarried |
| Less than High School | 0 (0.0%) | 0 (0.0%) |
| High School Diploma | 0 (0.0%) | 0 (0.0%) |
| College or Associate's Degree | 0 (0.0%) | 0 (0.0%) |
| Bachelor's Degree | 0 (0.0%) | 0 (0.0%) |
| Graduate Degree | 0 (0.0%) | 0 (0.0%) |
| Total | 0 (0.0%) | 0 (0.0%) |
Employment Characteristics in Hereford
Employment by Class of Employer in Hereford
Among the 734 employed individuals in Hereford, private company employees (693 | 94.4%), not-for-profit organizations (15 | 2.0%), and self-employed (not incorporated) (11 | 1.5%) make up the most common classes of employment.
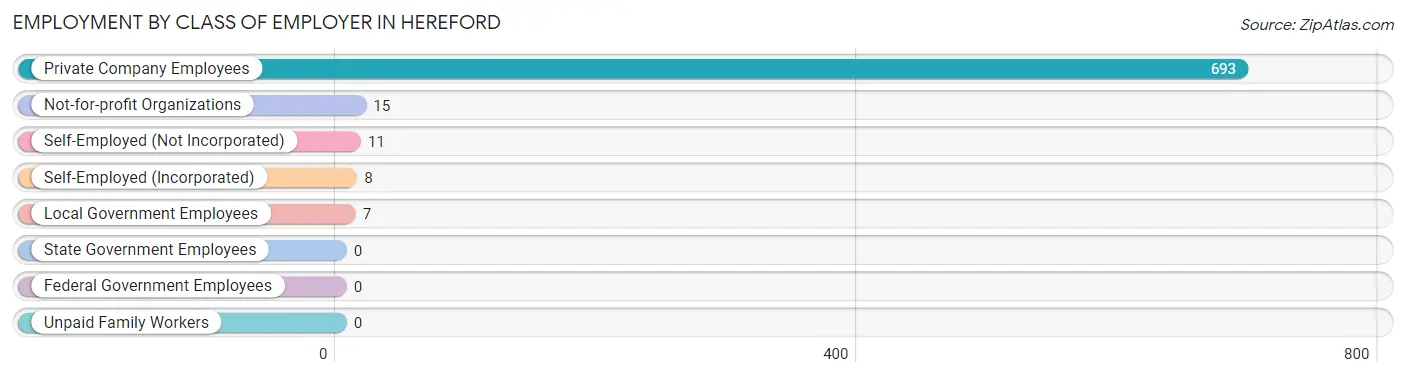
| Employer Class | # Employees | % Employees |
| Private Company Employees | 693 | 94.4% |
| Self-Employed (Incorporated) | 8 | 1.1% |
| Self-Employed (Not Incorporated) | 11 | 1.5% |
| Not-for-profit Organizations | 15 | 2.0% |
| Local Government Employees | 7 | 0.9% |
| State Government Employees | 0 | 0.0% |
| Federal Government Employees | 0 | 0.0% |
| Unpaid Family Workers | 0 | 0.0% |
| Total | 734 | 100.0% |
Employment Status by Age in Hereford
According to the labor force statistics for Hereford, out of the total population over 16 years of age (1,335), 58.0% or 774 individuals are in the labor force, with 2.5% or 19 of them unemployed. The age group with the highest labor force participation rate is 25 to 29 years, with 100.0% or 196 individuals in the labor force. Within the labor force, the 45 to 54 years age range has the highest percentage of unemployed individuals, with 7.1% or 13 of them being unemployed.
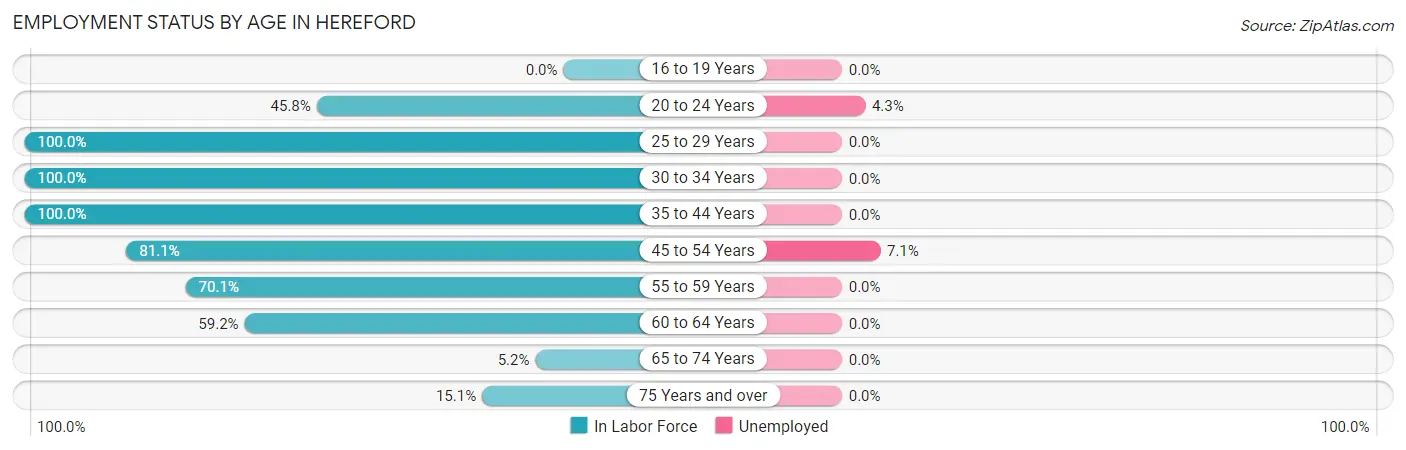
| Age Bracket | In Labor Force | Unemployed |
| 16 to 19 Years | 0 (0.0%) | 0 (0.0%) |
| 20 to 24 Years | 141 (45.8%) | 6 (4.3%) |
| 25 to 29 Years | 196 (100.0%) | 0 (0.0%) |
| 30 to 34 Years | 31 (100.0%) | 0 (0.0%) |
| 35 to 44 Years | 112 (100.0%) | 0 (0.0%) |
| 45 to 54 Years | 184 (81.1%) | 13 (7.1%) |
| 55 to 59 Years | 61 (70.1%) | 0 (0.0%) |
| 60 to 64 Years | 29 (59.2%) | 0 (0.0%) |
| 65 to 74 Years | 4 (5.2%) | 0 (0.0%) |
| 75 Years and over | 16 (15.1%) | 0 (0.0%) |
| Total | 774 (58.0%) | 19 (2.5%) |
Employment Status by Educational Attainment in Hereford
According to labor force statistics for Hereford, 87.3% of individuals (613) out of the total population between 25 and 64 years of age (702) are in the labor force, with 2.1% or 13 of them being unemployed. The group with the highest labor force participation rate are those with the educational attainment of college / associate degree, with 100.0% or 96 individuals in the labor force. Within the labor force, individuals with college / associate degree education have the highest percentage of unemployment, with 13.5% or 13 of them being unemployed.
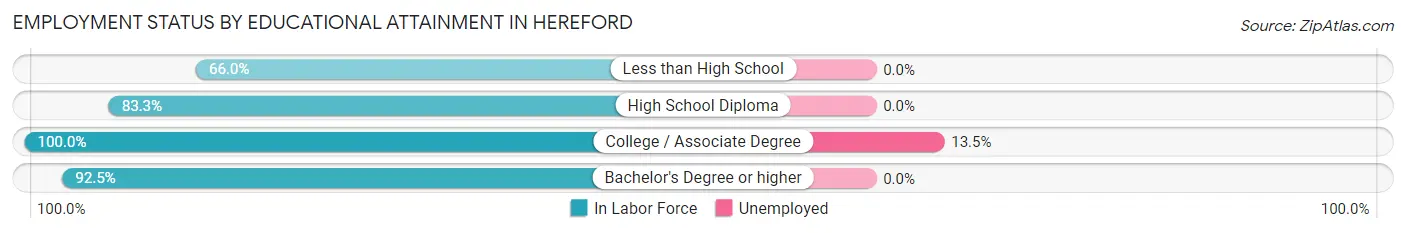
| Educational Attainment | In Labor Force | Unemployed |
| Less than High School | 33 (66.0%) | 0 (0.0%) |
| High School Diploma | 275 (83.3%) | 0 (0.0%) |
| College / Associate Degree | 96 (100.0%) | 13 (13.5%) |
| Bachelor's Degree or higher | 209 (92.5%) | 0 (0.0%) |
| Total | 613 (87.3%) | 15 (2.1%) |
Employment Occupations by Sex in Hereford
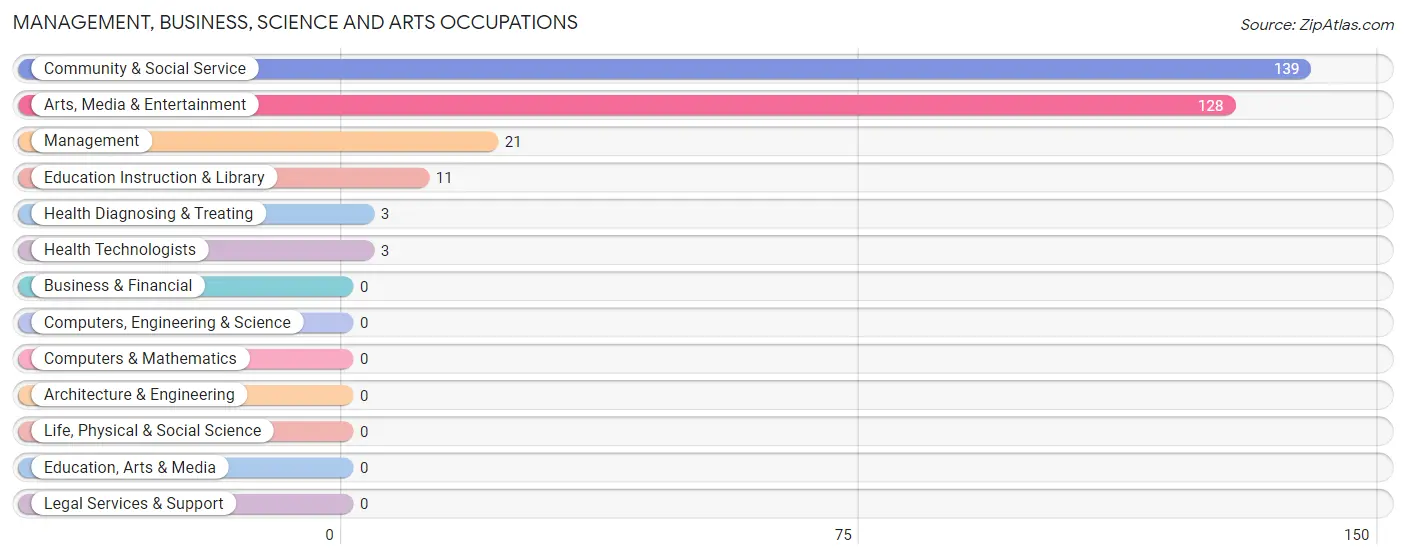
Management, Business, Science and Arts Occupations
The most common Management, Business, Science and Arts occupations in Hereford are Community & Social Service (139 | 18.4%), Arts, Media & Entertainment (128 | 17.0%), Management (21 | 2.8%), Education Instruction & Library (11 | 1.5%), and Health Diagnosing & Treating (3 | 0.4%).
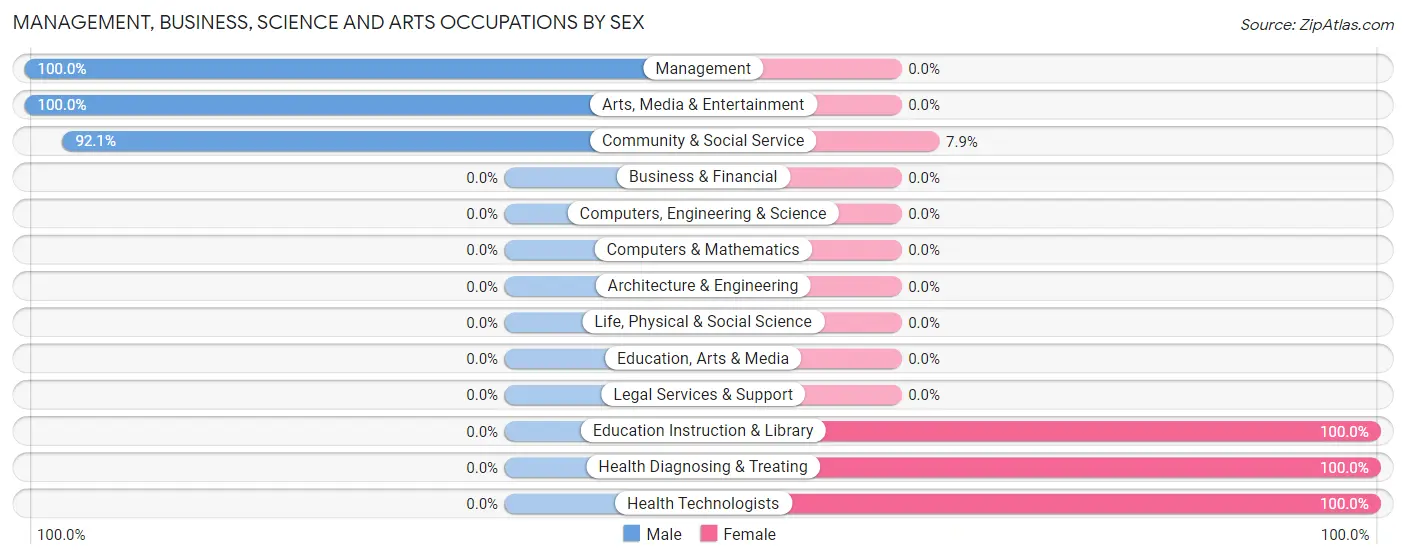
Management, Business, Science and Arts Occupations by Sex
Within the Management, Business, Science and Arts occupations in Hereford, the most male-oriented occupations are Management (100.0%), Arts, Media & Entertainment (100.0%), and Community & Social Service (92.1%), while the most female-oriented occupations are Education Instruction & Library (100.0%), Health Diagnosing & Treating (100.0%), and Health Technologists (100.0%).
| Occupation | Male | Female |
| Management | 21 (100.0%) | 0 (0.0%) |
| Business & Financial | 0 (0.0%) | 0 (0.0%) |
| Computers, Engineering & Science | 0 (0.0%) | 0 (0.0%) |
| Computers & Mathematics | 0 (0.0%) | 0 (0.0%) |
| Architecture & Engineering | 0 (0.0%) | 0 (0.0%) |
| Life, Physical & Social Science | 0 (0.0%) | 0 (0.0%) |
| Community & Social Service | 128 (92.1%) | 11 (7.9%) |
| Education, Arts & Media | 0 (0.0%) | 0 (0.0%) |
| Legal Services & Support | 0 (0.0%) | 0 (0.0%) |
| Education Instruction & Library | 0 (0.0%) | 11 (100.0%) |
| Arts, Media & Entertainment | 128 (100.0%) | 0 (0.0%) |
| Health Diagnosing & Treating | 0 (0.0%) | 3 (100.0%) |
| Health Technologists | 0 (0.0%) | 3 (100.0%) |
| Total (Category) | 149 (91.4%) | 14 (8.6%) |
| Total (Overall) | 538 (71.3%) | 217 (28.7%) |
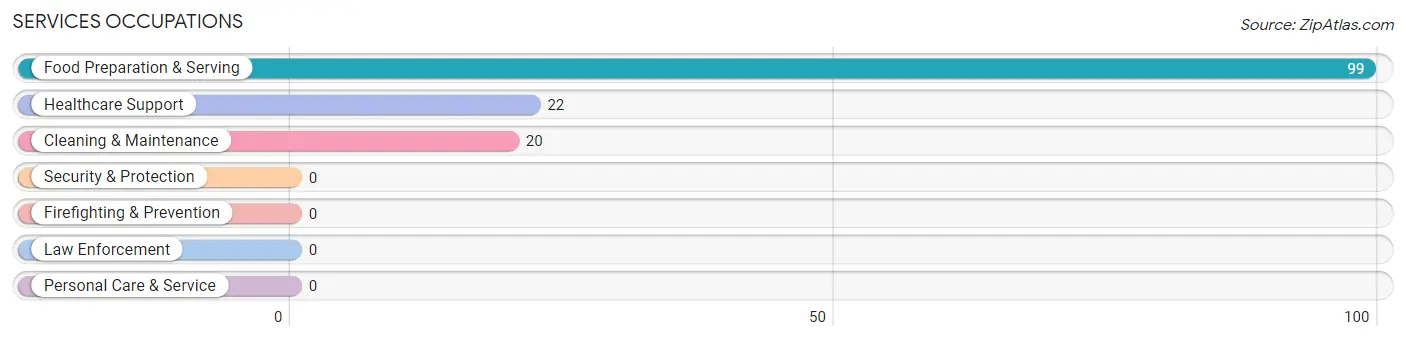
Services Occupations
The most common Services occupations in Hereford are Food Preparation & Serving (99 | 13.1%), Healthcare Support (22 | 2.9%), and Cleaning & Maintenance (20 | 2.6%).
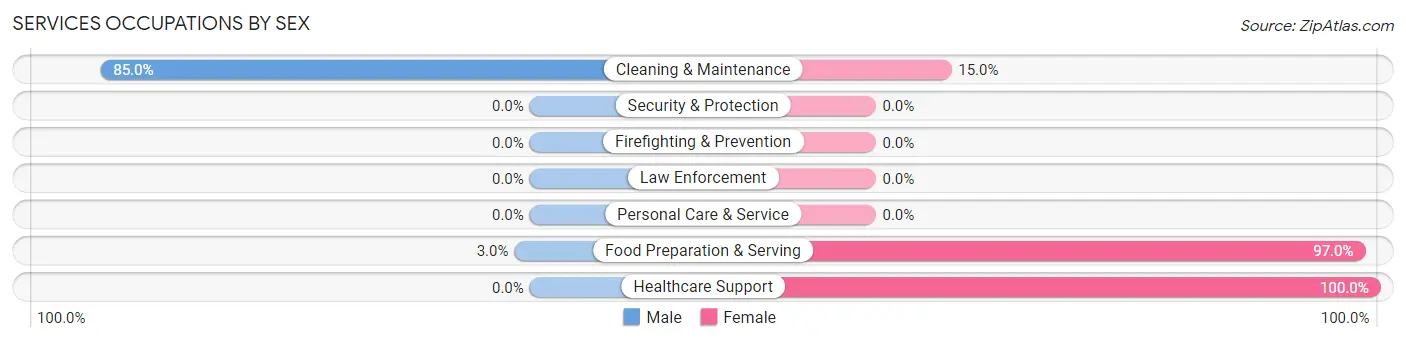
Services Occupations by Sex
Within the Services occupations in Hereford, the most male-oriented occupations are Cleaning & Maintenance (85.0%), and Food Preparation & Serving (3.0%), while the most female-oriented occupations are Healthcare Support (100.0%), Food Preparation & Serving (97.0%), and Cleaning & Maintenance (15.0%).
| Occupation | Male | Female |
| Healthcare Support | 0 (0.0%) | 22 (100.0%) |
| Security & Protection | 0 (0.0%) | 0 (0.0%) |
| Firefighting & Prevention | 0 (0.0%) | 0 (0.0%) |
| Law Enforcement | 0 (0.0%) | 0 (0.0%) |
| Food Preparation & Serving | 3 (3.0%) | 96 (97.0%) |
| Cleaning & Maintenance | 17 (85.0%) | 3 (15.0%) |
| Personal Care & Service | 0 (0.0%) | 0 (0.0%) |
| Total (Category) | 20 (14.2%) | 121 (85.8%) |
| Total (Overall) | 538 (71.3%) | 217 (28.7%) |
Sales and Office Occupations
The most common Sales and Office occupations in Hereford are Office & Administration (108 | 14.3%), and Sales & Related (18 | 2.4%).
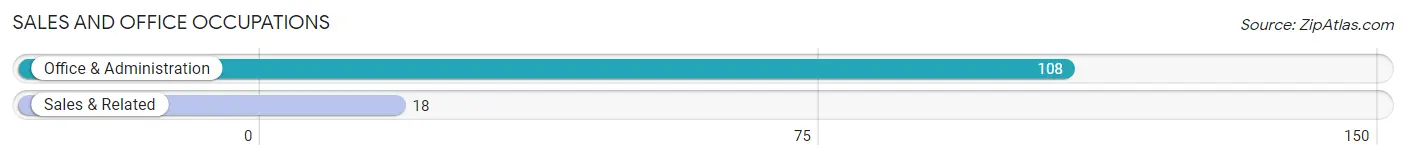
Sales and Office Occupations by Sex
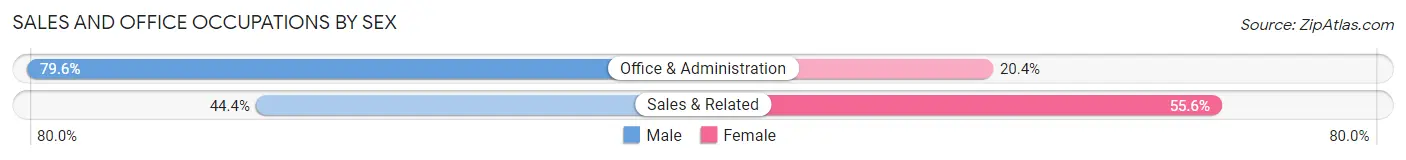
| Occupation | Male | Female |
| Sales & Related | 8 (44.4%) | 10 (55.6%) |
| Office & Administration | 86 (79.6%) | 22 (20.4%) |
| Total (Category) | 94 (74.6%) | 32 (25.4%) |
| Total (Overall) | 538 (71.3%) | 217 (28.7%) |
Natural Resources, Construction and Maintenance Occupations
The most common Natural Resources, Construction and Maintenance occupations in Hereford are Construction & Extraction (49 | 6.5%), and Installation, Maintenance & Repair (4 | 0.5%).
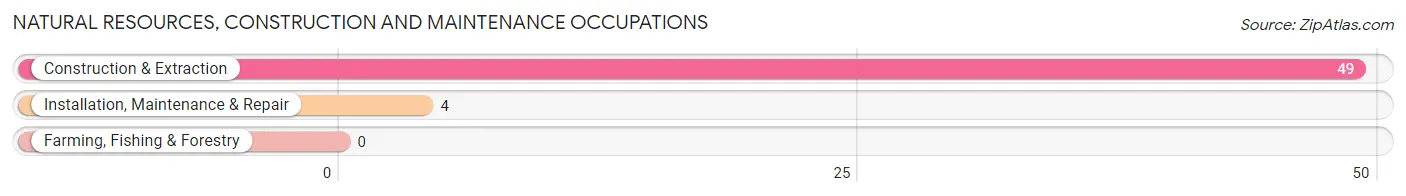
Natural Resources, Construction and Maintenance Occupations by Sex
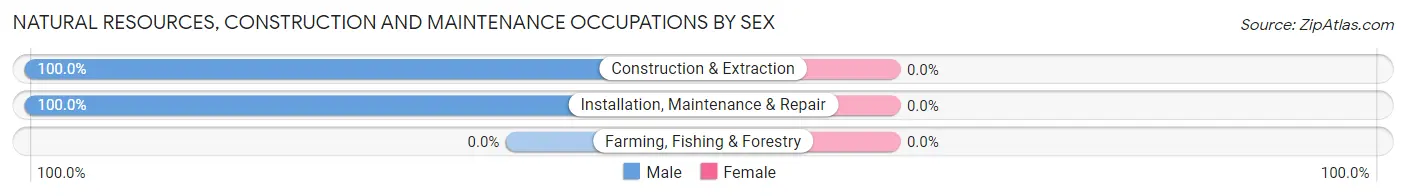
| Occupation | Male | Female |
| Farming, Fishing & Forestry | 0 (0.0%) | 0 (0.0%) |
| Construction & Extraction | 49 (100.0%) | 0 (0.0%) |
| Installation, Maintenance & Repair | 4 (100.0%) | 0 (0.0%) |
| Total (Category) | 53 (100.0%) | 0 (0.0%) |
| Total (Overall) | 538 (71.3%) | 217 (28.7%) |
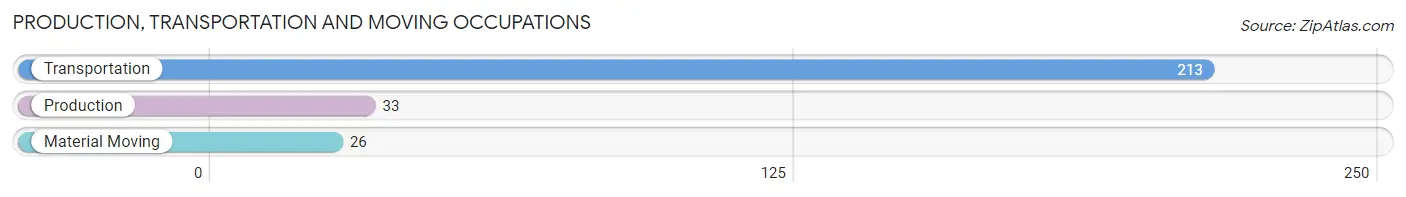
Production, Transportation and Moving Occupations
The most common Production, Transportation and Moving occupations in Hereford are Transportation (213 | 28.2%), Production (33 | 4.4%), and Material Moving (26 | 3.4%).
Production, Transportation and Moving Occupations by Sex
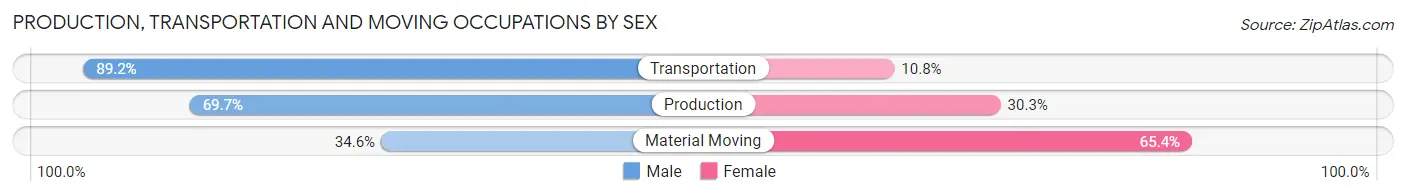
| Occupation | Male | Female |
| Production | 23 (69.7%) | 10 (30.3%) |
| Transportation | 190 (89.2%) | 23 (10.8%) |
| Material Moving | 9 (34.6%) | 17 (65.4%) |
| Total (Category) | 222 (81.6%) | 50 (18.4%) |
| Total (Overall) | 538 (71.3%) | 217 (28.7%) |
Employment Industries by Sex in Hereford
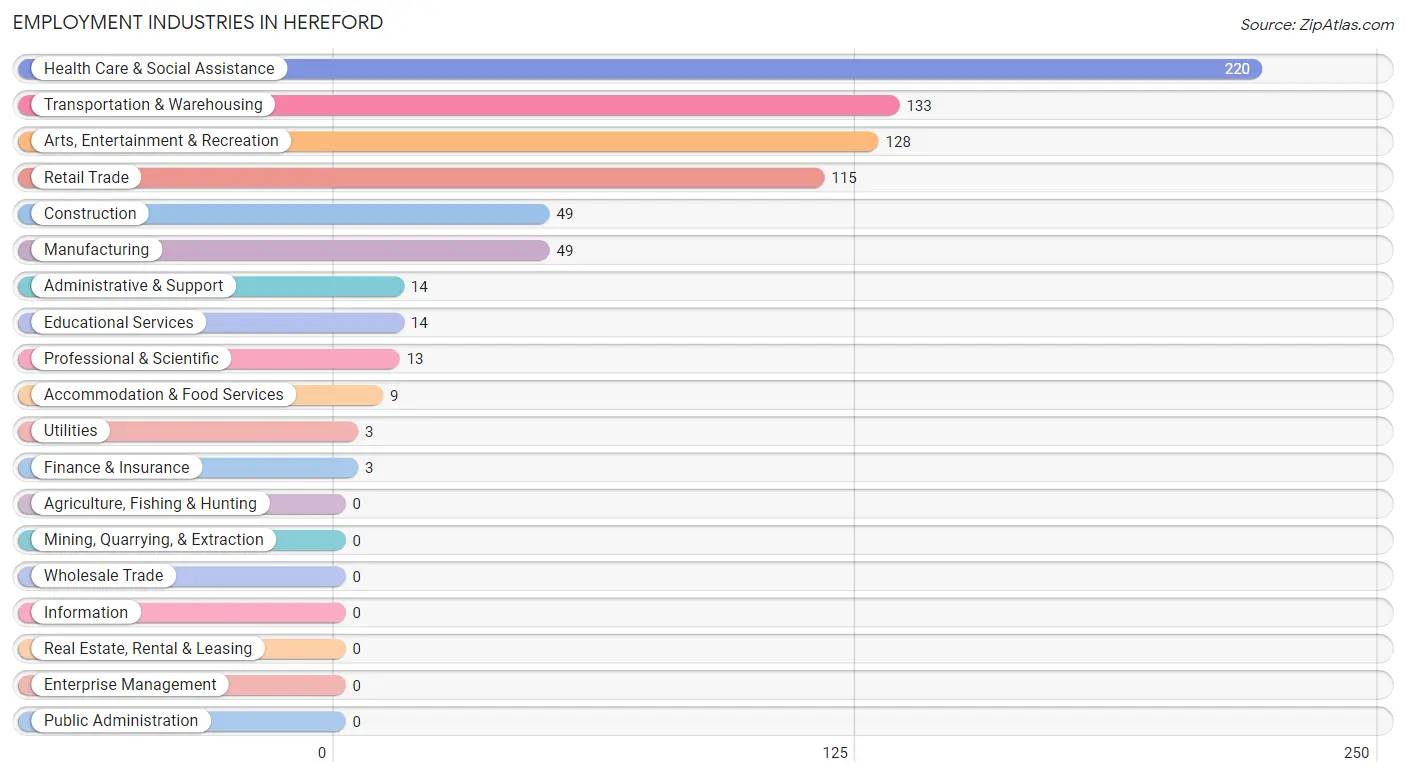
Employment Industries in Hereford
The major employment industries in Hereford include Health Care & Social Assistance (220 | 29.1%), Transportation & Warehousing (133 | 17.6%), Arts, Entertainment & Recreation (128 | 17.0%), Retail Trade (115 | 15.2%), and Construction (49 | 6.5%).
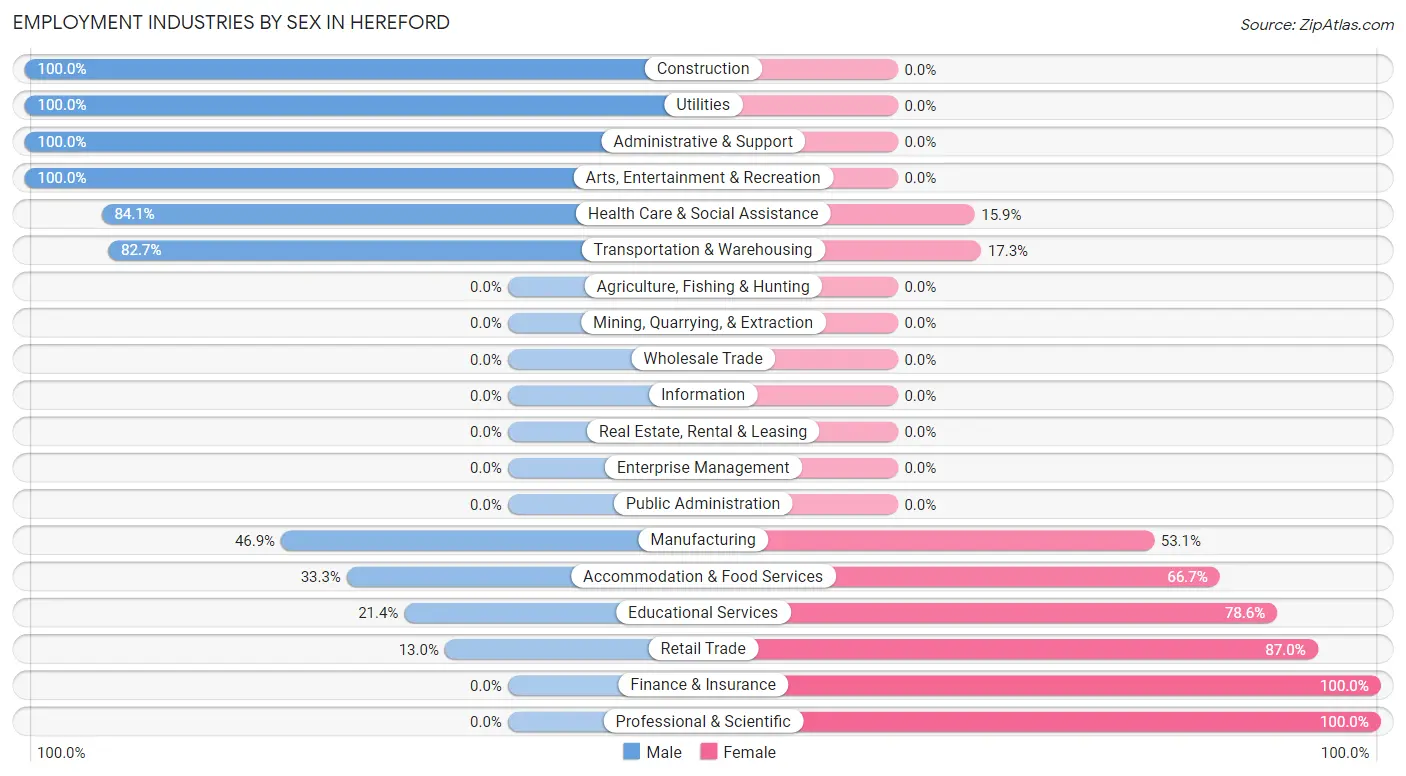
Employment Industries by Sex in Hereford
The Hereford industries that see more men than women are Construction (100.0%), Utilities (100.0%), and Administrative & Support (100.0%), whereas the industries that tend to have a higher number of women are Finance & Insurance (100.0%), Professional & Scientific (100.0%), and Retail Trade (87.0%).
| Industry | Male | Female |
| Agriculture, Fishing & Hunting | 0 (0.0%) | 0 (0.0%) |
| Mining, Quarrying, & Extraction | 0 (0.0%) | 0 (0.0%) |
| Construction | 49 (100.0%) | 0 (0.0%) |
| Manufacturing | 23 (46.9%) | 26 (53.1%) |
| Wholesale Trade | 0 (0.0%) | 0 (0.0%) |
| Retail Trade | 15 (13.0%) | 100 (87.0%) |
| Transportation & Warehousing | 110 (82.7%) | 23 (17.3%) |
| Utilities | 3 (100.0%) | 0 (0.0%) |
| Information | 0 (0.0%) | 0 (0.0%) |
| Finance & Insurance | 0 (0.0%) | 3 (100.0%) |
| Real Estate, Rental & Leasing | 0 (0.0%) | 0 (0.0%) |
| Professional & Scientific | 0 (0.0%) | 13 (100.0%) |
| Enterprise Management | 0 (0.0%) | 0 (0.0%) |
| Administrative & Support | 14 (100.0%) | 0 (0.0%) |
| Educational Services | 3 (21.4%) | 11 (78.6%) |
| Health Care & Social Assistance | 185 (84.1%) | 35 (15.9%) |
| Arts, Entertainment & Recreation | 128 (100.0%) | 0 (0.0%) |
| Accommodation & Food Services | 3 (33.3%) | 6 (66.7%) |
| Public Administration | 0 (0.0%) | 0 (0.0%) |
| Total | 538 (71.3%) | 217 (28.7%) |
Education in Hereford
School Enrollment in Hereford
The most common levels of schooling among the 425 students in Hereford are high school (169 | 39.8%), graduate / professional (137 | 32.2%), and middle school (61 | 14.3%).
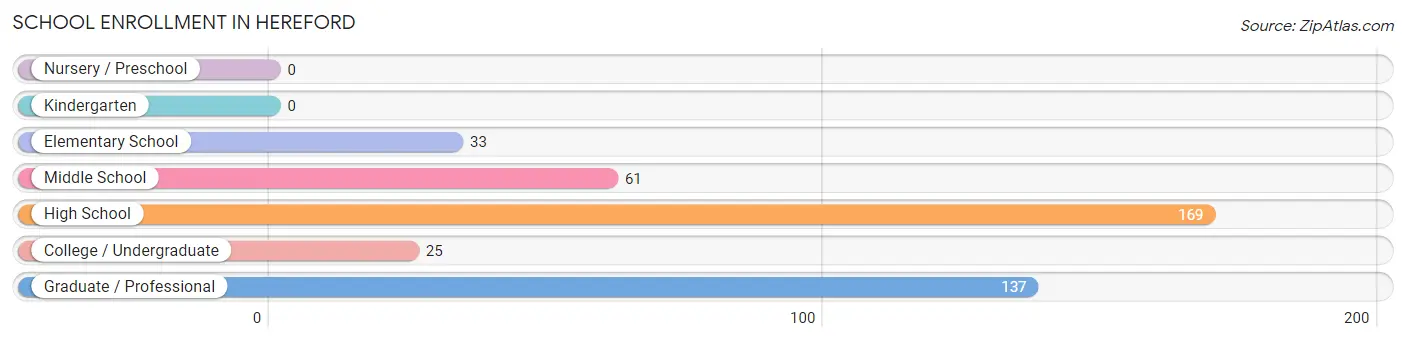
| School Level | # Students | % Students |
| Nursery / Preschool | 0 | 0.0% |
| Kindergarten | 0 | 0.0% |
| Elementary School | 33 | 7.8% |
| Middle School | 61 | 14.3% |
| High School | 169 | 39.8% |
| College / Undergraduate | 25 | 5.9% |
| Graduate / Professional | 137 | 32.2% |
| Total | 425 | 100.0% |
School Enrollment by Age by Funding Source in Hereford
Out of a total of 425 students who are enrolled in schools in Hereford, 156 (36.7%) attend a private institution, while the remaining 269 (63.3%) are enrolled in public schools. The age group of 20 to 24 year olds has the highest likelihood of being enrolled in private schools, with 156 (96.3% in the age bracket) enrolled. Conversely, the age group of 5 to 9 year old has the lowest likelihood of being enrolled in a private school, with 33 (100.0% in the age bracket) attending a public institution.
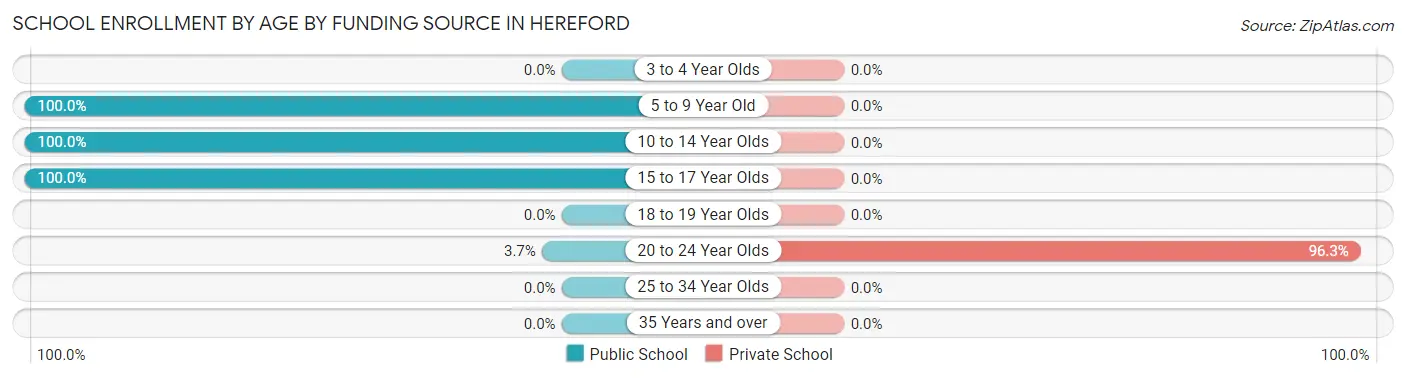
| Age Bracket | Public School | Private School |
| 3 to 4 Year Olds | 0 (0.0%) | 0 (0.0%) |
| 5 to 9 Year Old | 33 (100.0%) | 0 (0.0%) |
| 10 to 14 Year Olds | 70 (100.0%) | 0 (0.0%) |
| 15 to 17 Year Olds | 160 (100.0%) | 0 (0.0%) |
| 18 to 19 Year Olds | 0 (0.0%) | 0 (0.0%) |
| 20 to 24 Year Olds | 6 (3.7%) | 156 (96.3%) |
| 25 to 34 Year Olds | 0 (0.0%) | 0 (0.0%) |
| 35 Years and over | 0 (0.0%) | 0 (0.0%) |
| Total | 269 (63.3%) | 156 (36.7%) |
Educational Attainment by Field of Study in Hereford
Business (180 | 78.3%), visual & performing arts (21 | 9.1%), arts & humanities (20 | 8.7%), liberal arts & history (5 | 2.2%), and education (4 | 1.7%) are the most common fields of study among 230 individuals in Hereford who have obtained a bachelor's degree or higher.
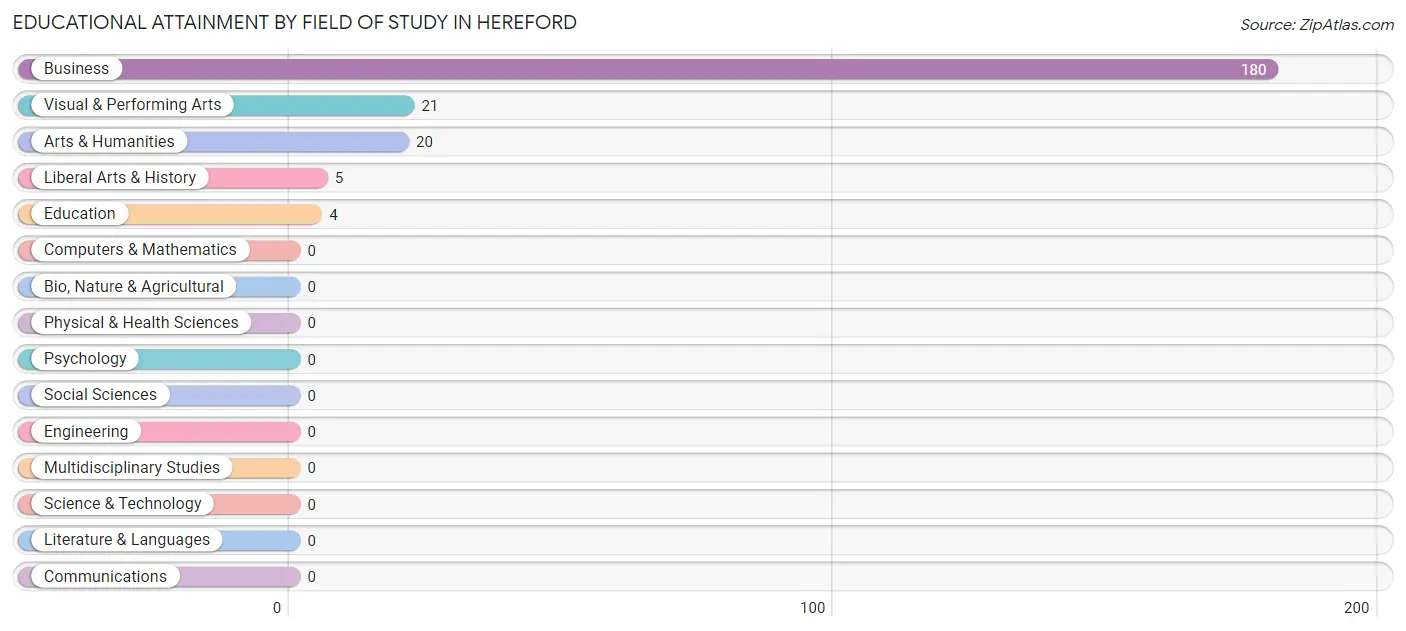
| Field of Study | # Graduates | % Graduates |
| Computers & Mathematics | 0 | 0.0% |
| Bio, Nature & Agricultural | 0 | 0.0% |
| Physical & Health Sciences | 0 | 0.0% |
| Psychology | 0 | 0.0% |
| Social Sciences | 0 | 0.0% |
| Engineering | 0 | 0.0% |
| Multidisciplinary Studies | 0 | 0.0% |
| Science & Technology | 0 | 0.0% |
| Business | 180 | 78.3% |
| Education | 4 | 1.7% |
| Literature & Languages | 0 | 0.0% |
| Liberal Arts & History | 5 | 2.2% |
| Visual & Performing Arts | 21 | 9.1% |
| Communications | 0 | 0.0% |
| Arts & Humanities | 20 | 8.7% |
| Total | 230 | 100.0% |
Transportation & Commute in Hereford
Vehicle Availability by Sex in Hereford
The most prevalent vehicle ownership categories in Hereford are males with 4 vehicles (389, accounting for 73.0%) and females with 4 vehicles (90, making up 193.5%).
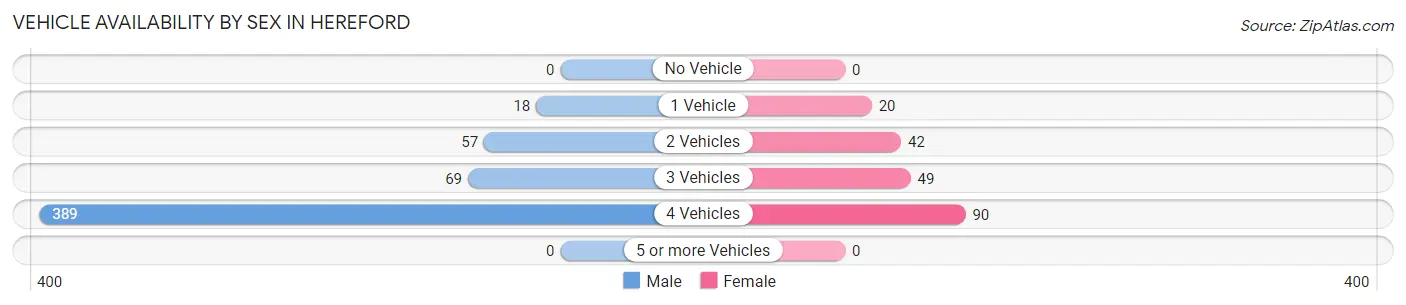
| Vehicles Available | Male | Female |
| No Vehicle | 0 (0.0%) | 0 (0.0%) |
| 1 Vehicle | 18 (3.4%) | 20 (10.0%) |
| 2 Vehicles | 57 (10.7%) | 42 (20.9%) |
| 3 Vehicles | 69 (13.0%) | 49 (24.4%) |
| 4 Vehicles | 389 (73.0%) | 90 (44.8%) |
| 5 or more Vehicles | 0 (0.0%) | 0 (0.0%) |
| Total | 533 (100.0%) | 201 (100.0%) |
Commute Time in Hereford
The most frequently occuring commute durations in Hereford are 35 to 39 minutes (107 commuters, 35.3%), 20 to 24 minutes (32 commuters, 10.6%), and 5 to 9 minutes (31 commuters, 10.2%).
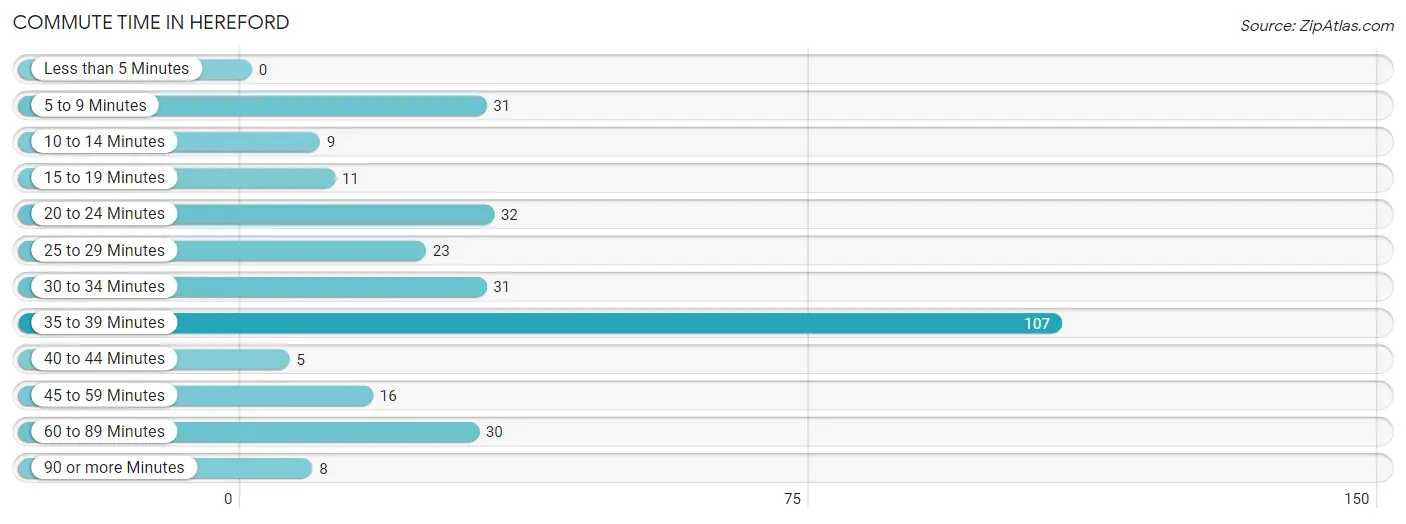
| Commute Time | # Commuters | % Commuters |
| Less than 5 Minutes | 0 | 0.0% |
| 5 to 9 Minutes | 31 | 10.2% |
| 10 to 14 Minutes | 9 | 3.0% |
| 15 to 19 Minutes | 11 | 3.6% |
| 20 to 24 Minutes | 32 | 10.6% |
| 25 to 29 Minutes | 23 | 7.6% |
| 30 to 34 Minutes | 31 | 10.2% |
| 35 to 39 Minutes | 107 | 35.3% |
| 40 to 44 Minutes | 5 | 1.7% |
| 45 to 59 Minutes | 16 | 5.3% |
| 60 to 89 Minutes | 30 | 9.9% |
| 90 or more Minutes | 8 | 2.6% |
Commute Time by Sex in Hereford
The most common commute times in Hereford are 25 to 29 minutes (23 commuters, 22.6%) for males and 35 to 39 minutes (97 commuters, 48.3%) for females.
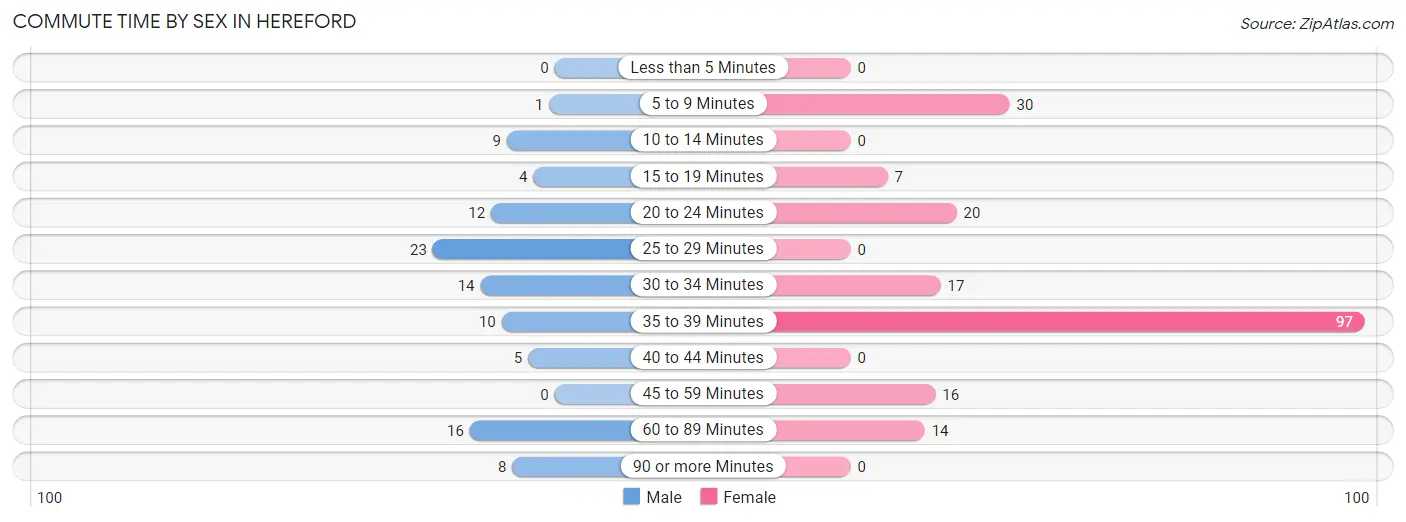
| Commute Time | Male | Female |
| Less than 5 Minutes | 0 (0.0%) | 0 (0.0%) |
| 5 to 9 Minutes | 1 (1.0%) | 30 (14.9%) |
| 10 to 14 Minutes | 9 (8.8%) | 0 (0.0%) |
| 15 to 19 Minutes | 4 (3.9%) | 7 (3.5%) |
| 20 to 24 Minutes | 12 (11.8%) | 20 (10.0%) |
| 25 to 29 Minutes | 23 (22.6%) | 0 (0.0%) |
| 30 to 34 Minutes | 14 (13.7%) | 17 (8.5%) |
| 35 to 39 Minutes | 10 (9.8%) | 97 (48.3%) |
| 40 to 44 Minutes | 5 (4.9%) | 0 (0.0%) |
| 45 to 59 Minutes | 0 (0.0%) | 16 (8.0%) |
| 60 to 89 Minutes | 16 (15.7%) | 14 (7.0%) |
| 90 or more Minutes | 8 (7.8%) | 0 (0.0%) |
Time of Departure to Work by Sex in Hereford
The most frequent times of departure to work in Hereford are 4:00 PM to 11:59 PM (38, 37.2%) for males and 4:00 PM to 11:59 PM (99, 49.2%) for females.
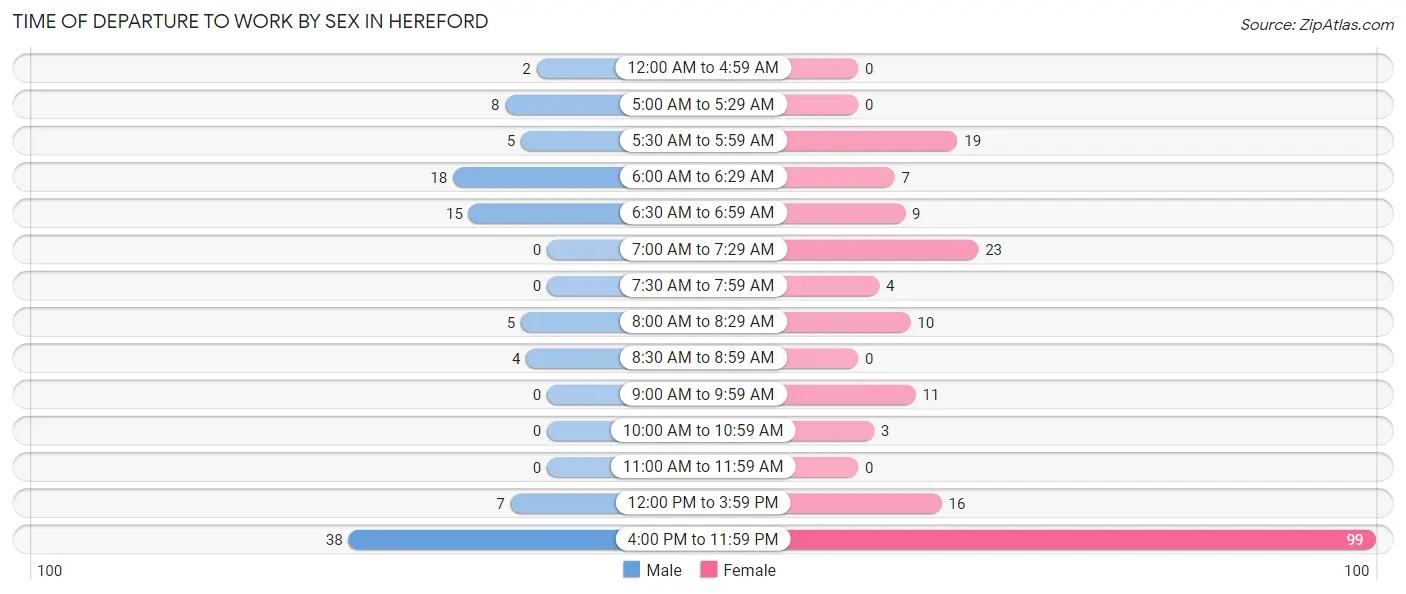
| Time of Departure | Male | Female |
| 12:00 AM to 4:59 AM | 2 (2.0%) | 0 (0.0%) |
| 5:00 AM to 5:29 AM | 8 (7.8%) | 0 (0.0%) |
| 5:30 AM to 5:59 AM | 5 (4.9%) | 19 (9.5%) |
| 6:00 AM to 6:29 AM | 18 (17.6%) | 7 (3.5%) |
| 6:30 AM to 6:59 AM | 15 (14.7%) | 9 (4.5%) |
| 7:00 AM to 7:29 AM | 0 (0.0%) | 23 (11.4%) |
| 7:30 AM to 7:59 AM | 0 (0.0%) | 4 (2.0%) |
| 8:00 AM to 8:29 AM | 5 (4.9%) | 10 (5.0%) |
| 8:30 AM to 8:59 AM | 4 (3.9%) | 0 (0.0%) |
| 9:00 AM to 9:59 AM | 0 (0.0%) | 11 (5.5%) |
| 10:00 AM to 10:59 AM | 0 (0.0%) | 3 (1.5%) |
| 11:00 AM to 11:59 AM | 0 (0.0%) | 0 (0.0%) |
| 12:00 PM to 3:59 PM | 7 (6.9%) | 16 (8.0%) |
| 4:00 PM to 11:59 PM | 38 (37.2%) | 99 (49.2%) |
| Total | 102 (100.0%) | 201 (100.0%) |
Housing Occupancy in Hereford
Occupancy by Ownership in Hereford
Of the total 391 dwellings in Hereford, owner-occupied units account for 255 (65.2%), while renter-occupied units make up 136 (34.8%).
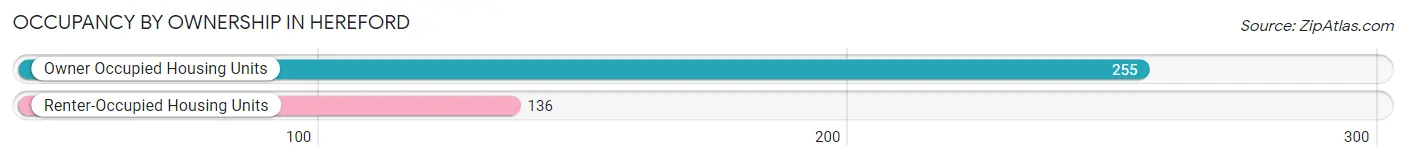
| Occupancy | # Housing Units | % Housing Units |
| Owner Occupied Housing Units | 255 | 65.2% |
| Renter-Occupied Housing Units | 136 | 34.8% |
| Total Occupied Housing Units | 391 | 100.0% |
Occupancy by Household Size in Hereford
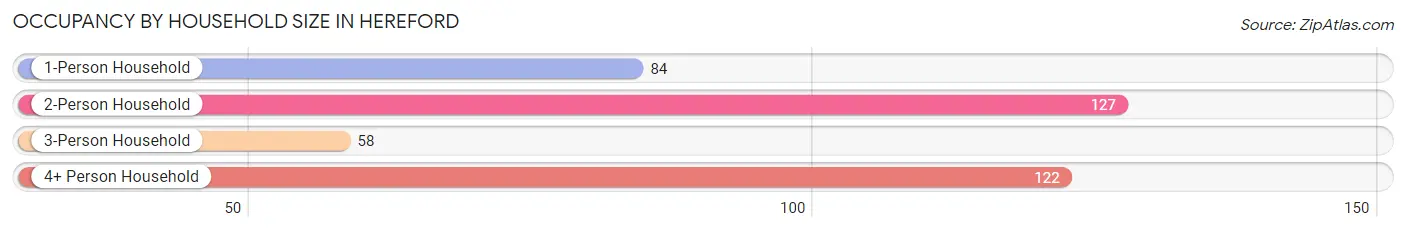
| Household Size | # Housing Units | % Housing Units |
| 1-Person Household | 84 | 21.5% |
| 2-Person Household | 127 | 32.5% |
| 3-Person Household | 58 | 14.8% |
| 4+ Person Household | 122 | 31.2% |
| Total Housing Units | 391 | 100.0% |
Occupancy by Ownership by Household Size in Hereford
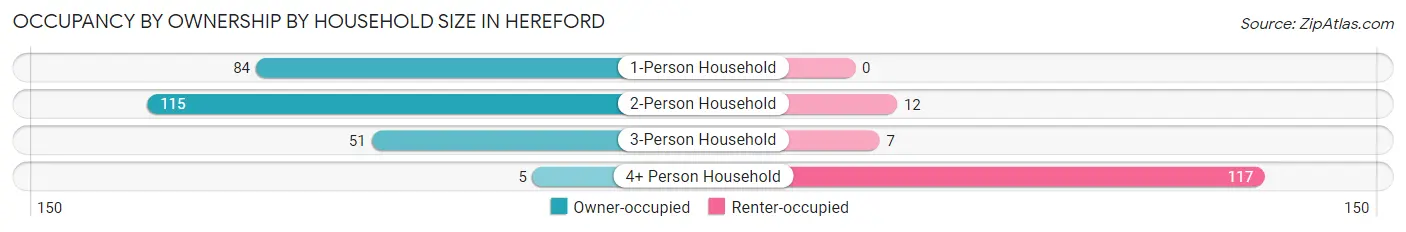
| Household Size | Owner-occupied | Renter-occupied |
| 1-Person Household | 84 (100.0%) | 0 (0.0%) |
| 2-Person Household | 115 (90.5%) | 12 (9.5%) |
| 3-Person Household | 51 (87.9%) | 7 (12.1%) |
| 4+ Person Household | 5 (4.1%) | 117 (95.9%) |
| Total Housing Units | 255 (65.2%) | 136 (34.8%) |
Occupancy by Educational Attainment in Hereford
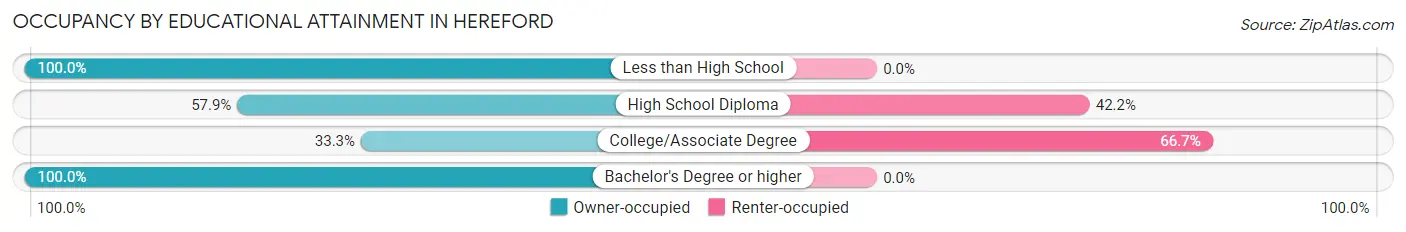
| Household Size | Owner-occupied | Renter-occupied |
| Less than High School | 72 (100.0%) | 0 (0.0%) |
| High School Diploma | 140 (57.9%) | 102 (42.1%) |
| College/Associate Degree | 17 (33.3%) | 34 (66.7%) |
| Bachelor's Degree or higher | 26 (100.0%) | 0 (0.0%) |
Occupancy by Age of Householder in Hereford
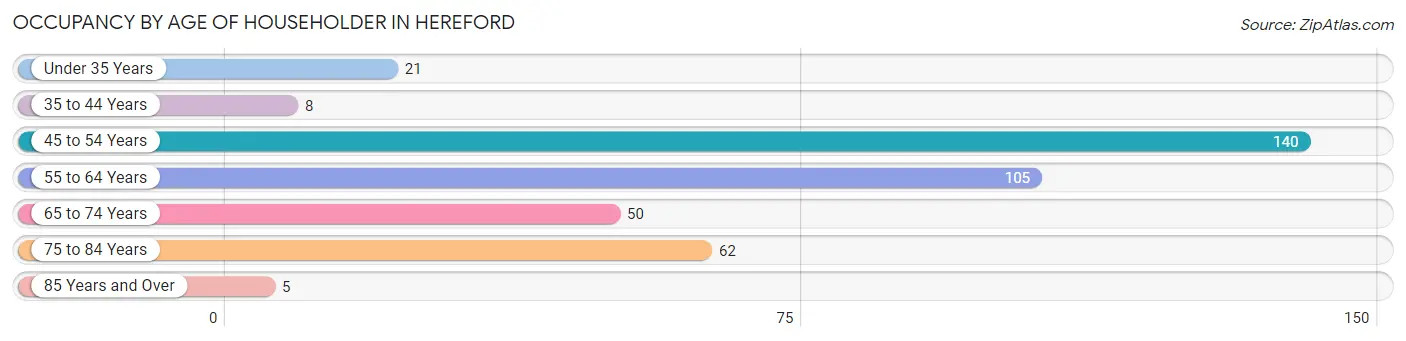
| Age Bracket | # Households | % Households |
| Under 35 Years | 21 | 5.4% |
| 35 to 44 Years | 8 | 2.1% |
| 45 to 54 Years | 140 | 35.8% |
| 55 to 64 Years | 105 | 26.9% |
| 65 to 74 Years | 50 | 12.8% |
| 75 to 84 Years | 62 | 15.9% |
| 85 Years and Over | 5 | 1.3% |
| Total | 391 | 100.0% |
Housing Finances in Hereford
Median Income by Occupancy in Hereford
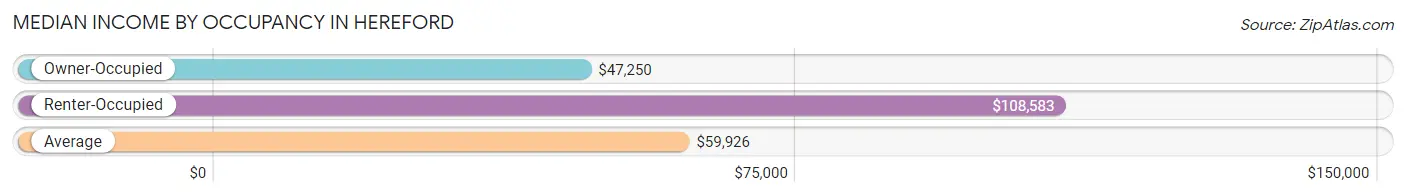
| Occupancy Type | # Households | Median Income |
| Owner-Occupied | 255 (65.2%) | $47,250 |
| Renter-Occupied | 136 (34.8%) | $108,583 |
| Average | 391 (100.0%) | $59,926 |
Occupancy by Householder Income Bracket in Hereford
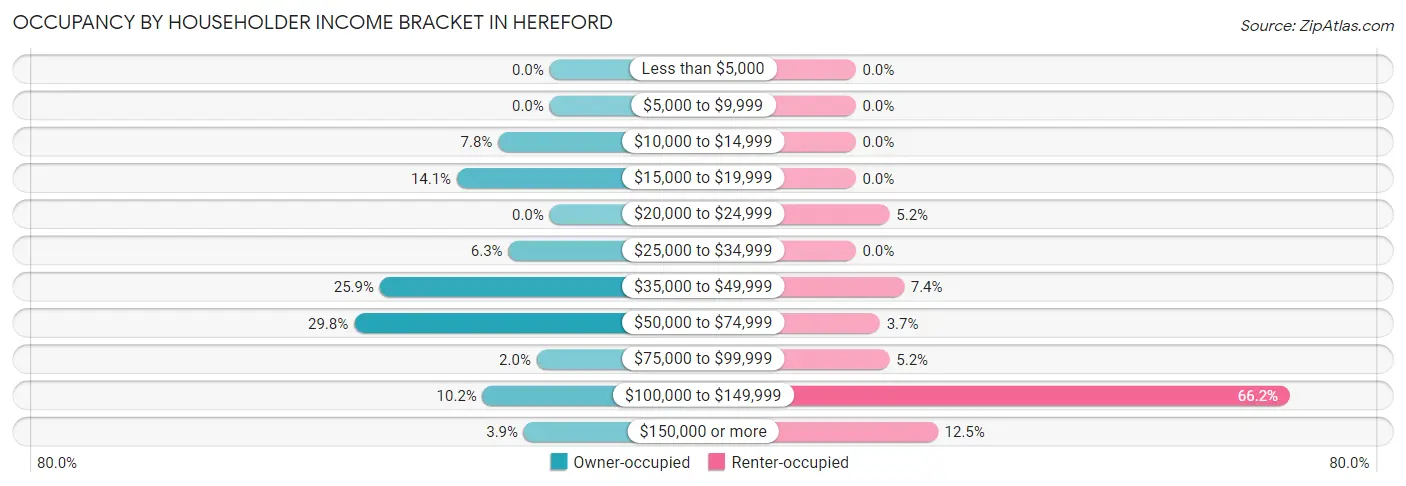
| Income Bracket | Owner-occupied | Renter-occupied |
| Less than $5,000 | 0 (0.0%) | 0 (0.0%) |
| $5,000 to $9,999 | 0 (0.0%) | 0 (0.0%) |
| $10,000 to $14,999 | 20 (7.8%) | 0 (0.0%) |
| $15,000 to $19,999 | 36 (14.1%) | 0 (0.0%) |
| $20,000 to $24,999 | 0 (0.0%) | 7 (5.1%) |
| $25,000 to $34,999 | 16 (6.3%) | 0 (0.0%) |
| $35,000 to $49,999 | 66 (25.9%) | 10 (7.3%) |
| $50,000 to $74,999 | 76 (29.8%) | 5 (3.7%) |
| $75,000 to $99,999 | 5 (2.0%) | 7 (5.1%) |
| $100,000 to $149,999 | 26 (10.2%) | 90 (66.2%) |
| $150,000 or more | 10 (3.9%) | 17 (12.5%) |
| Total | 255 (100.0%) | 136 (100.0%) |
Monthly Housing Cost Tiers in Hereford
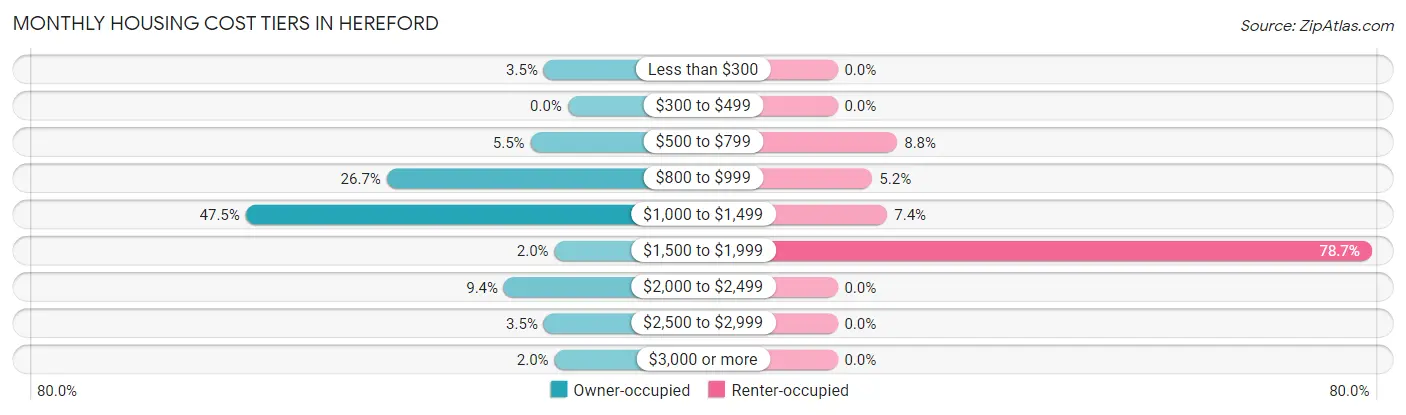
| Monthly Cost | Owner-occupied | Renter-occupied |
| Less than $300 | 9 (3.5%) | 0 (0.0%) |
| $300 to $499 | 0 (0.0%) | 0 (0.0%) |
| $500 to $799 | 14 (5.5%) | 12 (8.8%) |
| $800 to $999 | 68 (26.7%) | 7 (5.1%) |
| $1,000 to $1,499 | 121 (47.4%) | 10 (7.3%) |
| $1,500 to $1,999 | 5 (2.0%) | 107 (78.7%) |
| $2,000 to $2,499 | 24 (9.4%) | 0 (0.0%) |
| $2,500 to $2,999 | 9 (3.5%) | 0 (0.0%) |
| $3,000 or more | 5 (2.0%) | 0 (0.0%) |
| Total | 255 (100.0%) | 136 (100.0%) |
Physical Housing Characteristics in Hereford
Housing Structures in Hereford
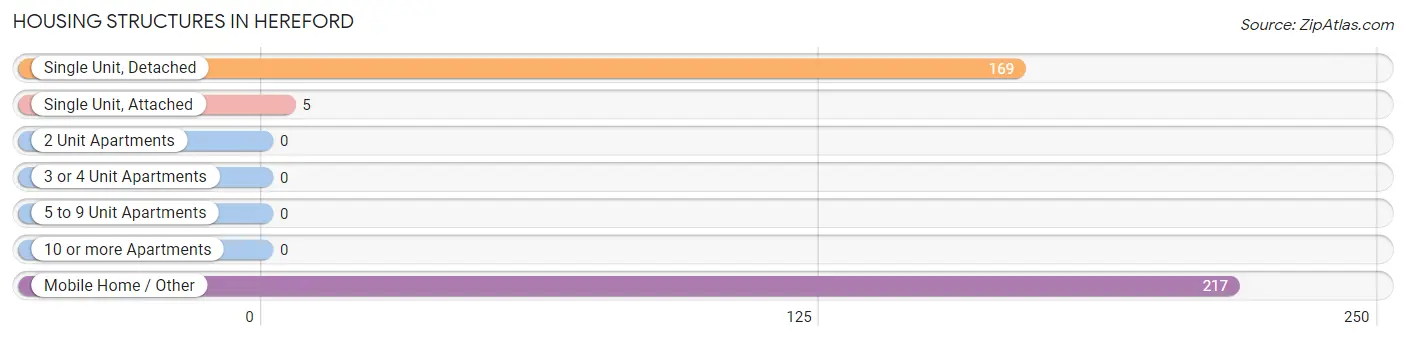
| Structure Type | # Housing Units | % Housing Units |
| Single Unit, Detached | 169 | 43.2% |
| Single Unit, Attached | 5 | 1.3% |
| 2 Unit Apartments | 0 | 0.0% |
| 3 or 4 Unit Apartments | 0 | 0.0% |
| 5 to 9 Unit Apartments | 0 | 0.0% |
| 10 or more Apartments | 0 | 0.0% |
| Mobile Home / Other | 217 | 55.5% |
| Total | 391 | 100.0% |
Housing Structures by Occupancy in Hereford
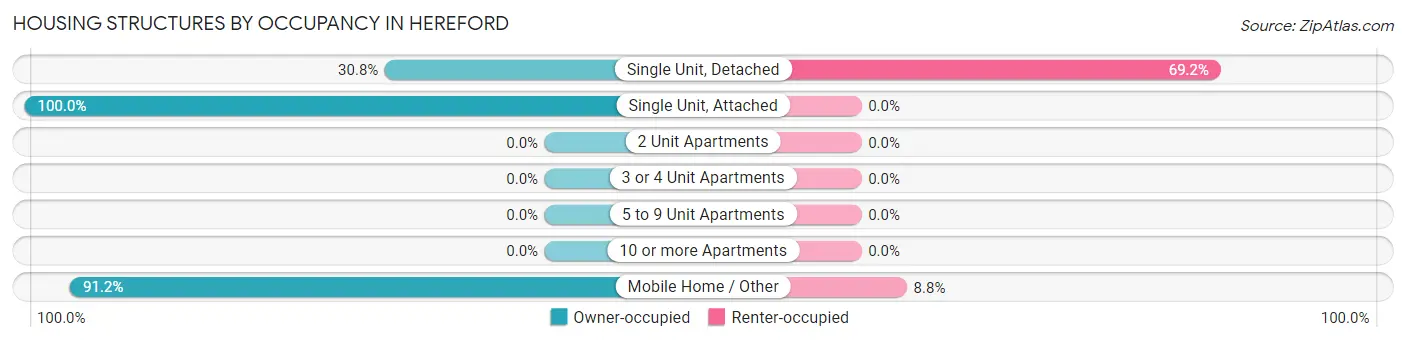
| Structure Type | Owner-occupied | Renter-occupied |
| Single Unit, Detached | 52 (30.8%) | 117 (69.2%) |
| Single Unit, Attached | 5 (100.0%) | 0 (0.0%) |
| 2 Unit Apartments | 0 (0.0%) | 0 (0.0%) |
| 3 or 4 Unit Apartments | 0 (0.0%) | 0 (0.0%) |
| 5 to 9 Unit Apartments | 0 (0.0%) | 0 (0.0%) |
| 10 or more Apartments | 0 (0.0%) | 0 (0.0%) |
| Mobile Home / Other | 198 (91.2%) | 19 (8.8%) |
| Total | 255 (65.2%) | 136 (34.8%) |
Housing Structures by Number of Rooms in Hereford
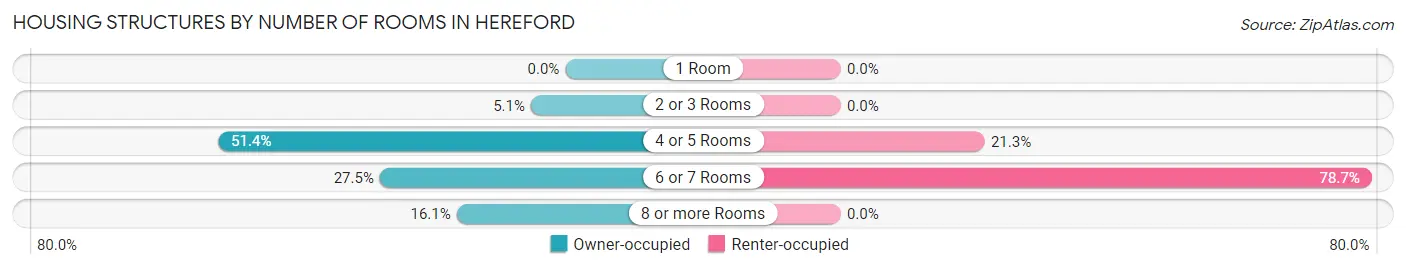
| Number of Rooms | Owner-occupied | Renter-occupied |
| 1 Room | 0 (0.0%) | 0 (0.0%) |
| 2 or 3 Rooms | 13 (5.1%) | 0 (0.0%) |
| 4 or 5 Rooms | 131 (51.4%) | 29 (21.3%) |
| 6 or 7 Rooms | 70 (27.5%) | 107 (78.7%) |
| 8 or more Rooms | 41 (16.1%) | 0 (0.0%) |
| Total | 255 (100.0%) | 136 (100.0%) |
Housing Structure by Heating Type in Hereford
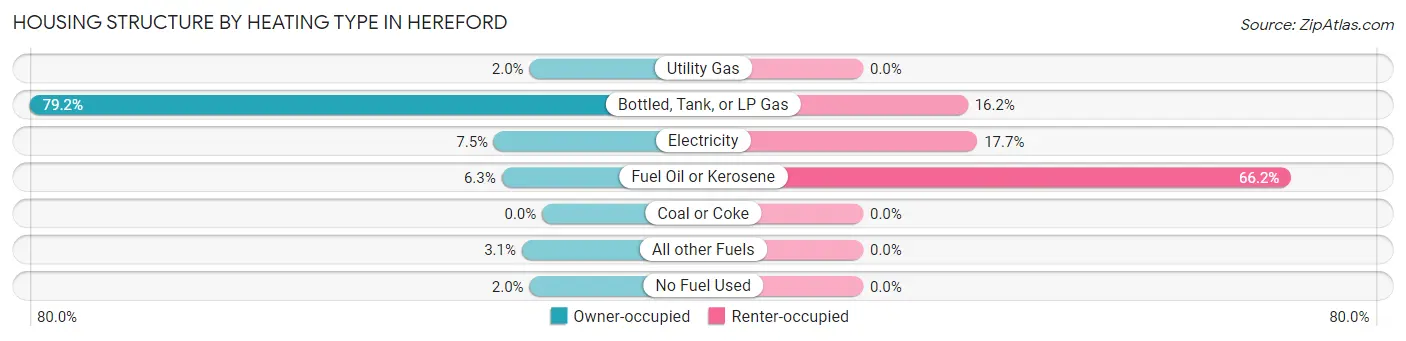
| Heating Type | Owner-occupied | Renter-occupied |
| Utility Gas | 5 (2.0%) | 0 (0.0%) |
| Bottled, Tank, or LP Gas | 202 (79.2%) | 22 (16.2%) |
| Electricity | 19 (7.4%) | 24 (17.6%) |
| Fuel Oil or Kerosene | 16 (6.3%) | 90 (66.2%) |
| Coal or Coke | 0 (0.0%) | 0 (0.0%) |
| All other Fuels | 8 (3.1%) | 0 (0.0%) |
| No Fuel Used | 5 (2.0%) | 0 (0.0%) |
| Total | 255 (100.0%) | 136 (100.0%) |
Household Vehicle Usage in Hereford
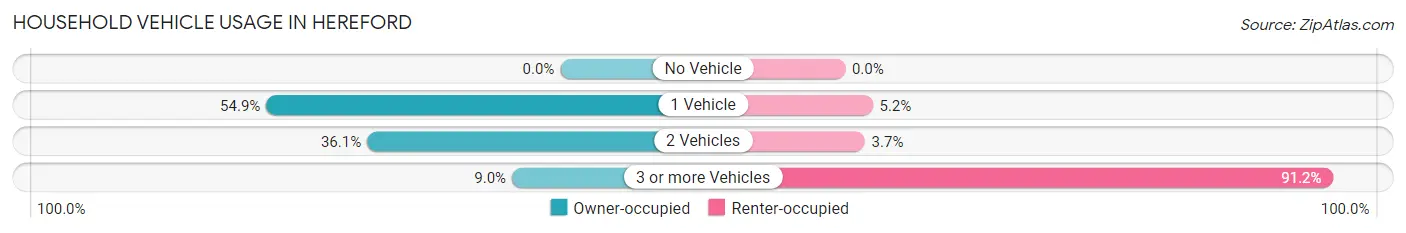
| Vehicles per Household | Owner-occupied | Renter-occupied |
| No Vehicle | 0 (0.0%) | 0 (0.0%) |
| 1 Vehicle | 140 (54.9%) | 7 (5.1%) |
| 2 Vehicles | 92 (36.1%) | 5 (3.7%) |
| 3 or more Vehicles | 23 (9.0%) | 124 (91.2%) |
| Total | 255 (100.0%) | 136 (100.0%) |
Real Estate & Mortgages in Hereford
Real Estate and Mortgage Overview in Hereford
| Characteristic | Without Mortgage | With Mortgage |
| Housing Units | 168 | 87 |
| Median Property Value | $27,900 | $0 |
| Median Household Income | $36,371 | $5 |
| Monthly Housing Costs | $1,005 | $5 |
| Real Estate Taxes | $513 | $0 |
Property Value by Mortgage Status in Hereford
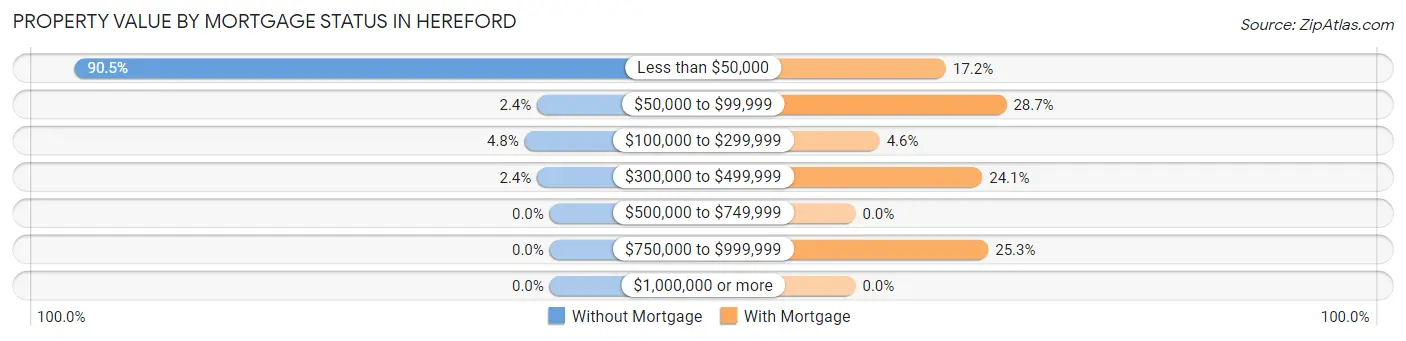
| Property Value | Without Mortgage | With Mortgage |
| Less than $50,000 | 152 (90.5%) | 15 (17.2%) |
| $50,000 to $99,999 | 4 (2.4%) | 25 (28.7%) |
| $100,000 to $299,999 | 8 (4.8%) | 4 (4.6%) |
| $300,000 to $499,999 | 4 (2.4%) | 21 (24.1%) |
| $500,000 to $749,999 | 0 (0.0%) | 0 (0.0%) |
| $750,000 to $999,999 | 0 (0.0%) | 22 (25.3%) |
| $1,000,000 or more | 0 (0.0%) | 0 (0.0%) |
| Total | 168 (100.0%) | 87 (100.0%) |
Household Income by Mortgage Status in Hereford
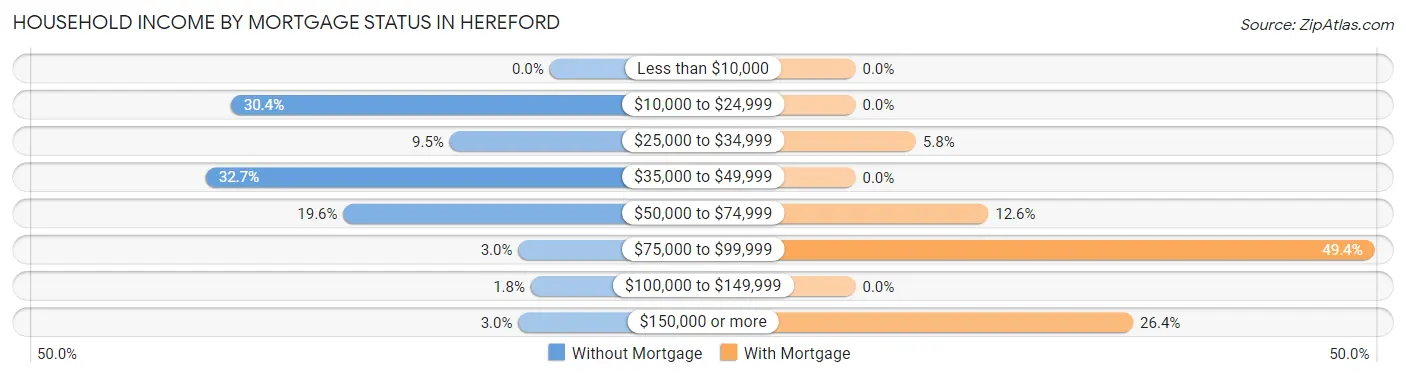
| Household Income | Without Mortgage | With Mortgage |
| Less than $10,000 | 0 (0.0%) | 0 (0.0%) |
| $10,000 to $24,999 | 51 (30.4%) | 0 (0.0%) |
| $25,000 to $34,999 | 16 (9.5%) | 5 (5.8%) |
| $35,000 to $49,999 | 55 (32.7%) | 0 (0.0%) |
| $50,000 to $74,999 | 33 (19.6%) | 11 (12.6%) |
| $75,000 to $99,999 | 5 (3.0%) | 43 (49.4%) |
| $100,000 to $149,999 | 3 (1.8%) | 0 (0.0%) |
| $150,000 or more | 5 (3.0%) | 23 (26.4%) |
| Total | 168 (100.0%) | 87 (100.0%) |
Property Value to Household Income Ratio in Hereford
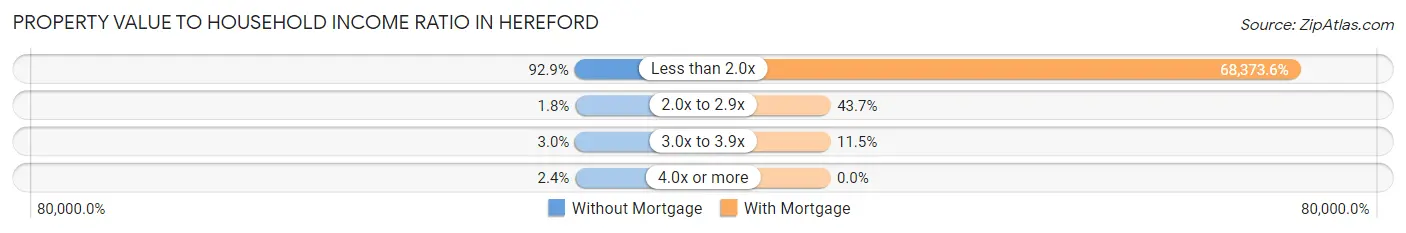
| Value-to-Income Ratio | Without Mortgage | With Mortgage |
| Less than 2.0x | 156 (92.9%) | 59,485 (68,373.6%) |
| 2.0x to 2.9x | 3 (1.8%) | 38 (43.7%) |
| 3.0x to 3.9x | 5 (3.0%) | 10 (11.5%) |
| 4.0x or more | 4 (2.4%) | 0 (0.0%) |
| Total | 168 (100.0%) | 87 (100.0%) |
Real Estate Taxes by Mortgage Status in Hereford
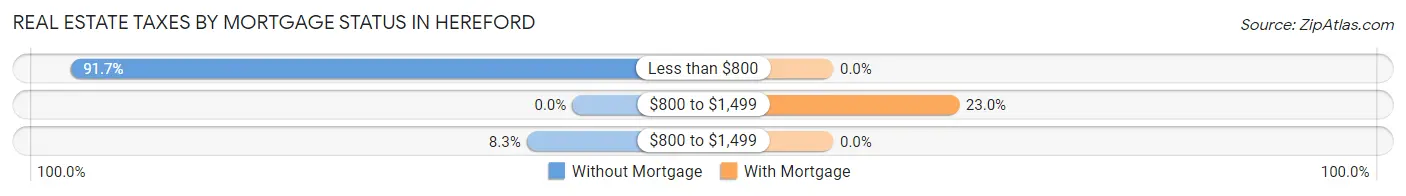
| Property Taxes | Without Mortgage | With Mortgage |
| Less than $800 | 154 (91.7%) | 0 (0.0%) |
| $800 to $1,499 | 0 (0.0%) | 20 (23.0%) |
| $800 to $1,499 | 14 (8.3%) | 0 (0.0%) |
| Total | 168 (100.0%) | 87 (100.0%) |
Health & Disability in Hereford
Health Insurance Coverage by Age in Hereford
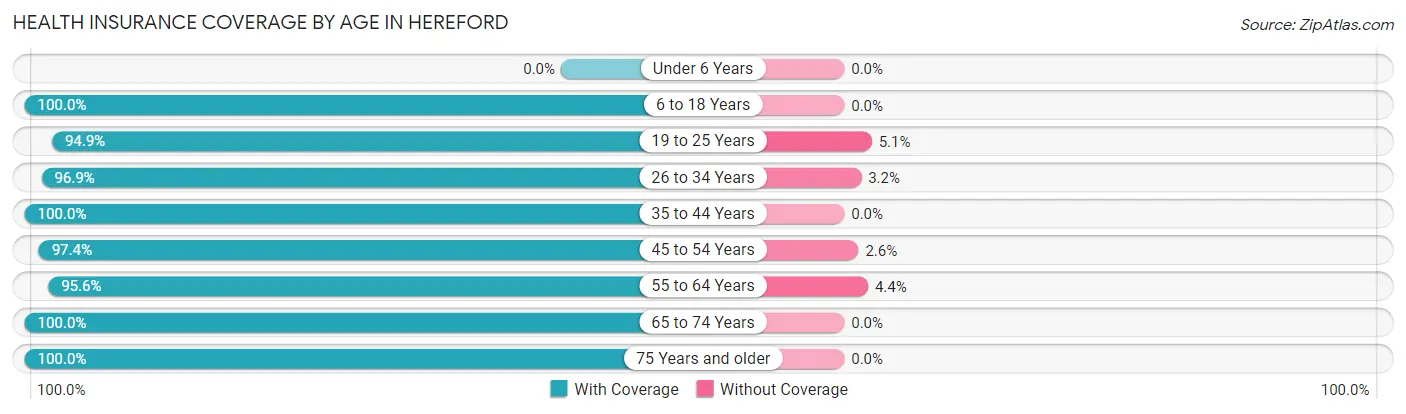
| Age Bracket | With Coverage | Without Coverage |
| Under 6 Years | 0 (0.0%) | 0 (0.0%) |
| 6 to 18 Years | 356 (100.0%) | 0 (0.0%) |
| 19 to 25 Years | 297 (94.9%) | 16 (5.1%) |
| 26 to 34 Years | 215 (96.9%) | 7 (3.2%) |
| 35 to 44 Years | 112 (100.0%) | 0 (0.0%) |
| 45 to 54 Years | 221 (97.4%) | 6 (2.6%) |
| 55 to 64 Years | 130 (95.6%) | 6 (4.4%) |
| 65 to 74 Years | 77 (100.0%) | 0 (0.0%) |
| 75 Years and older | 106 (100.0%) | 0 (0.0%) |
| Total | 1,514 (97.7%) | 35 (2.3%) |
Health Insurance Coverage by Citizenship Status in Hereford
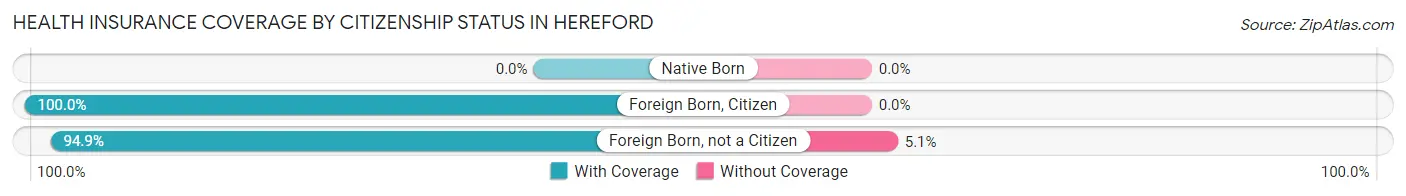
| Citizenship Status | With Coverage | Without Coverage |
| Native Born | 0 (0.0%) | 0 (0.0%) |
| Foreign Born, Citizen | 356 (100.0%) | 0 (0.0%) |
| Foreign Born, not a Citizen | 297 (94.9%) | 16 (5.1%) |
Health Insurance Coverage by Household Income in Hereford
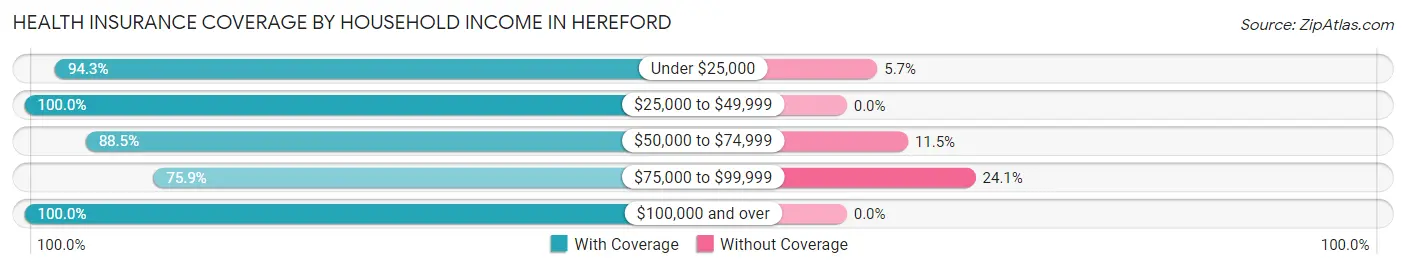
| Household Income | With Coverage | Without Coverage |
| Under $25,000 | 99 (94.3%) | 6 (5.7%) |
| $25,000 to $49,999 | 192 (100.0%) | 0 (0.0%) |
| $50,000 to $74,999 | 170 (88.5%) | 22 (11.5%) |
| $75,000 to $99,999 | 22 (75.9%) | 7 (24.1%) |
| $100,000 and over | 1,031 (100.0%) | 0 (0.0%) |
Public vs Private Health Insurance Coverage by Age in Hereford
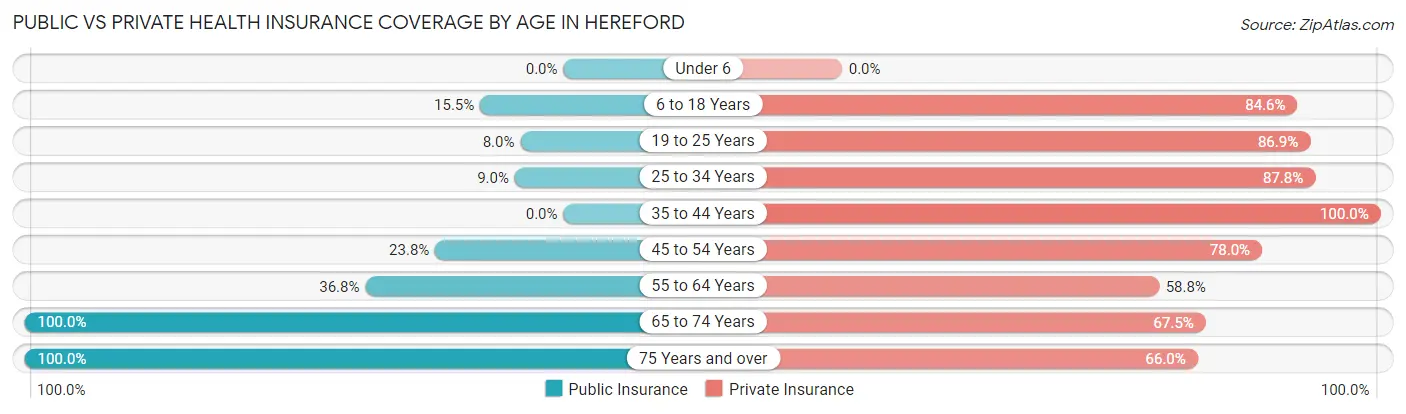
| Age Bracket | Public Insurance | Private Insurance |
| Under 6 | 0 (0.0%) | 0 (0.0%) |
| 6 to 18 Years | 55 (15.4%) | 301 (84.6%) |
| 19 to 25 Years | 25 (8.0%) | 272 (86.9%) |
| 25 to 34 Years | 20 (9.0%) | 195 (87.8%) |
| 35 to 44 Years | 0 (0.0%) | 112 (100.0%) |
| 45 to 54 Years | 54 (23.8%) | 177 (78.0%) |
| 55 to 64 Years | 50 (36.8%) | 80 (58.8%) |
| 65 to 74 Years | 77 (100.0%) | 52 (67.5%) |
| 75 Years and over | 106 (100.0%) | 70 (66.0%) |
| Total | 387 (25.0%) | 1,259 (81.3%) |
Disability Status by Sex by Age in Hereford
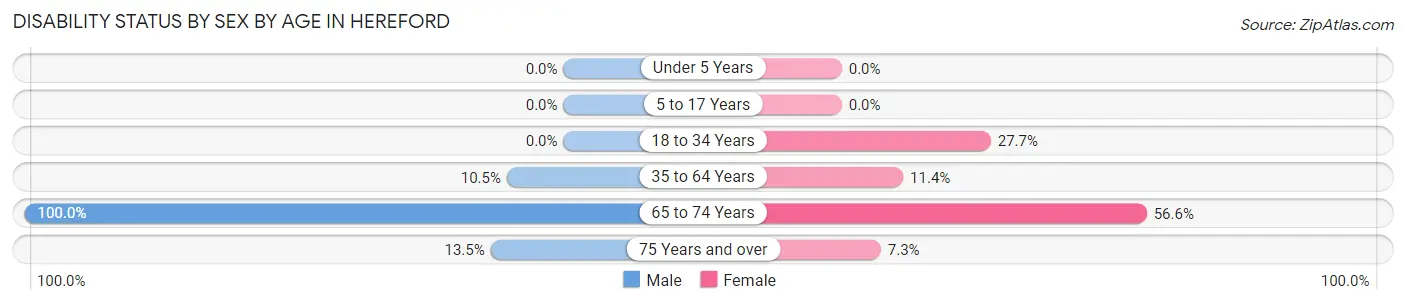
| Age Bracket | Male | Female |
| Under 5 Years | 0 (0.0%) | 0 (0.0%) |
| 5 to 17 Years | 0 (0.0%) | 0 (0.0%) |
| 18 to 34 Years | 0 (0.0%) | 13 (27.7%) |
| 35 to 64 Years | 25 (10.5%) | 27 (11.4%) |
| 65 to 74 Years | 24 (100.0%) | 30 (56.6%) |
| 75 Years and over | 5 (13.5%) | 5 (7.2%) |
Disability Class by Sex by Age in Hereford
Disability Class: Hearing Difficulty
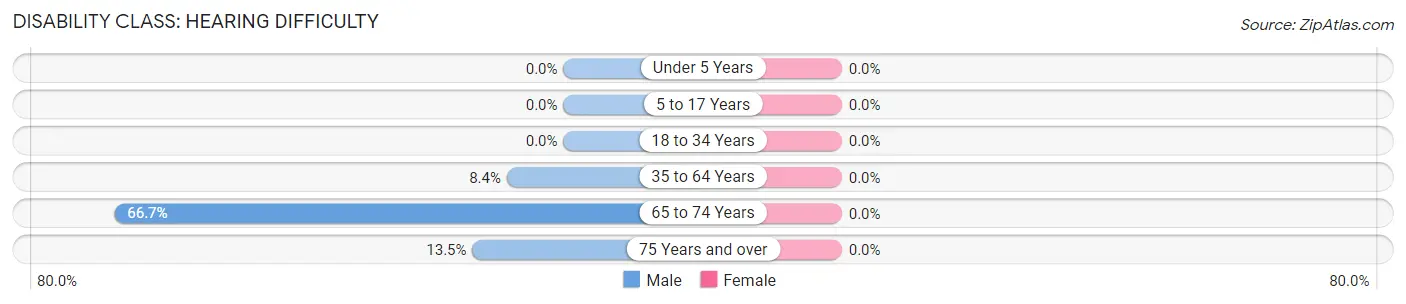
| Age Bracket | Male | Female |
| Under 5 Years | 0 (0.0%) | 0 (0.0%) |
| 5 to 17 Years | 0 (0.0%) | 0 (0.0%) |
| 18 to 34 Years | 0 (0.0%) | 0 (0.0%) |
| 35 to 64 Years | 20 (8.4%) | 0 (0.0%) |
| 65 to 74 Years | 16 (66.7%) | 0 (0.0%) |
| 75 Years and over | 5 (13.5%) | 0 (0.0%) |
Disability Class: Vision Difficulty
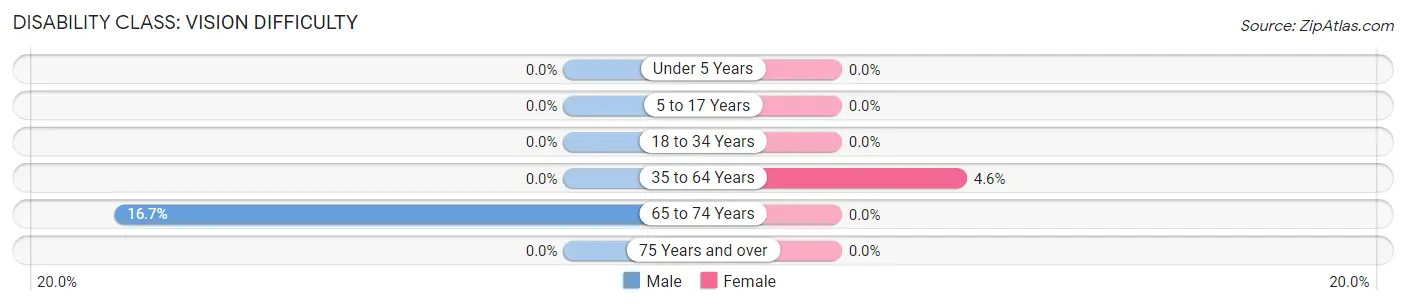
| Age Bracket | Male | Female |
| Under 5 Years | 0 (0.0%) | 0 (0.0%) |
| 5 to 17 Years | 0 (0.0%) | 0 (0.0%) |
| 18 to 34 Years | 0 (0.0%) | 0 (0.0%) |
| 35 to 64 Years | 0 (0.0%) | 11 (4.6%) |
| 65 to 74 Years | 4 (16.7%) | 0 (0.0%) |
| 75 Years and over | 0 (0.0%) | 0 (0.0%) |
Disability Class: Cognitive Difficulty
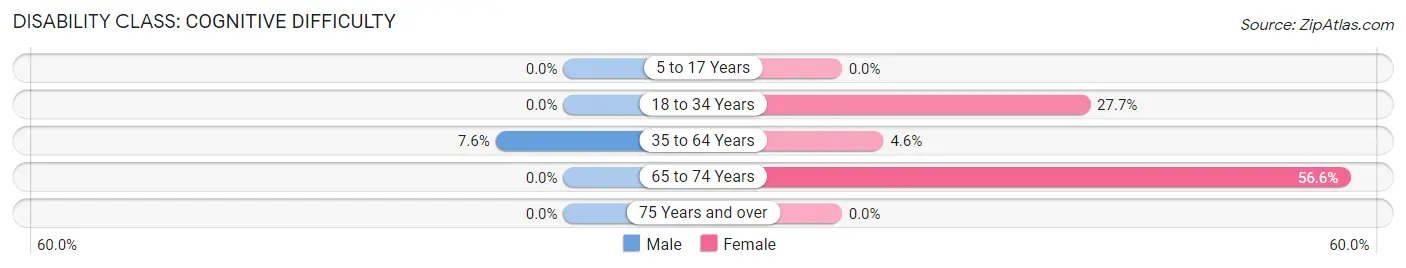
| Age Bracket | Male | Female |
| 5 to 17 Years | 0 (0.0%) | 0 (0.0%) |
| 18 to 34 Years | 0 (0.0%) | 13 (27.7%) |
| 35 to 64 Years | 18 (7.6%) | 11 (4.6%) |
| 65 to 74 Years | 0 (0.0%) | 30 (56.6%) |
| 75 Years and over | 0 (0.0%) | 0 (0.0%) |
Disability Class: Ambulatory Difficulty
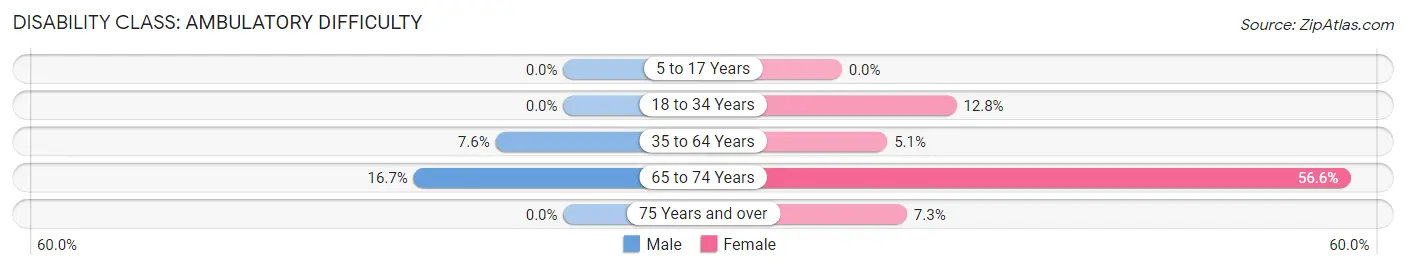
| Age Bracket | Male | Female |
| 5 to 17 Years | 0 (0.0%) | 0 (0.0%) |
| 18 to 34 Years | 0 (0.0%) | 6 (12.8%) |
| 35 to 64 Years | 18 (7.6%) | 12 (5.1%) |
| 65 to 74 Years | 4 (16.7%) | 30 (56.6%) |
| 75 Years and over | 0 (0.0%) | 5 (7.2%) |
Disability Class: Self-Care Difficulty
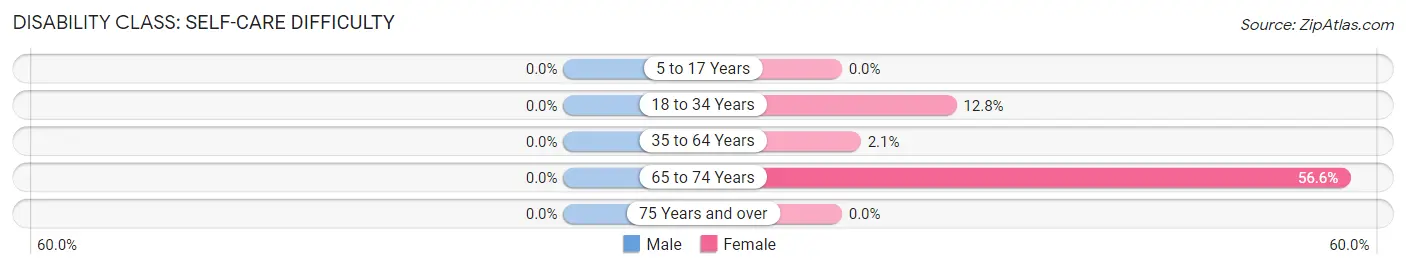
| Age Bracket | Male | Female |
| 5 to 17 Years | 0 (0.0%) | 0 (0.0%) |
| 18 to 34 Years | 0 (0.0%) | 6 (12.8%) |
| 35 to 64 Years | 0 (0.0%) | 5 (2.1%) |
| 65 to 74 Years | 0 (0.0%) | 30 (56.6%) |
| 75 Years and over | 0 (0.0%) | 0 (0.0%) |
Technology Access in Hereford
Computing Device Access in Hereford
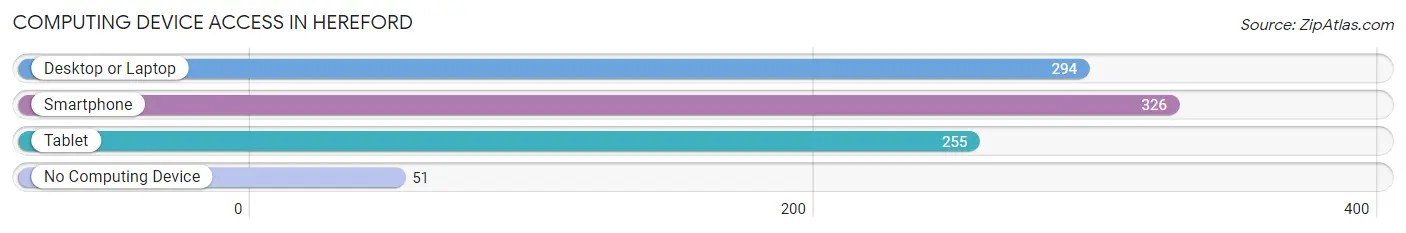
| Device Type | # Households | % Households |
| Desktop or Laptop | 294 | 75.2% |
| Smartphone | 326 | 83.4% |
| Tablet | 255 | 65.2% |
| No Computing Device | 51 | 13.0% |
| Total | 391 | 100.0% |
Internet Access in Hereford
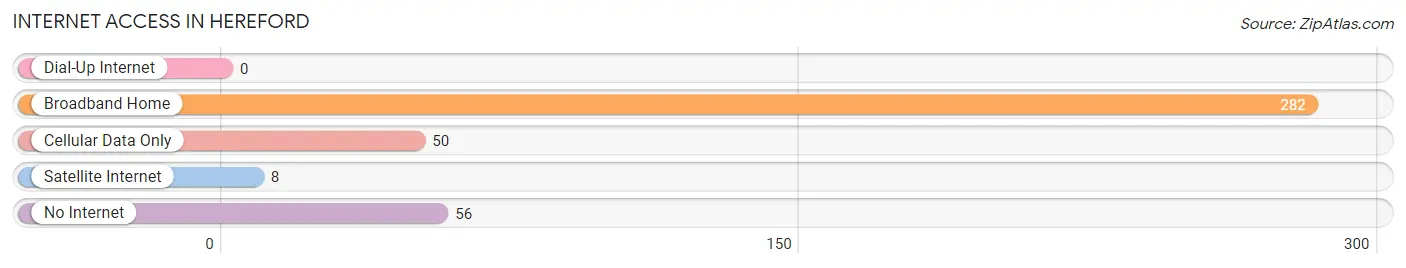
| Internet Type | # Households | % Households |
| Dial-Up Internet | 0 | 0.0% |
| Broadband Home | 282 | 72.1% |
| Cellular Data Only | 50 | 12.8% |
| Satellite Internet | 8 | 2.1% |
| No Internet | 56 | 14.3% |
| Total | 391 | 100.0% |
Hereford Summary
History
The small town of Hereford, Pennsylvania is located in Berks County, about an hour northwest of Philadelphia. The area was first settled in 1723 by German immigrants, and the town was officially established in 1741. The town was named after Herefordshire, England, and was originally part of the Oley Township.
In the early 19th century, Hereford was a thriving agricultural community, with many farms and mills. The town was also home to a number of small businesses, including a tannery, a blacksmith, a wagon maker, and a general store.
The town experienced a period of growth in the late 19th century, when the Reading Railroad was built through the area. This allowed for the transportation of goods and people, and the town began to grow.
In the early 20th century, Hereford was a popular tourist destination, with many people coming to the area to enjoy the natural beauty of the area. The town was also home to a number of summer resorts, which attracted visitors from all over the country.
In the 1950s, the town began to decline, as many of the businesses and industries in the area closed. The town was also affected by the decline of the railroad industry, as the Reading Railroad ceased operations in the area.
Geography
Hereford is located in Berks County, Pennsylvania, about an hour northwest of Philadelphia. The town is situated in the Schuylkill Valley, and is surrounded by rolling hills and farmland. The town is located on the banks of the Schuylkill River, and is home to several small lakes and streams.
The town is located in a temperate climate, with hot summers and cold winters. The average temperature in the summer is around 75 degrees Fahrenheit, and the average temperature in the winter is around 35 degrees Fahrenheit.
Economy
Hereford is a small town, and the economy is largely based on agriculture and tourism. The town is home to several small farms, which produce a variety of crops, including corn, soybeans, and hay. The town is also home to several small businesses, including a general store, a hardware store, and a few restaurants.
The town is also home to a number of tourist attractions, including the Hereford Heritage Museum, the Hereford Covered Bridge, and the Hereford Nature Center. These attractions draw visitors from all over the region, and help to support the local economy.
Demographics
As of the 2010 census, the population of Hereford was 1,845. The town is predominantly white, with 92.3% of the population identifying as white. The town is also home to a small Hispanic population, with 4.2% of the population identifying as Hispanic or Latino.
The median household income in Hereford is $50,972, and the median home value is $179,400. The town has a low unemployment rate, with only 4.2% of the population unemployed. The town also has a low poverty rate, with only 8.2% of the population living below the poverty line.
Common Questions
What is Per Capita Income in Hereford?
Per Capita income in Hereford is $19,248.
What is the Median Family Income in Hereford?
Median Family Income in Hereford is $90,042.
What is the Median Household income in Hereford?
Median Household Income in Hereford is $59,926.
What is Income or Wage Gap in Hereford?
Income or Wage Gap in Hereford is 56.3%.
Women in Hereford earn 43.7 cents for every dollar earned by a man.
What is Inequality or Gini Index in Hereford?
Inequality or Gini Index in Hereford is 0.34.
What is the Total Population of Hereford?
Total Population of Hereford is 1,549.
What is the Total Male Population of Hereford?
Total Male Population of Hereford is 974.
What is the Total Female Population of Hereford?
Total Female Population of Hereford is 575.
What is the Ratio of Males per 100 Females in Hereford?
There are 169.39 Males per 100 Females in Hereford.
What is the Ratio of Females per 100 Males in Hereford?
There are 59.03 Females per 100 Males in Hereford.
What is the Median Population Age in Hereford?
Median Population Age in Hereford is 27.5 Years.
What is the Average Family Size in Hereford
Average Family Size in Hereford is 4.5 People.
What is the Average Household Size in Hereford
Average Household Size in Hereford is 4.0 People.
How Large is the Labor Force in Hereford?
There are 774 People in the Labor Forcein in Hereford.
What is the Percentage of People in the Labor Force in Hereford?
58.0% of People are in the Labor Force in Hereford.
What is the Unemployment Rate in Hereford?
Unemployment Rate in Hereford is 2.5%.