Heilwood, PA Map & Demographics
Heilwood Map
Heilwood Overview
$33,488
PER CAPITA INCOME
$94,423
AVG FAMILY INCOME
0.44
INEQUALITY / GINI INDEX
234
TOTAL POPULATION
75
MALE POPULATION
159
FEMALE POPULATION
47.17
MALES / 100 FEMALES
212.00
FEMALES / 100 MALES
49.5
MEDIAN AGE
2.8
AVG FAMILY SIZE
2.1
AVG HOUSEHOLD SIZE
114
LABOR FORCE [ PEOPLE ]
56.7%
PERCENT IN LABOR FORCE
4.4%
UNEMPLOYMENT RATE
Heilwood Zip Codes
Heilwood Area Codes
Income in Heilwood
Income Overview in Heilwood
| Characteristic | Number | Measure |
| Per Capita Income | 234 | $33,488 |
| Median Family Income | 70 | $94,423 |
| Mean Family Income | 70 | $98,906 |
| Median Household Income | 110 | $0 |
| Mean Household Income | 110 | $69,893 |
| Income Deficit | 70 | $0 |
| Wage / Income Gap (%) | 234 | 0.00% |
| Wage / Income Gap ($) | 234 | 100.00¢ per $1 |
| Gini / Inequality Index | 234 | 0.44 |
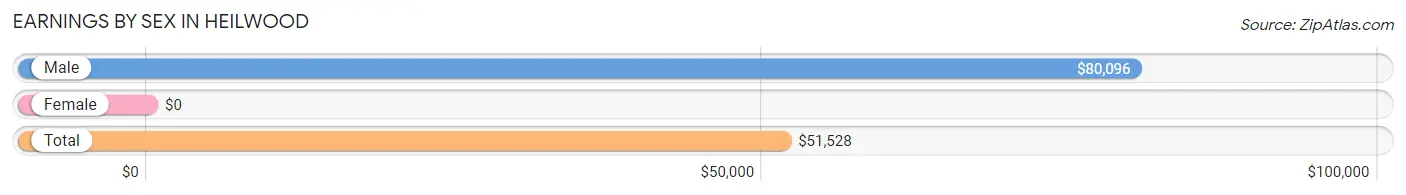
Earnings by Sex in Heilwood
| Sex | Number | Average Earnings |
| Male | 57 (48.7%) | $80,096 |
| Female | 60 (51.3%) | $0 |
| Total | 117 (100.0%) | $51,528 |
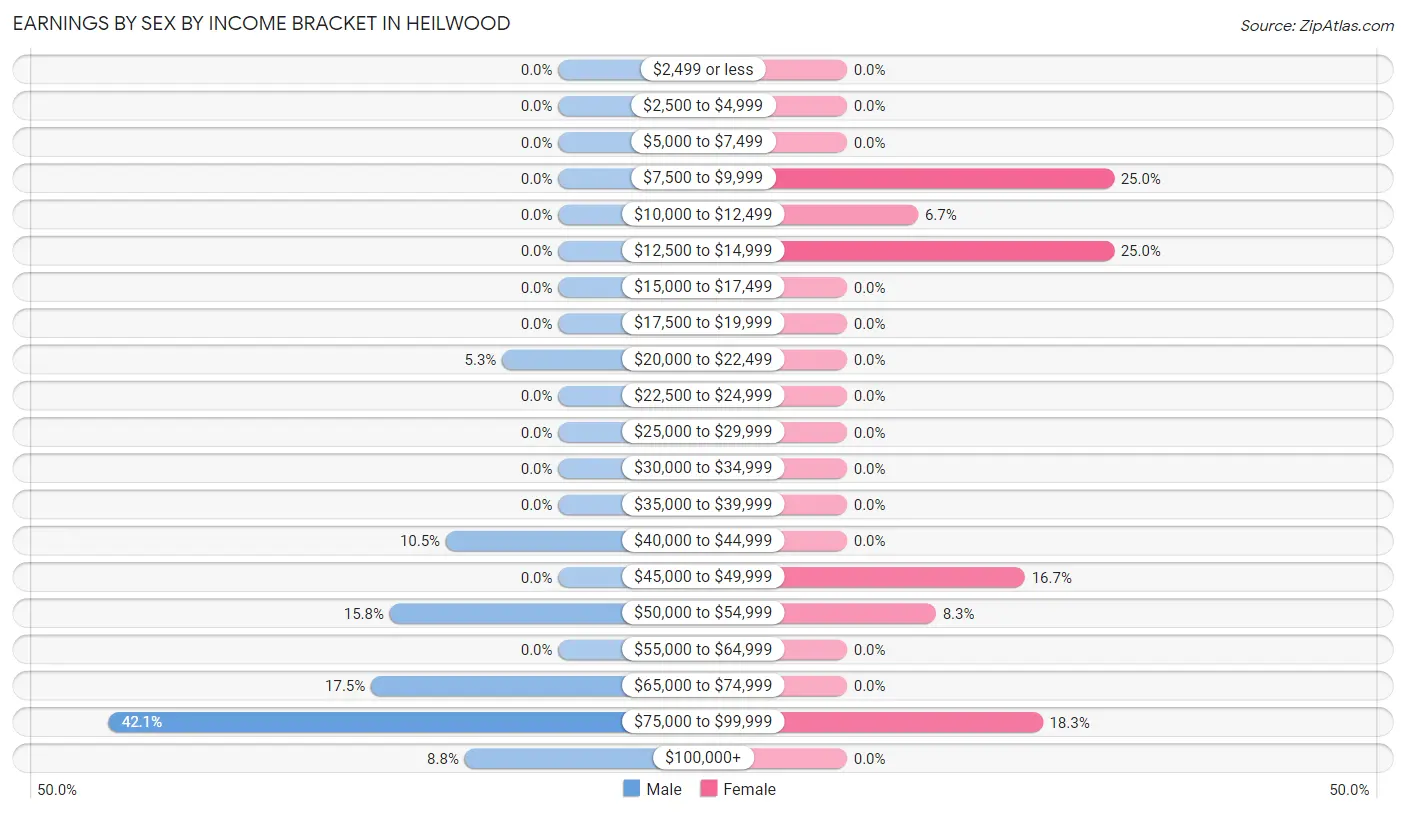
Earnings by Sex by Income Bracket in Heilwood
The most common earnings brackets in Heilwood are $75,000 to $99,999 for men (24 | 42.1%) and $7,500 to $9,999 for women (15 | 25.0%).
| Income | Male | Female |
| $2,499 or less | 0 (0.0%) | 0 (0.0%) |
| $2,500 to $4,999 | 0 (0.0%) | 0 (0.0%) |
| $5,000 to $7,499 | 0 (0.0%) | 0 (0.0%) |
| $7,500 to $9,999 | 0 (0.0%) | 15 (25.0%) |
| $10,000 to $12,499 | 0 (0.0%) | 4 (6.7%) |
| $12,500 to $14,999 | 0 (0.0%) | 15 (25.0%) |
| $15,000 to $17,499 | 0 (0.0%) | 0 (0.0%) |
| $17,500 to $19,999 | 0 (0.0%) | 0 (0.0%) |
| $20,000 to $22,499 | 3 (5.3%) | 0 (0.0%) |
| $22,500 to $24,999 | 0 (0.0%) | 0 (0.0%) |
| $25,000 to $29,999 | 0 (0.0%) | 0 (0.0%) |
| $30,000 to $34,999 | 0 (0.0%) | 0 (0.0%) |
| $35,000 to $39,999 | 0 (0.0%) | 0 (0.0%) |
| $40,000 to $44,999 | 6 (10.5%) | 0 (0.0%) |
| $45,000 to $49,999 | 0 (0.0%) | 10 (16.7%) |
| $50,000 to $54,999 | 9 (15.8%) | 5 (8.3%) |
| $55,000 to $64,999 | 0 (0.0%) | 0 (0.0%) |
| $65,000 to $74,999 | 10 (17.5%) | 0 (0.0%) |
| $75,000 to $99,999 | 24 (42.1%) | 11 (18.3%) |
| $100,000+ | 5 (8.8%) | 0 (0.0%) |
| Total | 57 (100.0%) | 60 (100.0%) |
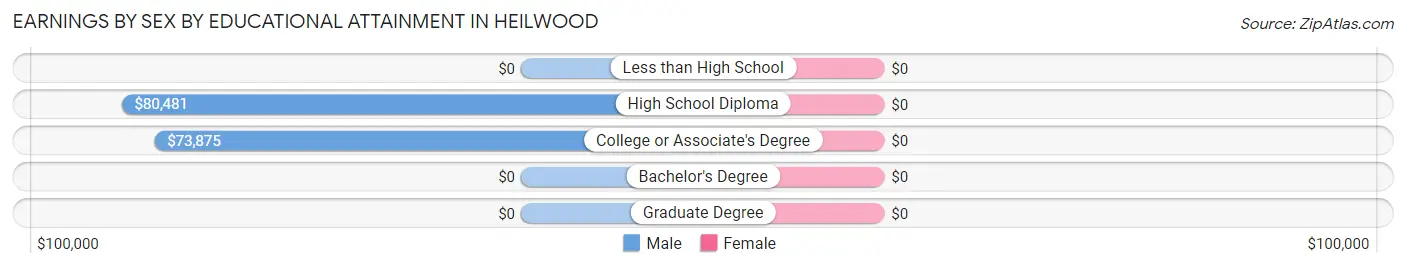
Earnings by Sex by Educational Attainment in Heilwood
| Educational Attainment | Male Income | Female Income |
| Less than High School | - | - |
| High School Diploma | $80,481 | $0 |
| College or Associate's Degree | $73,875 | $0 |
| Bachelor's Degree | - | - |
| Graduate Degree | - | - |
| Total | $80,096 | $0 |
Family Income in Heilwood
Family Income Brackets in Heilwood
According to the Heilwood family income data, there are 23 families falling into the $100,000 to $149,999 income range, which is the most common income bracket and makes up 32.9% of all families.
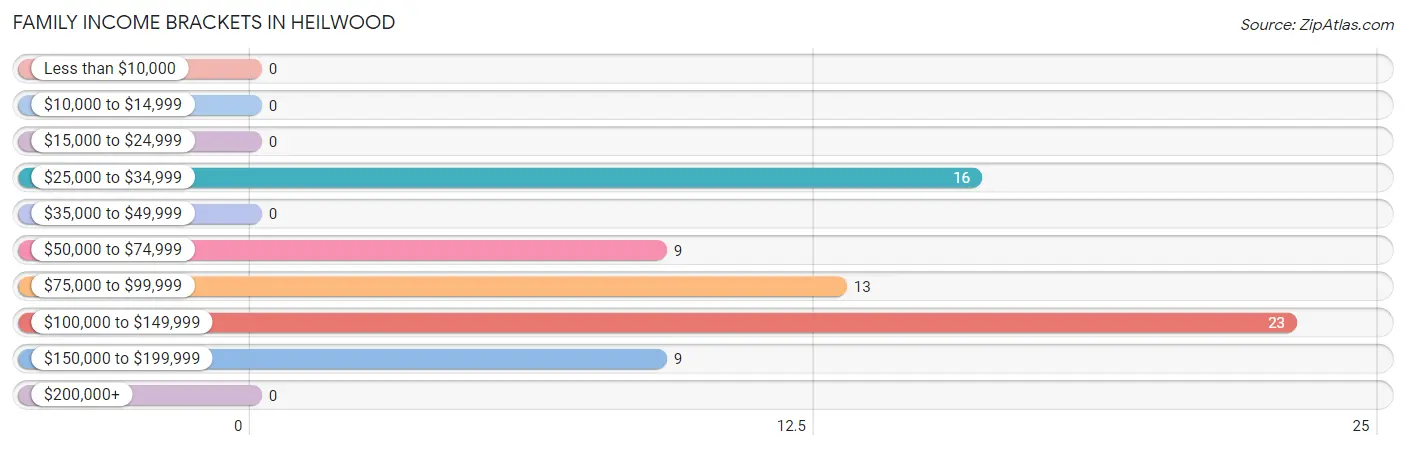
| Income Bracket | # Families | % Families |
| Less than $10,000 | 0 | 0.0% |
| $10,000 to $14,999 | 0 | 0.0% |
| $15,000 to $24,999 | 0 | 0.0% |
| $25,000 to $34,999 | 16 | 22.9% |
| $35,000 to $49,999 | 0 | 0.0% |
| $50,000 to $74,999 | 9 | 12.9% |
| $75,000 to $99,999 | 13 | 18.6% |
| $100,000 to $149,999 | 23 | 32.9% |
| $150,000 to $199,999 | 9 | 12.9% |
| $200,000+ | 0 | 0.0% |
Family Income by Famaliy Size in Heilwood
3-person families (30 | 42.9%) account for the highest median family income in Heilwood with $143,500 per family, while 3-person families (30 | 42.9%) have the highest median income of $47,833 per family member.
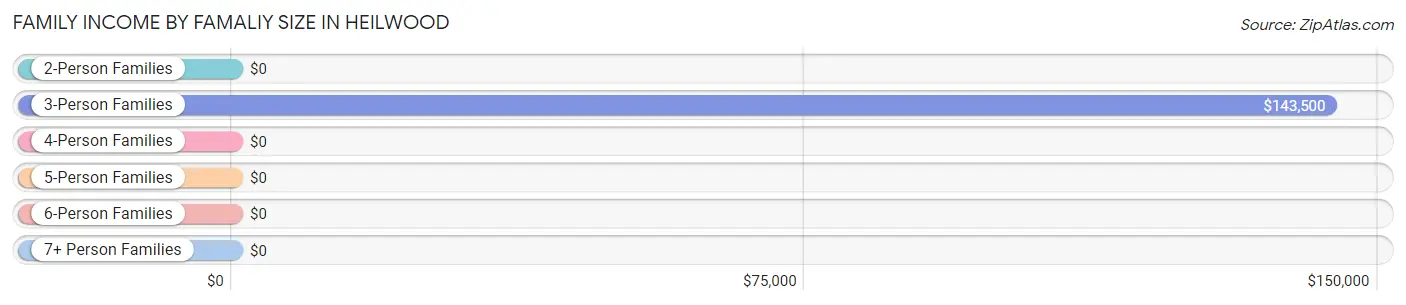
| Income Bracket | # Families | Median Income |
| 2-Person Families | 34 (48.6%) | $0 |
| 3-Person Families | 30 (42.9%) | $143,500 |
| 4-Person Families | 6 (8.6%) | $0 |
| 5-Person Families | 0 (0.0%) | $0 |
| 6-Person Families | 0 (0.0%) | $0 |
| 7+ Person Families | 0 (0.0%) | $0 |
| Total | 70 (100.0%) | $94,423 |
Family Income by Number of Earners in Heilwood
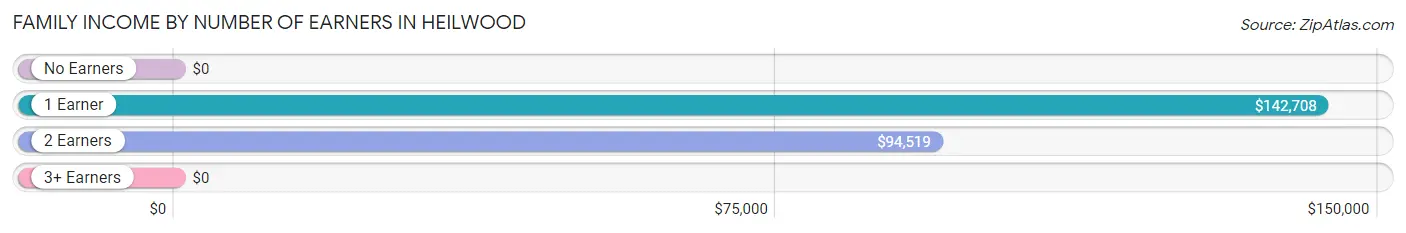
| Number of Earners | # Families | Median Income |
| No Earners | 16 (22.9%) | $0 |
| 1 Earner | 11 (15.7%) | $142,708 |
| 2 Earners | 33 (47.1%) | $94,519 |
| 3+ Earners | 10 (14.3%) | $0 |
| Total | 70 (100.0%) | $94,423 |
Household Income in Heilwood
Household Income Brackets in Heilwood
With 23 households falling in the category, the $100,000 to $149,999 income range is the most frequent in Heilwood, accounting for 20.9% of all households.
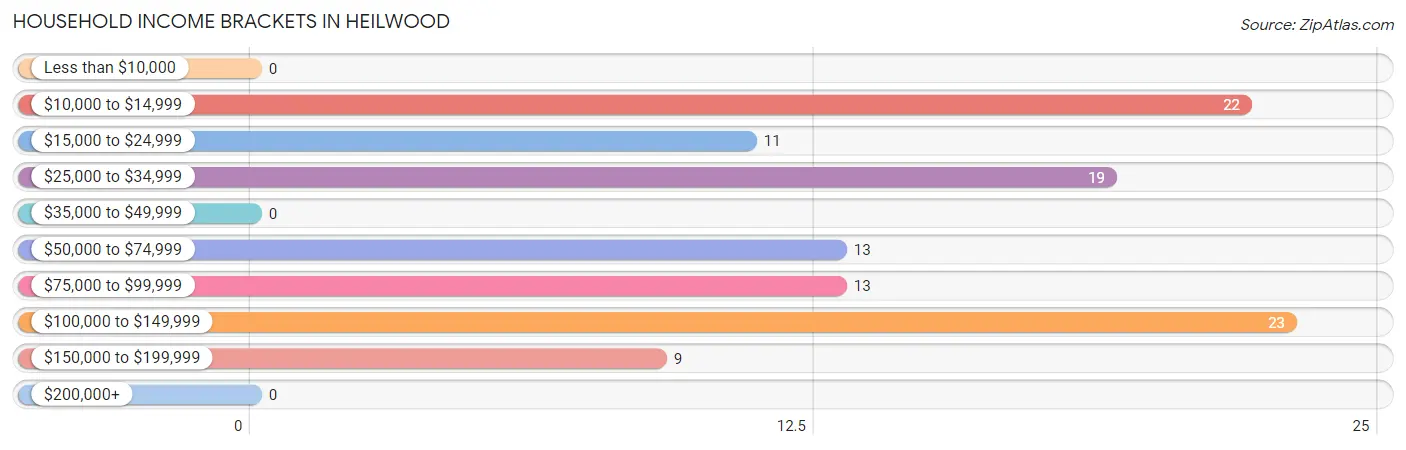
| Income Bracket | # Households | % Households |
| Less than $10,000 | 0 | 0.0% |
| $10,000 to $14,999 | 22 | 20.0% |
| $15,000 to $24,999 | 11 | 10.0% |
| $25,000 to $34,999 | 19 | 17.3% |
| $35,000 to $49,999 | 0 | 0.0% |
| $50,000 to $74,999 | 13 | 11.8% |
| $75,000 to $99,999 | 13 | 11.8% |
| $100,000 to $149,999 | 23 | 20.9% |
| $150,000 to $199,999 | 9 | 8.2% |
| $200,000+ | 0 | 0.0% |
Household Income by Householder Age in Heilwood
The median household income in Heilwood is $0, with the highest median household income of $125,000 found in the 25 to 44 years age bracket for the primary householder. A total of 30 households (27.3%) fall into this category.
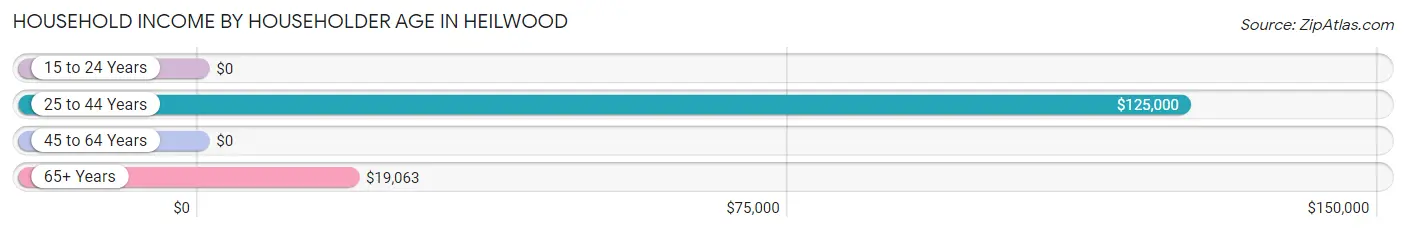
| Income Bracket | # Households | Median Income |
| 15 to 24 Years | 0 (0.0%) | $0 |
| 25 to 44 Years | 30 (27.3%) | $125,000 |
| 45 to 64 Years | 52 (47.3%) | $0 |
| 65+ Years | 28 (25.5%) | $19,063 |
| Total | 110 (100.0%) | $0 |
Poverty in Heilwood
Income Below Poverty by Sex and Age in Heilwood
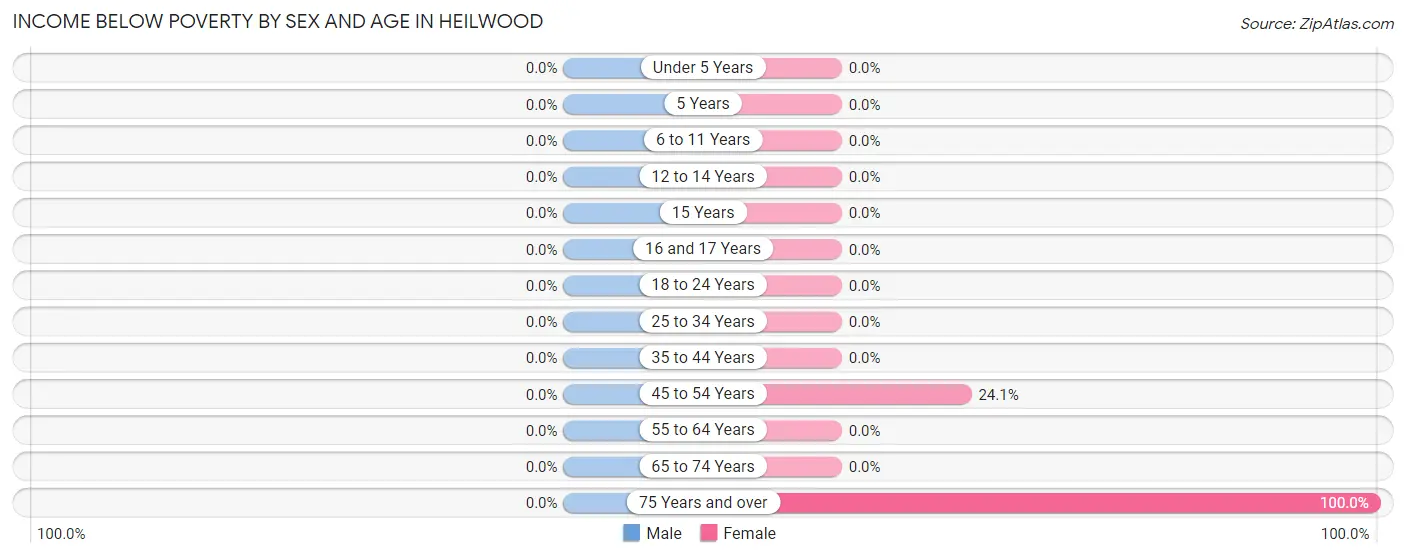
| Age Bracket | Male | Female |
| Under 5 Years | 0 (0.0%) | 0 (0.0%) |
| 5 Years | 0 (0.0%) | 0 (0.0%) |
| 6 to 11 Years | 0 (0.0%) | 0 (0.0%) |
| 12 to 14 Years | 0 (0.0%) | 0 (0.0%) |
| 15 Years | 0 (0.0%) | 0 (0.0%) |
| 16 and 17 Years | 0 (0.0%) | 0 (0.0%) |
| 18 to 24 Years | 0 (0.0%) | 0 (0.0%) |
| 25 to 34 Years | 0 (0.0%) | 0 (0.0%) |
| 35 to 44 Years | 0 (0.0%) | 0 (0.0%) |
| 45 to 54 Years | 0 (0.0%) | 13 (24.1%) |
| 55 to 64 Years | 0 (0.0%) | 0 (0.0%) |
| 65 to 74 Years | 0 (0.0%) | 0 (0.0%) |
| 75 Years and over | 0 (0.0%) | 9 (100.0%) |
| Total | 0 (0.0%) | 22 (13.8%) |
Income Above Poverty by Sex and Age in Heilwood
According to the poverty statistics in Heilwood, males aged under 5 years and females aged under 5 years are the age groups that are most secure financially, with 100.0% of males and 100.0% of females in these age groups living above the poverty line.
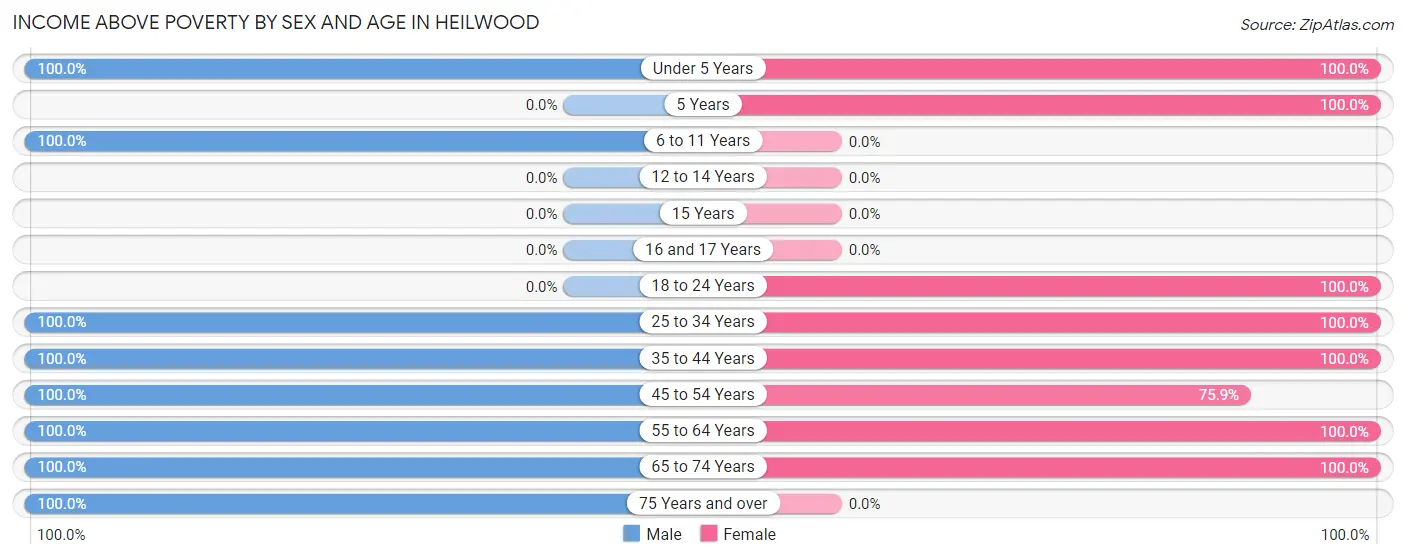
| Age Bracket | Male | Female |
| Under 5 Years | 5 (100.0%) | 12 (100.0%) |
| 5 Years | 0 (0.0%) | 11 (100.0%) |
| 6 to 11 Years | 5 (100.0%) | 0 (0.0%) |
| 12 to 14 Years | 0 (0.0%) | 0 (0.0%) |
| 15 Years | 0 (0.0%) | 0 (0.0%) |
| 16 and 17 Years | 0 (0.0%) | 0 (0.0%) |
| 18 to 24 Years | 0 (0.0%) | 15 (100.0%) |
| 25 to 34 Years | 20 (100.0%) | 18 (100.0%) |
| 35 to 44 Years | 11 (100.0%) | 6 (100.0%) |
| 45 to 54 Years | 13 (100.0%) | 41 (75.9%) |
| 55 to 64 Years | 10 (100.0%) | 2 (100.0%) |
| 65 to 74 Years | 5 (100.0%) | 32 (100.0%) |
| 75 Years and over | 6 (100.0%) | 0 (0.0%) |
| Total | 75 (100.0%) | 137 (86.2%) |
Income Below Poverty Among Married-Couple Families in Heilwood
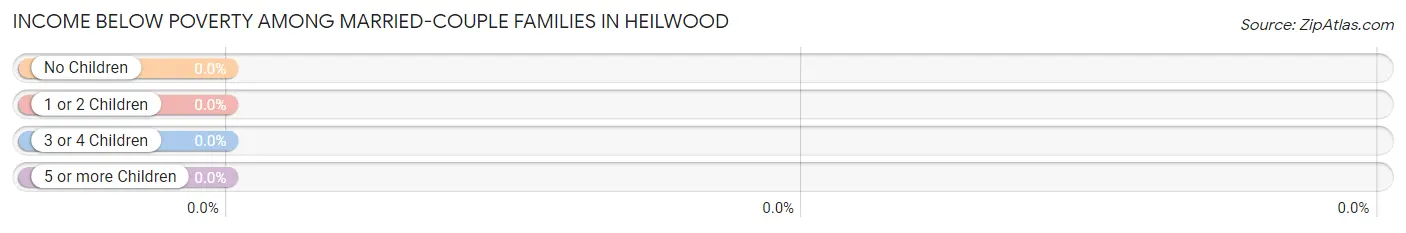
| Children | Above Poverty | Below Poverty |
| No Children | 28 (100.0%) | 0 (0.0%) |
| 1 or 2 Children | 26 (100.0%) | 0 (0.0%) |
| 3 or 4 Children | 0 (0.0%) | 0 (0.0%) |
| 5 or more Children | 0 (0.0%) | 0 (0.0%) |
| Total | 54 (100.0%) | 0 (0.0%) |
Income Below Poverty Among Single-Parent Households in Heilwood
| Children | Single Father | Single Mother |
| No Children | 0 (0.0%) | 0 (0.0%) |
| 1 or 2 Children | 0 (0.0%) | 0 (0.0%) |
| 3 or 4 Children | 0 (0.0%) | 0 (0.0%) |
| 5 or more Children | 0 (0.0%) | 0 (0.0%) |
| Total | 0 (0.0%) | 0 (0.0%) |
Income Below Poverty Among Married-Couple vs Single-Parent Households in Heilwood
| Children | Married-Couple Families | Single-Parent Households |
| No Children | 0 (0.0%) | 0 (0.0%) |
| 1 or 2 Children | 0 (0.0%) | 0 (0.0%) |
| 3 or 4 Children | 0 (0.0%) | 0 (0.0%) |
| 5 or more Children | 0 (0.0%) | 0 (0.0%) |
| Total | 0 (0.0%) | 0 (0.0%) |
Race in Heilwood
The most populous races in Heilwood are , and White / Caucasian (234 | 100.0%).
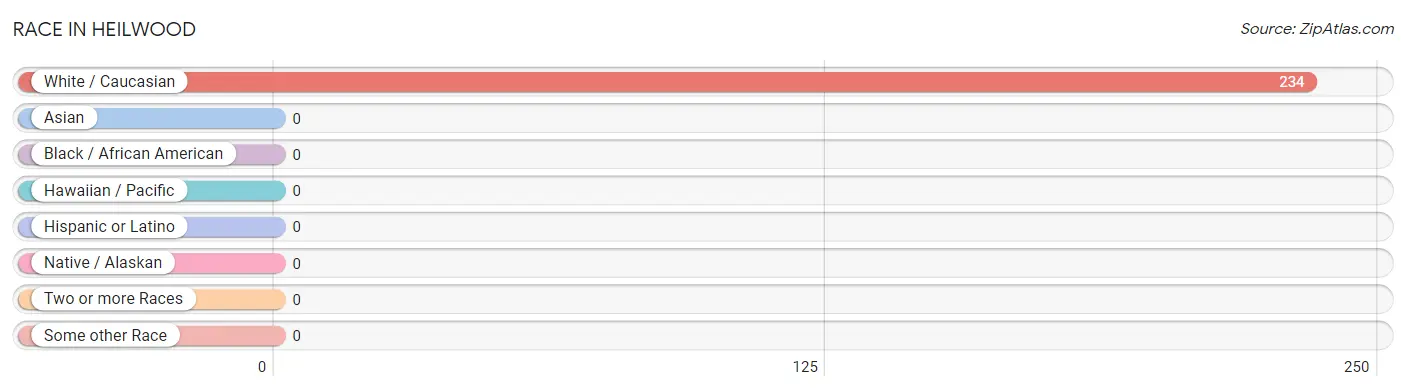
| Race | # Population | % Population |
| Asian | 0 | 0.0% |
| Black / African American | 0 | 0.0% |
| Hawaiian / Pacific | 0 | 0.0% |
| Hispanic or Latino | 0 | 0.0% |
| Native / Alaskan | 0 | 0.0% |
| White / Caucasian | 234 | 100.0% |
| Two or more Races | 0 | 0.0% |
| Some other Race | 0 | 0.0% |
| Total | 234 | 100.0% |
Ancestry in Heilwood
The most populous ancestries reported in Heilwood are German (56 | 23.9%), Irish (45 | 19.2%), European (35 | 15.0%), English (17 | 7.3%), and Slovak (15 | 6.4%), together accounting for 71.8% of all Heilwood residents.
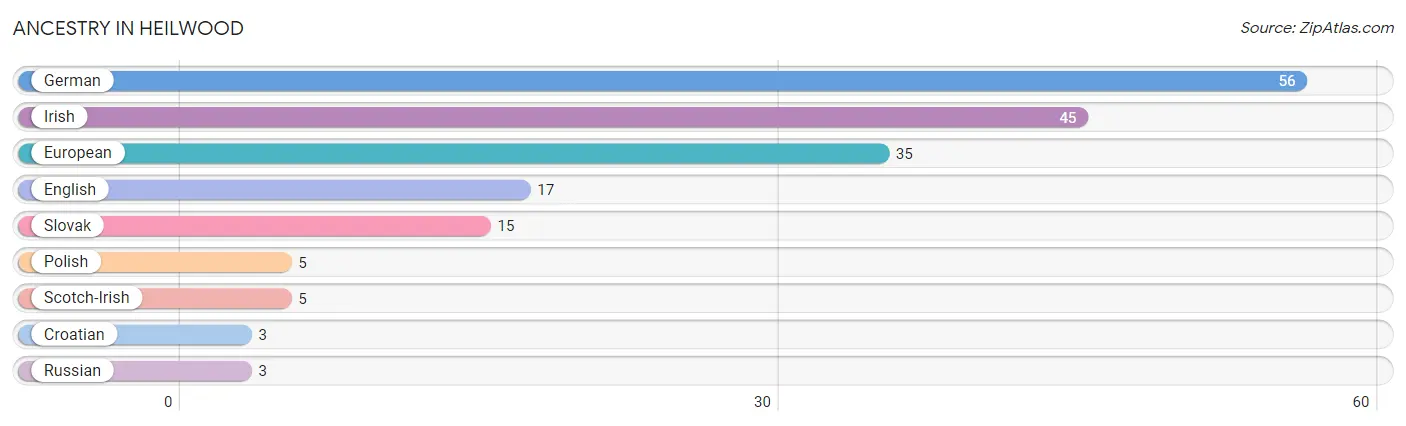
| Ancestry | # Population | % Population |
| Croatian | 3 | 1.3% |
| English | 17 | 7.3% |
| European | 35 | 15.0% |
| German | 56 | 23.9% |
| Irish | 45 | 19.2% |
| Polish | 5 | 2.1% |
| Russian | 3 | 1.3% |
| Scotch-Irish | 5 | 2.1% |
| Slovak | 15 | 6.4% | View All 9 Rows |
Immigrants in Heilwood

| Immigration Origin | # Population | % Population | View All 0 Rows |
Sex and Age in Heilwood
Sex and Age in Heilwood
The most populous age groups in Heilwood are 30 to 34 Years (15 | 20.0%) for men and 50 to 54 Years (39 | 24.5%) for women.
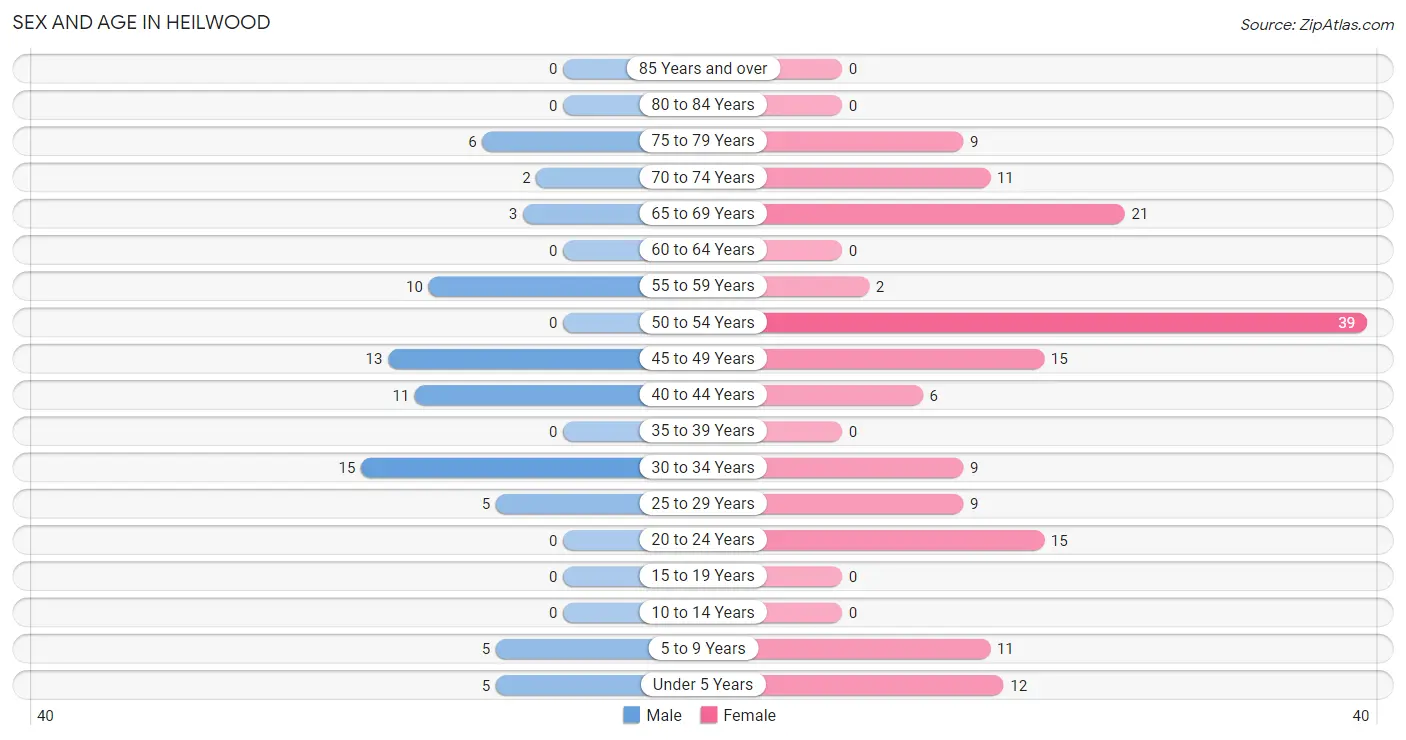
| Age Bracket | Male | Female |
| Under 5 Years | 5 (6.7%) | 12 (7.5%) |
| 5 to 9 Years | 5 (6.7%) | 11 (6.9%) |
| 10 to 14 Years | 0 (0.0%) | 0 (0.0%) |
| 15 to 19 Years | 0 (0.0%) | 0 (0.0%) |
| 20 to 24 Years | 0 (0.0%) | 15 (9.4%) |
| 25 to 29 Years | 5 (6.7%) | 9 (5.7%) |
| 30 to 34 Years | 15 (20.0%) | 9 (5.7%) |
| 35 to 39 Years | 0 (0.0%) | 0 (0.0%) |
| 40 to 44 Years | 11 (14.7%) | 6 (3.8%) |
| 45 to 49 Years | 13 (17.3%) | 15 (9.4%) |
| 50 to 54 Years | 0 (0.0%) | 39 (24.5%) |
| 55 to 59 Years | 10 (13.3%) | 2 (1.3%) |
| 60 to 64 Years | 0 (0.0%) | 0 (0.0%) |
| 65 to 69 Years | 3 (4.0%) | 21 (13.2%) |
| 70 to 74 Years | 2 (2.7%) | 11 (6.9%) |
| 75 to 79 Years | 6 (8.0%) | 9 (5.7%) |
| 80 to 84 Years | 0 (0.0%) | 0 (0.0%) |
| 85 Years and over | 0 (0.0%) | 0 (0.0%) |
| Total | 75 (100.0%) | 159 (100.0%) |
Families and Households in Heilwood
Median Family Size in Heilwood
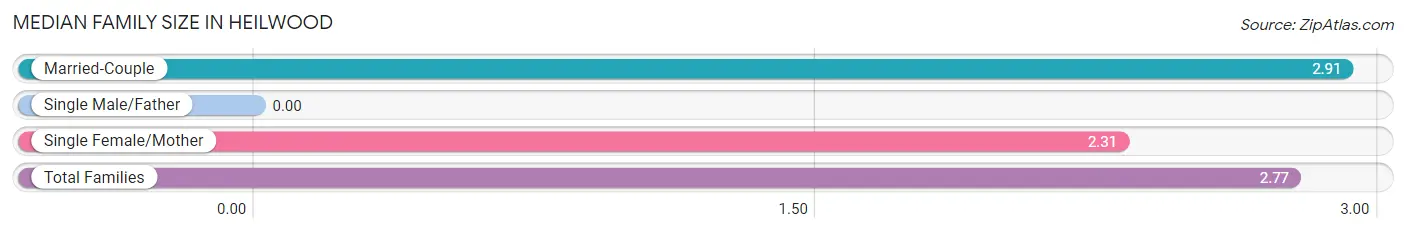
| Family Type | # Families | Family Size |
| Married-Couple | 54 (77.1%) | 2.91 |
| Single Male/Father | 0 (0.0%) | - |
| Single Female/Mother | 16 (22.9%) | 2.31 |
| Total Families | 70 (100.0%) | 2.77 |
Median Household Size in Heilwood
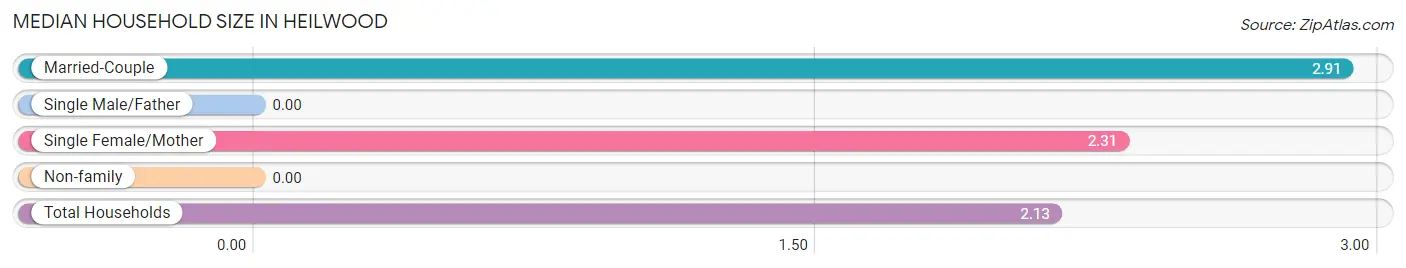
| Household Type | # Households | Household Size |
| Married-Couple | 54 (49.1%) | 2.91 |
| Single Male/Father | 0 (0.0%) | - |
| Single Female/Mother | 16 (14.5%) | 2.31 |
| Non-family | 40 (36.4%) | - |
| Total Households | 110 (100.0%) | 2.13 |
Household Size by Marriage Status in Heilwood
Out of a total of 110 households in Heilwood, 70 (63.6%) are family households, while 40 (36.4%) are nonfamily households. The most numerous type of family households are 2-person households, comprising 34, and the most common type of nonfamily households are 1-person households, comprising 40.
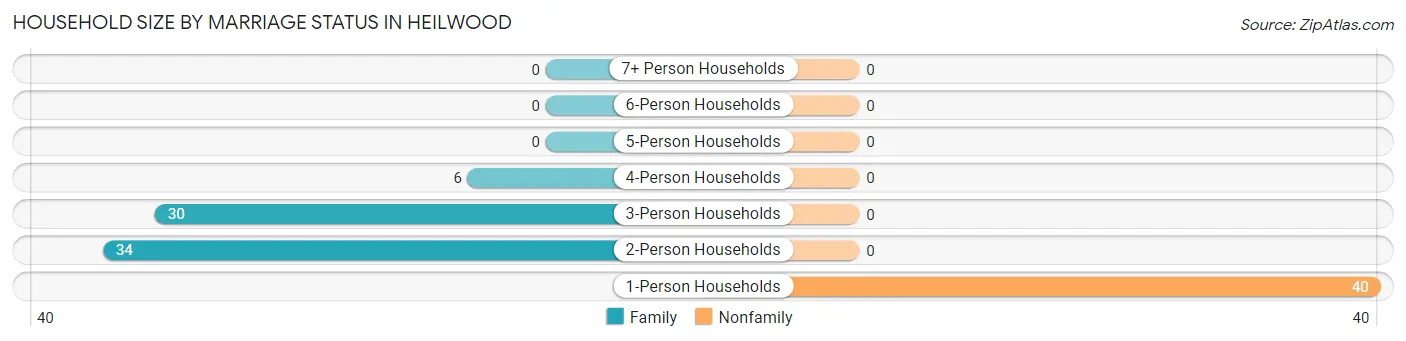
| Household Size | Family Households | Nonfamily Households |
| 1-Person Households | - | 40 (36.4%) |
| 2-Person Households | 34 (30.9%) | 0 (0.0%) |
| 3-Person Households | 30 (27.3%) | 0 (0.0%) |
| 4-Person Households | 6 (5.4%) | 0 (0.0%) |
| 5-Person Households | 0 (0.0%) | 0 (0.0%) |
| 6-Person Households | 0 (0.0%) | 0 (0.0%) |
| 7+ Person Households | 0 (0.0%) | 0 (0.0%) |
| Total | 70 (63.6%) | 40 (36.4%) |
Female Fertility in Heilwood
Fertility by Age in Heilwood
Average fertility rate in Heilwood is 93.0 births per 1,000 women. Women in the age bracket of 20 to 34 years have the highest fertility rate with 152.0 births per 1,000 women. Women in the age bracket of 20 to 34 years acount for 100.0% of all women with births.
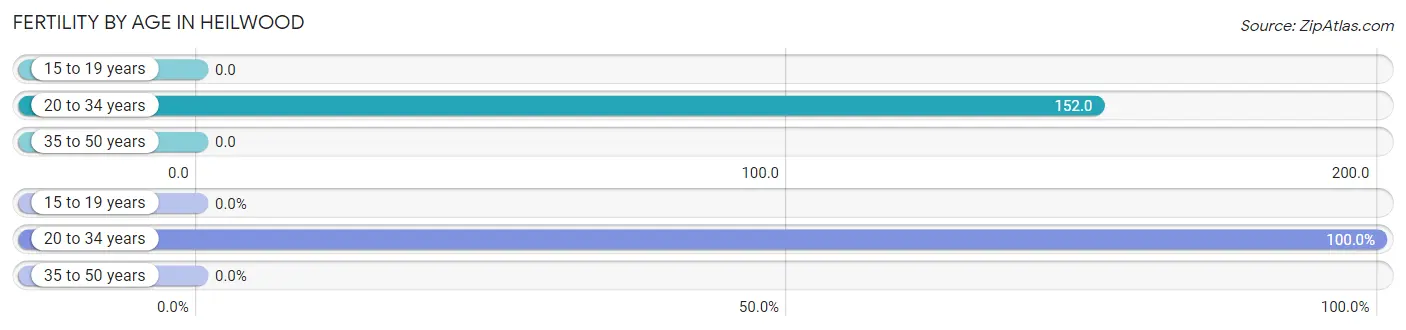
| Age Bracket | Women with Births | Births / 1,000 Women |
| 15 to 19 years | 0 (0.0%) | 0.0 |
| 20 to 34 years | 5 (100.0%) | 152.0 |
| 35 to 50 years | 0 (0.0%) | 0.0 |
| Total | 5 (100.0%) | 93.0 |
Fertility by Age by Marriage Status in Heilwood
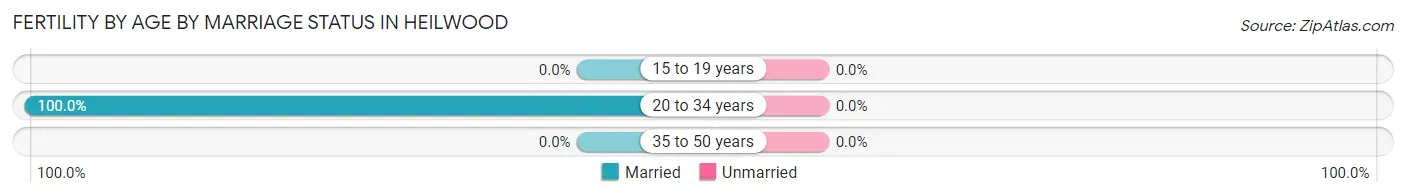
| Age Bracket | Married | Unmarried |
| 15 to 19 years | 0 (0.0%) | 0 (0.0%) |
| 20 to 34 years | 5 (100.0%) | 0 (0.0%) |
| 35 to 50 years | 0 (0.0%) | 0 (0.0%) |
| Total | 5 (100.0%) | 0 (0.0%) |
Fertility by Education in Heilwood
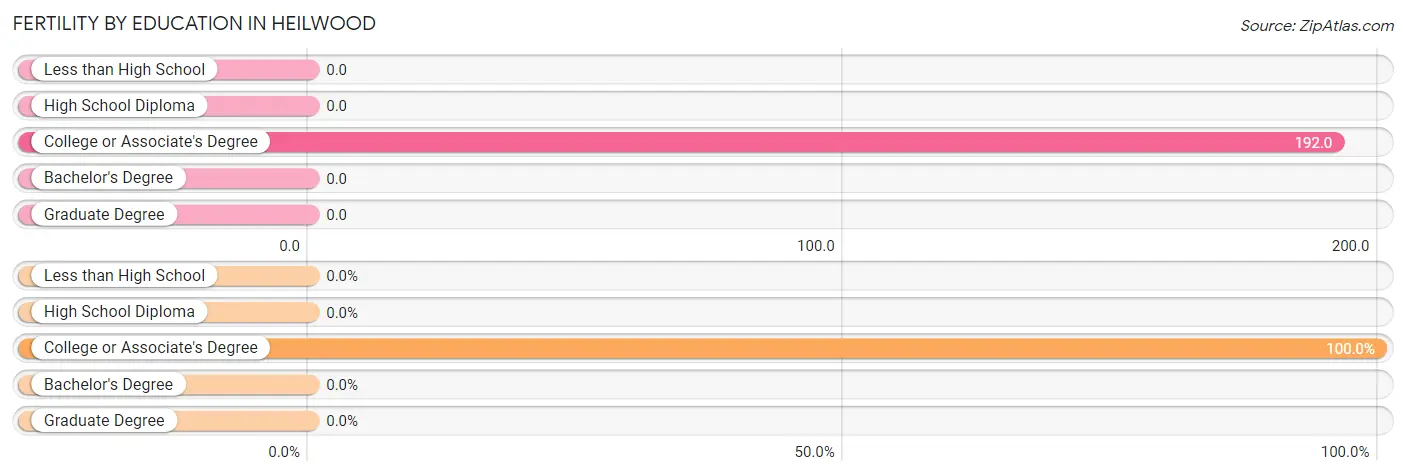
| Educational Attainment | Women with Births | Births / 1,000 Women |
| Less than High School | 0 (0.0%) | 0.0 |
| High School Diploma | 0 (0.0%) | 0.0 |
| College or Associate's Degree | 5 (100.0%) | 192.0 |
| Bachelor's Degree | 0 (0.0%) | 0.0 |
| Graduate Degree | 0 (0.0%) | 0.0 |
| Total | 5 (100.0%) | 93.0 |
Fertility by Education by Marriage Status in Heilwood
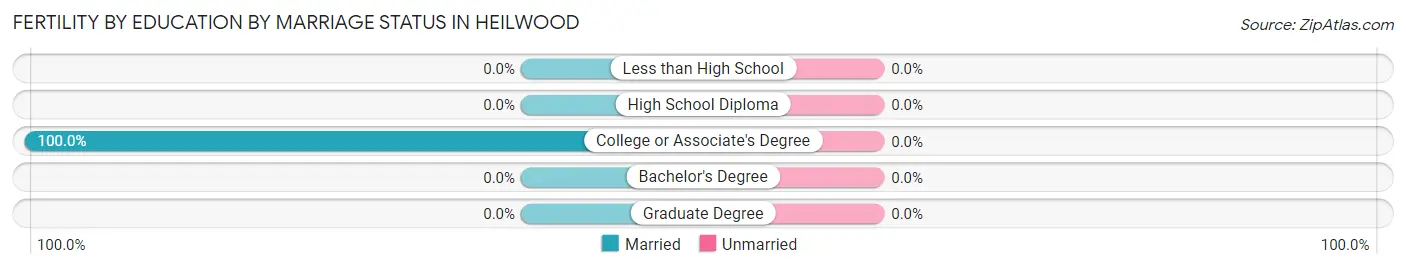
| Educational Attainment | Married | Unmarried |
| Less than High School | 0 (0.0%) | 0 (0.0%) |
| High School Diploma | 0 (0.0%) | 0 (0.0%) |
| College or Associate's Degree | 5 (100.0%) | 0 (0.0%) |
| Bachelor's Degree | 0 (0.0%) | 0 (0.0%) |
| Graduate Degree | 0 (0.0%) | 0 (0.0%) |
| Total | 5 (100.0%) | 0 (0.0%) |
Employment Characteristics in Heilwood
Employment by Class of Employer in Heilwood
Among the 109 employed individuals in Heilwood, private company employees (89 | 81.7%), state government employees (18 | 16.5%), and not-for-profit organizations (2 | 1.8%) make up the most common classes of employment.
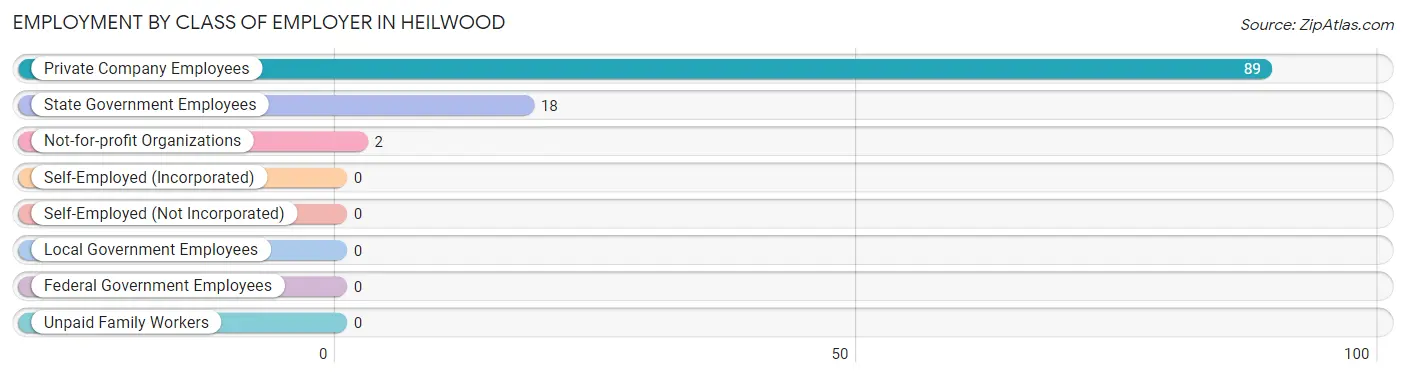
| Employer Class | # Employees | % Employees |
| Private Company Employees | 89 | 81.7% |
| Self-Employed (Incorporated) | 0 | 0.0% |
| Self-Employed (Not Incorporated) | 0 | 0.0% |
| Not-for-profit Organizations | 2 | 1.8% |
| Local Government Employees | 0 | 0.0% |
| State Government Employees | 18 | 16.5% |
| Federal Government Employees | 0 | 0.0% |
| Unpaid Family Workers | 0 | 0.0% |
| Total | 109 | 100.0% |
Employment Status by Age in Heilwood
According to the labor force statistics for Heilwood, out of the total population over 16 years of age (201), 56.7% or 114 individuals are in the labor force, with 4.4% or 5 of them unemployed. The age group with the highest labor force participation rate is 20 to 24 years, with 100.0% or 15 individuals in the labor force. Within the labor force, the 35 to 44 years age range has the highest percentage of unemployed individuals, with 45.5% or 5 of them being unemployed.
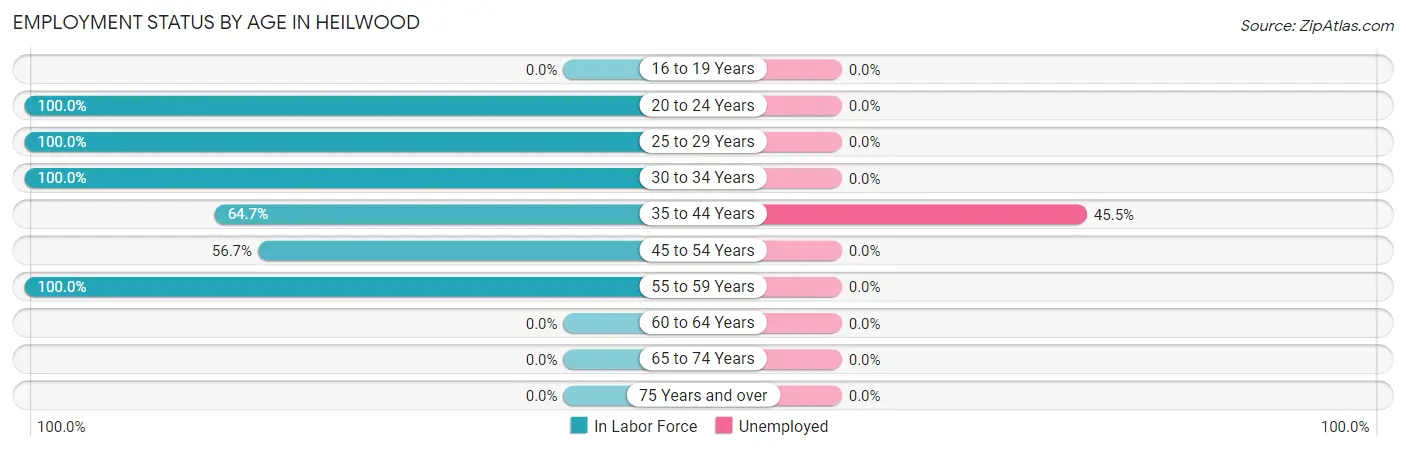
| Age Bracket | In Labor Force | Unemployed |
| 16 to 19 Years | 0 (0.0%) | 0 (0.0%) |
| 20 to 24 Years | 15 (100.0%) | 0 (0.0%) |
| 25 to 29 Years | 14 (100.0%) | 0 (0.0%) |
| 30 to 34 Years | 24 (100.0%) | 0 (0.0%) |
| 35 to 44 Years | 11 (64.7%) | 5 (45.5%) |
| 45 to 54 Years | 38 (56.7%) | 0 (0.0%) |
| 55 to 59 Years | 12 (100.0%) | 0 (0.0%) |
| 60 to 64 Years | 0 (0.0%) | 0 (0.0%) |
| 65 to 74 Years | 0 (0.0%) | 0 (0.0%) |
| 75 Years and over | 0 (0.0%) | 0 (0.0%) |
| Total | 114 (56.7%) | 5 (4.4%) |
Employment Status by Educational Attainment in Heilwood
According to labor force statistics for Heilwood, 73.9% of individuals (99) out of the total population between 25 and 64 years of age (134) are in the labor force, with 5.1% or 5 of them being unemployed. The group with the highest labor force participation rate are those with the educational attainment of bachelor's degree or higher, with 100.0% or 36 individuals in the labor force. Within the labor force, individuals with college / associate degree education have the highest percentage of unemployment, with 19.2% or 5 of them being unemployed.
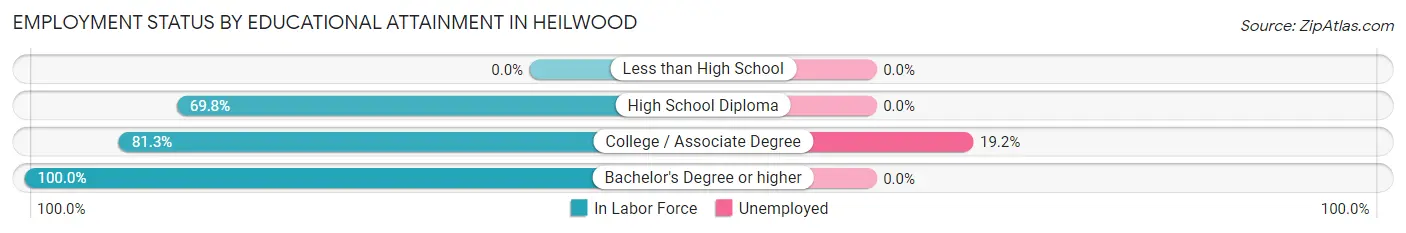
| Educational Attainment | In Labor Force | Unemployed |
| Less than High School | 0 (0.0%) | 0 (0.0%) |
| High School Diploma | 37 (69.8%) | 0 (0.0%) |
| College / Associate Degree | 26 (81.3%) | 6 (19.2%) |
| Bachelor's Degree or higher | 36 (100.0%) | 0 (0.0%) |
| Total | 99 (73.9%) | 7 (5.1%) |
Employment Occupations by Sex in Heilwood
Management, Business, Science and Arts Occupations
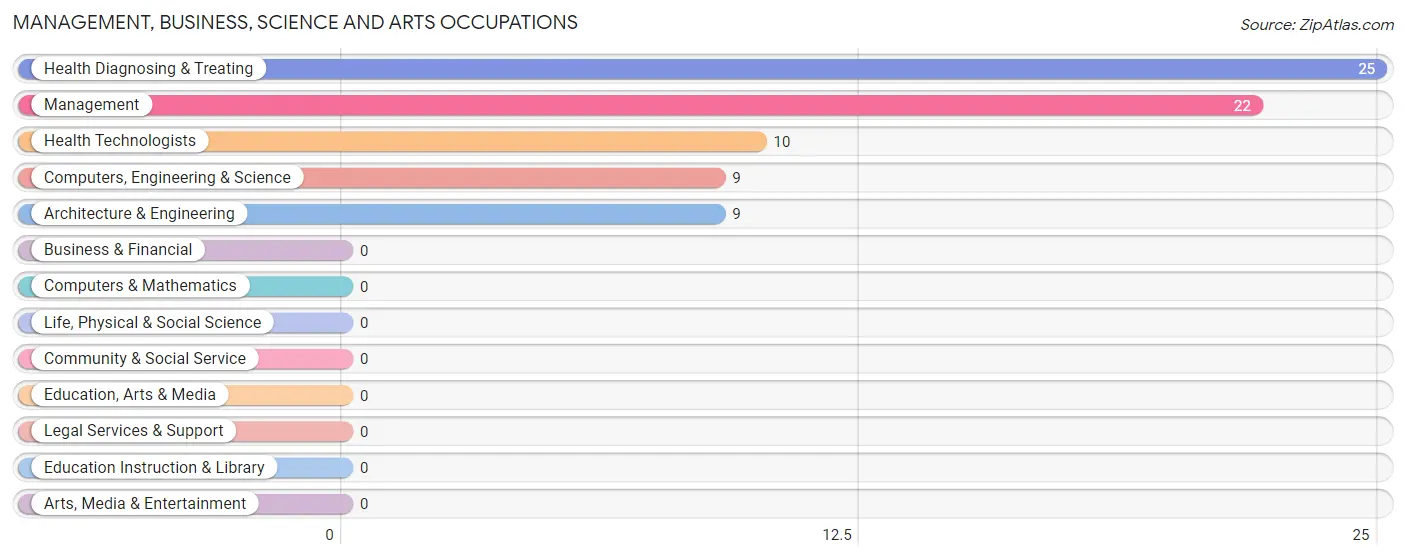
The most common Management, Business, Science and Arts occupations in Heilwood are Health Diagnosing & Treating (25 | 22.9%), Management (22 | 20.2%), Health Technologists (10 | 9.2%), Computers, Engineering & Science (9 | 8.3%), and Architecture & Engineering (9 | 8.3%).
Management, Business, Science and Arts Occupations by Sex
Within the Management, Business, Science and Arts occupations in Heilwood, the most male-oriented occupations are Computers, Engineering & Science (100.0%), Architecture & Engineering (100.0%), and Management (50.0%), while the most female-oriented occupations are Health Diagnosing & Treating (100.0%), Health Technologists (100.0%), and Management (50.0%).
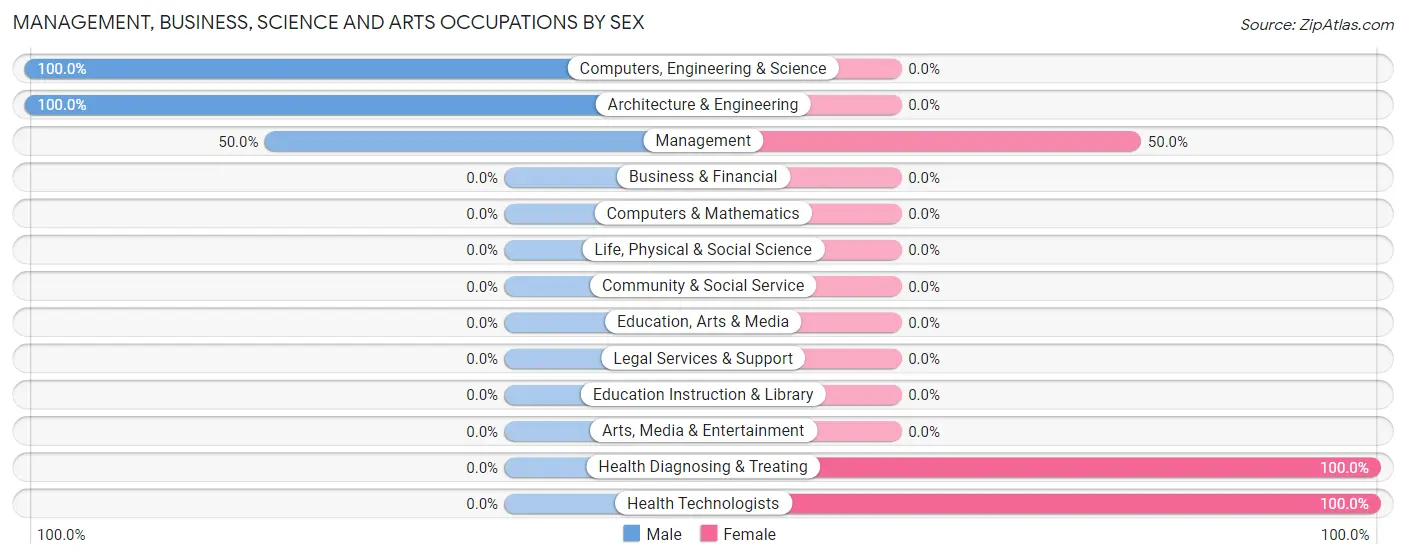
| Occupation | Male | Female |
| Management | 11 (50.0%) | 11 (50.0%) |
| Business & Financial | 0 (0.0%) | 0 (0.0%) |
| Computers, Engineering & Science | 9 (100.0%) | 0 (0.0%) |
| Computers & Mathematics | 0 (0.0%) | 0 (0.0%) |
| Architecture & Engineering | 9 (100.0%) | 0 (0.0%) |
| Life, Physical & Social Science | 0 (0.0%) | 0 (0.0%) |
| Community & Social Service | 0 (0.0%) | 0 (0.0%) |
| Education, Arts & Media | 0 (0.0%) | 0 (0.0%) |
| Legal Services & Support | 0 (0.0%) | 0 (0.0%) |
| Education Instruction & Library | 0 (0.0%) | 0 (0.0%) |
| Arts, Media & Entertainment | 0 (0.0%) | 0 (0.0%) |
| Health Diagnosing & Treating | 0 (0.0%) | 25 (100.0%) |
| Health Technologists | 0 (0.0%) | 10 (100.0%) |
| Total (Category) | 20 (35.7%) | 36 (64.3%) |
| Total (Overall) | 49 (45.0%) | 60 (55.0%) |
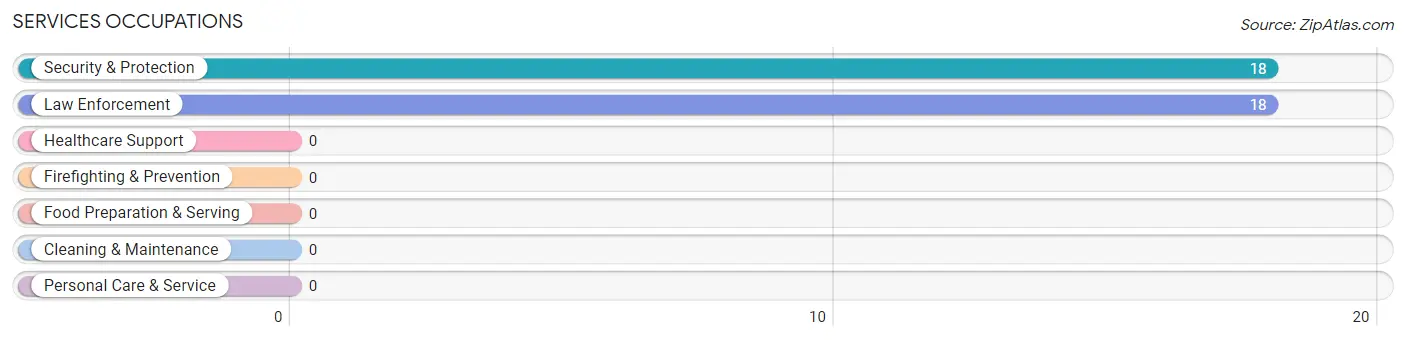
Services Occupations
The most common Services occupations in Heilwood are Security & Protection (18 | 16.5%), and Law Enforcement (18 | 16.5%).
Services Occupations by Sex
Within the Services occupations in Heilwood, the most male-oriented occupations are Security & Protection (72.2%), and Law Enforcement (72.2%), while the most female-oriented occupations are Security & Protection (27.8%), and Law Enforcement (27.8%).
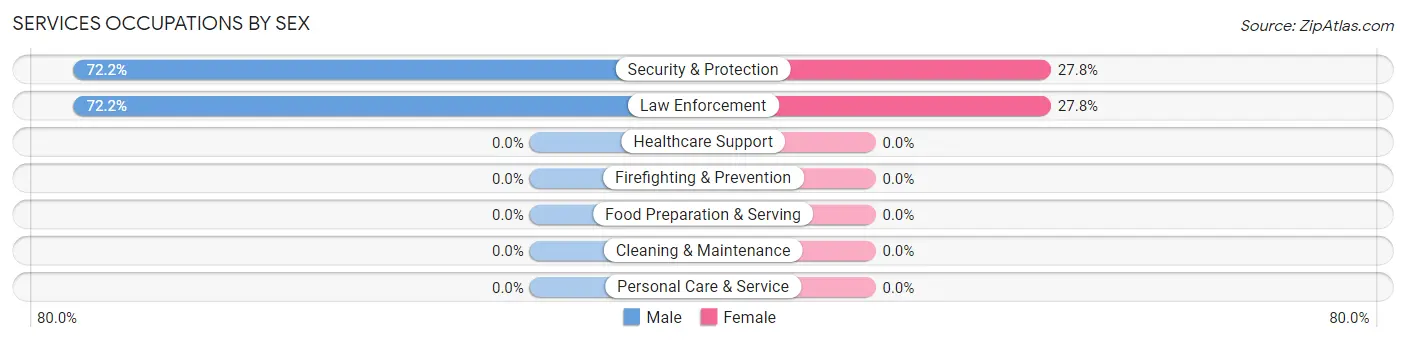
| Occupation | Male | Female |
| Healthcare Support | 0 (0.0%) | 0 (0.0%) |
| Security & Protection | 13 (72.2%) | 5 (27.8%) |
| Firefighting & Prevention | 0 (0.0%) | 0 (0.0%) |
| Law Enforcement | 13 (72.2%) | 5 (27.8%) |
| Food Preparation & Serving | 0 (0.0%) | 0 (0.0%) |
| Cleaning & Maintenance | 0 (0.0%) | 0 (0.0%) |
| Personal Care & Service | 0 (0.0%) | 0 (0.0%) |
| Total (Category) | 13 (72.2%) | 5 (27.8%) |
| Total (Overall) | 49 (45.0%) | 60 (55.0%) |
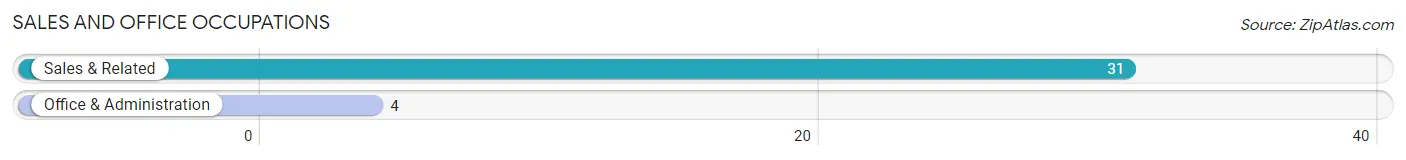
Sales and Office Occupations
The most common Sales and Office occupations in Heilwood are Sales & Related (31 | 28.4%), and Office & Administration (4 | 3.7%).
Sales and Office Occupations by Sex
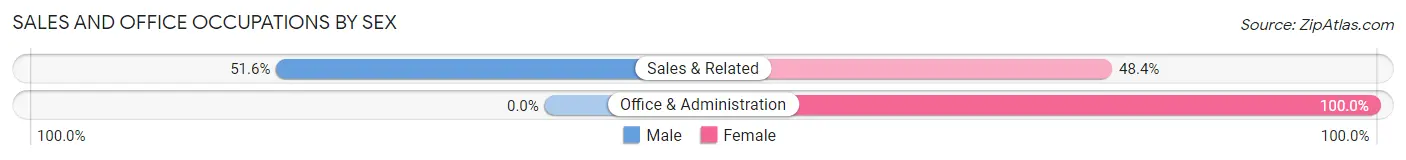
| Occupation | Male | Female |
| Sales & Related | 16 (51.6%) | 15 (48.4%) |
| Office & Administration | 0 (0.0%) | 4 (100.0%) |
| Total (Category) | 16 (45.7%) | 19 (54.3%) |
| Total (Overall) | 49 (45.0%) | 60 (55.0%) |
Natural Resources, Construction and Maintenance Occupations
Natural Resources, Construction and Maintenance Occupations by Sex
| Occupation | Male | Female |
| Farming, Fishing & Forestry | 0 (0.0%) | 0 (0.0%) |
| Construction & Extraction | 0 (0.0%) | 0 (0.0%) |
| Installation, Maintenance & Repair | 0 (0.0%) | 0 (0.0%) |
| Total (Category) | 0 (0.0%) | 0 (0.0%) |
| Total (Overall) | 49 (45.0%) | 60 (55.0%) |
Production, Transportation and Moving Occupations
Production, Transportation and Moving Occupations by Sex
| Occupation | Male | Female |
| Production | 0 (0.0%) | 0 (0.0%) |
| Transportation | 0 (0.0%) | 0 (0.0%) |
| Material Moving | 0 (0.0%) | 0 (0.0%) |
| Total (Category) | 0 (0.0%) | 0 (0.0%) |
| Total (Overall) | 49 (45.0%) | 60 (55.0%) |
Employment Industries by Sex in Heilwood
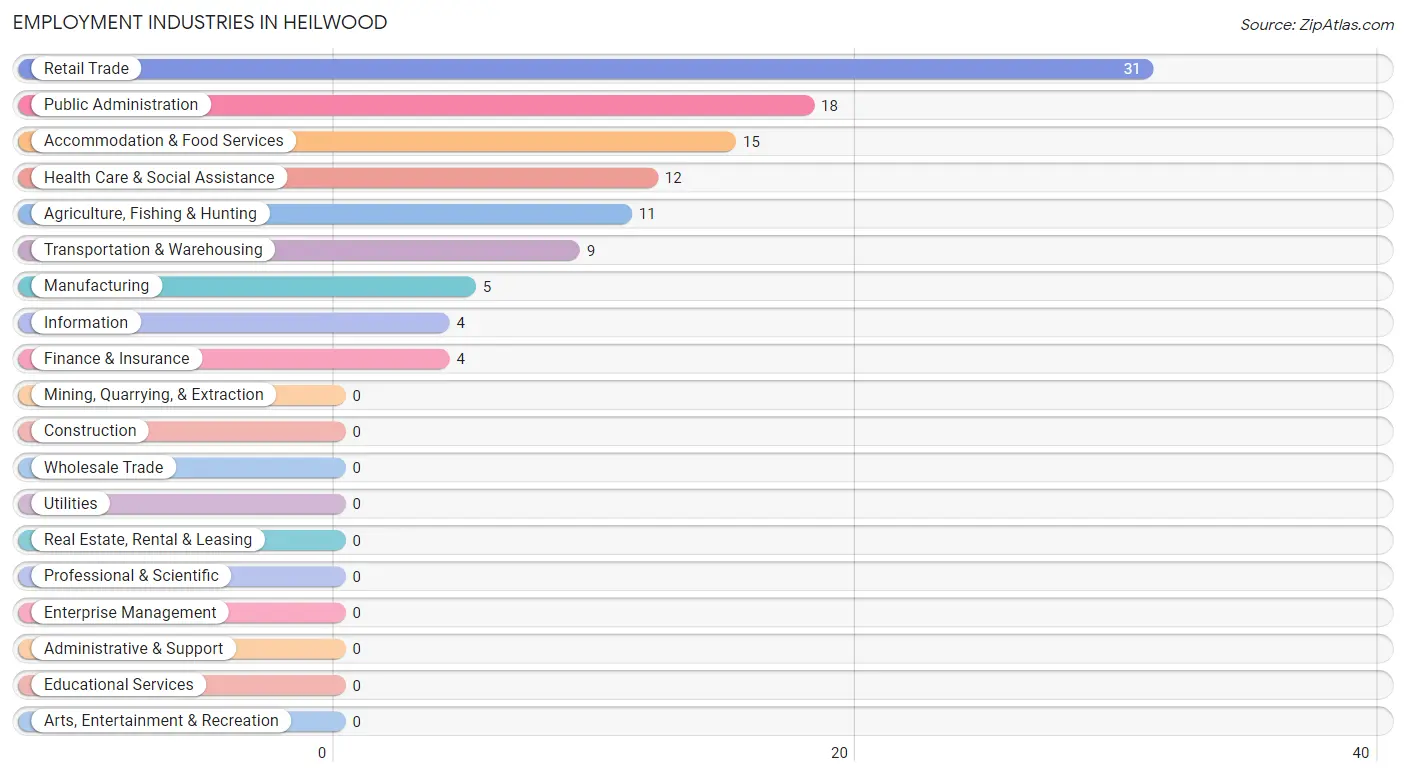
Employment Industries in Heilwood
The major employment industries in Heilwood include Retail Trade (31 | 28.4%), Public Administration (18 | 16.5%), Accommodation & Food Services (15 | 13.8%), Health Care & Social Assistance (12 | 11.0%), and Agriculture, Fishing & Hunting (11 | 10.1%).
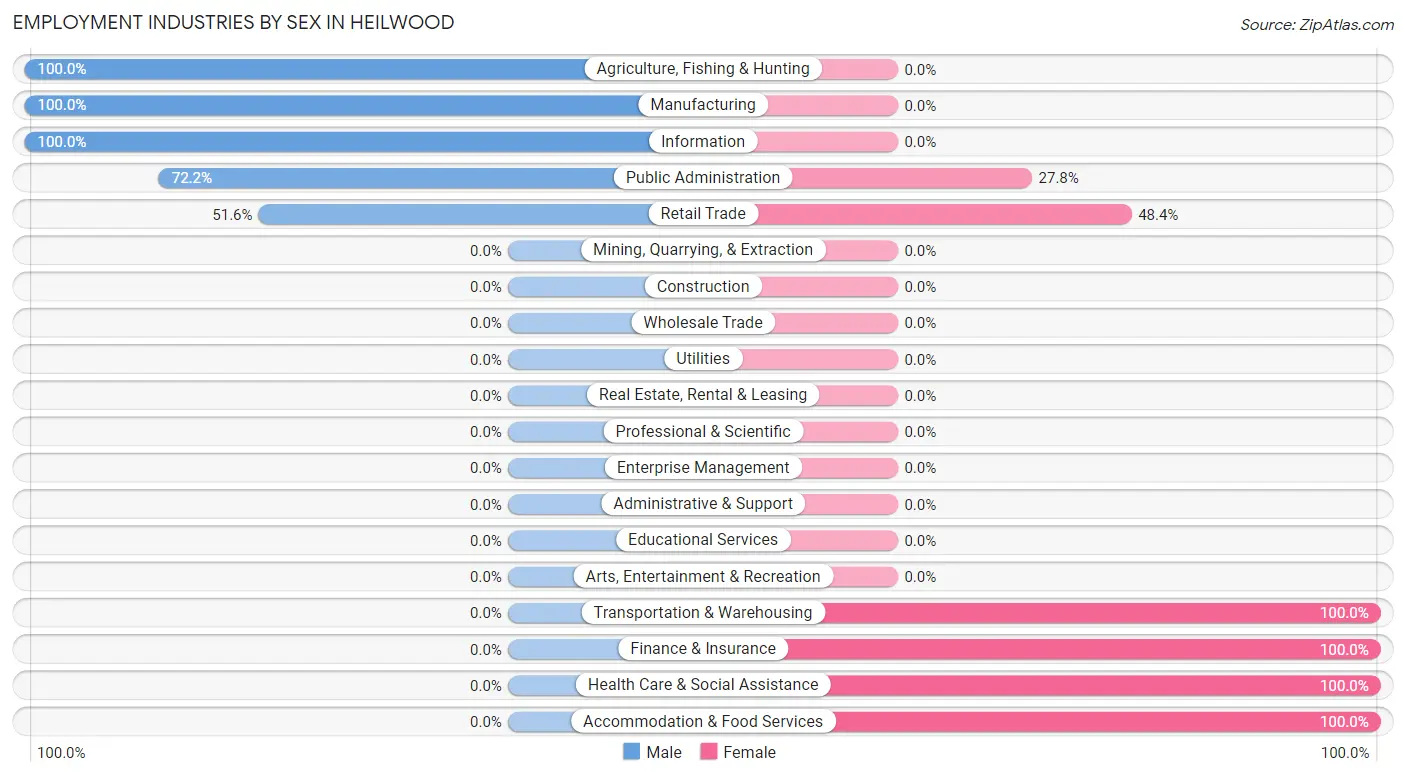
Employment Industries by Sex in Heilwood
The Heilwood industries that see more men than women are Agriculture, Fishing & Hunting (100.0%), Manufacturing (100.0%), and Information (100.0%), whereas the industries that tend to have a higher number of women are Transportation & Warehousing (100.0%), Finance & Insurance (100.0%), and Health Care & Social Assistance (100.0%).
| Industry | Male | Female |
| Agriculture, Fishing & Hunting | 11 (100.0%) | 0 (0.0%) |
| Mining, Quarrying, & Extraction | 0 (0.0%) | 0 (0.0%) |
| Construction | 0 (0.0%) | 0 (0.0%) |
| Manufacturing | 5 (100.0%) | 0 (0.0%) |
| Wholesale Trade | 0 (0.0%) | 0 (0.0%) |
| Retail Trade | 16 (51.6%) | 15 (48.4%) |
| Transportation & Warehousing | 0 (0.0%) | 9 (100.0%) |
| Utilities | 0 (0.0%) | 0 (0.0%) |
| Information | 4 (100.0%) | 0 (0.0%) |
| Finance & Insurance | 0 (0.0%) | 4 (100.0%) |
| Real Estate, Rental & Leasing | 0 (0.0%) | 0 (0.0%) |
| Professional & Scientific | 0 (0.0%) | 0 (0.0%) |
| Enterprise Management | 0 (0.0%) | 0 (0.0%) |
| Administrative & Support | 0 (0.0%) | 0 (0.0%) |
| Educational Services | 0 (0.0%) | 0 (0.0%) |
| Health Care & Social Assistance | 0 (0.0%) | 12 (100.0%) |
| Arts, Entertainment & Recreation | 0 (0.0%) | 0 (0.0%) |
| Accommodation & Food Services | 0 (0.0%) | 15 (100.0%) |
| Public Administration | 13 (72.2%) | 5 (27.8%) |
| Total | 49 (45.0%) | 60 (55.0%) |
Education in Heilwood
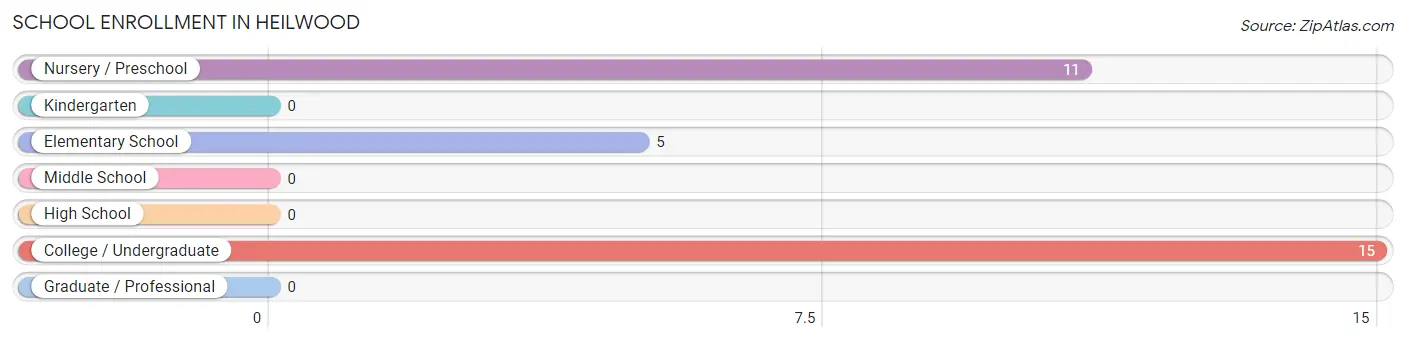
School Enrollment in Heilwood
The most common levels of schooling among the 31 students in Heilwood are college / undergraduate (15 | 48.4%), nursery / preschool (11 | 35.5%), and elementary school (5 | 16.1%).
| School Level | # Students | % Students |
| Nursery / Preschool | 11 | 35.5% |
| Kindergarten | 0 | 0.0% |
| Elementary School | 5 | 16.1% |
| Middle School | 0 | 0.0% |
| High School | 0 | 0.0% |
| College / Undergraduate | 15 | 48.4% |
| Graduate / Professional | 0 | 0.0% |
| Total | 31 | 100.0% |
School Enrollment by Age by Funding Source in Heilwood
Out of a total of 31 students who are enrolled in schools in Heilwood, 5 (16.1%) attend a private institution, while the remaining 26 (83.9%) are enrolled in public schools. The age group of 5 to 9 year old has the highest likelihood of being enrolled in private schools, with 5 (31.2% in the age bracket) enrolled. Conversely, the age group of 20 to 24 year olds has the lowest likelihood of being enrolled in a private school, with 15 (100.0% in the age bracket) attending a public institution.
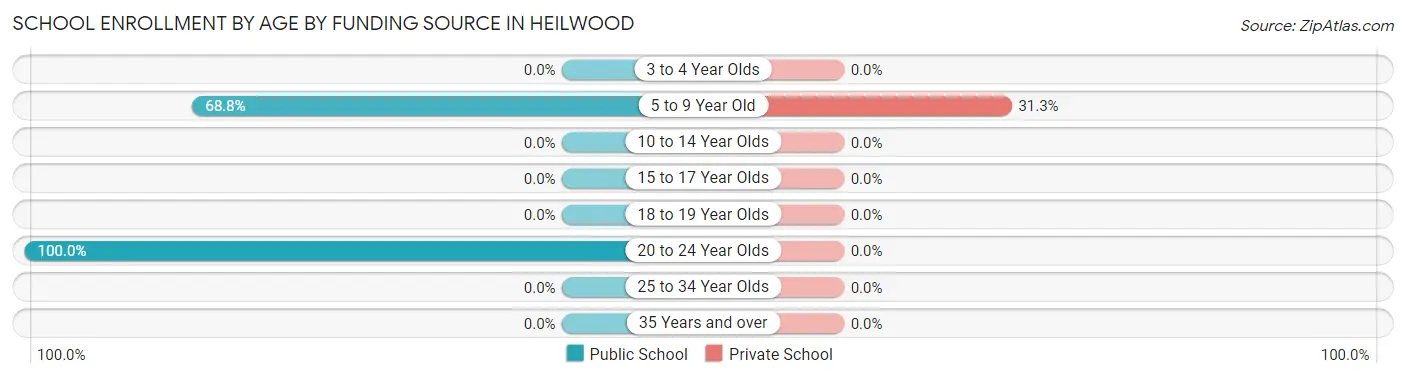
| Age Bracket | Public School | Private School |
| 3 to 4 Year Olds | 0 (0.0%) | 0 (0.0%) |
| 5 to 9 Year Old | 11 (68.8%) | 5 (31.2%) |
| 10 to 14 Year Olds | 0 (0.0%) | 0 (0.0%) |
| 15 to 17 Year Olds | 0 (0.0%) | 0 (0.0%) |
| 18 to 19 Year Olds | 0 (0.0%) | 0 (0.0%) |
| 20 to 24 Year Olds | 15 (100.0%) | 0 (0.0%) |
| 25 to 34 Year Olds | 0 (0.0%) | 0 (0.0%) |
| 35 Years and over | 0 (0.0%) | 0 (0.0%) |
| Total | 26 (83.9%) | 5 (16.1%) |
Educational Attainment by Field of Study in Heilwood
Bio, nature & agricultural (11 | 30.6%), science & technology (10 | 27.8%), communications (9 | 25.0%), and social sciences (6 | 16.7%) are the most common fields of study among 36 individuals in Heilwood who have obtained a bachelor's degree or higher.
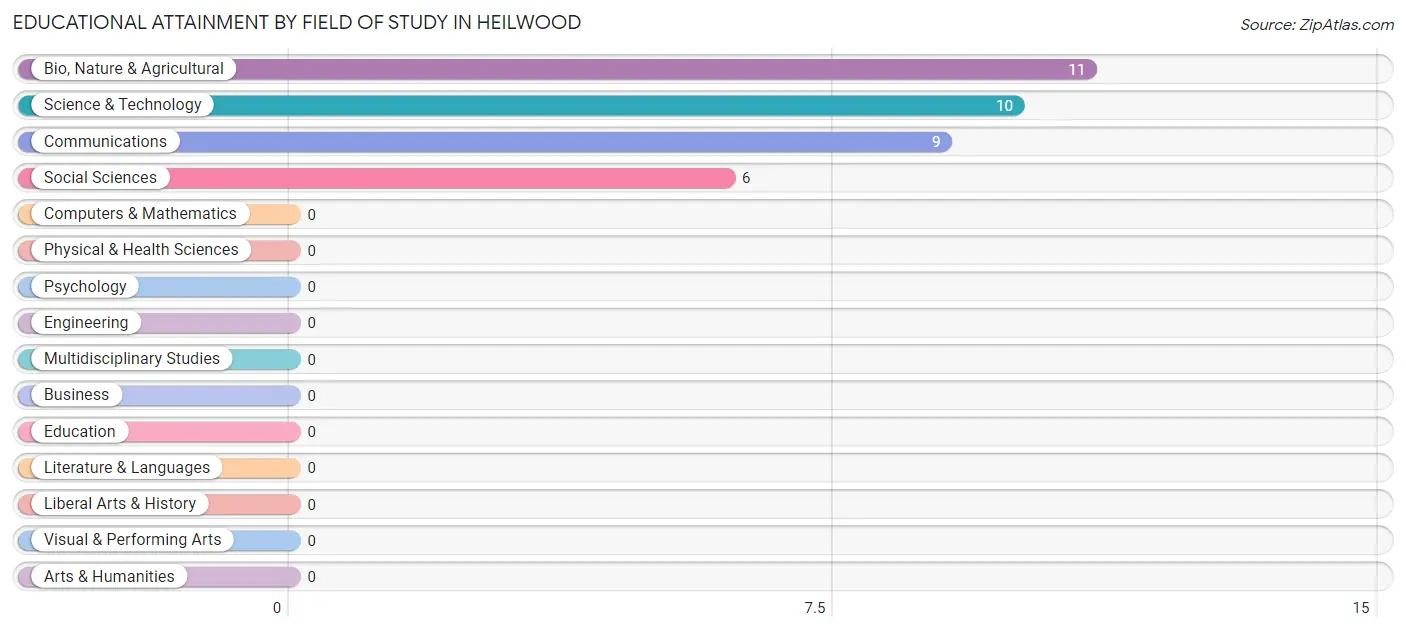
| Field of Study | # Graduates | % Graduates |
| Computers & Mathematics | 0 | 0.0% |
| Bio, Nature & Agricultural | 11 | 30.6% |
| Physical & Health Sciences | 0 | 0.0% |
| Psychology | 0 | 0.0% |
| Social Sciences | 6 | 16.7% |
| Engineering | 0 | 0.0% |
| Multidisciplinary Studies | 0 | 0.0% |
| Science & Technology | 10 | 27.8% |
| Business | 0 | 0.0% |
| Education | 0 | 0.0% |
| Literature & Languages | 0 | 0.0% |
| Liberal Arts & History | 0 | 0.0% |
| Visual & Performing Arts | 0 | 0.0% |
| Communications | 9 | 25.0% |
| Arts & Humanities | 0 | 0.0% |
| Total | 36 | 100.0% |
Transportation & Commute in Heilwood
Vehicle Availability by Sex in Heilwood
The most prevalent vehicle ownership categories in Heilwood are males with 3 vehicles (26, accounting for 53.1%) and females with 3 vehicles (39, making up 43.3%).
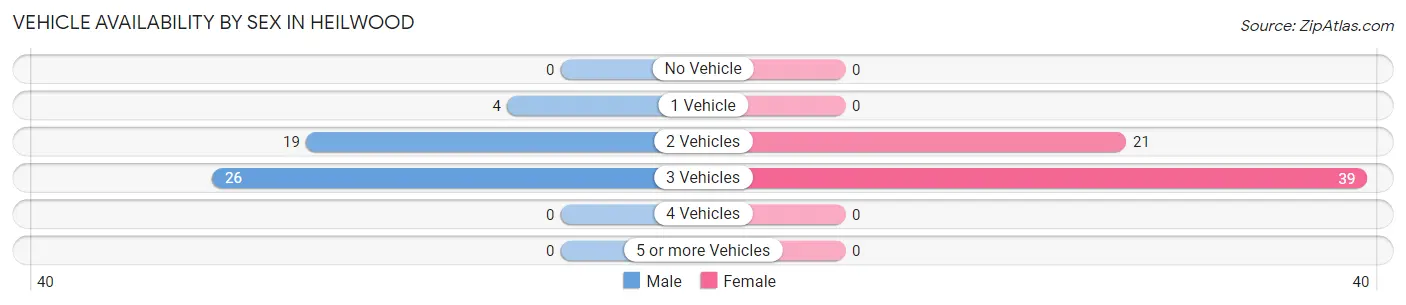
| Vehicles Available | Male | Female |
| No Vehicle | 0 (0.0%) | 0 (0.0%) |
| 1 Vehicle | 4 (8.2%) | 0 (0.0%) |
| 2 Vehicles | 19 (38.8%) | 21 (35.0%) |
| 3 Vehicles | 26 (53.1%) | 39 (65.0%) |
| 4 Vehicles | 0 (0.0%) | 0 (0.0%) |
| 5 or more Vehicles | 0 (0.0%) | 0 (0.0%) |
| Total | 49 (100.0%) | 60 (100.0%) |
Commute Time in Heilwood
The most frequently occuring commute durations in Heilwood are 20 to 24 minutes (36 commuters, 33.0%), 15 to 19 minutes (24 commuters, 22.0%), and 10 to 14 minutes (15 commuters, 13.8%).
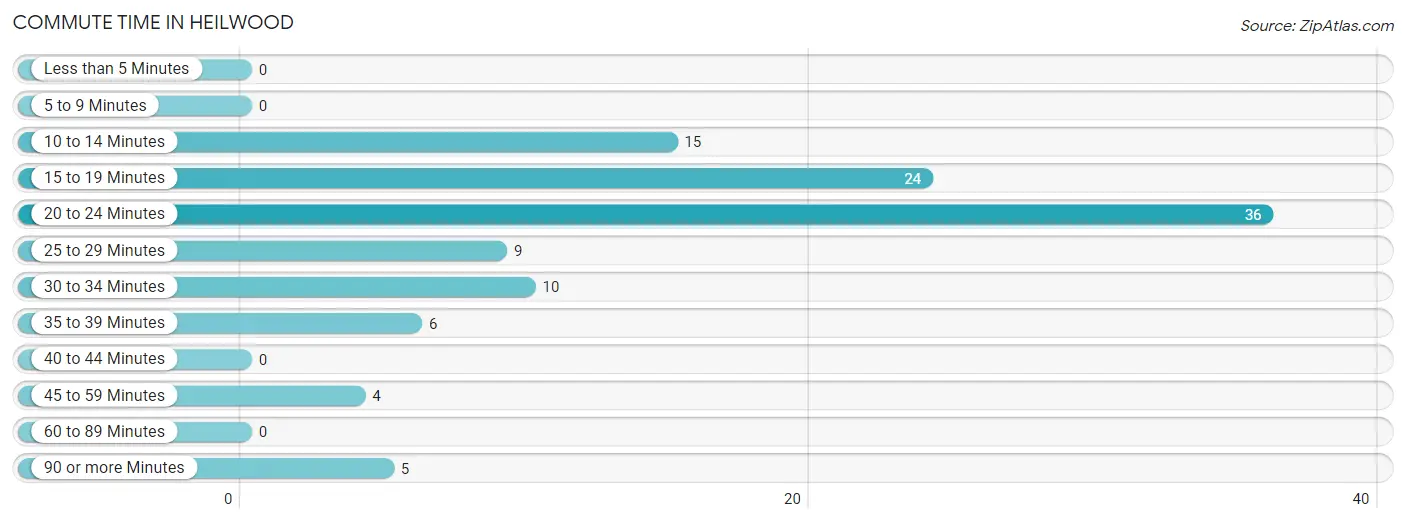
| Commute Time | # Commuters | % Commuters |
| Less than 5 Minutes | 0 | 0.0% |
| 5 to 9 Minutes | 0 | 0.0% |
| 10 to 14 Minutes | 15 | 13.8% |
| 15 to 19 Minutes | 24 | 22.0% |
| 20 to 24 Minutes | 36 | 33.0% |
| 25 to 29 Minutes | 9 | 8.3% |
| 30 to 34 Minutes | 10 | 9.2% |
| 35 to 39 Minutes | 6 | 5.5% |
| 40 to 44 Minutes | 0 | 0.0% |
| 45 to 59 Minutes | 4 | 3.7% |
| 60 to 89 Minutes | 0 | 0.0% |
| 90 or more Minutes | 5 | 4.6% |
Commute Time by Sex in Heilwood
The most common commute times in Heilwood are 15 to 19 minutes (24 commuters, 49.0%) for males and 20 to 24 minutes (26 commuters, 43.3%) for females.
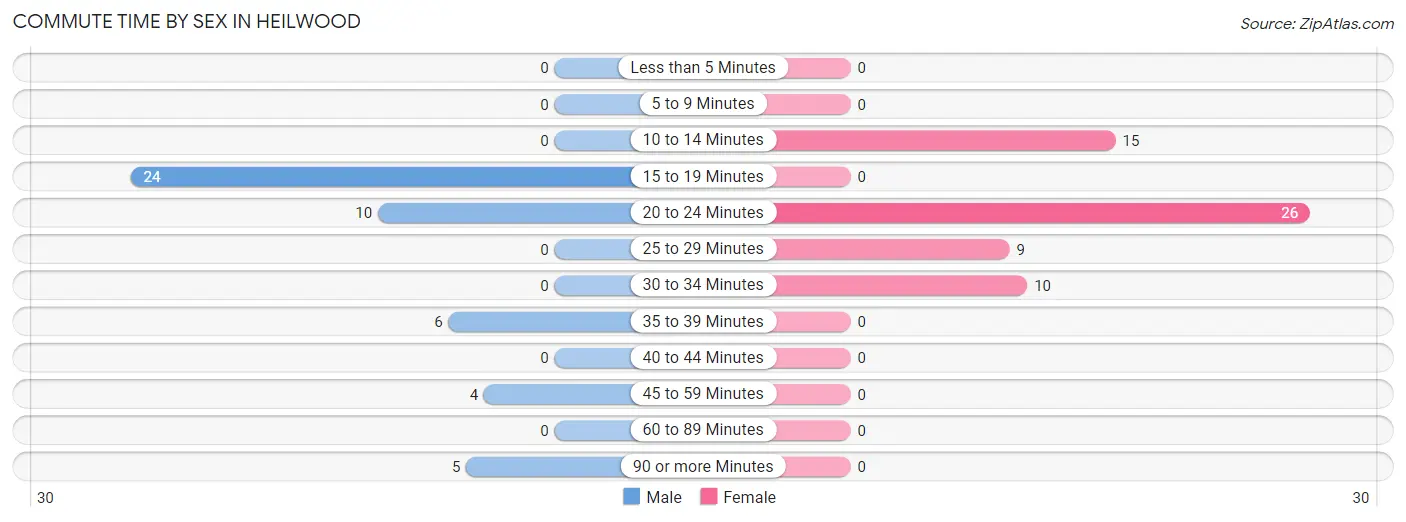
| Commute Time | Male | Female |
| Less than 5 Minutes | 0 (0.0%) | 0 (0.0%) |
| 5 to 9 Minutes | 0 (0.0%) | 0 (0.0%) |
| 10 to 14 Minutes | 0 (0.0%) | 15 (25.0%) |
| 15 to 19 Minutes | 24 (49.0%) | 0 (0.0%) |
| 20 to 24 Minutes | 10 (20.4%) | 26 (43.3%) |
| 25 to 29 Minutes | 0 (0.0%) | 9 (15.0%) |
| 30 to 34 Minutes | 0 (0.0%) | 10 (16.7%) |
| 35 to 39 Minutes | 6 (12.2%) | 0 (0.0%) |
| 40 to 44 Minutes | 0 (0.0%) | 0 (0.0%) |
| 45 to 59 Minutes | 4 (8.2%) | 0 (0.0%) |
| 60 to 89 Minutes | 0 (0.0%) | 0 (0.0%) |
| 90 or more Minutes | 5 (10.2%) | 0 (0.0%) |
Time of Departure to Work by Sex in Heilwood
The most frequent times of departure to work in Heilwood are 4:00 PM to 11:59 PM (13, 26.5%) for males and 12:00 PM to 3:59 PM (20, 33.3%) for females.
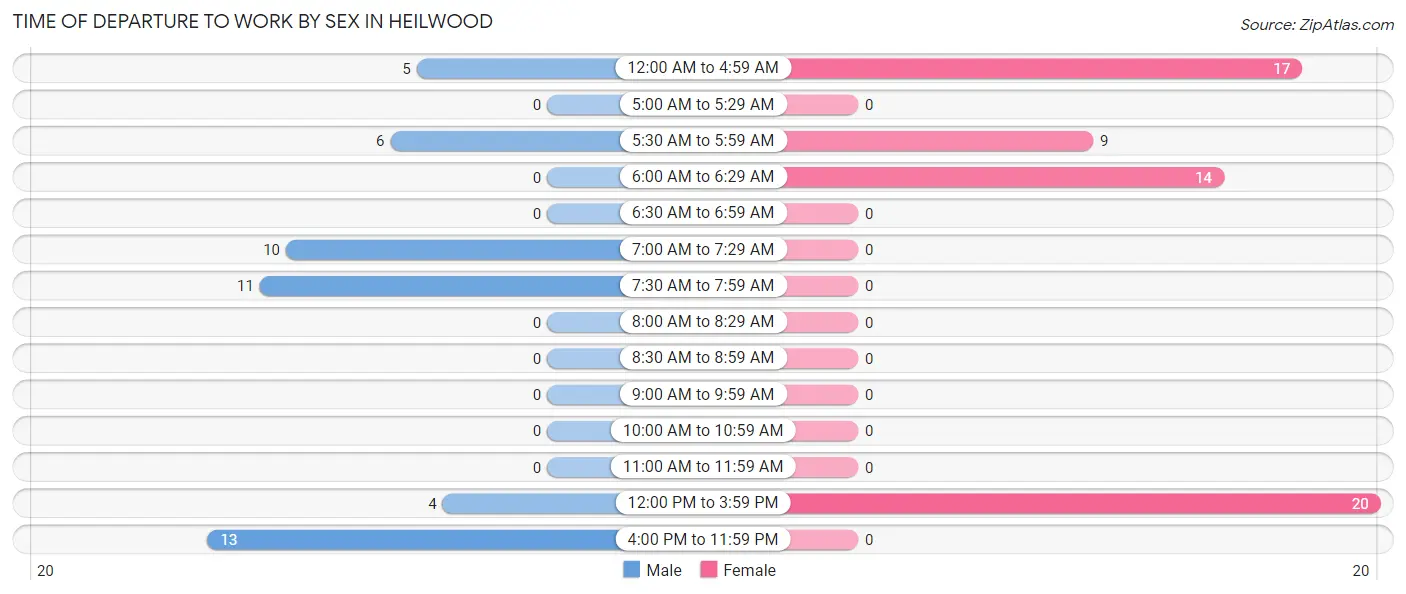
| Time of Departure | Male | Female |
| 12:00 AM to 4:59 AM | 5 (10.2%) | 17 (28.3%) |
| 5:00 AM to 5:29 AM | 0 (0.0%) | 0 (0.0%) |
| 5:30 AM to 5:59 AM | 6 (12.2%) | 9 (15.0%) |
| 6:00 AM to 6:29 AM | 0 (0.0%) | 14 (23.3%) |
| 6:30 AM to 6:59 AM | 0 (0.0%) | 0 (0.0%) |
| 7:00 AM to 7:29 AM | 10 (20.4%) | 0 (0.0%) |
| 7:30 AM to 7:59 AM | 11 (22.5%) | 0 (0.0%) |
| 8:00 AM to 8:29 AM | 0 (0.0%) | 0 (0.0%) |
| 8:30 AM to 8:59 AM | 0 (0.0%) | 0 (0.0%) |
| 9:00 AM to 9:59 AM | 0 (0.0%) | 0 (0.0%) |
| 10:00 AM to 10:59 AM | 0 (0.0%) | 0 (0.0%) |
| 11:00 AM to 11:59 AM | 0 (0.0%) | 0 (0.0%) |
| 12:00 PM to 3:59 PM | 4 (8.2%) | 20 (33.3%) |
| 4:00 PM to 11:59 PM | 13 (26.5%) | 0 (0.0%) |
| Total | 49 (100.0%) | 60 (100.0%) |
Housing Occupancy in Heilwood
Occupancy by Ownership in Heilwood
Of the total 110 dwellings in Heilwood, owner-occupied units account for 107 (97.3%), while renter-occupied units make up 3 (2.7%).
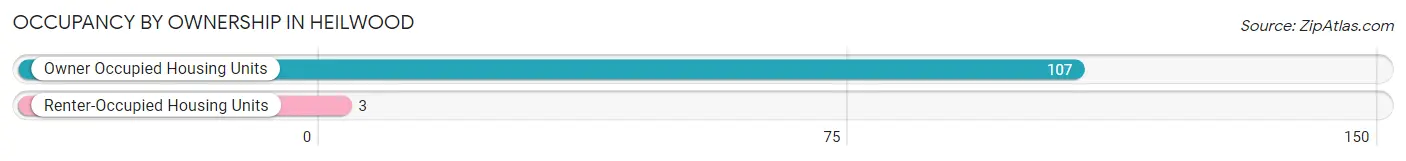
| Occupancy | # Housing Units | % Housing Units |
| Owner Occupied Housing Units | 107 | 97.3% |
| Renter-Occupied Housing Units | 3 | 2.7% |
| Total Occupied Housing Units | 110 | 100.0% |
Occupancy by Household Size in Heilwood
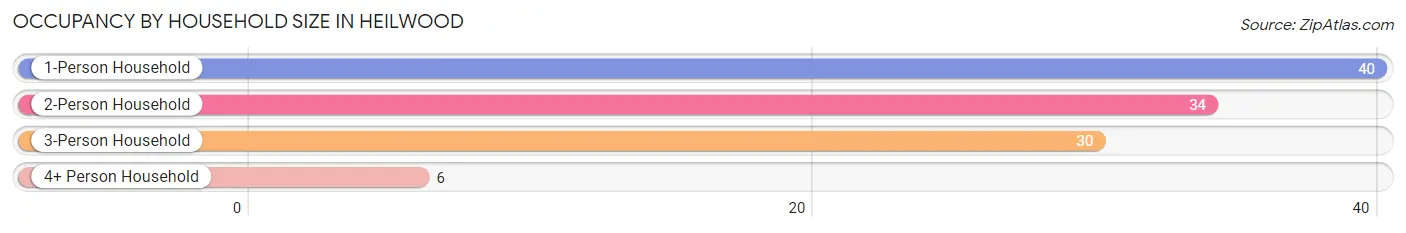
| Household Size | # Housing Units | % Housing Units |
| 1-Person Household | 40 | 36.4% |
| 2-Person Household | 34 | 30.9% |
| 3-Person Household | 30 | 27.3% |
| 4+ Person Household | 6 | 5.4% |
| Total Housing Units | 110 | 100.0% |
Occupancy by Ownership by Household Size in Heilwood
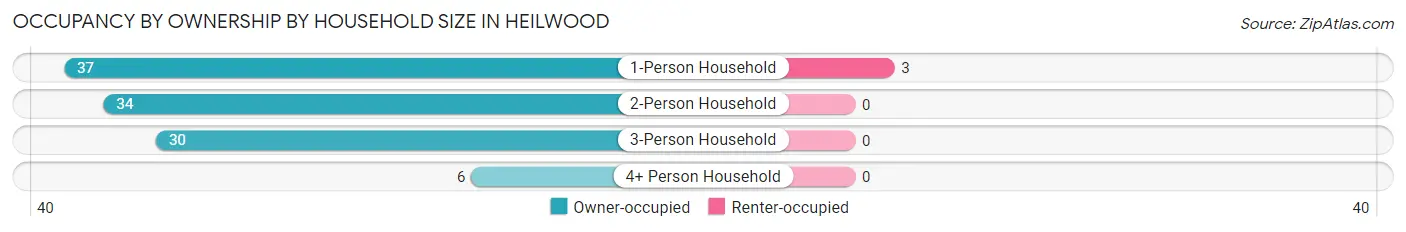
| Household Size | Owner-occupied | Renter-occupied |
| 1-Person Household | 37 (92.5%) | 3 (7.5%) |
| 2-Person Household | 34 (100.0%) | 0 (0.0%) |
| 3-Person Household | 30 (100.0%) | 0 (0.0%) |
| 4+ Person Household | 6 (100.0%) | 0 (0.0%) |
| Total Housing Units | 107 (97.3%) | 3 (2.7%) |
Occupancy by Educational Attainment in Heilwood
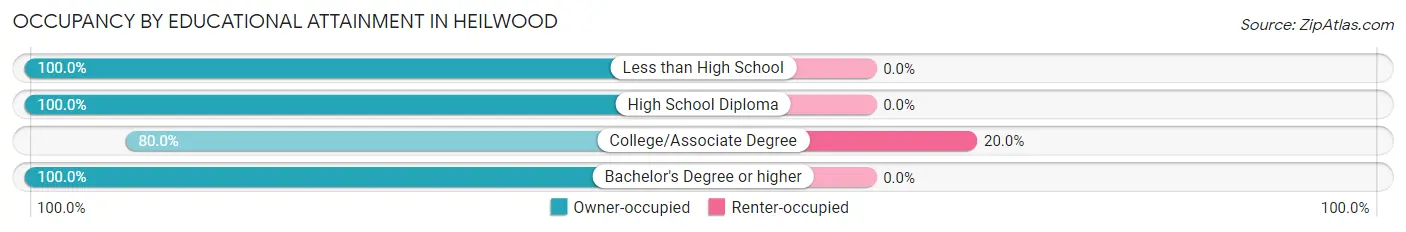
| Household Size | Owner-occupied | Renter-occupied |
| Less than High School | 13 (100.0%) | 0 (0.0%) |
| High School Diploma | 57 (100.0%) | 0 (0.0%) |
| College/Associate Degree | 12 (80.0%) | 3 (20.0%) |
| Bachelor's Degree or higher | 25 (100.0%) | 0 (0.0%) |
Occupancy by Age of Householder in Heilwood
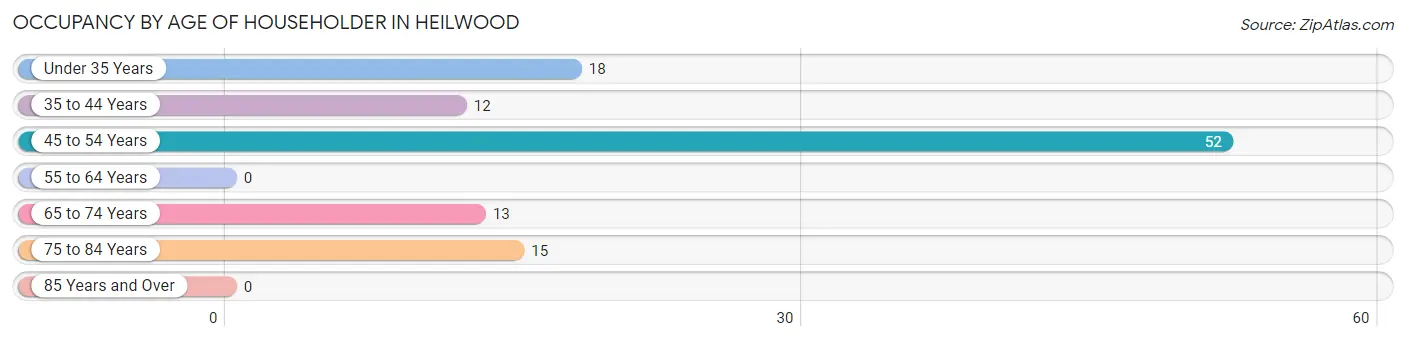
| Age Bracket | # Households | % Households |
| Under 35 Years | 18 | 16.4% |
| 35 to 44 Years | 12 | 10.9% |
| 45 to 54 Years | 52 | 47.3% |
| 55 to 64 Years | 0 | 0.0% |
| 65 to 74 Years | 13 | 11.8% |
| 75 to 84 Years | 15 | 13.6% |
| 85 Years and Over | 0 | 0.0% |
| Total | 110 | 100.0% |
Housing Finances in Heilwood
Median Income by Occupancy in Heilwood
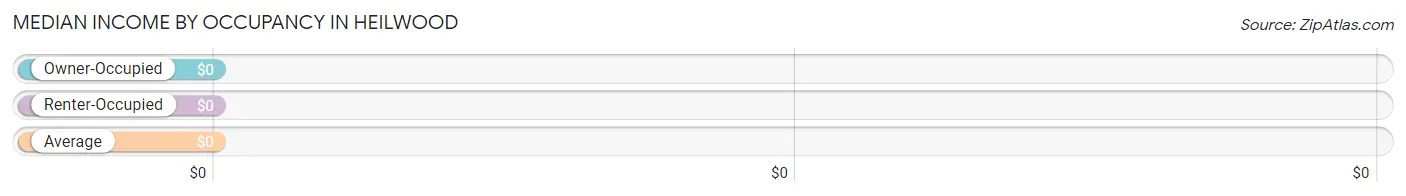
| Occupancy Type | # Households | Median Income |
| Owner-Occupied | 107 (97.3%) | $0 |
| Renter-Occupied | 3 (2.7%) | $0 |
| Average | 110 (100.0%) | $0 |
Occupancy by Householder Income Bracket in Heilwood
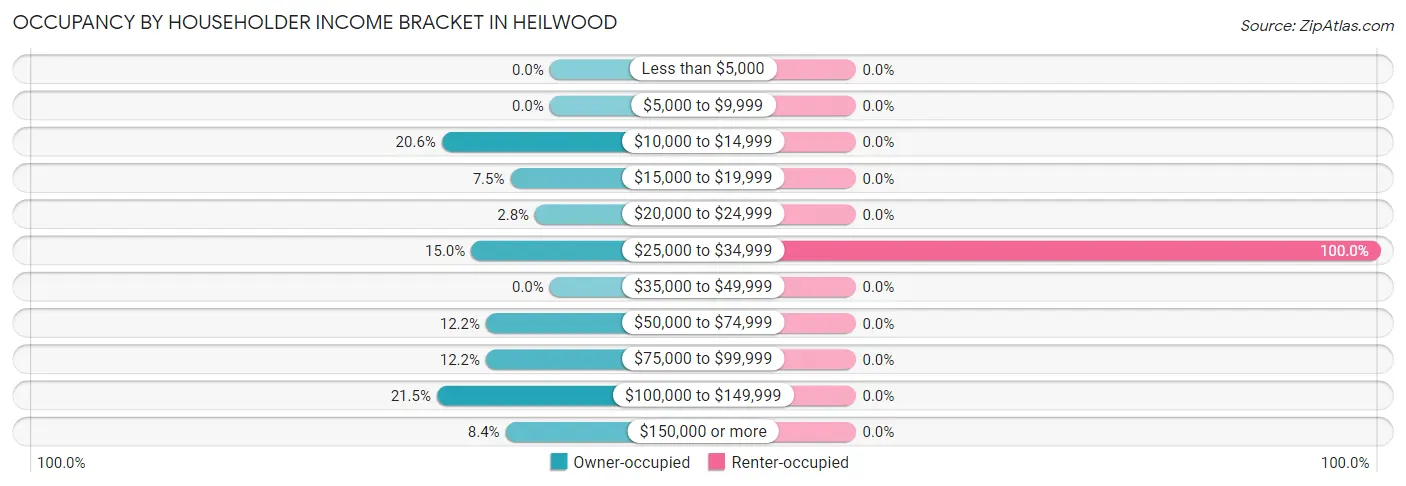
| Income Bracket | Owner-occupied | Renter-occupied |
| Less than $5,000 | 0 (0.0%) | 0 (0.0%) |
| $5,000 to $9,999 | 0 (0.0%) | 0 (0.0%) |
| $10,000 to $14,999 | 22 (20.6%) | 0 (0.0%) |
| $15,000 to $19,999 | 8 (7.5%) | 0 (0.0%) |
| $20,000 to $24,999 | 3 (2.8%) | 0 (0.0%) |
| $25,000 to $34,999 | 16 (14.9%) | 3 (100.0%) |
| $35,000 to $49,999 | 0 (0.0%) | 0 (0.0%) |
| $50,000 to $74,999 | 13 (12.1%) | 0 (0.0%) |
| $75,000 to $99,999 | 13 (12.1%) | 0 (0.0%) |
| $100,000 to $149,999 | 23 (21.5%) | 0 (0.0%) |
| $150,000 or more | 9 (8.4%) | 0 (0.0%) |
| Total | 107 (100.0%) | 3 (100.0%) |
Monthly Housing Cost Tiers in Heilwood
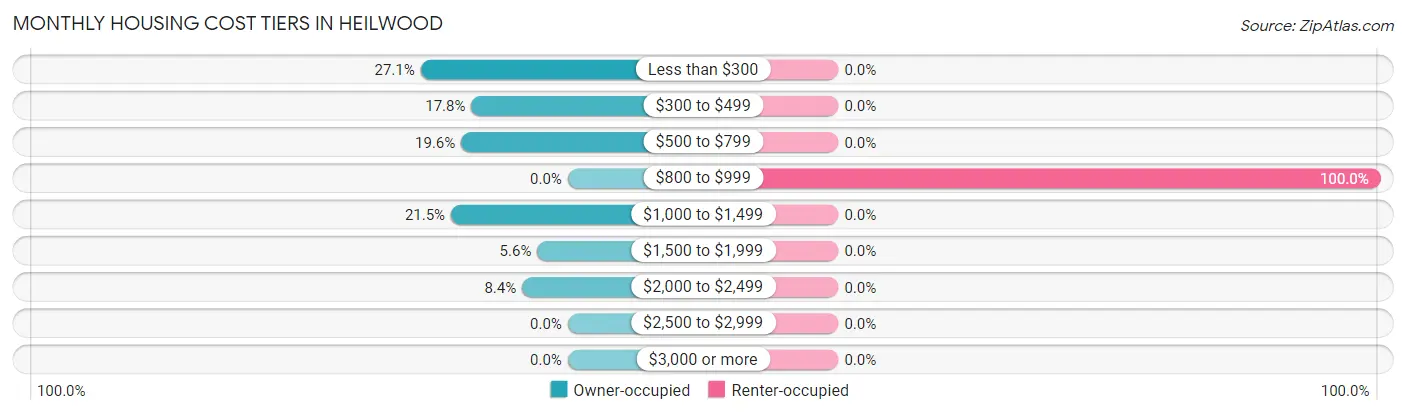
| Monthly Cost | Owner-occupied | Renter-occupied |
| Less than $300 | 29 (27.1%) | 0 (0.0%) |
| $300 to $499 | 19 (17.8%) | 0 (0.0%) |
| $500 to $799 | 21 (19.6%) | 0 (0.0%) |
| $800 to $999 | 0 (0.0%) | 3 (100.0%) |
| $1,000 to $1,499 | 23 (21.5%) | 0 (0.0%) |
| $1,500 to $1,999 | 6 (5.6%) | 0 (0.0%) |
| $2,000 to $2,499 | 9 (8.4%) | 0 (0.0%) |
| $2,500 to $2,999 | 0 (0.0%) | 0 (0.0%) |
| $3,000 or more | 0 (0.0%) | 0 (0.0%) |
| Total | 107 (100.0%) | 3 (100.0%) |
Physical Housing Characteristics in Heilwood
Housing Structures in Heilwood
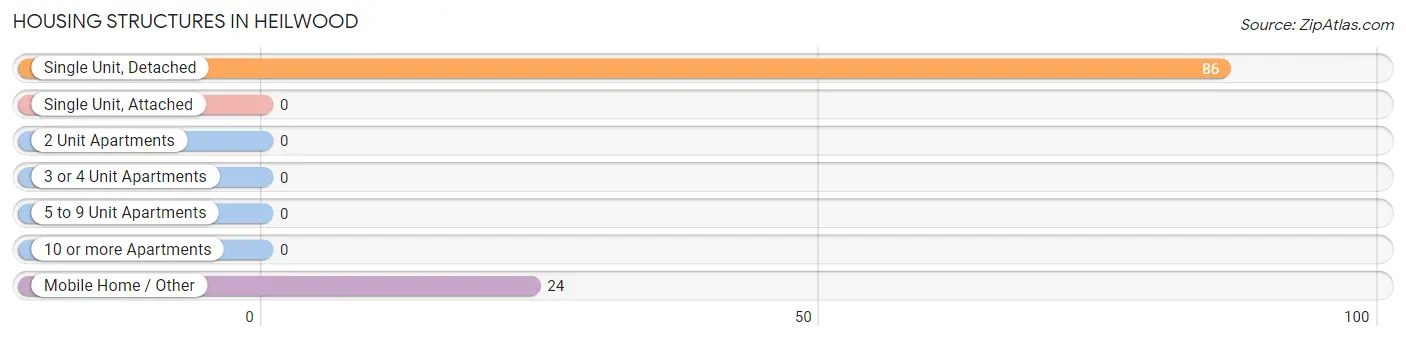
| Structure Type | # Housing Units | % Housing Units |
| Single Unit, Detached | 86 | 78.2% |
| Single Unit, Attached | 0 | 0.0% |
| 2 Unit Apartments | 0 | 0.0% |
| 3 or 4 Unit Apartments | 0 | 0.0% |
| 5 to 9 Unit Apartments | 0 | 0.0% |
| 10 or more Apartments | 0 | 0.0% |
| Mobile Home / Other | 24 | 21.8% |
| Total | 110 | 100.0% |
Housing Structures by Occupancy in Heilwood
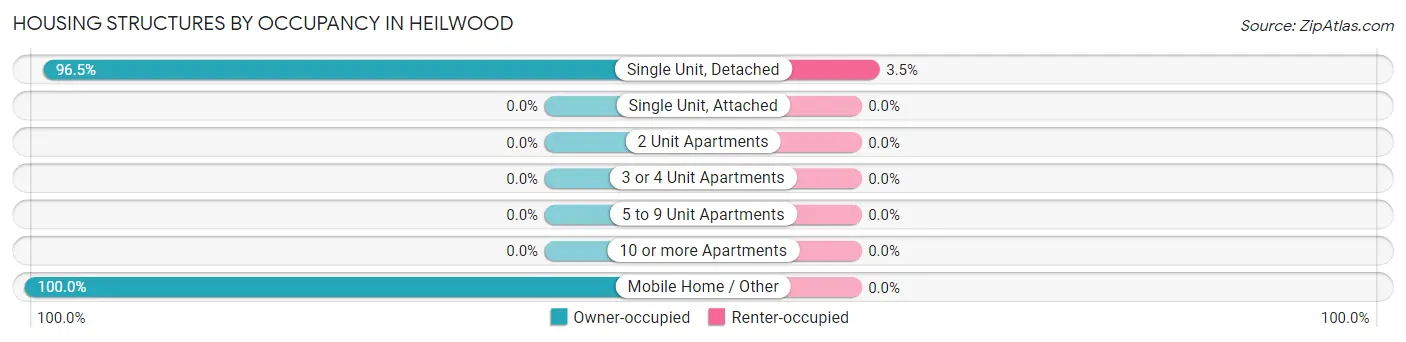
| Structure Type | Owner-occupied | Renter-occupied |
| Single Unit, Detached | 83 (96.5%) | 3 (3.5%) |
| Single Unit, Attached | 0 (0.0%) | 0 (0.0%) |
| 2 Unit Apartments | 0 (0.0%) | 0 (0.0%) |
| 3 or 4 Unit Apartments | 0 (0.0%) | 0 (0.0%) |
| 5 to 9 Unit Apartments | 0 (0.0%) | 0 (0.0%) |
| 10 or more Apartments | 0 (0.0%) | 0 (0.0%) |
| Mobile Home / Other | 24 (100.0%) | 0 (0.0%) |
| Total | 107 (97.3%) | 3 (2.7%) |
Housing Structures by Number of Rooms in Heilwood
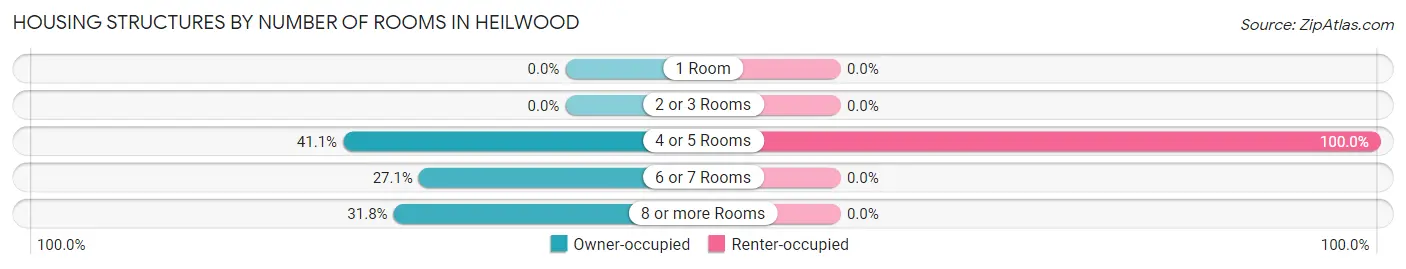
| Number of Rooms | Owner-occupied | Renter-occupied |
| 1 Room | 0 (0.0%) | 0 (0.0%) |
| 2 or 3 Rooms | 0 (0.0%) | 0 (0.0%) |
| 4 or 5 Rooms | 44 (41.1%) | 3 (100.0%) |
| 6 or 7 Rooms | 29 (27.1%) | 0 (0.0%) |
| 8 or more Rooms | 34 (31.8%) | 0 (0.0%) |
| Total | 107 (100.0%) | 3 (100.0%) |
Housing Structure by Heating Type in Heilwood
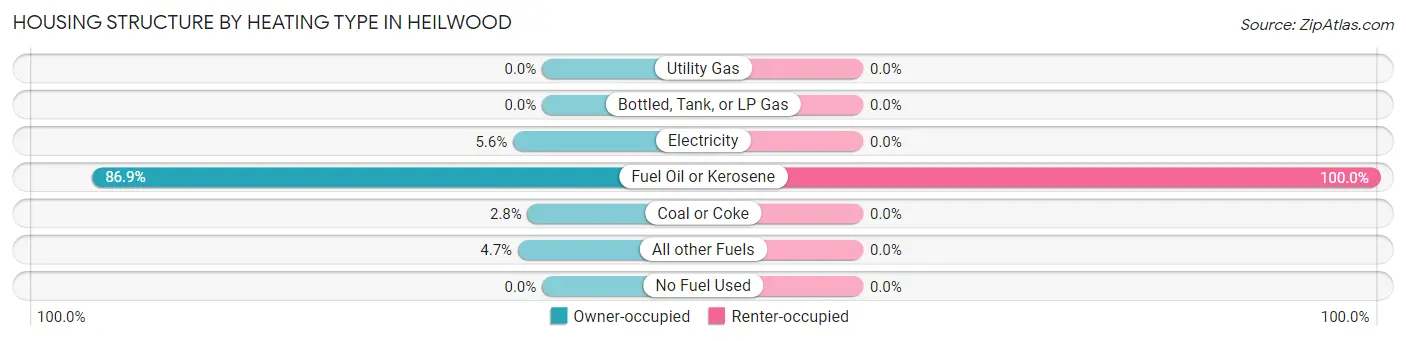
| Heating Type | Owner-occupied | Renter-occupied |
| Utility Gas | 0 (0.0%) | 0 (0.0%) |
| Bottled, Tank, or LP Gas | 0 (0.0%) | 0 (0.0%) |
| Electricity | 6 (5.6%) | 0 (0.0%) |
| Fuel Oil or Kerosene | 93 (86.9%) | 3 (100.0%) |
| Coal or Coke | 3 (2.8%) | 0 (0.0%) |
| All other Fuels | 5 (4.7%) | 0 (0.0%) |
| No Fuel Used | 0 (0.0%) | 0 (0.0%) |
| Total | 107 (100.0%) | 3 (100.0%) |
Household Vehicle Usage in Heilwood
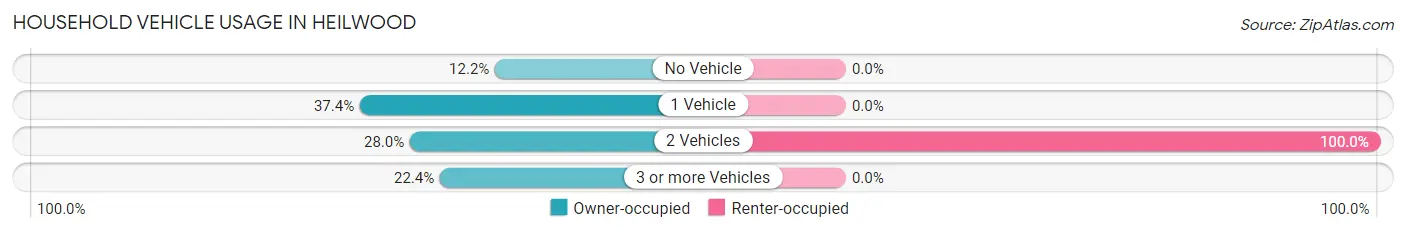
| Vehicles per Household | Owner-occupied | Renter-occupied |
| No Vehicle | 13 (12.1%) | 0 (0.0%) |
| 1 Vehicle | 40 (37.4%) | 0 (0.0%) |
| 2 Vehicles | 30 (28.0%) | 3 (100.0%) |
| 3 or more Vehicles | 24 (22.4%) | 0 (0.0%) |
| Total | 107 (100.0%) | 3 (100.0%) |
Real Estate & Mortgages in Heilwood
Real Estate and Mortgage Overview in Heilwood
| Characteristic | Without Mortgage | With Mortgage |
| Housing Units | 56 | 51 |
| Median Property Value | - | - |
| Median Household Income | $27,969 | $9 |
| Monthly Housing Costs | $297 | $0 |
| Real Estate Taxes | $495 | $0 |
Property Value by Mortgage Status in Heilwood
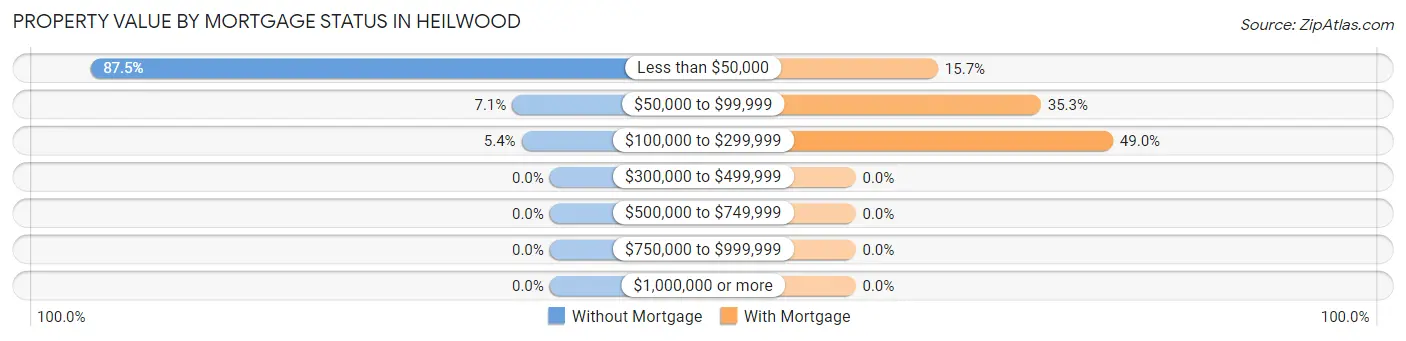
| Property Value | Without Mortgage | With Mortgage |
| Less than $50,000 | 49 (87.5%) | 8 (15.7%) |
| $50,000 to $99,999 | 4 (7.1%) | 18 (35.3%) |
| $100,000 to $299,999 | 3 (5.4%) | 25 (49.0%) |
| $300,000 to $499,999 | 0 (0.0%) | 0 (0.0%) |
| $500,000 to $749,999 | 0 (0.0%) | 0 (0.0%) |
| $750,000 to $999,999 | 0 (0.0%) | 0 (0.0%) |
| $1,000,000 or more | 0 (0.0%) | 0 (0.0%) |
| Total | 56 (100.0%) | 51 (100.0%) |
Household Income by Mortgage Status in Heilwood
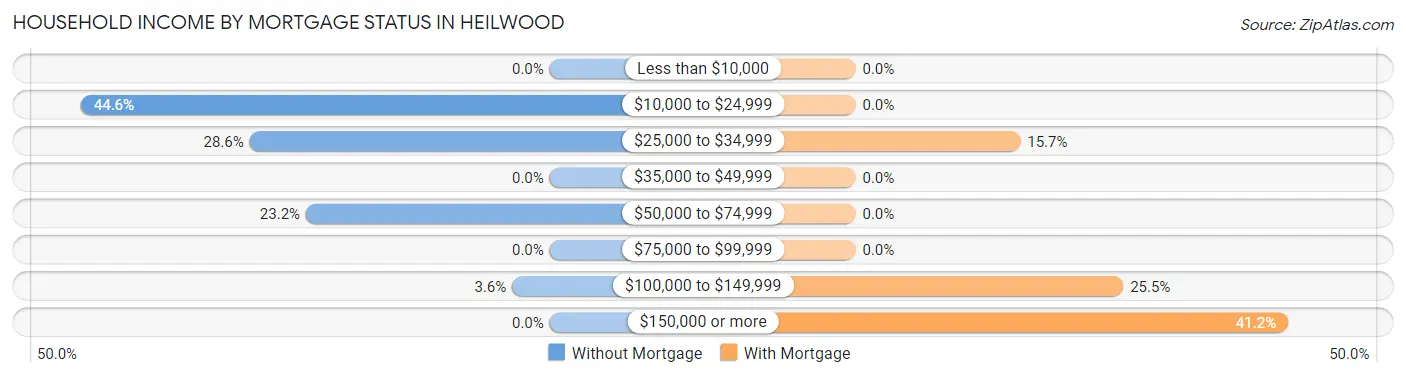
| Household Income | Without Mortgage | With Mortgage |
| Less than $10,000 | 0 (0.0%) | 0 (0.0%) |
| $10,000 to $24,999 | 25 (44.6%) | 0 (0.0%) |
| $25,000 to $34,999 | 16 (28.6%) | 8 (15.7%) |
| $35,000 to $49,999 | 0 (0.0%) | 0 (0.0%) |
| $50,000 to $74,999 | 13 (23.2%) | 0 (0.0%) |
| $75,000 to $99,999 | 0 (0.0%) | 0 (0.0%) |
| $100,000 to $149,999 | 2 (3.6%) | 13 (25.5%) |
| $150,000 or more | 0 (0.0%) | 21 (41.2%) |
| Total | 56 (100.0%) | 51 (100.0%) |
Property Value to Household Income Ratio in Heilwood
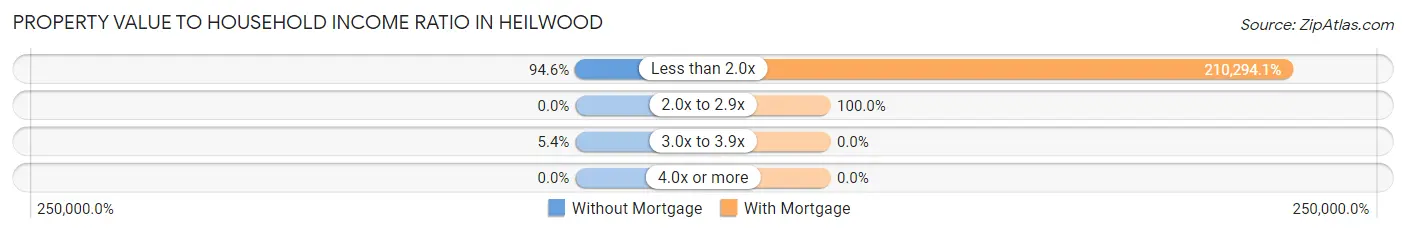
| Value-to-Income Ratio | Without Mortgage | With Mortgage |
| Less than 2.0x | 53 (94.6%) | 107,250 (210,294.1%) |
| 2.0x to 2.9x | 0 (0.0%) | 51 (100.0%) |
| 3.0x to 3.9x | 3 (5.4%) | 0 (0.0%) |
| 4.0x or more | 0 (0.0%) | 0 (0.0%) |
| Total | 56 (100.0%) | 51 (100.0%) |
Real Estate Taxes by Mortgage Status in Heilwood
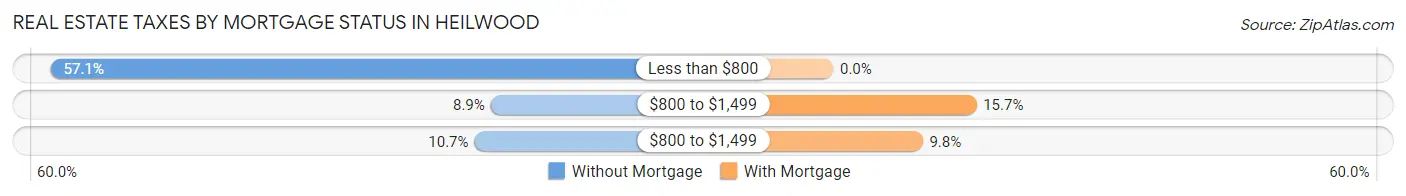
| Property Taxes | Without Mortgage | With Mortgage |
| Less than $800 | 32 (57.1%) | 0 (0.0%) |
| $800 to $1,499 | 5 (8.9%) | 8 (15.7%) |
| $800 to $1,499 | 6 (10.7%) | 5 (9.8%) |
| Total | 56 (100.0%) | 51 (100.0%) |
Health & Disability in Heilwood
Health Insurance Coverage by Age in Heilwood
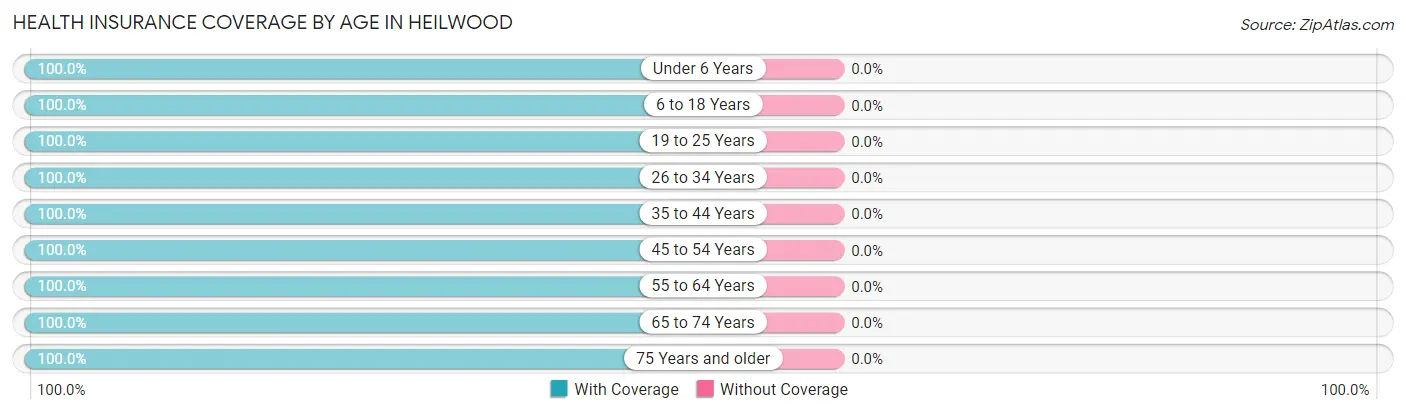
| Age Bracket | With Coverage | Without Coverage |
| Under 6 Years | 28 (100.0%) | 0 (0.0%) |
| 6 to 18 Years | 5 (100.0%) | 0 (0.0%) |
| 19 to 25 Years | 15 (100.0%) | 0 (0.0%) |
| 26 to 34 Years | 38 (100.0%) | 0 (0.0%) |
| 35 to 44 Years | 17 (100.0%) | 0 (0.0%) |
| 45 to 54 Years | 67 (100.0%) | 0 (0.0%) |
| 55 to 64 Years | 12 (100.0%) | 0 (0.0%) |
| 65 to 74 Years | 37 (100.0%) | 0 (0.0%) |
| 75 Years and older | 15 (100.0%) | 0 (0.0%) |
| Total | 234 (100.0%) | 0 (0.0%) |
Health Insurance Coverage by Citizenship Status in Heilwood
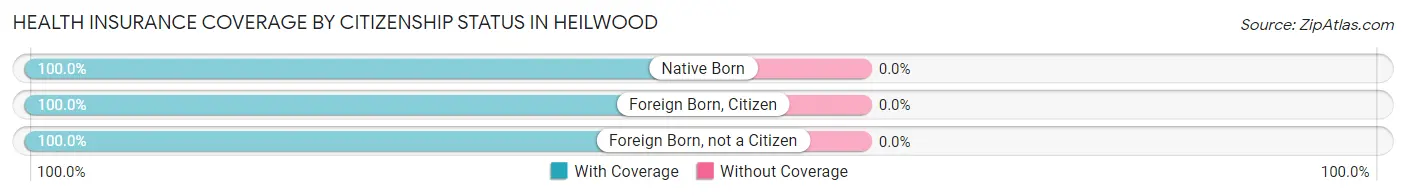
| Citizenship Status | With Coverage | Without Coverage |
| Native Born | 28 (100.0%) | 0 (0.0%) |
| Foreign Born, Citizen | 5 (100.0%) | 0 (0.0%) |
| Foreign Born, not a Citizen | 15 (100.0%) | 0 (0.0%) |
Health Insurance Coverage by Household Income in Heilwood
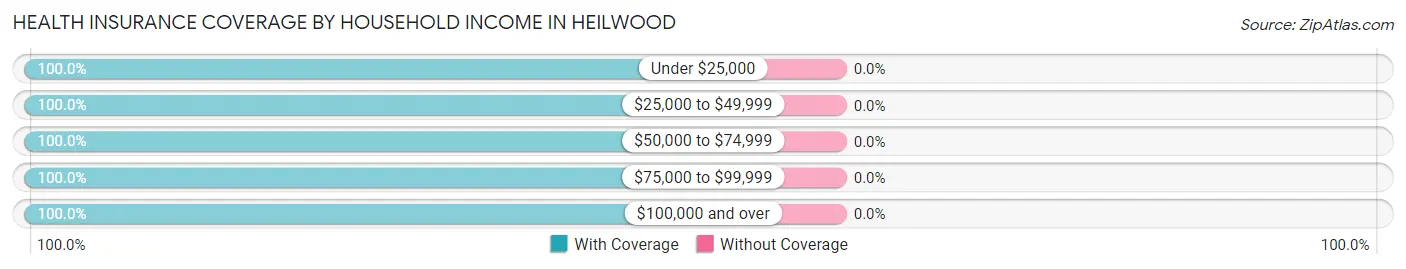
| Household Income | With Coverage | Without Coverage |
| Under $25,000 | 33 (100.0%) | 0 (0.0%) |
| $25,000 to $49,999 | 40 (100.0%) | 0 (0.0%) |
| $50,000 to $74,999 | 25 (100.0%) | 0 (0.0%) |
| $75,000 to $99,999 | 28 (100.0%) | 0 (0.0%) |
| $100,000 and over | 108 (100.0%) | 0 (0.0%) |
Public vs Private Health Insurance Coverage by Age in Heilwood
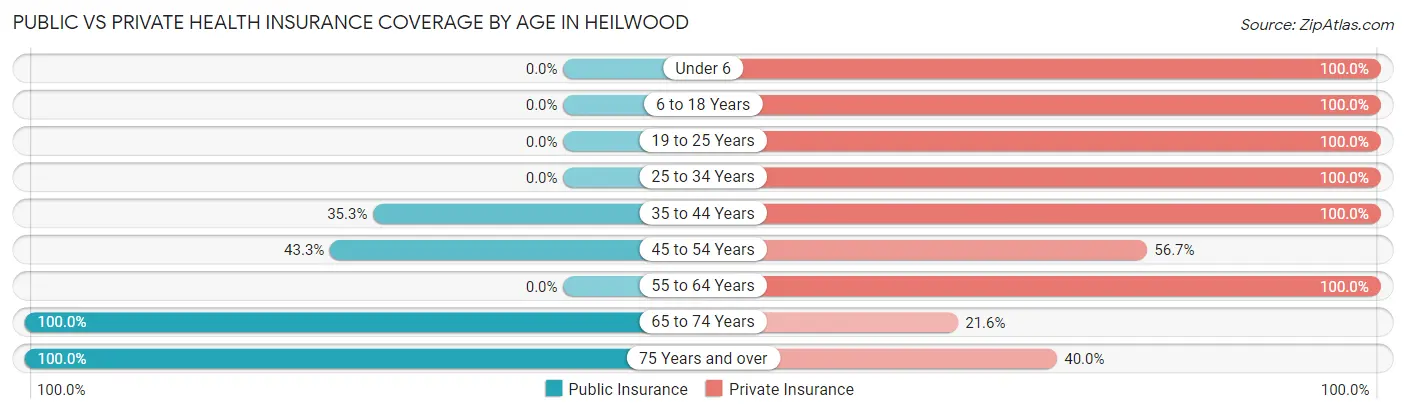
| Age Bracket | Public Insurance | Private Insurance |
| Under 6 | 0 (0.0%) | 28 (100.0%) |
| 6 to 18 Years | 0 (0.0%) | 5 (100.0%) |
| 19 to 25 Years | 0 (0.0%) | 15 (100.0%) |
| 25 to 34 Years | 0 (0.0%) | 38 (100.0%) |
| 35 to 44 Years | 6 (35.3%) | 17 (100.0%) |
| 45 to 54 Years | 29 (43.3%) | 38 (56.7%) |
| 55 to 64 Years | 0 (0.0%) | 12 (100.0%) |
| 65 to 74 Years | 37 (100.0%) | 8 (21.6%) |
| 75 Years and over | 15 (100.0%) | 6 (40.0%) |
| Total | 87 (37.2%) | 167 (71.4%) |
Disability Status by Sex by Age in Heilwood
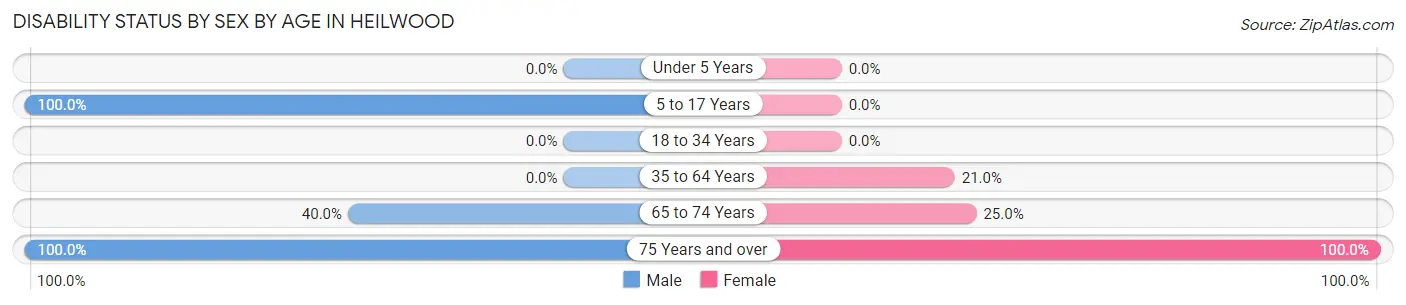
| Age Bracket | Male | Female |
| Under 5 Years | 0 (0.0%) | 0 (0.0%) |
| 5 to 17 Years | 5 (100.0%) | 0 (0.0%) |
| 18 to 34 Years | 0 (0.0%) | 0 (0.0%) |
| 35 to 64 Years | 0 (0.0%) | 13 (21.0%) |
| 65 to 74 Years | 2 (40.0%) | 8 (25.0%) |
| 75 Years and over | 6 (100.0%) | 9 (100.0%) |
Disability Class by Sex by Age in Heilwood
Disability Class: Hearing Difficulty
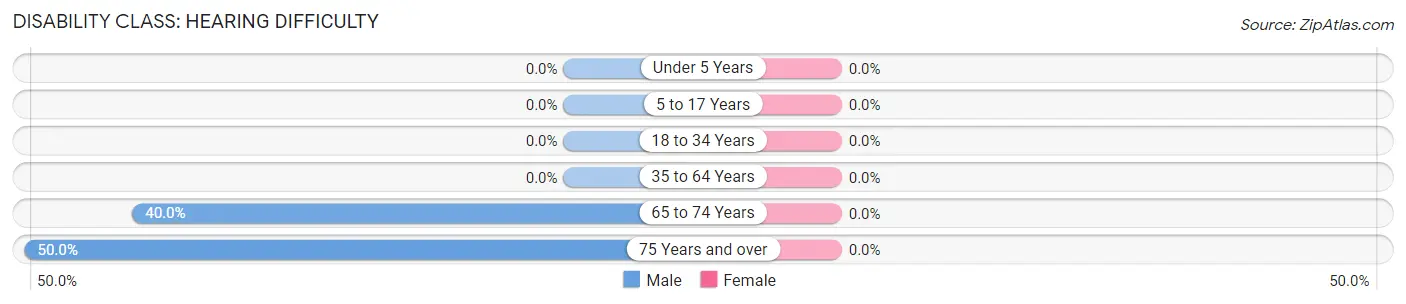
| Age Bracket | Male | Female |
| Under 5 Years | 0 (0.0%) | 0 (0.0%) |
| 5 to 17 Years | 0 (0.0%) | 0 (0.0%) |
| 18 to 34 Years | 0 (0.0%) | 0 (0.0%) |
| 35 to 64 Years | 0 (0.0%) | 0 (0.0%) |
| 65 to 74 Years | 2 (40.0%) | 0 (0.0%) |
| 75 Years and over | 3 (50.0%) | 0 (0.0%) |
Disability Class: Vision Difficulty
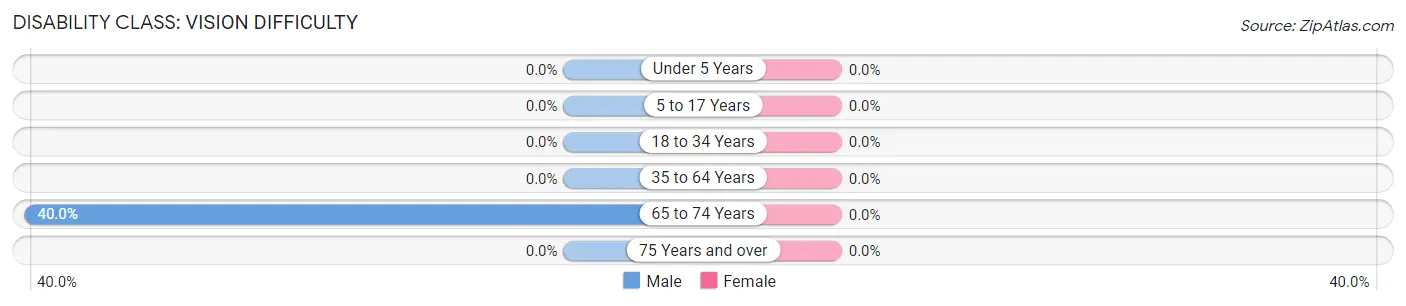
| Age Bracket | Male | Female |
| Under 5 Years | 0 (0.0%) | 0 (0.0%) |
| 5 to 17 Years | 0 (0.0%) | 0 (0.0%) |
| 18 to 34 Years | 0 (0.0%) | 0 (0.0%) |
| 35 to 64 Years | 0 (0.0%) | 0 (0.0%) |
| 65 to 74 Years | 2 (40.0%) | 0 (0.0%) |
| 75 Years and over | 0 (0.0%) | 0 (0.0%) |
Disability Class: Cognitive Difficulty
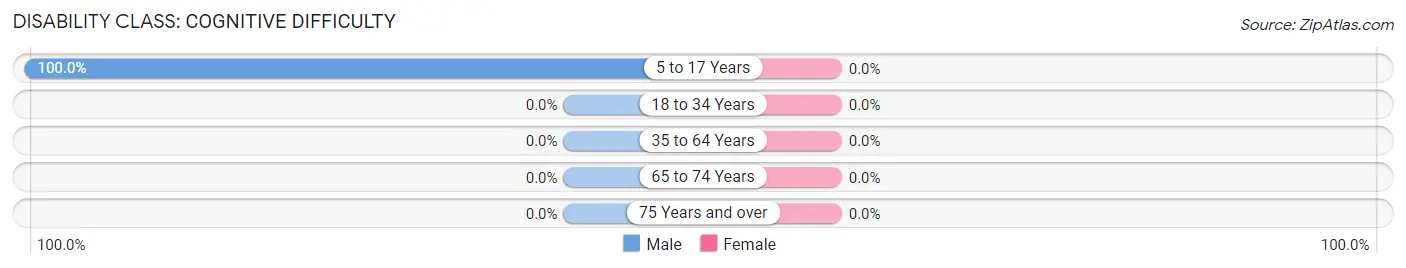
| Age Bracket | Male | Female |
| 5 to 17 Years | 5 (100.0%) | 0 (0.0%) |
| 18 to 34 Years | 0 (0.0%) | 0 (0.0%) |
| 35 to 64 Years | 0 (0.0%) | 0 (0.0%) |
| 65 to 74 Years | 0 (0.0%) | 0 (0.0%) |
| 75 Years and over | 0 (0.0%) | 0 (0.0%) |
Disability Class: Ambulatory Difficulty
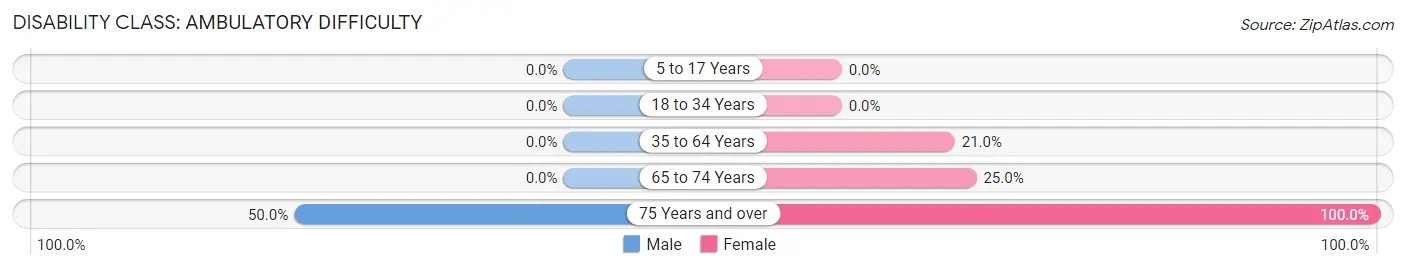
| Age Bracket | Male | Female |
| 5 to 17 Years | 0 (0.0%) | 0 (0.0%) |
| 18 to 34 Years | 0 (0.0%) | 0 (0.0%) |
| 35 to 64 Years | 0 (0.0%) | 13 (21.0%) |
| 65 to 74 Years | 0 (0.0%) | 8 (25.0%) |
| 75 Years and over | 3 (50.0%) | 9 (100.0%) |
Disability Class: Self-Care Difficulty
| Age Bracket | Male | Female |
| 5 to 17 Years | 0 (0.0%) | 0 (0.0%) |
| 18 to 34 Years | 0 (0.0%) | 0 (0.0%) |
| 35 to 64 Years | 0 (0.0%) | 0 (0.0%) |
| 65 to 74 Years | 0 (0.0%) | 0 (0.0%) |
| 75 Years and over | 0 (0.0%) | 0 (0.0%) |
Technology Access in Heilwood
Computing Device Access in Heilwood
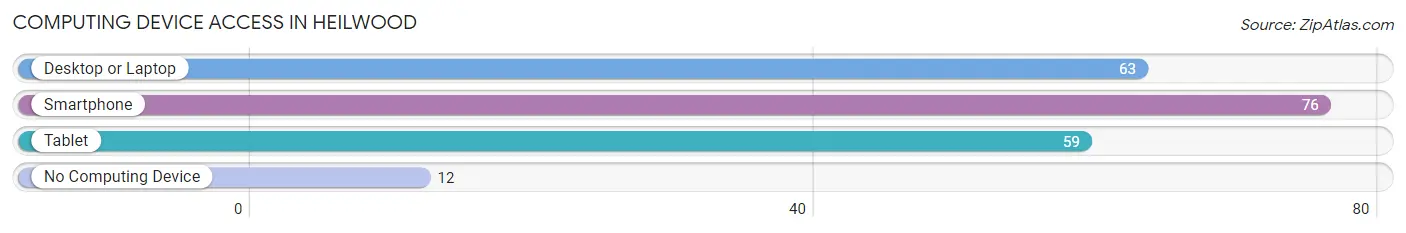
| Device Type | # Households | % Households |
| Desktop or Laptop | 63 | 57.3% |
| Smartphone | 76 | 69.1% |
| Tablet | 59 | 53.6% |
| No Computing Device | 12 | 10.9% |
| Total | 110 | 100.0% |
Internet Access in Heilwood
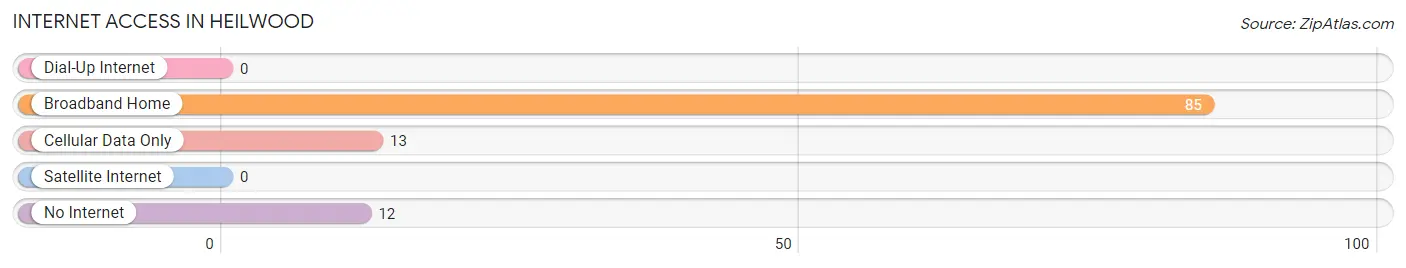
| Internet Type | # Households | % Households |
| Dial-Up Internet | 0 | 0.0% |
| Broadband Home | 85 | 77.3% |
| Cellular Data Only | 13 | 11.8% |
| Satellite Internet | 0 | 0.0% |
| No Internet | 12 | 10.9% |
| Total | 110 | 100.0% |
Heilwood Summary
Heilwood is a small borough located in Indiana County, Pennsylvania. It is situated in the foothills of the Allegheny Mountains, approximately 30 miles northeast of Pittsburgh. The population of Heilwood was 545 at the 2010 census.
Geography
Heilwood is located at 40°41'45" North, 79°14'45" West (40.695833, -79.245833). According to the United States Census Bureau, the borough has a total area of 0.3 square miles (0.8 km2), all of it land.
History
Heilwood was founded in 1891 by the Heilwood Coal Company. The company was founded by John Heil, a German immigrant who had come to the United States in 1881. Heilwood was named after him. The town was originally a coal mining town, and the coal industry was the main source of employment for the residents.
The town was incorporated in 1895. In the early 1900s, the town was home to a number of businesses, including a hotel, a general store, a post office, a bank, a barber shop, a blacksmith shop, and a movie theater.
In the 1950s, the coal industry began to decline, and the town's population began to decline as well. By the 1970s, the town had become a virtual ghost town. In the 1980s, the town began to experience a resurgence, as people began to move back to the area.
Economy
Today, Heilwood is a small, rural community. The town's economy is largely based on agriculture and tourism. The town is home to a number of small businesses, including a general store, a restaurant, a bar, and a bed and breakfast.
Demographics
As of the 2010 census, the population of Heilwood was 545. The racial makeup of the town was 97.3% White, 0.7% African American, 0.2% Native American, 0.2% Asian, 0.2% from other races, and 1.6% from two or more races. Hispanic or Latino of any race were 0.7% of the population.
The median income for a household in the town was $37,500, and the median income for a family was $41,250. The per capita income for the town was $17,845. About 11.2% of families and 13.2% of the population were below the poverty line, including 16.7% of those under age 18 and none of those age 65 or over.
Heilwood is served by the Indiana Area School District. The town is home to a number of churches, including the Heilwood United Methodist Church, the Heilwood Presbyterian Church, and the Heilwood Baptist Church. The town also has a volunteer fire department.
Common Questions
What is Per Capita Income in Heilwood?
Per Capita income in Heilwood is $33,488.
What is the Median Family Income in Heilwood?
Median Family Income in Heilwood is $94,423.
What is Inequality or Gini Index in Heilwood?
Inequality or Gini Index in Heilwood is 0.44.
What is the Total Population of Heilwood?
Total Population of Heilwood is 234.
What is the Total Male Population of Heilwood?
Total Male Population of Heilwood is 75.
What is the Total Female Population of Heilwood?
Total Female Population of Heilwood is 159.
What is the Ratio of Males per 100 Females in Heilwood?
There are 47.17 Males per 100 Females in Heilwood.
What is the Ratio of Females per 100 Males in Heilwood?
There are 212.00 Females per 100 Males in Heilwood.
What is the Median Population Age in Heilwood?
Median Population Age in Heilwood is 49.5 Years.
What is the Average Family Size in Heilwood
Average Family Size in Heilwood is 2.8 People.
What is the Average Household Size in Heilwood
Average Household Size in Heilwood is 2.1 People.
How Large is the Labor Force in Heilwood?
There are 114 People in the Labor Forcein in Heilwood.
What is the Percentage of People in the Labor Force in Heilwood?
56.7% of People are in the Labor Force in Heilwood.
What is the Unemployment Rate in Heilwood?
Unemployment Rate in Heilwood is 4.4%.