Hawk Run, PA Map & Demographics
Hawk Run Map
Hawk Run Overview
$25,395
PER CAPITA INCOME
$50,781
AVG FAMILY INCOME
$50,703
AVG HOUSEHOLD INCOME
0.44
INEQUALITY / GINI INDEX
564
TOTAL POPULATION
255
MALE POPULATION
309
FEMALE POPULATION
82.52
MALES / 100 FEMALES
121.18
FEMALES / 100 MALES
38.9
MEDIAN AGE
2.6
AVG FAMILY SIZE
2.3
AVG HOUSEHOLD SIZE
268
LABOR FORCE [ PEOPLE ]
62.9%
PERCENT IN LABOR FORCE
33.2%
UNEMPLOYMENT RATE
Hawk Run Zip Codes
Hawk Run Area Codes
Income in Hawk Run
Income Overview in Hawk Run
Per Capita Income in Hawk Run is $25,395, while median incomes of families and households are $50,781 and $50,703 respectively.
| Characteristic | Number | Measure |
| Per Capita Income | 564 | $25,395 |
| Median Family Income | 186 | $50,781 |
| Mean Family Income | 186 | $56,179 |
| Median Household Income | 248 | $50,703 |
| Mean Household Income | 248 | $57,579 |
| Income Deficit | 186 | $0 |
| Wage / Income Gap (%) | 564 | 0.00% |
| Wage / Income Gap ($) | 564 | 100.00¢ per $1 |
| Gini / Inequality Index | 564 | 0.44 |
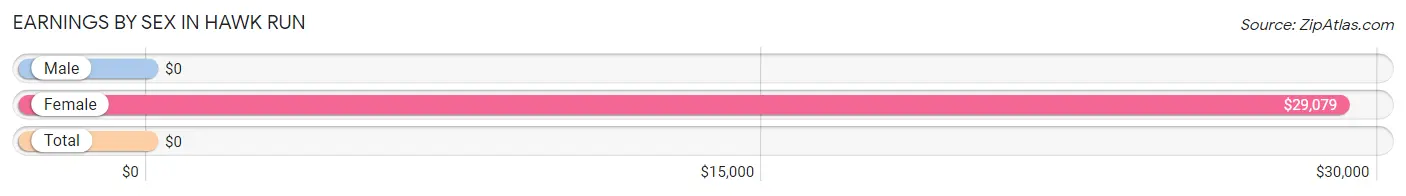
Earnings by Sex in Hawk Run
| Sex | Number | Average Earnings |
| Male | 166 (61.9%) | $0 |
| Female | 102 (38.1%) | $29,079 |
| Total | 268 (100.0%) | $0 |
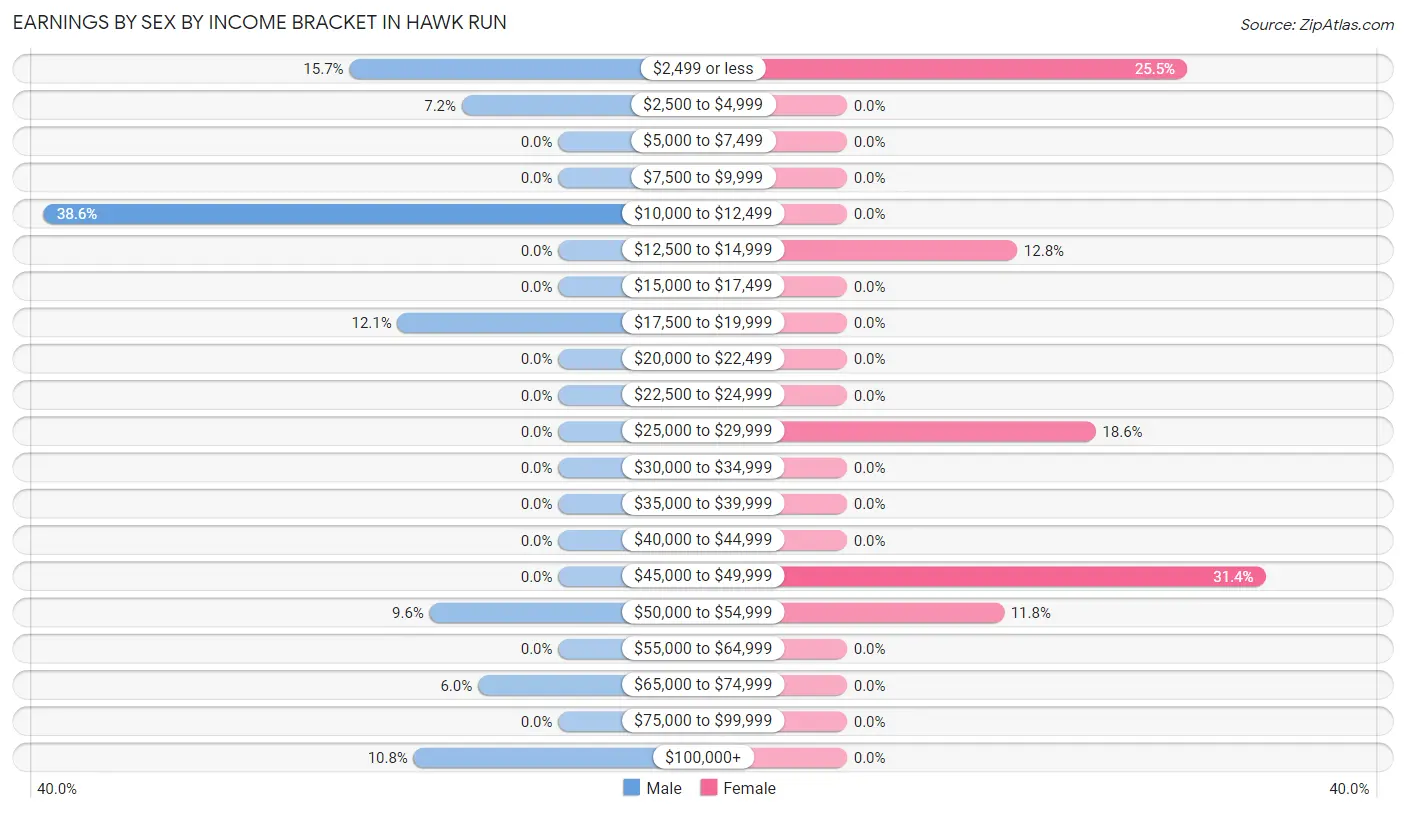
Earnings by Sex by Income Bracket in Hawk Run
The most common earnings brackets in Hawk Run are $10,000 to $12,499 for men (64 | 38.6%) and $45,000 to $49,999 for women (32 | 31.4%).
| Income | Male | Female |
| $2,499 or less | 26 (15.7%) | 26 (25.5%) |
| $2,500 to $4,999 | 12 (7.2%) | 0 (0.0%) |
| $5,000 to $7,499 | 0 (0.0%) | 0 (0.0%) |
| $7,500 to $9,999 | 0 (0.0%) | 0 (0.0%) |
| $10,000 to $12,499 | 64 (38.6%) | 0 (0.0%) |
| $12,500 to $14,999 | 0 (0.0%) | 13 (12.8%) |
| $15,000 to $17,499 | 0 (0.0%) | 0 (0.0%) |
| $17,500 to $19,999 | 20 (12.0%) | 0 (0.0%) |
| $20,000 to $22,499 | 0 (0.0%) | 0 (0.0%) |
| $22,500 to $24,999 | 0 (0.0%) | 0 (0.0%) |
| $25,000 to $29,999 | 0 (0.0%) | 19 (18.6%) |
| $30,000 to $34,999 | 0 (0.0%) | 0 (0.0%) |
| $35,000 to $39,999 | 0 (0.0%) | 0 (0.0%) |
| $40,000 to $44,999 | 0 (0.0%) | 0 (0.0%) |
| $45,000 to $49,999 | 0 (0.0%) | 32 (31.4%) |
| $50,000 to $54,999 | 16 (9.6%) | 12 (11.8%) |
| $55,000 to $64,999 | 0 (0.0%) | 0 (0.0%) |
| $65,000 to $74,999 | 10 (6.0%) | 0 (0.0%) |
| $75,000 to $99,999 | 0 (0.0%) | 0 (0.0%) |
| $100,000+ | 18 (10.8%) | 0 (0.0%) |
| Total | 166 (100.0%) | 102 (100.0%) |
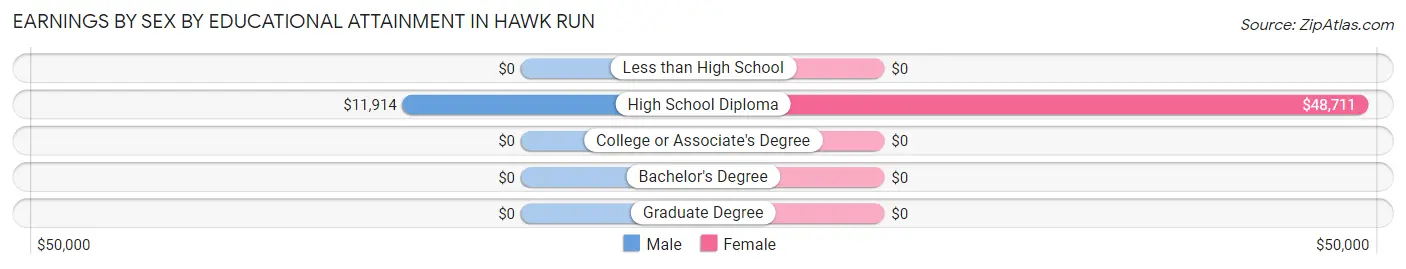
Earnings by Sex by Educational Attainment in Hawk Run
| Educational Attainment | Male Income | Female Income |
| Less than High School | - | - |
| High School Diploma | $11,914 | $48,711 |
| College or Associate's Degree | - | - |
| Bachelor's Degree | - | - |
| Graduate Degree | - | - |
| Total | - | - |
Family Income in Hawk Run
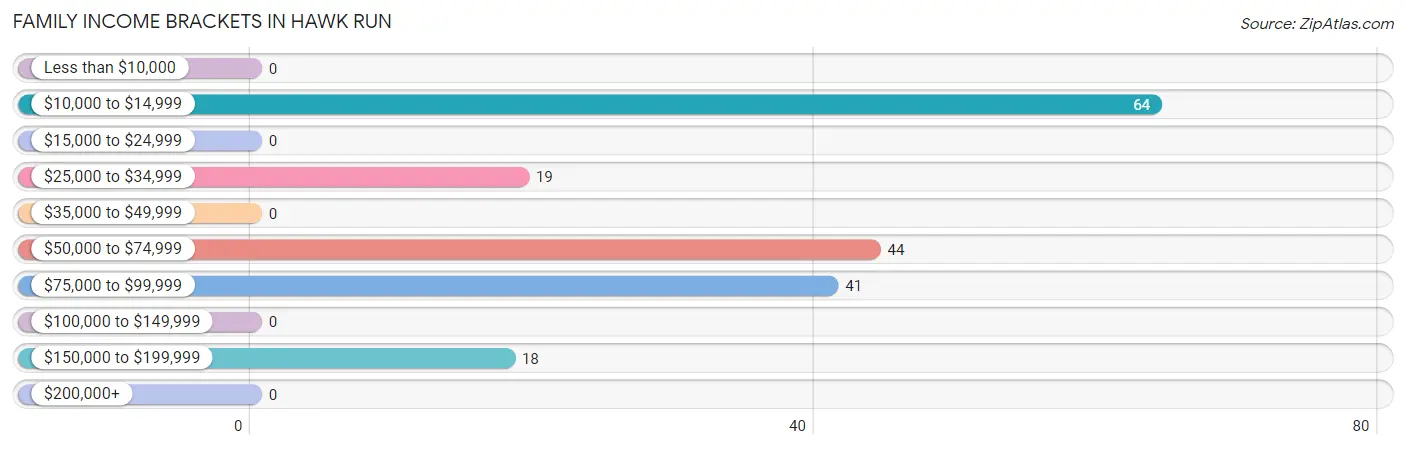
Family Income Brackets in Hawk Run
According to the Hawk Run family income data, there are 64 families falling into the $10,000 to $14,999 income range, which is the most common income bracket and makes up 34.4% of all families.
| Income Bracket | # Families | % Families |
| Less than $10,000 | 0 | 0.0% |
| $10,000 to $14,999 | 64 | 34.4% |
| $15,000 to $24,999 | 0 | 0.0% |
| $25,000 to $34,999 | 19 | 10.2% |
| $35,000 to $49,999 | 0 | 0.0% |
| $50,000 to $74,999 | 44 | 23.7% |
| $75,000 to $99,999 | 41 | 22.0% |
| $100,000 to $149,999 | 0 | 0.0% |
| $150,000 to $199,999 | 18 | 9.7% |
| $200,000+ | 0 | 0.0% |
Family Income by Famaliy Size in Hawk Run
| Income Bracket | # Families | Median Income |
| 2-Person Families | 62 (33.3%) | $0 |
| 3-Person Families | 124 (66.7%) | $0 |
| 4-Person Families | 0 (0.0%) | $0 |
| 5-Person Families | 0 (0.0%) | $0 |
| 6-Person Families | 0 (0.0%) | $0 |
| 7+ Person Families | 0 (0.0%) | $0 |
| Total | 186 (100.0%) | $50,781 |
Family Income by Number of Earners in Hawk Run
| Number of Earners | # Families | Median Income |
| No Earners | 32 (17.2%) | $0 |
| 1 Earner | 92 (49.5%) | $0 |
| 2 Earners | 18 (9.7%) | $0 |
| 3+ Earners | 44 (23.7%) | $0 |
| Total | 186 (100.0%) | $50,781 |
Household Income in Hawk Run
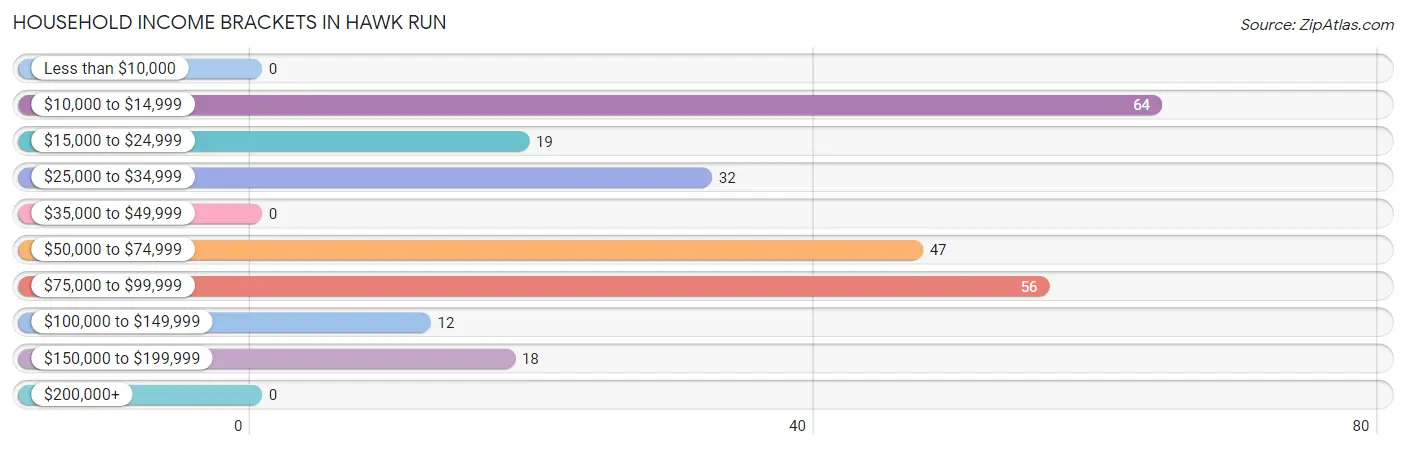
Household Income Brackets in Hawk Run
With 64 households falling in the category, the $10,000 to $14,999 income range is the most frequent in Hawk Run, accounting for 25.8% of all households.
| Income Bracket | # Households | % Households |
| Less than $10,000 | 0 | 0.0% |
| $10,000 to $14,999 | 64 | 25.8% |
| $15,000 to $24,999 | 19 | 7.7% |
| $25,000 to $34,999 | 32 | 12.9% |
| $35,000 to $49,999 | 0 | 0.0% |
| $50,000 to $74,999 | 47 | 19.0% |
| $75,000 to $99,999 | 56 | 22.6% |
| $100,000 to $149,999 | 12 | 4.8% |
| $150,000 to $199,999 | 18 | 7.3% |
| $200,000+ | 0 | 0.0% |
Household Income by Householder Age in Hawk Run
The median household income in Hawk Run is $50,703, with the highest median household income of $56,750 found in the 45 to 64 years age bracket for the primary householder. A total of 41 households (16.5%) fall into this category.
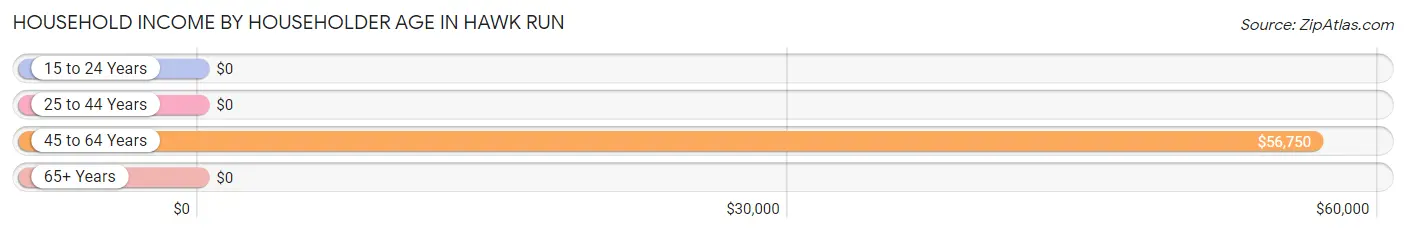
| Income Bracket | # Households | Median Income |
| 15 to 24 Years | 0 (0.0%) | $0 |
| 25 to 44 Years | 126 (50.8%) | $0 |
| 45 to 64 Years | 41 (16.5%) | $56,750 |
| 65+ Years | 81 (32.7%) | $0 |
| Total | 248 (100.0%) | $50,703 |
Poverty in Hawk Run
Income Below Poverty by Sex and Age in Hawk Run
With 25.1% poverty level for males and 40.8% for females among the residents of Hawk Run, 35 to 44 year old males and 6 to 11 year old females are the most vulnerable to poverty, with 64 males (78.0%) and 50 females (100.0%) in their respective age groups living below the poverty level.
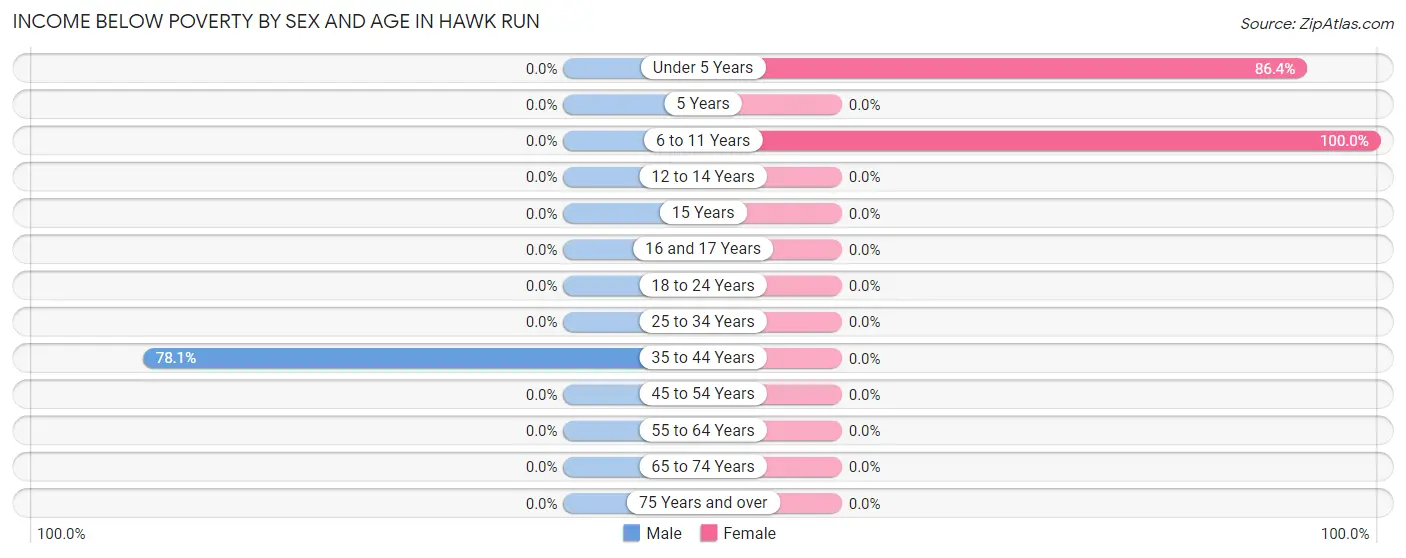
| Age Bracket | Male | Female |
| Under 5 Years | 0 (0.0%) | 76 (86.4%) |
| 5 Years | 0 (0.0%) | 0 (0.0%) |
| 6 to 11 Years | 0 (0.0%) | 50 (100.0%) |
| 12 to 14 Years | 0 (0.0%) | 0 (0.0%) |
| 15 Years | 0 (0.0%) | 0 (0.0%) |
| 16 and 17 Years | 0 (0.0%) | 0 (0.0%) |
| 18 to 24 Years | 0 (0.0%) | 0 (0.0%) |
| 25 to 34 Years | 0 (0.0%) | 0 (0.0%) |
| 35 to 44 Years | 64 (78.0%) | 0 (0.0%) |
| 45 to 54 Years | 0 (0.0%) | 0 (0.0%) |
| 55 to 64 Years | 0 (0.0%) | 0 (0.0%) |
| 65 to 74 Years | 0 (0.0%) | 0 (0.0%) |
| 75 Years and over | 0 (0.0%) | 0 (0.0%) |
| Total | 64 (25.1%) | 126 (40.8%) |
Income Above Poverty by Sex and Age in Hawk Run
According to the poverty statistics in Hawk Run, males aged 16 and 17 years and females aged 16 and 17 years are the age groups that are most secure financially, with 100.0% of males and 100.0% of females in these age groups living above the poverty line.
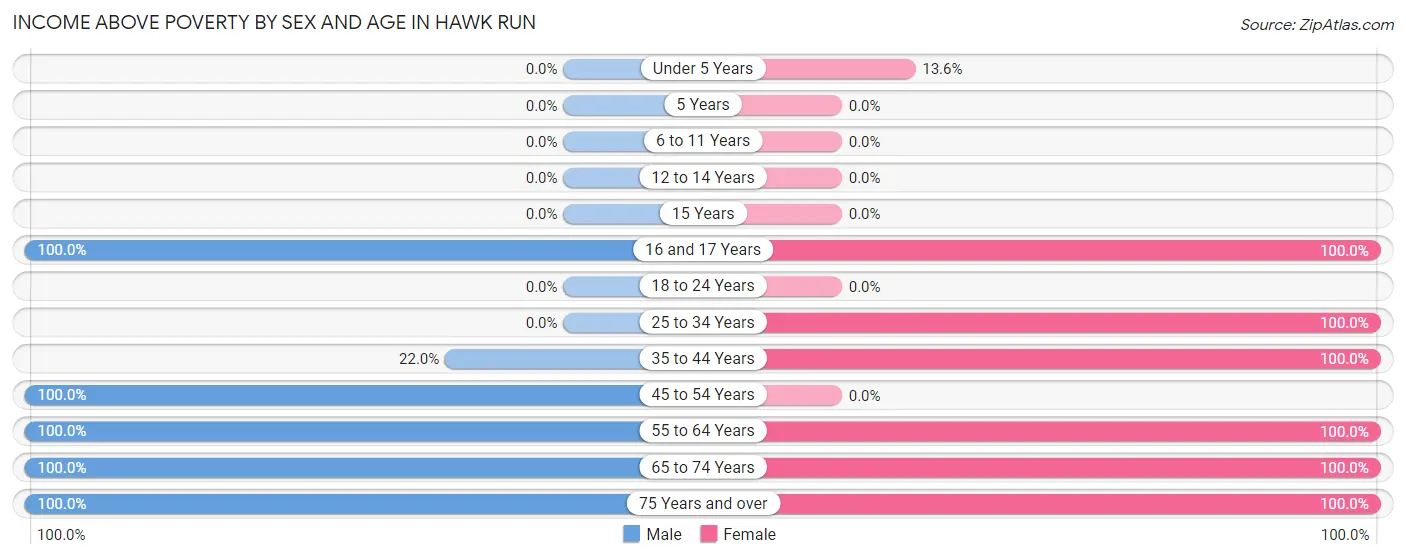
| Age Bracket | Male | Female |
| Under 5 Years | 0 (0.0%) | 12 (13.6%) |
| 5 Years | 0 (0.0%) | 0 (0.0%) |
| 6 to 11 Years | 0 (0.0%) | 0 (0.0%) |
| 12 to 14 Years | 0 (0.0%) | 0 (0.0%) |
| 15 Years | 0 (0.0%) | 0 (0.0%) |
| 16 and 17 Years | 26 (100.0%) | 26 (100.0%) |
| 18 to 24 Years | 0 (0.0%) | 0 (0.0%) |
| 25 to 34 Years | 0 (0.0%) | 19 (100.0%) |
| 35 to 44 Years | 18 (22.0%) | 44 (100.0%) |
| 45 to 54 Years | 46 (100.0%) | 0 (0.0%) |
| 55 to 64 Years | 31 (100.0%) | 22 (100.0%) |
| 65 to 74 Years | 28 (100.0%) | 19 (100.0%) |
| 75 Years and over | 42 (100.0%) | 41 (100.0%) |
| Total | 191 (74.9%) | 183 (59.2%) |
Income Below Poverty Among Married-Couple Families in Hawk Run
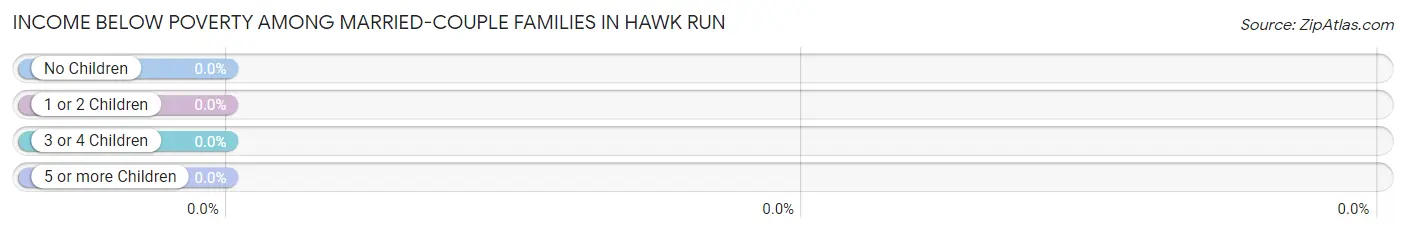
| Children | Above Poverty | Below Poverty |
| No Children | 43 (100.0%) | 0 (0.0%) |
| 1 or 2 Children | 0 (0.0%) | 0 (0.0%) |
| 3 or 4 Children | 0 (0.0%) | 0 (0.0%) |
| 5 or more Children | 0 (0.0%) | 0 (0.0%) |
| Total | 43 (100.0%) | 0 (0.0%) |
Income Below Poverty Among Single-Parent Households in Hawk Run
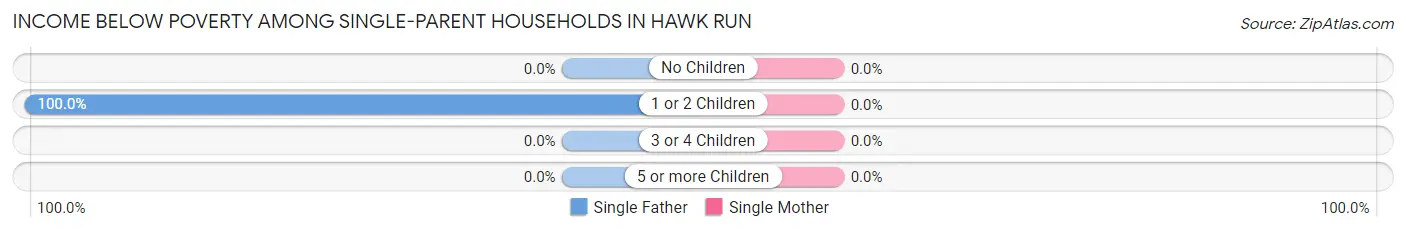
| Children | Single Father | Single Mother |
| No Children | 0 (0.0%) | 0 (0.0%) |
| 1 or 2 Children | 64 (100.0%) | 0 (0.0%) |
| 3 or 4 Children | 0 (0.0%) | 0 (0.0%) |
| 5 or more Children | 0 (0.0%) | 0 (0.0%) |
| Total | 64 (80.0%) | 0 (0.0%) |
Income Below Poverty Among Married-Couple vs Single-Parent Households in Hawk Run
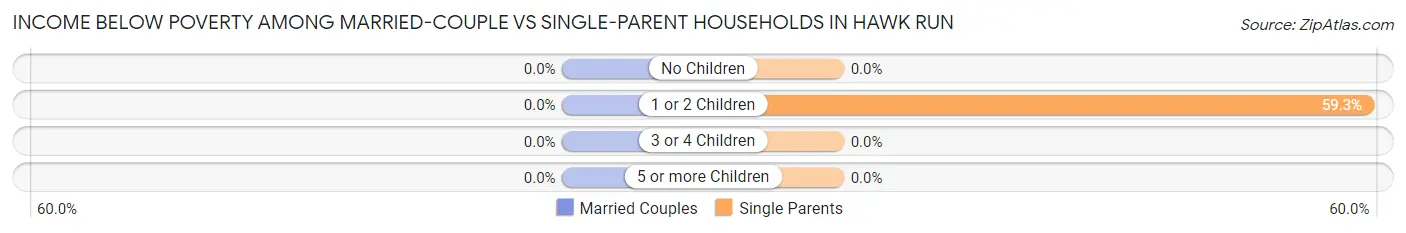
| Children | Married-Couple Families | Single-Parent Households |
| No Children | 0 (0.0%) | 0 (0.0%) |
| 1 or 2 Children | 0 (0.0%) | 64 (59.3%) |
| 3 or 4 Children | 0 (0.0%) | 0 (0.0%) |
| 5 or more Children | 0 (0.0%) | 0 (0.0%) |
| Total | 0 (0.0%) | 64 (44.8%) |
Race in Hawk Run
The most populous races in Hawk Run are , and White / Caucasian (564 | 100.0%).
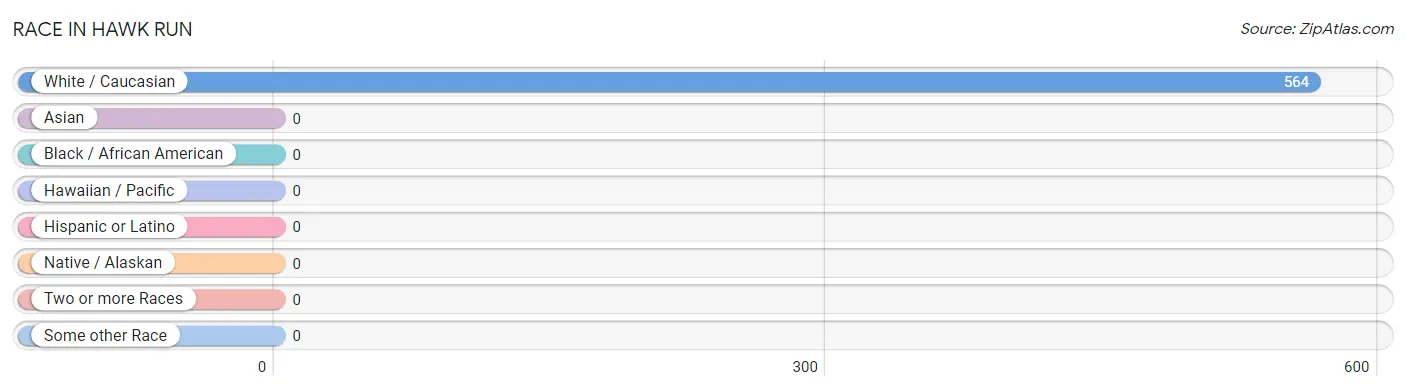
| Race | # Population | % Population |
| Asian | 0 | 0.0% |
| Black / African American | 0 | 0.0% |
| Hawaiian / Pacific | 0 | 0.0% |
| Hispanic or Latino | 0 | 0.0% |
| Native / Alaskan | 0 | 0.0% |
| White / Caucasian | 564 | 100.0% |
| Two or more Races | 0 | 0.0% |
| Some other Race | 0 | 0.0% |
| Total | 564 | 100.0% |
Ancestry in Hawk Run
The most populous ancestries reported in Hawk Run are Polish (202 | 35.8%), American (49 | 8.7%), Dutch (47 | 8.3%), English (47 | 8.3%), and Swedish (33 | 5.9%), together accounting for 67.0% of all Hawk Run residents.
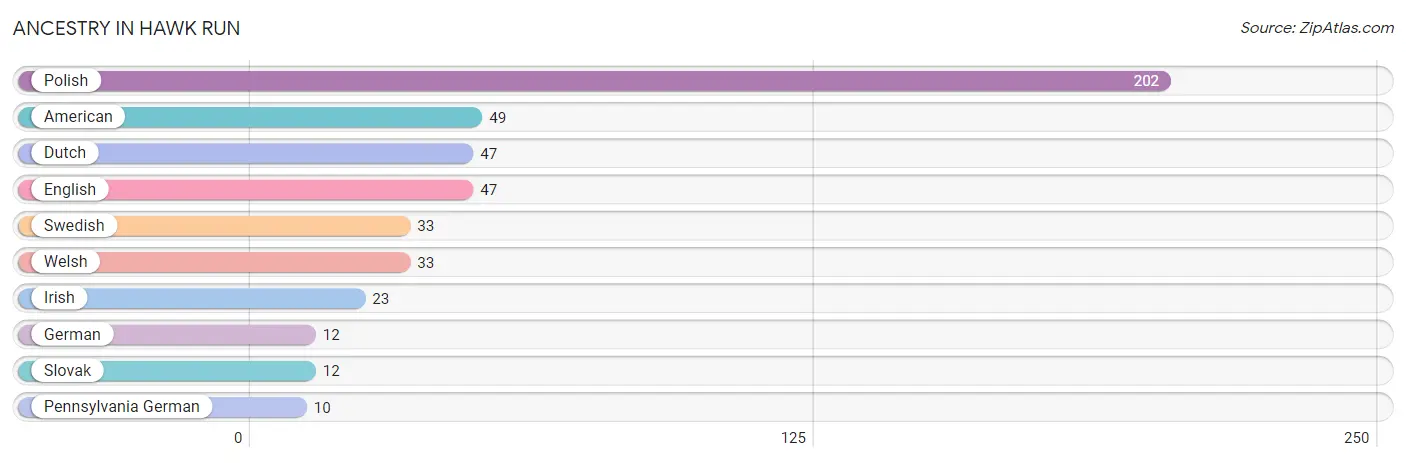
| Ancestry | # Population | % Population |
| American | 49 | 8.7% |
| Dutch | 47 | 8.3% |
| English | 47 | 8.3% |
| German | 12 | 2.1% |
| Irish | 23 | 4.1% |
| Pennsylvania German | 10 | 1.8% |
| Polish | 202 | 35.8% |
| Slovak | 12 | 2.1% |
| Swedish | 33 | 5.9% |
| Welsh | 33 | 5.9% | View All 10 Rows |
Immigrants in Hawk Run

| Immigration Origin | # Population | % Population | View All 0 Rows |
Sex and Age in Hawk Run
Sex and Age in Hawk Run
The most populous age groups in Hawk Run are 35 to 39 Years (82 | 32.2%) for men and Under 5 Years (88 | 28.5%) for women.
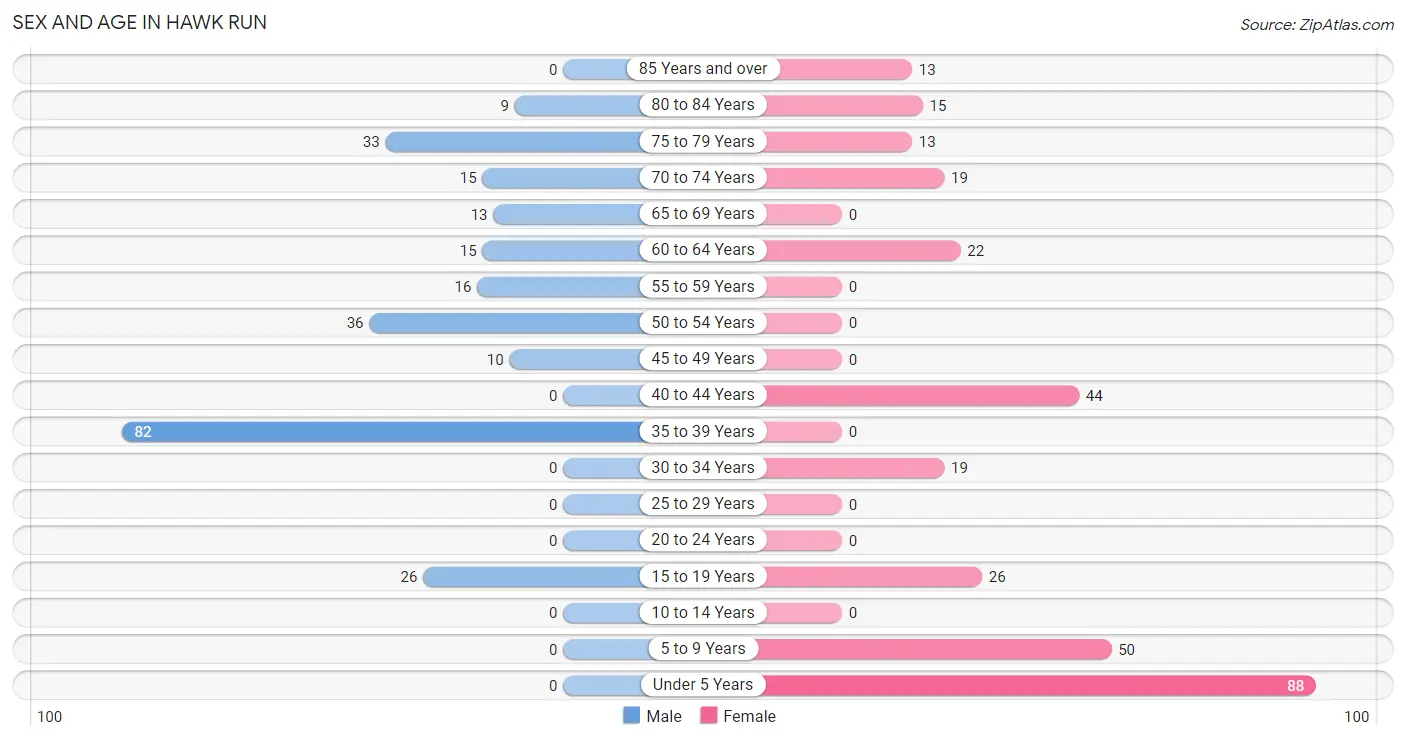
| Age Bracket | Male | Female |
| Under 5 Years | 0 (0.0%) | 88 (28.5%) |
| 5 to 9 Years | 0 (0.0%) | 50 (16.2%) |
| 10 to 14 Years | 0 (0.0%) | 0 (0.0%) |
| 15 to 19 Years | 26 (10.2%) | 26 (8.4%) |
| 20 to 24 Years | 0 (0.0%) | 0 (0.0%) |
| 25 to 29 Years | 0 (0.0%) | 0 (0.0%) |
| 30 to 34 Years | 0 (0.0%) | 19 (6.1%) |
| 35 to 39 Years | 82 (32.2%) | 0 (0.0%) |
| 40 to 44 Years | 0 (0.0%) | 44 (14.2%) |
| 45 to 49 Years | 10 (3.9%) | 0 (0.0%) |
| 50 to 54 Years | 36 (14.1%) | 0 (0.0%) |
| 55 to 59 Years | 16 (6.3%) | 0 (0.0%) |
| 60 to 64 Years | 15 (5.9%) | 22 (7.1%) |
| 65 to 69 Years | 13 (5.1%) | 0 (0.0%) |
| 70 to 74 Years | 15 (5.9%) | 19 (6.1%) |
| 75 to 79 Years | 33 (12.9%) | 13 (4.2%) |
| 80 to 84 Years | 9 (3.5%) | 15 (4.9%) |
| 85 Years and over | 0 (0.0%) | 13 (4.2%) |
| Total | 255 (100.0%) | 309 (100.0%) |
Families and Households in Hawk Run
Median Family Size in Hawk Run
The median family size in Hawk Run is 2.65 persons per family, with single male/father families (80 | 43.0%) accounting for the largest median family size of 2.96 persons per family. On the other hand, single female/mother families (63 | 33.9%) represent the smallest median family size with 2.35 persons per family.
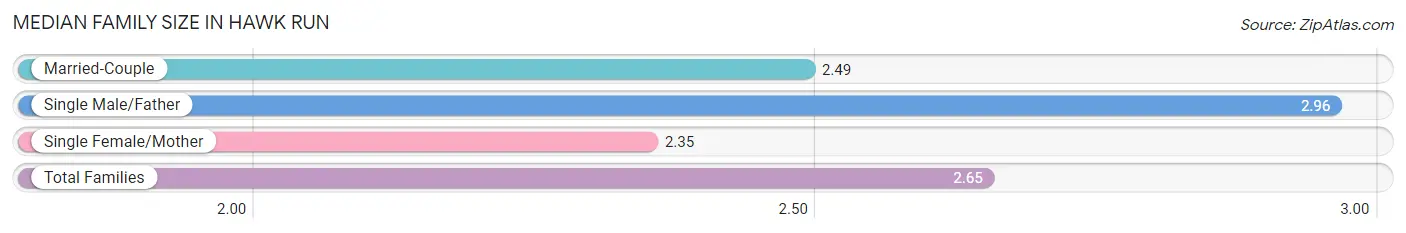
| Family Type | # Families | Family Size |
| Married-Couple | 43 (23.1%) | 2.49 |
| Single Male/Father | 80 (43.0%) | 2.96 |
| Single Female/Mother | 63 (33.9%) | 2.35 |
| Total Families | 186 (100.0%) | 2.65 |
Median Household Size in Hawk Run
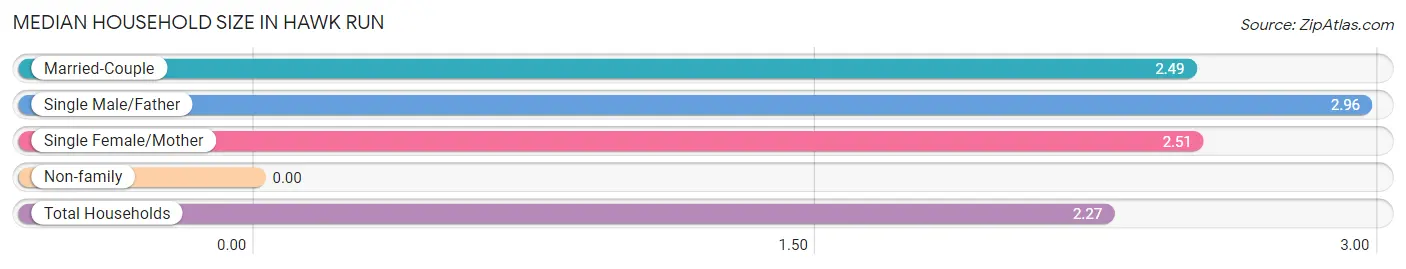
| Household Type | # Households | Household Size |
| Married-Couple | 43 (17.3%) | 2.49 |
| Single Male/Father | 80 (32.3%) | 2.96 |
| Single Female/Mother | 63 (25.4%) | 2.51 |
| Non-family | 62 (25.0%) | - |
| Total Households | 248 (100.0%) | 2.27 |
Household Size by Marriage Status in Hawk Run
Out of a total of 248 households in Hawk Run, 186 (75.0%) are family households, while 62 (25.0%) are nonfamily households. The most numerous type of family households are 3-person households, comprising 136, and the most common type of nonfamily households are 1-person households, comprising 62.
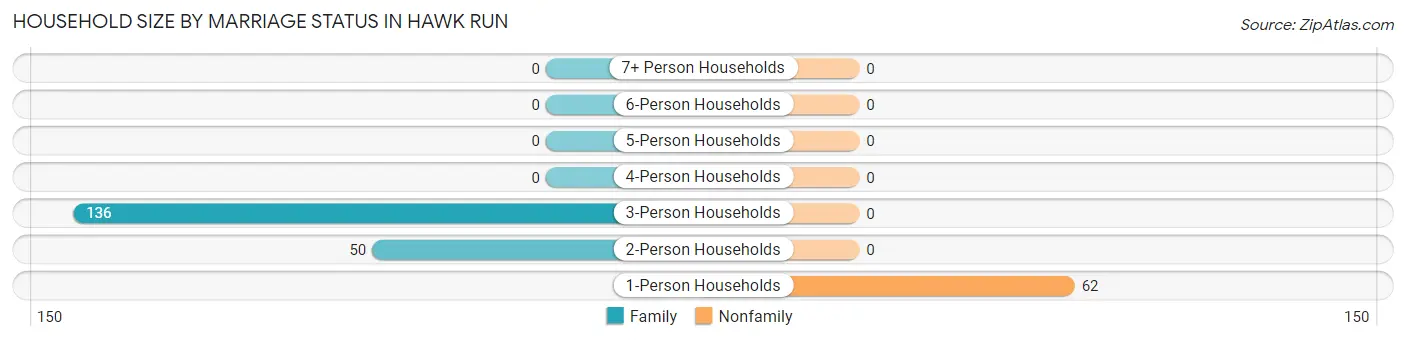
| Household Size | Family Households | Nonfamily Households |
| 1-Person Households | - | 62 (25.0%) |
| 2-Person Households | 50 (20.2%) | 0 (0.0%) |
| 3-Person Households | 136 (54.8%) | 0 (0.0%) |
| 4-Person Households | 0 (0.0%) | 0 (0.0%) |
| 5-Person Households | 0 (0.0%) | 0 (0.0%) |
| 6-Person Households | 0 (0.0%) | 0 (0.0%) |
| 7+ Person Households | 0 (0.0%) | 0 (0.0%) |
| Total | 186 (75.0%) | 62 (25.0%) |
Female Fertility in Hawk Run
Fertility by Age in Hawk Run
| Age Bracket | Women with Births | Births / 1,000 Women |
| 15 to 19 years | 0 (0.0%) | 0.0 |
| 20 to 34 years | 0 (0.0%) | 0.0 |
| 35 to 50 years | 0 (0.0%) | 0.0 |
| Total | 0 (0.0%) | 0.0 |
Fertility by Age by Marriage Status in Hawk Run
| Age Bracket | Married | Unmarried |
| 15 to 19 years | 0 (0.0%) | 0 (0.0%) |
| 20 to 34 years | 0 (0.0%) | 0 (0.0%) |
| 35 to 50 years | 0 (0.0%) | 0 (0.0%) |
| Total | 0 (0.0%) | 0 (0.0%) |
Fertility by Education in Hawk Run
| Educational Attainment | Women with Births | Births / 1,000 Women |
| Less than High School | 0 (0.0%) | 0.0 |
| High School Diploma | 0 (0.0%) | 0.0 |
| College or Associate's Degree | 0 (0.0%) | 0.0 |
| Bachelor's Degree | 0 (0.0%) | 0.0 |
| Graduate Degree | 0 (0.0%) | 0.0 |
| Total | 0 (0.0%) | 0.0 |
Fertility by Education by Marriage Status in Hawk Run
| Educational Attainment | Married | Unmarried |
| Less than High School | 0 (0.0%) | 0 (0.0%) |
| High School Diploma | 0 (0.0%) | 0 (0.0%) |
| College or Associate's Degree | 0 (0.0%) | 0 (0.0%) |
| Bachelor's Degree | 0 (0.0%) | 0 (0.0%) |
| Graduate Degree | 0 (0.0%) | 0 (0.0%) |
| Total | 0 (0.0%) | 0 (0.0%) |
Employment Characteristics in Hawk Run
Employment by Class of Employer in Hawk Run
Among the 179 employed individuals in Hawk Run, self-employed (incorporated) (58 | 32.4%), self-employed (not incorporated) (44 | 24.6%), and not-for-profit organizations (38 | 21.2%) make up the most common classes of employment.
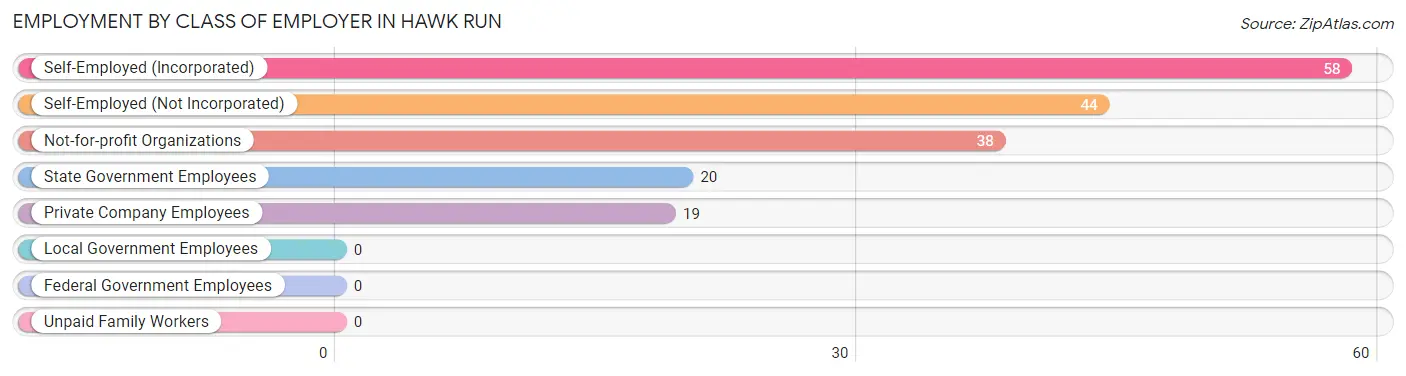
| Employer Class | # Employees | % Employees |
| Private Company Employees | 19 | 10.6% |
| Self-Employed (Incorporated) | 58 | 32.4% |
| Self-Employed (Not Incorporated) | 44 | 24.6% |
| Not-for-profit Organizations | 38 | 21.2% |
| Local Government Employees | 0 | 0.0% |
| State Government Employees | 20 | 11.2% |
| Federal Government Employees | 0 | 0.0% |
| Unpaid Family Workers | 0 | 0.0% |
| Total | 179 | 100.0% |
Employment Status by Age in Hawk Run
According to the labor force statistics for Hawk Run, out of the total population over 16 years of age (426), 62.9% or 268 individuals are in the labor force, with 33.2% or 89 of them unemployed. The age group with the highest labor force participation rate is 16 to 19 years, with 100.0% or 52 individuals in the labor force. Within the labor force, the 75 years and over age range has the highest percentage of unemployed individuals, with 100.0% or 25 of them being unemployed.
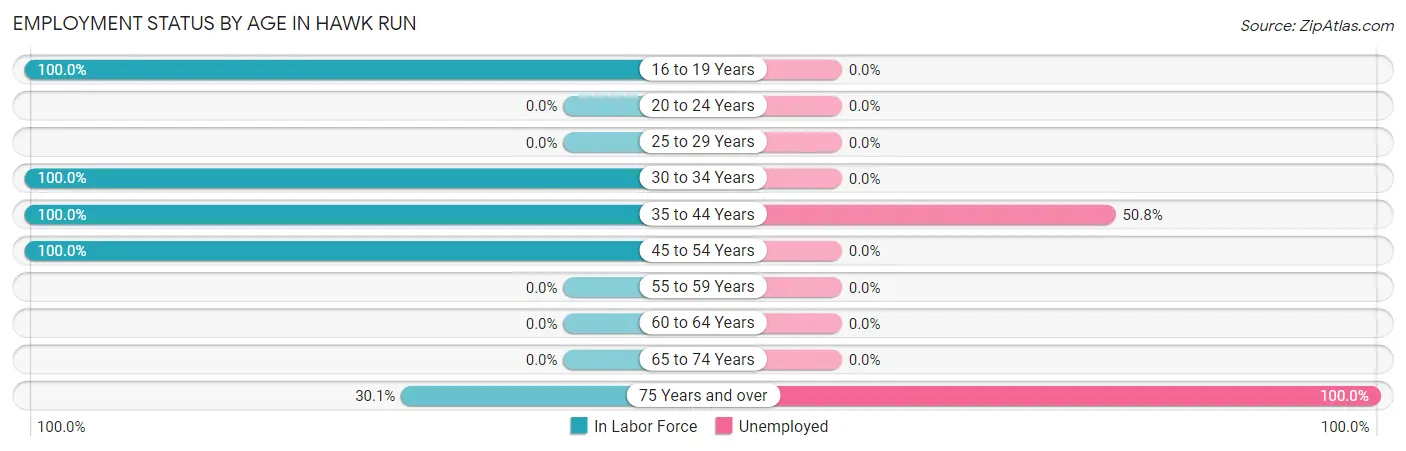
| Age Bracket | In Labor Force | Unemployed |
| 16 to 19 Years | 52 (100.0%) | 0 (0.0%) |
| 20 to 24 Years | 0 (0.0%) | 0 (0.0%) |
| 25 to 29 Years | 0 (0.0%) | 0 (0.0%) |
| 30 to 34 Years | 19 (100.0%) | 0 (0.0%) |
| 35 to 44 Years | 126 (100.0%) | 64 (50.8%) |
| 45 to 54 Years | 46 (100.0%) | 0 (0.0%) |
| 55 to 59 Years | 0 (0.0%) | 0 (0.0%) |
| 60 to 64 Years | 0 (0.0%) | 0 (0.0%) |
| 65 to 74 Years | 0 (0.0%) | 0 (0.0%) |
| 75 Years and over | 25 (30.1%) | 25 (100.0%) |
| Total | 268 (62.9%) | 89 (33.2%) |
Employment Status by Educational Attainment in Hawk Run
According to labor force statistics for Hawk Run, 78.3% of individuals (191) out of the total population between 25 and 64 years of age (244) are in the labor force, with 33.5% or 64 of them being unemployed. The group with the highest labor force participation rate are those with the educational attainment of less than high school, with 100.0% or 18 individuals in the labor force. Within the labor force, individuals with high school diploma education have the highest percentage of unemployment, with 41.6% or 64 of them being unemployed.
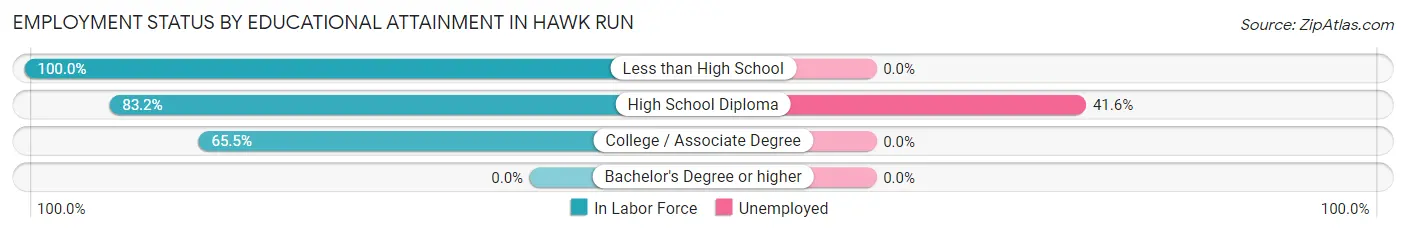
| Educational Attainment | In Labor Force | Unemployed |
| Less than High School | 18 (100.0%) | 0 (0.0%) |
| High School Diploma | 154 (83.2%) | 77 (41.6%) |
| College / Associate Degree | 19 (65.5%) | 0 (0.0%) |
| Bachelor's Degree or higher | 0 (0.0%) | 0 (0.0%) |
| Total | 191 (78.3%) | 82 (33.5%) |
Employment Occupations by Sex in Hawk Run
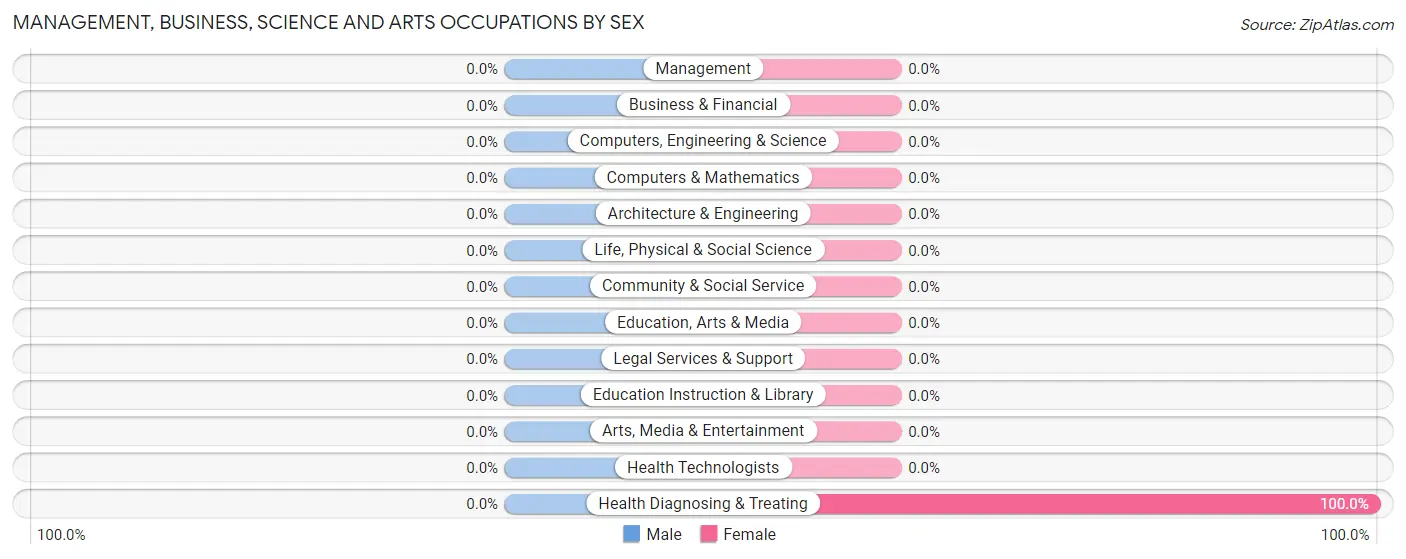
Management, Business, Science and Arts Occupations
The most common Management, Business, Science and Arts occupations in Hawk Run are , and Health Diagnosing & Treating (19 | 10.6%).
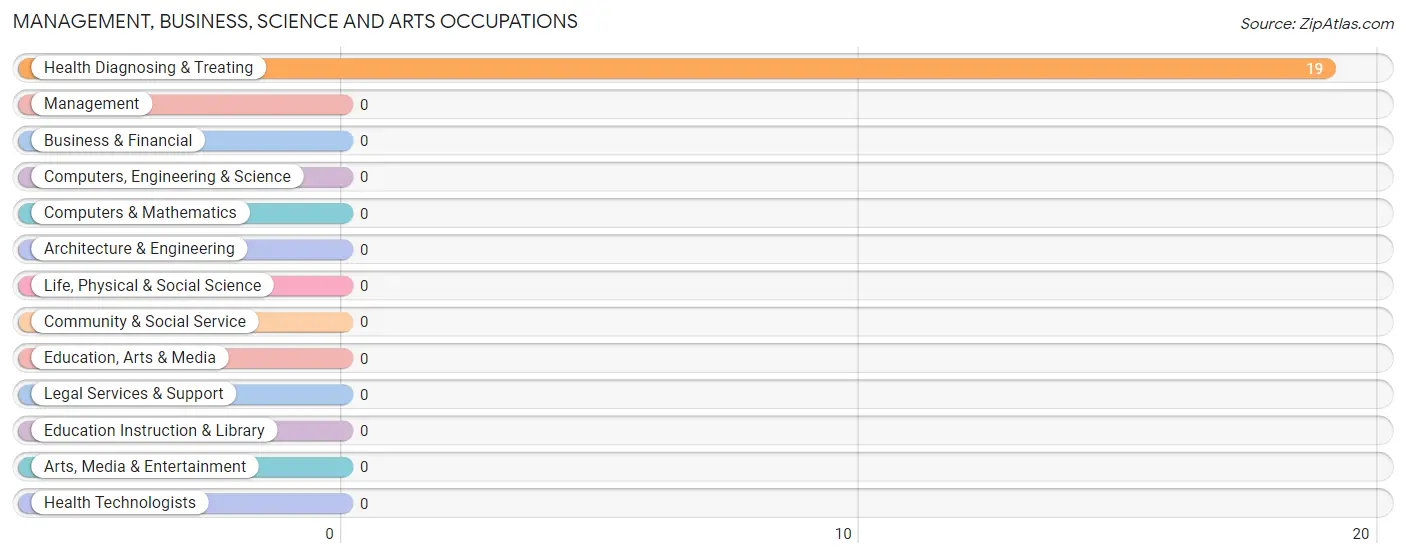
Management, Business, Science and Arts Occupations by Sex
| Occupation | Male | Female |
| Management | 0 (0.0%) | 0 (0.0%) |
| Business & Financial | 0 (0.0%) | 0 (0.0%) |
| Computers, Engineering & Science | 0 (0.0%) | 0 (0.0%) |
| Computers & Mathematics | 0 (0.0%) | 0 (0.0%) |
| Architecture & Engineering | 0 (0.0%) | 0 (0.0%) |
| Life, Physical & Social Science | 0 (0.0%) | 0 (0.0%) |
| Community & Social Service | 0 (0.0%) | 0 (0.0%) |
| Education, Arts & Media | 0 (0.0%) | 0 (0.0%) |
| Legal Services & Support | 0 (0.0%) | 0 (0.0%) |
| Education Instruction & Library | 0 (0.0%) | 0 (0.0%) |
| Arts, Media & Entertainment | 0 (0.0%) | 0 (0.0%) |
| Health Diagnosing & Treating | 0 (0.0%) | 19 (100.0%) |
| Health Technologists | 0 (0.0%) | 0 (0.0%) |
| Total (Category) | 0 (0.0%) | 19 (100.0%) |
| Total (Overall) | 90 (50.3%) | 89 (49.7%) |
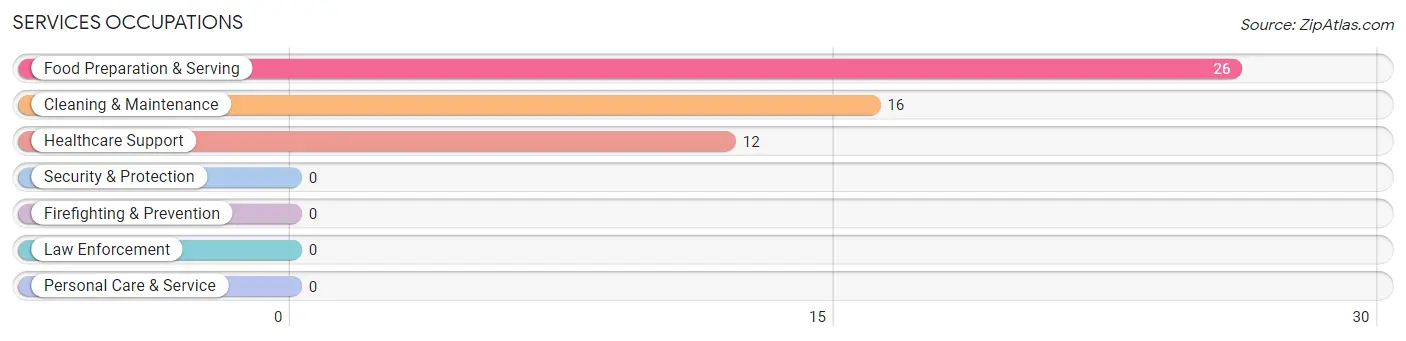
Services Occupations
The most common Services occupations in Hawk Run are Food Preparation & Serving (26 | 14.5%), Cleaning & Maintenance (16 | 8.9%), and Healthcare Support (12 | 6.7%).
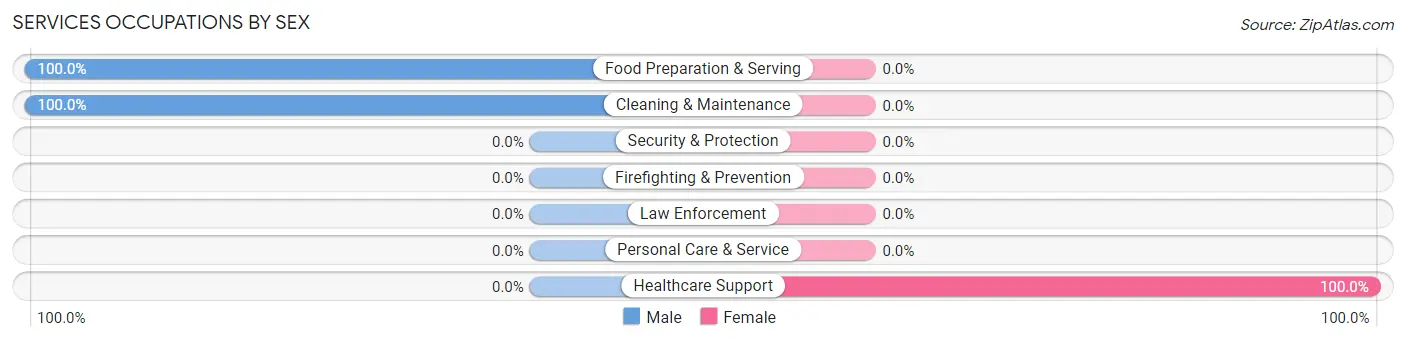
Services Occupations by Sex
| Occupation | Male | Female |
| Healthcare Support | 0 (0.0%) | 12 (100.0%) |
| Security & Protection | 0 (0.0%) | 0 (0.0%) |
| Firefighting & Prevention | 0 (0.0%) | 0 (0.0%) |
| Law Enforcement | 0 (0.0%) | 0 (0.0%) |
| Food Preparation & Serving | 26 (100.0%) | 0 (0.0%) |
| Cleaning & Maintenance | 16 (100.0%) | 0 (0.0%) |
| Personal Care & Service | 0 (0.0%) | 0 (0.0%) |
| Total (Category) | 42 (77.8%) | 12 (22.2%) |
| Total (Overall) | 90 (50.3%) | 89 (49.7%) |
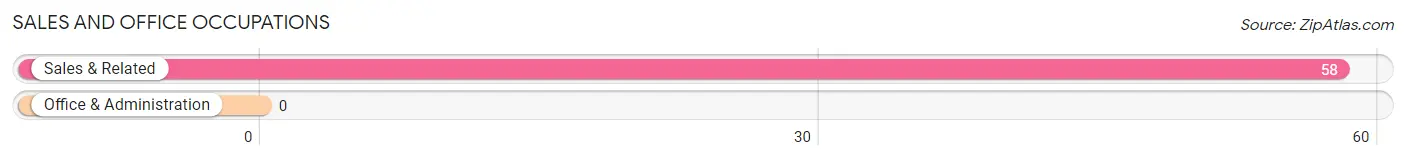
Sales and Office Occupations
The most common Sales and Office occupations in Hawk Run are , and Sales & Related (58 | 32.4%).
Sales and Office Occupations by Sex
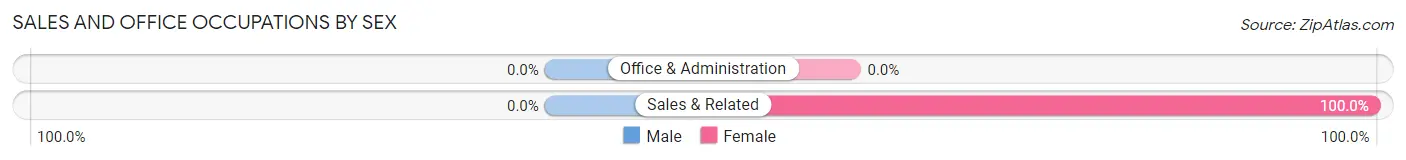
| Occupation | Male | Female |
| Sales & Related | 0 (0.0%) | 58 (100.0%) |
| Office & Administration | 0 (0.0%) | 0 (0.0%) |
| Total (Category) | 0 (0.0%) | 58 (100.0%) |
| Total (Overall) | 90 (50.3%) | 89 (49.7%) |
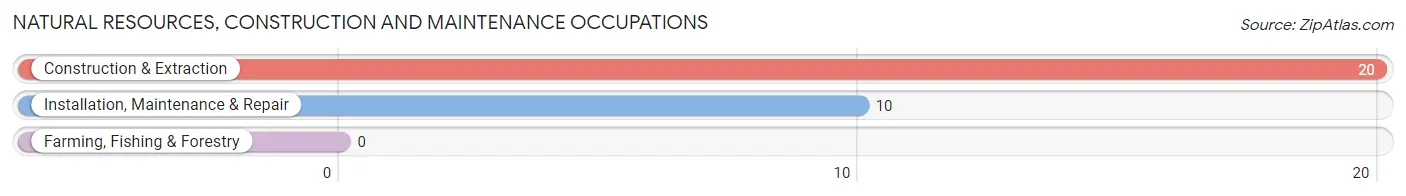
Natural Resources, Construction and Maintenance Occupations
The most common Natural Resources, Construction and Maintenance occupations in Hawk Run are Construction & Extraction (20 | 11.2%), and Installation, Maintenance & Repair (10 | 5.6%).
Natural Resources, Construction and Maintenance Occupations by Sex
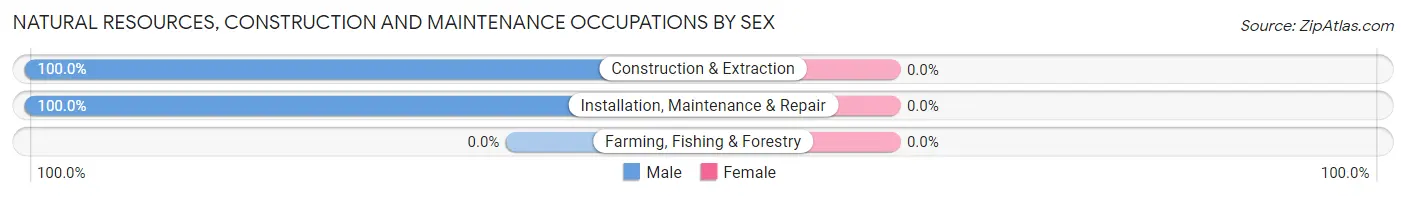
| Occupation | Male | Female |
| Farming, Fishing & Forestry | 0 (0.0%) | 0 (0.0%) |
| Construction & Extraction | 20 (100.0%) | 0 (0.0%) |
| Installation, Maintenance & Repair | 10 (100.0%) | 0 (0.0%) |
| Total (Category) | 30 (100.0%) | 0 (0.0%) |
| Total (Overall) | 90 (50.3%) | 89 (49.7%) |
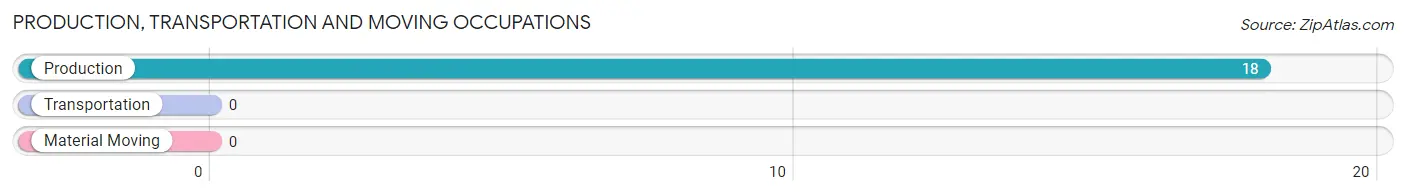
Production, Transportation and Moving Occupations
The most common Production, Transportation and Moving occupations in Hawk Run are , and Production (18 | 10.1%).
Production, Transportation and Moving Occupations by Sex
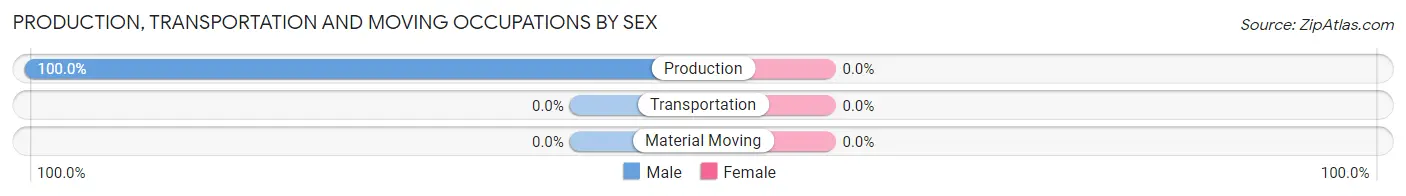
| Occupation | Male | Female |
| Production | 18 (100.0%) | 0 (0.0%) |
| Transportation | 0 (0.0%) | 0 (0.0%) |
| Material Moving | 0 (0.0%) | 0 (0.0%) |
| Total (Category) | 18 (100.0%) | 0 (0.0%) |
| Total (Overall) | 90 (50.3%) | 89 (49.7%) |
Employment Industries by Sex in Hawk Run
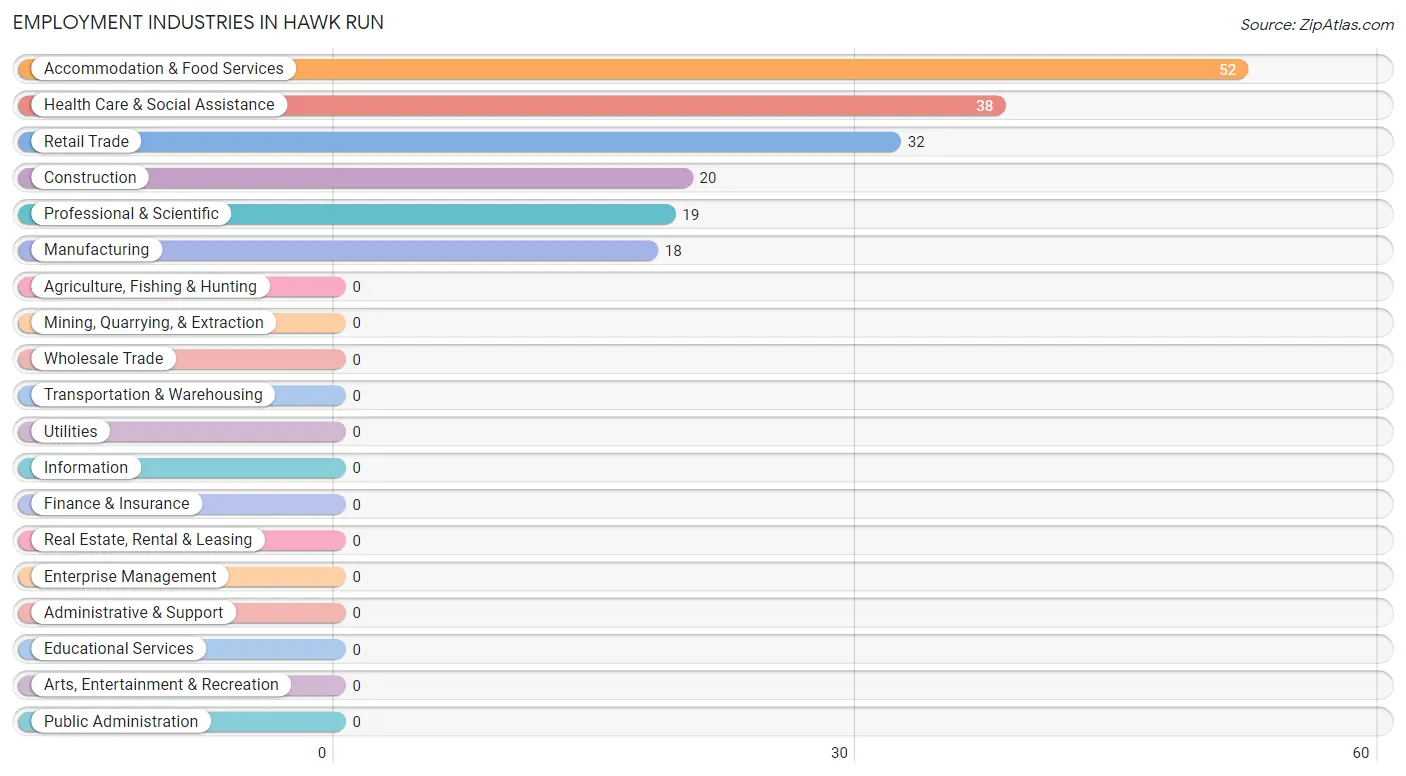
Employment Industries in Hawk Run
The major employment industries in Hawk Run include Accommodation & Food Services (52 | 29.0%), Health Care & Social Assistance (38 | 21.2%), Retail Trade (32 | 17.9%), Construction (20 | 11.2%), and Professional & Scientific (19 | 10.6%).
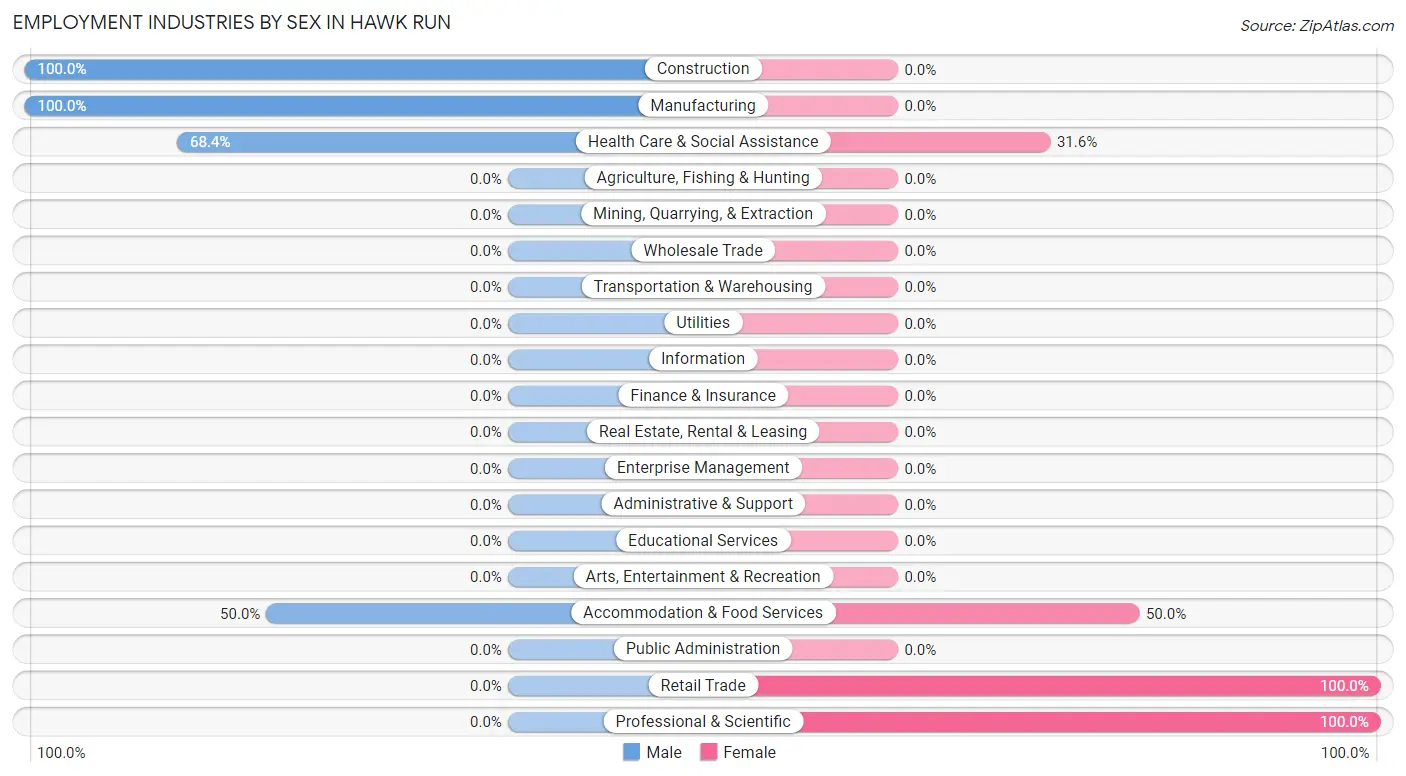
Employment Industries by Sex in Hawk Run
The Hawk Run industries that see more men than women are Construction (100.0%), Manufacturing (100.0%), and Health Care & Social Assistance (68.4%), whereas the industries that tend to have a higher number of women are Retail Trade (100.0%), Professional & Scientific (100.0%), and Accommodation & Food Services (50.0%).
| Industry | Male | Female |
| Agriculture, Fishing & Hunting | 0 (0.0%) | 0 (0.0%) |
| Mining, Quarrying, & Extraction | 0 (0.0%) | 0 (0.0%) |
| Construction | 20 (100.0%) | 0 (0.0%) |
| Manufacturing | 18 (100.0%) | 0 (0.0%) |
| Wholesale Trade | 0 (0.0%) | 0 (0.0%) |
| Retail Trade | 0 (0.0%) | 32 (100.0%) |
| Transportation & Warehousing | 0 (0.0%) | 0 (0.0%) |
| Utilities | 0 (0.0%) | 0 (0.0%) |
| Information | 0 (0.0%) | 0 (0.0%) |
| Finance & Insurance | 0 (0.0%) | 0 (0.0%) |
| Real Estate, Rental & Leasing | 0 (0.0%) | 0 (0.0%) |
| Professional & Scientific | 0 (0.0%) | 19 (100.0%) |
| Enterprise Management | 0 (0.0%) | 0 (0.0%) |
| Administrative & Support | 0 (0.0%) | 0 (0.0%) |
| Educational Services | 0 (0.0%) | 0 (0.0%) |
| Health Care & Social Assistance | 26 (68.4%) | 12 (31.6%) |
| Arts, Entertainment & Recreation | 0 (0.0%) | 0 (0.0%) |
| Accommodation & Food Services | 26 (50.0%) | 26 (50.0%) |
| Public Administration | 0 (0.0%) | 0 (0.0%) |
| Total | 90 (50.3%) | 89 (49.7%) |
Education in Hawk Run
School Enrollment in Hawk Run
The most common levels of schooling among the 102 students in Hawk Run are high school (52 | 51.0%), and elementary school (50 | 49.0%).
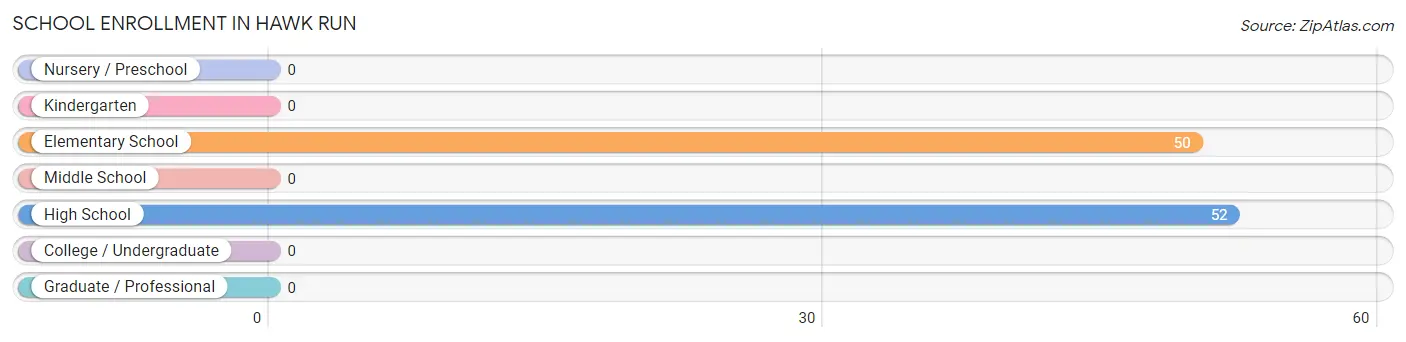
| School Level | # Students | % Students |
| Nursery / Preschool | 0 | 0.0% |
| Kindergarten | 0 | 0.0% |
| Elementary School | 50 | 49.0% |
| Middle School | 0 | 0.0% |
| High School | 52 | 51.0% |
| College / Undergraduate | 0 | 0.0% |
| Graduate / Professional | 0 | 0.0% |
| Total | 102 | 100.0% |
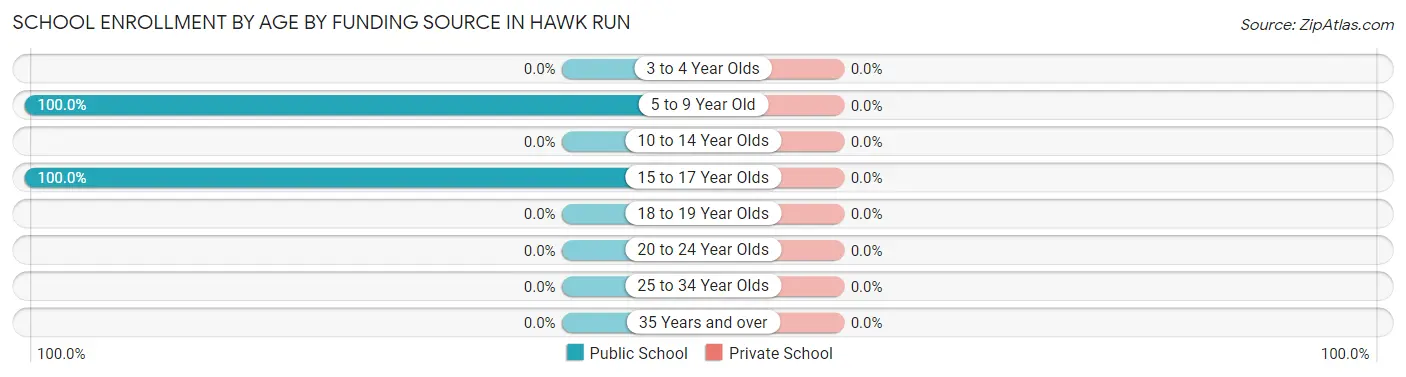
School Enrollment by Age by Funding Source in Hawk Run
| Age Bracket | Public School | Private School |
| 3 to 4 Year Olds | 0 (0.0%) | 0 (0.0%) |
| 5 to 9 Year Old | 50 (100.0%) | 0 (0.0%) |
| 10 to 14 Year Olds | 0 (0.0%) | 0 (0.0%) |
| 15 to 17 Year Olds | 52 (100.0%) | 0 (0.0%) |
| 18 to 19 Year Olds | 0 (0.0%) | 0 (0.0%) |
| 20 to 24 Year Olds | 0 (0.0%) | 0 (0.0%) |
| 25 to 34 Year Olds | 0 (0.0%) | 0 (0.0%) |
| 35 Years and over | 0 (0.0%) | 0 (0.0%) |
| Total | 102 (100.0%) | 0 (0.0%) |
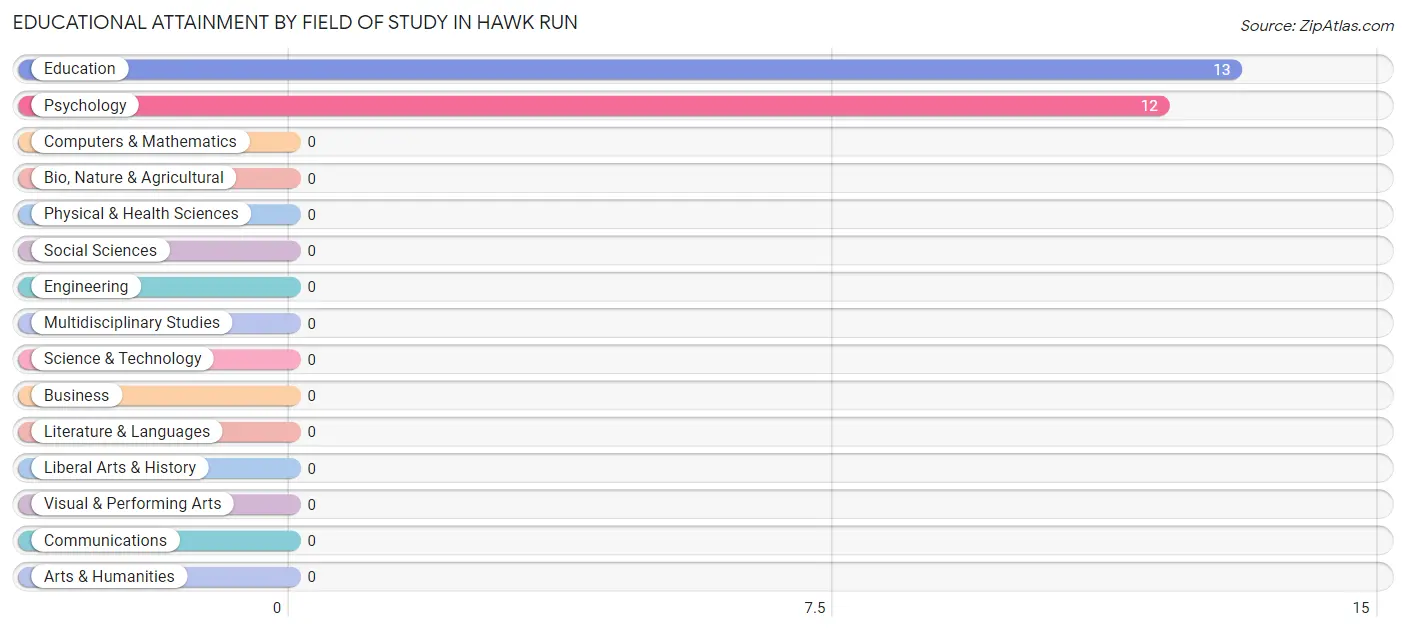
Educational Attainment by Field of Study in Hawk Run
Education (13 | 52.0%), and psychology (12 | 48.0%) are the most common fields of study among 25 individuals in Hawk Run who have obtained a bachelor's degree or higher.
| Field of Study | # Graduates | % Graduates |
| Computers & Mathematics | 0 | 0.0% |
| Bio, Nature & Agricultural | 0 | 0.0% |
| Physical & Health Sciences | 0 | 0.0% |
| Psychology | 12 | 48.0% |
| Social Sciences | 0 | 0.0% |
| Engineering | 0 | 0.0% |
| Multidisciplinary Studies | 0 | 0.0% |
| Science & Technology | 0 | 0.0% |
| Business | 0 | 0.0% |
| Education | 13 | 52.0% |
| Literature & Languages | 0 | 0.0% |
| Liberal Arts & History | 0 | 0.0% |
| Visual & Performing Arts | 0 | 0.0% |
| Communications | 0 | 0.0% |
| Arts & Humanities | 0 | 0.0% |
| Total | 25 | 100.0% |
Transportation & Commute in Hawk Run
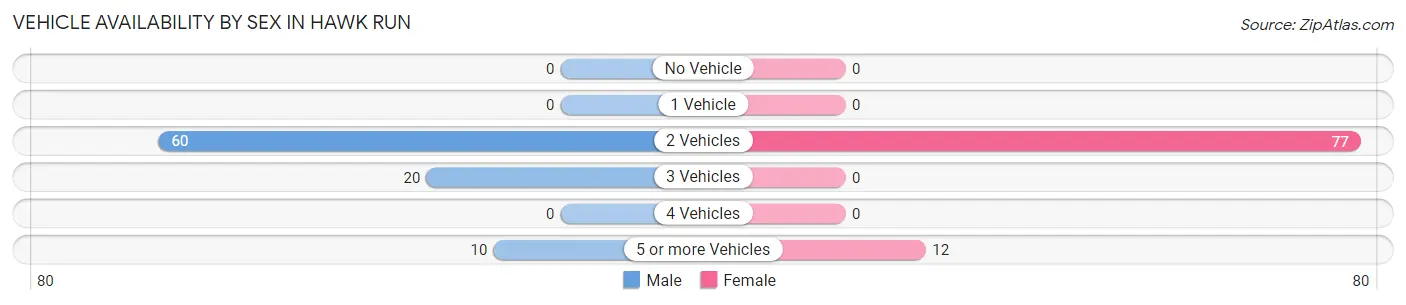
Vehicle Availability by Sex in Hawk Run
The most prevalent vehicle ownership categories in Hawk Run are males with 2 vehicles (60, accounting for 66.7%) and females with 2 vehicles (77, making up 67.4%).
| Vehicles Available | Male | Female |
| No Vehicle | 0 (0.0%) | 0 (0.0%) |
| 1 Vehicle | 0 (0.0%) | 0 (0.0%) |
| 2 Vehicles | 60 (66.7%) | 77 (86.5%) |
| 3 Vehicles | 20 (22.2%) | 0 (0.0%) |
| 4 Vehicles | 0 (0.0%) | 0 (0.0%) |
| 5 or more Vehicles | 10 (11.1%) | 12 (13.5%) |
| Total | 90 (100.0%) | 89 (100.0%) |
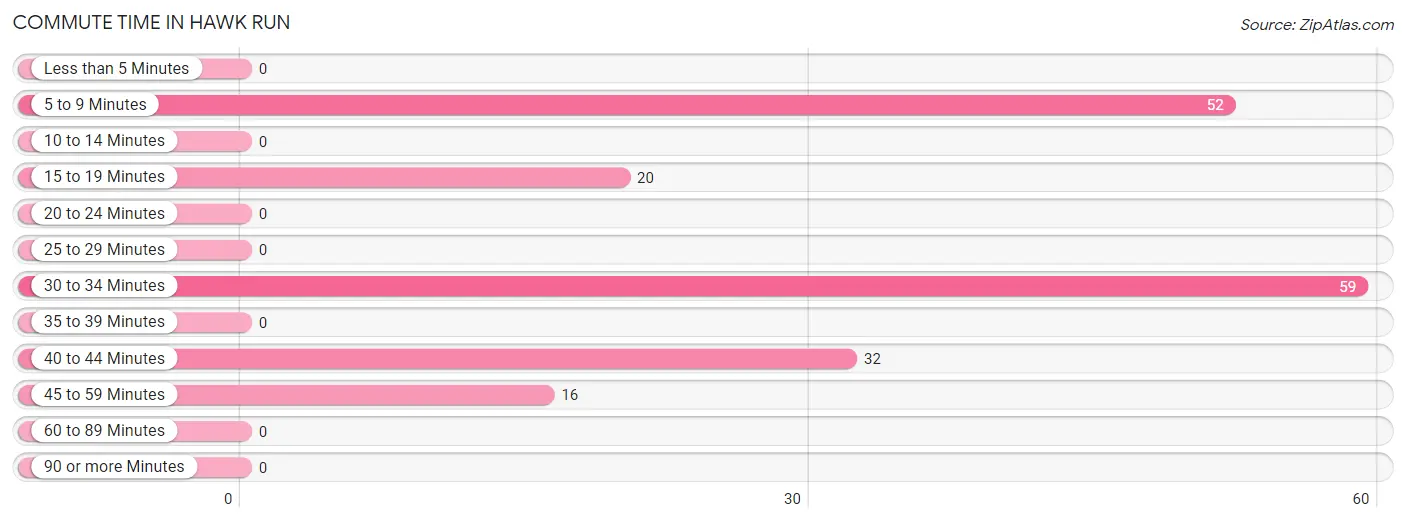
Commute Time in Hawk Run
The most frequently occuring commute durations in Hawk Run are 30 to 34 minutes (59 commuters, 33.0%), 5 to 9 minutes (52 commuters, 29.0%), and 40 to 44 minutes (32 commuters, 17.9%).
| Commute Time | # Commuters | % Commuters |
| Less than 5 Minutes | 0 | 0.0% |
| 5 to 9 Minutes | 52 | 29.0% |
| 10 to 14 Minutes | 0 | 0.0% |
| 15 to 19 Minutes | 20 | 11.2% |
| 20 to 24 Minutes | 0 | 0.0% |
| 25 to 29 Minutes | 0 | 0.0% |
| 30 to 34 Minutes | 59 | 33.0% |
| 35 to 39 Minutes | 0 | 0.0% |
| 40 to 44 Minutes | 32 | 17.9% |
| 45 to 59 Minutes | 16 | 8.9% |
| 60 to 89 Minutes | 0 | 0.0% |
| 90 or more Minutes | 0 | 0.0% |
Commute Time by Sex in Hawk Run
The most common commute times in Hawk Run are 30 to 34 minutes (28 commuters, 31.1%) for males and 40 to 44 minutes (32 commuters, 36.0%) for females.
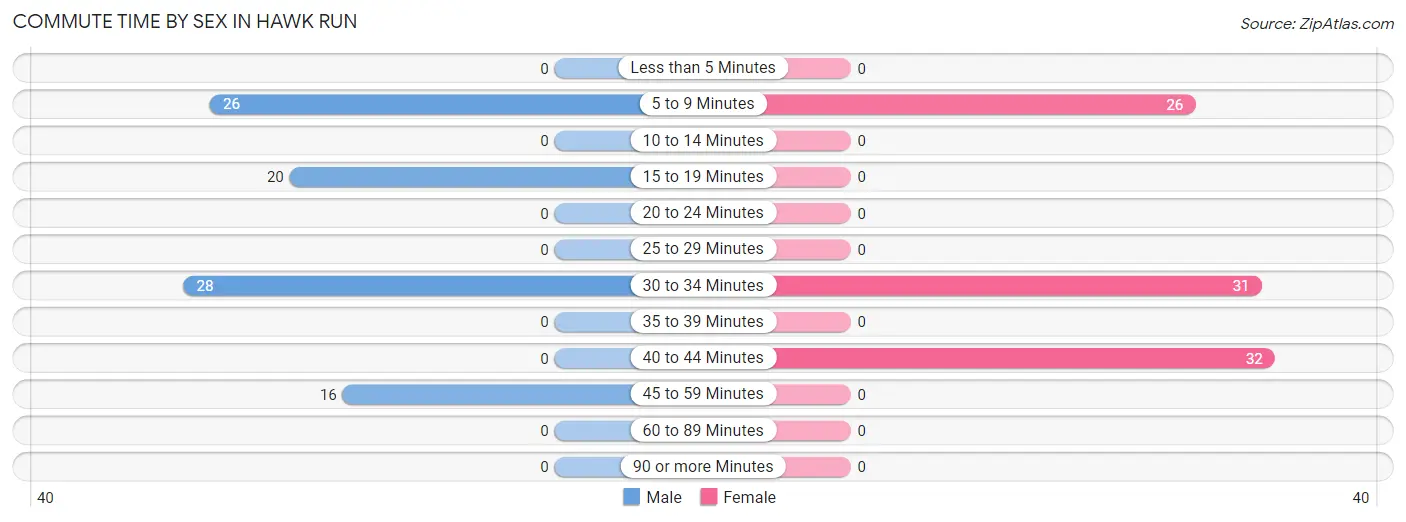
| Commute Time | Male | Female |
| Less than 5 Minutes | 0 (0.0%) | 0 (0.0%) |
| 5 to 9 Minutes | 26 (28.9%) | 26 (29.2%) |
| 10 to 14 Minutes | 0 (0.0%) | 0 (0.0%) |
| 15 to 19 Minutes | 20 (22.2%) | 0 (0.0%) |
| 20 to 24 Minutes | 0 (0.0%) | 0 (0.0%) |
| 25 to 29 Minutes | 0 (0.0%) | 0 (0.0%) |
| 30 to 34 Minutes | 28 (31.1%) | 31 (34.8%) |
| 35 to 39 Minutes | 0 (0.0%) | 0 (0.0%) |
| 40 to 44 Minutes | 0 (0.0%) | 32 (36.0%) |
| 45 to 59 Minutes | 16 (17.8%) | 0 (0.0%) |
| 60 to 89 Minutes | 0 (0.0%) | 0 (0.0%) |
| 90 or more Minutes | 0 (0.0%) | 0 (0.0%) |
Time of Departure to Work by Sex in Hawk Run
The most frequent times of departure to work in Hawk Run are 5:30 AM to 5:59 AM (28, 31.1%) for males and 12:00 AM to 4:59 AM (58, 65.2%) for females.
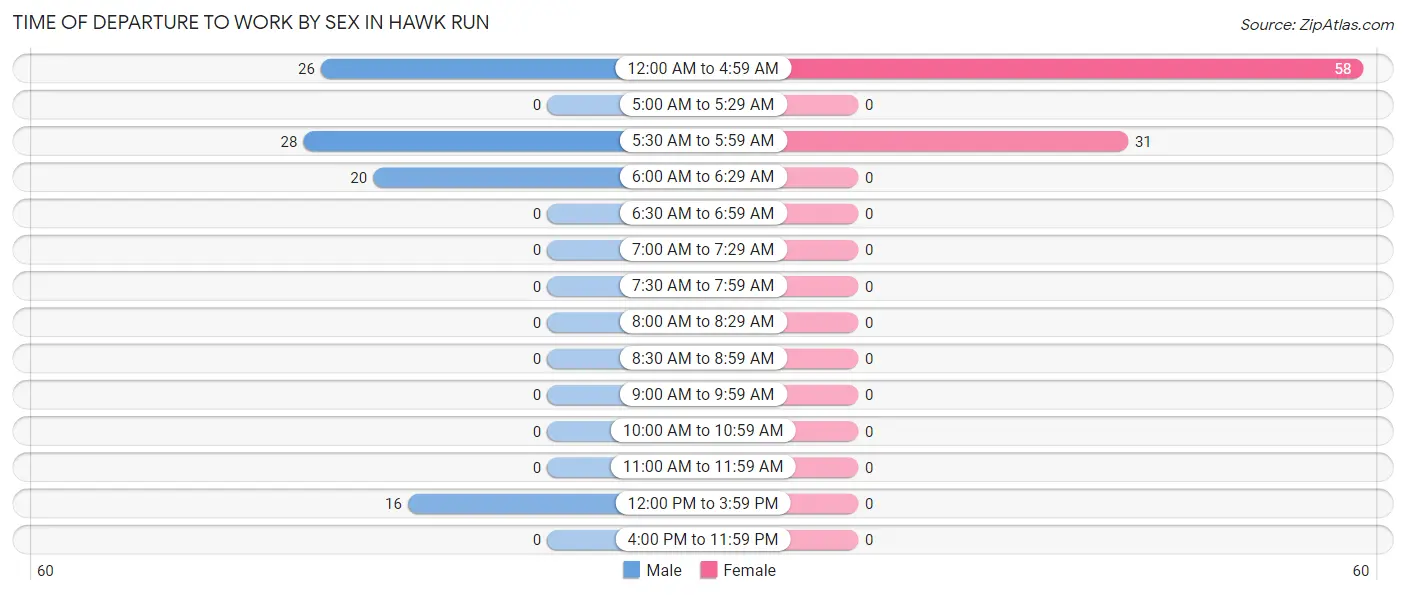
| Time of Departure | Male | Female |
| 12:00 AM to 4:59 AM | 26 (28.9%) | 58 (65.2%) |
| 5:00 AM to 5:29 AM | 0 (0.0%) | 0 (0.0%) |
| 5:30 AM to 5:59 AM | 28 (31.1%) | 31 (34.8%) |
| 6:00 AM to 6:29 AM | 20 (22.2%) | 0 (0.0%) |
| 6:30 AM to 6:59 AM | 0 (0.0%) | 0 (0.0%) |
| 7:00 AM to 7:29 AM | 0 (0.0%) | 0 (0.0%) |
| 7:30 AM to 7:59 AM | 0 (0.0%) | 0 (0.0%) |
| 8:00 AM to 8:29 AM | 0 (0.0%) | 0 (0.0%) |
| 8:30 AM to 8:59 AM | 0 (0.0%) | 0 (0.0%) |
| 9:00 AM to 9:59 AM | 0 (0.0%) | 0 (0.0%) |
| 10:00 AM to 10:59 AM | 0 (0.0%) | 0 (0.0%) |
| 11:00 AM to 11:59 AM | 0 (0.0%) | 0 (0.0%) |
| 12:00 PM to 3:59 PM | 16 (17.8%) | 0 (0.0%) |
| 4:00 PM to 11:59 PM | 0 (0.0%) | 0 (0.0%) |
| Total | 90 (100.0%) | 89 (100.0%) |
Housing Occupancy in Hawk Run
Occupancy by Ownership in Hawk Run
Of the total 248 dwellings in Hawk Run, owner-occupied units account for 223 (89.9%), while renter-occupied units make up 25 (10.1%).
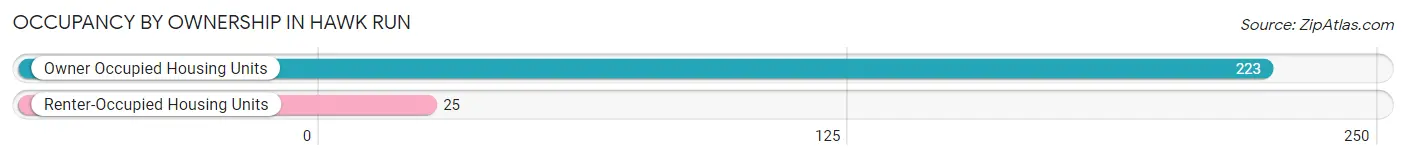
| Occupancy | # Housing Units | % Housing Units |
| Owner Occupied Housing Units | 223 | 89.9% |
| Renter-Occupied Housing Units | 25 | 10.1% |
| Total Occupied Housing Units | 248 | 100.0% |
Occupancy by Household Size in Hawk Run
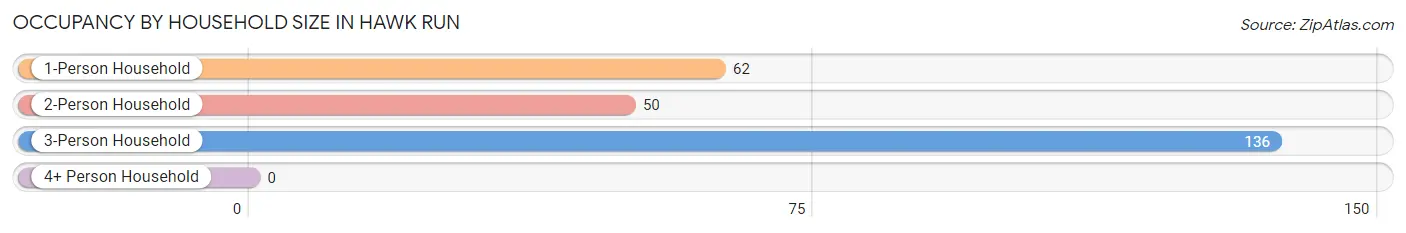
| Household Size | # Housing Units | % Housing Units |
| 1-Person Household | 62 | 25.0% |
| 2-Person Household | 50 | 20.2% |
| 3-Person Household | 136 | 54.8% |
| 4+ Person Household | 0 | 0.0% |
| Total Housing Units | 248 | 100.0% |
Occupancy by Ownership by Household Size in Hawk Run
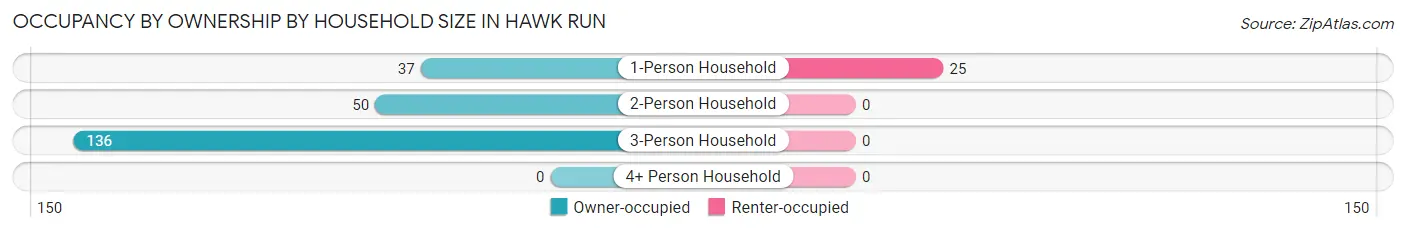
| Household Size | Owner-occupied | Renter-occupied |
| 1-Person Household | 37 (59.7%) | 25 (40.3%) |
| 2-Person Household | 50 (100.0%) | 0 (0.0%) |
| 3-Person Household | 136 (100.0%) | 0 (0.0%) |
| 4+ Person Household | 0 (0.0%) | 0 (0.0%) |
| Total Housing Units | 223 (89.9%) | 25 (10.1%) |
Occupancy by Educational Attainment in Hawk Run
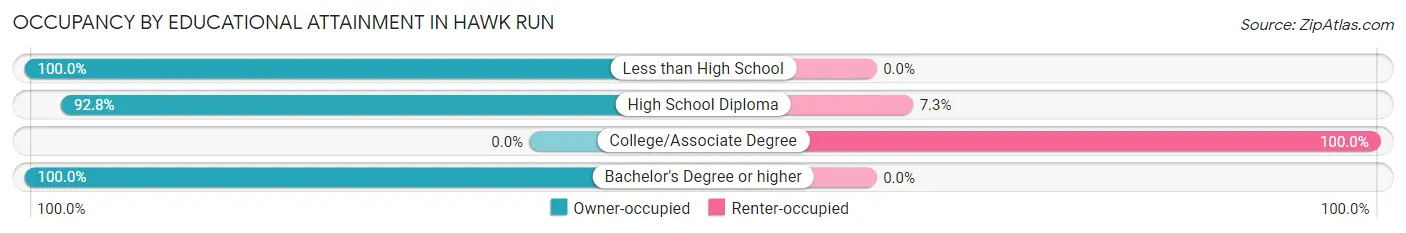
| Household Size | Owner-occupied | Renter-occupied |
| Less than High School | 18 (100.0%) | 0 (0.0%) |
| High School Diploma | 192 (92.7%) | 15 (7.2%) |
| College/Associate Degree | 0 (0.0%) | 10 (100.0%) |
| Bachelor's Degree or higher | 13 (100.0%) | 0 (0.0%) |
Occupancy by Age of Householder in Hawk Run
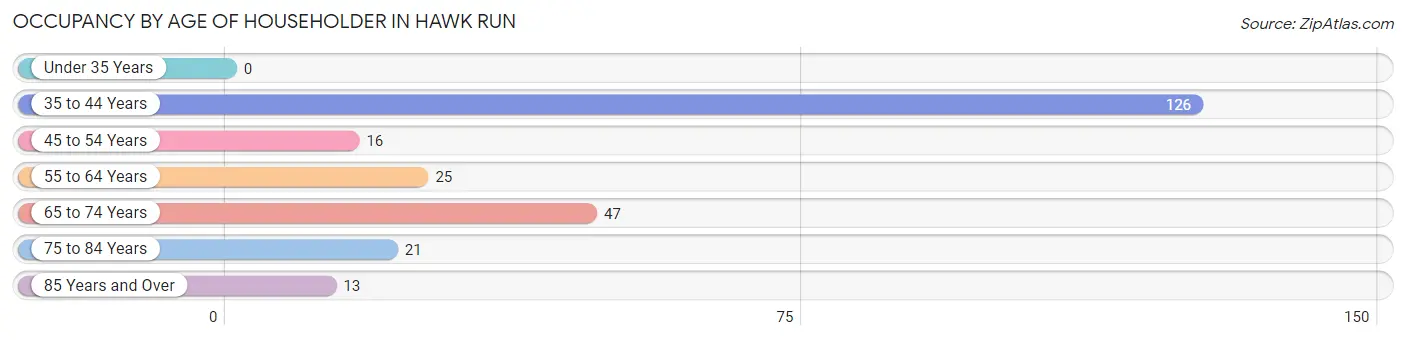
| Age Bracket | # Households | % Households |
| Under 35 Years | 0 | 0.0% |
| 35 to 44 Years | 126 | 50.8% |
| 45 to 54 Years | 16 | 6.5% |
| 55 to 64 Years | 25 | 10.1% |
| 65 to 74 Years | 47 | 19.0% |
| 75 to 84 Years | 21 | 8.5% |
| 85 Years and Over | 13 | 5.2% |
| Total | 248 | 100.0% |
Housing Finances in Hawk Run
Median Income by Occupancy in Hawk Run
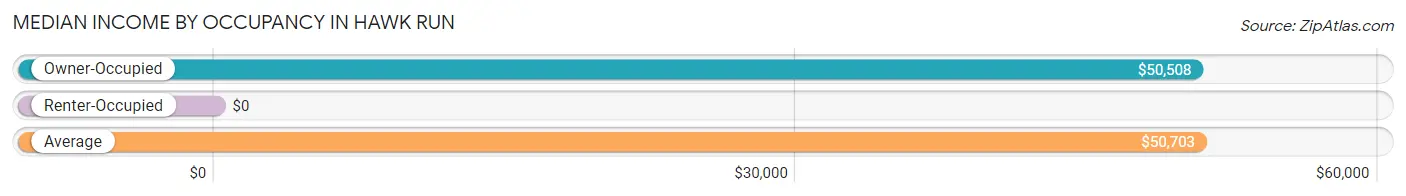
| Occupancy Type | # Households | Median Income |
| Owner-Occupied | 223 (89.9%) | $50,508 |
| Renter-Occupied | 25 (10.1%) | $0 |
| Average | 248 (100.0%) | $50,703 |
Occupancy by Householder Income Bracket in Hawk Run
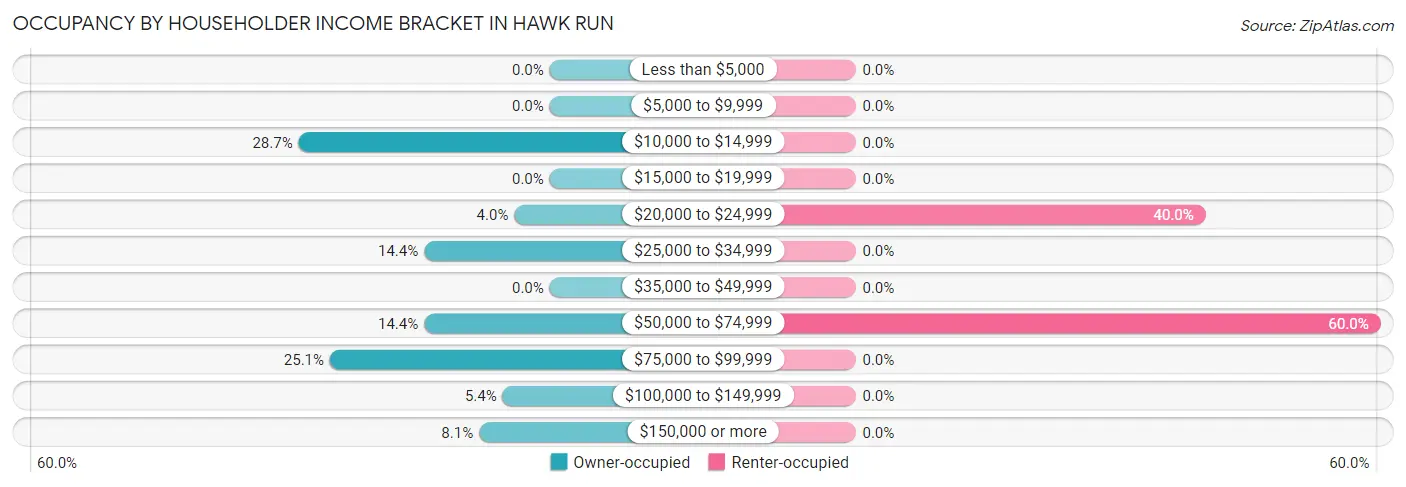
| Income Bracket | Owner-occupied | Renter-occupied |
| Less than $5,000 | 0 (0.0%) | 0 (0.0%) |
| $5,000 to $9,999 | 0 (0.0%) | 0 (0.0%) |
| $10,000 to $14,999 | 64 (28.7%) | 0 (0.0%) |
| $15,000 to $19,999 | 0 (0.0%) | 0 (0.0%) |
| $20,000 to $24,999 | 9 (4.0%) | 10 (40.0%) |
| $25,000 to $34,999 | 32 (14.3%) | 0 (0.0%) |
| $35,000 to $49,999 | 0 (0.0%) | 0 (0.0%) |
| $50,000 to $74,999 | 32 (14.3%) | 15 (60.0%) |
| $75,000 to $99,999 | 56 (25.1%) | 0 (0.0%) |
| $100,000 to $149,999 | 12 (5.4%) | 0 (0.0%) |
| $150,000 or more | 18 (8.1%) | 0 (0.0%) |
| Total | 223 (100.0%) | 25 (100.0%) |
Monthly Housing Cost Tiers in Hawk Run
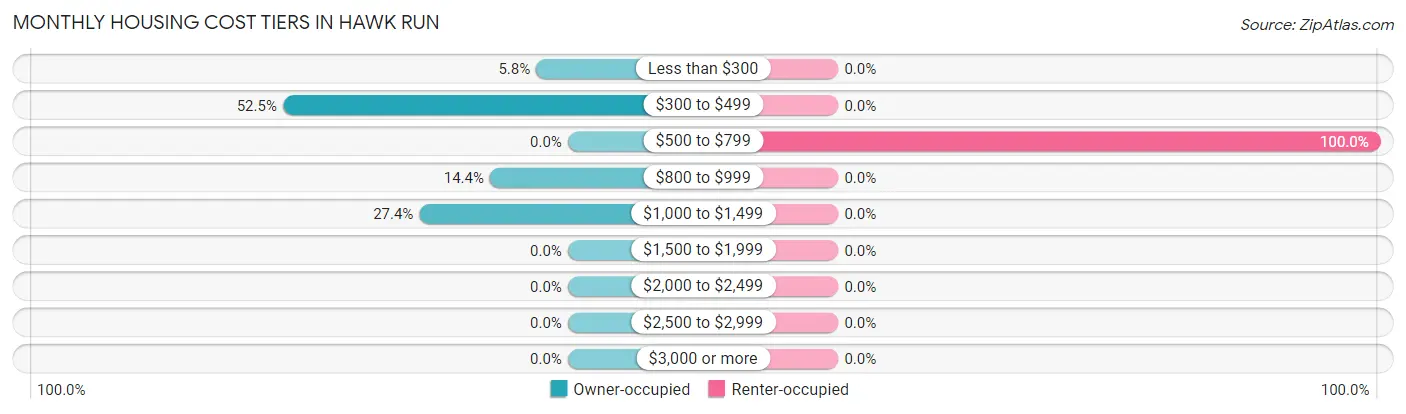
| Monthly Cost | Owner-occupied | Renter-occupied |
| Less than $300 | 13 (5.8%) | 0 (0.0%) |
| $300 to $499 | 117 (52.5%) | 0 (0.0%) |
| $500 to $799 | 0 (0.0%) | 25 (100.0%) |
| $800 to $999 | 32 (14.3%) | 0 (0.0%) |
| $1,000 to $1,499 | 61 (27.4%) | 0 (0.0%) |
| $1,500 to $1,999 | 0 (0.0%) | 0 (0.0%) |
| $2,000 to $2,499 | 0 (0.0%) | 0 (0.0%) |
| $2,500 to $2,999 | 0 (0.0%) | 0 (0.0%) |
| $3,000 or more | 0 (0.0%) | 0 (0.0%) |
| Total | 223 (100.0%) | 25 (100.0%) |
Physical Housing Characteristics in Hawk Run
Housing Structures in Hawk Run
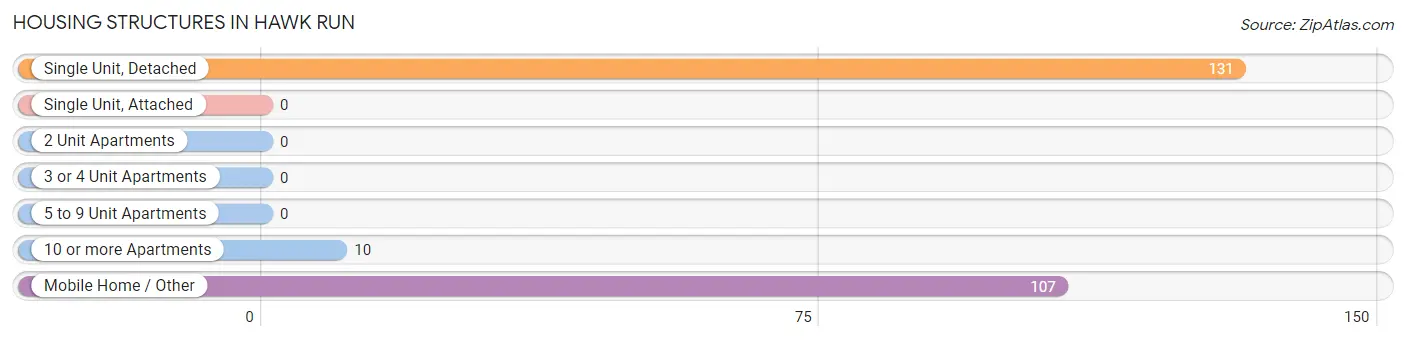
| Structure Type | # Housing Units | % Housing Units |
| Single Unit, Detached | 131 | 52.8% |
| Single Unit, Attached | 0 | 0.0% |
| 2 Unit Apartments | 0 | 0.0% |
| 3 or 4 Unit Apartments | 0 | 0.0% |
| 5 to 9 Unit Apartments | 0 | 0.0% |
| 10 or more Apartments | 10 | 4.0% |
| Mobile Home / Other | 107 | 43.1% |
| Total | 248 | 100.0% |
Housing Structures by Occupancy in Hawk Run
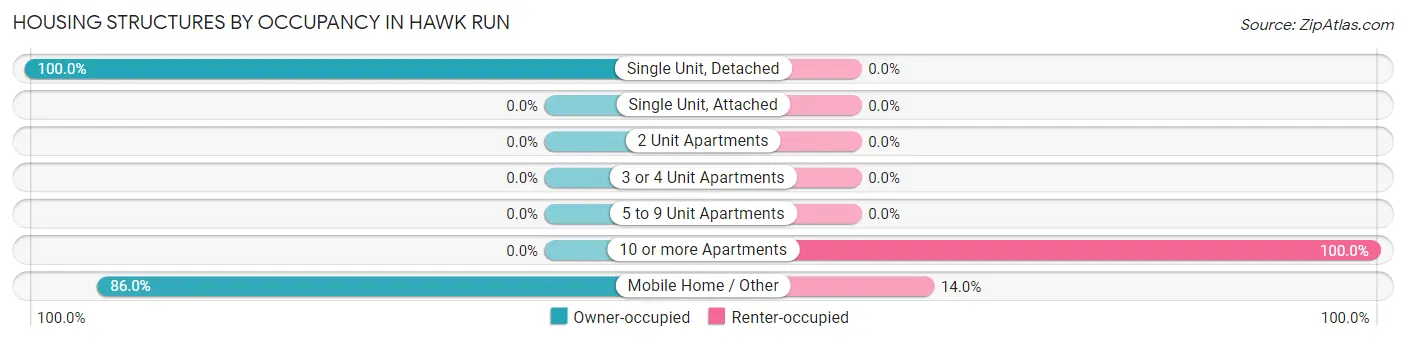
| Structure Type | Owner-occupied | Renter-occupied |
| Single Unit, Detached | 131 (100.0%) | 0 (0.0%) |
| Single Unit, Attached | 0 (0.0%) | 0 (0.0%) |
| 2 Unit Apartments | 0 (0.0%) | 0 (0.0%) |
| 3 or 4 Unit Apartments | 0 (0.0%) | 0 (0.0%) |
| 5 to 9 Unit Apartments | 0 (0.0%) | 0 (0.0%) |
| 10 or more Apartments | 0 (0.0%) | 10 (100.0%) |
| Mobile Home / Other | 92 (86.0%) | 15 (14.0%) |
| Total | 223 (89.9%) | 25 (10.1%) |
Housing Structures by Number of Rooms in Hawk Run
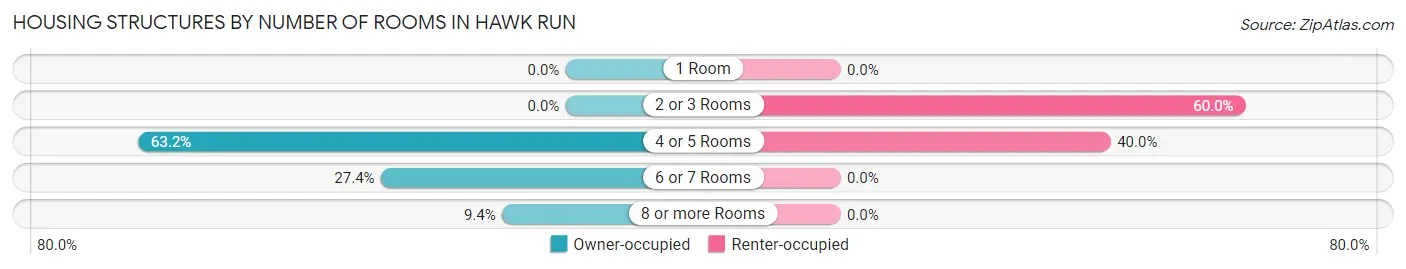
| Number of Rooms | Owner-occupied | Renter-occupied |
| 1 Room | 0 (0.0%) | 0 (0.0%) |
| 2 or 3 Rooms | 0 (0.0%) | 15 (60.0%) |
| 4 or 5 Rooms | 141 (63.2%) | 10 (40.0%) |
| 6 or 7 Rooms | 61 (27.4%) | 0 (0.0%) |
| 8 or more Rooms | 21 (9.4%) | 0 (0.0%) |
| Total | 223 (100.0%) | 25 (100.0%) |
Housing Structure by Heating Type in Hawk Run
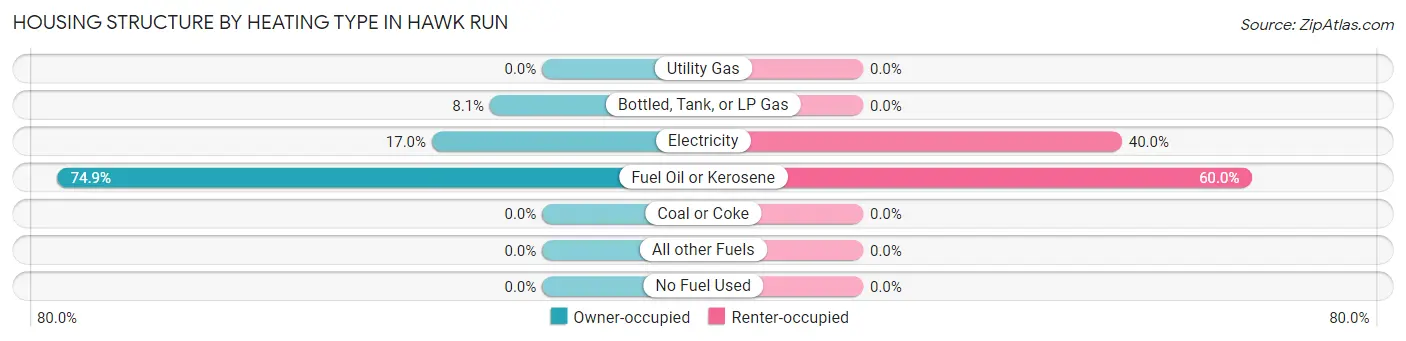
| Heating Type | Owner-occupied | Renter-occupied |
| Utility Gas | 0 (0.0%) | 0 (0.0%) |
| Bottled, Tank, or LP Gas | 18 (8.1%) | 0 (0.0%) |
| Electricity | 38 (17.0%) | 10 (40.0%) |
| Fuel Oil or Kerosene | 167 (74.9%) | 15 (60.0%) |
| Coal or Coke | 0 (0.0%) | 0 (0.0%) |
| All other Fuels | 0 (0.0%) | 0 (0.0%) |
| No Fuel Used | 0 (0.0%) | 0 (0.0%) |
| Total | 223 (100.0%) | 25 (100.0%) |
Household Vehicle Usage in Hawk Run
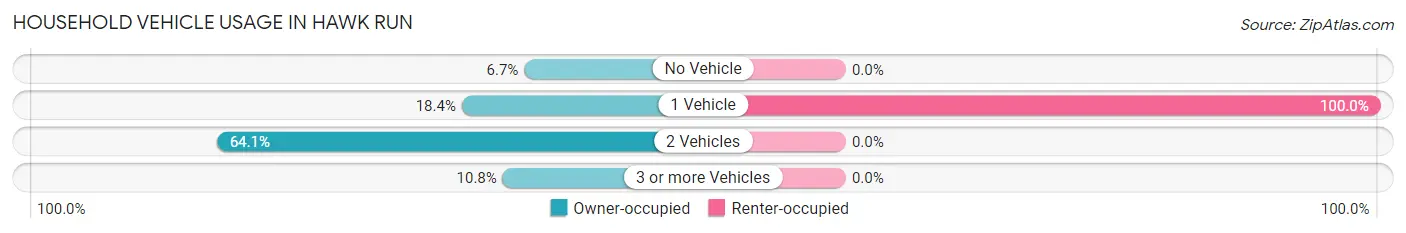
| Vehicles per Household | Owner-occupied | Renter-occupied |
| No Vehicle | 15 (6.7%) | 0 (0.0%) |
| 1 Vehicle | 41 (18.4%) | 25 (100.0%) |
| 2 Vehicles | 143 (64.1%) | 0 (0.0%) |
| 3 or more Vehicles | 24 (10.8%) | 0 (0.0%) |
| Total | 223 (100.0%) | 25 (100.0%) |
Real Estate & Mortgages in Hawk Run
Real Estate and Mortgage Overview in Hawk Run
| Characteristic | Without Mortgage | With Mortgage |
| Housing Units | 111 | 112 |
| Median Property Value | $58,700 | $0 |
| Median Household Income | - | - |
| Monthly Housing Costs | $413 | $0 |
| Real Estate Taxes | $1,164 | $0 |
Property Value by Mortgage Status in Hawk Run
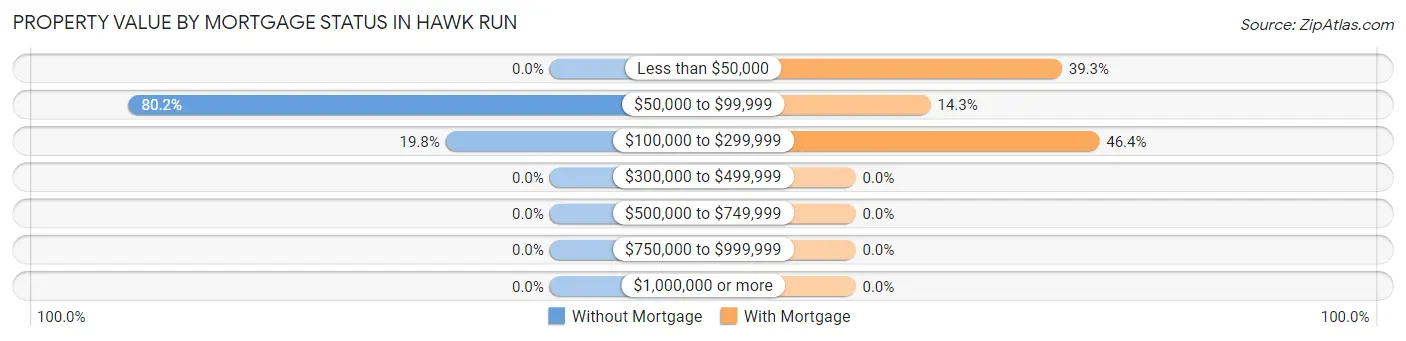
| Property Value | Without Mortgage | With Mortgage |
| Less than $50,000 | 0 (0.0%) | 44 (39.3%) |
| $50,000 to $99,999 | 89 (80.2%) | 16 (14.3%) |
| $100,000 to $299,999 | 22 (19.8%) | 52 (46.4%) |
| $300,000 to $499,999 | 0 (0.0%) | 0 (0.0%) |
| $500,000 to $749,999 | 0 (0.0%) | 0 (0.0%) |
| $750,000 to $999,999 | 0 (0.0%) | 0 (0.0%) |
| $1,000,000 or more | 0 (0.0%) | 0 (0.0%) |
| Total | 111 (100.0%) | 112 (100.0%) |
Household Income by Mortgage Status in Hawk Run
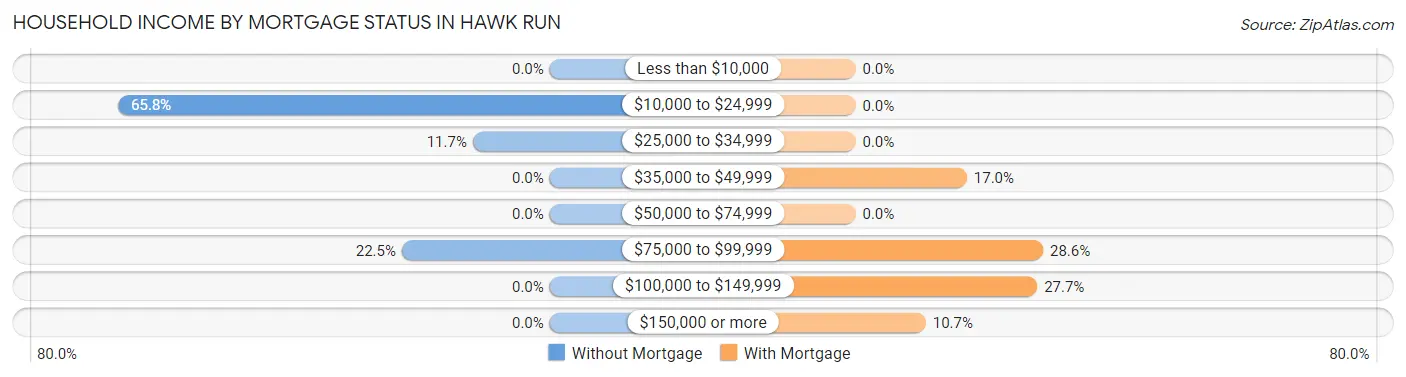
| Household Income | Without Mortgage | With Mortgage |
| Less than $10,000 | 0 (0.0%) | 0 (0.0%) |
| $10,000 to $24,999 | 73 (65.8%) | 0 (0.0%) |
| $25,000 to $34,999 | 13 (11.7%) | 0 (0.0%) |
| $35,000 to $49,999 | 0 (0.0%) | 19 (17.0%) |
| $50,000 to $74,999 | 0 (0.0%) | 0 (0.0%) |
| $75,000 to $99,999 | 25 (22.5%) | 32 (28.6%) |
| $100,000 to $149,999 | 0 (0.0%) | 31 (27.7%) |
| $150,000 or more | 0 (0.0%) | 12 (10.7%) |
| Total | 111 (100.0%) | 112 (100.0%) |
Property Value to Household Income Ratio in Hawk Run
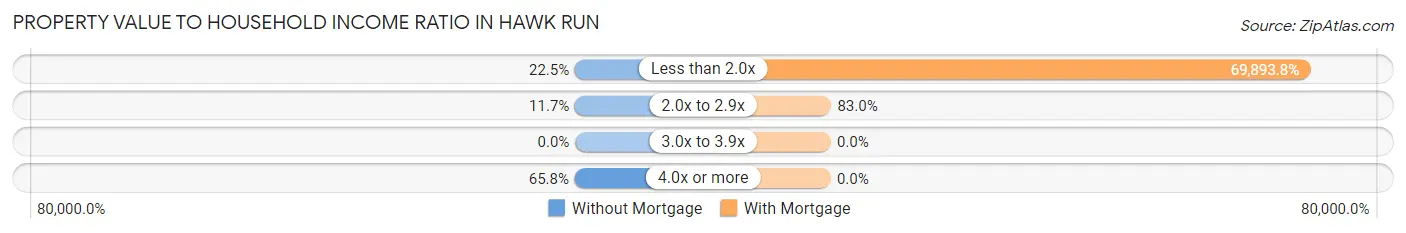
| Value-to-Income Ratio | Without Mortgage | With Mortgage |
| Less than 2.0x | 25 (22.5%) | 78,281 (69,893.8%) |
| 2.0x to 2.9x | 13 (11.7%) | 93 (83.0%) |
| 3.0x to 3.9x | 0 (0.0%) | 0 (0.0%) |
| 4.0x or more | 73 (65.8%) | 0 (0.0%) |
| Total | 111 (100.0%) | 112 (100.0%) |
Real Estate Taxes by Mortgage Status in Hawk Run
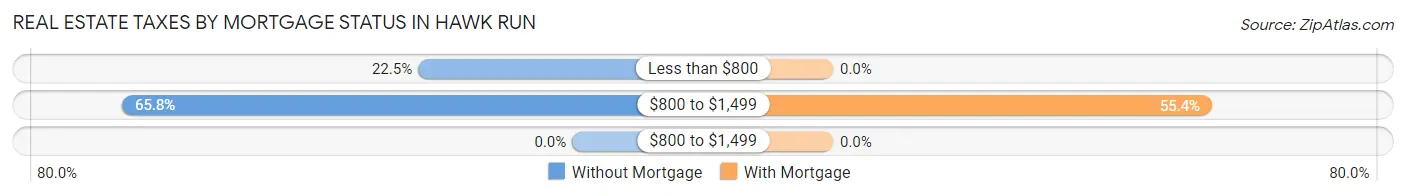
| Property Taxes | Without Mortgage | With Mortgage |
| Less than $800 | 25 (22.5%) | 0 (0.0%) |
| $800 to $1,499 | 73 (65.8%) | 62 (55.4%) |
| $800 to $1,499 | 0 (0.0%) | 0 (0.0%) |
| Total | 111 (100.0%) | 112 (100.0%) |
Health & Disability in Hawk Run
Health Insurance Coverage by Age in Hawk Run
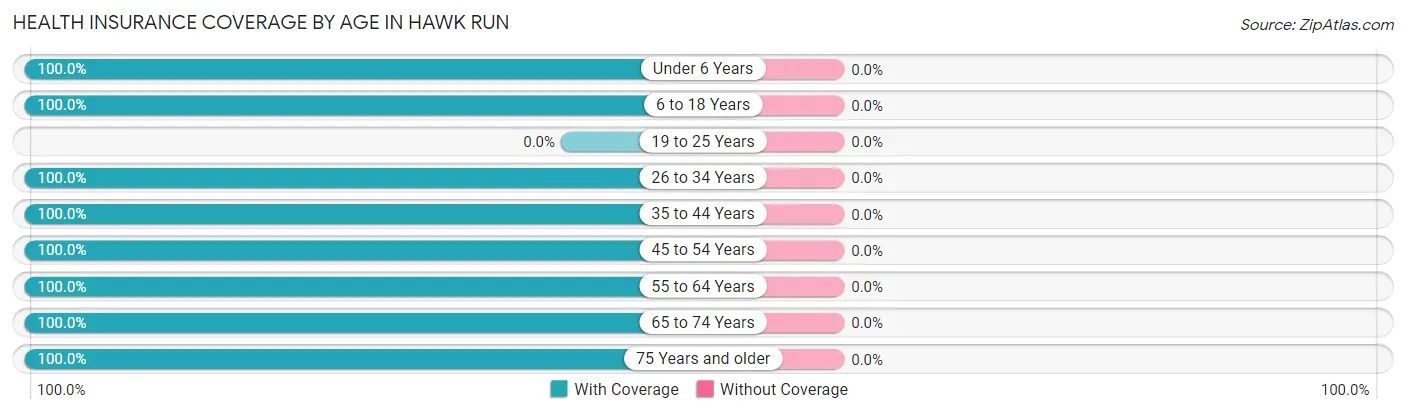
| Age Bracket | With Coverage | Without Coverage |
| Under 6 Years | 88 (100.0%) | 0 (0.0%) |
| 6 to 18 Years | 102 (100.0%) | 0 (0.0%) |
| 19 to 25 Years | 0 (0.0%) | 0 (0.0%) |
| 26 to 34 Years | 19 (100.0%) | 0 (0.0%) |
| 35 to 44 Years | 126 (100.0%) | 0 (0.0%) |
| 45 to 54 Years | 46 (100.0%) | 0 (0.0%) |
| 55 to 64 Years | 53 (100.0%) | 0 (0.0%) |
| 65 to 74 Years | 47 (100.0%) | 0 (0.0%) |
| 75 Years and older | 83 (100.0%) | 0 (0.0%) |
| Total | 564 (100.0%) | 0 (0.0%) |
Health Insurance Coverage by Citizenship Status in Hawk Run
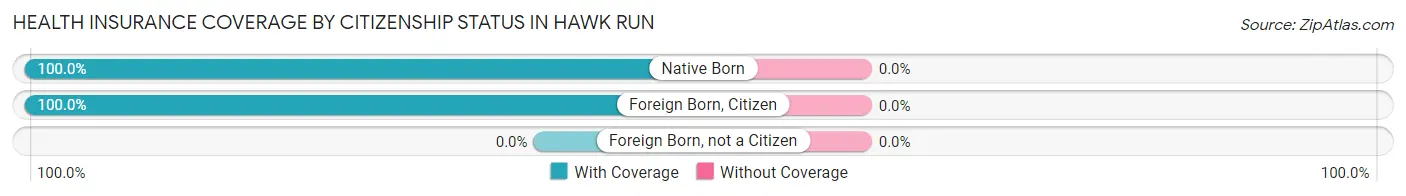
| Citizenship Status | With Coverage | Without Coverage |
| Native Born | 88 (100.0%) | 0 (0.0%) |
| Foreign Born, Citizen | 102 (100.0%) | 0 (0.0%) |
| Foreign Born, not a Citizen | 0 (0.0%) | 0 (0.0%) |
Health Insurance Coverage by Household Income in Hawk Run
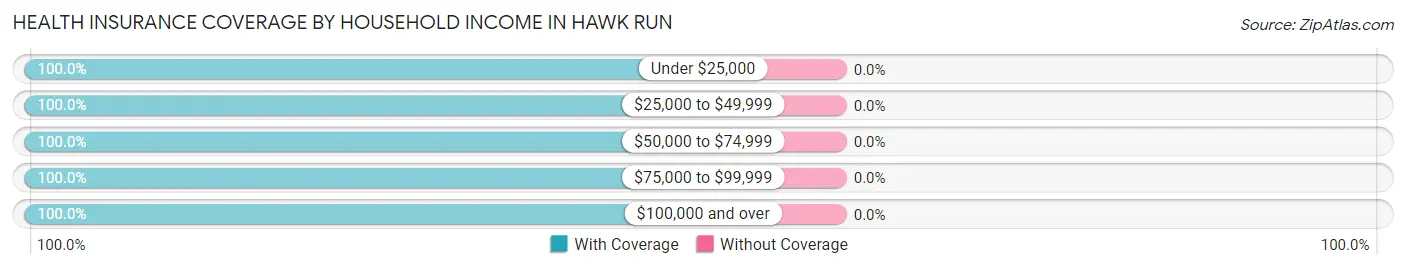
| Household Income | With Coverage | Without Coverage |
| Under $25,000 | 209 (100.0%) | 0 (0.0%) |
| $25,000 to $49,999 | 53 (100.0%) | 0 (0.0%) |
| $50,000 to $74,999 | 99 (100.0%) | 0 (0.0%) |
| $75,000 to $99,999 | 132 (100.0%) | 0 (0.0%) |
| $100,000 and over | 71 (100.0%) | 0 (0.0%) |
Public vs Private Health Insurance Coverage by Age in Hawk Run
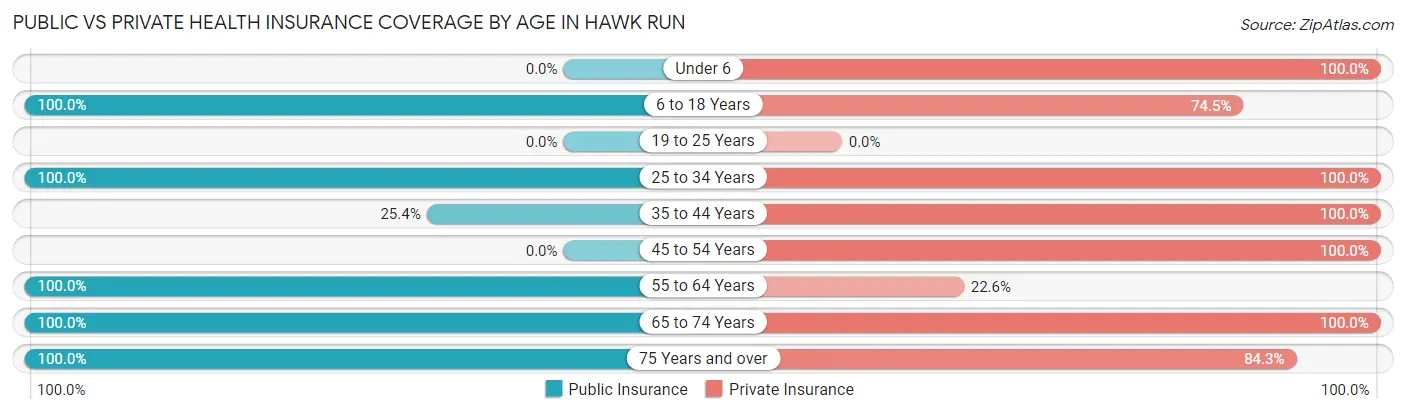
| Age Bracket | Public Insurance | Private Insurance |
| Under 6 | 0 (0.0%) | 88 (100.0%) |
| 6 to 18 Years | 102 (100.0%) | 76 (74.5%) |
| 19 to 25 Years | 0 (0.0%) | 0 (0.0%) |
| 25 to 34 Years | 19 (100.0%) | 19 (100.0%) |
| 35 to 44 Years | 32 (25.4%) | 126 (100.0%) |
| 45 to 54 Years | 0 (0.0%) | 46 (100.0%) |
| 55 to 64 Years | 53 (100.0%) | 12 (22.6%) |
| 65 to 74 Years | 47 (100.0%) | 47 (100.0%) |
| 75 Years and over | 83 (100.0%) | 70 (84.3%) |
| Total | 336 (59.6%) | 484 (85.8%) |
Disability Status by Sex by Age in Hawk Run
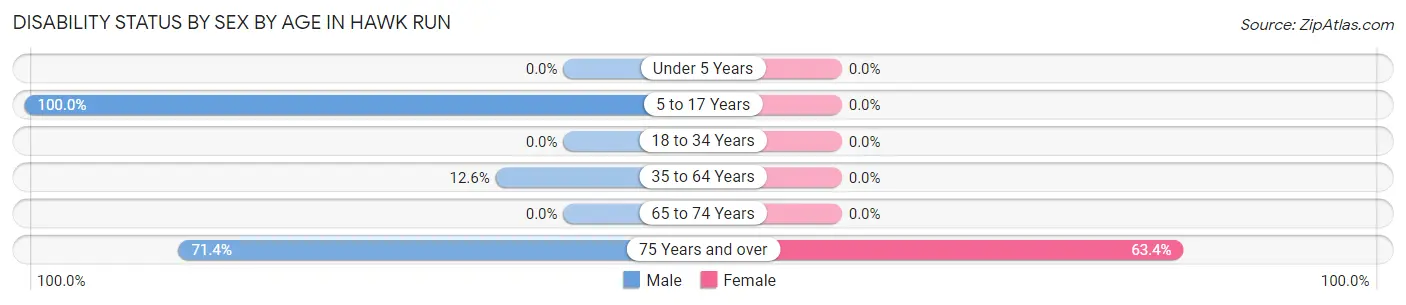
| Age Bracket | Male | Female |
| Under 5 Years | 0 (0.0%) | 0 (0.0%) |
| 5 to 17 Years | 26 (100.0%) | 0 (0.0%) |
| 18 to 34 Years | 0 (0.0%) | 0 (0.0%) |
| 35 to 64 Years | 20 (12.6%) | 0 (0.0%) |
| 65 to 74 Years | 0 (0.0%) | 0 (0.0%) |
| 75 Years and over | 30 (71.4%) | 26 (63.4%) |
Disability Class by Sex by Age in Hawk Run
Disability Class: Hearing Difficulty
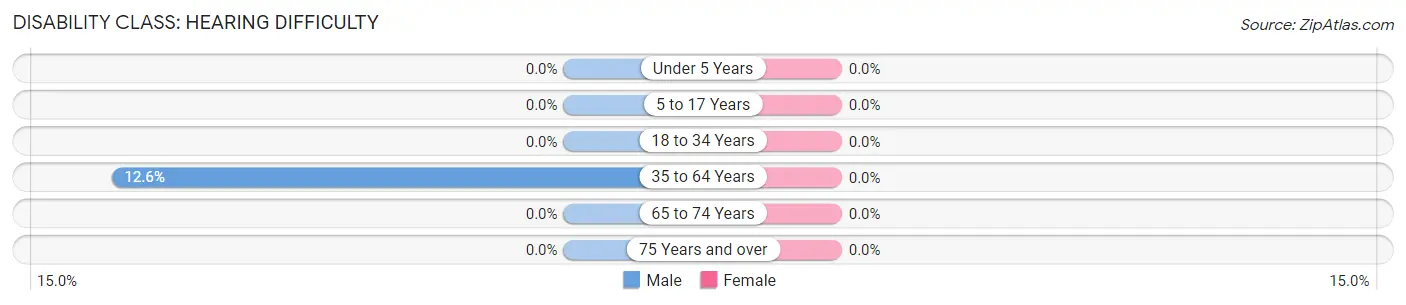
| Age Bracket | Male | Female |
| Under 5 Years | 0 (0.0%) | 0 (0.0%) |
| 5 to 17 Years | 0 (0.0%) | 0 (0.0%) |
| 18 to 34 Years | 0 (0.0%) | 0 (0.0%) |
| 35 to 64 Years | 20 (12.6%) | 0 (0.0%) |
| 65 to 74 Years | 0 (0.0%) | 0 (0.0%) |
| 75 Years and over | 0 (0.0%) | 0 (0.0%) |
Disability Class: Vision Difficulty
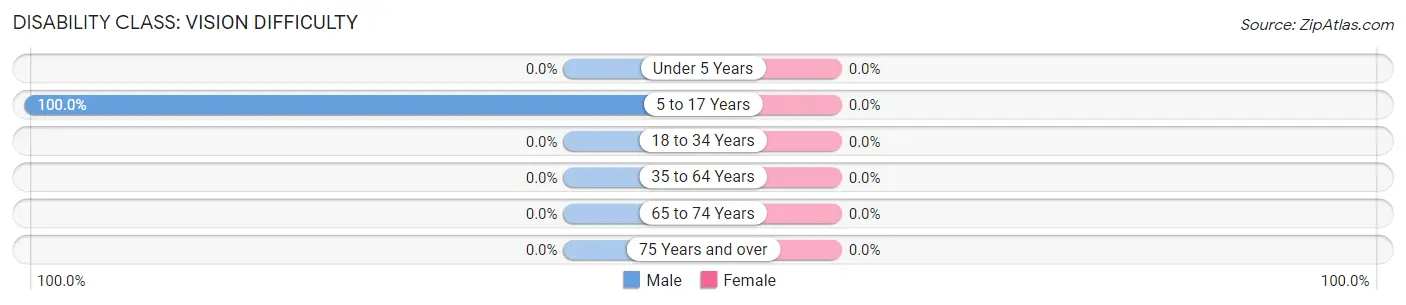
| Age Bracket | Male | Female |
| Under 5 Years | 0 (0.0%) | 0 (0.0%) |
| 5 to 17 Years | 26 (100.0%) | 0 (0.0%) |
| 18 to 34 Years | 0 (0.0%) | 0 (0.0%) |
| 35 to 64 Years | 0 (0.0%) | 0 (0.0%) |
| 65 to 74 Years | 0 (0.0%) | 0 (0.0%) |
| 75 Years and over | 0 (0.0%) | 0 (0.0%) |
Disability Class: Cognitive Difficulty
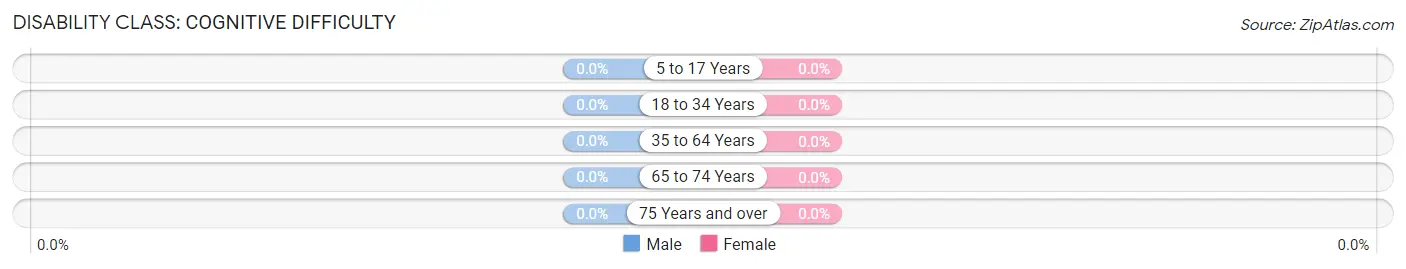
| Age Bracket | Male | Female |
| 5 to 17 Years | 0 (0.0%) | 0 (0.0%) |
| 18 to 34 Years | 0 (0.0%) | 0 (0.0%) |
| 35 to 64 Years | 0 (0.0%) | 0 (0.0%) |
| 65 to 74 Years | 0 (0.0%) | 0 (0.0%) |
| 75 Years and over | 0 (0.0%) | 0 (0.0%) |
Disability Class: Ambulatory Difficulty
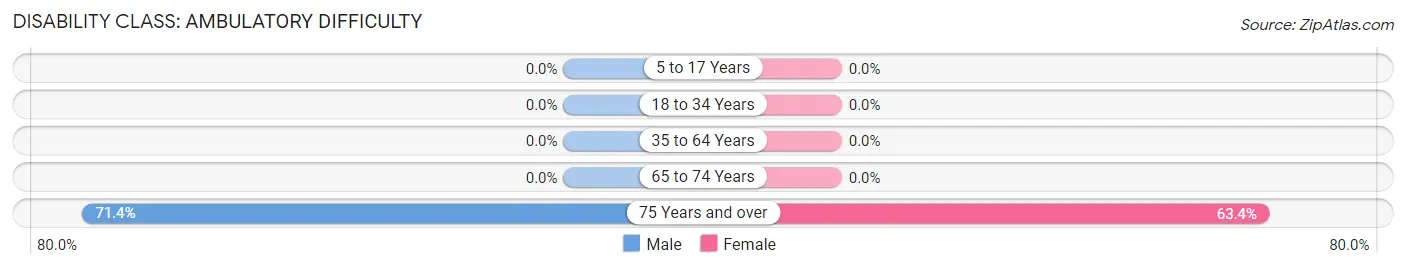
| Age Bracket | Male | Female |
| 5 to 17 Years | 0 (0.0%) | 0 (0.0%) |
| 18 to 34 Years | 0 (0.0%) | 0 (0.0%) |
| 35 to 64 Years | 0 (0.0%) | 0 (0.0%) |
| 65 to 74 Years | 0 (0.0%) | 0 (0.0%) |
| 75 Years and over | 30 (71.4%) | 26 (63.4%) |
Disability Class: Self-Care Difficulty
| Age Bracket | Male | Female |
| 5 to 17 Years | 0 (0.0%) | 0 (0.0%) |
| 18 to 34 Years | 0 (0.0%) | 0 (0.0%) |
| 35 to 64 Years | 0 (0.0%) | 0 (0.0%) |
| 65 to 74 Years | 0 (0.0%) | 0 (0.0%) |
| 75 Years and over | 0 (0.0%) | 0 (0.0%) |
Technology Access in Hawk Run
Computing Device Access in Hawk Run
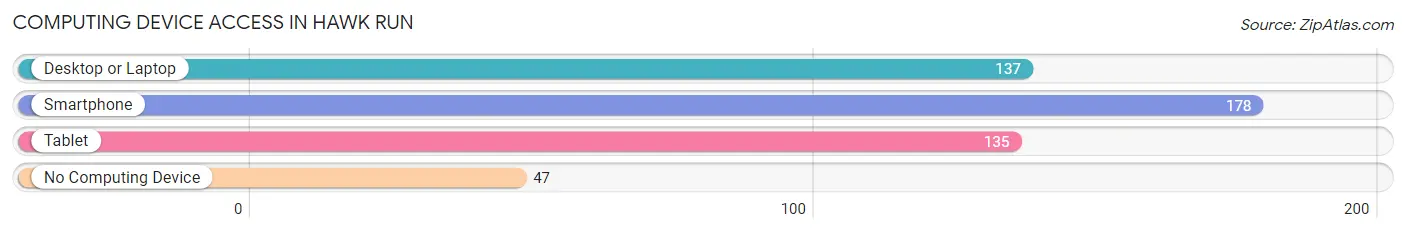
| Device Type | # Households | % Households |
| Desktop or Laptop | 137 | 55.2% |
| Smartphone | 178 | 71.8% |
| Tablet | 135 | 54.4% |
| No Computing Device | 47 | 19.0% |
| Total | 248 | 100.0% |
Internet Access in Hawk Run
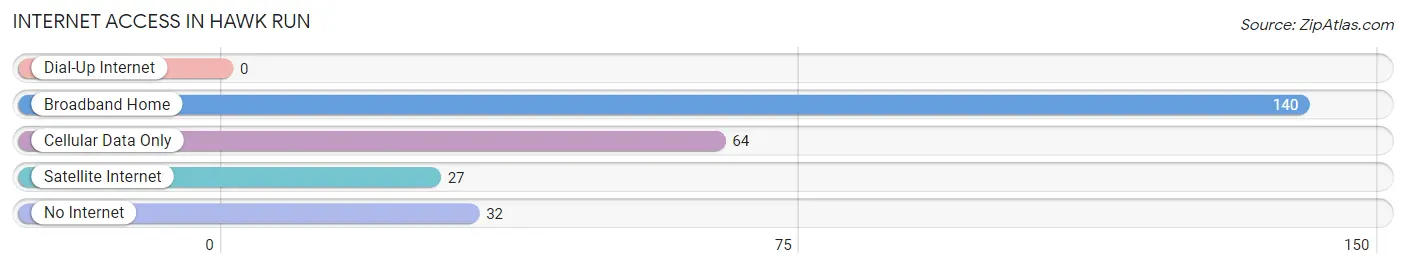
| Internet Type | # Households | % Households |
| Dial-Up Internet | 0 | 0.0% |
| Broadband Home | 140 | 56.5% |
| Cellular Data Only | 64 | 25.8% |
| Satellite Internet | 27 | 10.9% |
| No Internet | 32 | 12.9% |
| Total | 248 | 100.0% |
Hawk Run Summary
Hawk Run is a small borough located in Clearfield County, Pennsylvania. It is situated in the western part of the state, about 20 miles east of the city of DuBois. The population of Hawk Run was 545 at the 2010 census.
History
Hawk Run was founded in 1872 by a group of settlers from the nearby town of Clearfield. The town was named after a nearby stream, Hawk Run, which was named for the hawks that were often seen in the area. The town was originally a farming community, but in the early 1900s, the coal industry began to take off in the area. The coal industry provided jobs for many of the residents of Hawk Run, and the town grew rapidly.
Geography
Hawk Run is located in western Pennsylvania, about 20 miles east of the city of DuBois. The town is situated in a valley, surrounded by hills and mountains. The town is located in the Allegheny Plateau region of the Appalachian Mountains. The climate in Hawk Run is humid continental, with cold winters and warm summers.
Economy
Hawk Run’s economy is largely based on the coal industry. The town is home to several coal mines, and many of the residents are employed in the coal industry. In addition to the coal industry, Hawk Run also has a few small businesses, including a grocery store, a hardware store, and a few restaurants.
Demographics
As of the 2010 census, the population of Hawk Run was 545. The racial makeup of the town was 97.3% White, 0.7% African American, 0.2% Native American, 0.2% Asian, and 1.6% from two or more races. The median household income in Hawk Run was $37,500, and the median family income was $45,000. The per capita income in Hawk Run was $17,000.
Conclusion
Hawk Run is a small borough located in Clearfield County, Pennsylvania. It was founded in 1872 by a group of settlers from the nearby town of Clearfield, and was named after a nearby stream. The town’s economy is largely based on the coal industry, and many of the residents are employed in the coal industry. The population of Hawk Run was 545 at the 2010 census, and the racial makeup of the town was 97.3% White, 0.7% African American, 0.2% Native American, 0.2% Asian, and 1.6% from two or more races. The median household income in Hawk Run was $37,500, and the median family income was $45,000.
Common Questions
What is Per Capita Income in Hawk Run?
Per Capita income in Hawk Run is $25,395.
What is the Median Family Income in Hawk Run?
Median Family Income in Hawk Run is $50,781.
What is the Median Household income in Hawk Run?
Median Household Income in Hawk Run is $50,703.
What is Inequality or Gini Index in Hawk Run?
Inequality or Gini Index in Hawk Run is 0.44.
What is the Total Population of Hawk Run?
Total Population of Hawk Run is 564.
What is the Total Male Population of Hawk Run?
Total Male Population of Hawk Run is 255.
What is the Total Female Population of Hawk Run?
Total Female Population of Hawk Run is 309.
What is the Ratio of Males per 100 Females in Hawk Run?
There are 82.52 Males per 100 Females in Hawk Run.
What is the Ratio of Females per 100 Males in Hawk Run?
There are 121.18 Females per 100 Males in Hawk Run.
What is the Median Population Age in Hawk Run?
Median Population Age in Hawk Run is 38.9 Years.
What is the Average Family Size in Hawk Run
Average Family Size in Hawk Run is 2.6 People.
What is the Average Household Size in Hawk Run
Average Household Size in Hawk Run is 2.3 People.
How Large is the Labor Force in Hawk Run?
There are 268 People in the Labor Forcein in Hawk Run.
What is the Percentage of People in the Labor Force in Hawk Run?
62.9% of People are in the Labor Force in Hawk Run.
What is the Unemployment Rate in Hawk Run?
Unemployment Rate in Hawk Run is 33.2%.