Harleysville, PA Map & Demographics
Harleysville Map
Harleysville Overview
$56,896
PER CAPITA INCOME
$144,375
AVG FAMILY INCOME
$109,091
AVG HOUSEHOLD INCOME
36.1%
WAGE / INCOME GAP [ % ]
63.9¢/ $1
WAGE / INCOME GAP [ $ ]
0.41
INEQUALITY / GINI INDEX
8,992
TOTAL POPULATION
4,632
MALE POPULATION
4,360
FEMALE POPULATION
106.24
MALES / 100 FEMALES
94.13
FEMALES / 100 MALES
49.0
MEDIAN AGE
2.9
AVG FAMILY SIZE
2.4
AVG HOUSEHOLD SIZE
5,201
LABOR FORCE [ PEOPLE ]
66.3%
PERCENT IN LABOR FORCE
2.7%
UNEMPLOYMENT RATE
Harleysville Zip Codes
Income in Harleysville
Income Overview in Harleysville
Per Capita Income in Harleysville is $56,896, while median incomes of families and households are $144,375 and $109,091 respectively.
| Characteristic | Number | Measure |
| Per Capita Income | 8,992 | $56,896 |
| Median Family Income | 2,564 | $144,375 |
| Mean Family Income | 2,564 | $162,475 |
| Median Household Income | 3,692 | $109,091 |
| Mean Household Income | 3,692 | $134,789 |
| Income Deficit | 2,564 | $0 |
| Wage / Income Gap (%) | 8,992 | 36.08% |
| Wage / Income Gap ($) | 8,992 | 63.92¢ per $1 |
| Gini / Inequality Index | 8,992 | 0.41 |
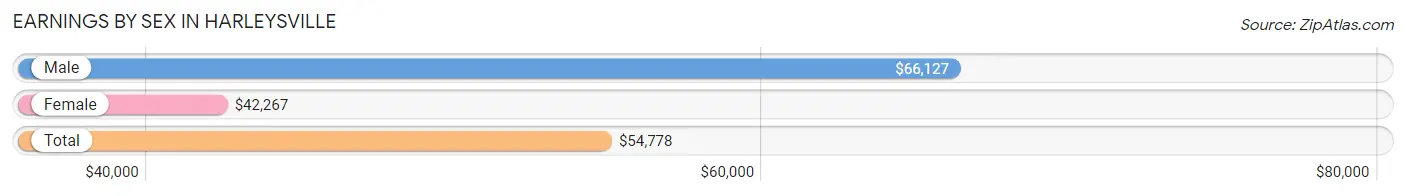
Earnings by Sex in Harleysville
Average Earnings in Harleysville are $54,778, $66,127 for men and $42,267 for women, a difference of 36.1%.
| Sex | Number | Average Earnings |
| Male | 2,805 (52.1%) | $66,127 |
| Female | 2,581 (47.9%) | $42,267 |
| Total | 5,386 (100.0%) | $54,778 |
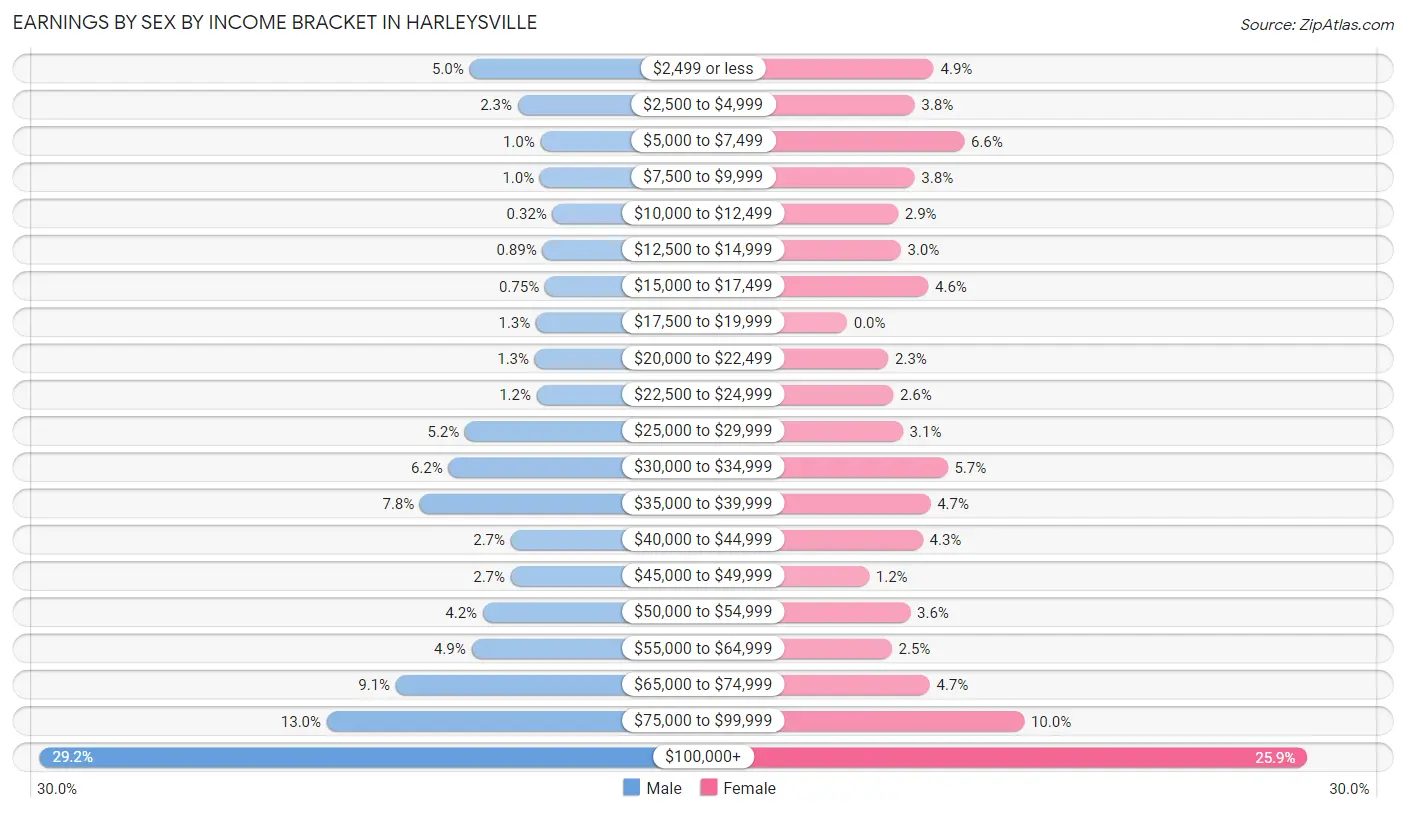
Earnings by Sex by Income Bracket in Harleysville
The most common earnings brackets in Harleysville are $100,000+ for men (818 | 29.2%) and $100,000+ for women (668 | 25.9%).
| Income | Male | Female |
| $2,499 or less | 140 (5.0%) | 126 (4.9%) |
| $2,500 to $4,999 | 64 (2.3%) | 98 (3.8%) |
| $5,000 to $7,499 | 28 (1.0%) | 170 (6.6%) |
| $7,500 to $9,999 | 29 (1.0%) | 98 (3.8%) |
| $10,000 to $12,499 | 9 (0.3%) | 74 (2.9%) |
| $12,500 to $14,999 | 25 (0.9%) | 78 (3.0%) |
| $15,000 to $17,499 | 21 (0.7%) | 118 (4.6%) |
| $17,500 to $19,999 | 35 (1.3%) | 0 (0.0%) |
| $20,000 to $22,499 | 37 (1.3%) | 60 (2.3%) |
| $22,500 to $24,999 | 34 (1.2%) | 67 (2.6%) |
| $25,000 to $29,999 | 147 (5.2%) | 81 (3.1%) |
| $30,000 to $34,999 | 173 (6.2%) | 146 (5.7%) |
| $35,000 to $39,999 | 218 (7.8%) | 121 (4.7%) |
| $40,000 to $44,999 | 75 (2.7%) | 110 (4.3%) |
| $45,000 to $49,999 | 75 (2.7%) | 32 (1.2%) |
| $50,000 to $54,999 | 119 (4.2%) | 92 (3.6%) |
| $55,000 to $64,999 | 137 (4.9%) | 65 (2.5%) |
| $65,000 to $74,999 | 256 (9.1%) | 120 (4.6%) |
| $75,000 to $99,999 | 365 (13.0%) | 257 (10.0%) |
| $100,000+ | 818 (29.2%) | 668 (25.9%) |
| Total | 2,805 (100.0%) | 2,581 (100.0%) |
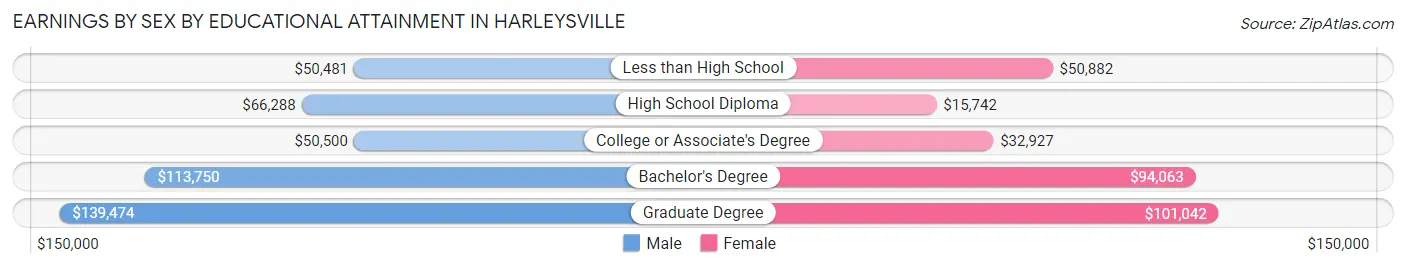
Earnings by Sex by Educational Attainment in Harleysville
Average earnings in Harleysville are $73,915 for men and $53,793 for women, a difference of 27.2%. Men with an educational attainment of graduate degree enjoy the highest average annual earnings of $139,474, while those with less than high school education earn the least with $50,481. Women with an educational attainment of graduate degree earn the most with the average annual earnings of $101,042, while those with high school diploma education have the smallest earnings of $15,742.
| Educational Attainment | Male Income | Female Income |
| Less than High School | $50,481 | $50,882 |
| High School Diploma | $66,288 | $15,742 |
| College or Associate's Degree | $50,500 | $32,927 |
| Bachelor's Degree | $113,750 | $94,063 |
| Graduate Degree | $139,474 | $101,042 |
| Total | $73,915 | $53,793 |
Family Income in Harleysville
Family Income Brackets in Harleysville
According to the Harleysville family income data, there are 651 families falling into the $150,000 to $199,999 income range, which is the most common income bracket and makes up 25.4% of all families.
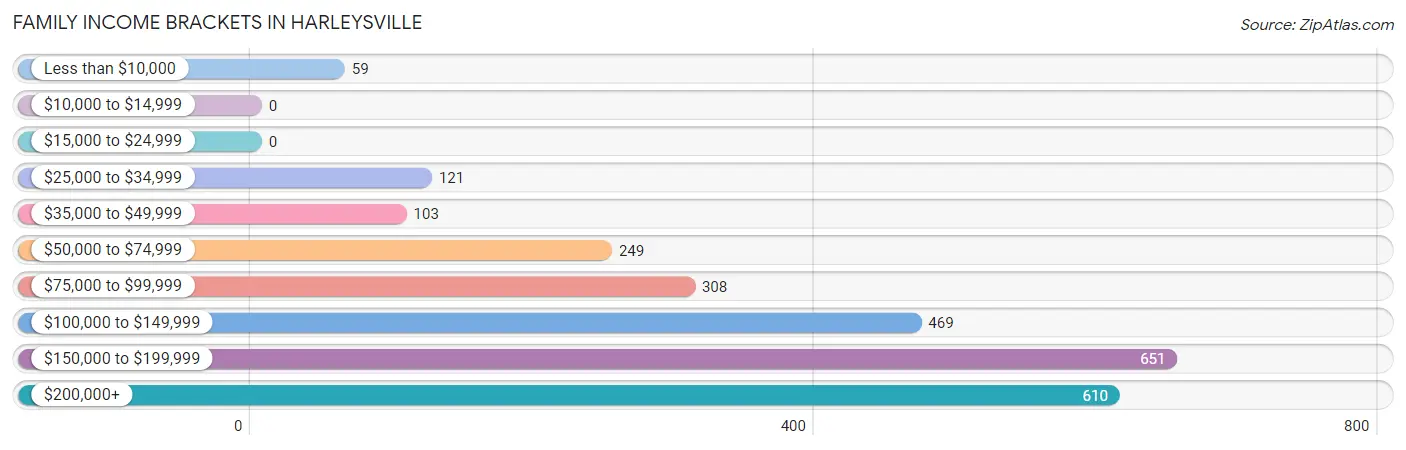
| Income Bracket | # Families | % Families |
| Less than $10,000 | 59 | 2.3% |
| $10,000 to $14,999 | 0 | 0.0% |
| $15,000 to $24,999 | 0 | 0.0% |
| $25,000 to $34,999 | 121 | 4.7% |
| $35,000 to $49,999 | 103 | 4.0% |
| $50,000 to $74,999 | 249 | 9.7% |
| $75,000 to $99,999 | 308 | 12.0% |
| $100,000 to $149,999 | 469 | 18.3% |
| $150,000 to $199,999 | 651 | 25.4% |
| $200,000+ | 610 | 23.8% |
Family Income by Famaliy Size in Harleysville
6-person families (63 | 2.5%) account for the highest median family income in Harleysville with $250,001 per family, while 2-person families (1,456 | 56.8%) have the highest median income of $54,250 per family member.
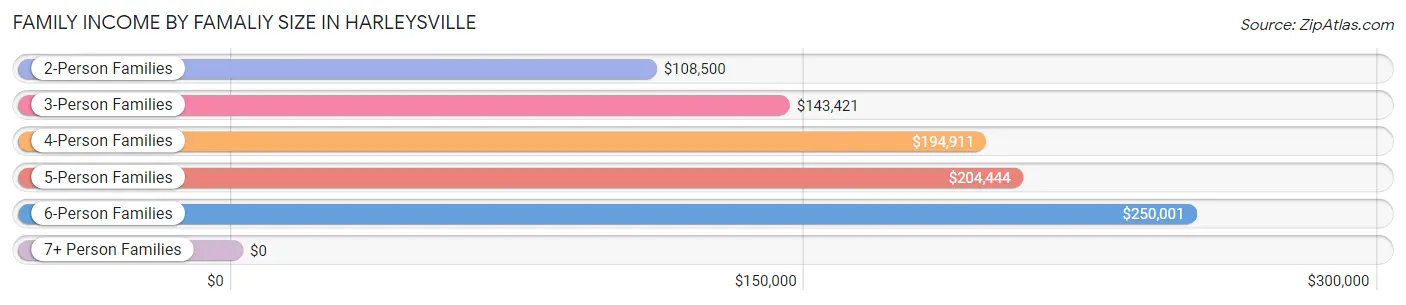
| Income Bracket | # Families | Median Income |
| 2-Person Families | 1,456 (56.8%) | $108,500 |
| 3-Person Families | 472 (18.4%) | $143,421 |
| 4-Person Families | 399 (15.6%) | $194,911 |
| 5-Person Families | 174 (6.8%) | $204,444 |
| 6-Person Families | 63 (2.5%) | $250,001 |
| 7+ Person Families | 0 (0.0%) | $0 |
| Total | 2,564 (100.0%) | $144,375 |
Family Income by Number of Earners in Harleysville
The median family income in Harleysville is $144,375, with families comprising 3+ earners (431) having the highest median family income of $196,625, while families with no earners (335) have the lowest median family income of $68,021, accounting for 16.8% and 13.1% of families, respectively.
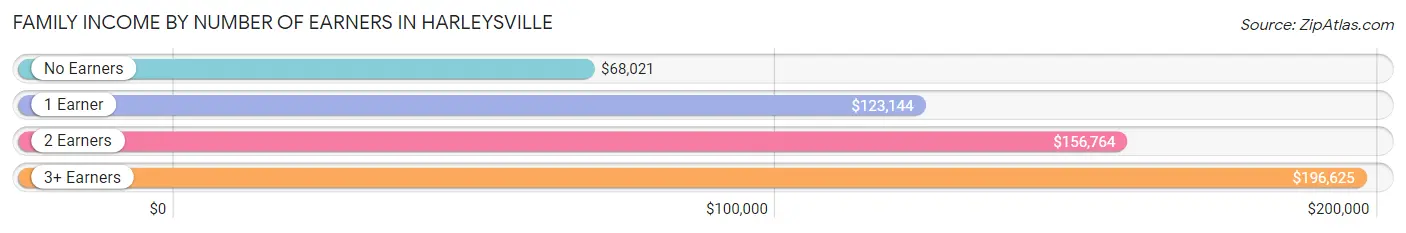
| Number of Earners | # Families | Median Income |
| No Earners | 335 (13.1%) | $68,021 |
| 1 Earner | 609 (23.7%) | $123,144 |
| 2 Earners | 1,189 (46.4%) | $156,764 |
| 3+ Earners | 431 (16.8%) | $196,625 |
| Total | 2,564 (100.0%) | $144,375 |
Household Income in Harleysville
Household Income Brackets in Harleysville
With 709 households falling in the category, the $150,000 to $199,999 income range is the most frequent in Harleysville, accounting for 19.2% of all households. In contrast, only 7 households (0.2%) fall into the $10,000 to $14,999 income bracket, making it the least populous group.
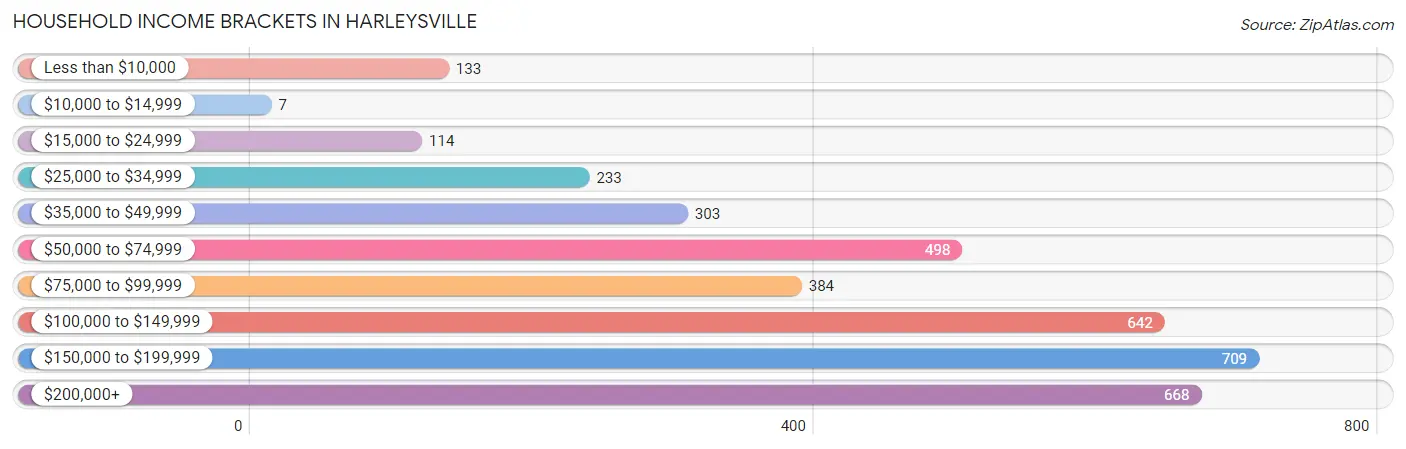
| Income Bracket | # Households | % Households |
| Less than $10,000 | 133 | 3.6% |
| $10,000 to $14,999 | 7 | 0.2% |
| $15,000 to $24,999 | 114 | 3.1% |
| $25,000 to $34,999 | 233 | 6.3% |
| $35,000 to $49,999 | 303 | 8.2% |
| $50,000 to $74,999 | 498 | 13.5% |
| $75,000 to $99,999 | 384 | 10.4% |
| $100,000 to $149,999 | 642 | 17.4% |
| $150,000 to $199,999 | 709 | 19.2% |
| $200,000+ | 668 | 18.1% |
Household Income by Householder Age in Harleysville
The median household income in Harleysville is $109,091, with the highest median household income of $155,976 found in the 45 to 64 years age bracket for the primary householder. A total of 1,510 households (40.9%) fall into this category. Meanwhile, the 15 to 24 years age bracket for the primary householder has the lowest median household income of $0, with 62 households (1.7%) in this group.
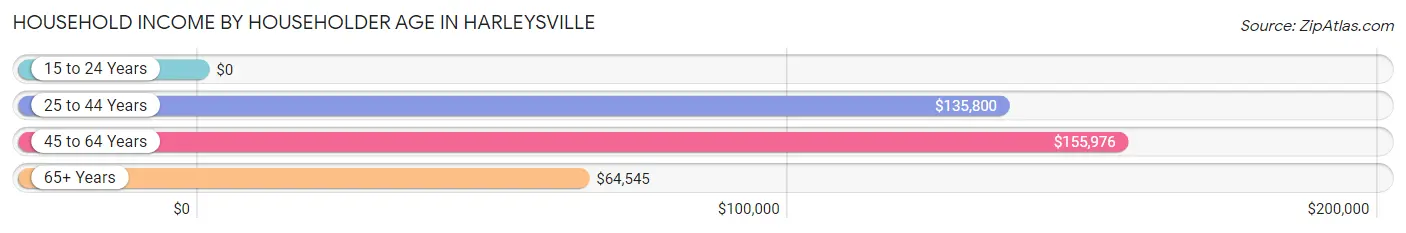
| Income Bracket | # Households | Median Income |
| 15 to 24 Years | 62 (1.7%) | $0 |
| 25 to 44 Years | 768 (20.8%) | $135,800 |
| 45 to 64 Years | 1,510 (40.9%) | $155,976 |
| 65+ Years | 1,352 (36.6%) | $64,545 |
| Total | 3,692 (100.0%) | $109,091 |
Poverty in Harleysville
Income Below Poverty by Sex and Age in Harleysville
With 3.4% poverty level for males and 5.4% for females among the residents of Harleysville, 12 to 14 year old males and 12 to 14 year old females are the most vulnerable to poverty, with 33 males (21.1%) and 33 females (25.2%) in their respective age groups living below the poverty level.
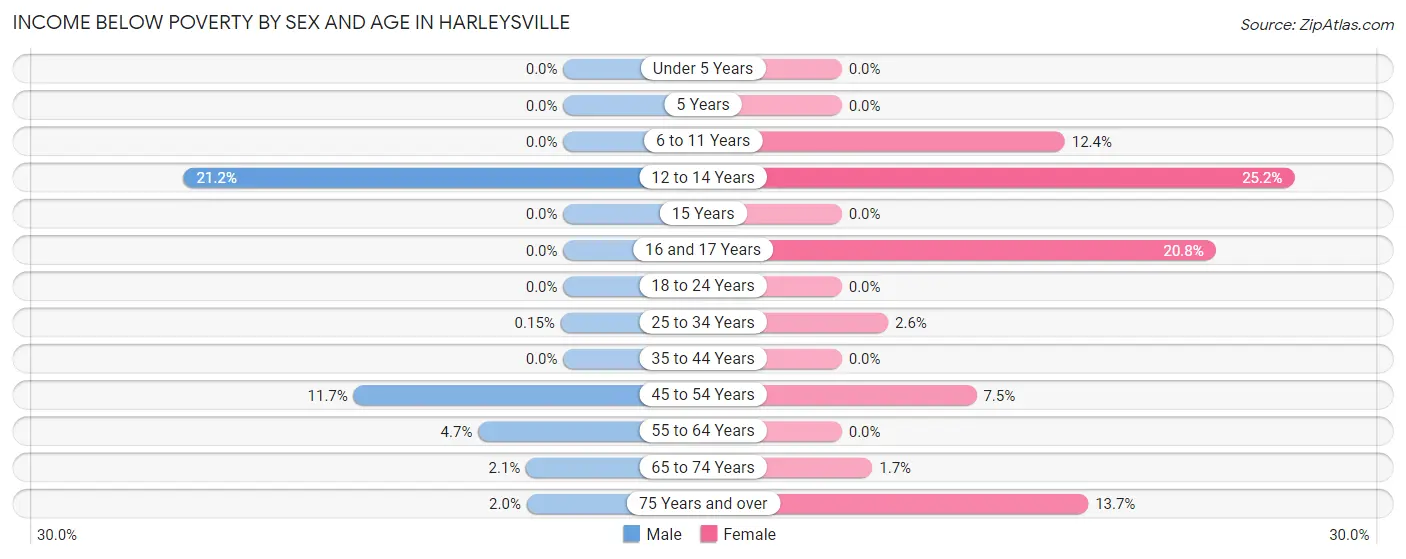
| Age Bracket | Male | Female |
| Under 5 Years | 0 (0.0%) | 0 (0.0%) |
| 5 Years | 0 (0.0%) | 0 (0.0%) |
| 6 to 11 Years | 0 (0.0%) | 19 (12.4%) |
| 12 to 14 Years | 33 (21.1%) | 33 (25.2%) |
| 15 Years | 0 (0.0%) | 0 (0.0%) |
| 16 and 17 Years | 0 (0.0%) | 31 (20.8%) |
| 18 to 24 Years | 0 (0.0%) | 0 (0.0%) |
| 25 to 34 Years | 1 (0.2%) | 10 (2.6%) |
| 35 to 44 Years | 0 (0.0%) | 0 (0.0%) |
| 45 to 54 Years | 64 (11.7%) | 53 (7.5%) |
| 55 to 64 Years | 36 (4.7%) | 0 (0.0%) |
| 65 to 74 Years | 10 (2.1%) | 9 (1.7%) |
| 75 Years and over | 11 (2.0%) | 76 (13.7%) |
| Total | 155 (3.4%) | 231 (5.4%) |
Income Above Poverty by Sex and Age in Harleysville
According to the poverty statistics in Harleysville, males aged under 5 years and females aged under 5 years are the age groups that are most secure financially, with 100.0% of males and 100.0% of females in these age groups living above the poverty line.
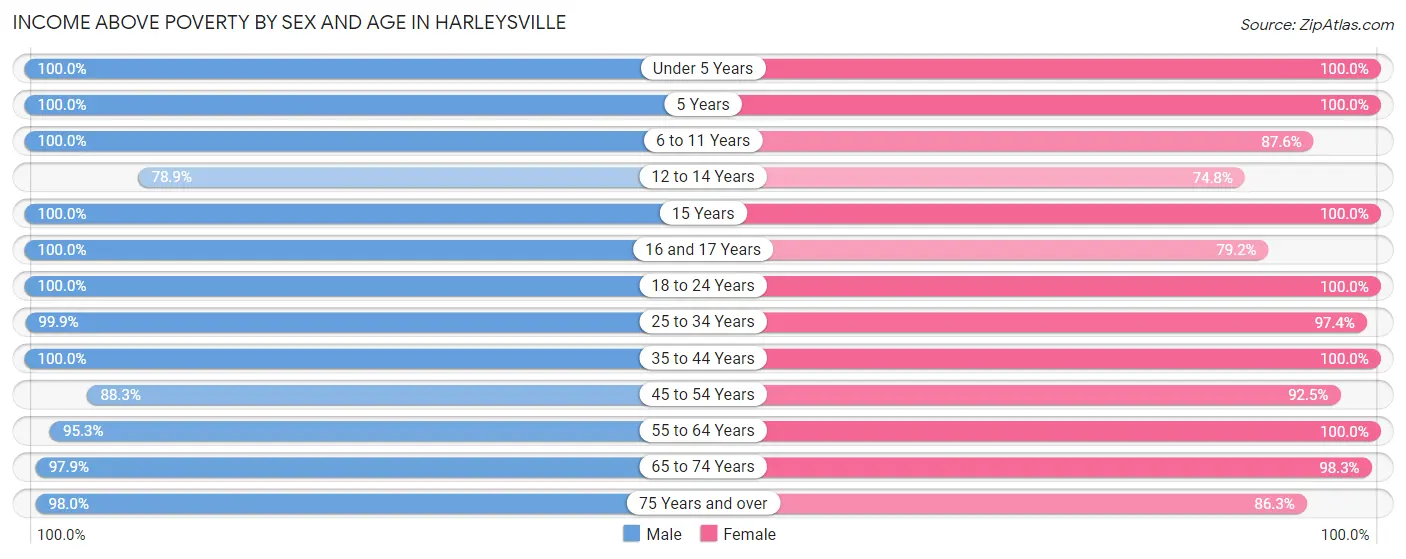
| Age Bracket | Male | Female |
| Under 5 Years | 233 (100.0%) | 138 (100.0%) |
| 5 Years | 63 (100.0%) | 33 (100.0%) |
| 6 to 11 Years | 183 (100.0%) | 134 (87.6%) |
| 12 to 14 Years | 123 (78.8%) | 98 (74.8%) |
| 15 Years | 24 (100.0%) | 34 (100.0%) |
| 16 and 17 Years | 129 (100.0%) | 118 (79.2%) |
| 18 to 24 Years | 301 (100.0%) | 290 (100.0%) |
| 25 to 34 Years | 661 (99.9%) | 377 (97.4%) |
| 35 to 44 Years | 515 (100.0%) | 396 (100.0%) |
| 45 to 54 Years | 484 (88.3%) | 654 (92.5%) |
| 55 to 64 Years | 724 (95.3%) | 789 (100.0%) |
| 65 to 74 Years | 473 (97.9%) | 521 (98.3%) |
| 75 Years and over | 527 (98.0%) | 478 (86.3%) |
| Total | 4,440 (96.6%) | 4,060 (94.6%) |
Income Below Poverty Among Married-Couple Families in Harleysville
The poverty statistics for married-couple families in Harleysville show that 2.2% or 48 of the total 2,173 families live below the poverty line. Families with 1 or 2 children have the highest poverty rate of 5.1%, comprising of 27 families. On the other hand, families with no children have the lowest poverty rate of 0.9%, which includes 13 families.
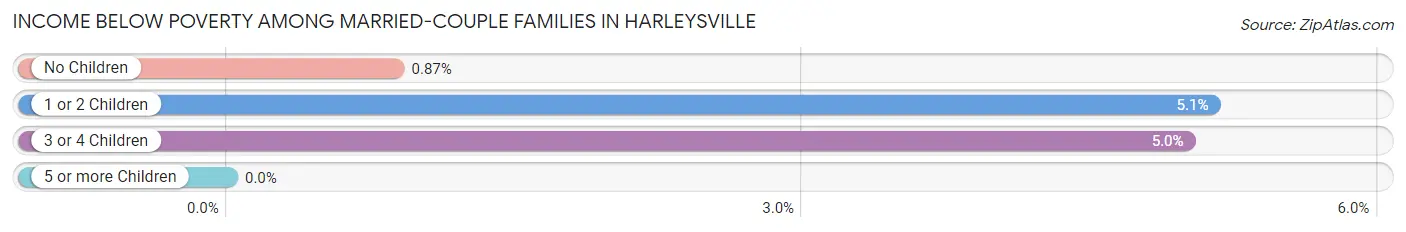
| Children | Above Poverty | Below Poverty |
| No Children | 1,474 (99.1%) | 13 (0.9%) |
| 1 or 2 Children | 499 (94.9%) | 27 (5.1%) |
| 3 or 4 Children | 152 (95.0%) | 8 (5.0%) |
| 5 or more Children | 0 (0.0%) | 0 (0.0%) |
| Total | 2,125 (97.8%) | 48 (2.2%) |
Income Below Poverty Among Single-Parent Households in Harleysville
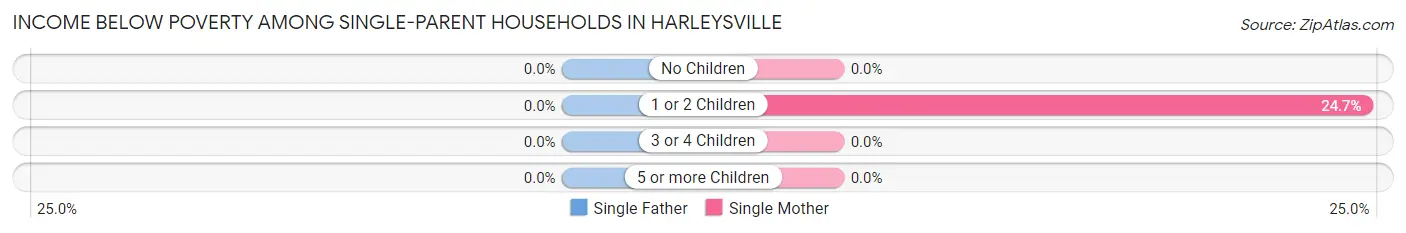
| Children | Single Father | Single Mother |
| No Children | 0 (0.0%) | 0 (0.0%) |
| 1 or 2 Children | 0 (0.0%) | 18 (24.7%) |
| 3 or 4 Children | 0 (0.0%) | 0 (0.0%) |
| 5 or more Children | 0 (0.0%) | 0 (0.0%) |
| Total | 0 (0.0%) | 18 (5.1%) |
Income Below Poverty Among Married-Couple vs Single-Parent Households in Harleysville
The poverty data for Harleysville shows that 48 of the married-couple family households (2.2%) and 18 of the single-parent households (4.6%) are living below the poverty level. Within the married-couple family households, those with 1 or 2 children have the highest poverty rate, with 27 households (5.1%) falling below the poverty line. Among the single-parent households, those with 1 or 2 children have the highest poverty rate, with 18 household (24.7%) living below poverty.
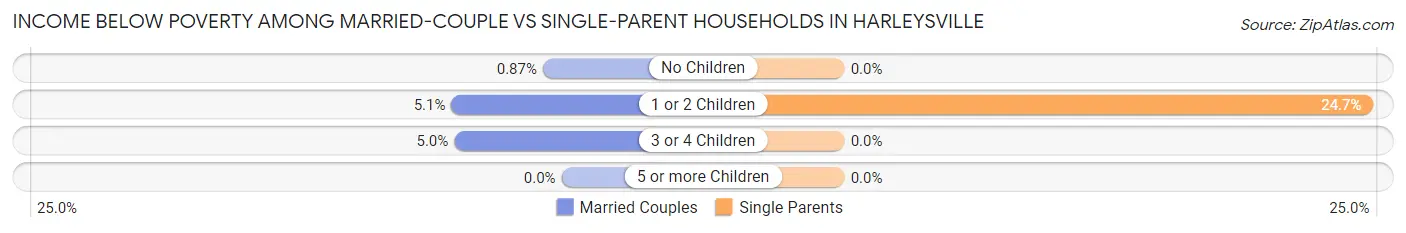
| Children | Married-Couple Families | Single-Parent Households |
| No Children | 13 (0.9%) | 0 (0.0%) |
| 1 or 2 Children | 27 (5.1%) | 18 (24.7%) |
| 3 or 4 Children | 8 (5.0%) | 0 (0.0%) |
| 5 or more Children | 0 (0.0%) | 0 (0.0%) |
| Total | 48 (2.2%) | 18 (4.6%) |
Race in Harleysville
The most populous races in Harleysville are White / Caucasian (7,824 | 87.0%), Hispanic or Latino (463 | 5.1%), and Black / African American (390 | 4.3%).
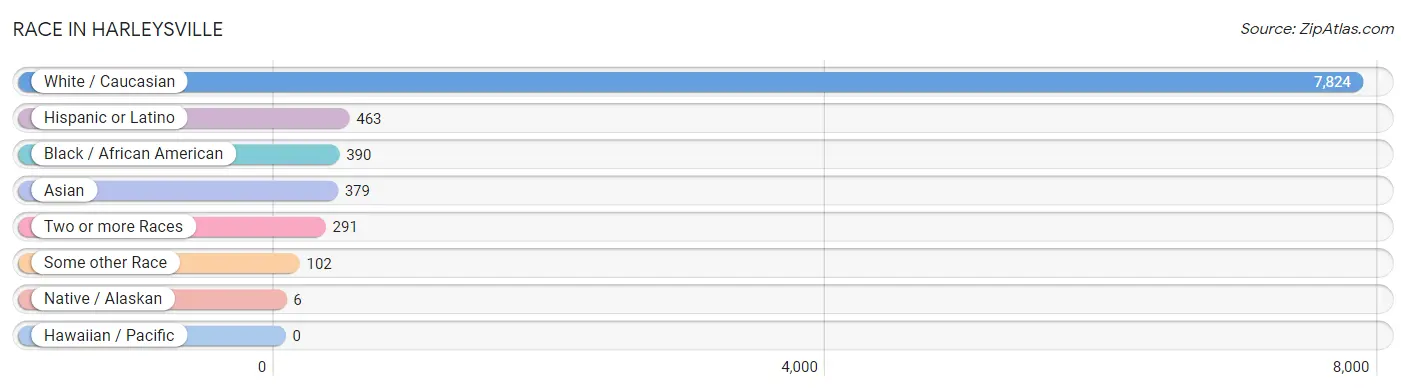
| Race | # Population | % Population |
| Asian | 379 | 4.2% |
| Black / African American | 390 | 4.3% |
| Hawaiian / Pacific | 0 | 0.0% |
| Hispanic or Latino | 463 | 5.1% |
| Native / Alaskan | 6 | 0.1% |
| White / Caucasian | 7,824 | 87.0% |
| Two or more Races | 291 | 3.2% |
| Some other Race | 102 | 1.1% |
| Total | 8,992 | 100.0% |
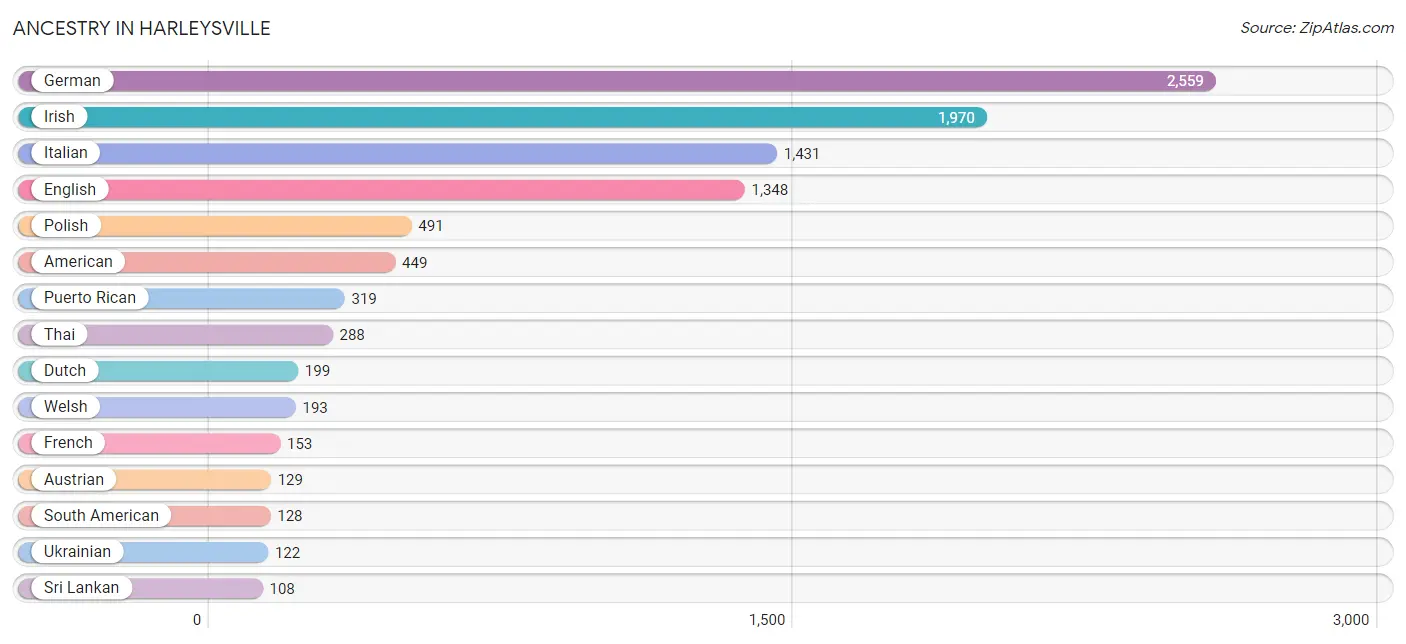
Ancestry in Harleysville
The most populous ancestries reported in Harleysville are German (2,559 | 28.5%), Irish (1,970 | 21.9%), Italian (1,431 | 15.9%), English (1,348 | 15.0%), and Polish (491 | 5.5%), together accounting for 86.7% of all Harleysville residents.
| Ancestry | # Population | % Population |
| American | 449 | 5.0% |
| Australian | 12 | 0.1% |
| Austrian | 129 | 1.4% |
| British | 41 | 0.5% |
| Canadian | 13 | 0.1% |
| Central American Indian | 6 | 0.1% |
| Colombian | 57 | 0.6% |
| Croatian | 10 | 0.1% |
| Cuban | 9 | 0.1% |
| Czech | 63 | 0.7% |
| Czechoslovakian | 10 | 0.1% |
| Danish | 20 | 0.2% |
| Dutch | 199 | 2.2% |
| Eastern European | 29 | 0.3% |
| English | 1,348 | 15.0% |
| European | 75 | 0.8% |
| Finnish | 10 | 0.1% |
| French | 153 | 1.7% |
| French Canadian | 30 | 0.3% |
| German | 2,559 | 28.5% |
| Hungarian | 72 | 0.8% |
| Indian (Asian) | 23 | 0.3% |
| Iranian | 19 | 0.2% |
| Irish | 1,970 | 21.9% |
| Italian | 1,431 | 15.9% |
| Jamaican | 40 | 0.4% |
| Korean | 40 | 0.4% |
| Latvian | 21 | 0.2% |
| Lithuanian | 27 | 0.3% |
| Norwegian | 18 | 0.2% |
| Pennsylvania German | 81 | 0.9% |
| Polish | 491 | 5.5% |
| Puerto Rican | 319 | 3.5% |
| Romanian | 8 | 0.1% |
| Russian | 35 | 0.4% |
| Scotch-Irish | 23 | 0.3% |
| Scottish | 99 | 1.1% |
| Slovak | 65 | 0.7% |
| South American | 128 | 1.4% |
| Sri Lankan | 108 | 1.2% |
| Swedish | 35 | 0.4% |
| Swiss | 27 | 0.3% |
| Thai | 288 | 3.2% |
| Ukrainian | 122 | 1.4% |
| Venezuelan | 71 | 0.8% |
| Welsh | 193 | 2.1% |
| West Indian | 6 | 0.1% |
| Yugoslavian | 24 | 0.3% | View All 48 Rows |
Immigrants in Harleysville
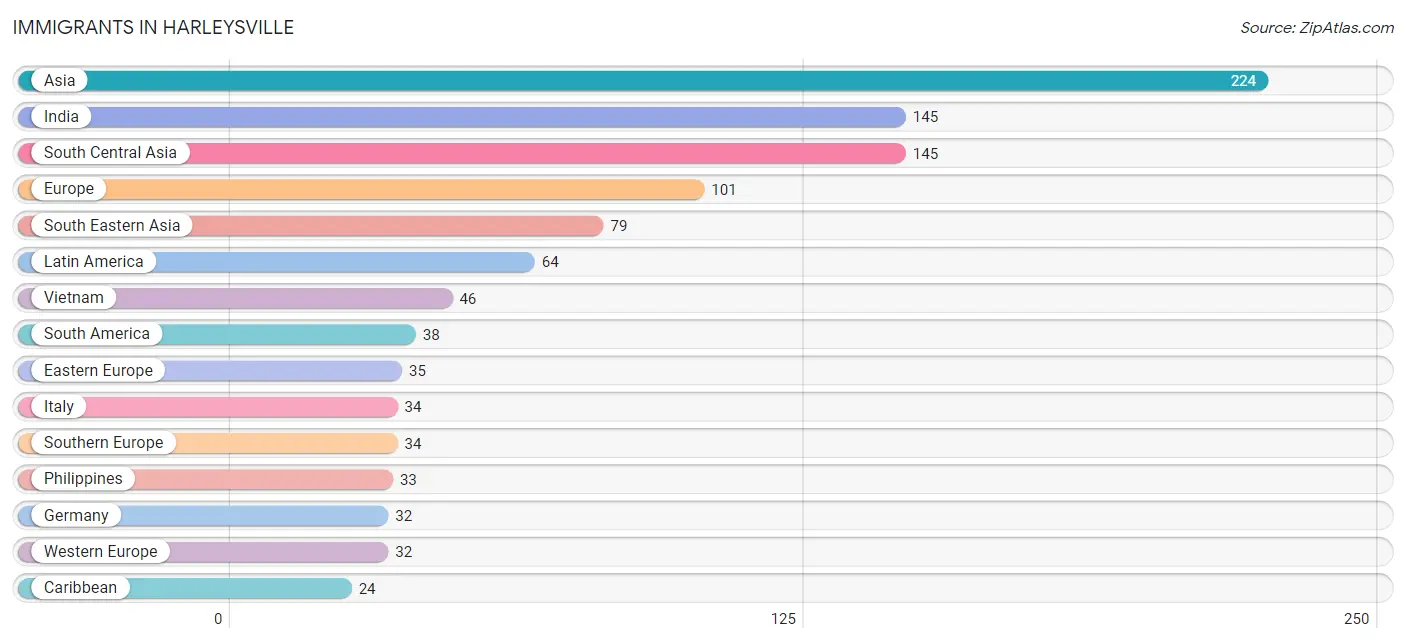
The most numerous immigrant groups reported in Harleysville came from Asia (224 | 2.5%), India (145 | 1.6%), South Central Asia (145 | 1.6%), Europe (101 | 1.1%), and South Eastern Asia (79 | 0.9%), together accounting for 7.7% of all Harleysville residents.
| Immigration Origin | # Population | % Population |
| Asia | 224 | 2.5% |
| Canada | 8 | 0.1% |
| Caribbean | 24 | 0.3% |
| Central America | 2 | 0.0% |
| Colombia | 24 | 0.3% |
| Cuba | 9 | 0.1% |
| Eastern Europe | 35 | 0.4% |
| Europe | 101 | 1.1% |
| Germany | 32 | 0.4% |
| Guatemala | 2 | 0.0% |
| India | 145 | 1.6% |
| Italy | 34 | 0.4% |
| Jamaica | 15 | 0.2% |
| Latin America | 64 | 0.7% |
| Lithuania | 16 | 0.2% |
| Philippines | 33 | 0.4% |
| Poland | 13 | 0.1% |
| Russia | 6 | 0.1% |
| South America | 38 | 0.4% |
| South Central Asia | 145 | 1.6% |
| South Eastern Asia | 79 | 0.9% |
| Southern Europe | 34 | 0.4% |
| Venezuela | 14 | 0.2% |
| Vietnam | 46 | 0.5% |
| Western Europe | 32 | 0.4% | View All 25 Rows |
Sex and Age in Harleysville
Sex and Age in Harleysville
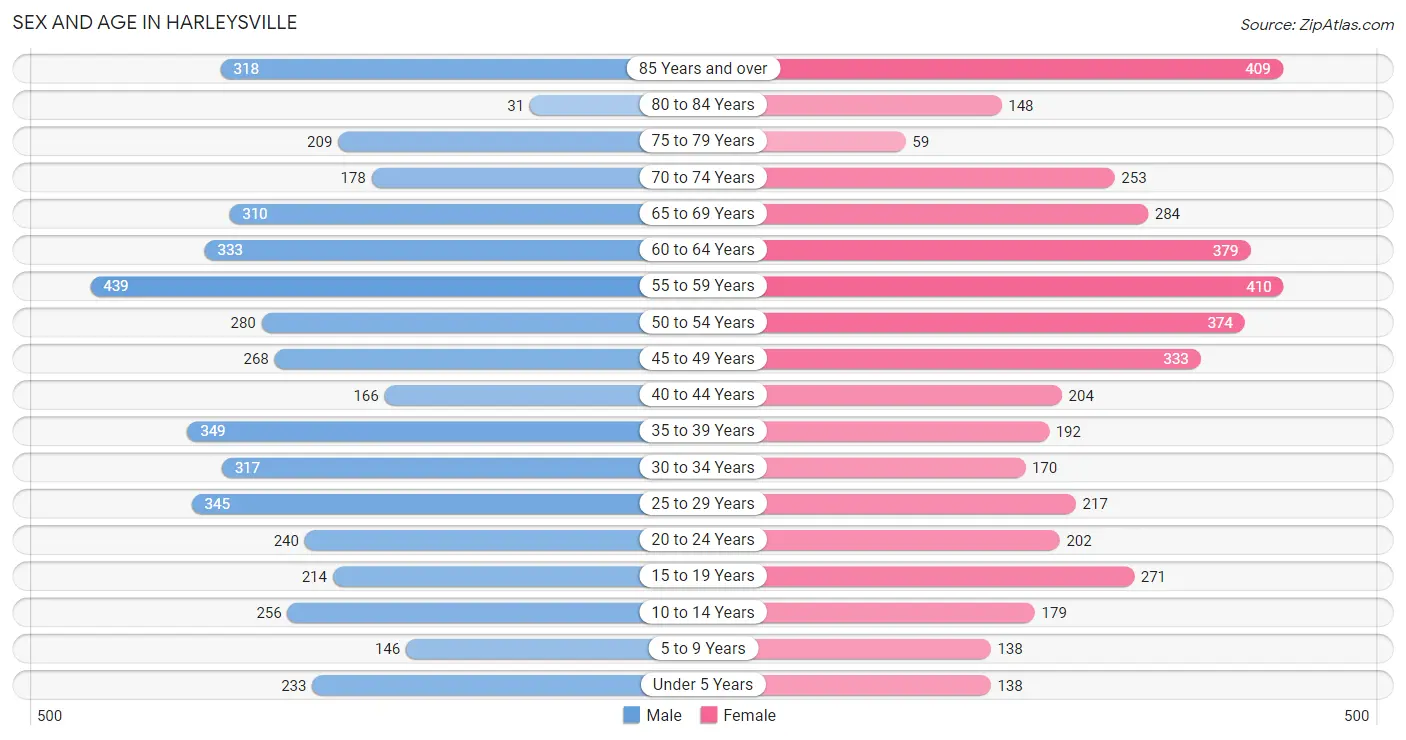
The most populous age groups in Harleysville are 55 to 59 Years (439 | 9.5%) for men and 55 to 59 Years (410 | 9.4%) for women.
| Age Bracket | Male | Female |
| Under 5 Years | 233 (5.0%) | 138 (3.2%) |
| 5 to 9 Years | 146 (3.2%) | 138 (3.2%) |
| 10 to 14 Years | 256 (5.5%) | 179 (4.1%) |
| 15 to 19 Years | 214 (4.6%) | 271 (6.2%) |
| 20 to 24 Years | 240 (5.2%) | 202 (4.6%) |
| 25 to 29 Years | 345 (7.4%) | 217 (5.0%) |
| 30 to 34 Years | 317 (6.8%) | 170 (3.9%) |
| 35 to 39 Years | 349 (7.5%) | 192 (4.4%) |
| 40 to 44 Years | 166 (3.6%) | 204 (4.7%) |
| 45 to 49 Years | 268 (5.8%) | 333 (7.6%) |
| 50 to 54 Years | 280 (6.0%) | 374 (8.6%) |
| 55 to 59 Years | 439 (9.5%) | 410 (9.4%) |
| 60 to 64 Years | 333 (7.2%) | 379 (8.7%) |
| 65 to 69 Years | 310 (6.7%) | 284 (6.5%) |
| 70 to 74 Years | 178 (3.8%) | 253 (5.8%) |
| 75 to 79 Years | 209 (4.5%) | 59 (1.3%) |
| 80 to 84 Years | 31 (0.7%) | 148 (3.4%) |
| 85 Years and over | 318 (6.9%) | 409 (9.4%) |
| Total | 4,632 (100.0%) | 4,360 (100.0%) |
Families and Households in Harleysville
Median Family Size in Harleysville
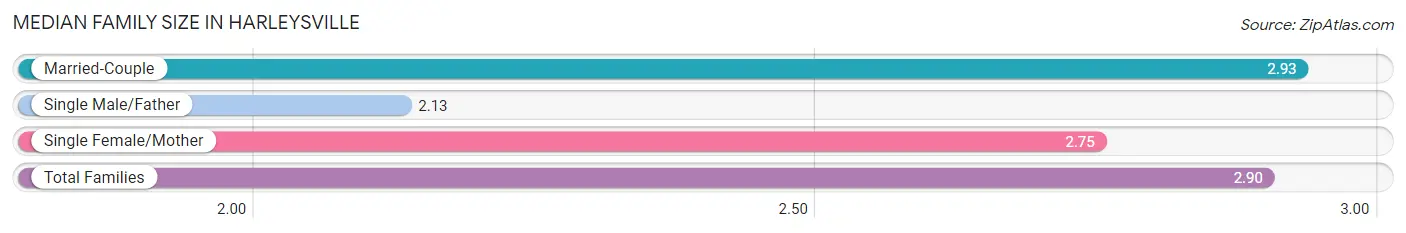
The median family size in Harleysville is 2.90 persons per family, with married-couple families (2,173 | 84.8%) accounting for the largest median family size of 2.93 persons per family. On the other hand, single male/father families (39 | 1.5%) represent the smallest median family size with 2.13 persons per family.
| Family Type | # Families | Family Size |
| Married-Couple | 2,173 (84.8%) | 2.93 |
| Single Male/Father | 39 (1.5%) | 2.13 |
| Single Female/Mother | 352 (13.7%) | 2.75 |
| Total Families | 2,564 (100.0%) | 2.90 |
Median Household Size in Harleysville
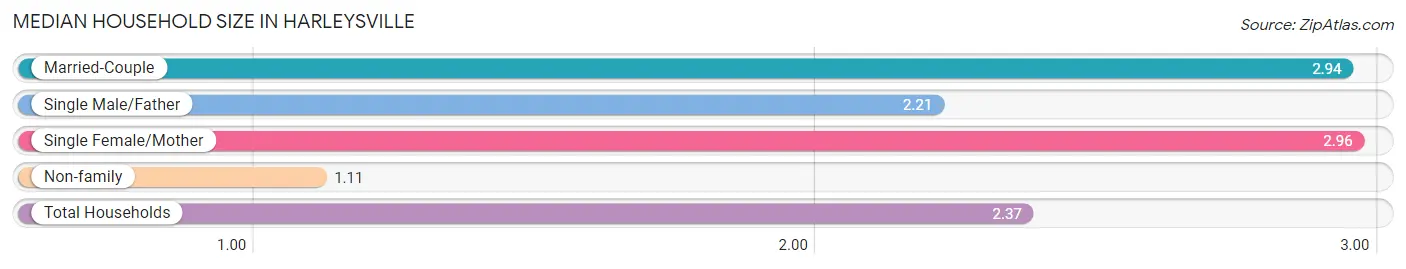
The median household size in Harleysville is 2.37 persons per household, with single female/mother households (352 | 9.5%) accounting for the largest median household size of 2.96 persons per household. non-family households (1,128 | 30.5%) represent the smallest median household size with 1.11 persons per household.
| Household Type | # Households | Household Size |
| Married-Couple | 2,173 (58.9%) | 2.94 |
| Single Male/Father | 39 (1.1%) | 2.21 |
| Single Female/Mother | 352 (9.5%) | 2.96 |
| Non-family | 1,128 (30.5%) | 1.11 |
| Total Households | 3,692 (100.0%) | 2.37 |
Household Size by Marriage Status in Harleysville
Out of a total of 3,692 households in Harleysville, 2,564 (69.5%) are family households, while 1,128 (30.5%) are nonfamily households. The most numerous type of family households are 2-person households, comprising 1,424, and the most common type of nonfamily households are 1-person households, comprising 999.
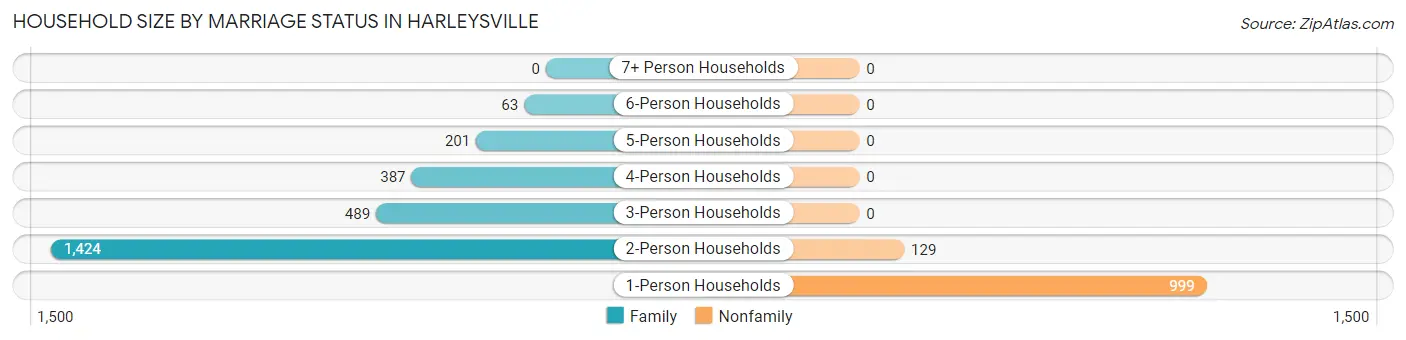
| Household Size | Family Households | Nonfamily Households |
| 1-Person Households | - | 999 (27.1%) |
| 2-Person Households | 1,424 (38.6%) | 129 (3.5%) |
| 3-Person Households | 489 (13.2%) | 0 (0.0%) |
| 4-Person Households | 387 (10.5%) | 0 (0.0%) |
| 5-Person Households | 201 (5.4%) | 0 (0.0%) |
| 6-Person Households | 63 (1.7%) | 0 (0.0%) |
| 7+ Person Households | 0 (0.0%) | 0 (0.0%) |
| Total | 2,564 (69.5%) | 1,128 (30.5%) |
Female Fertility in Harleysville
Fertility by Age in Harleysville
Average fertility rate in Harleysville is 57.0 births per 1,000 women. Women in the age bracket of 20 to 34 years have the highest fertility rate with 97.0 births per 1,000 women. Women in the age bracket of 20 to 34 years acount for 61.3% of all women with births.
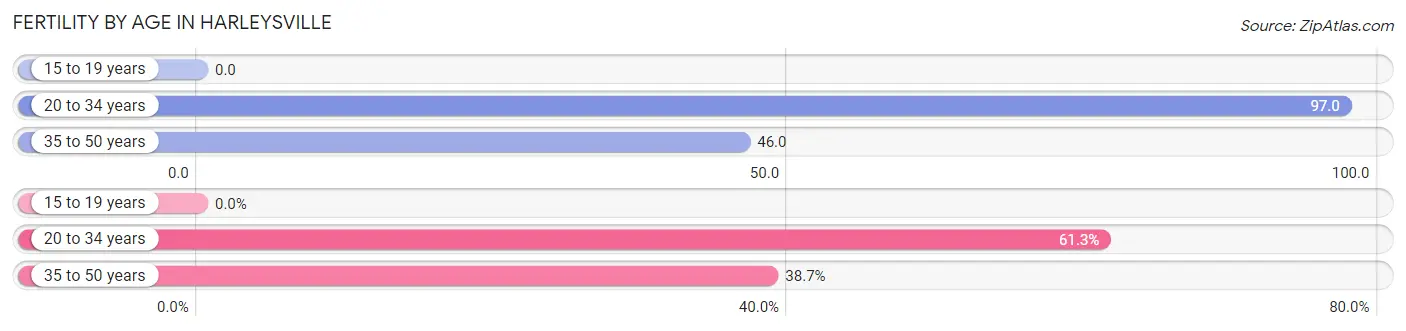
| Age Bracket | Women with Births | Births / 1,000 Women |
| 15 to 19 years | 0 (0.0%) | 0.0 |
| 20 to 34 years | 57 (61.3%) | 97.0 |
| 35 to 50 years | 36 (38.7%) | 46.0 |
| Total | 93 (100.0%) | 57.0 |
Fertility by Age by Marriage Status in Harleysville
89.2% of women with births (93) in Harleysville are married. The highest percentage of unmarried women with births falls into 35 to 50 years age bracket with 27.8% of them unmarried at the time of birth, while the lowest percentage of unmarried women with births belong to 20 to 34 years age bracket with 0.0% of them unmarried.
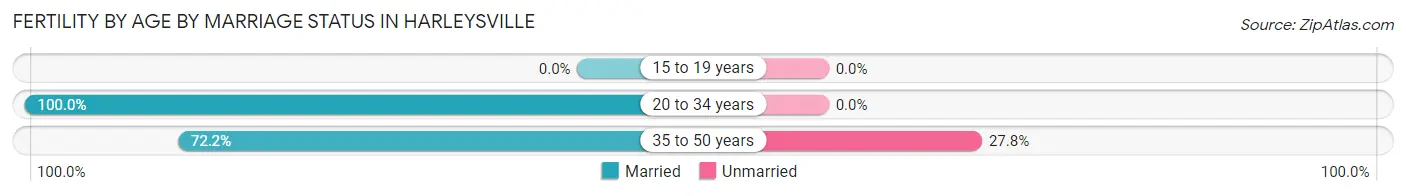
| Age Bracket | Married | Unmarried |
| 15 to 19 years | 0 (0.0%) | 0 (0.0%) |
| 20 to 34 years | 57 (100.0%) | 0 (0.0%) |
| 35 to 50 years | 26 (72.2%) | 10 (27.8%) |
| Total | 83 (89.2%) | 10 (10.7%) |
Fertility by Education in Harleysville
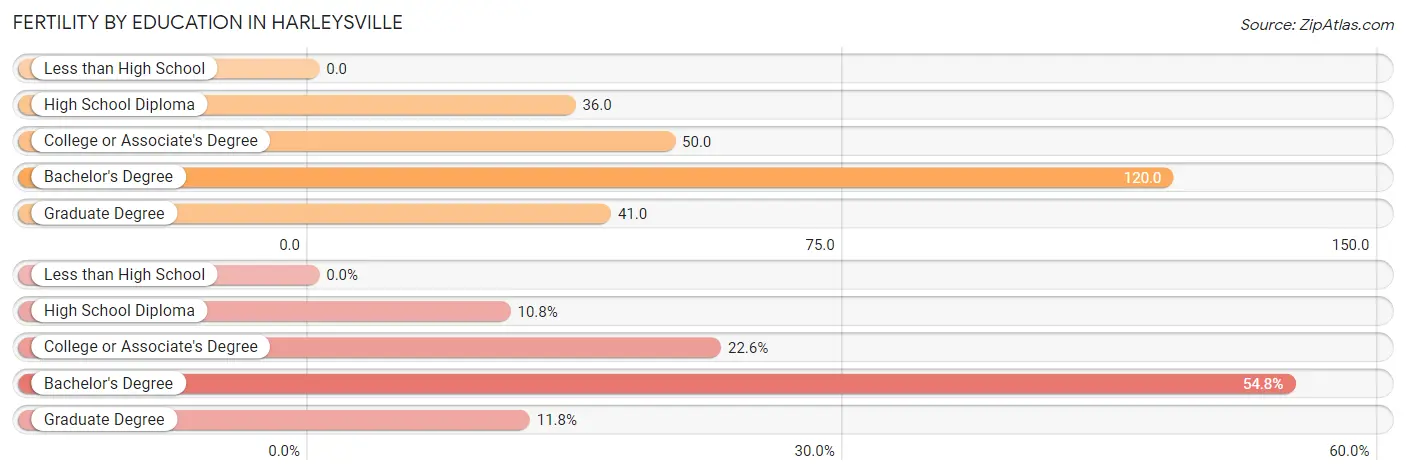
| Educational Attainment | Women with Births | Births / 1,000 Women |
| Less than High School | 0 (0.0%) | 0.0 |
| High School Diploma | 10 (10.7%) | 36.0 |
| College or Associate's Degree | 21 (22.6%) | 50.0 |
| Bachelor's Degree | 51 (54.8%) | 120.0 |
| Graduate Degree | 11 (11.8%) | 41.0 |
| Total | 93 (100.0%) | 57.0 |
Fertility by Education by Marriage Status in Harleysville
10.7% of women with births in Harleysville are unmarried. Women with the educational attainment of college or associate's degree are most likely to be married with 100.0% of them married at childbirth, while women with the educational attainment of high school diploma are least likely to be married with 100.0% of them unmarried at childbirth.
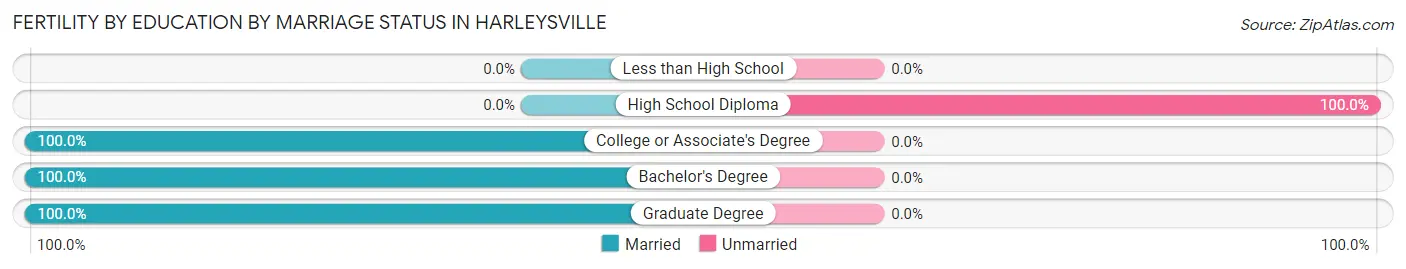
| Educational Attainment | Married | Unmarried |
| Less than High School | 0 (0.0%) | 0 (0.0%) |
| High School Diploma | 0 (0.0%) | 10 (100.0%) |
| College or Associate's Degree | 21 (100.0%) | 0 (0.0%) |
| Bachelor's Degree | 51 (100.0%) | 0 (0.0%) |
| Graduate Degree | 11 (100.0%) | 0 (0.0%) |
| Total | 83 (89.2%) | 10 (10.7%) |
Employment Characteristics in Harleysville
Employment by Class of Employer in Harleysville
Among the 4,907 employed individuals in Harleysville, private company employees (3,909 | 79.7%), not-for-profit organizations (431 | 8.8%), and local government employees (193 | 3.9%) make up the most common classes of employment.
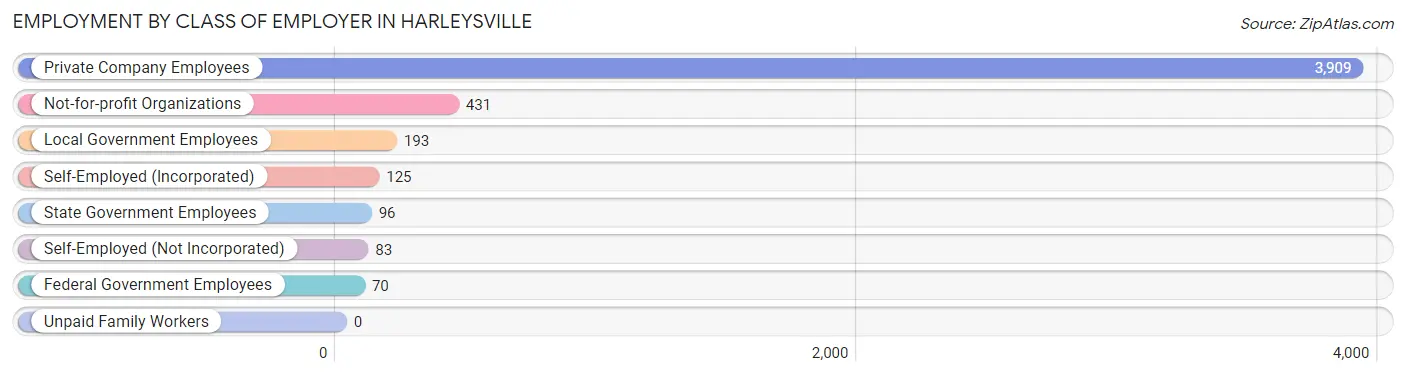
| Employer Class | # Employees | % Employees |
| Private Company Employees | 3,909 | 79.7% |
| Self-Employed (Incorporated) | 125 | 2.5% |
| Self-Employed (Not Incorporated) | 83 | 1.7% |
| Not-for-profit Organizations | 431 | 8.8% |
| Local Government Employees | 193 | 3.9% |
| State Government Employees | 96 | 2.0% |
| Federal Government Employees | 70 | 1.4% |
| Unpaid Family Workers | 0 | 0.0% |
| Total | 4,907 | 100.0% |
Employment Status by Age in Harleysville
According to the labor force statistics for Harleysville, out of the total population over 16 years of age (7,844), 66.3% or 5,201 individuals are in the labor force, with 2.7% or 140 of them unemployed. The age group with the highest labor force participation rate is 25 to 29 years, with 97.9% or 550 individuals in the labor force. Within the labor force, the 30 to 34 years age range has the highest percentage of unemployed individuals, with 9.0% or 39 of them being unemployed.
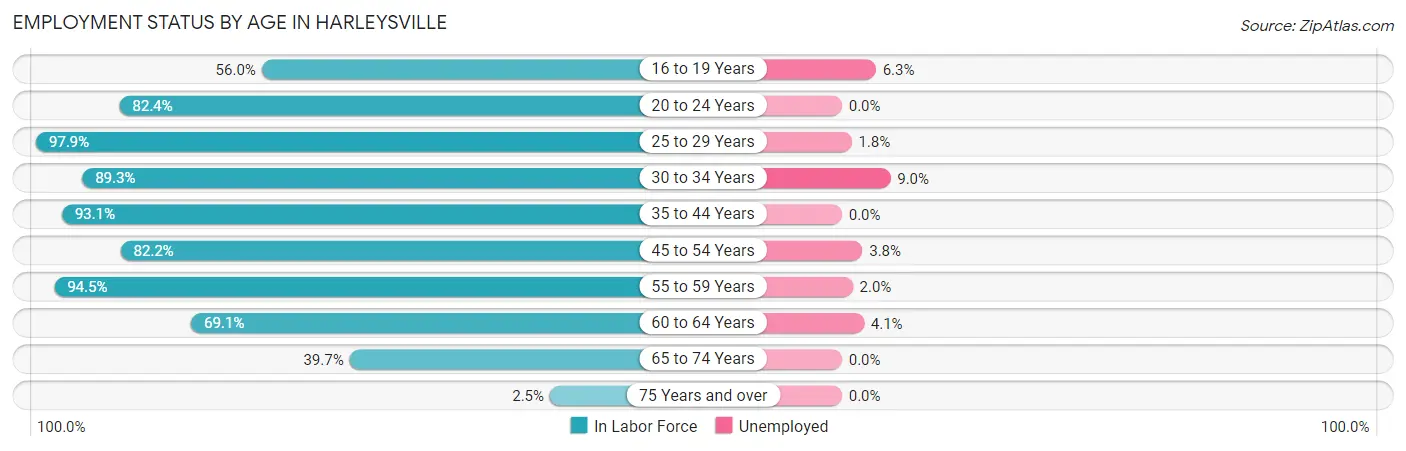
| Age Bracket | In Labor Force | Unemployed |
| 16 to 19 Years | 239 (56.0%) | 15 (6.3%) |
| 20 to 24 Years | 364 (82.4%) | 0 (0.0%) |
| 25 to 29 Years | 550 (97.9%) | 10 (1.8%) |
| 30 to 34 Years | 435 (89.3%) | 39 (9.0%) |
| 35 to 44 Years | 848 (93.1%) | 0 (0.0%) |
| 45 to 54 Years | 1,032 (82.2%) | 39 (3.8%) |
| 55 to 59 Years | 802 (94.5%) | 16 (2.0%) |
| 60 to 64 Years | 492 (69.1%) | 20 (4.1%) |
| 65 to 74 Years | 407 (39.7%) | 0 (0.0%) |
| 75 Years and over | 29 (2.5%) | 0 (0.0%) |
| Total | 5,201 (66.3%) | 140 (2.7%) |
Employment Status by Educational Attainment in Harleysville
According to labor force statistics for Harleysville, 87.1% of individuals (4,160) out of the total population between 25 and 64 years of age (4,776) are in the labor force, with 3.0% or 125 of them being unemployed. The group with the highest labor force participation rate are those with the educational attainment of bachelor's degree or higher, with 92.0% or 2,031 individuals in the labor force. Within the labor force, individuals with college / associate degree education have the highest percentage of unemployment, with 5.8% or 59 of them being unemployed.
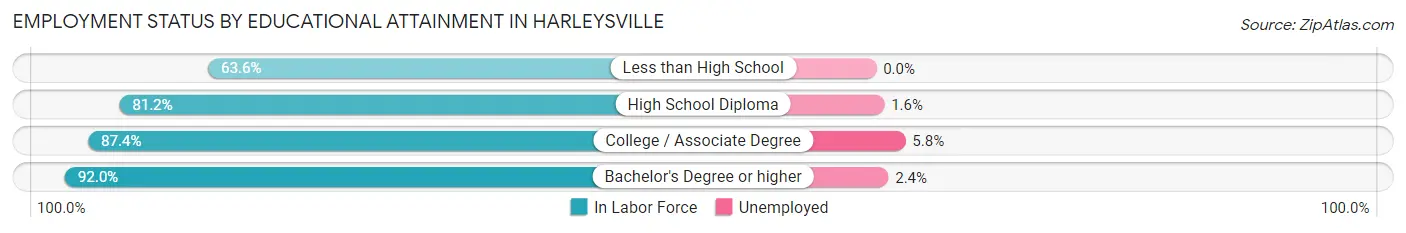
| Educational Attainment | In Labor Force | Unemployed |
| Less than High School | 110 (63.6%) | 0 (0.0%) |
| High School Diploma | 1,008 (81.2%) | 20 (1.6%) |
| College / Associate Degree | 1,009 (87.4%) | 67 (5.8%) |
| Bachelor's Degree or higher | 2,031 (92.0%) | 53 (2.4%) |
| Total | 4,160 (87.1%) | 143 (3.0%) |
Employment Occupations by Sex in Harleysville
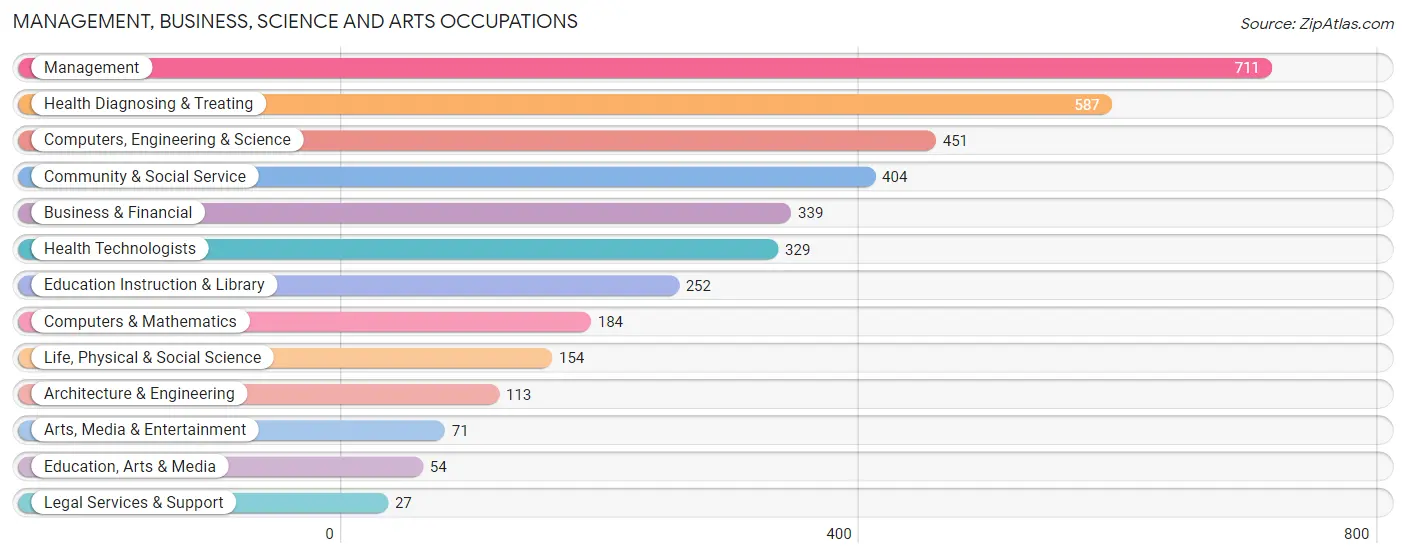
Management, Business, Science and Arts Occupations
The most common Management, Business, Science and Arts occupations in Harleysville are Management (711 | 14.1%), Health Diagnosing & Treating (587 | 11.6%), Computers, Engineering & Science (451 | 8.9%), Community & Social Service (404 | 8.0%), and Business & Financial (339 | 6.7%).
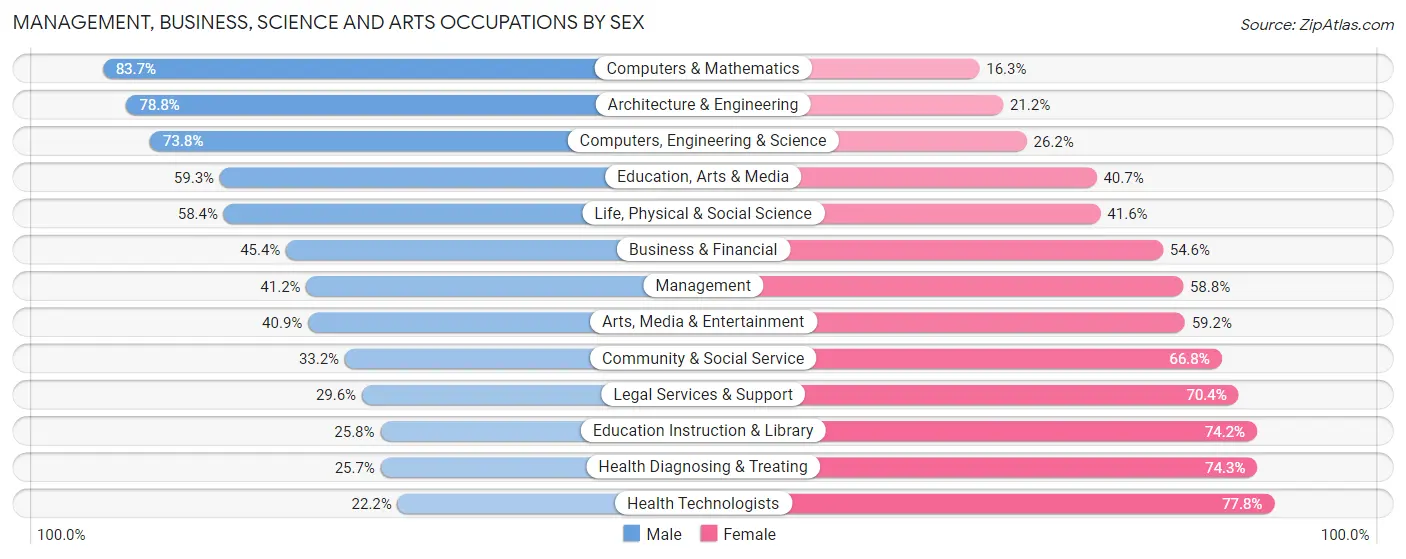
Management, Business, Science and Arts Occupations by Sex
Within the Management, Business, Science and Arts occupations in Harleysville, the most male-oriented occupations are Computers & Mathematics (83.7%), Architecture & Engineering (78.8%), and Computers, Engineering & Science (73.8%), while the most female-oriented occupations are Health Technologists (77.8%), Health Diagnosing & Treating (74.3%), and Education Instruction & Library (74.2%).
| Occupation | Male | Female |
| Management | 293 (41.2%) | 418 (58.8%) |
| Business & Financial | 154 (45.4%) | 185 (54.6%) |
| Computers, Engineering & Science | 333 (73.8%) | 118 (26.2%) |
| Computers & Mathematics | 154 (83.7%) | 30 (16.3%) |
| Architecture & Engineering | 89 (78.8%) | 24 (21.2%) |
| Life, Physical & Social Science | 90 (58.4%) | 64 (41.6%) |
| Community & Social Service | 134 (33.2%) | 270 (66.8%) |
| Education, Arts & Media | 32 (59.3%) | 22 (40.7%) |
| Legal Services & Support | 8 (29.6%) | 19 (70.4%) |
| Education Instruction & Library | 65 (25.8%) | 187 (74.2%) |
| Arts, Media & Entertainment | 29 (40.8%) | 42 (59.2%) |
| Health Diagnosing & Treating | 151 (25.7%) | 436 (74.3%) |
| Health Technologists | 73 (22.2%) | 256 (77.8%) |
| Total (Category) | 1,065 (42.7%) | 1,427 (57.3%) |
| Total (Overall) | 2,699 (53.3%) | 2,360 (46.7%) |
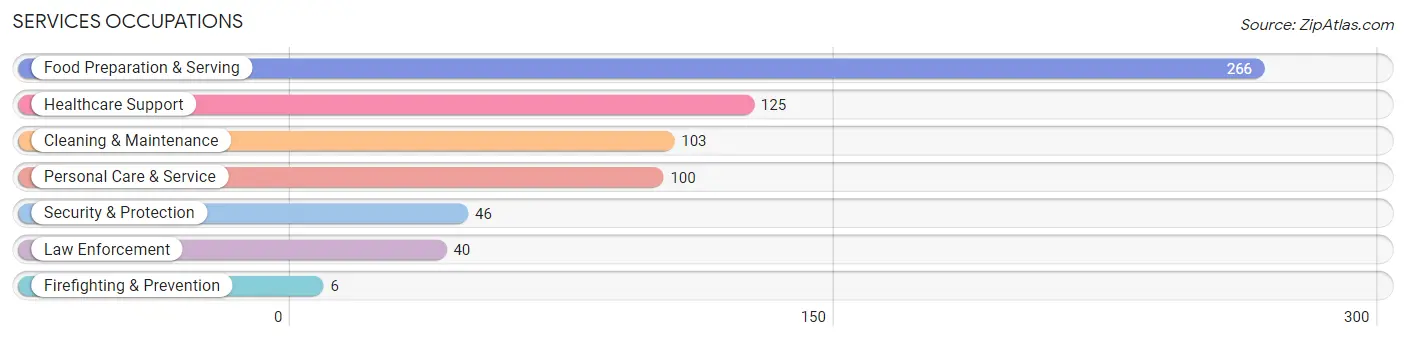
Services Occupations
The most common Services occupations in Harleysville are Food Preparation & Serving (266 | 5.3%), Healthcare Support (125 | 2.5%), Cleaning & Maintenance (103 | 2.0%), Personal Care & Service (100 | 2.0%), and Security & Protection (46 | 0.9%).
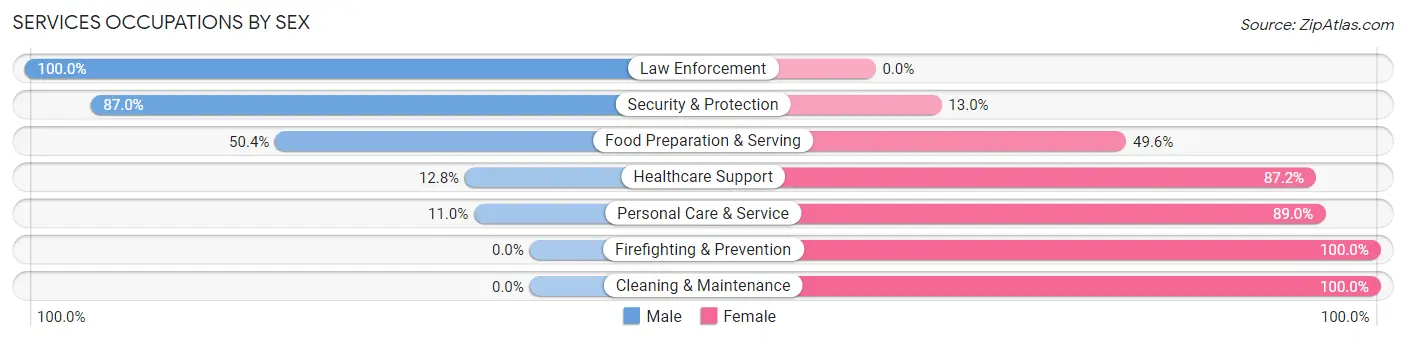
Services Occupations by Sex
Within the Services occupations in Harleysville, the most male-oriented occupations are Law Enforcement (100.0%), Security & Protection (87.0%), and Food Preparation & Serving (50.4%), while the most female-oriented occupations are Firefighting & Prevention (100.0%), Cleaning & Maintenance (100.0%), and Personal Care & Service (89.0%).
| Occupation | Male | Female |
| Healthcare Support | 16 (12.8%) | 109 (87.2%) |
| Security & Protection | 40 (87.0%) | 6 (13.0%) |
| Firefighting & Prevention | 0 (0.0%) | 6 (100.0%) |
| Law Enforcement | 40 (100.0%) | 0 (0.0%) |
| Food Preparation & Serving | 134 (50.4%) | 132 (49.6%) |
| Cleaning & Maintenance | 0 (0.0%) | 103 (100.0%) |
| Personal Care & Service | 11 (11.0%) | 89 (89.0%) |
| Total (Category) | 201 (31.4%) | 439 (68.6%) |
| Total (Overall) | 2,699 (53.3%) | 2,360 (46.7%) |
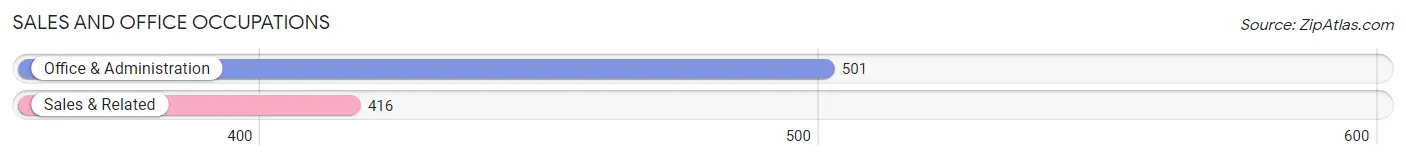
Sales and Office Occupations
The most common Sales and Office occupations in Harleysville are Office & Administration (501 | 9.9%), and Sales & Related (416 | 8.2%).
Sales and Office Occupations by Sex
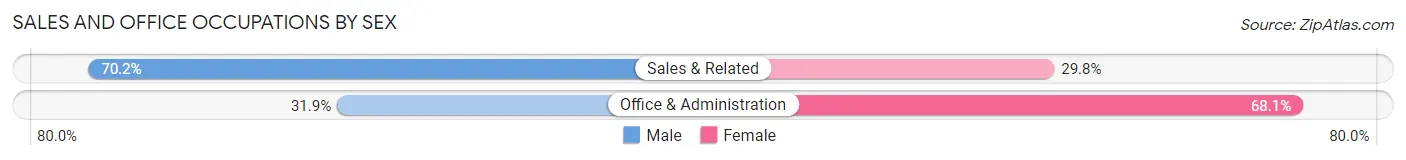
| Occupation | Male | Female |
| Sales & Related | 292 (70.2%) | 124 (29.8%) |
| Office & Administration | 160 (31.9%) | 341 (68.1%) |
| Total (Category) | 452 (49.3%) | 465 (50.7%) |
| Total (Overall) | 2,699 (53.3%) | 2,360 (46.7%) |
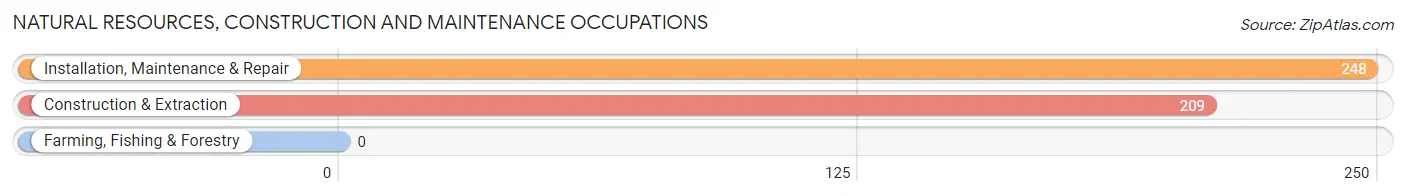
Natural Resources, Construction and Maintenance Occupations
The most common Natural Resources, Construction and Maintenance occupations in Harleysville are Installation, Maintenance & Repair (248 | 4.9%), and Construction & Extraction (209 | 4.1%).
Natural Resources, Construction and Maintenance Occupations by Sex
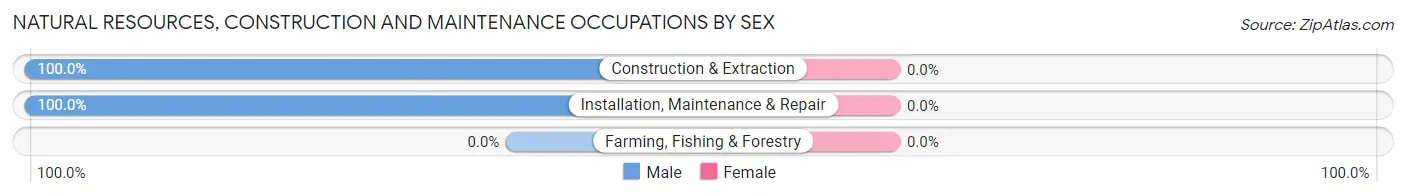
| Occupation | Male | Female |
| Farming, Fishing & Forestry | 0 (0.0%) | 0 (0.0%) |
| Construction & Extraction | 209 (100.0%) | 0 (0.0%) |
| Installation, Maintenance & Repair | 248 (100.0%) | 0 (0.0%) |
| Total (Category) | 457 (100.0%) | 0 (0.0%) |
| Total (Overall) | 2,699 (53.3%) | 2,360 (46.7%) |
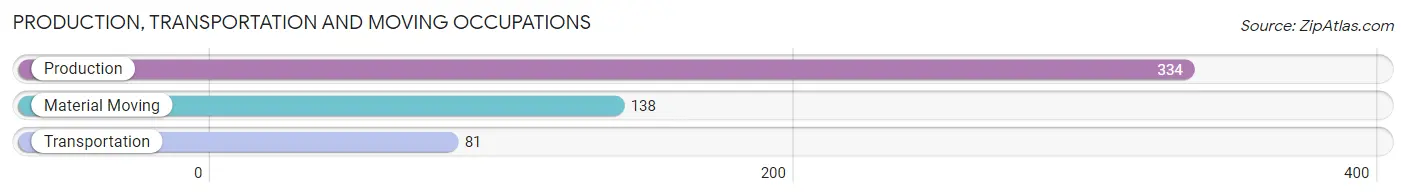
Production, Transportation and Moving Occupations
The most common Production, Transportation and Moving occupations in Harleysville are Production (334 | 6.6%), Material Moving (138 | 2.7%), and Transportation (81 | 1.6%).
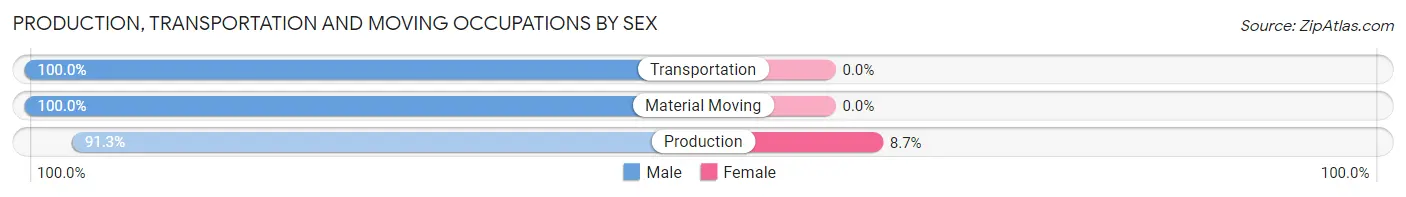
Production, Transportation and Moving Occupations by Sex
| Occupation | Male | Female |
| Production | 305 (91.3%) | 29 (8.7%) |
| Transportation | 81 (100.0%) | 0 (0.0%) |
| Material Moving | 138 (100.0%) | 0 (0.0%) |
| Total (Category) | 524 (94.8%) | 29 (5.2%) |
| Total (Overall) | 2,699 (53.3%) | 2,360 (46.7%) |
Employment Industries by Sex in Harleysville
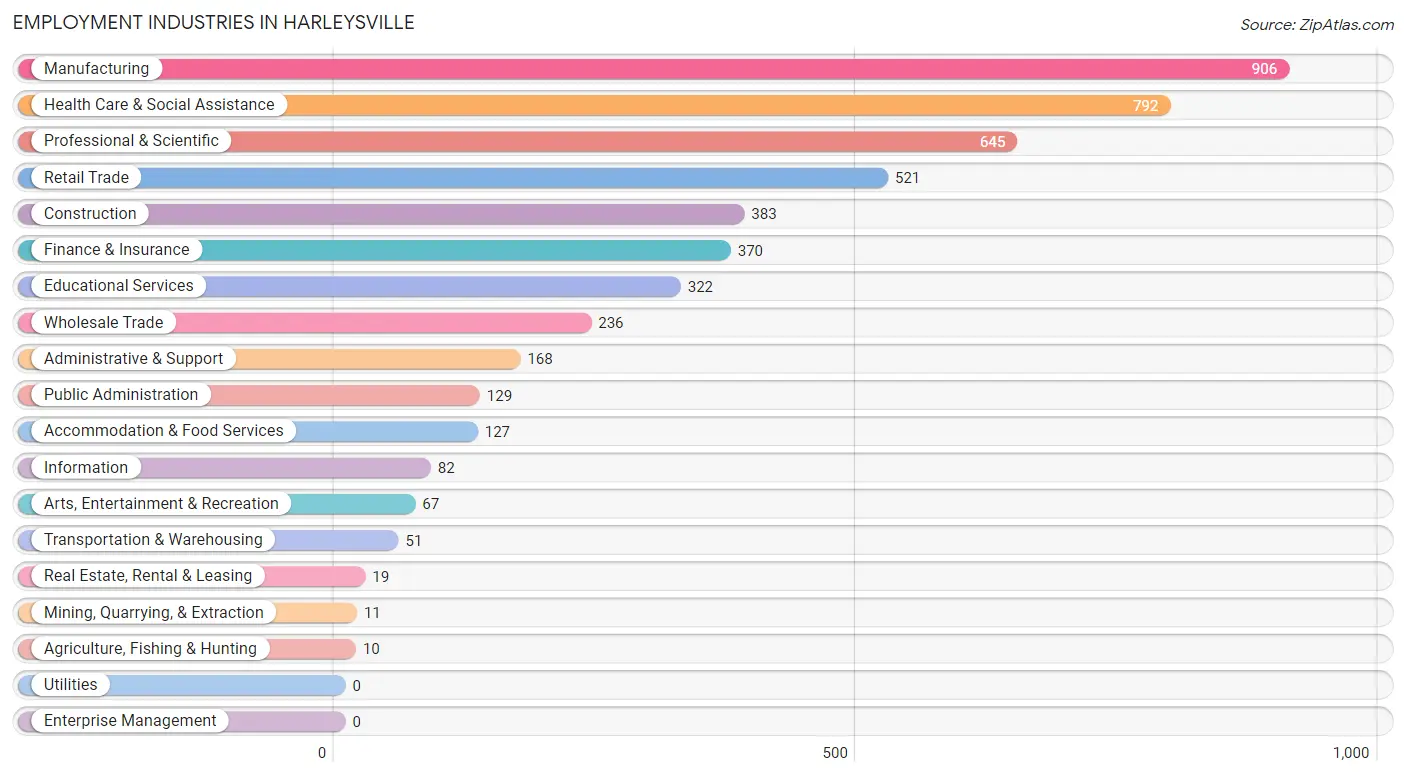
Employment Industries in Harleysville
The major employment industries in Harleysville include Manufacturing (906 | 17.9%), Health Care & Social Assistance (792 | 15.7%), Professional & Scientific (645 | 12.8%), Retail Trade (521 | 10.3%), and Construction (383 | 7.6%).
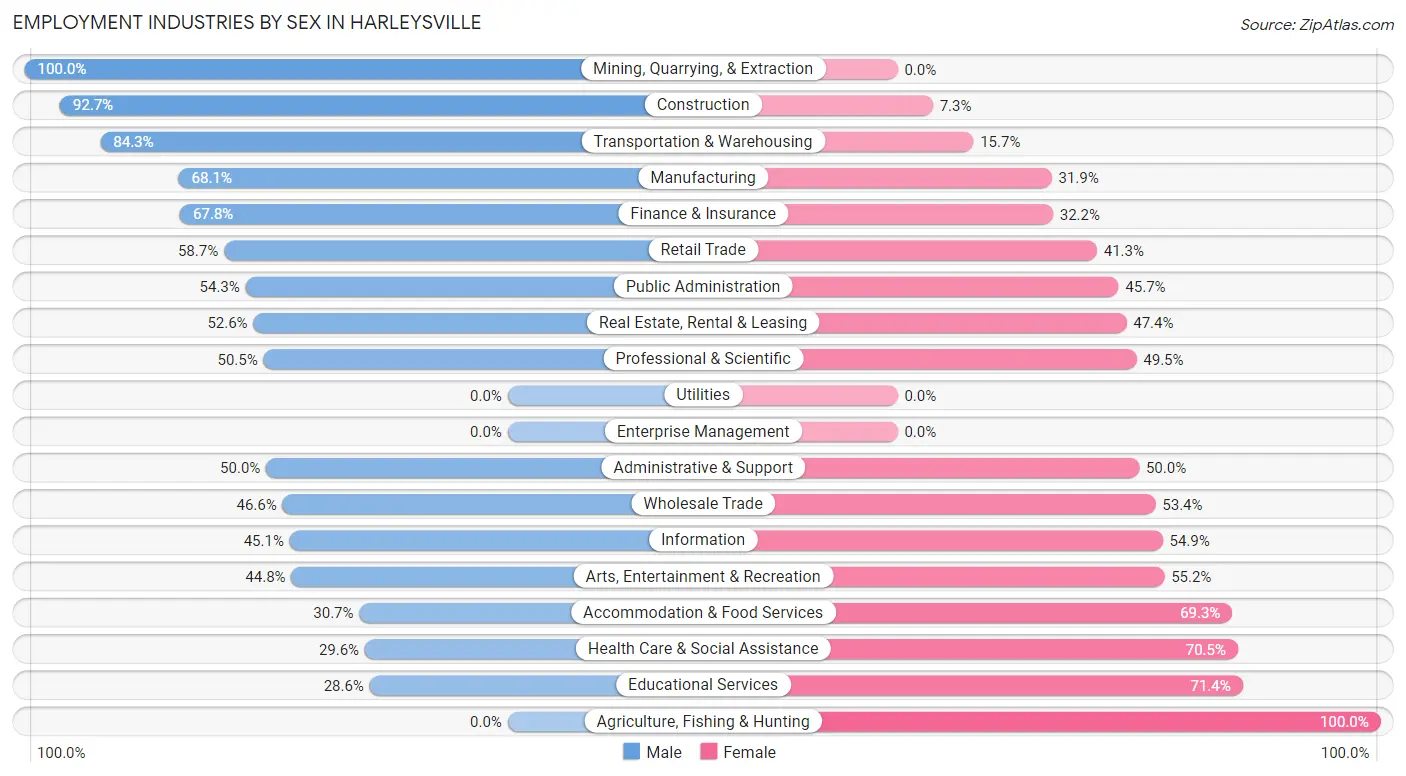
Employment Industries by Sex in Harleysville
The Harleysville industries that see more men than women are Mining, Quarrying, & Extraction (100.0%), Construction (92.7%), and Transportation & Warehousing (84.3%), whereas the industries that tend to have a higher number of women are Agriculture, Fishing & Hunting (100.0%), Educational Services (71.4%), and Health Care & Social Assistance (70.5%).
| Industry | Male | Female |
| Agriculture, Fishing & Hunting | 0 (0.0%) | 10 (100.0%) |
| Mining, Quarrying, & Extraction | 11 (100.0%) | 0 (0.0%) |
| Construction | 355 (92.7%) | 28 (7.3%) |
| Manufacturing | 617 (68.1%) | 289 (31.9%) |
| Wholesale Trade | 110 (46.6%) | 126 (53.4%) |
| Retail Trade | 306 (58.7%) | 215 (41.3%) |
| Transportation & Warehousing | 43 (84.3%) | 8 (15.7%) |
| Utilities | 0 (0.0%) | 0 (0.0%) |
| Information | 37 (45.1%) | 45 (54.9%) |
| Finance & Insurance | 251 (67.8%) | 119 (32.2%) |
| Real Estate, Rental & Leasing | 10 (52.6%) | 9 (47.4%) |
| Professional & Scientific | 326 (50.5%) | 319 (49.5%) |
| Enterprise Management | 0 (0.0%) | 0 (0.0%) |
| Administrative & Support | 84 (50.0%) | 84 (50.0%) |
| Educational Services | 92 (28.6%) | 230 (71.4%) |
| Health Care & Social Assistance | 234 (29.5%) | 558 (70.5%) |
| Arts, Entertainment & Recreation | 30 (44.8%) | 37 (55.2%) |
| Accommodation & Food Services | 39 (30.7%) | 88 (69.3%) |
| Public Administration | 70 (54.3%) | 59 (45.7%) |
| Total | 2,699 (53.3%) | 2,360 (46.7%) |
Education in Harleysville
School Enrollment in Harleysville
The most common levels of schooling among the 1,450 students in Harleysville are high school (454 | 31.3%), middle school (371 | 25.6%), and college / undergraduate (197 | 13.6%).
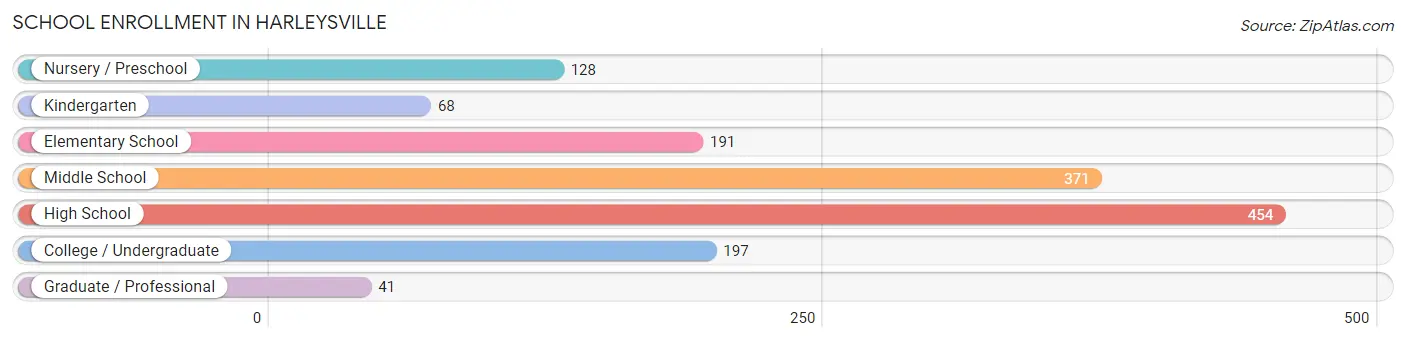
| School Level | # Students | % Students |
| Nursery / Preschool | 128 | 8.8% |
| Kindergarten | 68 | 4.7% |
| Elementary School | 191 | 13.2% |
| Middle School | 371 | 25.6% |
| High School | 454 | 31.3% |
| College / Undergraduate | 197 | 13.6% |
| Graduate / Professional | 41 | 2.8% |
| Total | 1,450 | 100.0% |
School Enrollment by Age by Funding Source in Harleysville
Out of a total of 1,450 students who are enrolled in schools in Harleysville, 218 (15.0%) attend a private institution, while the remaining 1,232 (85.0%) are enrolled in public schools. The age group of 3 to 4 year olds has the highest likelihood of being enrolled in private schools, with 80 (88.9% in the age bracket) enrolled. Conversely, the age group of 15 to 17 year olds has the lowest likelihood of being enrolled in a private school, with 336 (100.0% in the age bracket) attending a public institution.
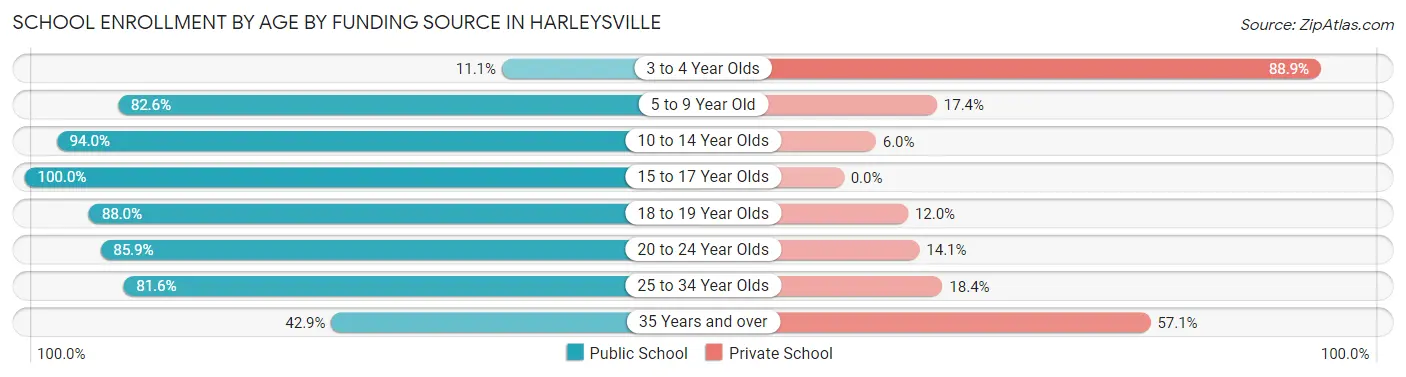
| Age Bracket | Public School | Private School |
| 3 to 4 Year Olds | 10 (11.1%) | 80 (88.9%) |
| 5 to 9 Year Old | 219 (82.6%) | 46 (17.4%) |
| 10 to 14 Year Olds | 409 (94.0%) | 26 (6.0%) |
| 15 to 17 Year Olds | 336 (100.0%) | 0 (0.0%) |
| 18 to 19 Year Olds | 103 (88.0%) | 14 (12.0%) |
| 20 to 24 Year Olds | 67 (85.9%) | 11 (14.1%) |
| 25 to 34 Year Olds | 71 (81.6%) | 16 (18.4%) |
| 35 Years and over | 18 (42.9%) | 24 (57.1%) |
| Total | 1,232 (85.0%) | 218 (15.0%) |
Educational Attainment by Field of Study in Harleysville
Business (965 | 32.7%), education (337 | 11.4%), engineering (259 | 8.8%), science & technology (247 | 8.4%), and bio, nature & agricultural (209 | 7.1%) are the most common fields of study among 2,948 individuals in Harleysville who have obtained a bachelor's degree or higher.
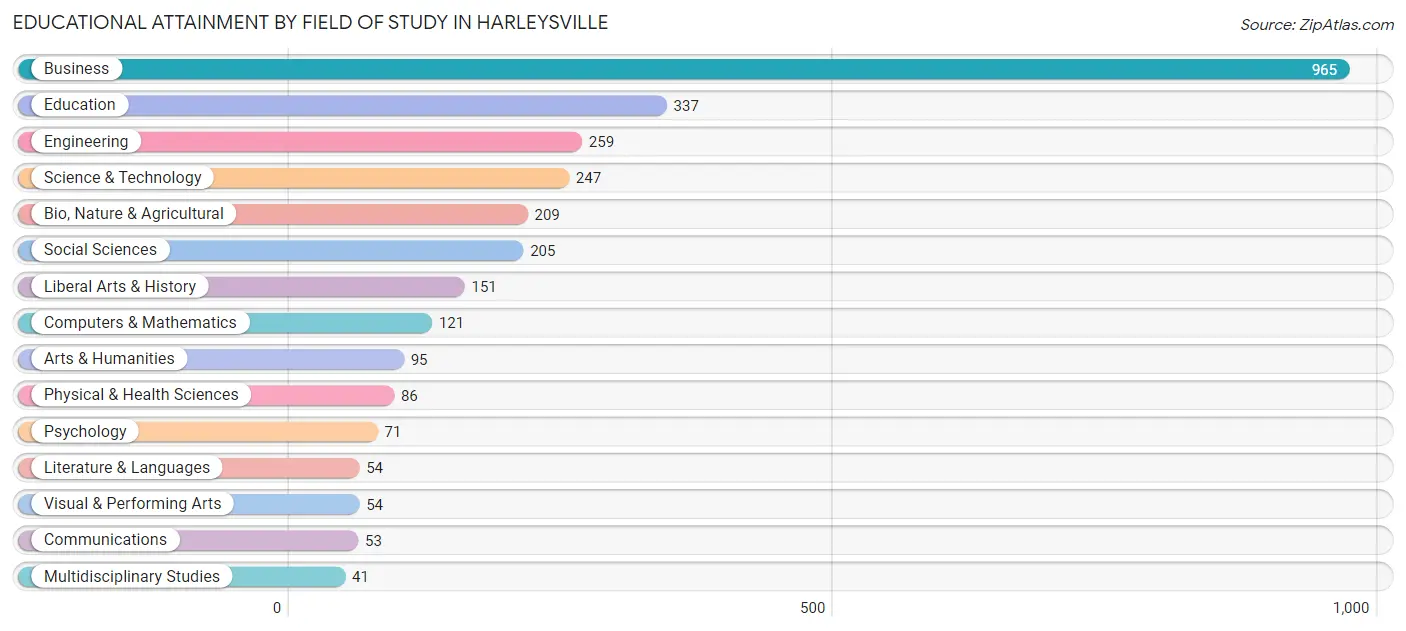
| Field of Study | # Graduates | % Graduates |
| Computers & Mathematics | 121 | 4.1% |
| Bio, Nature & Agricultural | 209 | 7.1% |
| Physical & Health Sciences | 86 | 2.9% |
| Psychology | 71 | 2.4% |
| Social Sciences | 205 | 7.0% |
| Engineering | 259 | 8.8% |
| Multidisciplinary Studies | 41 | 1.4% |
| Science & Technology | 247 | 8.4% |
| Business | 965 | 32.7% |
| Education | 337 | 11.4% |
| Literature & Languages | 54 | 1.8% |
| Liberal Arts & History | 151 | 5.1% |
| Visual & Performing Arts | 54 | 1.8% |
| Communications | 53 | 1.8% |
| Arts & Humanities | 95 | 3.2% |
| Total | 2,948 | 100.0% |
Transportation & Commute in Harleysville
Vehicle Availability by Sex in Harleysville
The most prevalent vehicle ownership categories in Harleysville are males with 2 vehicles (1,090, accounting for 42.0%) and females with 2 vehicles (993, making up 47.6%).
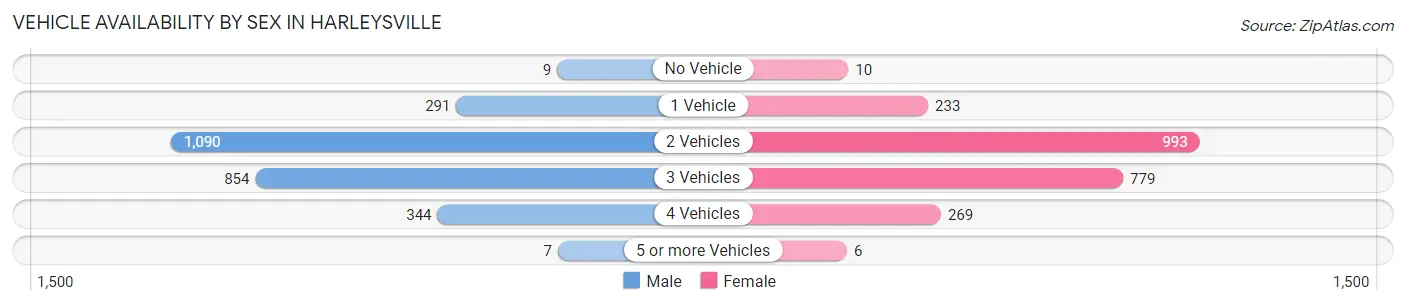
| Vehicles Available | Male | Female |
| No Vehicle | 9 (0.4%) | 10 (0.4%) |
| 1 Vehicle | 291 (11.2%) | 233 (10.2%) |
| 2 Vehicles | 1,090 (42.0%) | 993 (43.4%) |
| 3 Vehicles | 854 (32.9%) | 779 (34.0%) |
| 4 Vehicles | 344 (13.3%) | 269 (11.7%) |
| 5 or more Vehicles | 7 (0.3%) | 6 (0.3%) |
| Total | 2,595 (100.0%) | 2,290 (100.0%) |
Commute Time in Harleysville
The most frequently occuring commute durations in Harleysville are 45 to 59 minutes (550 commuters, 13.4%), 10 to 14 minutes (547 commuters, 13.3%), and 30 to 34 minutes (522 commuters, 12.7%).
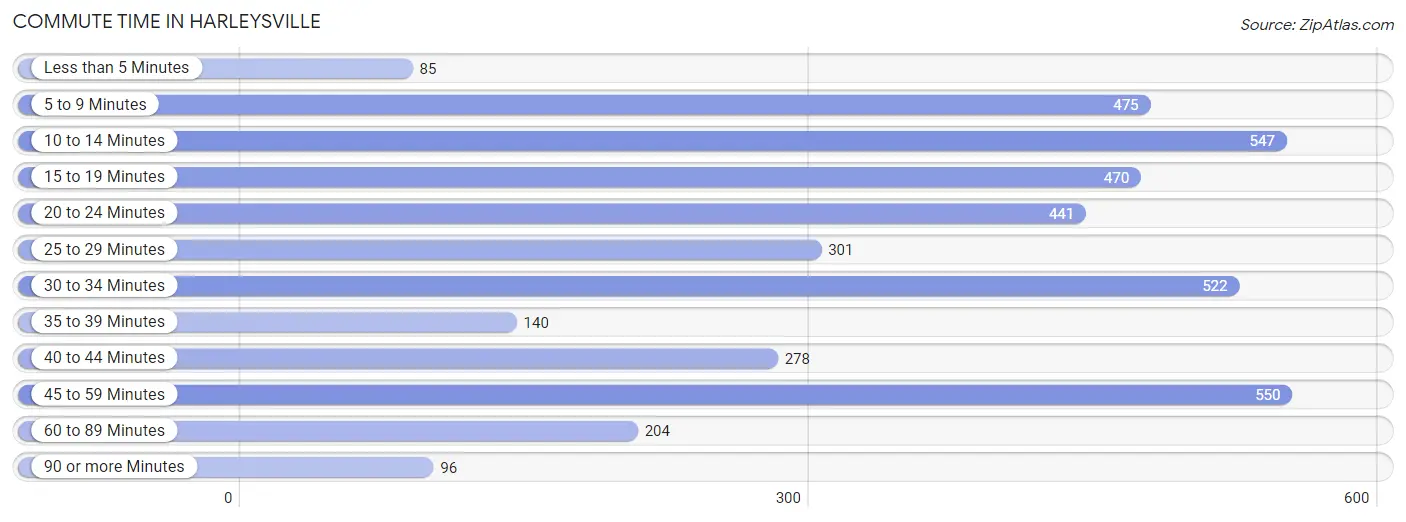
| Commute Time | # Commuters | % Commuters |
| Less than 5 Minutes | 85 | 2.1% |
| 5 to 9 Minutes | 475 | 11.6% |
| 10 to 14 Minutes | 547 | 13.3% |
| 15 to 19 Minutes | 470 | 11.4% |
| 20 to 24 Minutes | 441 | 10.7% |
| 25 to 29 Minutes | 301 | 7.3% |
| 30 to 34 Minutes | 522 | 12.7% |
| 35 to 39 Minutes | 140 | 3.4% |
| 40 to 44 Minutes | 278 | 6.8% |
| 45 to 59 Minutes | 550 | 13.4% |
| 60 to 89 Minutes | 204 | 5.0% |
| 90 or more Minutes | 96 | 2.3% |
Commute Time by Sex in Harleysville
The most common commute times in Harleysville are 45 to 59 minutes (296 commuters, 13.1%) for males and 10 to 14 minutes (262 commuters, 14.1%) for females.
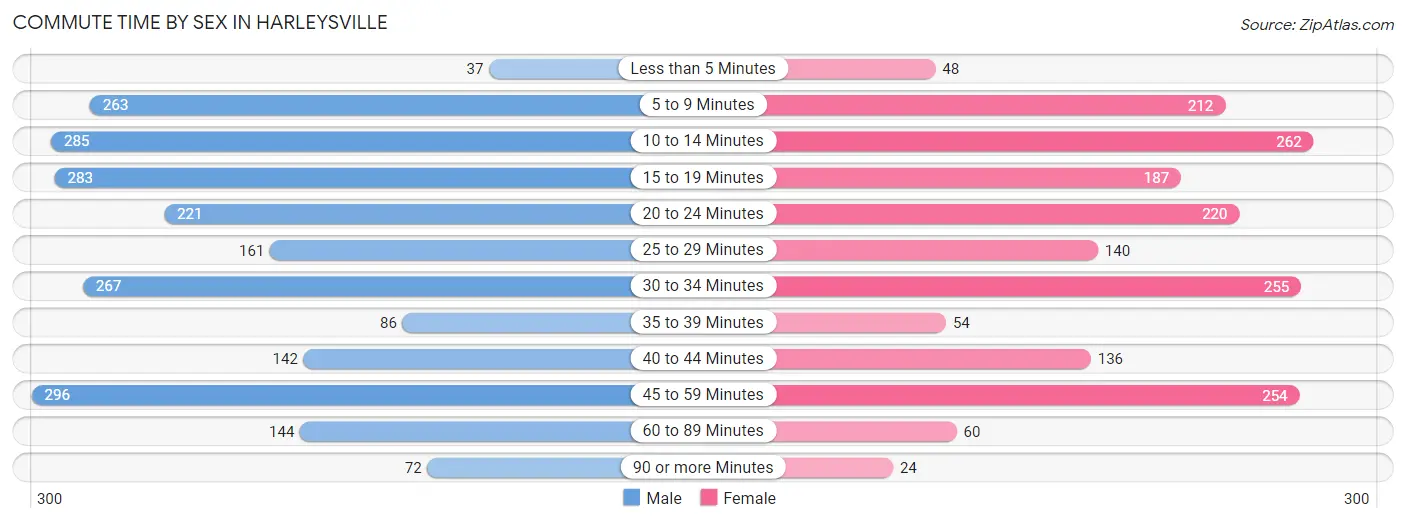
| Commute Time | Male | Female |
| Less than 5 Minutes | 37 (1.6%) | 48 (2.6%) |
| 5 to 9 Minutes | 263 (11.7%) | 212 (11.5%) |
| 10 to 14 Minutes | 285 (12.6%) | 262 (14.1%) |
| 15 to 19 Minutes | 283 (12.5%) | 187 (10.1%) |
| 20 to 24 Minutes | 221 (9.8%) | 220 (11.9%) |
| 25 to 29 Minutes | 161 (7.1%) | 140 (7.6%) |
| 30 to 34 Minutes | 267 (11.8%) | 255 (13.8%) |
| 35 to 39 Minutes | 86 (3.8%) | 54 (2.9%) |
| 40 to 44 Minutes | 142 (6.3%) | 136 (7.3%) |
| 45 to 59 Minutes | 296 (13.1%) | 254 (13.7%) |
| 60 to 89 Minutes | 144 (6.4%) | 60 (3.2%) |
| 90 or more Minutes | 72 (3.2%) | 24 (1.3%) |
Time of Departure to Work by Sex in Harleysville
The most frequent times of departure to work in Harleysville are 7:30 AM to 7:59 AM (323, 14.3%) for males and 7:00 AM to 7:29 AM (491, 26.5%) for females.
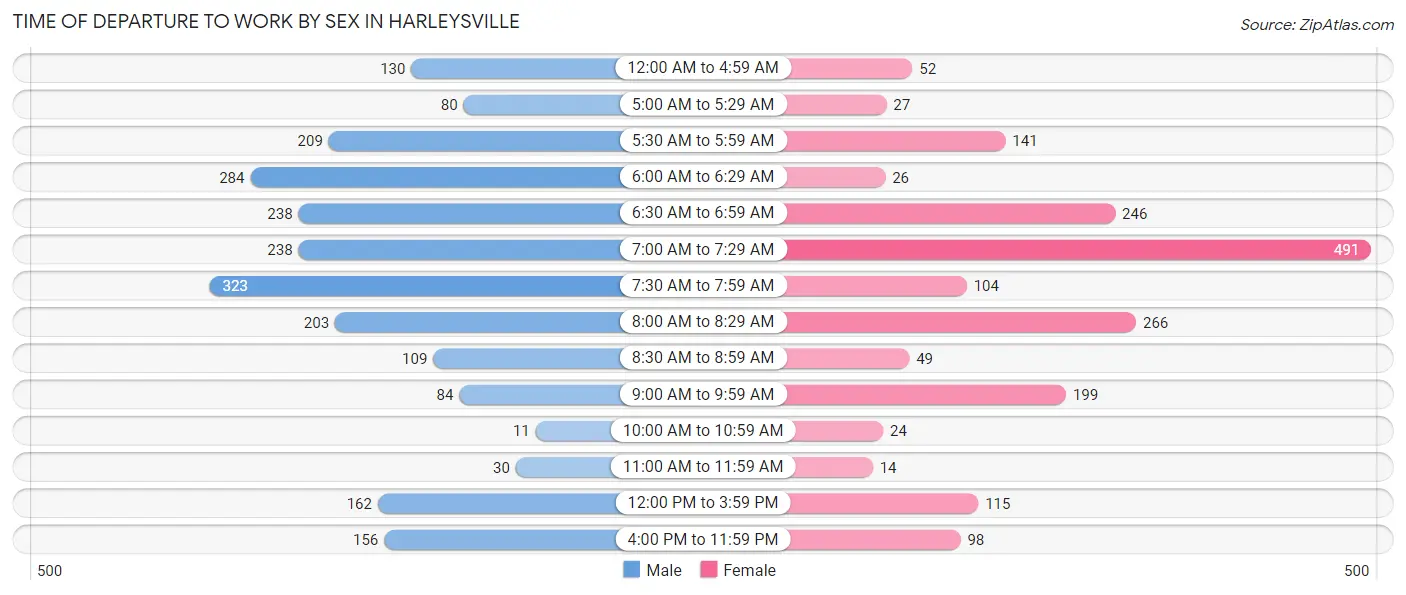
| Time of Departure | Male | Female |
| 12:00 AM to 4:59 AM | 130 (5.8%) | 52 (2.8%) |
| 5:00 AM to 5:29 AM | 80 (3.5%) | 27 (1.5%) |
| 5:30 AM to 5:59 AM | 209 (9.3%) | 141 (7.6%) |
| 6:00 AM to 6:29 AM | 284 (12.6%) | 26 (1.4%) |
| 6:30 AM to 6:59 AM | 238 (10.5%) | 246 (13.3%) |
| 7:00 AM to 7:29 AM | 238 (10.5%) | 491 (26.5%) |
| 7:30 AM to 7:59 AM | 323 (14.3%) | 104 (5.6%) |
| 8:00 AM to 8:29 AM | 203 (9.0%) | 266 (14.4%) |
| 8:30 AM to 8:59 AM | 109 (4.8%) | 49 (2.6%) |
| 9:00 AM to 9:59 AM | 84 (3.7%) | 199 (10.7%) |
| 10:00 AM to 10:59 AM | 11 (0.5%) | 24 (1.3%) |
| 11:00 AM to 11:59 AM | 30 (1.3%) | 14 (0.8%) |
| 12:00 PM to 3:59 PM | 162 (7.2%) | 115 (6.2%) |
| 4:00 PM to 11:59 PM | 156 (6.9%) | 98 (5.3%) |
| Total | 2,257 (100.0%) | 1,852 (100.0%) |
Housing Occupancy in Harleysville
Occupancy by Ownership in Harleysville
Of the total 3,692 dwellings in Harleysville, owner-occupied units account for 2,454 (66.5%), while renter-occupied units make up 1,238 (33.5%).
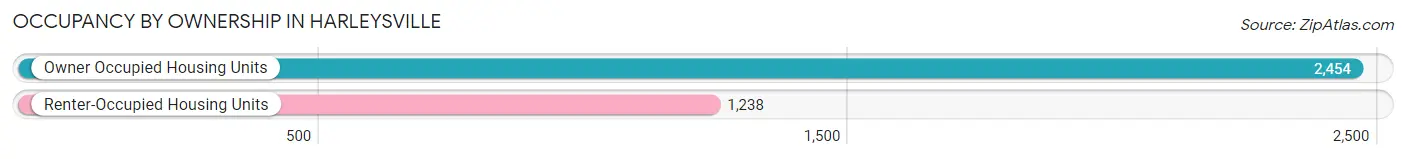
| Occupancy | # Housing Units | % Housing Units |
| Owner Occupied Housing Units | 2,454 | 66.5% |
| Renter-Occupied Housing Units | 1,238 | 33.5% |
| Total Occupied Housing Units | 3,692 | 100.0% |
Occupancy by Household Size in Harleysville
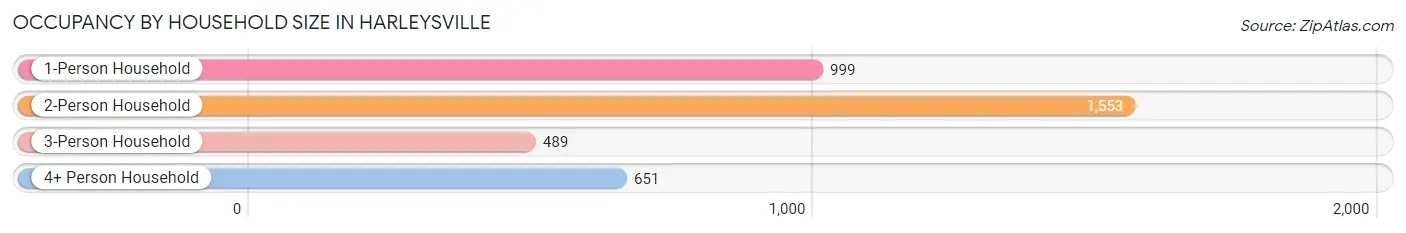
| Household Size | # Housing Units | % Housing Units |
| 1-Person Household | 999 | 27.1% |
| 2-Person Household | 1,553 | 42.1% |
| 3-Person Household | 489 | 13.2% |
| 4+ Person Household | 651 | 17.6% |
| Total Housing Units | 3,692 | 100.0% |
Occupancy by Ownership by Household Size in Harleysville
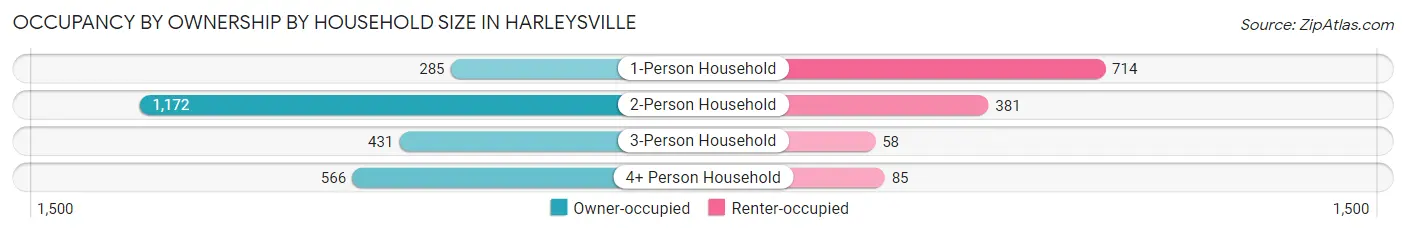
| Household Size | Owner-occupied | Renter-occupied |
| 1-Person Household | 285 (28.5%) | 714 (71.5%) |
| 2-Person Household | 1,172 (75.5%) | 381 (24.5%) |
| 3-Person Household | 431 (88.1%) | 58 (11.9%) |
| 4+ Person Household | 566 (86.9%) | 85 (13.1%) |
| Total Housing Units | 2,454 (66.5%) | 1,238 (33.5%) |
Occupancy by Educational Attainment in Harleysville
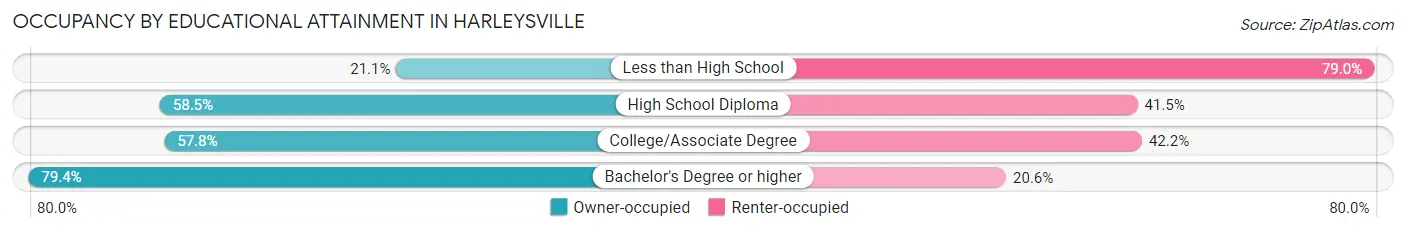
| Household Size | Owner-occupied | Renter-occupied |
| Less than High School | 24 (21.0%) | 90 (78.9%) |
| High School Diploma | 586 (58.5%) | 415 (41.5%) |
| College/Associate Degree | 542 (57.8%) | 395 (42.2%) |
| Bachelor's Degree or higher | 1,302 (79.4%) | 338 (20.6%) |
Occupancy by Age of Householder in Harleysville
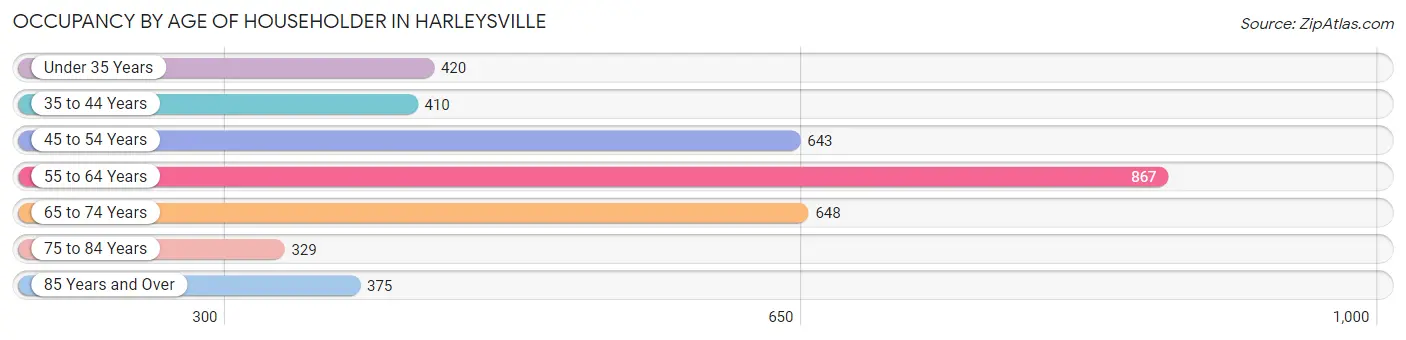
| Age Bracket | # Households | % Households |
| Under 35 Years | 420 | 11.4% |
| 35 to 44 Years | 410 | 11.1% |
| 45 to 54 Years | 643 | 17.4% |
| 55 to 64 Years | 867 | 23.5% |
| 65 to 74 Years | 648 | 17.5% |
| 75 to 84 Years | 329 | 8.9% |
| 85 Years and Over | 375 | 10.2% |
| Total | 3,692 | 100.0% |
Housing Finances in Harleysville
Median Income by Occupancy in Harleysville
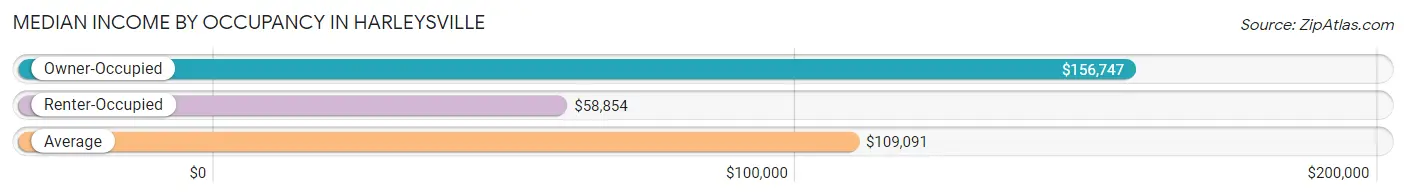
| Occupancy Type | # Households | Median Income |
| Owner-Occupied | 2,454 (66.5%) | $156,747 |
| Renter-Occupied | 1,238 (33.5%) | $58,854 |
| Average | 3,692 (100.0%) | $109,091 |
Occupancy by Householder Income Bracket in Harleysville
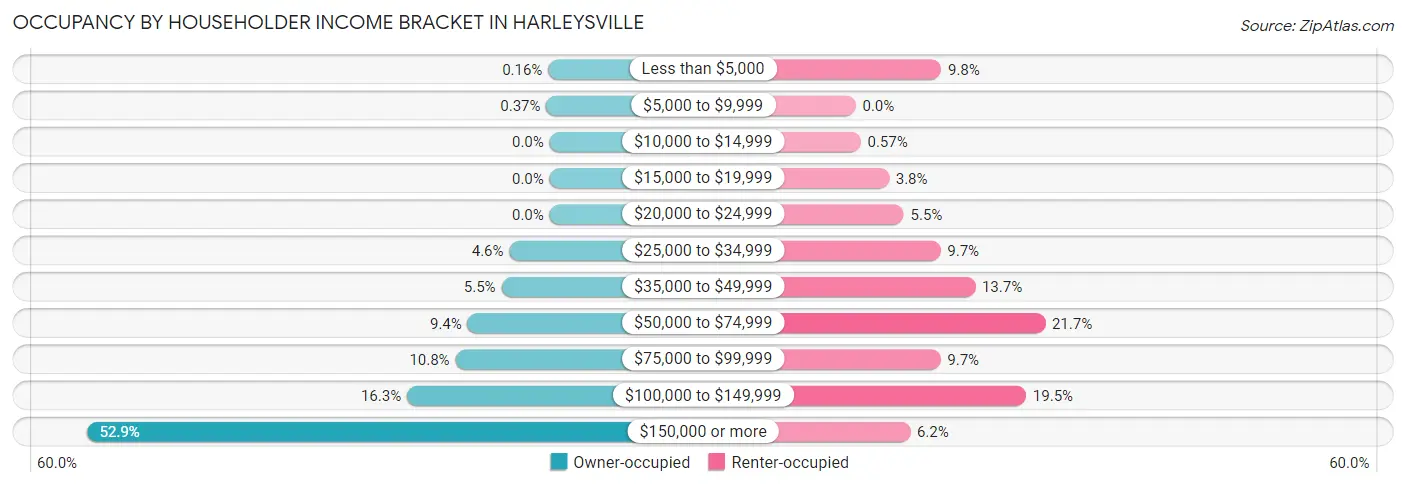
| Income Bracket | Owner-occupied | Renter-occupied |
| Less than $5,000 | 4 (0.2%) | 121 (9.8%) |
| $5,000 to $9,999 | 9 (0.4%) | 0 (0.0%) |
| $10,000 to $14,999 | 0 (0.0%) | 7 (0.6%) |
| $15,000 to $19,999 | 0 (0.0%) | 47 (3.8%) |
| $20,000 to $24,999 | 0 (0.0%) | 68 (5.5%) |
| $25,000 to $34,999 | 113 (4.6%) | 120 (9.7%) |
| $35,000 to $49,999 | 135 (5.5%) | 169 (13.7%) |
| $50,000 to $74,999 | 230 (9.4%) | 268 (21.6%) |
| $75,000 to $99,999 | 264 (10.8%) | 120 (9.7%) |
| $100,000 to $149,999 | 400 (16.3%) | 241 (19.5%) |
| $150,000 or more | 1,299 (52.9%) | 77 (6.2%) |
| Total | 2,454 (100.0%) | 1,238 (100.0%) |
Monthly Housing Cost Tiers in Harleysville
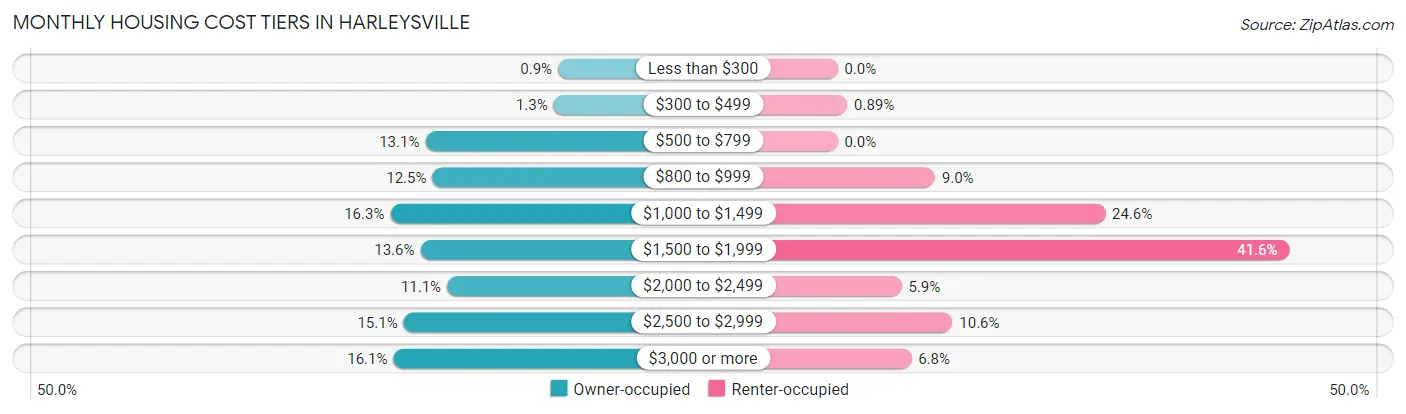
| Monthly Cost | Owner-occupied | Renter-occupied |
| Less than $300 | 22 (0.9%) | 0 (0.0%) |
| $300 to $499 | 32 (1.3%) | 11 (0.9%) |
| $500 to $799 | 322 (13.1%) | 0 (0.0%) |
| $800 to $999 | 306 (12.5%) | 111 (9.0%) |
| $1,000 to $1,499 | 401 (16.3%) | 305 (24.6%) |
| $1,500 to $1,999 | 333 (13.6%) | 515 (41.6%) |
| $2,000 to $2,499 | 273 (11.1%) | 73 (5.9%) |
| $2,500 to $2,999 | 371 (15.1%) | 131 (10.6%) |
| $3,000 or more | 394 (16.1%) | 84 (6.8%) |
| Total | 2,454 (100.0%) | 1,238 (100.0%) |
Physical Housing Characteristics in Harleysville
Housing Structures in Harleysville
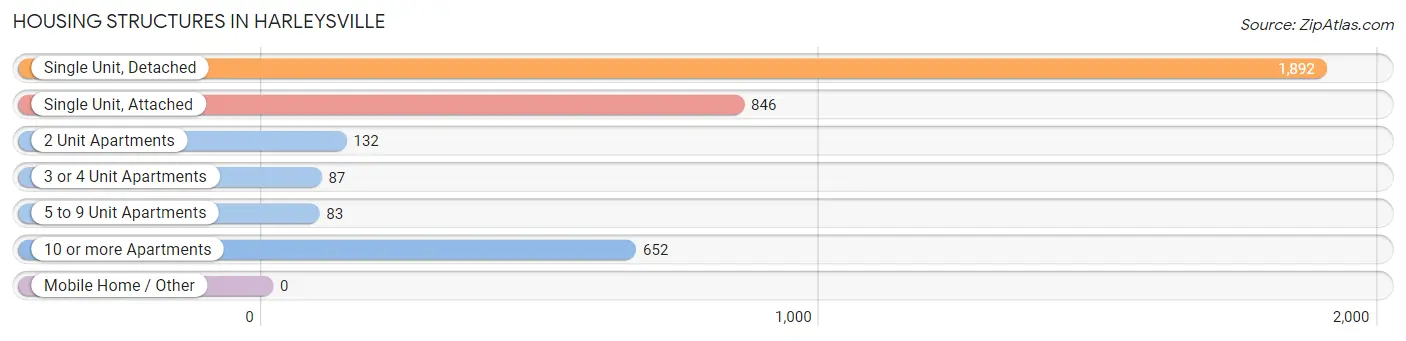
| Structure Type | # Housing Units | % Housing Units |
| Single Unit, Detached | 1,892 | 51.2% |
| Single Unit, Attached | 846 | 22.9% |
| 2 Unit Apartments | 132 | 3.6% |
| 3 or 4 Unit Apartments | 87 | 2.4% |
| 5 to 9 Unit Apartments | 83 | 2.2% |
| 10 or more Apartments | 652 | 17.7% |
| Mobile Home / Other | 0 | 0.0% |
| Total | 3,692 | 100.0% |
Housing Structures by Occupancy in Harleysville
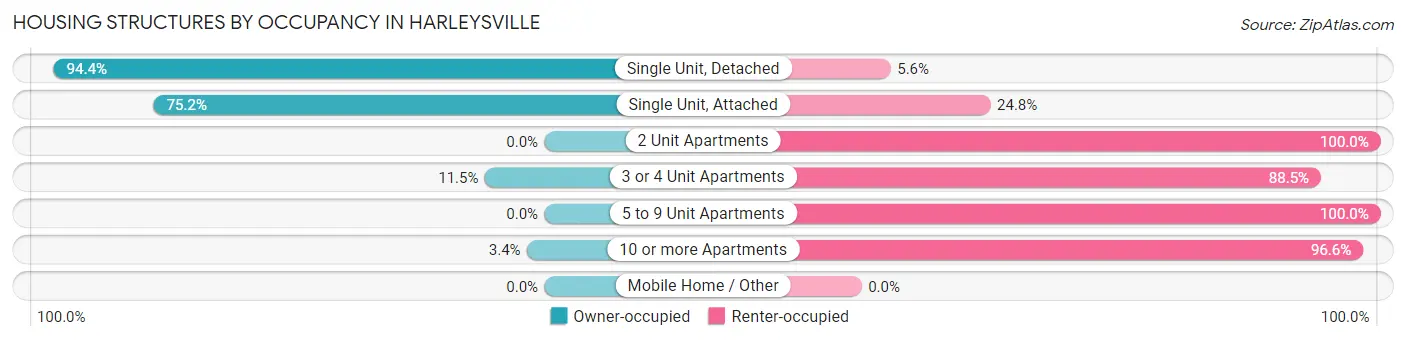
| Structure Type | Owner-occupied | Renter-occupied |
| Single Unit, Detached | 1,786 (94.4%) | 106 (5.6%) |
| Single Unit, Attached | 636 (75.2%) | 210 (24.8%) |
| 2 Unit Apartments | 0 (0.0%) | 132 (100.0%) |
| 3 or 4 Unit Apartments | 10 (11.5%) | 77 (88.5%) |
| 5 to 9 Unit Apartments | 0 (0.0%) | 83 (100.0%) |
| 10 or more Apartments | 22 (3.4%) | 630 (96.6%) |
| Mobile Home / Other | 0 (0.0%) | 0 (0.0%) |
| Total | 2,454 (66.5%) | 1,238 (33.5%) |
Housing Structures by Number of Rooms in Harleysville
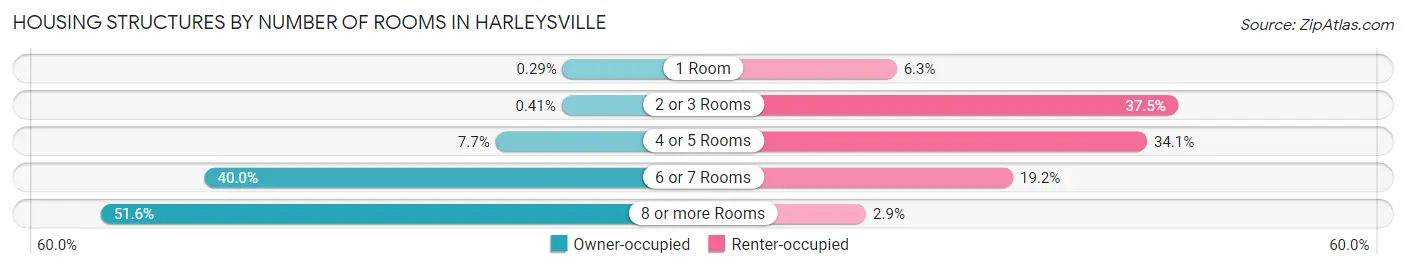
| Number of Rooms | Owner-occupied | Renter-occupied |
| 1 Room | 7 (0.3%) | 78 (6.3%) |
| 2 or 3 Rooms | 10 (0.4%) | 464 (37.5%) |
| 4 or 5 Rooms | 190 (7.7%) | 422 (34.1%) |
| 6 or 7 Rooms | 982 (40.0%) | 238 (19.2%) |
| 8 or more Rooms | 1,265 (51.5%) | 36 (2.9%) |
| Total | 2,454 (100.0%) | 1,238 (100.0%) |
Housing Structure by Heating Type in Harleysville
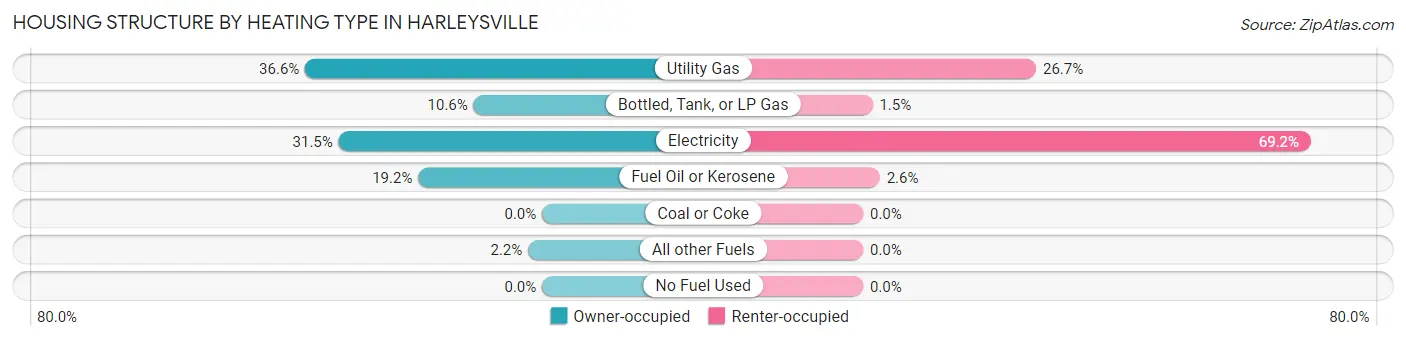
| Heating Type | Owner-occupied | Renter-occupied |
| Utility Gas | 899 (36.6%) | 331 (26.7%) |
| Bottled, Tank, or LP Gas | 260 (10.6%) | 18 (1.5%) |
| Electricity | 772 (31.5%) | 857 (69.2%) |
| Fuel Oil or Kerosene | 470 (19.2%) | 32 (2.6%) |
| Coal or Coke | 0 (0.0%) | 0 (0.0%) |
| All other Fuels | 53 (2.2%) | 0 (0.0%) |
| No Fuel Used | 0 (0.0%) | 0 (0.0%) |
| Total | 2,454 (100.0%) | 1,238 (100.0%) |
Household Vehicle Usage in Harleysville
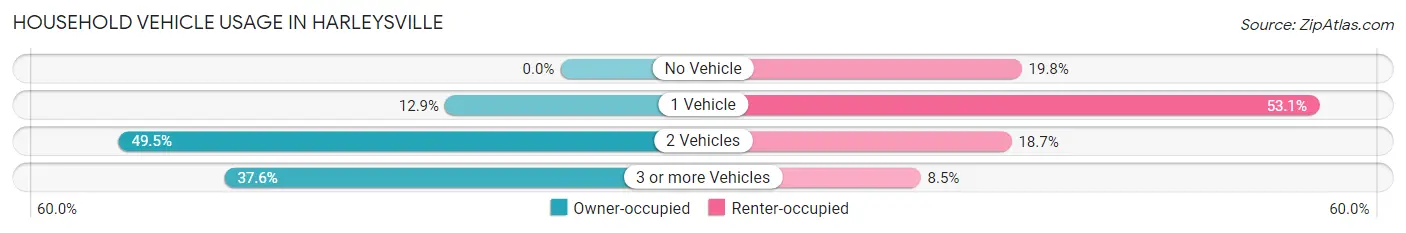
| Vehicles per Household | Owner-occupied | Renter-occupied |
| No Vehicle | 0 (0.0%) | 245 (19.8%) |
| 1 Vehicle | 317 (12.9%) | 657 (53.1%) |
| 2 Vehicles | 1,214 (49.5%) | 231 (18.7%) |
| 3 or more Vehicles | 923 (37.6%) | 105 (8.5%) |
| Total | 2,454 (100.0%) | 1,238 (100.0%) |
Real Estate & Mortgages in Harleysville
Real Estate and Mortgage Overview in Harleysville
| Characteristic | Without Mortgage | With Mortgage |
| Housing Units | 943 | 1,511 |
| Median Property Value | $371,500 | $407,300 |
| Median Household Income | $108,693 | $906 |
| Monthly Housing Costs | $849 | $394 |
| Real Estate Taxes | $5,726 | $0 |
Property Value by Mortgage Status in Harleysville
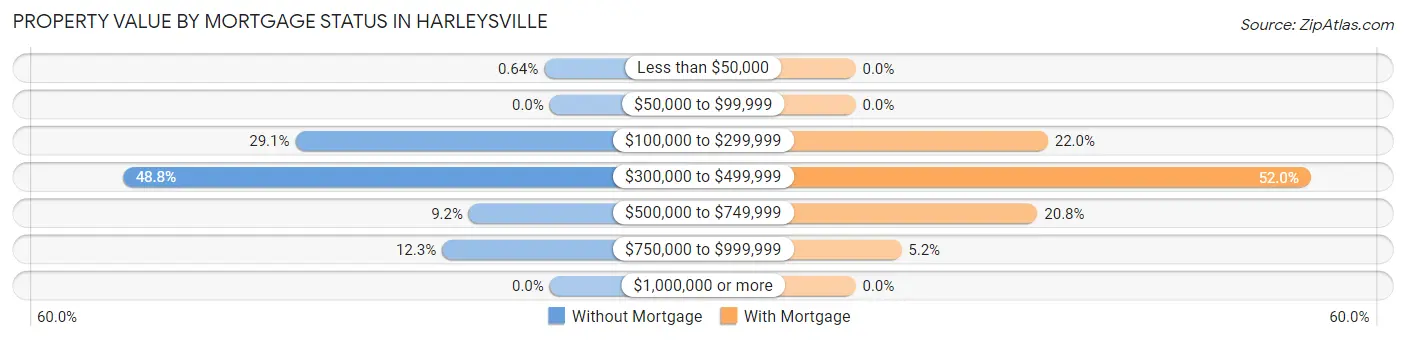
| Property Value | Without Mortgage | With Mortgage |
| Less than $50,000 | 6 (0.6%) | 0 (0.0%) |
| $50,000 to $99,999 | 0 (0.0%) | 0 (0.0%) |
| $100,000 to $299,999 | 274 (29.1%) | 332 (22.0%) |
| $300,000 to $499,999 | 460 (48.8%) | 786 (52.0%) |
| $500,000 to $749,999 | 87 (9.2%) | 314 (20.8%) |
| $750,000 to $999,999 | 116 (12.3%) | 79 (5.2%) |
| $1,000,000 or more | 0 (0.0%) | 0 (0.0%) |
| Total | 943 (100.0%) | 1,511 (100.0%) |
Household Income by Mortgage Status in Harleysville
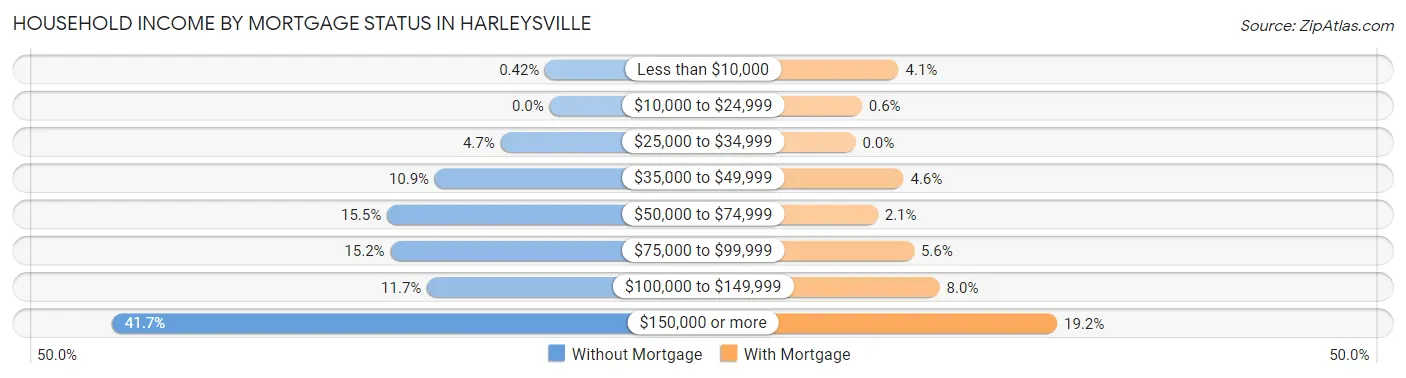
| Household Income | Without Mortgage | With Mortgage |
| Less than $10,000 | 4 (0.4%) | 62 (4.1%) |
| $10,000 to $24,999 | 0 (0.0%) | 9 (0.6%) |
| $25,000 to $34,999 | 44 (4.7%) | 0 (0.0%) |
| $35,000 to $49,999 | 103 (10.9%) | 69 (4.6%) |
| $50,000 to $74,999 | 146 (15.5%) | 32 (2.1%) |
| $75,000 to $99,999 | 143 (15.2%) | 84 (5.6%) |
| $100,000 to $149,999 | 110 (11.7%) | 121 (8.0%) |
| $150,000 or more | 393 (41.7%) | 290 (19.2%) |
| Total | 943 (100.0%) | 1,511 (100.0%) |
Property Value to Household Income Ratio in Harleysville
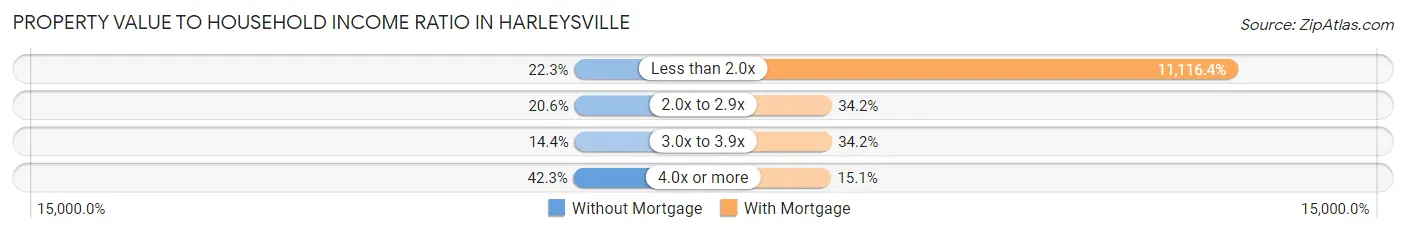
| Value-to-Income Ratio | Without Mortgage | With Mortgage |
| Less than 2.0x | 210 (22.3%) | 167,969 (11,116.4%) |
| 2.0x to 2.9x | 194 (20.6%) | 517 (34.2%) |
| 3.0x to 3.9x | 136 (14.4%) | 516 (34.2%) |
| 4.0x or more | 399 (42.3%) | 228 (15.1%) |
| Total | 943 (100.0%) | 1,511 (100.0%) |
Real Estate Taxes by Mortgage Status in Harleysville
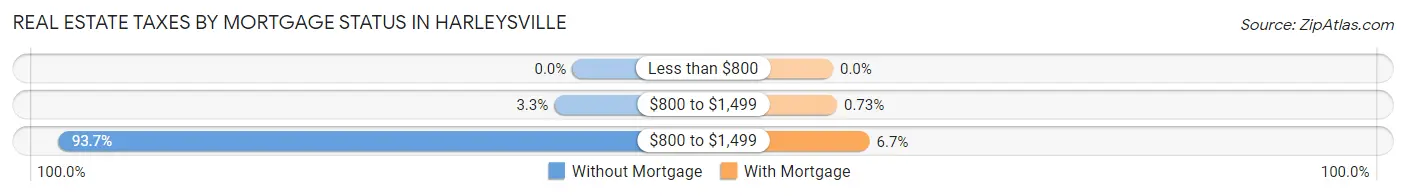
| Property Taxes | Without Mortgage | With Mortgage |
| Less than $800 | 0 (0.0%) | 0 (0.0%) |
| $800 to $1,499 | 31 (3.3%) | 11 (0.7%) |
| $800 to $1,499 | 884 (93.7%) | 101 (6.7%) |
| Total | 943 (100.0%) | 1,511 (100.0%) |
Health & Disability in Harleysville
Health Insurance Coverage by Age in Harleysville
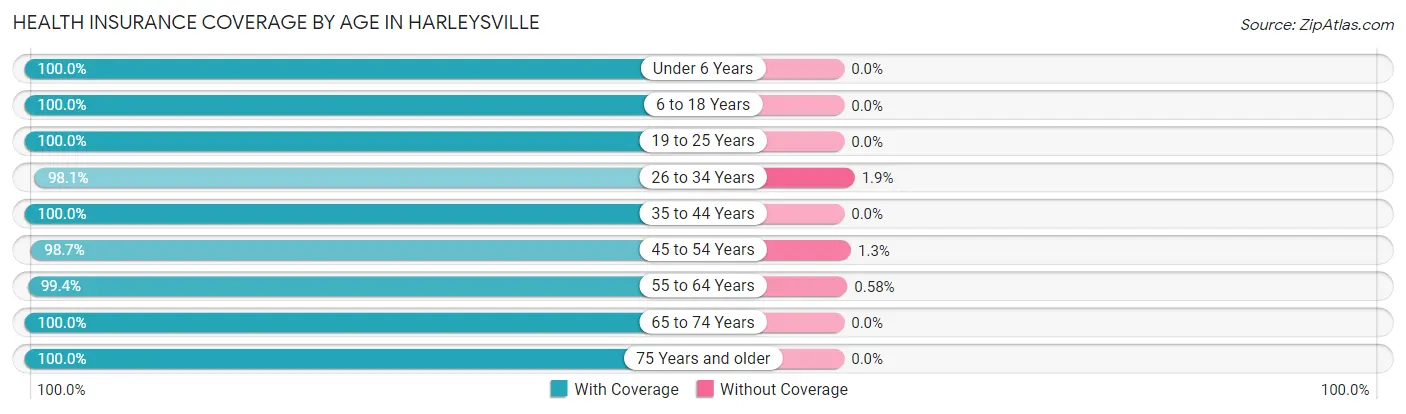
| Age Bracket | With Coverage | Without Coverage |
| Under 6 Years | 467 (100.0%) | 0 (0.0%) |
| 6 to 18 Years | 1,056 (100.0%) | 0 (0.0%) |
| 19 to 25 Years | 667 (100.0%) | 0 (0.0%) |
| 26 to 34 Years | 859 (98.1%) | 17 (1.9%) |
| 35 to 44 Years | 911 (100.0%) | 0 (0.0%) |
| 45 to 54 Years | 1,239 (98.7%) | 16 (1.3%) |
| 55 to 64 Years | 1,540 (99.4%) | 9 (0.6%) |
| 65 to 74 Years | 1,013 (100.0%) | 0 (0.0%) |
| 75 Years and older | 1,092 (100.0%) | 0 (0.0%) |
| Total | 8,844 (99.5%) | 42 (0.5%) |
Health Insurance Coverage by Citizenship Status in Harleysville
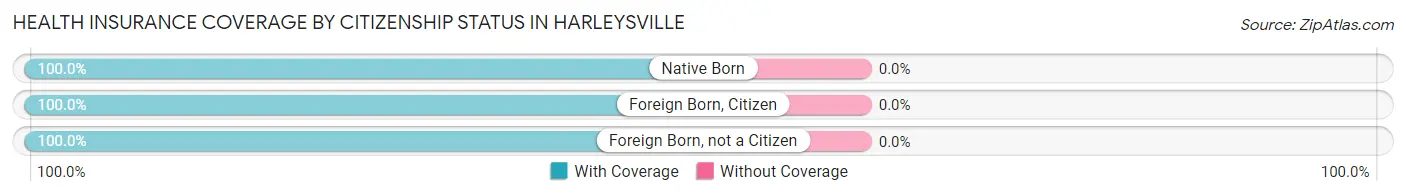
| Citizenship Status | With Coverage | Without Coverage |
| Native Born | 467 (100.0%) | 0 (0.0%) |
| Foreign Born, Citizen | 1,056 (100.0%) | 0 (0.0%) |
| Foreign Born, not a Citizen | 667 (100.0%) | 0 (0.0%) |
Health Insurance Coverage by Household Income in Harleysville
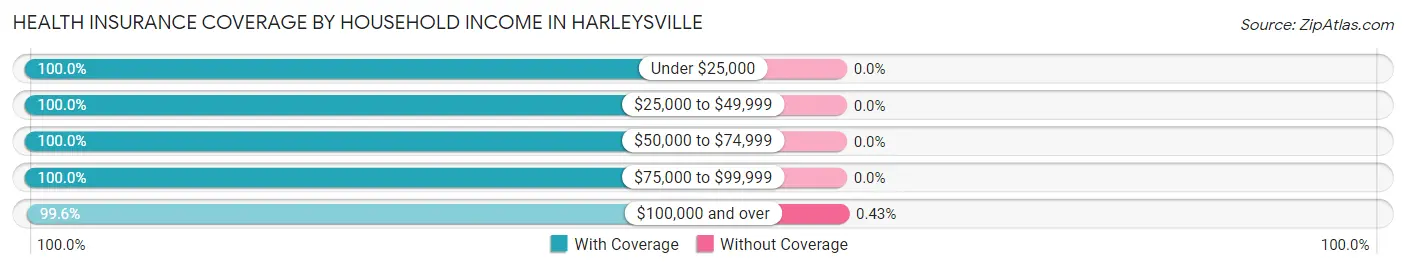
| Household Income | With Coverage | Without Coverage |
| Under $25,000 | 393 (100.0%) | 0 (0.0%) |
| $25,000 to $49,999 | 900 (100.0%) | 0 (0.0%) |
| $50,000 to $74,999 | 832 (100.0%) | 0 (0.0%) |
| $75,000 to $99,999 | 851 (100.0%) | 0 (0.0%) |
| $100,000 and over | 5,766 (99.6%) | 25 (0.4%) |
Public vs Private Health Insurance Coverage by Age in Harleysville
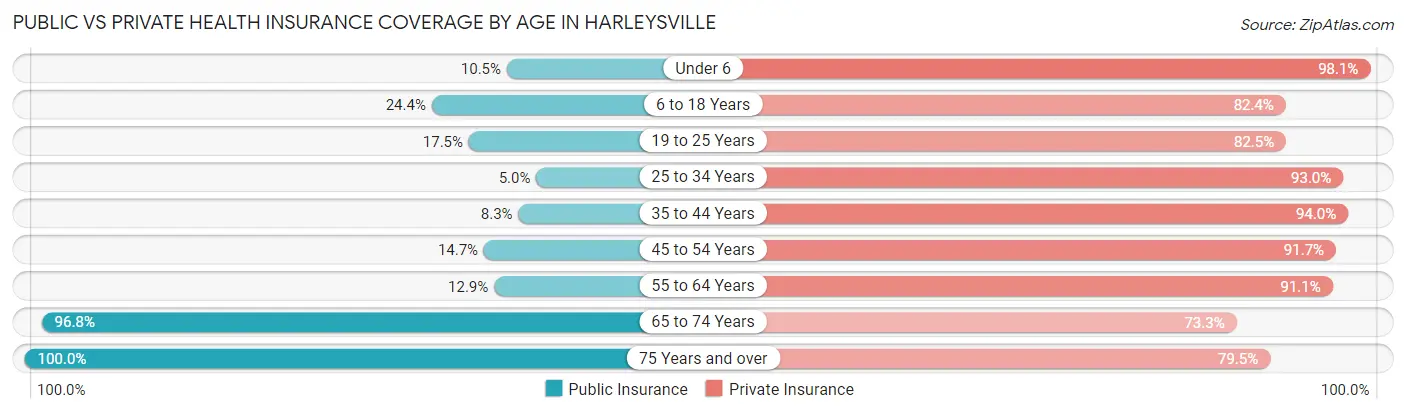
| Age Bracket | Public Insurance | Private Insurance |
| Under 6 | 49 (10.5%) | 458 (98.1%) |
| 6 to 18 Years | 258 (24.4%) | 870 (82.4%) |
| 19 to 25 Years | 117 (17.5%) | 550 (82.5%) |
| 25 to 34 Years | 44 (5.0%) | 815 (93.0%) |
| 35 to 44 Years | 76 (8.3%) | 856 (94.0%) |
| 45 to 54 Years | 185 (14.7%) | 1,151 (91.7%) |
| 55 to 64 Years | 199 (12.9%) | 1,411 (91.1%) |
| 65 to 74 Years | 981 (96.8%) | 742 (73.3%) |
| 75 Years and over | 1,092 (100.0%) | 868 (79.5%) |
| Total | 3,001 (33.8%) | 7,721 (86.9%) |
Disability Status by Sex by Age in Harleysville
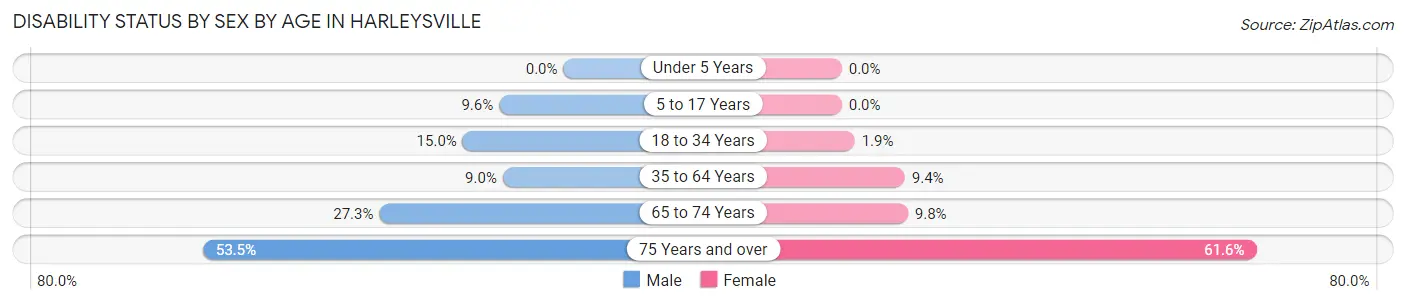
| Age Bracket | Male | Female |
| Under 5 Years | 0 (0.0%) | 0 (0.0%) |
| 5 to 17 Years | 53 (9.6%) | 0 (0.0%) |
| 18 to 34 Years | 144 (14.9%) | 13 (1.9%) |
| 35 to 64 Years | 164 (9.0%) | 177 (9.4%) |
| 65 to 74 Years | 132 (27.3%) | 52 (9.8%) |
| 75 Years and over | 288 (53.5%) | 341 (61.6%) |
Disability Class by Sex by Age in Harleysville
Disability Class: Hearing Difficulty
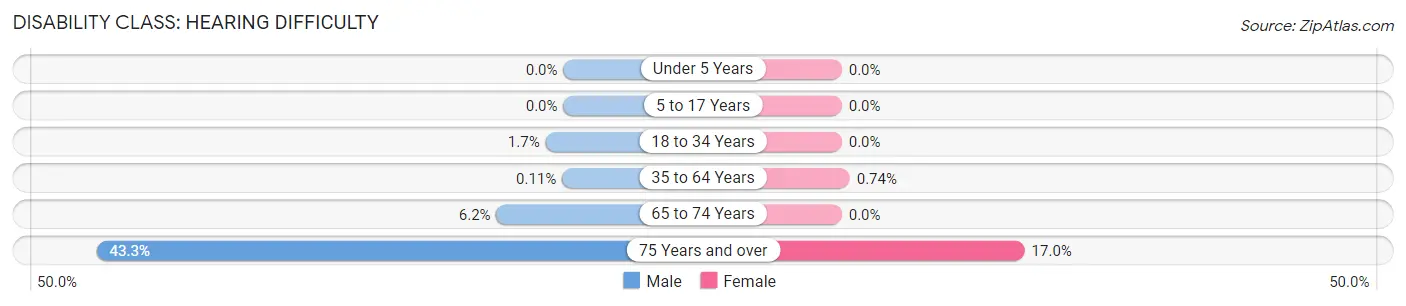
| Age Bracket | Male | Female |
| Under 5 Years | 0 (0.0%) | 0 (0.0%) |
| 5 to 17 Years | 0 (0.0%) | 0 (0.0%) |
| 18 to 34 Years | 16 (1.7%) | 0 (0.0%) |
| 35 to 64 Years | 2 (0.1%) | 14 (0.7%) |
| 65 to 74 Years | 30 (6.2%) | 0 (0.0%) |
| 75 Years and over | 233 (43.3%) | 94 (17.0%) |
Disability Class: Vision Difficulty
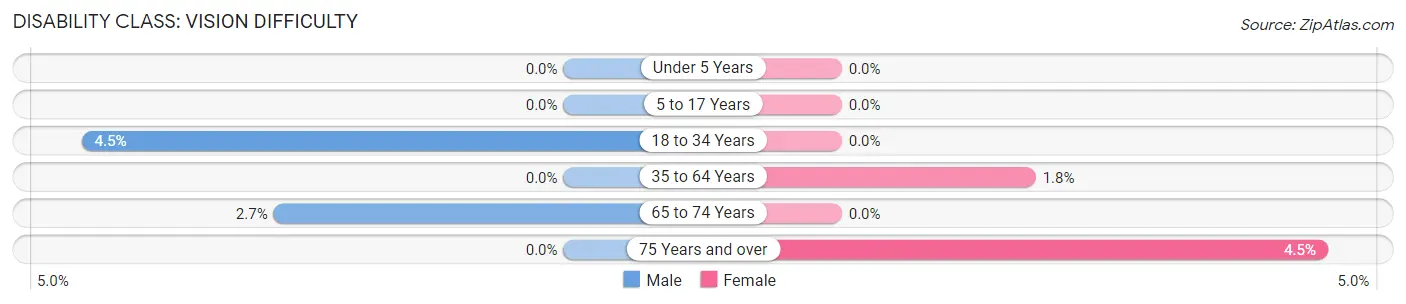
| Age Bracket | Male | Female |
| Under 5 Years | 0 (0.0%) | 0 (0.0%) |
| 5 to 17 Years | 0 (0.0%) | 0 (0.0%) |
| 18 to 34 Years | 43 (4.5%) | 0 (0.0%) |
| 35 to 64 Years | 0 (0.0%) | 34 (1.8%) |
| 65 to 74 Years | 13 (2.7%) | 0 (0.0%) |
| 75 Years and over | 0 (0.0%) | 25 (4.5%) |
Disability Class: Cognitive Difficulty
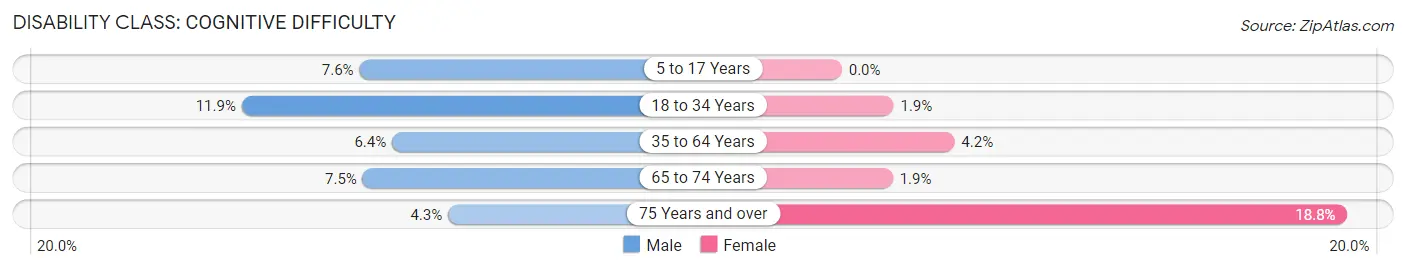
| Age Bracket | Male | Female |
| 5 to 17 Years | 42 (7.6%) | 0 (0.0%) |
| 18 to 34 Years | 115 (11.9%) | 13 (1.9%) |
| 35 to 64 Years | 116 (6.4%) | 79 (4.2%) |
| 65 to 74 Years | 36 (7.4%) | 10 (1.9%) |
| 75 Years and over | 23 (4.3%) | 104 (18.8%) |
Disability Class: Ambulatory Difficulty
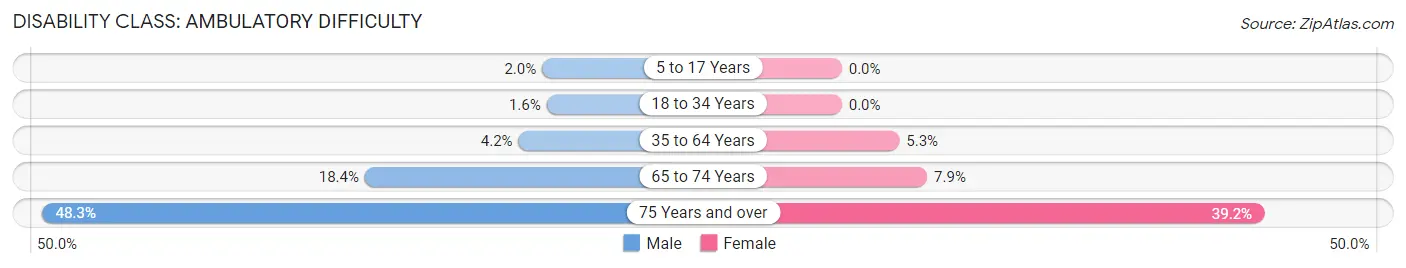
| Age Bracket | Male | Female |
| 5 to 17 Years | 11 (2.0%) | 0 (0.0%) |
| 18 to 34 Years | 15 (1.6%) | 0 (0.0%) |
| 35 to 64 Years | 76 (4.2%) | 101 (5.3%) |
| 65 to 74 Years | 89 (18.4%) | 42 (7.9%) |
| 75 Years and over | 260 (48.3%) | 217 (39.2%) |
Disability Class: Self-Care Difficulty
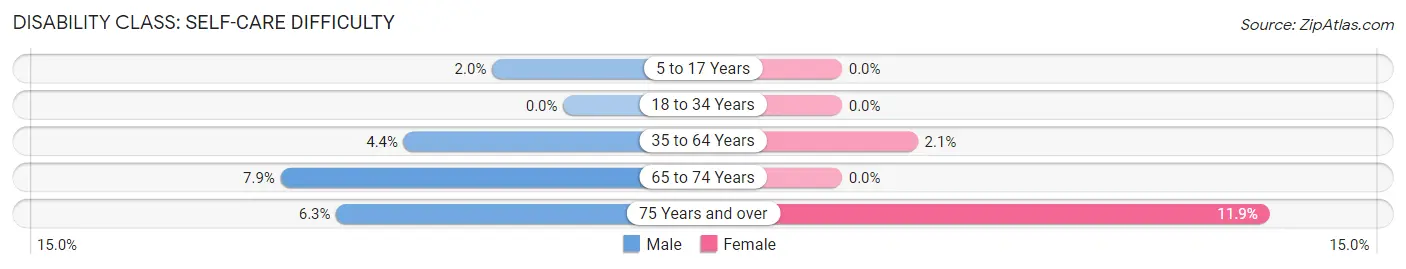
| Age Bracket | Male | Female |
| 5 to 17 Years | 11 (2.0%) | 0 (0.0%) |
| 18 to 34 Years | 0 (0.0%) | 0 (0.0%) |
| 35 to 64 Years | 81 (4.4%) | 40 (2.1%) |
| 65 to 74 Years | 38 (7.9%) | 0 (0.0%) |
| 75 Years and over | 34 (6.3%) | 66 (11.9%) |
Technology Access in Harleysville
Computing Device Access in Harleysville
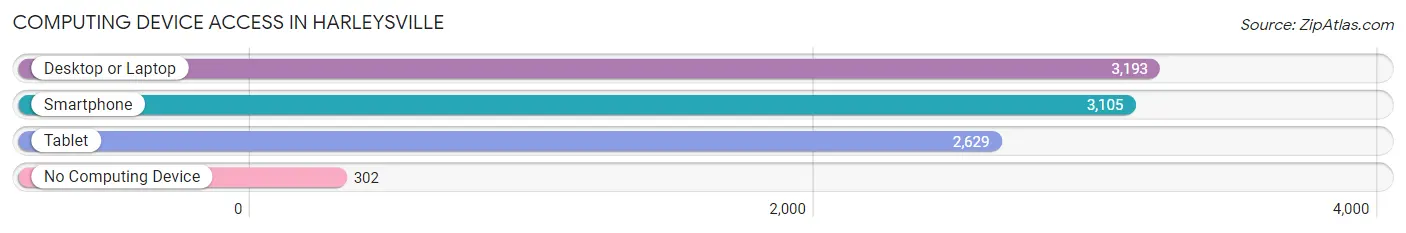
| Device Type | # Households | % Households |
| Desktop or Laptop | 3,193 | 86.5% |
| Smartphone | 3,105 | 84.1% |
| Tablet | 2,629 | 71.2% |
| No Computing Device | 302 | 8.2% |
| Total | 3,692 | 100.0% |
Internet Access in Harleysville
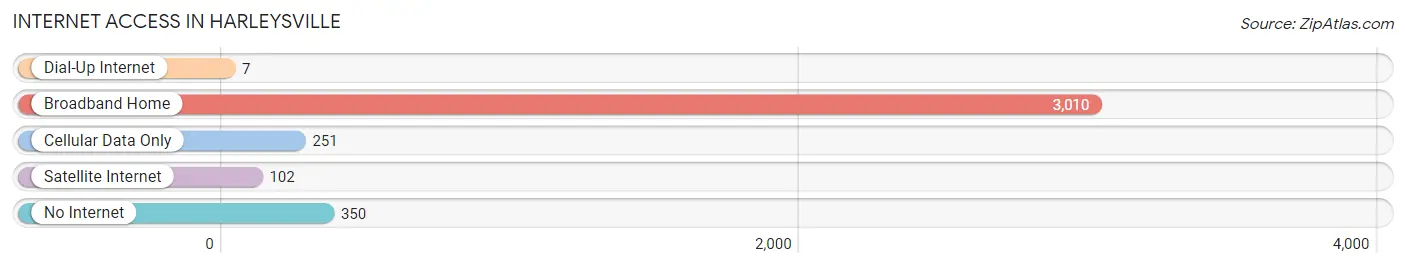
| Internet Type | # Households | % Households |
| Dial-Up Internet | 7 | 0.2% |
| Broadband Home | 3,010 | 81.5% |
| Cellular Data Only | 251 | 6.8% |
| Satellite Internet | 102 | 2.8% |
| No Internet | 350 | 9.5% |
| Total | 3,692 | 100.0% |
Harleysville Summary
Harleysville, Pennsylvania is a small borough located in Montgomery County, Pennsylvania. It is situated approximately 25 miles northwest of Philadelphia and is part of the North Penn Valley region. The borough is home to a population of approximately 8,000 people and is known for its rural charm and small-town atmosphere.
History
Harleysville was founded in 1719 by John Harleys, a Quaker from England. The town was originally known as Harleysville Crossroads, and was a small farming community. In 1835, the town was officially incorporated as a borough. During the 19th century, the town grew and prospered due to its location on the main road between Philadelphia and Allentown. The town was also home to several mills, including a paper mill, a grist mill, and a saw mill.
In the early 20th century, the town began to experience a decline in population as people moved away to larger cities. However, in the 1950s, the town experienced a resurgence in population as people moved back to the area. This trend has continued into the present day, and the town has seen a steady population growth since the 1950s.
Geography
Harleysville is located in southeastern Pennsylvania, in Montgomery County. It is situated approximately 25 miles northwest of Philadelphia and is part of the North Penn Valley region. The borough is bordered by Lower Salford Township to the north, Franconia Township to the east, Upper Salford Township to the south, and Towamencin Township to the west.
The borough is situated in a rural area, and is surrounded by rolling hills and farmland. The Perkiomen Creek runs through the town, and there are several small lakes and ponds in the area. The climate in Harleysville is typical of the Northeastern United States, with cold winters and hot, humid summers.
Economy
Harleysville is a small, rural community, and the economy is largely based on agriculture and small businesses. The town is home to several small businesses, including restaurants, retail stores, and professional services. The town is also home to several large employers, including a medical center, a manufacturing plant, and a distribution center.
The town is also home to several educational institutions, including a community college, a technical school, and a private school. The town is also home to several parks and recreational facilities, including a public pool, a golf course, and several hiking trails.
Demographics
As of the 2010 census, the population of Harleysville was 8,079. The racial makeup of the town was 94.3% White, 1.3% African American, 0.3% Native American, 1.2% Asian, 0.1% Pacific Islander, 1.2% from other races, and 1.6% from two or more races. Hispanic or Latino of any race were 3.3% of the population.
The median household income in Harleysville was $68,944, and the median family income was $77,917. The per capita income was $30,945. About 4.2% of families and 5.3% of the population were below the poverty line, including 6.2% of those under age 18 and 4.2% of those age 65 or over.
Harleysville is a small, rural community with a strong sense of community and a rich history. The town is home to a diverse population, and the economy is largely based on agriculture and small businesses. The town is also home to several educational institutions and recreational facilities, making it an attractive place to live and work.
Common Questions
What is Per Capita Income in Harleysville?
Per Capita income in Harleysville is $56,896.
What is the Median Family Income in Harleysville?
Median Family Income in Harleysville is $144,375.
What is the Median Household income in Harleysville?
Median Household Income in Harleysville is $109,091.
What is Income or Wage Gap in Harleysville?
Income or Wage Gap in Harleysville is 36.1%.
Women in Harleysville earn 63.9 cents for every dollar earned by a man.
What is Inequality or Gini Index in Harleysville?
Inequality or Gini Index in Harleysville is 0.41.
What is the Total Population of Harleysville?
Total Population of Harleysville is 8,992.
What is the Total Male Population of Harleysville?
Total Male Population of Harleysville is 4,632.
What is the Total Female Population of Harleysville?
Total Female Population of Harleysville is 4,360.
What is the Ratio of Males per 100 Females in Harleysville?
There are 106.24 Males per 100 Females in Harleysville.
What is the Ratio of Females per 100 Males in Harleysville?
There are 94.13 Females per 100 Males in Harleysville.
What is the Median Population Age in Harleysville?
Median Population Age in Harleysville is 49.0 Years.
What is the Average Family Size in Harleysville
Average Family Size in Harleysville is 2.9 People.
What is the Average Household Size in Harleysville
Average Household Size in Harleysville is 2.4 People.
How Large is the Labor Force in Harleysville?
There are 5,201 People in the Labor Forcein in Harleysville.
What is the Percentage of People in the Labor Force in Harleysville?
66.3% of People are in the Labor Force in Harleysville.
What is the Unemployment Rate in Harleysville?
Unemployment Rate in Harleysville is 2.7%.