Freedom borough, PA Map & Demographics
Freedom borough Overview
$26,445
PER CAPITA INCOME
$67,803
AVG FAMILY INCOME
$60,074
AVG HOUSEHOLD INCOME
20.8%
WAGE / INCOME GAP [ % ]
79.2¢/ $1
WAGE / INCOME GAP [ $ ]
0.41
INEQUALITY / GINI INDEX
1,625
TOTAL POPULATION
879
MALE POPULATION
746
FEMALE POPULATION
117.83
MALES / 100 FEMALES
84.87
FEMALES / 100 MALES
30.6
MEDIAN AGE
3.1
AVG FAMILY SIZE
2.6
AVG HOUSEHOLD SIZE
838
LABOR FORCE [ PEOPLE ]
68.0%
PERCENT IN LABOR FORCE
4.4%
UNEMPLOYMENT RATE
Income in Freedom borough
Income Overview in Freedom borough
Per Capita Income in Freedom borough is $26,445, while median incomes of families and households are $67,803 and $60,074 respectively.
| Characteristic | Number | Measure |
| Per Capita Income | 1,625 | $26,445 |
| Median Family Income | 436 | $67,803 |
| Mean Family Income | 436 | $73,284 |
| Median Household Income | 631 | $60,074 |
| Mean Household Income | 631 | $68,350 |
| Income Deficit | 436 | $0 |
| Wage / Income Gap (%) | 1,625 | 20.83% |
| Wage / Income Gap ($) | 1,625 | 79.17¢ per $1 |
| Gini / Inequality Index | 1,625 | 0.41 |
Earnings by Sex in Freedom borough
Average Earnings in Freedom borough are $32,609, $37,206 for men and $29,455 for women, a difference of 20.8%.
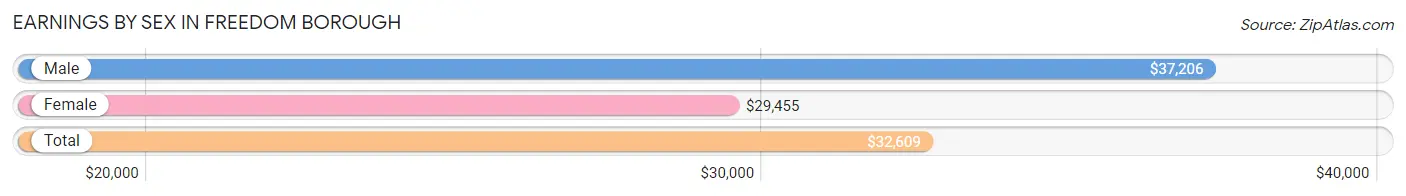
| Sex | Number | Average Earnings |
| Male | 460 (54.6%) | $37,206 |
| Female | 382 (45.4%) | $29,455 |
| Total | 842 (100.0%) | $32,609 |
Earnings by Sex by Income Bracket in Freedom borough
The most common earnings brackets in Freedom borough are $25,000 to $29,999 for men (54 | 11.7%) and $25,000 to $29,999 for women (83 | 21.7%).
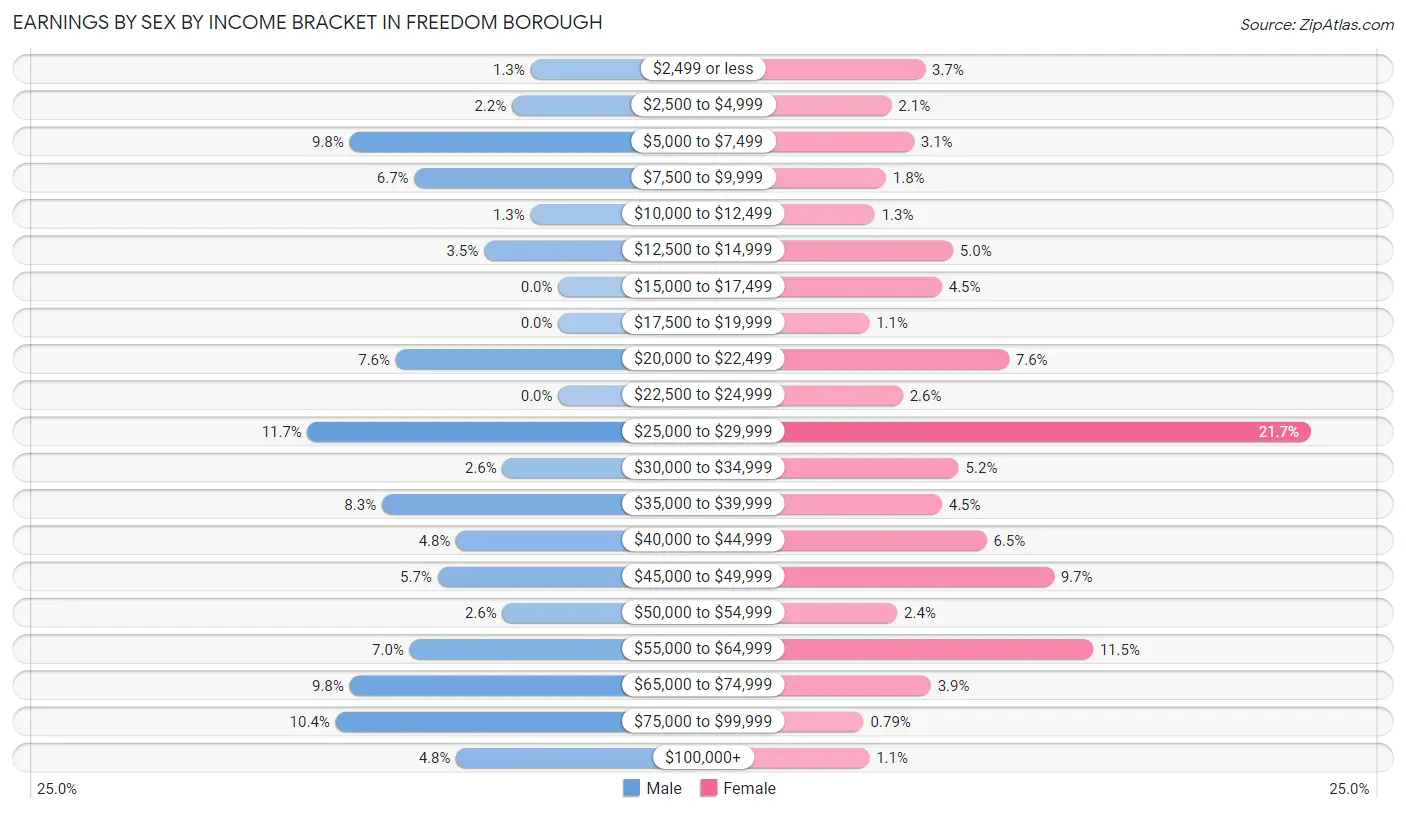
| Income | Male | Female |
| $2,499 or less | 6 (1.3%) | 14 (3.7%) |
| $2,500 to $4,999 | 10 (2.2%) | 8 (2.1%) |
| $5,000 to $7,499 | 45 (9.8%) | 12 (3.1%) |
| $7,500 to $9,999 | 31 (6.7%) | 7 (1.8%) |
| $10,000 to $12,499 | 6 (1.3%) | 5 (1.3%) |
| $12,500 to $14,999 | 16 (3.5%) | 19 (5.0%) |
| $15,000 to $17,499 | 0 (0.0%) | 17 (4.4%) |
| $17,500 to $19,999 | 0 (0.0%) | 4 (1.1%) |
| $20,000 to $22,499 | 35 (7.6%) | 29 (7.6%) |
| $22,500 to $24,999 | 0 (0.0%) | 10 (2.6%) |
| $25,000 to $29,999 | 54 (11.7%) | 83 (21.7%) |
| $30,000 to $34,999 | 12 (2.6%) | 20 (5.2%) |
| $35,000 to $39,999 | 38 (8.3%) | 17 (4.4%) |
| $40,000 to $44,999 | 22 (4.8%) | 25 (6.5%) |
| $45,000 to $49,999 | 26 (5.7%) | 37 (9.7%) |
| $50,000 to $54,999 | 12 (2.6%) | 9 (2.4%) |
| $55,000 to $64,999 | 32 (7.0%) | 44 (11.5%) |
| $65,000 to $74,999 | 45 (9.8%) | 15 (3.9%) |
| $75,000 to $99,999 | 48 (10.4%) | 3 (0.8%) |
| $100,000+ | 22 (4.8%) | 4 (1.1%) |
| Total | 460 (100.0%) | 382 (100.0%) |
Earnings by Sex by Educational Attainment in Freedom borough
Average earnings in Freedom borough are $43,942 for men and $37,721 for women, a difference of 14.2%. Men with an educational attainment of bachelor's degree enjoy the highest average annual earnings of $70,313, while those with high school diploma education earn the least with $29,808. Women with an educational attainment of bachelor's degree earn the most with the average annual earnings of $49,118, while those with high school diploma education have the smallest earnings of $22,875.
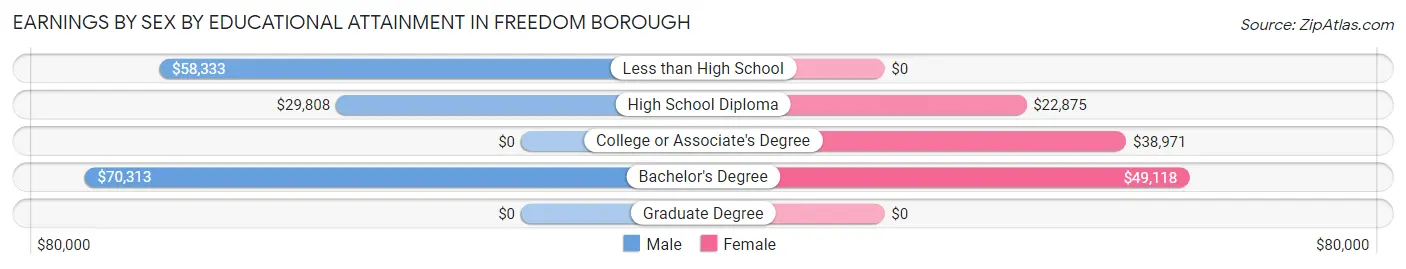
| Educational Attainment | Male Income | Female Income |
| Less than High School | $58,333 | $0 |
| High School Diploma | $29,808 | $22,875 |
| College or Associate's Degree | - | - |
| Bachelor's Degree | $70,313 | $49,118 |
| Graduate Degree | - | - |
| Total | $43,942 | $37,721 |
Family Income in Freedom borough
Family Income Brackets in Freedom borough
According to the Freedom borough family income data, there are 113 families falling into the $75,000 to $99,999 income range, which is the most common income bracket and makes up 25.9% of all families. Conversely, the $200,000+ income bracket is the least frequent group with only 11 families (2.5%) belonging to this category.
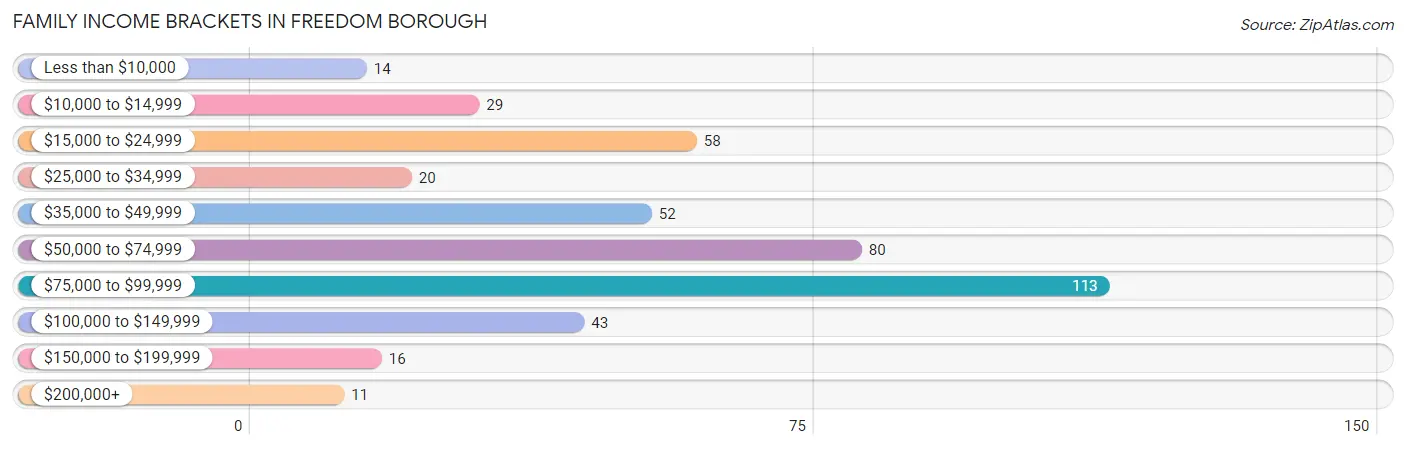
| Income Bracket | # Families | % Families |
| Less than $10,000 | 14 | 3.2% |
| $10,000 to $14,999 | 29 | 6.7% |
| $15,000 to $24,999 | 58 | 13.3% |
| $25,000 to $34,999 | 20 | 4.6% |
| $35,000 to $49,999 | 52 | 11.9% |
| $50,000 to $74,999 | 80 | 18.3% |
| $75,000 to $99,999 | 113 | 25.9% |
| $100,000 to $149,999 | 43 | 9.9% |
| $150,000 to $199,999 | 16 | 3.7% |
| $200,000+ | 11 | 2.5% |
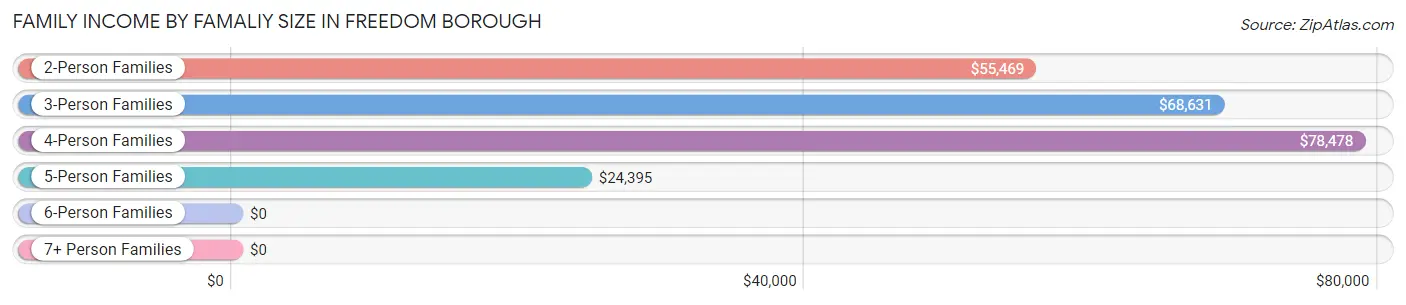
Family Income by Famaliy Size in Freedom borough
4-person families (114 | 26.2%) account for the highest median family income in Freedom borough with $78,478 per family, while 2-person families (171 | 39.2%) have the highest median income of $27,734 per family member.
| Income Bracket | # Families | Median Income |
| 2-Person Families | 171 (39.2%) | $55,469 |
| 3-Person Families | 87 (20.0%) | $68,631 |
| 4-Person Families | 114 (26.2%) | $78,478 |
| 5-Person Families | 47 (10.8%) | $24,395 |
| 6-Person Families | 17 (3.9%) | $0 |
| 7+ Person Families | 0 (0.0%) | $0 |
| Total | 436 (100.0%) | $67,803 |
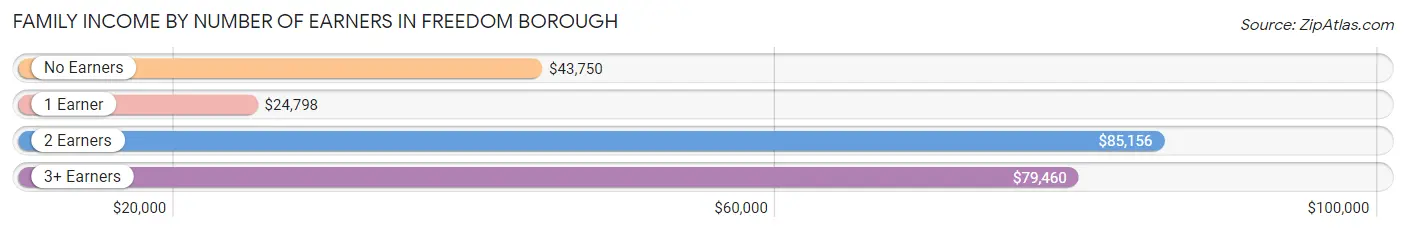
Family Income by Number of Earners in Freedom borough
The median family income in Freedom borough is $67,803, with families comprising 2 earners (152) having the highest median family income of $85,156, while families with 1 earner (145) have the lowest median family income of $24,798, accounting for 34.9% and 33.3% of families, respectively.
| Number of Earners | # Families | Median Income |
| No Earners | 70 (16.1%) | $43,750 |
| 1 Earner | 145 (33.3%) | $24,798 |
| 2 Earners | 152 (34.9%) | $85,156 |
| 3+ Earners | 69 (15.8%) | $79,460 |
| Total | 436 (100.0%) | $67,803 |
Household Income in Freedom borough
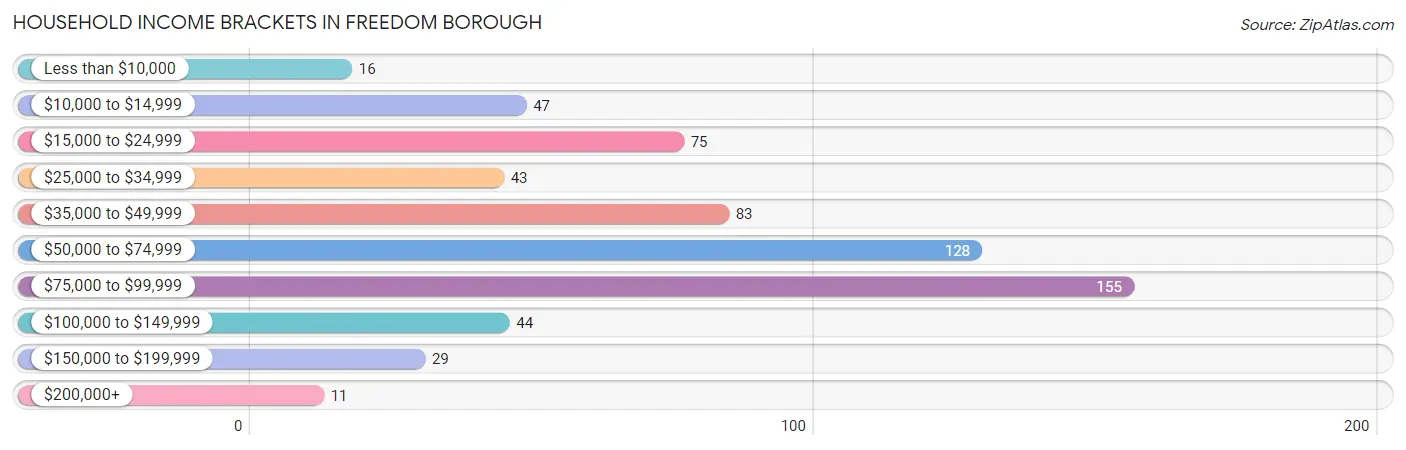
Household Income Brackets in Freedom borough
With 155 households falling in the category, the $75,000 to $99,999 income range is the most frequent in Freedom borough, accounting for 24.6% of all households. In contrast, only 11 households (1.7%) fall into the $200,000+ income bracket, making it the least populous group.
| Income Bracket | # Households | % Households |
| Less than $10,000 | 16 | 2.5% |
| $10,000 to $14,999 | 47 | 7.4% |
| $15,000 to $24,999 | 75 | 11.9% |
| $25,000 to $34,999 | 43 | 6.8% |
| $35,000 to $49,999 | 83 | 13.2% |
| $50,000 to $74,999 | 128 | 20.3% |
| $75,000 to $99,999 | 155 | 24.6% |
| $100,000 to $149,999 | 44 | 7.0% |
| $150,000 to $199,999 | 29 | 4.6% |
| $200,000+ | 11 | 1.7% |
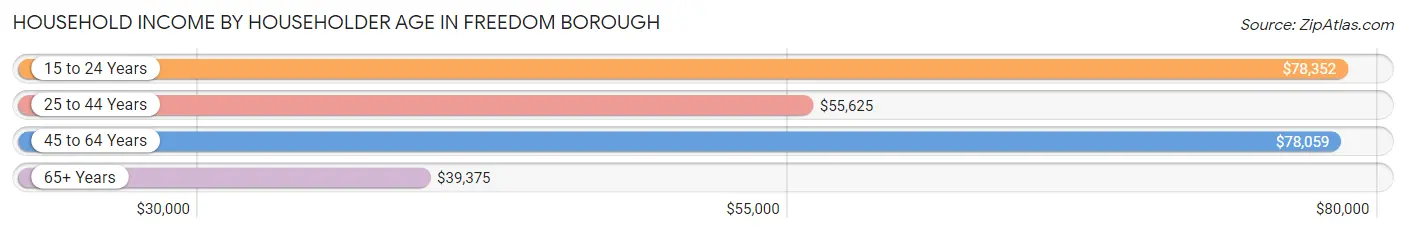
Household Income by Householder Age in Freedom borough
The median household income in Freedom borough is $60,074, with the highest median household income of $78,352 found in the 15 to 24 years age bracket for the primary householder. A total of 84 households (13.3%) fall into this category. Meanwhile, the 65+ years age bracket for the primary householder has the lowest median household income of $39,375, with 130 households (20.6%) in this group.
| Income Bracket | # Households | Median Income |
| 15 to 24 Years | 84 (13.3%) | $78,352 |
| 25 to 44 Years | 210 (33.3%) | $55,625 |
| 45 to 64 Years | 207 (32.8%) | $78,059 |
| 65+ Years | 130 (20.6%) | $39,375 |
| Total | 631 (100.0%) | $60,074 |
Poverty in Freedom borough
Income Below Poverty by Sex and Age in Freedom borough
With 25.5% poverty level for males and 33.9% for females among the residents of Freedom borough, 5 year old males and under 5 year old females are the most vulnerable to poverty, with 22 males (100.0%) and 50 females (100.0%) in their respective age groups living below the poverty level.
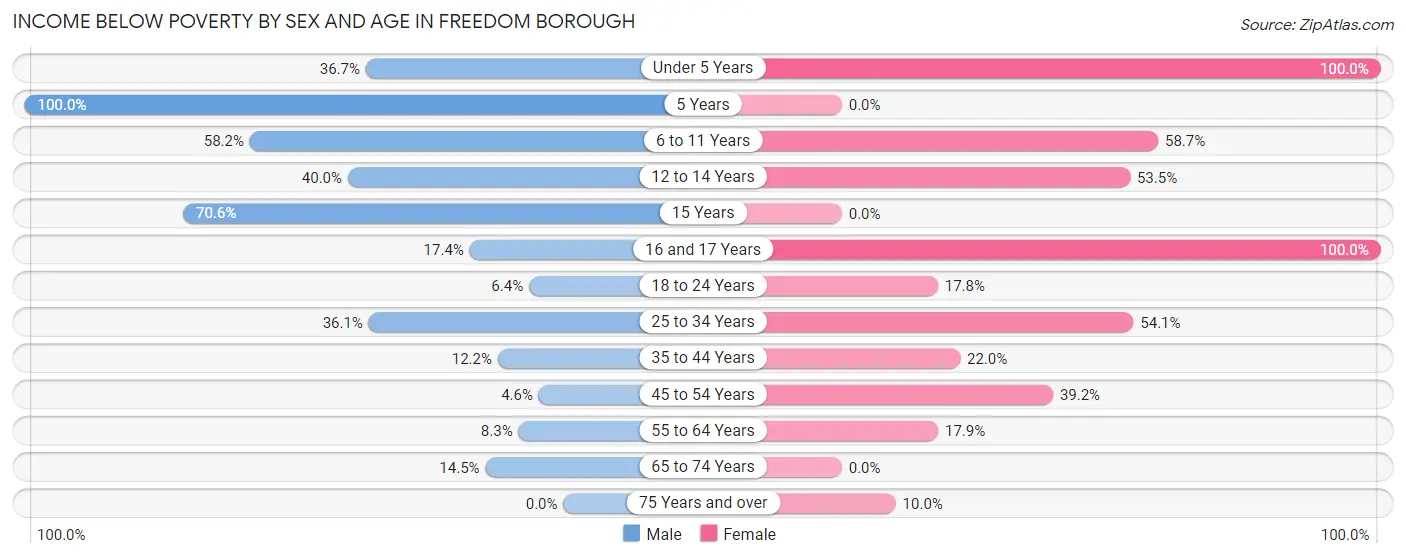
| Age Bracket | Male | Female |
| Under 5 Years | 22 (36.7%) | 50 (100.0%) |
| 5 Years | 22 (100.0%) | 0 (0.0%) |
| 6 to 11 Years | 71 (58.2%) | 27 (58.7%) |
| 12 to 14 Years | 8 (40.0%) | 23 (53.5%) |
| 15 Years | 12 (70.6%) | 0 (0.0%) |
| 16 and 17 Years | 4 (17.4%) | 15 (100.0%) |
| 18 to 24 Years | 9 (6.4%) | 18 (17.8%) |
| 25 to 34 Years | 43 (36.1%) | 46 (54.1%) |
| 35 to 44 Years | 9 (12.2%) | 27 (22.0%) |
| 45 to 54 Years | 3 (4.5%) | 29 (39.2%) |
| 55 to 64 Years | 10 (8.3%) | 15 (17.9%) |
| 65 to 74 Years | 11 (14.5%) | 0 (0.0%) |
| 75 Years and over | 0 (0.0%) | 3 (10.0%) |
| Total | 224 (25.5%) | 253 (33.9%) |
Income Above Poverty by Sex and Age in Freedom borough
According to the poverty statistics in Freedom borough, males aged 75 years and over and females aged 5 years are the age groups that are most secure financially, with 100.0% of males and 100.0% of females in these age groups living above the poverty line.
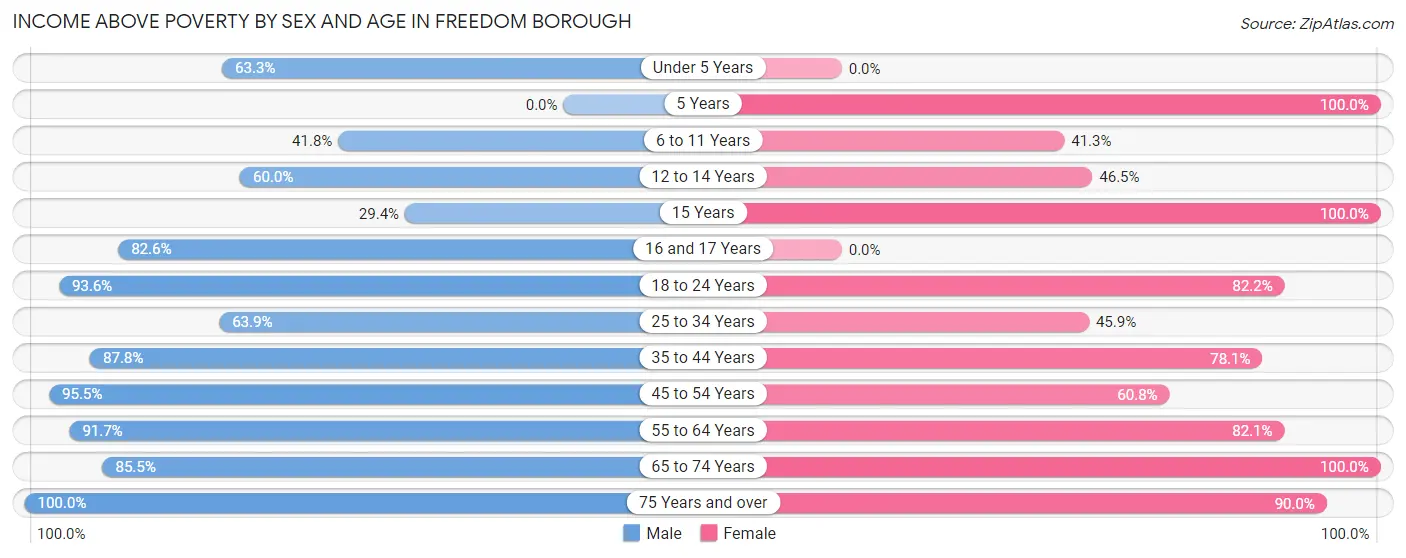
| Age Bracket | Male | Female |
| Under 5 Years | 38 (63.3%) | 0 (0.0%) |
| 5 Years | 0 (0.0%) | 4 (100.0%) |
| 6 to 11 Years | 51 (41.8%) | 19 (41.3%) |
| 12 to 14 Years | 12 (60.0%) | 20 (46.5%) |
| 15 Years | 5 (29.4%) | 9 (100.0%) |
| 16 and 17 Years | 19 (82.6%) | 0 (0.0%) |
| 18 to 24 Years | 132 (93.6%) | 83 (82.2%) |
| 25 to 34 Years | 76 (63.9%) | 39 (45.9%) |
| 35 to 44 Years | 65 (87.8%) | 96 (78.0%) |
| 45 to 54 Years | 63 (95.5%) | 45 (60.8%) |
| 55 to 64 Years | 110 (91.7%) | 69 (82.1%) |
| 65 to 74 Years | 65 (85.5%) | 82 (100.0%) |
| 75 Years and over | 19 (100.0%) | 27 (90.0%) |
| Total | 655 (74.5%) | 493 (66.1%) |
Income Below Poverty Among Married-Couple Families in Freedom borough
The poverty statistics for married-couple families in Freedom borough show that 13.9% or 43 of the total 309 families live below the poverty line. Families with 3 or 4 children have the highest poverty rate of 73.9%, comprising of 34 families. On the other hand, families with no children have the lowest poverty rate of 2.7%, which includes 5 families.
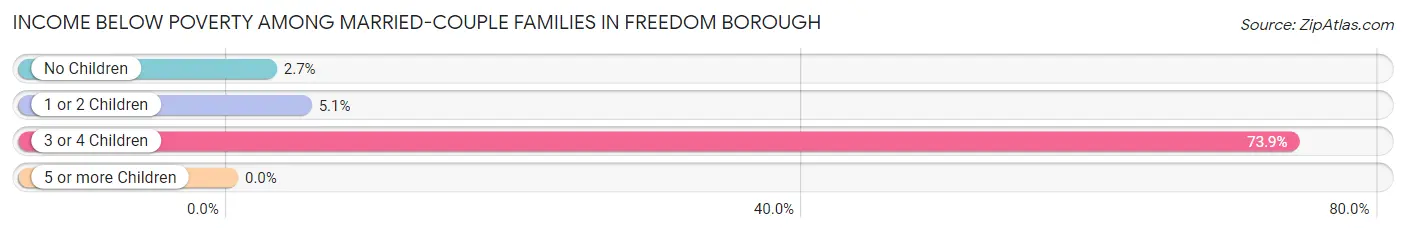
| Children | Above Poverty | Below Poverty |
| No Children | 180 (97.3%) | 5 (2.7%) |
| 1 or 2 Children | 74 (94.9%) | 4 (5.1%) |
| 3 or 4 Children | 12 (26.1%) | 34 (73.9%) |
| 5 or more Children | 0 (0.0%) | 0 (0.0%) |
| Total | 266 (86.1%) | 43 (13.9%) |
Income Below Poverty Among Single-Parent Households in Freedom borough
According to the poverty data in Freedom borough, 22.2% or 8 single-father households and 64.8% or 59 single-mother households are living below the poverty line. Among single-father households, those with 3 or 4 children have the highest poverty rate, with 8 households (100.0%) experiencing poverty. Likewise, among single-mother households, those with 3 or 4 children have the highest poverty rate, with 24 households (100.0%) falling below the poverty line.
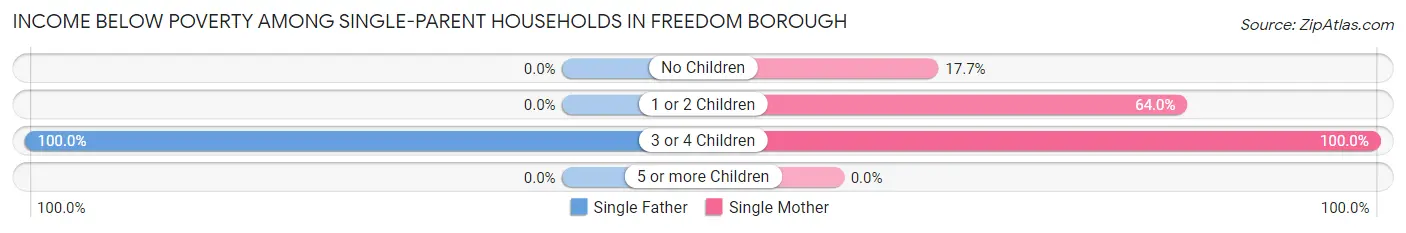
| Children | Single Father | Single Mother |
| No Children | 0 (0.0%) | 3 (17.6%) |
| 1 or 2 Children | 0 (0.0%) | 32 (64.0%) |
| 3 or 4 Children | 8 (100.0%) | 24 (100.0%) |
| 5 or more Children | 0 (0.0%) | 0 (0.0%) |
| Total | 8 (22.2%) | 59 (64.8%) |
Income Below Poverty Among Married-Couple vs Single-Parent Households in Freedom borough
The poverty data for Freedom borough shows that 43 of the married-couple family households (13.9%) and 67 of the single-parent households (52.8%) are living below the poverty level. Within the married-couple family households, those with 3 or 4 children have the highest poverty rate, with 34 households (73.9%) falling below the poverty line. Among the single-parent households, those with 3 or 4 children have the highest poverty rate, with 32 household (100.0%) living below poverty.
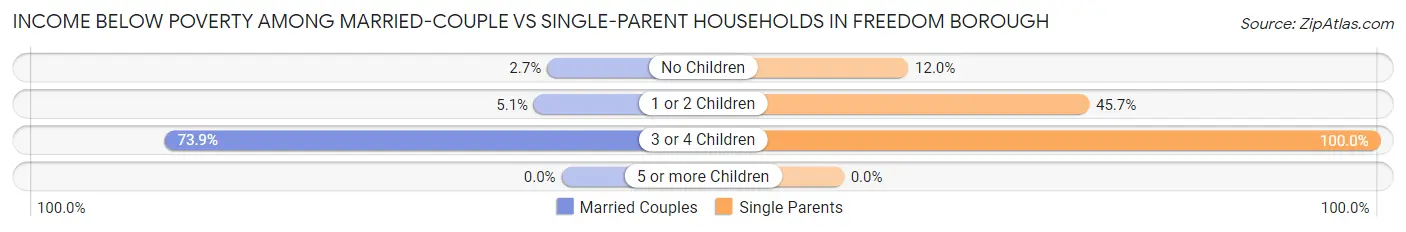
| Children | Married-Couple Families | Single-Parent Households |
| No Children | 5 (2.7%) | 3 (12.0%) |
| 1 or 2 Children | 4 (5.1%) | 32 (45.7%) |
| 3 or 4 Children | 34 (73.9%) | 32 (100.0%) |
| 5 or more Children | 0 (0.0%) | 0 (0.0%) |
| Total | 43 (13.9%) | 67 (52.8%) |
Race in Freedom borough
The most populous races in Freedom borough are White / Caucasian (1,486 | 91.4%), Two or more Races (109 | 6.7%), and Hispanic or Latino (63 | 3.9%).
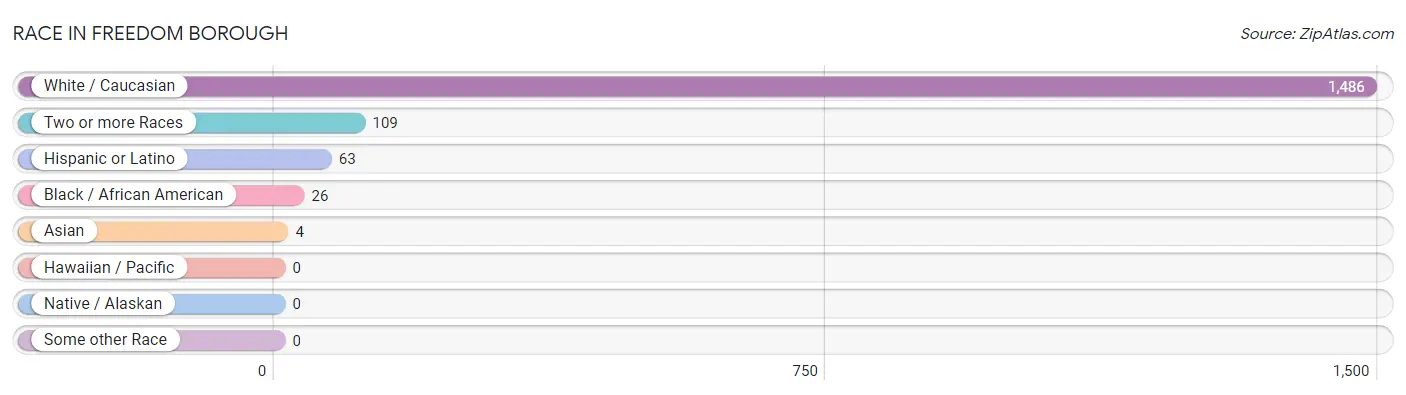
| Race | # Population | % Population |
| Asian | 4 | 0.3% |
| Black / African American | 26 | 1.6% |
| Hawaiian / Pacific | 0 | 0.0% |
| Hispanic or Latino | 63 | 3.9% |
| Native / Alaskan | 0 | 0.0% |
| White / Caucasian | 1,486 | 91.4% |
| Two or more Races | 109 | 6.7% |
| Some other Race | 0 | 0.0% |
| Total | 1,625 | 100.0% |
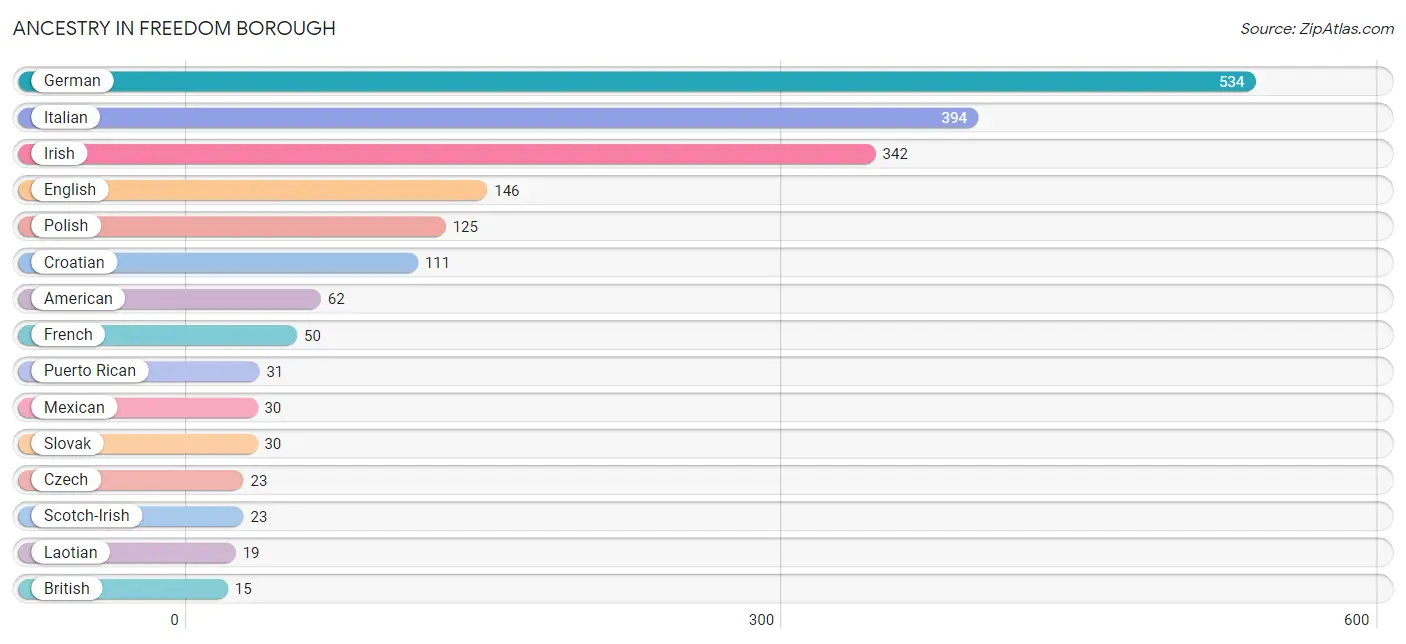
Ancestry in Freedom borough
The most populous ancestries reported in Freedom borough are German (534 | 32.9%), Italian (394 | 24.2%), Irish (342 | 21.0%), English (146 | 9.0%), and Polish (125 | 7.7%), together accounting for 94.8% of all Freedom borough residents.
| Ancestry | # Population | % Population |
| American | 62 | 3.8% |
| Australian | 8 | 0.5% |
| British | 15 | 0.9% |
| Cherokee | 1 | 0.1% |
| Colombian | 2 | 0.1% |
| Croatian | 111 | 6.8% |
| Czech | 23 | 1.4% |
| Dutch | 4 | 0.3% |
| Eastern European | 2 | 0.1% |
| English | 146 | 9.0% |
| European | 15 | 0.9% |
| French | 50 | 3.1% |
| German | 534 | 32.9% |
| Greek | 2 | 0.1% |
| Hungarian | 7 | 0.4% |
| Irish | 342 | 21.0% |
| Italian | 394 | 24.2% |
| Laotian | 19 | 1.2% |
| Mexican | 30 | 1.8% |
| Polish | 125 | 7.7% |
| Puerto Rican | 31 | 1.9% |
| Scotch-Irish | 23 | 1.4% |
| Scottish | 4 | 0.3% |
| Slovak | 30 | 1.8% |
| South American | 2 | 0.1% |
| Swedish | 3 | 0.2% |
| Ukrainian | 15 | 0.9% |
| Welsh | 13 | 0.8% |
| Yugoslavian | 11 | 0.7% | View All 29 Rows |
Immigrants in Freedom borough
The most numerous immigrant groups reported in Freedom borough came from Asia (4 | 0.3%), Indonesia (4 | 0.3%), and South Eastern Asia (4 | 0.3%), together accounting for 0.7% of all Freedom borough residents.
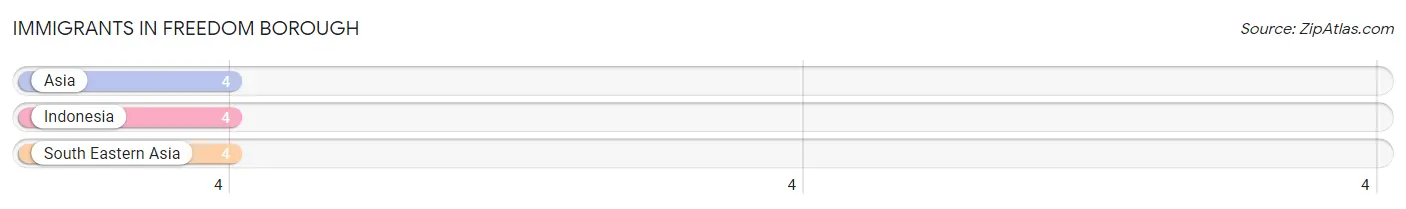
| Immigration Origin | # Population | % Population |
| Asia | 4 | 0.3% |
| Indonesia | 4 | 0.3% |
| South Eastern Asia | 4 | 0.3% | View All 3 Rows |
Sex and Age in Freedom borough
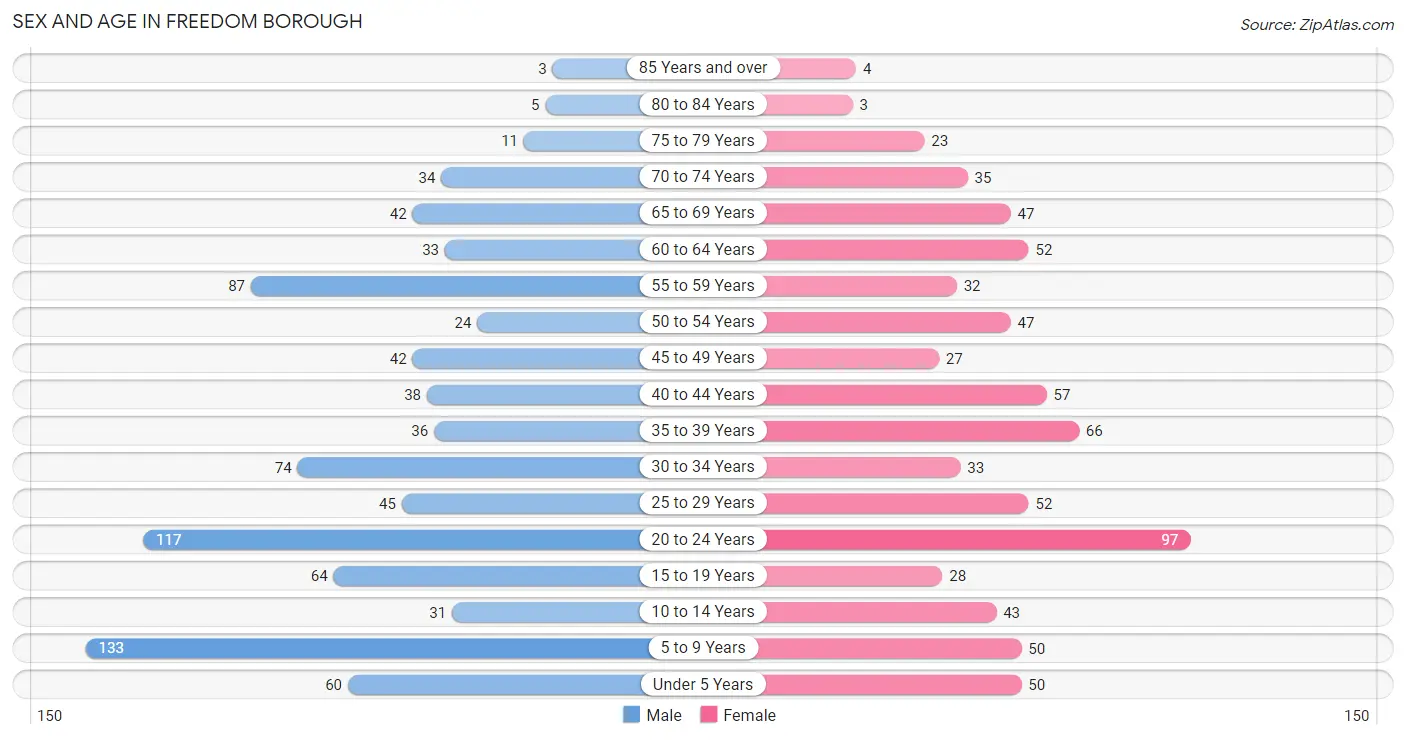
Sex and Age in Freedom borough
The most populous age groups in Freedom borough are 5 to 9 Years (133 | 15.1%) for men and 20 to 24 Years (97 | 13.0%) for women.
| Age Bracket | Male | Female |
| Under 5 Years | 60 (6.8%) | 50 (6.7%) |
| 5 to 9 Years | 133 (15.1%) | 50 (6.7%) |
| 10 to 14 Years | 31 (3.5%) | 43 (5.8%) |
| 15 to 19 Years | 64 (7.3%) | 28 (3.7%) |
| 20 to 24 Years | 117 (13.3%) | 97 (13.0%) |
| 25 to 29 Years | 45 (5.1%) | 52 (7.0%) |
| 30 to 34 Years | 74 (8.4%) | 33 (4.4%) |
| 35 to 39 Years | 36 (4.1%) | 66 (8.8%) |
| 40 to 44 Years | 38 (4.3%) | 57 (7.6%) |
| 45 to 49 Years | 42 (4.8%) | 27 (3.6%) |
| 50 to 54 Years | 24 (2.7%) | 47 (6.3%) |
| 55 to 59 Years | 87 (9.9%) | 32 (4.3%) |
| 60 to 64 Years | 33 (3.7%) | 52 (7.0%) |
| 65 to 69 Years | 42 (4.8%) | 47 (6.3%) |
| 70 to 74 Years | 34 (3.9%) | 35 (4.7%) |
| 75 to 79 Years | 11 (1.3%) | 23 (3.1%) |
| 80 to 84 Years | 5 (0.6%) | 3 (0.4%) |
| 85 Years and over | 3 (0.3%) | 4 (0.5%) |
| Total | 879 (100.0%) | 746 (100.0%) |
Families and Households in Freedom borough
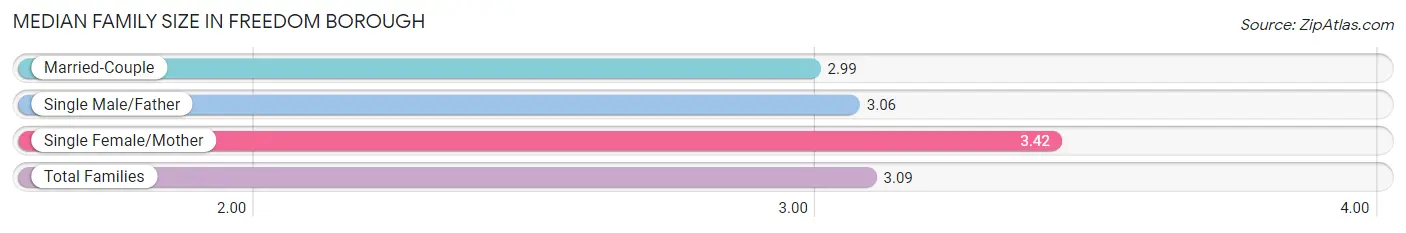
Median Family Size in Freedom borough
The median family size in Freedom borough is 3.09 persons per family, with single female/mother families (91 | 20.9%) accounting for the largest median family size of 3.42 persons per family. On the other hand, married-couple families (309 | 70.9%) represent the smallest median family size with 2.99 persons per family.
| Family Type | # Families | Family Size |
| Married-Couple | 309 (70.9%) | 2.99 |
| Single Male/Father | 36 (8.3%) | 3.06 |
| Single Female/Mother | 91 (20.9%) | 3.42 |
| Total Families | 436 (100.0%) | 3.09 |
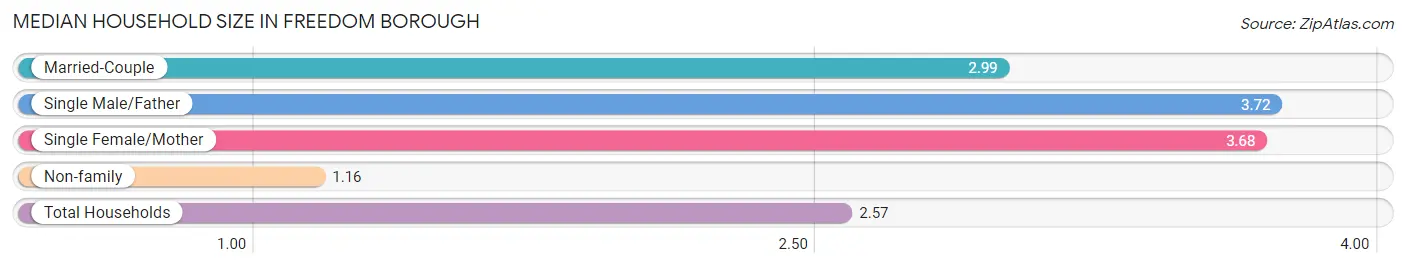
Median Household Size in Freedom borough
The median household size in Freedom borough is 2.57 persons per household, with single male/father households (36 | 5.7%) accounting for the largest median household size of 3.72 persons per household. non-family households (195 | 30.9%) represent the smallest median household size with 1.16 persons per household.
| Household Type | # Households | Household Size |
| Married-Couple | 309 (49.0%) | 2.99 |
| Single Male/Father | 36 (5.7%) | 3.72 |
| Single Female/Mother | 91 (14.4%) | 3.68 |
| Non-family | 195 (30.9%) | 1.16 |
| Total Households | 631 (100.0%) | 2.57 |
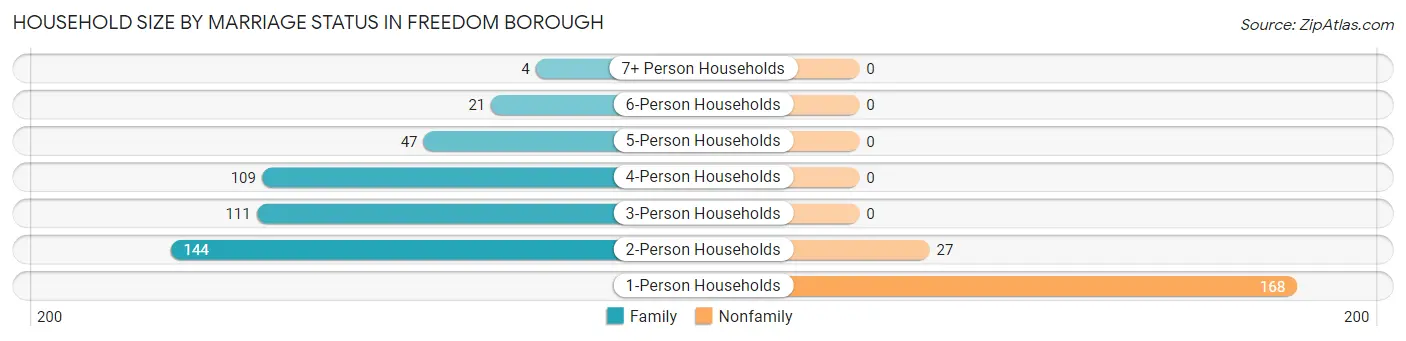
Household Size by Marriage Status in Freedom borough
Out of a total of 631 households in Freedom borough, 436 (69.1%) are family households, while 195 (30.9%) are nonfamily households. The most numerous type of family households are 2-person households, comprising 144, and the most common type of nonfamily households are 1-person households, comprising 168.
| Household Size | Family Households | Nonfamily Households |
| 1-Person Households | - | 168 (26.6%) |
| 2-Person Households | 144 (22.8%) | 27 (4.3%) |
| 3-Person Households | 111 (17.6%) | 0 (0.0%) |
| 4-Person Households | 109 (17.3%) | 0 (0.0%) |
| 5-Person Households | 47 (7.4%) | 0 (0.0%) |
| 6-Person Households | 21 (3.3%) | 0 (0.0%) |
| 7+ Person Households | 4 (0.6%) | 0 (0.0%) |
| Total | 436 (69.1%) | 195 (30.9%) |
Female Fertility in Freedom borough
Fertility by Age in Freedom borough
Average fertility rate in Freedom borough is 19.0 births per 1,000 women. Women in the age bracket of 20 to 34 years have the highest fertility rate with 38.0 births per 1,000 women. Women in the age bracket of 20 to 34 years acount for 100.0% of all women with births.
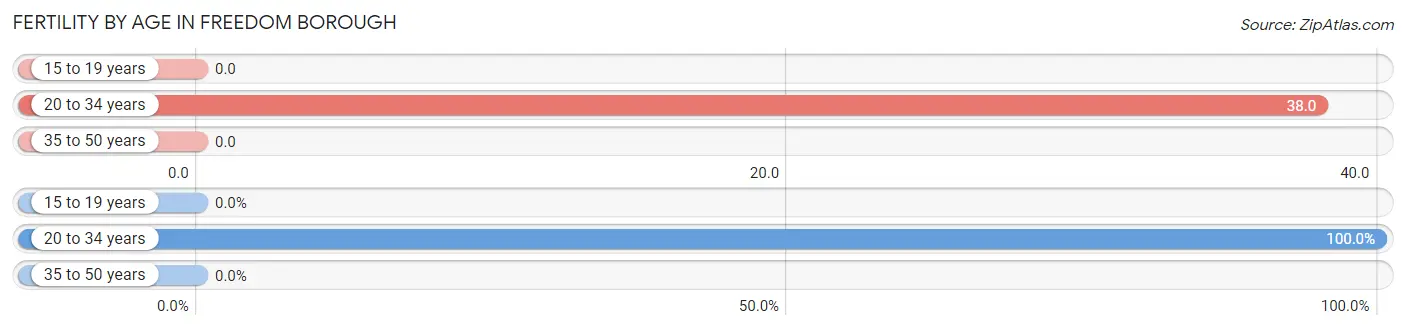
| Age Bracket | Women with Births | Births / 1,000 Women |
| 15 to 19 years | 0 (0.0%) | 0.0 |
| 20 to 34 years | 7 (100.0%) | 38.0 |
| 35 to 50 years | 0 (0.0%) | 0.0 |
| Total | 7 (100.0%) | 19.0 |
Fertility by Age by Marriage Status in Freedom borough
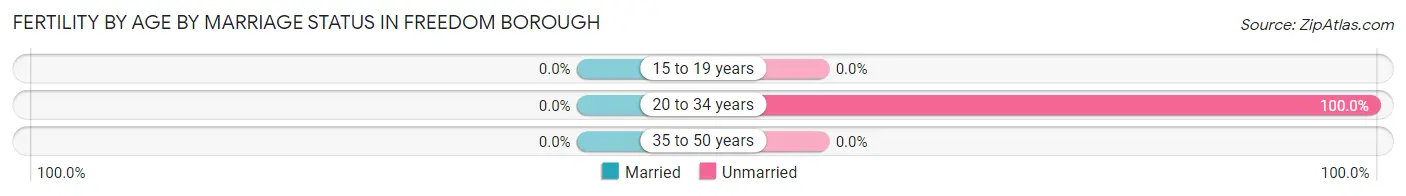
| Age Bracket | Married | Unmarried |
| 15 to 19 years | 0 (0.0%) | 0 (0.0%) |
| 20 to 34 years | 0 (0.0%) | 7 (100.0%) |
| 35 to 50 years | 0 (0.0%) | 0 (0.0%) |
| Total | 0 (0.0%) | 7 (100.0%) |
Fertility by Education in Freedom borough
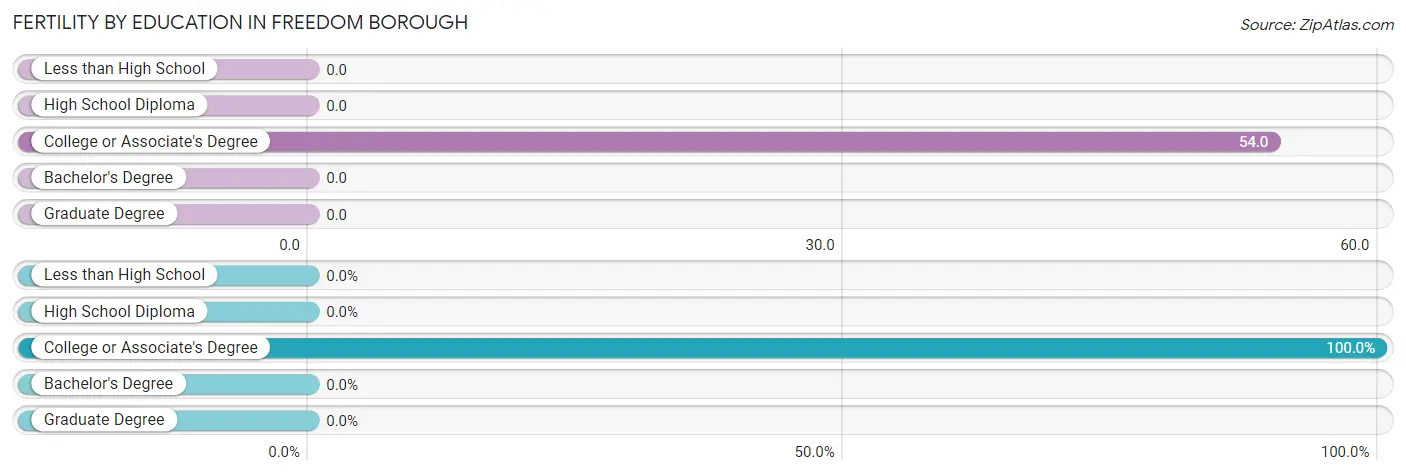
| Educational Attainment | Women with Births | Births / 1,000 Women |
| Less than High School | 0 (0.0%) | 0.0 |
| High School Diploma | 0 (0.0%) | 0.0 |
| College or Associate's Degree | 7 (100.0%) | 54.0 |
| Bachelor's Degree | 0 (0.0%) | 0.0 |
| Graduate Degree | 0 (0.0%) | 0.0 |
| Total | 7 (100.0%) | 19.0 |
Fertility by Education by Marriage Status in Freedom borough
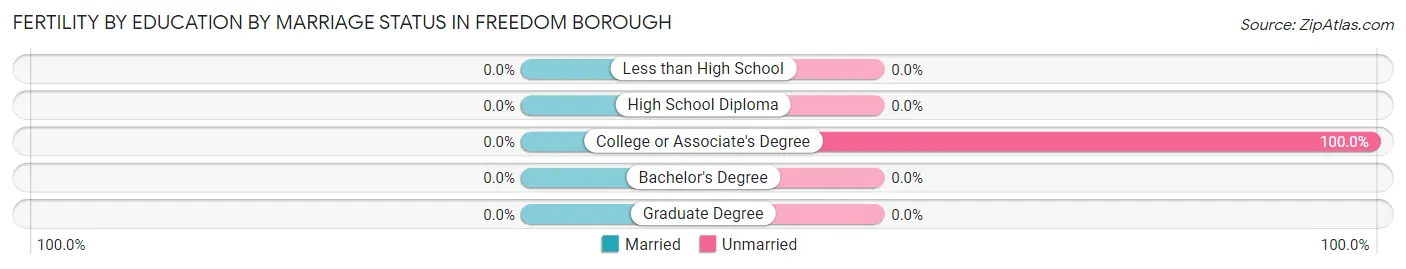
| Educational Attainment | Married | Unmarried |
| Less than High School | 0 (0.0%) | 0 (0.0%) |
| High School Diploma | 0 (0.0%) | 0 (0.0%) |
| College or Associate's Degree | 0 (0.0%) | 7 (100.0%) |
| Bachelor's Degree | 0 (0.0%) | 0 (0.0%) |
| Graduate Degree | 0 (0.0%) | 0 (0.0%) |
| Total | 0 (0.0%) | 7 (100.0%) |
Employment Characteristics in Freedom borough
Employment by Class of Employer in Freedom borough
Among the 780 employed individuals in Freedom borough, private company employees (663 | 85.0%), not-for-profit organizations (50 | 6.4%), and self-employed (incorporated) (19 | 2.4%) make up the most common classes of employment.
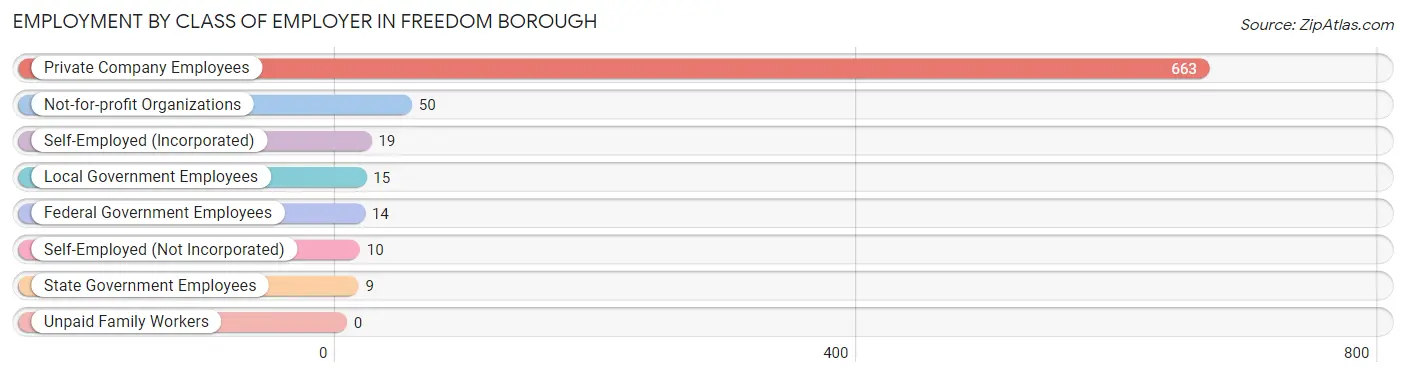
| Employer Class | # Employees | % Employees |
| Private Company Employees | 663 | 85.0% |
| Self-Employed (Incorporated) | 19 | 2.4% |
| Self-Employed (Not Incorporated) | 10 | 1.3% |
| Not-for-profit Organizations | 50 | 6.4% |
| Local Government Employees | 15 | 1.9% |
| State Government Employees | 9 | 1.1% |
| Federal Government Employees | 14 | 1.8% |
| Unpaid Family Workers | 0 | 0.0% |
| Total | 780 | 100.0% |
Employment Status by Age in Freedom borough
According to the labor force statistics for Freedom borough, out of the total population over 16 years of age (1,232), 68.0% or 838 individuals are in the labor force, with 4.4% or 37 of them unemployed. The age group with the highest labor force participation rate is 55 to 59 years, with 91.6% or 109 individuals in the labor force. Within the labor force, the 25 to 29 years age range has the highest percentage of unemployed individuals, with 13.5% or 10 of them being unemployed.
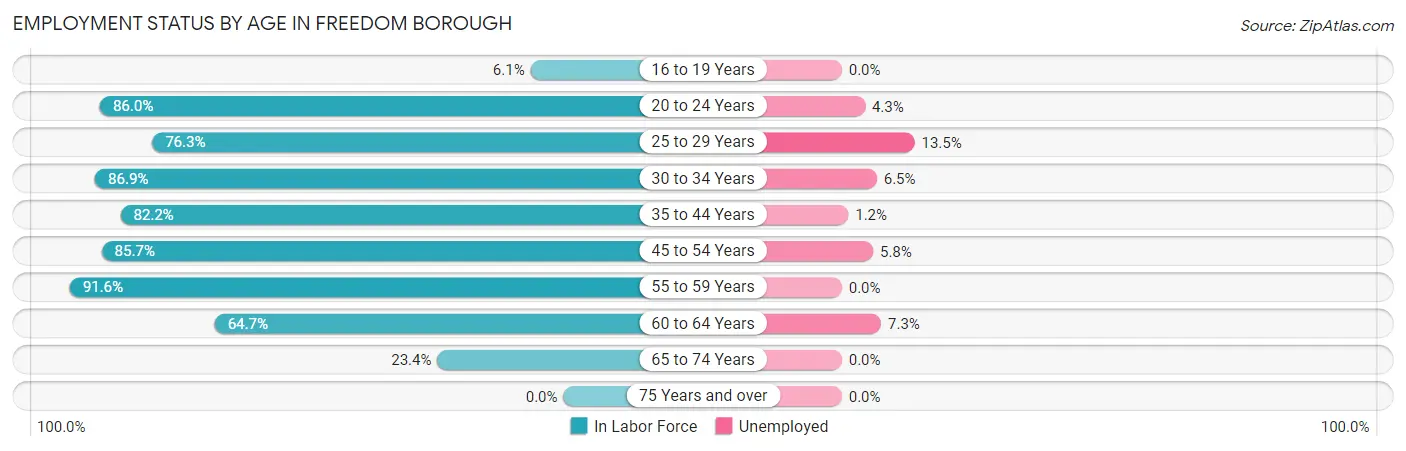
| Age Bracket | In Labor Force | Unemployed |
| 16 to 19 Years | 4 (6.1%) | 0 (0.0%) |
| 20 to 24 Years | 184 (86.0%) | 8 (4.3%) |
| 25 to 29 Years | 74 (76.3%) | 10 (13.5%) |
| 30 to 34 Years | 93 (86.9%) | 6 (6.5%) |
| 35 to 44 Years | 162 (82.2%) | 2 (1.2%) |
| 45 to 54 Years | 120 (85.7%) | 7 (5.8%) |
| 55 to 59 Years | 109 (91.6%) | 0 (0.0%) |
| 60 to 64 Years | 55 (64.7%) | 4 (7.3%) |
| 65 to 74 Years | 37 (23.4%) | 0 (0.0%) |
| 75 Years and over | 0 (0.0%) | 0 (0.0%) |
| Total | 838 (68.0%) | 37 (4.4%) |
Employment Status by Educational Attainment in Freedom borough
According to labor force statistics for Freedom borough, 82.3% of individuals (613) out of the total population between 25 and 64 years of age (745) are in the labor force, with 4.7% or 29 of them being unemployed. The group with the highest labor force participation rate are those with the educational attainment of bachelor's degree or higher, with 96.6% or 113 individuals in the labor force. Within the labor force, individuals with high school diploma education have the highest percentage of unemployment, with 8.4% or 22 of them being unemployed.
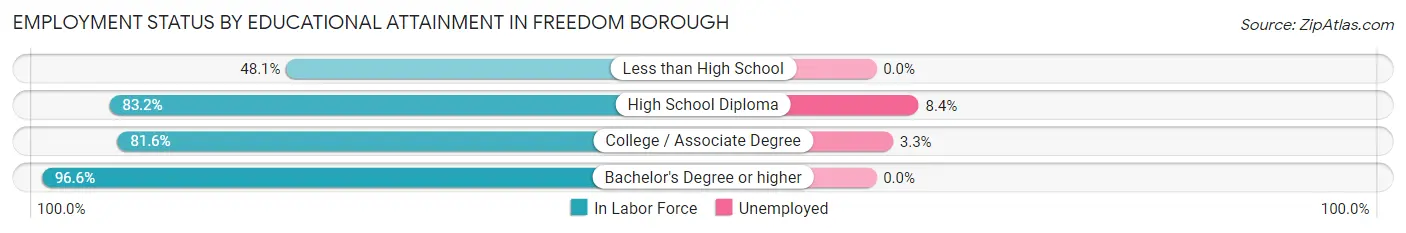
| Educational Attainment | In Labor Force | Unemployed |
| Less than High School | 25 (48.1%) | 0 (0.0%) |
| High School Diploma | 262 (83.2%) | 26 (8.4%) |
| College / Associate Degree | 213 (81.6%) | 9 (3.3%) |
| Bachelor's Degree or higher | 113 (96.6%) | 0 (0.0%) |
| Total | 613 (82.3%) | 35 (4.7%) |
Employment Occupations by Sex in Freedom borough
Management, Business, Science and Arts Occupations
The most common Management, Business, Science and Arts occupations in Freedom borough are Management (69 | 8.6%), Community & Social Service (46 | 5.7%), Business & Financial (37 | 4.6%), Health Diagnosing & Treating (36 | 4.5%), and Computers, Engineering & Science (27 | 3.4%).
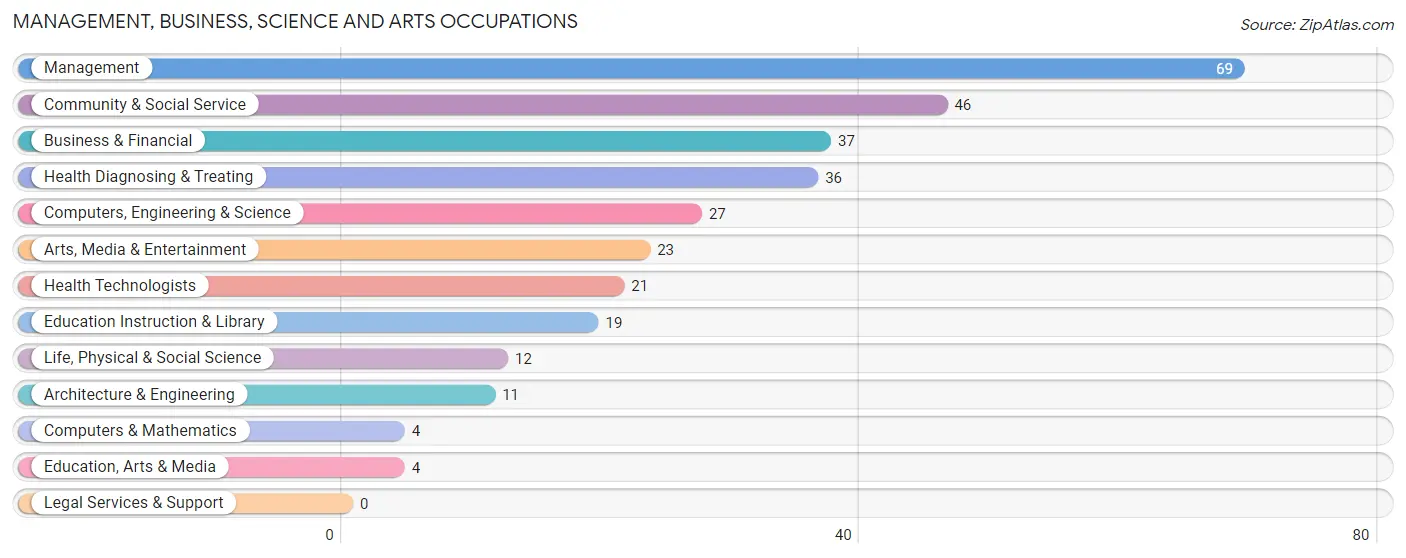
Management, Business, Science and Arts Occupations by Sex
Within the Management, Business, Science and Arts occupations in Freedom borough, the most male-oriented occupations are Computers & Mathematics (100.0%), Architecture & Engineering (100.0%), and Education, Arts & Media (100.0%), while the most female-oriented occupations are Life, Physical & Social Science (100.0%), Education Instruction & Library (100.0%), and Health Diagnosing & Treating (100.0%).
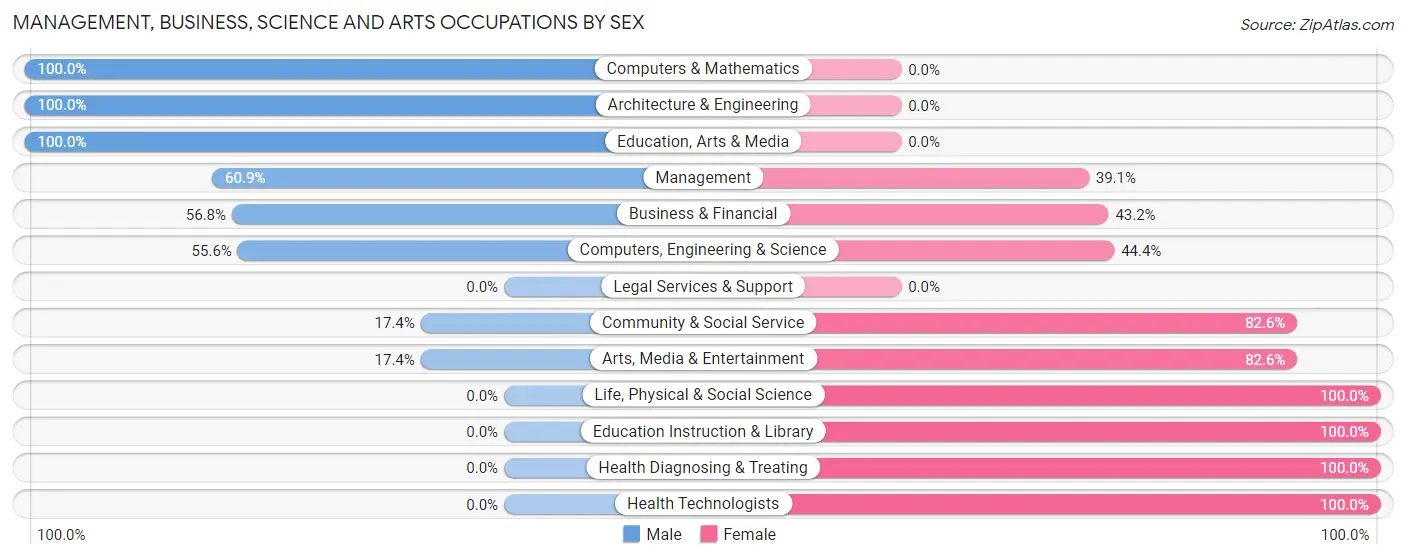
| Occupation | Male | Female |
| Management | 42 (60.9%) | 27 (39.1%) |
| Business & Financial | 21 (56.8%) | 16 (43.2%) |
| Computers, Engineering & Science | 15 (55.6%) | 12 (44.4%) |
| Computers & Mathematics | 4 (100.0%) | 0 (0.0%) |
| Architecture & Engineering | 11 (100.0%) | 0 (0.0%) |
| Life, Physical & Social Science | 0 (0.0%) | 12 (100.0%) |
| Community & Social Service | 8 (17.4%) | 38 (82.6%) |
| Education, Arts & Media | 4 (100.0%) | 0 (0.0%) |
| Legal Services & Support | 0 (0.0%) | 0 (0.0%) |
| Education Instruction & Library | 0 (0.0%) | 19 (100.0%) |
| Arts, Media & Entertainment | 4 (17.4%) | 19 (82.6%) |
| Health Diagnosing & Treating | 0 (0.0%) | 36 (100.0%) |
| Health Technologists | 0 (0.0%) | 21 (100.0%) |
| Total (Category) | 86 (40.0%) | 129 (60.0%) |
| Total (Overall) | 435 (54.3%) | 366 (45.7%) |
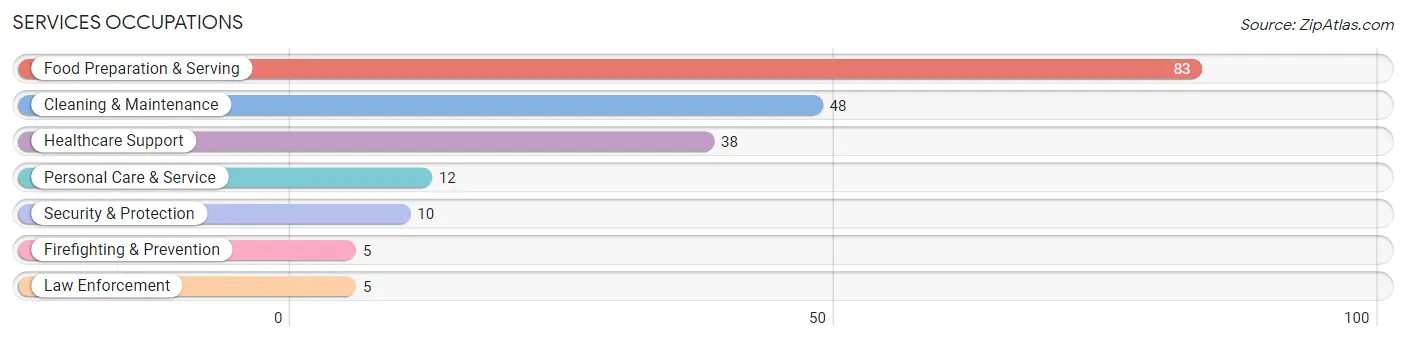
Services Occupations
The most common Services occupations in Freedom borough are Food Preparation & Serving (83 | 10.4%), Cleaning & Maintenance (48 | 6.0%), Healthcare Support (38 | 4.7%), Personal Care & Service (12 | 1.5%), and Security & Protection (10 | 1.3%).
Services Occupations by Sex
Within the Services occupations in Freedom borough, the most male-oriented occupations are Law Enforcement (100.0%), Cleaning & Maintenance (60.4%), and Security & Protection (50.0%), while the most female-oriented occupations are Firefighting & Prevention (100.0%), Food Preparation & Serving (90.4%), and Healthcare Support (81.6%).
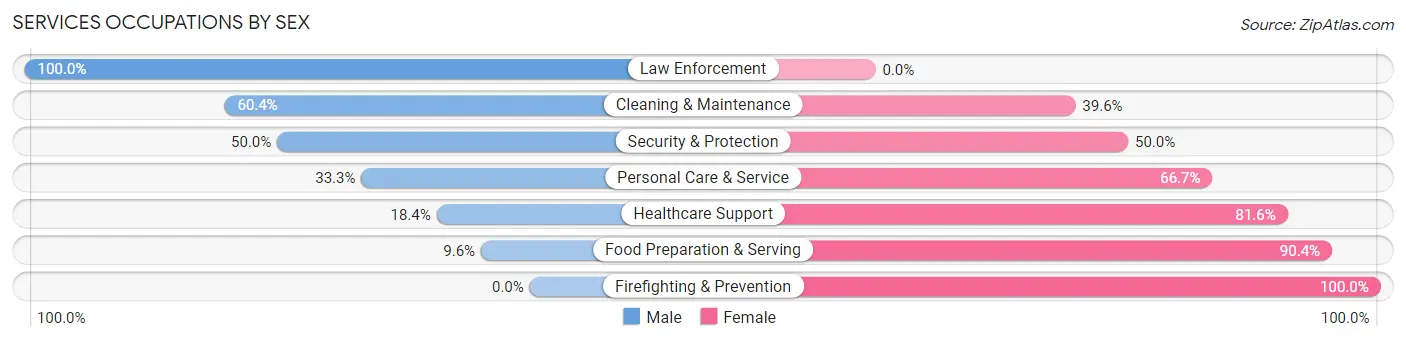
| Occupation | Male | Female |
| Healthcare Support | 7 (18.4%) | 31 (81.6%) |
| Security & Protection | 5 (50.0%) | 5 (50.0%) |
| Firefighting & Prevention | 0 (0.0%) | 5 (100.0%) |
| Law Enforcement | 5 (100.0%) | 0 (0.0%) |
| Food Preparation & Serving | 8 (9.6%) | 75 (90.4%) |
| Cleaning & Maintenance | 29 (60.4%) | 19 (39.6%) |
| Personal Care & Service | 4 (33.3%) | 8 (66.7%) |
| Total (Category) | 53 (27.8%) | 138 (72.3%) |
| Total (Overall) | 435 (54.3%) | 366 (45.7%) |
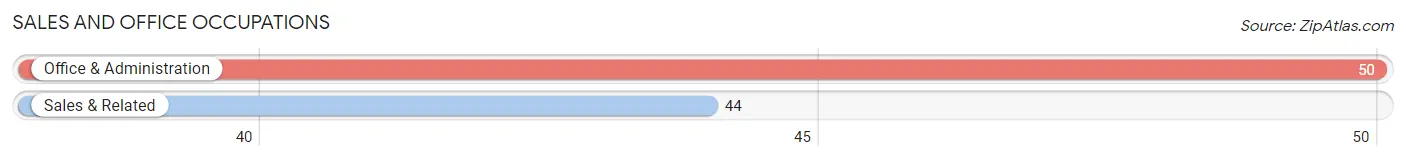
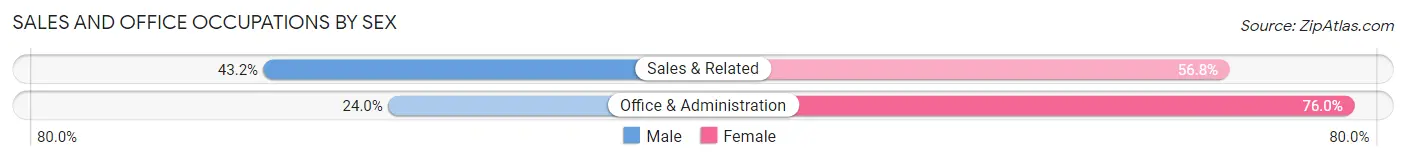
Sales and Office Occupations
The most common Sales and Office occupations in Freedom borough are Office & Administration (50 | 6.2%), and Sales & Related (44 | 5.5%).
Sales and Office Occupations by Sex
| Occupation | Male | Female |
| Sales & Related | 19 (43.2%) | 25 (56.8%) |
| Office & Administration | 12 (24.0%) | 38 (76.0%) |
| Total (Category) | 31 (33.0%) | 63 (67.0%) |
| Total (Overall) | 435 (54.3%) | 366 (45.7%) |
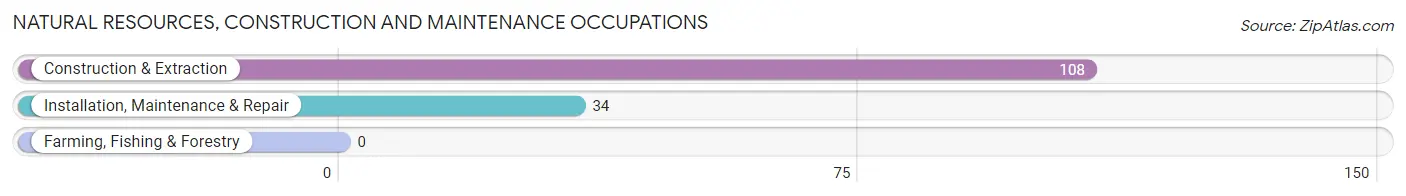
Natural Resources, Construction and Maintenance Occupations
The most common Natural Resources, Construction and Maintenance occupations in Freedom borough are Construction & Extraction (108 | 13.5%), and Installation, Maintenance & Repair (34 | 4.2%).
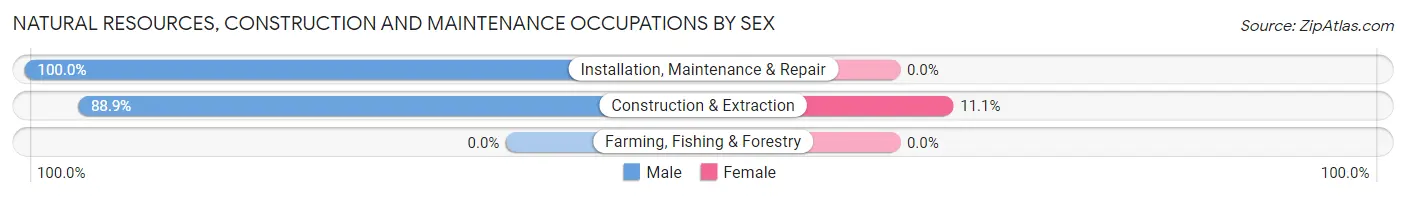
Natural Resources, Construction and Maintenance Occupations by Sex
| Occupation | Male | Female |
| Farming, Fishing & Forestry | 0 (0.0%) | 0 (0.0%) |
| Construction & Extraction | 96 (88.9%) | 12 (11.1%) |
| Installation, Maintenance & Repair | 34 (100.0%) | 0 (0.0%) |
| Total (Category) | 130 (91.5%) | 12 (8.5%) |
| Total (Overall) | 435 (54.3%) | 366 (45.7%) |
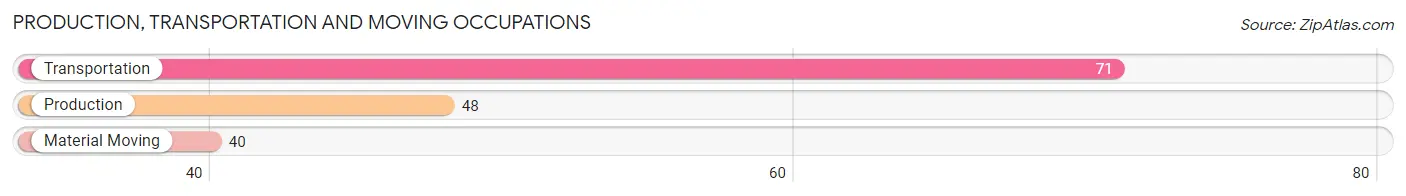
Production, Transportation and Moving Occupations
The most common Production, Transportation and Moving occupations in Freedom borough are Transportation (71 | 8.9%), Production (48 | 6.0%), and Material Moving (40 | 5.0%).
Production, Transportation and Moving Occupations by Sex
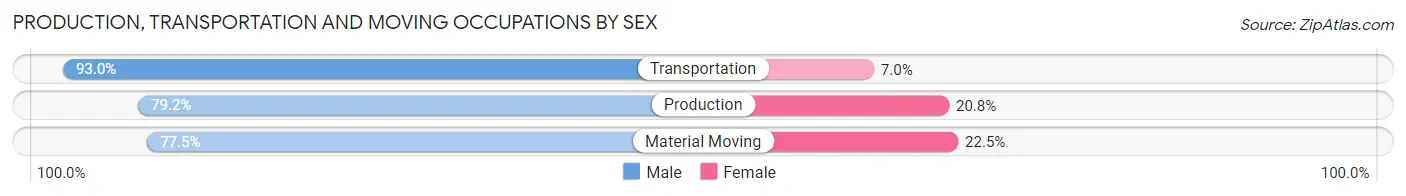
| Occupation | Male | Female |
| Production | 38 (79.2%) | 10 (20.8%) |
| Transportation | 66 (93.0%) | 5 (7.0%) |
| Material Moving | 31 (77.5%) | 9 (22.5%) |
| Total (Category) | 135 (84.9%) | 24 (15.1%) |
| Total (Overall) | 435 (54.3%) | 366 (45.7%) |
Employment Industries by Sex in Freedom borough
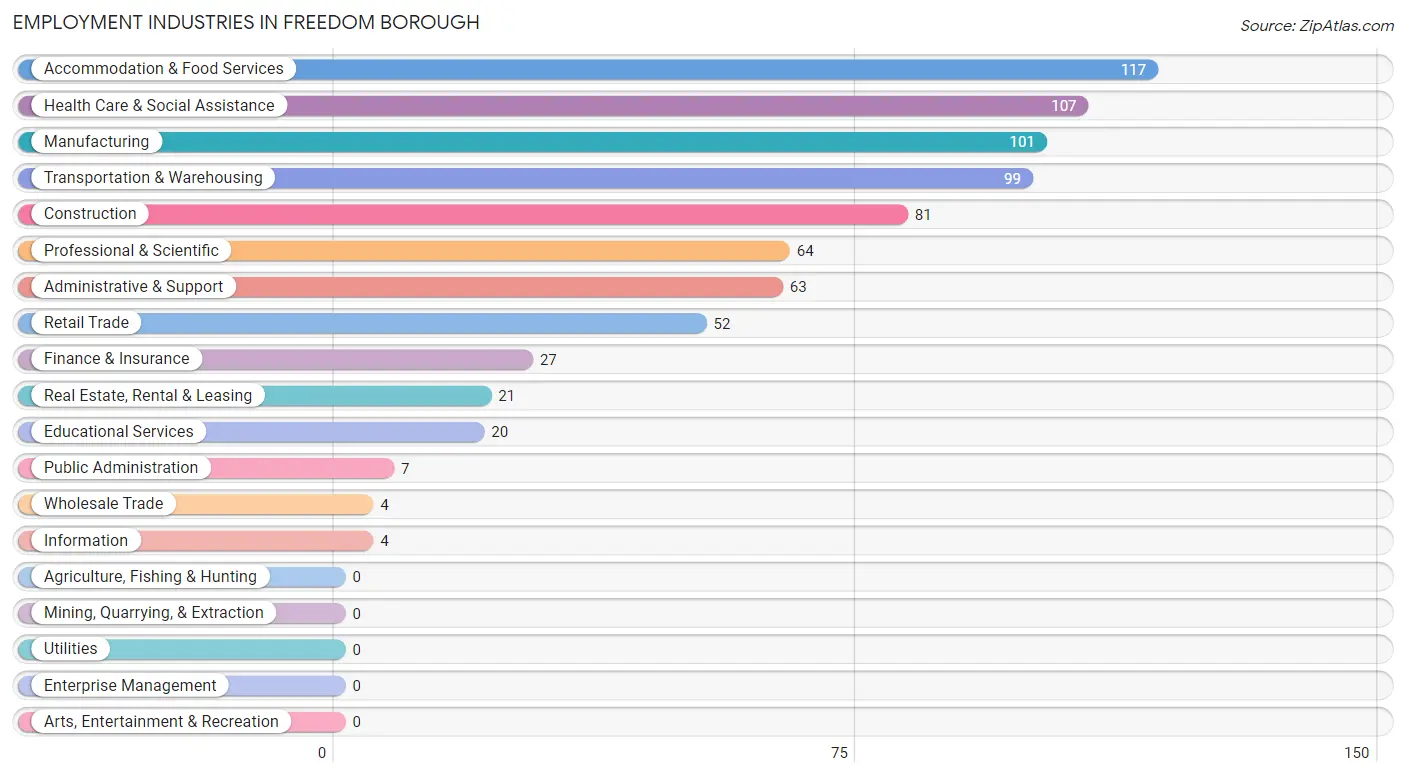
Employment Industries in Freedom borough
The major employment industries in Freedom borough include Accommodation & Food Services (117 | 14.6%), Health Care & Social Assistance (107 | 13.4%), Manufacturing (101 | 12.6%), Transportation & Warehousing (99 | 12.4%), and Construction (81 | 10.1%).
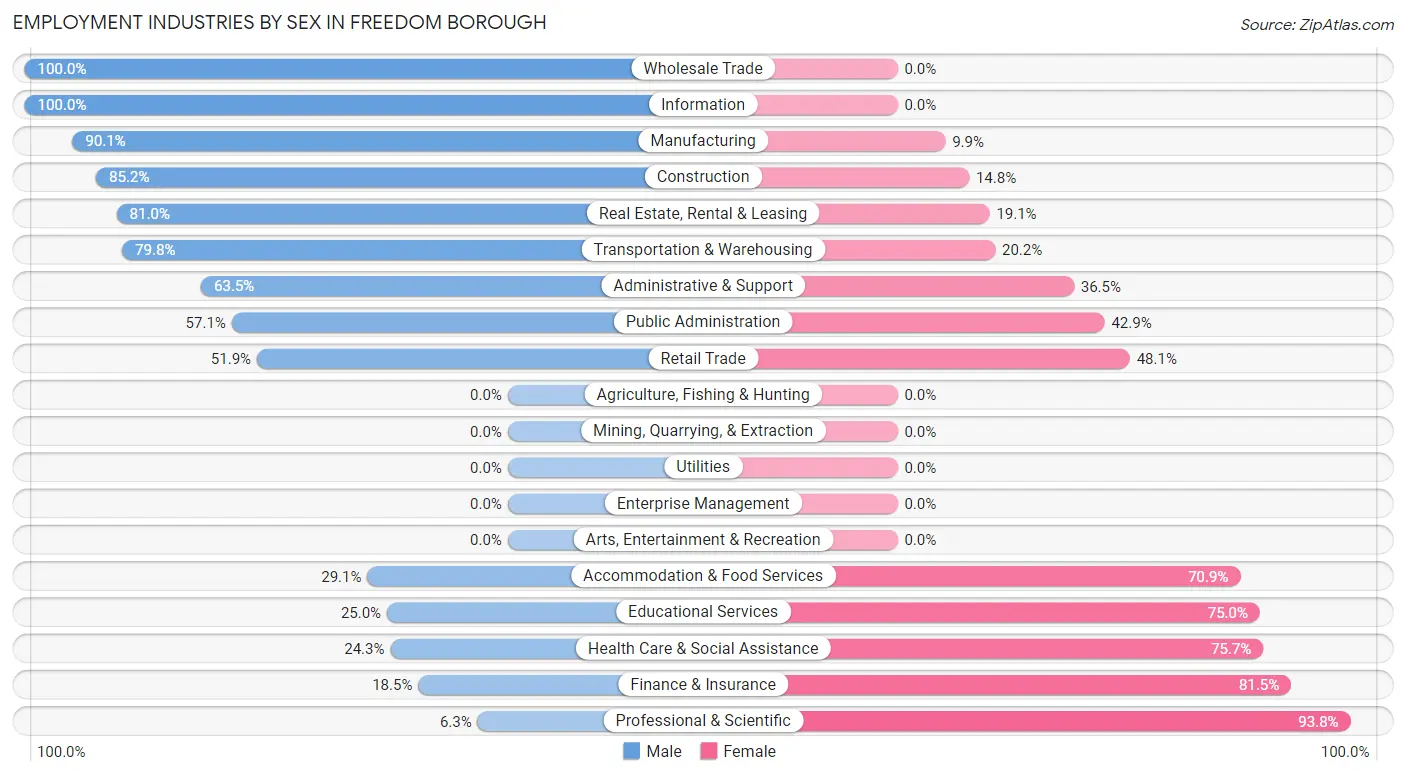
Employment Industries by Sex in Freedom borough
The Freedom borough industries that see more men than women are Wholesale Trade (100.0%), Information (100.0%), and Manufacturing (90.1%), whereas the industries that tend to have a higher number of women are Professional & Scientific (93.8%), Finance & Insurance (81.5%), and Health Care & Social Assistance (75.7%).
| Industry | Male | Female |
| Agriculture, Fishing & Hunting | 0 (0.0%) | 0 (0.0%) |
| Mining, Quarrying, & Extraction | 0 (0.0%) | 0 (0.0%) |
| Construction | 69 (85.2%) | 12 (14.8%) |
| Manufacturing | 91 (90.1%) | 10 (9.9%) |
| Wholesale Trade | 4 (100.0%) | 0 (0.0%) |
| Retail Trade | 27 (51.9%) | 25 (48.1%) |
| Transportation & Warehousing | 79 (79.8%) | 20 (20.2%) |
| Utilities | 0 (0.0%) | 0 (0.0%) |
| Information | 4 (100.0%) | 0 (0.0%) |
| Finance & Insurance | 5 (18.5%) | 22 (81.5%) |
| Real Estate, Rental & Leasing | 17 (80.9%) | 4 (19.1%) |
| Professional & Scientific | 4 (6.2%) | 60 (93.8%) |
| Enterprise Management | 0 (0.0%) | 0 (0.0%) |
| Administrative & Support | 40 (63.5%) | 23 (36.5%) |
| Educational Services | 5 (25.0%) | 15 (75.0%) |
| Health Care & Social Assistance | 26 (24.3%) | 81 (75.7%) |
| Arts, Entertainment & Recreation | 0 (0.0%) | 0 (0.0%) |
| Accommodation & Food Services | 34 (29.1%) | 83 (70.9%) |
| Public Administration | 4 (57.1%) | 3 (42.9%) |
| Total | 435 (54.3%) | 366 (45.7%) |
Education in Freedom borough
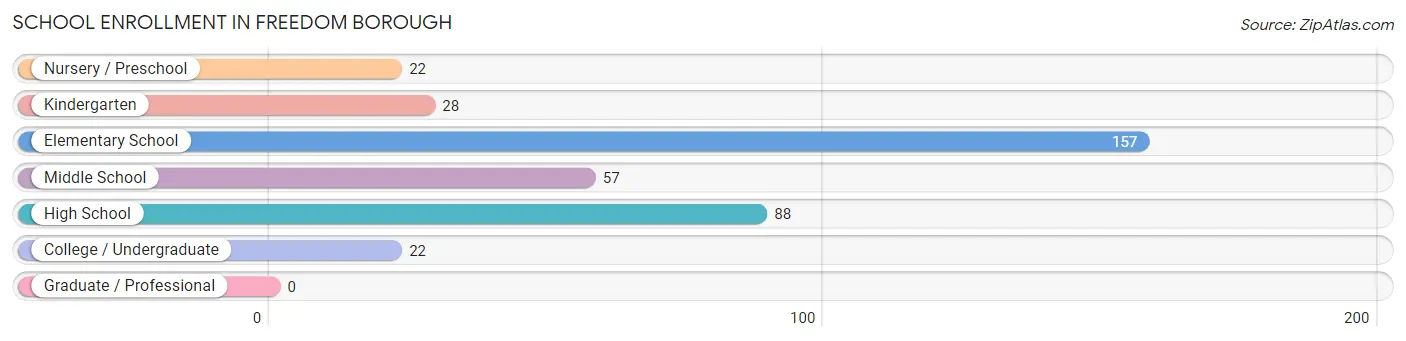
School Enrollment in Freedom borough
The most common levels of schooling among the 374 students in Freedom borough are elementary school (157 | 42.0%), high school (88 | 23.5%), and middle school (57 | 15.2%).
| School Level | # Students | % Students |
| Nursery / Preschool | 22 | 5.9% |
| Kindergarten | 28 | 7.5% |
| Elementary School | 157 | 42.0% |
| Middle School | 57 | 15.2% |
| High School | 88 | 23.5% |
| College / Undergraduate | 22 | 5.9% |
| Graduate / Professional | 0 | 0.0% |
| Total | 374 | 100.0% |
School Enrollment by Age by Funding Source in Freedom borough
Out of a total of 374 students who are enrolled in schools in Freedom borough, 71 (19.0%) attend a private institution, while the remaining 303 (81.0%) are enrolled in public schools. The age group of 18 to 19 year olds has the highest likelihood of being enrolled in private schools, with 24 (100.0% in the age bracket) enrolled. Conversely, the age group of 3 to 4 year olds has the lowest likelihood of being enrolled in a private school, with 20 (100.0% in the age bracket) attending a public institution.
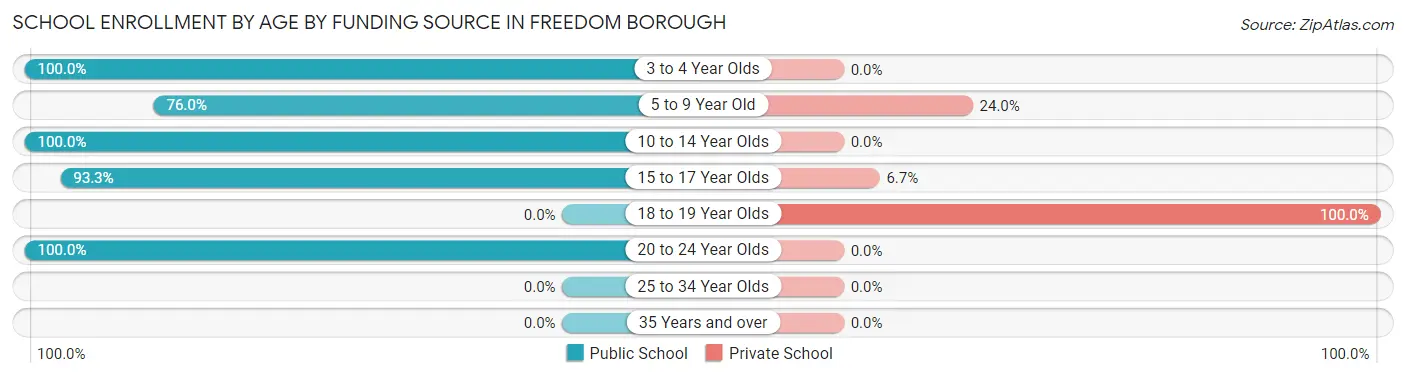
| Age Bracket | Public School | Private School |
| 3 to 4 Year Olds | 20 (100.0%) | 0 (0.0%) |
| 5 to 9 Year Old | 136 (76.0%) | 43 (24.0%) |
| 10 to 14 Year Olds | 69 (100.0%) | 0 (0.0%) |
| 15 to 17 Year Olds | 56 (93.3%) | 4 (6.7%) |
| 18 to 19 Year Olds | 0 (0.0%) | 24 (100.0%) |
| 20 to 24 Year Olds | 22 (100.0%) | 0 (0.0%) |
| 25 to 34 Year Olds | 0 (0.0%) | 0 (0.0%) |
| 35 Years and over | 0 (0.0%) | 0 (0.0%) |
| Total | 303 (81.0%) | 71 (19.0%) |
Educational Attainment by Field of Study in Freedom borough
Business (47 | 36.1%), psychology (19 | 14.6%), visual & performing arts (17 | 13.1%), science & technology (14 | 10.8%), and education (7 | 5.4%) are the most common fields of study among 130 individuals in Freedom borough who have obtained a bachelor's degree or higher.
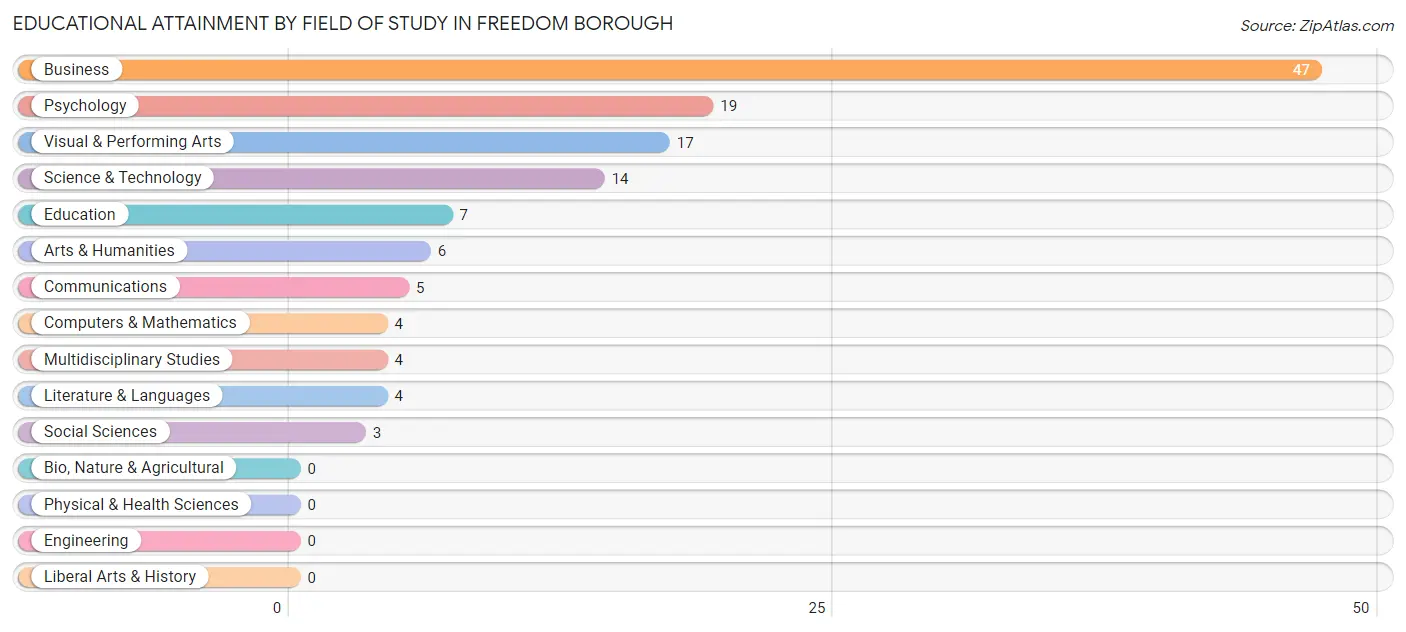
| Field of Study | # Graduates | % Graduates |
| Computers & Mathematics | 4 | 3.1% |
| Bio, Nature & Agricultural | 0 | 0.0% |
| Physical & Health Sciences | 0 | 0.0% |
| Psychology | 19 | 14.6% |
| Social Sciences | 3 | 2.3% |
| Engineering | 0 | 0.0% |
| Multidisciplinary Studies | 4 | 3.1% |
| Science & Technology | 14 | 10.8% |
| Business | 47 | 36.1% |
| Education | 7 | 5.4% |
| Literature & Languages | 4 | 3.1% |
| Liberal Arts & History | 0 | 0.0% |
| Visual & Performing Arts | 17 | 13.1% |
| Communications | 5 | 3.8% |
| Arts & Humanities | 6 | 4.6% |
| Total | 130 | 100.0% |
Transportation & Commute in Freedom borough
Vehicle Availability by Sex in Freedom borough
The most prevalent vehicle ownership categories in Freedom borough are males with 2 vehicles (194, accounting for 46.1%) and females with 2 vehicles (100, making up 54.2%).
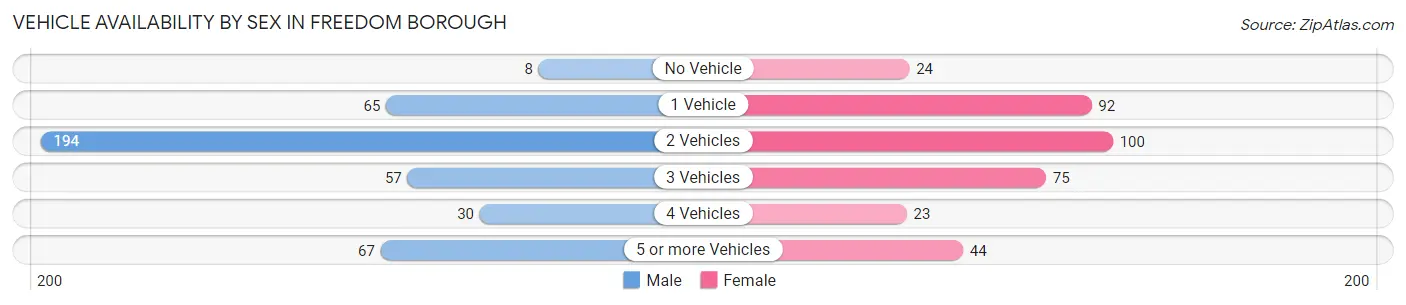
| Vehicles Available | Male | Female |
| No Vehicle | 8 (1.9%) | 24 (6.7%) |
| 1 Vehicle | 65 (15.4%) | 92 (25.7%) |
| 2 Vehicles | 194 (46.1%) | 100 (27.9%) |
| 3 Vehicles | 57 (13.5%) | 75 (20.9%) |
| 4 Vehicles | 30 (7.1%) | 23 (6.4%) |
| 5 or more Vehicles | 67 (15.9%) | 44 (12.3%) |
| Total | 421 (100.0%) | 358 (100.0%) |
Commute Time in Freedom borough
The most frequently occuring commute durations in Freedom borough are 25 to 29 minutes (150 commuters, 21.3%), 20 to 24 minutes (131 commuters, 18.6%), and 15 to 19 minutes (89 commuters, 12.6%).
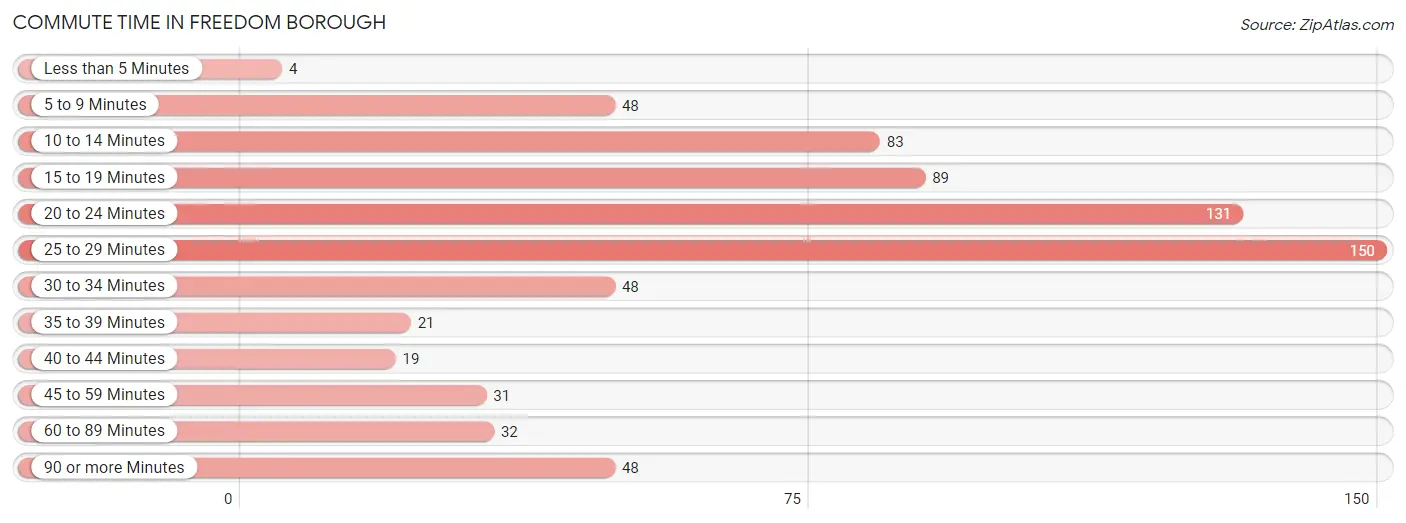
| Commute Time | # Commuters | % Commuters |
| Less than 5 Minutes | 4 | 0.6% |
| 5 to 9 Minutes | 48 | 6.8% |
| 10 to 14 Minutes | 83 | 11.8% |
| 15 to 19 Minutes | 89 | 12.6% |
| 20 to 24 Minutes | 131 | 18.6% |
| 25 to 29 Minutes | 150 | 21.3% |
| 30 to 34 Minutes | 48 | 6.8% |
| 35 to 39 Minutes | 21 | 3.0% |
| 40 to 44 Minutes | 19 | 2.7% |
| 45 to 59 Minutes | 31 | 4.4% |
| 60 to 89 Minutes | 32 | 4.5% |
| 90 or more Minutes | 48 | 6.8% |
Commute Time by Sex in Freedom borough
The most common commute times in Freedom borough are 20 to 24 minutes (79 commuters, 19.9%) for males and 25 to 29 minutes (109 commuters, 35.5%) for females.
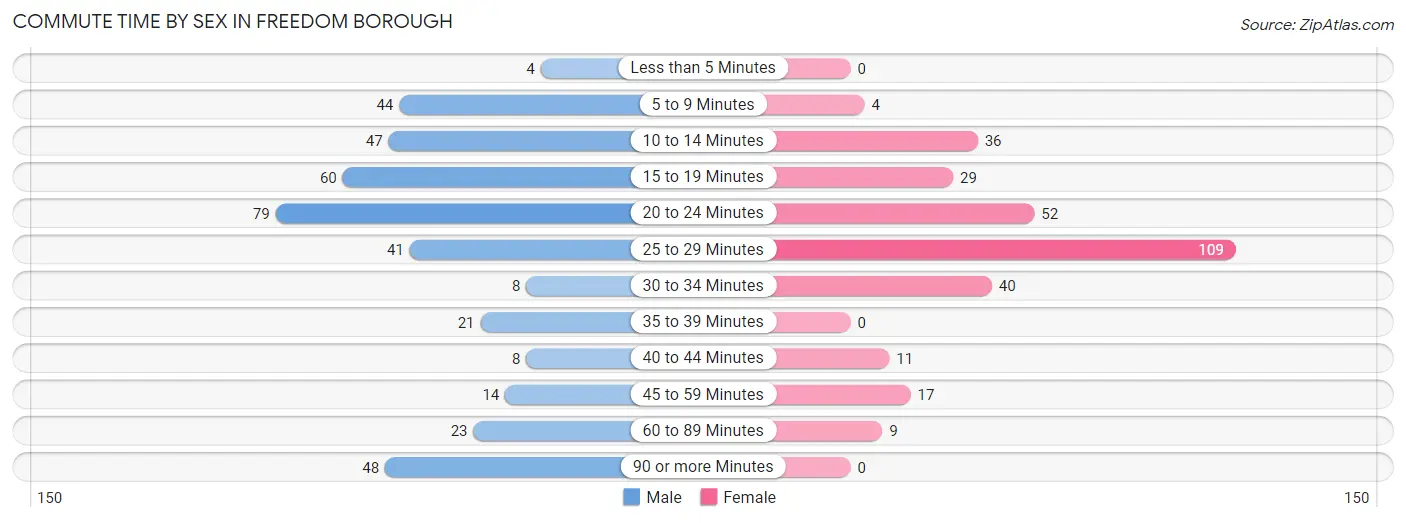
| Commute Time | Male | Female |
| Less than 5 Minutes | 4 (1.0%) | 0 (0.0%) |
| 5 to 9 Minutes | 44 (11.1%) | 4 (1.3%) |
| 10 to 14 Minutes | 47 (11.8%) | 36 (11.7%) |
| 15 to 19 Minutes | 60 (15.1%) | 29 (9.5%) |
| 20 to 24 Minutes | 79 (19.9%) | 52 (16.9%) |
| 25 to 29 Minutes | 41 (10.3%) | 109 (35.5%) |
| 30 to 34 Minutes | 8 (2.0%) | 40 (13.0%) |
| 35 to 39 Minutes | 21 (5.3%) | 0 (0.0%) |
| 40 to 44 Minutes | 8 (2.0%) | 11 (3.6%) |
| 45 to 59 Minutes | 14 (3.5%) | 17 (5.5%) |
| 60 to 89 Minutes | 23 (5.8%) | 9 (2.9%) |
| 90 or more Minutes | 48 (12.1%) | 0 (0.0%) |
Time of Departure to Work by Sex in Freedom borough
The most frequent times of departure to work in Freedom borough are 4:00 PM to 11:59 PM (98, 24.7%) for males and 5:00 AM to 5:29 AM (56, 18.2%) for females.
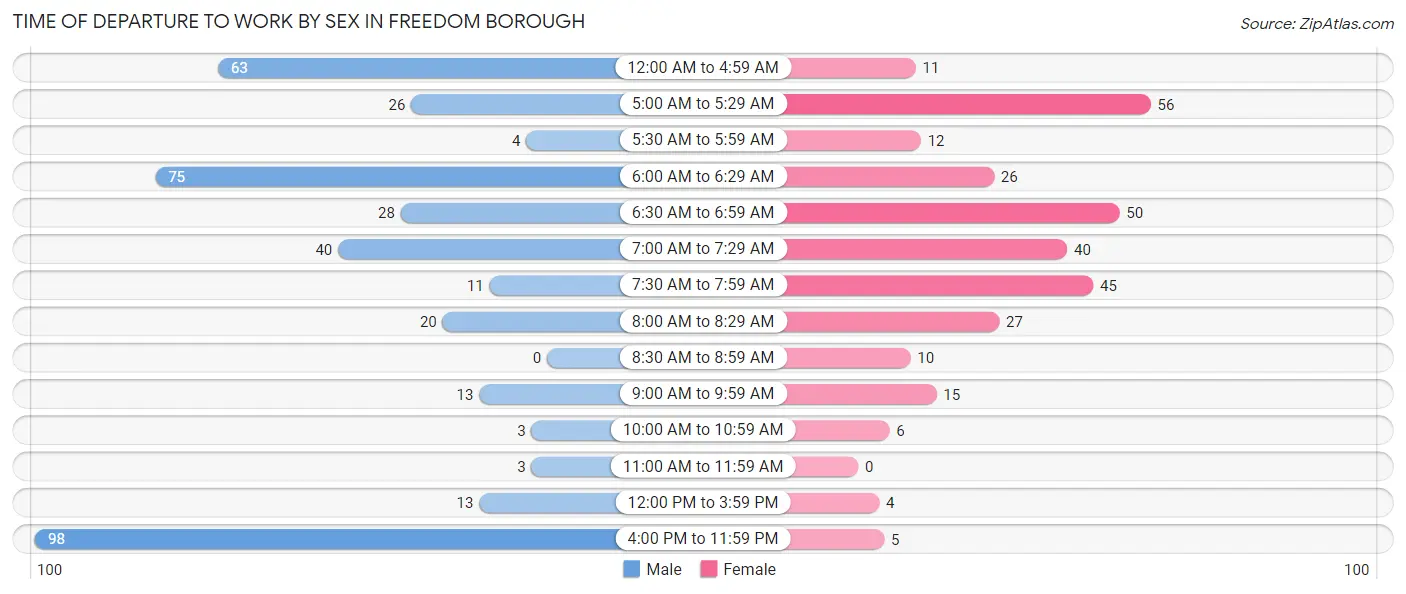
| Time of Departure | Male | Female |
| 12:00 AM to 4:59 AM | 63 (15.9%) | 11 (3.6%) |
| 5:00 AM to 5:29 AM | 26 (6.6%) | 56 (18.2%) |
| 5:30 AM to 5:59 AM | 4 (1.0%) | 12 (3.9%) |
| 6:00 AM to 6:29 AM | 75 (18.9%) | 26 (8.5%) |
| 6:30 AM to 6:59 AM | 28 (7.0%) | 50 (16.3%) |
| 7:00 AM to 7:29 AM | 40 (10.1%) | 40 (13.0%) |
| 7:30 AM to 7:59 AM | 11 (2.8%) | 45 (14.7%) |
| 8:00 AM to 8:29 AM | 20 (5.0%) | 27 (8.8%) |
| 8:30 AM to 8:59 AM | 0 (0.0%) | 10 (3.3%) |
| 9:00 AM to 9:59 AM | 13 (3.3%) | 15 (4.9%) |
| 10:00 AM to 10:59 AM | 3 (0.8%) | 6 (1.9%) |
| 11:00 AM to 11:59 AM | 3 (0.8%) | 0 (0.0%) |
| 12:00 PM to 3:59 PM | 13 (3.3%) | 4 (1.3%) |
| 4:00 PM to 11:59 PM | 98 (24.7%) | 5 (1.6%) |
| Total | 397 (100.0%) | 307 (100.0%) |
Housing Occupancy in Freedom borough
Occupancy by Ownership in Freedom borough
Of the total 631 dwellings in Freedom borough, owner-occupied units account for 403 (63.9%), while renter-occupied units make up 228 (36.1%).
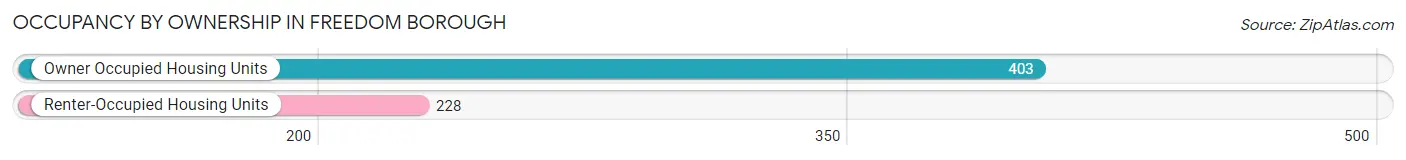
| Occupancy | # Housing Units | % Housing Units |
| Owner Occupied Housing Units | 403 | 63.9% |
| Renter-Occupied Housing Units | 228 | 36.1% |
| Total Occupied Housing Units | 631 | 100.0% |
Occupancy by Household Size in Freedom borough
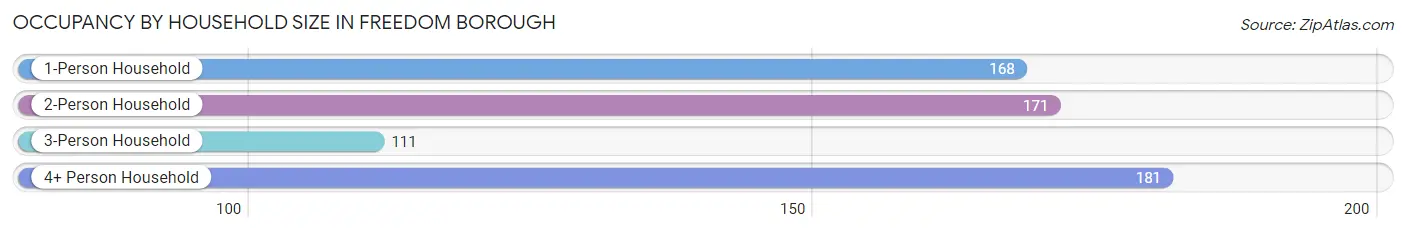
| Household Size | # Housing Units | % Housing Units |
| 1-Person Household | 168 | 26.6% |
| 2-Person Household | 171 | 27.1% |
| 3-Person Household | 111 | 17.6% |
| 4+ Person Household | 181 | 28.7% |
| Total Housing Units | 631 | 100.0% |
Occupancy by Ownership by Household Size in Freedom borough
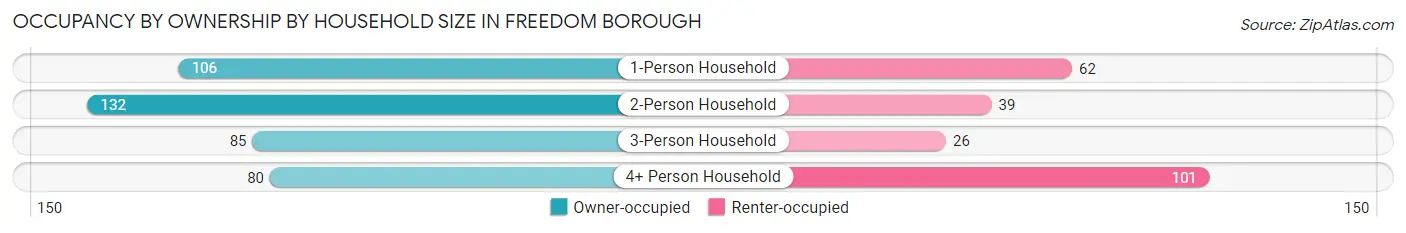
| Household Size | Owner-occupied | Renter-occupied |
| 1-Person Household | 106 (63.1%) | 62 (36.9%) |
| 2-Person Household | 132 (77.2%) | 39 (22.8%) |
| 3-Person Household | 85 (76.6%) | 26 (23.4%) |
| 4+ Person Household | 80 (44.2%) | 101 (55.8%) |
| Total Housing Units | 403 (63.9%) | 228 (36.1%) |
Occupancy by Educational Attainment in Freedom borough
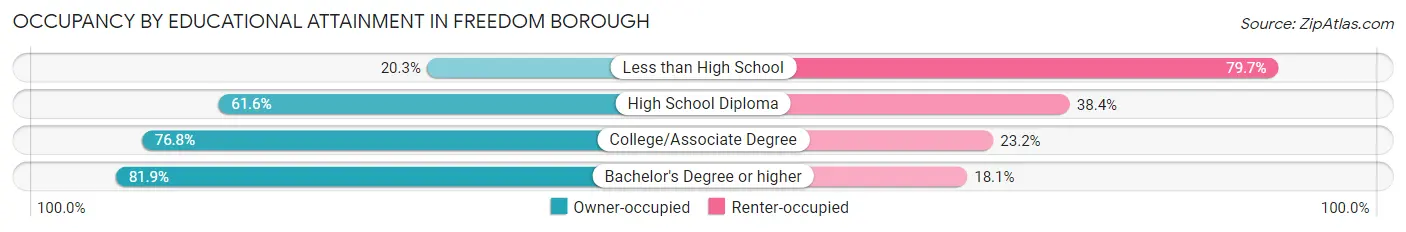
| Household Size | Owner-occupied | Renter-occupied |
| Less than High School | 15 (20.3%) | 59 (79.7%) |
| High School Diploma | 178 (61.6%) | 111 (38.4%) |
| College/Associate Degree | 142 (76.8%) | 43 (23.2%) |
| Bachelor's Degree or higher | 68 (81.9%) | 15 (18.1%) |
Occupancy by Age of Householder in Freedom borough
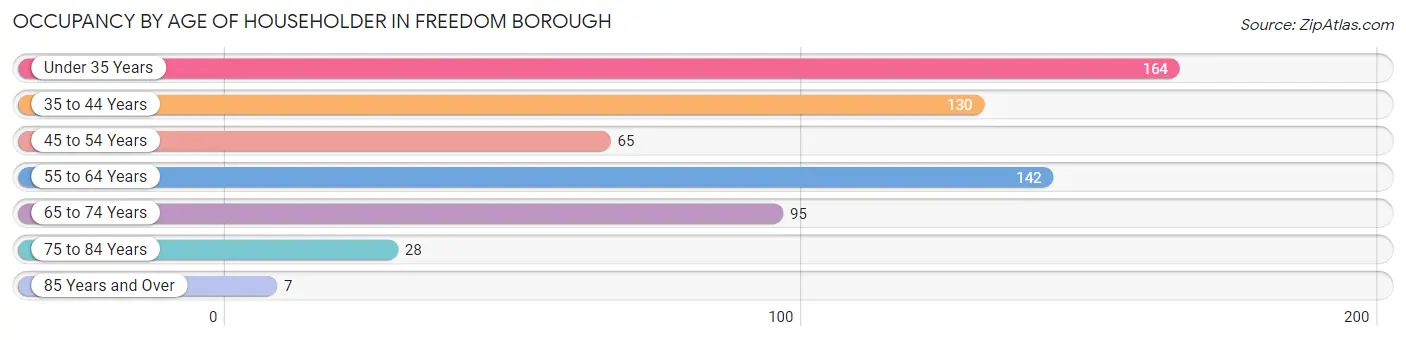
| Age Bracket | # Households | % Households |
| Under 35 Years | 164 | 26.0% |
| 35 to 44 Years | 130 | 20.6% |
| 45 to 54 Years | 65 | 10.3% |
| 55 to 64 Years | 142 | 22.5% |
| 65 to 74 Years | 95 | 15.1% |
| 75 to 84 Years | 28 | 4.4% |
| 85 Years and Over | 7 | 1.1% |
| Total | 631 | 100.0% |
Housing Finances in Freedom borough
Median Income by Occupancy in Freedom borough
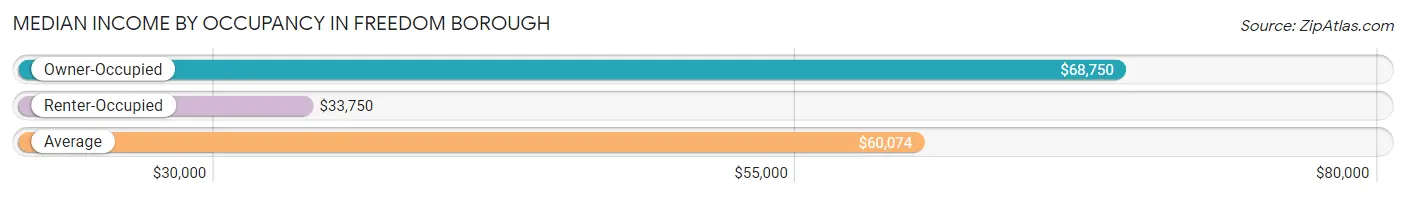
| Occupancy Type | # Households | Median Income |
| Owner-Occupied | 403 (63.9%) | $68,750 |
| Renter-Occupied | 228 (36.1%) | $33,750 |
| Average | 631 (100.0%) | $60,074 |
Occupancy by Householder Income Bracket in Freedom borough
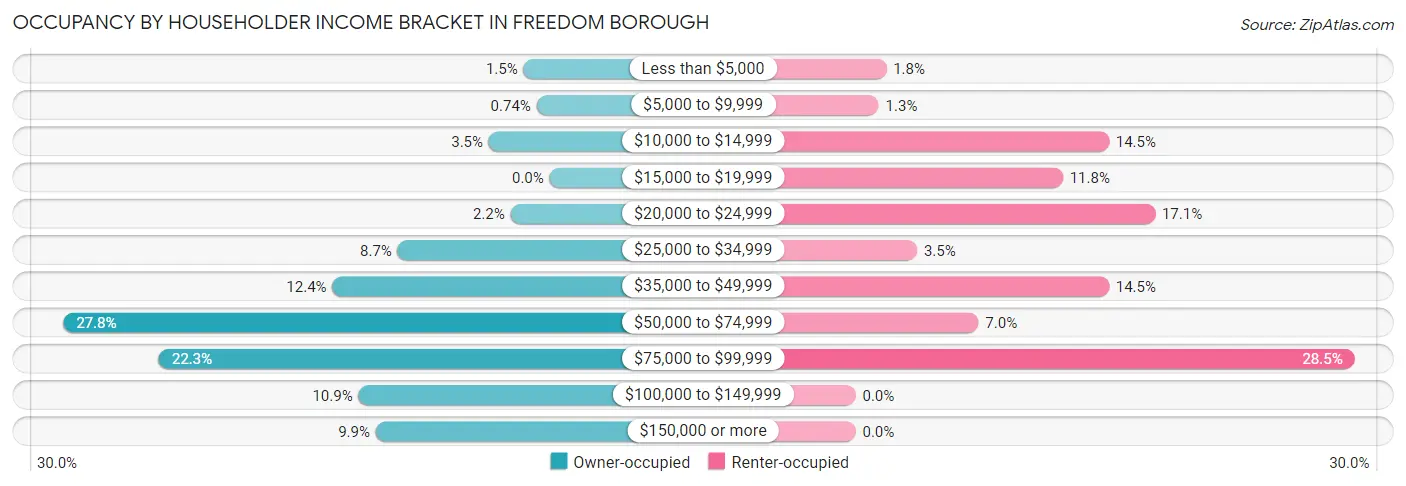
| Income Bracket | Owner-occupied | Renter-occupied |
| Less than $5,000 | 6 (1.5%) | 4 (1.8%) |
| $5,000 to $9,999 | 3 (0.7%) | 3 (1.3%) |
| $10,000 to $14,999 | 14 (3.5%) | 33 (14.5%) |
| $15,000 to $19,999 | 0 (0.0%) | 27 (11.8%) |
| $20,000 to $24,999 | 9 (2.2%) | 39 (17.1%) |
| $25,000 to $34,999 | 35 (8.7%) | 8 (3.5%) |
| $35,000 to $49,999 | 50 (12.4%) | 33 (14.5%) |
| $50,000 to $74,999 | 112 (27.8%) | 16 (7.0%) |
| $75,000 to $99,999 | 90 (22.3%) | 65 (28.5%) |
| $100,000 to $149,999 | 44 (10.9%) | 0 (0.0%) |
| $150,000 or more | 40 (9.9%) | 0 (0.0%) |
| Total | 403 (100.0%) | 228 (100.0%) |
Monthly Housing Cost Tiers in Freedom borough
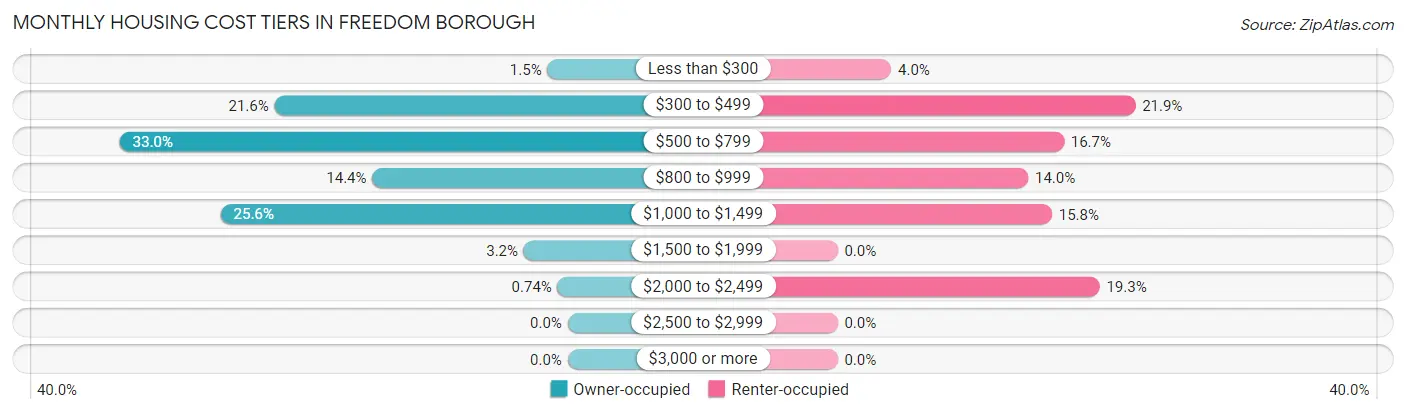
| Monthly Cost | Owner-occupied | Renter-occupied |
| Less than $300 | 6 (1.5%) | 9 (4.0%) |
| $300 to $499 | 87 (21.6%) | 50 (21.9%) |
| $500 to $799 | 133 (33.0%) | 38 (16.7%) |
| $800 to $999 | 58 (14.4%) | 32 (14.0%) |
| $1,000 to $1,499 | 103 (25.6%) | 36 (15.8%) |
| $1,500 to $1,999 | 13 (3.2%) | 0 (0.0%) |
| $2,000 to $2,499 | 3 (0.7%) | 44 (19.3%) |
| $2,500 to $2,999 | 0 (0.0%) | 0 (0.0%) |
| $3,000 or more | 0 (0.0%) | 0 (0.0%) |
| Total | 403 (100.0%) | 228 (100.0%) |
Physical Housing Characteristics in Freedom borough
Housing Structures in Freedom borough
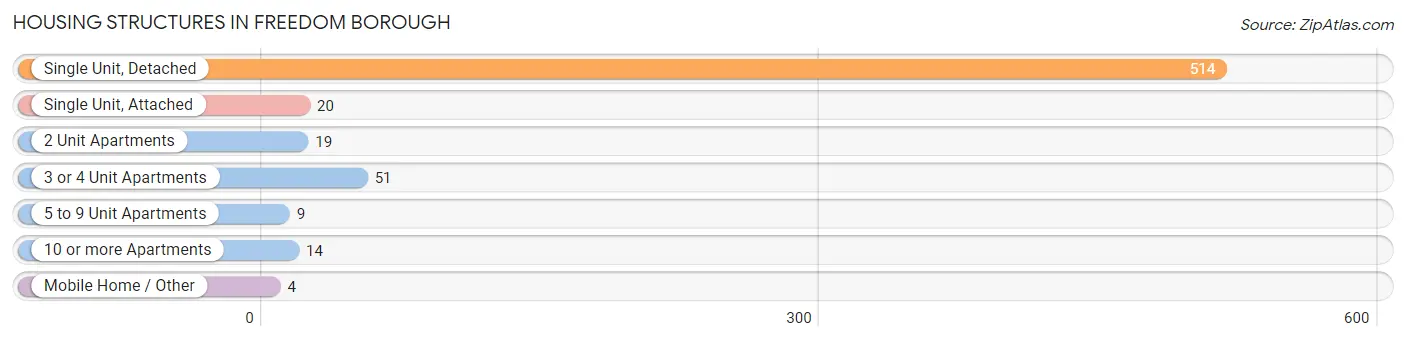
| Structure Type | # Housing Units | % Housing Units |
| Single Unit, Detached | 514 | 81.5% |
| Single Unit, Attached | 20 | 3.2% |
| 2 Unit Apartments | 19 | 3.0% |
| 3 or 4 Unit Apartments | 51 | 8.1% |
| 5 to 9 Unit Apartments | 9 | 1.4% |
| 10 or more Apartments | 14 | 2.2% |
| Mobile Home / Other | 4 | 0.6% |
| Total | 631 | 100.0% |
Housing Structures by Occupancy in Freedom borough
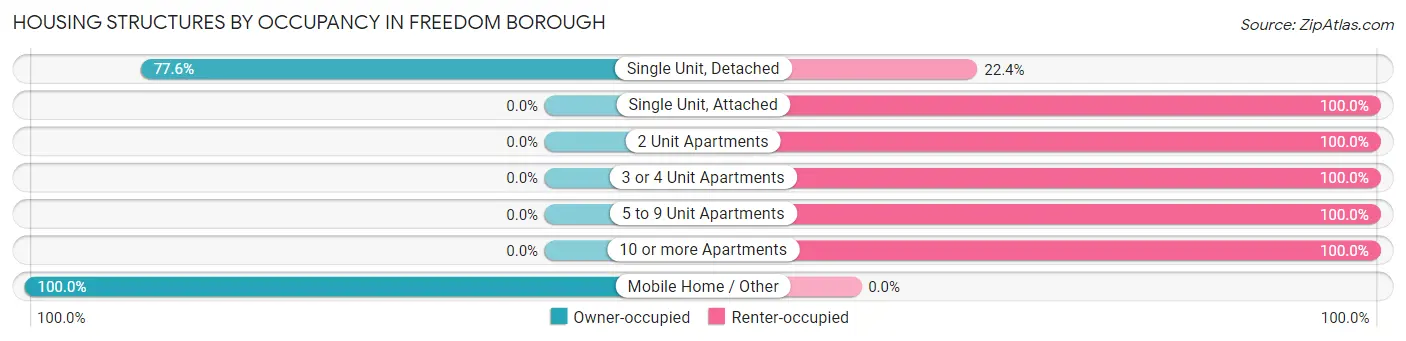
| Structure Type | Owner-occupied | Renter-occupied |
| Single Unit, Detached | 399 (77.6%) | 115 (22.4%) |
| Single Unit, Attached | 0 (0.0%) | 20 (100.0%) |
| 2 Unit Apartments | 0 (0.0%) | 19 (100.0%) |
| 3 or 4 Unit Apartments | 0 (0.0%) | 51 (100.0%) |
| 5 to 9 Unit Apartments | 0 (0.0%) | 9 (100.0%) |
| 10 or more Apartments | 0 (0.0%) | 14 (100.0%) |
| Mobile Home / Other | 4 (100.0%) | 0 (0.0%) |
| Total | 403 (63.9%) | 228 (36.1%) |
Housing Structures by Number of Rooms in Freedom borough
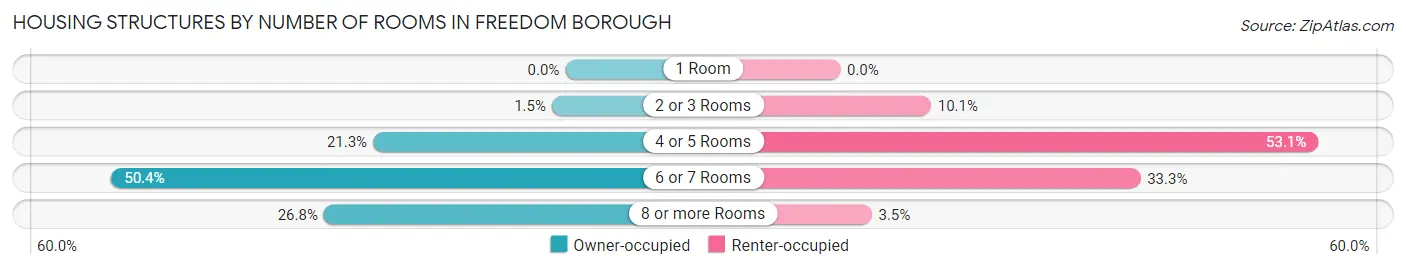
| Number of Rooms | Owner-occupied | Renter-occupied |
| 1 Room | 0 (0.0%) | 0 (0.0%) |
| 2 or 3 Rooms | 6 (1.5%) | 23 (10.1%) |
| 4 or 5 Rooms | 86 (21.3%) | 121 (53.1%) |
| 6 or 7 Rooms | 203 (50.4%) | 76 (33.3%) |
| 8 or more Rooms | 108 (26.8%) | 8 (3.5%) |
| Total | 403 (100.0%) | 228 (100.0%) |
Housing Structure by Heating Type in Freedom borough
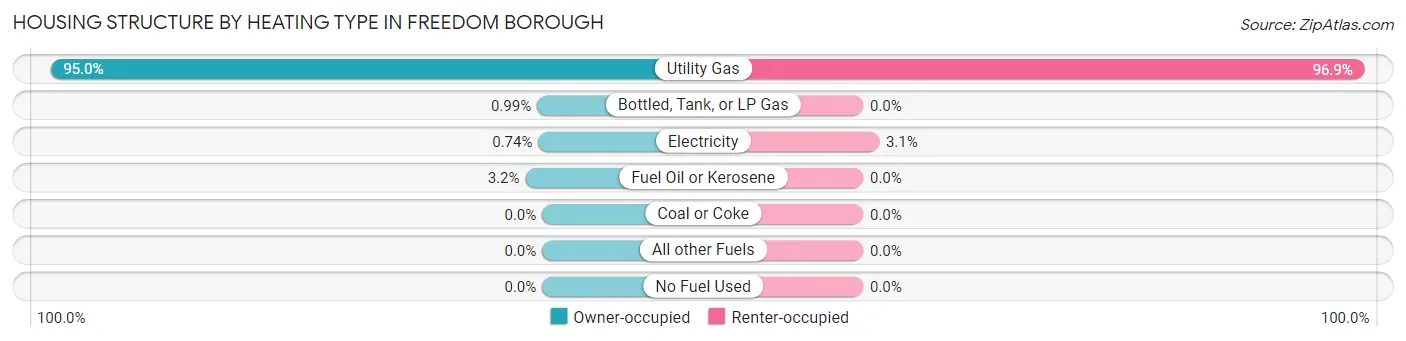
| Heating Type | Owner-occupied | Renter-occupied |
| Utility Gas | 383 (95.0%) | 221 (96.9%) |
| Bottled, Tank, or LP Gas | 4 (1.0%) | 0 (0.0%) |
| Electricity | 3 (0.7%) | 7 (3.1%) |
| Fuel Oil or Kerosene | 13 (3.2%) | 0 (0.0%) |
| Coal or Coke | 0 (0.0%) | 0 (0.0%) |
| All other Fuels | 0 (0.0%) | 0 (0.0%) |
| No Fuel Used | 0 (0.0%) | 0 (0.0%) |
| Total | 403 (100.0%) | 228 (100.0%) |
Household Vehicle Usage in Freedom borough
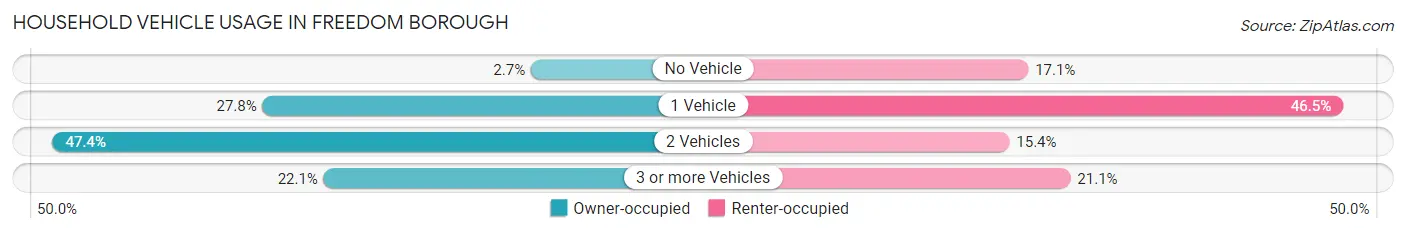
| Vehicles per Household | Owner-occupied | Renter-occupied |
| No Vehicle | 11 (2.7%) | 39 (17.1%) |
| 1 Vehicle | 112 (27.8%) | 106 (46.5%) |
| 2 Vehicles | 191 (47.4%) | 35 (15.3%) |
| 3 or more Vehicles | 89 (22.1%) | 48 (21.0%) |
| Total | 403 (100.0%) | 228 (100.0%) |
Real Estate & Mortgages in Freedom borough
Real Estate and Mortgage Overview in Freedom borough
| Characteristic | Without Mortgage | With Mortgage |
| Housing Units | 221 | 182 |
| Median Property Value | $100,600 | $85,700 |
| Median Household Income | $68,902 | $27 |
| Monthly Housing Costs | $532 | $0 |
| Real Estate Taxes | $1,633 | $7 |
Property Value by Mortgage Status in Freedom borough
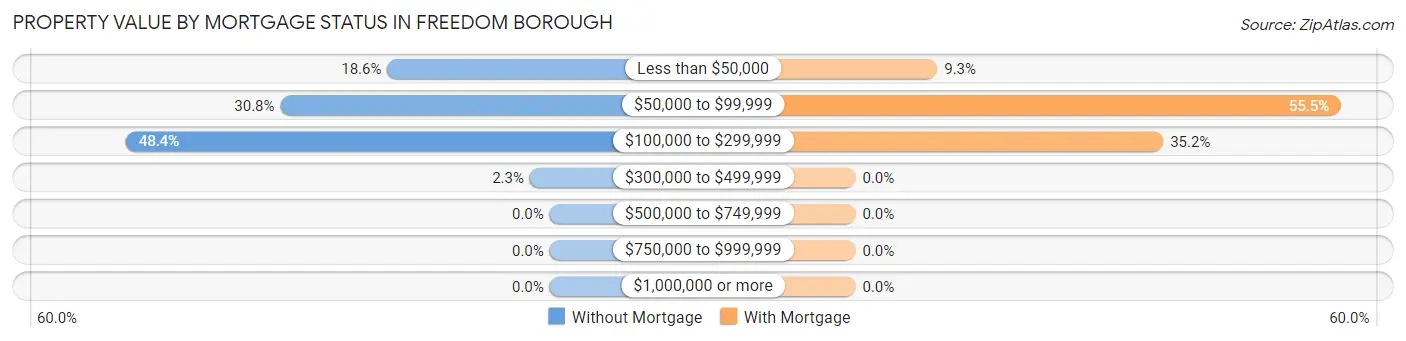
| Property Value | Without Mortgage | With Mortgage |
| Less than $50,000 | 41 (18.5%) | 17 (9.3%) |
| $50,000 to $99,999 | 68 (30.8%) | 101 (55.5%) |
| $100,000 to $299,999 | 107 (48.4%) | 64 (35.2%) |
| $300,000 to $499,999 | 5 (2.3%) | 0 (0.0%) |
| $500,000 to $749,999 | 0 (0.0%) | 0 (0.0%) |
| $750,000 to $999,999 | 0 (0.0%) | 0 (0.0%) |
| $1,000,000 or more | 0 (0.0%) | 0 (0.0%) |
| Total | 221 (100.0%) | 182 (100.0%) |
Household Income by Mortgage Status in Freedom borough
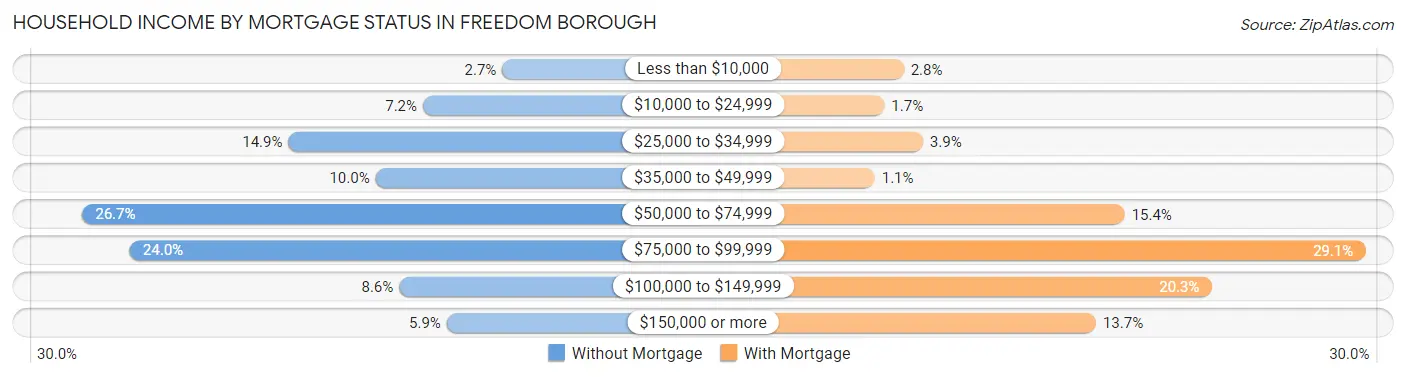
| Household Income | Without Mortgage | With Mortgage |
| Less than $10,000 | 6 (2.7%) | 5 (2.8%) |
| $10,000 to $24,999 | 16 (7.2%) | 3 (1.7%) |
| $25,000 to $34,999 | 33 (14.9%) | 7 (3.8%) |
| $35,000 to $49,999 | 22 (10.0%) | 2 (1.1%) |
| $50,000 to $74,999 | 59 (26.7%) | 28 (15.4%) |
| $75,000 to $99,999 | 53 (24.0%) | 53 (29.1%) |
| $100,000 to $149,999 | 19 (8.6%) | 37 (20.3%) |
| $150,000 or more | 13 (5.9%) | 25 (13.7%) |
| Total | 221 (100.0%) | 182 (100.0%) |
Property Value to Household Income Ratio in Freedom borough
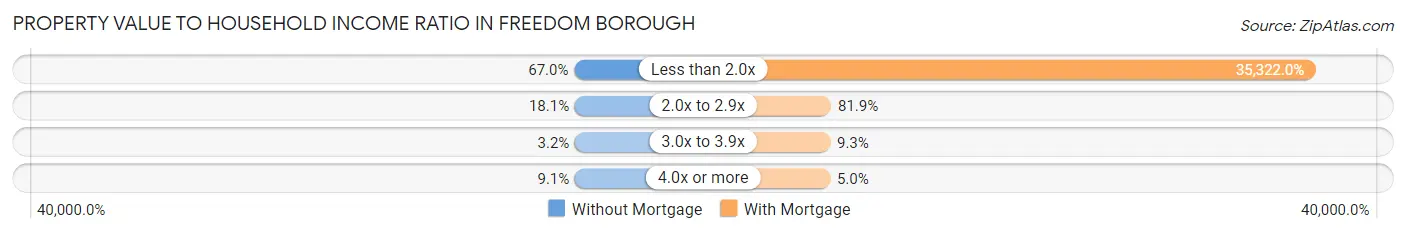
| Value-to-Income Ratio | Without Mortgage | With Mortgage |
| Less than 2.0x | 148 (67.0%) | 64,286 (35,322.0%) |
| 2.0x to 2.9x | 40 (18.1%) | 149 (81.9%) |
| 3.0x to 3.9x | 7 (3.2%) | 17 (9.3%) |
| 4.0x or more | 20 (9.0%) | 9 (5.0%) |
| Total | 221 (100.0%) | 182 (100.0%) |
Real Estate Taxes by Mortgage Status in Freedom borough
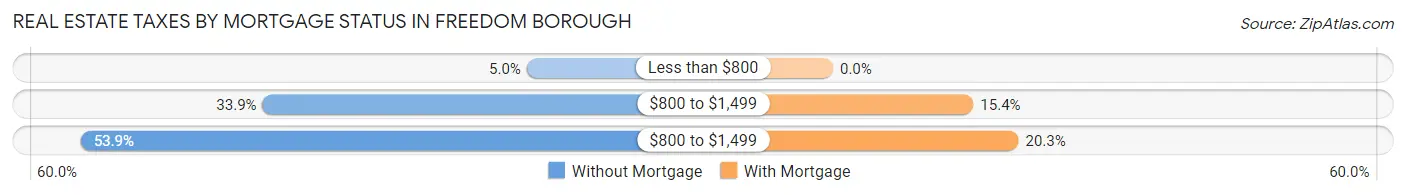
| Property Taxes | Without Mortgage | With Mortgage |
| Less than $800 | 11 (5.0%) | 0 (0.0%) |
| $800 to $1,499 | 75 (33.9%) | 28 (15.4%) |
| $800 to $1,499 | 119 (53.8%) | 37 (20.3%) |
| Total | 221 (100.0%) | 182 (100.0%) |
Health & Disability in Freedom borough
Health Insurance Coverage by Age in Freedom borough
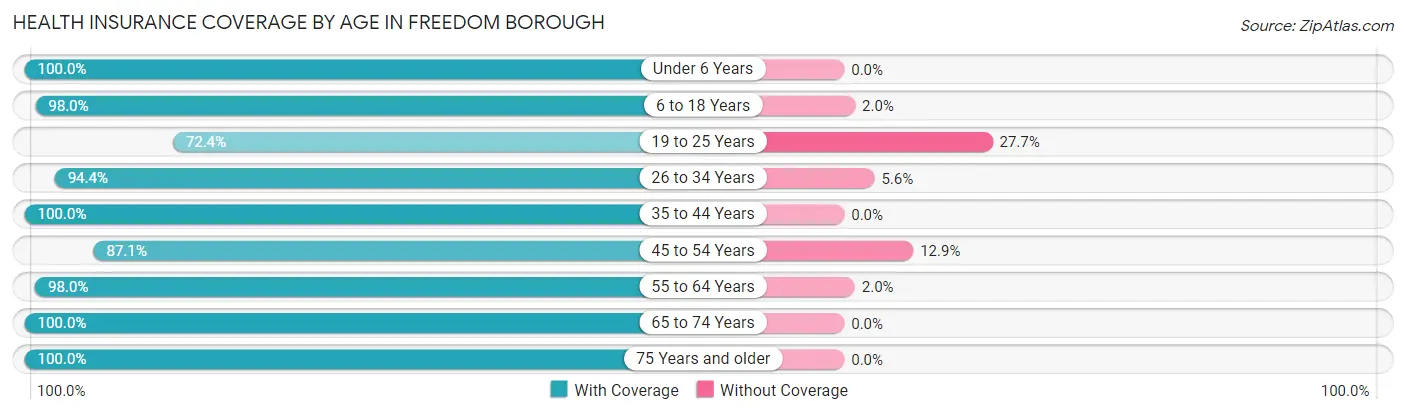
| Age Bracket | With Coverage | Without Coverage |
| Under 6 Years | 136 (100.0%) | 0 (0.0%) |
| 6 to 18 Years | 293 (98.0%) | 6 (2.0%) |
| 19 to 25 Years | 191 (72.4%) | 73 (27.7%) |
| 26 to 34 Years | 168 (94.4%) | 10 (5.6%) |
| 35 to 44 Years | 197 (100.0%) | 0 (0.0%) |
| 45 to 54 Years | 122 (87.1%) | 18 (12.9%) |
| 55 to 64 Years | 200 (98.0%) | 4 (2.0%) |
| 65 to 74 Years | 158 (100.0%) | 0 (0.0%) |
| 75 Years and older | 49 (100.0%) | 0 (0.0%) |
| Total | 1,514 (93.2%) | 111 (6.8%) |
Health Insurance Coverage by Citizenship Status in Freedom borough
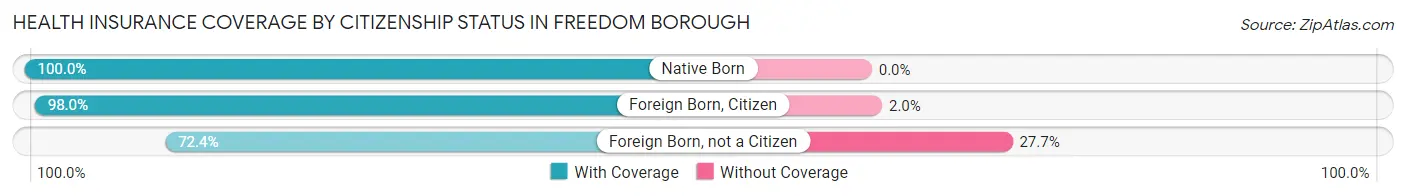
| Citizenship Status | With Coverage | Without Coverage |
| Native Born | 136 (100.0%) | 0 (0.0%) |
| Foreign Born, Citizen | 293 (98.0%) | 6 (2.0%) |
| Foreign Born, not a Citizen | 191 (72.4%) | 73 (27.7%) |
Health Insurance Coverage by Household Income in Freedom borough
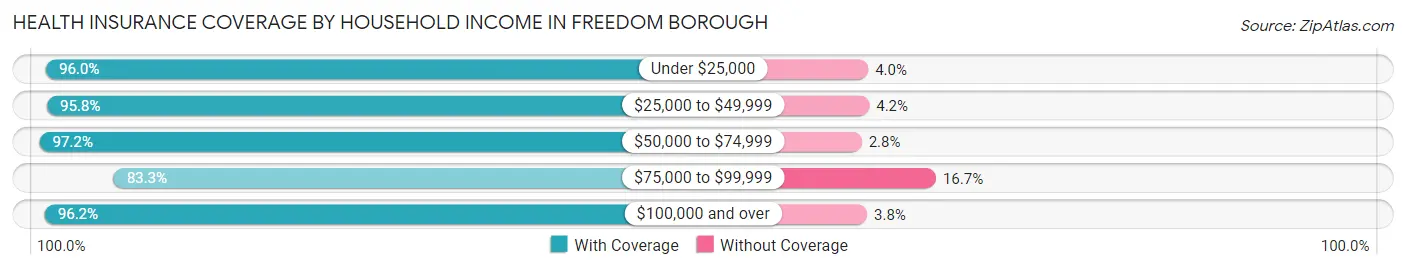
| Household Income | With Coverage | Without Coverage |
| Under $25,000 | 358 (96.0%) | 15 (4.0%) |
| $25,000 to $49,999 | 296 (95.8%) | 13 (4.2%) |
| $50,000 to $74,999 | 278 (97.2%) | 8 (2.8%) |
| $75,000 to $99,999 | 324 (83.3%) | 65 (16.7%) |
| $100,000 and over | 253 (96.2%) | 10 (3.8%) |
Public vs Private Health Insurance Coverage by Age in Freedom borough
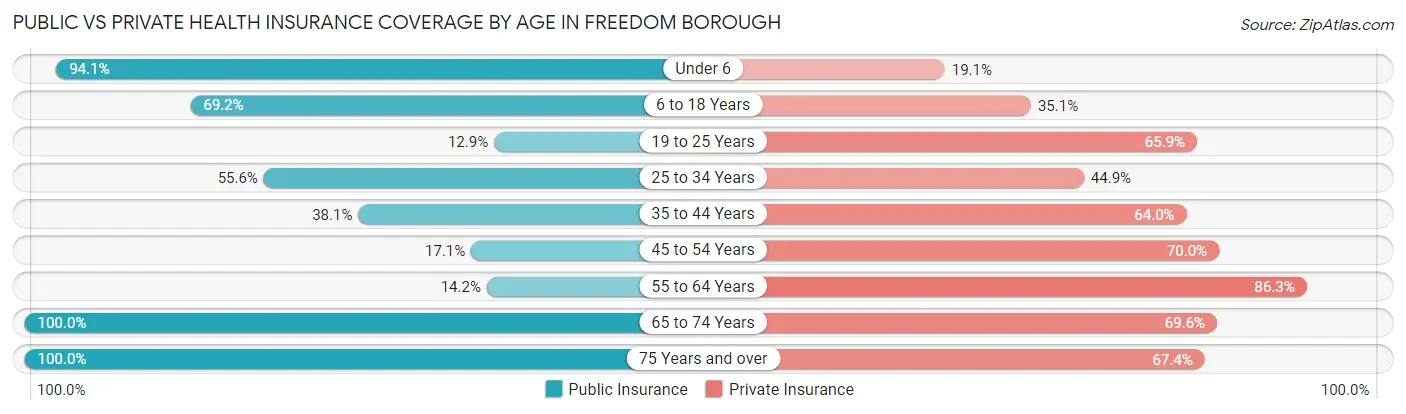
| Age Bracket | Public Insurance | Private Insurance |
| Under 6 | 128 (94.1%) | 26 (19.1%) |
| 6 to 18 Years | 207 (69.2%) | 105 (35.1%) |
| 19 to 25 Years | 34 (12.9%) | 174 (65.9%) |
| 25 to 34 Years | 99 (55.6%) | 80 (44.9%) |
| 35 to 44 Years | 75 (38.1%) | 126 (64.0%) |
| 45 to 54 Years | 24 (17.1%) | 98 (70.0%) |
| 55 to 64 Years | 29 (14.2%) | 176 (86.3%) |
| 65 to 74 Years | 158 (100.0%) | 110 (69.6%) |
| 75 Years and over | 49 (100.0%) | 33 (67.3%) |
| Total | 803 (49.4%) | 928 (57.1%) |
Disability Status by Sex by Age in Freedom borough
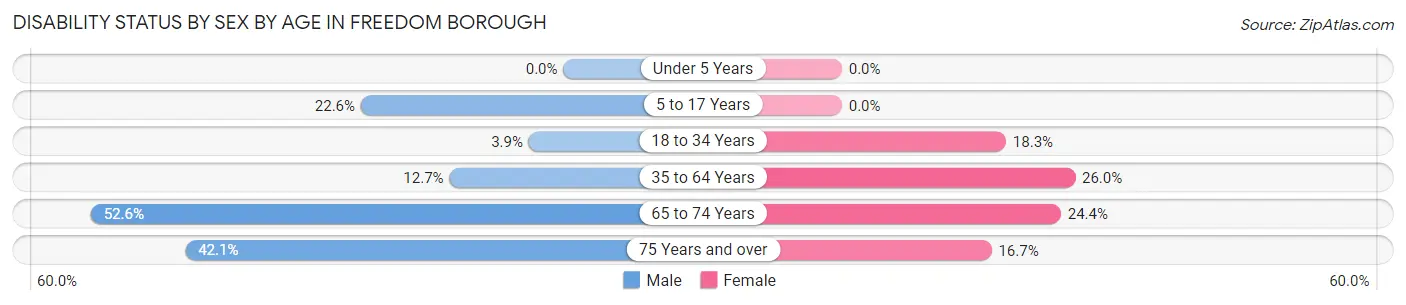
| Age Bracket | Male | Female |
| Under 5 Years | 0 (0.0%) | 0 (0.0%) |
| 5 to 17 Years | 46 (22.6%) | 0 (0.0%) |
| 18 to 34 Years | 10 (3.8%) | 34 (18.3%) |
| 35 to 64 Years | 33 (12.7%) | 73 (26.0%) |
| 65 to 74 Years | 40 (52.6%) | 20 (24.4%) |
| 75 Years and over | 8 (42.1%) | 5 (16.7%) |
Disability Class by Sex by Age in Freedom borough
Disability Class: Hearing Difficulty
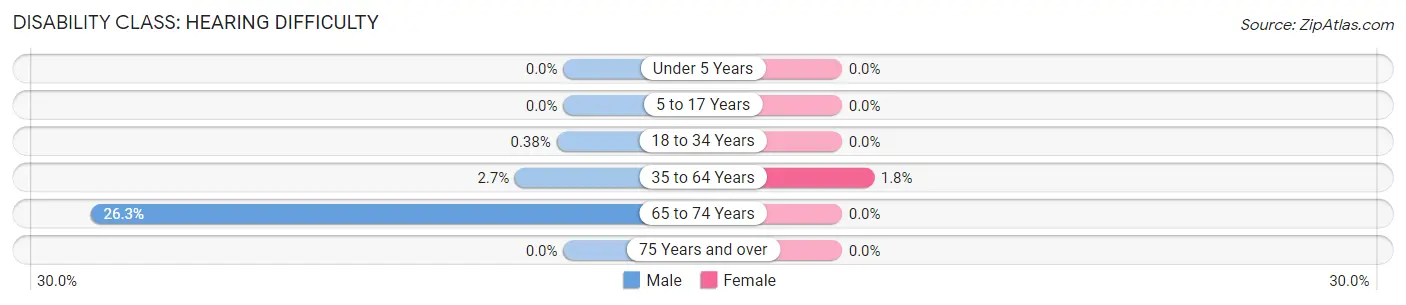
| Age Bracket | Male | Female |
| Under 5 Years | 0 (0.0%) | 0 (0.0%) |
| 5 to 17 Years | 0 (0.0%) | 0 (0.0%) |
| 18 to 34 Years | 1 (0.4%) | 0 (0.0%) |
| 35 to 64 Years | 7 (2.7%) | 5 (1.8%) |
| 65 to 74 Years | 20 (26.3%) | 0 (0.0%) |
| 75 Years and over | 0 (0.0%) | 0 (0.0%) |
Disability Class: Vision Difficulty
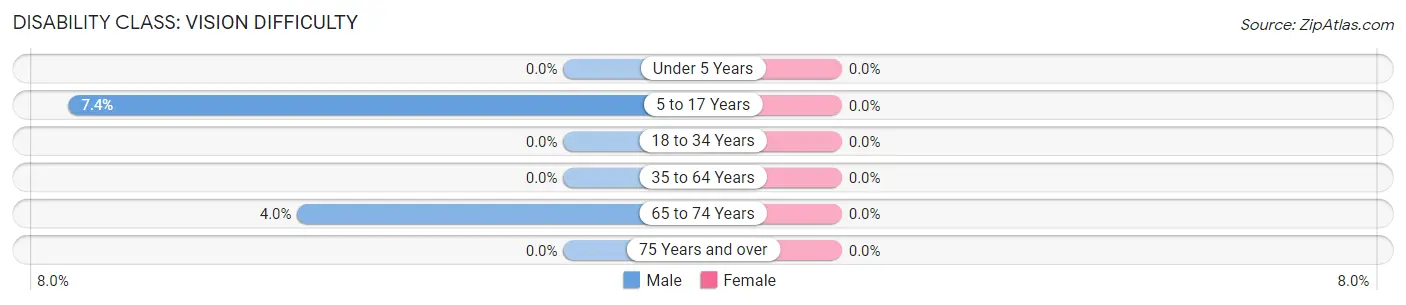
| Age Bracket | Male | Female |
| Under 5 Years | 0 (0.0%) | 0 (0.0%) |
| 5 to 17 Years | 15 (7.3%) | 0 (0.0%) |
| 18 to 34 Years | 0 (0.0%) | 0 (0.0%) |
| 35 to 64 Years | 0 (0.0%) | 0 (0.0%) |
| 65 to 74 Years | 3 (4.0%) | 0 (0.0%) |
| 75 Years and over | 0 (0.0%) | 0 (0.0%) |
Disability Class: Cognitive Difficulty
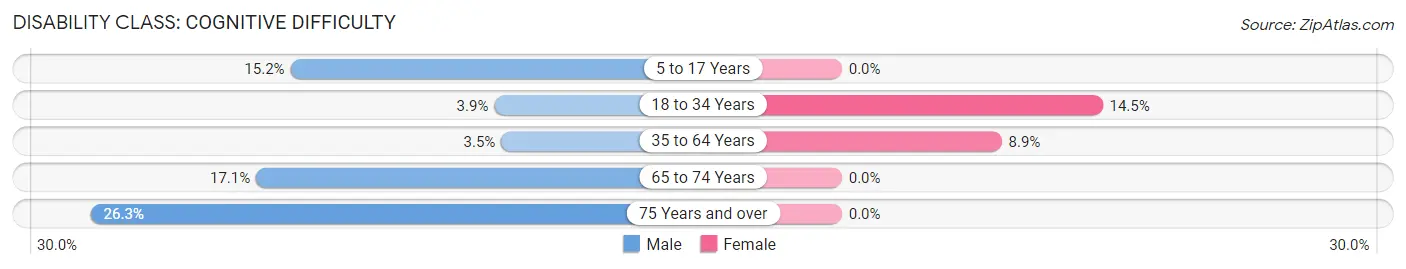
| Age Bracket | Male | Female |
| 5 to 17 Years | 31 (15.2%) | 0 (0.0%) |
| 18 to 34 Years | 10 (3.8%) | 27 (14.5%) |
| 35 to 64 Years | 9 (3.5%) | 25 (8.9%) |
| 65 to 74 Years | 13 (17.1%) | 0 (0.0%) |
| 75 Years and over | 5 (26.3%) | 0 (0.0%) |
Disability Class: Ambulatory Difficulty
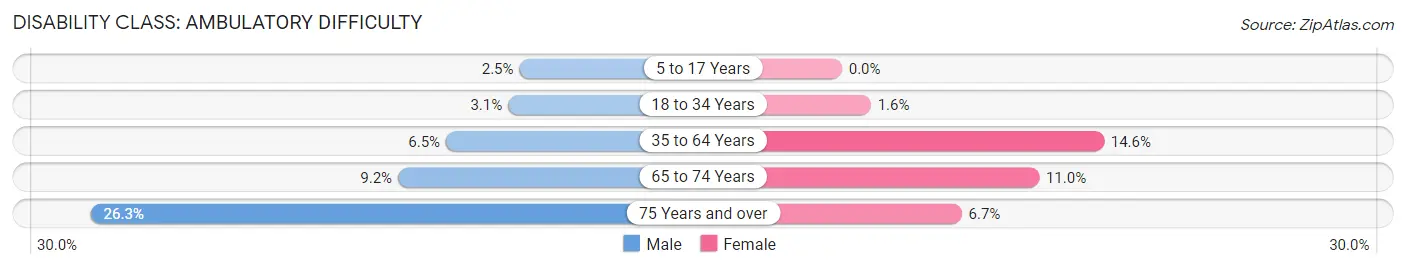
| Age Bracket | Male | Female |
| 5 to 17 Years | 5 (2.5%) | 0 (0.0%) |
| 18 to 34 Years | 8 (3.1%) | 3 (1.6%) |
| 35 to 64 Years | 17 (6.5%) | 41 (14.6%) |
| 65 to 74 Years | 7 (9.2%) | 9 (11.0%) |
| 75 Years and over | 5 (26.3%) | 2 (6.7%) |
Disability Class: Self-Care Difficulty
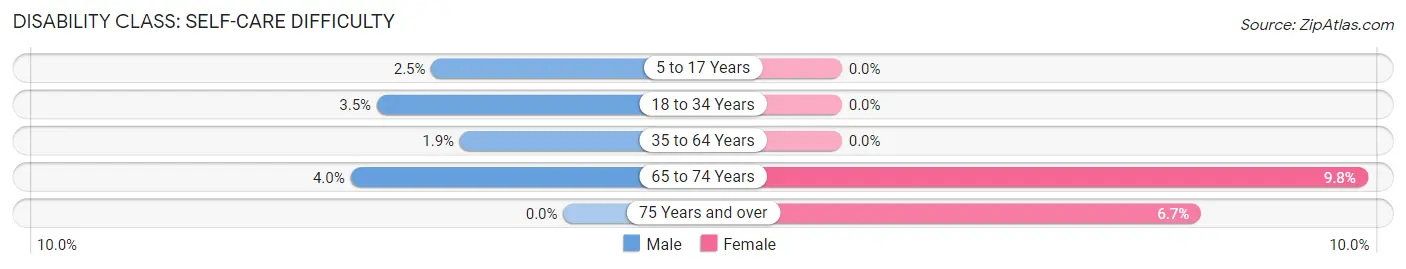
| Age Bracket | Male | Female |
| 5 to 17 Years | 5 (2.5%) | 0 (0.0%) |
| 18 to 34 Years | 9 (3.5%) | 0 (0.0%) |
| 35 to 64 Years | 5 (1.9%) | 0 (0.0%) |
| 65 to 74 Years | 3 (4.0%) | 8 (9.8%) |
| 75 Years and over | 0 (0.0%) | 2 (6.7%) |
Technology Access in Freedom borough
Computing Device Access in Freedom borough
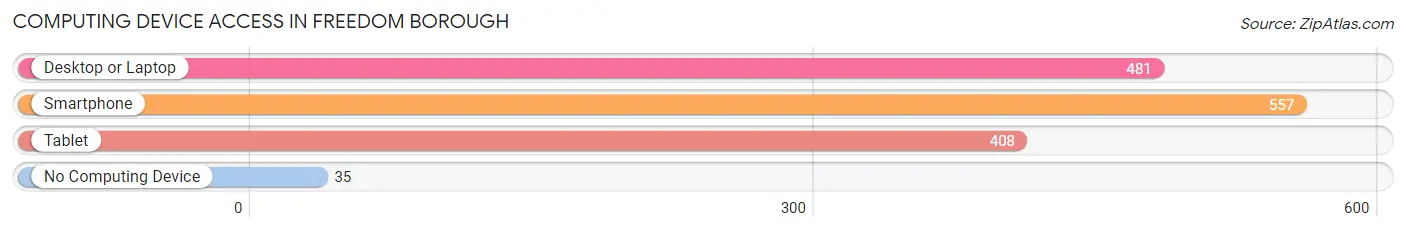
| Device Type | # Households | % Households |
| Desktop or Laptop | 481 | 76.2% |
| Smartphone | 557 | 88.3% |
| Tablet | 408 | 64.7% |
| No Computing Device | 35 | 5.6% |
| Total | 631 | 100.0% |
Internet Access in Freedom borough
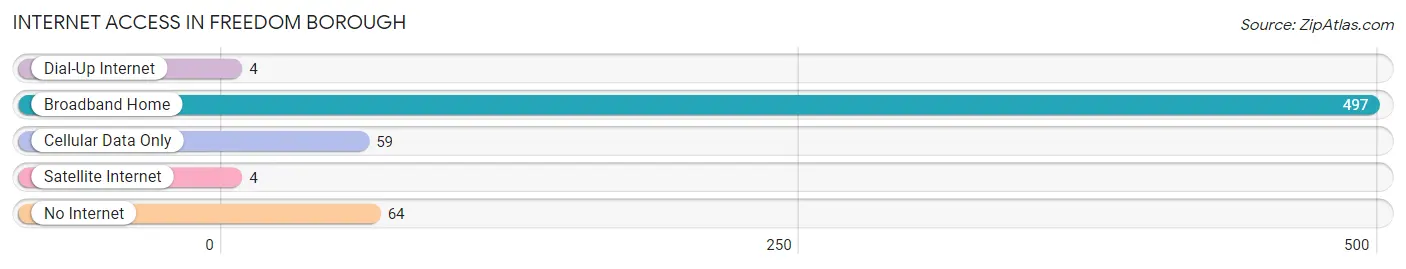
| Internet Type | # Households | % Households |
| Dial-Up Internet | 4 | 0.6% |
| Broadband Home | 497 | 78.8% |
| Cellular Data Only | 59 | 9.3% |
| Satellite Internet | 4 | 0.6% |
| No Internet | 64 | 10.1% |
| Total | 631 | 100.0% |
Freedom borough Summary
Borough of Freedom Pennsylvania
History
The Borough of Freedom, Pennsylvania is located in Beaver County, Pennsylvania, and is part of the Pittsburgh metropolitan area. The borough was founded in 1832 and was originally known as Freedom Township. The name was changed to the Borough of Freedom in 1867.
The borough was originally settled by German immigrants in the early 1800s. The first settlers were the families of John and Jacob Miller, who arrived in 1802. The Millers were followed by other German families, including the Schmidts, the Schaffers, the Schaeffers, and the Schaeffers.
The borough was an agricultural community for many years, with the main crops being wheat, corn, and oats. The borough also had a number of small businesses, including a sawmill, a gristmill, a blacksmith shop, and a general store.
In the late 1800s, the borough began to experience a period of growth and development. The population increased from 1,000 in 1880 to 2,000 in 1900. This growth was due in part to the construction of the Pittsburgh and Lake Erie Railroad, which ran through the borough.
The borough continued to grow and develop throughout the 20th century. In the 1950s, the borough experienced a period of industrialization, with the construction of several factories. The borough also experienced a period of suburbanization in the 1960s and 1970s, as many people moved to the borough from the city of Pittsburgh.
Geography
The Borough of Freedom is located in Beaver County, Pennsylvania, and is part of the Pittsburgh metropolitan area. The borough is situated on the banks of the Ohio River, and is bordered by the boroughs of Rochester and Monaca to the north, and the townships of Brighton and New Sewickley to the south.
The borough has a total area of 1.3 square miles, all of which is land. The borough is located at an elevation of 890 feet above sea level.
Economy
The economy of the Borough of Freedom is largely based on manufacturing and retail. The borough is home to several factories, including a steel mill, a paper mill, and a plastics plant. The borough also has several retail stores, including a grocery store, a hardware store, and a pharmacy.
The borough also has a number of small businesses, including restaurants, bars, and other service-oriented businesses.
Demographics
As of the 2010 census, the population of the Borough of Freedom was 2,845. The racial makeup of the borough was 94.3% White, 2.7% African American, 0.3% Native American, 0.7% Asian, 0.1% Pacific Islander, 0.7% from other races, and 1.2% from two or more races. Hispanic or Latino of any race were 1.7% of the population.
The median household income in the borough was $41,944, and the median family income was $50,938. The per capita income in the borough was $20,945. About 8.3% of families and 10.2% of the population were below the poverty line, including 14.2% of those under age 18 and 6.3% of those age 65 or over.
Common Questions
What is Per Capita Income in Freedom borough?
Per Capita income in Freedom borough is $26,445.
What is the Median Family Income in Freedom borough?
Median Family Income in Freedom borough is $67,803.
What is the Median Household income in Freedom borough?
Median Household Income in Freedom borough is $60,074.
What is Income or Wage Gap in Freedom borough?
Income or Wage Gap in Freedom borough is 20.8%.
Women in Freedom borough earn 79.2 cents for every dollar earned by a man.
What is Inequality or Gini Index in Freedom borough?
Inequality or Gini Index in Freedom borough is 0.41.
What is the Total Population of Freedom borough?
Total Population of Freedom borough is 1,625.
What is the Total Male Population of Freedom borough?
Total Male Population of Freedom borough is 879.
What is the Total Female Population of Freedom borough?
Total Female Population of Freedom borough is 746.
What is the Ratio of Males per 100 Females in Freedom borough?
There are 117.83 Males per 100 Females in Freedom borough.
What is the Ratio of Females per 100 Males in Freedom borough?
There are 84.87 Females per 100 Males in Freedom borough.
What is the Median Population Age in Freedom borough?
Median Population Age in Freedom borough is 30.6 Years.
What is the Average Family Size in Freedom borough
Average Family Size in Freedom borough is 3.1 People.
What is the Average Household Size in Freedom borough
Average Household Size in Freedom borough is 2.6 People.
How Large is the Labor Force in Freedom borough?
There are 838 People in the Labor Forcein in Freedom borough.
What is the Percentage of People in the Labor Force in Freedom borough?
68.0% of People are in the Labor Force in Freedom borough.
What is the Unemployment Rate in Freedom borough?
Unemployment Rate in Freedom borough is 4.4%.