Franklin, PA Map & Demographics
Franklin Map
Franklin Overview
$32,849
PER CAPITA INCOME
$72,404
AVG FAMILY INCOME
$54,235
AVG HOUSEHOLD INCOME
27.4%
WAGE / INCOME GAP [ % ]
72.6¢/ $1
WAGE / INCOME GAP [ $ ]
0.45
INEQUALITY / GINI INDEX
6,066
TOTAL POPULATION
2,909
MALE POPULATION
3,157
FEMALE POPULATION
92.14
MALES / 100 FEMALES
108.53
FEMALES / 100 MALES
43.9
MEDIAN AGE
2.7
AVG FAMILY SIZE
2.2
AVG HOUSEHOLD SIZE
2,911
LABOR FORCE [ PEOPLE ]
58.4%
PERCENT IN LABOR FORCE
7.2%
UNEMPLOYMENT RATE
Franklin Zip Codes
Franklin Area Codes
Income in Franklin
Income Overview in Franklin
Per Capita Income in Franklin is $32,849, while median incomes of families and households are $72,404 and $54,235 respectively.
| Characteristic | Number | Measure |
| Per Capita Income | 6,066 | $32,849 |
| Median Family Income | 1,653 | $72,404 |
| Mean Family Income | 1,653 | $87,142 |
| Median Household Income | 2,676 | $54,235 |
| Mean Household Income | 2,676 | $72,094 |
| Income Deficit | 1,653 | $0 |
| Wage / Income Gap (%) | 6,066 | 27.41% |
| Wage / Income Gap ($) | 6,066 | 72.59¢ per $1 |
| Gini / Inequality Index | 6,066 | 0.45 |
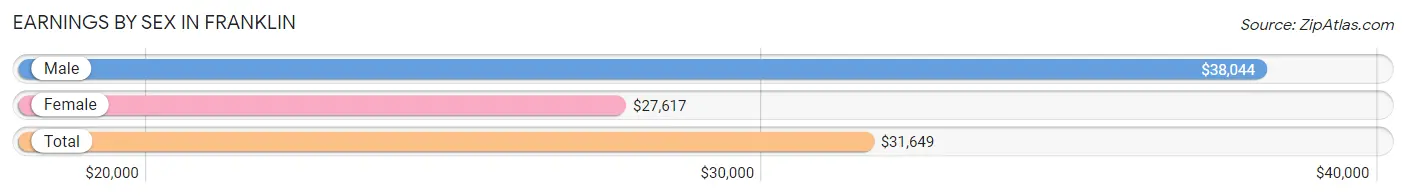
Earnings by Sex in Franklin
Average Earnings in Franklin are $31,649, $38,044 for men and $27,617 for women, a difference of 27.4%.
| Sex | Number | Average Earnings |
| Male | 1,543 (50.7%) | $38,044 |
| Female | 1,503 (49.3%) | $27,617 |
| Total | 3,046 (100.0%) | $31,649 |
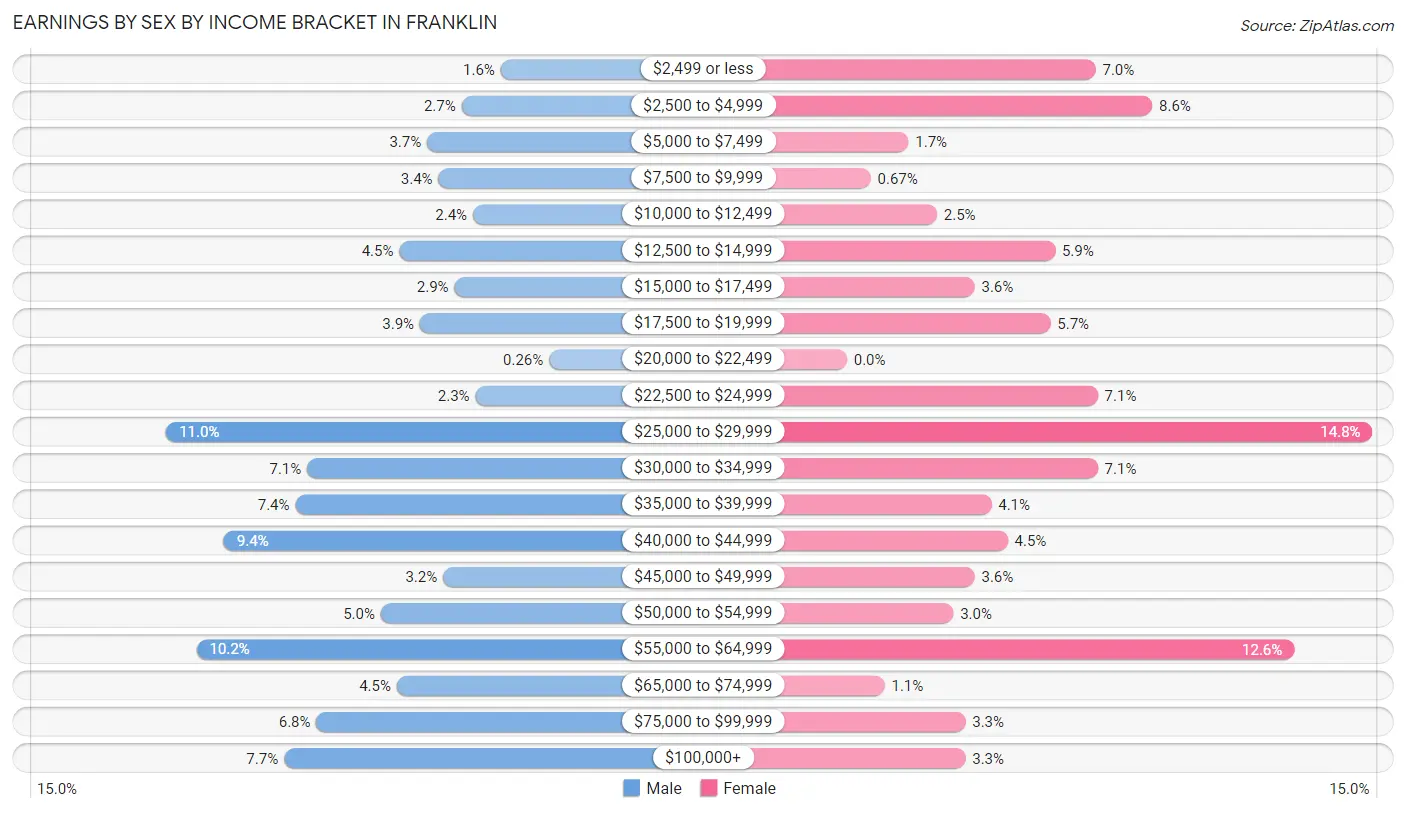
Earnings by Sex by Income Bracket in Franklin
The most common earnings brackets in Franklin are $25,000 to $29,999 for men (170 | 11.0%) and $25,000 to $29,999 for women (222 | 14.8%).
| Income | Male | Female |
| $2,499 or less | 25 (1.6%) | 105 (7.0%) |
| $2,500 to $4,999 | 42 (2.7%) | 129 (8.6%) |
| $5,000 to $7,499 | 57 (3.7%) | 26 (1.7%) |
| $7,500 to $9,999 | 52 (3.4%) | 10 (0.7%) |
| $10,000 to $12,499 | 37 (2.4%) | 38 (2.5%) |
| $12,500 to $14,999 | 69 (4.5%) | 88 (5.9%) |
| $15,000 to $17,499 | 45 (2.9%) | 54 (3.6%) |
| $17,500 to $19,999 | 60 (3.9%) | 86 (5.7%) |
| $20,000 to $22,499 | 4 (0.3%) | 0 (0.0%) |
| $22,500 to $24,999 | 36 (2.3%) | 106 (7.0%) |
| $25,000 to $29,999 | 170 (11.0%) | 222 (14.8%) |
| $30,000 to $34,999 | 109 (7.1%) | 106 (7.0%) |
| $35,000 to $39,999 | 114 (7.4%) | 61 (4.1%) |
| $40,000 to $44,999 | 145 (9.4%) | 68 (4.5%) |
| $45,000 to $49,999 | 50 (3.2%) | 54 (3.6%) |
| $50,000 to $54,999 | 77 (5.0%) | 45 (3.0%) |
| $55,000 to $64,999 | 157 (10.2%) | 189 (12.6%) |
| $65,000 to $74,999 | 70 (4.5%) | 16 (1.1%) |
| $75,000 to $99,999 | 105 (6.8%) | 50 (3.3%) |
| $100,000+ | 119 (7.7%) | 50 (3.3%) |
| Total | 1,543 (100.0%) | 1,503 (100.0%) |
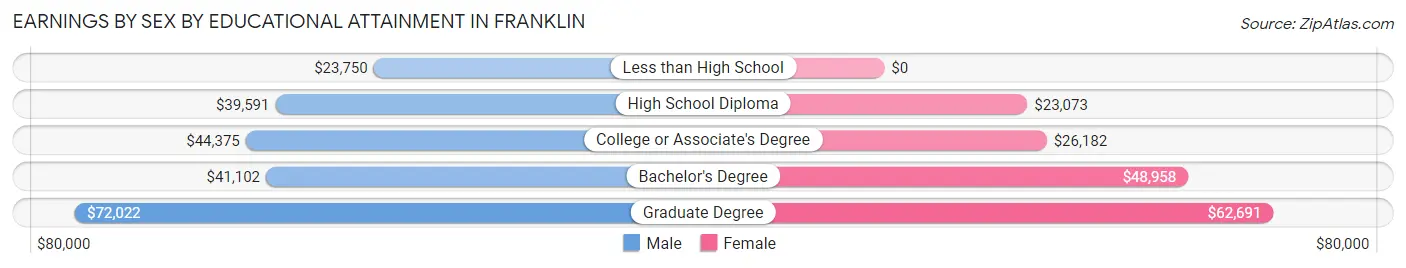
Earnings by Sex by Educational Attainment in Franklin
Average earnings in Franklin are $41,613 for men and $28,784 for women, a difference of 30.8%. Men with an educational attainment of graduate degree enjoy the highest average annual earnings of $72,022, while those with less than high school education earn the least with $23,750. Women with an educational attainment of graduate degree earn the most with the average annual earnings of $62,691, while those with high school diploma education have the smallest earnings of $23,073.
| Educational Attainment | Male Income | Female Income |
| Less than High School | $23,750 | $0 |
| High School Diploma | $39,591 | $23,073 |
| College or Associate's Degree | $44,375 | $26,182 |
| Bachelor's Degree | $41,102 | $48,958 |
| Graduate Degree | $72,022 | $62,691 |
| Total | $41,613 | $28,784 |
Family Income in Franklin
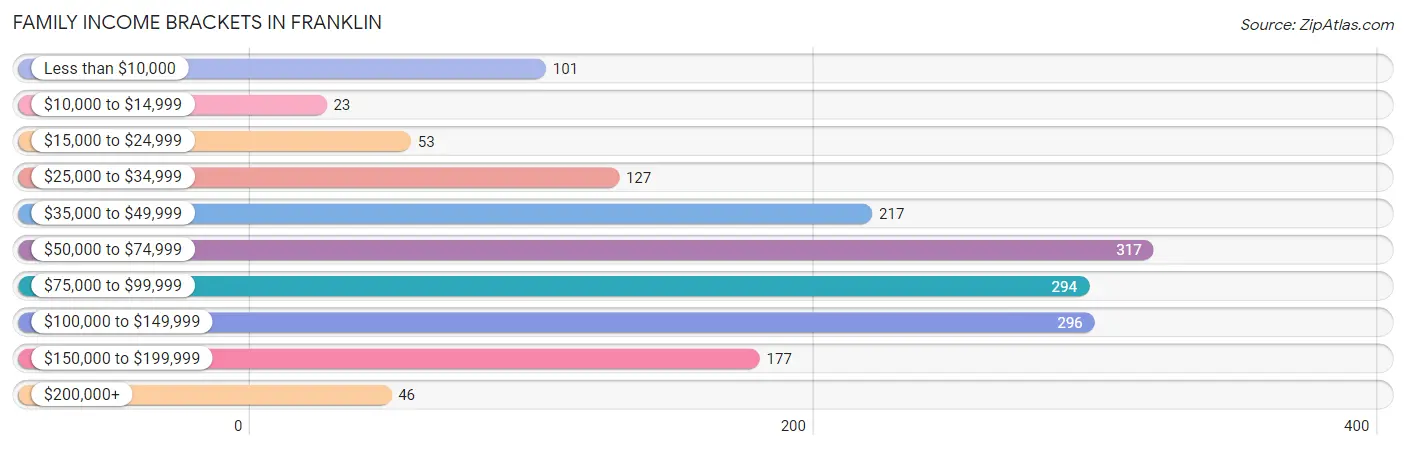
Family Income Brackets in Franklin
According to the Franklin family income data, there are 317 families falling into the $50,000 to $74,999 income range, which is the most common income bracket and makes up 19.2% of all families. Conversely, the $10,000 to $14,999 income bracket is the least frequent group with only 23 families (1.4%) belonging to this category.
| Income Bracket | # Families | % Families |
| Less than $10,000 | 101 | 6.1% |
| $10,000 to $14,999 | 23 | 1.4% |
| $15,000 to $24,999 | 53 | 3.2% |
| $25,000 to $34,999 | 127 | 7.7% |
| $35,000 to $49,999 | 217 | 13.1% |
| $50,000 to $74,999 | 317 | 19.2% |
| $75,000 to $99,999 | 294 | 17.8% |
| $100,000 to $149,999 | 296 | 17.9% |
| $150,000 to $199,999 | 177 | 10.7% |
| $200,000+ | 46 | 2.8% |
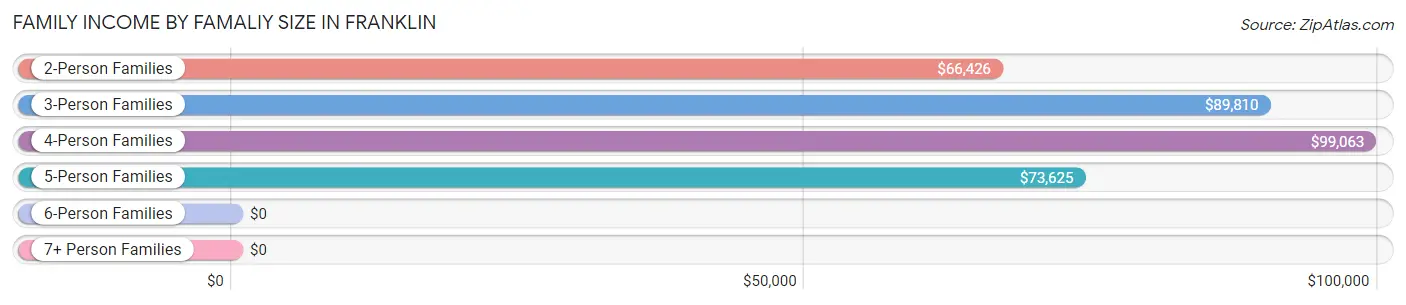
Family Income by Famaliy Size in Franklin
4-person families (139 | 8.4%) account for the highest median family income in Franklin with $99,063 per family, while 2-person families (919 | 55.6%) have the highest median income of $33,213 per family member.
| Income Bracket | # Families | Median Income |
| 2-Person Families | 919 (55.6%) | $66,426 |
| 3-Person Families | 478 (28.9%) | $89,810 |
| 4-Person Families | 139 (8.4%) | $99,063 |
| 5-Person Families | 71 (4.3%) | $73,625 |
| 6-Person Families | 5 (0.3%) | $0 |
| 7+ Person Families | 41 (2.5%) | $0 |
| Total | 1,653 (100.0%) | $72,404 |
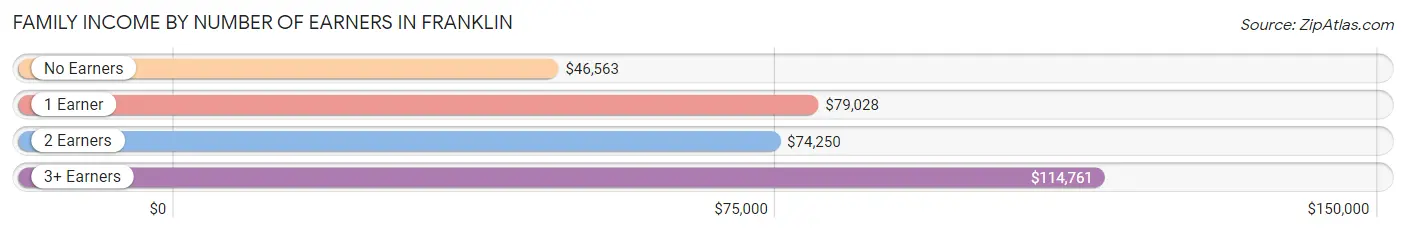
Family Income by Number of Earners in Franklin
The median family income in Franklin is $72,404, with families comprising 3+ earners (137) having the highest median family income of $114,761, while families with no earners (376) have the lowest median family income of $46,563, accounting for 8.3% and 22.8% of families, respectively.
| Number of Earners | # Families | Median Income |
| No Earners | 376 (22.8%) | $46,563 |
| 1 Earner | 498 (30.1%) | $79,028 |
| 2 Earners | 642 (38.8%) | $74,250 |
| 3+ Earners | 137 (8.3%) | $114,761 |
| Total | 1,653 (100.0%) | $72,404 |
Household Income in Franklin
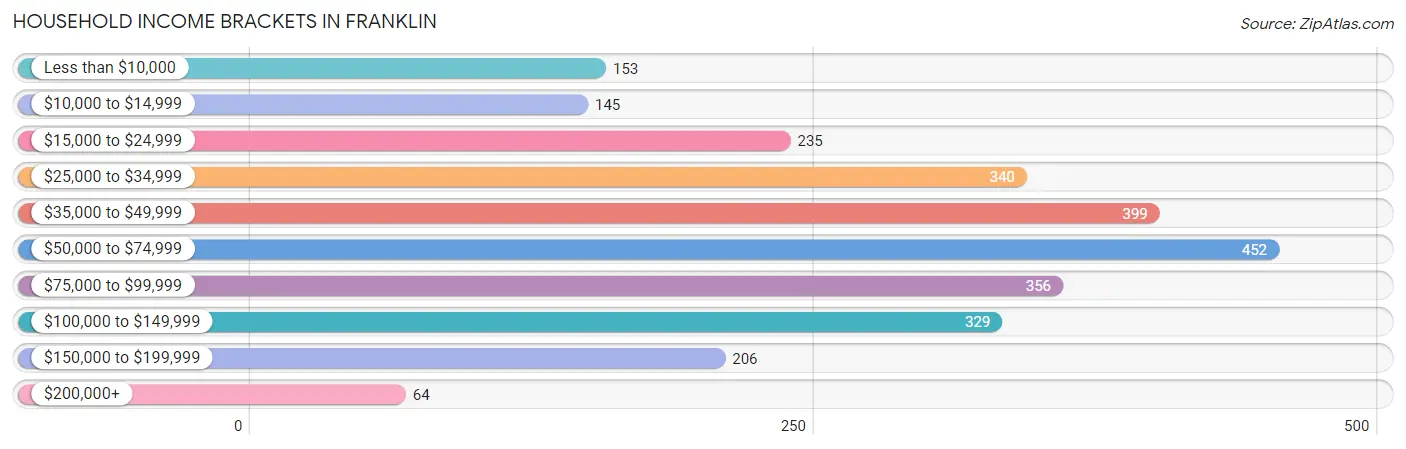
Household Income Brackets in Franklin
With 452 households falling in the category, the $50,000 to $74,999 income range is the most frequent in Franklin, accounting for 16.9% of all households. In contrast, only 64 households (2.4%) fall into the $200,000+ income bracket, making it the least populous group.
| Income Bracket | # Households | % Households |
| Less than $10,000 | 153 | 5.7% |
| $10,000 to $14,999 | 145 | 5.4% |
| $15,000 to $24,999 | 235 | 8.8% |
| $25,000 to $34,999 | 340 | 12.7% |
| $35,000 to $49,999 | 399 | 14.9% |
| $50,000 to $74,999 | 452 | 16.9% |
| $75,000 to $99,999 | 356 | 13.3% |
| $100,000 to $149,999 | 329 | 12.3% |
| $150,000 to $199,999 | 206 | 7.7% |
| $200,000+ | 64 | 2.4% |
Household Income by Householder Age in Franklin
The median household income in Franklin is $54,235, with the highest median household income of $68,146 found in the 45 to 64 years age bracket for the primary householder. A total of 979 households (36.6%) fall into this category. Meanwhile, the 15 to 24 years age bracket for the primary householder has the lowest median household income of $0, with 86 households (3.2%) in this group.
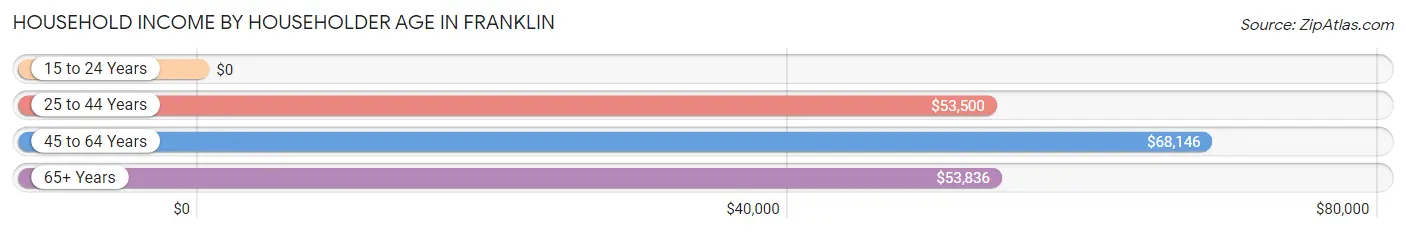
| Income Bracket | # Households | Median Income |
| 15 to 24 Years | 86 (3.2%) | $0 |
| 25 to 44 Years | 750 (28.0%) | $53,500 |
| 45 to 64 Years | 979 (36.6%) | $68,146 |
| 65+ Years | 861 (32.2%) | $53,836 |
| Total | 2,676 (100.0%) | $54,235 |
Poverty in Franklin
Income Below Poverty by Sex and Age in Franklin
With 16.4% poverty level for males and 18.8% for females among the residents of Franklin, 6 to 11 year old males and 15 year old females are the most vulnerable to poverty, with 71 males (54.2%) and 54 females (80.6%) in their respective age groups living below the poverty level.
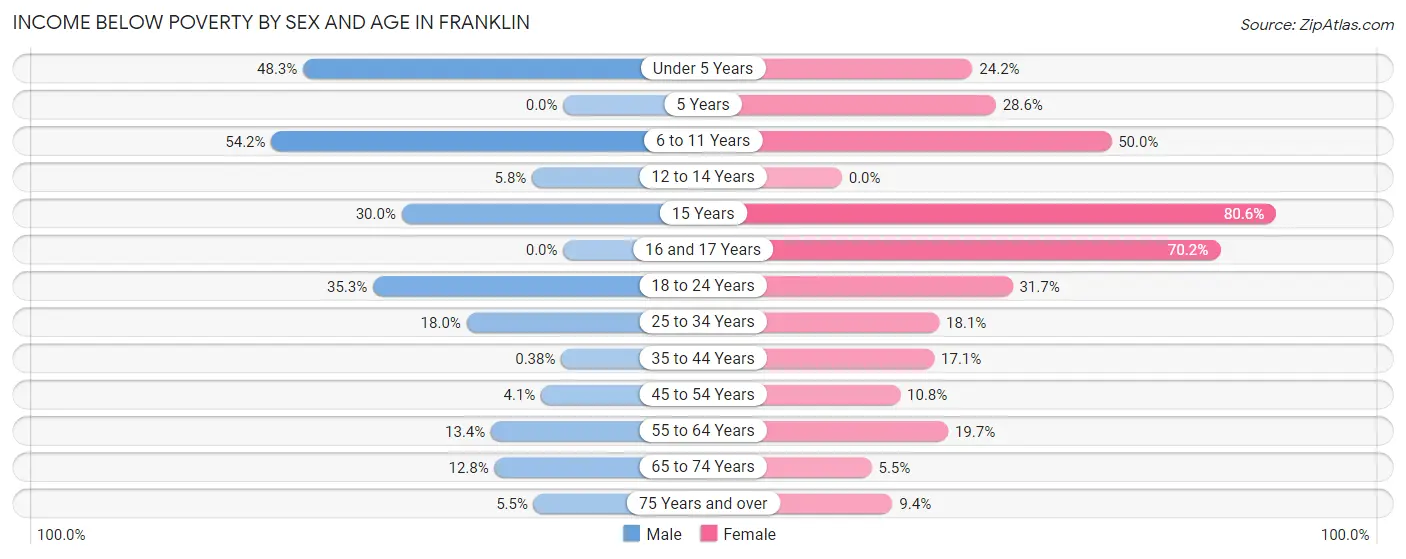
| Age Bracket | Male | Female |
| Under 5 Years | 85 (48.3%) | 48 (24.2%) |
| 5 Years | 0 (0.0%) | 16 (28.6%) |
| 6 to 11 Years | 71 (54.2%) | 53 (50.0%) |
| 12 to 14 Years | 10 (5.8%) | 0 (0.0%) |
| 15 Years | 9 (30.0%) | 54 (80.6%) |
| 16 and 17 Years | 0 (0.0%) | 33 (70.2%) |
| 18 to 24 Years | 89 (35.3%) | 64 (31.7%) |
| 25 to 34 Years | 70 (17.9%) | 71 (18.1%) |
| 35 to 44 Years | 1 (0.4%) | 62 (17.1%) |
| 45 to 54 Years | 17 (4.1%) | 41 (10.8%) |
| 55 to 64 Years | 46 (13.4%) | 83 (19.7%) |
| 65 to 74 Years | 41 (12.8%) | 23 (5.5%) |
| 75 Years and over | 12 (5.5%) | 29 (9.4%) |
| Total | 451 (16.4%) | 577 (18.8%) |
Income Above Poverty by Sex and Age in Franklin
According to the poverty statistics in Franklin, males aged 5 years and females aged 12 to 14 years are the age groups that are most secure financially, with 100.0% of males and 100.0% of females in these age groups living above the poverty line.
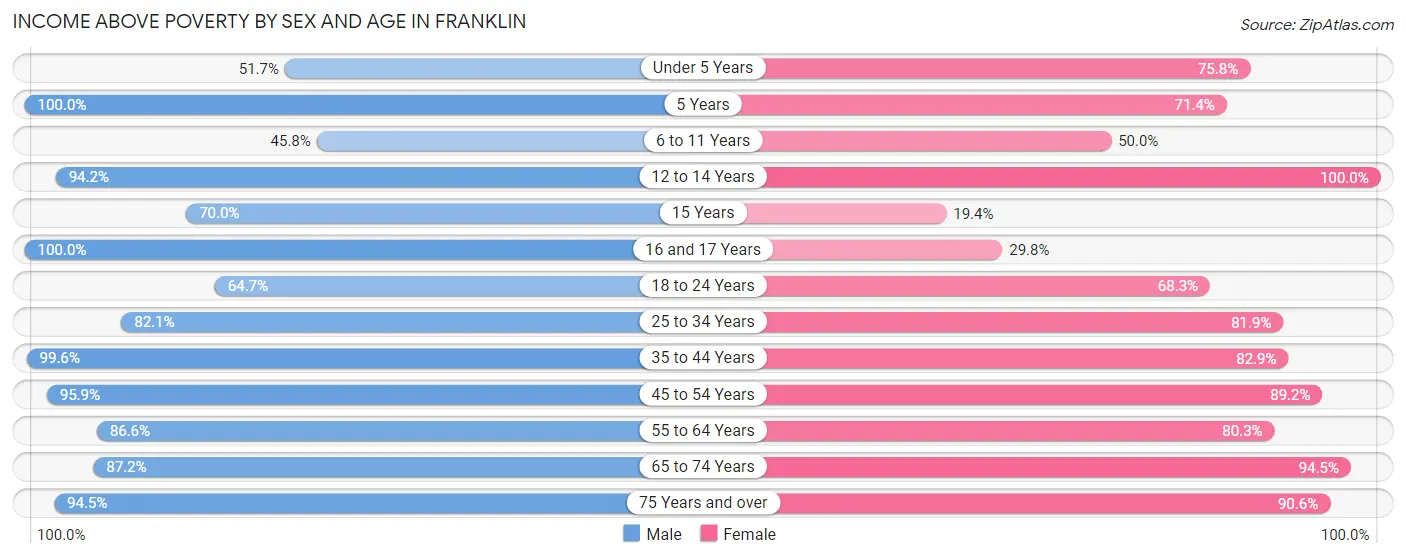
| Age Bracket | Male | Female |
| Under 5 Years | 91 (51.7%) | 150 (75.8%) |
| 5 Years | 10 (100.0%) | 40 (71.4%) |
| 6 to 11 Years | 60 (45.8%) | 53 (50.0%) |
| 12 to 14 Years | 163 (94.2%) | 118 (100.0%) |
| 15 Years | 21 (70.0%) | 13 (19.4%) |
| 16 and 17 Years | 30 (100.0%) | 14 (29.8%) |
| 18 to 24 Years | 163 (64.7%) | 138 (68.3%) |
| 25 to 34 Years | 320 (82.1%) | 322 (81.9%) |
| 35 to 44 Years | 263 (99.6%) | 300 (82.9%) |
| 45 to 54 Years | 396 (95.9%) | 338 (89.2%) |
| 55 to 64 Years | 297 (86.6%) | 338 (80.3%) |
| 65 to 74 Years | 280 (87.2%) | 394 (94.5%) |
| 75 Years and over | 207 (94.5%) | 280 (90.6%) |
| Total | 2,301 (83.6%) | 2,498 (81.2%) |
Income Below Poverty Among Married-Couple Families in Franklin
The poverty statistics for married-couple families in Franklin show that 4.0% or 43 of the total 1,072 families live below the poverty line. Families with 5 or more children have the highest poverty rate of 41.5%, comprising of 17 families. On the other hand, families with 3 or 4 children have the lowest poverty rate of 0.0%, which includes 0 families.
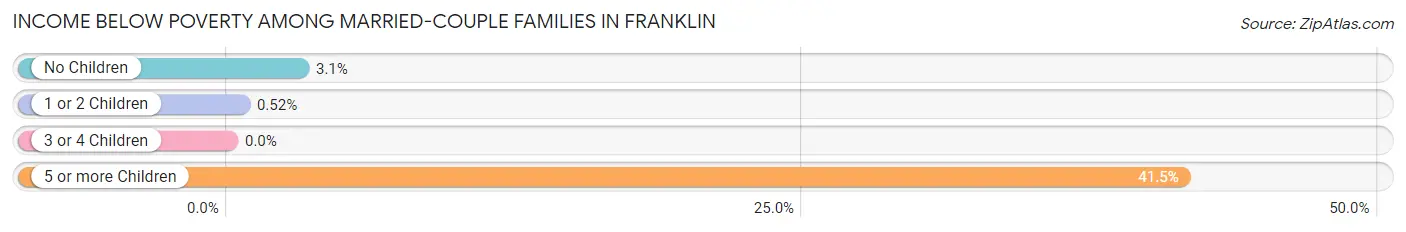
| Children | Above Poverty | Below Poverty |
| No Children | 784 (96.9%) | 25 (3.1%) |
| 1 or 2 Children | 190 (99.5%) | 1 (0.5%) |
| 3 or 4 Children | 31 (100.0%) | 0 (0.0%) |
| 5 or more Children | 24 (58.5%) | 17 (41.5%) |
| Total | 1,029 (96.0%) | 43 (4.0%) |
Income Below Poverty Among Single-Parent Households in Franklin
According to the poverty data in Franklin, 2.1% or 4 single-father households and 34.2% or 135 single-mother households are living below the poverty line. Among single-father households, those with 1 or 2 children have the highest poverty rate, with 4 households (2.5%) experiencing poverty. Likewise, among single-mother households, those with 3 or 4 children have the highest poverty rate, with 38 households (65.5%) falling below the poverty line.
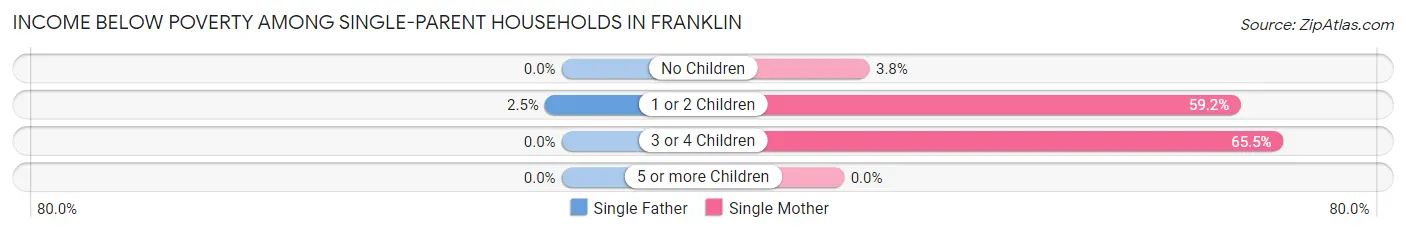
| Children | Single Father | Single Mother |
| No Children | 0 (0.0%) | 7 (3.8%) |
| 1 or 2 Children | 4 (2.5%) | 90 (59.2%) |
| 3 or 4 Children | 0 (0.0%) | 38 (65.5%) |
| 5 or more Children | 0 (0.0%) | 0 (0.0%) |
| Total | 4 (2.1%) | 135 (34.2%) |
Income Below Poverty Among Married-Couple vs Single-Parent Households in Franklin
The poverty data for Franklin shows that 43 of the married-couple family households (4.0%) and 139 of the single-parent households (23.9%) are living below the poverty level. Within the married-couple family households, those with 5 or more children have the highest poverty rate, with 17 households (41.5%) falling below the poverty line. Among the single-parent households, those with 3 or 4 children have the highest poverty rate, with 38 household (65.5%) living below poverty.
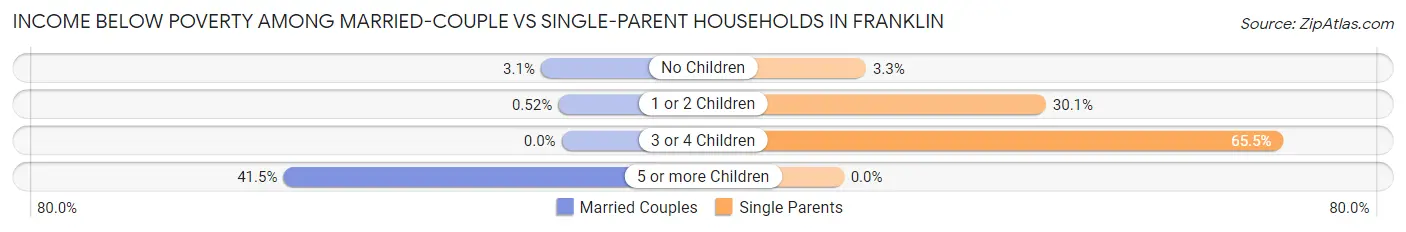
| Children | Married-Couple Families | Single-Parent Households |
| No Children | 25 (3.1%) | 7 (3.3%) |
| 1 or 2 Children | 1 (0.5%) | 94 (30.1%) |
| 3 or 4 Children | 0 (0.0%) | 38 (65.5%) |
| 5 or more Children | 17 (41.5%) | 0 (0.0%) |
| Total | 43 (4.0%) | 139 (23.9%) |
Race in Franklin
The most populous races in Franklin are White / Caucasian (5,404 | 89.1%), Black / African American (326 | 5.4%), and Two or more Races (288 | 4.8%).
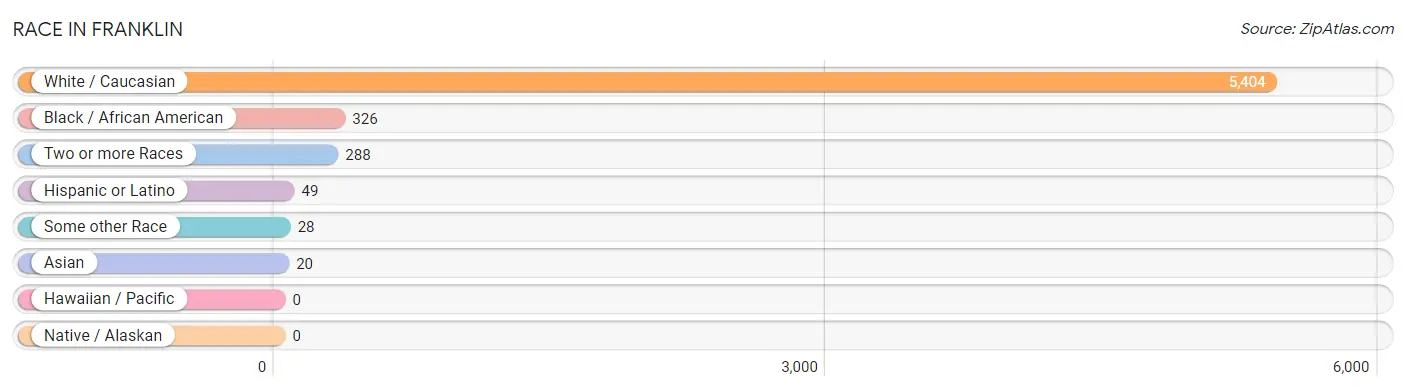
| Race | # Population | % Population |
| Asian | 20 | 0.3% |
| Black / African American | 326 | 5.4% |
| Hawaiian / Pacific | 0 | 0.0% |
| Hispanic or Latino | 49 | 0.8% |
| Native / Alaskan | 0 | 0.0% |
| White / Caucasian | 5,404 | 89.1% |
| Two or more Races | 288 | 4.8% |
| Some other Race | 28 | 0.5% |
| Total | 6,066 | 100.0% |
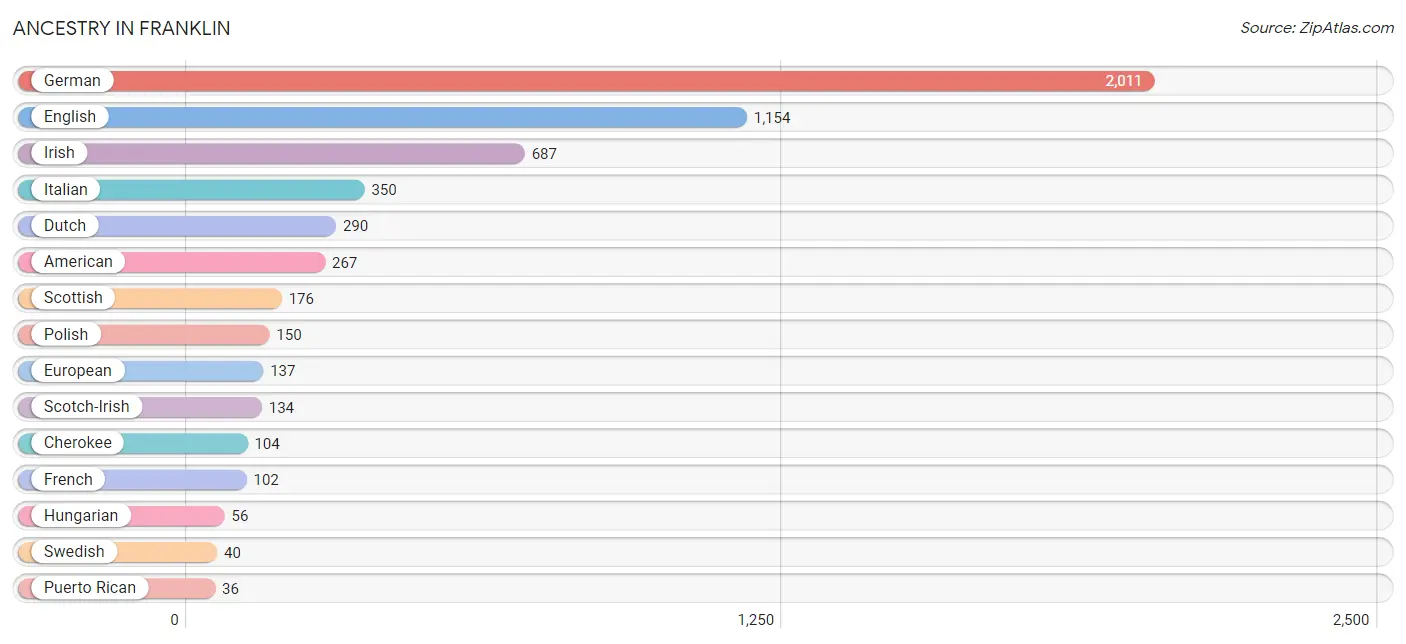
Ancestry in Franklin
The most populous ancestries reported in Franklin are German (2,011 | 33.2%), English (1,154 | 19.0%), Irish (687 | 11.3%), Italian (350 | 5.8%), and Dutch (290 | 4.8%), together accounting for 74.0% of all Franklin residents.
| Ancestry | # Population | % Population |
| African | 15 | 0.3% |
| American | 267 | 4.4% |
| Arab | 7 | 0.1% |
| Blackfeet | 9 | 0.2% |
| British | 7 | 0.1% |
| Burmese | 15 | 0.3% |
| Cajun | 4 | 0.1% |
| Central American | 6 | 0.1% |
| Cherokee | 104 | 1.7% |
| Cree | 4 | 0.1% |
| Croatian | 1 | 0.0% |
| Czech | 9 | 0.2% |
| Danish | 16 | 0.3% |
| Dutch | 290 | 4.8% |
| Eastern European | 12 | 0.2% |
| English | 1,154 | 19.0% |
| European | 137 | 2.3% |
| Finnish | 18 | 0.3% |
| French | 102 | 1.7% |
| French Canadian | 4 | 0.1% |
| German | 2,011 | 33.2% |
| Hungarian | 56 | 0.9% |
| Irish | 687 | 11.3% |
| Italian | 350 | 5.8% |
| Jamaican | 10 | 0.2% |
| Korean | 14 | 0.2% |
| Lithuanian | 15 | 0.3% |
| Mexican | 7 | 0.1% |
| Norwegian | 31 | 0.5% |
| Panamanian | 6 | 0.1% |
| Pennsylvania German | 26 | 0.4% |
| Polish | 150 | 2.5% |
| Puerto Rican | 36 | 0.6% |
| Russian | 8 | 0.1% |
| Scandinavian | 19 | 0.3% |
| Scotch-Irish | 134 | 2.2% |
| Scottish | 176 | 2.9% |
| Serbian | 6 | 0.1% |
| Slovak | 6 | 0.1% |
| Slovene | 9 | 0.2% |
| Subsaharan African | 15 | 0.3% |
| Swedish | 40 | 0.7% |
| Swiss | 16 | 0.3% |
| Syrian | 7 | 0.1% |
| Thai | 20 | 0.3% |
| Ukrainian | 15 | 0.3% |
| Welsh | 11 | 0.2% | View All 47 Rows |
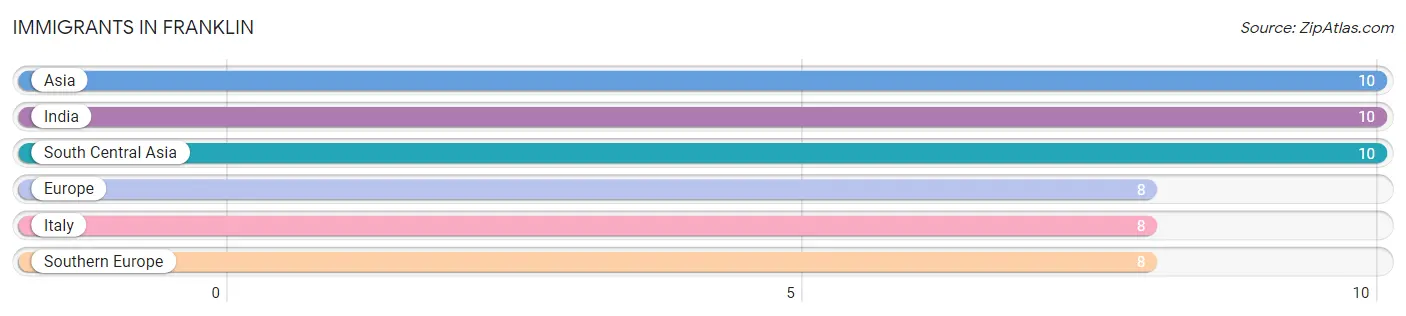
Immigrants in Franklin
The most numerous immigrant groups reported in Franklin came from Asia (10 | 0.2%), India (10 | 0.2%), South Central Asia (10 | 0.2%), Europe (8 | 0.1%), and Italy (8 | 0.1%), together accounting for 0.7% of all Franklin residents.
| Immigration Origin | # Population | % Population |
| Asia | 10 | 0.2% |
| Europe | 8 | 0.1% |
| India | 10 | 0.2% |
| Italy | 8 | 0.1% |
| South Central Asia | 10 | 0.2% |
| Southern Europe | 8 | 0.1% | View All 6 Rows |
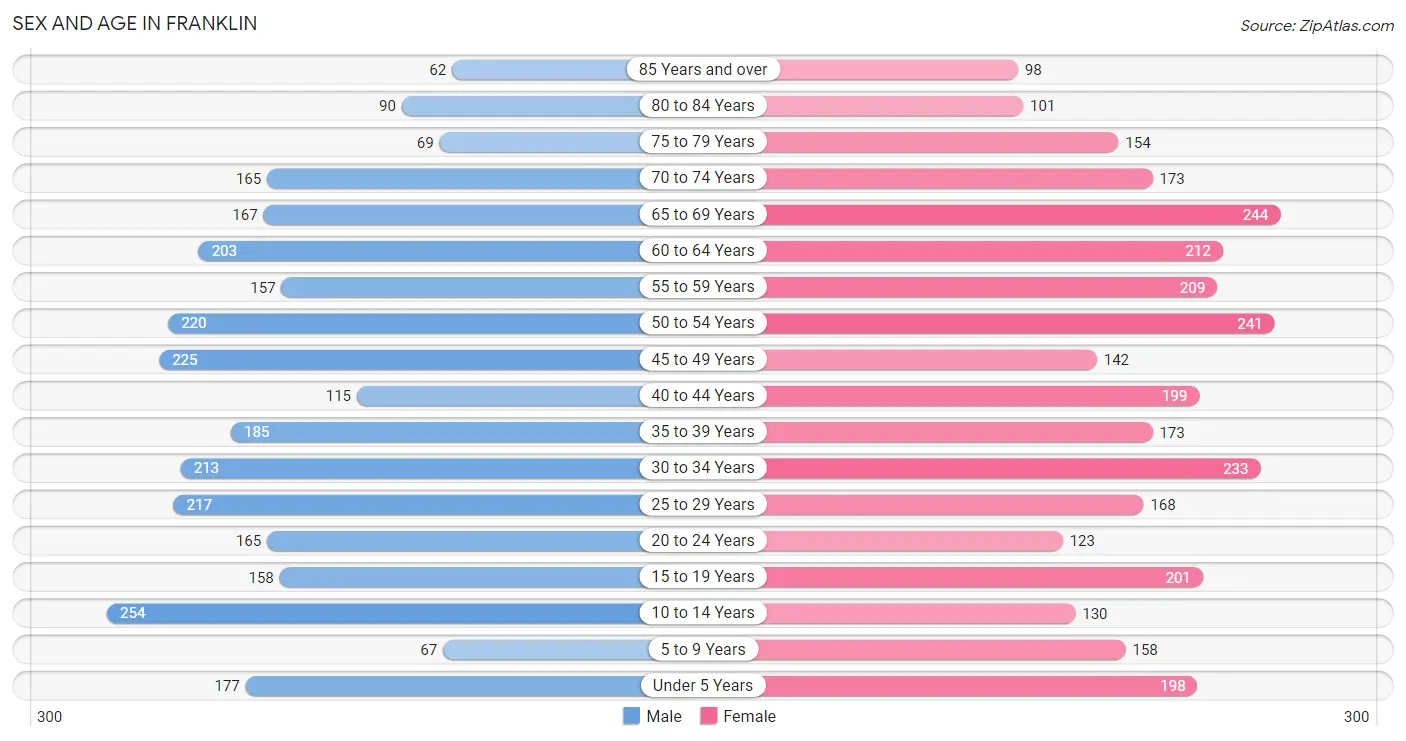
Sex and Age in Franklin
Sex and Age in Franklin
The most populous age groups in Franklin are 10 to 14 Years (254 | 8.7%) for men and 65 to 69 Years (244 | 7.7%) for women.
| Age Bracket | Male | Female |
| Under 5 Years | 177 (6.1%) | 198 (6.3%) |
| 5 to 9 Years | 67 (2.3%) | 158 (5.0%) |
| 10 to 14 Years | 254 (8.7%) | 130 (4.1%) |
| 15 to 19 Years | 158 (5.4%) | 201 (6.4%) |
| 20 to 24 Years | 165 (5.7%) | 123 (3.9%) |
| 25 to 29 Years | 217 (7.5%) | 168 (5.3%) |
| 30 to 34 Years | 213 (7.3%) | 233 (7.4%) |
| 35 to 39 Years | 185 (6.4%) | 173 (5.5%) |
| 40 to 44 Years | 115 (4.0%) | 199 (6.3%) |
| 45 to 49 Years | 225 (7.7%) | 142 (4.5%) |
| 50 to 54 Years | 220 (7.6%) | 241 (7.6%) |
| 55 to 59 Years | 157 (5.4%) | 209 (6.6%) |
| 60 to 64 Years | 203 (7.0%) | 212 (6.7%) |
| 65 to 69 Years | 167 (5.7%) | 244 (7.7%) |
| 70 to 74 Years | 165 (5.7%) | 173 (5.5%) |
| 75 to 79 Years | 69 (2.4%) | 154 (4.9%) |
| 80 to 84 Years | 90 (3.1%) | 101 (3.2%) |
| 85 Years and over | 62 (2.1%) | 98 (3.1%) |
| Total | 2,909 (100.0%) | 3,157 (100.0%) |
Families and Households in Franklin
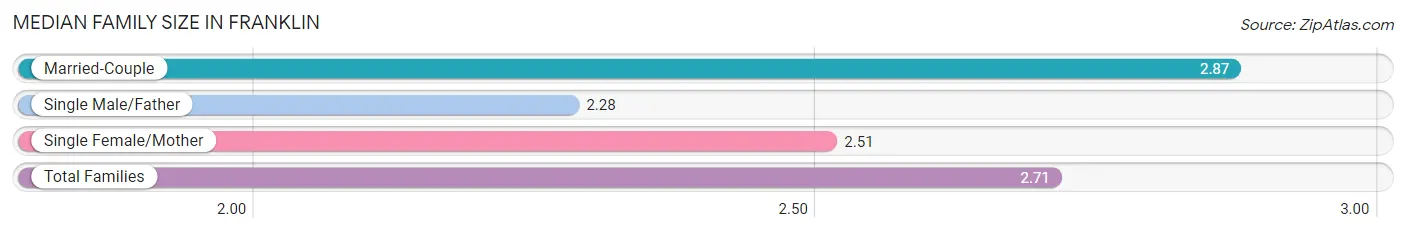
Median Family Size in Franklin
The median family size in Franklin is 2.71 persons per family, with married-couple families (1,072 | 64.8%) accounting for the largest median family size of 2.87 persons per family. On the other hand, single male/father families (186 | 11.3%) represent the smallest median family size with 2.28 persons per family.
| Family Type | # Families | Family Size |
| Married-Couple | 1,072 (64.8%) | 2.87 |
| Single Male/Father | 186 (11.3%) | 2.28 |
| Single Female/Mother | 395 (23.9%) | 2.51 |
| Total Families | 1,653 (100.0%) | 2.71 |
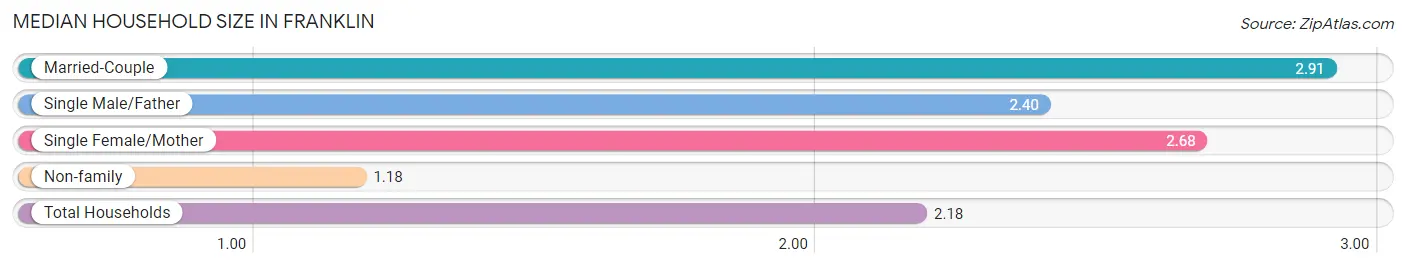
Median Household Size in Franklin
The median household size in Franklin is 2.18 persons per household, with married-couple households (1,072 | 40.1%) accounting for the largest median household size of 2.91 persons per household. non-family households (1,023 | 38.2%) represent the smallest median household size with 1.18 persons per household.
| Household Type | # Households | Household Size |
| Married-Couple | 1,072 (40.1%) | 2.91 |
| Single Male/Father | 186 (7.0%) | 2.40 |
| Single Female/Mother | 395 (14.8%) | 2.68 |
| Non-family | 1,023 (38.2%) | 1.18 |
| Total Households | 2,676 (100.0%) | 2.18 |
Household Size by Marriage Status in Franklin
Out of a total of 2,676 households in Franklin, 1,653 (61.8%) are family households, while 1,023 (38.2%) are nonfamily households. The most numerous type of family households are 2-person households, comprising 871, and the most common type of nonfamily households are 1-person households, comprising 844.
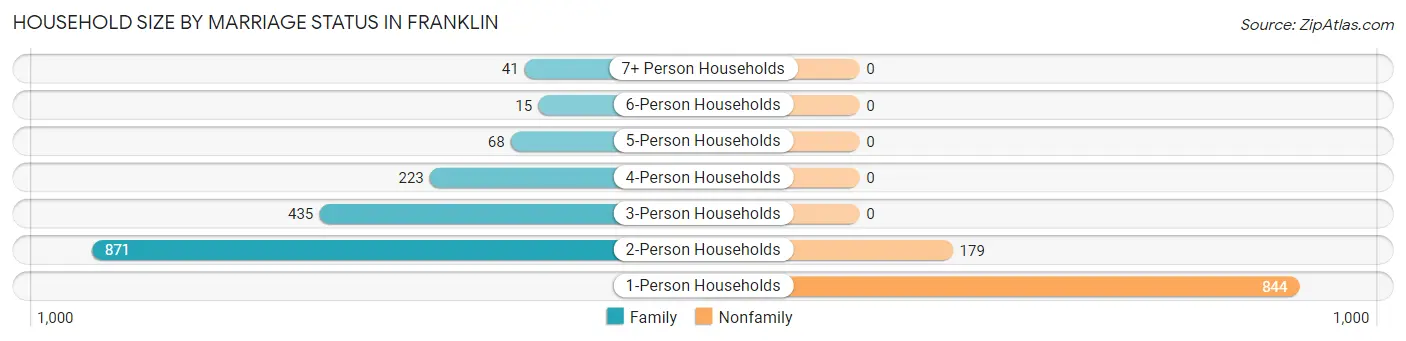
| Household Size | Family Households | Nonfamily Households |
| 1-Person Households | - | 844 (31.5%) |
| 2-Person Households | 871 (32.6%) | 179 (6.7%) |
| 3-Person Households | 435 (16.3%) | 0 (0.0%) |
| 4-Person Households | 223 (8.3%) | 0 (0.0%) |
| 5-Person Households | 68 (2.5%) | 0 (0.0%) |
| 6-Person Households | 15 (0.6%) | 0 (0.0%) |
| 7+ Person Households | 41 (1.5%) | 0 (0.0%) |
| Total | 1,653 (61.8%) | 1,023 (38.2%) |
Female Fertility in Franklin
Fertility by Age in Franklin
Average fertility rate in Franklin is 37.0 births per 1,000 women. Women in the age bracket of 20 to 34 years have the highest fertility rate with 53.0 births per 1,000 women. Women in the age bracket of 20 to 34 years acount for 58.3% of all women with births.
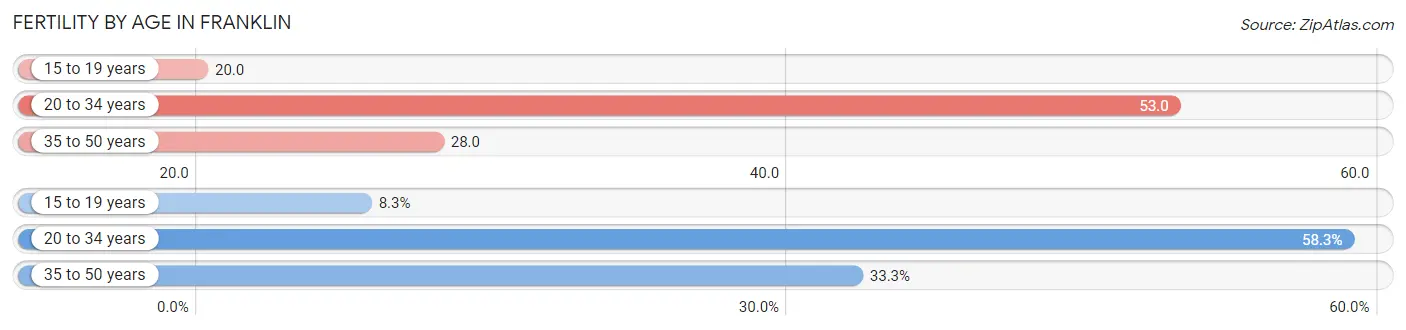
| Age Bracket | Women with Births | Births / 1,000 Women |
| 15 to 19 years | 4 (8.3%) | 20.0 |
| 20 to 34 years | 28 (58.3%) | 53.0 |
| 35 to 50 years | 16 (33.3%) | 28.0 |
| Total | 48 (100.0%) | 37.0 |
Fertility by Age by Marriage Status in Franklin
33.3% of women with births (48) in Franklin are married. The highest percentage of unmarried women with births falls into 15 to 19 years age bracket with 100.0% of them unmarried at the time of birth, while the lowest percentage of unmarried women with births belong to 35 to 50 years age bracket with 0.0% of them unmarried.
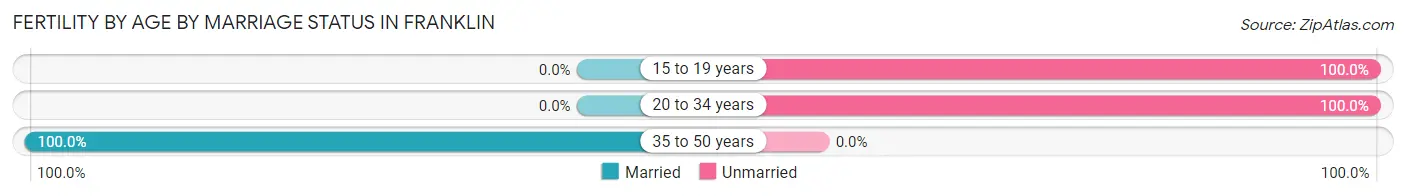
| Age Bracket | Married | Unmarried |
| 15 to 19 years | 0 (0.0%) | 4 (100.0%) |
| 20 to 34 years | 0 (0.0%) | 28 (100.0%) |
| 35 to 50 years | 16 (100.0%) | 0 (0.0%) |
| Total | 16 (33.3%) | 32 (66.7%) |
Fertility by Education in Franklin
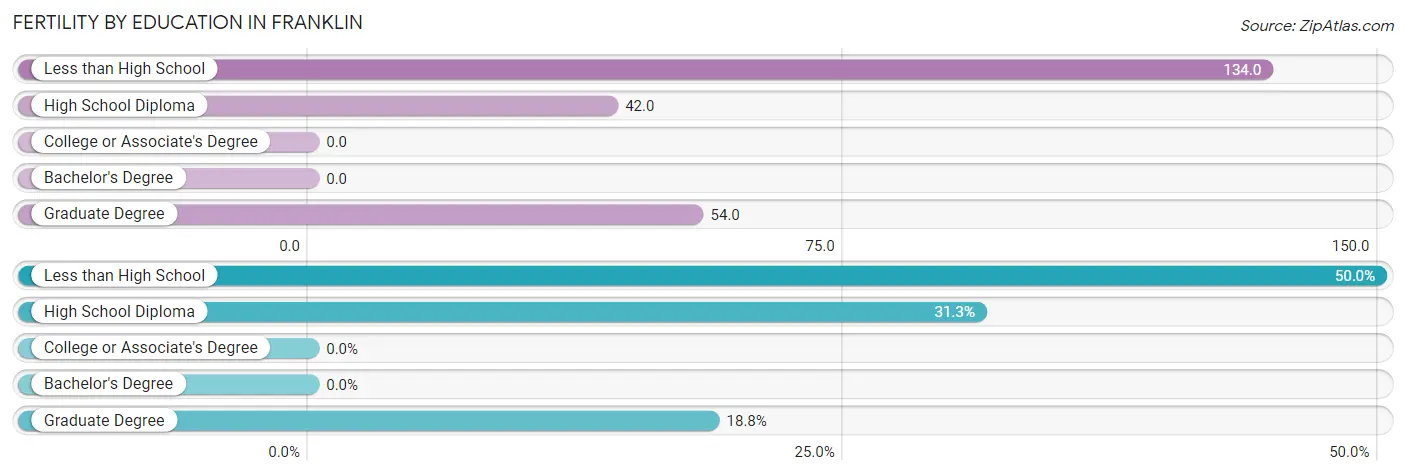
| Educational Attainment | Women with Births | Births / 1,000 Women |
| Less than High School | 24 (50.0%) | 134.0 |
| High School Diploma | 15 (31.2%) | 42.0 |
| College or Associate's Degree | 0 (0.0%) | 0.0 |
| Bachelor's Degree | 0 (0.0%) | 0.0 |
| Graduate Degree | 9 (18.8%) | 54.0 |
| Total | 48 (100.0%) | 37.0 |
Fertility by Education by Marriage Status in Franklin
66.7% of women with births in Franklin are unmarried. Women with the educational attainment of graduate degree are most likely to be married with 100.0% of them married at childbirth, while women with the educational attainment of less than high school are least likely to be married with 100.0% of them unmarried at childbirth.
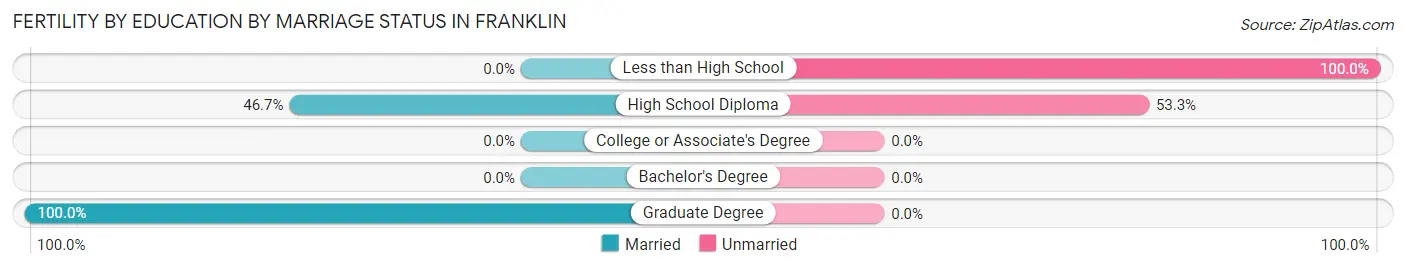
| Educational Attainment | Married | Unmarried |
| Less than High School | 0 (0.0%) | 24 (100.0%) |
| High School Diploma | 7 (46.7%) | 8 (53.3%) |
| College or Associate's Degree | 0 (0.0%) | 0 (0.0%) |
| Bachelor's Degree | 0 (0.0%) | 0 (0.0%) |
| Graduate Degree | 9 (100.0%) | 0 (0.0%) |
| Total | 16 (33.3%) | 32 (66.7%) |
Employment Characteristics in Franklin
Employment by Class of Employer in Franklin
Among the 2,656 employed individuals in Franklin, private company employees (1,471 | 55.4%), not-for-profit organizations (538 | 20.3%), and local government employees (226 | 8.5%) make up the most common classes of employment.
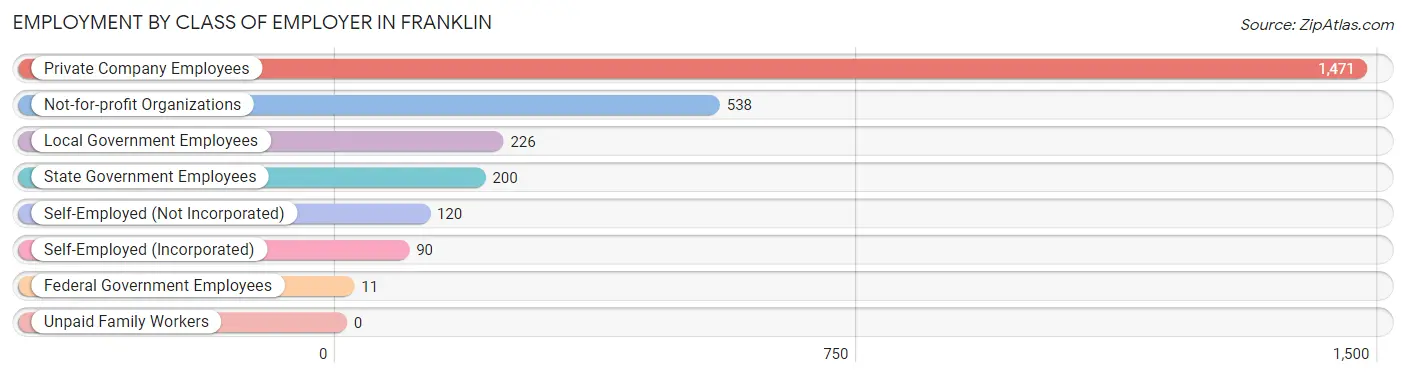
| Employer Class | # Employees | % Employees |
| Private Company Employees | 1,471 | 55.4% |
| Self-Employed (Incorporated) | 90 | 3.4% |
| Self-Employed (Not Incorporated) | 120 | 4.5% |
| Not-for-profit Organizations | 538 | 20.3% |
| Local Government Employees | 226 | 8.5% |
| State Government Employees | 200 | 7.5% |
| Federal Government Employees | 11 | 0.4% |
| Unpaid Family Workers | 0 | 0.0% |
| Total | 2,656 | 100.0% |
Employment Status by Age in Franklin
According to the labor force statistics for Franklin, out of the total population over 16 years of age (4,985), 58.4% or 2,911 individuals are in the labor force, with 7.2% or 210 of them unemployed. The age group with the highest labor force participation rate is 20 to 24 years, with 87.8% or 253 individuals in the labor force. Within the labor force, the 65 to 74 years age range has the highest percentage of unemployed individuals, with 28.9% or 43 of them being unemployed.
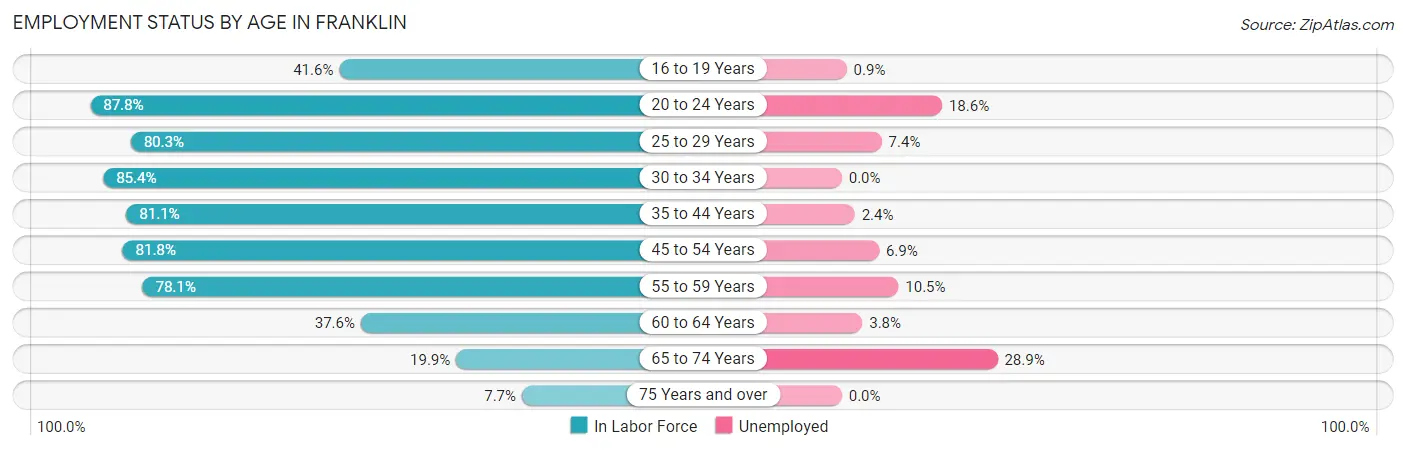
| Age Bracket | In Labor Force | Unemployed |
| 16 to 19 Years | 109 (41.6%) | 1 (0.9%) |
| 20 to 24 Years | 253 (87.8%) | 47 (18.6%) |
| 25 to 29 Years | 309 (80.3%) | 23 (7.4%) |
| 30 to 34 Years | 381 (85.4%) | 0 (0.0%) |
| 35 to 44 Years | 545 (81.1%) | 13 (2.4%) |
| 45 to 54 Years | 677 (81.8%) | 47 (6.9%) |
| 55 to 59 Years | 286 (78.1%) | 30 (10.5%) |
| 60 to 64 Years | 156 (37.6%) | 6 (3.8%) |
| 65 to 74 Years | 149 (19.9%) | 43 (28.9%) |
| 75 Years and over | 44 (7.7%) | 0 (0.0%) |
| Total | 2,911 (58.4%) | 210 (7.2%) |
Employment Status by Educational Attainment in Franklin
According to labor force statistics for Franklin, 75.6% of individuals (2,353) out of the total population between 25 and 64 years of age (3,112) are in the labor force, with 5.1% or 120 of them being unemployed. The group with the highest labor force participation rate are those with the educational attainment of bachelor's degree or higher, with 91.2% or 661 individuals in the labor force. Within the labor force, individuals with less than high school education have the highest percentage of unemployment, with 18.5% or 12 of them being unemployed.
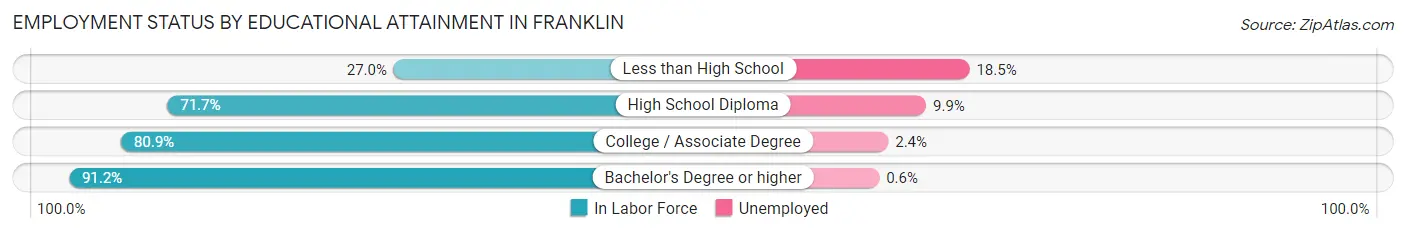
| Educational Attainment | In Labor Force | Unemployed |
| Less than High School | 65 (27.0%) | 45 (18.5%) |
| High School Diploma | 845 (71.7%) | 117 (9.9%) |
| College / Associate Degree | 783 (80.9%) | 23 (2.4%) |
| Bachelor's Degree or higher | 661 (91.2%) | 4 (0.6%) |
| Total | 2,353 (75.6%) | 159 (5.1%) |
Employment Occupations by Sex in Franklin
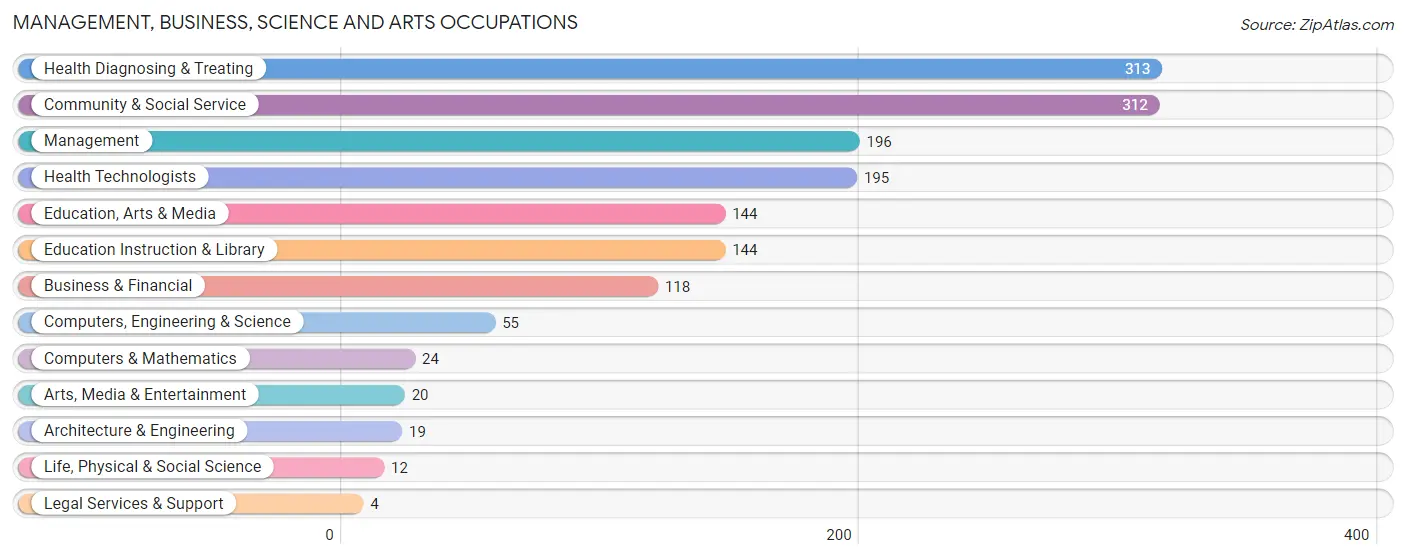
Management, Business, Science and Arts Occupations
The most common Management, Business, Science and Arts occupations in Franklin are Health Diagnosing & Treating (313 | 11.6%), Community & Social Service (312 | 11.6%), Management (196 | 7.3%), Health Technologists (195 | 7.2%), and Education, Arts & Media (144 | 5.3%).
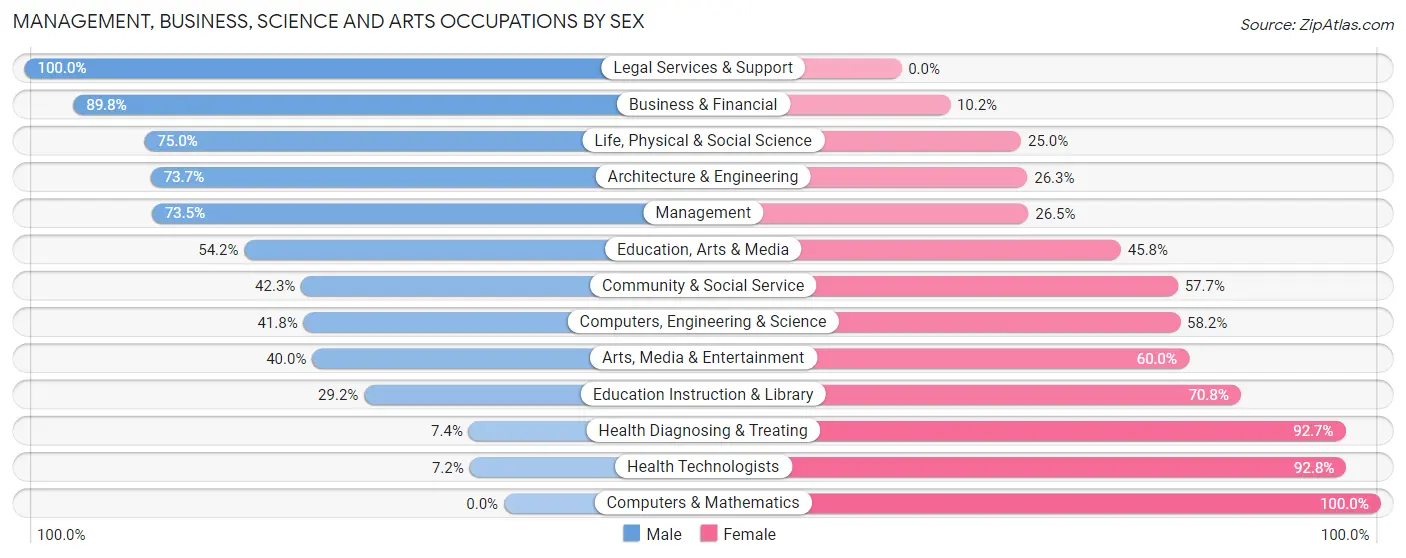
Management, Business, Science and Arts Occupations by Sex
Within the Management, Business, Science and Arts occupations in Franklin, the most male-oriented occupations are Legal Services & Support (100.0%), Business & Financial (89.8%), and Life, Physical & Social Science (75.0%), while the most female-oriented occupations are Computers & Mathematics (100.0%), Health Technologists (92.8%), and Health Diagnosing & Treating (92.6%).
| Occupation | Male | Female |
| Management | 144 (73.5%) | 52 (26.5%) |
| Business & Financial | 106 (89.8%) | 12 (10.2%) |
| Computers, Engineering & Science | 23 (41.8%) | 32 (58.2%) |
| Computers & Mathematics | 0 (0.0%) | 24 (100.0%) |
| Architecture & Engineering | 14 (73.7%) | 5 (26.3%) |
| Life, Physical & Social Science | 9 (75.0%) | 3 (25.0%) |
| Community & Social Service | 132 (42.3%) | 180 (57.7%) |
| Education, Arts & Media | 78 (54.2%) | 66 (45.8%) |
| Legal Services & Support | 4 (100.0%) | 0 (0.0%) |
| Education Instruction & Library | 42 (29.2%) | 102 (70.8%) |
| Arts, Media & Entertainment | 8 (40.0%) | 12 (60.0%) |
| Health Diagnosing & Treating | 23 (7.3%) | 290 (92.6%) |
| Health Technologists | 14 (7.2%) | 181 (92.8%) |
| Total (Category) | 428 (43.1%) | 566 (56.9%) |
| Total (Overall) | 1,394 (51.6%) | 1,305 (48.3%) |
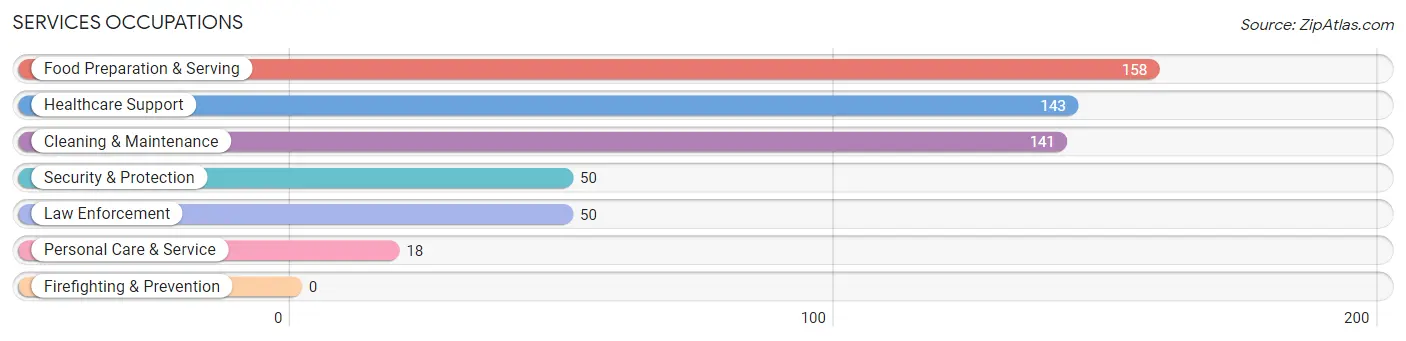
Services Occupations
The most common Services occupations in Franklin are Food Preparation & Serving (158 | 5.9%), Healthcare Support (143 | 5.3%), Cleaning & Maintenance (141 | 5.2%), Security & Protection (50 | 1.8%), and Law Enforcement (50 | 1.8%).
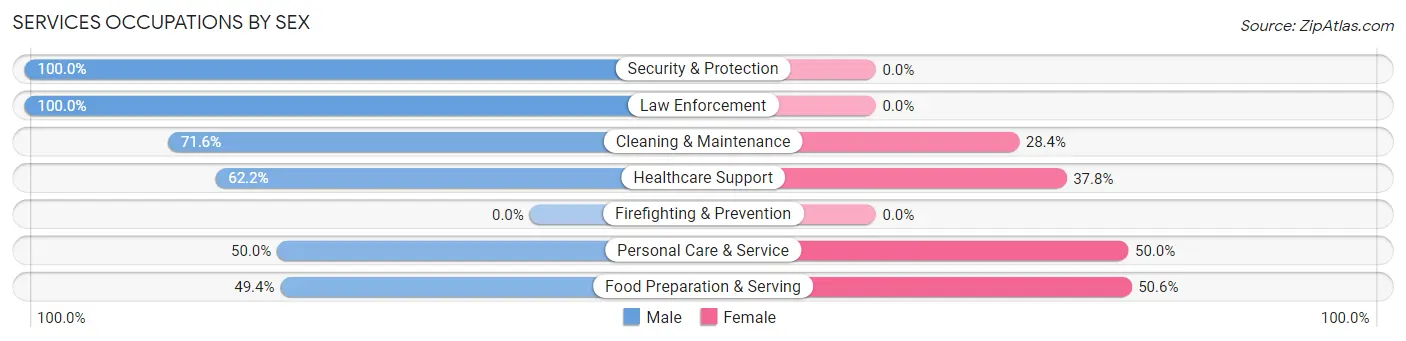
Services Occupations by Sex
Within the Services occupations in Franklin, the most male-oriented occupations are Security & Protection (100.0%), Law Enforcement (100.0%), and Cleaning & Maintenance (71.6%), while the most female-oriented occupations are Food Preparation & Serving (50.6%), Personal Care & Service (50.0%), and Healthcare Support (37.8%).
| Occupation | Male | Female |
| Healthcare Support | 89 (62.2%) | 54 (37.8%) |
| Security & Protection | 50 (100.0%) | 0 (0.0%) |
| Firefighting & Prevention | 0 (0.0%) | 0 (0.0%) |
| Law Enforcement | 50 (100.0%) | 0 (0.0%) |
| Food Preparation & Serving | 78 (49.4%) | 80 (50.6%) |
| Cleaning & Maintenance | 101 (71.6%) | 40 (28.4%) |
| Personal Care & Service | 9 (50.0%) | 9 (50.0%) |
| Total (Category) | 327 (64.1%) | 183 (35.9%) |
| Total (Overall) | 1,394 (51.6%) | 1,305 (48.3%) |
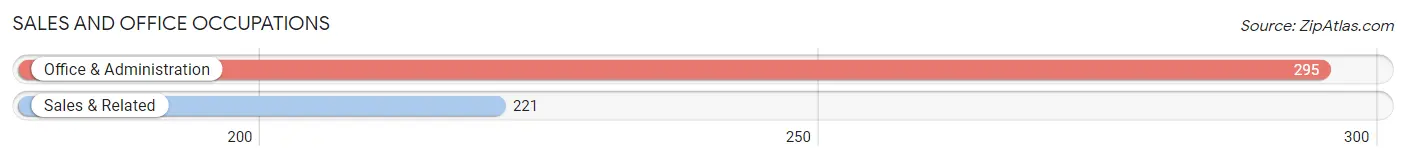
Sales and Office Occupations
The most common Sales and Office occupations in Franklin are Office & Administration (295 | 10.9%), and Sales & Related (221 | 8.2%).
Sales and Office Occupations by Sex
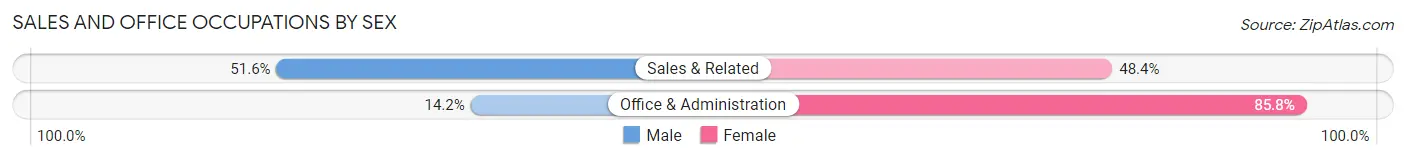
| Occupation | Male | Female |
| Sales & Related | 114 (51.6%) | 107 (48.4%) |
| Office & Administration | 42 (14.2%) | 253 (85.8%) |
| Total (Category) | 156 (30.2%) | 360 (69.8%) |
| Total (Overall) | 1,394 (51.6%) | 1,305 (48.3%) |
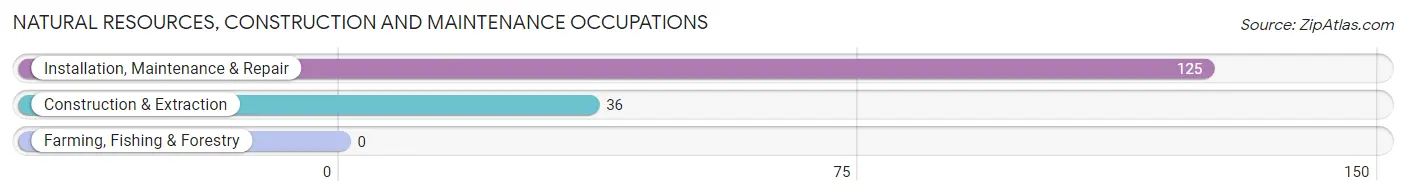
Natural Resources, Construction and Maintenance Occupations
The most common Natural Resources, Construction and Maintenance occupations in Franklin are Installation, Maintenance & Repair (125 | 4.6%), and Construction & Extraction (36 | 1.3%).
Natural Resources, Construction and Maintenance Occupations by Sex
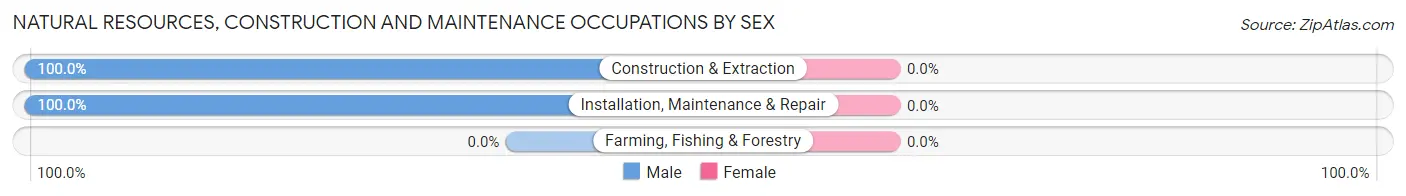
| Occupation | Male | Female |
| Farming, Fishing & Forestry | 0 (0.0%) | 0 (0.0%) |
| Construction & Extraction | 36 (100.0%) | 0 (0.0%) |
| Installation, Maintenance & Repair | 125 (100.0%) | 0 (0.0%) |
| Total (Category) | 161 (100.0%) | 0 (0.0%) |
| Total (Overall) | 1,394 (51.6%) | 1,305 (48.3%) |
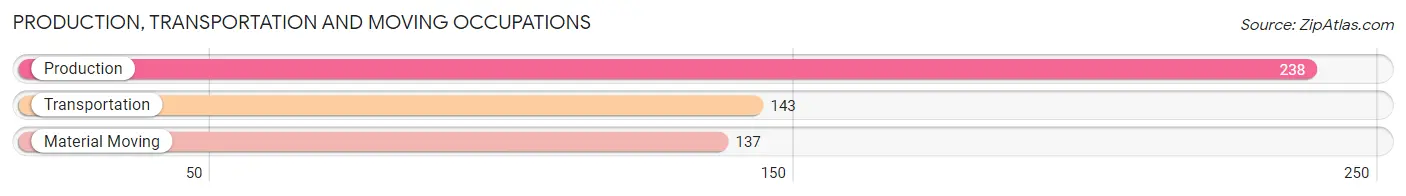
Production, Transportation and Moving Occupations
The most common Production, Transportation and Moving occupations in Franklin are Production (238 | 8.8%), Transportation (143 | 5.3%), and Material Moving (137 | 5.1%).
Production, Transportation and Moving Occupations by Sex
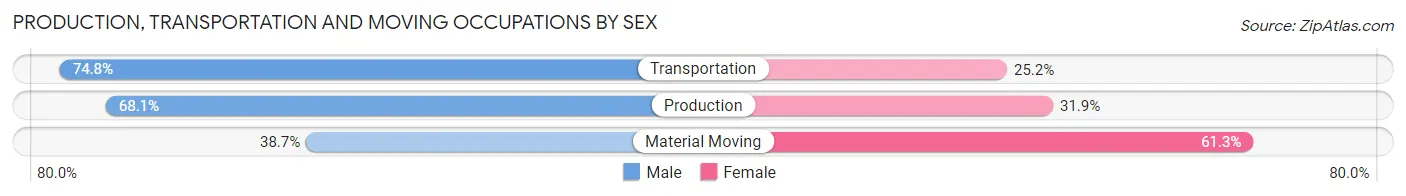
| Occupation | Male | Female |
| Production | 162 (68.1%) | 76 (31.9%) |
| Transportation | 107 (74.8%) | 36 (25.2%) |
| Material Moving | 53 (38.7%) | 84 (61.3%) |
| Total (Category) | 322 (62.2%) | 196 (37.8%) |
| Total (Overall) | 1,394 (51.6%) | 1,305 (48.3%) |
Employment Industries by Sex in Franklin
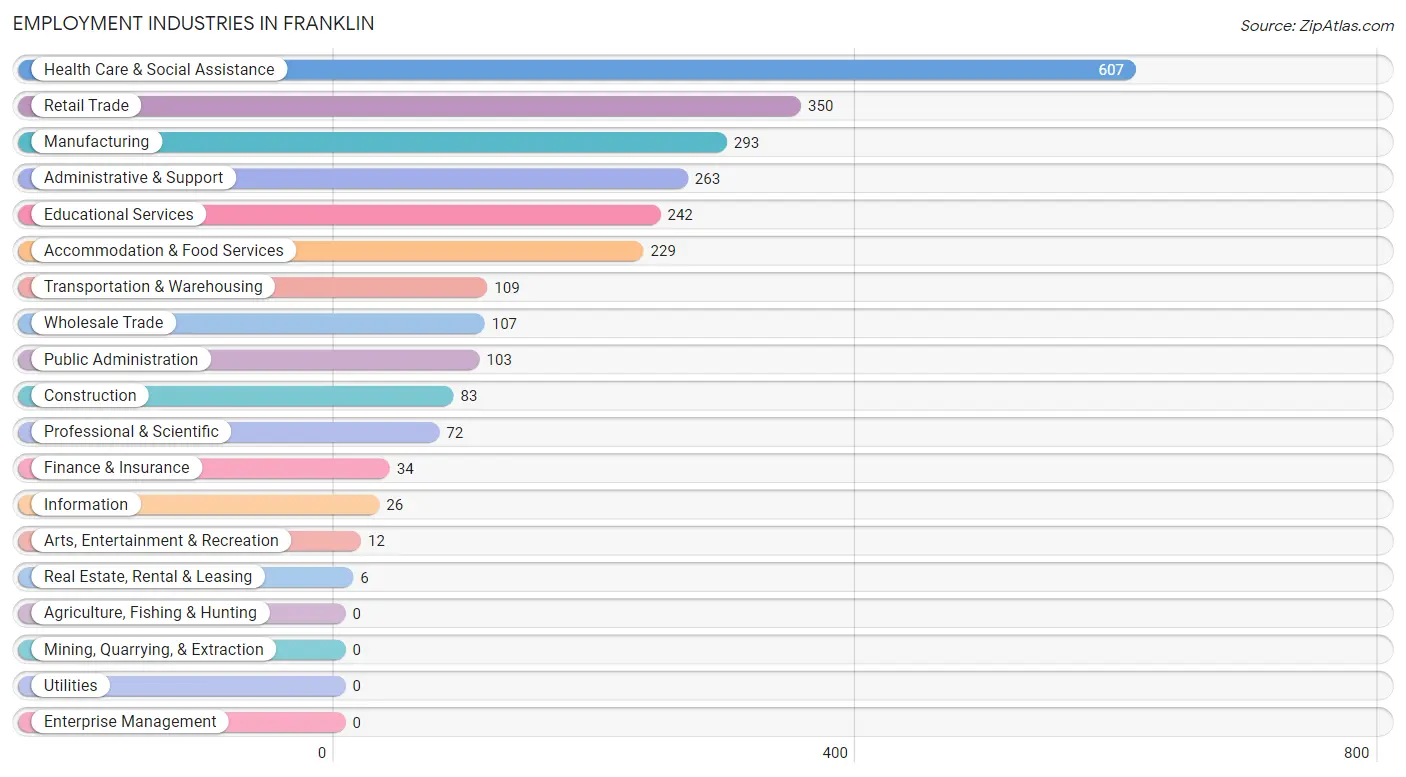
Employment Industries in Franklin
The major employment industries in Franklin include Health Care & Social Assistance (607 | 22.5%), Retail Trade (350 | 13.0%), Manufacturing (293 | 10.9%), Administrative & Support (263 | 9.7%), and Educational Services (242 | 9.0%).
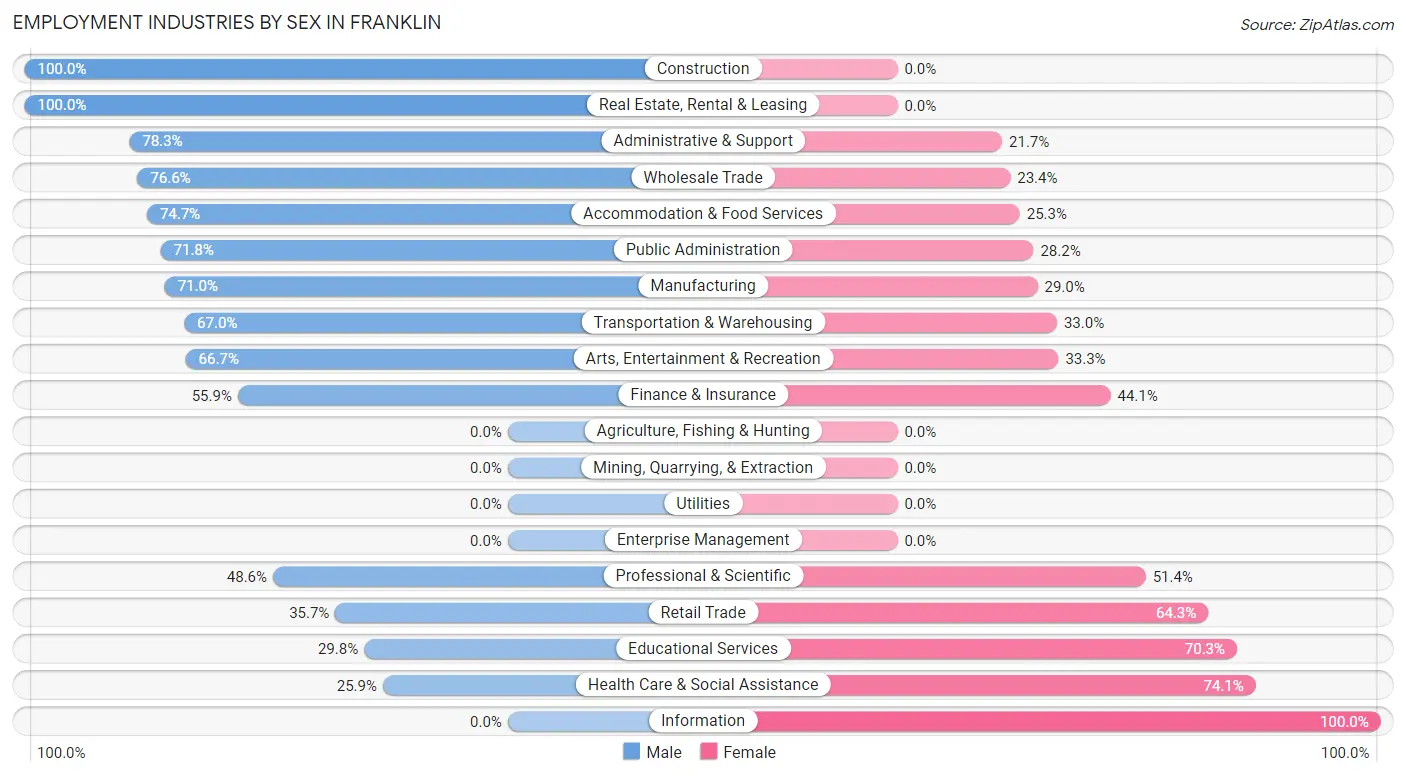
Employment Industries by Sex in Franklin
The Franklin industries that see more men than women are Construction (100.0%), Real Estate, Rental & Leasing (100.0%), and Administrative & Support (78.3%), whereas the industries that tend to have a higher number of women are Information (100.0%), Health Care & Social Assistance (74.1%), and Educational Services (70.3%).
| Industry | Male | Female |
| Agriculture, Fishing & Hunting | 0 (0.0%) | 0 (0.0%) |
| Mining, Quarrying, & Extraction | 0 (0.0%) | 0 (0.0%) |
| Construction | 83 (100.0%) | 0 (0.0%) |
| Manufacturing | 208 (71.0%) | 85 (29.0%) |
| Wholesale Trade | 82 (76.6%) | 25 (23.4%) |
| Retail Trade | 125 (35.7%) | 225 (64.3%) |
| Transportation & Warehousing | 73 (67.0%) | 36 (33.0%) |
| Utilities | 0 (0.0%) | 0 (0.0%) |
| Information | 0 (0.0%) | 26 (100.0%) |
| Finance & Insurance | 19 (55.9%) | 15 (44.1%) |
| Real Estate, Rental & Leasing | 6 (100.0%) | 0 (0.0%) |
| Professional & Scientific | 35 (48.6%) | 37 (51.4%) |
| Enterprise Management | 0 (0.0%) | 0 (0.0%) |
| Administrative & Support | 206 (78.3%) | 57 (21.7%) |
| Educational Services | 72 (29.7%) | 170 (70.3%) |
| Health Care & Social Assistance | 157 (25.9%) | 450 (74.1%) |
| Arts, Entertainment & Recreation | 8 (66.7%) | 4 (33.3%) |
| Accommodation & Food Services | 171 (74.7%) | 58 (25.3%) |
| Public Administration | 74 (71.8%) | 29 (28.2%) |
| Total | 1,394 (51.6%) | 1,305 (48.3%) |
Education in Franklin
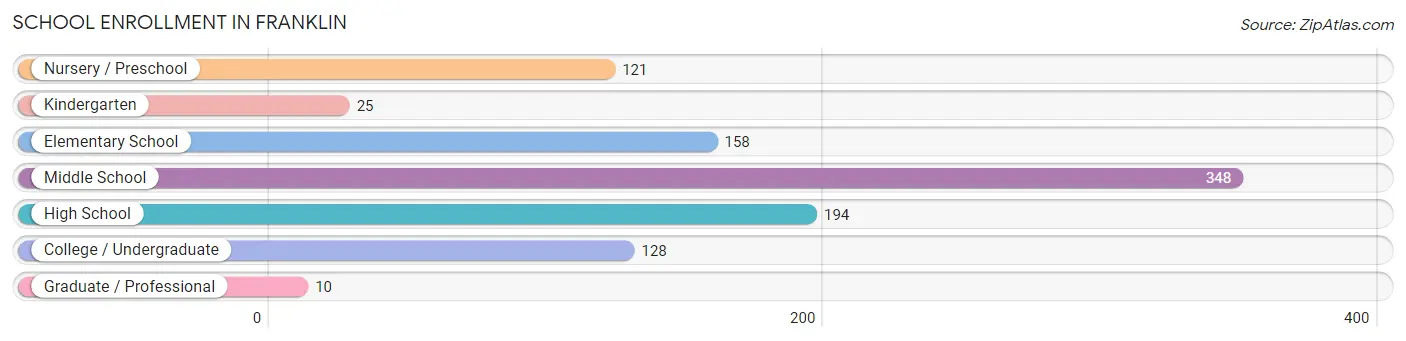
School Enrollment in Franklin
The most common levels of schooling among the 984 students in Franklin are middle school (348 | 35.4%), high school (194 | 19.7%), and elementary school (158 | 16.1%).
| School Level | # Students | % Students |
| Nursery / Preschool | 121 | 12.3% |
| Kindergarten | 25 | 2.5% |
| Elementary School | 158 | 16.1% |
| Middle School | 348 | 35.4% |
| High School | 194 | 19.7% |
| College / Undergraduate | 128 | 13.0% |
| Graduate / Professional | 10 | 1.0% |
| Total | 984 | 100.0% |
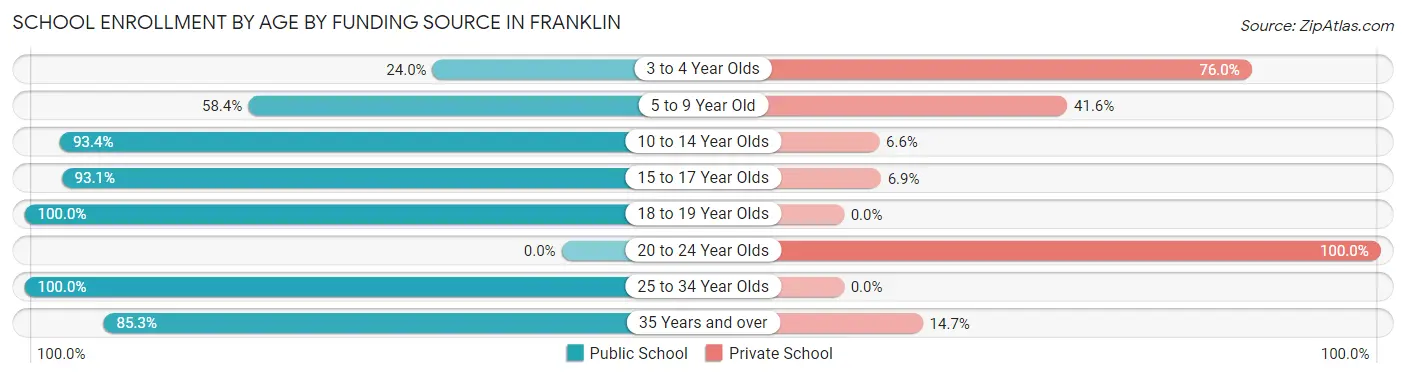
School Enrollment by Age by Funding Source in Franklin
Out of a total of 984 students who are enrolled in schools in Franklin, 207 (21.0%) attend a private institution, while the remaining 777 (79.0%) are enrolled in public schools. The age group of 20 to 24 year olds has the highest likelihood of being enrolled in private schools, with 14 (100.0% in the age bracket) enrolled. Conversely, the age group of 18 to 19 year olds has the lowest likelihood of being enrolled in a private school, with 96 (100.0% in the age bracket) attending a public institution.
| Age Bracket | Public School | Private School |
| 3 to 4 Year Olds | 25 (24.0%) | 79 (76.0%) |
| 5 to 9 Year Old | 101 (58.4%) | 72 (41.6%) |
| 10 to 14 Year Olds | 354 (93.4%) | 25 (6.6%) |
| 15 to 17 Year Olds | 162 (93.1%) | 12 (6.9%) |
| 18 to 19 Year Olds | 96 (100.0%) | 0 (0.0%) |
| 20 to 24 Year Olds | 0 (0.0%) | 14 (100.0%) |
| 25 to 34 Year Olds | 10 (100.0%) | 0 (0.0%) |
| 35 Years and over | 29 (85.3%) | 5 (14.7%) |
| Total | 777 (79.0%) | 207 (21.0%) |
Educational Attainment by Field of Study in Franklin
Education (247 | 21.6%), liberal arts & history (160 | 14.0%), science & technology (155 | 13.5%), communications (113 | 9.9%), and business (97 | 8.5%) are the most common fields of study among 1,145 individuals in Franklin who have obtained a bachelor's degree or higher.
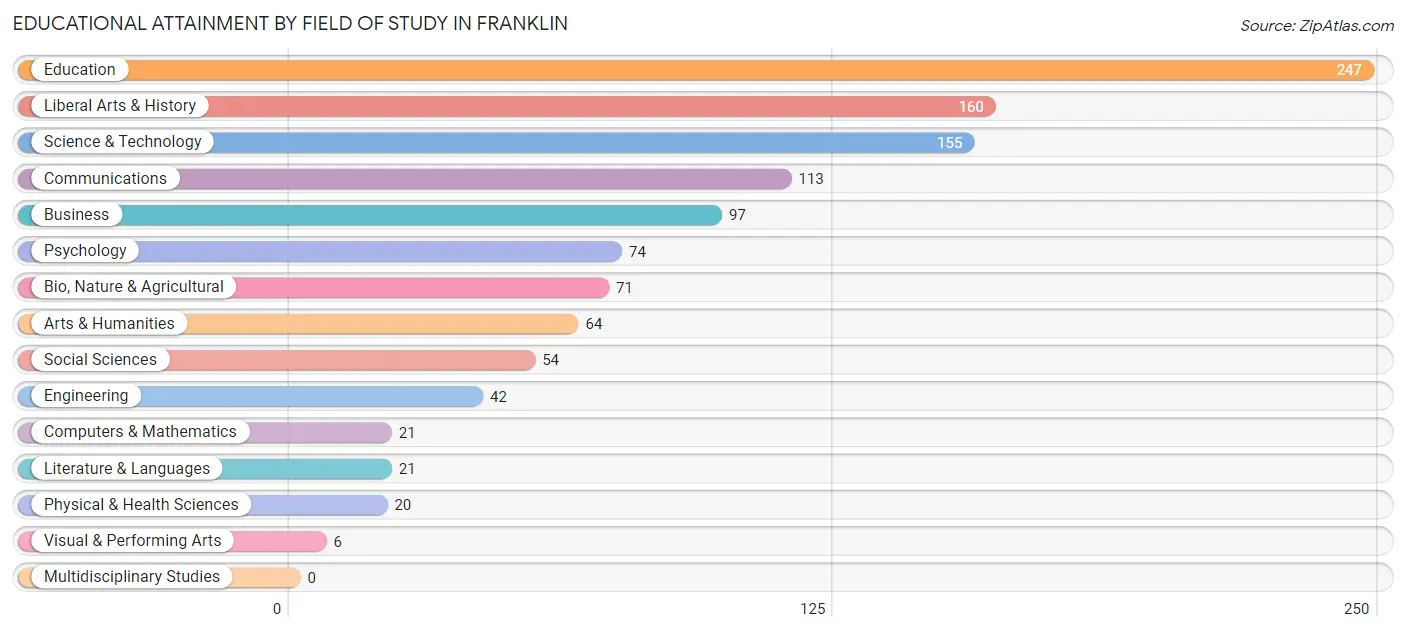
| Field of Study | # Graduates | % Graduates |
| Computers & Mathematics | 21 | 1.8% |
| Bio, Nature & Agricultural | 71 | 6.2% |
| Physical & Health Sciences | 20 | 1.8% |
| Psychology | 74 | 6.5% |
| Social Sciences | 54 | 4.7% |
| Engineering | 42 | 3.7% |
| Multidisciplinary Studies | 0 | 0.0% |
| Science & Technology | 155 | 13.5% |
| Business | 97 | 8.5% |
| Education | 247 | 21.6% |
| Literature & Languages | 21 | 1.8% |
| Liberal Arts & History | 160 | 14.0% |
| Visual & Performing Arts | 6 | 0.5% |
| Communications | 113 | 9.9% |
| Arts & Humanities | 64 | 5.6% |
| Total | 1,145 | 100.0% |
Transportation & Commute in Franklin
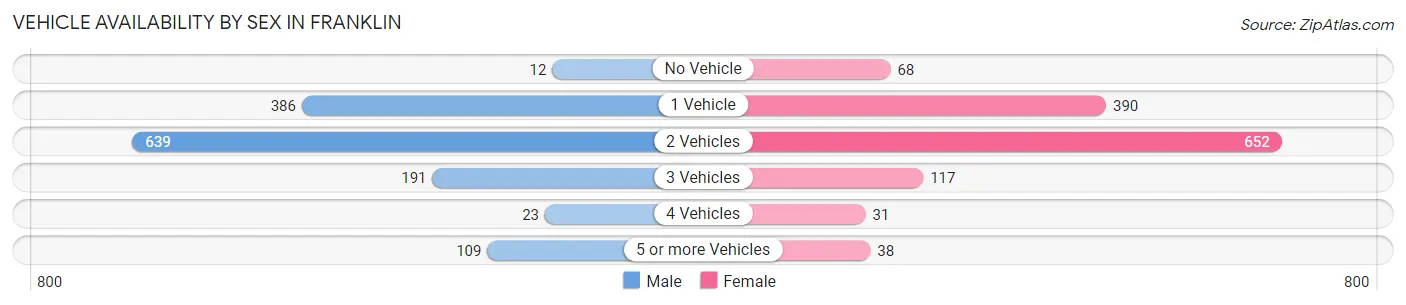
Vehicle Availability by Sex in Franklin
The most prevalent vehicle ownership categories in Franklin are males with 2 vehicles (639, accounting for 47.0%) and females with 2 vehicles (652, making up 49.3%).
| Vehicles Available | Male | Female |
| No Vehicle | 12 (0.9%) | 68 (5.2%) |
| 1 Vehicle | 386 (28.4%) | 390 (30.1%) |
| 2 Vehicles | 639 (47.0%) | 652 (50.3%) |
| 3 Vehicles | 191 (14.0%) | 117 (9.0%) |
| 4 Vehicles | 23 (1.7%) | 31 (2.4%) |
| 5 or more Vehicles | 109 (8.0%) | 38 (2.9%) |
| Total | 1,360 (100.0%) | 1,296 (100.0%) |
Commute Time in Franklin
The most frequently occuring commute durations in Franklin are 5 to 9 minutes (583 commuters, 25.5%), 10 to 14 minutes (465 commuters, 20.4%), and 15 to 19 minutes (357 commuters, 15.6%).
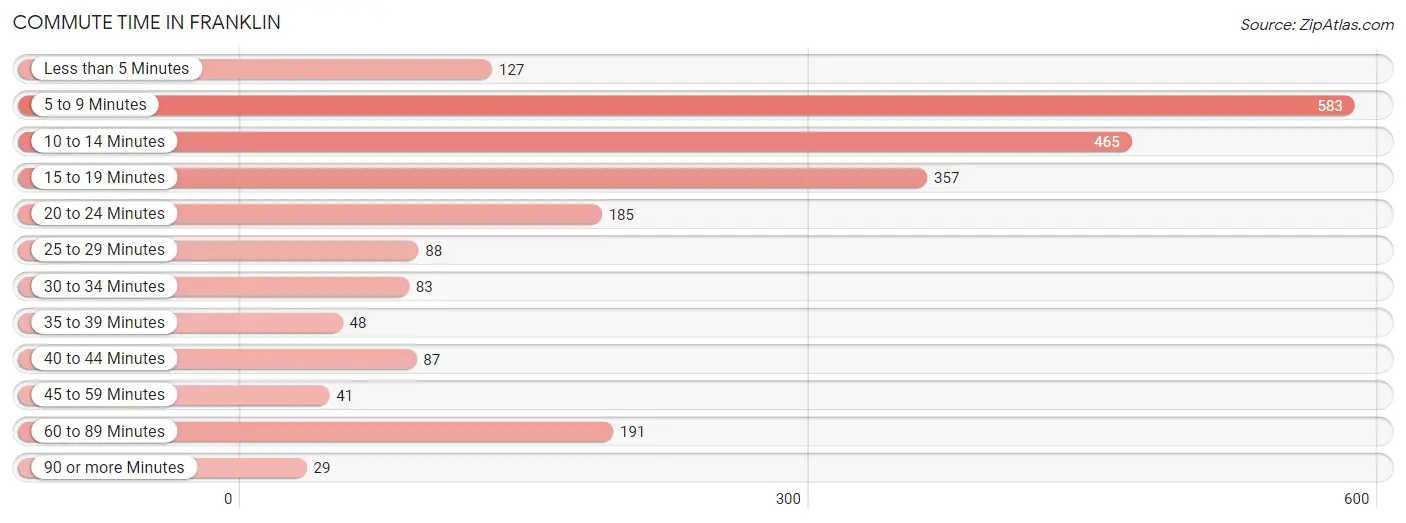
| Commute Time | # Commuters | % Commuters |
| Less than 5 Minutes | 127 | 5.6% |
| 5 to 9 Minutes | 583 | 25.5% |
| 10 to 14 Minutes | 465 | 20.4% |
| 15 to 19 Minutes | 357 | 15.6% |
| 20 to 24 Minutes | 185 | 8.1% |
| 25 to 29 Minutes | 88 | 3.8% |
| 30 to 34 Minutes | 83 | 3.6% |
| 35 to 39 Minutes | 48 | 2.1% |
| 40 to 44 Minutes | 87 | 3.8% |
| 45 to 59 Minutes | 41 | 1.8% |
| 60 to 89 Minutes | 191 | 8.4% |
| 90 or more Minutes | 29 | 1.3% |
Commute Time by Sex in Franklin
The most common commute times in Franklin are 5 to 9 minutes (331 commuters, 27.8%) for males and 10 to 14 minutes (268 commuters, 24.5%) for females.
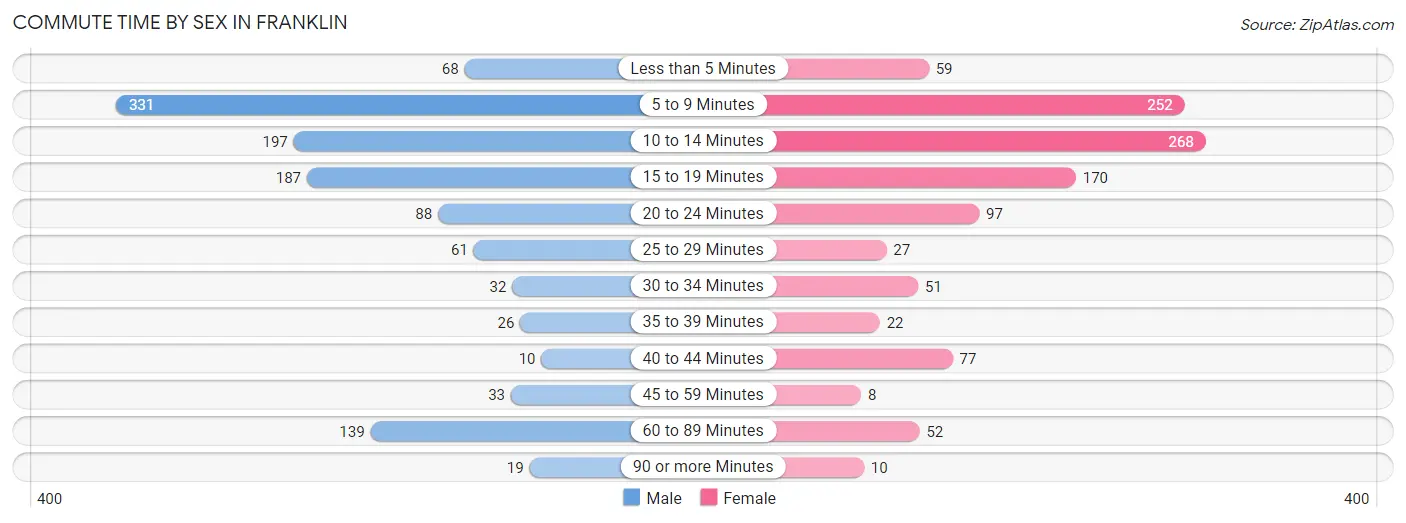
| Commute Time | Male | Female |
| Less than 5 Minutes | 68 (5.7%) | 59 (5.4%) |
| 5 to 9 Minutes | 331 (27.8%) | 252 (23.1%) |
| 10 to 14 Minutes | 197 (16.5%) | 268 (24.5%) |
| 15 to 19 Minutes | 187 (15.7%) | 170 (15.5%) |
| 20 to 24 Minutes | 88 (7.4%) | 97 (8.9%) |
| 25 to 29 Minutes | 61 (5.1%) | 27 (2.5%) |
| 30 to 34 Minutes | 32 (2.7%) | 51 (4.7%) |
| 35 to 39 Minutes | 26 (2.2%) | 22 (2.0%) |
| 40 to 44 Minutes | 10 (0.8%) | 77 (7.0%) |
| 45 to 59 Minutes | 33 (2.8%) | 8 (0.7%) |
| 60 to 89 Minutes | 139 (11.7%) | 52 (4.8%) |
| 90 or more Minutes | 19 (1.6%) | 10 (0.9%) |
Time of Departure to Work by Sex in Franklin
The most frequent times of departure to work in Franklin are 7:00 AM to 7:29 AM (187, 15.7%) for males and 7:30 AM to 7:59 AM (180, 16.5%) for females.
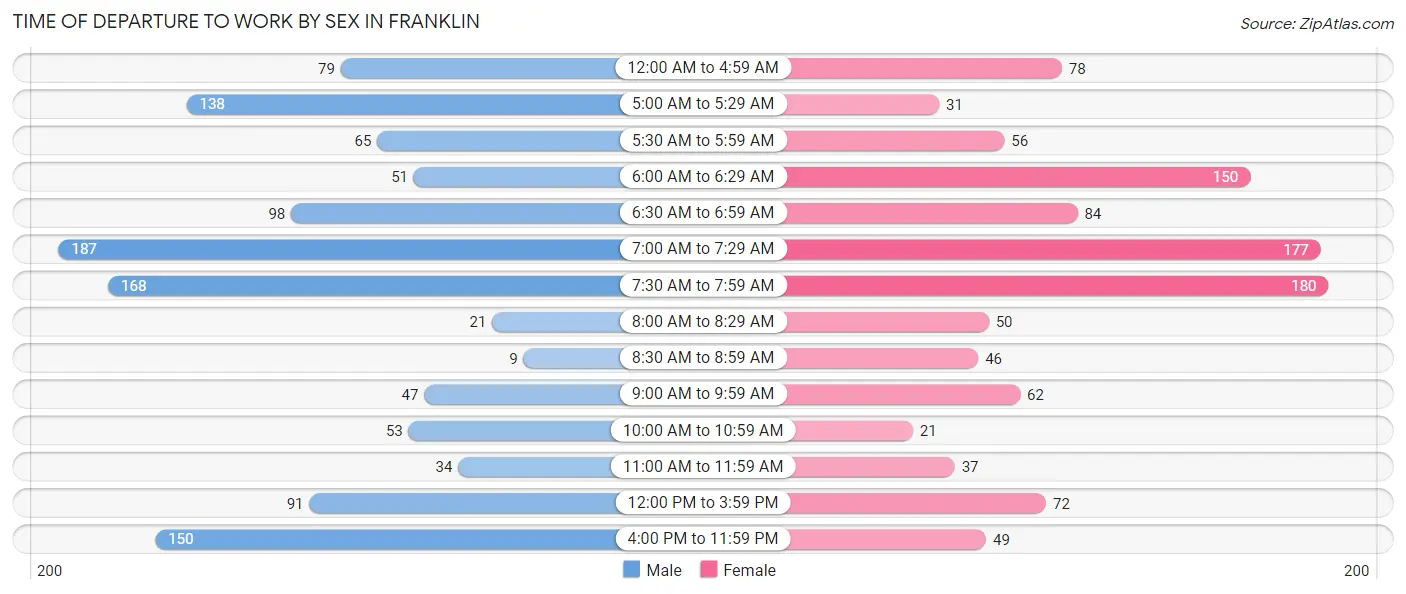
| Time of Departure | Male | Female |
| 12:00 AM to 4:59 AM | 79 (6.6%) | 78 (7.1%) |
| 5:00 AM to 5:29 AM | 138 (11.6%) | 31 (2.8%) |
| 5:30 AM to 5:59 AM | 65 (5.5%) | 56 (5.1%) |
| 6:00 AM to 6:29 AM | 51 (4.3%) | 150 (13.7%) |
| 6:30 AM to 6:59 AM | 98 (8.2%) | 84 (7.7%) |
| 7:00 AM to 7:29 AM | 187 (15.7%) | 177 (16.2%) |
| 7:30 AM to 7:59 AM | 168 (14.1%) | 180 (16.5%) |
| 8:00 AM to 8:29 AM | 21 (1.8%) | 50 (4.6%) |
| 8:30 AM to 8:59 AM | 9 (0.8%) | 46 (4.2%) |
| 9:00 AM to 9:59 AM | 47 (4.0%) | 62 (5.7%) |
| 10:00 AM to 10:59 AM | 53 (4.4%) | 21 (1.9%) |
| 11:00 AM to 11:59 AM | 34 (2.9%) | 37 (3.4%) |
| 12:00 PM to 3:59 PM | 91 (7.6%) | 72 (6.6%) |
| 4:00 PM to 11:59 PM | 150 (12.6%) | 49 (4.5%) |
| Total | 1,191 (100.0%) | 1,093 (100.0%) |
Housing Occupancy in Franklin
Occupancy by Ownership in Franklin
Of the total 2,676 dwellings in Franklin, owner-occupied units account for 1,479 (55.3%), while renter-occupied units make up 1,197 (44.7%).
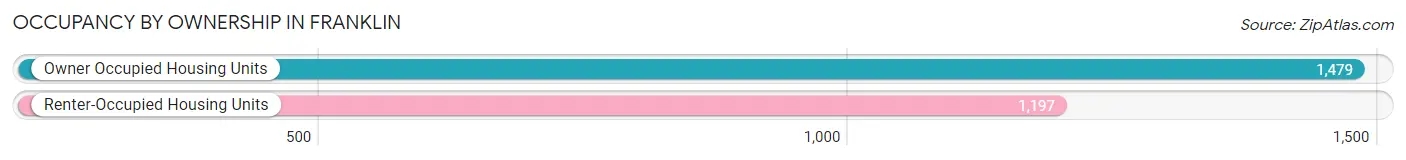
| Occupancy | # Housing Units | % Housing Units |
| Owner Occupied Housing Units | 1,479 | 55.3% |
| Renter-Occupied Housing Units | 1,197 | 44.7% |
| Total Occupied Housing Units | 2,676 | 100.0% |
Occupancy by Household Size in Franklin
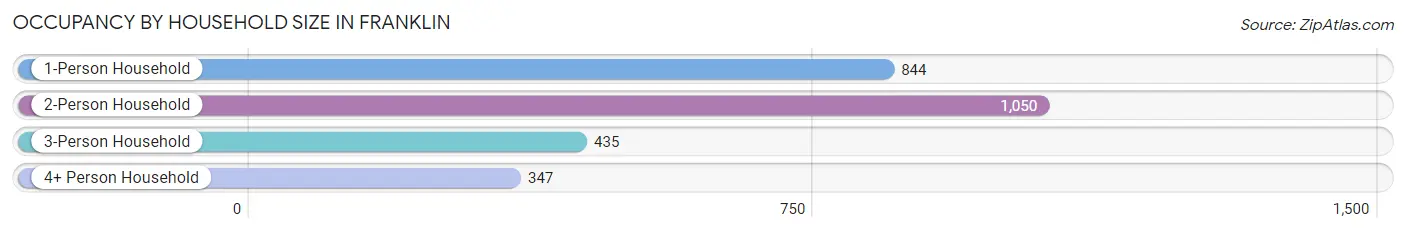
| Household Size | # Housing Units | % Housing Units |
| 1-Person Household | 844 | 31.5% |
| 2-Person Household | 1,050 | 39.2% |
| 3-Person Household | 435 | 16.3% |
| 4+ Person Household | 347 | 13.0% |
| Total Housing Units | 2,676 | 100.0% |
Occupancy by Ownership by Household Size in Franklin
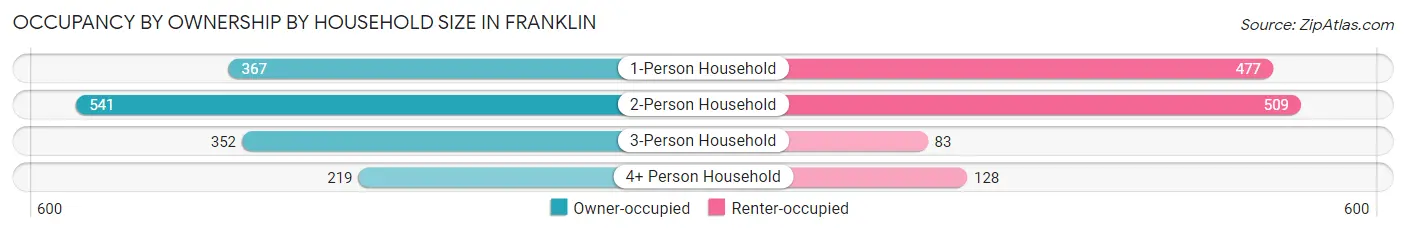
| Household Size | Owner-occupied | Renter-occupied |
| 1-Person Household | 367 (43.5%) | 477 (56.5%) |
| 2-Person Household | 541 (51.5%) | 509 (48.5%) |
| 3-Person Household | 352 (80.9%) | 83 (19.1%) |
| 4+ Person Household | 219 (63.1%) | 128 (36.9%) |
| Total Housing Units | 1,479 (55.3%) | 1,197 (44.7%) |
Occupancy by Educational Attainment in Franklin
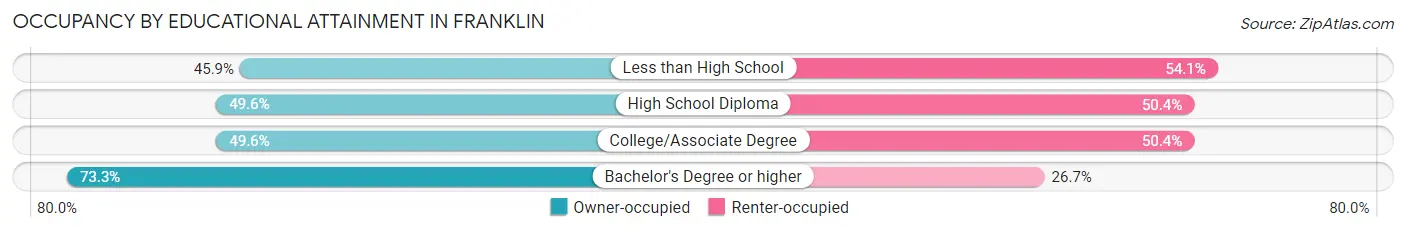
| Household Size | Owner-occupied | Renter-occupied |
| Less than High School | 83 (45.9%) | 98 (54.1%) |
| High School Diploma | 493 (49.6%) | 501 (50.4%) |
| College/Associate Degree | 412 (49.6%) | 419 (50.4%) |
| Bachelor's Degree or higher | 491 (73.3%) | 179 (26.7%) |
Occupancy by Age of Householder in Franklin
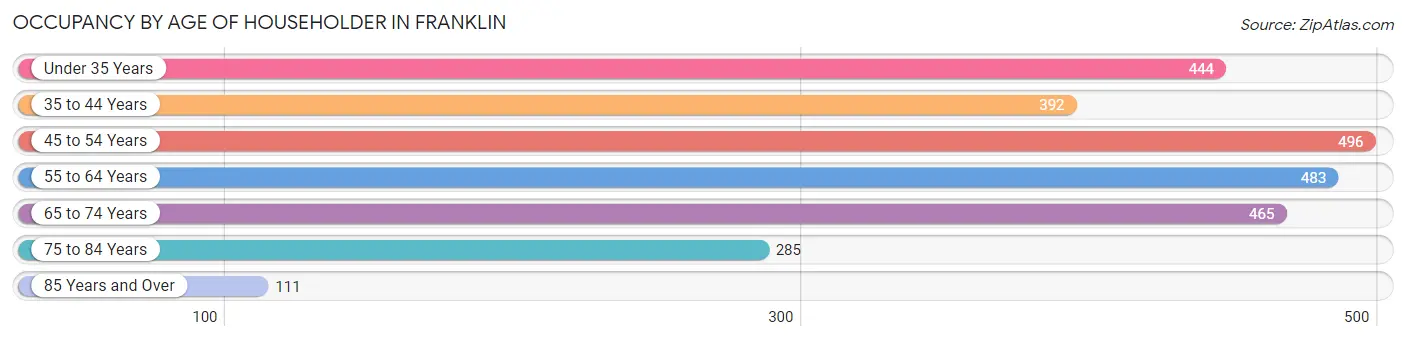
| Age Bracket | # Households | % Households |
| Under 35 Years | 444 | 16.6% |
| 35 to 44 Years | 392 | 14.6% |
| 45 to 54 Years | 496 | 18.5% |
| 55 to 64 Years | 483 | 18.0% |
| 65 to 74 Years | 465 | 17.4% |
| 75 to 84 Years | 285 | 10.6% |
| 85 Years and Over | 111 | 4.2% |
| Total | 2,676 | 100.0% |
Housing Finances in Franklin
Median Income by Occupancy in Franklin
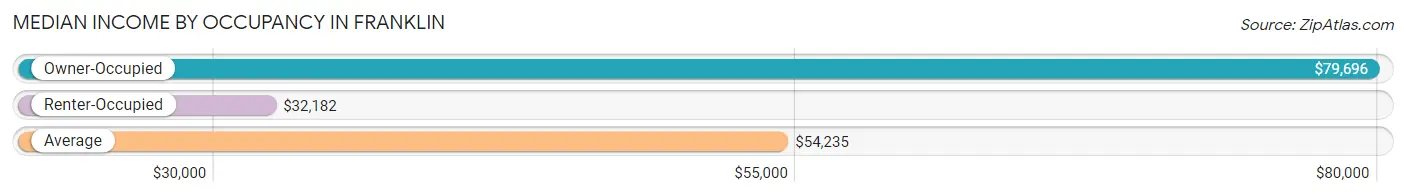
| Occupancy Type | # Households | Median Income |
| Owner-Occupied | 1,479 (55.3%) | $79,696 |
| Renter-Occupied | 1,197 (44.7%) | $32,182 |
| Average | 2,676 (100.0%) | $54,235 |
Occupancy by Householder Income Bracket in Franklin
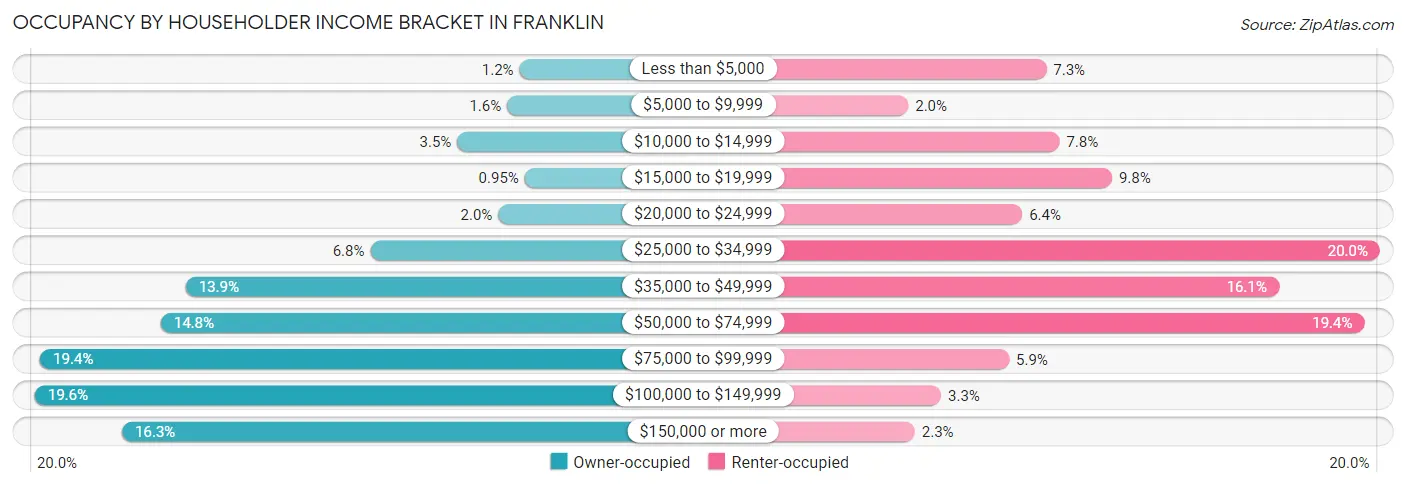
| Income Bracket | Owner-occupied | Renter-occupied |
| Less than $5,000 | 17 (1.1%) | 87 (7.3%) |
| $5,000 to $9,999 | 24 (1.6%) | 24 (2.0%) |
| $10,000 to $14,999 | 52 (3.5%) | 93 (7.8%) |
| $15,000 to $19,999 | 14 (0.9%) | 117 (9.8%) |
| $20,000 to $24,999 | 29 (2.0%) | 76 (6.4%) |
| $25,000 to $34,999 | 101 (6.8%) | 239 (20.0%) |
| $35,000 to $49,999 | 205 (13.9%) | 193 (16.1%) |
| $50,000 to $74,999 | 219 (14.8%) | 232 (19.4%) |
| $75,000 to $99,999 | 287 (19.4%) | 70 (5.9%) |
| $100,000 to $149,999 | 290 (19.6%) | 39 (3.3%) |
| $150,000 or more | 241 (16.3%) | 27 (2.3%) |
| Total | 1,479 (100.0%) | 1,197 (100.0%) |
Monthly Housing Cost Tiers in Franklin
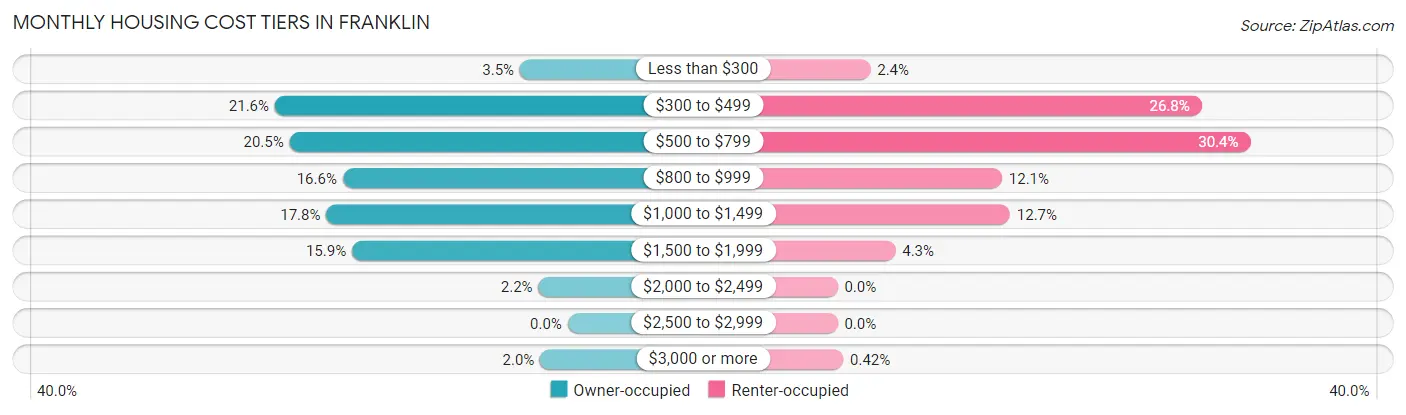
| Monthly Cost | Owner-occupied | Renter-occupied |
| Less than $300 | 52 (3.5%) | 29 (2.4%) |
| $300 to $499 | 319 (21.6%) | 321 (26.8%) |
| $500 to $799 | 303 (20.5%) | 364 (30.4%) |
| $800 to $999 | 245 (16.6%) | 145 (12.1%) |
| $1,000 to $1,499 | 263 (17.8%) | 152 (12.7%) |
| $1,500 to $1,999 | 235 (15.9%) | 51 (4.3%) |
| $2,000 to $2,499 | 32 (2.2%) | 0 (0.0%) |
| $2,500 to $2,999 | 0 (0.0%) | 0 (0.0%) |
| $3,000 or more | 30 (2.0%) | 5 (0.4%) |
| Total | 1,479 (100.0%) | 1,197 (100.0%) |
Physical Housing Characteristics in Franklin
Housing Structures in Franklin
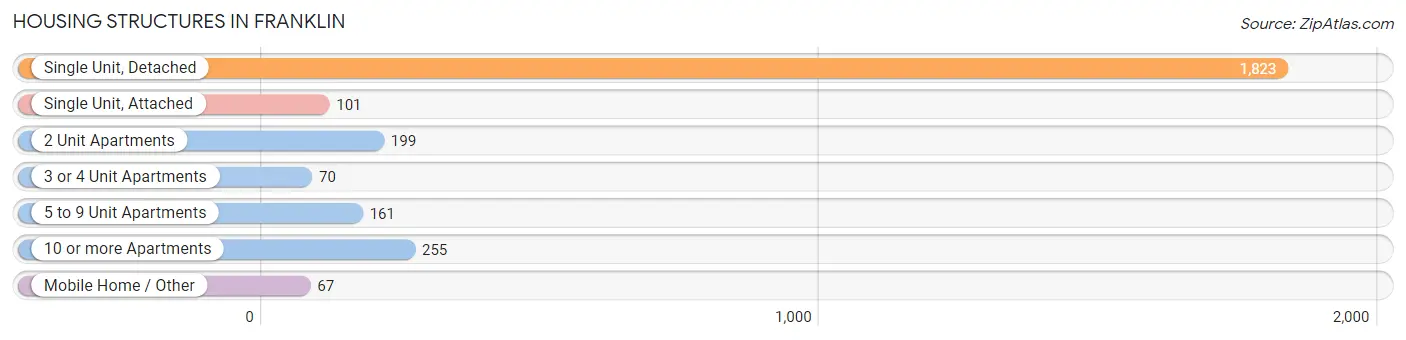
| Structure Type | # Housing Units | % Housing Units |
| Single Unit, Detached | 1,823 | 68.1% |
| Single Unit, Attached | 101 | 3.8% |
| 2 Unit Apartments | 199 | 7.4% |
| 3 or 4 Unit Apartments | 70 | 2.6% |
| 5 to 9 Unit Apartments | 161 | 6.0% |
| 10 or more Apartments | 255 | 9.5% |
| Mobile Home / Other | 67 | 2.5% |
| Total | 2,676 | 100.0% |
Housing Structures by Occupancy in Franklin
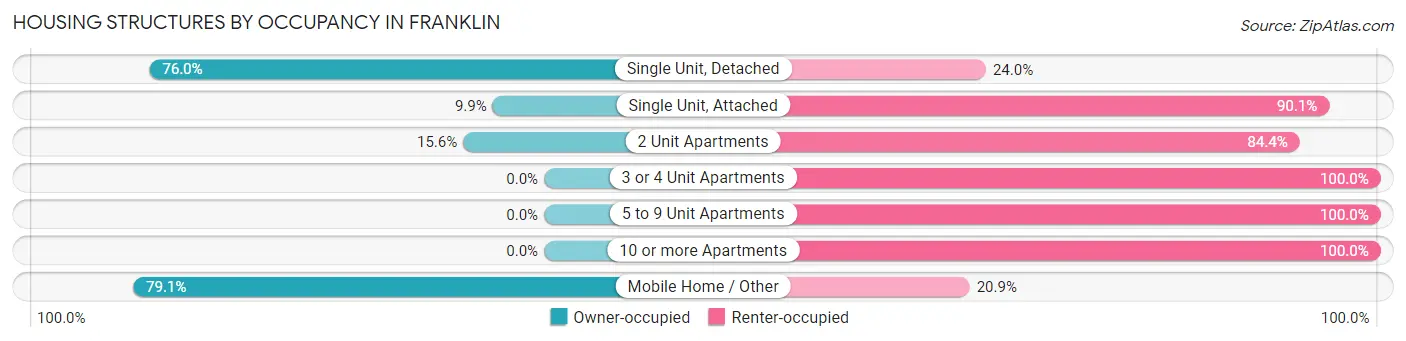
| Structure Type | Owner-occupied | Renter-occupied |
| Single Unit, Detached | 1,385 (76.0%) | 438 (24.0%) |
| Single Unit, Attached | 10 (9.9%) | 91 (90.1%) |
| 2 Unit Apartments | 31 (15.6%) | 168 (84.4%) |
| 3 or 4 Unit Apartments | 0 (0.0%) | 70 (100.0%) |
| 5 to 9 Unit Apartments | 0 (0.0%) | 161 (100.0%) |
| 10 or more Apartments | 0 (0.0%) | 255 (100.0%) |
| Mobile Home / Other | 53 (79.1%) | 14 (20.9%) |
| Total | 1,479 (55.3%) | 1,197 (44.7%) |
Housing Structures by Number of Rooms in Franklin
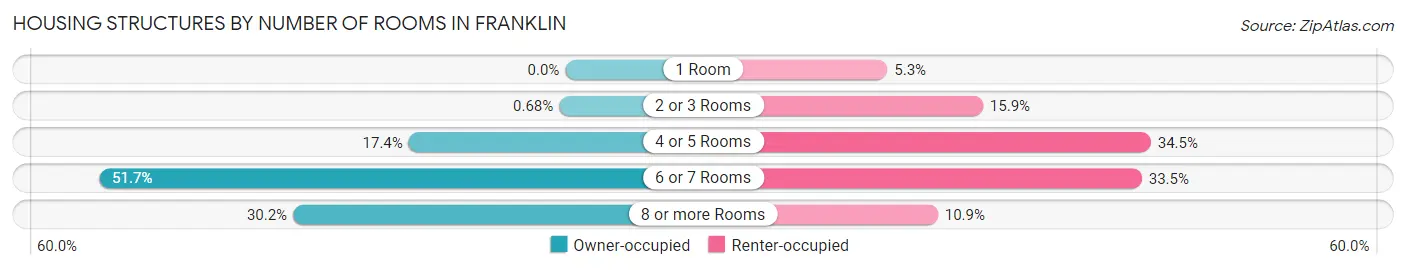
| Number of Rooms | Owner-occupied | Renter-occupied |
| 1 Room | 0 (0.0%) | 63 (5.3%) |
| 2 or 3 Rooms | 10 (0.7%) | 190 (15.9%) |
| 4 or 5 Rooms | 257 (17.4%) | 413 (34.5%) |
| 6 or 7 Rooms | 765 (51.7%) | 401 (33.5%) |
| 8 or more Rooms | 447 (30.2%) | 130 (10.9%) |
| Total | 1,479 (100.0%) | 1,197 (100.0%) |
Housing Structure by Heating Type in Franklin
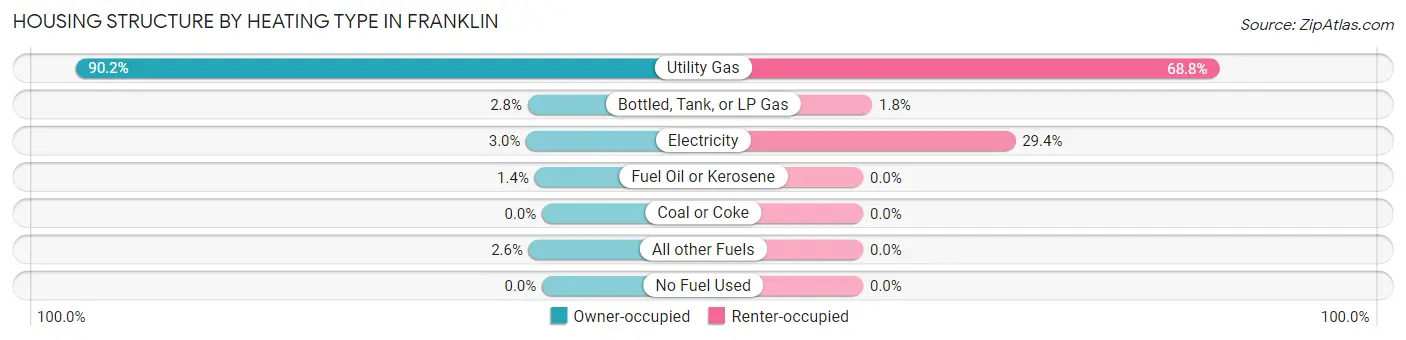
| Heating Type | Owner-occupied | Renter-occupied |
| Utility Gas | 1,334 (90.2%) | 824 (68.8%) |
| Bottled, Tank, or LP Gas | 41 (2.8%) | 21 (1.8%) |
| Electricity | 45 (3.0%) | 352 (29.4%) |
| Fuel Oil or Kerosene | 21 (1.4%) | 0 (0.0%) |
| Coal or Coke | 0 (0.0%) | 0 (0.0%) |
| All other Fuels | 38 (2.6%) | 0 (0.0%) |
| No Fuel Used | 0 (0.0%) | 0 (0.0%) |
| Total | 1,479 (100.0%) | 1,197 (100.0%) |
Household Vehicle Usage in Franklin
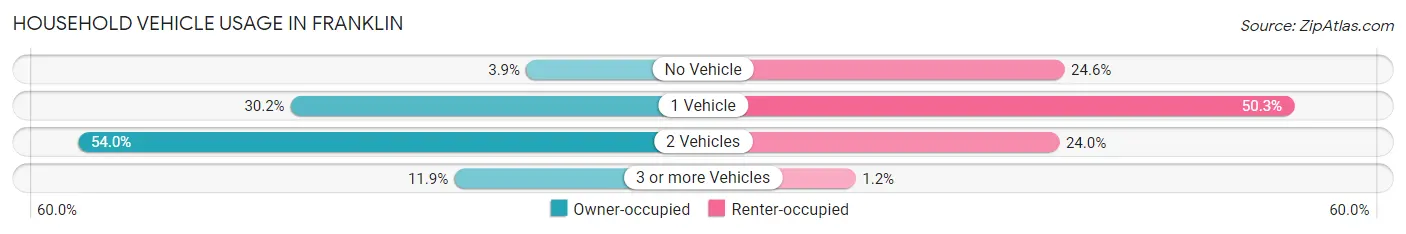
| Vehicles per Household | Owner-occupied | Renter-occupied |
| No Vehicle | 57 (3.8%) | 294 (24.6%) |
| 1 Vehicle | 447 (30.2%) | 602 (50.3%) |
| 2 Vehicles | 799 (54.0%) | 287 (24.0%) |
| 3 or more Vehicles | 176 (11.9%) | 14 (1.2%) |
| Total | 1,479 (100.0%) | 1,197 (100.0%) |
Real Estate & Mortgages in Franklin
Real Estate and Mortgage Overview in Franklin
| Characteristic | Without Mortgage | With Mortgage |
| Housing Units | 655 | 824 |
| Median Property Value | $75,000 | $126,500 |
| Median Household Income | $58,798 | $161 |
| Monthly Housing Costs | $474 | $30 |
| Real Estate Taxes | $1,545 | $0 |
Property Value by Mortgage Status in Franklin
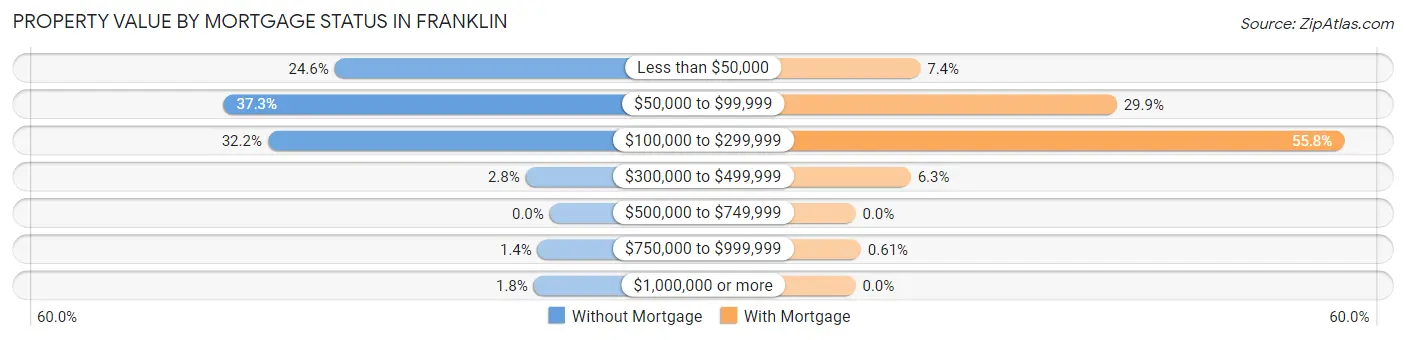
| Property Value | Without Mortgage | With Mortgage |
| Less than $50,000 | 161 (24.6%) | 61 (7.4%) |
| $50,000 to $99,999 | 244 (37.2%) | 246 (29.8%) |
| $100,000 to $299,999 | 211 (32.2%) | 460 (55.8%) |
| $300,000 to $499,999 | 18 (2.8%) | 52 (6.3%) |
| $500,000 to $749,999 | 0 (0.0%) | 0 (0.0%) |
| $750,000 to $999,999 | 9 (1.4%) | 5 (0.6%) |
| $1,000,000 or more | 12 (1.8%) | 0 (0.0%) |
| Total | 655 (100.0%) | 824 (100.0%) |
Household Income by Mortgage Status in Franklin
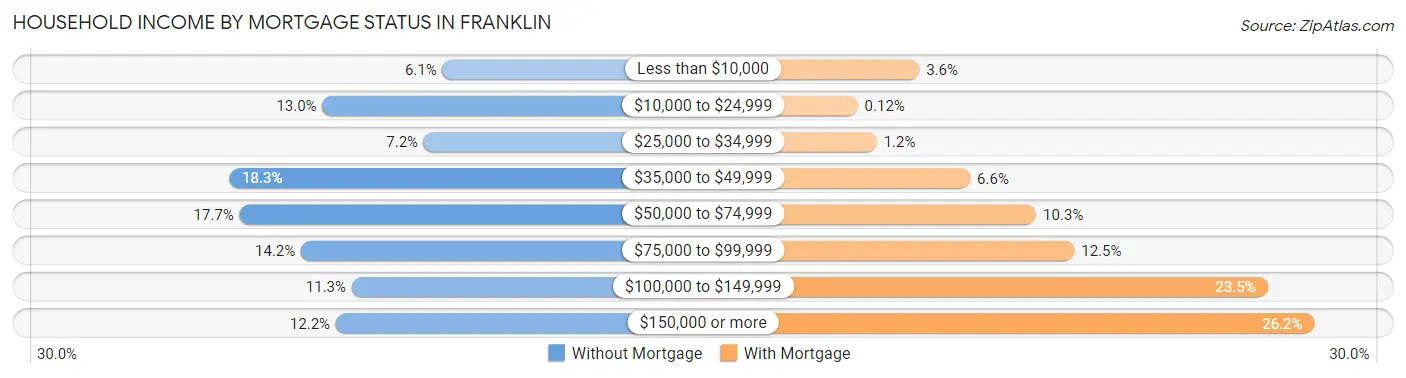
| Household Income | Without Mortgage | With Mortgage |
| Less than $10,000 | 40 (6.1%) | 30 (3.6%) |
| $10,000 to $24,999 | 85 (13.0%) | 1 (0.1%) |
| $25,000 to $34,999 | 47 (7.2%) | 10 (1.2%) |
| $35,000 to $49,999 | 120 (18.3%) | 54 (6.6%) |
| $50,000 to $74,999 | 116 (17.7%) | 85 (10.3%) |
| $75,000 to $99,999 | 93 (14.2%) | 103 (12.5%) |
| $100,000 to $149,999 | 74 (11.3%) | 194 (23.5%) |
| $150,000 or more | 80 (12.2%) | 216 (26.2%) |
| Total | 655 (100.0%) | 824 (100.0%) |
Property Value to Household Income Ratio in Franklin
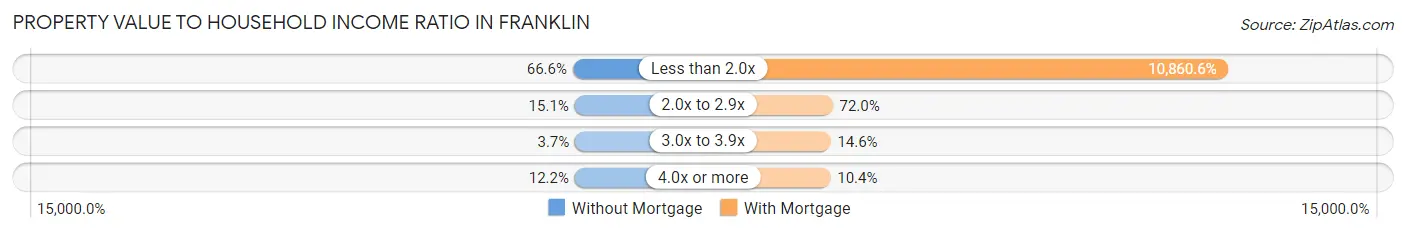
| Value-to-Income Ratio | Without Mortgage | With Mortgage |
| Less than 2.0x | 436 (66.6%) | 89,491 (10,860.6%) |
| 2.0x to 2.9x | 99 (15.1%) | 593 (72.0%) |
| 3.0x to 3.9x | 24 (3.7%) | 120 (14.6%) |
| 4.0x or more | 80 (12.2%) | 86 (10.4%) |
| Total | 655 (100.0%) | 824 (100.0%) |
Real Estate Taxes by Mortgage Status in Franklin
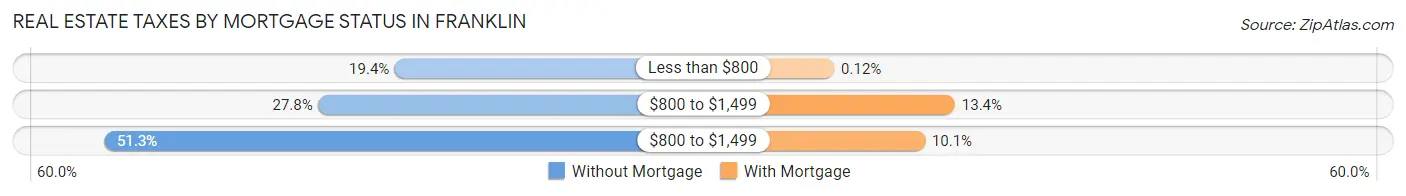
| Property Taxes | Without Mortgage | With Mortgage |
| Less than $800 | 127 (19.4%) | 1 (0.1%) |
| $800 to $1,499 | 182 (27.8%) | 110 (13.4%) |
| $800 to $1,499 | 336 (51.3%) | 83 (10.1%) |
| Total | 655 (100.0%) | 824 (100.0%) |
Health & Disability in Franklin
Health Insurance Coverage by Age in Franklin

| Age Bracket | With Coverage | Without Coverage |
| Under 6 Years | 441 (100.0%) | 0 (0.0%) |
| 6 to 18 Years | 738 (100.0%) | 0 (0.0%) |
| 19 to 25 Years | 420 (90.1%) | 46 (9.9%) |
| 26 to 34 Years | 750 (100.0%) | 0 (0.0%) |
| 35 to 44 Years | 599 (95.7%) | 27 (4.3%) |
| 45 to 54 Years | 770 (97.2%) | 22 (2.8%) |
| 55 to 64 Years | 764 (100.0%) | 0 (0.0%) |
| 65 to 74 Years | 738 (100.0%) | 0 (0.0%) |
| 75 Years and older | 528 (100.0%) | 0 (0.0%) |
| Total | 5,748 (98.4%) | 95 (1.6%) |
Health Insurance Coverage by Citizenship Status in Franklin
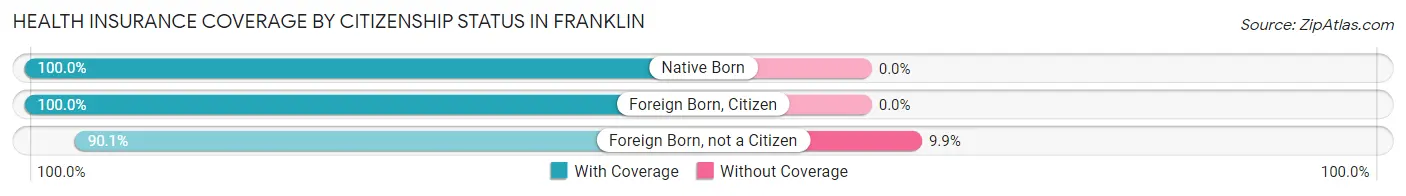
| Citizenship Status | With Coverage | Without Coverage |
| Native Born | 441 (100.0%) | 0 (0.0%) |
| Foreign Born, Citizen | 738 (100.0%) | 0 (0.0%) |
| Foreign Born, not a Citizen | 420 (90.1%) | 46 (9.9%) |
Health Insurance Coverage by Household Income in Franklin
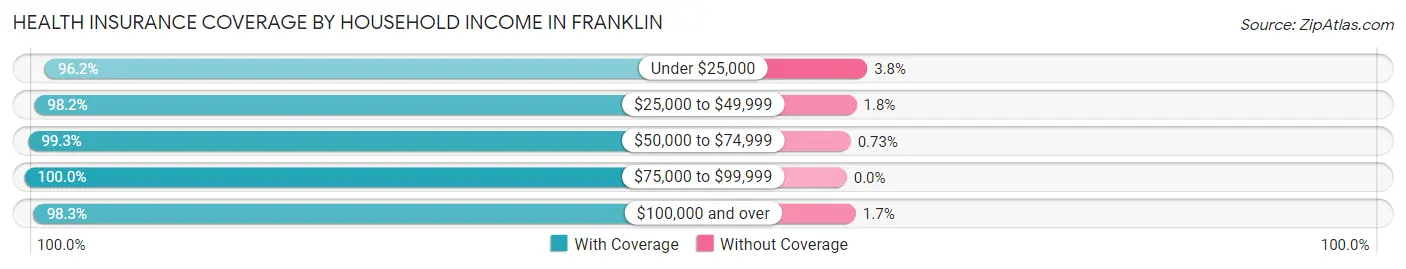
| Household Income | With Coverage | Without Coverage |
| Under $25,000 | 802 (96.2%) | 32 (3.8%) |
| $25,000 to $49,999 | 1,450 (98.2%) | 27 (1.8%) |
| $50,000 to $74,999 | 950 (99.3%) | 7 (0.7%) |
| $75,000 to $99,999 | 872 (100.0%) | 0 (0.0%) |
| $100,000 and over | 1,663 (98.3%) | 29 (1.7%) |
Public vs Private Health Insurance Coverage by Age in Franklin
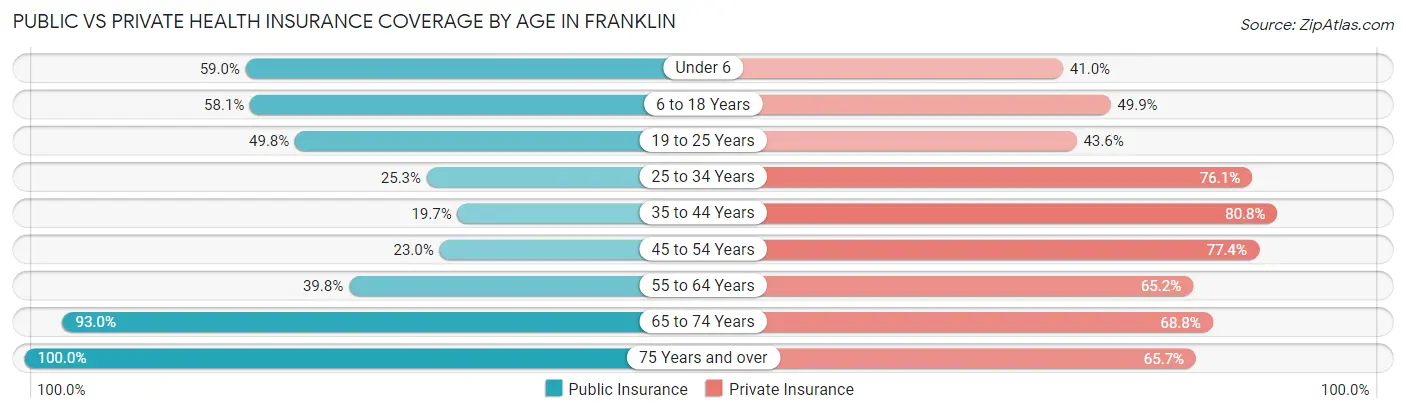
| Age Bracket | Public Insurance | Private Insurance |
| Under 6 | 260 (59.0%) | 181 (41.0%) |
| 6 to 18 Years | 429 (58.1%) | 368 (49.9%) |
| 19 to 25 Years | 232 (49.8%) | 203 (43.6%) |
| 25 to 34 Years | 190 (25.3%) | 571 (76.1%) |
| 35 to 44 Years | 123 (19.7%) | 506 (80.8%) |
| 45 to 54 Years | 182 (23.0%) | 613 (77.4%) |
| 55 to 64 Years | 304 (39.8%) | 498 (65.2%) |
| 65 to 74 Years | 686 (92.9%) | 508 (68.8%) |
| 75 Years and over | 528 (100.0%) | 347 (65.7%) |
| Total | 2,934 (50.2%) | 3,795 (64.9%) |
Disability Status by Sex by Age in Franklin
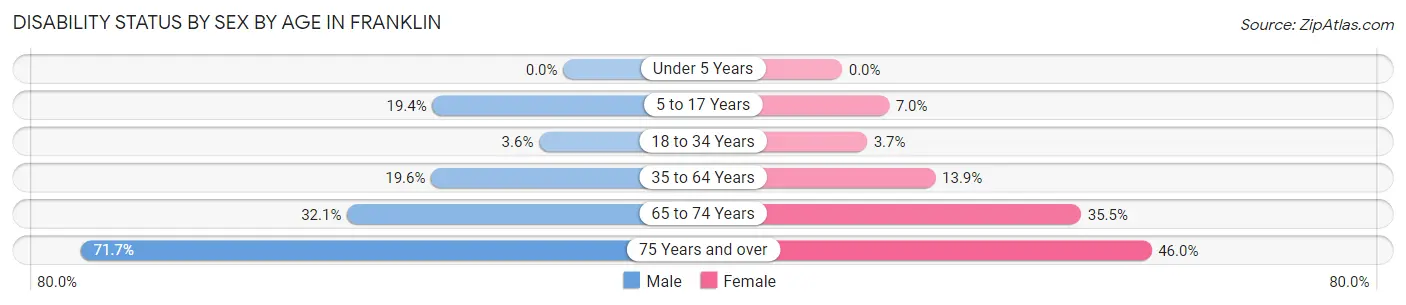
| Age Bracket | Male | Female |
| Under 5 Years | 0 (0.0%) | 0 (0.0%) |
| 5 to 17 Years | 74 (19.4%) | 28 (7.0%) |
| 18 to 34 Years | 23 (3.6%) | 22 (3.7%) |
| 35 to 64 Years | 200 (19.6%) | 161 (13.9%) |
| 65 to 74 Years | 103 (32.1%) | 148 (35.5%) |
| 75 Years and over | 157 (71.7%) | 142 (46.0%) |
Disability Class by Sex by Age in Franklin
Disability Class: Hearing Difficulty
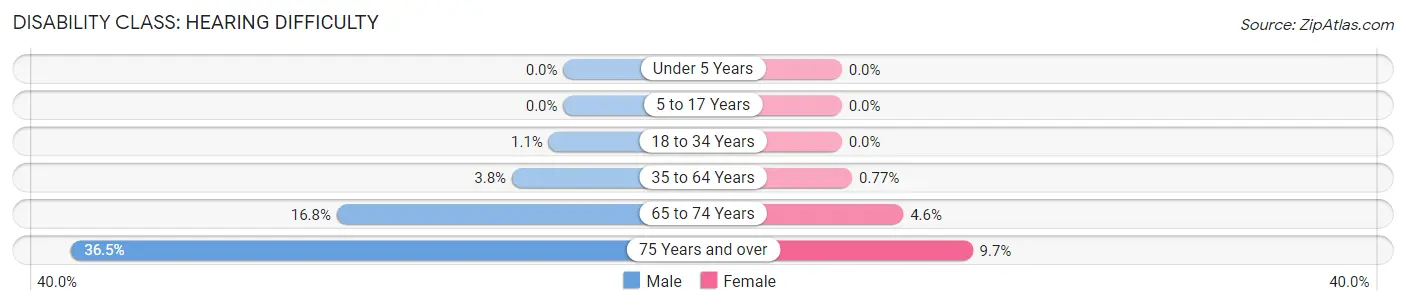
| Age Bracket | Male | Female |
| Under 5 Years | 0 (0.0%) | 0 (0.0%) |
| 5 to 17 Years | 0 (0.0%) | 0 (0.0%) |
| 18 to 34 Years | 7 (1.1%) | 0 (0.0%) |
| 35 to 64 Years | 39 (3.8%) | 9 (0.8%) |
| 65 to 74 Years | 54 (16.8%) | 19 (4.6%) |
| 75 Years and over | 80 (36.5%) | 30 (9.7%) |
Disability Class: Vision Difficulty
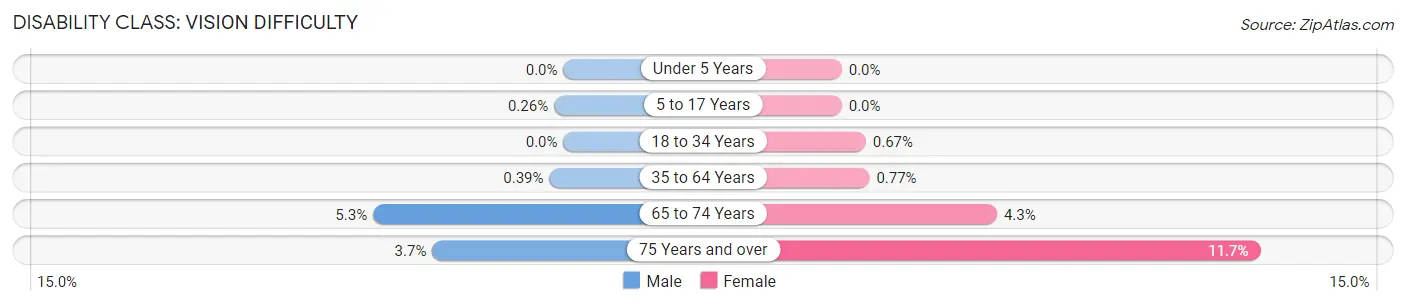
| Age Bracket | Male | Female |
| Under 5 Years | 0 (0.0%) | 0 (0.0%) |
| 5 to 17 Years | 1 (0.3%) | 0 (0.0%) |
| 18 to 34 Years | 0 (0.0%) | 4 (0.7%) |
| 35 to 64 Years | 4 (0.4%) | 9 (0.8%) |
| 65 to 74 Years | 17 (5.3%) | 18 (4.3%) |
| 75 Years and over | 8 (3.6%) | 36 (11.7%) |
Disability Class: Cognitive Difficulty
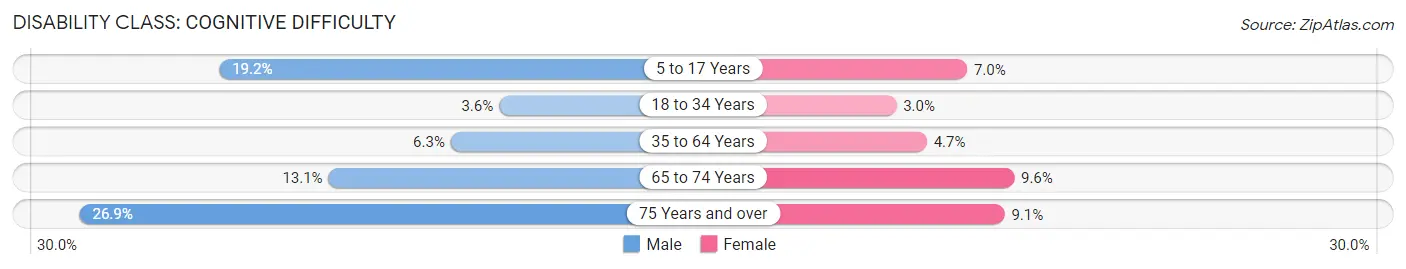
| Age Bracket | Male | Female |
| 5 to 17 Years | 73 (19.2%) | 28 (7.0%) |
| 18 to 34 Years | 23 (3.6%) | 18 (3.0%) |
| 35 to 64 Years | 64 (6.3%) | 55 (4.7%) |
| 65 to 74 Years | 42 (13.1%) | 40 (9.6%) |
| 75 Years and over | 59 (26.9%) | 28 (9.1%) |
Disability Class: Ambulatory Difficulty
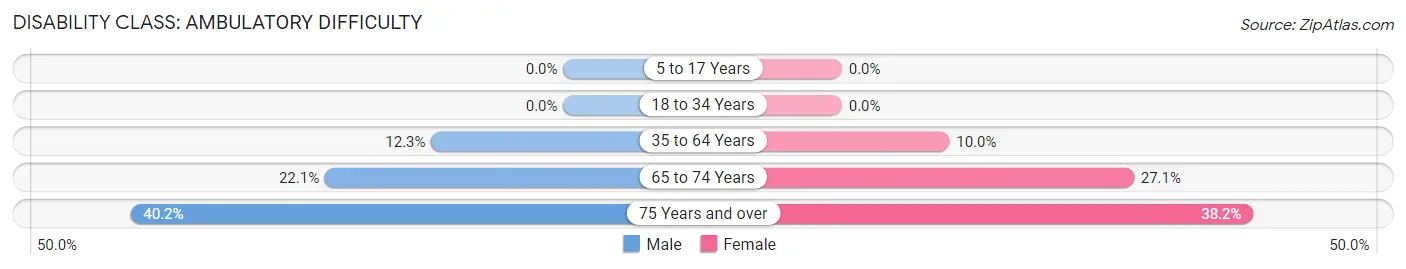
| Age Bracket | Male | Female |
| 5 to 17 Years | 0 (0.0%) | 0 (0.0%) |
| 18 to 34 Years | 0 (0.0%) | 0 (0.0%) |
| 35 to 64 Years | 125 (12.2%) | 116 (10.0%) |
| 65 to 74 Years | 71 (22.1%) | 113 (27.1%) |
| 75 Years and over | 88 (40.2%) | 118 (38.2%) |
Disability Class: Self-Care Difficulty
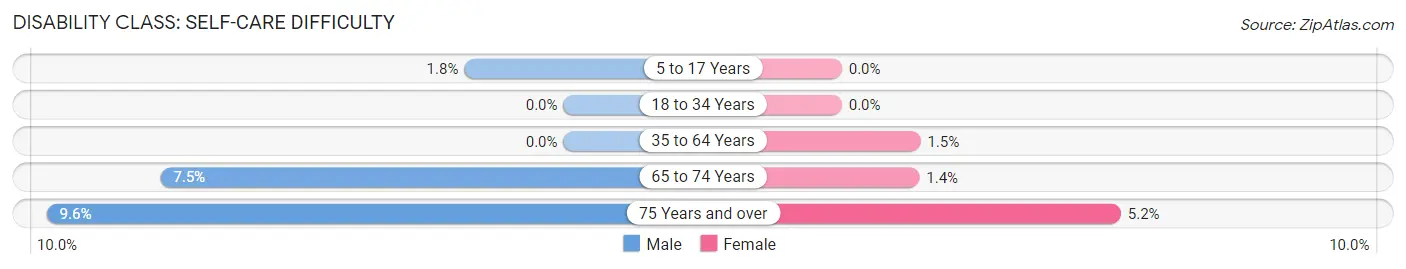
| Age Bracket | Male | Female |
| 5 to 17 Years | 7 (1.8%) | 0 (0.0%) |
| 18 to 34 Years | 0 (0.0%) | 0 (0.0%) |
| 35 to 64 Years | 0 (0.0%) | 17 (1.5%) |
| 65 to 74 Years | 24 (7.5%) | 6 (1.4%) |
| 75 Years and over | 21 (9.6%) | 16 (5.2%) |
Technology Access in Franklin
Computing Device Access in Franklin
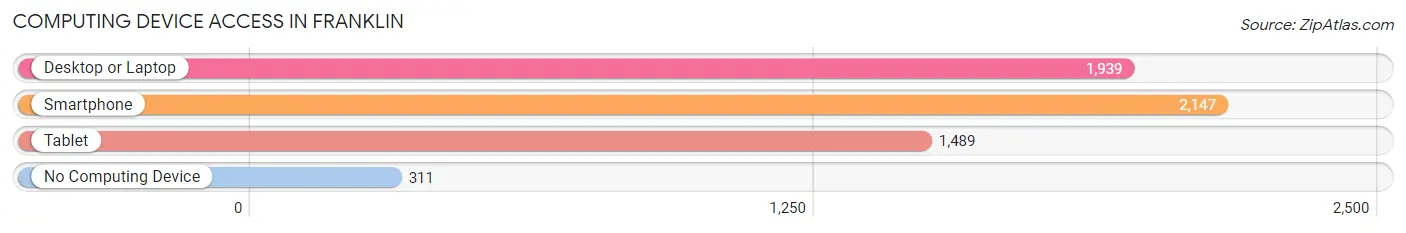
| Device Type | # Households | % Households |
| Desktop or Laptop | 1,939 | 72.5% |
| Smartphone | 2,147 | 80.2% |
| Tablet | 1,489 | 55.6% |
| No Computing Device | 311 | 11.6% |
| Total | 2,676 | 100.0% |
Internet Access in Franklin
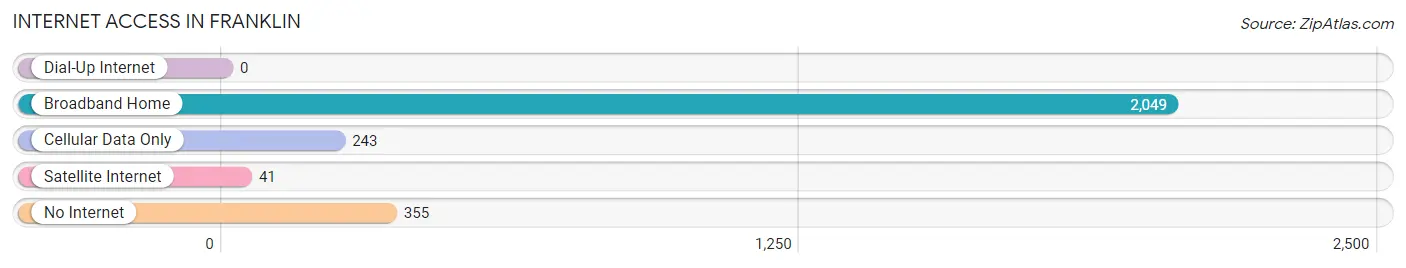
| Internet Type | # Households | % Households |
| Dial-Up Internet | 0 | 0.0% |
| Broadband Home | 2,049 | 76.6% |
| Cellular Data Only | 243 | 9.1% |
| Satellite Internet | 41 | 1.5% |
| No Internet | 355 | 13.3% |
| Total | 2,676 | 100.0% |
Franklin Summary
Franklin, Pennsylvania is a city located in Venango County, Pennsylvania. It is the county seat of Venango County and is located in the northwestern part of the state. The city is situated along the Allegheny River and is part of the Oil Region of Pennsylvania. The population of Franklin was estimated to be 6,845 in 2019.
History
The area that is now Franklin was first settled in 1795 by William Franklin, a Revolutionary War veteran. The town was originally known as Franklinville and was incorporated as a borough in 1839. The town was named after William Franklin, who was the son of Benjamin Franklin.
In 1844, the borough was reincorporated as a city. During the 19th century, Franklin was an important center for the oil industry. The city was home to several oil refineries and was the site of the first oil well in the United States.
Geography
Franklin is located in northwestern Pennsylvania at the confluence of the Allegheny and French Creek rivers. The city has a total area of 2.3 square miles, all of which is land. The city is located in the Oil Region of Pennsylvania and is part of the Appalachian Mountains.
The climate in Franklin is humid continental, with cold winters and warm summers. The average annual temperature is 48°F, with an average high of 68°F in July and an average low of 28°F in January. The average annual precipitation is 40 inches.
Economy
Franklin’s economy is largely based on the oil industry. The city is home to several oil refineries and is the site of the first oil well in the United States. The city is also home to several manufacturing companies, including a paper mill and a steel mill.
The city is also home to several educational institutions, including the University of Pittsburgh at Titusville, the Pennsylvania College of Technology, and the Venango County Career and Technical Center.
Demographics
As of the 2019 census, the population of Franklin was estimated to be 6,845. The racial makeup of the city was 94.3% White, 2.2% African American, 0.3% Native American, 0.7% Asian, 0.1% Pacific Islander, 0.7% from other races, and 1.7% from two or more races. Hispanic or Latino of any race were 2.2% of the population.
The median household income in Franklin was $37,941 in 2019. The median age of the population was 43.7 years. The city’s population is largely made up of families, with 28.3% of households having children under the age of 18.
Conclusion
Franklin, Pennsylvania is a city located in Venango County, Pennsylvania. It is the county seat of Venango County and is located in the northwestern part of the state. The city is situated along the Allegheny River and is part of the Oil Region of Pennsylvania. The population of Franklin was estimated to be 6,845 in 2019. The city’s economy is largely based on the oil industry, and it is also home to several educational institutions. The racial makeup of the city was 94.3% White, 2.2% African American, 0.3% Native American, 0.7% Asian, 0.1% Pacific Islander, 0.7% from other races, and 1.7% from two or more races. The median household income in Franklin was $37,941 in 2019.
Common Questions
What is Per Capita Income in Franklin?
Per Capita income in Franklin is $32,849.
What is the Median Family Income in Franklin?
Median Family Income in Franklin is $72,404.
What is the Median Household income in Franklin?
Median Household Income in Franklin is $54,235.
What is Income or Wage Gap in Franklin?
Income or Wage Gap in Franklin is 27.4%.
Women in Franklin earn 72.6 cents for every dollar earned by a man.
What is Inequality or Gini Index in Franklin?
Inequality or Gini Index in Franklin is 0.45.
What is the Total Population of Franklin?
Total Population of Franklin is 6,066.
What is the Total Male Population of Franklin?
Total Male Population of Franklin is 2,909.
What is the Total Female Population of Franklin?
Total Female Population of Franklin is 3,157.
What is the Ratio of Males per 100 Females in Franklin?
There are 92.14 Males per 100 Females in Franklin.
What is the Ratio of Females per 100 Males in Franklin?
There are 108.53 Females per 100 Males in Franklin.
What is the Median Population Age in Franklin?
Median Population Age in Franklin is 43.9 Years.
What is the Average Family Size in Franklin
Average Family Size in Franklin is 2.7 People.
What is the Average Household Size in Franklin
Average Household Size in Franklin is 2.2 People.
How Large is the Labor Force in Franklin?
There are 2,911 People in the Labor Forcein in Franklin.
What is the Percentage of People in the Labor Force in Franklin?
58.4% of People are in the Labor Force in Franklin.
What is the Unemployment Rate in Franklin?
Unemployment Rate in Franklin is 7.2%.