Fayetteville, PA Map & Demographics
Fayetteville Map
Fayetteville Overview
$37,884
PER CAPITA INCOME
$75,139
AVG FAMILY INCOME
$58,510
AVG HOUSEHOLD INCOME
39.1%
WAGE / INCOME GAP [ % ]
60.9¢/ $1
WAGE / INCOME GAP [ $ ]
0.46
INEQUALITY / GINI INDEX
2,745
TOTAL POPULATION
1,184
MALE POPULATION
1,561
FEMALE POPULATION
75.85
MALES / 100 FEMALES
131.84
FEMALES / 100 MALES
51.1
MEDIAN AGE
2.6
AVG FAMILY SIZE
2.0
AVG HOUSEHOLD SIZE
1,203
LABOR FORCE [ PEOPLE ]
52.7%
PERCENT IN LABOR FORCE
Fayetteville Zip Codes
Fayetteville Area Codes
Income in Fayetteville
Income Overview in Fayetteville
Per Capita Income in Fayetteville is $37,884, while median incomes of families and households are $75,139 and $58,510 respectively.
| Characteristic | Number | Measure |
| Per Capita Income | 2,745 | $37,884 |
| Median Family Income | 790 | $75,139 |
| Mean Family Income | 790 | $68,328 |
| Median Household Income | 1,353 | $58,510 |
| Mean Household Income | 1,353 | $76,337 |
| Income Deficit | 790 | $0 |
| Wage / Income Gap (%) | 2,745 | 39.14% |
| Wage / Income Gap ($) | 2,745 | 60.86¢ per $1 |
| Gini / Inequality Index | 2,745 | 0.46 |
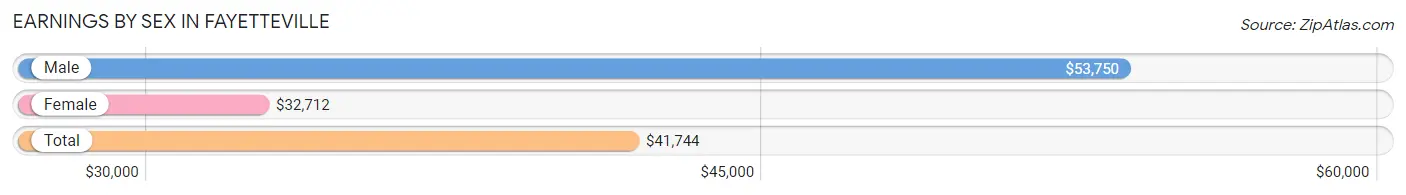
Earnings by Sex in Fayetteville
Average Earnings in Fayetteville are $41,744, $53,750 for men and $32,712 for women, a difference of 39.1%.
| Sex | Number | Average Earnings |
| Male | 616 (51.2%) | $53,750 |
| Female | 587 (48.8%) | $32,712 |
| Total | 1,203 (100.0%) | $41,744 |
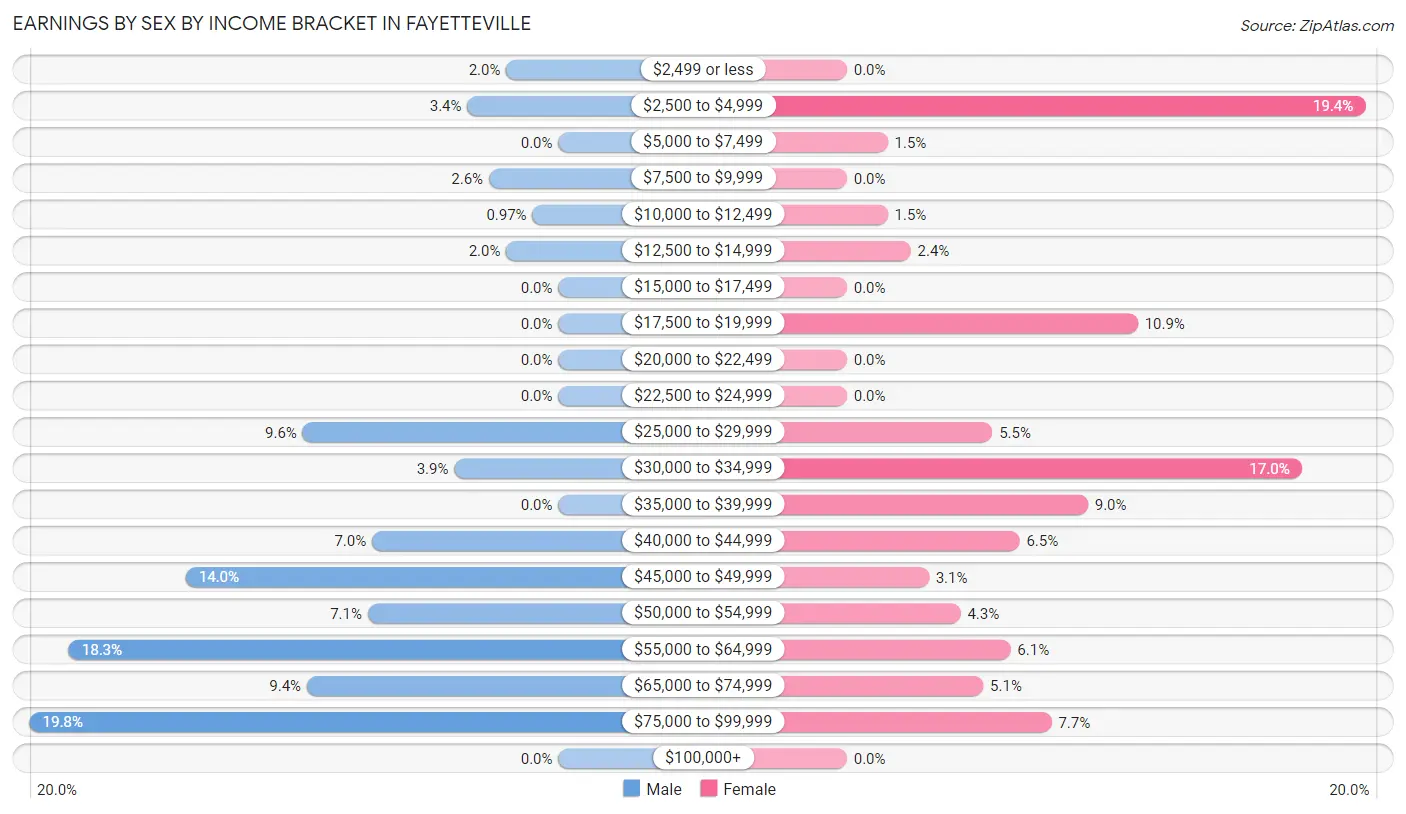
Earnings by Sex by Income Bracket in Fayetteville
The most common earnings brackets in Fayetteville are $75,000 to $99,999 for men (122 | 19.8%) and $2,500 to $4,999 for women (114 | 19.4%).
| Income | Male | Female |
| $2,499 or less | 12 (1.9%) | 0 (0.0%) |
| $2,500 to $4,999 | 21 (3.4%) | 114 (19.4%) |
| $5,000 to $7,499 | 0 (0.0%) | 9 (1.5%) |
| $7,500 to $9,999 | 16 (2.6%) | 0 (0.0%) |
| $10,000 to $12,499 | 6 (1.0%) | 9 (1.5%) |
| $12,500 to $14,999 | 12 (1.9%) | 14 (2.4%) |
| $15,000 to $17,499 | 0 (0.0%) | 0 (0.0%) |
| $17,500 to $19,999 | 0 (0.0%) | 64 (10.9%) |
| $20,000 to $22,499 | 0 (0.0%) | 0 (0.0%) |
| $22,500 to $24,999 | 0 (0.0%) | 0 (0.0%) |
| $25,000 to $29,999 | 59 (9.6%) | 32 (5.4%) |
| $30,000 to $34,999 | 24 (3.9%) | 100 (17.0%) |
| $35,000 to $39,999 | 0 (0.0%) | 53 (9.0%) |
| $40,000 to $44,999 | 43 (7.0%) | 38 (6.5%) |
| $45,000 to $49,999 | 86 (14.0%) | 18 (3.1%) |
| $50,000 to $54,999 | 44 (7.1%) | 25 (4.3%) |
| $55,000 to $64,999 | 113 (18.3%) | 36 (6.1%) |
| $65,000 to $74,999 | 58 (9.4%) | 30 (5.1%) |
| $75,000 to $99,999 | 122 (19.8%) | 45 (7.7%) |
| $100,000+ | 0 (0.0%) | 0 (0.0%) |
| Total | 616 (100.0%) | 587 (100.0%) |
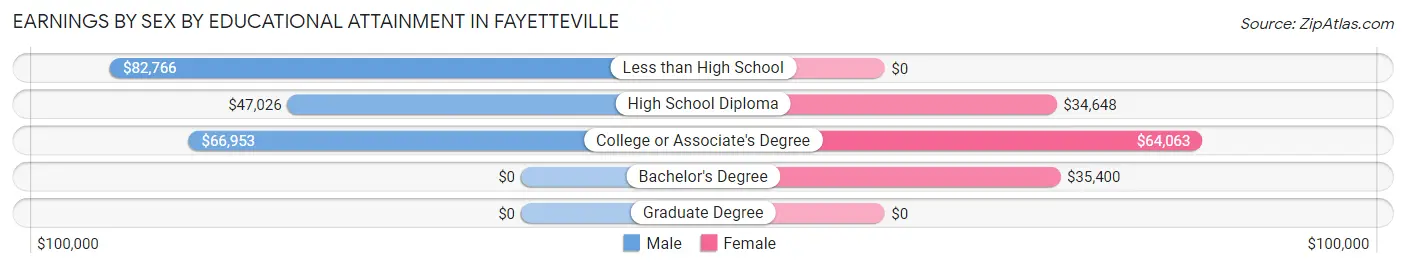
Earnings by Sex by Educational Attainment in Fayetteville
Average earnings in Fayetteville are $53,750 for men and $36,297 for women, a difference of 32.5%. Men with an educational attainment of less than high school enjoy the highest average annual earnings of $82,766, while those with high school diploma education earn the least with $47,026. Women with an educational attainment of college or associate's degree earn the most with the average annual earnings of $64,063, while those with high school diploma education have the smallest earnings of $34,648.
| Educational Attainment | Male Income | Female Income |
| Less than High School | $82,766 | $0 |
| High School Diploma | $47,026 | $34,648 |
| College or Associate's Degree | $66,953 | $64,063 |
| Bachelor's Degree | - | - |
| Graduate Degree | - | - |
| Total | $53,750 | $36,297 |
Family Income in Fayetteville
Family Income Brackets in Fayetteville
According to the Fayetteville family income data, there are 287 families falling into the $75,000 to $99,999 income range, which is the most common income bracket and makes up 36.3% of all families.
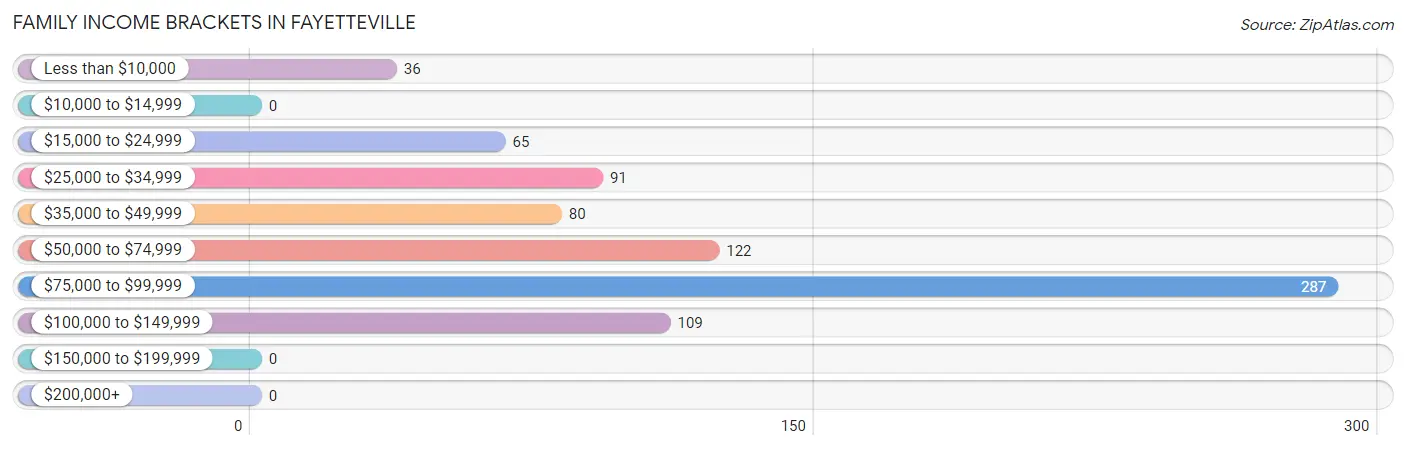
| Income Bracket | # Families | % Families |
| Less than $10,000 | 36 | 4.6% |
| $10,000 to $14,999 | 0 | 0.0% |
| $15,000 to $24,999 | 65 | 8.2% |
| $25,000 to $34,999 | 91 | 11.5% |
| $35,000 to $49,999 | 80 | 10.1% |
| $50,000 to $74,999 | 122 | 15.4% |
| $75,000 to $99,999 | 287 | 36.3% |
| $100,000 to $149,999 | 109 | 13.8% |
| $150,000 to $199,999 | 0 | 0.0% |
| $200,000+ | 0 | 0.0% |
Family Income by Famaliy Size in Fayetteville
4-person families (150 | 19.0%) account for the highest median family income in Fayetteville with $82,895 per family, while 2-person families (484 | 61.3%) have the highest median income of $32,500 per family member.
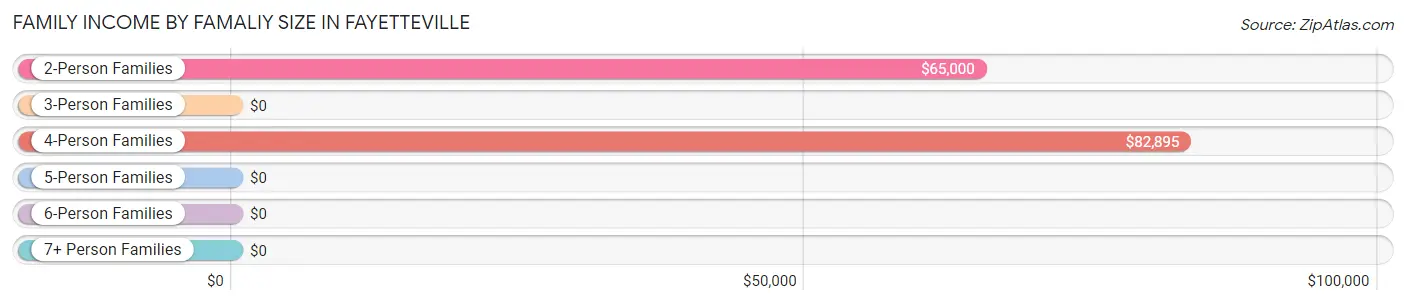
| Income Bracket | # Families | Median Income |
| 2-Person Families | 484 (61.3%) | $65,000 |
| 3-Person Families | 128 (16.2%) | $0 |
| 4-Person Families | 150 (19.0%) | $82,895 |
| 5-Person Families | 28 (3.5%) | $0 |
| 6-Person Families | 0 (0.0%) | $0 |
| 7+ Person Families | 0 (0.0%) | $0 |
| Total | 790 (100.0%) | $75,139 |
Family Income by Number of Earners in Fayetteville
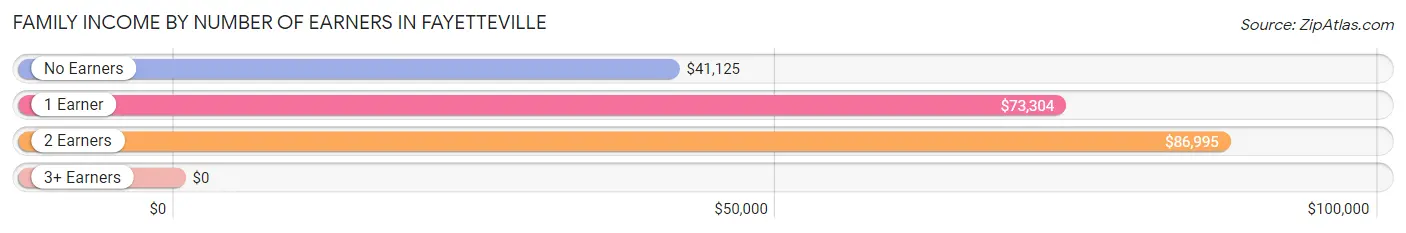
| Number of Earners | # Families | Median Income |
| No Earners | 211 (26.7%) | $41,125 |
| 1 Earner | 373 (47.2%) | $73,304 |
| 2 Earners | 153 (19.4%) | $86,995 |
| 3+ Earners | 53 (6.7%) | $0 |
| Total | 790 (100.0%) | $75,139 |
Household Income in Fayetteville
Household Income Brackets in Fayetteville
With 368 households falling in the category, the $75,000 to $99,999 income range is the most frequent in Fayetteville, accounting for 27.2% of all households.
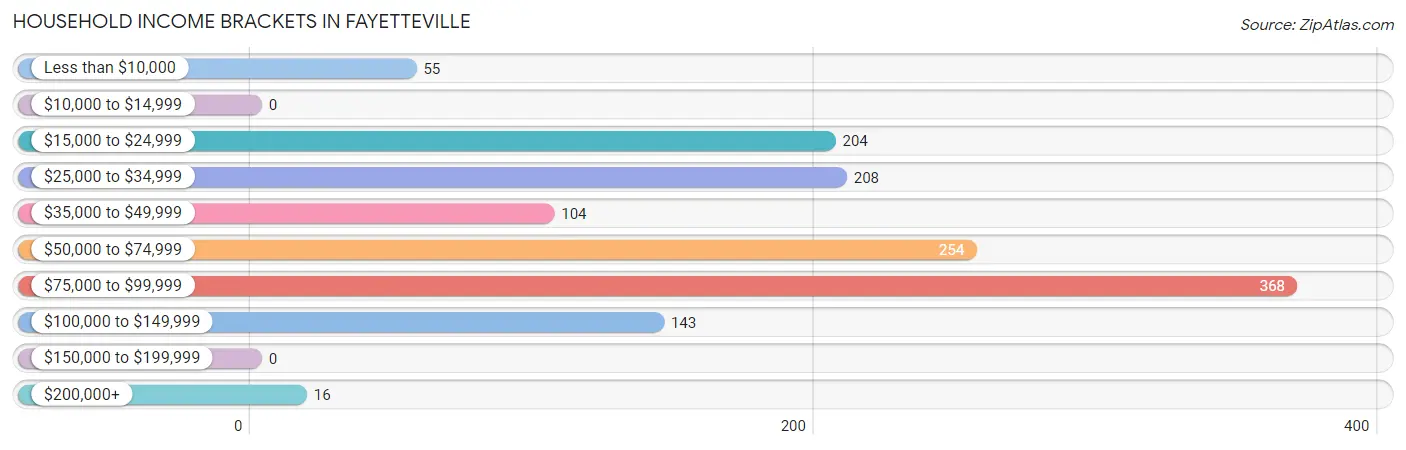
| Income Bracket | # Households | % Households |
| Less than $10,000 | 55 | 4.1% |
| $10,000 to $14,999 | 0 | 0.0% |
| $15,000 to $24,999 | 204 | 15.1% |
| $25,000 to $34,999 | 208 | 15.4% |
| $35,000 to $49,999 | 104 | 7.7% |
| $50,000 to $74,999 | 254 | 18.8% |
| $75,000 to $99,999 | 368 | 27.2% |
| $100,000 to $149,999 | 143 | 10.6% |
| $150,000 to $199,999 | 0 | 0.0% |
| $200,000+ | 16 | 1.2% |
Household Income by Householder Age in Fayetteville
The median household income in Fayetteville is $58,510, with the highest median household income of $81,250 found in the 25 to 44 years age bracket for the primary householder. A total of 240 households (17.7%) fall into this category. Meanwhile, the 15 to 24 years age bracket for the primary householder has the lowest median household income of $0, with 53 households (3.9%) in this group.
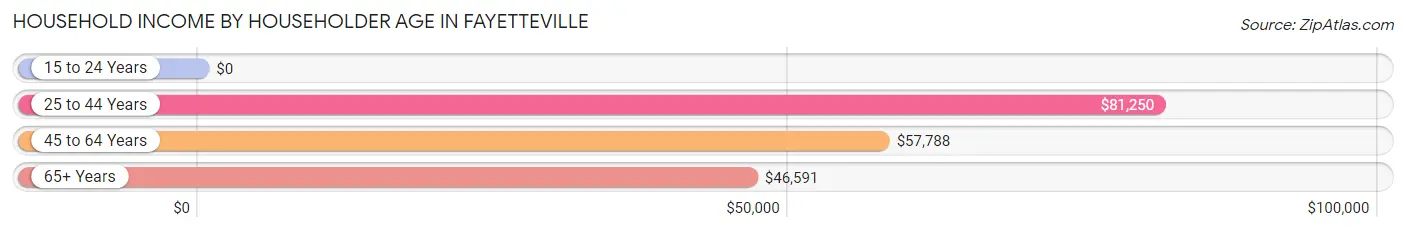
| Income Bracket | # Households | Median Income |
| 15 to 24 Years | 53 (3.9%) | $0 |
| 25 to 44 Years | 240 (17.7%) | $81,250 |
| 45 to 64 Years | 550 (40.6%) | $57,788 |
| 65+ Years | 510 (37.7%) | $46,591 |
| Total | 1,353 (100.0%) | $58,510 |
Poverty in Fayetteville
Income Below Poverty by Sex and Age in Fayetteville
With 5.2% poverty level for males and 3.9% for females among the residents of Fayetteville, 35 to 44 year old males and under 5 year old females are the most vulnerable to poverty, with 22 males (19.1%) and 20 females (20.6%) in their respective age groups living below the poverty level.
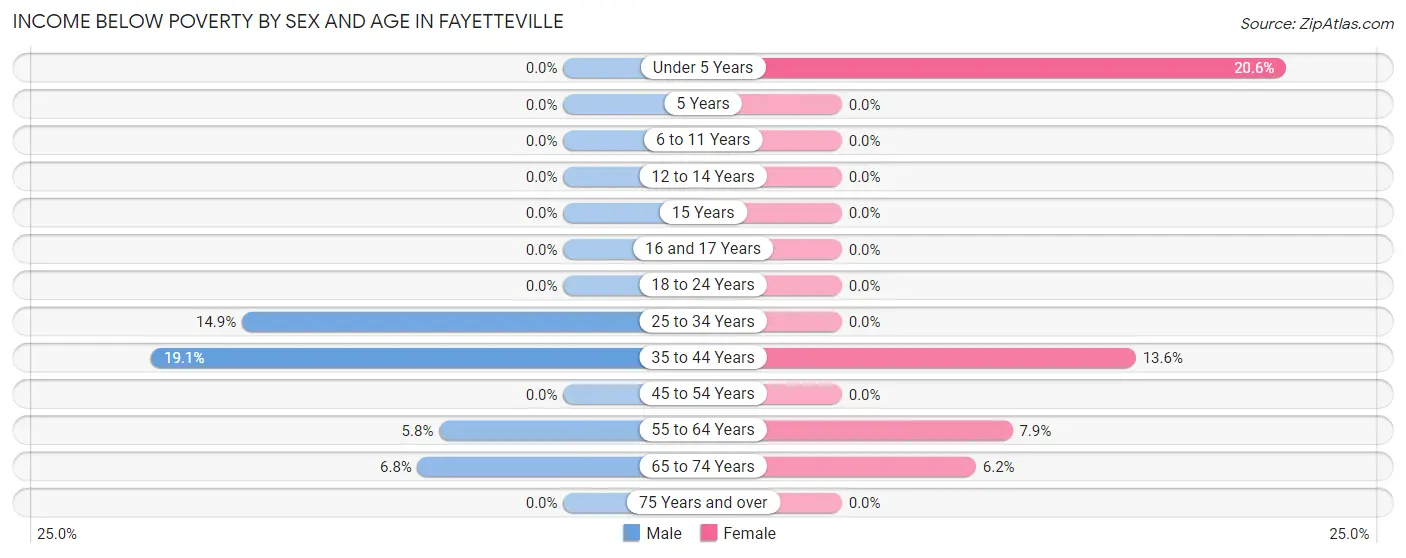
| Age Bracket | Male | Female |
| Under 5 Years | 0 (0.0%) | 20 (20.6%) |
| 5 Years | 0 (0.0%) | 0 (0.0%) |
| 6 to 11 Years | 0 (0.0%) | 0 (0.0%) |
| 12 to 14 Years | 0 (0.0%) | 0 (0.0%) |
| 15 Years | 0 (0.0%) | 0 (0.0%) |
| 16 and 17 Years | 0 (0.0%) | 0 (0.0%) |
| 18 to 24 Years | 0 (0.0%) | 0 (0.0%) |
| 25 to 34 Years | 17 (14.9%) | 0 (0.0%) |
| 35 to 44 Years | 22 (19.1%) | 6 (13.6%) |
| 45 to 54 Years | 0 (0.0%) | 0 (0.0%) |
| 55 to 64 Years | 8 (5.8%) | 19 (7.9%) |
| 65 to 74 Years | 14 (6.8%) | 15 (6.2%) |
| 75 Years and over | 0 (0.0%) | 0 (0.0%) |
| Total | 61 (5.2%) | 60 (3.9%) |
Income Above Poverty by Sex and Age in Fayetteville
According to the poverty statistics in Fayetteville, males aged under 5 years and females aged 5 years are the age groups that are most secure financially, with 100.0% of males and 100.0% of females in these age groups living above the poverty line.
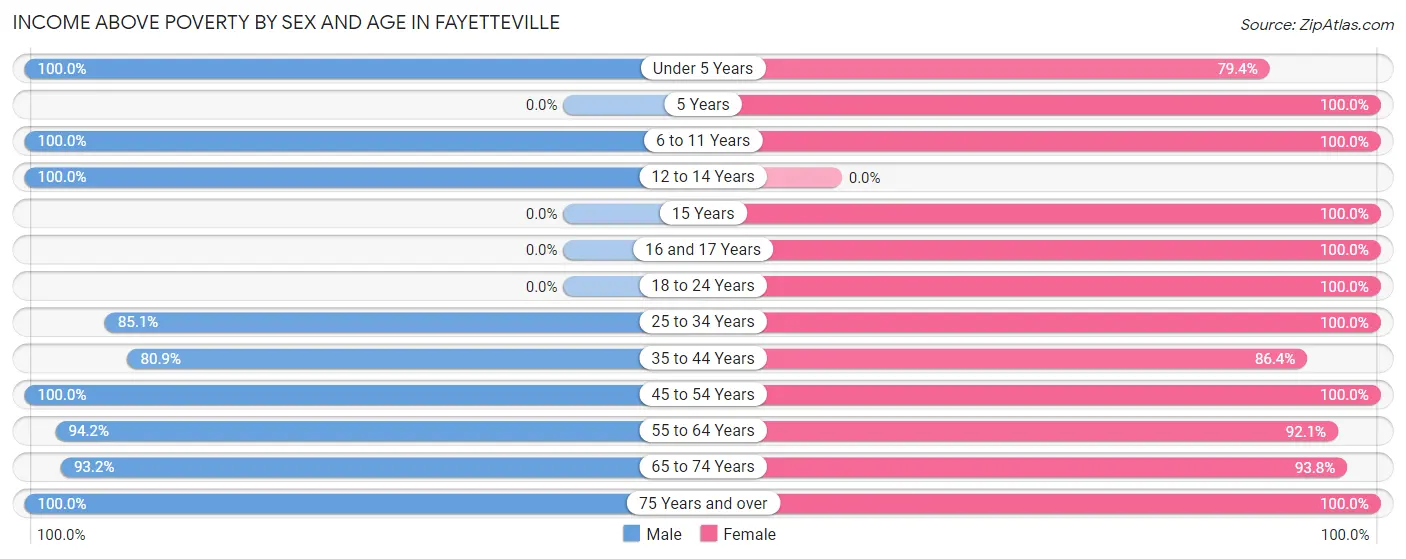
| Age Bracket | Male | Female |
| Under 5 Years | 55 (100.0%) | 77 (79.4%) |
| 5 Years | 0 (0.0%) | 25 (100.0%) |
| 6 to 11 Years | 70 (100.0%) | 89 (100.0%) |
| 12 to 14 Years | 48 (100.0%) | 0 (0.0%) |
| 15 Years | 0 (0.0%) | 36 (100.0%) |
| 16 and 17 Years | 0 (0.0%) | 19 (100.0%) |
| 18 to 24 Years | 0 (0.0%) | 213 (100.0%) |
| 25 to 34 Years | 97 (85.1%) | 217 (100.0%) |
| 35 to 44 Years | 93 (80.9%) | 38 (86.4%) |
| 45 to 54 Years | 215 (100.0%) | 160 (100.0%) |
| 55 to 64 Years | 131 (94.2%) | 221 (92.1%) |
| 65 to 74 Years | 193 (93.2%) | 226 (93.8%) |
| 75 Years and over | 205 (100.0%) | 153 (100.0%) |
| Total | 1,107 (94.8%) | 1,474 (96.1%) |
Income Below Poverty Among Married-Couple Families in Fayetteville
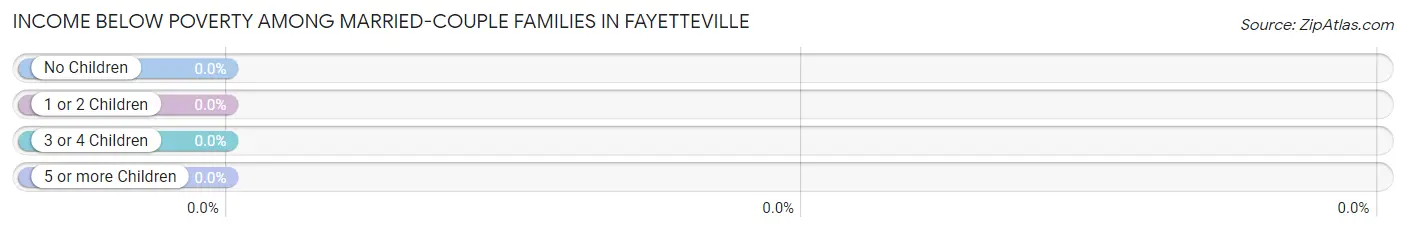
| Children | Above Poverty | Below Poverty |
| No Children | 366 (100.0%) | 0 (0.0%) |
| 1 or 2 Children | 189 (100.0%) | 0 (0.0%) |
| 3 or 4 Children | 7 (100.0%) | 0 (0.0%) |
| 5 or more Children | 0 (0.0%) | 0 (0.0%) |
| Total | 562 (100.0%) | 0 (0.0%) |
Income Below Poverty Among Single-Parent Households in Fayetteville
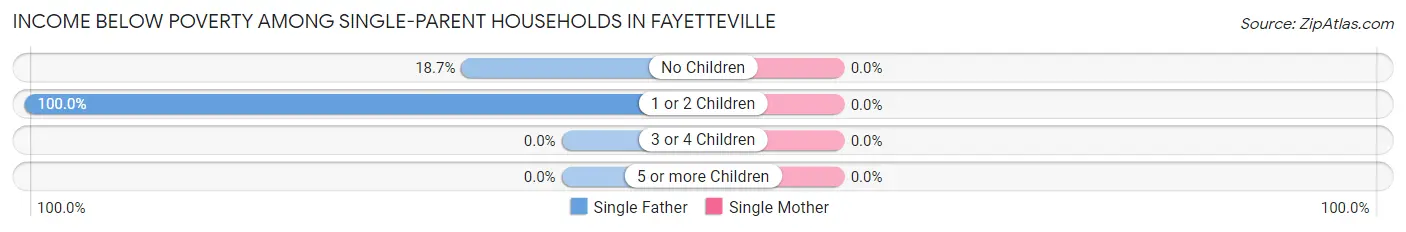
| Children | Single Father | Single Mother |
| No Children | 14 (18.7%) | 0 (0.0%) |
| 1 or 2 Children | 22 (100.0%) | 0 (0.0%) |
| 3 or 4 Children | 0 (0.0%) | 0 (0.0%) |
| 5 or more Children | 0 (0.0%) | 0 (0.0%) |
| Total | 36 (37.1%) | 0 (0.0%) |
Income Below Poverty Among Married-Couple vs Single-Parent Households in Fayetteville
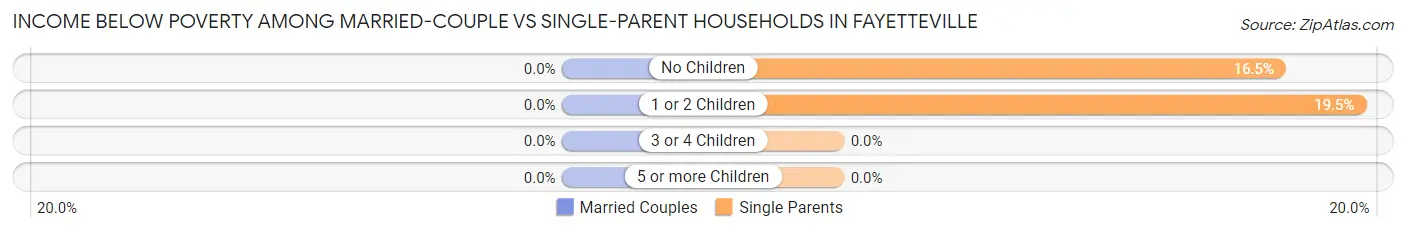
| Children | Married-Couple Families | Single-Parent Households |
| No Children | 0 (0.0%) | 14 (16.5%) |
| 1 or 2 Children | 0 (0.0%) | 22 (19.5%) |
| 3 or 4 Children | 0 (0.0%) | 0 (0.0%) |
| 5 or more Children | 0 (0.0%) | 0 (0.0%) |
| Total | 0 (0.0%) | 36 (15.8%) |
Race in Fayetteville
The most populous races in Fayetteville are White / Caucasian (2,501 | 91.1%), Two or more Races (228 | 8.3%), and Black / African American (16 | 0.6%).
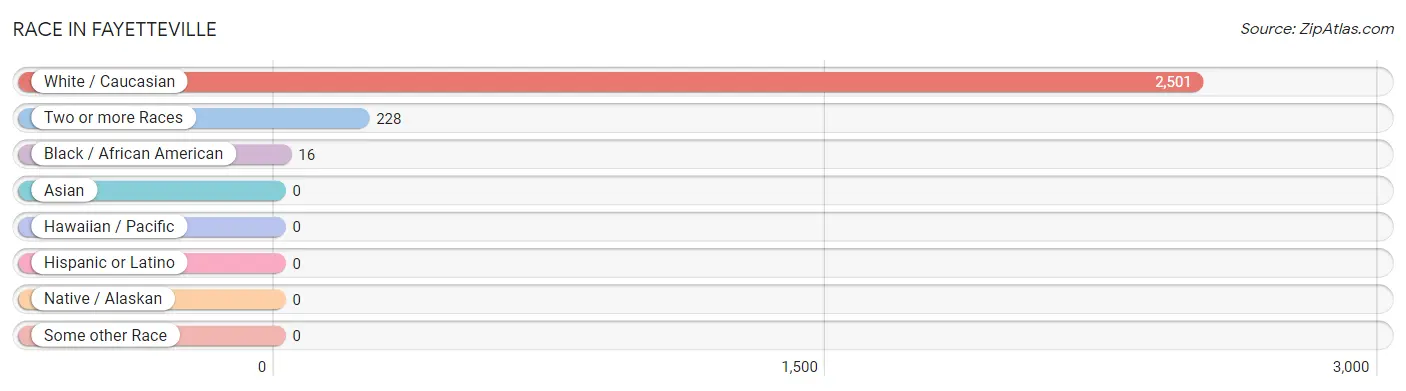
| Race | # Population | % Population |
| Asian | 0 | 0.0% |
| Black / African American | 16 | 0.6% |
| Hawaiian / Pacific | 0 | 0.0% |
| Hispanic or Latino | 0 | 0.0% |
| Native / Alaskan | 0 | 0.0% |
| White / Caucasian | 2,501 | 91.1% |
| Two or more Races | 228 | 8.3% |
| Some other Race | 0 | 0.0% |
| Total | 2,745 | 100.0% |
Ancestry in Fayetteville
The most populous ancestries reported in Fayetteville are German (540 | 19.7%), American (329 | 12.0%), English (269 | 9.8%), Irish (231 | 8.4%), and Scottish (123 | 4.5%), together accounting for 54.4% of all Fayetteville residents.
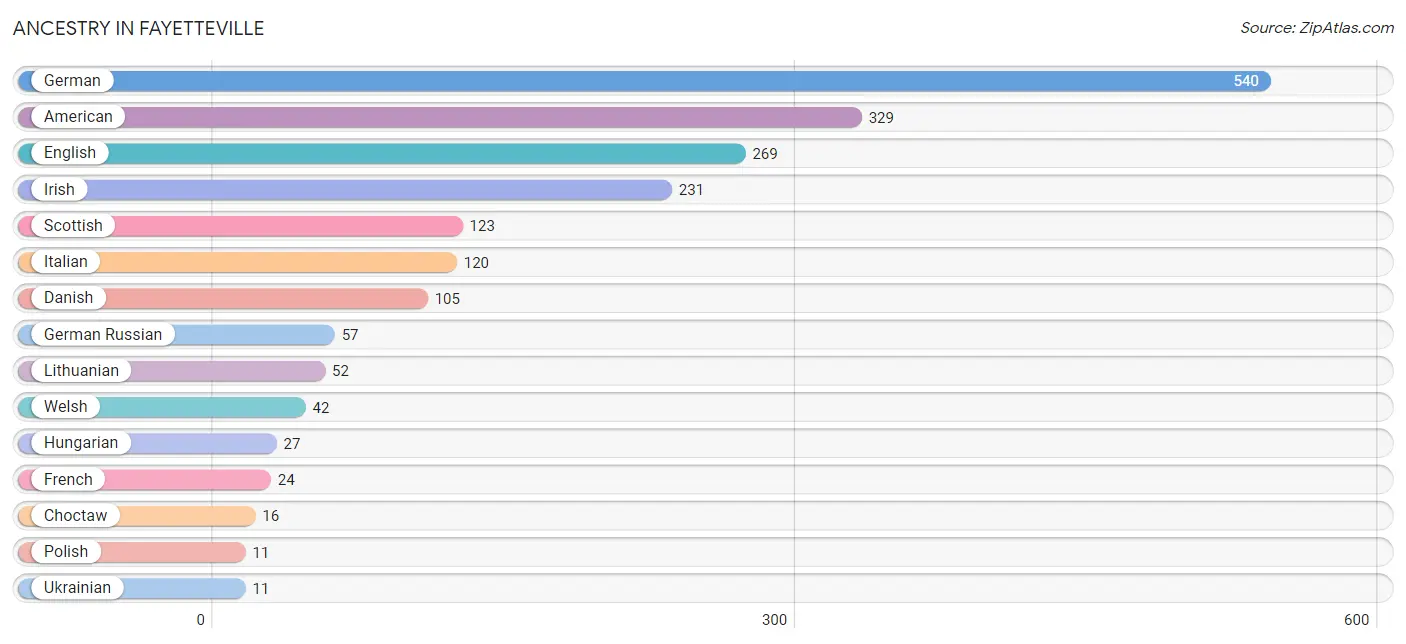
| Ancestry | # Population | % Population |
| African | 10 | 0.4% |
| American | 329 | 12.0% |
| Belgian | 6 | 0.2% |
| British | 9 | 0.3% |
| Choctaw | 16 | 0.6% |
| Danish | 105 | 3.8% |
| English | 269 | 9.8% |
| French | 24 | 0.9% |
| German | 540 | 19.7% |
| German Russian | 57 | 2.1% |
| Hungarian | 27 | 1.0% |
| Irish | 231 | 8.4% |
| Italian | 120 | 4.4% |
| Lithuanian | 52 | 1.9% |
| Polish | 11 | 0.4% |
| Scottish | 123 | 4.5% |
| Subsaharan African | 10 | 0.4% |
| Ukrainian | 11 | 0.4% |
| Welsh | 42 | 1.5% | View All 19 Rows |
Immigrants in Fayetteville
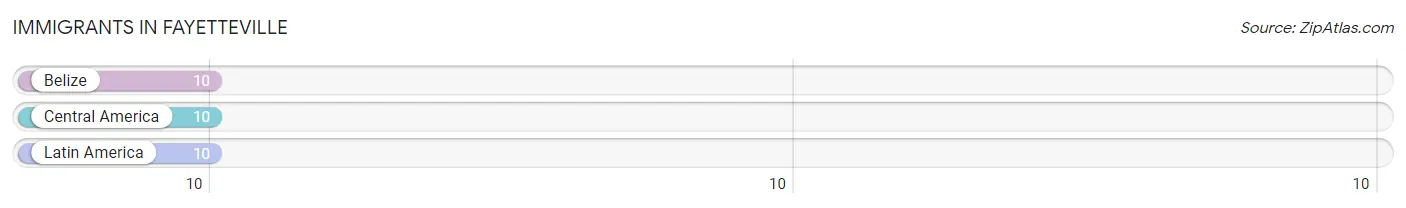
The most numerous immigrant groups reported in Fayetteville came from Belize (10 | 0.4%), Central America (10 | 0.4%), and Latin America (10 | 0.4%), together accounting for 1.1% of all Fayetteville residents.
| Immigration Origin | # Population | % Population |
| Belize | 10 | 0.4% |
| Central America | 10 | 0.4% |
| Latin America | 10 | 0.4% | View All 3 Rows |
Sex and Age in Fayetteville
Sex and Age in Fayetteville
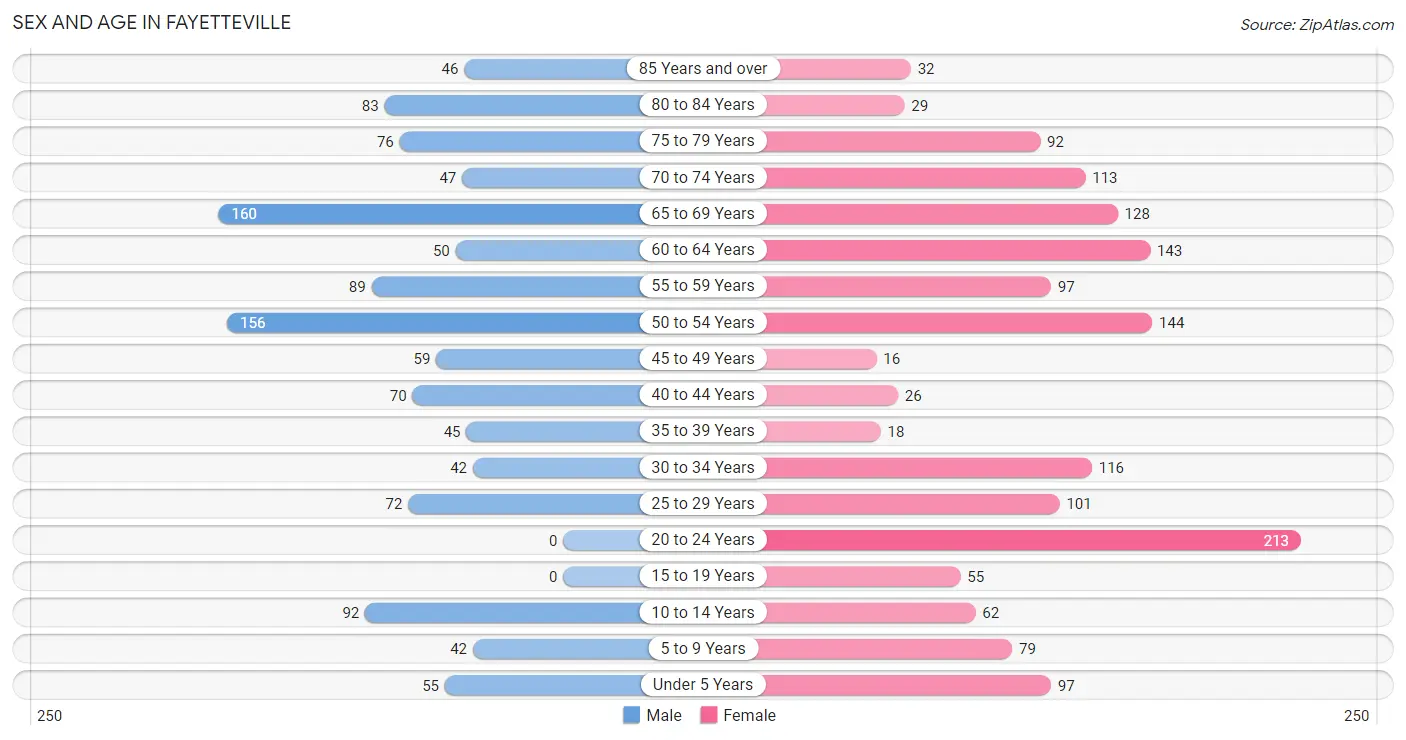
The most populous age groups in Fayetteville are 65 to 69 Years (160 | 13.5%) for men and 20 to 24 Years (213 | 13.7%) for women.
| Age Bracket | Male | Female |
| Under 5 Years | 55 (4.6%) | 97 (6.2%) |
| 5 to 9 Years | 42 (3.5%) | 79 (5.1%) |
| 10 to 14 Years | 92 (7.8%) | 62 (4.0%) |
| 15 to 19 Years | 0 (0.0%) | 55 (3.5%) |
| 20 to 24 Years | 0 (0.0%) | 213 (13.7%) |
| 25 to 29 Years | 72 (6.1%) | 101 (6.5%) |
| 30 to 34 Years | 42 (3.5%) | 116 (7.4%) |
| 35 to 39 Years | 45 (3.8%) | 18 (1.1%) |
| 40 to 44 Years | 70 (5.9%) | 26 (1.7%) |
| 45 to 49 Years | 59 (5.0%) | 16 (1.0%) |
| 50 to 54 Years | 156 (13.2%) | 144 (9.2%) |
| 55 to 59 Years | 89 (7.5%) | 97 (6.2%) |
| 60 to 64 Years | 50 (4.2%) | 143 (9.2%) |
| 65 to 69 Years | 160 (13.5%) | 128 (8.2%) |
| 70 to 74 Years | 47 (4.0%) | 113 (7.2%) |
| 75 to 79 Years | 76 (6.4%) | 92 (5.9%) |
| 80 to 84 Years | 83 (7.0%) | 29 (1.9%) |
| 85 Years and over | 46 (3.9%) | 32 (2.1%) |
| Total | 1,184 (100.0%) | 1,561 (100.0%) |
Families and Households in Fayetteville
Median Family Size in Fayetteville
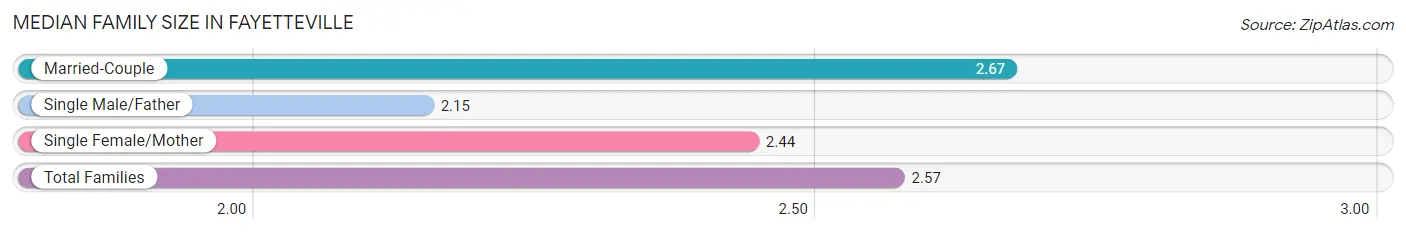
The median family size in Fayetteville is 2.57 persons per family, with married-couple families (562 | 71.1%) accounting for the largest median family size of 2.67 persons per family. On the other hand, single male/father families (97 | 12.3%) represent the smallest median family size with 2.15 persons per family.
| Family Type | # Families | Family Size |
| Married-Couple | 562 (71.1%) | 2.67 |
| Single Male/Father | 97 (12.3%) | 2.15 |
| Single Female/Mother | 131 (16.6%) | 2.44 |
| Total Families | 790 (100.0%) | 2.57 |
Median Household Size in Fayetteville
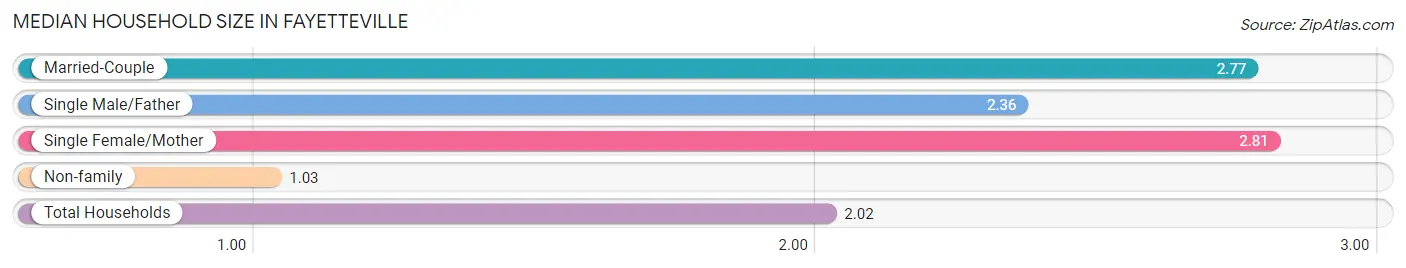
The median household size in Fayetteville is 2.02 persons per household, with single female/mother households (131 | 9.7%) accounting for the largest median household size of 2.81 persons per household. non-family households (563 | 41.6%) represent the smallest median household size with 1.03 persons per household.
| Household Type | # Households | Household Size |
| Married-Couple | 562 (41.5%) | 2.77 |
| Single Male/Father | 97 (7.2%) | 2.36 |
| Single Female/Mother | 131 (9.7%) | 2.81 |
| Non-family | 563 (41.6%) | 1.03 |
| Total Households | 1,353 (100.0%) | 2.02 |
Household Size by Marriage Status in Fayetteville
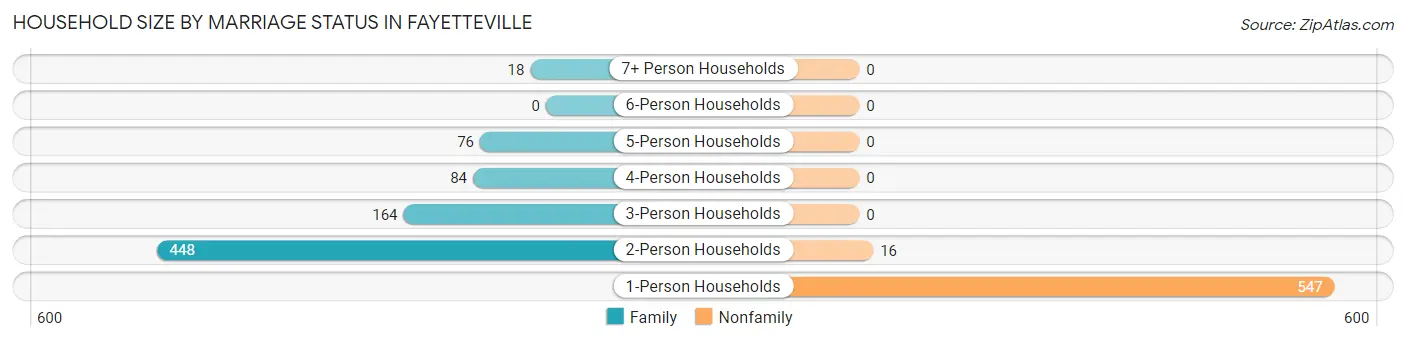
Out of a total of 1,353 households in Fayetteville, 790 (58.4%) are family households, while 563 (41.6%) are nonfamily households. The most numerous type of family households are 2-person households, comprising 448, and the most common type of nonfamily households are 1-person households, comprising 547.
| Household Size | Family Households | Nonfamily Households |
| 1-Person Households | - | 547 (40.4%) |
| 2-Person Households | 448 (33.1%) | 16 (1.2%) |
| 3-Person Households | 164 (12.1%) | 0 (0.0%) |
| 4-Person Households | 84 (6.2%) | 0 (0.0%) |
| 5-Person Households | 76 (5.6%) | 0 (0.0%) |
| 6-Person Households | 0 (0.0%) | 0 (0.0%) |
| 7+ Person Households | 18 (1.3%) | 0 (0.0%) |
| Total | 790 (58.4%) | 563 (41.6%) |
Female Fertility in Fayetteville
Fertility by Age in Fayetteville
| Age Bracket | Women with Births | Births / 1,000 Women |
| 15 to 19 years | 0 (0.0%) | 0.0 |
| 20 to 34 years | 0 (0.0%) | 0.0 |
| 35 to 50 years | 0 (0.0%) | 0.0 |
| Total | 0 (0.0%) | 0.0 |
Fertility by Age by Marriage Status in Fayetteville
| Age Bracket | Married | Unmarried |
| 15 to 19 years | 0 (0.0%) | 0 (0.0%) |
| 20 to 34 years | 0 (0.0%) | 0 (0.0%) |
| 35 to 50 years | 0 (0.0%) | 0 (0.0%) |
| Total | 0 (0.0%) | 0 (0.0%) |
Fertility by Education in Fayetteville
| Educational Attainment | Women with Births | Births / 1,000 Women |
| Less than High School | 0 (0.0%) | 0.0 |
| High School Diploma | 0 (0.0%) | 0.0 |
| College or Associate's Degree | 0 (0.0%) | 0.0 |
| Bachelor's Degree | 0 (0.0%) | 0.0 |
| Graduate Degree | 0 (0.0%) | 0.0 |
| Total | 0 (0.0%) | 0.0 |
Fertility by Education by Marriage Status in Fayetteville
| Educational Attainment | Married | Unmarried |
| Less than High School | 0 (0.0%) | 0 (0.0%) |
| High School Diploma | 0 (0.0%) | 0 (0.0%) |
| College or Associate's Degree | 0 (0.0%) | 0 (0.0%) |
| Bachelor's Degree | 0 (0.0%) | 0 (0.0%) |
| Graduate Degree | 0 (0.0%) | 0 (0.0%) |
| Total | 0 (0.0%) | 0 (0.0%) |
Employment Characteristics in Fayetteville
Employment by Class of Employer in Fayetteville
Among the 1,161 employed individuals in Fayetteville, private company employees (877 | 75.5%), local government employees (122 | 10.5%), and self-employed (not incorporated) (61 | 5.2%) make up the most common classes of employment.
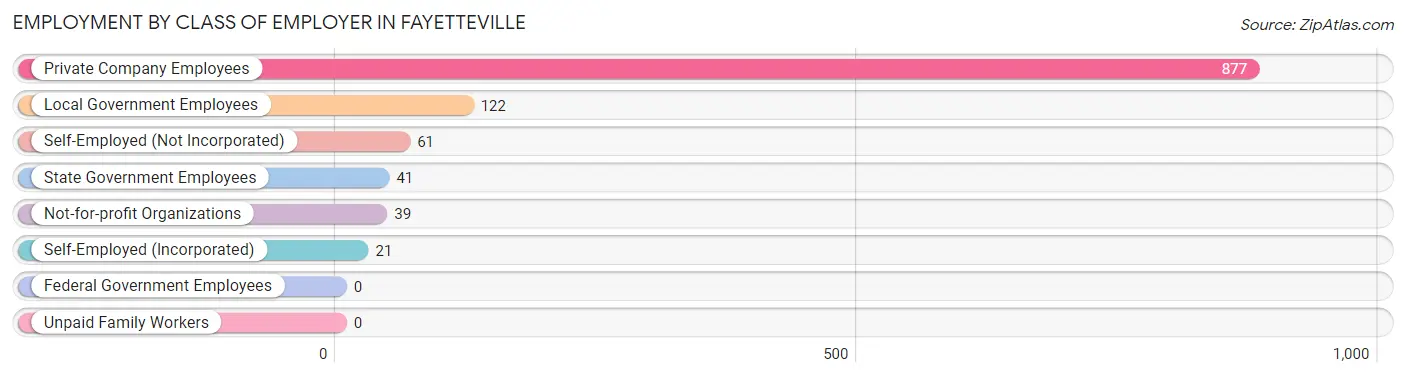
| Employer Class | # Employees | % Employees |
| Private Company Employees | 877 | 75.5% |
| Self-Employed (Incorporated) | 21 | 1.8% |
| Self-Employed (Not Incorporated) | 61 | 5.2% |
| Not-for-profit Organizations | 39 | 3.4% |
| Local Government Employees | 122 | 10.5% |
| State Government Employees | 41 | 3.5% |
| Federal Government Employees | 0 | 0.0% |
| Unpaid Family Workers | 0 | 0.0% |
| Total | 1,161 | 100.0% |
Employment Status by Age in Fayetteville
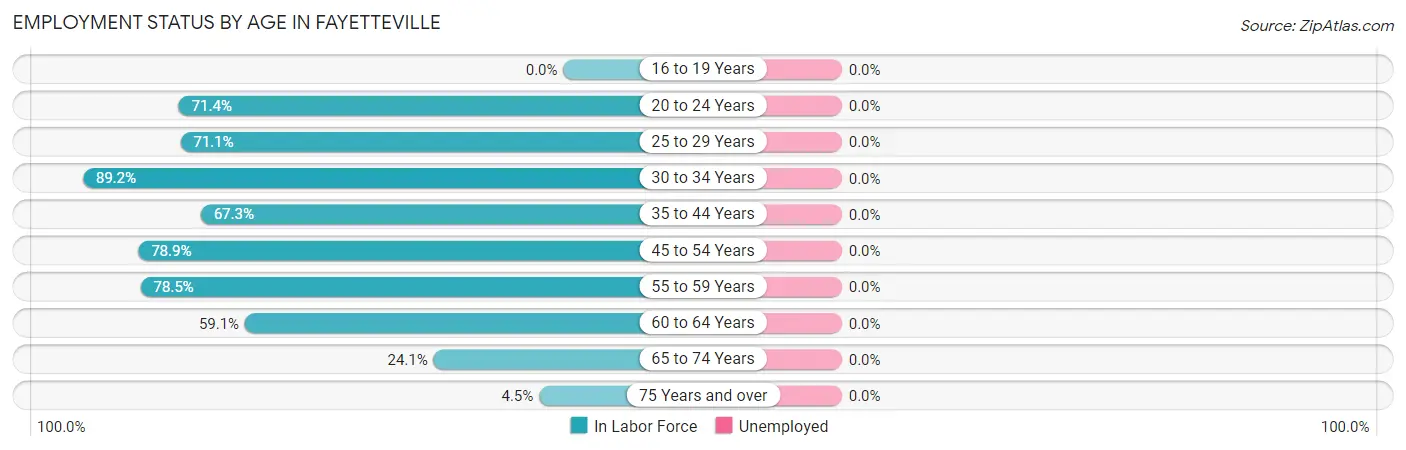
| Age Bracket | In Labor Force | Unemployed |
| 16 to 19 Years | 0 (0.0%) | 0 (0.0%) |
| 20 to 24 Years | 152 (71.4%) | 0 (0.0%) |
| 25 to 29 Years | 123 (71.1%) | 0 (0.0%) |
| 30 to 34 Years | 141 (89.2%) | 0 (0.0%) |
| 35 to 44 Years | 107 (67.3%) | 0 (0.0%) |
| 45 to 54 Years | 296 (78.9%) | 0 (0.0%) |
| 55 to 59 Years | 146 (78.5%) | 0 (0.0%) |
| 60 to 64 Years | 114 (59.1%) | 0 (0.0%) |
| 65 to 74 Years | 108 (24.1%) | 0 (0.0%) |
| 75 Years and over | 16 (4.5%) | 0 (0.0%) |
| Total | 1,203 (52.7%) | 0 (0.0%) |
Employment Status by Educational Attainment in Fayetteville
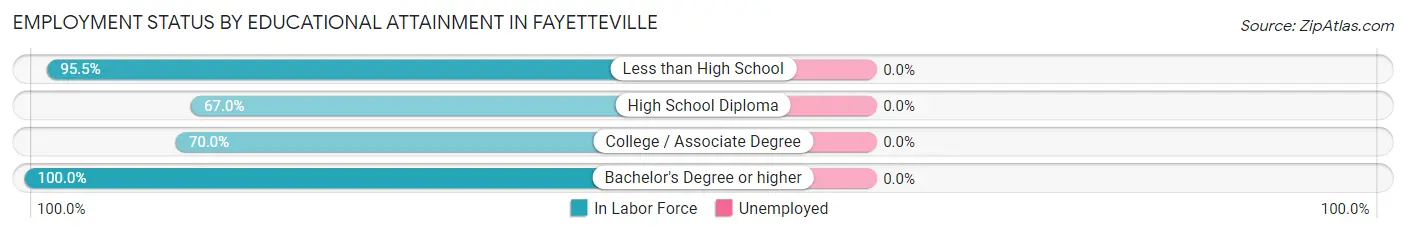
| Educational Attainment | In Labor Force | Unemployed |
| Less than High School | 127 (95.5%) | 0 (0.0%) |
| High School Diploma | 392 (67.0%) | 0 (0.0%) |
| College / Associate Degree | 275 (70.0%) | 0 (0.0%) |
| Bachelor's Degree or higher | 133 (100.0%) | 0 (0.0%) |
| Total | 927 (74.5%) | 0 (0.0%) |
Employment Occupations by Sex in Fayetteville
Management, Business, Science and Arts Occupations
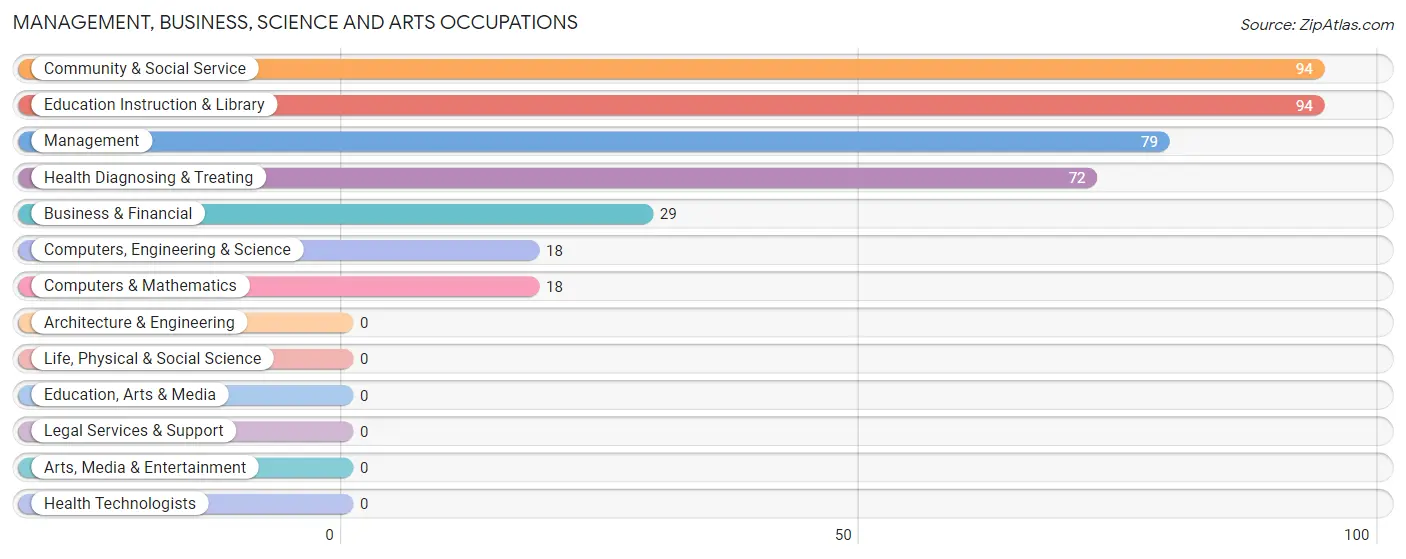
The most common Management, Business, Science and Arts occupations in Fayetteville are Community & Social Service (94 | 7.8%), Education Instruction & Library (94 | 7.8%), Management (79 | 6.6%), Health Diagnosing & Treating (72 | 6.0%), and Business & Financial (29 | 2.4%).
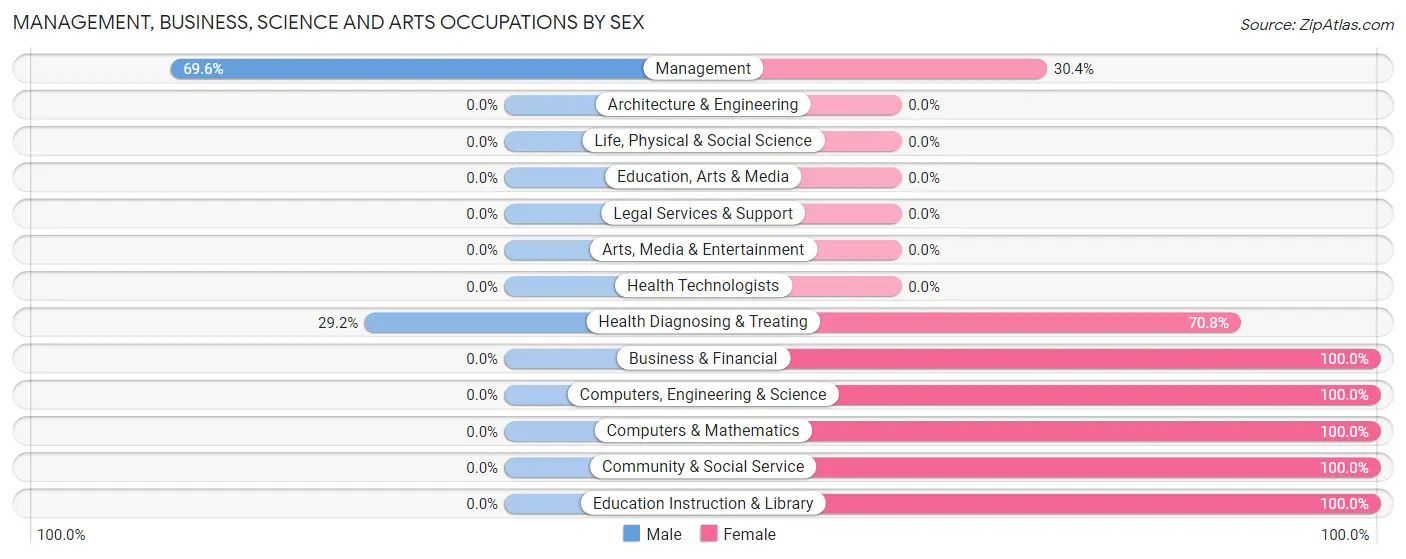
Management, Business, Science and Arts Occupations by Sex
Within the Management, Business, Science and Arts occupations in Fayetteville, the most male-oriented occupations are Management (69.6%), and Health Diagnosing & Treating (29.2%), while the most female-oriented occupations are Business & Financial (100.0%), Computers, Engineering & Science (100.0%), and Computers & Mathematics (100.0%).
| Occupation | Male | Female |
| Management | 55 (69.6%) | 24 (30.4%) |
| Business & Financial | 0 (0.0%) | 29 (100.0%) |
| Computers, Engineering & Science | 0 (0.0%) | 18 (100.0%) |
| Computers & Mathematics | 0 (0.0%) | 18 (100.0%) |
| Architecture & Engineering | 0 (0.0%) | 0 (0.0%) |
| Life, Physical & Social Science | 0 (0.0%) | 0 (0.0%) |
| Community & Social Service | 0 (0.0%) | 94 (100.0%) |
| Education, Arts & Media | 0 (0.0%) | 0 (0.0%) |
| Legal Services & Support | 0 (0.0%) | 0 (0.0%) |
| Education Instruction & Library | 0 (0.0%) | 94 (100.0%) |
| Arts, Media & Entertainment | 0 (0.0%) | 0 (0.0%) |
| Health Diagnosing & Treating | 21 (29.2%) | 51 (70.8%) |
| Health Technologists | 0 (0.0%) | 0 (0.0%) |
| Total (Category) | 76 (26.0%) | 216 (74.0%) |
| Total (Overall) | 616 (51.2%) | 587 (48.8%) |
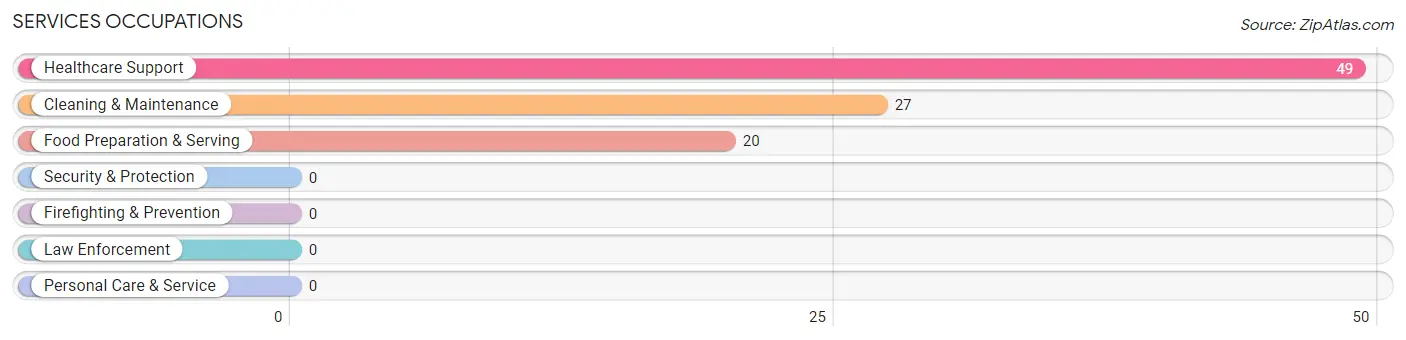
Services Occupations
The most common Services occupations in Fayetteville are Healthcare Support (49 | 4.1%), Cleaning & Maintenance (27 | 2.2%), and Food Preparation & Serving (20 | 1.7%).
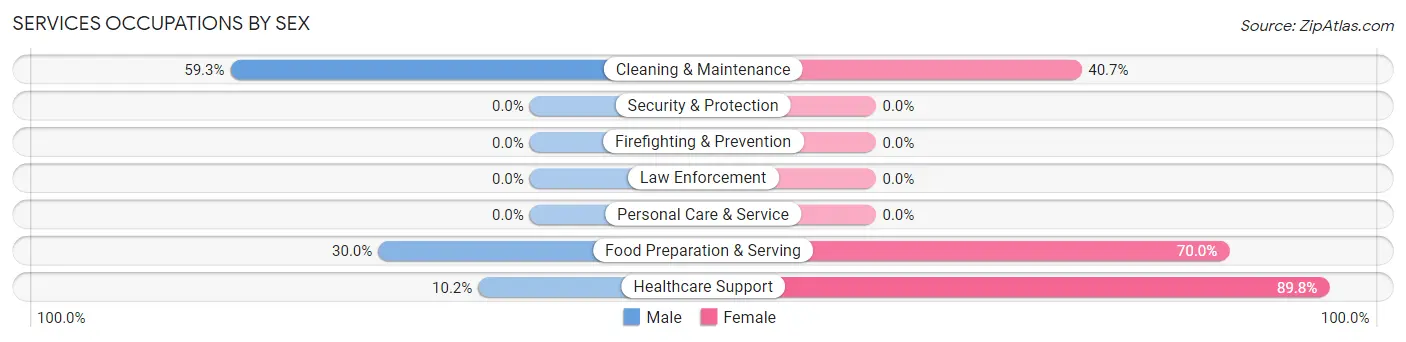
Services Occupations by Sex
Within the Services occupations in Fayetteville, the most male-oriented occupations are Cleaning & Maintenance (59.3%), Food Preparation & Serving (30.0%), and Healthcare Support (10.2%), while the most female-oriented occupations are Healthcare Support (89.8%), Food Preparation & Serving (70.0%), and Cleaning & Maintenance (40.7%).
| Occupation | Male | Female |
| Healthcare Support | 5 (10.2%) | 44 (89.8%) |
| Security & Protection | 0 (0.0%) | 0 (0.0%) |
| Firefighting & Prevention | 0 (0.0%) | 0 (0.0%) |
| Law Enforcement | 0 (0.0%) | 0 (0.0%) |
| Food Preparation & Serving | 6 (30.0%) | 14 (70.0%) |
| Cleaning & Maintenance | 16 (59.3%) | 11 (40.7%) |
| Personal Care & Service | 0 (0.0%) | 0 (0.0%) |
| Total (Category) | 27 (28.1%) | 69 (71.9%) |
| Total (Overall) | 616 (51.2%) | 587 (48.8%) |
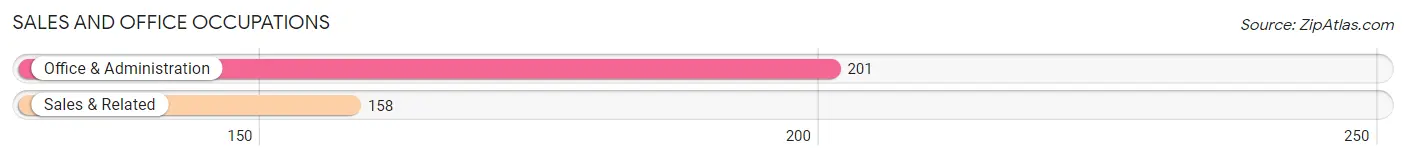
Sales and Office Occupations
The most common Sales and Office occupations in Fayetteville are Office & Administration (201 | 16.7%), and Sales & Related (158 | 13.1%).
Sales and Office Occupations by Sex
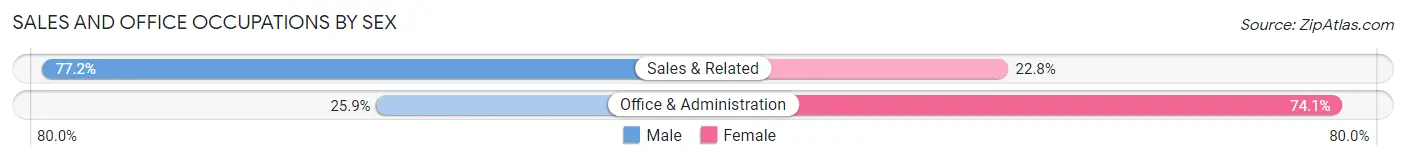
| Occupation | Male | Female |
| Sales & Related | 122 (77.2%) | 36 (22.8%) |
| Office & Administration | 52 (25.9%) | 149 (74.1%) |
| Total (Category) | 174 (48.5%) | 185 (51.5%) |
| Total (Overall) | 616 (51.2%) | 587 (48.8%) |
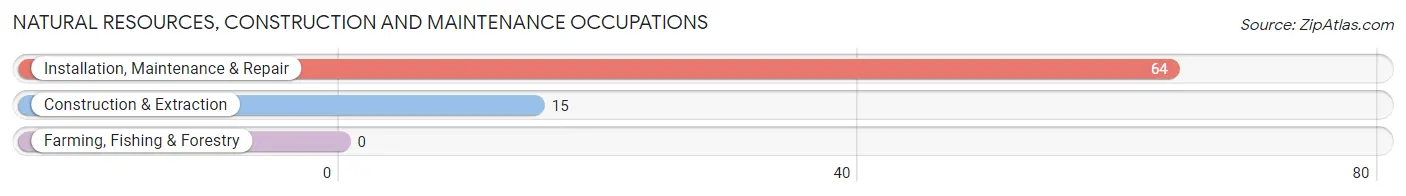
Natural Resources, Construction and Maintenance Occupations
The most common Natural Resources, Construction and Maintenance occupations in Fayetteville are Installation, Maintenance & Repair (64 | 5.3%), and Construction & Extraction (15 | 1.3%).
Natural Resources, Construction and Maintenance Occupations by Sex
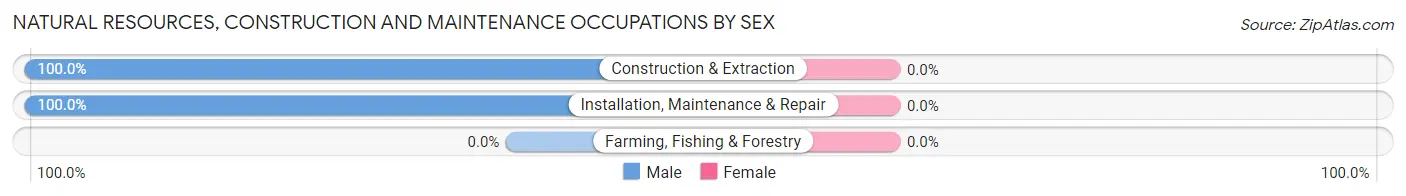
| Occupation | Male | Female |
| Farming, Fishing & Forestry | 0 (0.0%) | 0 (0.0%) |
| Construction & Extraction | 15 (100.0%) | 0 (0.0%) |
| Installation, Maintenance & Repair | 64 (100.0%) | 0 (0.0%) |
| Total (Category) | 79 (100.0%) | 0 (0.0%) |
| Total (Overall) | 616 (51.2%) | 587 (48.8%) |
Production, Transportation and Moving Occupations
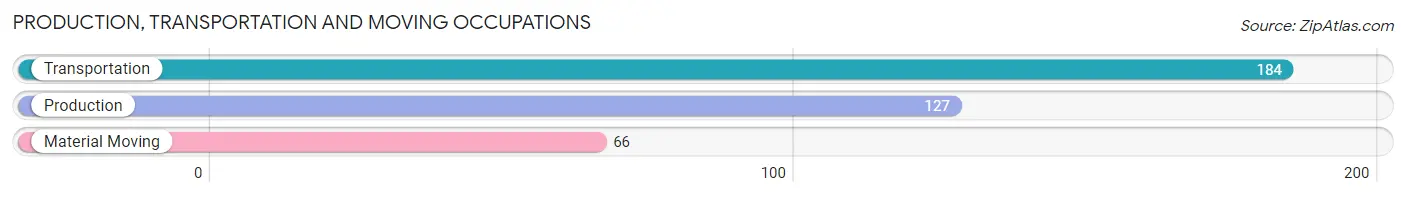
The most common Production, Transportation and Moving occupations in Fayetteville are Transportation (184 | 15.3%), Production (127 | 10.6%), and Material Moving (66 | 5.5%).
Production, Transportation and Moving Occupations by Sex
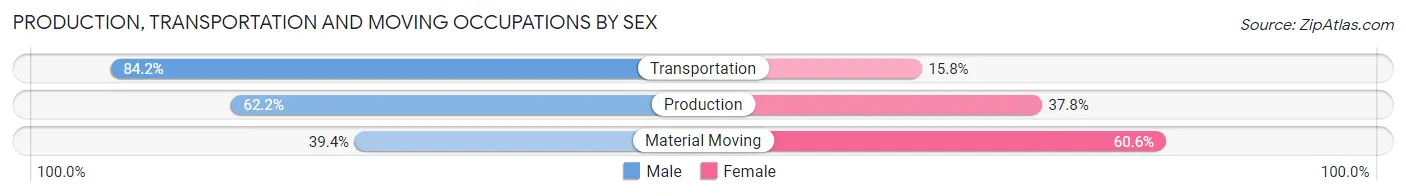
| Occupation | Male | Female |
| Production | 79 (62.2%) | 48 (37.8%) |
| Transportation | 155 (84.2%) | 29 (15.8%) |
| Material Moving | 26 (39.4%) | 40 (60.6%) |
| Total (Category) | 260 (69.0%) | 117 (31.0%) |
| Total (Overall) | 616 (51.2%) | 587 (48.8%) |
Employment Industries by Sex in Fayetteville
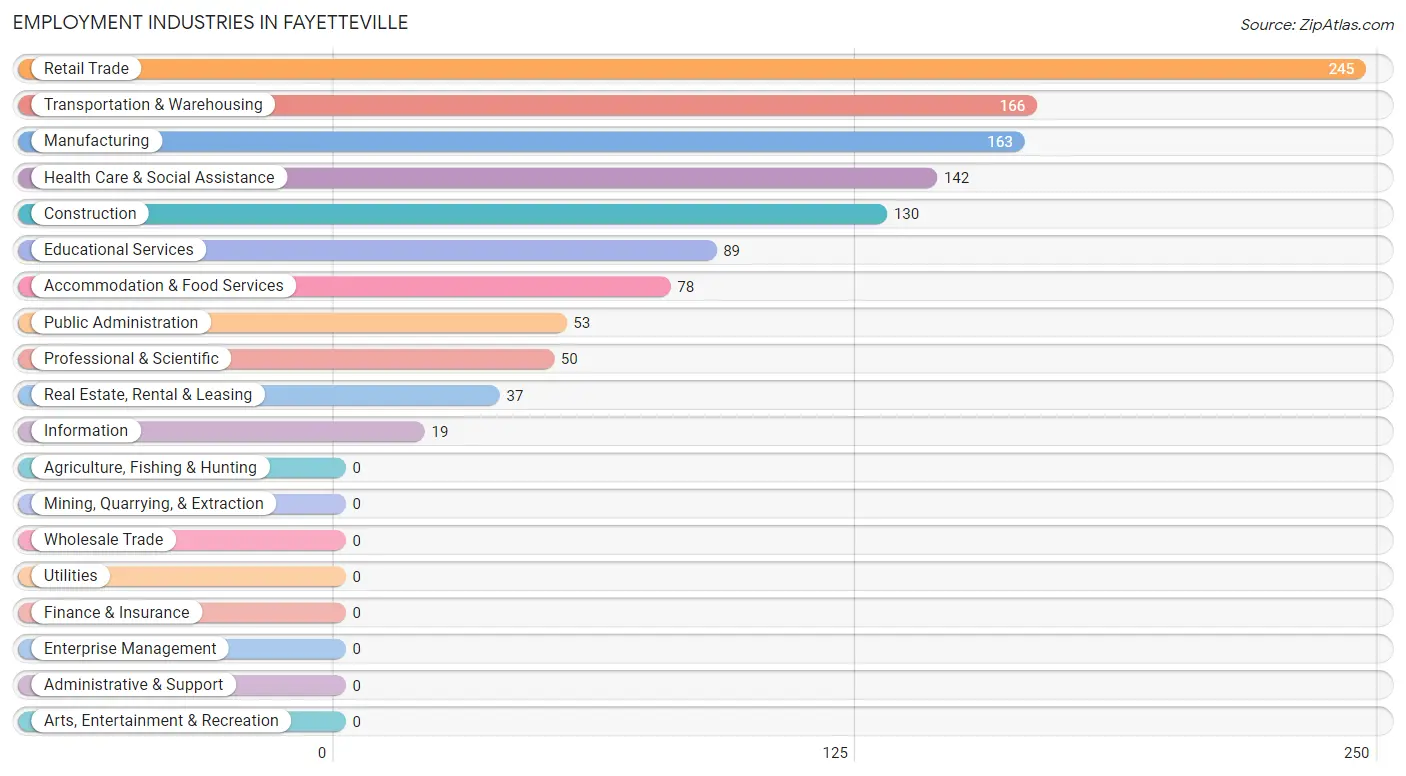
Employment Industries in Fayetteville
The major employment industries in Fayetteville include Retail Trade (245 | 20.4%), Transportation & Warehousing (166 | 13.8%), Manufacturing (163 | 13.6%), Health Care & Social Assistance (142 | 11.8%), and Construction (130 | 10.8%).
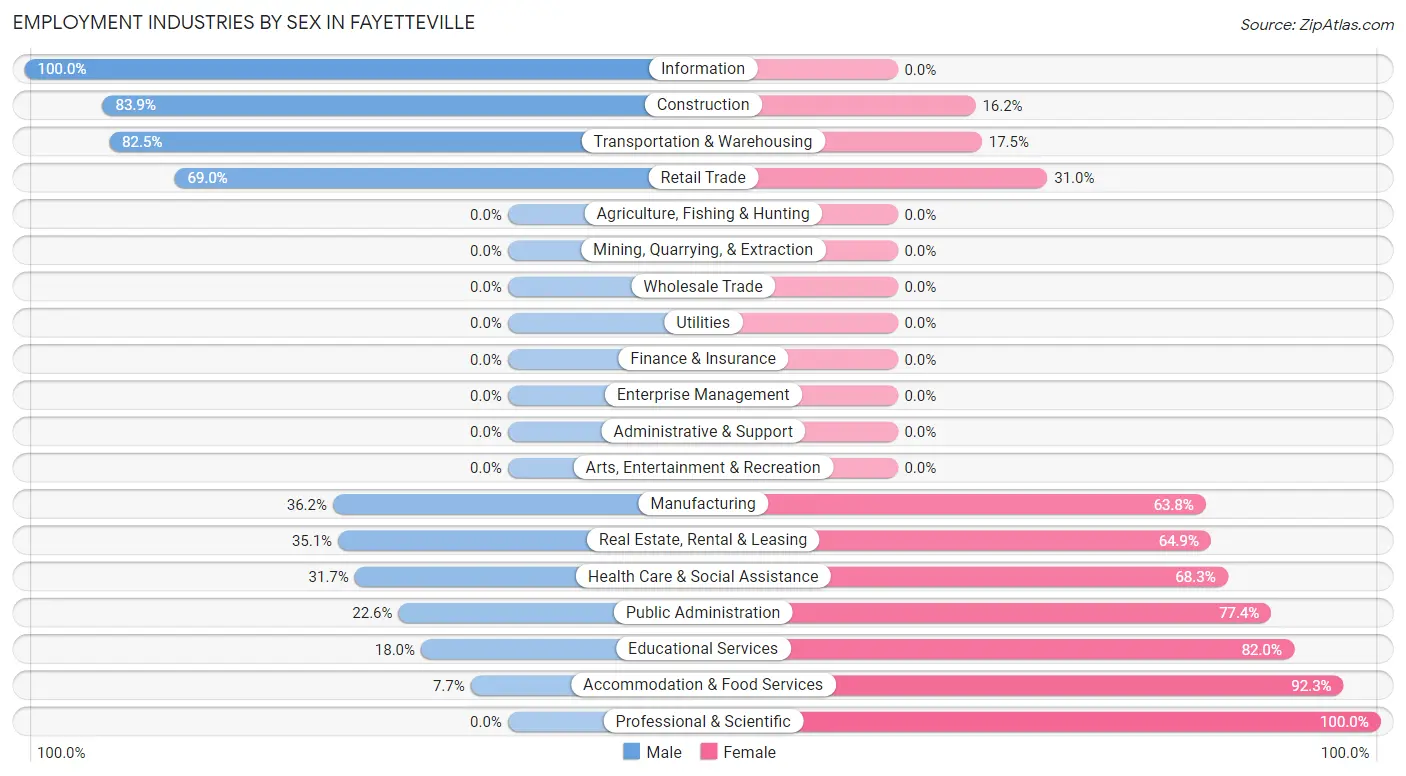
Employment Industries by Sex in Fayetteville
The Fayetteville industries that see more men than women are Information (100.0%), Construction (83.9%), and Transportation & Warehousing (82.5%), whereas the industries that tend to have a higher number of women are Professional & Scientific (100.0%), Accommodation & Food Services (92.3%), and Educational Services (82.0%).
| Industry | Male | Female |
| Agriculture, Fishing & Hunting | 0 (0.0%) | 0 (0.0%) |
| Mining, Quarrying, & Extraction | 0 (0.0%) | 0 (0.0%) |
| Construction | 109 (83.9%) | 21 (16.2%) |
| Manufacturing | 59 (36.2%) | 104 (63.8%) |
| Wholesale Trade | 0 (0.0%) | 0 (0.0%) |
| Retail Trade | 169 (69.0%) | 76 (31.0%) |
| Transportation & Warehousing | 137 (82.5%) | 29 (17.5%) |
| Utilities | 0 (0.0%) | 0 (0.0%) |
| Information | 19 (100.0%) | 0 (0.0%) |
| Finance & Insurance | 0 (0.0%) | 0 (0.0%) |
| Real Estate, Rental & Leasing | 13 (35.1%) | 24 (64.9%) |
| Professional & Scientific | 0 (0.0%) | 50 (100.0%) |
| Enterprise Management | 0 (0.0%) | 0 (0.0%) |
| Administrative & Support | 0 (0.0%) | 0 (0.0%) |
| Educational Services | 16 (18.0%) | 73 (82.0%) |
| Health Care & Social Assistance | 45 (31.7%) | 97 (68.3%) |
| Arts, Entertainment & Recreation | 0 (0.0%) | 0 (0.0%) |
| Accommodation & Food Services | 6 (7.7%) | 72 (92.3%) |
| Public Administration | 12 (22.6%) | 41 (77.4%) |
| Total | 616 (51.2%) | 587 (48.8%) |
Education in Fayetteville
School Enrollment in Fayetteville
The most common levels of schooling among the 469 students in Fayetteville are college / undergraduate (152 | 32.4%), middle school (109 | 23.2%), and elementary school (85 | 18.1%).
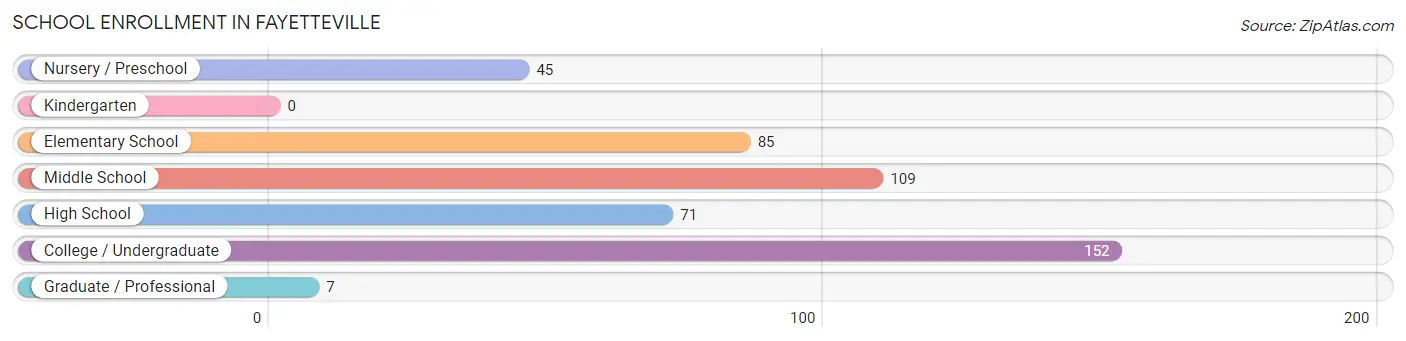
| School Level | # Students | % Students |
| Nursery / Preschool | 45 | 9.6% |
| Kindergarten | 0 | 0.0% |
| Elementary School | 85 | 18.1% |
| Middle School | 109 | 23.2% |
| High School | 71 | 15.1% |
| College / Undergraduate | 152 | 32.4% |
| Graduate / Professional | 7 | 1.5% |
| Total | 469 | 100.0% |
School Enrollment by Age by Funding Source in Fayetteville
Out of a total of 469 students who are enrolled in schools in Fayetteville, 41 (8.7%) attend a private institution, while the remaining 428 (91.3%) are enrolled in public schools. The age group of 20 to 24 year olds has the highest likelihood of being enrolled in private schools, with 41 (27.0% in the age bracket) enrolled. Conversely, the age group of 3 to 4 year olds has the lowest likelihood of being enrolled in a private school, with 20 (100.0% in the age bracket) attending a public institution.
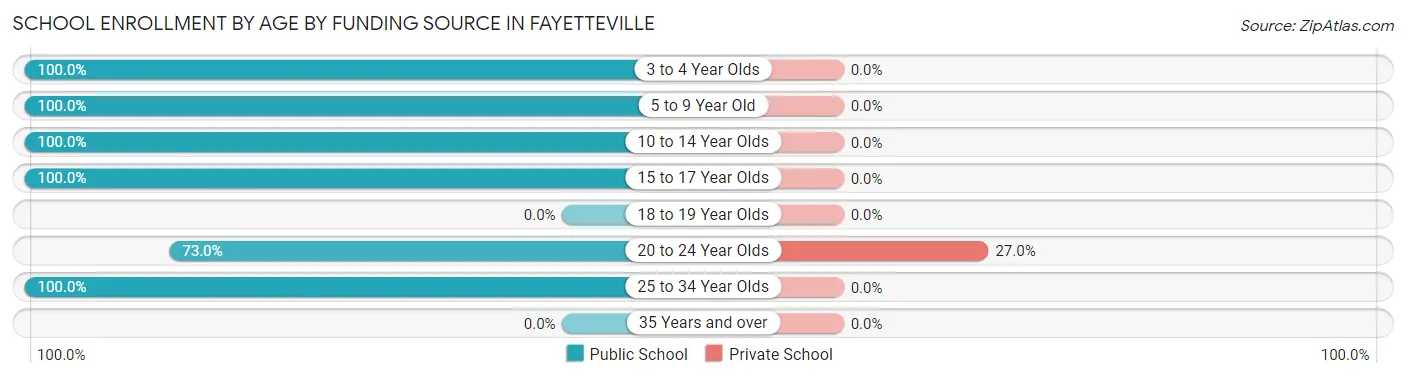
| Age Bracket | Public School | Private School |
| 3 to 4 Year Olds | 20 (100.0%) | 0 (0.0%) |
| 5 to 9 Year Old | 110 (100.0%) | 0 (0.0%) |
| 10 to 14 Year Olds | 125 (100.0%) | 0 (0.0%) |
| 15 to 17 Year Olds | 55 (100.0%) | 0 (0.0%) |
| 18 to 19 Year Olds | 0 (0.0%) | 0 (0.0%) |
| 20 to 24 Year Olds | 111 (73.0%) | 41 (27.0%) |
| 25 to 34 Year Olds | 7 (100.0%) | 0 (0.0%) |
| 35 Years and over | 0 (0.0%) | 0 (0.0%) |
| Total | 428 (91.3%) | 41 (8.7%) |
Educational Attainment by Field of Study in Fayetteville
Liberal arts & history (41 | 19.5%), business (35 | 16.7%), arts & humanities (35 | 16.7%), computers & mathematics (25 | 11.9%), and bio, nature & agricultural (20 | 9.5%) are the most common fields of study among 210 individuals in Fayetteville who have obtained a bachelor's degree or higher.
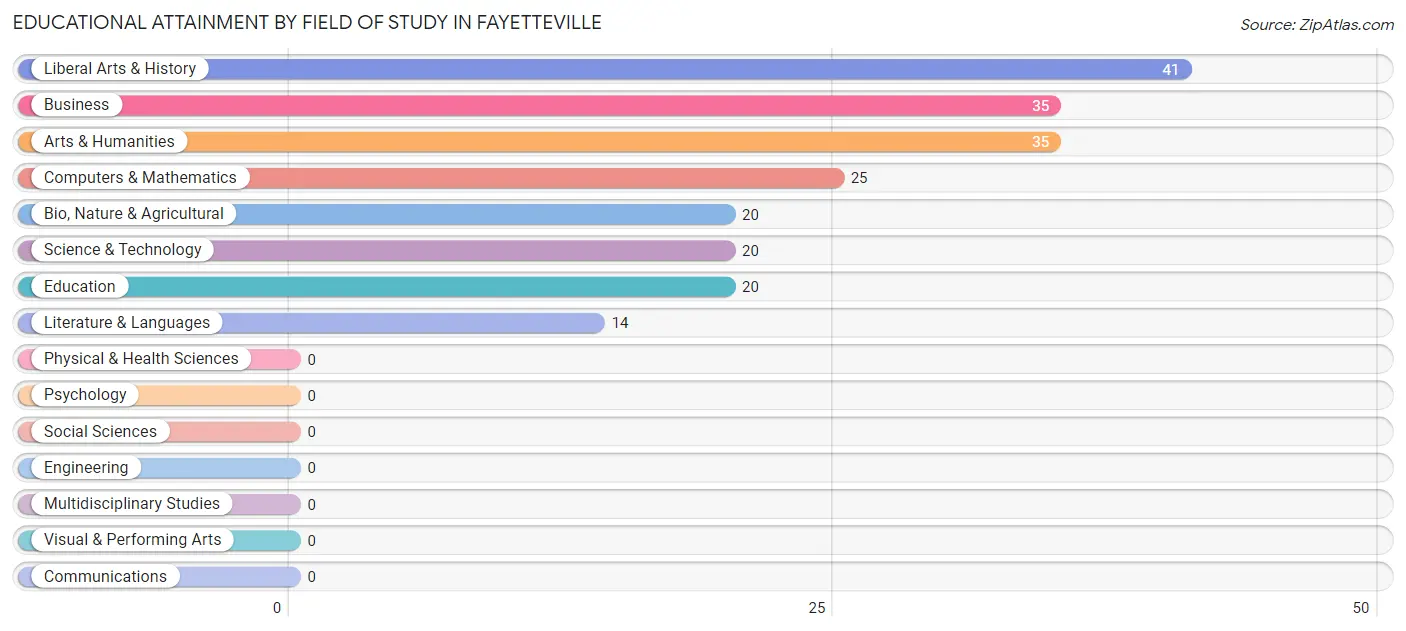
| Field of Study | # Graduates | % Graduates |
| Computers & Mathematics | 25 | 11.9% |
| Bio, Nature & Agricultural | 20 | 9.5% |
| Physical & Health Sciences | 0 | 0.0% |
| Psychology | 0 | 0.0% |
| Social Sciences | 0 | 0.0% |
| Engineering | 0 | 0.0% |
| Multidisciplinary Studies | 0 | 0.0% |
| Science & Technology | 20 | 9.5% |
| Business | 35 | 16.7% |
| Education | 20 | 9.5% |
| Literature & Languages | 14 | 6.7% |
| Liberal Arts & History | 41 | 19.5% |
| Visual & Performing Arts | 0 | 0.0% |
| Communications | 0 | 0.0% |
| Arts & Humanities | 35 | 16.7% |
| Total | 210 | 100.0% |
Transportation & Commute in Fayetteville
Vehicle Availability by Sex in Fayetteville
The most prevalent vehicle ownership categories in Fayetteville are males with 2 vehicles (278, accounting for 48.4%) and females with 2 vehicles (162, making up 47.7%).
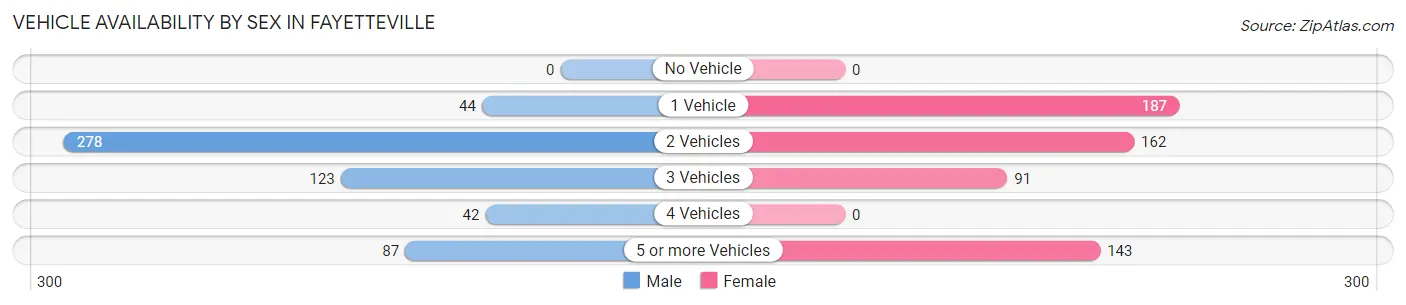
| Vehicles Available | Male | Female |
| No Vehicle | 0 (0.0%) | 0 (0.0%) |
| 1 Vehicle | 44 (7.7%) | 187 (32.1%) |
| 2 Vehicles | 278 (48.4%) | 162 (27.8%) |
| 3 Vehicles | 123 (21.4%) | 91 (15.6%) |
| 4 Vehicles | 42 (7.3%) | 0 (0.0%) |
| 5 or more Vehicles | 87 (15.2%) | 143 (24.5%) |
| Total | 574 (100.0%) | 583 (100.0%) |
Commute Time in Fayetteville
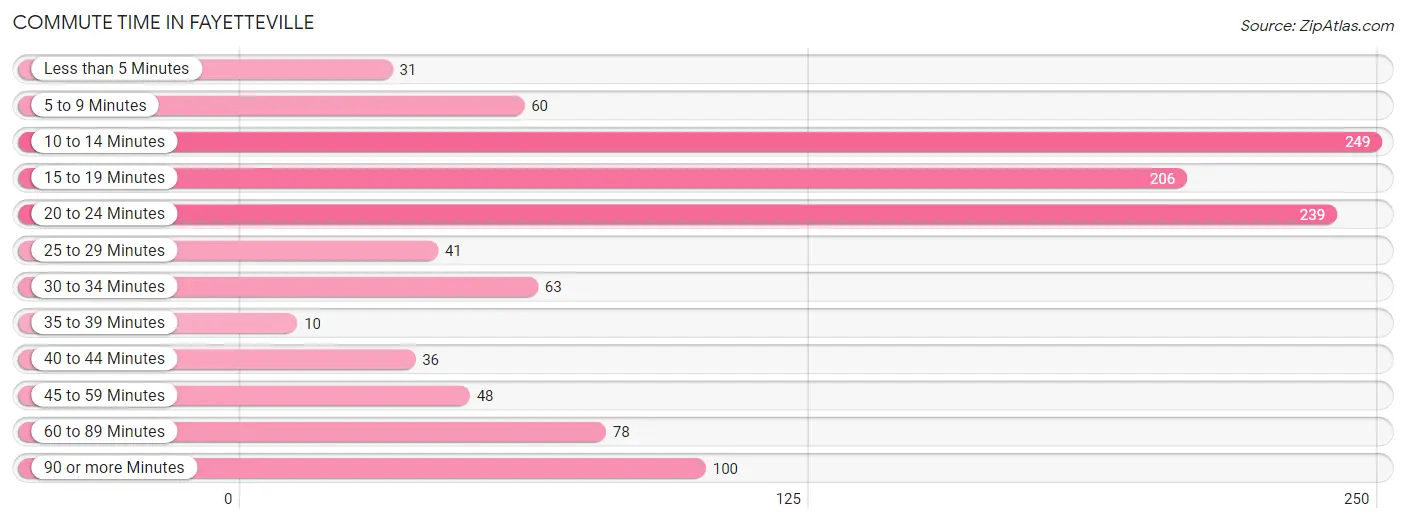
The most frequently occuring commute durations in Fayetteville are 10 to 14 minutes (249 commuters, 21.4%), 20 to 24 minutes (239 commuters, 20.6%), and 15 to 19 minutes (206 commuters, 17.7%).
| Commute Time | # Commuters | % Commuters |
| Less than 5 Minutes | 31 | 2.7% |
| 5 to 9 Minutes | 60 | 5.2% |
| 10 to 14 Minutes | 249 | 21.4% |
| 15 to 19 Minutes | 206 | 17.7% |
| 20 to 24 Minutes | 239 | 20.6% |
| 25 to 29 Minutes | 41 | 3.5% |
| 30 to 34 Minutes | 63 | 5.4% |
| 35 to 39 Minutes | 10 | 0.9% |
| 40 to 44 Minutes | 36 | 3.1% |
| 45 to 59 Minutes | 48 | 4.1% |
| 60 to 89 Minutes | 78 | 6.7% |
| 90 or more Minutes | 100 | 8.6% |
Commute Time by Sex in Fayetteville
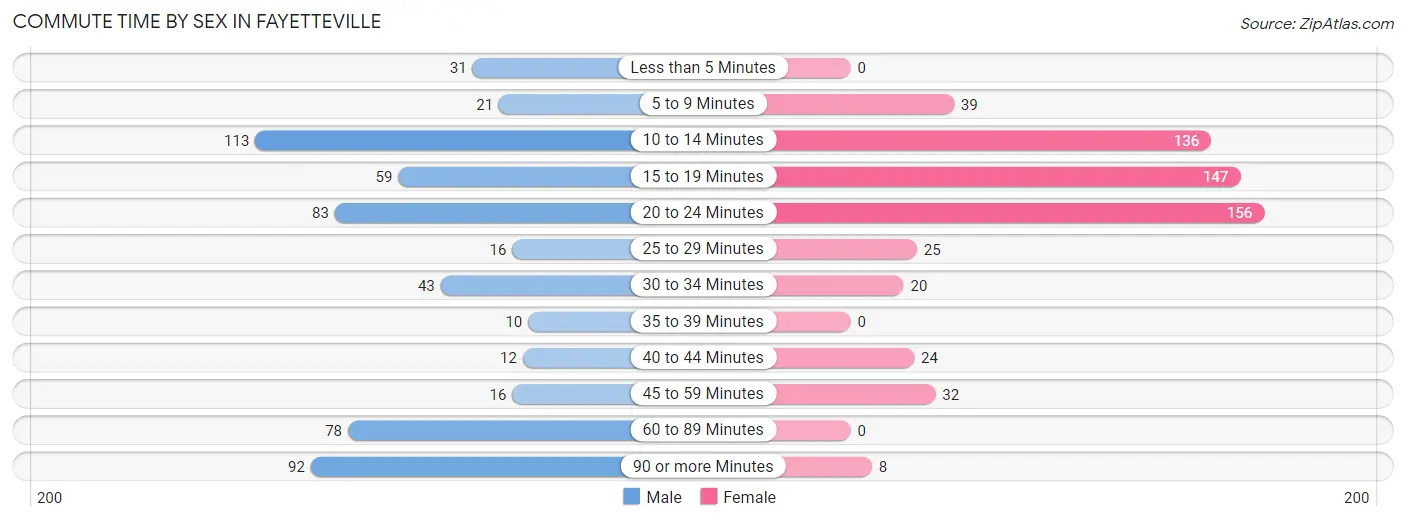
The most common commute times in Fayetteville are 10 to 14 minutes (113 commuters, 19.7%) for males and 20 to 24 minutes (156 commuters, 26.6%) for females.
| Commute Time | Male | Female |
| Less than 5 Minutes | 31 (5.4%) | 0 (0.0%) |
| 5 to 9 Minutes | 21 (3.7%) | 39 (6.6%) |
| 10 to 14 Minutes | 113 (19.7%) | 136 (23.2%) |
| 15 to 19 Minutes | 59 (10.3%) | 147 (25.0%) |
| 20 to 24 Minutes | 83 (14.5%) | 156 (26.6%) |
| 25 to 29 Minutes | 16 (2.8%) | 25 (4.3%) |
| 30 to 34 Minutes | 43 (7.5%) | 20 (3.4%) |
| 35 to 39 Minutes | 10 (1.7%) | 0 (0.0%) |
| 40 to 44 Minutes | 12 (2.1%) | 24 (4.1%) |
| 45 to 59 Minutes | 16 (2.8%) | 32 (5.4%) |
| 60 to 89 Minutes | 78 (13.6%) | 0 (0.0%) |
| 90 or more Minutes | 92 (16.0%) | 8 (1.4%) |
Time of Departure to Work by Sex in Fayetteville
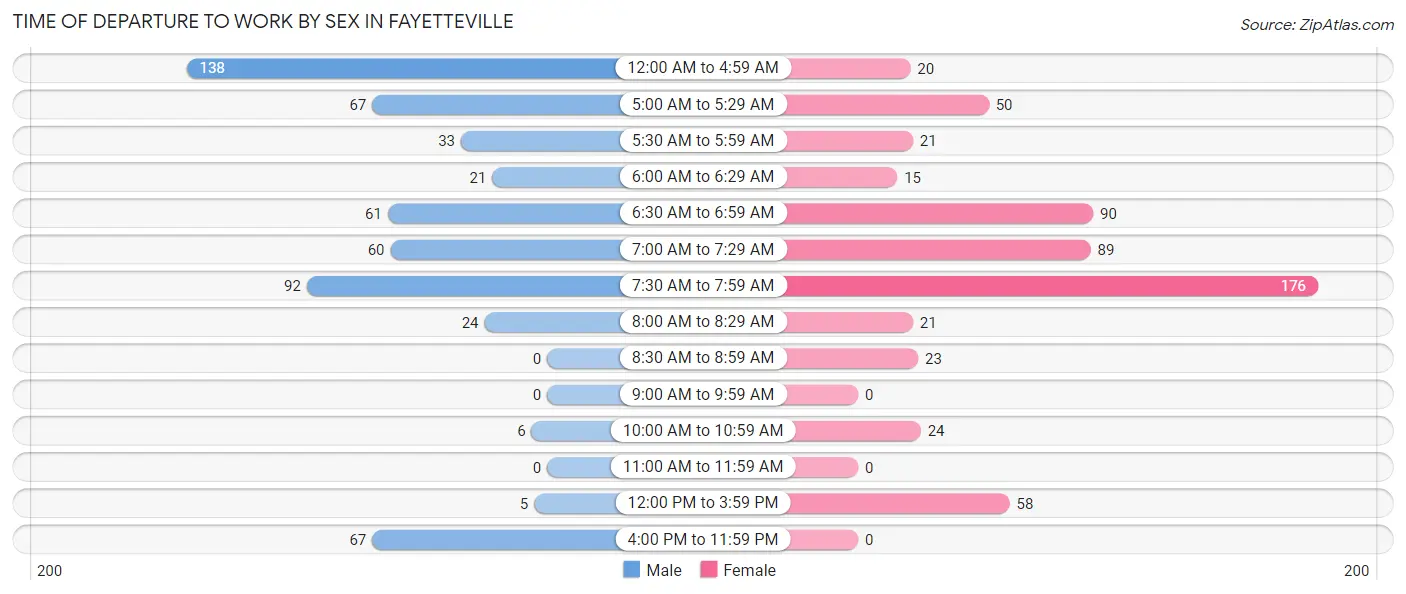
The most frequent times of departure to work in Fayetteville are 12:00 AM to 4:59 AM (138, 24.0%) for males and 7:30 AM to 7:59 AM (176, 30.0%) for females.
| Time of Departure | Male | Female |
| 12:00 AM to 4:59 AM | 138 (24.0%) | 20 (3.4%) |
| 5:00 AM to 5:29 AM | 67 (11.7%) | 50 (8.5%) |
| 5:30 AM to 5:59 AM | 33 (5.8%) | 21 (3.6%) |
| 6:00 AM to 6:29 AM | 21 (3.7%) | 15 (2.6%) |
| 6:30 AM to 6:59 AM | 61 (10.6%) | 90 (15.3%) |
| 7:00 AM to 7:29 AM | 60 (10.4%) | 89 (15.2%) |
| 7:30 AM to 7:59 AM | 92 (16.0%) | 176 (30.0%) |
| 8:00 AM to 8:29 AM | 24 (4.2%) | 21 (3.6%) |
| 8:30 AM to 8:59 AM | 0 (0.0%) | 23 (3.9%) |
| 9:00 AM to 9:59 AM | 0 (0.0%) | 0 (0.0%) |
| 10:00 AM to 10:59 AM | 6 (1.1%) | 24 (4.1%) |
| 11:00 AM to 11:59 AM | 0 (0.0%) | 0 (0.0%) |
| 12:00 PM to 3:59 PM | 5 (0.9%) | 58 (9.9%) |
| 4:00 PM to 11:59 PM | 67 (11.7%) | 0 (0.0%) |
| Total | 574 (100.0%) | 587 (100.0%) |
Housing Occupancy in Fayetteville
Occupancy by Ownership in Fayetteville
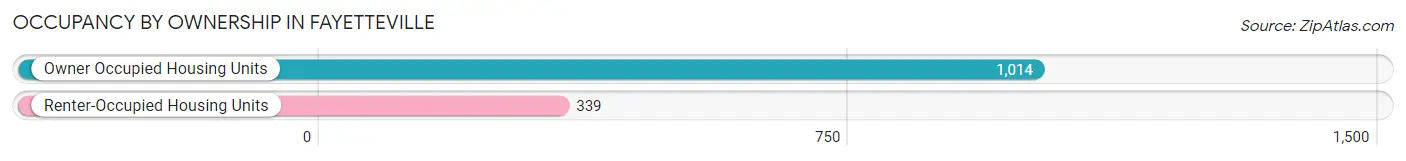
Of the total 1,353 dwellings in Fayetteville, owner-occupied units account for 1,014 (74.9%), while renter-occupied units make up 339 (25.1%).
| Occupancy | # Housing Units | % Housing Units |
| Owner Occupied Housing Units | 1,014 | 74.9% |
| Renter-Occupied Housing Units | 339 | 25.1% |
| Total Occupied Housing Units | 1,353 | 100.0% |
Occupancy by Household Size in Fayetteville
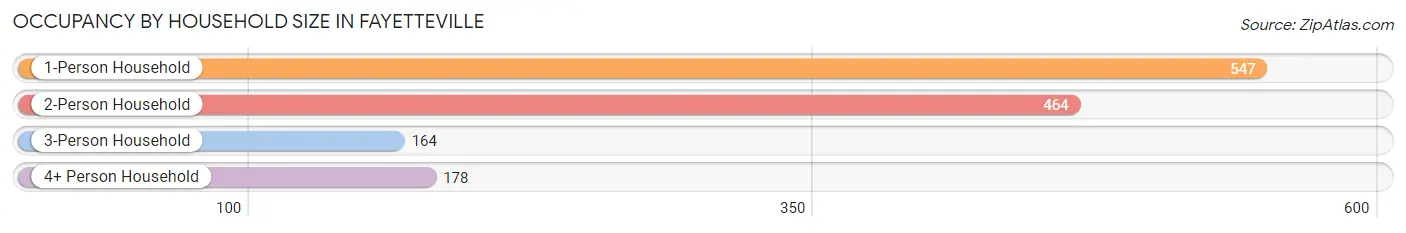
| Household Size | # Housing Units | % Housing Units |
| 1-Person Household | 547 | 40.4% |
| 2-Person Household | 464 | 34.3% |
| 3-Person Household | 164 | 12.1% |
| 4+ Person Household | 178 | 13.2% |
| Total Housing Units | 1,353 | 100.0% |
Occupancy by Ownership by Household Size in Fayetteville
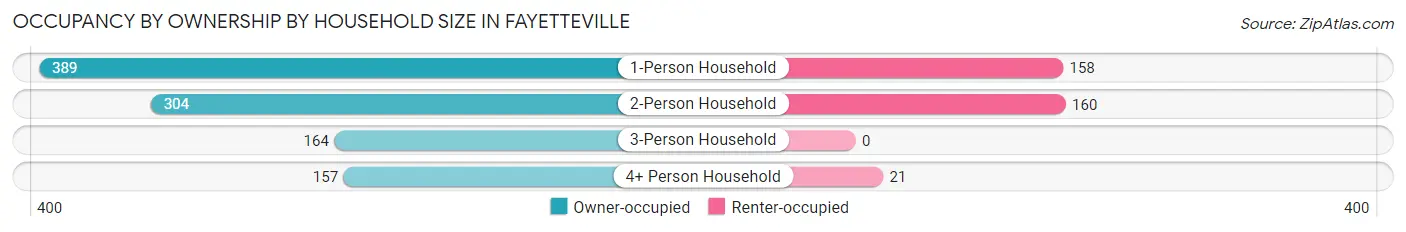
| Household Size | Owner-occupied | Renter-occupied |
| 1-Person Household | 389 (71.1%) | 158 (28.9%) |
| 2-Person Household | 304 (65.5%) | 160 (34.5%) |
| 3-Person Household | 164 (100.0%) | 0 (0.0%) |
| 4+ Person Household | 157 (88.2%) | 21 (11.8%) |
| Total Housing Units | 1,014 (74.9%) | 339 (25.1%) |
Occupancy by Educational Attainment in Fayetteville
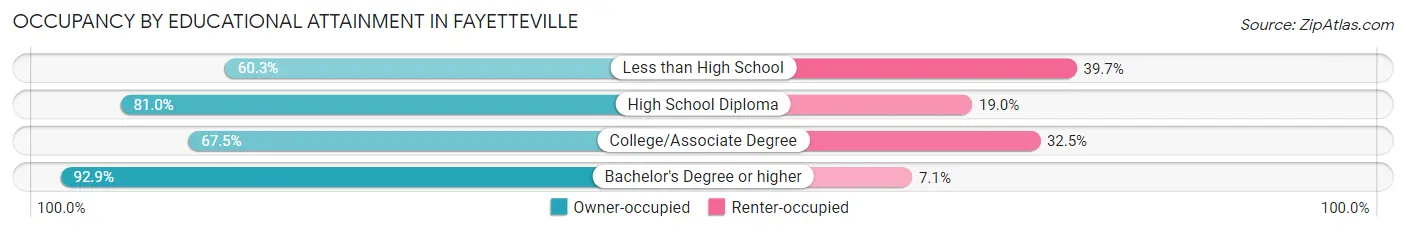
| Household Size | Owner-occupied | Renter-occupied |
| Less than High School | 85 (60.3%) | 56 (39.7%) |
| High School Diploma | 473 (81.0%) | 111 (19.0%) |
| College/Associate Degree | 339 (67.5%) | 163 (32.5%) |
| Bachelor's Degree or higher | 117 (92.9%) | 9 (7.1%) |
Occupancy by Age of Householder in Fayetteville
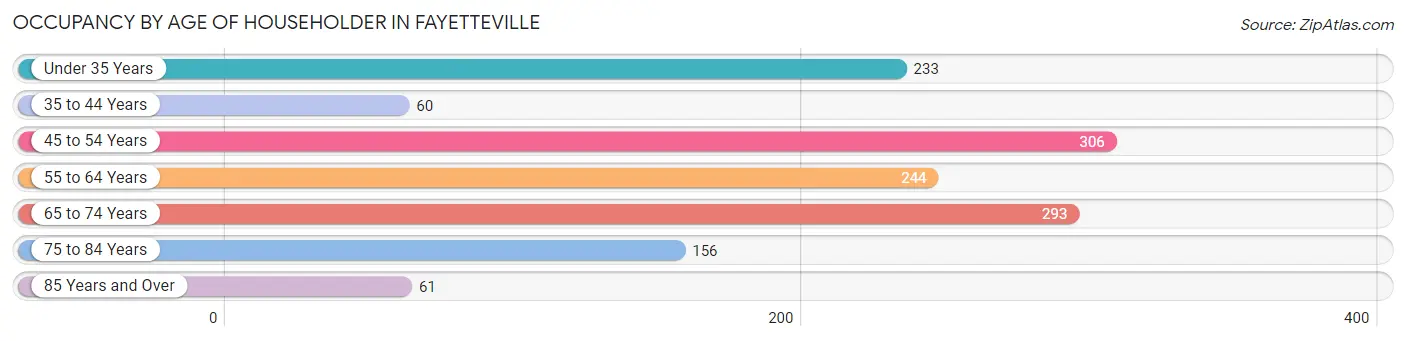
| Age Bracket | # Households | % Households |
| Under 35 Years | 233 | 17.2% |
| 35 to 44 Years | 60 | 4.4% |
| 45 to 54 Years | 306 | 22.6% |
| 55 to 64 Years | 244 | 18.0% |
| 65 to 74 Years | 293 | 21.7% |
| 75 to 84 Years | 156 | 11.5% |
| 85 Years and Over | 61 | 4.5% |
| Total | 1,353 | 100.0% |
Housing Finances in Fayetteville
Median Income by Occupancy in Fayetteville
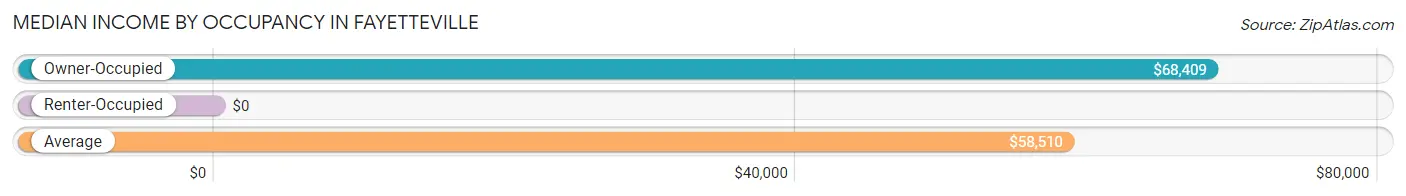
| Occupancy Type | # Households | Median Income |
| Owner-Occupied | 1,014 (74.9%) | $68,409 |
| Renter-Occupied | 339 (25.1%) | $0 |
| Average | 1,353 (100.0%) | $58,510 |
Occupancy by Householder Income Bracket in Fayetteville
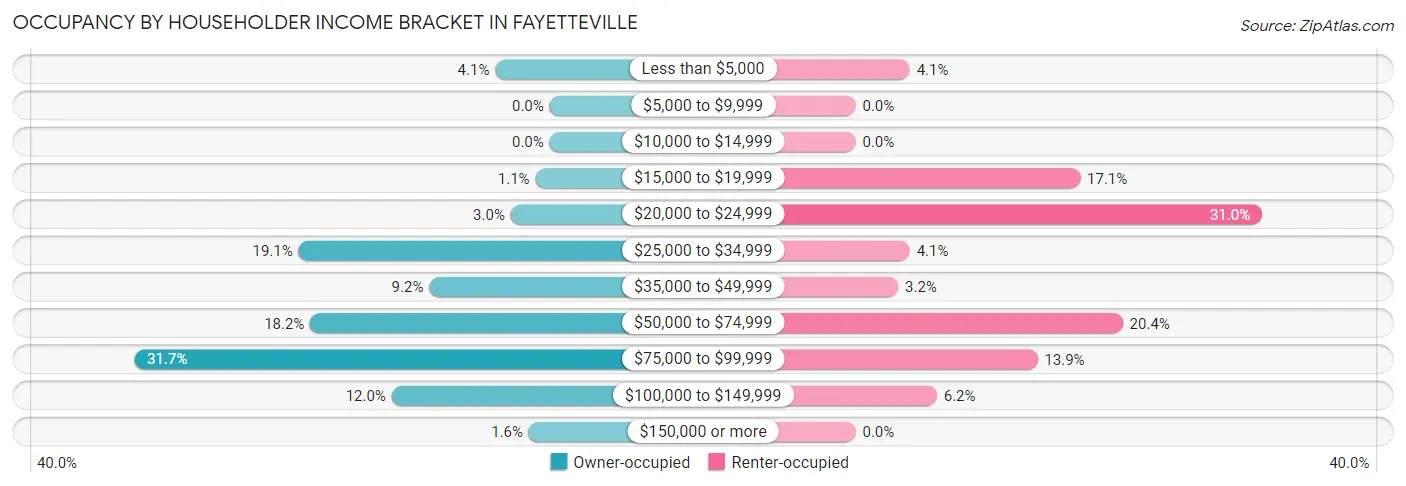
| Income Bracket | Owner-occupied | Renter-occupied |
| Less than $5,000 | 42 (4.1%) | 14 (4.1%) |
| $5,000 to $9,999 | 0 (0.0%) | 0 (0.0%) |
| $10,000 to $14,999 | 0 (0.0%) | 0 (0.0%) |
| $15,000 to $19,999 | 11 (1.1%) | 58 (17.1%) |
| $20,000 to $24,999 | 30 (3.0%) | 105 (31.0%) |
| $25,000 to $34,999 | 194 (19.1%) | 14 (4.1%) |
| $35,000 to $49,999 | 93 (9.2%) | 11 (3.2%) |
| $50,000 to $74,999 | 185 (18.2%) | 69 (20.3%) |
| $75,000 to $99,999 | 321 (31.7%) | 47 (13.9%) |
| $100,000 to $149,999 | 122 (12.0%) | 21 (6.2%) |
| $150,000 or more | 16 (1.6%) | 0 (0.0%) |
| Total | 1,014 (100.0%) | 339 (100.0%) |
Monthly Housing Cost Tiers in Fayetteville
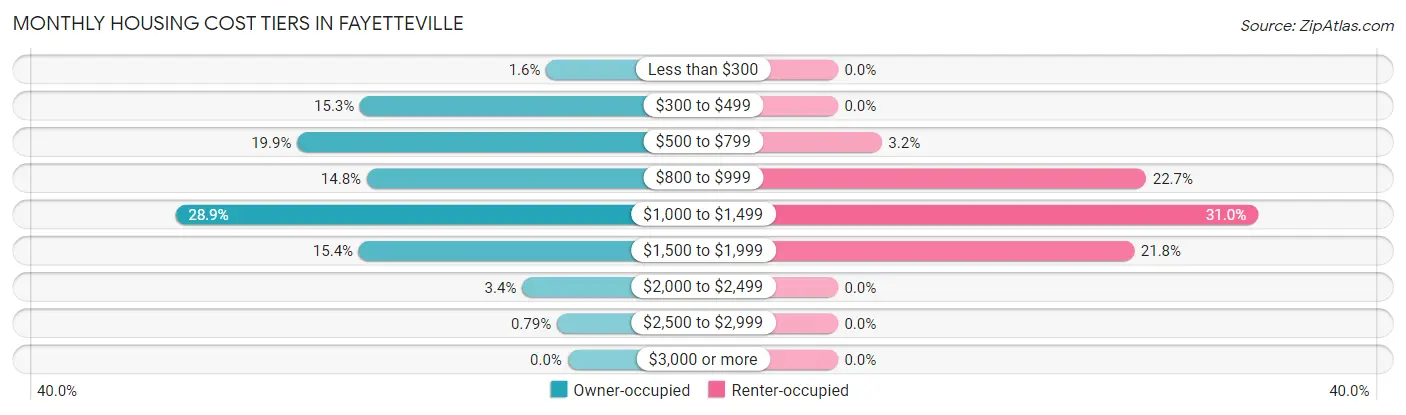
| Monthly Cost | Owner-occupied | Renter-occupied |
| Less than $300 | 16 (1.6%) | 0 (0.0%) |
| $300 to $499 | 155 (15.3%) | 0 (0.0%) |
| $500 to $799 | 202 (19.9%) | 11 (3.2%) |
| $800 to $999 | 150 (14.8%) | 77 (22.7%) |
| $1,000 to $1,499 | 293 (28.9%) | 105 (31.0%) |
| $1,500 to $1,999 | 156 (15.4%) | 74 (21.8%) |
| $2,000 to $2,499 | 34 (3.4%) | 0 (0.0%) |
| $2,500 to $2,999 | 8 (0.8%) | 0 (0.0%) |
| $3,000 or more | 0 (0.0%) | 0 (0.0%) |
| Total | 1,014 (100.0%) | 339 (100.0%) |
Physical Housing Characteristics in Fayetteville
Housing Structures in Fayetteville
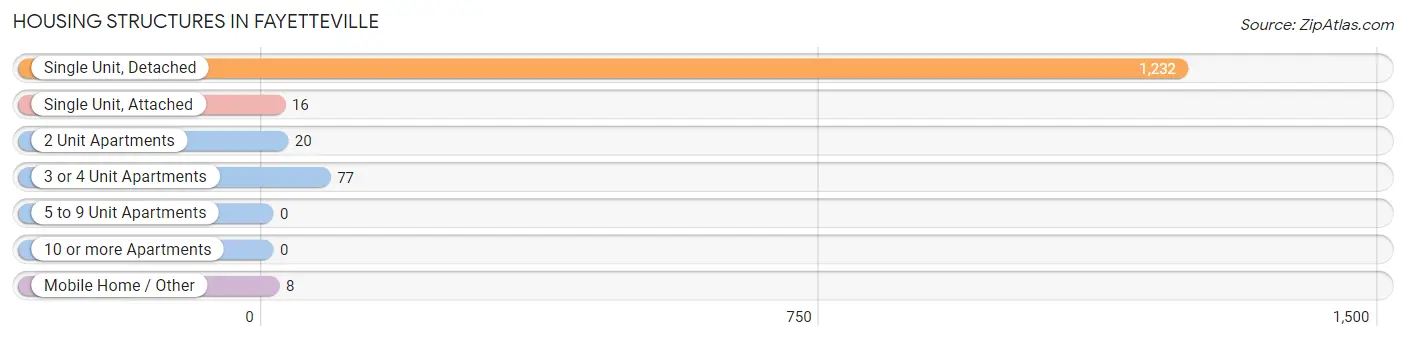
| Structure Type | # Housing Units | % Housing Units |
| Single Unit, Detached | 1,232 | 91.1% |
| Single Unit, Attached | 16 | 1.2% |
| 2 Unit Apartments | 20 | 1.5% |
| 3 or 4 Unit Apartments | 77 | 5.7% |
| 5 to 9 Unit Apartments | 0 | 0.0% |
| 10 or more Apartments | 0 | 0.0% |
| Mobile Home / Other | 8 | 0.6% |
| Total | 1,353 | 100.0% |
Housing Structures by Occupancy in Fayetteville
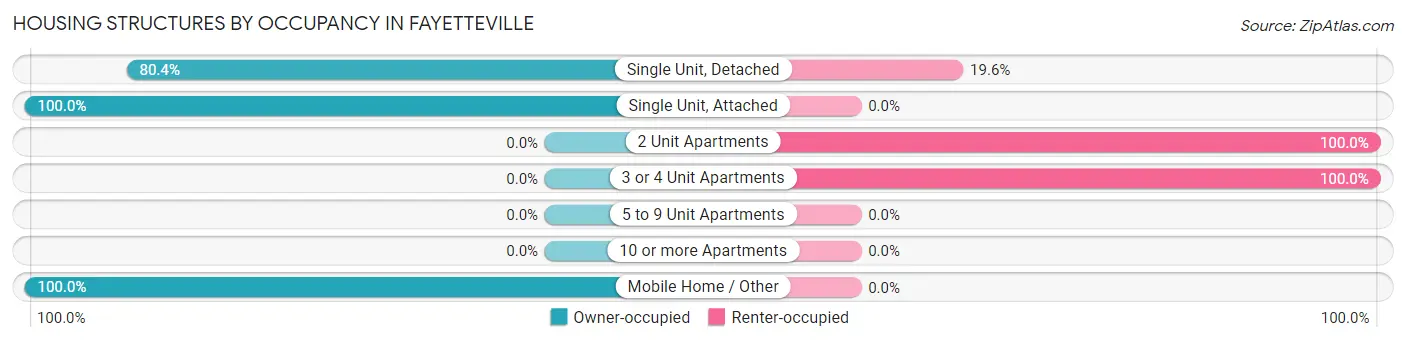
| Structure Type | Owner-occupied | Renter-occupied |
| Single Unit, Detached | 990 (80.4%) | 242 (19.6%) |
| Single Unit, Attached | 16 (100.0%) | 0 (0.0%) |
| 2 Unit Apartments | 0 (0.0%) | 20 (100.0%) |
| 3 or 4 Unit Apartments | 0 (0.0%) | 77 (100.0%) |
| 5 to 9 Unit Apartments | 0 (0.0%) | 0 (0.0%) |
| 10 or more Apartments | 0 (0.0%) | 0 (0.0%) |
| Mobile Home / Other | 8 (100.0%) | 0 (0.0%) |
| Total | 1,014 (74.9%) | 339 (25.1%) |
Housing Structures by Number of Rooms in Fayetteville
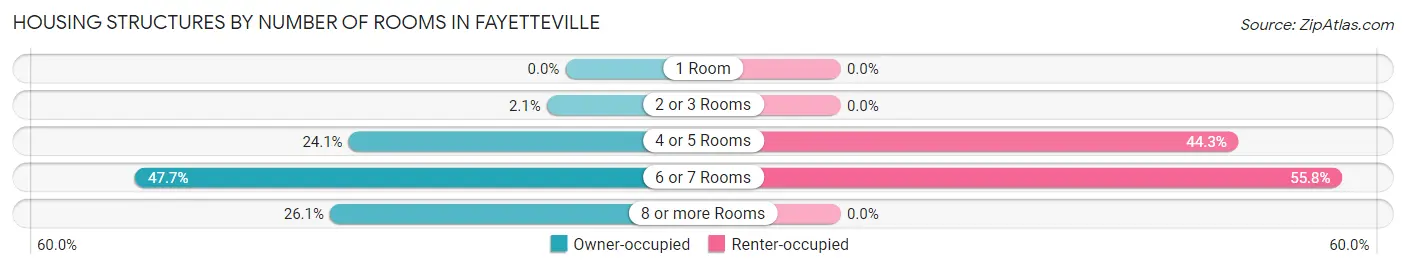
| Number of Rooms | Owner-occupied | Renter-occupied |
| 1 Room | 0 (0.0%) | 0 (0.0%) |
| 2 or 3 Rooms | 21 (2.1%) | 0 (0.0%) |
| 4 or 5 Rooms | 244 (24.1%) | 150 (44.3%) |
| 6 or 7 Rooms | 484 (47.7%) | 189 (55.7%) |
| 8 or more Rooms | 265 (26.1%) | 0 (0.0%) |
| Total | 1,014 (100.0%) | 339 (100.0%) |
Housing Structure by Heating Type in Fayetteville
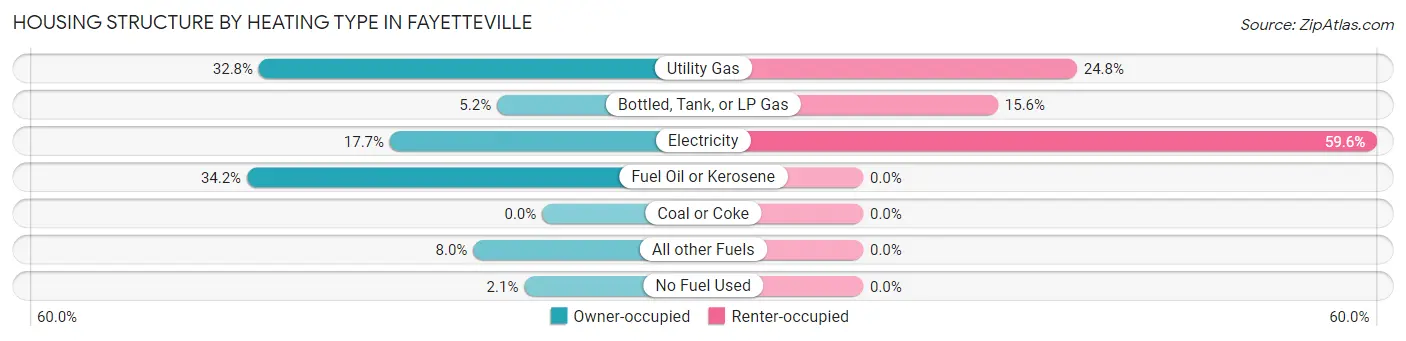
| Heating Type | Owner-occupied | Renter-occupied |
| Utility Gas | 333 (32.8%) | 84 (24.8%) |
| Bottled, Tank, or LP Gas | 53 (5.2%) | 53 (15.6%) |
| Electricity | 179 (17.6%) | 202 (59.6%) |
| Fuel Oil or Kerosene | 347 (34.2%) | 0 (0.0%) |
| Coal or Coke | 0 (0.0%) | 0 (0.0%) |
| All other Fuels | 81 (8.0%) | 0 (0.0%) |
| No Fuel Used | 21 (2.1%) | 0 (0.0%) |
| Total | 1,014 (100.0%) | 339 (100.0%) |
Household Vehicle Usage in Fayetteville
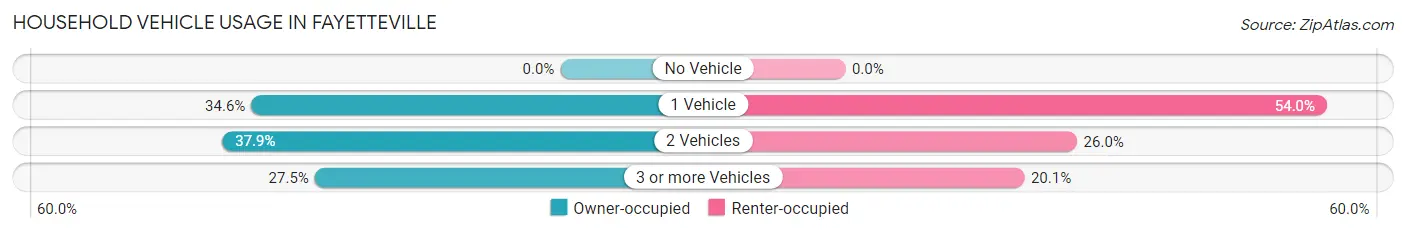
| Vehicles per Household | Owner-occupied | Renter-occupied |
| No Vehicle | 0 (0.0%) | 0 (0.0%) |
| 1 Vehicle | 351 (34.6%) | 183 (54.0%) |
| 2 Vehicles | 384 (37.9%) | 88 (26.0%) |
| 3 or more Vehicles | 279 (27.5%) | 68 (20.1%) |
| Total | 1,014 (100.0%) | 339 (100.0%) |
Real Estate & Mortgages in Fayetteville
Real Estate and Mortgage Overview in Fayetteville
| Characteristic | Without Mortgage | With Mortgage |
| Housing Units | 386 | 628 |
| Median Property Value | $222,200 | $166,900 |
| Median Household Income | $49,524 | $16 |
| Monthly Housing Costs | $624 | $0 |
| Real Estate Taxes | $2,855 | $21 |
Property Value by Mortgage Status in Fayetteville
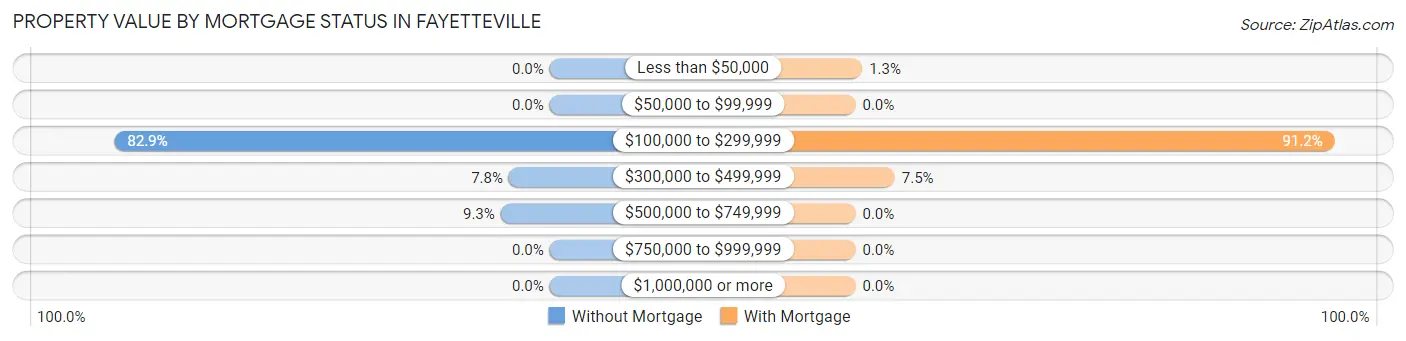
| Property Value | Without Mortgage | With Mortgage |
| Less than $50,000 | 0 (0.0%) | 8 (1.3%) |
| $50,000 to $99,999 | 0 (0.0%) | 0 (0.0%) |
| $100,000 to $299,999 | 320 (82.9%) | 573 (91.2%) |
| $300,000 to $499,999 | 30 (7.8%) | 47 (7.5%) |
| $500,000 to $749,999 | 36 (9.3%) | 0 (0.0%) |
| $750,000 to $999,999 | 0 (0.0%) | 0 (0.0%) |
| $1,000,000 or more | 0 (0.0%) | 0 (0.0%) |
| Total | 386 (100.0%) | 628 (100.0%) |
Household Income by Mortgage Status in Fayetteville
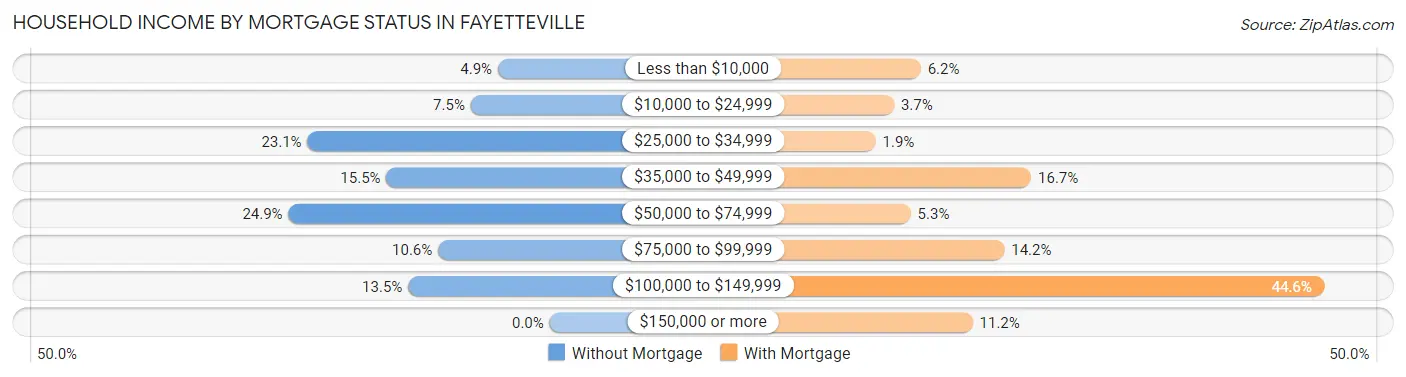
| Household Income | Without Mortgage | With Mortgage |
| Less than $10,000 | 19 (4.9%) | 39 (6.2%) |
| $10,000 to $24,999 | 29 (7.5%) | 23 (3.7%) |
| $25,000 to $34,999 | 89 (23.1%) | 12 (1.9%) |
| $35,000 to $49,999 | 60 (15.5%) | 105 (16.7%) |
| $50,000 to $74,999 | 96 (24.9%) | 33 (5.2%) |
| $75,000 to $99,999 | 41 (10.6%) | 89 (14.2%) |
| $100,000 to $149,999 | 52 (13.5%) | 280 (44.6%) |
| $150,000 or more | 0 (0.0%) | 70 (11.2%) |
| Total | 386 (100.0%) | 628 (100.0%) |
Property Value to Household Income Ratio in Fayetteville
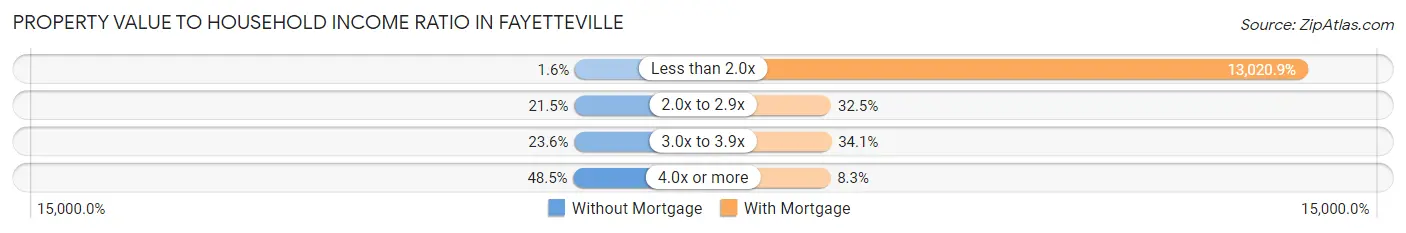
| Value-to-Income Ratio | Without Mortgage | With Mortgage |
| Less than 2.0x | 6 (1.5%) | 81,771 (13,020.9%) |
| 2.0x to 2.9x | 83 (21.5%) | 204 (32.5%) |
| 3.0x to 3.9x | 91 (23.6%) | 214 (34.1%) |
| 4.0x or more | 187 (48.4%) | 52 (8.3%) |
| Total | 386 (100.0%) | 628 (100.0%) |
Real Estate Taxes by Mortgage Status in Fayetteville
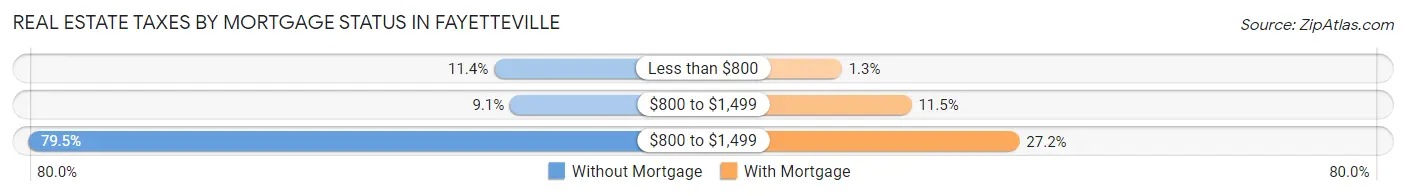
| Property Taxes | Without Mortgage | With Mortgage |
| Less than $800 | 44 (11.4%) | 8 (1.3%) |
| $800 to $1,499 | 35 (9.1%) | 72 (11.5%) |
| $800 to $1,499 | 307 (79.5%) | 171 (27.2%) |
| Total | 386 (100.0%) | 628 (100.0%) |
Health & Disability in Fayetteville
Health Insurance Coverage by Age in Fayetteville
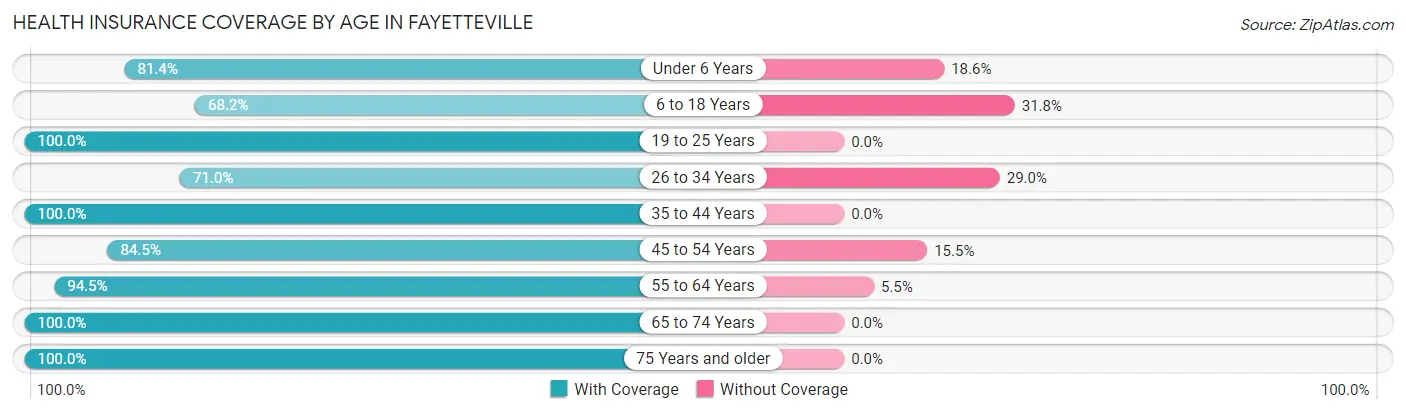
| Age Bracket | With Coverage | Without Coverage |
| Under 6 Years | 144 (81.4%) | 33 (18.6%) |
| 6 to 18 Years | 208 (68.2%) | 97 (31.8%) |
| 19 to 25 Years | 213 (100.0%) | 0 (0.0%) |
| 26 to 34 Years | 235 (71.0%) | 96 (29.0%) |
| 35 to 44 Years | 159 (100.0%) | 0 (0.0%) |
| 45 to 54 Years | 317 (84.5%) | 58 (15.5%) |
| 55 to 64 Years | 358 (94.5%) | 21 (5.5%) |
| 65 to 74 Years | 448 (100.0%) | 0 (0.0%) |
| 75 Years and older | 358 (100.0%) | 0 (0.0%) |
| Total | 2,440 (88.9%) | 305 (11.1%) |
Health Insurance Coverage by Citizenship Status in Fayetteville
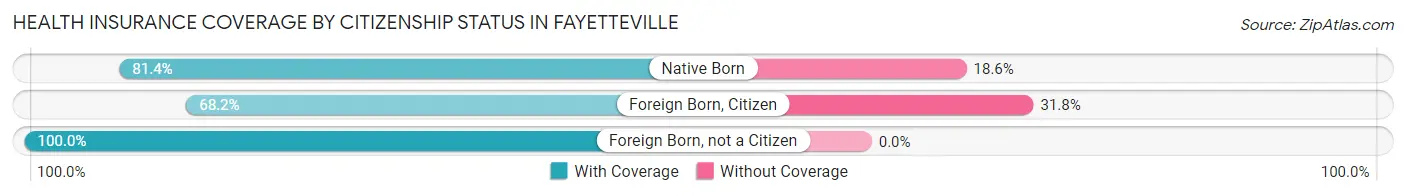
| Citizenship Status | With Coverage | Without Coverage |
| Native Born | 144 (81.4%) | 33 (18.6%) |
| Foreign Born, Citizen | 208 (68.2%) | 97 (31.8%) |
| Foreign Born, not a Citizen | 213 (100.0%) | 0 (0.0%) |
Health Insurance Coverage by Household Income in Fayetteville
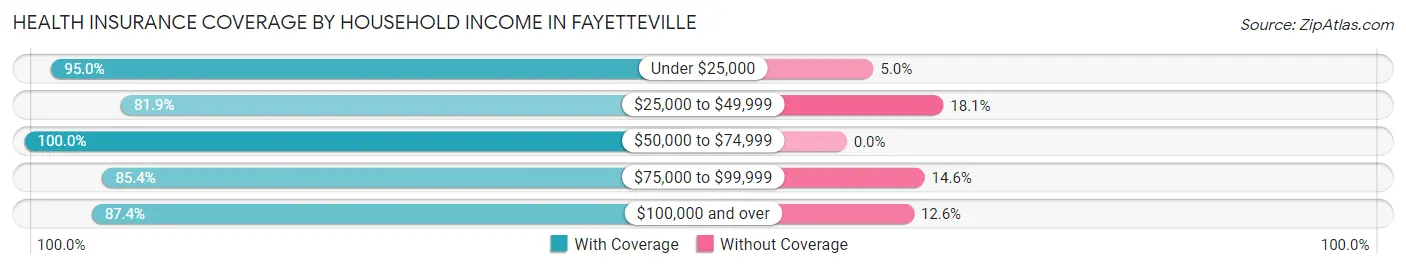
| Household Income | With Coverage | Without Coverage |
| Under $25,000 | 322 (95.0%) | 17 (5.0%) |
| $25,000 to $49,999 | 403 (81.9%) | 89 (18.1%) |
| $50,000 to $74,999 | 471 (100.0%) | 0 (0.0%) |
| $75,000 to $99,999 | 814 (85.4%) | 139 (14.6%) |
| $100,000 and over | 417 (87.4%) | 60 (12.6%) |
Public vs Private Health Insurance Coverage by Age in Fayetteville
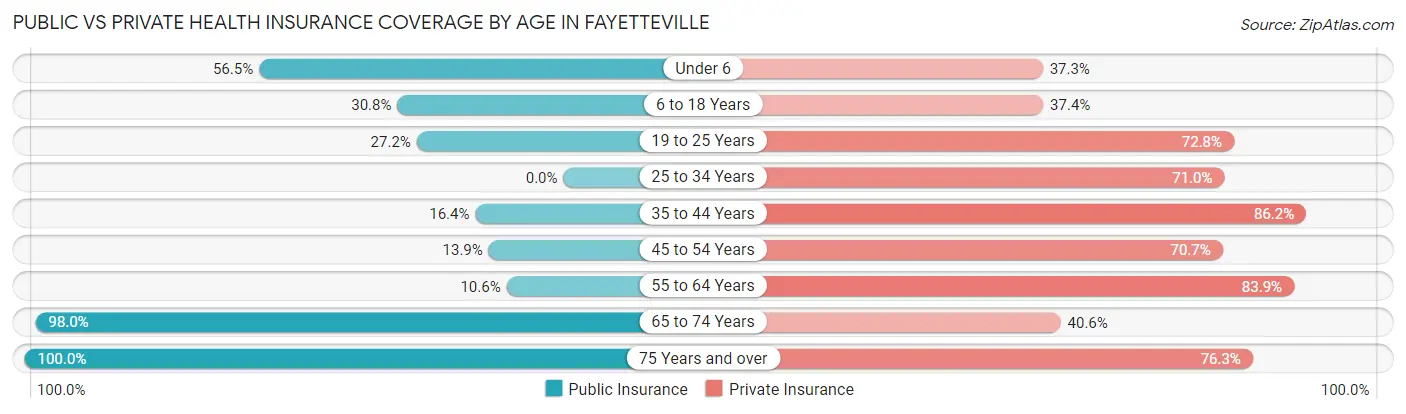
| Age Bracket | Public Insurance | Private Insurance |
| Under 6 | 100 (56.5%) | 66 (37.3%) |
| 6 to 18 Years | 94 (30.8%) | 114 (37.4%) |
| 19 to 25 Years | 58 (27.2%) | 155 (72.8%) |
| 25 to 34 Years | 0 (0.0%) | 235 (71.0%) |
| 35 to 44 Years | 26 (16.4%) | 137 (86.2%) |
| 45 to 54 Years | 52 (13.9%) | 265 (70.7%) |
| 55 to 64 Years | 40 (10.5%) | 318 (83.9%) |
| 65 to 74 Years | 439 (98.0%) | 182 (40.6%) |
| 75 Years and over | 358 (100.0%) | 273 (76.3%) |
| Total | 1,167 (42.5%) | 1,745 (63.6%) |
Disability Status by Sex by Age in Fayetteville
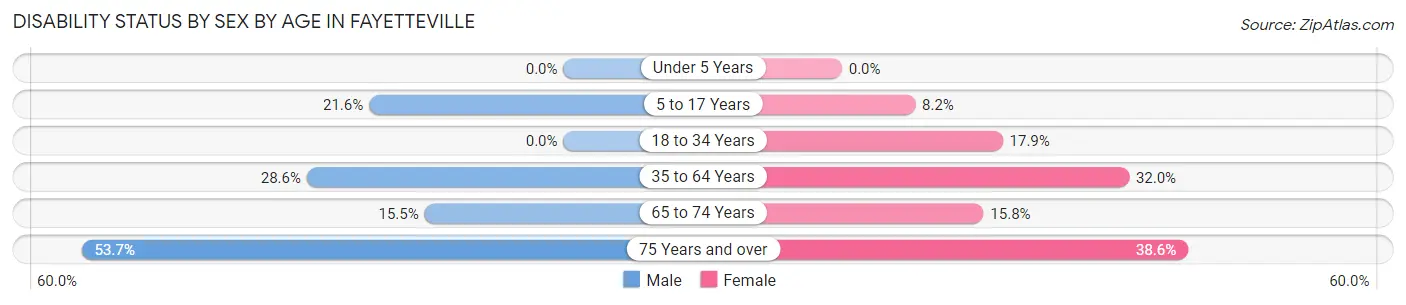
| Age Bracket | Male | Female |
| Under 5 Years | 0 (0.0%) | 0 (0.0%) |
| 5 to 17 Years | 29 (21.6%) | 16 (8.2%) |
| 18 to 34 Years | 0 (0.0%) | 77 (17.9%) |
| 35 to 64 Years | 134 (28.6%) | 142 (32.0%) |
| 65 to 74 Years | 32 (15.5%) | 38 (15.8%) |
| 75 Years and over | 110 (53.7%) | 59 (38.6%) |
Disability Class by Sex by Age in Fayetteville
Disability Class: Hearing Difficulty
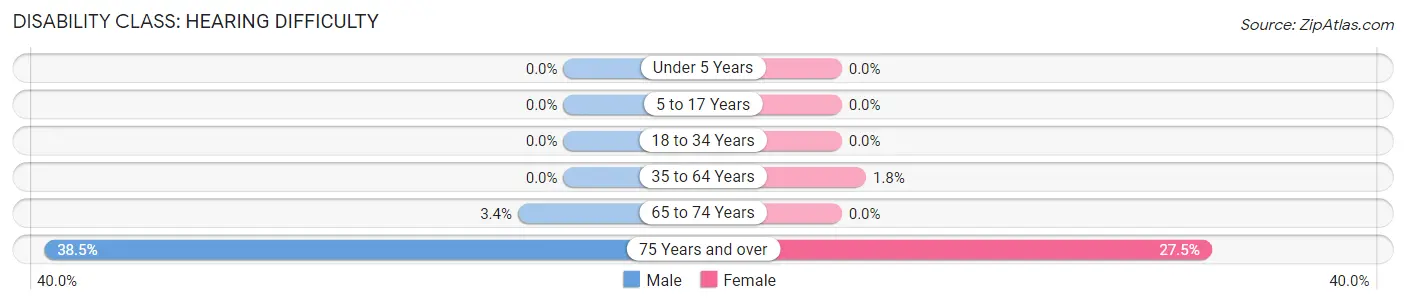
| Age Bracket | Male | Female |
| Under 5 Years | 0 (0.0%) | 0 (0.0%) |
| 5 to 17 Years | 0 (0.0%) | 0 (0.0%) |
| 18 to 34 Years | 0 (0.0%) | 0 (0.0%) |
| 35 to 64 Years | 0 (0.0%) | 8 (1.8%) |
| 65 to 74 Years | 7 (3.4%) | 0 (0.0%) |
| 75 Years and over | 79 (38.5%) | 42 (27.5%) |
Disability Class: Vision Difficulty
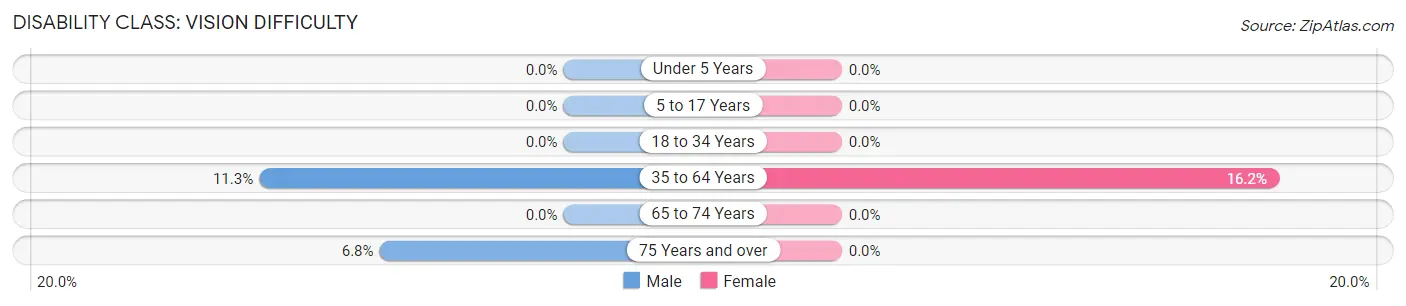
| Age Bracket | Male | Female |
| Under 5 Years | 0 (0.0%) | 0 (0.0%) |
| 5 to 17 Years | 0 (0.0%) | 0 (0.0%) |
| 18 to 34 Years | 0 (0.0%) | 0 (0.0%) |
| 35 to 64 Years | 53 (11.3%) | 72 (16.2%) |
| 65 to 74 Years | 0 (0.0%) | 0 (0.0%) |
| 75 Years and over | 14 (6.8%) | 0 (0.0%) |
Disability Class: Cognitive Difficulty
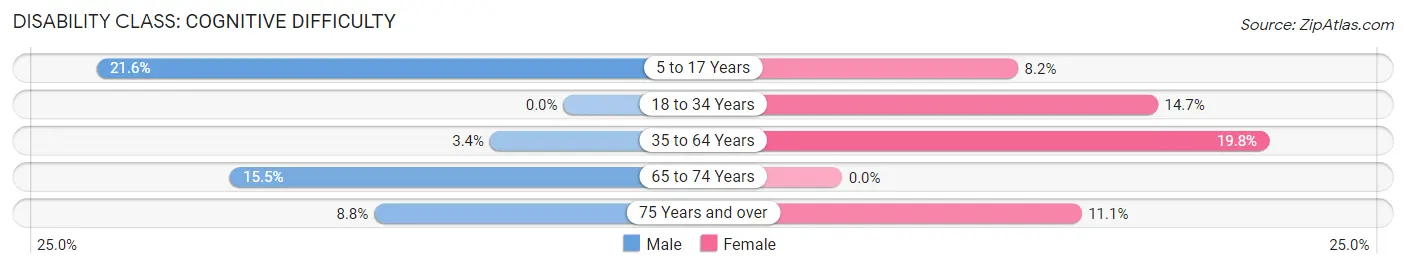
| Age Bracket | Male | Female |
| 5 to 17 Years | 29 (21.6%) | 16 (8.2%) |
| 18 to 34 Years | 0 (0.0%) | 63 (14.6%) |
| 35 to 64 Years | 16 (3.4%) | 88 (19.8%) |
| 65 to 74 Years | 32 (15.5%) | 0 (0.0%) |
| 75 Years and over | 18 (8.8%) | 17 (11.1%) |
Disability Class: Ambulatory Difficulty
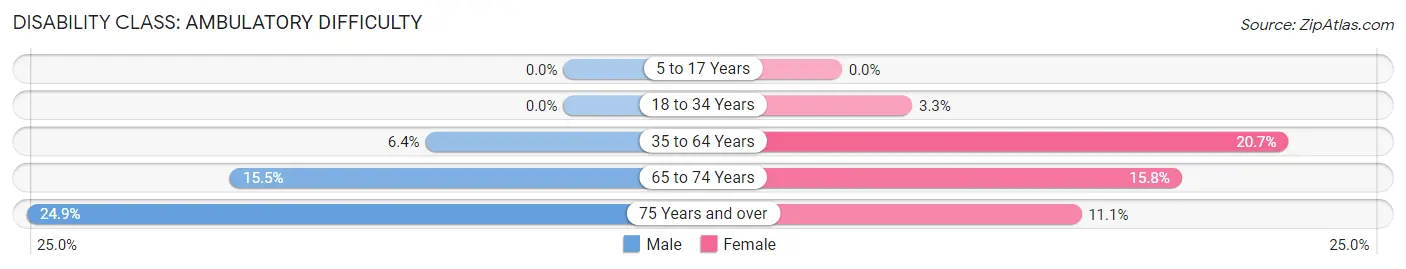
| Age Bracket | Male | Female |
| 5 to 17 Years | 0 (0.0%) | 0 (0.0%) |
| 18 to 34 Years | 0 (0.0%) | 14 (3.3%) |
| 35 to 64 Years | 30 (6.4%) | 92 (20.7%) |
| 65 to 74 Years | 32 (15.5%) | 38 (15.8%) |
| 75 Years and over | 51 (24.9%) | 17 (11.1%) |
Disability Class: Self-Care Difficulty
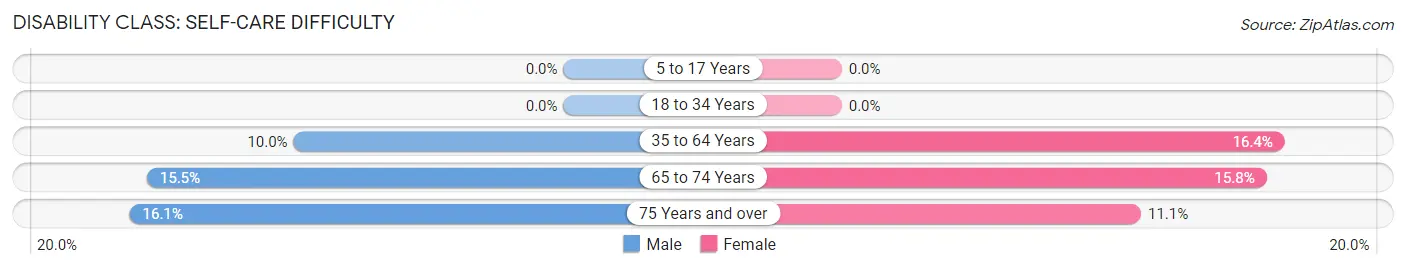
| Age Bracket | Male | Female |
| 5 to 17 Years | 0 (0.0%) | 0 (0.0%) |
| 18 to 34 Years | 0 (0.0%) | 0 (0.0%) |
| 35 to 64 Years | 47 (10.0%) | 73 (16.4%) |
| 65 to 74 Years | 32 (15.5%) | 38 (15.8%) |
| 75 Years and over | 33 (16.1%) | 17 (11.1%) |
Technology Access in Fayetteville
Computing Device Access in Fayetteville
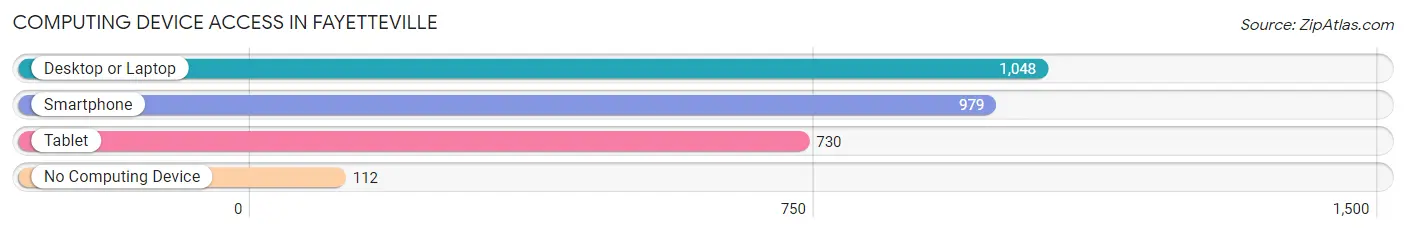
| Device Type | # Households | % Households |
| Desktop or Laptop | 1,048 | 77.5% |
| Smartphone | 979 | 72.4% |
| Tablet | 730 | 53.9% |
| No Computing Device | 112 | 8.3% |
| Total | 1,353 | 100.0% |
Internet Access in Fayetteville
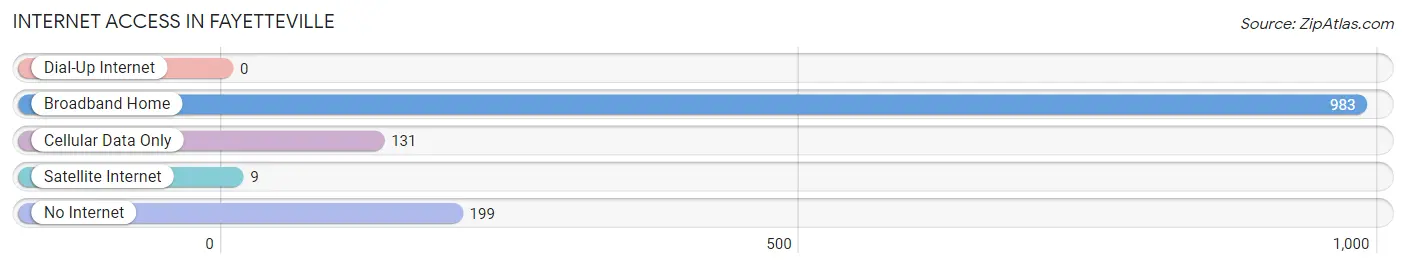
| Internet Type | # Households | % Households |
| Dial-Up Internet | 0 | 0.0% |
| Broadband Home | 983 | 72.7% |
| Cellular Data Only | 131 | 9.7% |
| Satellite Internet | 9 | 0.7% |
| No Internet | 199 | 14.7% |
| Total | 1,353 | 100.0% |
Fayetteville Summary
Fayetteville, Pennsylvania is a small borough located in Franklin County, Pennsylvania. It is situated in the Cumberland Valley, which is part of the Great Appalachian Valley. The borough is located approximately 10 miles south of Chambersburg and is part of the Chambersburg-Waynesboro Metropolitan Statistical Area. The population of Fayetteville was 1,717 at the 2010 census.
History
Fayetteville was founded in 1764 by a group of settlers from Maryland and Virginia. The town was named after the Marquis de Lafayette, a French military officer who fought in the American Revolutionary War. The town was originally part of Cumberland County, but was later annexed to Franklin County in 1820.
Fayetteville was an important stop on the Underground Railroad, a network of secret routes and safe houses used by African-American slaves to escape to freedom in the northern United States and Canada. The town was also the site of a Civil War battle in 1863, when Confederate forces attempted to capture the town. The Union forces were able to repel the attack and the town remained in Union hands.
Geography
Fayetteville is located at 39°48'N 77°45'W (39.8, -77.75). According to the United States Census Bureau, the borough has a total area of 0.6 square miles (1.6 km2), all of it land.
The borough is located in the Cumberland Valley, which is part of the Great Appalachian Valley. The valley is surrounded by the Blue Ridge Mountains to the east and the Allegheny Mountains to the west. The valley is drained by the Conococheague Creek, which flows through the borough.
Economy
The economy of Fayetteville is largely based on agriculture and tourism. The borough is home to several farms, which produce a variety of crops, including corn, soybeans, wheat, and hay. The borough is also home to several wineries, which produce a variety of wines.
Tourism is an important part of the local economy. The borough is home to several historic sites, including the Fayetteville Historic District, which is listed on the National Register of Historic Places. The borough is also home to several parks, including the Fayetteville Community Park, which features a playground, picnic areas, and a walking trail.
Demographics
As of the 2010 census, there were 1,717 people, 717 households, and 463 families residing in the borough. The population density was 2,845.3 people per square mile (1,098.7/km2). There were 790 housing units at an average density of 1,297.2 per square mile (498.7/km2). The racial makeup of the borough was 97.2% White, 0.9% African American, 0.2% Native American, 0.2% Asian, 0.2% from other races, and 1.3% from two or more races. Hispanic or Latino of any race were 1.2% of the population.
There were 717 households, out of which 28.2% had children under the age of 18 living with them, 48.2% were married couples living together, 11.7% had a female householder with no husband present, and 35.3% were non-families. 30.2% of all households were made up of individuals, and 14.2% had someone living alone who was 65 years of age or older. The average household size was 2.40 and the average family size was 2.97.
In the borough, the population was spread out, with 24.2% under the age of 18, 7.2% from 18 to 24, 28.2% from 25 to 44, 24.2% from 45 to 64, and 16.2% who were 65 years of age or older. The median age was 38 years. For every 100 females, there were 92.2 males. For every 100 females age 18 and over, there were 88.2 males.
The median income for a household in the borough was $37,500, and the median income for a family was $45,000. Males had a median income of $31,250 versus $22,500 for females. The per capita income for the borough was $18,945. About 6.2% of families and 8.2% of the population were below the poverty line, including 10.2% of those under age 18 and 8.2% of those age 65 or over.
Common Questions
What is Per Capita Income in Fayetteville?
Per Capita income in Fayetteville is $37,884.
What is the Median Family Income in Fayetteville?
Median Family Income in Fayetteville is $75,139.
What is the Median Household income in Fayetteville?
Median Household Income in Fayetteville is $58,510.
What is Income or Wage Gap in Fayetteville?
Income or Wage Gap in Fayetteville is 39.1%.
Women in Fayetteville earn 60.9 cents for every dollar earned by a man.
What is Inequality or Gini Index in Fayetteville?
Inequality or Gini Index in Fayetteville is 0.46.
What is the Total Population of Fayetteville?
Total Population of Fayetteville is 2,745.
What is the Total Male Population of Fayetteville?
Total Male Population of Fayetteville is 1,184.
What is the Total Female Population of Fayetteville?
Total Female Population of Fayetteville is 1,561.
What is the Ratio of Males per 100 Females in Fayetteville?
There are 75.85 Males per 100 Females in Fayetteville.
What is the Ratio of Females per 100 Males in Fayetteville?
There are 131.84 Females per 100 Males in Fayetteville.
What is the Median Population Age in Fayetteville?
Median Population Age in Fayetteville is 51.1 Years.
What is the Average Family Size in Fayetteville
Average Family Size in Fayetteville is 2.6 People.
What is the Average Household Size in Fayetteville
Average Household Size in Fayetteville is 2.0 People.
How Large is the Labor Force in Fayetteville?
There are 1,203 People in the Labor Forcein in Fayetteville.
What is the Percentage of People in the Labor Force in Fayetteville?
52.7% of People are in the Labor Force in Fayetteville.