Falmouth, PA Map & Demographics
Falmouth Map
Falmouth Overview
$34,959
PER CAPITA INCOME
$71,932
AVG HOUSEHOLD INCOME
31.8%
WAGE / INCOME GAP [ % ]
68.2¢/ $1
WAGE / INCOME GAP [ $ ]
0.33
INEQUALITY / GINI INDEX
518
TOTAL POPULATION
279
MALE POPULATION
239
FEMALE POPULATION
116.74
MALES / 100 FEMALES
85.66
FEMALES / 100 MALES
39.1
MEDIAN AGE
2.7
AVG FAMILY SIZE
2.3
AVG HOUSEHOLD SIZE
260
LABOR FORCE [ PEOPLE ]
63.7%
PERCENT IN LABOR FORCE
3.1%
UNEMPLOYMENT RATE
Income in Falmouth
Income Overview in Falmouth
| Characteristic | Number | Measure |
| Per Capita Income | 518 | $34,959 |
| Median Family Income | 158 | $0 |
| Mean Family Income | 158 | $89,771 |
| Median Household Income | 223 | $71,932 |
| Mean Household Income | 223 | $82,301 |
| Income Deficit | 158 | $0 |
| Wage / Income Gap (%) | 518 | 31.77% |
| Wage / Income Gap ($) | 518 | 68.23¢ per $1 |
| Gini / Inequality Index | 518 | 0.33 |
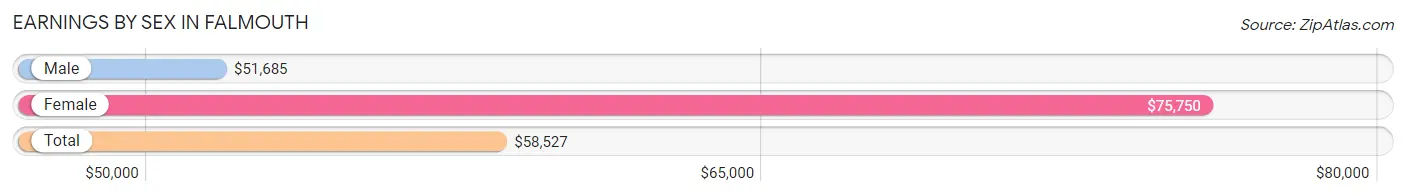
Earnings by Sex in Falmouth
Average Earnings in Falmouth are $58,527, $51,685 for men and $75,750 for women, a difference of 31.8%.
| Sex | Number | Average Earnings |
| Male | 145 (55.3%) | $51,685 |
| Female | 117 (44.7%) | $75,750 |
| Total | 262 (100.0%) | $58,527 |
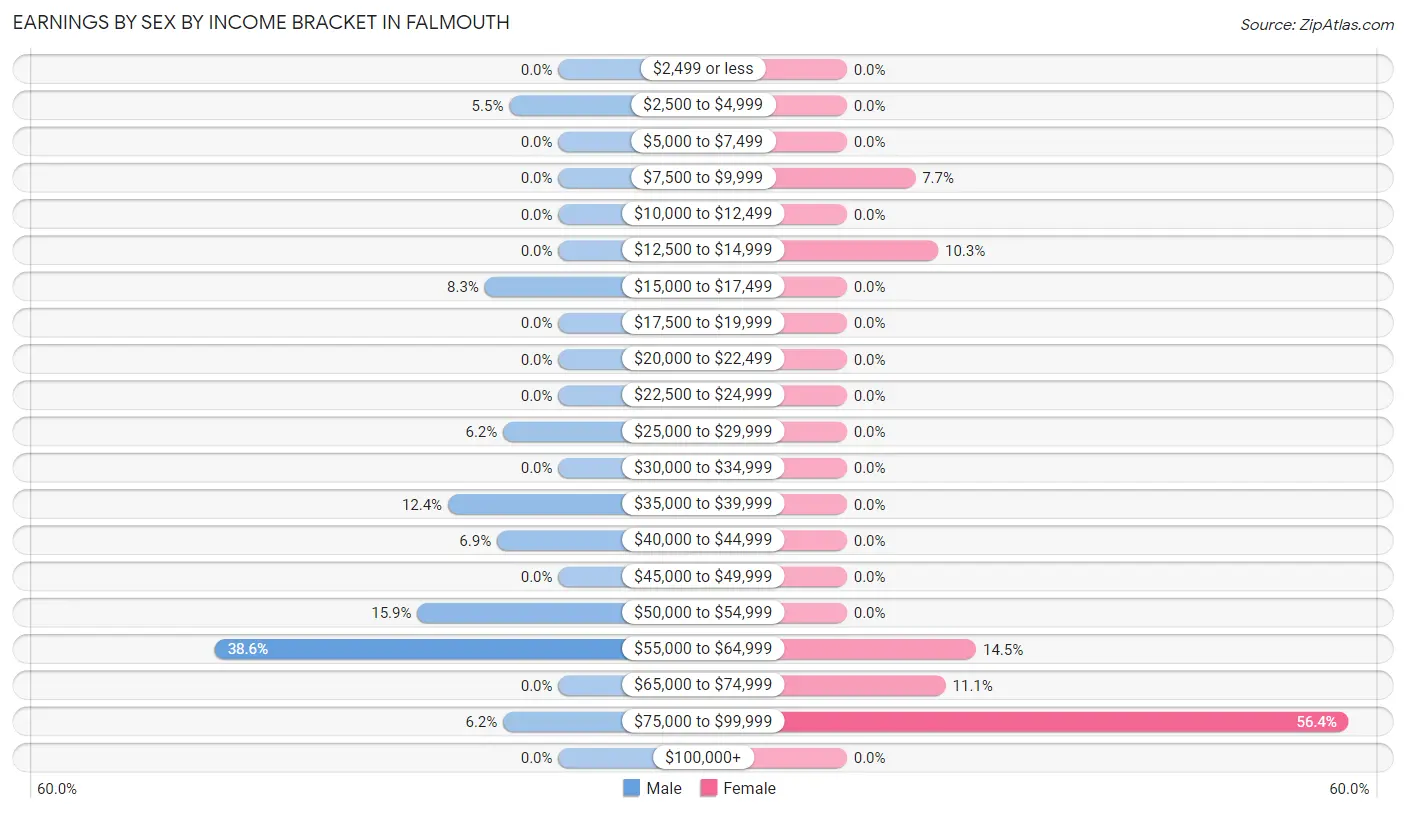
Earnings by Sex by Income Bracket in Falmouth
The most common earnings brackets in Falmouth are $55,000 to $64,999 for men (56 | 38.6%) and $75,000 to $99,999 for women (66 | 56.4%).
| Income | Male | Female |
| $2,499 or less | 0 (0.0%) | 0 (0.0%) |
| $2,500 to $4,999 | 8 (5.5%) | 0 (0.0%) |
| $5,000 to $7,499 | 0 (0.0%) | 0 (0.0%) |
| $7,500 to $9,999 | 0 (0.0%) | 9 (7.7%) |
| $10,000 to $12,499 | 0 (0.0%) | 0 (0.0%) |
| $12,500 to $14,999 | 0 (0.0%) | 12 (10.3%) |
| $15,000 to $17,499 | 12 (8.3%) | 0 (0.0%) |
| $17,500 to $19,999 | 0 (0.0%) | 0 (0.0%) |
| $20,000 to $22,499 | 0 (0.0%) | 0 (0.0%) |
| $22,500 to $24,999 | 0 (0.0%) | 0 (0.0%) |
| $25,000 to $29,999 | 9 (6.2%) | 0 (0.0%) |
| $30,000 to $34,999 | 0 (0.0%) | 0 (0.0%) |
| $35,000 to $39,999 | 18 (12.4%) | 0 (0.0%) |
| $40,000 to $44,999 | 10 (6.9%) | 0 (0.0%) |
| $45,000 to $49,999 | 0 (0.0%) | 0 (0.0%) |
| $50,000 to $54,999 | 23 (15.9%) | 0 (0.0%) |
| $55,000 to $64,999 | 56 (38.6%) | 17 (14.5%) |
| $65,000 to $74,999 | 0 (0.0%) | 13 (11.1%) |
| $75,000 to $99,999 | 9 (6.2%) | 66 (56.4%) |
| $100,000+ | 0 (0.0%) | 0 (0.0%) |
| Total | 145 (100.0%) | 117 (100.0%) |
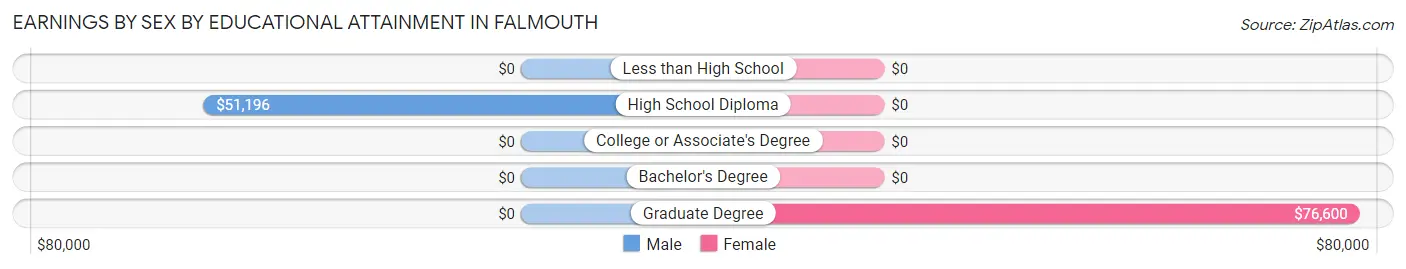
Earnings by Sex by Educational Attainment in Falmouth
Average earnings in Falmouth are $52,120 for men and $75,750 for women, a difference of 31.2%. Men with an educational attainment of high school diploma enjoy the highest average annual earnings of $51,196, while those with high school diploma education earn the least with $51,196. Women with an educational attainment of graduate degree earn the most with the average annual earnings of $76,600, while those with graduate degree education have the smallest earnings of $76,600.
| Educational Attainment | Male Income | Female Income |
| Less than High School | - | - |
| High School Diploma | $51,196 | $0 |
| College or Associate's Degree | - | - |
| Bachelor's Degree | - | - |
| Graduate Degree | - | - |
| Total | $52,120 | $75,750 |
Family Income in Falmouth
Family Income Brackets in Falmouth
According to the Falmouth family income data, there are 78 families falling into the $100,000 to $149,999 income range, which is the most common income bracket and makes up 49.4% of all families.
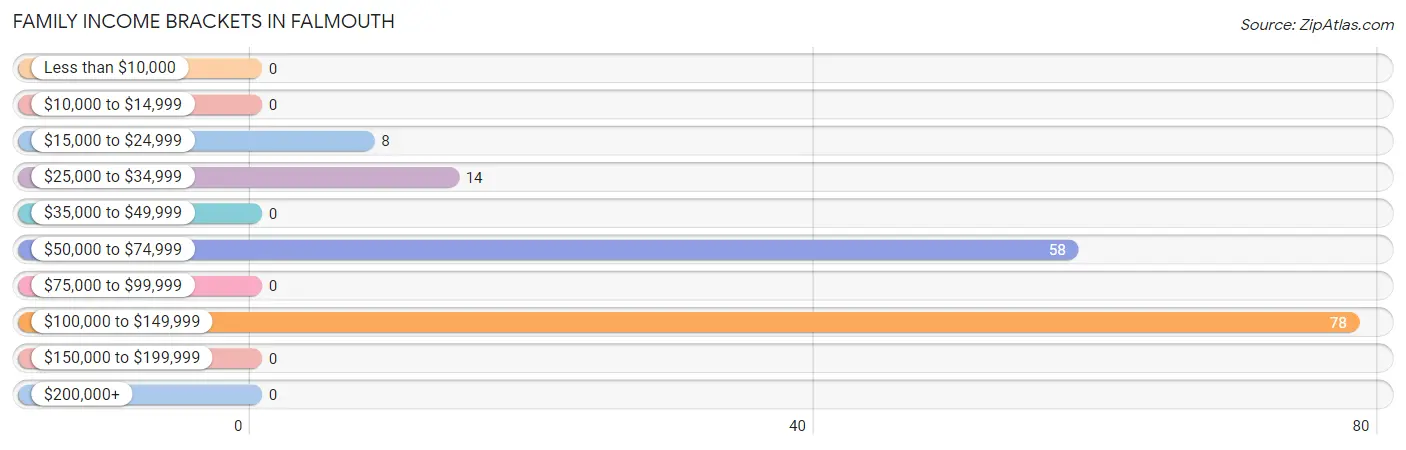
| Income Bracket | # Families | % Families |
| Less than $10,000 | 0 | 0.0% |
| $10,000 to $14,999 | 0 | 0.0% |
| $15,000 to $24,999 | 8 | 5.1% |
| $25,000 to $34,999 | 14 | 8.9% |
| $35,000 to $49,999 | 0 | 0.0% |
| $50,000 to $74,999 | 58 | 36.7% |
| $75,000 to $99,999 | 0 | 0.0% |
| $100,000 to $149,999 | 78 | 49.4% |
| $150,000 to $199,999 | 0 | 0.0% |
| $200,000+ | 0 | 0.0% |
Family Income by Famaliy Size in Falmouth
3-person families (87 | 55.1%) account for the highest median family income in Falmouth with $135,450 per family, while 3-person families (87 | 55.1%) have the highest median income of $45,150 per family member.
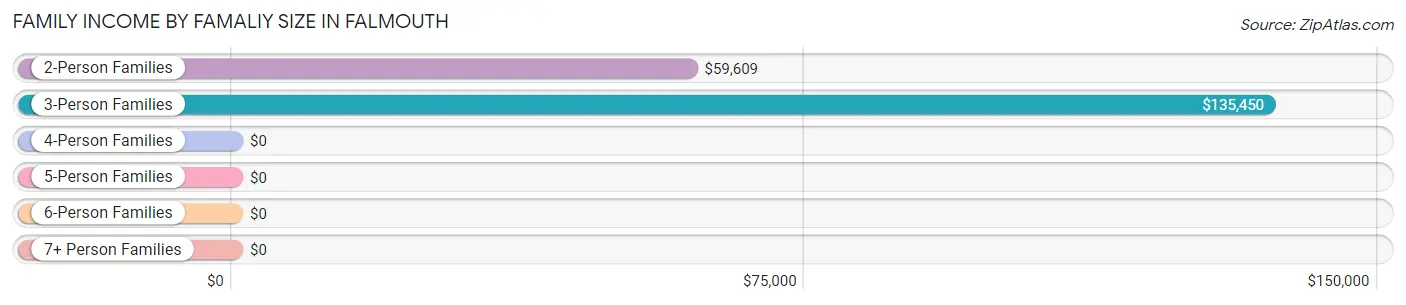
| Income Bracket | # Families | Median Income |
| 2-Person Families | 55 (34.8%) | $59,609 |
| 3-Person Families | 87 (55.1%) | $135,450 |
| 4-Person Families | 8 (5.1%) | $0 |
| 5-Person Families | 8 (5.1%) | $0 |
| 6-Person Families | 0 (0.0%) | $0 |
| 7+ Person Families | 0 (0.0%) | $0 |
| Total | 158 (100.0%) | $0 |
Family Income by Number of Earners in Falmouth
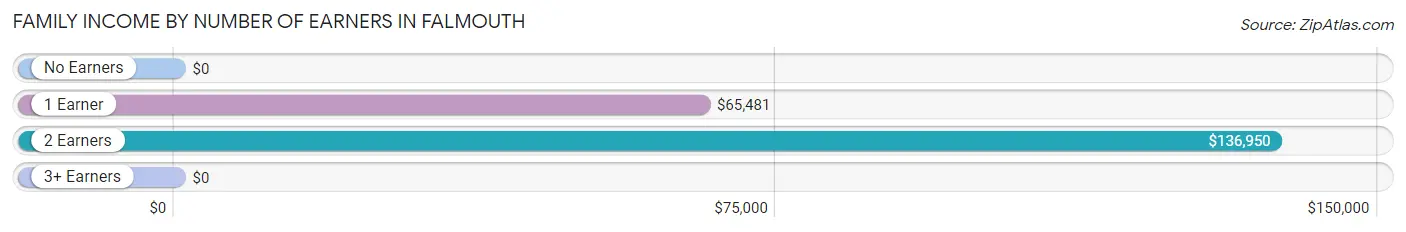
| Number of Earners | # Families | Median Income |
| No Earners | 22 (13.9%) | $0 |
| 1 Earner | 71 (44.9%) | $65,481 |
| 2 Earners | 57 (36.1%) | $136,950 |
| 3+ Earners | 8 (5.1%) | $0 |
| Total | 158 (100.0%) | $0 |
Household Income in Falmouth
Household Income Brackets in Falmouth
With 92 households falling in the category, the $100,000 to $149,999 income range is the most frequent in Falmouth, accounting for 41.3% of all households.
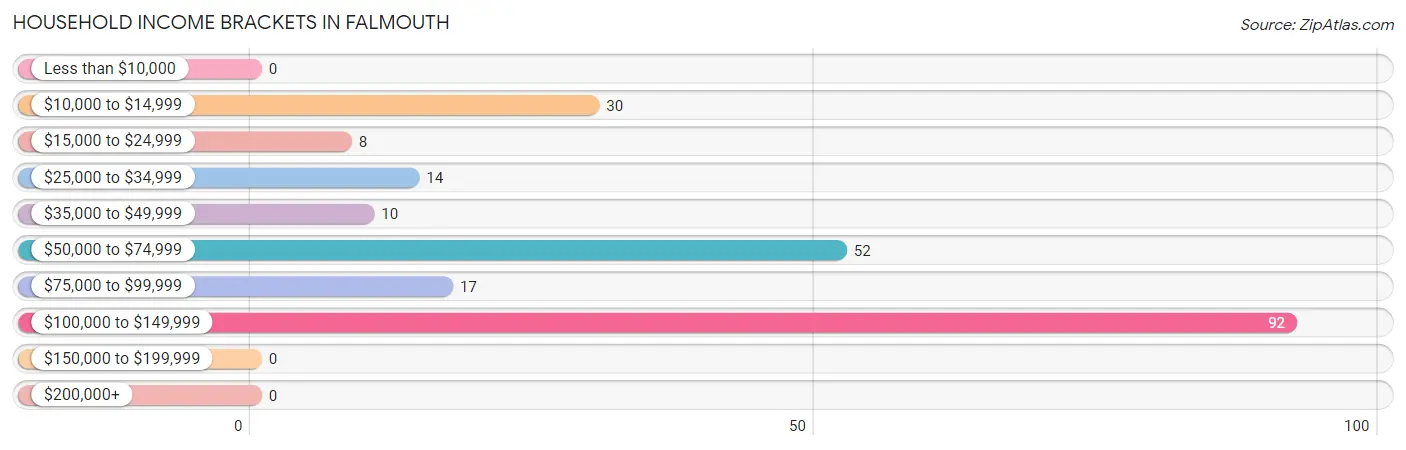
| Income Bracket | # Households | % Households |
| Less than $10,000 | 0 | 0.0% |
| $10,000 to $14,999 | 30 | 13.5% |
| $15,000 to $24,999 | 8 | 3.6% |
| $25,000 to $34,999 | 14 | 6.3% |
| $35,000 to $49,999 | 10 | 4.5% |
| $50,000 to $74,999 | 52 | 23.3% |
| $75,000 to $99,999 | 17 | 7.6% |
| $100,000 to $149,999 | 92 | 41.3% |
| $150,000 to $199,999 | 0 | 0.0% |
| $200,000+ | 0 | 0.0% |
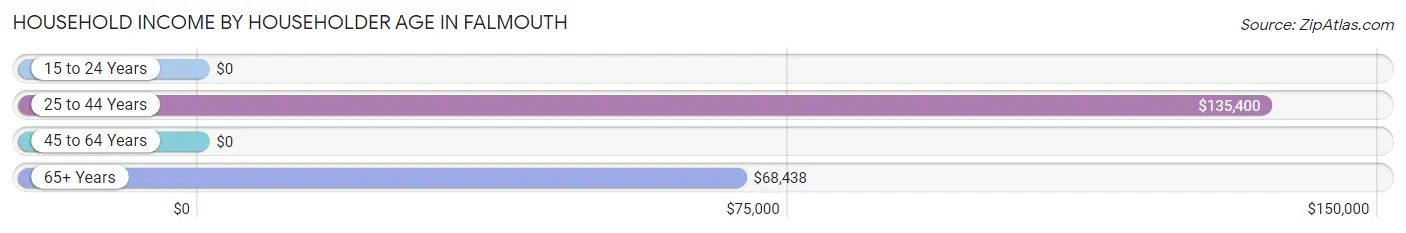
Household Income by Householder Age in Falmouth
The median household income in Falmouth is $71,932, with the highest median household income of $135,400 found in the 25 to 44 years age bracket for the primary householder. A total of 88 households (39.5%) fall into this category.
| Income Bracket | # Households | Median Income |
| 15 to 24 Years | 0 (0.0%) | $0 |
| 25 to 44 Years | 88 (39.5%) | $135,400 |
| 45 to 64 Years | 98 (44.0%) | $0 |
| 65+ Years | 37 (16.6%) | $68,438 |
| Total | 223 (100.0%) | $71,932 |
Poverty in Falmouth
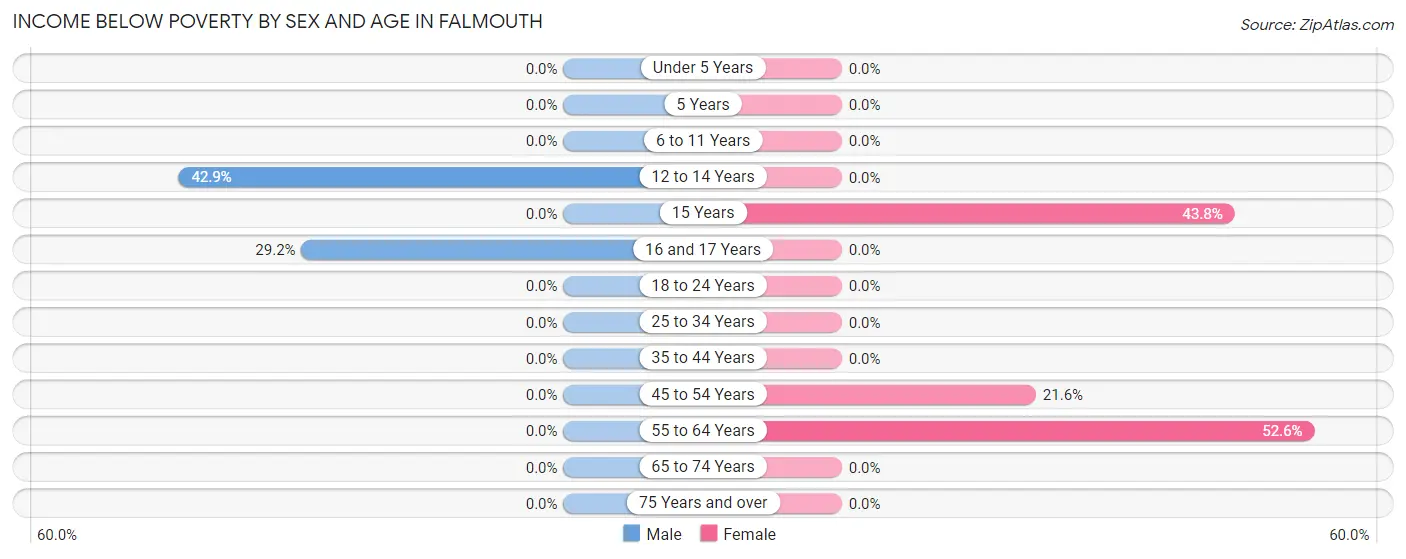
Income Below Poverty by Sex and Age in Falmouth
With 4.7% poverty level for males and 18.8% for females among the residents of Falmouth, 12 to 14 year old males and 55 to 64 year old females are the most vulnerable to poverty, with 6 males (42.9%) and 30 females (52.6%) in their respective age groups living below the poverty level.
| Age Bracket | Male | Female |
| Under 5 Years | 0 (0.0%) | 0 (0.0%) |
| 5 Years | 0 (0.0%) | 0 (0.0%) |
| 6 to 11 Years | 0 (0.0%) | 0 (0.0%) |
| 12 to 14 Years | 6 (42.9%) | 0 (0.0%) |
| 15 Years | 0 (0.0%) | 7 (43.8%) |
| 16 and 17 Years | 7 (29.2%) | 0 (0.0%) |
| 18 to 24 Years | 0 (0.0%) | 0 (0.0%) |
| 25 to 34 Years | 0 (0.0%) | 0 (0.0%) |
| 35 to 44 Years | 0 (0.0%) | 0 (0.0%) |
| 45 to 54 Years | 0 (0.0%) | 8 (21.6%) |
| 55 to 64 Years | 0 (0.0%) | 30 (52.6%) |
| 65 to 74 Years | 0 (0.0%) | 0 (0.0%) |
| 75 Years and over | 0 (0.0%) | 0 (0.0%) |
| Total | 13 (4.7%) | 45 (18.8%) |
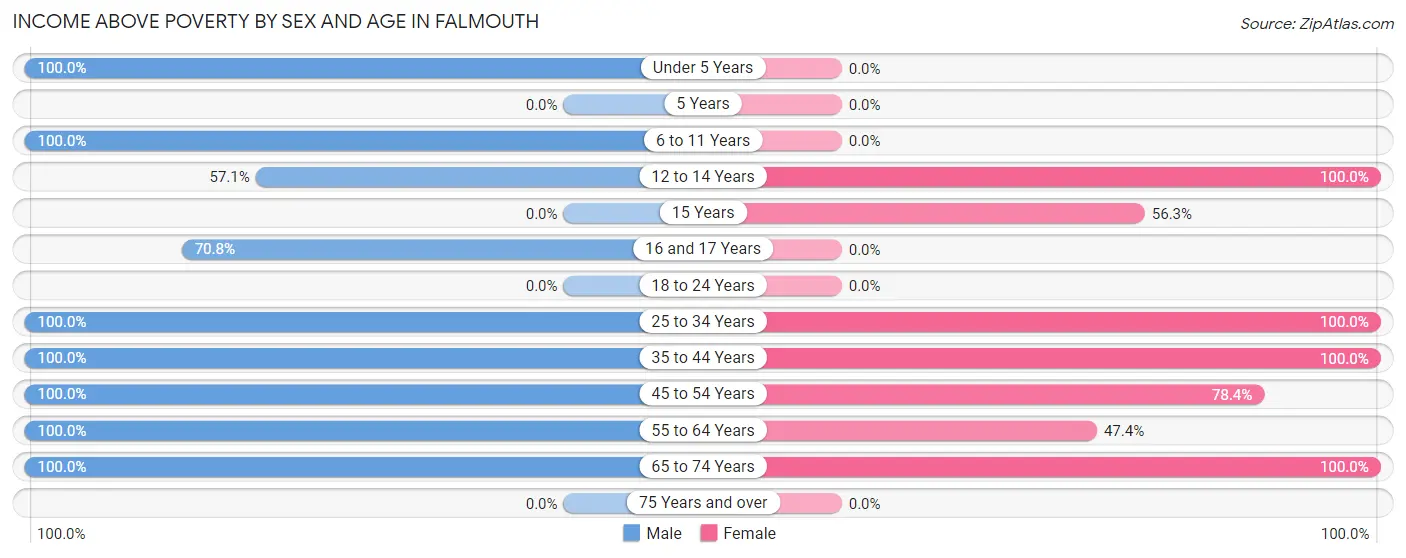
Income Above Poverty by Sex and Age in Falmouth
According to the poverty statistics in Falmouth, males aged under 5 years and females aged 12 to 14 years are the age groups that are most secure financially, with 100.0% of males and 100.0% of females in these age groups living above the poverty line.
| Age Bracket | Male | Female |
| Under 5 Years | 32 (100.0%) | 0 (0.0%) |
| 5 Years | 0 (0.0%) | 0 (0.0%) |
| 6 to 11 Years | 32 (100.0%) | 0 (0.0%) |
| 12 to 14 Years | 8 (57.1%) | 16 (100.0%) |
| 15 Years | 0 (0.0%) | 9 (56.2%) |
| 16 and 17 Years | 17 (70.8%) | 0 (0.0%) |
| 18 to 24 Years | 0 (0.0%) | 0 (0.0%) |
| 25 to 34 Years | 54 (100.0%) | 55 (100.0%) |
| 35 to 44 Years | 36 (100.0%) | 21 (100.0%) |
| 45 to 54 Years | 32 (100.0%) | 29 (78.4%) |
| 55 to 64 Years | 29 (100.0%) | 27 (47.4%) |
| 65 to 74 Years | 26 (100.0%) | 37 (100.0%) |
| 75 Years and over | 0 (0.0%) | 0 (0.0%) |
| Total | 266 (95.3%) | 194 (81.2%) |
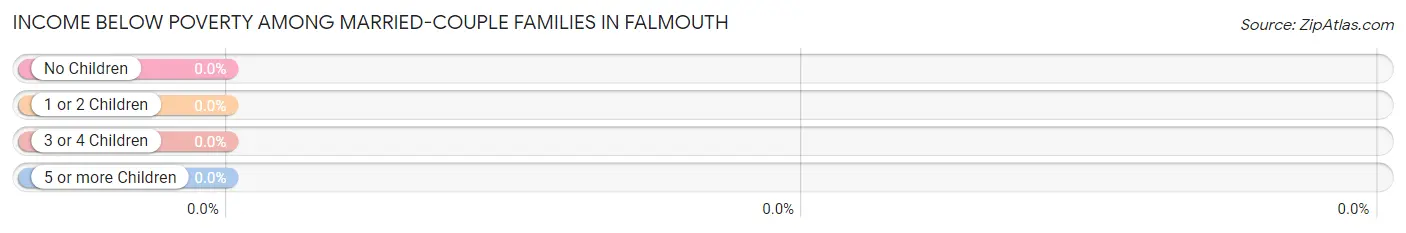
Income Below Poverty Among Married-Couple Families in Falmouth
| Children | Above Poverty | Below Poverty |
| No Children | 55 (100.0%) | 0 (0.0%) |
| 1 or 2 Children | 70 (100.0%) | 0 (0.0%) |
| 3 or 4 Children | 8 (100.0%) | 0 (0.0%) |
| 5 or more Children | 0 (0.0%) | 0 (0.0%) |
| Total | 133 (100.0%) | 0 (0.0%) |
Income Below Poverty Among Single-Parent Households in Falmouth
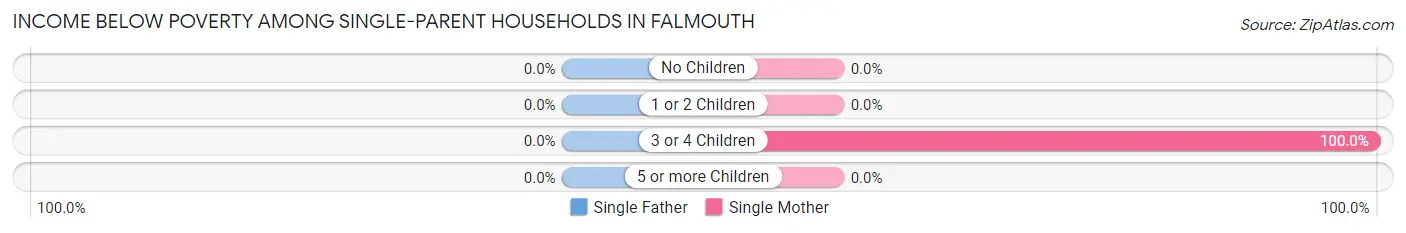
| Children | Single Father | Single Mother |
| No Children | 0 (0.0%) | 0 (0.0%) |
| 1 or 2 Children | 0 (0.0%) | 0 (0.0%) |
| 3 or 4 Children | 0 (0.0%) | 8 (100.0%) |
| 5 or more Children | 0 (0.0%) | 0 (0.0%) |
| Total | 0 (0.0%) | 8 (32.0%) |
Income Below Poverty Among Married-Couple vs Single-Parent Households in Falmouth
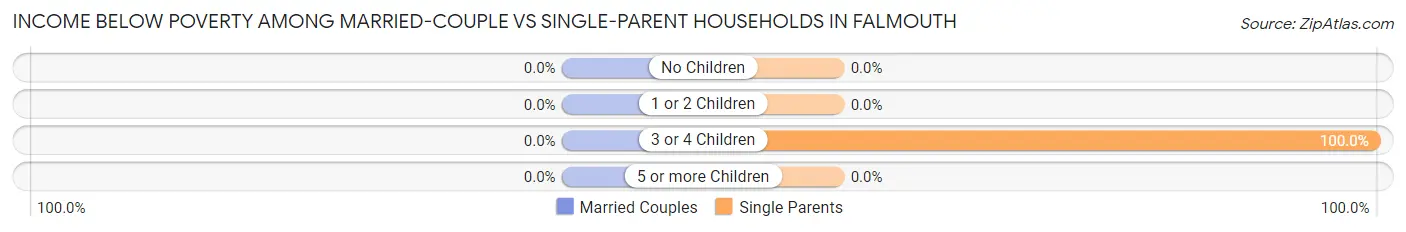
| Children | Married-Couple Families | Single-Parent Households |
| No Children | 0 (0.0%) | 0 (0.0%) |
| 1 or 2 Children | 0 (0.0%) | 0 (0.0%) |
| 3 or 4 Children | 0 (0.0%) | 8 (100.0%) |
| 5 or more Children | 0 (0.0%) | 0 (0.0%) |
| Total | 0 (0.0%) | 8 (32.0%) |
Race in Falmouth
The most populous races in Falmouth are , and White / Caucasian (518 | 100.0%).
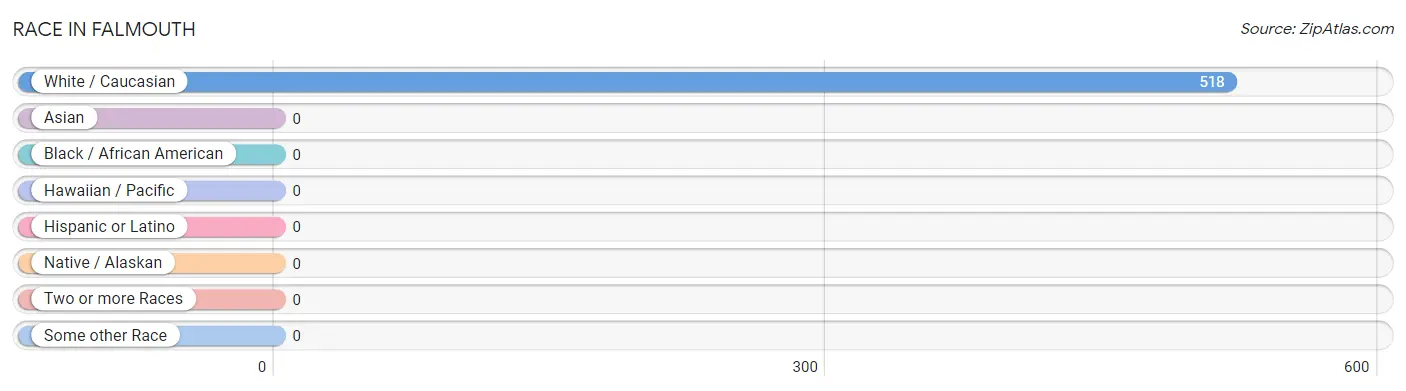
| Race | # Population | % Population |
| Asian | 0 | 0.0% |
| Black / African American | 0 | 0.0% |
| Hawaiian / Pacific | 0 | 0.0% |
| Hispanic or Latino | 0 | 0.0% |
| Native / Alaskan | 0 | 0.0% |
| White / Caucasian | 518 | 100.0% |
| Two or more Races | 0 | 0.0% |
| Some other Race | 0 | 0.0% |
| Total | 518 | 100.0% |
Ancestry in Falmouth
The most populous ancestries reported in Falmouth are German (322 | 62.2%), French (71 | 13.7%), Irish (68 | 13.1%), English (47 | 9.1%), and Italian (43 | 8.3%), together accounting for 106.4% of all Falmouth residents.
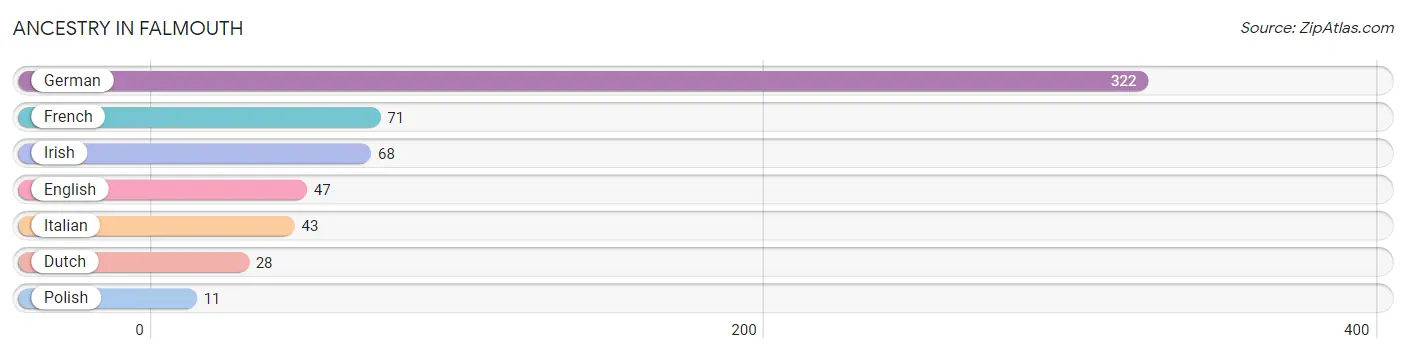
| Ancestry | # Population | % Population |
| Dutch | 28 | 5.4% |
| English | 47 | 9.1% |
| French | 71 | 13.7% |
| German | 322 | 62.2% |
| Irish | 68 | 13.1% |
| Italian | 43 | 8.3% |
| Polish | 11 | 2.1% | View All 7 Rows |
Immigrants in Falmouth

| Immigration Origin | # Population | % Population | View All 0 Rows |
Sex and Age in Falmouth
Sex and Age in Falmouth
The most populous age groups in Falmouth are 30 to 34 Years (44 | 15.8%) for men and 55 to 59 Years (57 | 23.8%) for women.
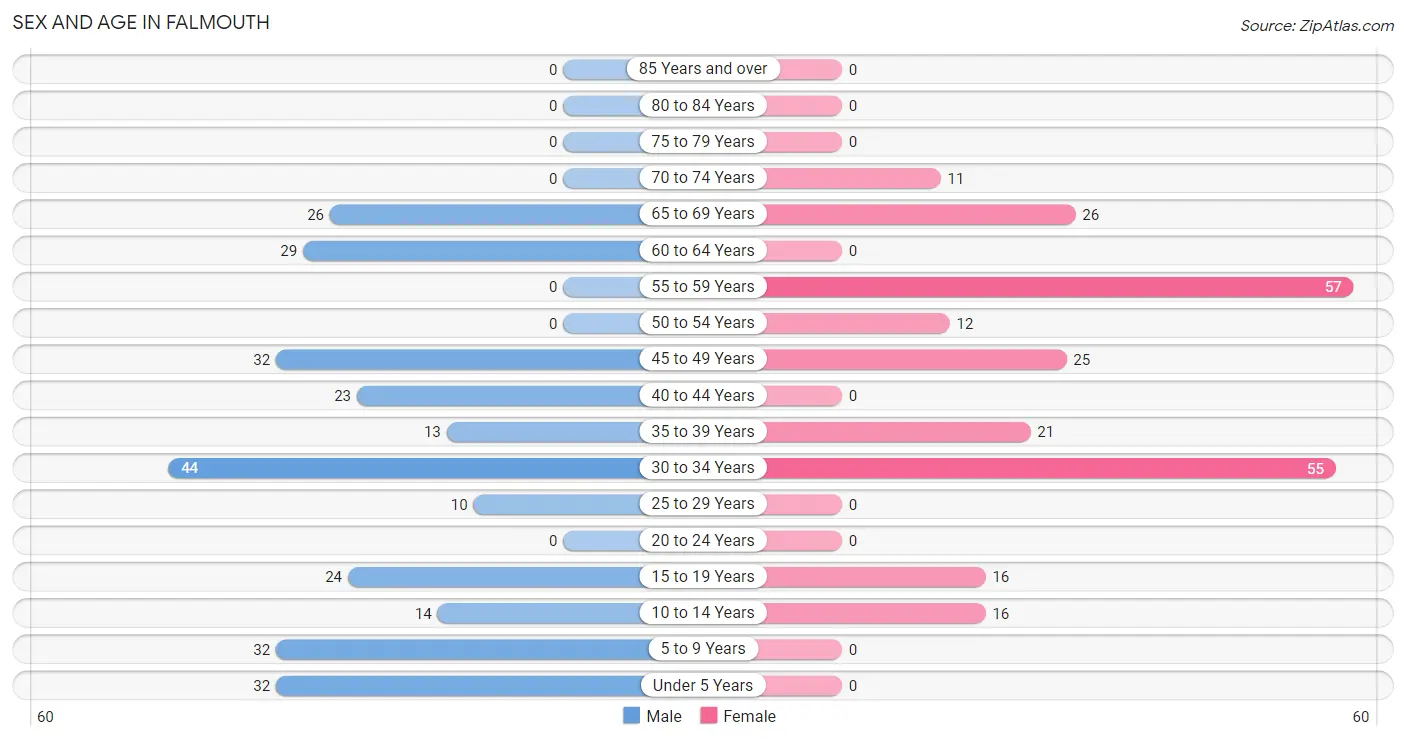
| Age Bracket | Male | Female |
| Under 5 Years | 32 (11.5%) | 0 (0.0%) |
| 5 to 9 Years | 32 (11.5%) | 0 (0.0%) |
| 10 to 14 Years | 14 (5.0%) | 16 (6.7%) |
| 15 to 19 Years | 24 (8.6%) | 16 (6.7%) |
| 20 to 24 Years | 0 (0.0%) | 0 (0.0%) |
| 25 to 29 Years | 10 (3.6%) | 0 (0.0%) |
| 30 to 34 Years | 44 (15.8%) | 55 (23.0%) |
| 35 to 39 Years | 13 (4.7%) | 21 (8.8%) |
| 40 to 44 Years | 23 (8.2%) | 0 (0.0%) |
| 45 to 49 Years | 32 (11.5%) | 25 (10.5%) |
| 50 to 54 Years | 0 (0.0%) | 12 (5.0%) |
| 55 to 59 Years | 0 (0.0%) | 57 (23.8%) |
| 60 to 64 Years | 29 (10.4%) | 0 (0.0%) |
| 65 to 69 Years | 26 (9.3%) | 26 (10.9%) |
| 70 to 74 Years | 0 (0.0%) | 11 (4.6%) |
| 75 to 79 Years | 0 (0.0%) | 0 (0.0%) |
| 80 to 84 Years | 0 (0.0%) | 0 (0.0%) |
| 85 Years and over | 0 (0.0%) | 0 (0.0%) |
| Total | 279 (100.0%) | 239 (100.0%) |
Families and Households in Falmouth
Median Family Size in Falmouth
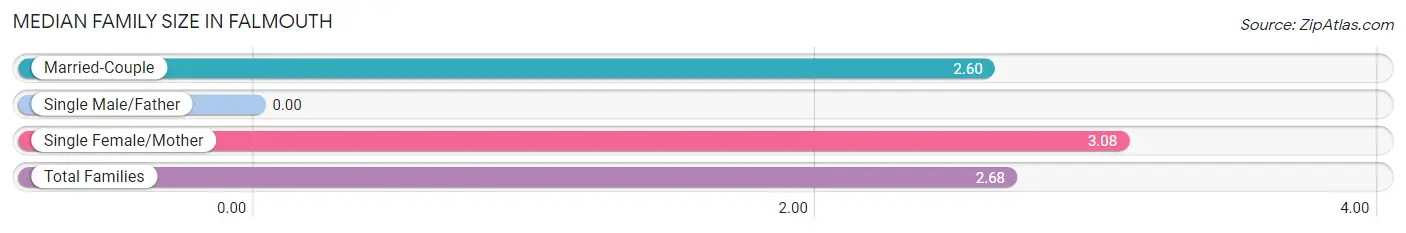
| Family Type | # Families | Family Size |
| Married-Couple | 133 (84.2%) | 2.60 |
| Single Male/Father | 0 (0.0%) | - |
| Single Female/Mother | 25 (15.8%) | 3.08 |
| Total Families | 158 (100.0%) | 2.68 |
Median Household Size in Falmouth
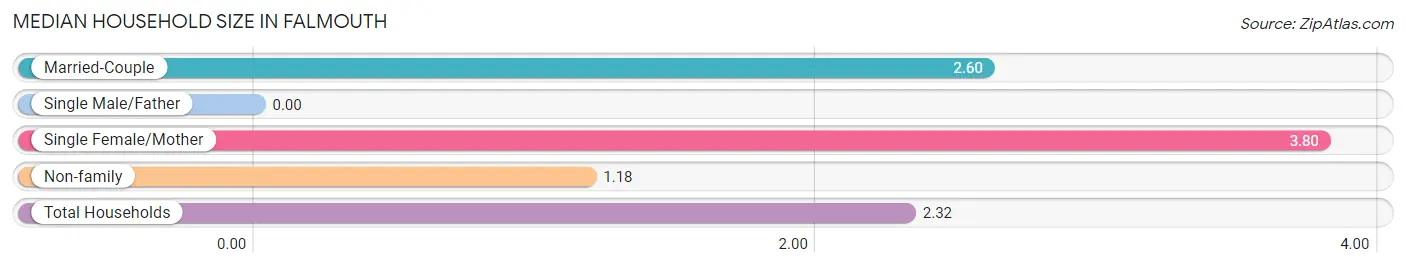
| Household Type | # Households | Household Size |
| Married-Couple | 133 (59.6%) | 2.60 |
| Single Male/Father | 0 (0.0%) | - |
| Single Female/Mother | 25 (11.2%) | 3.80 |
| Non-family | 65 (29.1%) | 1.18 |
| Total Households | 223 (100.0%) | 2.32 |
Household Size by Marriage Status in Falmouth
Out of a total of 223 households in Falmouth, 158 (70.9%) are family households, while 65 (29.1%) are nonfamily households. The most numerous type of family households are 3-person households, comprising 70, and the most common type of nonfamily households are 1-person households, comprising 51.
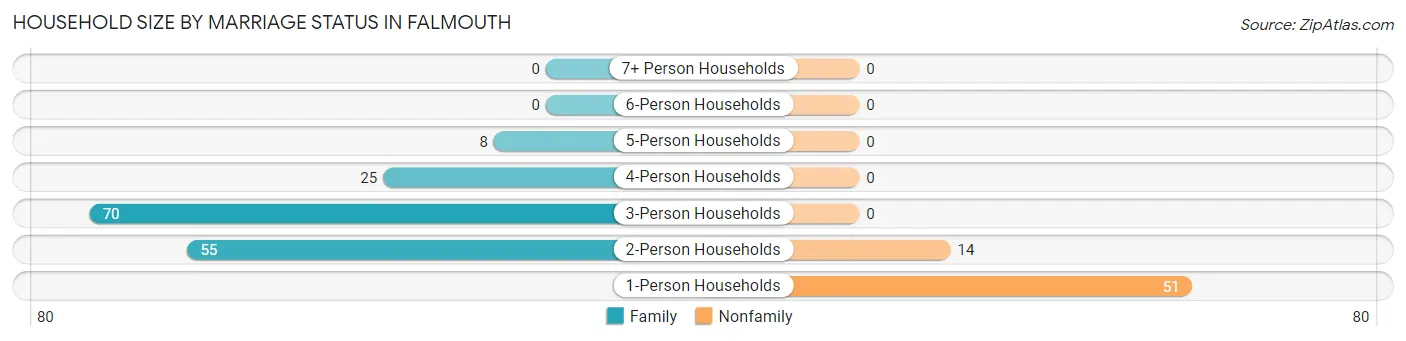
| Household Size | Family Households | Nonfamily Households |
| 1-Person Households | - | 51 (22.9%) |
| 2-Person Households | 55 (24.7%) | 14 (6.3%) |
| 3-Person Households | 70 (31.4%) | 0 (0.0%) |
| 4-Person Households | 25 (11.2%) | 0 (0.0%) |
| 5-Person Households | 8 (3.6%) | 0 (0.0%) |
| 6-Person Households | 0 (0.0%) | 0 (0.0%) |
| 7+ Person Households | 0 (0.0%) | 0 (0.0%) |
| Total | 158 (70.9%) | 65 (29.1%) |
Female Fertility in Falmouth
Fertility by Age in Falmouth
Average fertility rate in Falmouth is 325.0 births per 1,000 women. Women in the age bracket of 20 to 34 years have the highest fertility rate with 691.0 births per 1,000 women. Women in the age bracket of 20 to 34 years acount for 100.0% of all women with births.
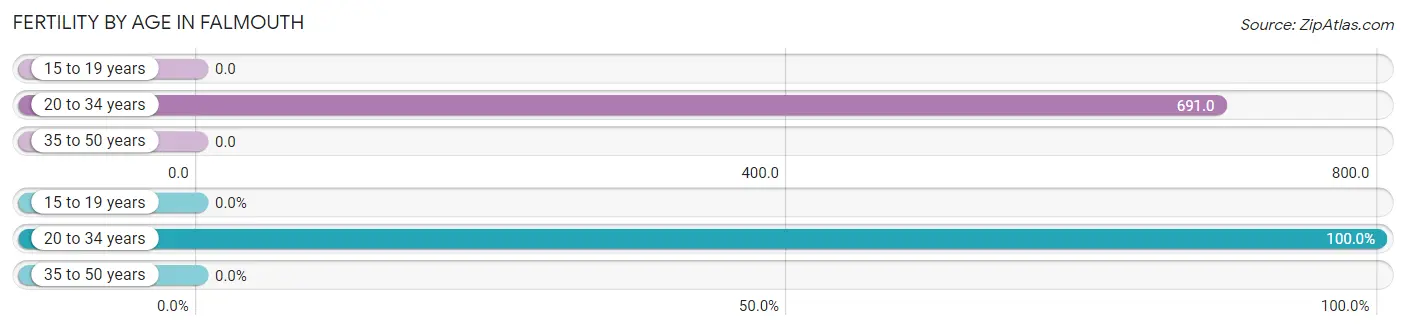
| Age Bracket | Women with Births | Births / 1,000 Women |
| 15 to 19 years | 0 (0.0%) | 0.0 |
| 20 to 34 years | 38 (100.0%) | 691.0 |
| 35 to 50 years | 0 (0.0%) | 0.0 |
| Total | 38 (100.0%) | 325.0 |
Fertility by Age by Marriage Status in Falmouth
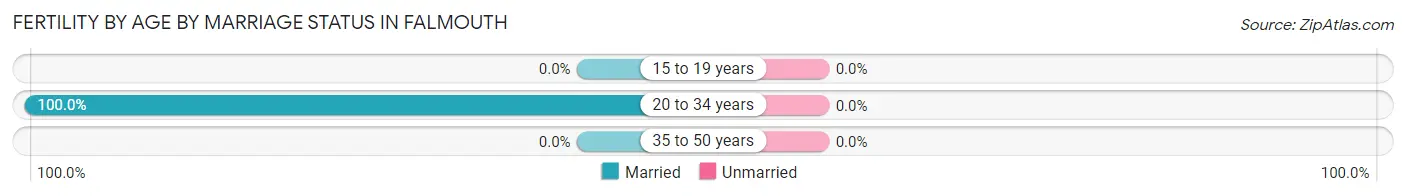
| Age Bracket | Married | Unmarried |
| 15 to 19 years | 0 (0.0%) | 0 (0.0%) |
| 20 to 34 years | 38 (100.0%) | 0 (0.0%) |
| 35 to 50 years | 0 (0.0%) | 0 (0.0%) |
| Total | 38 (100.0%) | 0 (0.0%) |
Fertility by Education in Falmouth
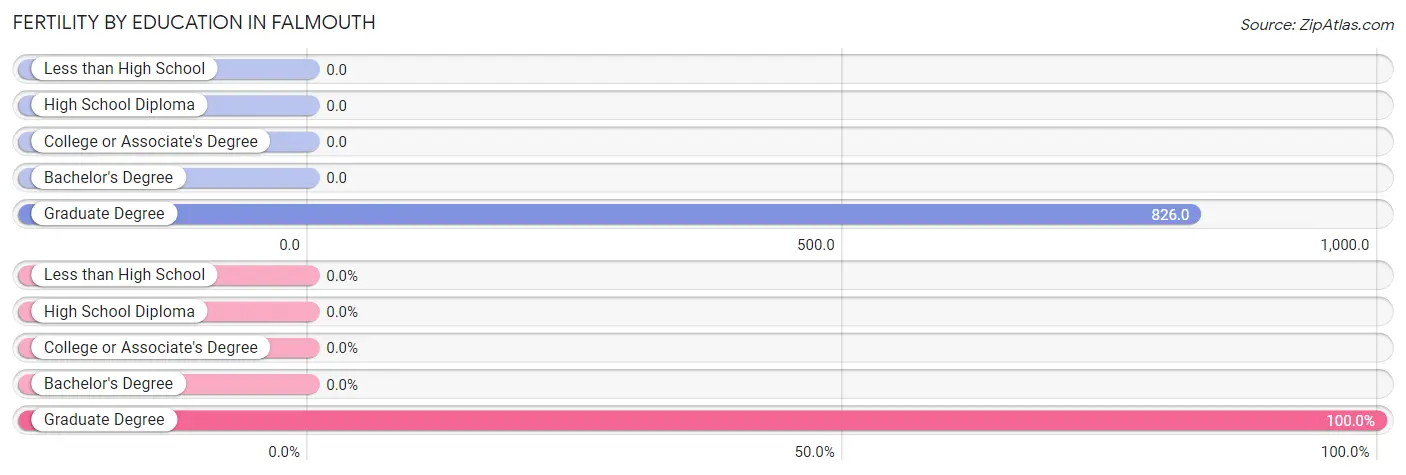
| Educational Attainment | Women with Births | Births / 1,000 Women |
| Less than High School | 0 (0.0%) | 0.0 |
| High School Diploma | 0 (0.0%) | 0.0 |
| College or Associate's Degree | 0 (0.0%) | 0.0 |
| Bachelor's Degree | 0 (0.0%) | 0.0 |
| Graduate Degree | 38 (100.0%) | 826.0 |
| Total | 38 (100.0%) | 325.0 |
Fertility by Education by Marriage Status in Falmouth
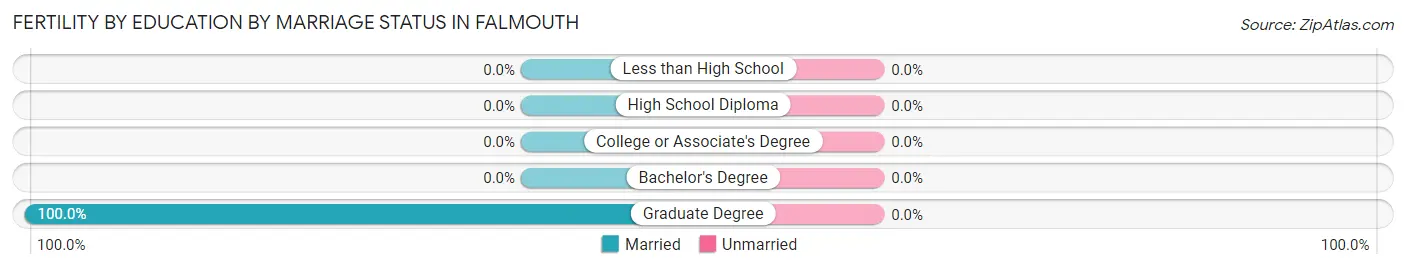
| Educational Attainment | Married | Unmarried |
| Less than High School | 0 (0.0%) | 0 (0.0%) |
| High School Diploma | 0 (0.0%) | 0 (0.0%) |
| College or Associate's Degree | 0 (0.0%) | 0 (0.0%) |
| Bachelor's Degree | 0 (0.0%) | 0 (0.0%) |
| Graduate Degree | 38 (100.0%) | 0 (0.0%) |
| Total | 38 (100.0%) | 0 (0.0%) |
Employment Characteristics in Falmouth
Employment by Class of Employer in Falmouth
Among the 252 employed individuals in Falmouth, private company employees (206 | 81.8%), state government employees (25 | 9.9%), and local government employees (13 | 5.2%) make up the most common classes of employment.
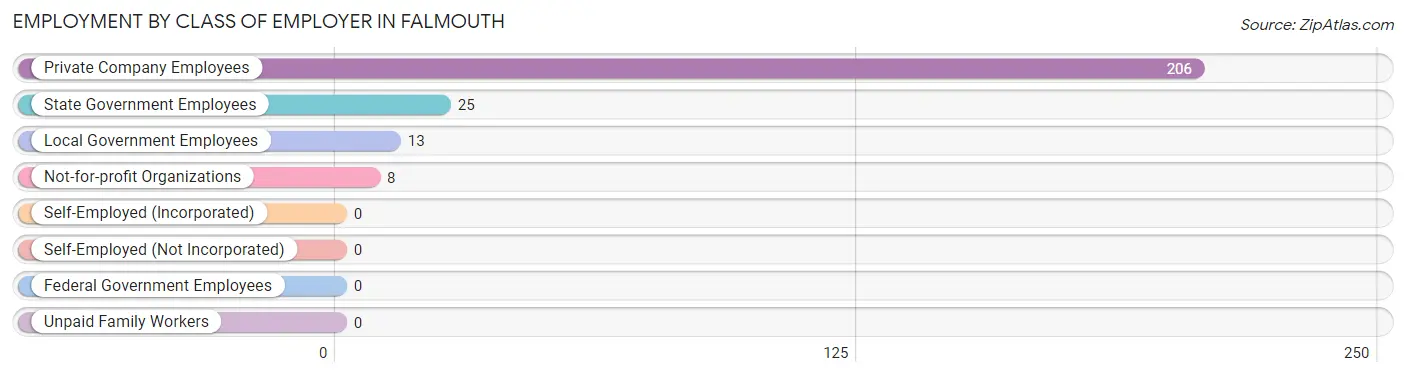
| Employer Class | # Employees | % Employees |
| Private Company Employees | 206 | 81.8% |
| Self-Employed (Incorporated) | 0 | 0.0% |
| Self-Employed (Not Incorporated) | 0 | 0.0% |
| Not-for-profit Organizations | 8 | 3.2% |
| Local Government Employees | 13 | 5.2% |
| State Government Employees | 25 | 9.9% |
| Federal Government Employees | 0 | 0.0% |
| Unpaid Family Workers | 0 | 0.0% |
| Total | 252 | 100.0% |
Employment Status by Age in Falmouth
According to the labor force statistics for Falmouth, out of the total population over 16 years of age (408), 63.7% or 260 individuals are in the labor force, with 3.1% or 8 of them unemployed. The age group with the highest labor force participation rate is 30 to 34 years, with 100.0% or 99 individuals in the labor force. Within the labor force, the 45 to 54 years age range has the highest percentage of unemployed individuals, with 11.6% or 8 of them being unemployed.
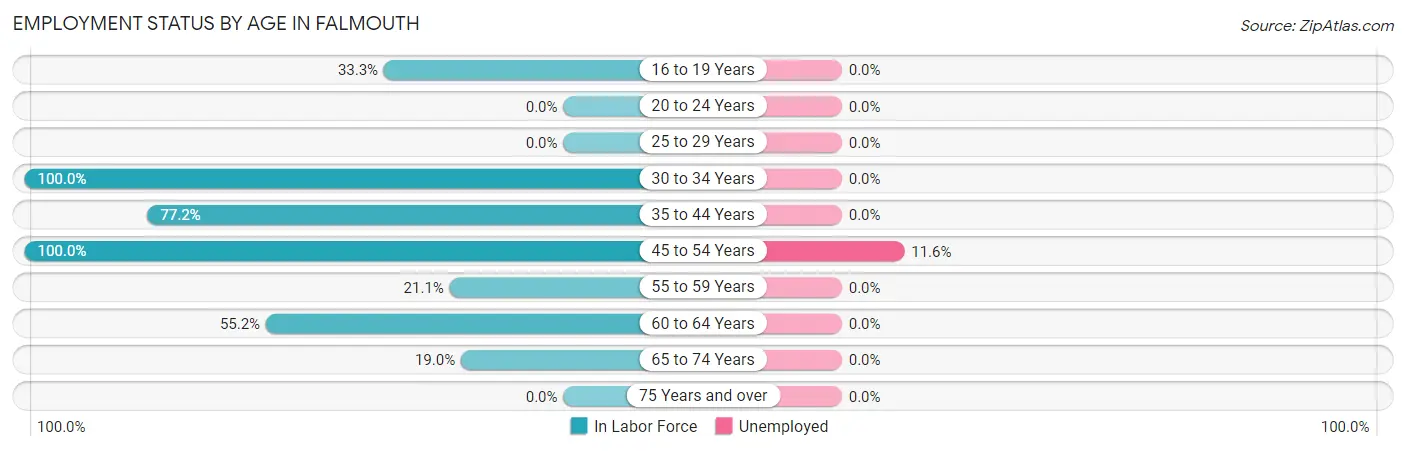
| Age Bracket | In Labor Force | Unemployed |
| 16 to 19 Years | 8 (33.3%) | 0 (0.0%) |
| 20 to 24 Years | 0 (0.0%) | 0 (0.0%) |
| 25 to 29 Years | 0 (0.0%) | 0 (0.0%) |
| 30 to 34 Years | 99 (100.0%) | 0 (0.0%) |
| 35 to 44 Years | 44 (77.2%) | 0 (0.0%) |
| 45 to 54 Years | 69 (100.0%) | 8 (11.6%) |
| 55 to 59 Years | 12 (21.1%) | 0 (0.0%) |
| 60 to 64 Years | 16 (55.2%) | 0 (0.0%) |
| 65 to 74 Years | 12 (19.0%) | 0 (0.0%) |
| 75 Years and over | 0 (0.0%) | 0 (0.0%) |
| Total | 260 (63.7%) | 8 (3.1%) |
Employment Status by Educational Attainment in Falmouth
According to labor force statistics for Falmouth, 74.8% of individuals (240) out of the total population between 25 and 64 years of age (321) are in the labor force, with 3.3% or 8 of them being unemployed. The group with the highest labor force participation rate are those with the educational attainment of bachelor's degree or higher, with 100.0% or 66 individuals in the labor force. Within the labor force, individuals with bachelor's degree or higher education have the highest percentage of unemployment, with 12.1% or 8 of them being unemployed.
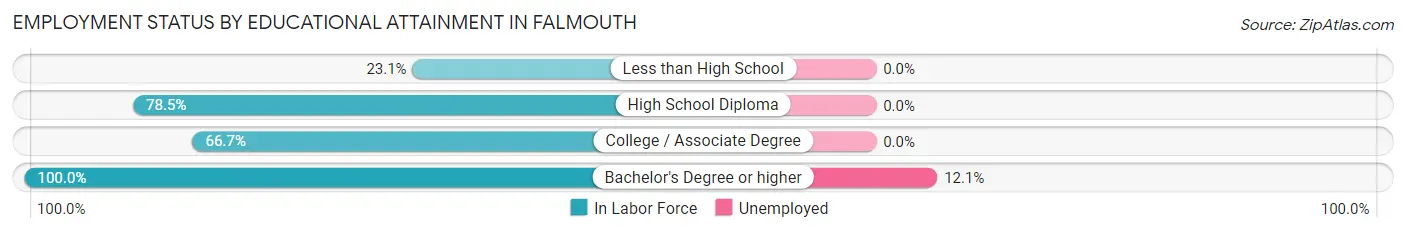
| Educational Attainment | In Labor Force | Unemployed |
| Less than High School | 9 (23.1%) | 0 (0.0%) |
| High School Diploma | 139 (78.5%) | 0 (0.0%) |
| College / Associate Degree | 26 (66.7%) | 0 (0.0%) |
| Bachelor's Degree or higher | 66 (100.0%) | 8 (12.1%) |
| Total | 240 (74.8%) | 11 (3.3%) |
Employment Occupations by Sex in Falmouth
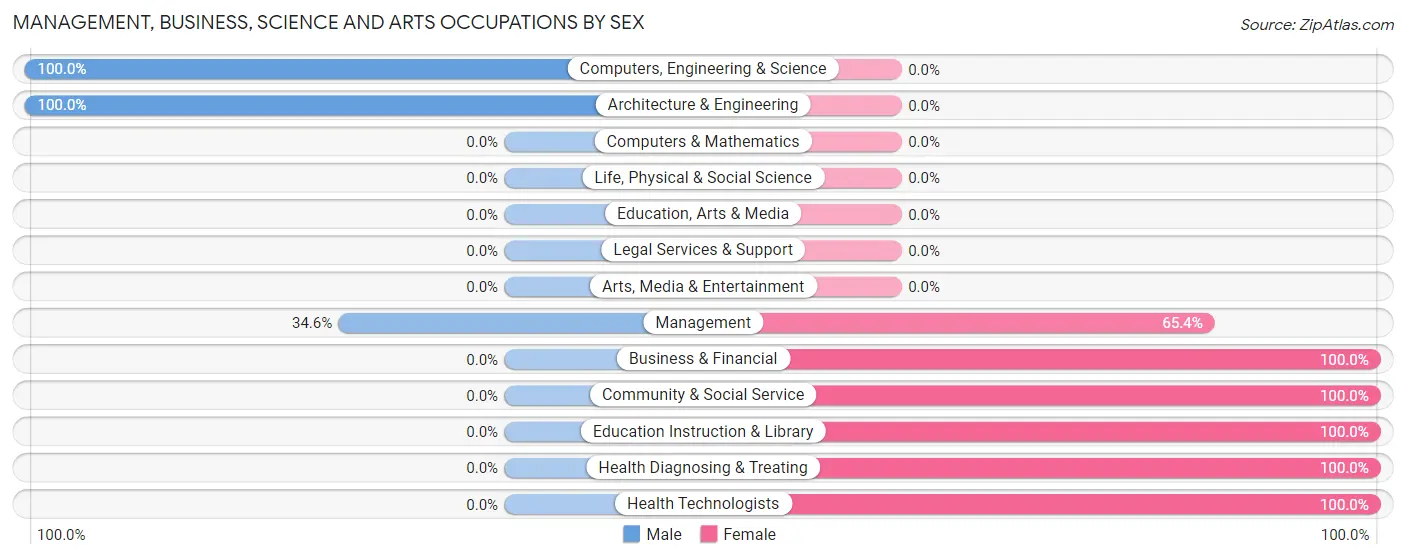
Management, Business, Science and Arts Occupations
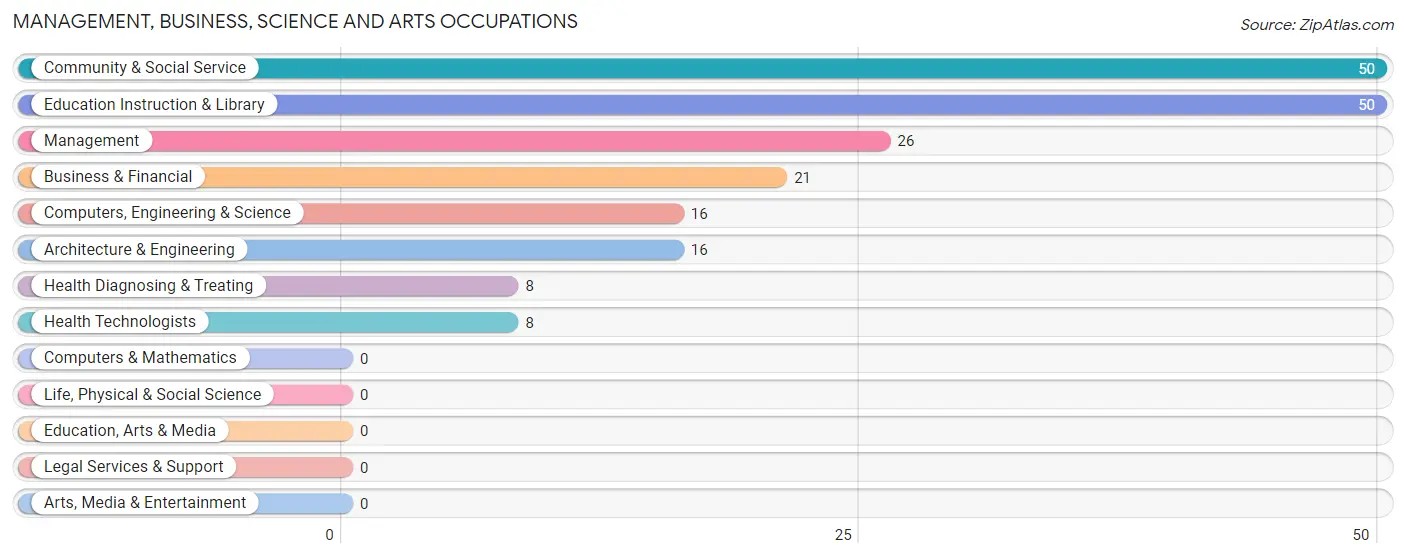
The most common Management, Business, Science and Arts occupations in Falmouth are Community & Social Service (50 | 19.8%), Education Instruction & Library (50 | 19.8%), Management (26 | 10.3%), Business & Financial (21 | 8.3%), and Computers, Engineering & Science (16 | 6.4%).
Management, Business, Science and Arts Occupations by Sex
Within the Management, Business, Science and Arts occupations in Falmouth, the most male-oriented occupations are Computers, Engineering & Science (100.0%), Architecture & Engineering (100.0%), and Management (34.6%), while the most female-oriented occupations are Business & Financial (100.0%), Community & Social Service (100.0%), and Education Instruction & Library (100.0%).
| Occupation | Male | Female |
| Management | 9 (34.6%) | 17 (65.4%) |
| Business & Financial | 0 (0.0%) | 21 (100.0%) |
| Computers, Engineering & Science | 16 (100.0%) | 0 (0.0%) |
| Computers & Mathematics | 0 (0.0%) | 0 (0.0%) |
| Architecture & Engineering | 16 (100.0%) | 0 (0.0%) |
| Life, Physical & Social Science | 0 (0.0%) | 0 (0.0%) |
| Community & Social Service | 0 (0.0%) | 50 (100.0%) |
| Education, Arts & Media | 0 (0.0%) | 0 (0.0%) |
| Legal Services & Support | 0 (0.0%) | 0 (0.0%) |
| Education Instruction & Library | 0 (0.0%) | 50 (100.0%) |
| Arts, Media & Entertainment | 0 (0.0%) | 0 (0.0%) |
| Health Diagnosing & Treating | 0 (0.0%) | 8 (100.0%) |
| Health Technologists | 0 (0.0%) | 8 (100.0%) |
| Total (Category) | 25 (20.7%) | 96 (79.3%) |
| Total (Overall) | 135 (53.6%) | 117 (46.4%) |
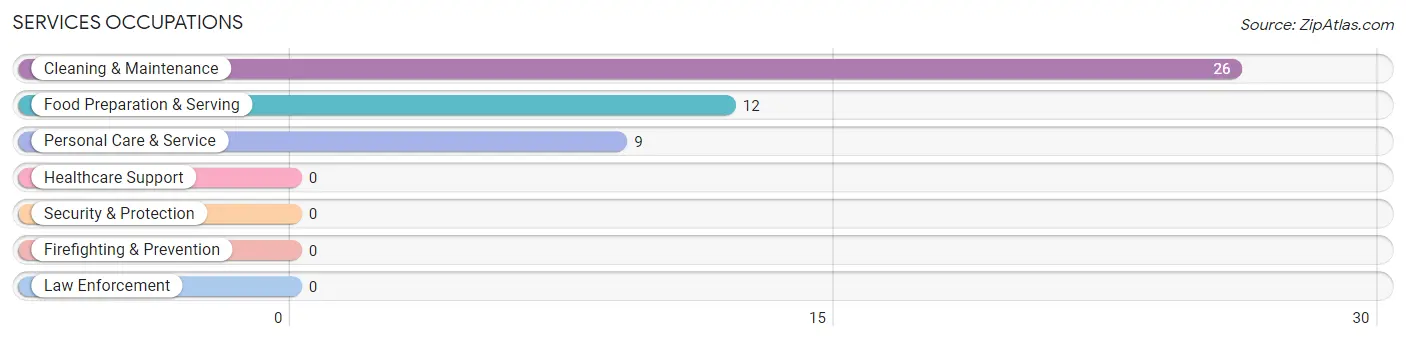
Services Occupations
The most common Services occupations in Falmouth are Cleaning & Maintenance (26 | 10.3%), Food Preparation & Serving (12 | 4.8%), and Personal Care & Service (9 | 3.6%).
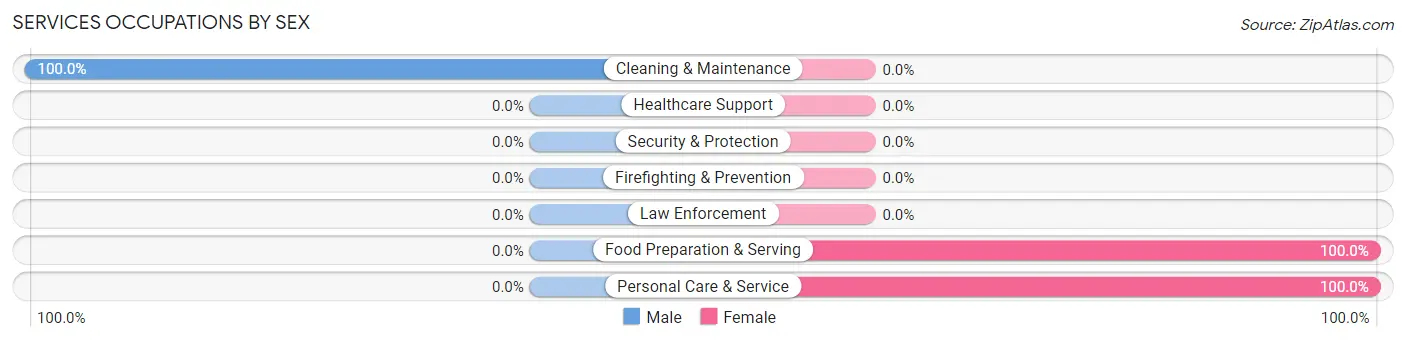
Services Occupations by Sex
| Occupation | Male | Female |
| Healthcare Support | 0 (0.0%) | 0 (0.0%) |
| Security & Protection | 0 (0.0%) | 0 (0.0%) |
| Firefighting & Prevention | 0 (0.0%) | 0 (0.0%) |
| Law Enforcement | 0 (0.0%) | 0 (0.0%) |
| Food Preparation & Serving | 0 (0.0%) | 12 (100.0%) |
| Cleaning & Maintenance | 26 (100.0%) | 0 (0.0%) |
| Personal Care & Service | 0 (0.0%) | 9 (100.0%) |
| Total (Category) | 26 (55.3%) | 21 (44.7%) |
| Total (Overall) | 135 (53.6%) | 117 (46.4%) |
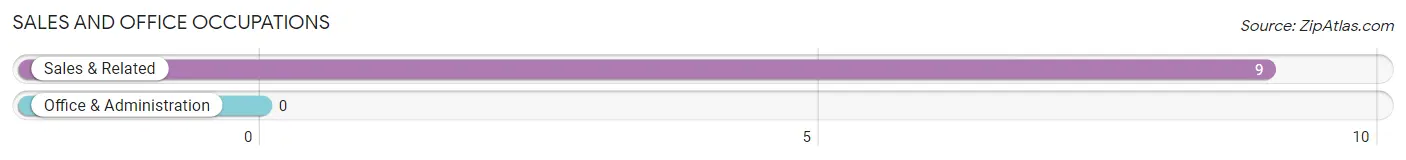
Sales and Office Occupations
The most common Sales and Office occupations in Falmouth are , and Sales & Related (9 | 3.6%).
Sales and Office Occupations by Sex

| Occupation | Male | Female |
| Sales & Related | 9 (100.0%) | 0 (0.0%) |
| Office & Administration | 0 (0.0%) | 0 (0.0%) |
| Total (Category) | 9 (100.0%) | 0 (0.0%) |
| Total (Overall) | 135 (53.6%) | 117 (46.4%) |
Natural Resources, Construction and Maintenance Occupations
The most common Natural Resources, Construction and Maintenance occupations in Falmouth are , and Construction & Extraction (18 | 7.1%).
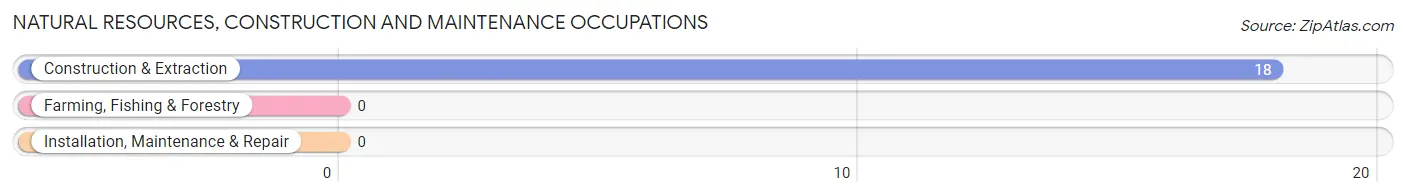
Natural Resources, Construction and Maintenance Occupations by Sex
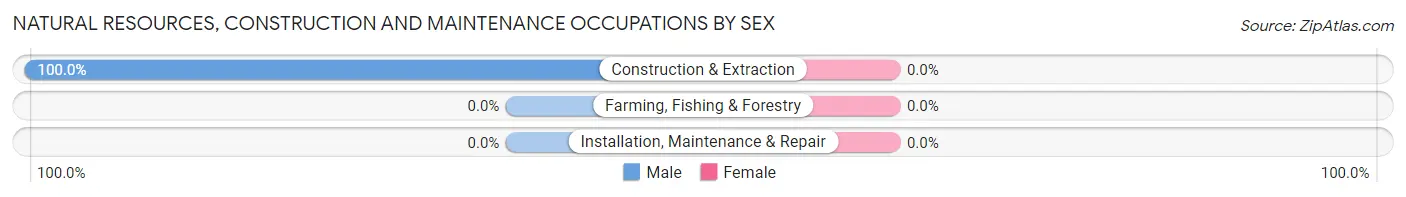
| Occupation | Male | Female |
| Farming, Fishing & Forestry | 0 (0.0%) | 0 (0.0%) |
| Construction & Extraction | 18 (100.0%) | 0 (0.0%) |
| Installation, Maintenance & Repair | 0 (0.0%) | 0 (0.0%) |
| Total (Category) | 18 (100.0%) | 0 (0.0%) |
| Total (Overall) | 135 (53.6%) | 117 (46.4%) |
Production, Transportation and Moving Occupations
The most common Production, Transportation and Moving occupations in Falmouth are Production (35 | 13.9%), and Material Moving (22 | 8.7%).
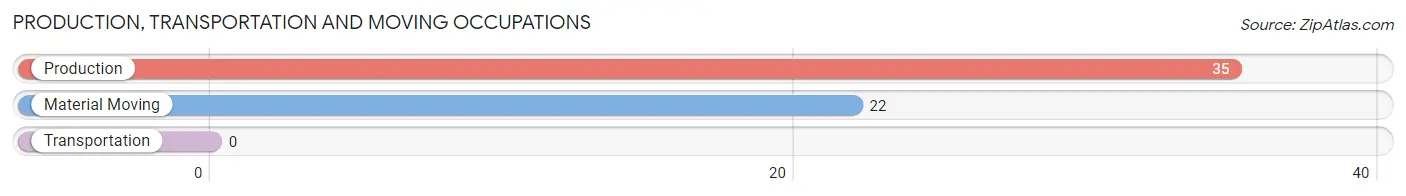
Production, Transportation and Moving Occupations by Sex
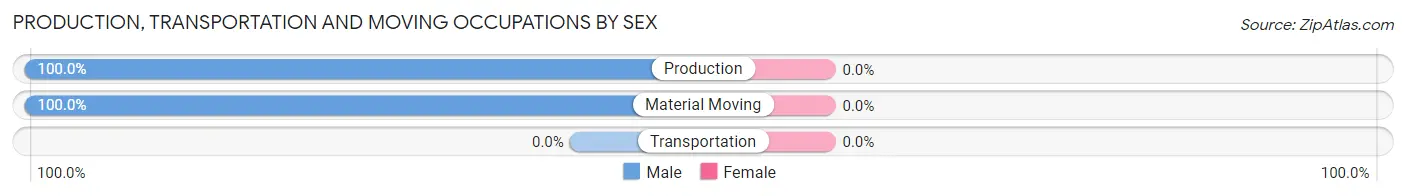
| Occupation | Male | Female |
| Production | 35 (100.0%) | 0 (0.0%) |
| Transportation | 0 (0.0%) | 0 (0.0%) |
| Material Moving | 22 (100.0%) | 0 (0.0%) |
| Total (Category) | 57 (100.0%) | 0 (0.0%) |
| Total (Overall) | 135 (53.6%) | 117 (46.4%) |
Employment Industries by Sex in Falmouth
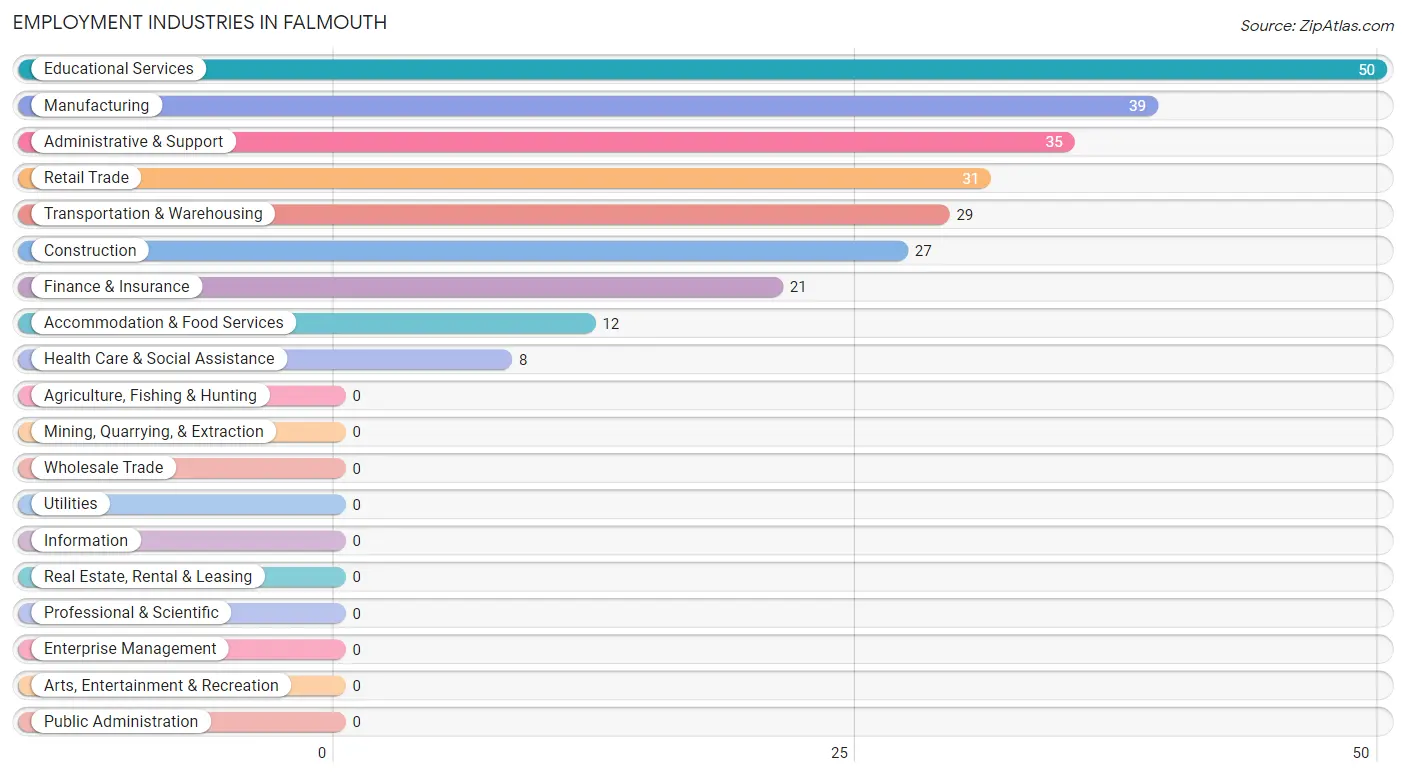
Employment Industries in Falmouth
The major employment industries in Falmouth include Educational Services (50 | 19.8%), Manufacturing (39 | 15.5%), Administrative & Support (35 | 13.9%), Retail Trade (31 | 12.3%), and Transportation & Warehousing (29 | 11.5%).
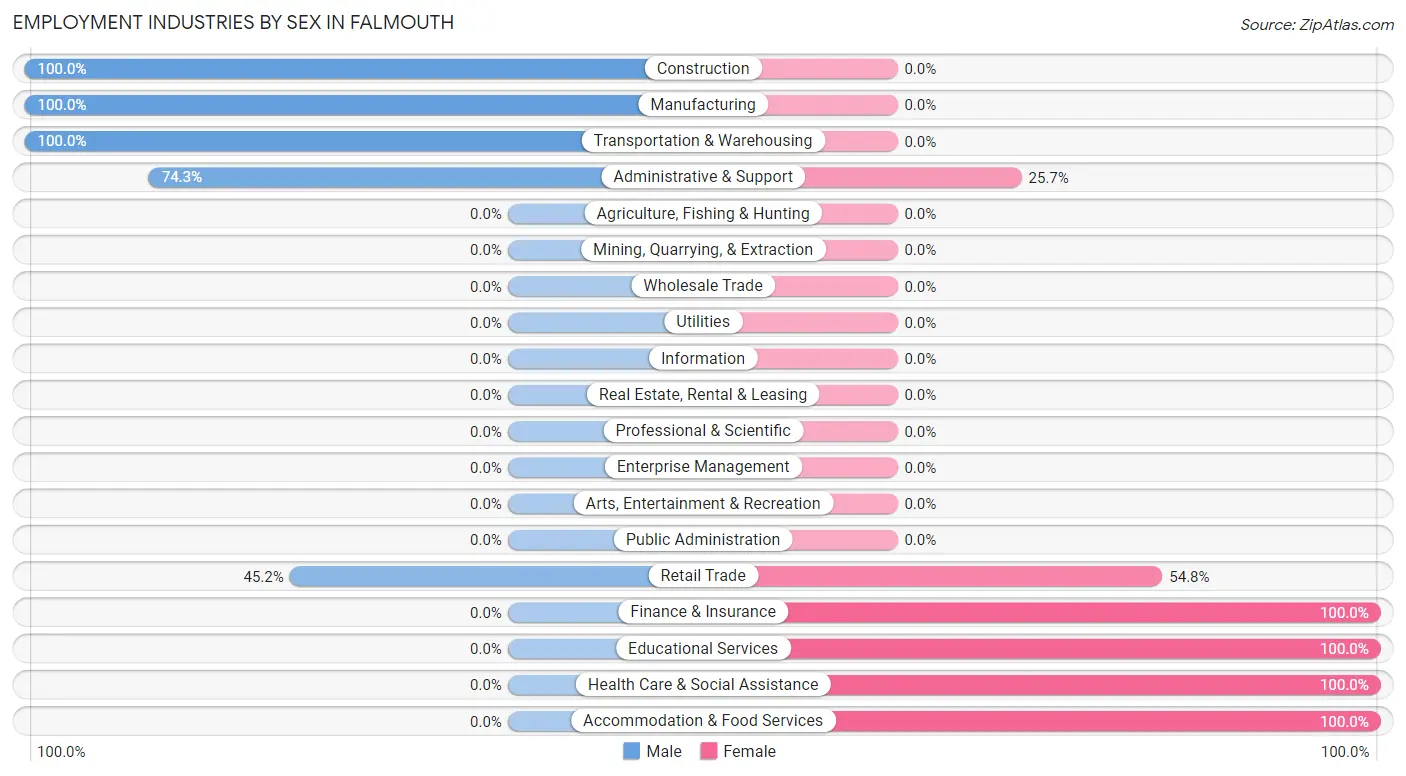
Employment Industries by Sex in Falmouth
The Falmouth industries that see more men than women are Construction (100.0%), Manufacturing (100.0%), and Transportation & Warehousing (100.0%), whereas the industries that tend to have a higher number of women are Finance & Insurance (100.0%), Educational Services (100.0%), and Health Care & Social Assistance (100.0%).
| Industry | Male | Female |
| Agriculture, Fishing & Hunting | 0 (0.0%) | 0 (0.0%) |
| Mining, Quarrying, & Extraction | 0 (0.0%) | 0 (0.0%) |
| Construction | 27 (100.0%) | 0 (0.0%) |
| Manufacturing | 39 (100.0%) | 0 (0.0%) |
| Wholesale Trade | 0 (0.0%) | 0 (0.0%) |
| Retail Trade | 14 (45.2%) | 17 (54.8%) |
| Transportation & Warehousing | 29 (100.0%) | 0 (0.0%) |
| Utilities | 0 (0.0%) | 0 (0.0%) |
| Information | 0 (0.0%) | 0 (0.0%) |
| Finance & Insurance | 0 (0.0%) | 21 (100.0%) |
| Real Estate, Rental & Leasing | 0 (0.0%) | 0 (0.0%) |
| Professional & Scientific | 0 (0.0%) | 0 (0.0%) |
| Enterprise Management | 0 (0.0%) | 0 (0.0%) |
| Administrative & Support | 26 (74.3%) | 9 (25.7%) |
| Educational Services | 0 (0.0%) | 50 (100.0%) |
| Health Care & Social Assistance | 0 (0.0%) | 8 (100.0%) |
| Arts, Entertainment & Recreation | 0 (0.0%) | 0 (0.0%) |
| Accommodation & Food Services | 0 (0.0%) | 12 (100.0%) |
| Public Administration | 0 (0.0%) | 0 (0.0%) |
| Total | 135 (53.6%) | 117 (46.4%) |
Education in Falmouth
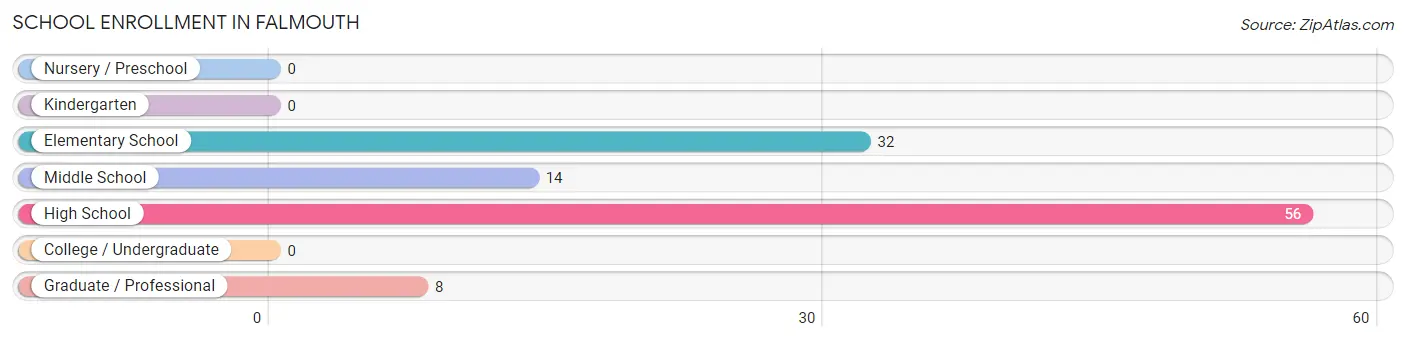
School Enrollment in Falmouth
The most common levels of schooling among the 110 students in Falmouth are high school (56 | 50.9%), elementary school (32 | 29.1%), and middle school (14 | 12.7%).
| School Level | # Students | % Students |
| Nursery / Preschool | 0 | 0.0% |
| Kindergarten | 0 | 0.0% |
| Elementary School | 32 | 29.1% |
| Middle School | 14 | 12.7% |
| High School | 56 | 50.9% |
| College / Undergraduate | 0 | 0.0% |
| Graduate / Professional | 8 | 7.3% |
| Total | 110 | 100.0% |
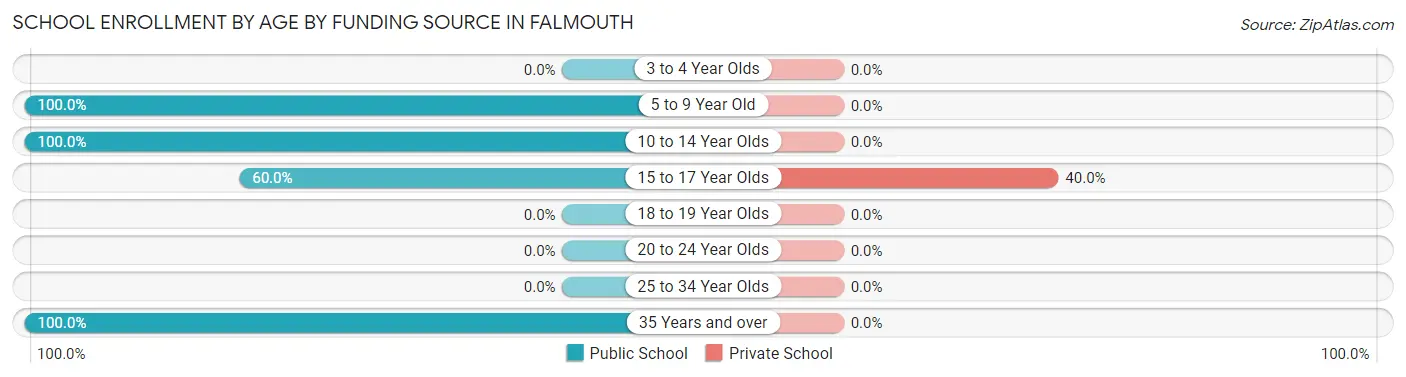
School Enrollment by Age by Funding Source in Falmouth
Out of a total of 110 students who are enrolled in schools in Falmouth, 16 (14.5%) attend a private institution, while the remaining 94 (85.5%) are enrolled in public schools. The age group of 15 to 17 year olds has the highest likelihood of being enrolled in private schools, with 16 (40.0% in the age bracket) enrolled. Conversely, the age group of 5 to 9 year old has the lowest likelihood of being enrolled in a private school, with 32 (100.0% in the age bracket) attending a public institution.
| Age Bracket | Public School | Private School |
| 3 to 4 Year Olds | 0 (0.0%) | 0 (0.0%) |
| 5 to 9 Year Old | 32 (100.0%) | 0 (0.0%) |
| 10 to 14 Year Olds | 30 (100.0%) | 0 (0.0%) |
| 15 to 17 Year Olds | 24 (60.0%) | 16 (40.0%) |
| 18 to 19 Year Olds | 0 (0.0%) | 0 (0.0%) |
| 20 to 24 Year Olds | 0 (0.0%) | 0 (0.0%) |
| 25 to 34 Year Olds | 0 (0.0%) | 0 (0.0%) |
| 35 Years and over | 8 (100.0%) | 0 (0.0%) |
| Total | 94 (85.5%) | 16 (14.5%) |
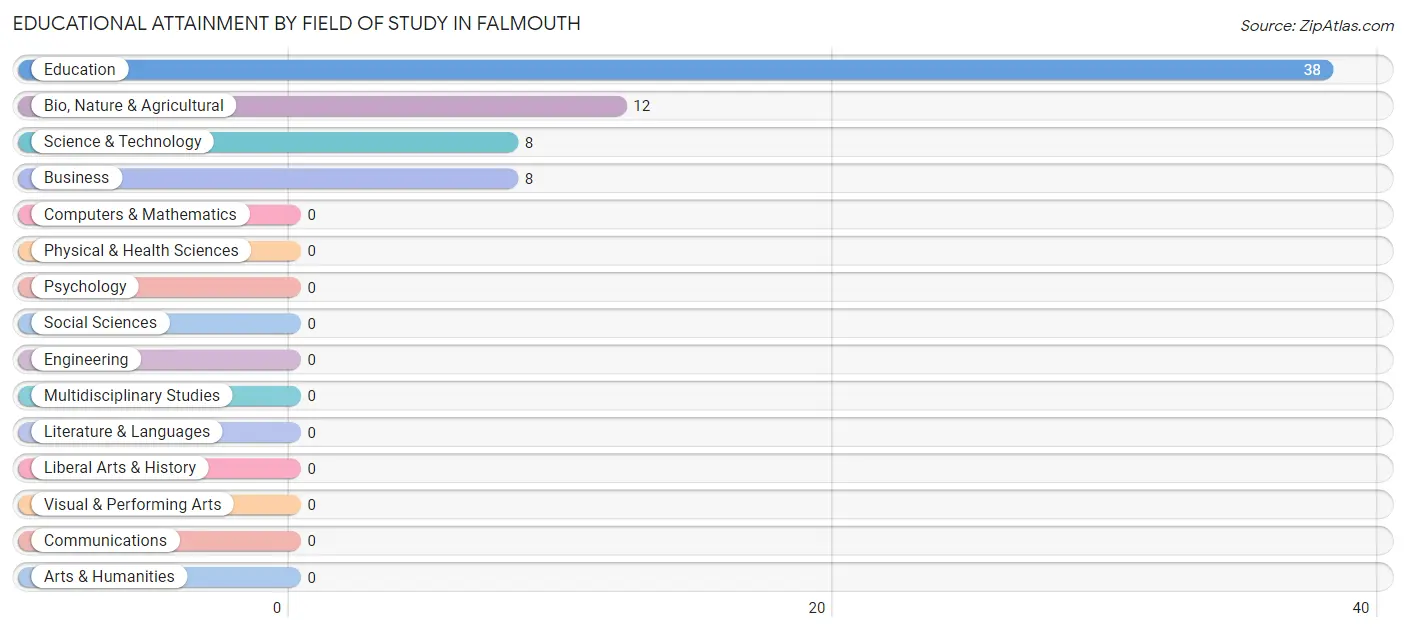
Educational Attainment by Field of Study in Falmouth
Education (38 | 57.6%), bio, nature & agricultural (12 | 18.2%), science & technology (8 | 12.1%), and business (8 | 12.1%) are the most common fields of study among 66 individuals in Falmouth who have obtained a bachelor's degree or higher.
| Field of Study | # Graduates | % Graduates |
| Computers & Mathematics | 0 | 0.0% |
| Bio, Nature & Agricultural | 12 | 18.2% |
| Physical & Health Sciences | 0 | 0.0% |
| Psychology | 0 | 0.0% |
| Social Sciences | 0 | 0.0% |
| Engineering | 0 | 0.0% |
| Multidisciplinary Studies | 0 | 0.0% |
| Science & Technology | 8 | 12.1% |
| Business | 8 | 12.1% |
| Education | 38 | 57.6% |
| Literature & Languages | 0 | 0.0% |
| Liberal Arts & History | 0 | 0.0% |
| Visual & Performing Arts | 0 | 0.0% |
| Communications | 0 | 0.0% |
| Arts & Humanities | 0 | 0.0% |
| Total | 66 | 100.0% |
Transportation & Commute in Falmouth
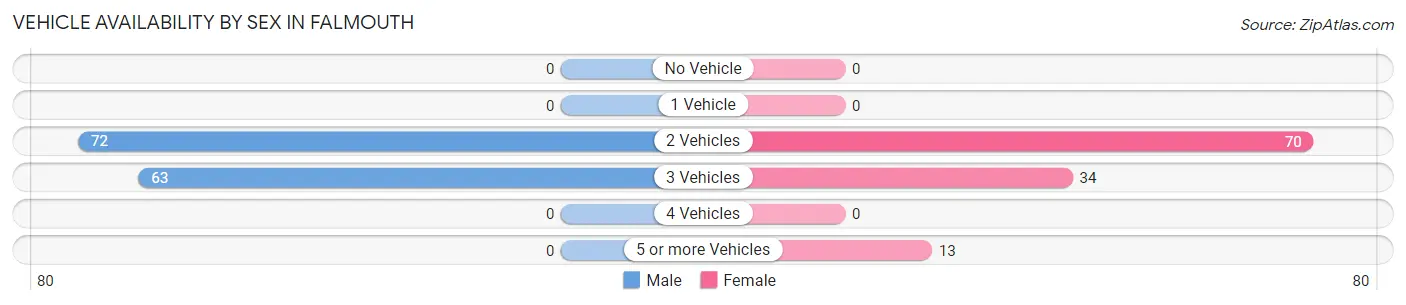
Vehicle Availability by Sex in Falmouth
The most prevalent vehicle ownership categories in Falmouth are males with 2 vehicles (72, accounting for 53.3%) and females with 2 vehicles (70, making up 61.5%).
| Vehicles Available | Male | Female |
| No Vehicle | 0 (0.0%) | 0 (0.0%) |
| 1 Vehicle | 0 (0.0%) | 0 (0.0%) |
| 2 Vehicles | 72 (53.3%) | 70 (59.8%) |
| 3 Vehicles | 63 (46.7%) | 34 (29.1%) |
| 4 Vehicles | 0 (0.0%) | 0 (0.0%) |
| 5 or more Vehicles | 0 (0.0%) | 13 (11.1%) |
| Total | 135 (100.0%) | 117 (100.0%) |
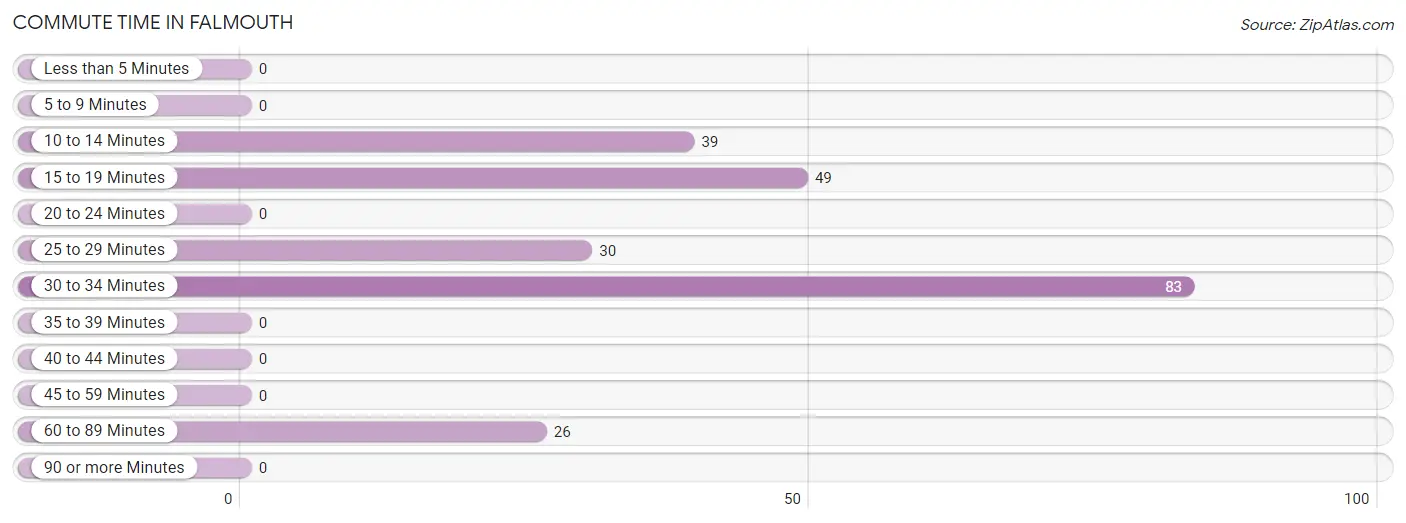
Commute Time in Falmouth
The most frequently occuring commute durations in Falmouth are 30 to 34 minutes (83 commuters, 36.6%), 15 to 19 minutes (49 commuters, 21.6%), and 10 to 14 minutes (39 commuters, 17.2%).
| Commute Time | # Commuters | % Commuters |
| Less than 5 Minutes | 0 | 0.0% |
| 5 to 9 Minutes | 0 | 0.0% |
| 10 to 14 Minutes | 39 | 17.2% |
| 15 to 19 Minutes | 49 | 21.6% |
| 20 to 24 Minutes | 0 | 0.0% |
| 25 to 29 Minutes | 30 | 13.2% |
| 30 to 34 Minutes | 83 | 36.6% |
| 35 to 39 Minutes | 0 | 0.0% |
| 40 to 44 Minutes | 0 | 0.0% |
| 45 to 59 Minutes | 0 | 0.0% |
| 60 to 89 Minutes | 26 | 11.5% |
| 90 or more Minutes | 0 | 0.0% |
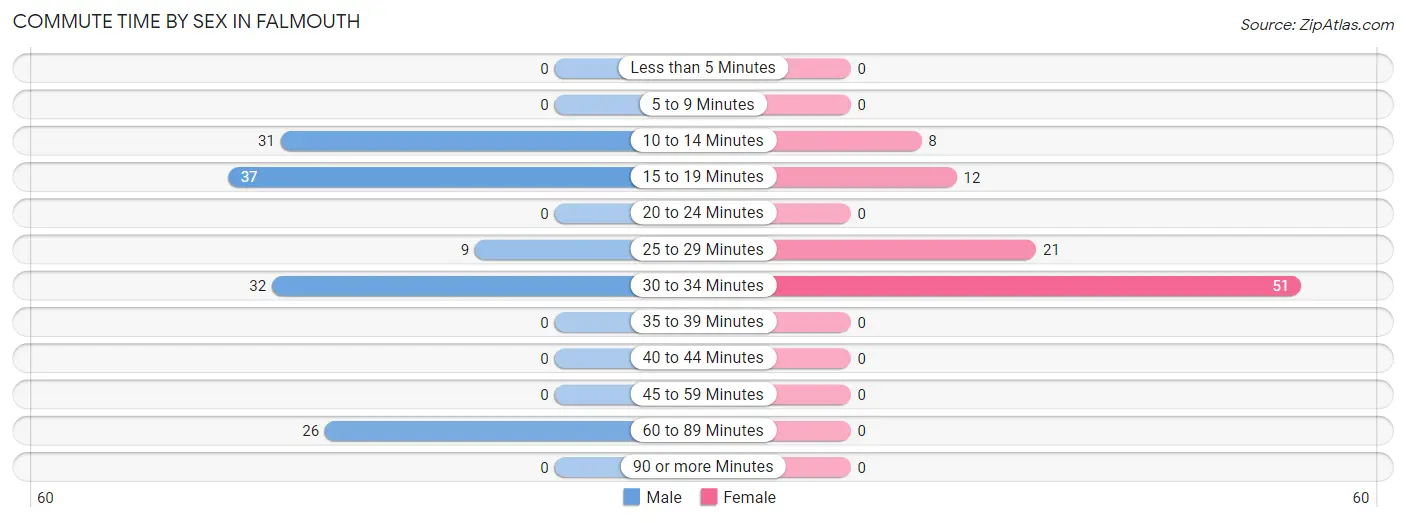
Commute Time by Sex in Falmouth
The most common commute times in Falmouth are 15 to 19 minutes (37 commuters, 27.4%) for males and 30 to 34 minutes (51 commuters, 55.4%) for females.
| Commute Time | Male | Female |
| Less than 5 Minutes | 0 (0.0%) | 0 (0.0%) |
| 5 to 9 Minutes | 0 (0.0%) | 0 (0.0%) |
| 10 to 14 Minutes | 31 (23.0%) | 8 (8.7%) |
| 15 to 19 Minutes | 37 (27.4%) | 12 (13.0%) |
| 20 to 24 Minutes | 0 (0.0%) | 0 (0.0%) |
| 25 to 29 Minutes | 9 (6.7%) | 21 (22.8%) |
| 30 to 34 Minutes | 32 (23.7%) | 51 (55.4%) |
| 35 to 39 Minutes | 0 (0.0%) | 0 (0.0%) |
| 40 to 44 Minutes | 0 (0.0%) | 0 (0.0%) |
| 45 to 59 Minutes | 0 (0.0%) | 0 (0.0%) |
| 60 to 89 Minutes | 26 (19.3%) | 0 (0.0%) |
| 90 or more Minutes | 0 (0.0%) | 0 (0.0%) |
Time of Departure to Work by Sex in Falmouth
The most frequent times of departure to work in Falmouth are 6:00 AM to 6:29 AM (60, 44.4%) for males and 7:00 AM to 7:29 AM (30, 32.6%) for females.
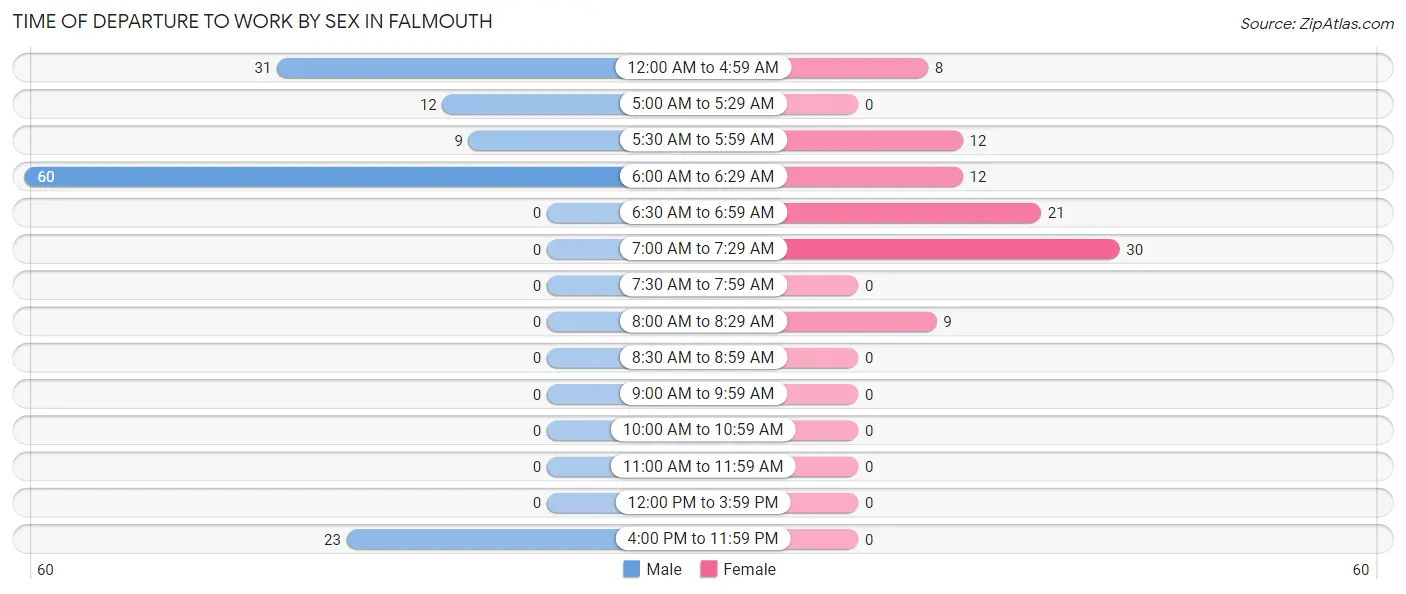
| Time of Departure | Male | Female |
| 12:00 AM to 4:59 AM | 31 (23.0%) | 8 (8.7%) |
| 5:00 AM to 5:29 AM | 12 (8.9%) | 0 (0.0%) |
| 5:30 AM to 5:59 AM | 9 (6.7%) | 12 (13.0%) |
| 6:00 AM to 6:29 AM | 60 (44.4%) | 12 (13.0%) |
| 6:30 AM to 6:59 AM | 0 (0.0%) | 21 (22.8%) |
| 7:00 AM to 7:29 AM | 0 (0.0%) | 30 (32.6%) |
| 7:30 AM to 7:59 AM | 0 (0.0%) | 0 (0.0%) |
| 8:00 AM to 8:29 AM | 0 (0.0%) | 9 (9.8%) |
| 8:30 AM to 8:59 AM | 0 (0.0%) | 0 (0.0%) |
| 9:00 AM to 9:59 AM | 0 (0.0%) | 0 (0.0%) |
| 10:00 AM to 10:59 AM | 0 (0.0%) | 0 (0.0%) |
| 11:00 AM to 11:59 AM | 0 (0.0%) | 0 (0.0%) |
| 12:00 PM to 3:59 PM | 0 (0.0%) | 0 (0.0%) |
| 4:00 PM to 11:59 PM | 23 (17.0%) | 0 (0.0%) |
| Total | 135 (100.0%) | 92 (100.0%) |
Housing Occupancy in Falmouth
Occupancy by Ownership in Falmouth
Of the total 223 dwellings in Falmouth, owner-occupied units account for 193 (86.6%), while renter-occupied units make up 30 (13.5%).
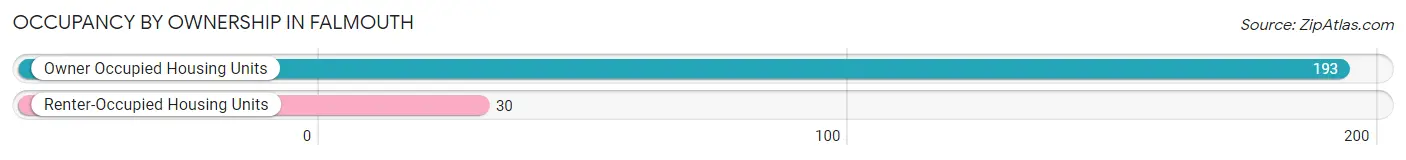
| Occupancy | # Housing Units | % Housing Units |
| Owner Occupied Housing Units | 193 | 86.6% |
| Renter-Occupied Housing Units | 30 | 13.5% |
| Total Occupied Housing Units | 223 | 100.0% |
Occupancy by Household Size in Falmouth
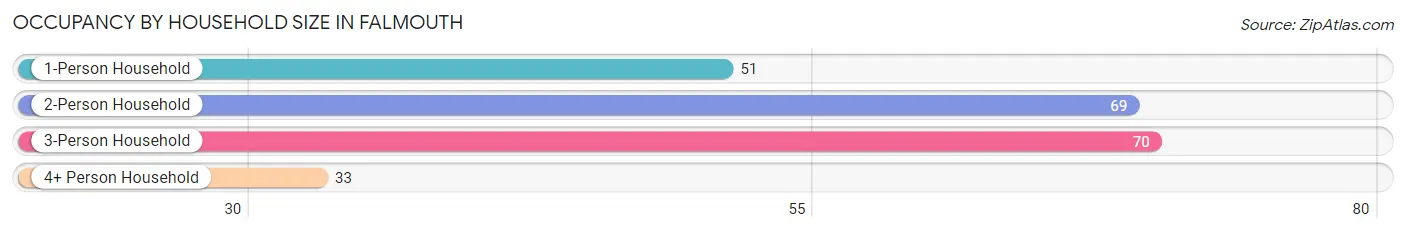
| Household Size | # Housing Units | % Housing Units |
| 1-Person Household | 51 | 22.9% |
| 2-Person Household | 69 | 30.9% |
| 3-Person Household | 70 | 31.4% |
| 4+ Person Household | 33 | 14.8% |
| Total Housing Units | 223 | 100.0% |
Occupancy by Ownership by Household Size in Falmouth
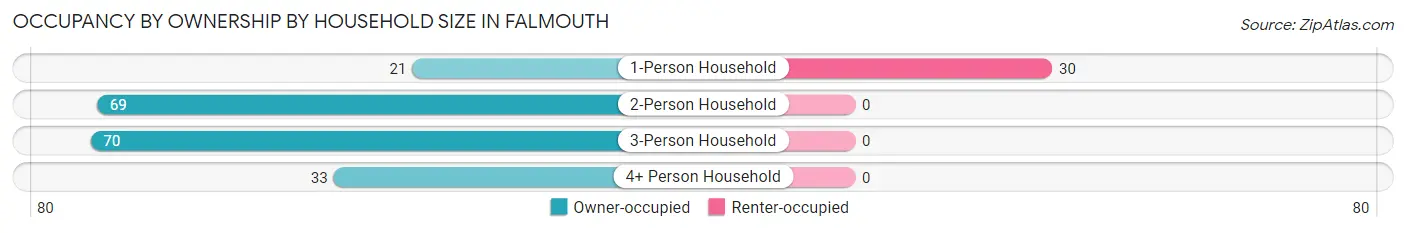
| Household Size | Owner-occupied | Renter-occupied |
| 1-Person Household | 21 (41.2%) | 30 (58.8%) |
| 2-Person Household | 69 (100.0%) | 0 (0.0%) |
| 3-Person Household | 70 (100.0%) | 0 (0.0%) |
| 4+ Person Household | 33 (100.0%) | 0 (0.0%) |
| Total Housing Units | 193 (86.6%) | 30 (13.5%) |
Occupancy by Educational Attainment in Falmouth
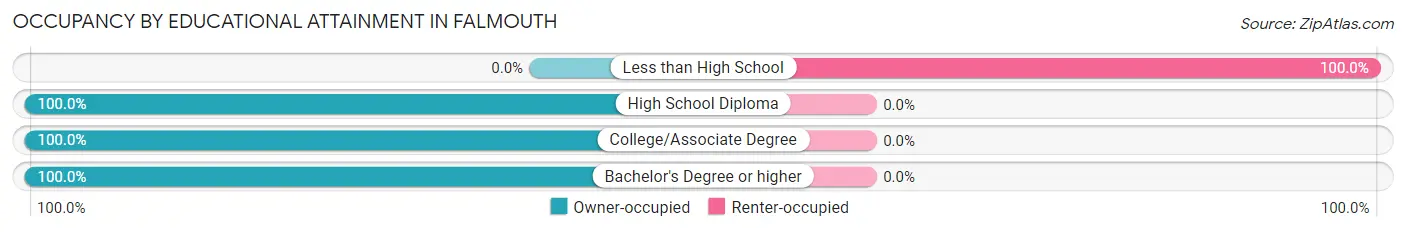
| Household Size | Owner-occupied | Renter-occupied |
| Less than High School | 0 (0.0%) | 30 (100.0%) |
| High School Diploma | 115 (100.0%) | 0 (0.0%) |
| College/Associate Degree | 24 (100.0%) | 0 (0.0%) |
| Bachelor's Degree or higher | 54 (100.0%) | 0 (0.0%) |
Occupancy by Age of Householder in Falmouth
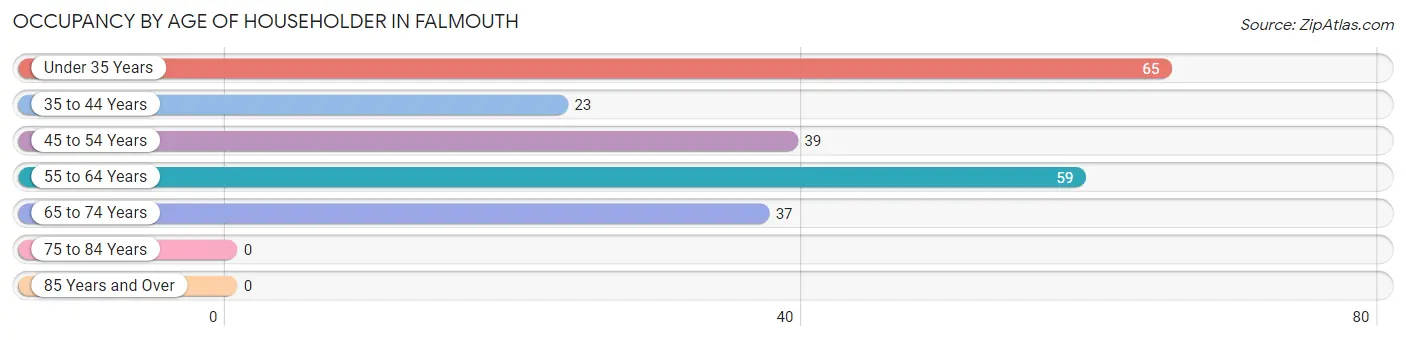
| Age Bracket | # Households | % Households |
| Under 35 Years | 65 | 29.1% |
| 35 to 44 Years | 23 | 10.3% |
| 45 to 54 Years | 39 | 17.5% |
| 55 to 64 Years | 59 | 26.5% |
| 65 to 74 Years | 37 | 16.6% |
| 75 to 84 Years | 0 | 0.0% |
| 85 Years and Over | 0 | 0.0% |
| Total | 223 | 100.0% |
Housing Finances in Falmouth
Median Income by Occupancy in Falmouth
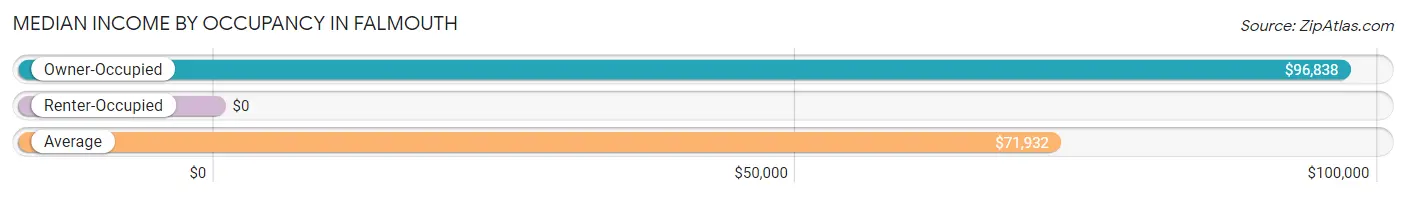
| Occupancy Type | # Households | Median Income |
| Owner-Occupied | 193 (86.6%) | $96,838 |
| Renter-Occupied | 30 (13.5%) | $0 |
| Average | 223 (100.0%) | $71,932 |
Occupancy by Householder Income Bracket in Falmouth
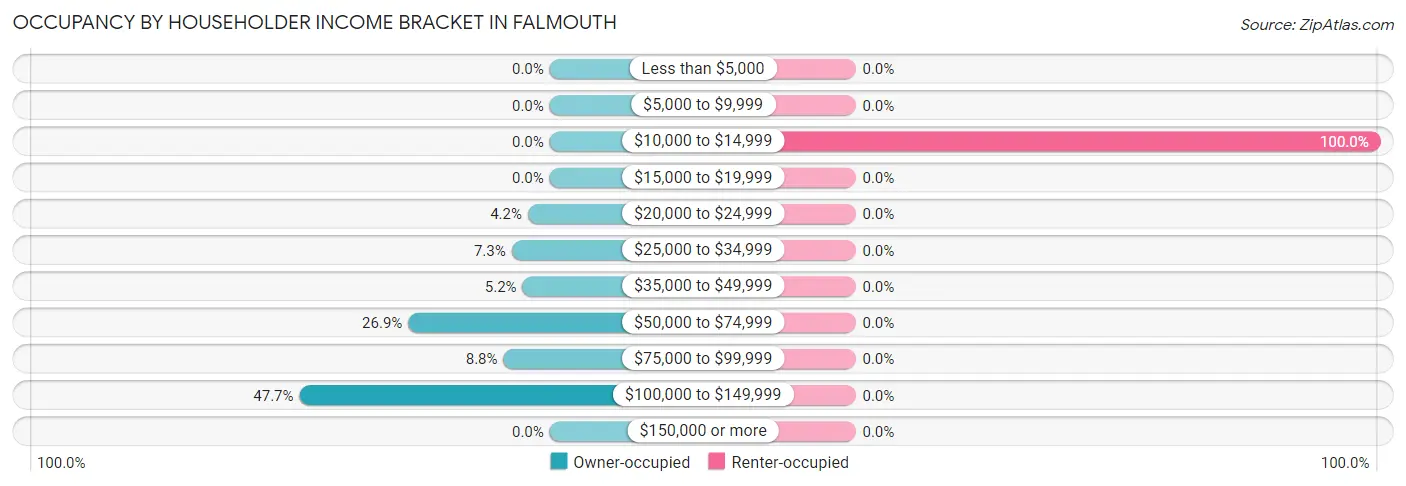
| Income Bracket | Owner-occupied | Renter-occupied |
| Less than $5,000 | 0 (0.0%) | 0 (0.0%) |
| $5,000 to $9,999 | 0 (0.0%) | 0 (0.0%) |
| $10,000 to $14,999 | 0 (0.0%) | 30 (100.0%) |
| $15,000 to $19,999 | 0 (0.0%) | 0 (0.0%) |
| $20,000 to $24,999 | 8 (4.2%) | 0 (0.0%) |
| $25,000 to $34,999 | 14 (7.2%) | 0 (0.0%) |
| $35,000 to $49,999 | 10 (5.2%) | 0 (0.0%) |
| $50,000 to $74,999 | 52 (26.9%) | 0 (0.0%) |
| $75,000 to $99,999 | 17 (8.8%) | 0 (0.0%) |
| $100,000 to $149,999 | 92 (47.7%) | 0 (0.0%) |
| $150,000 or more | 0 (0.0%) | 0 (0.0%) |
| Total | 193 (100.0%) | 30 (100.0%) |
Monthly Housing Cost Tiers in Falmouth
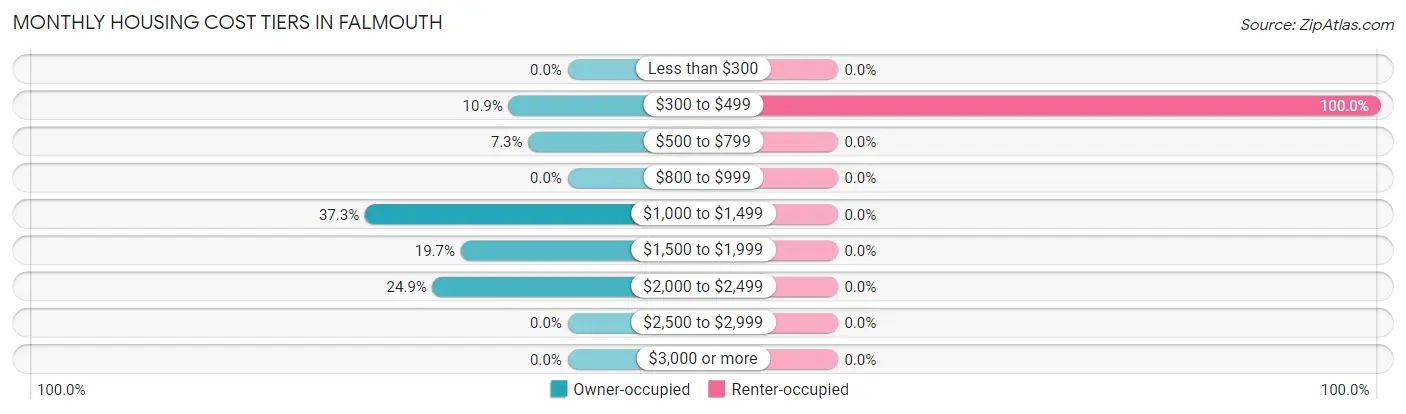
| Monthly Cost | Owner-occupied | Renter-occupied |
| Less than $300 | 0 (0.0%) | 0 (0.0%) |
| $300 to $499 | 21 (10.9%) | 30 (100.0%) |
| $500 to $799 | 14 (7.2%) | 0 (0.0%) |
| $800 to $999 | 0 (0.0%) | 0 (0.0%) |
| $1,000 to $1,499 | 72 (37.3%) | 0 (0.0%) |
| $1,500 to $1,999 | 38 (19.7%) | 0 (0.0%) |
| $2,000 to $2,499 | 48 (24.9%) | 0 (0.0%) |
| $2,500 to $2,999 | 0 (0.0%) | 0 (0.0%) |
| $3,000 or more | 0 (0.0%) | 0 (0.0%) |
| Total | 193 (100.0%) | 30 (100.0%) |
Physical Housing Characteristics in Falmouth
Housing Structures in Falmouth
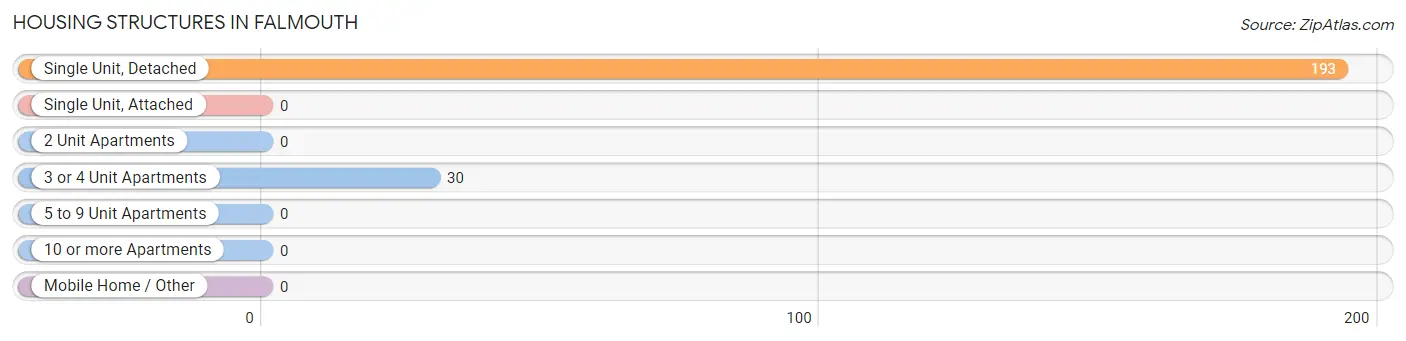
| Structure Type | # Housing Units | % Housing Units |
| Single Unit, Detached | 193 | 86.6% |
| Single Unit, Attached | 0 | 0.0% |
| 2 Unit Apartments | 0 | 0.0% |
| 3 or 4 Unit Apartments | 30 | 13.5% |
| 5 to 9 Unit Apartments | 0 | 0.0% |
| 10 or more Apartments | 0 | 0.0% |
| Mobile Home / Other | 0 | 0.0% |
| Total | 223 | 100.0% |
Housing Structures by Occupancy in Falmouth
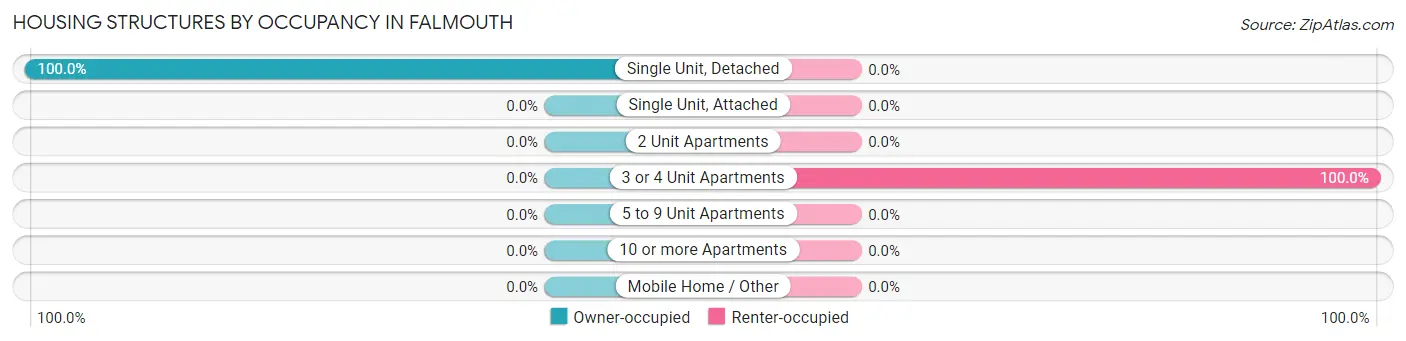
| Structure Type | Owner-occupied | Renter-occupied |
| Single Unit, Detached | 193 (100.0%) | 0 (0.0%) |
| Single Unit, Attached | 0 (0.0%) | 0 (0.0%) |
| 2 Unit Apartments | 0 (0.0%) | 0 (0.0%) |
| 3 or 4 Unit Apartments | 0 (0.0%) | 30 (100.0%) |
| 5 to 9 Unit Apartments | 0 (0.0%) | 0 (0.0%) |
| 10 or more Apartments | 0 (0.0%) | 0 (0.0%) |
| Mobile Home / Other | 0 (0.0%) | 0 (0.0%) |
| Total | 193 (86.6%) | 30 (13.5%) |
Housing Structures by Number of Rooms in Falmouth
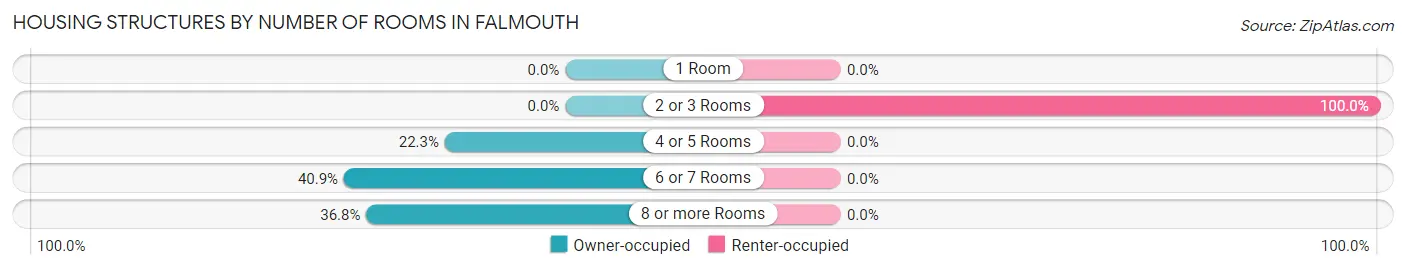
| Number of Rooms | Owner-occupied | Renter-occupied |
| 1 Room | 0 (0.0%) | 0 (0.0%) |
| 2 or 3 Rooms | 0 (0.0%) | 30 (100.0%) |
| 4 or 5 Rooms | 43 (22.3%) | 0 (0.0%) |
| 6 or 7 Rooms | 79 (40.9%) | 0 (0.0%) |
| 8 or more Rooms | 71 (36.8%) | 0 (0.0%) |
| Total | 193 (100.0%) | 30 (100.0%) |
Housing Structure by Heating Type in Falmouth
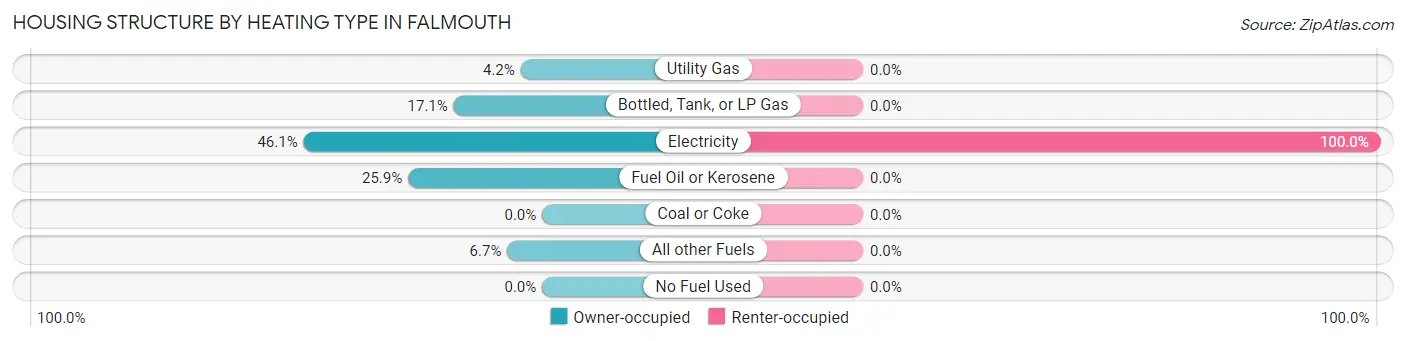
| Heating Type | Owner-occupied | Renter-occupied |
| Utility Gas | 8 (4.2%) | 0 (0.0%) |
| Bottled, Tank, or LP Gas | 33 (17.1%) | 0 (0.0%) |
| Electricity | 89 (46.1%) | 30 (100.0%) |
| Fuel Oil or Kerosene | 50 (25.9%) | 0 (0.0%) |
| Coal or Coke | 0 (0.0%) | 0 (0.0%) |
| All other Fuels | 13 (6.7%) | 0 (0.0%) |
| No Fuel Used | 0 (0.0%) | 0 (0.0%) |
| Total | 193 (100.0%) | 30 (100.0%) |
Household Vehicle Usage in Falmouth
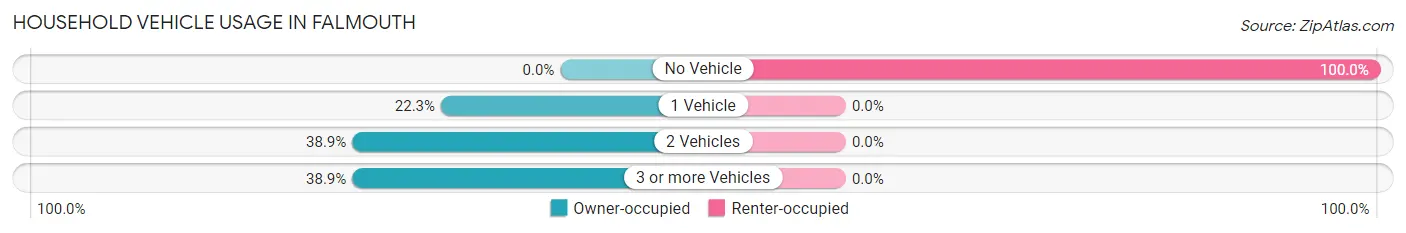
| Vehicles per Household | Owner-occupied | Renter-occupied |
| No Vehicle | 0 (0.0%) | 30 (100.0%) |
| 1 Vehicle | 43 (22.3%) | 0 (0.0%) |
| 2 Vehicles | 75 (38.9%) | 0 (0.0%) |
| 3 or more Vehicles | 75 (38.9%) | 0 (0.0%) |
| Total | 193 (100.0%) | 30 (100.0%) |
Real Estate & Mortgages in Falmouth
Real Estate and Mortgage Overview in Falmouth
| Characteristic | Without Mortgage | With Mortgage |
| Housing Units | 44 | 149 |
| Median Property Value | $253,600 | $258,800 |
| Median Household Income | $100,278 | $0 |
| Monthly Housing Costs | $707 | $0 |
| Real Estate Taxes | - | - |
Property Value by Mortgage Status in Falmouth
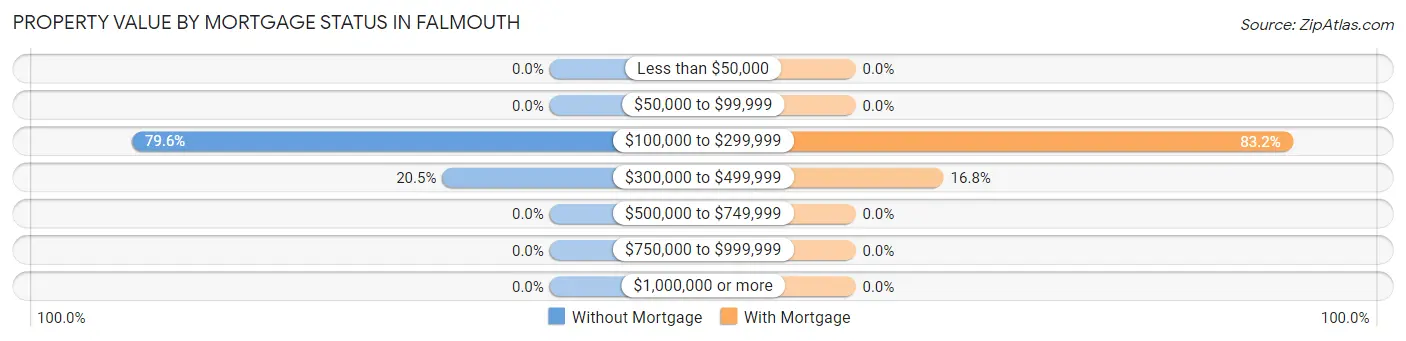
| Property Value | Without Mortgage | With Mortgage |
| Less than $50,000 | 0 (0.0%) | 0 (0.0%) |
| $50,000 to $99,999 | 0 (0.0%) | 0 (0.0%) |
| $100,000 to $299,999 | 35 (79.5%) | 124 (83.2%) |
| $300,000 to $499,999 | 9 (20.4%) | 25 (16.8%) |
| $500,000 to $749,999 | 0 (0.0%) | 0 (0.0%) |
| $750,000 to $999,999 | 0 (0.0%) | 0 (0.0%) |
| $1,000,000 or more | 0 (0.0%) | 0 (0.0%) |
| Total | 44 (100.0%) | 149 (100.0%) |
Household Income by Mortgage Status in Falmouth
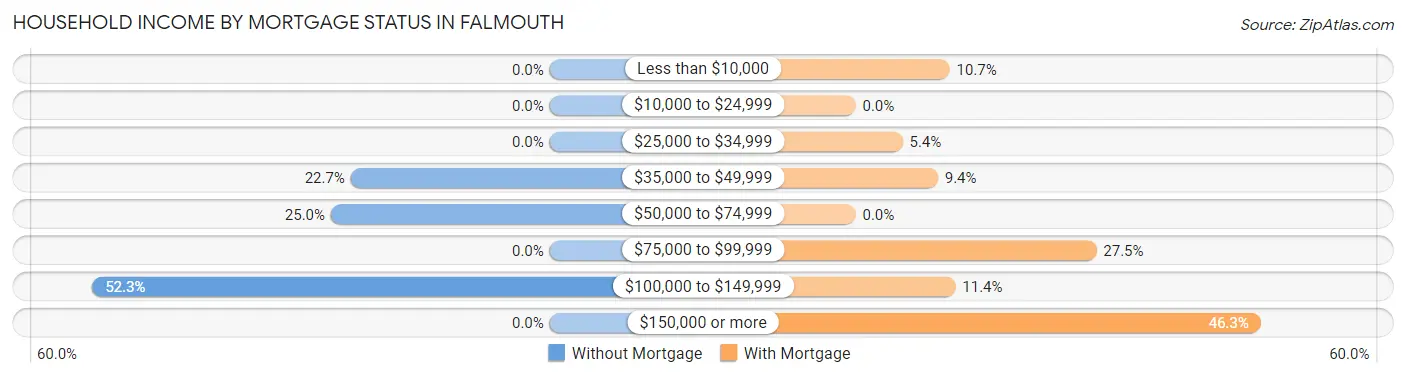
| Household Income | Without Mortgage | With Mortgage |
| Less than $10,000 | 0 (0.0%) | 16 (10.7%) |
| $10,000 to $24,999 | 0 (0.0%) | 0 (0.0%) |
| $25,000 to $34,999 | 0 (0.0%) | 8 (5.4%) |
| $35,000 to $49,999 | 10 (22.7%) | 14 (9.4%) |
| $50,000 to $74,999 | 11 (25.0%) | 0 (0.0%) |
| $75,000 to $99,999 | 0 (0.0%) | 41 (27.5%) |
| $100,000 to $149,999 | 23 (52.3%) | 17 (11.4%) |
| $150,000 or more | 0 (0.0%) | 69 (46.3%) |
| Total | 44 (100.0%) | 149 (100.0%) |
Property Value to Household Income Ratio in Falmouth
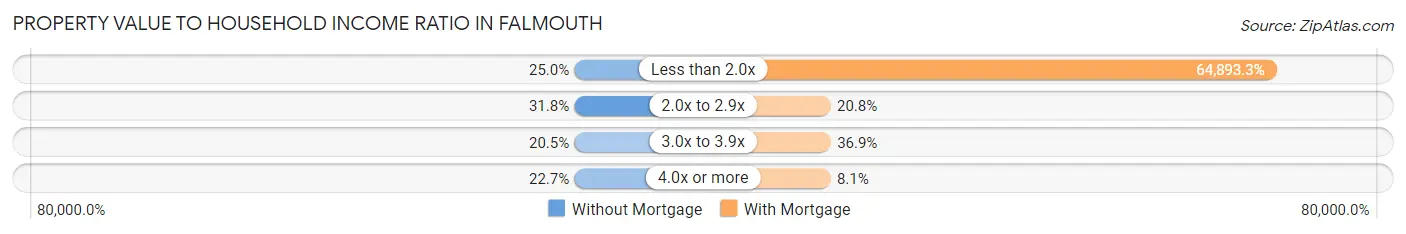
| Value-to-Income Ratio | Without Mortgage | With Mortgage |
| Less than 2.0x | 11 (25.0%) | 96,691 (64,893.3%) |
| 2.0x to 2.9x | 14 (31.8%) | 31 (20.8%) |
| 3.0x to 3.9x | 9 (20.4%) | 55 (36.9%) |
| 4.0x or more | 10 (22.7%) | 12 (8.1%) |
| Total | 44 (100.0%) | 149 (100.0%) |
Real Estate Taxes by Mortgage Status in Falmouth
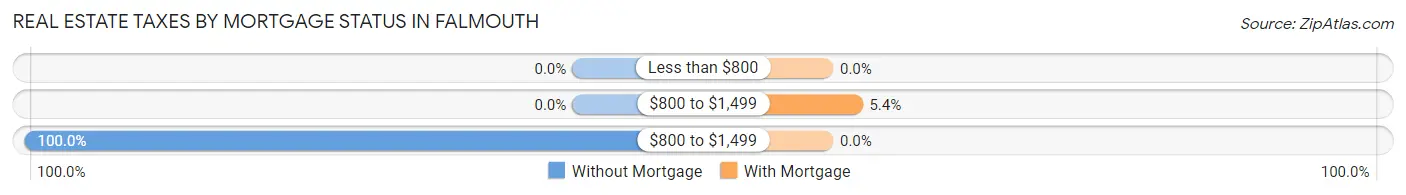
| Property Taxes | Without Mortgage | With Mortgage |
| Less than $800 | 0 (0.0%) | 0 (0.0%) |
| $800 to $1,499 | 0 (0.0%) | 8 (5.4%) |
| $800 to $1,499 | 44 (100.0%) | 0 (0.0%) |
| Total | 44 (100.0%) | 149 (100.0%) |
Health & Disability in Falmouth
Health Insurance Coverage by Age in Falmouth
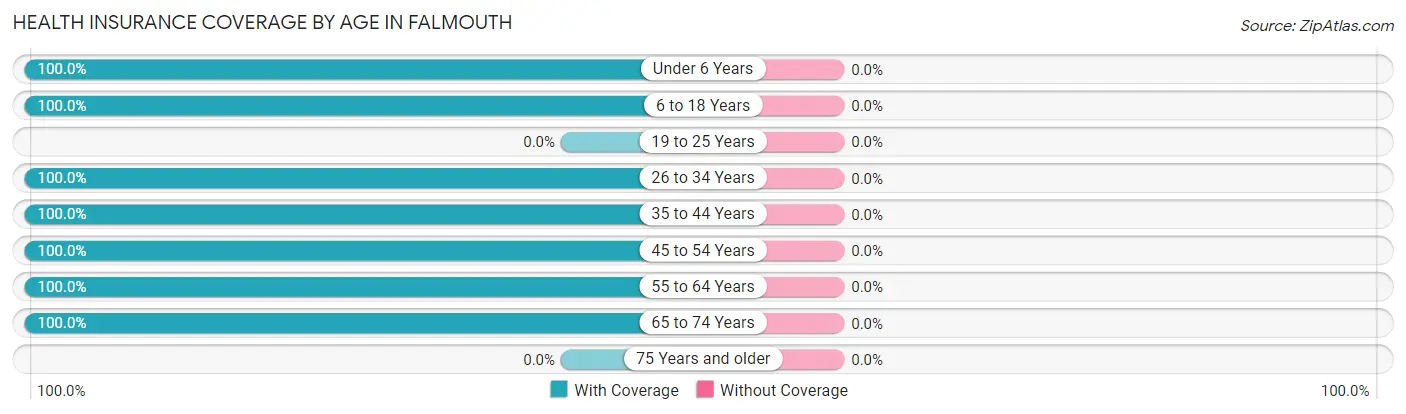
| Age Bracket | With Coverage | Without Coverage |
| Under 6 Years | 32 (100.0%) | 0 (0.0%) |
| 6 to 18 Years | 102 (100.0%) | 0 (0.0%) |
| 19 to 25 Years | 0 (0.0%) | 0 (0.0%) |
| 26 to 34 Years | 109 (100.0%) | 0 (0.0%) |
| 35 to 44 Years | 57 (100.0%) | 0 (0.0%) |
| 45 to 54 Years | 69 (100.0%) | 0 (0.0%) |
| 55 to 64 Years | 86 (100.0%) | 0 (0.0%) |
| 65 to 74 Years | 63 (100.0%) | 0 (0.0%) |
| 75 Years and older | 0 (0.0%) | 0 (0.0%) |
| Total | 518 (100.0%) | 0 (0.0%) |
Health Insurance Coverage by Citizenship Status in Falmouth
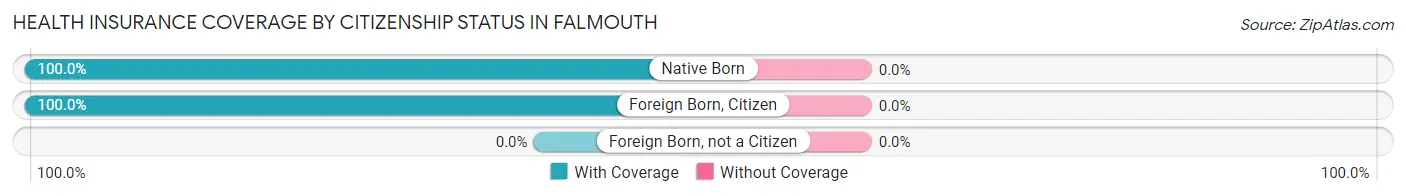
| Citizenship Status | With Coverage | Without Coverage |
| Native Born | 32 (100.0%) | 0 (0.0%) |
| Foreign Born, Citizen | 102 (100.0%) | 0 (0.0%) |
| Foreign Born, not a Citizen | 0 (0.0%) | 0 (0.0%) |
Health Insurance Coverage by Household Income in Falmouth
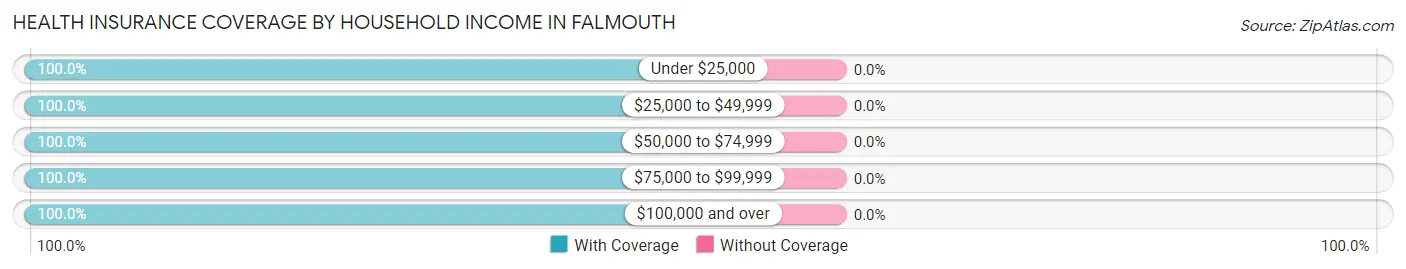
| Household Income | With Coverage | Without Coverage |
| Under $25,000 | 58 (100.0%) | 0 (0.0%) |
| $25,000 to $49,999 | 38 (100.0%) | 0 (0.0%) |
| $50,000 to $74,999 | 104 (100.0%) | 0 (0.0%) |
| $75,000 to $99,999 | 67 (100.0%) | 0 (0.0%) |
| $100,000 and over | 251 (100.0%) | 0 (0.0%) |
Public vs Private Health Insurance Coverage by Age in Falmouth
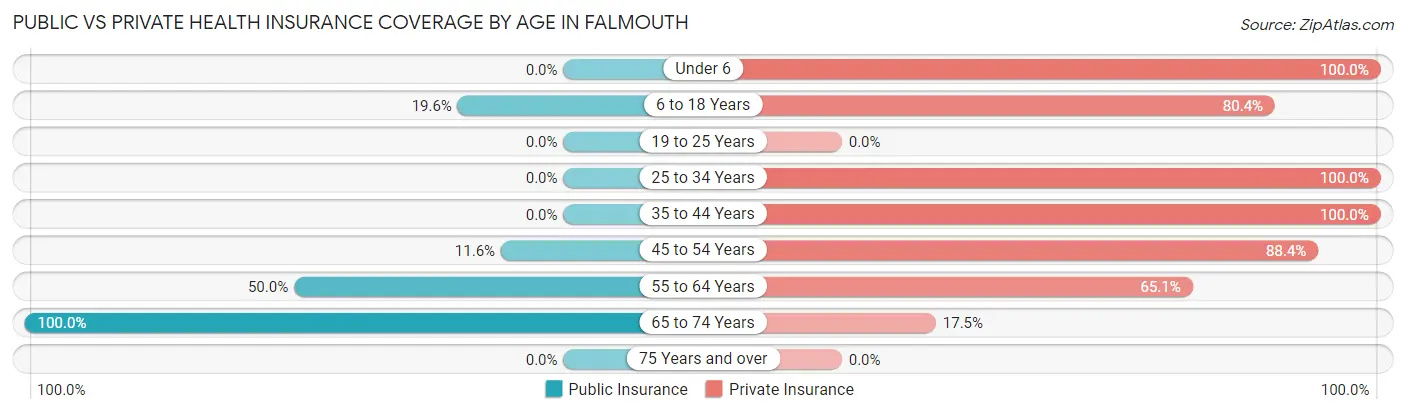
| Age Bracket | Public Insurance | Private Insurance |
| Under 6 | 0 (0.0%) | 32 (100.0%) |
| 6 to 18 Years | 20 (19.6%) | 82 (80.4%) |
| 19 to 25 Years | 0 (0.0%) | 0 (0.0%) |
| 25 to 34 Years | 0 (0.0%) | 109 (100.0%) |
| 35 to 44 Years | 0 (0.0%) | 57 (100.0%) |
| 45 to 54 Years | 8 (11.6%) | 61 (88.4%) |
| 55 to 64 Years | 43 (50.0%) | 56 (65.1%) |
| 65 to 74 Years | 63 (100.0%) | 11 (17.5%) |
| 75 Years and over | 0 (0.0%) | 0 (0.0%) |
| Total | 134 (25.9%) | 408 (78.8%) |
Disability Status by Sex by Age in Falmouth
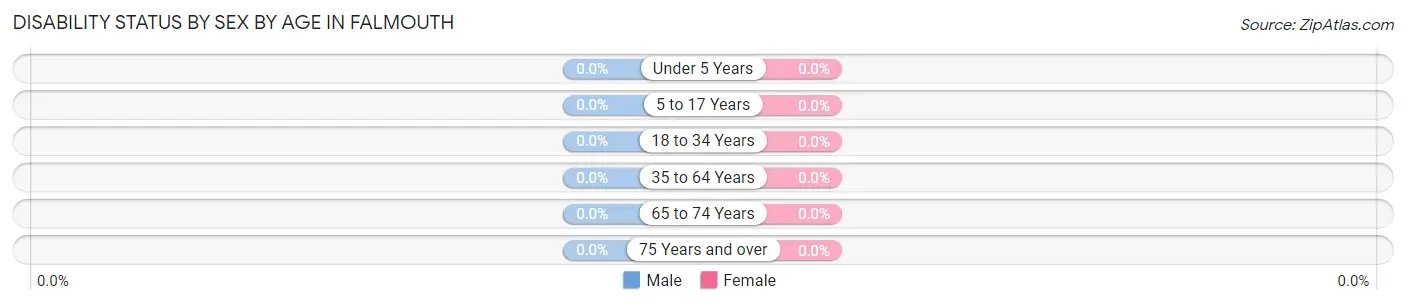
| Age Bracket | Male | Female |
| Under 5 Years | 0 (0.0%) | 0 (0.0%) |
| 5 to 17 Years | 0 (0.0%) | 0 (0.0%) |
| 18 to 34 Years | 0 (0.0%) | 0 (0.0%) |
| 35 to 64 Years | 0 (0.0%) | 0 (0.0%) |
| 65 to 74 Years | 0 (0.0%) | 0 (0.0%) |
| 75 Years and over | 0 (0.0%) | 0 (0.0%) |
Disability Class by Sex by Age in Falmouth
Disability Class: Hearing Difficulty
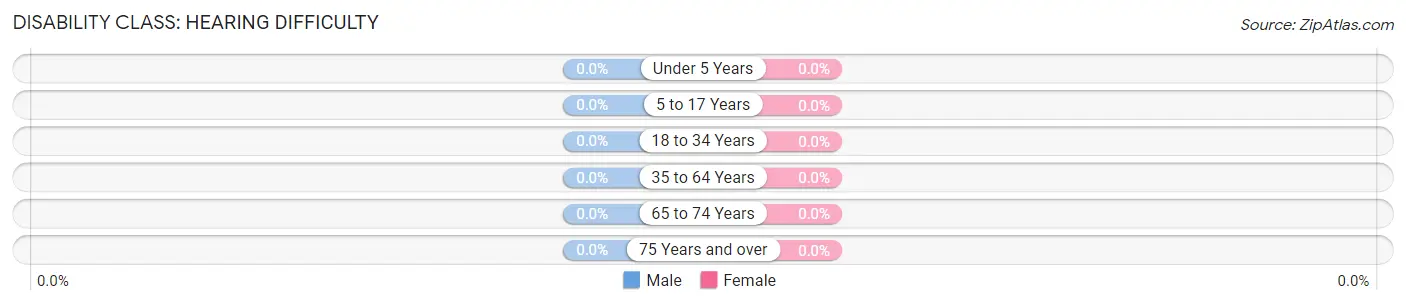
| Age Bracket | Male | Female |
| Under 5 Years | 0 (0.0%) | 0 (0.0%) |
| 5 to 17 Years | 0 (0.0%) | 0 (0.0%) |
| 18 to 34 Years | 0 (0.0%) | 0 (0.0%) |
| 35 to 64 Years | 0 (0.0%) | 0 (0.0%) |
| 65 to 74 Years | 0 (0.0%) | 0 (0.0%) |
| 75 Years and over | 0 (0.0%) | 0 (0.0%) |
Disability Class: Vision Difficulty
| Age Bracket | Male | Female |
| Under 5 Years | 0 (0.0%) | 0 (0.0%) |
| 5 to 17 Years | 0 (0.0%) | 0 (0.0%) |
| 18 to 34 Years | 0 (0.0%) | 0 (0.0%) |
| 35 to 64 Years | 0 (0.0%) | 0 (0.0%) |
| 65 to 74 Years | 0 (0.0%) | 0 (0.0%) |
| 75 Years and over | 0 (0.0%) | 0 (0.0%) |
Disability Class: Cognitive Difficulty
| Age Bracket | Male | Female |
| 5 to 17 Years | 0 (0.0%) | 0 (0.0%) |
| 18 to 34 Years | 0 (0.0%) | 0 (0.0%) |
| 35 to 64 Years | 0 (0.0%) | 0 (0.0%) |
| 65 to 74 Years | 0 (0.0%) | 0 (0.0%) |
| 75 Years and over | 0 (0.0%) | 0 (0.0%) |
Disability Class: Ambulatory Difficulty
| Age Bracket | Male | Female |
| 5 to 17 Years | 0 (0.0%) | 0 (0.0%) |
| 18 to 34 Years | 0 (0.0%) | 0 (0.0%) |
| 35 to 64 Years | 0 (0.0%) | 0 (0.0%) |
| 65 to 74 Years | 0 (0.0%) | 0 (0.0%) |
| 75 Years and over | 0 (0.0%) | 0 (0.0%) |
Disability Class: Self-Care Difficulty
| Age Bracket | Male | Female |
| 5 to 17 Years | 0 (0.0%) | 0 (0.0%) |
| 18 to 34 Years | 0 (0.0%) | 0 (0.0%) |
| 35 to 64 Years | 0 (0.0%) | 0 (0.0%) |
| 65 to 74 Years | 0 (0.0%) | 0 (0.0%) |
| 75 Years and over | 0 (0.0%) | 0 (0.0%) |
Technology Access in Falmouth
Computing Device Access in Falmouth
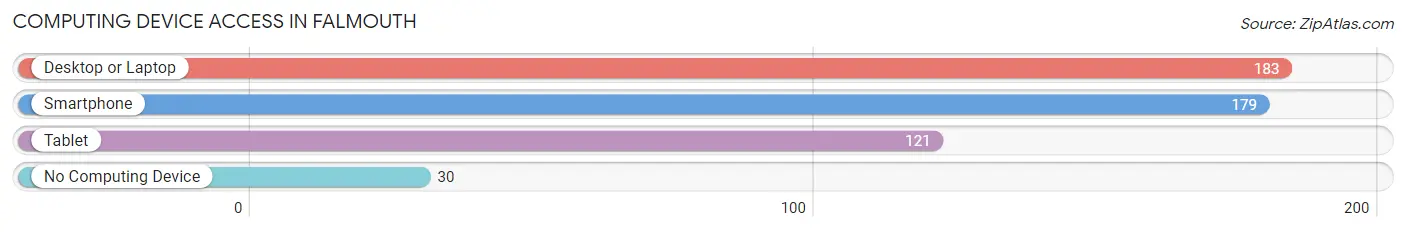
| Device Type | # Households | % Households |
| Desktop or Laptop | 183 | 82.1% |
| Smartphone | 179 | 80.3% |
| Tablet | 121 | 54.3% |
| No Computing Device | 30 | 13.5% |
| Total | 223 | 100.0% |
Internet Access in Falmouth
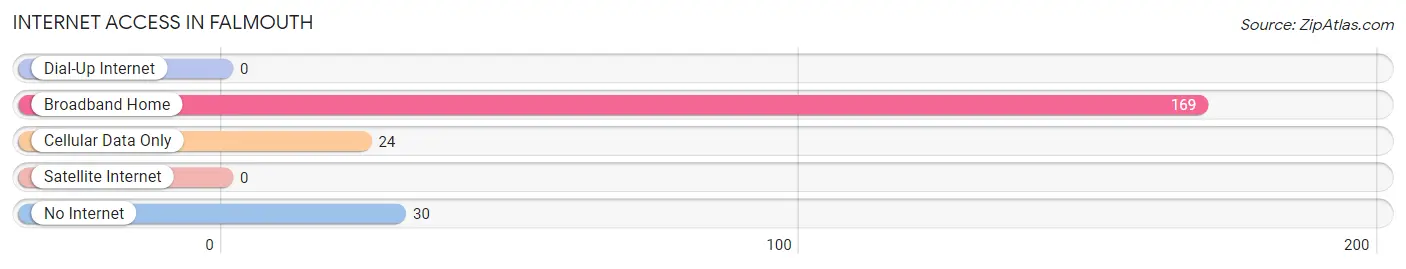
| Internet Type | # Households | % Households |
| Dial-Up Internet | 0 | 0.0% |
| Broadband Home | 169 | 75.8% |
| Cellular Data Only | 24 | 10.8% |
| Satellite Internet | 0 | 0.0% |
| No Internet | 30 | 13.5% |
| Total | 223 | 100.0% |
Falmouth Summary
Falmouth, Pennsylvania is a small borough located in the southwestern corner of the state, in the heart of the Laurel Highlands. It is situated in the foothills of the Allegheny Mountains, and is bordered by the Youghiogheny River to the east and the Conemaugh River to the west. The borough is part of Somerset County, and is located approximately 50 miles southeast of Pittsburgh.
History
The area that is now Falmouth was first settled in the late 1700s by German and Scotch-Irish immigrants. The town was originally known as “Falkner’s Mill”, after the first settler, John Falkner. In 1845, the town was officially incorporated as “Falmouth”, and the name was chosen to honor the town’s founder.
The town grew steadily throughout the 19th century, and by the early 20th century, it had become a thriving industrial center. The town was home to several coal mines, as well as a number of factories and mills. The town’s economy was further bolstered by the arrival of the Pennsylvania Railroad in the late 1800s.
Geography
Falmouth is located in the southwestern corner of Somerset County, in the heart of the Laurel Highlands. The borough is situated in the foothills of the Allegheny Mountains, and is bordered by the Youghiogheny River to the east and the Conemaugh River to the west. The town is located approximately 50 miles southeast of Pittsburgh.
The borough covers an area of 1.2 square miles, and is home to a population of approximately 1,400 people. The town is served by two major highways, US Route 30 and Pennsylvania Route 281.
Economy
The economy of Falmouth is largely based on tourism and agriculture. The town is home to several small businesses, including restaurants, shops, and a variety of other services. The town is also home to a number of farms, which produce a variety of crops, including corn, soybeans, and hay.
The town is also home to a number of manufacturing companies, including a steel mill and a paper mill. The town is also home to a number of coal mines, which provide employment for many of the town’s residents.
Demographics
As of the 2010 census, the population of Falmouth was 1,400. The racial makeup of the town was 97.3% White, 0.7% African American, 0.3% Native American, 0.3% Asian, and 1.3% from other races. The median household income was $37,500, and the median family income was $45,000.
The town is served by the Somerset Area School District, which includes two elementary schools, a middle school, and a high school. The town is also home to a number of churches, including the First United Methodist Church, the First Presbyterian Church, and the St. Paul’s Lutheran Church.
Conclusion
Falmouth, Pennsylvania is a small borough located in the southwestern corner of the state, in the heart of the Laurel Highlands. It is situated in the foothills of the Allegheny Mountains, and is bordered by the Youghiogheny River to the east and the Conemaugh River to the west. The borough is part of Somerset County, and is located approximately 50 miles southeast of Pittsburgh. The town’s economy is largely based on tourism and agriculture, and it is home to a number of small businesses, farms, and manufacturing companies. The population of Falmouth is approximately 1,400, and the town is served by the Somerset Area School District.
Common Questions
What is Per Capita Income in Falmouth?
Per Capita income in Falmouth is $34,959.
What is the Median Household income in Falmouth?
Median Household Income in Falmouth is $71,932.
What is Income or Wage Gap in Falmouth?
Income or Wage Gap in Falmouth is 31.8%.
Women in Falmouth earn 68.2 cents for every dollar earned by a man.
What is Inequality or Gini Index in Falmouth?
Inequality or Gini Index in Falmouth is 0.33.
What is the Total Population of Falmouth?
Total Population of Falmouth is 518.
What is the Total Male Population of Falmouth?
Total Male Population of Falmouth is 279.
What is the Total Female Population of Falmouth?
Total Female Population of Falmouth is 239.
What is the Ratio of Males per 100 Females in Falmouth?
There are 116.74 Males per 100 Females in Falmouth.
What is the Ratio of Females per 100 Males in Falmouth?
There are 85.66 Females per 100 Males in Falmouth.
What is the Median Population Age in Falmouth?
Median Population Age in Falmouth is 39.1 Years.
What is the Average Family Size in Falmouth
Average Family Size in Falmouth is 2.7 People.
What is the Average Household Size in Falmouth
Average Household Size in Falmouth is 2.3 People.
How Large is the Labor Force in Falmouth?
There are 260 People in the Labor Forcein in Falmouth.
What is the Percentage of People in the Labor Force in Falmouth?
63.7% of People are in the Labor Force in Falmouth.
What is the Unemployment Rate in Falmouth?
Unemployment Rate in Falmouth is 3.1%.