Fairview, PA Map & Demographics
Fairview Map
Fairview Overview
$35,708
PER CAPITA INCOME
$109,297
AVG FAMILY INCOME
$90,388
AVG HOUSEHOLD INCOME
17.4%
WAGE / INCOME GAP [ % ]
82.6¢/ $1
WAGE / INCOME GAP [ $ ]
0.42
INEQUALITY / GINI INDEX
2,959
TOTAL POPULATION
1,419
MALE POPULATION
1,540
FEMALE POPULATION
92.14
MALES / 100 FEMALES
108.53
FEMALES / 100 MALES
38.3
MEDIAN AGE
3.1
AVG FAMILY SIZE
2.7
AVG HOUSEHOLD SIZE
1,247
LABOR FORCE [ PEOPLE ]
54.0%
PERCENT IN LABOR FORCE
11.2%
UNEMPLOYMENT RATE
Fairview Zip Codes
Fairview Area Codes
Income in Fairview
Income Overview in Fairview
Per Capita Income in Fairview is $35,708, while median incomes of families and households are $109,297 and $90,388 respectively.
| Characteristic | Number | Measure |
| Per Capita Income | 2,959 | $35,708 |
| Median Family Income | 801 | $109,297 |
| Mean Family Income | 801 | $120,398 |
| Median Household Income | 992 | $90,388 |
| Mean Household Income | 992 | $102,969 |
| Income Deficit | 801 | $0 |
| Wage / Income Gap (%) | 2,959 | 17.45% |
| Wage / Income Gap ($) | 2,959 | 82.55¢ per $1 |
| Gini / Inequality Index | 2,959 | 0.42 |
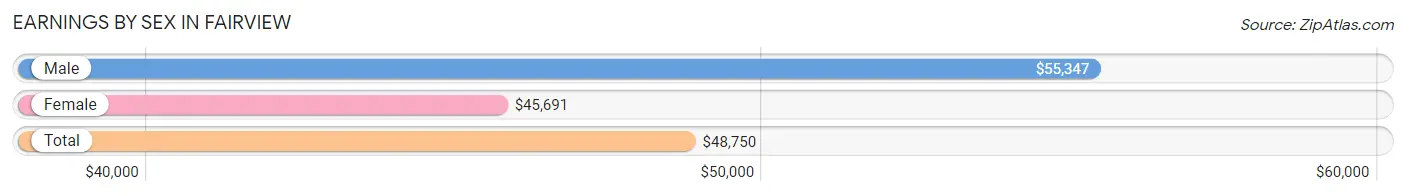
Earnings by Sex in Fairview
Average Earnings in Fairview are $48,750, $55,347 for men and $45,691 for women, a difference of 17.4%.
| Sex | Number | Average Earnings |
| Male | 715 (55.9%) | $55,347 |
| Female | 563 (44.1%) | $45,691 |
| Total | 1,278 (100.0%) | $48,750 |
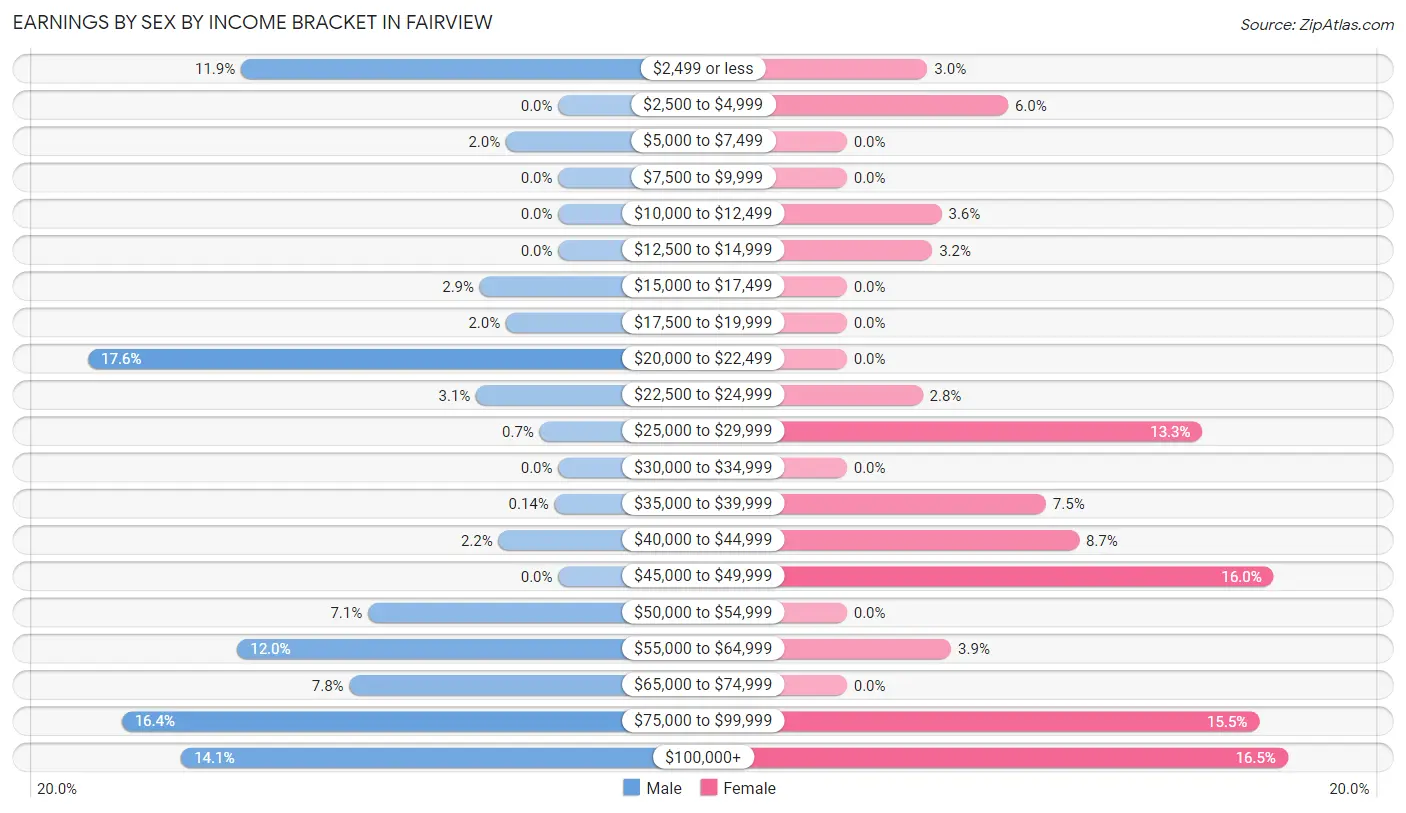
Earnings by Sex by Income Bracket in Fairview
The most common earnings brackets in Fairview are $20,000 to $22,499 for men (126 | 17.6%) and $100,000+ for women (93 | 16.5%).
| Income | Male | Female |
| $2,499 or less | 85 (11.9%) | 17 (3.0%) |
| $2,500 to $4,999 | 0 (0.0%) | 34 (6.0%) |
| $5,000 to $7,499 | 14 (2.0%) | 0 (0.0%) |
| $7,500 to $9,999 | 0 (0.0%) | 0 (0.0%) |
| $10,000 to $12,499 | 0 (0.0%) | 20 (3.5%) |
| $12,500 to $14,999 | 0 (0.0%) | 18 (3.2%) |
| $15,000 to $17,499 | 21 (2.9%) | 0 (0.0%) |
| $17,500 to $19,999 | 14 (2.0%) | 0 (0.0%) |
| $20,000 to $22,499 | 126 (17.6%) | 0 (0.0%) |
| $22,500 to $24,999 | 22 (3.1%) | 16 (2.8%) |
| $25,000 to $29,999 | 5 (0.7%) | 75 (13.3%) |
| $30,000 to $34,999 | 0 (0.0%) | 0 (0.0%) |
| $35,000 to $39,999 | 1 (0.1%) | 42 (7.5%) |
| $40,000 to $44,999 | 16 (2.2%) | 49 (8.7%) |
| $45,000 to $49,999 | 0 (0.0%) | 90 (16.0%) |
| $50,000 to $54,999 | 51 (7.1%) | 0 (0.0%) |
| $55,000 to $64,999 | 86 (12.0%) | 22 (3.9%) |
| $65,000 to $74,999 | 56 (7.8%) | 0 (0.0%) |
| $75,000 to $99,999 | 117 (16.4%) | 87 (15.4%) |
| $100,000+ | 101 (14.1%) | 93 (16.5%) |
| Total | 715 (100.0%) | 563 (100.0%) |
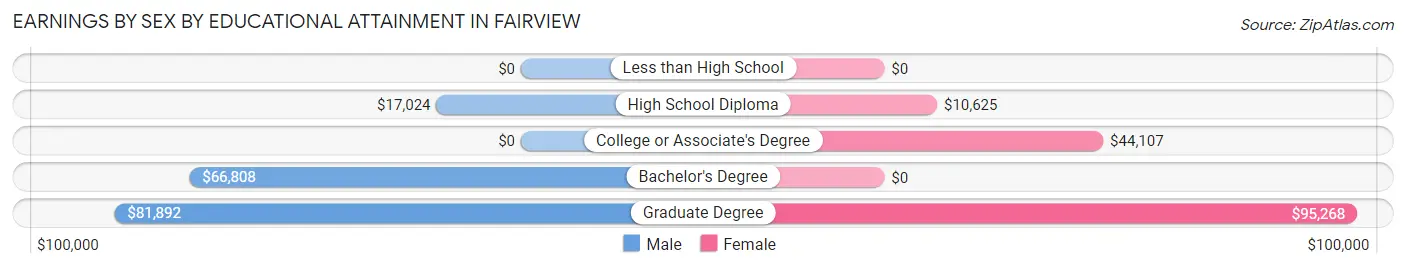
Earnings by Sex by Educational Attainment in Fairview
Average earnings in Fairview are $63,787 for men and $46,053 for women, a difference of 27.8%. Men with an educational attainment of graduate degree enjoy the highest average annual earnings of $81,892, while those with high school diploma education earn the least with $17,024. Women with an educational attainment of graduate degree earn the most with the average annual earnings of $95,268, while those with high school diploma education have the smallest earnings of $10,625.
| Educational Attainment | Male Income | Female Income |
| Less than High School | - | - |
| High School Diploma | $17,024 | $10,625 |
| College or Associate's Degree | - | - |
| Bachelor's Degree | $66,808 | $0 |
| Graduate Degree | $81,892 | $95,268 |
| Total | $63,787 | $46,053 |
Family Income in Fairview
Family Income Brackets in Fairview
According to the Fairview family income data, there are 213 families falling into the $100,000 to $149,999 income range, which is the most common income bracket and makes up 26.6% of all families.
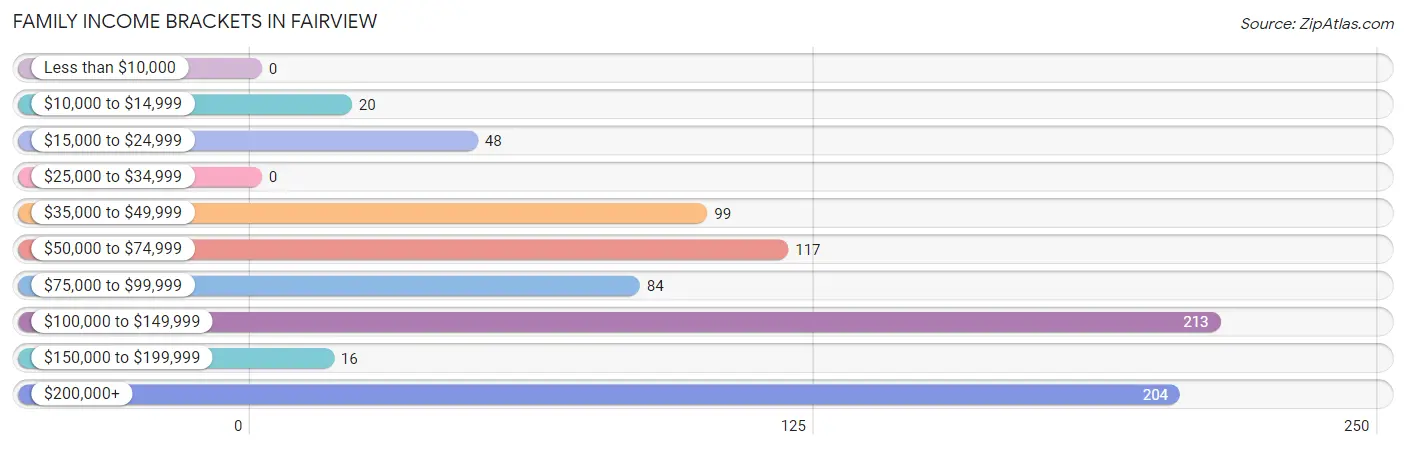
| Income Bracket | # Families | % Families |
| Less than $10,000 | 0 | 0.0% |
| $10,000 to $14,999 | 20 | 2.5% |
| $15,000 to $24,999 | 48 | 6.0% |
| $25,000 to $34,999 | 0 | 0.0% |
| $35,000 to $49,999 | 99 | 12.4% |
| $50,000 to $74,999 | 117 | 14.6% |
| $75,000 to $99,999 | 84 | 10.5% |
| $100,000 to $149,999 | 213 | 26.6% |
| $150,000 to $199,999 | 16 | 2.0% |
| $200,000+ | 204 | 25.5% |
Family Income by Famaliy Size in Fairview
4-person families (74 | 9.2%) account for the highest median family income in Fairview with $157,188 per family, while 3-person families (167 | 20.8%) have the highest median income of $48,053 per family member.
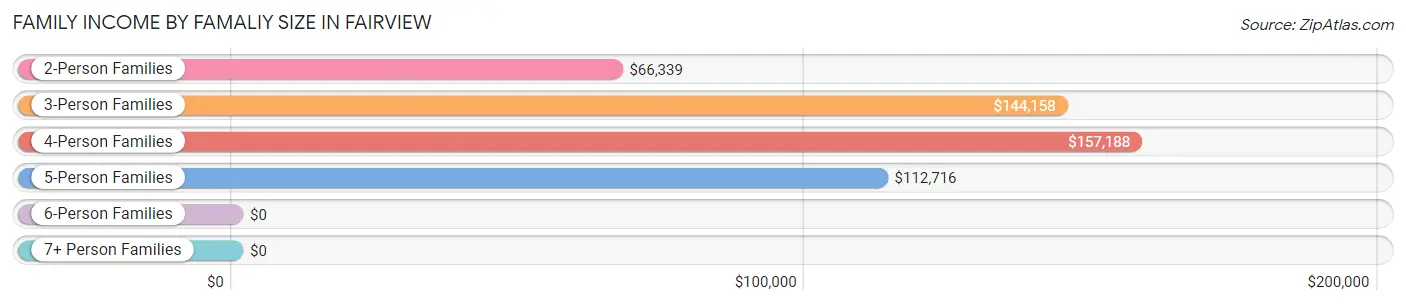
| Income Bracket | # Families | Median Income |
| 2-Person Families | 389 (48.6%) | $66,339 |
| 3-Person Families | 167 (20.8%) | $144,158 |
| 4-Person Families | 74 (9.2%) | $157,188 |
| 5-Person Families | 171 (21.3%) | $112,716 |
| 6-Person Families | 0 (0.0%) | $0 |
| 7+ Person Families | 0 (0.0%) | $0 |
| Total | 801 (100.0%) | $109,297 |
Family Income by Number of Earners in Fairview
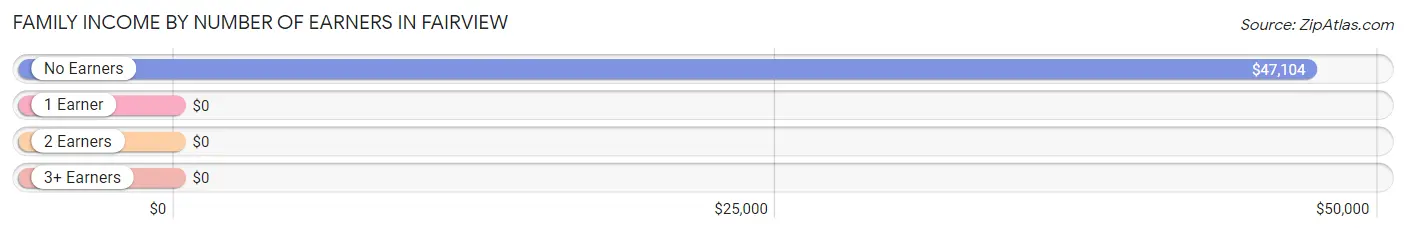
| Number of Earners | # Families | Median Income |
| No Earners | 197 (24.6%) | $47,104 |
| 1 Earner | 120 (15.0%) | $0 |
| 2 Earners | 468 (58.4%) | $0 |
| 3+ Earners | 16 (2.0%) | $0 |
| Total | 801 (100.0%) | $109,297 |
Household Income in Fairview
Household Income Brackets in Fairview
With 227 households falling in the category, the $100,000 to $149,999 income range is the most frequent in Fairview, accounting for 22.9% of all households. In contrast, only 16 households (1.6%) fall into the $150,000 to $199,999 income bracket, making it the least populous group.
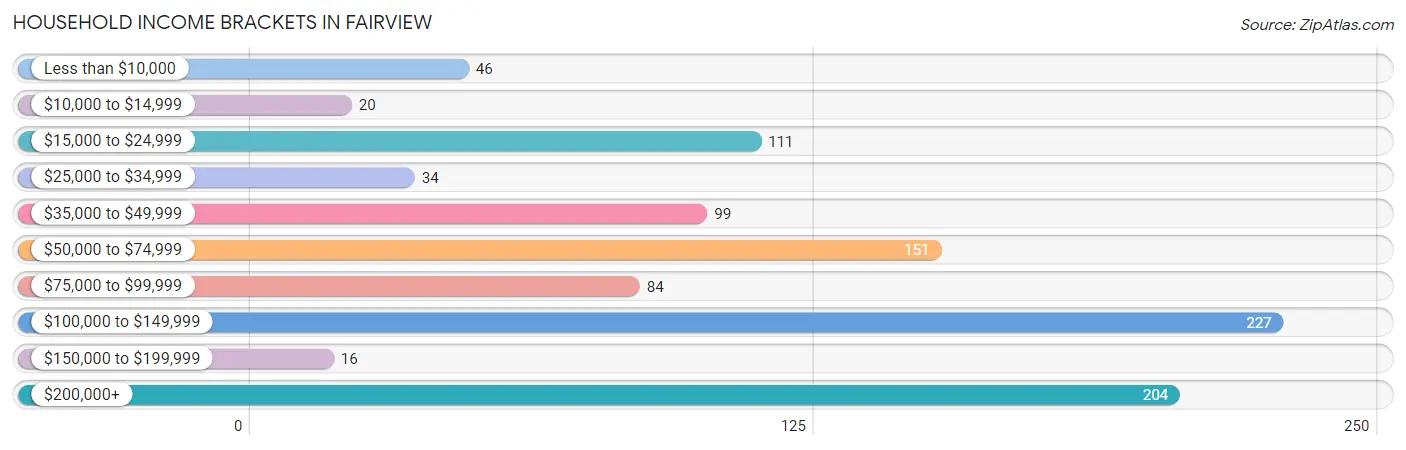
| Income Bracket | # Households | % Households |
| Less than $10,000 | 46 | 4.6% |
| $10,000 to $14,999 | 20 | 2.0% |
| $15,000 to $24,999 | 111 | 11.2% |
| $25,000 to $34,999 | 34 | 3.4% |
| $35,000 to $49,999 | 99 | 10.0% |
| $50,000 to $74,999 | 151 | 15.2% |
| $75,000 to $99,999 | 84 | 8.5% |
| $100,000 to $149,999 | 227 | 22.9% |
| $150,000 to $199,999 | 16 | 1.6% |
| $200,000+ | 204 | 20.6% |
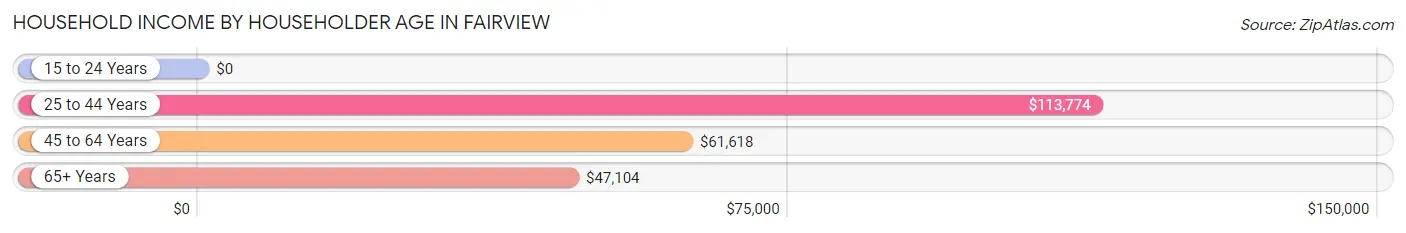
Household Income by Householder Age in Fairview
The median household income in Fairview is $90,388, with the highest median household income of $113,774 found in the 25 to 44 years age bracket for the primary householder. A total of 457 households (46.1%) fall into this category.
| Income Bracket | # Households | Median Income |
| 15 to 24 Years | 0 (0.0%) | $0 |
| 25 to 44 Years | 457 (46.1%) | $113,774 |
| 45 to 64 Years | 158 (15.9%) | $61,618 |
| 65+ Years | 377 (38.0%) | $47,104 |
| Total | 992 (100.0%) | $90,388 |
Poverty in Fairview
Income Below Poverty by Sex and Age in Fairview
With 3.9% poverty level for males and 6.1% for females among the residents of Fairview, 16 and 17 year old males and 55 to 64 year old females are the most vulnerable to poverty, with 18 males (100.0%) and 35 females (27.8%) in their respective age groups living below the poverty level.
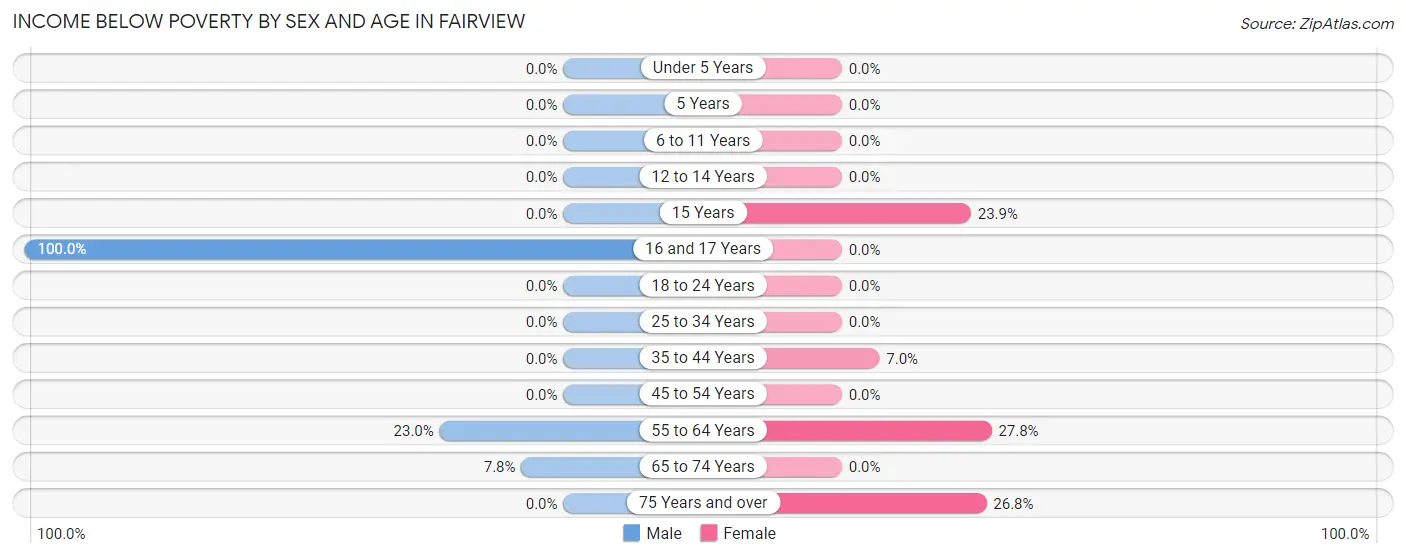
| Age Bracket | Male | Female |
| Under 5 Years | 0 (0.0%) | 0 (0.0%) |
| 5 Years | 0 (0.0%) | 0 (0.0%) |
| 6 to 11 Years | 0 (0.0%) | 0 (0.0%) |
| 12 to 14 Years | 0 (0.0%) | 0 (0.0%) |
| 15 Years | 0 (0.0%) | 17 (23.9%) |
| 16 and 17 Years | 18 (100.0%) | 0 (0.0%) |
| 18 to 24 Years | 0 (0.0%) | 0 (0.0%) |
| 25 to 34 Years | 0 (0.0%) | 0 (0.0%) |
| 35 to 44 Years | 0 (0.0%) | 20 (7.0%) |
| 45 to 54 Years | 0 (0.0%) | 0 (0.0%) |
| 55 to 64 Years | 17 (23.0%) | 35 (27.8%) |
| 65 to 74 Years | 18 (7.8%) | 0 (0.0%) |
| 75 Years and over | 0 (0.0%) | 11 (26.8%) |
| Total | 53 (3.9%) | 83 (6.1%) |
Income Above Poverty by Sex and Age in Fairview
According to the poverty statistics in Fairview, males aged under 5 years and females aged under 5 years are the age groups that are most secure financially, with 100.0% of males and 100.0% of females in these age groups living above the poverty line.
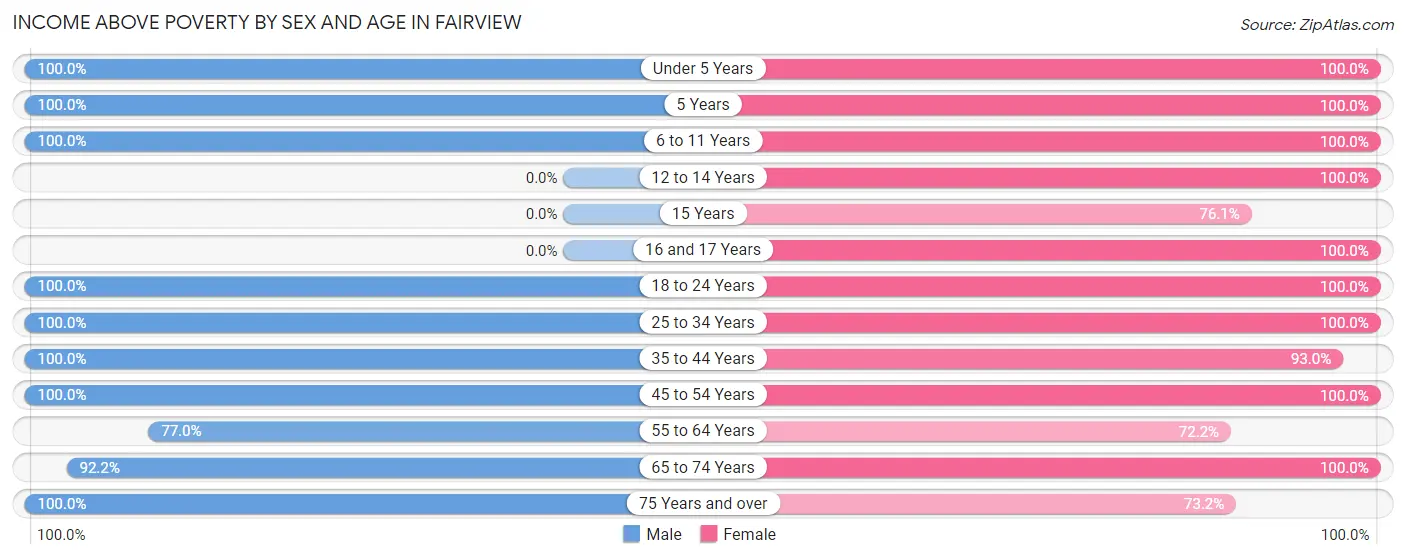
| Age Bracket | Male | Female |
| Under 5 Years | 17 (100.0%) | 82 (100.0%) |
| 5 Years | 18 (100.0%) | 20 (100.0%) |
| 6 to 11 Years | 166 (100.0%) | 112 (100.0%) |
| 12 to 14 Years | 0 (0.0%) | 164 (100.0%) |
| 15 Years | 0 (0.0%) | 54 (76.1%) |
| 16 and 17 Years | 0 (0.0%) | 14 (100.0%) |
| 18 to 24 Years | 114 (100.0%) | 11 (100.0%) |
| 25 to 34 Years | 242 (100.0%) | 130 (100.0%) |
| 35 to 44 Years | 300 (100.0%) | 267 (93.0%) |
| 45 to 54 Years | 19 (100.0%) | 46 (100.0%) |
| 55 to 64 Years | 57 (77.0%) | 91 (72.2%) |
| 65 to 74 Years | 213 (92.2%) | 249 (100.0%) |
| 75 Years and over | 147 (100.0%) | 30 (73.2%) |
| Total | 1,293 (96.1%) | 1,270 (93.9%) |
Income Below Poverty Among Married-Couple Families in Fairview
The poverty statistics for married-couple families in Fairview show that 2.5% or 18 of the total 734 families live below the poverty line. Families with no children have the highest poverty rate of 4.0%, comprising of 18 families. On the other hand, families with 1 or 2 children have the lowest poverty rate of 0.0%, which includes 0 families.
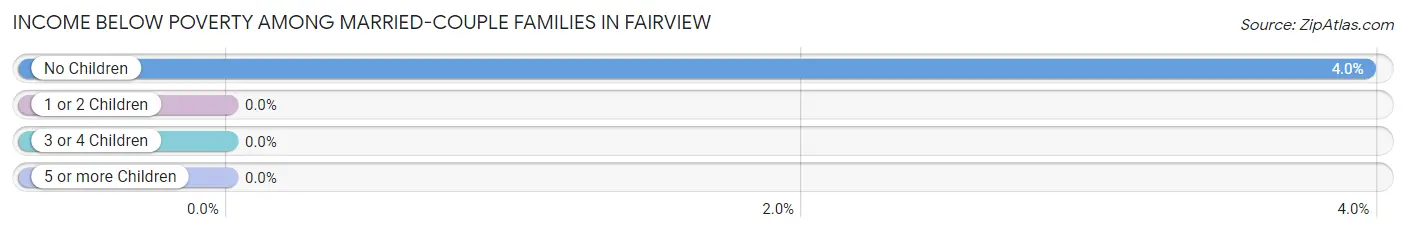
| Children | Above Poverty | Below Poverty |
| No Children | 437 (96.0%) | 18 (4.0%) |
| 1 or 2 Children | 150 (100.0%) | 0 (0.0%) |
| 3 or 4 Children | 129 (100.0%) | 0 (0.0%) |
| 5 or more Children | 0 (0.0%) | 0 (0.0%) |
| Total | 716 (97.6%) | 18 (2.5%) |
Income Below Poverty Among Single-Parent Households in Fairview
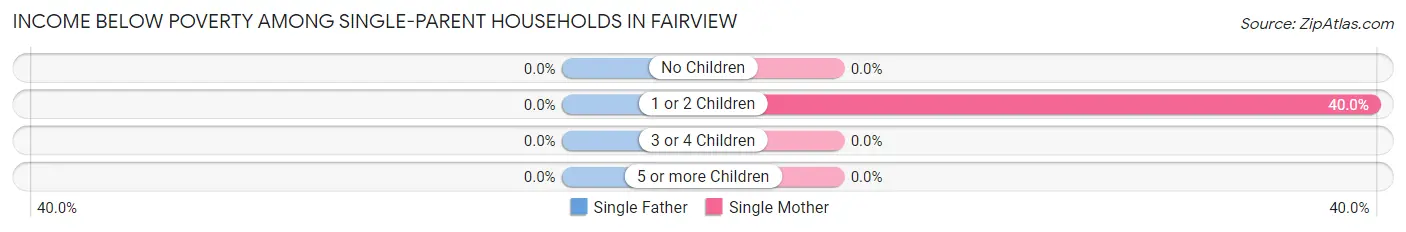
| Children | Single Father | Single Mother |
| No Children | 0 (0.0%) | 0 (0.0%) |
| 1 or 2 Children | 0 (0.0%) | 20 (40.0%) |
| 3 or 4 Children | 0 (0.0%) | 0 (0.0%) |
| 5 or more Children | 0 (0.0%) | 0 (0.0%) |
| Total | 0 (0.0%) | 20 (29.8%) |
Income Below Poverty Among Married-Couple vs Single-Parent Households in Fairview
The poverty data for Fairview shows that 18 of the married-couple family households (2.5%) and 20 of the single-parent households (29.8%) are living below the poverty level. Within the married-couple family households, those with no children have the highest poverty rate, with 18 households (4.0%) falling below the poverty line. Among the single-parent households, those with 1 or 2 children have the highest poverty rate, with 20 household (40.0%) living below poverty.
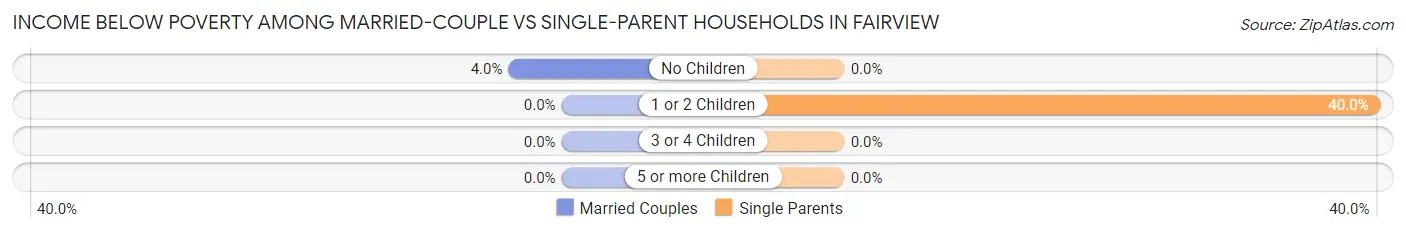
| Children | Married-Couple Families | Single-Parent Households |
| No Children | 18 (4.0%) | 0 (0.0%) |
| 1 or 2 Children | 0 (0.0%) | 20 (40.0%) |
| 3 or 4 Children | 0 (0.0%) | 0 (0.0%) |
| 5 or more Children | 0 (0.0%) | 0 (0.0%) |
| Total | 18 (2.5%) | 20 (29.8%) |
Race in Fairview
The most populous races in Fairview are White / Caucasian (2,669 | 90.2%), Two or more Races (234 | 7.9%), and Hispanic or Latino (225 | 7.6%).
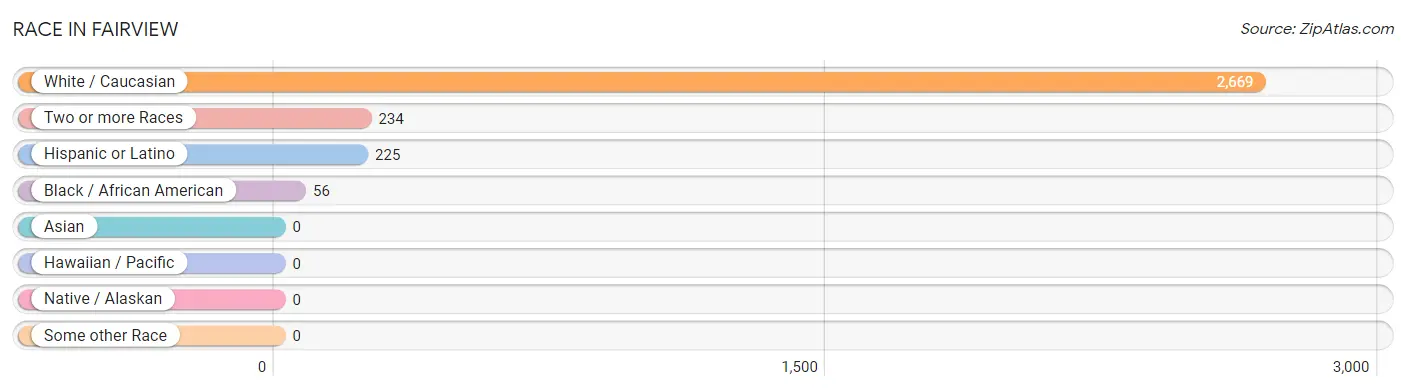
| Race | # Population | % Population |
| Asian | 0 | 0.0% |
| Black / African American | 56 | 1.9% |
| Hawaiian / Pacific | 0 | 0.0% |
| Hispanic or Latino | 225 | 7.6% |
| Native / Alaskan | 0 | 0.0% |
| White / Caucasian | 2,669 | 90.2% |
| Two or more Races | 234 | 7.9% |
| Some other Race | 0 | 0.0% |
| Total | 2,959 | 100.0% |
Ancestry in Fairview
The most populous ancestries reported in Fairview are German (886 | 29.9%), Italian (472 | 16.0%), Irish (427 | 14.4%), English (319 | 10.8%), and Polish (315 | 10.6%), together accounting for 81.8% of all Fairview residents.
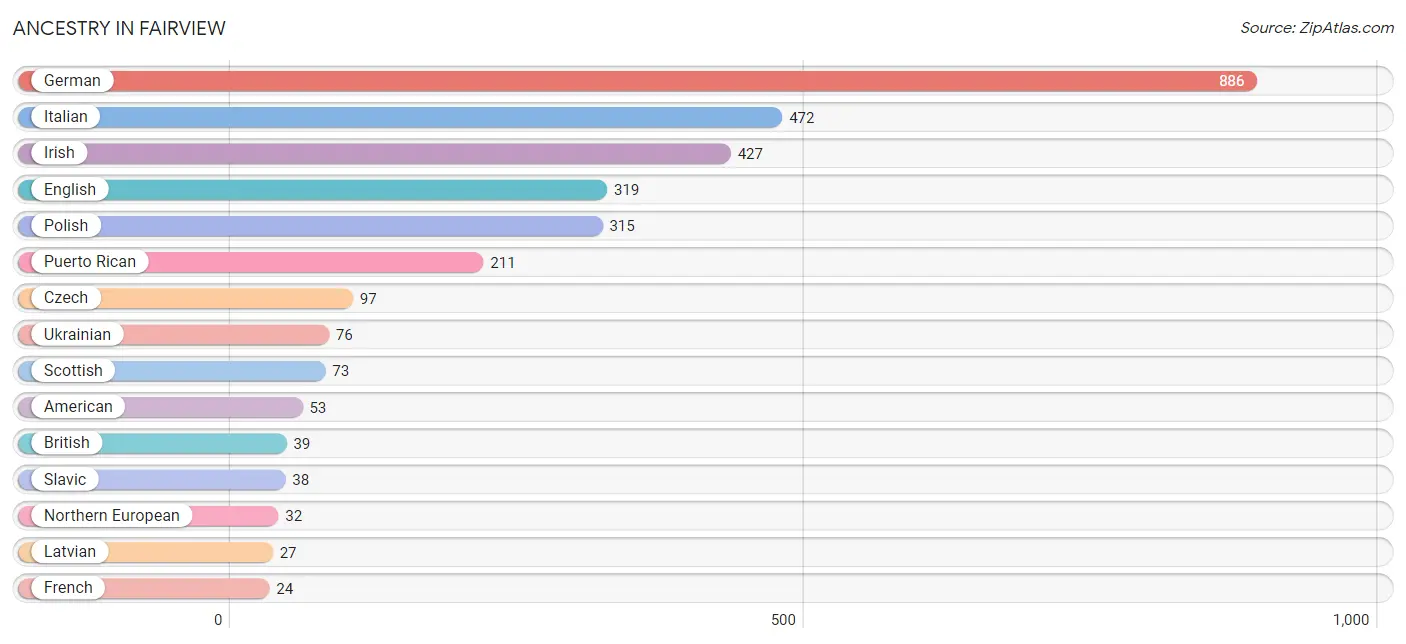
| Ancestry | # Population | % Population |
| American | 53 | 1.8% |
| Armenian | 16 | 0.5% |
| British | 39 | 1.3% |
| Czech | 97 | 3.3% |
| Eastern European | 19 | 0.6% |
| Ecuadorian | 14 | 0.5% |
| English | 319 | 10.8% |
| Finnish | 7 | 0.2% |
| French | 24 | 0.8% |
| German | 886 | 29.9% |
| Irish | 427 | 14.4% |
| Italian | 472 | 16.0% |
| Latvian | 27 | 0.9% |
| Northern European | 32 | 1.1% |
| Polish | 315 | 10.6% |
| Portuguese | 17 | 0.6% |
| Puerto Rican | 211 | 7.1% |
| Scandinavian | 20 | 0.7% |
| Scotch-Irish | 21 | 0.7% |
| Scottish | 73 | 2.5% |
| Slavic | 38 | 1.3% |
| Slovak | 14 | 0.5% |
| South American | 14 | 0.5% |
| Swiss | 20 | 0.7% |
| Ukrainian | 76 | 2.6% | View All 25 Rows |
Immigrants in Fairview
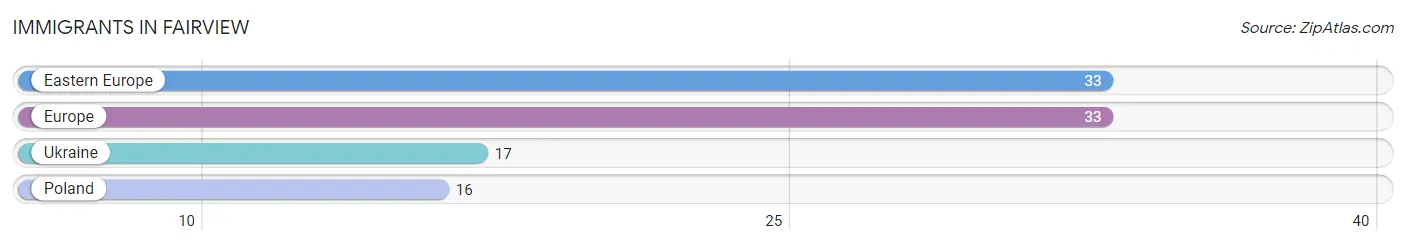
The most numerous immigrant groups reported in Fairview came from Eastern Europe (33 | 1.1%), Europe (33 | 1.1%), Ukraine (17 | 0.6%), and Poland (16 | 0.5%), together accounting for 3.4% of all Fairview residents.
| Immigration Origin | # Population | % Population |
| Eastern Europe | 33 | 1.1% |
| Europe | 33 | 1.1% |
| Poland | 16 | 0.5% |
| Ukraine | 17 | 0.6% | View All 4 Rows |
Sex and Age in Fairview
Sex and Age in Fairview
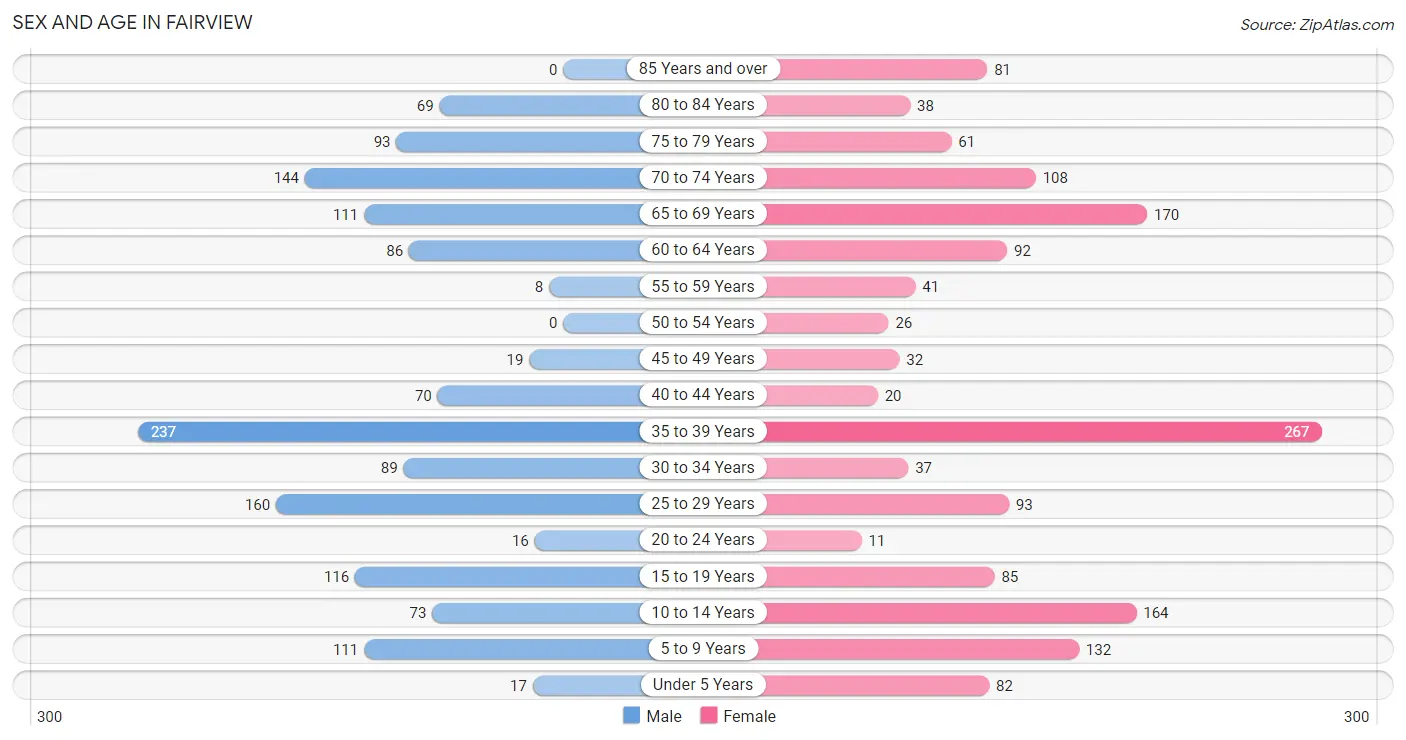
The most populous age groups in Fairview are 35 to 39 Years (237 | 16.7%) for men and 35 to 39 Years (267 | 17.3%) for women.
| Age Bracket | Male | Female |
| Under 5 Years | 17 (1.2%) | 82 (5.3%) |
| 5 to 9 Years | 111 (7.8%) | 132 (8.6%) |
| 10 to 14 Years | 73 (5.1%) | 164 (10.6%) |
| 15 to 19 Years | 116 (8.2%) | 85 (5.5%) |
| 20 to 24 Years | 16 (1.1%) | 11 (0.7%) |
| 25 to 29 Years | 160 (11.3%) | 93 (6.0%) |
| 30 to 34 Years | 89 (6.3%) | 37 (2.4%) |
| 35 to 39 Years | 237 (16.7%) | 267 (17.3%) |
| 40 to 44 Years | 70 (4.9%) | 20 (1.3%) |
| 45 to 49 Years | 19 (1.3%) | 32 (2.1%) |
| 50 to 54 Years | 0 (0.0%) | 26 (1.7%) |
| 55 to 59 Years | 8 (0.6%) | 41 (2.7%) |
| 60 to 64 Years | 86 (6.1%) | 92 (6.0%) |
| 65 to 69 Years | 111 (7.8%) | 170 (11.0%) |
| 70 to 74 Years | 144 (10.2%) | 108 (7.0%) |
| 75 to 79 Years | 93 (6.6%) | 61 (4.0%) |
| 80 to 84 Years | 69 (4.9%) | 38 (2.5%) |
| 85 Years and over | 0 (0.0%) | 81 (5.3%) |
| Total | 1,419 (100.0%) | 1,540 (100.0%) |
Families and Households in Fairview
Median Family Size in Fairview
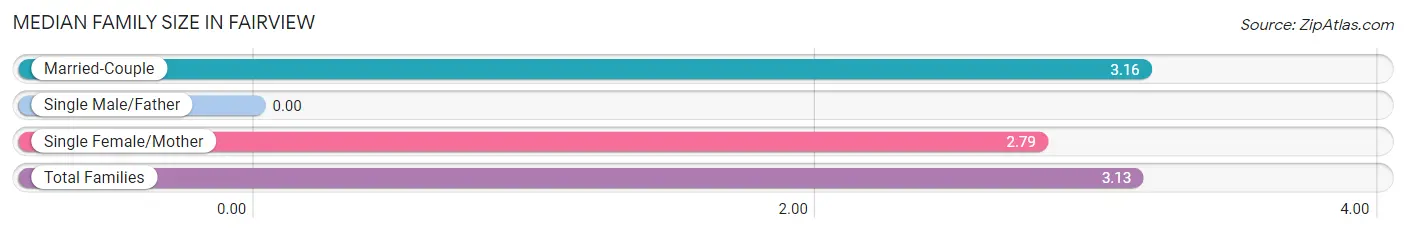
| Family Type | # Families | Family Size |
| Married-Couple | 734 (91.6%) | 3.16 |
| Single Male/Father | 0 (0.0%) | - |
| Single Female/Mother | 67 (8.4%) | 2.79 |
| Total Families | 801 (100.0%) | 3.13 |
Median Household Size in Fairview
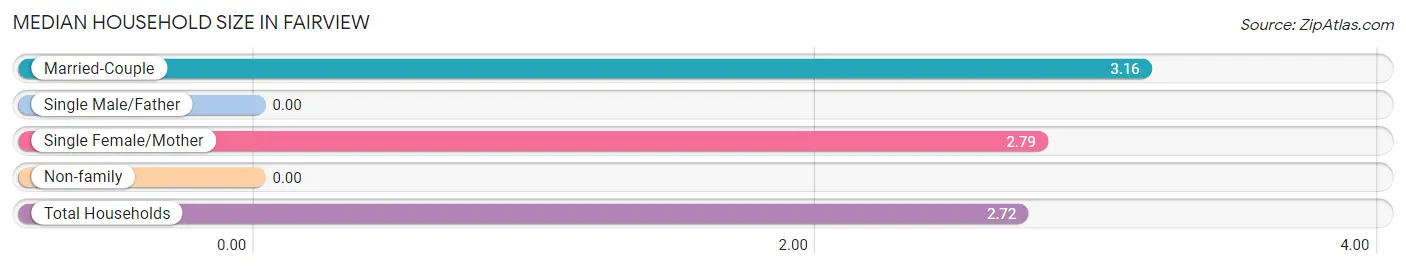
| Household Type | # Households | Household Size |
| Married-Couple | 734 (74.0%) | 3.16 |
| Single Male/Father | 0 (0.0%) | - |
| Single Female/Mother | 67 (6.8%) | 2.79 |
| Non-family | 191 (19.3%) | - |
| Total Households | 992 (100.0%) | 2.72 |
Household Size by Marriage Status in Fairview
Out of a total of 992 households in Fairview, 801 (80.7%) are family households, while 191 (19.3%) are nonfamily households. The most numerous type of family households are 2-person households, comprising 389, and the most common type of nonfamily households are 1-person households, comprising 191.
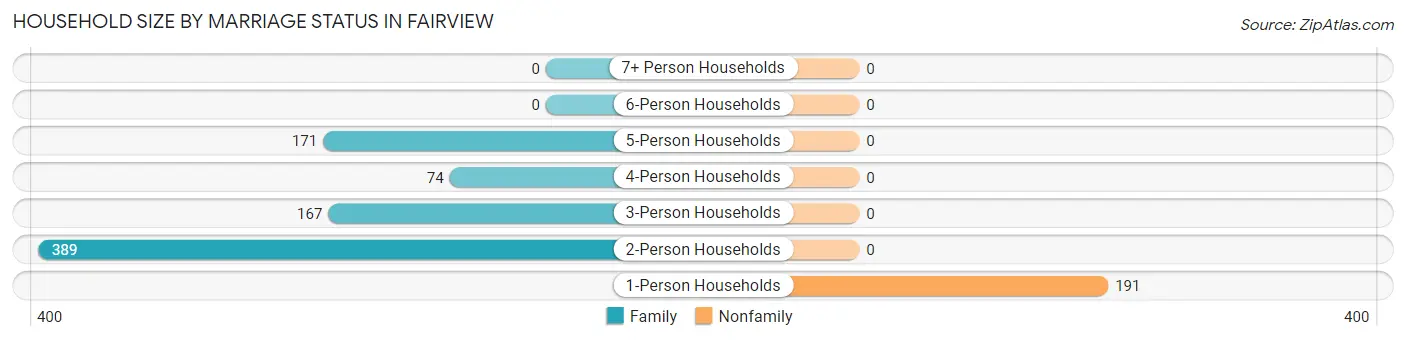
| Household Size | Family Households | Nonfamily Households |
| 1-Person Households | - | 191 (19.3%) |
| 2-Person Households | 389 (39.2%) | 0 (0.0%) |
| 3-Person Households | 167 (16.8%) | 0 (0.0%) |
| 4-Person Households | 74 (7.5%) | 0 (0.0%) |
| 5-Person Households | 171 (17.2%) | 0 (0.0%) |
| 6-Person Households | 0 (0.0%) | 0 (0.0%) |
| 7+ Person Households | 0 (0.0%) | 0 (0.0%) |
| Total | 801 (80.7%) | 191 (19.3%) |
Female Fertility in Fairview
Fertility by Age in Fairview
Average fertility rate in Fairview is 35.0 births per 1,000 women. Women in the age bracket of 35 to 50 years have the highest fertility rate with 60.0 births per 1,000 women. Women in the age bracket of 35 to 50 years acount for 100.0% of all women with births.
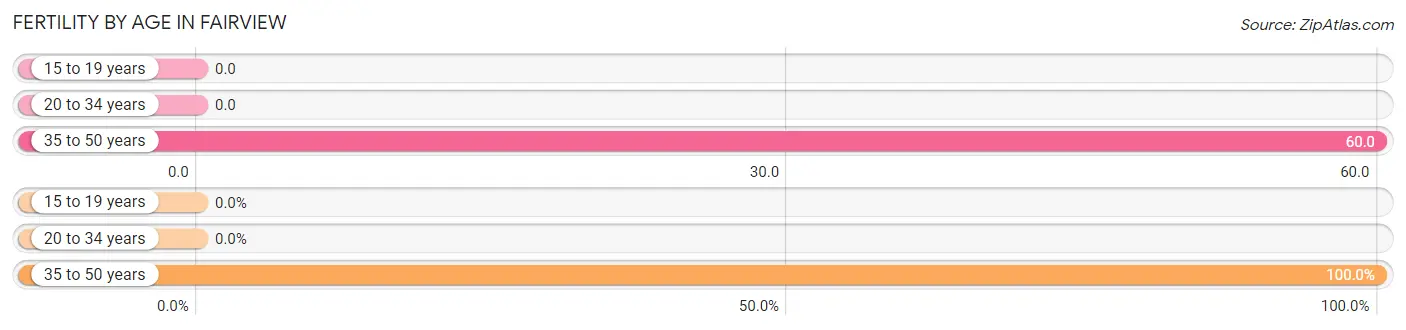
| Age Bracket | Women with Births | Births / 1,000 Women |
| 15 to 19 years | 0 (0.0%) | 0.0 |
| 20 to 34 years | 0 (0.0%) | 0.0 |
| 35 to 50 years | 19 (100.0%) | 60.0 |
| Total | 19 (100.0%) | 35.0 |
Fertility by Age by Marriage Status in Fairview
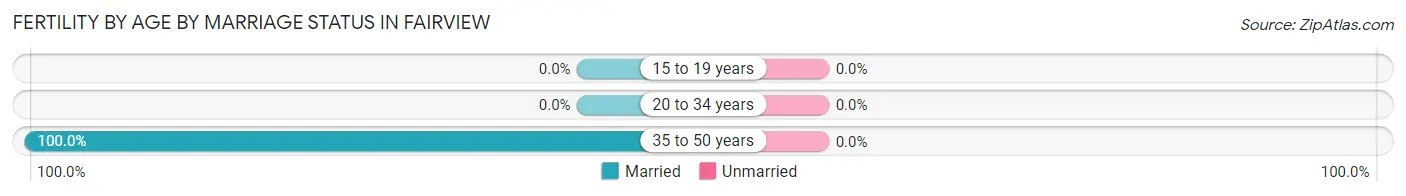
| Age Bracket | Married | Unmarried |
| 15 to 19 years | 0 (0.0%) | 0 (0.0%) |
| 20 to 34 years | 0 (0.0%) | 0 (0.0%) |
| 35 to 50 years | 19 (100.0%) | 0 (0.0%) |
| Total | 19 (100.0%) | 0 (0.0%) |
Fertility by Education in Fairview
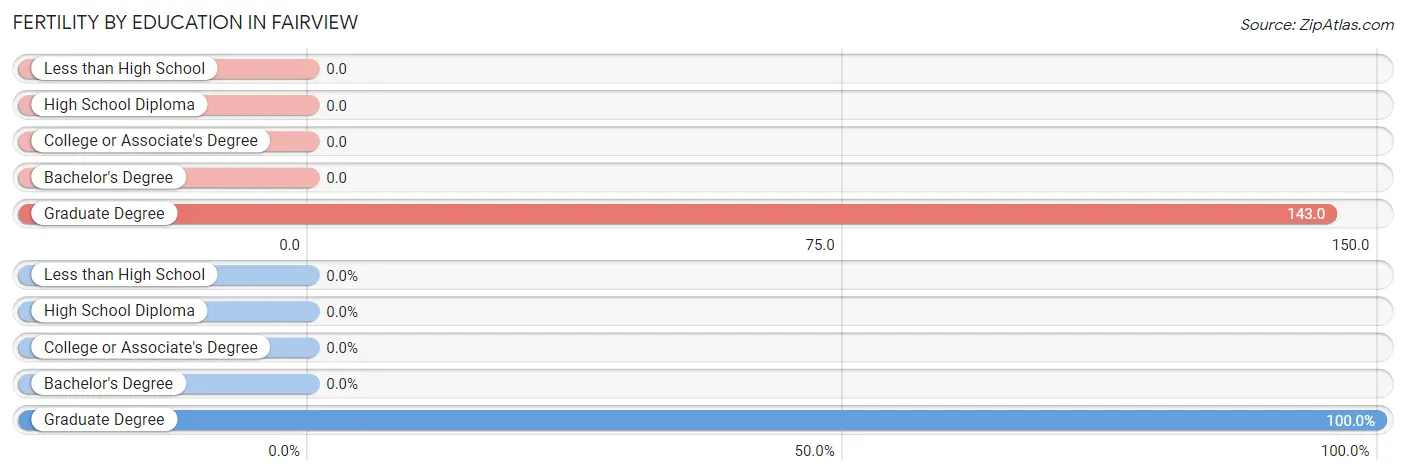
| Educational Attainment | Women with Births | Births / 1,000 Women |
| Less than High School | 0 (0.0%) | 0.0 |
| High School Diploma | 0 (0.0%) | 0.0 |
| College or Associate's Degree | 0 (0.0%) | 0.0 |
| Bachelor's Degree | 0 (0.0%) | 0.0 |
| Graduate Degree | 19 (100.0%) | 143.0 |
| Total | 19 (100.0%) | 35.0 |
Fertility by Education by Marriage Status in Fairview
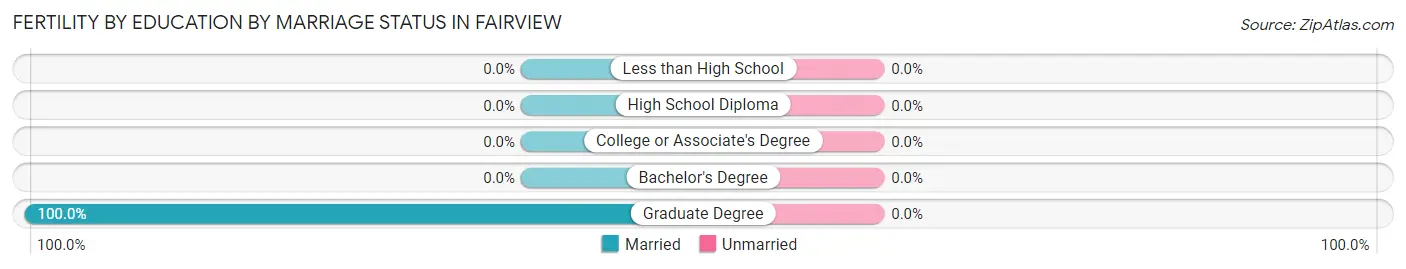
| Educational Attainment | Married | Unmarried |
| Less than High School | 0 (0.0%) | 0 (0.0%) |
| High School Diploma | 0 (0.0%) | 0 (0.0%) |
| College or Associate's Degree | 0 (0.0%) | 0 (0.0%) |
| Bachelor's Degree | 0 (0.0%) | 0 (0.0%) |
| Graduate Degree | 19 (100.0%) | 0 (0.0%) |
| Total | 19 (100.0%) | 0 (0.0%) |
Employment Characteristics in Fairview
Employment by Class of Employer in Fairview
Among the 1,108 employed individuals in Fairview, private company employees (622 | 56.1%), not-for-profit organizations (125 | 11.3%), and local government employees (122 | 11.0%) make up the most common classes of employment.
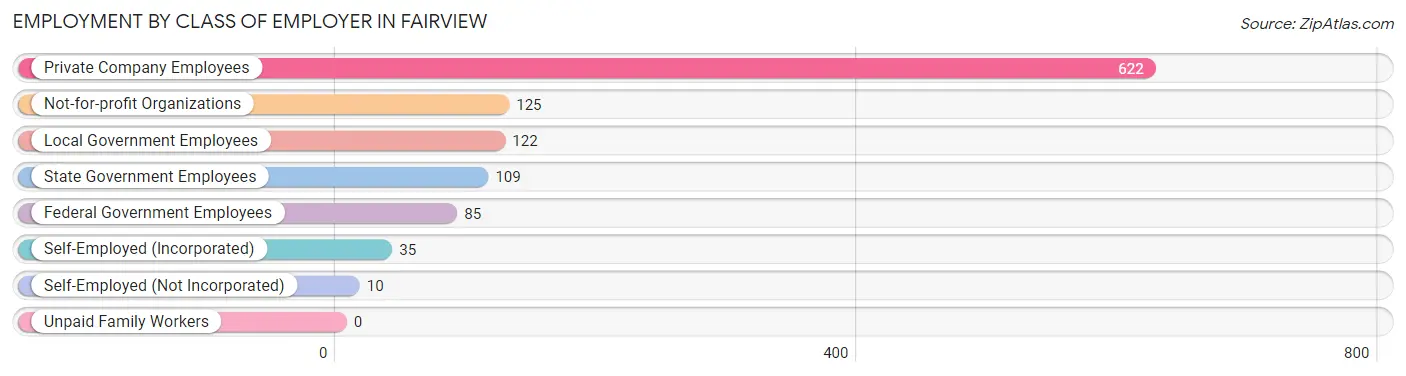
| Employer Class | # Employees | % Employees |
| Private Company Employees | 622 | 56.1% |
| Self-Employed (Incorporated) | 35 | 3.2% |
| Self-Employed (Not Incorporated) | 10 | 0.9% |
| Not-for-profit Organizations | 125 | 11.3% |
| Local Government Employees | 122 | 11.0% |
| State Government Employees | 109 | 9.8% |
| Federal Government Employees | 85 | 7.7% |
| Unpaid Family Workers | 0 | 0.0% |
| Total | 1,108 | 100.0% |
Employment Status by Age in Fairview
According to the labor force statistics for Fairview, out of the total population over 16 years of age (2,309), 54.0% or 1,247 individuals are in the labor force, with 11.2% or 140 of them unemployed. The age group with the highest labor force participation rate is 20 to 24 years, with 100.0% or 27 individuals in the labor force. Within the labor force, the 25 to 29 years age range has the highest percentage of unemployed individuals, with 39.3% or 90 of them being unemployed.
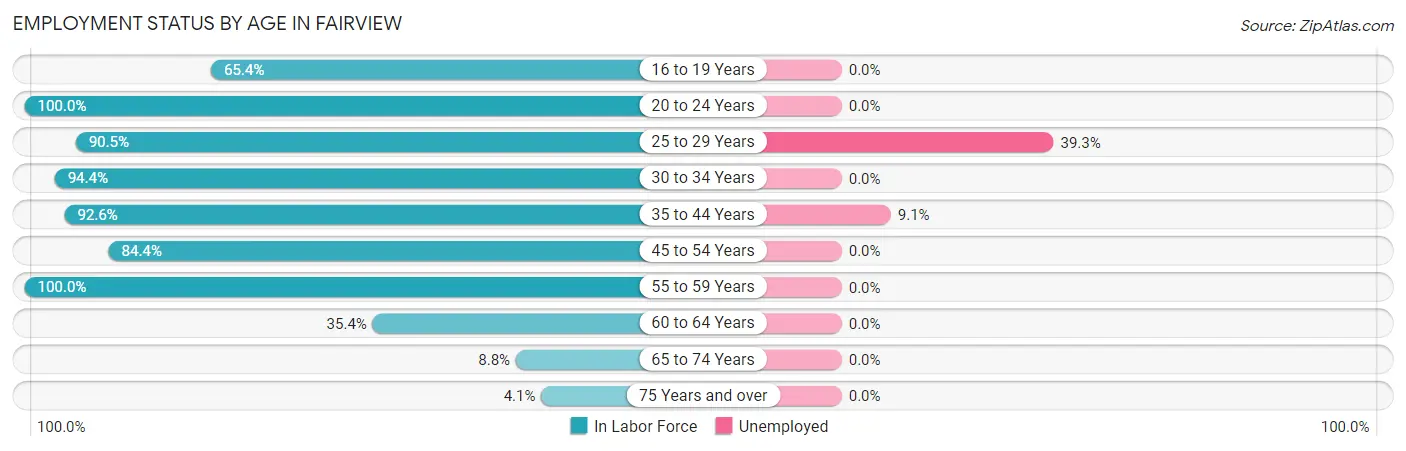
| Age Bracket | In Labor Force | Unemployed |
| 16 to 19 Years | 85 (65.4%) | 0 (0.0%) |
| 20 to 24 Years | 27 (100.0%) | 0 (0.0%) |
| 25 to 29 Years | 229 (90.5%) | 90 (39.3%) |
| 30 to 34 Years | 119 (94.4%) | 0 (0.0%) |
| 35 to 44 Years | 550 (92.6%) | 50 (9.1%) |
| 45 to 54 Years | 65 (84.4%) | 0 (0.0%) |
| 55 to 59 Years | 49 (100.0%) | 0 (0.0%) |
| 60 to 64 Years | 63 (35.4%) | 0 (0.0%) |
| 65 to 74 Years | 47 (8.8%) | 0 (0.0%) |
| 75 Years and over | 14 (4.1%) | 0 (0.0%) |
| Total | 1,247 (54.0%) | 140 (11.2%) |
Employment Status by Educational Attainment in Fairview
According to labor force statistics for Fairview, 84.2% of individuals (1,075) out of the total population between 25 and 64 years of age (1,277) are in the labor force, with 13.0% or 140 of them being unemployed. The group with the highest labor force participation rate are those with the educational attainment of bachelor's degree or higher, with 93.8% or 654 individuals in the labor force. Within the labor force, individuals with college / associate degree education have the highest percentage of unemployment, with 40.2% or 140 of them being unemployed.
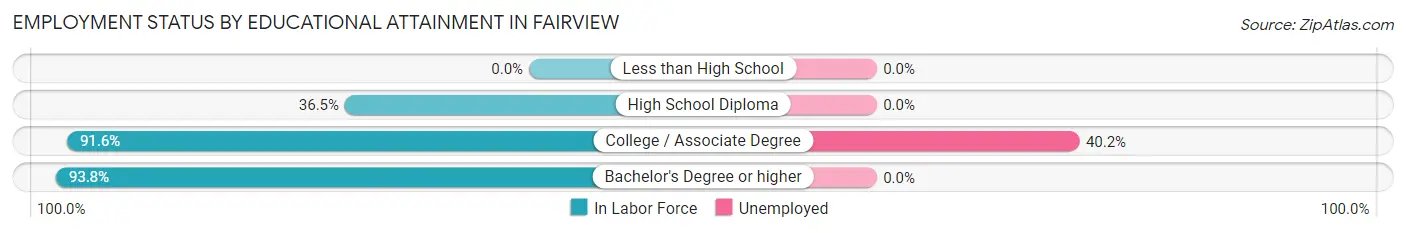
| Educational Attainment | In Labor Force | Unemployed |
| Less than High School | 0 (0.0%) | 0 (0.0%) |
| High School Diploma | 73 (36.5%) | 0 (0.0%) |
| College / Associate Degree | 348 (91.6%) | 153 (40.2%) |
| Bachelor's Degree or higher | 654 (93.8%) | 0 (0.0%) |
| Total | 1,075 (84.2%) | 166 (13.0%) |
Employment Occupations by Sex in Fairview
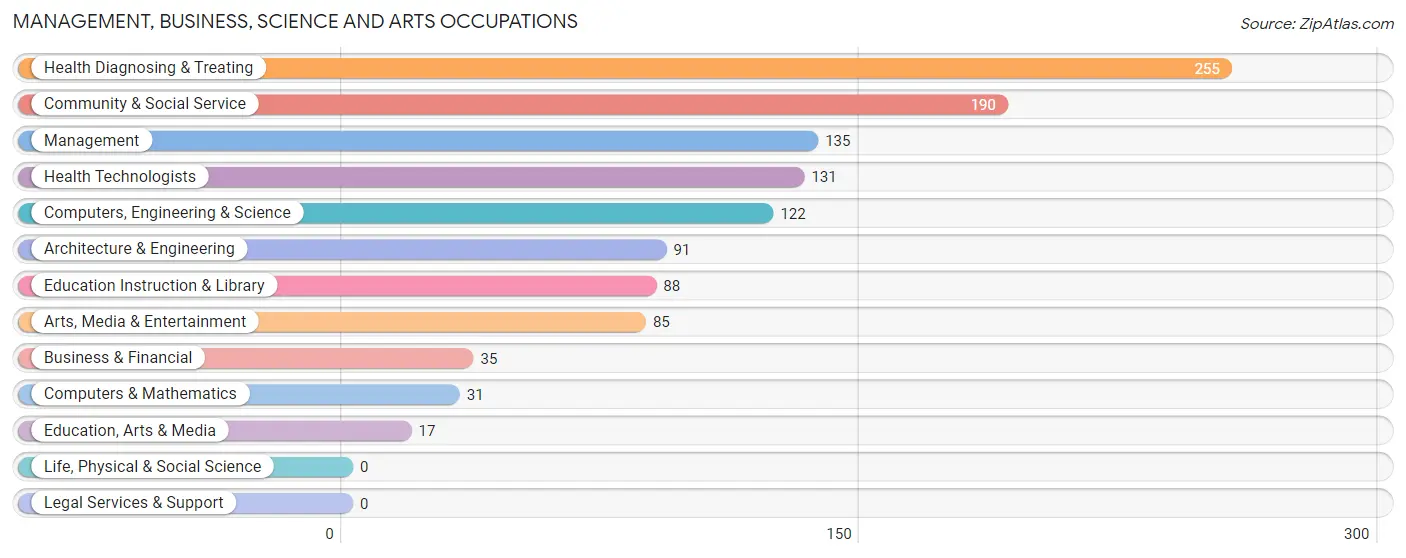
Management, Business, Science and Arts Occupations
The most common Management, Business, Science and Arts occupations in Fairview are Health Diagnosing & Treating (255 | 23.0%), Community & Social Service (190 | 17.2%), Management (135 | 12.2%), Health Technologists (131 | 11.8%), and Computers, Engineering & Science (122 | 11.0%).
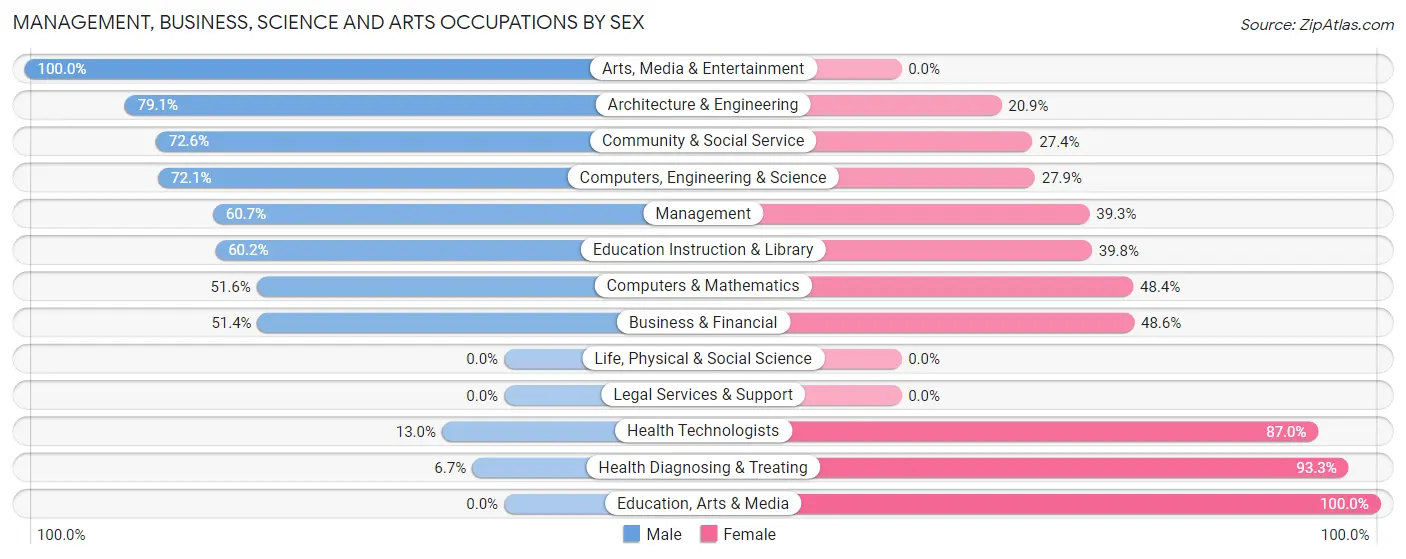
Management, Business, Science and Arts Occupations by Sex
Within the Management, Business, Science and Arts occupations in Fairview, the most male-oriented occupations are Arts, Media & Entertainment (100.0%), Architecture & Engineering (79.1%), and Community & Social Service (72.6%), while the most female-oriented occupations are Education, Arts & Media (100.0%), Health Diagnosing & Treating (93.3%), and Health Technologists (87.0%).
| Occupation | Male | Female |
| Management | 82 (60.7%) | 53 (39.3%) |
| Business & Financial | 18 (51.4%) | 17 (48.6%) |
| Computers, Engineering & Science | 88 (72.1%) | 34 (27.9%) |
| Computers & Mathematics | 16 (51.6%) | 15 (48.4%) |
| Architecture & Engineering | 72 (79.1%) | 19 (20.9%) |
| Life, Physical & Social Science | 0 (0.0%) | 0 (0.0%) |
| Community & Social Service | 138 (72.6%) | 52 (27.4%) |
| Education, Arts & Media | 0 (0.0%) | 17 (100.0%) |
| Legal Services & Support | 0 (0.0%) | 0 (0.0%) |
| Education Instruction & Library | 53 (60.2%) | 35 (39.8%) |
| Arts, Media & Entertainment | 85 (100.0%) | 0 (0.0%) |
| Health Diagnosing & Treating | 17 (6.7%) | 238 (93.3%) |
| Health Technologists | 17 (13.0%) | 114 (87.0%) |
| Total (Category) | 343 (46.5%) | 394 (53.5%) |
| Total (Overall) | 569 (51.3%) | 539 (48.6%) |
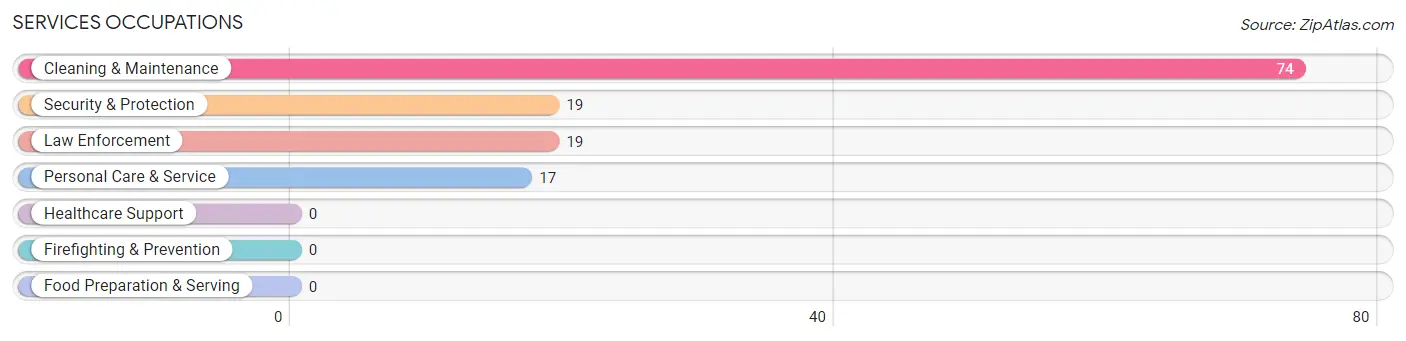
Services Occupations
The most common Services occupations in Fairview are Cleaning & Maintenance (74 | 6.7%), Security & Protection (19 | 1.7%), Law Enforcement (19 | 1.7%), and Personal Care & Service (17 | 1.5%).
Services Occupations by Sex
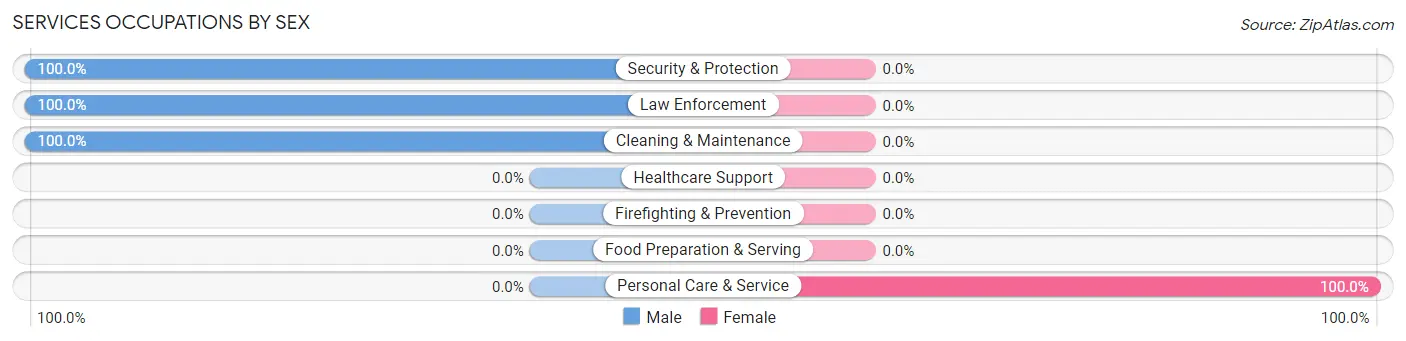
| Occupation | Male | Female |
| Healthcare Support | 0 (0.0%) | 0 (0.0%) |
| Security & Protection | 19 (100.0%) | 0 (0.0%) |
| Firefighting & Prevention | 0 (0.0%) | 0 (0.0%) |
| Law Enforcement | 19 (100.0%) | 0 (0.0%) |
| Food Preparation & Serving | 0 (0.0%) | 0 (0.0%) |
| Cleaning & Maintenance | 74 (100.0%) | 0 (0.0%) |
| Personal Care & Service | 0 (0.0%) | 17 (100.0%) |
| Total (Category) | 93 (84.6%) | 17 (15.4%) |
| Total (Overall) | 569 (51.3%) | 539 (48.6%) |
Sales and Office Occupations
The most common Sales and Office occupations in Fairview are Office & Administration (109 | 9.8%), and Sales & Related (58 | 5.2%).
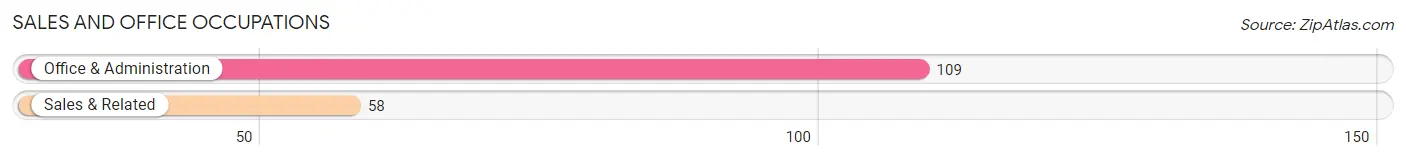
Sales and Office Occupations by Sex

| Occupation | Male | Female |
| Sales & Related | 41 (70.7%) | 17 (29.3%) |
| Office & Administration | 18 (16.5%) | 91 (83.5%) |
| Total (Category) | 59 (35.3%) | 108 (64.7%) |
| Total (Overall) | 569 (51.3%) | 539 (48.6%) |
Natural Resources, Construction and Maintenance Occupations
The most common Natural Resources, Construction and Maintenance occupations in Fairview are Installation, Maintenance & Repair (26 | 2.4%), and Construction & Extraction (16 | 1.4%).
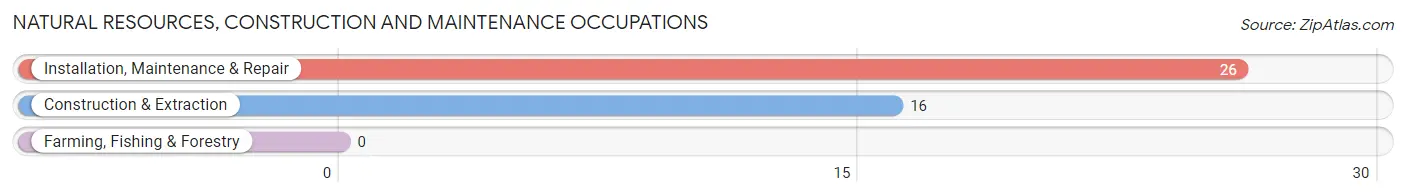
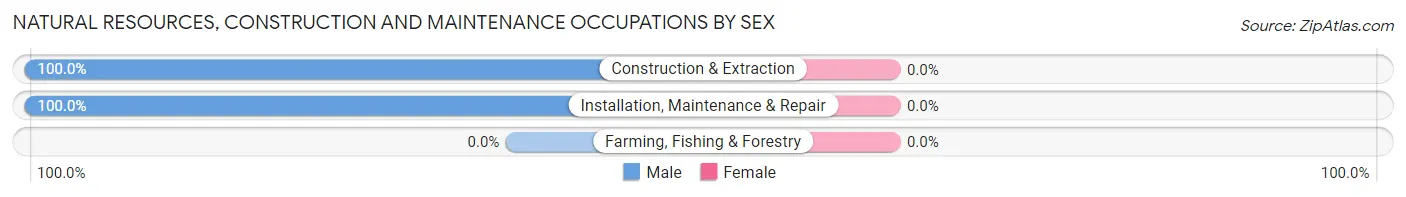
Natural Resources, Construction and Maintenance Occupations by Sex
| Occupation | Male | Female |
| Farming, Fishing & Forestry | 0 (0.0%) | 0 (0.0%) |
| Construction & Extraction | 16 (100.0%) | 0 (0.0%) |
| Installation, Maintenance & Repair | 26 (100.0%) | 0 (0.0%) |
| Total (Category) | 42 (100.0%) | 0 (0.0%) |
| Total (Overall) | 569 (51.3%) | 539 (48.6%) |
Production, Transportation and Moving Occupations
The most common Production, Transportation and Moving occupations in Fairview are Production (32 | 2.9%), and Material Moving (20 | 1.8%).
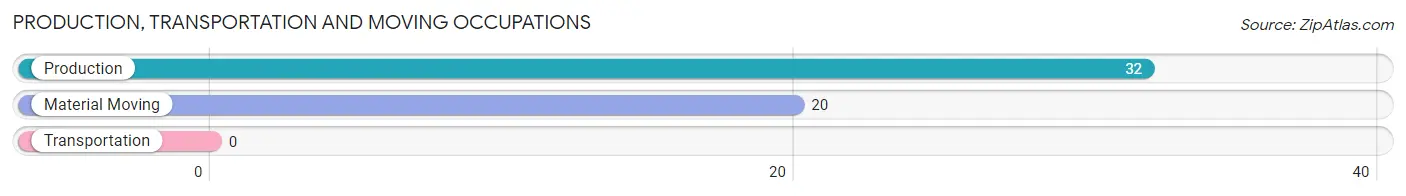
Production, Transportation and Moving Occupations by Sex
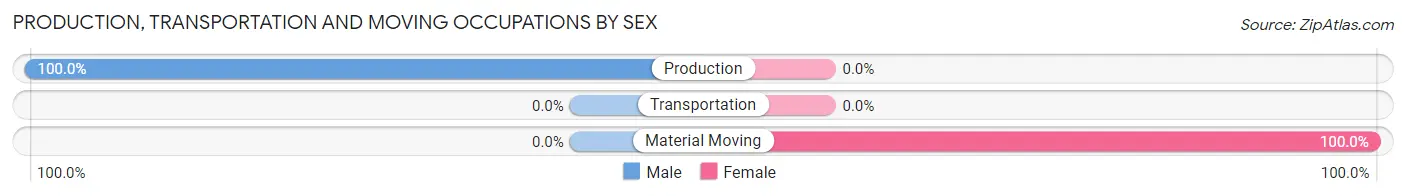
| Occupation | Male | Female |
| Production | 32 (100.0%) | 0 (0.0%) |
| Transportation | 0 (0.0%) | 0 (0.0%) |
| Material Moving | 0 (0.0%) | 20 (100.0%) |
| Total (Category) | 32 (61.5%) | 20 (38.5%) |
| Total (Overall) | 569 (51.3%) | 539 (48.6%) |
Employment Industries by Sex in Fairview
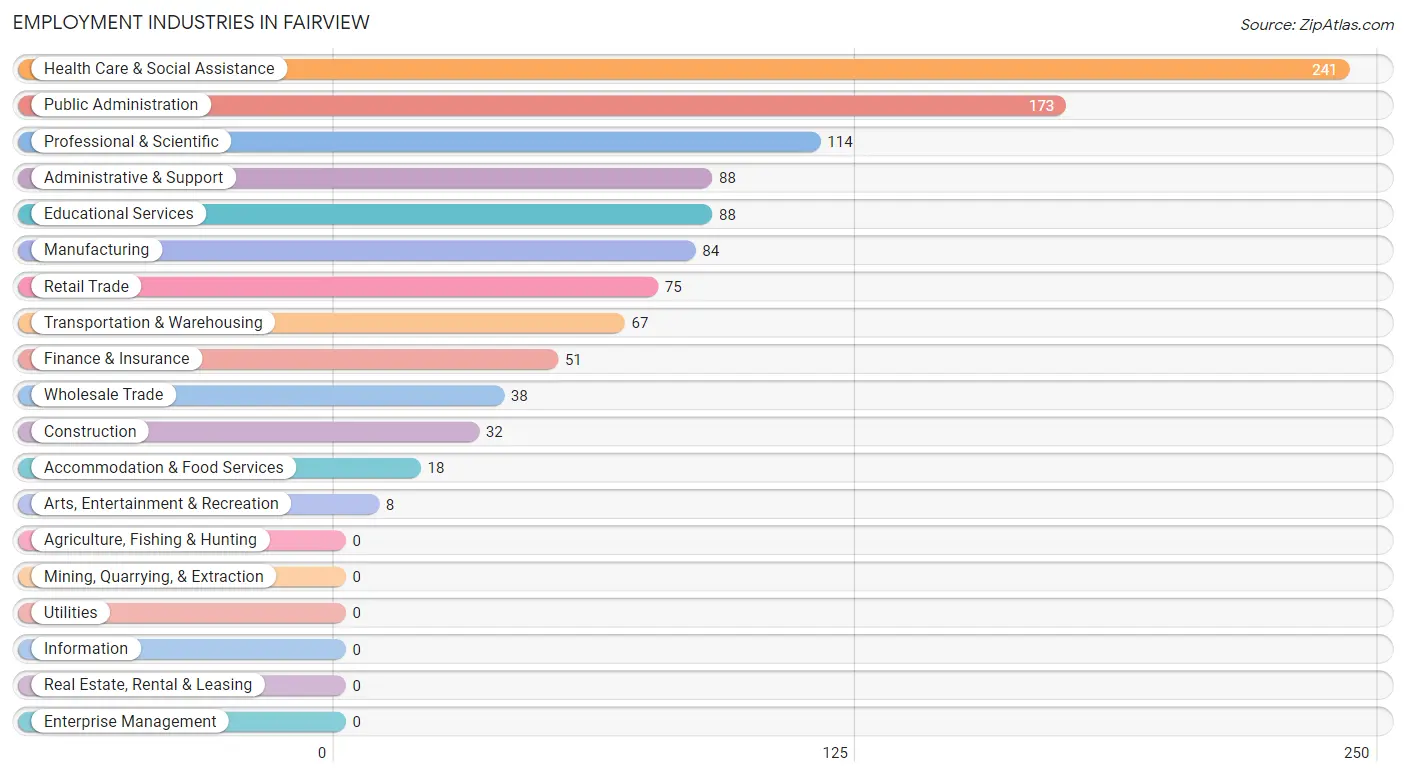
Employment Industries in Fairview
The major employment industries in Fairview include Health Care & Social Assistance (241 | 21.7%), Public Administration (173 | 15.6%), Professional & Scientific (114 | 10.3%), Administrative & Support (88 | 7.9%), and Educational Services (88 | 7.9%).
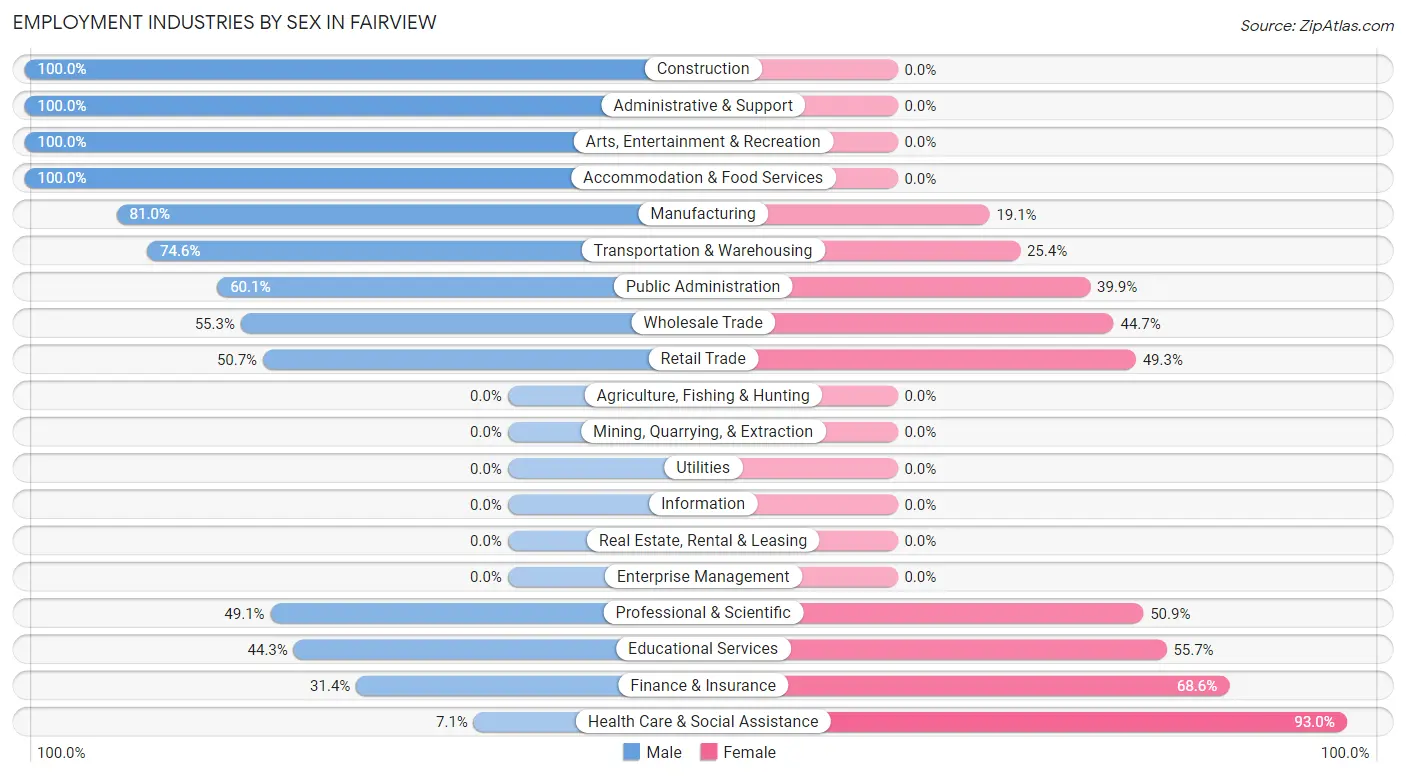
Employment Industries by Sex in Fairview
The Fairview industries that see more men than women are Construction (100.0%), Administrative & Support (100.0%), and Arts, Entertainment & Recreation (100.0%), whereas the industries that tend to have a higher number of women are Health Care & Social Assistance (92.9%), Finance & Insurance (68.6%), and Educational Services (55.7%).
| Industry | Male | Female |
| Agriculture, Fishing & Hunting | 0 (0.0%) | 0 (0.0%) |
| Mining, Quarrying, & Extraction | 0 (0.0%) | 0 (0.0%) |
| Construction | 32 (100.0%) | 0 (0.0%) |
| Manufacturing | 68 (80.9%) | 16 (19.1%) |
| Wholesale Trade | 21 (55.3%) | 17 (44.7%) |
| Retail Trade | 38 (50.7%) | 37 (49.3%) |
| Transportation & Warehousing | 50 (74.6%) | 17 (25.4%) |
| Utilities | 0 (0.0%) | 0 (0.0%) |
| Information | 0 (0.0%) | 0 (0.0%) |
| Finance & Insurance | 16 (31.4%) | 35 (68.6%) |
| Real Estate, Rental & Leasing | 0 (0.0%) | 0 (0.0%) |
| Professional & Scientific | 56 (49.1%) | 58 (50.9%) |
| Enterprise Management | 0 (0.0%) | 0 (0.0%) |
| Administrative & Support | 88 (100.0%) | 0 (0.0%) |
| Educational Services | 39 (44.3%) | 49 (55.7%) |
| Health Care & Social Assistance | 17 (7.0%) | 224 (92.9%) |
| Arts, Entertainment & Recreation | 8 (100.0%) | 0 (0.0%) |
| Accommodation & Food Services | 18 (100.0%) | 0 (0.0%) |
| Public Administration | 104 (60.1%) | 69 (39.9%) |
| Total | 569 (51.3%) | 539 (48.6%) |
Education in Fairview
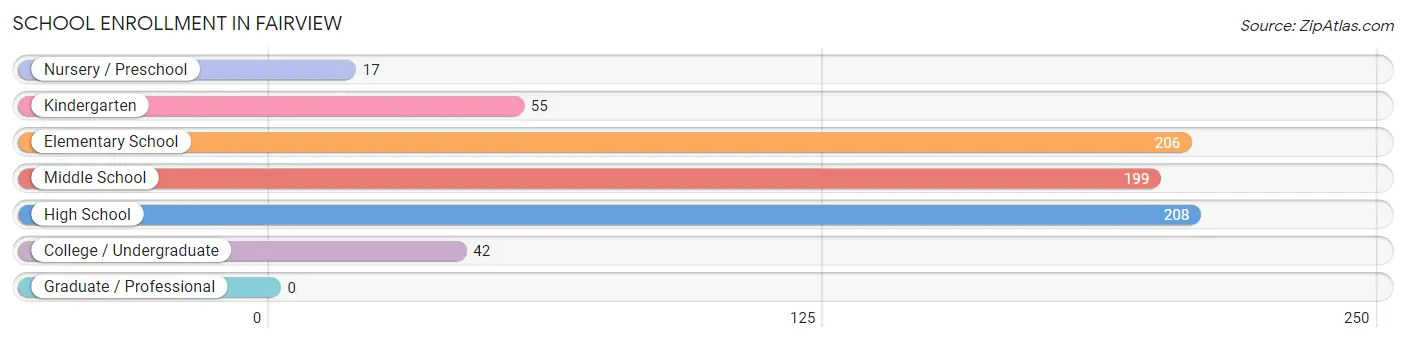
School Enrollment in Fairview
The most common levels of schooling among the 727 students in Fairview are high school (208 | 28.6%), elementary school (206 | 28.3%), and middle school (199 | 27.4%).
| School Level | # Students | % Students |
| Nursery / Preschool | 17 | 2.3% |
| Kindergarten | 55 | 7.6% |
| Elementary School | 206 | 28.3% |
| Middle School | 199 | 27.4% |
| High School | 208 | 28.6% |
| College / Undergraduate | 42 | 5.8% |
| Graduate / Professional | 0 | 0.0% |
| Total | 727 | 100.0% |
School Enrollment by Age by Funding Source in Fairview
Out of a total of 727 students who are enrolled in schools in Fairview, 58 (8.0%) attend a private institution, while the remaining 669 (92.0%) are enrolled in public schools. The age group of 3 to 4 year olds has the highest likelihood of being enrolled in private schools, with 17 (100.0% in the age bracket) enrolled. Conversely, the age group of 5 to 9 year old has the lowest likelihood of being enrolled in a private school, with 243 (100.0% in the age bracket) attending a public institution.
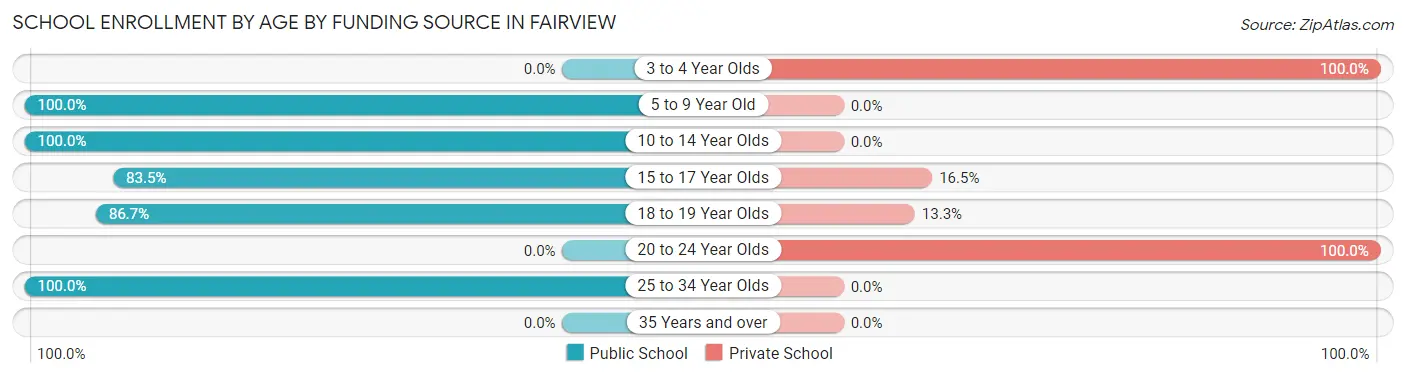
| Age Bracket | Public School | Private School |
| 3 to 4 Year Olds | 0 (0.0%) | 17 (100.0%) |
| 5 to 9 Year Old | 243 (100.0%) | 0 (0.0%) |
| 10 to 14 Year Olds | 237 (100.0%) | 0 (0.0%) |
| 15 to 17 Year Olds | 86 (83.5%) | 17 (16.5%) |
| 18 to 19 Year Olds | 85 (86.7%) | 13 (13.3%) |
| 20 to 24 Year Olds | 0 (0.0%) | 11 (100.0%) |
| 25 to 34 Year Olds | 18 (100.0%) | 0 (0.0%) |
| 35 Years and over | 0 (0.0%) | 0 (0.0%) |
| Total | 669 (92.0%) | 58 (8.0%) |
Educational Attainment by Field of Study in Fairview
Business (269 | 27.4%), bio, nature & agricultural (113 | 11.5%), education (112 | 11.4%), science & technology (81 | 8.3%), and communications (78 | 7.9%) are the most common fields of study among 982 individuals in Fairview who have obtained a bachelor's degree or higher.
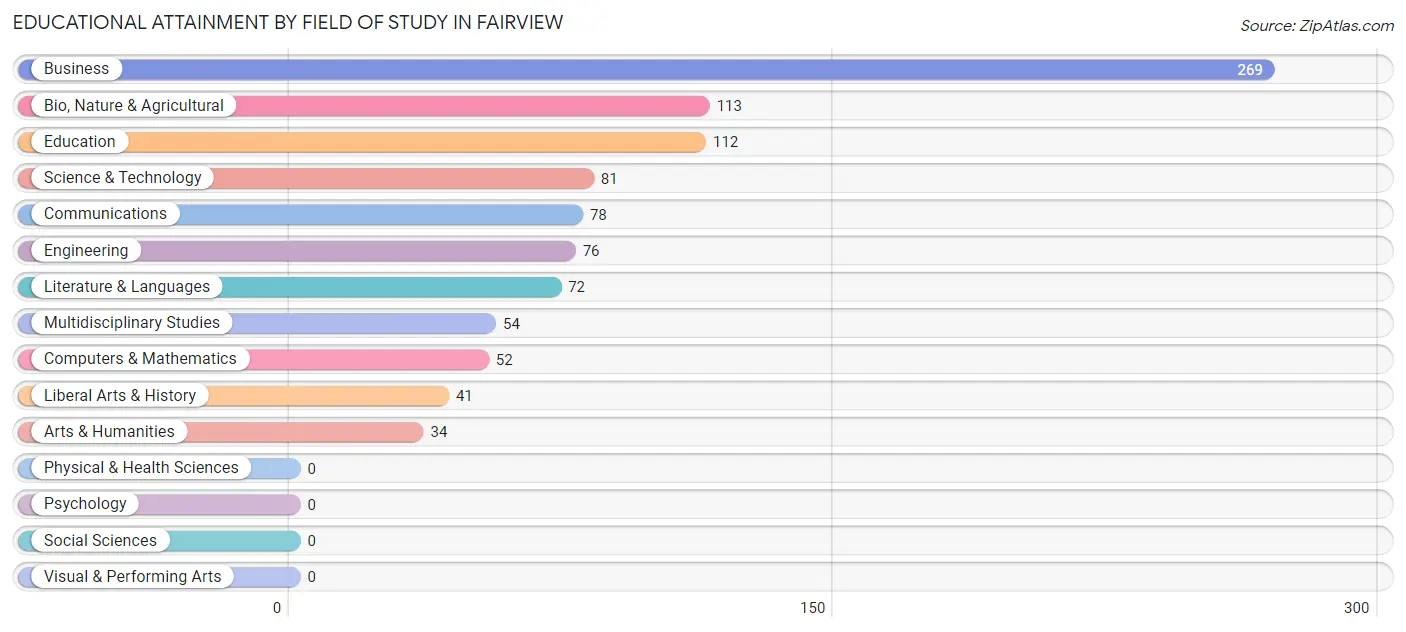
| Field of Study | # Graduates | % Graduates |
| Computers & Mathematics | 52 | 5.3% |
| Bio, Nature & Agricultural | 113 | 11.5% |
| Physical & Health Sciences | 0 | 0.0% |
| Psychology | 0 | 0.0% |
| Social Sciences | 0 | 0.0% |
| Engineering | 76 | 7.7% |
| Multidisciplinary Studies | 54 | 5.5% |
| Science & Technology | 81 | 8.3% |
| Business | 269 | 27.4% |
| Education | 112 | 11.4% |
| Literature & Languages | 72 | 7.3% |
| Liberal Arts & History | 41 | 4.2% |
| Visual & Performing Arts | 0 | 0.0% |
| Communications | 78 | 7.9% |
| Arts & Humanities | 34 | 3.5% |
| Total | 982 | 100.0% |
Transportation & Commute in Fairview
Vehicle Availability by Sex in Fairview
The most prevalent vehicle ownership categories in Fairview are males with 2 vehicles (441, accounting for 77.5%) and females with 2 vehicles (387, making up 81.8%).
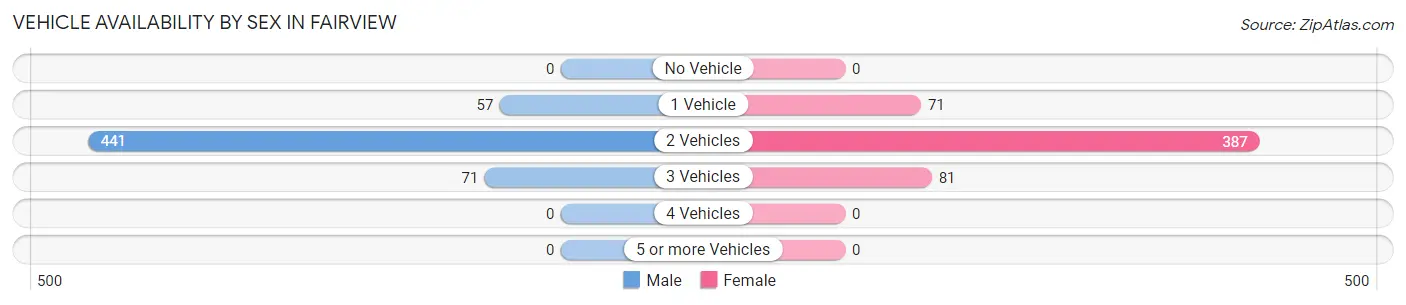
| Vehicles Available | Male | Female |
| No Vehicle | 0 (0.0%) | 0 (0.0%) |
| 1 Vehicle | 57 (10.0%) | 71 (13.2%) |
| 2 Vehicles | 441 (77.5%) | 387 (71.8%) |
| 3 Vehicles | 71 (12.5%) | 81 (15.0%) |
| 4 Vehicles | 0 (0.0%) | 0 (0.0%) |
| 5 or more Vehicles | 0 (0.0%) | 0 (0.0%) |
| Total | 569 (100.0%) | 539 (100.0%) |
Commute Time in Fairview
The most frequently occuring commute durations in Fairview are 25 to 29 minutes (277 commuters, 28.0%), 30 to 34 minutes (151 commuters, 15.2%), and 20 to 24 minutes (126 commuters, 12.7%).
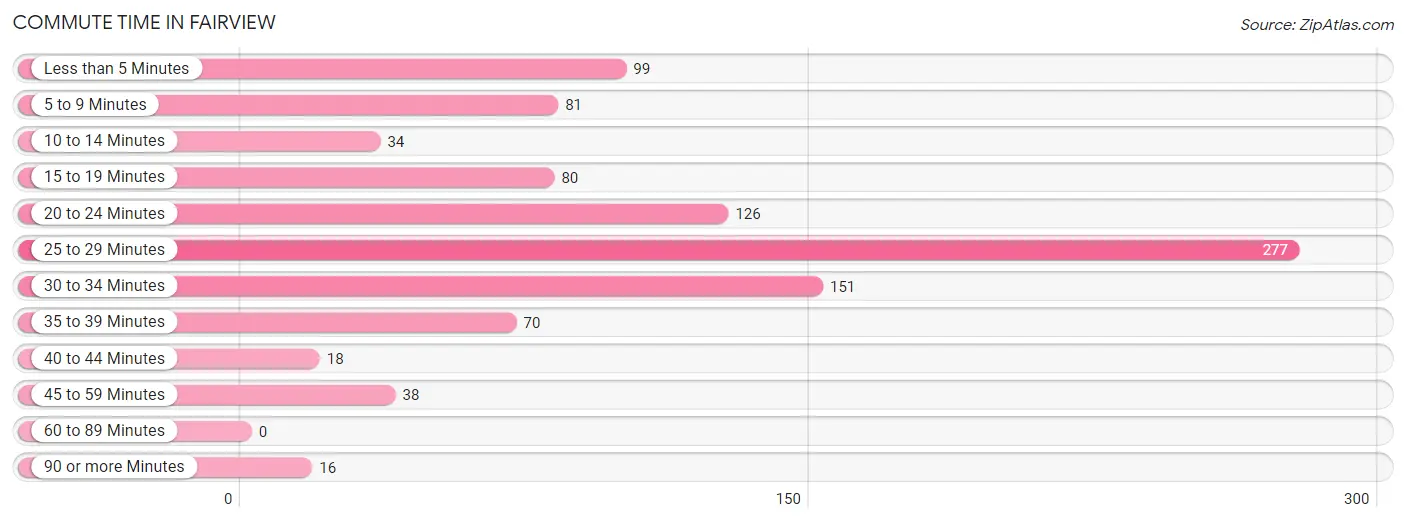
| Commute Time | # Commuters | % Commuters |
| Less than 5 Minutes | 99 | 10.0% |
| 5 to 9 Minutes | 81 | 8.2% |
| 10 to 14 Minutes | 34 | 3.4% |
| 15 to 19 Minutes | 80 | 8.1% |
| 20 to 24 Minutes | 126 | 12.7% |
| 25 to 29 Minutes | 277 | 28.0% |
| 30 to 34 Minutes | 151 | 15.2% |
| 35 to 39 Minutes | 70 | 7.1% |
| 40 to 44 Minutes | 18 | 1.8% |
| 45 to 59 Minutes | 38 | 3.8% |
| 60 to 89 Minutes | 0 | 0.0% |
| 90 or more Minutes | 16 | 1.6% |
Commute Time by Sex in Fairview
The most common commute times in Fairview are 25 to 29 minutes (137 commuters, 24.4%) for males and 25 to 29 minutes (140 commuters, 32.6%) for females.
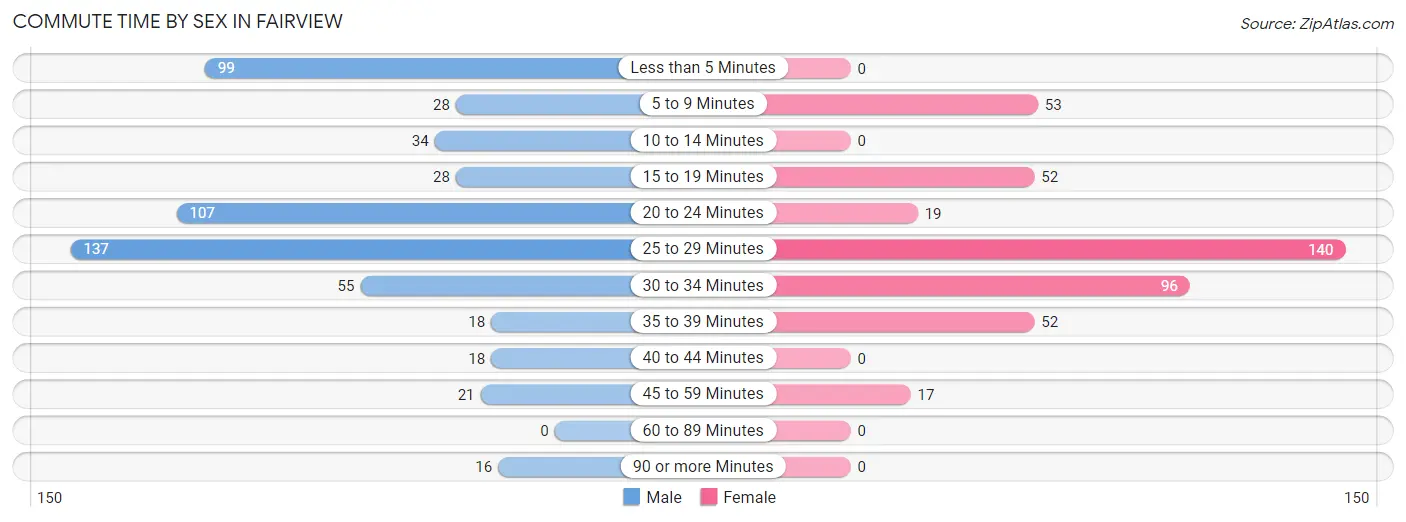
| Commute Time | Male | Female |
| Less than 5 Minutes | 99 (17.6%) | 0 (0.0%) |
| 5 to 9 Minutes | 28 (5.0%) | 53 (12.3%) |
| 10 to 14 Minutes | 34 (6.1%) | 0 (0.0%) |
| 15 to 19 Minutes | 28 (5.0%) | 52 (12.1%) |
| 20 to 24 Minutes | 107 (19.1%) | 19 (4.4%) |
| 25 to 29 Minutes | 137 (24.4%) | 140 (32.6%) |
| 30 to 34 Minutes | 55 (9.8%) | 96 (22.4%) |
| 35 to 39 Minutes | 18 (3.2%) | 52 (12.1%) |
| 40 to 44 Minutes | 18 (3.2%) | 0 (0.0%) |
| 45 to 59 Minutes | 21 (3.7%) | 17 (4.0%) |
| 60 to 89 Minutes | 0 (0.0%) | 0 (0.0%) |
| 90 or more Minutes | 16 (2.9%) | 0 (0.0%) |
Time of Departure to Work by Sex in Fairview
The most frequent times of departure to work in Fairview are 7:00 AM to 7:29 AM (230, 41.0%) for males and 7:00 AM to 7:29 AM (185, 43.1%) for females.
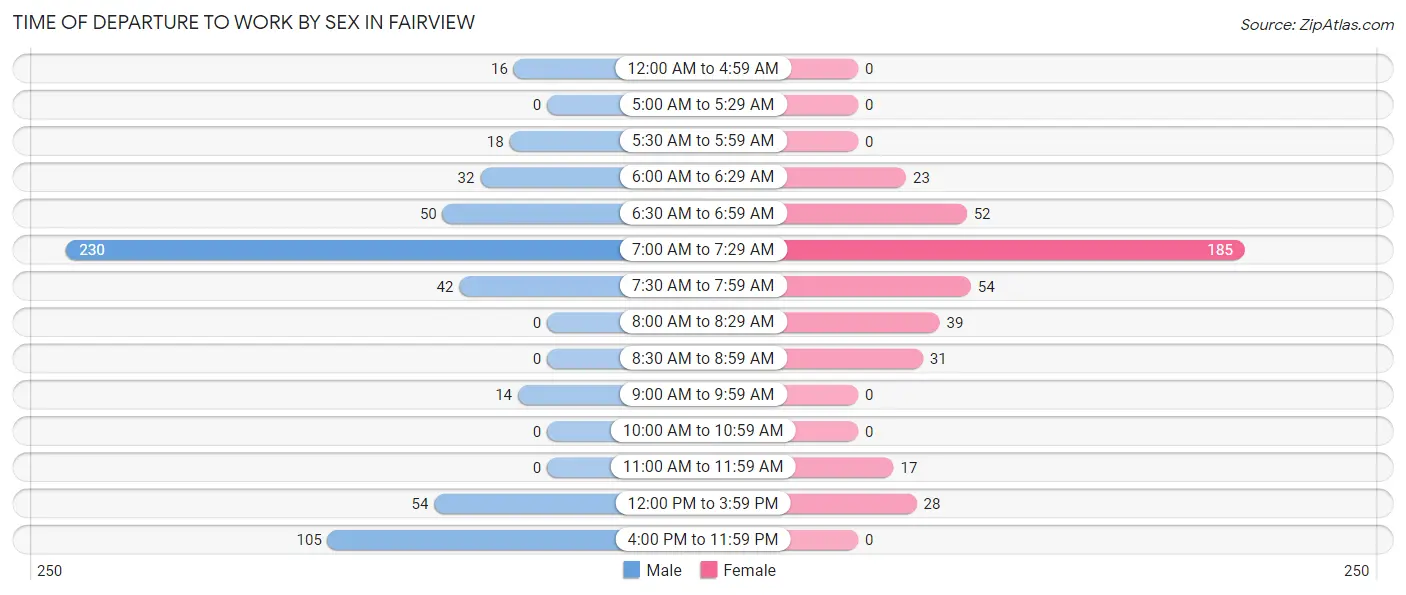
| Time of Departure | Male | Female |
| 12:00 AM to 4:59 AM | 16 (2.9%) | 0 (0.0%) |
| 5:00 AM to 5:29 AM | 0 (0.0%) | 0 (0.0%) |
| 5:30 AM to 5:59 AM | 18 (3.2%) | 0 (0.0%) |
| 6:00 AM to 6:29 AM | 32 (5.7%) | 23 (5.4%) |
| 6:30 AM to 6:59 AM | 50 (8.9%) | 52 (12.1%) |
| 7:00 AM to 7:29 AM | 230 (41.0%) | 185 (43.1%) |
| 7:30 AM to 7:59 AM | 42 (7.5%) | 54 (12.6%) |
| 8:00 AM to 8:29 AM | 0 (0.0%) | 39 (9.1%) |
| 8:30 AM to 8:59 AM | 0 (0.0%) | 31 (7.2%) |
| 9:00 AM to 9:59 AM | 14 (2.5%) | 0 (0.0%) |
| 10:00 AM to 10:59 AM | 0 (0.0%) | 0 (0.0%) |
| 11:00 AM to 11:59 AM | 0 (0.0%) | 17 (4.0%) |
| 12:00 PM to 3:59 PM | 54 (9.6%) | 28 (6.5%) |
| 4:00 PM to 11:59 PM | 105 (18.7%) | 0 (0.0%) |
| Total | 561 (100.0%) | 429 (100.0%) |
Housing Occupancy in Fairview
Occupancy by Ownership in Fairview
Of the total 992 dwellings in Fairview, owner-occupied units account for 852 (85.9%), while renter-occupied units make up 140 (14.1%).
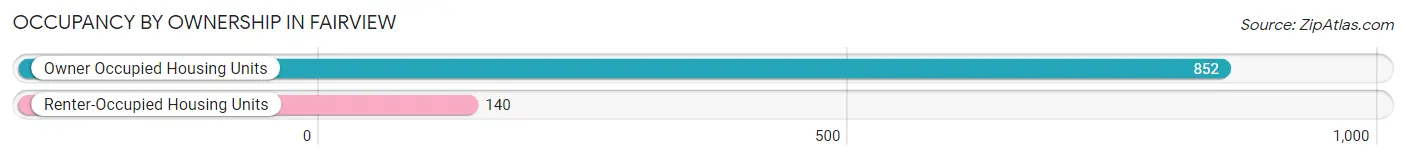
| Occupancy | # Housing Units | % Housing Units |
| Owner Occupied Housing Units | 852 | 85.9% |
| Renter-Occupied Housing Units | 140 | 14.1% |
| Total Occupied Housing Units | 992 | 100.0% |
Occupancy by Household Size in Fairview
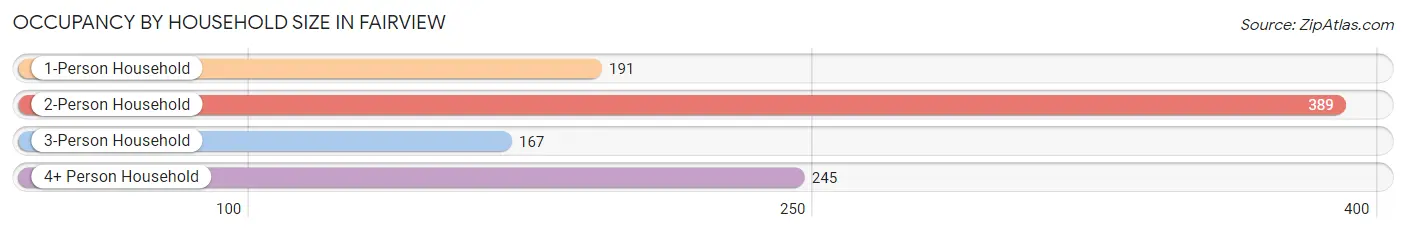
| Household Size | # Housing Units | % Housing Units |
| 1-Person Household | 191 | 19.3% |
| 2-Person Household | 389 | 39.2% |
| 3-Person Household | 167 | 16.8% |
| 4+ Person Household | 245 | 24.7% |
| Total Housing Units | 992 | 100.0% |
Occupancy by Ownership by Household Size in Fairview
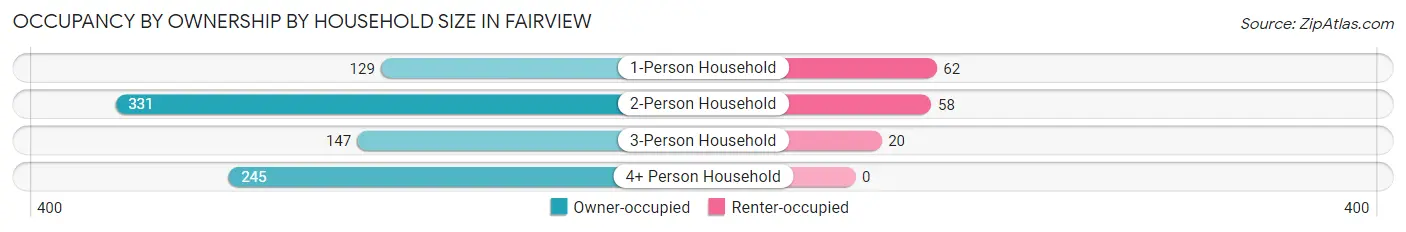
| Household Size | Owner-occupied | Renter-occupied |
| 1-Person Household | 129 (67.5%) | 62 (32.5%) |
| 2-Person Household | 331 (85.1%) | 58 (14.9%) |
| 3-Person Household | 147 (88.0%) | 20 (12.0%) |
| 4+ Person Household | 245 (100.0%) | 0 (0.0%) |
| Total Housing Units | 852 (85.9%) | 140 (14.1%) |
Occupancy by Educational Attainment in Fairview
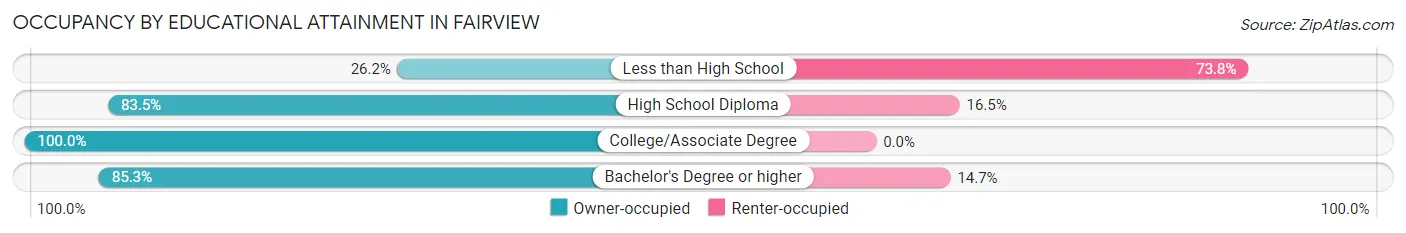
| Household Size | Owner-occupied | Renter-occupied |
| Less than High School | 16 (26.2%) | 45 (73.8%) |
| High School Diploma | 101 (83.5%) | 20 (16.5%) |
| College/Associate Degree | 301 (100.0%) | 0 (0.0%) |
| Bachelor's Degree or higher | 434 (85.3%) | 75 (14.7%) |
Occupancy by Age of Householder in Fairview
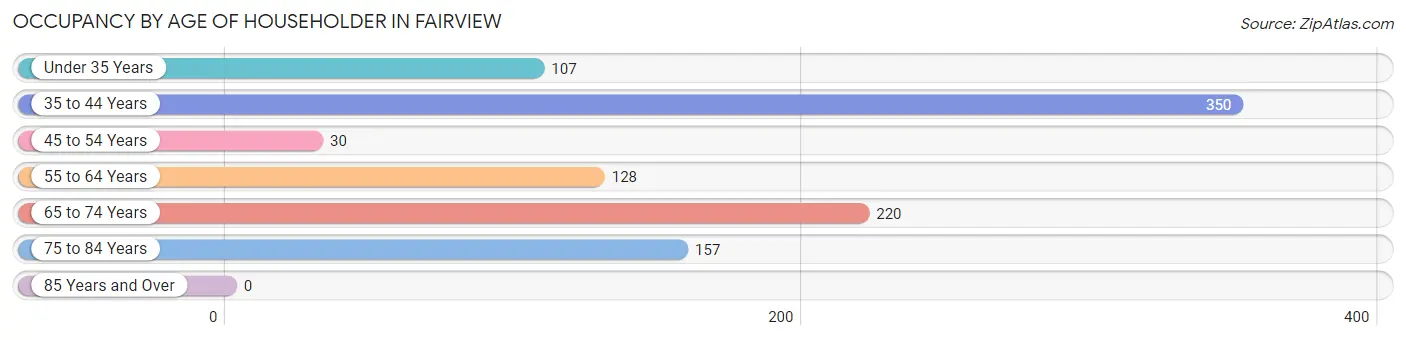
| Age Bracket | # Households | % Households |
| Under 35 Years | 107 | 10.8% |
| 35 to 44 Years | 350 | 35.3% |
| 45 to 54 Years | 30 | 3.0% |
| 55 to 64 Years | 128 | 12.9% |
| 65 to 74 Years | 220 | 22.2% |
| 75 to 84 Years | 157 | 15.8% |
| 85 Years and Over | 0 | 0.0% |
| Total | 992 | 100.0% |
Housing Finances in Fairview
Median Income by Occupancy in Fairview
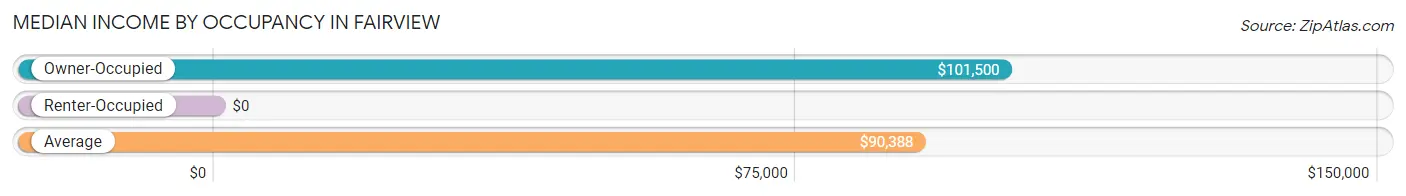
| Occupancy Type | # Households | Median Income |
| Owner-Occupied | 852 (85.9%) | $101,500 |
| Renter-Occupied | 140 (14.1%) | $0 |
| Average | 992 (100.0%) | $90,388 |
Occupancy by Householder Income Bracket in Fairview
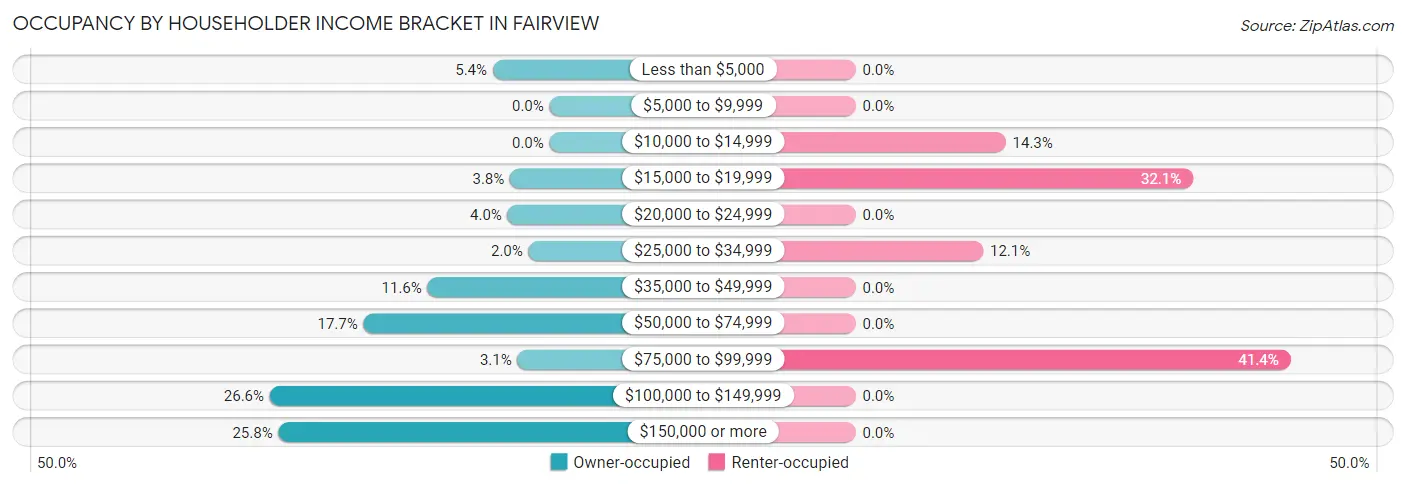
| Income Bracket | Owner-occupied | Renter-occupied |
| Less than $5,000 | 46 (5.4%) | 0 (0.0%) |
| $5,000 to $9,999 | 0 (0.0%) | 0 (0.0%) |
| $10,000 to $14,999 | 0 (0.0%) | 20 (14.3%) |
| $15,000 to $19,999 | 32 (3.8%) | 45 (32.1%) |
| $20,000 to $24,999 | 34 (4.0%) | 0 (0.0%) |
| $25,000 to $34,999 | 17 (2.0%) | 17 (12.1%) |
| $35,000 to $49,999 | 99 (11.6%) | 0 (0.0%) |
| $50,000 to $74,999 | 151 (17.7%) | 0 (0.0%) |
| $75,000 to $99,999 | 26 (3.0%) | 58 (41.4%) |
| $100,000 to $149,999 | 227 (26.6%) | 0 (0.0%) |
| $150,000 or more | 220 (25.8%) | 0 (0.0%) |
| Total | 852 (100.0%) | 140 (100.0%) |
Monthly Housing Cost Tiers in Fairview
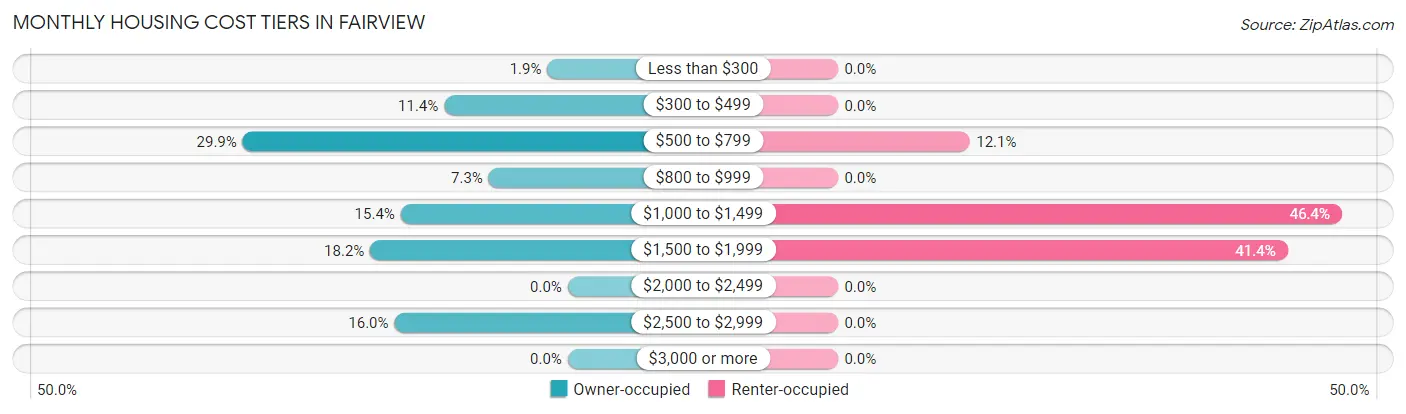
| Monthly Cost | Owner-occupied | Renter-occupied |
| Less than $300 | 16 (1.9%) | 0 (0.0%) |
| $300 to $499 | 97 (11.4%) | 0 (0.0%) |
| $500 to $799 | 255 (29.9%) | 17 (12.1%) |
| $800 to $999 | 62 (7.3%) | 0 (0.0%) |
| $1,000 to $1,499 | 131 (15.4%) | 65 (46.4%) |
| $1,500 to $1,999 | 155 (18.2%) | 58 (41.4%) |
| $2,000 to $2,499 | 0 (0.0%) | 0 (0.0%) |
| $2,500 to $2,999 | 136 (16.0%) | 0 (0.0%) |
| $3,000 or more | 0 (0.0%) | 0 (0.0%) |
| Total | 852 (100.0%) | 140 (100.0%) |
Physical Housing Characteristics in Fairview
Housing Structures in Fairview
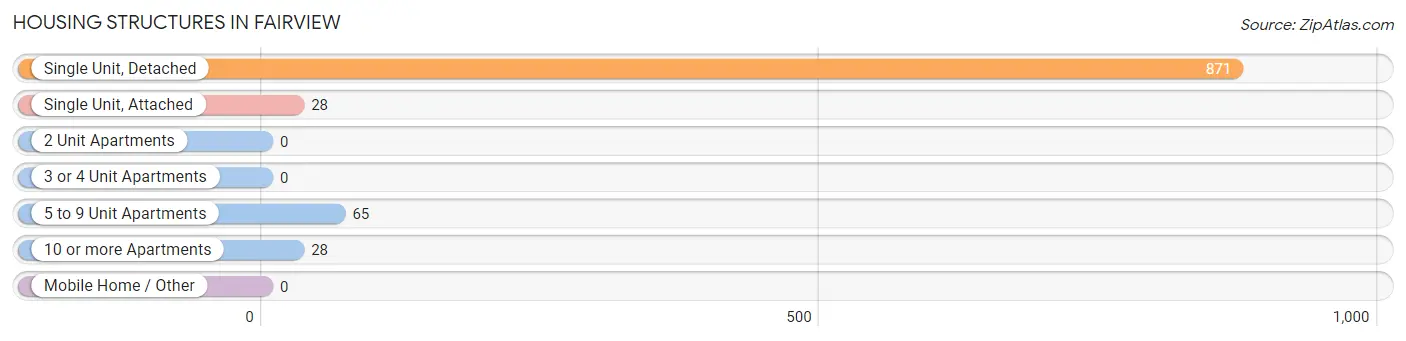
| Structure Type | # Housing Units | % Housing Units |
| Single Unit, Detached | 871 | 87.8% |
| Single Unit, Attached | 28 | 2.8% |
| 2 Unit Apartments | 0 | 0.0% |
| 3 or 4 Unit Apartments | 0 | 0.0% |
| 5 to 9 Unit Apartments | 65 | 6.6% |
| 10 or more Apartments | 28 | 2.8% |
| Mobile Home / Other | 0 | 0.0% |
| Total | 992 | 100.0% |
Housing Structures by Occupancy in Fairview
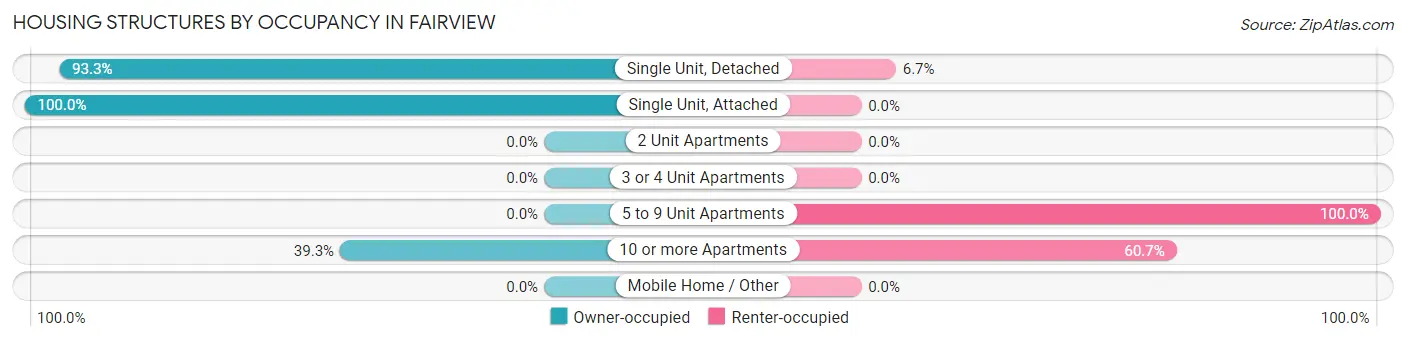
| Structure Type | Owner-occupied | Renter-occupied |
| Single Unit, Detached | 813 (93.3%) | 58 (6.7%) |
| Single Unit, Attached | 28 (100.0%) | 0 (0.0%) |
| 2 Unit Apartments | 0 (0.0%) | 0 (0.0%) |
| 3 or 4 Unit Apartments | 0 (0.0%) | 0 (0.0%) |
| 5 to 9 Unit Apartments | 0 (0.0%) | 65 (100.0%) |
| 10 or more Apartments | 11 (39.3%) | 17 (60.7%) |
| Mobile Home / Other | 0 (0.0%) | 0 (0.0%) |
| Total | 852 (85.9%) | 140 (14.1%) |
Housing Structures by Number of Rooms in Fairview
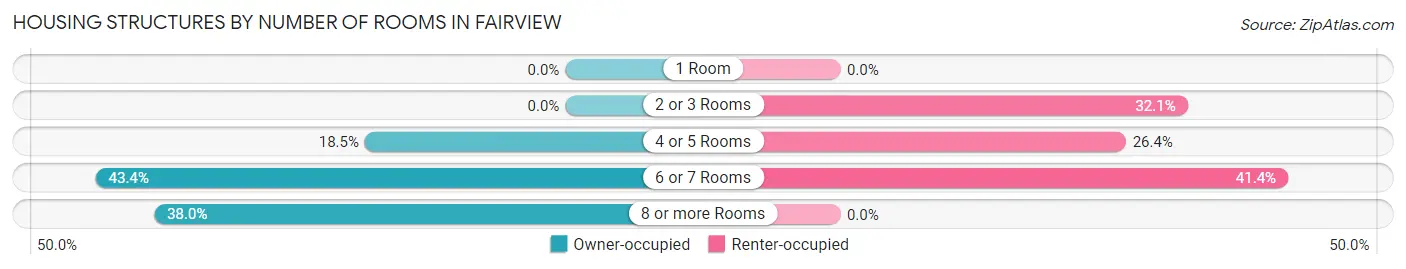
| Number of Rooms | Owner-occupied | Renter-occupied |
| 1 Room | 0 (0.0%) | 0 (0.0%) |
| 2 or 3 Rooms | 0 (0.0%) | 45 (32.1%) |
| 4 or 5 Rooms | 158 (18.5%) | 37 (26.4%) |
| 6 or 7 Rooms | 370 (43.4%) | 58 (41.4%) |
| 8 or more Rooms | 324 (38.0%) | 0 (0.0%) |
| Total | 852 (100.0%) | 140 (100.0%) |
Housing Structure by Heating Type in Fairview
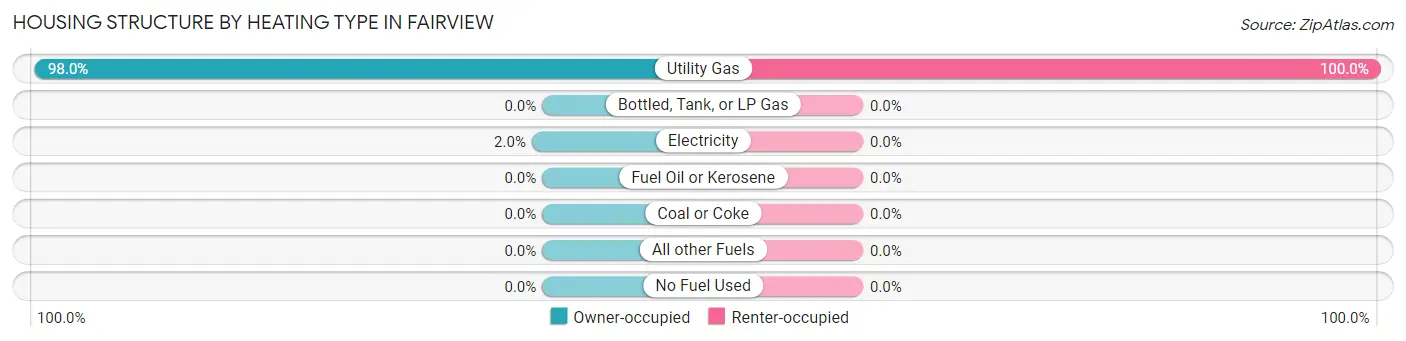
| Heating Type | Owner-occupied | Renter-occupied |
| Utility Gas | 835 (98.0%) | 140 (100.0%) |
| Bottled, Tank, or LP Gas | 0 (0.0%) | 0 (0.0%) |
| Electricity | 17 (2.0%) | 0 (0.0%) |
| Fuel Oil or Kerosene | 0 (0.0%) | 0 (0.0%) |
| Coal or Coke | 0 (0.0%) | 0 (0.0%) |
| All other Fuels | 0 (0.0%) | 0 (0.0%) |
| No Fuel Used | 0 (0.0%) | 0 (0.0%) |
| Total | 852 (100.0%) | 140 (100.0%) |
Household Vehicle Usage in Fairview
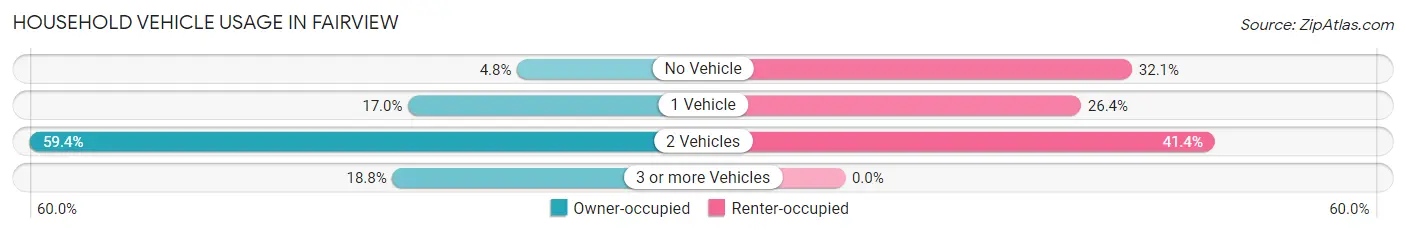
| Vehicles per Household | Owner-occupied | Renter-occupied |
| No Vehicle | 41 (4.8%) | 45 (32.1%) |
| 1 Vehicle | 145 (17.0%) | 37 (26.4%) |
| 2 Vehicles | 506 (59.4%) | 58 (41.4%) |
| 3 or more Vehicles | 160 (18.8%) | 0 (0.0%) |
| Total | 852 (100.0%) | 140 (100.0%) |
Real Estate & Mortgages in Fairview
Real Estate and Mortgage Overview in Fairview
| Characteristic | Without Mortgage | With Mortgage |
| Housing Units | 367 | 485 |
| Median Property Value | $173,200 | $199,800 |
| Median Household Income | $60,625 | $203 |
| Monthly Housing Costs | $541 | $0 |
| Real Estate Taxes | $2,851 | $0 |
Property Value by Mortgage Status in Fairview
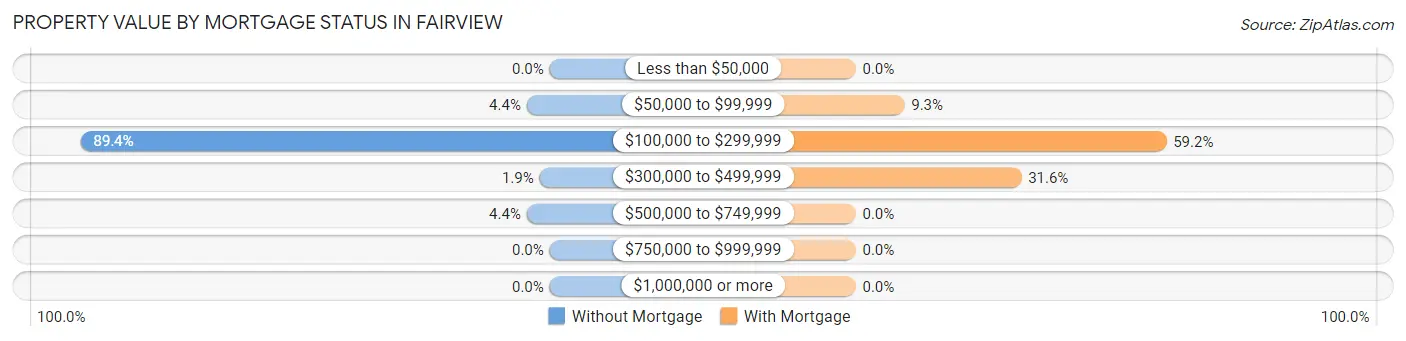
| Property Value | Without Mortgage | With Mortgage |
| Less than $50,000 | 0 (0.0%) | 0 (0.0%) |
| $50,000 to $99,999 | 16 (4.4%) | 45 (9.3%) |
| $100,000 to $299,999 | 328 (89.4%) | 287 (59.2%) |
| $300,000 to $499,999 | 7 (1.9%) | 153 (31.6%) |
| $500,000 to $749,999 | 16 (4.4%) | 0 (0.0%) |
| $750,000 to $999,999 | 0 (0.0%) | 0 (0.0%) |
| $1,000,000 or more | 0 (0.0%) | 0 (0.0%) |
| Total | 367 (100.0%) | 485 (100.0%) |
Household Income by Mortgage Status in Fairview
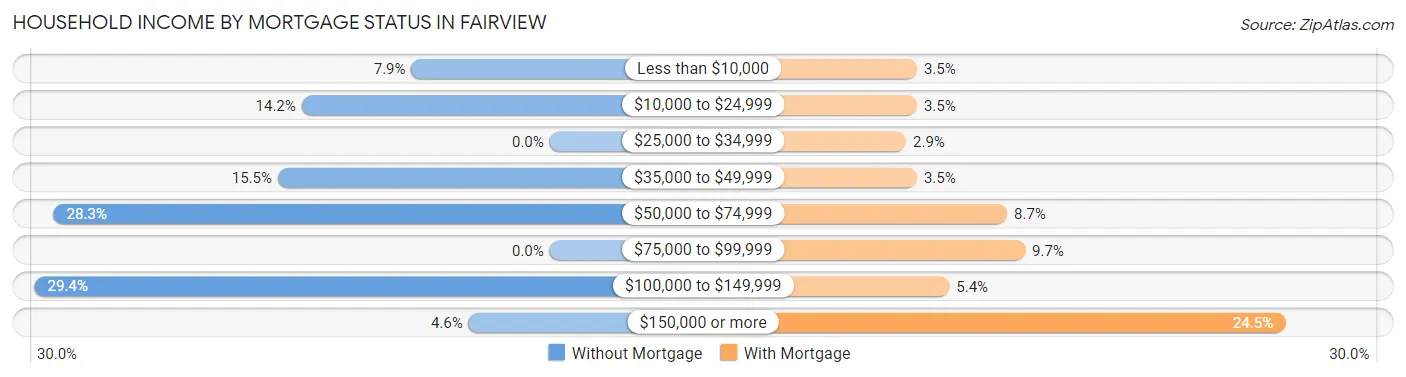
| Household Income | Without Mortgage | With Mortgage |
| Less than $10,000 | 29 (7.9%) | 17 (3.5%) |
| $10,000 to $24,999 | 52 (14.2%) | 17 (3.5%) |
| $25,000 to $34,999 | 0 (0.0%) | 14 (2.9%) |
| $35,000 to $49,999 | 57 (15.5%) | 17 (3.5%) |
| $50,000 to $74,999 | 104 (28.3%) | 42 (8.7%) |
| $75,000 to $99,999 | 0 (0.0%) | 47 (9.7%) |
| $100,000 to $149,999 | 108 (29.4%) | 26 (5.4%) |
| $150,000 or more | 17 (4.6%) | 119 (24.5%) |
| Total | 367 (100.0%) | 485 (100.0%) |
Property Value to Household Income Ratio in Fairview
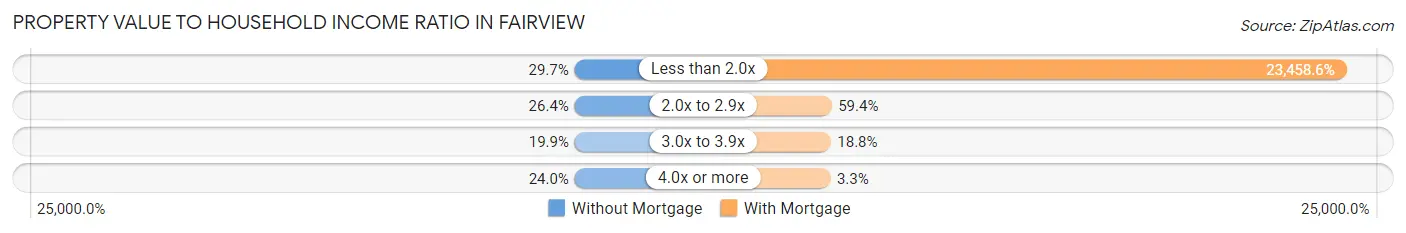
| Value-to-Income Ratio | Without Mortgage | With Mortgage |
| Less than 2.0x | 109 (29.7%) | 113,774 (23,458.6%) |
| 2.0x to 2.9x | 97 (26.4%) | 288 (59.4%) |
| 3.0x to 3.9x | 73 (19.9%) | 91 (18.8%) |
| 4.0x or more | 88 (24.0%) | 16 (3.3%) |
| Total | 367 (100.0%) | 485 (100.0%) |
Real Estate Taxes by Mortgage Status in Fairview
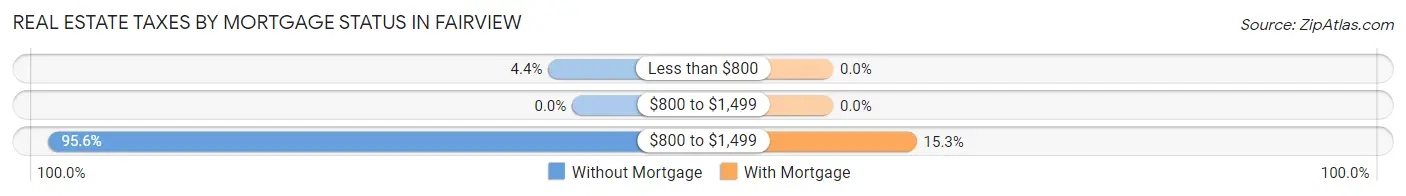
| Property Taxes | Without Mortgage | With Mortgage |
| Less than $800 | 16 (4.4%) | 0 (0.0%) |
| $800 to $1,499 | 0 (0.0%) | 0 (0.0%) |
| $800 to $1,499 | 351 (95.6%) | 74 (15.3%) |
| Total | 367 (100.0%) | 485 (100.0%) |
Health & Disability in Fairview
Health Insurance Coverage by Age in Fairview
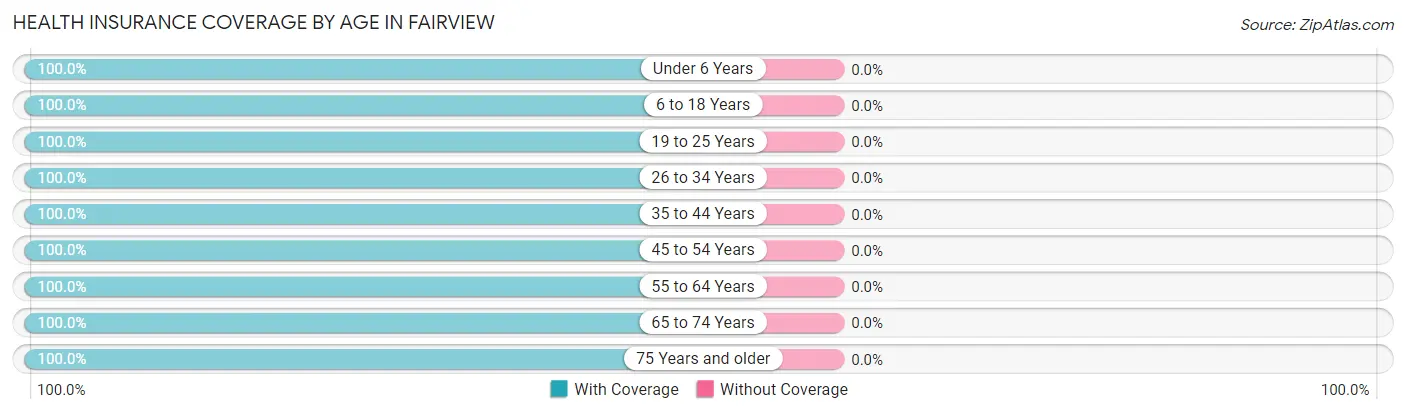
| Age Bracket | With Coverage | Without Coverage |
| Under 6 Years | 137 (100.0%) | 0 (0.0%) |
| 6 to 18 Years | 630 (100.0%) | 0 (0.0%) |
| 19 to 25 Years | 101 (100.0%) | 0 (0.0%) |
| 26 to 34 Years | 311 (100.0%) | 0 (0.0%) |
| 35 to 44 Years | 587 (100.0%) | 0 (0.0%) |
| 45 to 54 Years | 65 (100.0%) | 0 (0.0%) |
| 55 to 64 Years | 200 (100.0%) | 0 (0.0%) |
| 65 to 74 Years | 480 (100.0%) | 0 (0.0%) |
| 75 Years and older | 188 (100.0%) | 0 (0.0%) |
| Total | 2,699 (100.0%) | 0 (0.0%) |
Health Insurance Coverage by Citizenship Status in Fairview
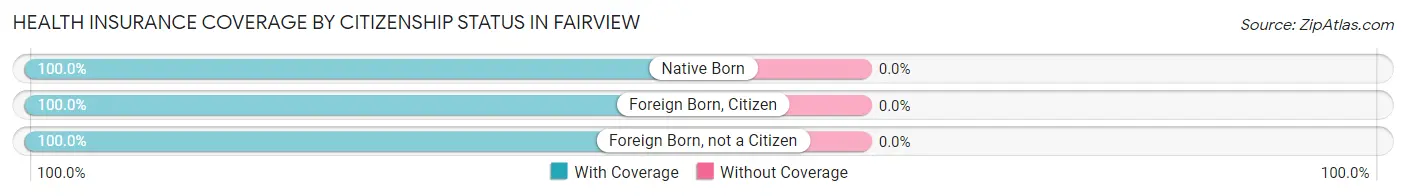
| Citizenship Status | With Coverage | Without Coverage |
| Native Born | 137 (100.0%) | 0 (0.0%) |
| Foreign Born, Citizen | 630 (100.0%) | 0 (0.0%) |
| Foreign Born, not a Citizen | 101 (100.0%) | 0 (0.0%) |
Health Insurance Coverage by Household Income in Fairview
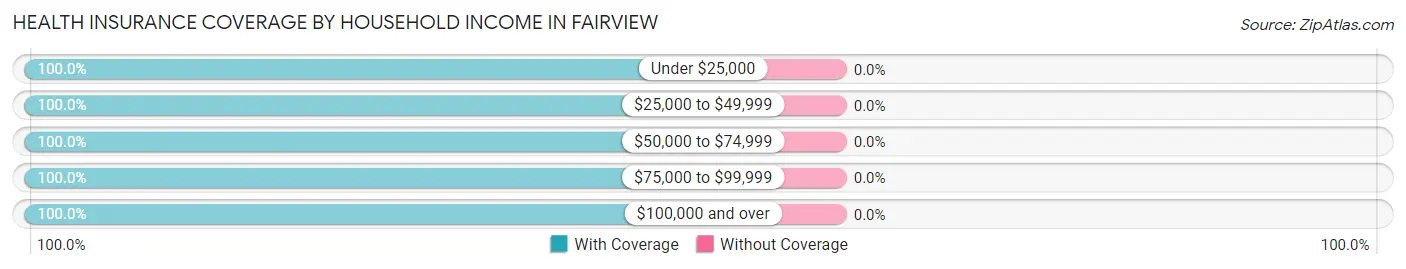
| Household Income | With Coverage | Without Coverage |
| Under $25,000 | 261 (100.0%) | 0 (0.0%) |
| $25,000 to $49,999 | 393 (100.0%) | 0 (0.0%) |
| $50,000 to $74,999 | 316 (100.0%) | 0 (0.0%) |
| $75,000 to $99,999 | 162 (100.0%) | 0 (0.0%) |
| $100,000 and over | 1,567 (100.0%) | 0 (0.0%) |
Public vs Private Health Insurance Coverage by Age in Fairview
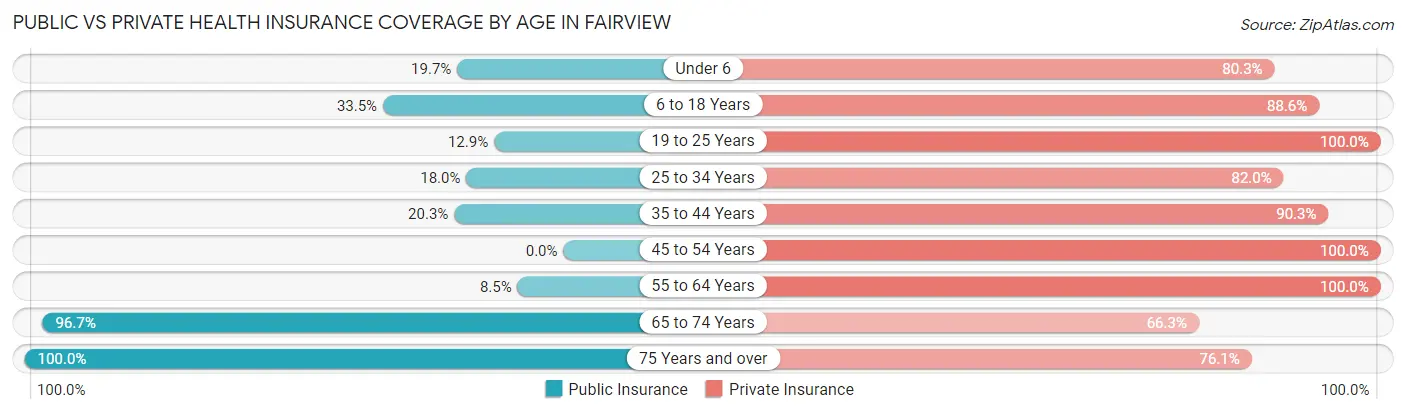
| Age Bracket | Public Insurance | Private Insurance |
| Under 6 | 27 (19.7%) | 110 (80.3%) |
| 6 to 18 Years | 211 (33.5%) | 558 (88.6%) |
| 19 to 25 Years | 13 (12.9%) | 101 (100.0%) |
| 25 to 34 Years | 56 (18.0%) | 255 (82.0%) |
| 35 to 44 Years | 119 (20.3%) | 530 (90.3%) |
| 45 to 54 Years | 0 (0.0%) | 65 (100.0%) |
| 55 to 64 Years | 17 (8.5%) | 200 (100.0%) |
| 65 to 74 Years | 464 (96.7%) | 318 (66.2%) |
| 75 Years and over | 188 (100.0%) | 143 (76.1%) |
| Total | 1,095 (40.6%) | 2,280 (84.5%) |
Disability Status by Sex by Age in Fairview
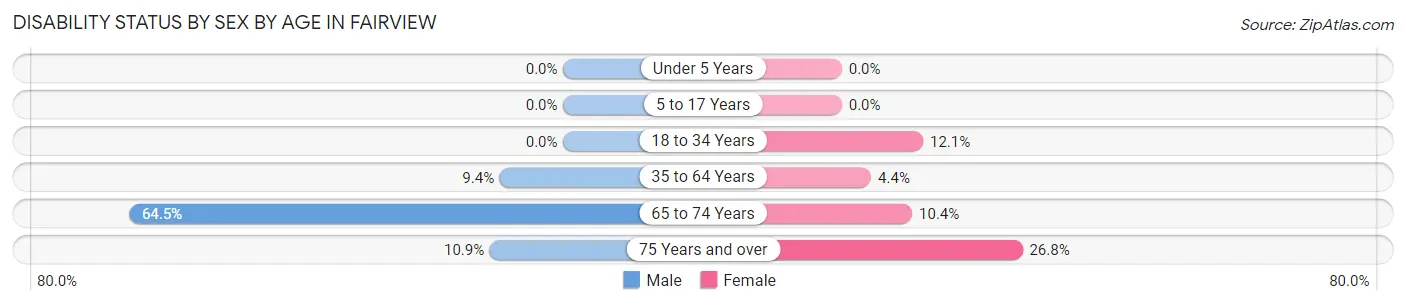
| Age Bracket | Male | Female |
| Under 5 Years | 0 (0.0%) | 0 (0.0%) |
| 5 to 17 Years | 0 (0.0%) | 0 (0.0%) |
| 18 to 34 Years | 0 (0.0%) | 17 (12.1%) |
| 35 to 64 Years | 37 (9.4%) | 20 (4.4%) |
| 65 to 74 Years | 149 (64.5%) | 26 (10.4%) |
| 75 Years and over | 16 (10.9%) | 11 (26.8%) |
Disability Class by Sex by Age in Fairview
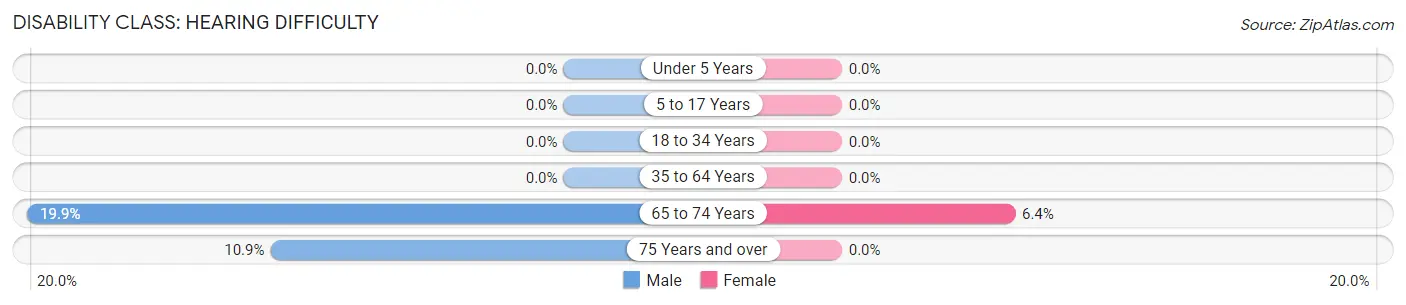
Disability Class: Hearing Difficulty
| Age Bracket | Male | Female |
| Under 5 Years | 0 (0.0%) | 0 (0.0%) |
| 5 to 17 Years | 0 (0.0%) | 0 (0.0%) |
| 18 to 34 Years | 0 (0.0%) | 0 (0.0%) |
| 35 to 64 Years | 0 (0.0%) | 0 (0.0%) |
| 65 to 74 Years | 46 (19.9%) | 16 (6.4%) |
| 75 Years and over | 16 (10.9%) | 0 (0.0%) |
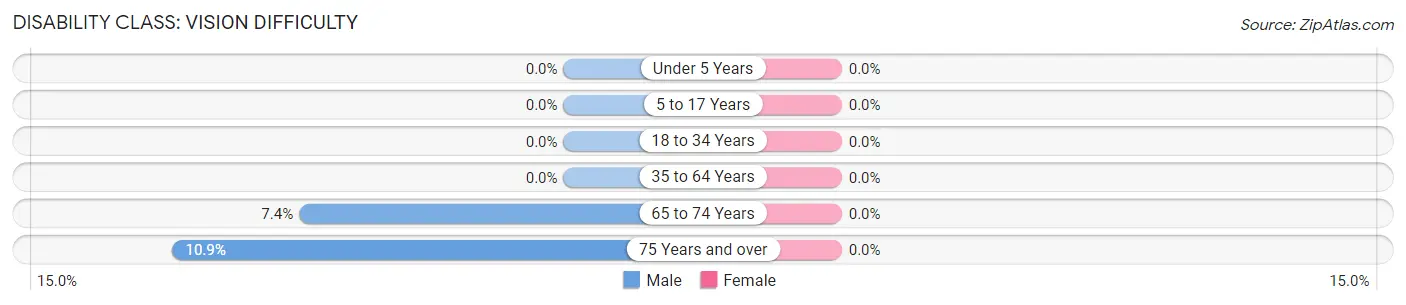
Disability Class: Vision Difficulty
| Age Bracket | Male | Female |
| Under 5 Years | 0 (0.0%) | 0 (0.0%) |
| 5 to 17 Years | 0 (0.0%) | 0 (0.0%) |
| 18 to 34 Years | 0 (0.0%) | 0 (0.0%) |
| 35 to 64 Years | 0 (0.0%) | 0 (0.0%) |
| 65 to 74 Years | 17 (7.4%) | 0 (0.0%) |
| 75 Years and over | 16 (10.9%) | 0 (0.0%) |
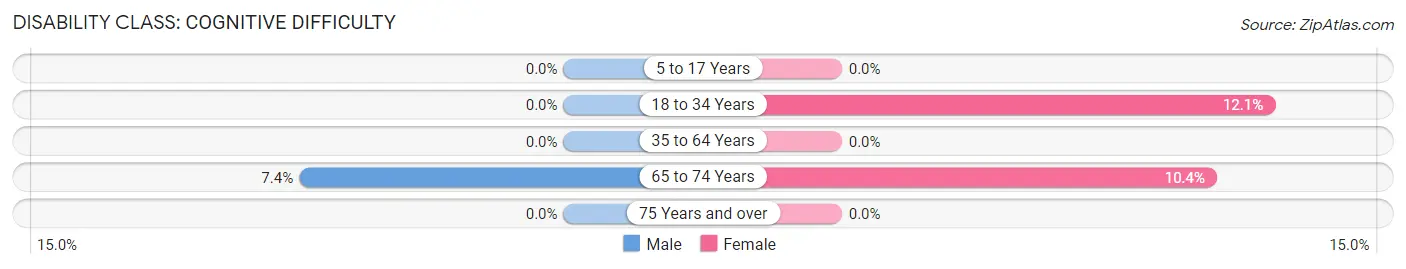
Disability Class: Cognitive Difficulty
| Age Bracket | Male | Female |
| 5 to 17 Years | 0 (0.0%) | 0 (0.0%) |
| 18 to 34 Years | 0 (0.0%) | 17 (12.1%) |
| 35 to 64 Years | 0 (0.0%) | 0 (0.0%) |
| 65 to 74 Years | 17 (7.4%) | 26 (10.4%) |
| 75 Years and over | 0 (0.0%) | 0 (0.0%) |
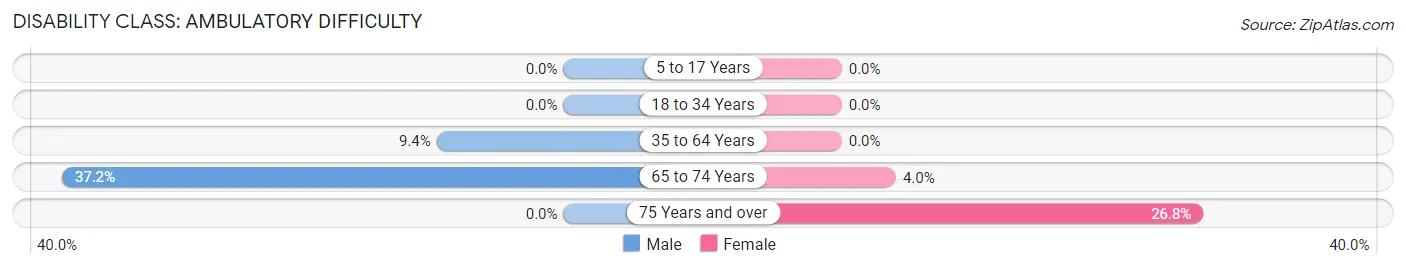
Disability Class: Ambulatory Difficulty
| Age Bracket | Male | Female |
| 5 to 17 Years | 0 (0.0%) | 0 (0.0%) |
| 18 to 34 Years | 0 (0.0%) | 0 (0.0%) |
| 35 to 64 Years | 37 (9.4%) | 0 (0.0%) |
| 65 to 74 Years | 86 (37.2%) | 10 (4.0%) |
| 75 Years and over | 0 (0.0%) | 11 (26.8%) |
Disability Class: Self-Care Difficulty
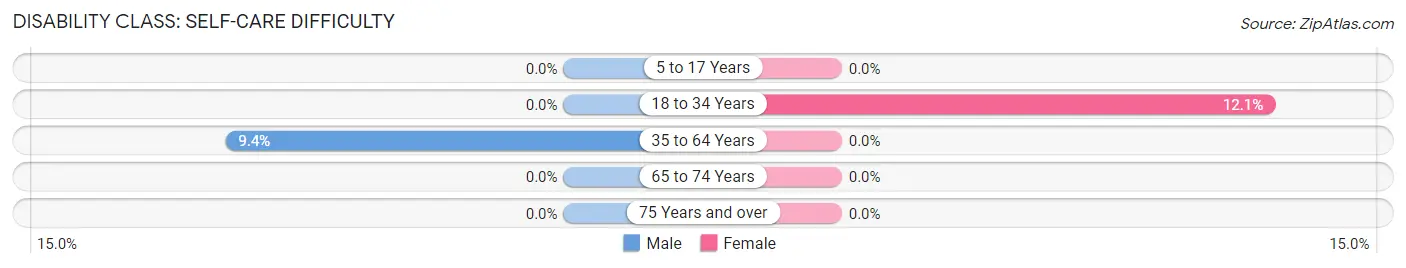
| Age Bracket | Male | Female |
| 5 to 17 Years | 0 (0.0%) | 0 (0.0%) |
| 18 to 34 Years | 0 (0.0%) | 17 (12.1%) |
| 35 to 64 Years | 37 (9.4%) | 0 (0.0%) |
| 65 to 74 Years | 0 (0.0%) | 0 (0.0%) |
| 75 Years and over | 0 (0.0%) | 0 (0.0%) |
Technology Access in Fairview
Computing Device Access in Fairview
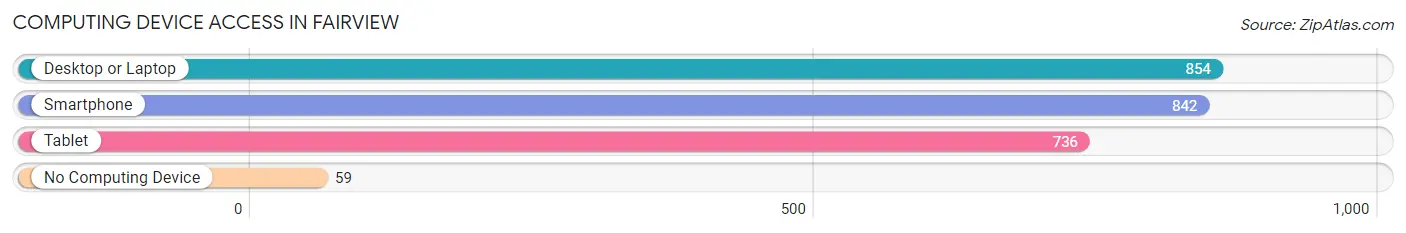
| Device Type | # Households | % Households |
| Desktop or Laptop | 854 | 86.1% |
| Smartphone | 842 | 84.9% |
| Tablet | 736 | 74.2% |
| No Computing Device | 59 | 5.9% |
| Total | 992 | 100.0% |
Internet Access in Fairview
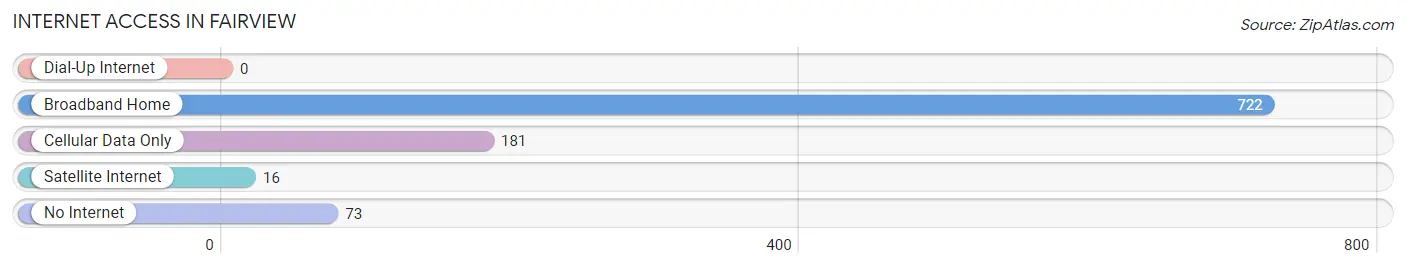
| Internet Type | # Households | % Households |
| Dial-Up Internet | 0 | 0.0% |
| Broadband Home | 722 | 72.8% |
| Cellular Data Only | 181 | 18.2% |
| Satellite Internet | 16 | 1.6% |
| No Internet | 73 | 7.4% |
| Total | 992 | 100.0% |
Fairview Summary
History
The history of Fairview, Pennsylvania dates back to the late 1700s when the area was first settled by European immigrants. The first settlers were mostly of German and English descent, and the area was known as “Fairview” due to its beautiful views of the surrounding countryside. The town was officially incorporated in 1845 and was named after the nearby Fairview Township.
The town of Fairview was a small farming community for many years, but it began to grow in the late 1800s when the railroad was built through the area. This allowed for the transportation of goods and people, and it also allowed for the development of industry in the area. The town was home to several factories, including a paper mill, a brickyard, and a tannery.
The town continued to grow throughout the 20th century, and by the year 2000, it had a population of approximately 4,000 people. The town is still largely a farming community, but it also has a few small businesses and industries.
Geography
Fairview is located in Erie County, Pennsylvania, in the northwestern part of the state. It is situated on the banks of the Conneaut Creek, which flows through the town and into Lake Erie. The town is surrounded by rolling hills and farmland, and it is located about 25 miles south of the city of Erie.
The town covers an area of about 4.5 square miles, and it has an elevation of about 1,000 feet above sea level. The climate in Fairview is generally mild, with cold winters and warm summers.
Economy
The economy of Fairview is largely based on agriculture and small businesses. The town is home to several farms, which produce a variety of crops, including corn, soybeans, and hay. There are also several small businesses in the town, including a few restaurants, a grocery store, and a hardware store.
The town is also home to a few small industries, including a paper mill, a brickyard, and a tannery. These industries provide employment for many of the town’s residents.
Demographics
As of the year 2000, the population of Fairview was approximately 4,000 people. The town is predominantly white, with about 95% of the population being of European descent. The remaining 5% of the population is made up of African Americans, Hispanics, and other ethnicities.
The median household income in Fairview is about $40,000, and the median home value is about $90,000. The town has a low unemployment rate, and the majority of the population is employed in either agriculture or small businesses.
Conclusion
Fairview, Pennsylvania is a small town with a rich history and a strong economy. The town is largely agricultural, but it also has a few small businesses and industries. The town has a population of about 4,000 people, and the majority of the population is of European descent. The town has a low unemployment rate, and the median household income is about $40,000.
Common Questions
What is Per Capita Income in Fairview?
Per Capita income in Fairview is $35,708.
What is the Median Family Income in Fairview?
Median Family Income in Fairview is $109,297.
What is the Median Household income in Fairview?
Median Household Income in Fairview is $90,388.
What is Income or Wage Gap in Fairview?
Income or Wage Gap in Fairview is 17.4%.
Women in Fairview earn 82.6 cents for every dollar earned by a man.
What is Inequality or Gini Index in Fairview?
Inequality or Gini Index in Fairview is 0.42.
What is the Total Population of Fairview?
Total Population of Fairview is 2,959.
What is the Total Male Population of Fairview?
Total Male Population of Fairview is 1,419.
What is the Total Female Population of Fairview?
Total Female Population of Fairview is 1,540.
What is the Ratio of Males per 100 Females in Fairview?
There are 92.14 Males per 100 Females in Fairview.
What is the Ratio of Females per 100 Males in Fairview?
There are 108.53 Females per 100 Males in Fairview.
What is the Median Population Age in Fairview?
Median Population Age in Fairview is 38.3 Years.
What is the Average Family Size in Fairview
Average Family Size in Fairview is 3.1 People.
What is the Average Household Size in Fairview
Average Household Size in Fairview is 2.7 People.
How Large is the Labor Force in Fairview?
There are 1,247 People in the Labor Forcein in Fairview.
What is the Percentage of People in the Labor Force in Fairview?
54.0% of People are in the Labor Force in Fairview.
What is the Unemployment Rate in Fairview?
Unemployment Rate in Fairview is 11.2%.