Emporium borough, PA Map & Demographics
Emporium borough Overview
$24,591
PER CAPITA INCOME
$42,469
AVG FAMILY INCOME
$34,387
AVG HOUSEHOLD INCOME
24.7%
WAGE / INCOME GAP [ % ]
75.3¢/ $1
WAGE / INCOME GAP [ $ ]
0.42
INEQUALITY / GINI INDEX
1,988
TOTAL POPULATION
921
MALE POPULATION
1,067
FEMALE POPULATION
86.32
MALES / 100 FEMALES
115.85
FEMALES / 100 MALES
46.9
MEDIAN AGE
2.3
AVG FAMILY SIZE
1.9
AVG HOUSEHOLD SIZE
915
LABOR FORCE [ PEOPLE ]
54.5%
PERCENT IN LABOR FORCE
10.1%
UNEMPLOYMENT RATE
Income in Emporium borough
Income Overview in Emporium borough
Per Capita Income in Emporium borough is $24,591, while median incomes of families and households are $42,469 and $34,387 respectively.
| Characteristic | Number | Measure |
| Per Capita Income | 1,988 | $24,591 |
| Median Family Income | 555 | $42,469 |
| Mean Family Income | 555 | $59,197 |
| Median Household Income | 1,035 | $34,387 |
| Mean Household Income | 1,035 | $47,816 |
| Income Deficit | 555 | $0 |
| Wage / Income Gap (%) | 1,988 | 24.72% |
| Wage / Income Gap ($) | 1,988 | 75.28¢ per $1 |
| Gini / Inequality Index | 1,988 | 0.42 |
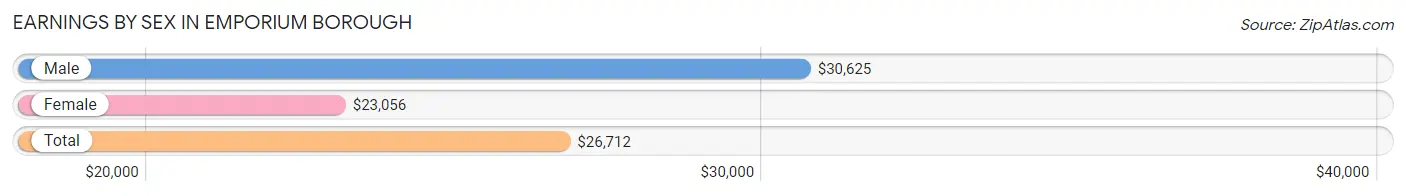
Earnings by Sex in Emporium borough
Average Earnings in Emporium borough are $26,712, $30,625 for men and $23,056 for women, a difference of 24.7%.
| Sex | Number | Average Earnings |
| Male | 485 (50.9%) | $30,625 |
| Female | 468 (49.1%) | $23,056 |
| Total | 953 (100.0%) | $26,712 |
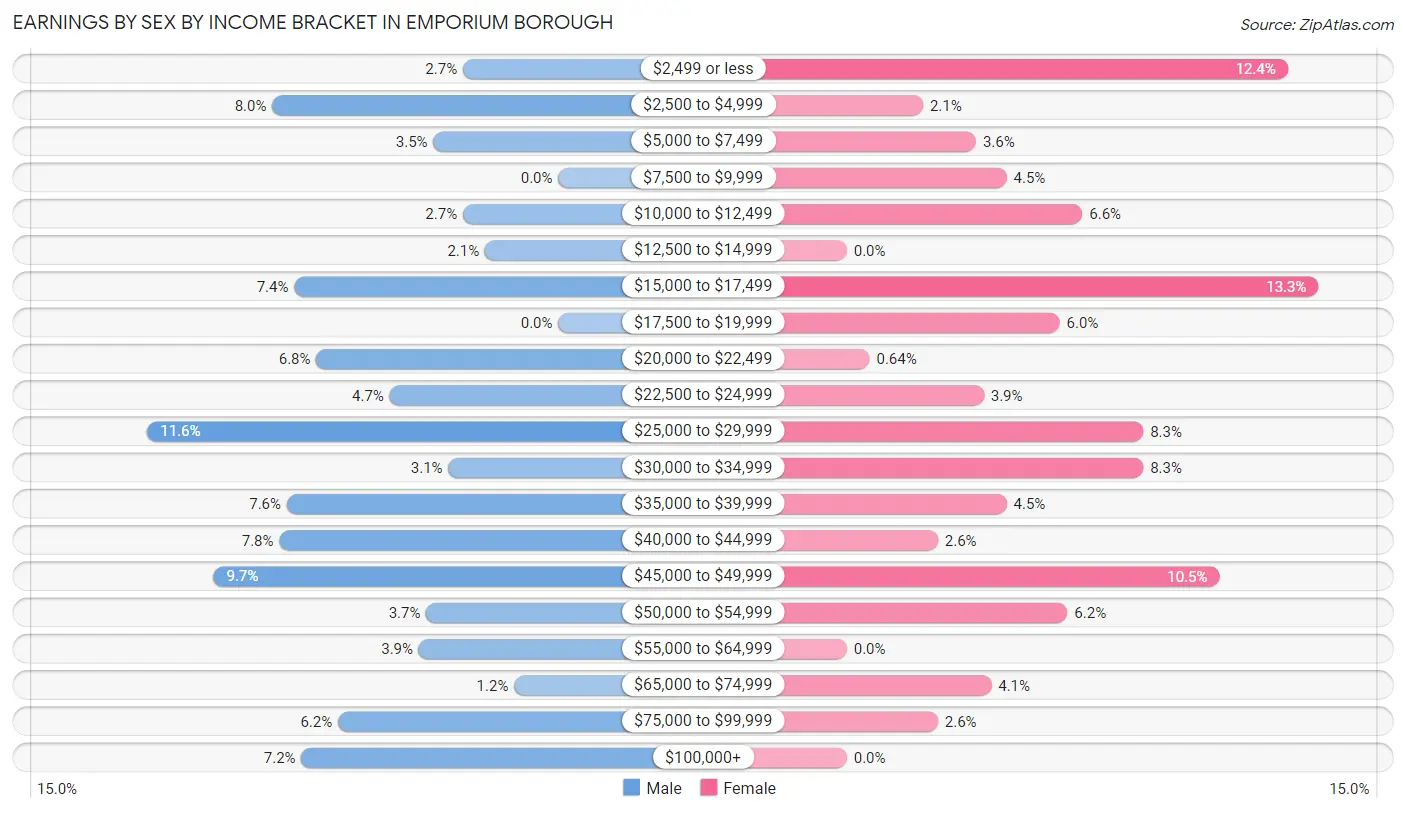
Earnings by Sex by Income Bracket in Emporium borough
The most common earnings brackets in Emporium borough are $25,000 to $29,999 for men (56 | 11.6%) and $15,000 to $17,499 for women (62 | 13.3%).
| Income | Male | Female |
| $2,499 or less | 13 (2.7%) | 58 (12.4%) |
| $2,500 to $4,999 | 39 (8.0%) | 10 (2.1%) |
| $5,000 to $7,499 | 17 (3.5%) | 17 (3.6%) |
| $7,500 to $9,999 | 0 (0.0%) | 21 (4.5%) |
| $10,000 to $12,499 | 13 (2.7%) | 31 (6.6%) |
| $12,500 to $14,999 | 10 (2.1%) | 0 (0.0%) |
| $15,000 to $17,499 | 36 (7.4%) | 62 (13.3%) |
| $17,500 to $19,999 | 0 (0.0%) | 28 (6.0%) |
| $20,000 to $22,499 | 33 (6.8%) | 3 (0.6%) |
| $22,500 to $24,999 | 23 (4.7%) | 18 (3.8%) |
| $25,000 to $29,999 | 56 (11.6%) | 39 (8.3%) |
| $30,000 to $34,999 | 15 (3.1%) | 39 (8.3%) |
| $35,000 to $39,999 | 37 (7.6%) | 21 (4.5%) |
| $40,000 to $44,999 | 38 (7.8%) | 12 (2.6%) |
| $45,000 to $49,999 | 47 (9.7%) | 49 (10.5%) |
| $50,000 to $54,999 | 18 (3.7%) | 29 (6.2%) |
| $55,000 to $64,999 | 19 (3.9%) | 0 (0.0%) |
| $65,000 to $74,999 | 6 (1.2%) | 19 (4.1%) |
| $75,000 to $99,999 | 30 (6.2%) | 12 (2.6%) |
| $100,000+ | 35 (7.2%) | 0 (0.0%) |
| Total | 485 (100.0%) | 468 (100.0%) |
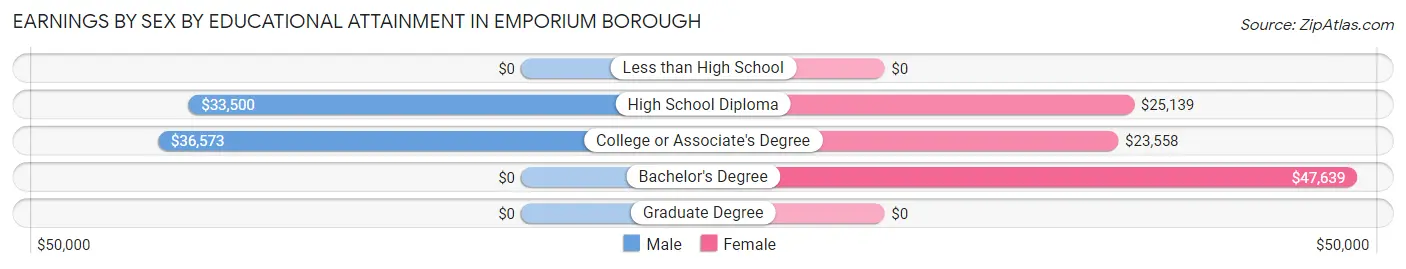
Earnings by Sex by Educational Attainment in Emporium borough
Average earnings in Emporium borough are $33,250 for men and $26,367 for women, a difference of 20.7%. Men with an educational attainment of college or associate's degree enjoy the highest average annual earnings of $36,573, while those with high school diploma education earn the least with $33,500. Women with an educational attainment of bachelor's degree earn the most with the average annual earnings of $47,639, while those with college or associate's degree education have the smallest earnings of $23,558.
| Educational Attainment | Male Income | Female Income |
| Less than High School | - | - |
| High School Diploma | $33,500 | $25,139 |
| College or Associate's Degree | $36,573 | $23,558 |
| Bachelor's Degree | - | - |
| Graduate Degree | - | - |
| Total | $33,250 | $26,367 |
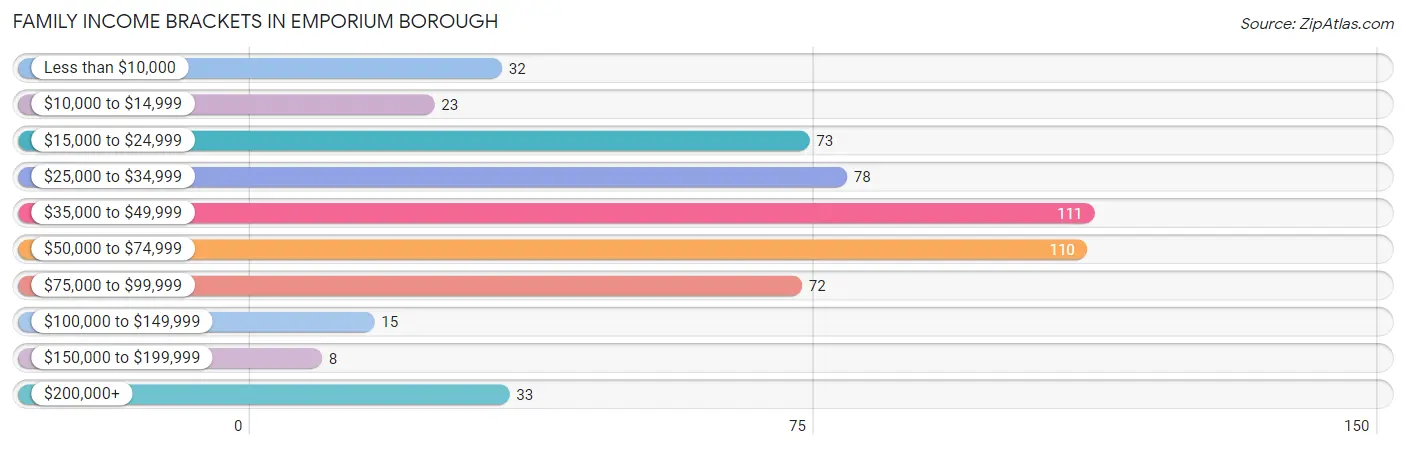
Family Income in Emporium borough
Family Income Brackets in Emporium borough
According to the Emporium borough family income data, there are 111 families falling into the $35,000 to $49,999 income range, which is the most common income bracket and makes up 20.0% of all families. Conversely, the $150,000 to $199,999 income bracket is the least frequent group with only 8 families (1.4%) belonging to this category.
| Income Bracket | # Families | % Families |
| Less than $10,000 | 32 | 5.8% |
| $10,000 to $14,999 | 23 | 4.1% |
| $15,000 to $24,999 | 73 | 13.2% |
| $25,000 to $34,999 | 78 | 14.1% |
| $35,000 to $49,999 | 111 | 20.0% |
| $50,000 to $74,999 | 110 | 19.8% |
| $75,000 to $99,999 | 72 | 13.0% |
| $100,000 to $149,999 | 15 | 2.7% |
| $150,000 to $199,999 | 8 | 1.4% |
| $200,000+ | 33 | 5.9% |
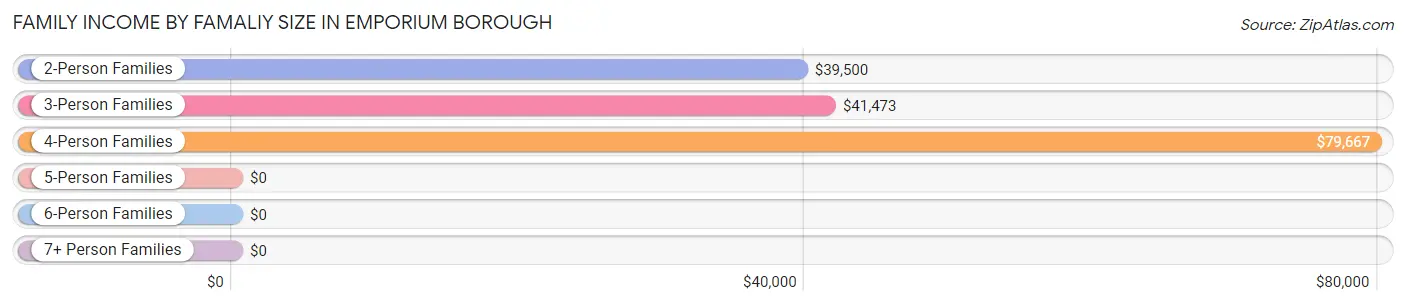
Family Income by Famaliy Size in Emporium borough
4-person families (38 | 6.9%) account for the highest median family income in Emporium borough with $79,667 per family, while 4-person families (38 | 6.9%) have the highest median income of $19,917 per family member.
| Income Bracket | # Families | Median Income |
| 2-Person Families | 378 (68.1%) | $39,500 |
| 3-Person Families | 125 (22.5%) | $41,473 |
| 4-Person Families | 38 (6.9%) | $79,667 |
| 5-Person Families | 14 (2.5%) | $0 |
| 6-Person Families | 0 (0.0%) | $0 |
| 7+ Person Families | 0 (0.0%) | $0 |
| Total | 555 (100.0%) | $42,469 |
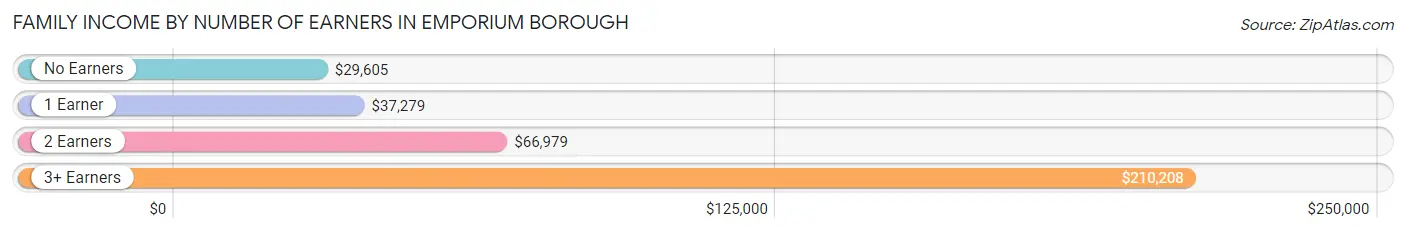
Family Income by Number of Earners in Emporium borough
The median family income in Emporium borough is $42,469, with families comprising 3+ earners (33) having the highest median family income of $210,208, while families with no earners (118) have the lowest median family income of $29,605, accounting for 5.9% and 21.3% of families, respectively.
| Number of Earners | # Families | Median Income |
| No Earners | 118 (21.3%) | $29,605 |
| 1 Earner | 251 (45.2%) | $37,279 |
| 2 Earners | 153 (27.6%) | $66,979 |
| 3+ Earners | 33 (5.9%) | $210,208 |
| Total | 555 (100.0%) | $42,469 |
Household Income in Emporium borough
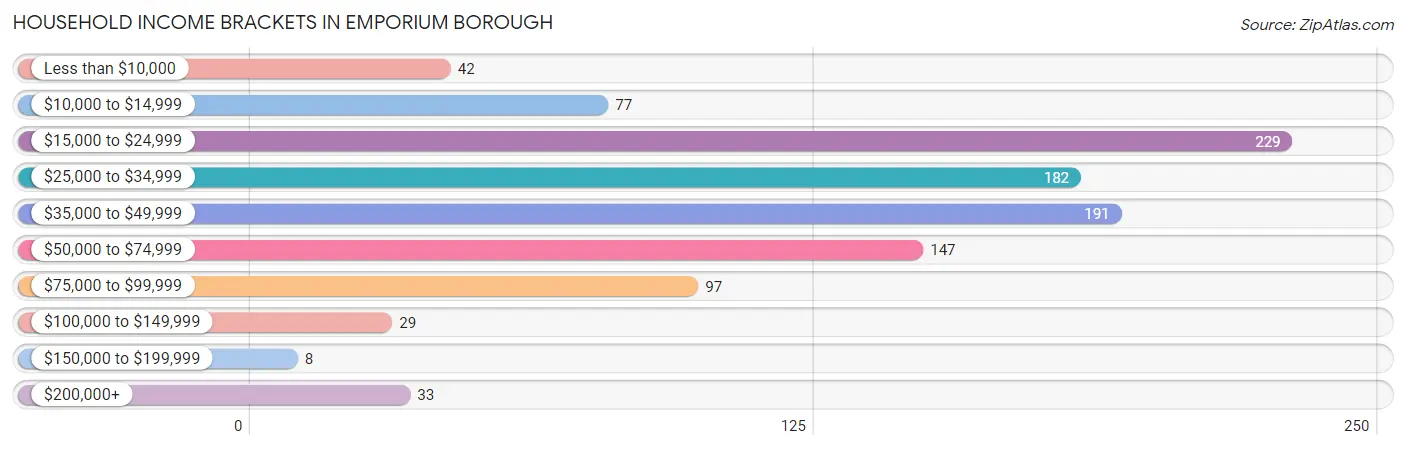
Household Income Brackets in Emporium borough
With 229 households falling in the category, the $15,000 to $24,999 income range is the most frequent in Emporium borough, accounting for 22.1% of all households. In contrast, only 8 households (0.8%) fall into the $150,000 to $199,999 income bracket, making it the least populous group.
| Income Bracket | # Households | % Households |
| Less than $10,000 | 42 | 4.1% |
| $10,000 to $14,999 | 77 | 7.4% |
| $15,000 to $24,999 | 229 | 22.1% |
| $25,000 to $34,999 | 182 | 17.6% |
| $35,000 to $49,999 | 191 | 18.5% |
| $50,000 to $74,999 | 147 | 14.2% |
| $75,000 to $99,999 | 97 | 9.4% |
| $100,000 to $149,999 | 29 | 2.8% |
| $150,000 to $199,999 | 8 | 0.8% |
| $200,000+ | 33 | 3.2% |
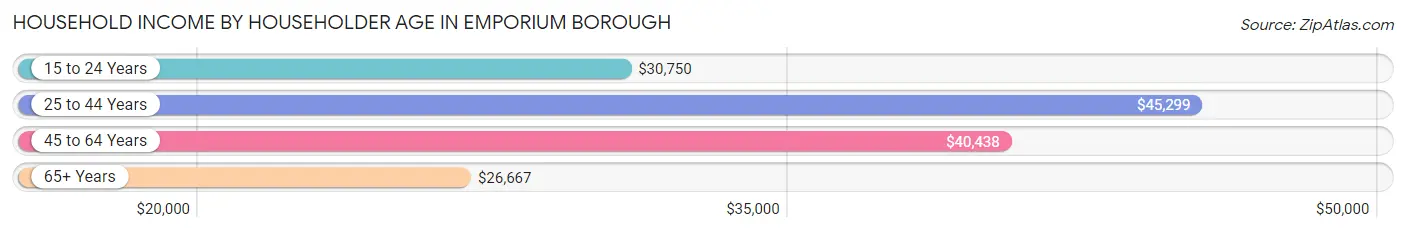
Household Income by Householder Age in Emporium borough
The median household income in Emporium borough is $34,387, with the highest median household income of $45,299 found in the 25 to 44 years age bracket for the primary householder. A total of 245 households (23.7%) fall into this category. Meanwhile, the 65+ years age bracket for the primary householder has the lowest median household income of $26,667, with 290 households (28.0%) in this group.
| Income Bracket | # Households | Median Income |
| 15 to 24 Years | 74 (7.1%) | $30,750 |
| 25 to 44 Years | 245 (23.7%) | $45,299 |
| 45 to 64 Years | 426 (41.2%) | $40,438 |
| 65+ Years | 290 (28.0%) | $26,667 |
| Total | 1,035 (100.0%) | $34,387 |
Poverty in Emporium borough
Income Below Poverty by Sex and Age in Emporium borough
With 15.2% poverty level for males and 23.3% for females among the residents of Emporium borough, under 5 year old males and 25 to 34 year old females are the most vulnerable to poverty, with 46 males (85.2%) and 65 females (60.8%) in their respective age groups living below the poverty level.
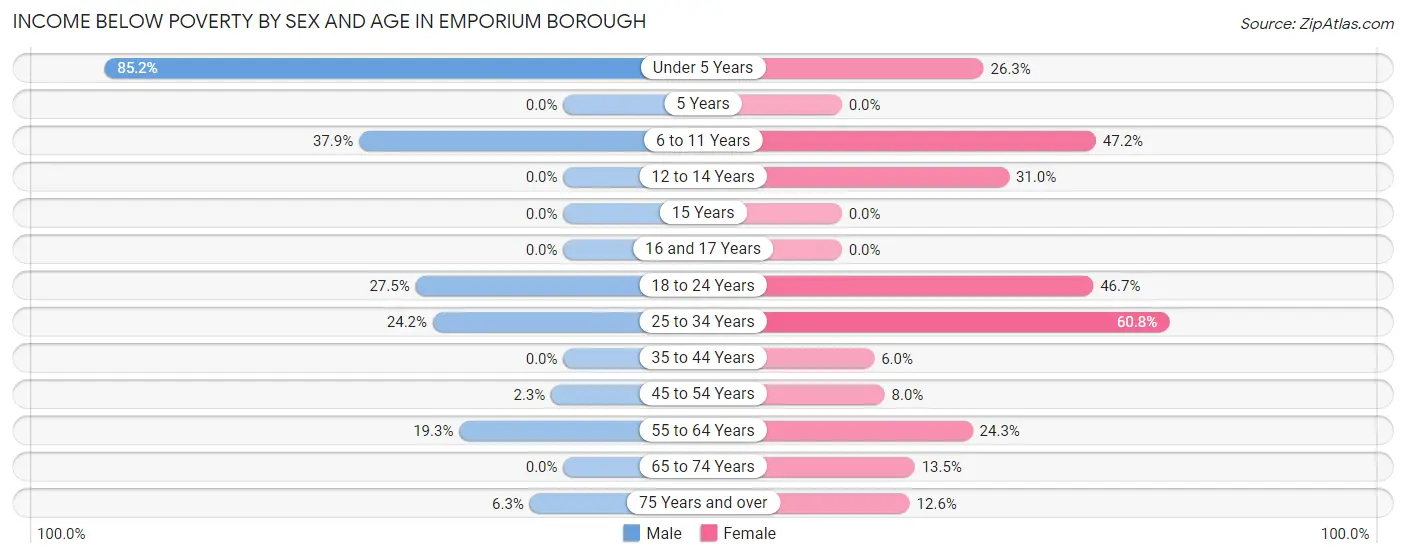
| Age Bracket | Male | Female |
| Under 5 Years | 46 (85.2%) | 15 (26.3%) |
| 5 Years | 0 (0.0%) | 0 (0.0%) |
| 6 to 11 Years | 11 (37.9%) | 25 (47.2%) |
| 12 to 14 Years | 0 (0.0%) | 9 (31.0%) |
| 15 Years | 0 (0.0%) | 0 (0.0%) |
| 16 and 17 Years | 0 (0.0%) | 0 (0.0%) |
| 18 to 24 Years | 14 (27.5%) | 42 (46.7%) |
| 25 to 34 Years | 31 (24.2%) | 65 (60.8%) |
| 35 to 44 Years | 0 (0.0%) | 5 (6.0%) |
| 45 to 54 Years | 3 (2.3%) | 14 (8.0%) |
| 55 to 64 Years | 29 (19.3%) | 34 (24.3%) |
| 65 to 74 Years | 0 (0.0%) | 18 (13.5%) |
| 75 Years and over | 4 (6.2%) | 16 (12.6%) |
| Total | 138 (15.2%) | 243 (23.3%) |
Income Above Poverty by Sex and Age in Emporium borough
According to the poverty statistics in Emporium borough, males aged 12 to 14 years and females aged 15 years are the age groups that are most secure financially, with 100.0% of males and 100.0% of females in these age groups living above the poverty line.
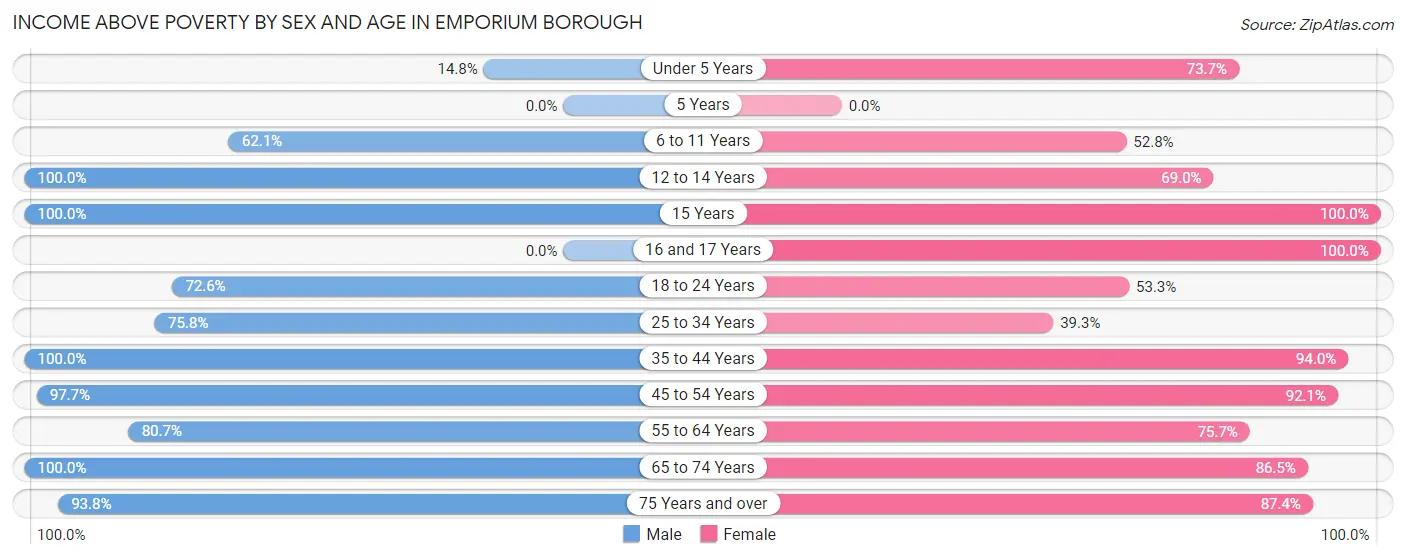
| Age Bracket | Male | Female |
| Under 5 Years | 8 (14.8%) | 42 (73.7%) |
| 5 Years | 0 (0.0%) | 0 (0.0%) |
| 6 to 11 Years | 18 (62.1%) | 28 (52.8%) |
| 12 to 14 Years | 59 (100.0%) | 20 (69.0%) |
| 15 Years | 9 (100.0%) | 20 (100.0%) |
| 16 and 17 Years | 0 (0.0%) | 30 (100.0%) |
| 18 to 24 Years | 37 (72.6%) | 48 (53.3%) |
| 25 to 34 Years | 97 (75.8%) | 42 (39.3%) |
| 35 to 44 Years | 150 (100.0%) | 78 (94.0%) |
| 45 to 54 Years | 129 (97.7%) | 162 (92.0%) |
| 55 to 64 Years | 121 (80.7%) | 106 (75.7%) |
| 65 to 74 Years | 82 (100.0%) | 115 (86.5%) |
| 75 Years and over | 60 (93.8%) | 111 (87.4%) |
| Total | 770 (84.8%) | 802 (76.7%) |
Income Below Poverty Among Married-Couple Families in Emporium borough
The poverty statistics for married-couple families in Emporium borough show that 4.7% or 14 of the total 298 families live below the poverty line. Families with 1 or 2 children have the highest poverty rate of 20.0%, comprising of 9 families. On the other hand, families with 3 or 4 children have the lowest poverty rate of 0.0%, which includes 0 families.
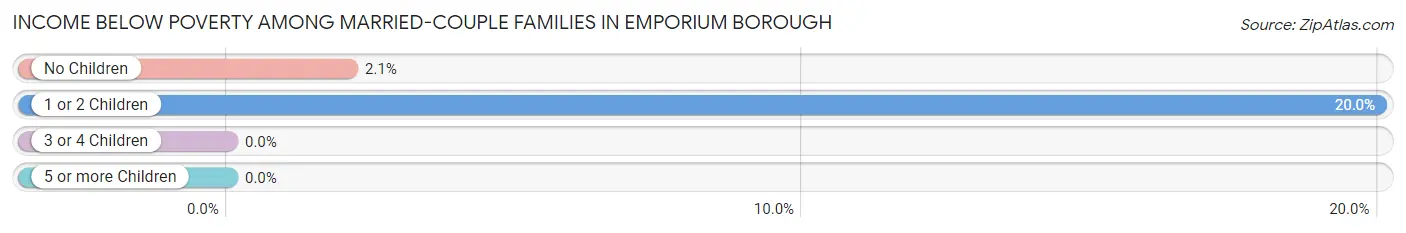
| Children | Above Poverty | Below Poverty |
| No Children | 234 (97.9%) | 5 (2.1%) |
| 1 or 2 Children | 36 (80.0%) | 9 (20.0%) |
| 3 or 4 Children | 14 (100.0%) | 0 (0.0%) |
| 5 or more Children | 0 (0.0%) | 0 (0.0%) |
| Total | 284 (95.3%) | 14 (4.7%) |
Income Below Poverty Among Single-Parent Households in Emporium borough
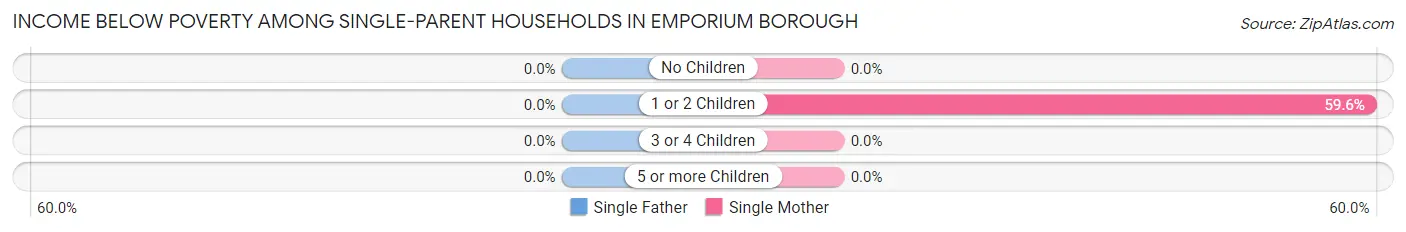
| Children | Single Father | Single Mother |
| No Children | 0 (0.0%) | 0 (0.0%) |
| 1 or 2 Children | 0 (0.0%) | 81 (59.6%) |
| 3 or 4 Children | 0 (0.0%) | 0 (0.0%) |
| 5 or more Children | 0 (0.0%) | 0 (0.0%) |
| Total | 0 (0.0%) | 81 (48.2%) |
Income Below Poverty Among Married-Couple vs Single-Parent Households in Emporium borough
The poverty data for Emporium borough shows that 14 of the married-couple family households (4.7%) and 81 of the single-parent households (31.5%) are living below the poverty level. Within the married-couple family households, those with 1 or 2 children have the highest poverty rate, with 9 households (20.0%) falling below the poverty line. Among the single-parent households, those with 1 or 2 children have the highest poverty rate, with 81 household (39.1%) living below poverty.
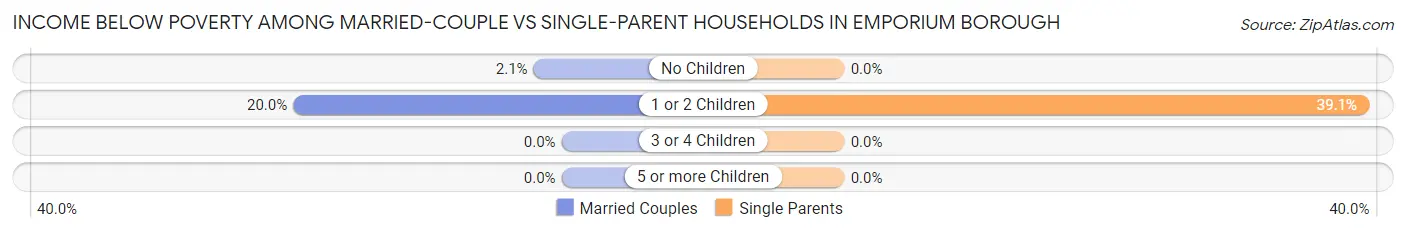
| Children | Married-Couple Families | Single-Parent Households |
| No Children | 5 (2.1%) | 0 (0.0%) |
| 1 or 2 Children | 9 (20.0%) | 81 (39.1%) |
| 3 or 4 Children | 0 (0.0%) | 0 (0.0%) |
| 5 or more Children | 0 (0.0%) | 0 (0.0%) |
| Total | 14 (4.7%) | 81 (31.5%) |
Race in Emporium borough
The most populous races in Emporium borough are White / Caucasian (1,818 | 91.4%), Two or more Races (160 | 8.1%), and Hispanic or Latino (57 | 2.9%).
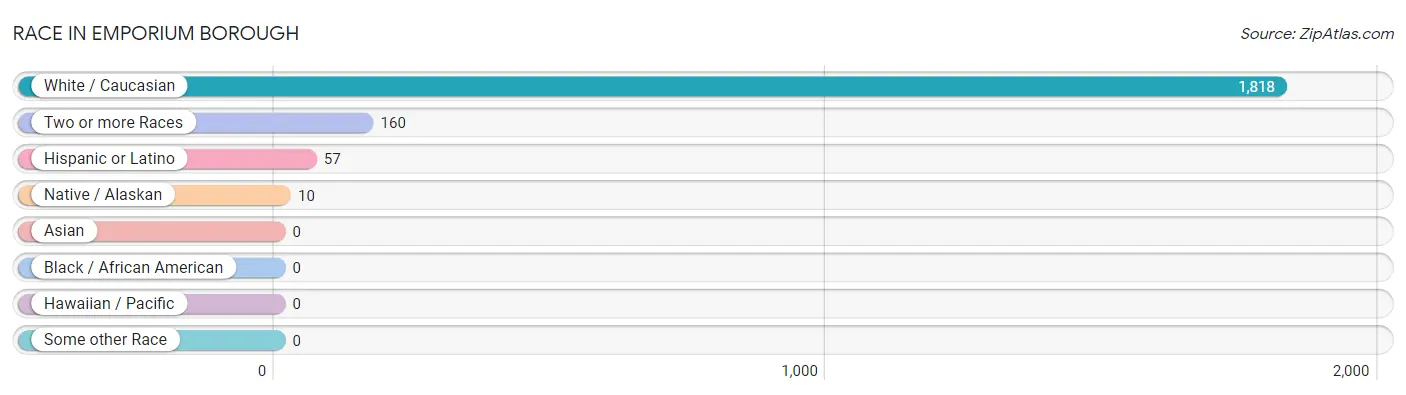
| Race | # Population | % Population |
| Asian | 0 | 0.0% |
| Black / African American | 0 | 0.0% |
| Hawaiian / Pacific | 0 | 0.0% |
| Hispanic or Latino | 57 | 2.9% |
| Native / Alaskan | 10 | 0.5% |
| White / Caucasian | 1,818 | 91.4% |
| Two or more Races | 160 | 8.1% |
| Some other Race | 0 | 0.0% |
| Total | 1,988 | 100.0% |
Ancestry in Emporium borough
The most populous ancestries reported in Emporium borough are German (473 | 23.8%), Irish (291 | 14.6%), Italian (284 | 14.3%), American (207 | 10.4%), and English (157 | 7.9%), together accounting for 71.0% of all Emporium borough residents.
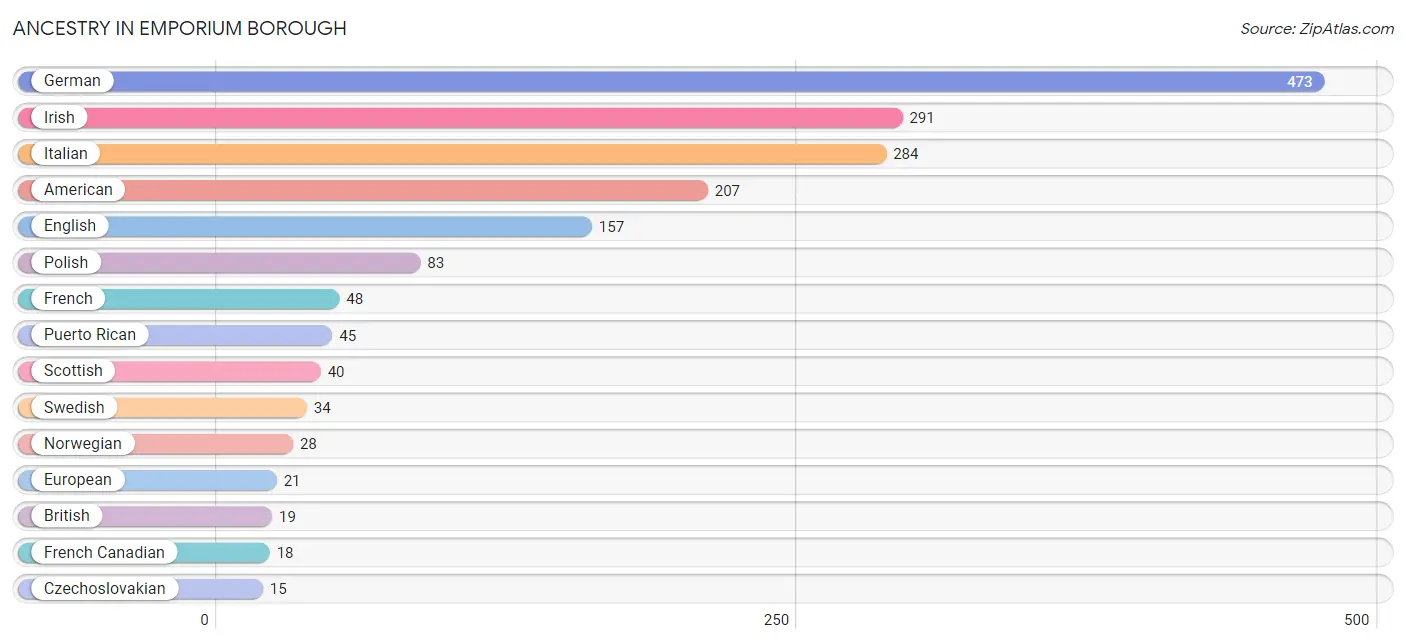
| Ancestry | # Population | % Population |
| American | 207 | 10.4% |
| Austrian | 3 | 0.2% |
| British | 19 | 1.0% |
| Czech | 4 | 0.2% |
| Czechoslovakian | 15 | 0.7% |
| Dutch | 6 | 0.3% |
| English | 157 | 7.9% |
| European | 21 | 1.1% |
| French | 48 | 2.4% |
| French Canadian | 18 | 0.9% |
| German | 473 | 23.8% |
| Greek | 13 | 0.6% |
| Irish | 291 | 14.6% |
| Italian | 284 | 14.3% |
| Mexican | 12 | 0.6% |
| Norwegian | 28 | 1.4% |
| Pennsylvania German | 5 | 0.3% |
| Polish | 83 | 4.2% |
| Puerto Rican | 45 | 2.3% |
| Scandinavian | 12 | 0.6% |
| Scottish | 40 | 2.0% |
| Slovak | 4 | 0.2% |
| Swedish | 34 | 1.7% |
| Swiss | 6 | 0.3% | View All 24 Rows |
Immigrants in Emporium borough
The most numerous immigrant groups reported in Emporium borough came from Europe (17 | 0.9%), Germany (11 | 0.5%), Western Europe (11 | 0.5%), Eastern Europe (6 | 0.3%), and Poland (6 | 0.3%), together accounting for 2.6% of all Emporium borough residents.
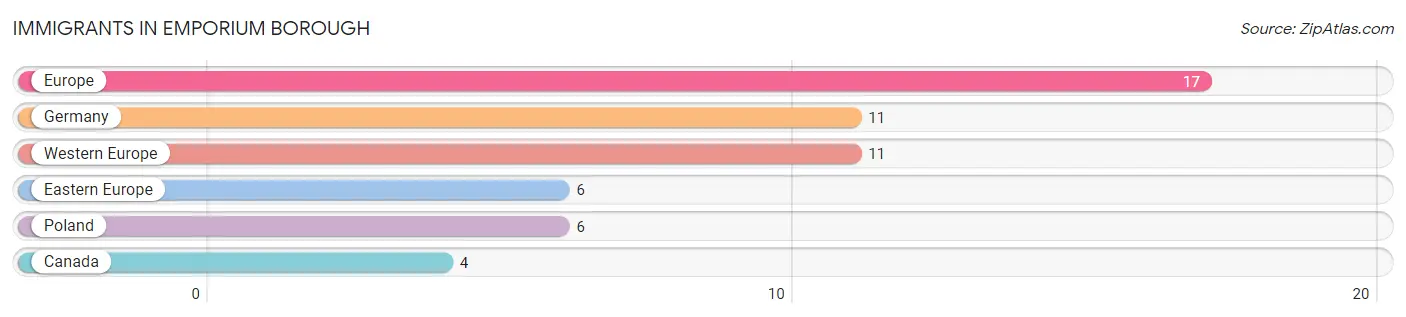
| Immigration Origin | # Population | % Population |
| Canada | 4 | 0.2% |
| Eastern Europe | 6 | 0.3% |
| Europe | 17 | 0.9% |
| Germany | 11 | 0.5% |
| Poland | 6 | 0.3% |
| Western Europe | 11 | 0.5% | View All 6 Rows |
Sex and Age in Emporium borough
Sex and Age in Emporium borough
The most populous age groups in Emporium borough are 60 to 64 Years (115 | 12.5%) for men and 55 to 59 Years (101 | 9.5%) for women.
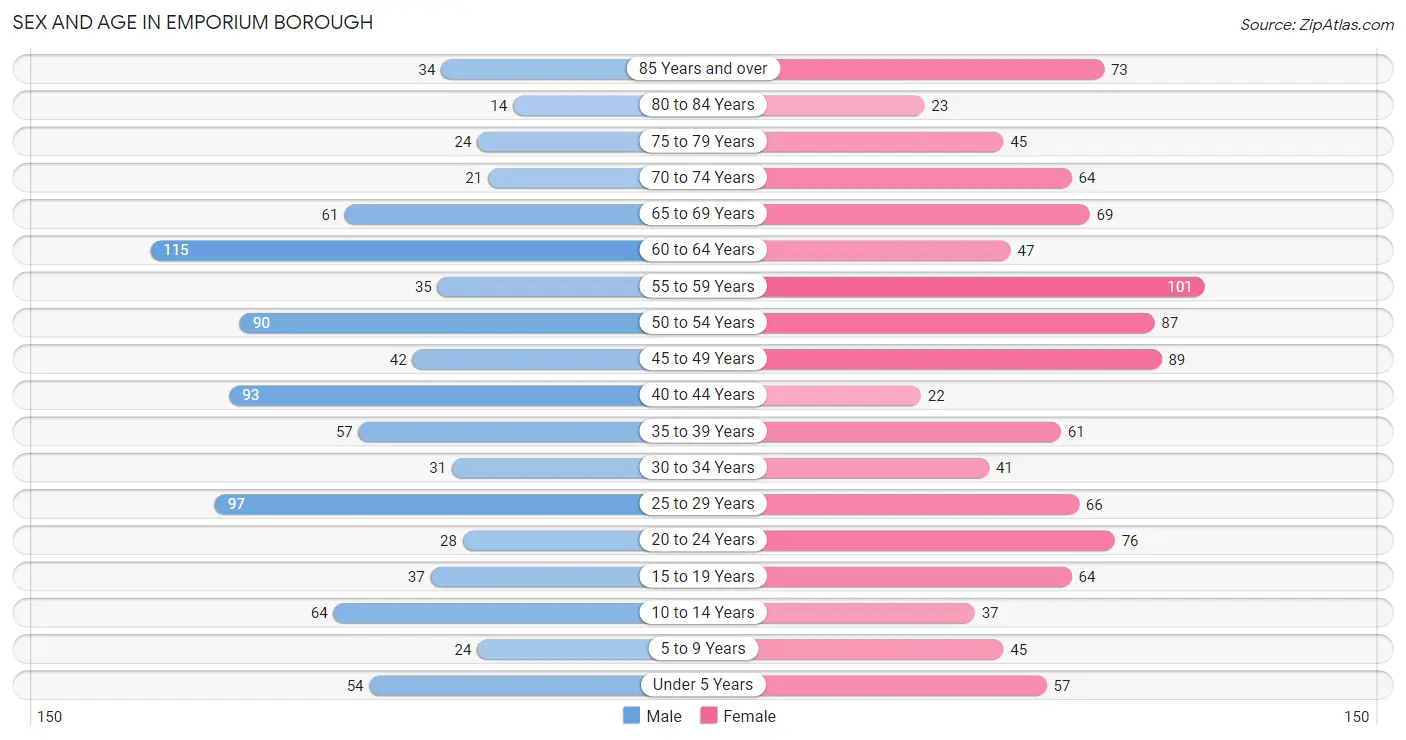
| Age Bracket | Male | Female |
| Under 5 Years | 54 (5.9%) | 57 (5.3%) |
| 5 to 9 Years | 24 (2.6%) | 45 (4.2%) |
| 10 to 14 Years | 64 (7.0%) | 37 (3.5%) |
| 15 to 19 Years | 37 (4.0%) | 64 (6.0%) |
| 20 to 24 Years | 28 (3.0%) | 76 (7.1%) |
| 25 to 29 Years | 97 (10.5%) | 66 (6.2%) |
| 30 to 34 Years | 31 (3.4%) | 41 (3.8%) |
| 35 to 39 Years | 57 (6.2%) | 61 (5.7%) |
| 40 to 44 Years | 93 (10.1%) | 22 (2.1%) |
| 45 to 49 Years | 42 (4.6%) | 89 (8.3%) |
| 50 to 54 Years | 90 (9.8%) | 87 (8.2%) |
| 55 to 59 Years | 35 (3.8%) | 101 (9.5%) |
| 60 to 64 Years | 115 (12.5%) | 47 (4.4%) |
| 65 to 69 Years | 61 (6.6%) | 69 (6.5%) |
| 70 to 74 Years | 21 (2.3%) | 64 (6.0%) |
| 75 to 79 Years | 24 (2.6%) | 45 (4.2%) |
| 80 to 84 Years | 14 (1.5%) | 23 (2.2%) |
| 85 Years and over | 34 (3.7%) | 73 (6.8%) |
| Total | 921 (100.0%) | 1,067 (100.0%) |
Families and Households in Emporium borough
Median Family Size in Emporium borough
The median family size in Emporium borough is 2.32 persons per family, with married-couple families (298 | 53.7%) accounting for the largest median family size of 2.51 persons per family. On the other hand, single male/father families (89 | 16.0%) represent the smallest median family size with 2.09 persons per family.
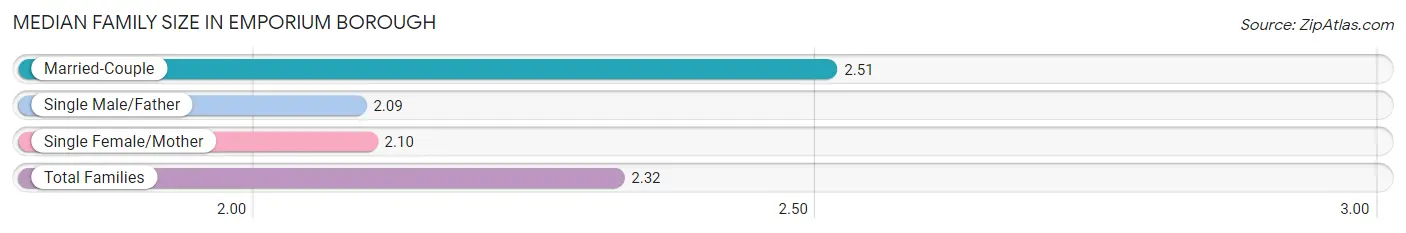
| Family Type | # Families | Family Size |
| Married-Couple | 298 (53.7%) | 2.51 |
| Single Male/Father | 89 (16.0%) | 2.09 |
| Single Female/Mother | 168 (30.3%) | 2.10 |
| Total Families | 555 (100.0%) | 2.32 |
Median Household Size in Emporium borough
The median household size in Emporium borough is 1.87 persons per household, with married-couple households (298 | 28.8%) accounting for the largest median household size of 2.51 persons per household. non-family households (480 | 46.4%) represent the smallest median household size with 1.15 persons per household.
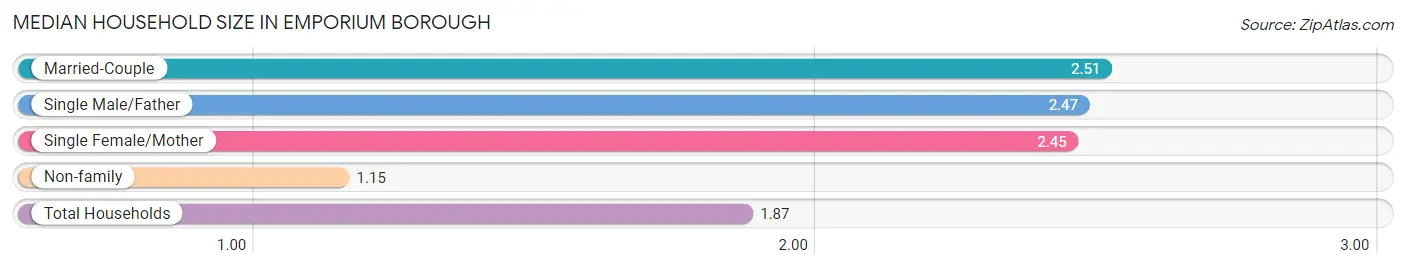
| Household Type | # Households | Household Size |
| Married-Couple | 298 (28.8%) | 2.51 |
| Single Male/Father | 89 (8.6%) | 2.47 |
| Single Female/Mother | 168 (16.2%) | 2.45 |
| Non-family | 480 (46.4%) | 1.15 |
| Total Households | 1,035 (100.0%) | 1.87 |
Household Size by Marriage Status in Emporium borough
Out of a total of 1,035 households in Emporium borough, 555 (53.6%) are family households, while 480 (46.4%) are nonfamily households. The most numerous type of family households are 2-person households, comprising 325, and the most common type of nonfamily households are 1-person households, comprising 409.
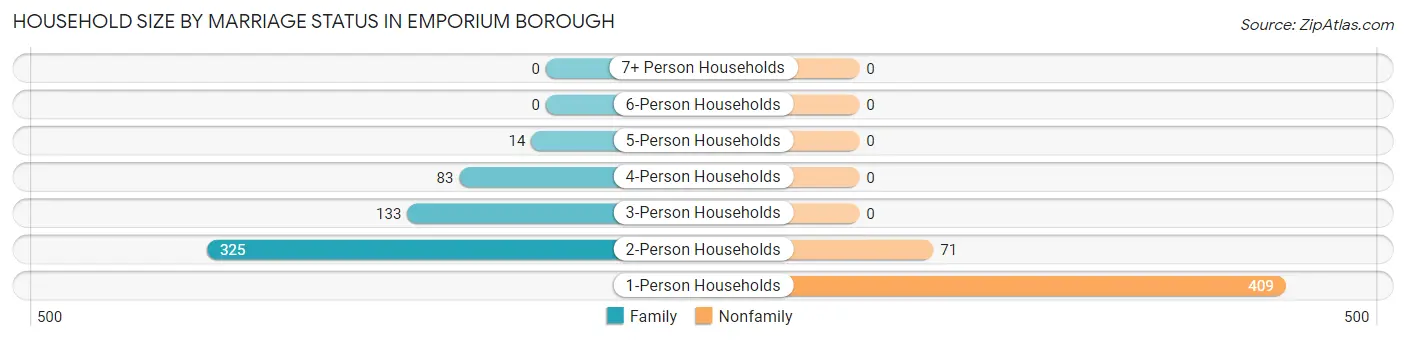
| Household Size | Family Households | Nonfamily Households |
| 1-Person Households | - | 409 (39.5%) |
| 2-Person Households | 325 (31.4%) | 71 (6.9%) |
| 3-Person Households | 133 (12.9%) | 0 (0.0%) |
| 4-Person Households | 83 (8.0%) | 0 (0.0%) |
| 5-Person Households | 14 (1.3%) | 0 (0.0%) |
| 6-Person Households | 0 (0.0%) | 0 (0.0%) |
| 7+ Person Households | 0 (0.0%) | 0 (0.0%) |
| Total | 555 (53.6%) | 480 (46.4%) |
Female Fertility in Emporium borough
Fertility by Age in Emporium borough
Average fertility rate in Emporium borough is 5.0 births per 1,000 women. Women in the age bracket of 20 to 34 years have the highest fertility rate with 11.0 births per 1,000 women. Women in the age bracket of 20 to 34 years acount for 100.0% of all women with births.
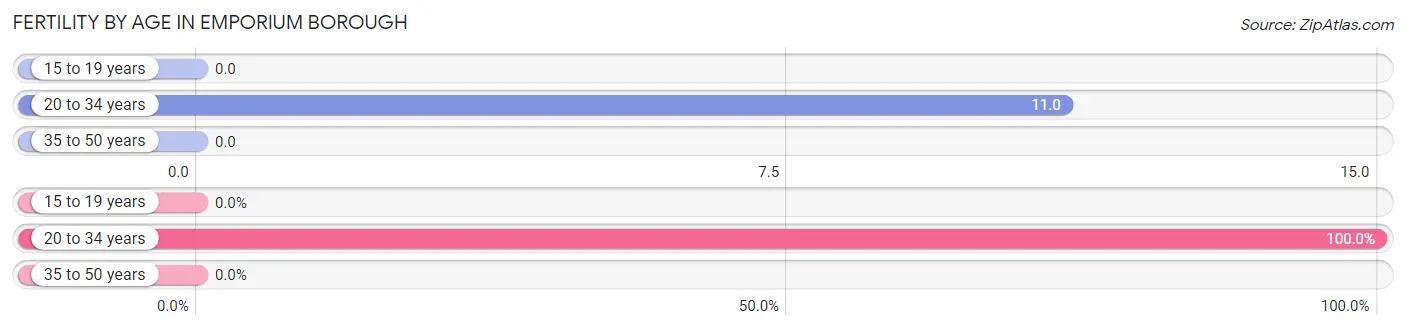
| Age Bracket | Women with Births | Births / 1,000 Women |
| 15 to 19 years | 0 (0.0%) | 0.0 |
| 20 to 34 years | 2 (100.0%) | 11.0 |
| 35 to 50 years | 0 (0.0%) | 0.0 |
| Total | 2 (100.0%) | 5.0 |
Fertility by Age by Marriage Status in Emporium borough
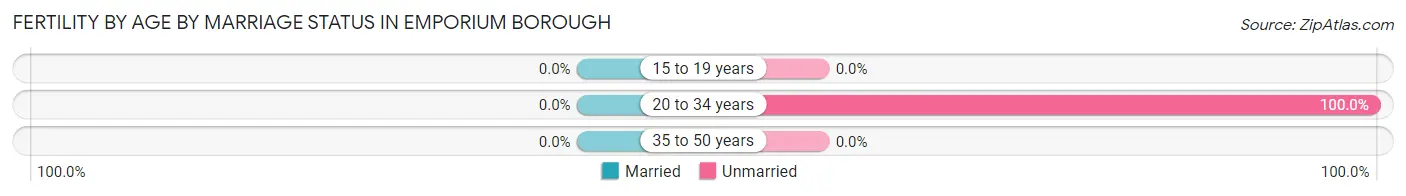
| Age Bracket | Married | Unmarried |
| 15 to 19 years | 0 (0.0%) | 0 (0.0%) |
| 20 to 34 years | 0 (0.0%) | 2 (100.0%) |
| 35 to 50 years | 0 (0.0%) | 0 (0.0%) |
| Total | 0 (0.0%) | 2 (100.0%) |
Fertility by Education in Emporium borough
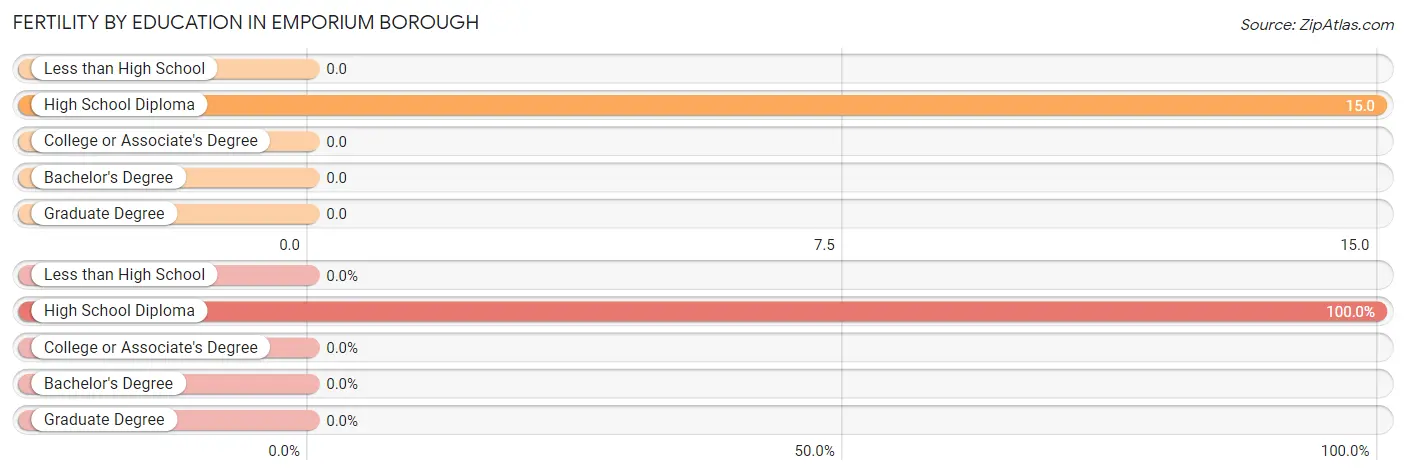
| Educational Attainment | Women with Births | Births / 1,000 Women |
| Less than High School | 0 (0.0%) | 0.0 |
| High School Diploma | 2 (100.0%) | 15.0 |
| College or Associate's Degree | 0 (0.0%) | 0.0 |
| Bachelor's Degree | 0 (0.0%) | 0.0 |
| Graduate Degree | 0 (0.0%) | 0.0 |
| Total | 2 (100.0%) | 5.0 |
Fertility by Education by Marriage Status in Emporium borough
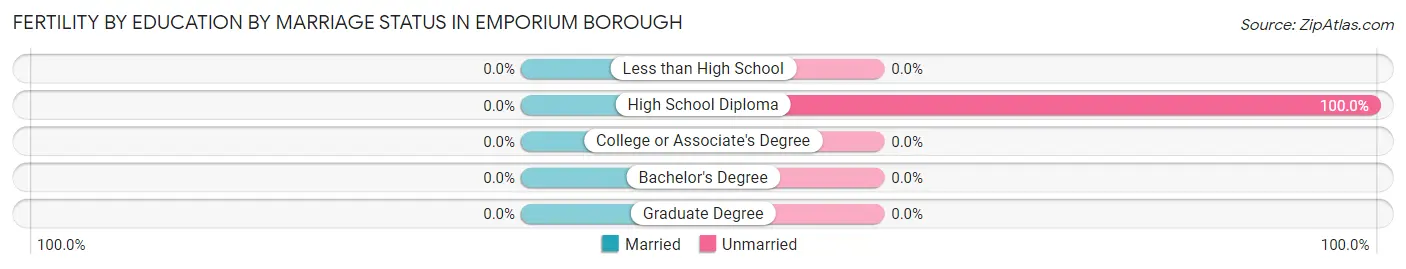
| Educational Attainment | Married | Unmarried |
| Less than High School | 0 (0.0%) | 0 (0.0%) |
| High School Diploma | 0 (0.0%) | 2 (100.0%) |
| College or Associate's Degree | 0 (0.0%) | 0 (0.0%) |
| Bachelor's Degree | 0 (0.0%) | 0 (0.0%) |
| Graduate Degree | 0 (0.0%) | 0 (0.0%) |
| Total | 0 (0.0%) | 2 (100.0%) |
Employment Characteristics in Emporium borough
Employment by Class of Employer in Emporium borough
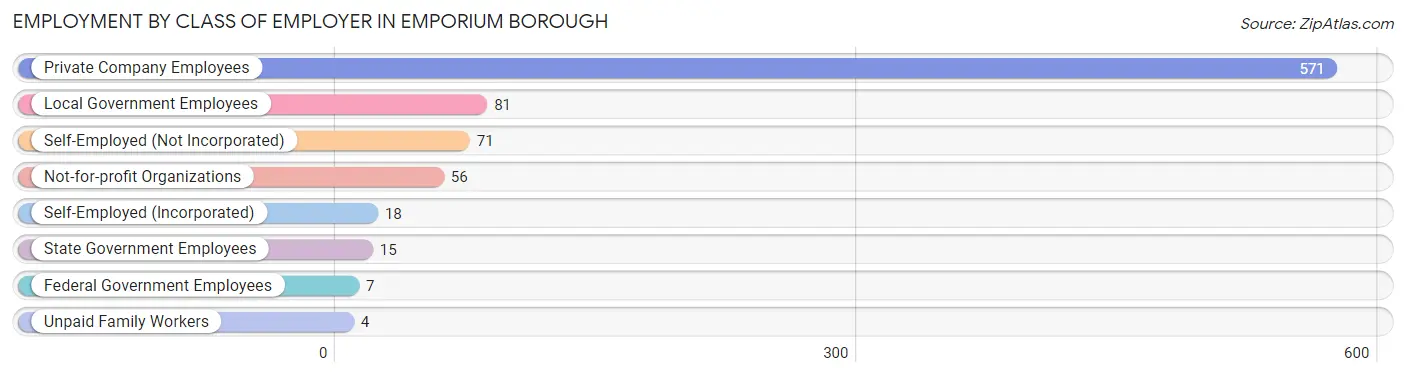
Among the 823 employed individuals in Emporium borough, private company employees (571 | 69.4%), local government employees (81 | 9.8%), and self-employed (not incorporated) (71 | 8.6%) make up the most common classes of employment.
| Employer Class | # Employees | % Employees |
| Private Company Employees | 571 | 69.4% |
| Self-Employed (Incorporated) | 18 | 2.2% |
| Self-Employed (Not Incorporated) | 71 | 8.6% |
| Not-for-profit Organizations | 56 | 6.8% |
| Local Government Employees | 81 | 9.8% |
| State Government Employees | 15 | 1.8% |
| Federal Government Employees | 7 | 0.9% |
| Unpaid Family Workers | 4 | 0.5% |
| Total | 823 | 100.0% |
Employment Status by Age in Emporium borough
According to the labor force statistics for Emporium borough, out of the total population over 16 years of age (1,678), 54.5% or 915 individuals are in the labor force, with 10.1% or 92 of them unemployed. The age group with the highest labor force participation rate is 30 to 34 years, with 94.4% or 68 individuals in the labor force. Within the labor force, the 30 to 34 years age range has the highest percentage of unemployed individuals, with 35.3% or 24 of them being unemployed.
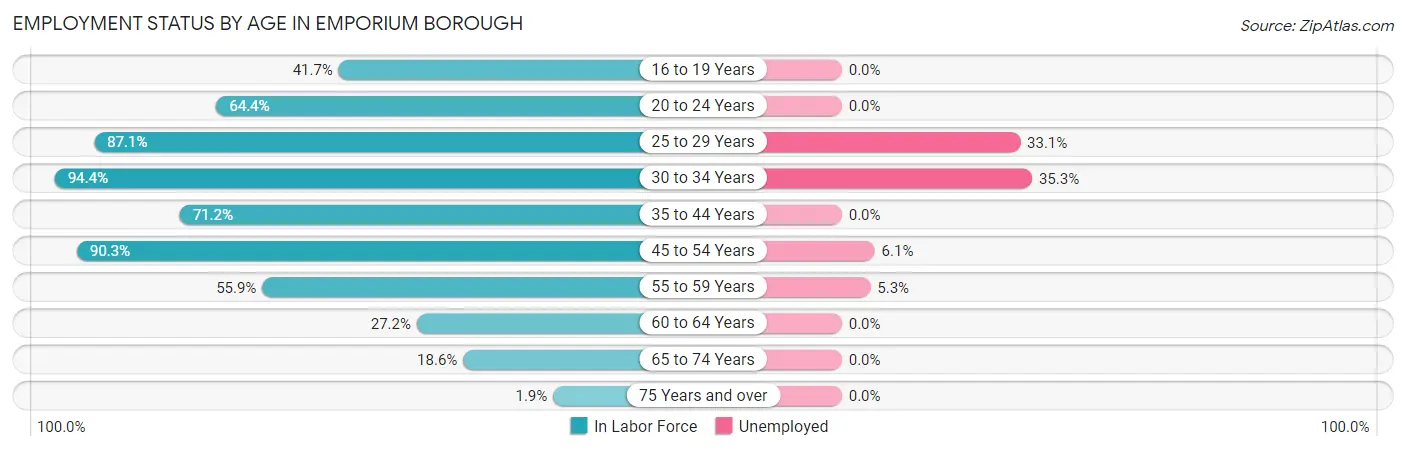
| Age Bracket | In Labor Force | Unemployed |
| 16 to 19 Years | 30 (41.7%) | 0 (0.0%) |
| 20 to 24 Years | 67 (64.4%) | 0 (0.0%) |
| 25 to 29 Years | 142 (87.1%) | 47 (33.1%) |
| 30 to 34 Years | 68 (94.4%) | 24 (35.3%) |
| 35 to 44 Years | 166 (71.2%) | 0 (0.0%) |
| 45 to 54 Years | 278 (90.3%) | 17 (6.1%) |
| 55 to 59 Years | 76 (55.9%) | 4 (5.3%) |
| 60 to 64 Years | 44 (27.2%) | 0 (0.0%) |
| 65 to 74 Years | 40 (18.6%) | 0 (0.0%) |
| 75 Years and over | 4 (1.9%) | 0 (0.0%) |
| Total | 915 (54.5%) | 92 (10.1%) |
Employment Status by Educational Attainment in Emporium borough
According to labor force statistics for Emporium borough, 72.1% of individuals (774) out of the total population between 25 and 64 years of age (1,074) are in the labor force, with 11.9% or 92 of them being unemployed. The group with the highest labor force participation rate are those with the educational attainment of bachelor's degree or higher, with 84.3% or 59 individuals in the labor force. Within the labor force, individuals with high school diploma education have the highest percentage of unemployment, with 13.9% or 45 of them being unemployed.
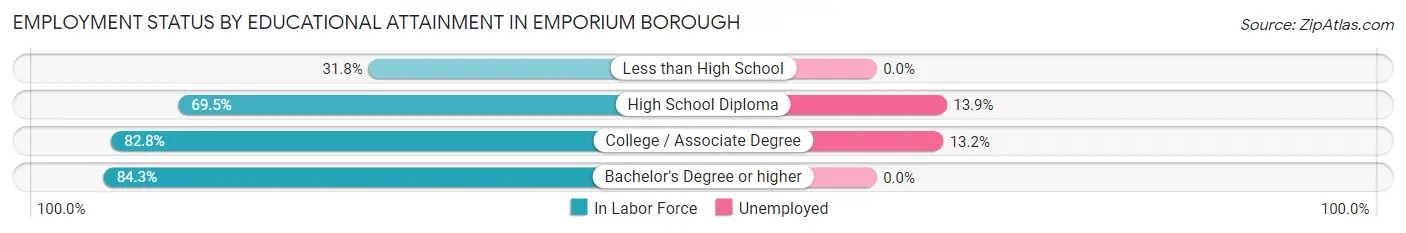
| Educational Attainment | In Labor Force | Unemployed |
| Less than High School | 34 (31.8%) | 0 (0.0%) |
| High School Diploma | 324 (69.5%) | 65 (13.9%) |
| College / Associate Degree | 357 (82.8%) | 57 (13.2%) |
| Bachelor's Degree or higher | 59 (84.3%) | 0 (0.0%) |
| Total | 774 (72.1%) | 128 (11.9%) |
Employment Occupations by Sex in Emporium borough
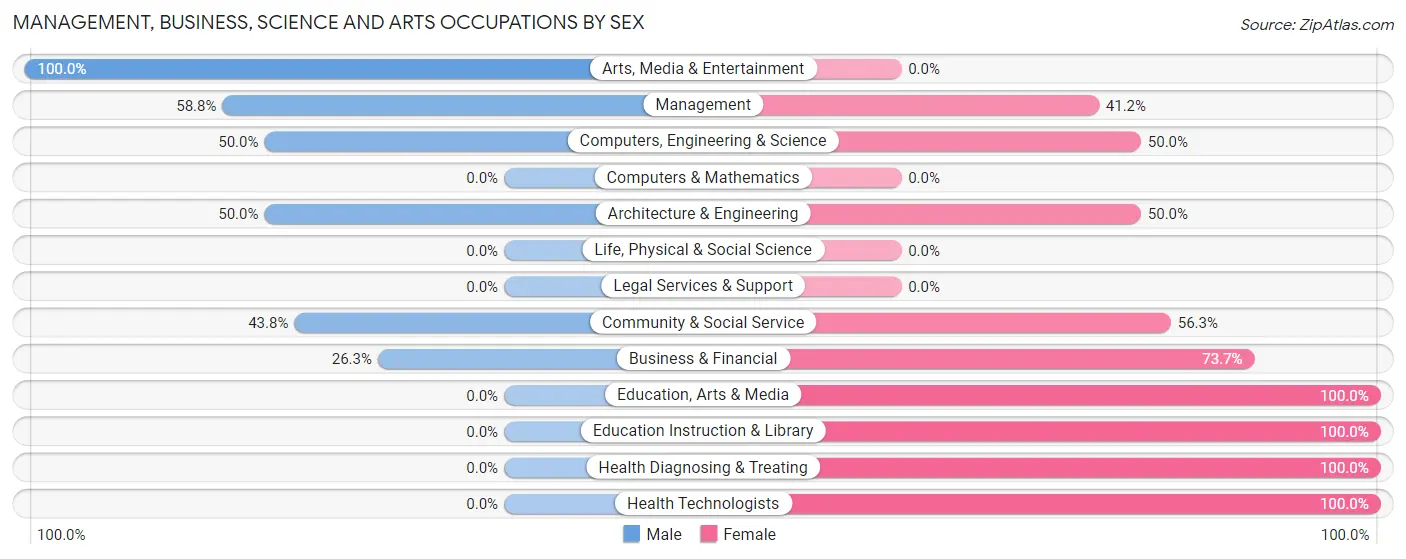
Management, Business, Science and Arts Occupations
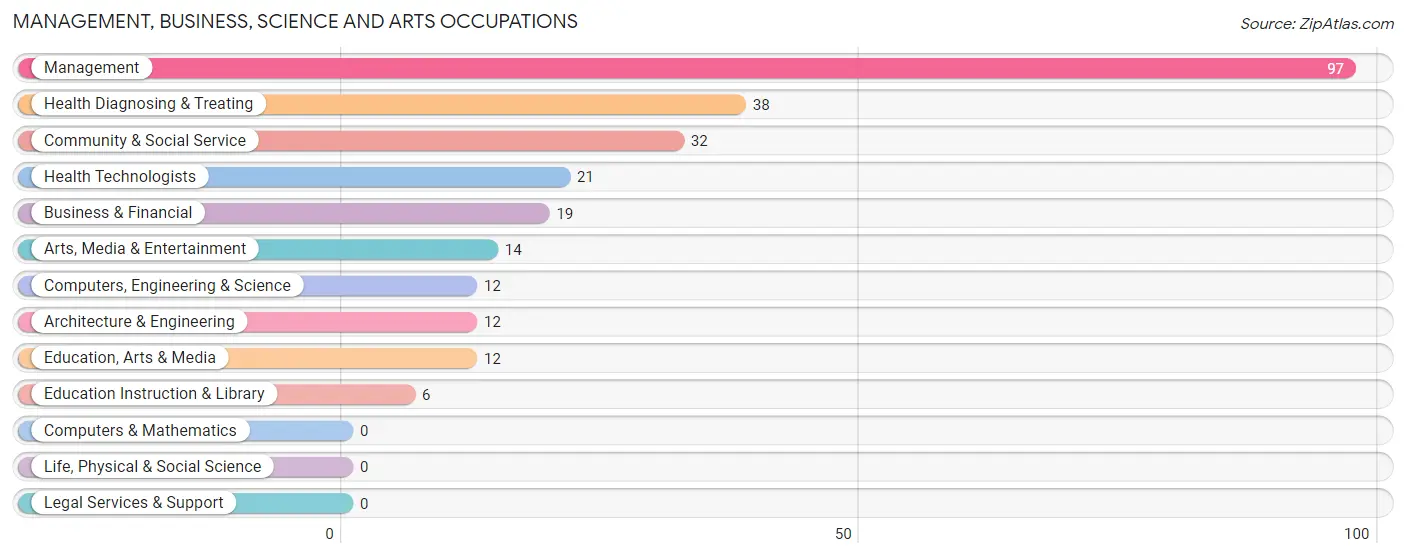
The most common Management, Business, Science and Arts occupations in Emporium borough are Management (97 | 11.8%), Health Diagnosing & Treating (38 | 4.6%), Community & Social Service (32 | 3.9%), Health Technologists (21 | 2.5%), and Business & Financial (19 | 2.3%).
Management, Business, Science and Arts Occupations by Sex
Within the Management, Business, Science and Arts occupations in Emporium borough, the most male-oriented occupations are Arts, Media & Entertainment (100.0%), Management (58.8%), and Computers, Engineering & Science (50.0%), while the most female-oriented occupations are Education, Arts & Media (100.0%), Education Instruction & Library (100.0%), and Health Diagnosing & Treating (100.0%).
| Occupation | Male | Female |
| Management | 57 (58.8%) | 40 (41.2%) |
| Business & Financial | 5 (26.3%) | 14 (73.7%) |
| Computers, Engineering & Science | 6 (50.0%) | 6 (50.0%) |
| Computers & Mathematics | 0 (0.0%) | 0 (0.0%) |
| Architecture & Engineering | 6 (50.0%) | 6 (50.0%) |
| Life, Physical & Social Science | 0 (0.0%) | 0 (0.0%) |
| Community & Social Service | 14 (43.8%) | 18 (56.2%) |
| Education, Arts & Media | 0 (0.0%) | 12 (100.0%) |
| Legal Services & Support | 0 (0.0%) | 0 (0.0%) |
| Education Instruction & Library | 0 (0.0%) | 6 (100.0%) |
| Arts, Media & Entertainment | 14 (100.0%) | 0 (0.0%) |
| Health Diagnosing & Treating | 0 (0.0%) | 38 (100.0%) |
| Health Technologists | 0 (0.0%) | 21 (100.0%) |
| Total (Category) | 82 (41.4%) | 116 (58.6%) |
| Total (Overall) | 416 (50.5%) | 407 (49.4%) |
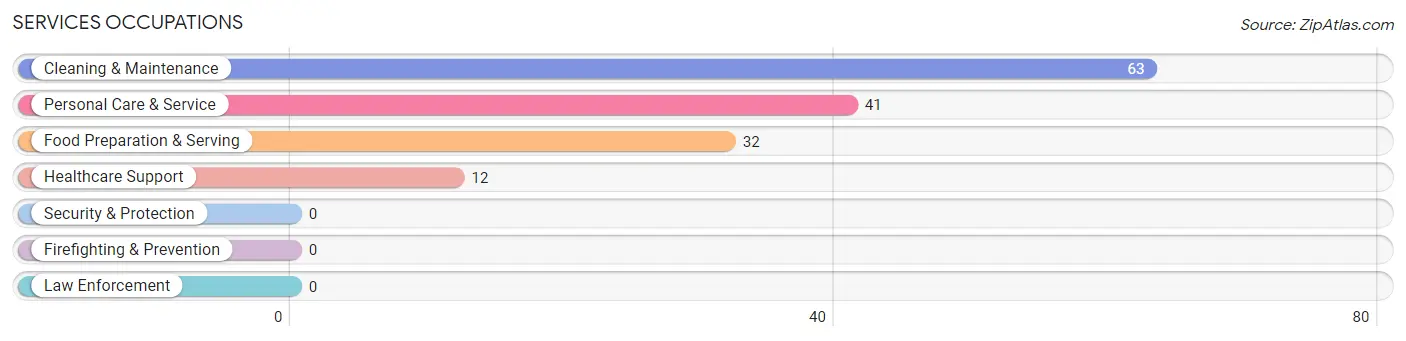
Services Occupations
The most common Services occupations in Emporium borough are Cleaning & Maintenance (63 | 7.6%), Personal Care & Service (41 | 5.0%), Food Preparation & Serving (32 | 3.9%), and Healthcare Support (12 | 1.5%).
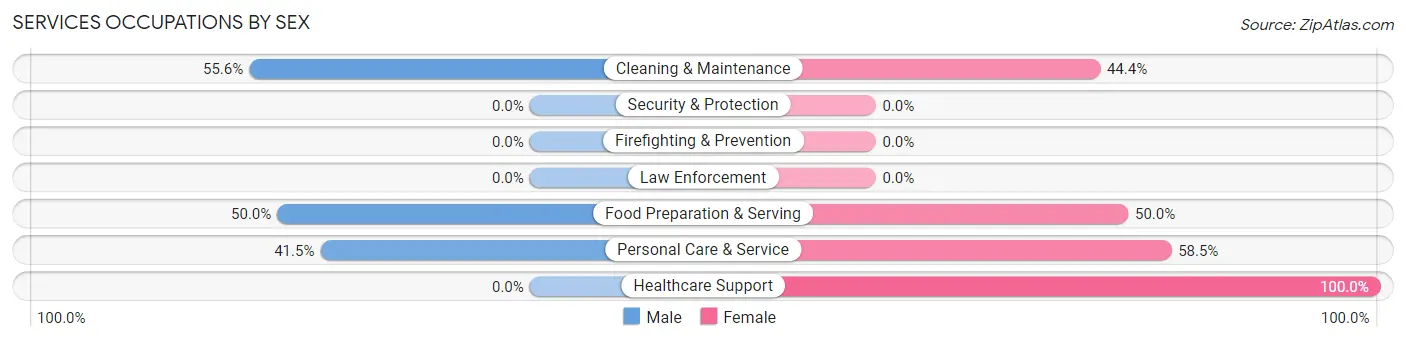
Services Occupations by Sex
Within the Services occupations in Emporium borough, the most male-oriented occupations are Cleaning & Maintenance (55.6%), Food Preparation & Serving (50.0%), and Personal Care & Service (41.5%), while the most female-oriented occupations are Healthcare Support (100.0%), Personal Care & Service (58.5%), and Food Preparation & Serving (50.0%).
| Occupation | Male | Female |
| Healthcare Support | 0 (0.0%) | 12 (100.0%) |
| Security & Protection | 0 (0.0%) | 0 (0.0%) |
| Firefighting & Prevention | 0 (0.0%) | 0 (0.0%) |
| Law Enforcement | 0 (0.0%) | 0 (0.0%) |
| Food Preparation & Serving | 16 (50.0%) | 16 (50.0%) |
| Cleaning & Maintenance | 35 (55.6%) | 28 (44.4%) |
| Personal Care & Service | 17 (41.5%) | 24 (58.5%) |
| Total (Category) | 68 (46.0%) | 80 (54.0%) |
| Total (Overall) | 416 (50.5%) | 407 (49.4%) |
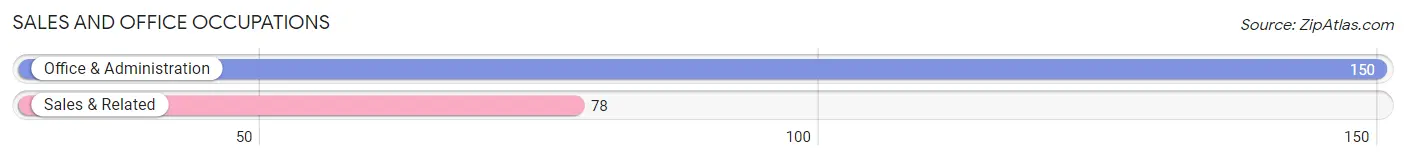
Sales and Office Occupations
The most common Sales and Office occupations in Emporium borough are Office & Administration (150 | 18.2%), and Sales & Related (78 | 9.5%).
Sales and Office Occupations by Sex
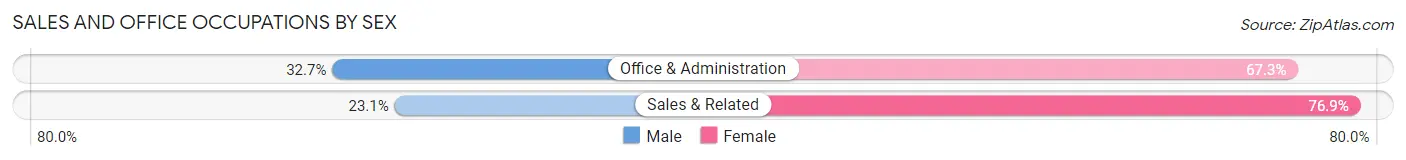
| Occupation | Male | Female |
| Sales & Related | 18 (23.1%) | 60 (76.9%) |
| Office & Administration | 49 (32.7%) | 101 (67.3%) |
| Total (Category) | 67 (29.4%) | 161 (70.6%) |
| Total (Overall) | 416 (50.5%) | 407 (49.4%) |
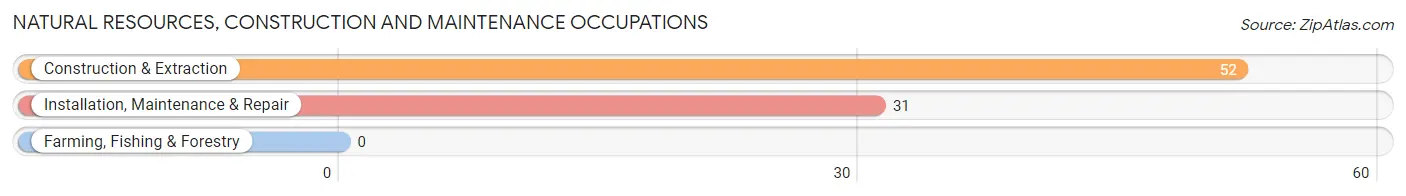
Natural Resources, Construction and Maintenance Occupations
The most common Natural Resources, Construction and Maintenance occupations in Emporium borough are Construction & Extraction (52 | 6.3%), and Installation, Maintenance & Repair (31 | 3.8%).
Natural Resources, Construction and Maintenance Occupations by Sex
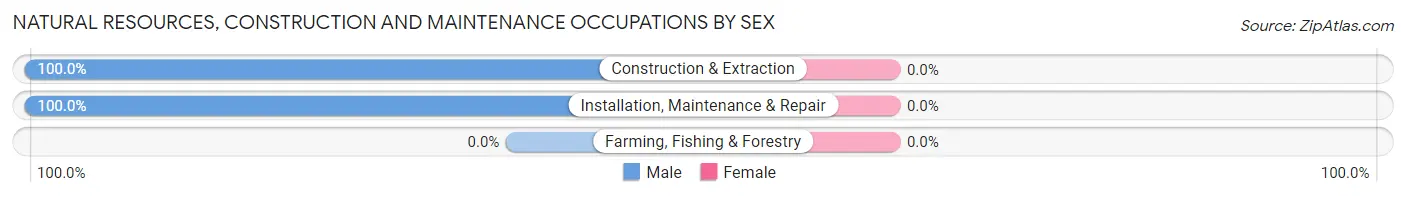
| Occupation | Male | Female |
| Farming, Fishing & Forestry | 0 (0.0%) | 0 (0.0%) |
| Construction & Extraction | 52 (100.0%) | 0 (0.0%) |
| Installation, Maintenance & Repair | 31 (100.0%) | 0 (0.0%) |
| Total (Category) | 83 (100.0%) | 0 (0.0%) |
| Total (Overall) | 416 (50.5%) | 407 (49.4%) |
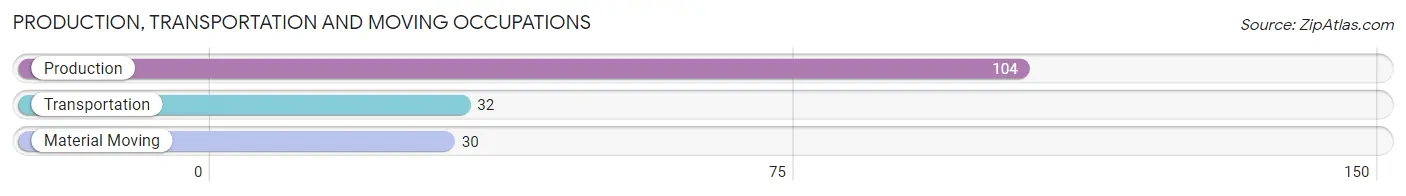
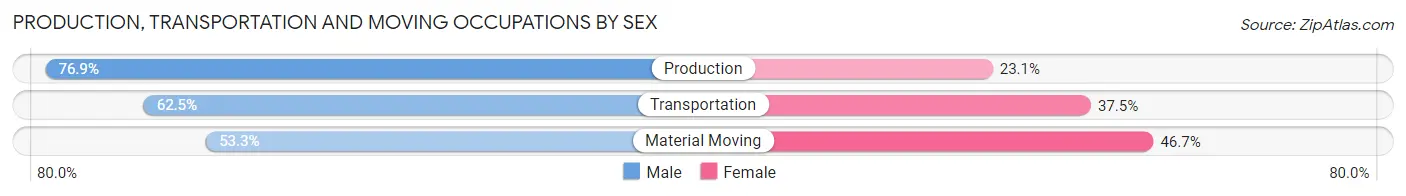
Production, Transportation and Moving Occupations
The most common Production, Transportation and Moving occupations in Emporium borough are Production (104 | 12.6%), Transportation (32 | 3.9%), and Material Moving (30 | 3.6%).
Production, Transportation and Moving Occupations by Sex
| Occupation | Male | Female |
| Production | 80 (76.9%) | 24 (23.1%) |
| Transportation | 20 (62.5%) | 12 (37.5%) |
| Material Moving | 16 (53.3%) | 14 (46.7%) |
| Total (Category) | 116 (69.9%) | 50 (30.1%) |
| Total (Overall) | 416 (50.5%) | 407 (49.4%) |
Employment Industries by Sex in Emporium borough
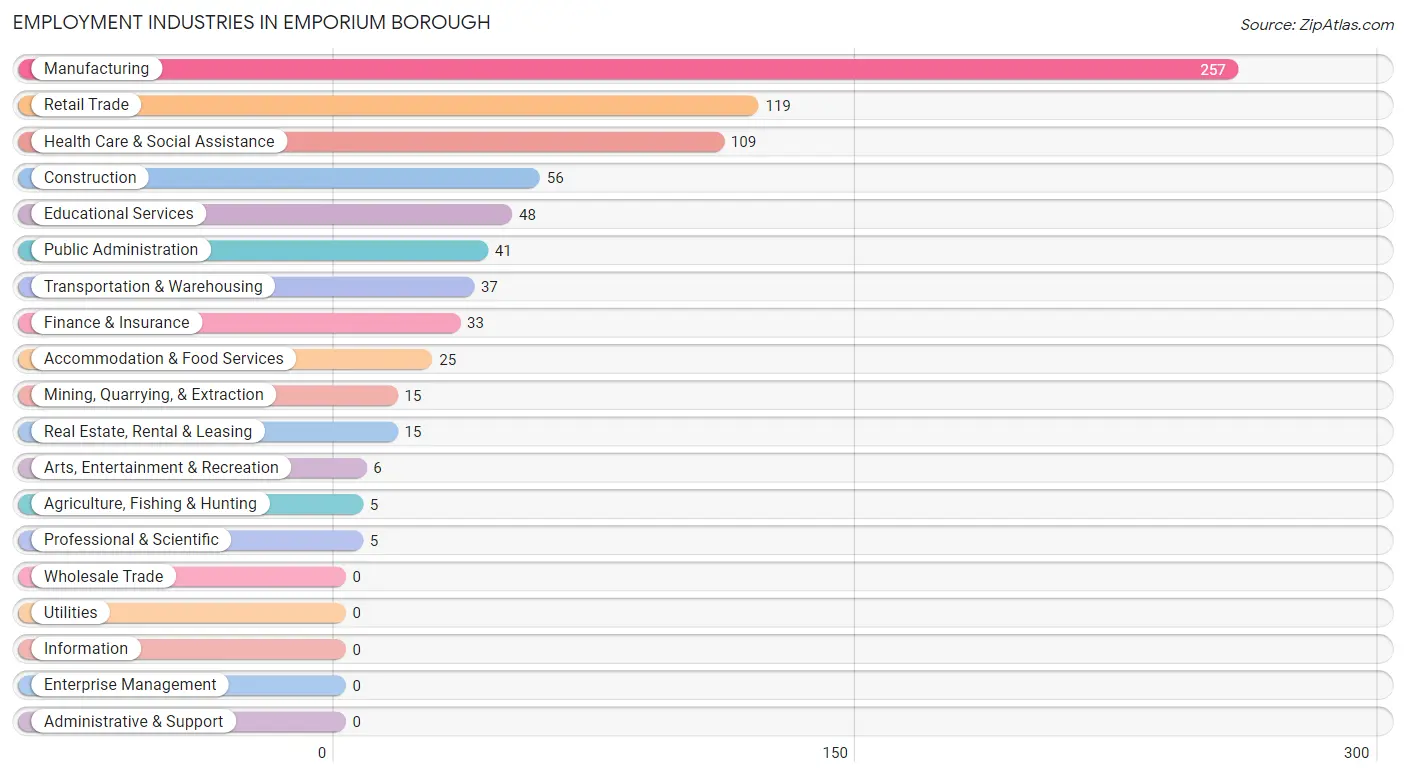
Employment Industries in Emporium borough
The major employment industries in Emporium borough include Manufacturing (257 | 31.2%), Retail Trade (119 | 14.5%), Health Care & Social Assistance (109 | 13.2%), Construction (56 | 6.8%), and Educational Services (48 | 5.8%).
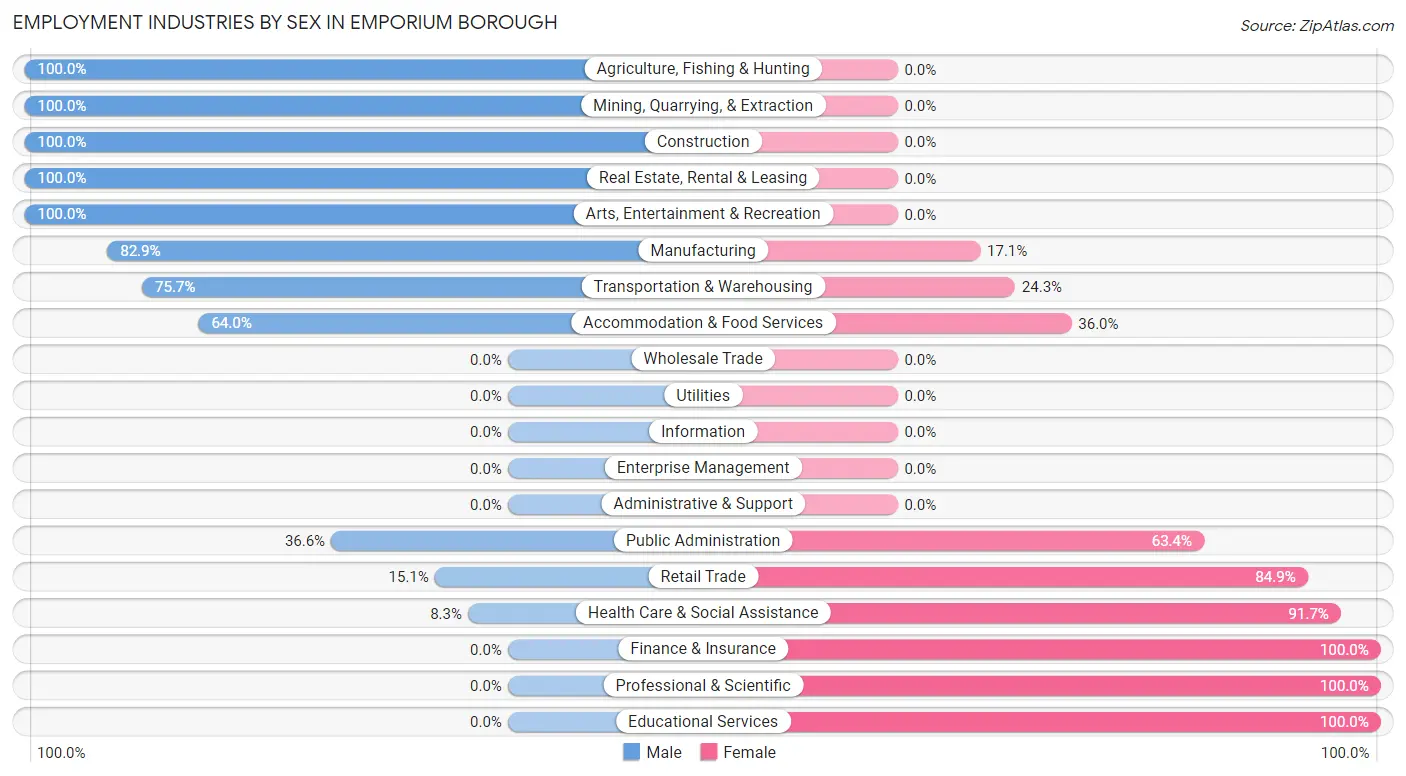
Employment Industries by Sex in Emporium borough
The Emporium borough industries that see more men than women are Agriculture, Fishing & Hunting (100.0%), Mining, Quarrying, & Extraction (100.0%), and Construction (100.0%), whereas the industries that tend to have a higher number of women are Finance & Insurance (100.0%), Professional & Scientific (100.0%), and Educational Services (100.0%).
| Industry | Male | Female |
| Agriculture, Fishing & Hunting | 5 (100.0%) | 0 (0.0%) |
| Mining, Quarrying, & Extraction | 15 (100.0%) | 0 (0.0%) |
| Construction | 56 (100.0%) | 0 (0.0%) |
| Manufacturing | 213 (82.9%) | 44 (17.1%) |
| Wholesale Trade | 0 (0.0%) | 0 (0.0%) |
| Retail Trade | 18 (15.1%) | 101 (84.9%) |
| Transportation & Warehousing | 28 (75.7%) | 9 (24.3%) |
| Utilities | 0 (0.0%) | 0 (0.0%) |
| Information | 0 (0.0%) | 0 (0.0%) |
| Finance & Insurance | 0 (0.0%) | 33 (100.0%) |
| Real Estate, Rental & Leasing | 15 (100.0%) | 0 (0.0%) |
| Professional & Scientific | 0 (0.0%) | 5 (100.0%) |
| Enterprise Management | 0 (0.0%) | 0 (0.0%) |
| Administrative & Support | 0 (0.0%) | 0 (0.0%) |
| Educational Services | 0 (0.0%) | 48 (100.0%) |
| Health Care & Social Assistance | 9 (8.3%) | 100 (91.7%) |
| Arts, Entertainment & Recreation | 6 (100.0%) | 0 (0.0%) |
| Accommodation & Food Services | 16 (64.0%) | 9 (36.0%) |
| Public Administration | 15 (36.6%) | 26 (63.4%) |
| Total | 416 (50.5%) | 407 (49.4%) |
Education in Emporium borough
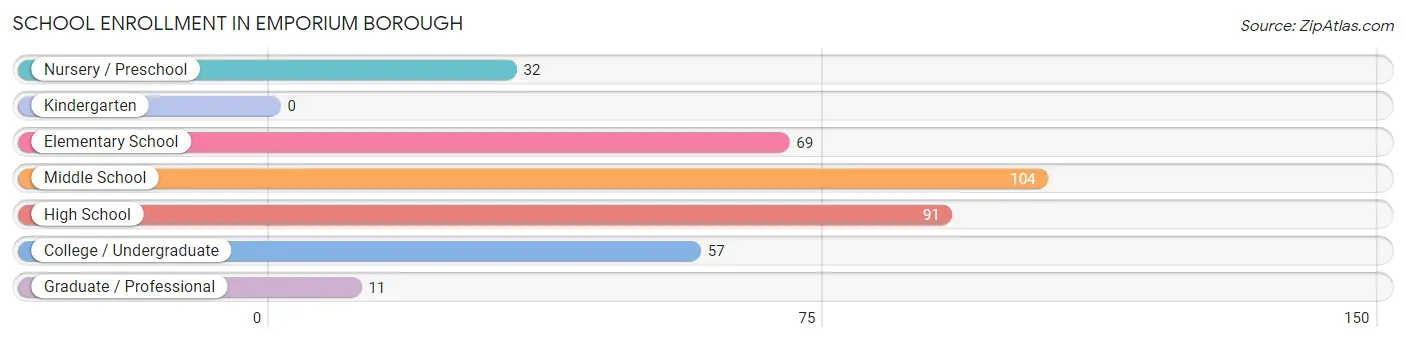
School Enrollment in Emporium borough
The most common levels of schooling among the 364 students in Emporium borough are middle school (104 | 28.6%), high school (91 | 25.0%), and elementary school (69 | 19.0%).
| School Level | # Students | % Students |
| Nursery / Preschool | 32 | 8.8% |
| Kindergarten | 0 | 0.0% |
| Elementary School | 69 | 19.0% |
| Middle School | 104 | 28.6% |
| High School | 91 | 25.0% |
| College / Undergraduate | 57 | 15.7% |
| Graduate / Professional | 11 | 3.0% |
| Total | 364 | 100.0% |
School Enrollment by Age by Funding Source in Emporium borough
Out of a total of 364 students who are enrolled in schools in Emporium borough, 41 (11.3%) attend a private institution, while the remaining 323 (88.7%) are enrolled in public schools. The age group of 35 years and over has the highest likelihood of being enrolled in private schools, with 30 (100.0% in the age bracket) enrolled. Conversely, the age group of 3 to 4 year olds has the lowest likelihood of being enrolled in a private school, with 32 (100.0% in the age bracket) attending a public institution.
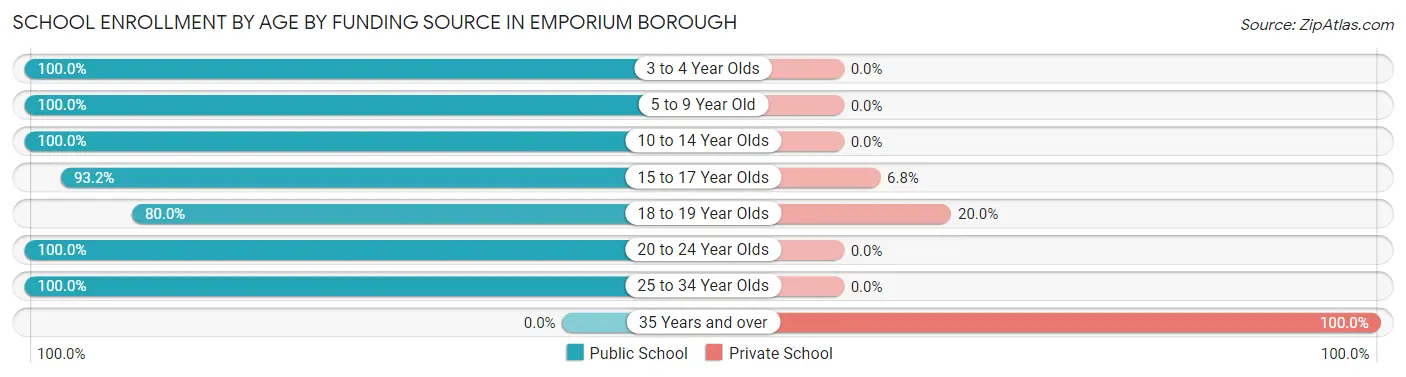
| Age Bracket | Public School | Private School |
| 3 to 4 Year Olds | 32 (100.0%) | 0 (0.0%) |
| 5 to 9 Year Old | 69 (100.0%) | 0 (0.0%) |
| 10 to 14 Year Olds | 101 (100.0%) | 0 (0.0%) |
| 15 to 17 Year Olds | 55 (93.2%) | 4 (6.8%) |
| 18 to 19 Year Olds | 28 (80.0%) | 7 (20.0%) |
| 20 to 24 Year Olds | 29 (100.0%) | 0 (0.0%) |
| 25 to 34 Year Olds | 9 (100.0%) | 0 (0.0%) |
| 35 Years and over | 0 (0.0%) | 30 (100.0%) |
| Total | 323 (88.7%) | 41 (11.3%) |
Educational Attainment by Field of Study in Emporium borough
Education (33 | 28.2%), psychology (25 | 21.4%), liberal arts & history (14 | 12.0%), social sciences (12 | 10.3%), and visual & performing arts (12 | 10.3%) are the most common fields of study among 117 individuals in Emporium borough who have obtained a bachelor's degree or higher.
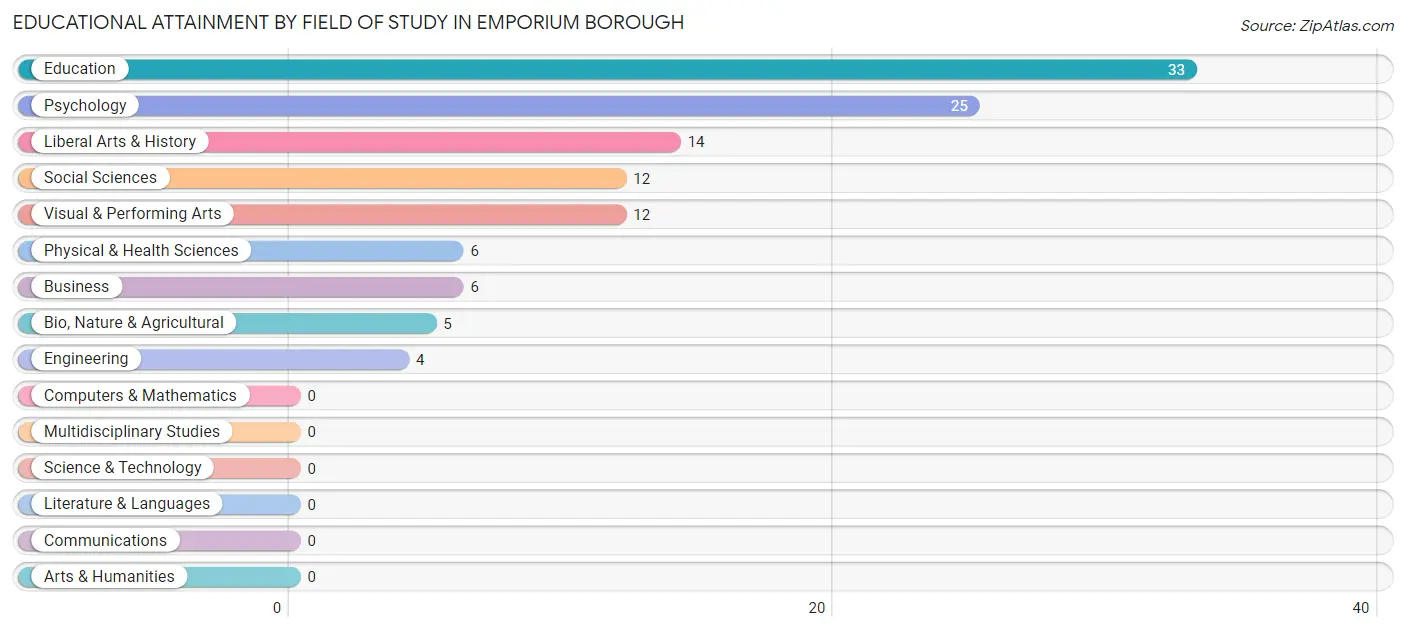
| Field of Study | # Graduates | % Graduates |
| Computers & Mathematics | 0 | 0.0% |
| Bio, Nature & Agricultural | 5 | 4.3% |
| Physical & Health Sciences | 6 | 5.1% |
| Psychology | 25 | 21.4% |
| Social Sciences | 12 | 10.3% |
| Engineering | 4 | 3.4% |
| Multidisciplinary Studies | 0 | 0.0% |
| Science & Technology | 0 | 0.0% |
| Business | 6 | 5.1% |
| Education | 33 | 28.2% |
| Literature & Languages | 0 | 0.0% |
| Liberal Arts & History | 14 | 12.0% |
| Visual & Performing Arts | 12 | 10.3% |
| Communications | 0 | 0.0% |
| Arts & Humanities | 0 | 0.0% |
| Total | 117 | 100.0% |
Transportation & Commute in Emporium borough
Vehicle Availability by Sex in Emporium borough
The most prevalent vehicle ownership categories in Emporium borough are males with 2 vehicles (194, accounting for 47.0%) and females with 2 vehicles (161, making up 48.5%).
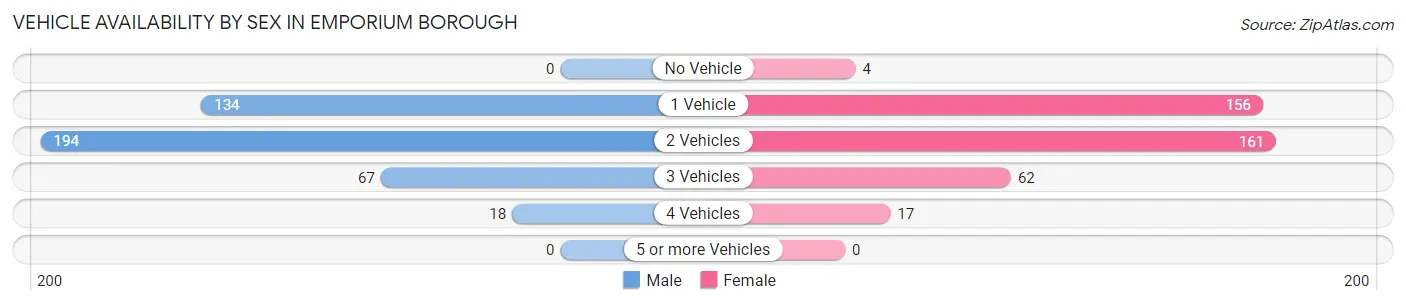
| Vehicles Available | Male | Female |
| No Vehicle | 0 (0.0%) | 4 (1.0%) |
| 1 Vehicle | 134 (32.5%) | 156 (39.0%) |
| 2 Vehicles | 194 (47.0%) | 161 (40.3%) |
| 3 Vehicles | 67 (16.2%) | 62 (15.5%) |
| 4 Vehicles | 18 (4.4%) | 17 (4.3%) |
| 5 or more Vehicles | 0 (0.0%) | 0 (0.0%) |
| Total | 413 (100.0%) | 400 (100.0%) |
Commute Time in Emporium borough
The most frequently occuring commute durations in Emporium borough are 5 to 9 minutes (310 commuters, 37.9%), less than 5 minutes (241 commuters, 29.5%), and 45 to 59 minutes (75 commuters, 9.2%).
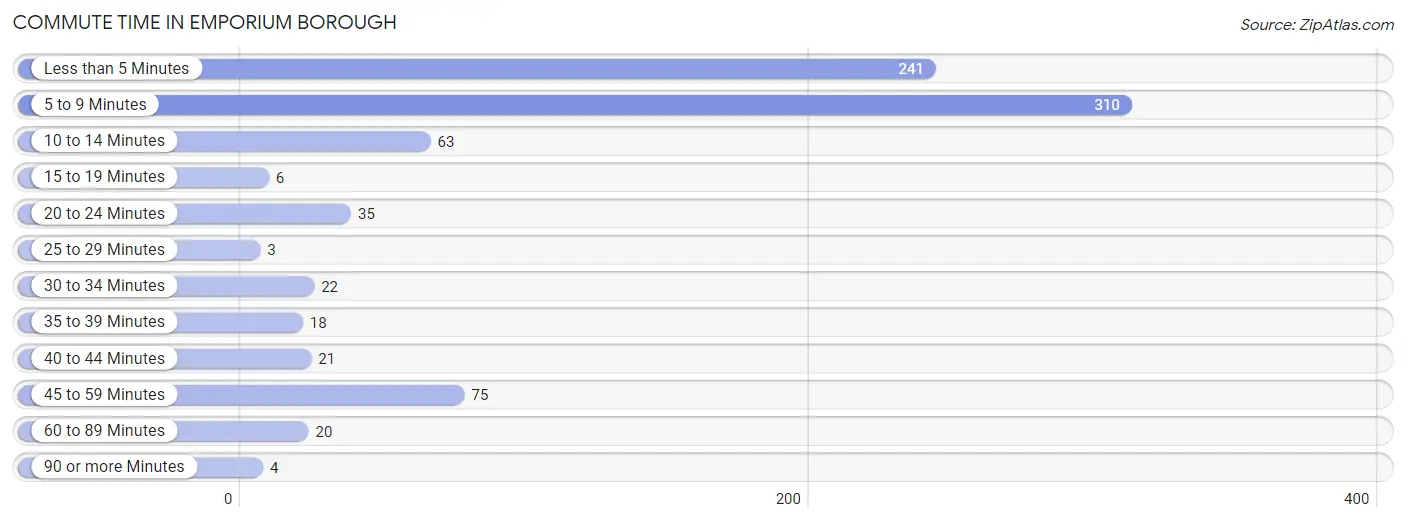
| Commute Time | # Commuters | % Commuters |
| Less than 5 Minutes | 241 | 29.5% |
| 5 to 9 Minutes | 310 | 37.9% |
| 10 to 14 Minutes | 63 | 7.7% |
| 15 to 19 Minutes | 6 | 0.7% |
| 20 to 24 Minutes | 35 | 4.3% |
| 25 to 29 Minutes | 3 | 0.4% |
| 30 to 34 Minutes | 22 | 2.7% |
| 35 to 39 Minutes | 18 | 2.2% |
| 40 to 44 Minutes | 21 | 2.6% |
| 45 to 59 Minutes | 75 | 9.2% |
| 60 to 89 Minutes | 20 | 2.4% |
| 90 or more Minutes | 4 | 0.5% |
Commute Time by Sex in Emporium borough
The most common commute times in Emporium borough are 5 to 9 minutes (168 commuters, 40.4%) for males and 5 to 9 minutes (142 commuters, 35.3%) for females.
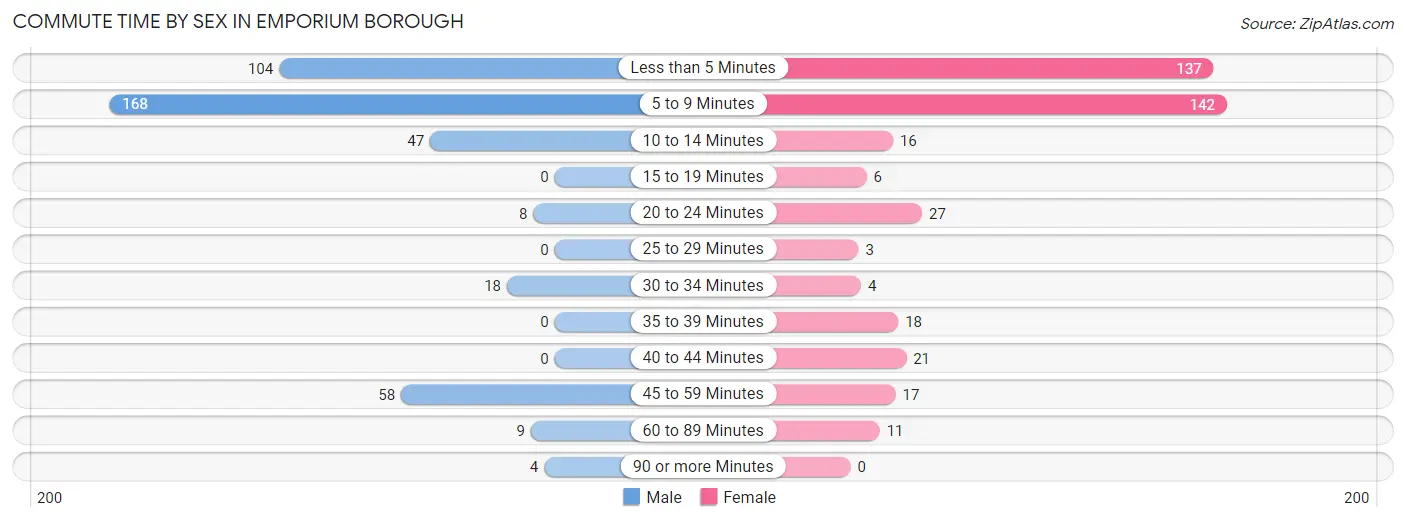
| Commute Time | Male | Female |
| Less than 5 Minutes | 104 (25.0%) | 137 (34.1%) |
| 5 to 9 Minutes | 168 (40.4%) | 142 (35.3%) |
| 10 to 14 Minutes | 47 (11.3%) | 16 (4.0%) |
| 15 to 19 Minutes | 0 (0.0%) | 6 (1.5%) |
| 20 to 24 Minutes | 8 (1.9%) | 27 (6.7%) |
| 25 to 29 Minutes | 0 (0.0%) | 3 (0.7%) |
| 30 to 34 Minutes | 18 (4.3%) | 4 (1.0%) |
| 35 to 39 Minutes | 0 (0.0%) | 18 (4.5%) |
| 40 to 44 Minutes | 0 (0.0%) | 21 (5.2%) |
| 45 to 59 Minutes | 58 (13.9%) | 17 (4.2%) |
| 60 to 89 Minutes | 9 (2.2%) | 11 (2.7%) |
| 90 or more Minutes | 4 (1.0%) | 0 (0.0%) |
Time of Departure to Work by Sex in Emporium borough
The most frequent times of departure to work in Emporium borough are 6:30 AM to 6:59 AM (92, 22.1%) for males and 7:30 AM to 7:59 AM (82, 20.4%) for females.
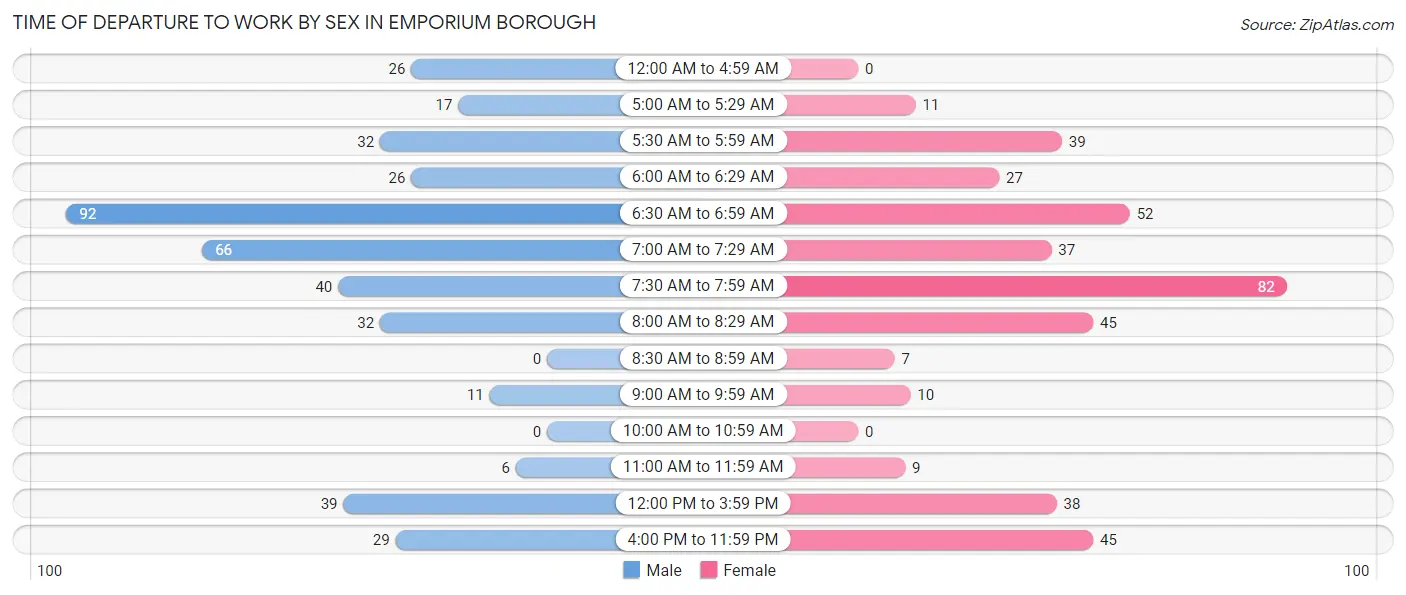
| Time of Departure | Male | Female |
| 12:00 AM to 4:59 AM | 26 (6.2%) | 0 (0.0%) |
| 5:00 AM to 5:29 AM | 17 (4.1%) | 11 (2.7%) |
| 5:30 AM to 5:59 AM | 32 (7.7%) | 39 (9.7%) |
| 6:00 AM to 6:29 AM | 26 (6.2%) | 27 (6.7%) |
| 6:30 AM to 6:59 AM | 92 (22.1%) | 52 (12.9%) |
| 7:00 AM to 7:29 AM | 66 (15.9%) | 37 (9.2%) |
| 7:30 AM to 7:59 AM | 40 (9.6%) | 82 (20.4%) |
| 8:00 AM to 8:29 AM | 32 (7.7%) | 45 (11.2%) |
| 8:30 AM to 8:59 AM | 0 (0.0%) | 7 (1.7%) |
| 9:00 AM to 9:59 AM | 11 (2.6%) | 10 (2.5%) |
| 10:00 AM to 10:59 AM | 0 (0.0%) | 0 (0.0%) |
| 11:00 AM to 11:59 AM | 6 (1.4%) | 9 (2.2%) |
| 12:00 PM to 3:59 PM | 39 (9.4%) | 38 (9.5%) |
| 4:00 PM to 11:59 PM | 29 (7.0%) | 45 (11.2%) |
| Total | 416 (100.0%) | 402 (100.0%) |
Housing Occupancy in Emporium borough
Occupancy by Ownership in Emporium borough
Of the total 1,035 dwellings in Emporium borough, owner-occupied units account for 557 (53.8%), while renter-occupied units make up 478 (46.2%).
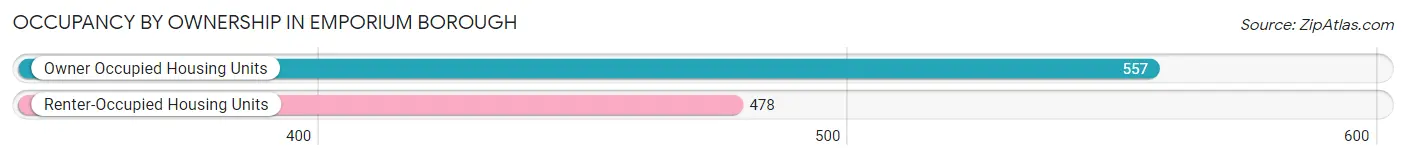
| Occupancy | # Housing Units | % Housing Units |
| Owner Occupied Housing Units | 557 | 53.8% |
| Renter-Occupied Housing Units | 478 | 46.2% |
| Total Occupied Housing Units | 1,035 | 100.0% |
Occupancy by Household Size in Emporium borough
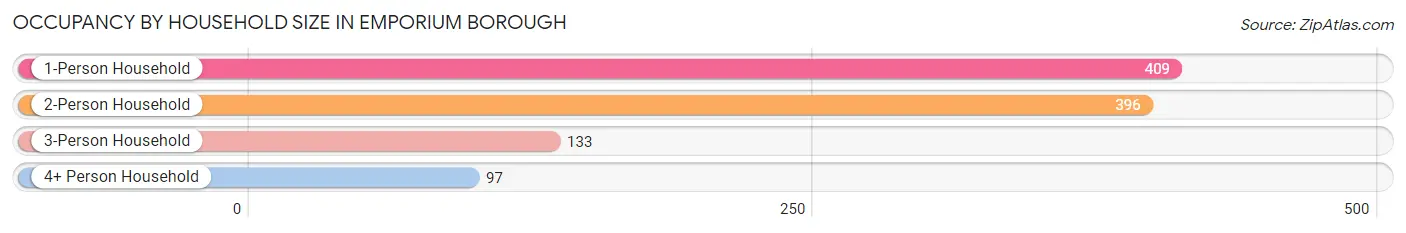
| Household Size | # Housing Units | % Housing Units |
| 1-Person Household | 409 | 39.5% |
| 2-Person Household | 396 | 38.3% |
| 3-Person Household | 133 | 12.9% |
| 4+ Person Household | 97 | 9.4% |
| Total Housing Units | 1,035 | 100.0% |
Occupancy by Ownership by Household Size in Emporium borough
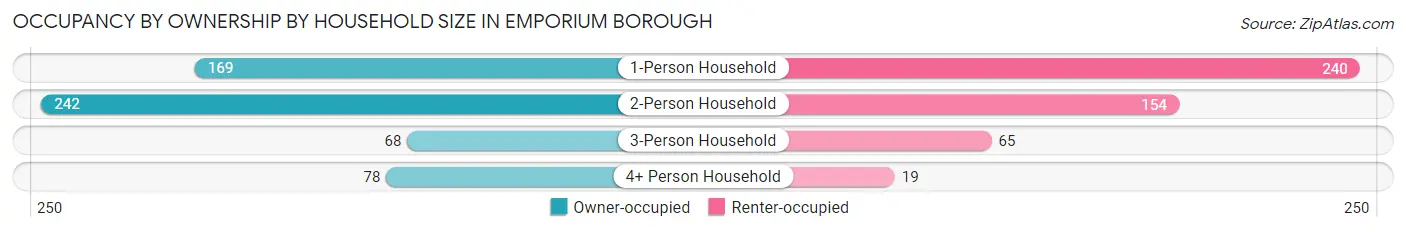
| Household Size | Owner-occupied | Renter-occupied |
| 1-Person Household | 169 (41.3%) | 240 (58.7%) |
| 2-Person Household | 242 (61.1%) | 154 (38.9%) |
| 3-Person Household | 68 (51.1%) | 65 (48.9%) |
| 4+ Person Household | 78 (80.4%) | 19 (19.6%) |
| Total Housing Units | 557 (53.8%) | 478 (46.2%) |
Occupancy by Educational Attainment in Emporium borough
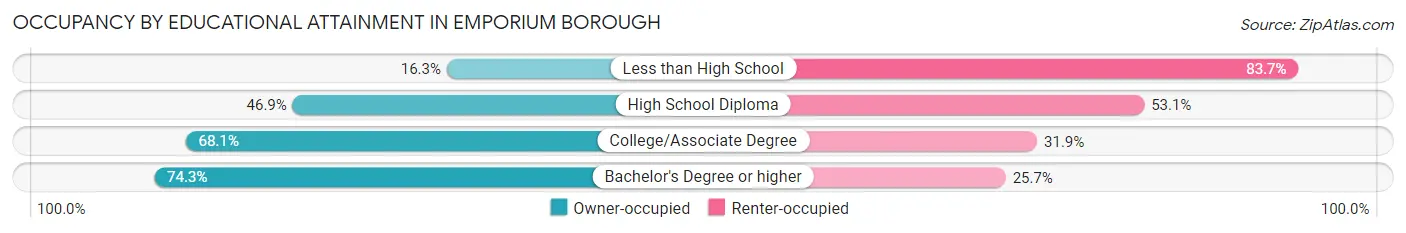
| Household Size | Owner-occupied | Renter-occupied |
| Less than High School | 15 (16.3%) | 77 (83.7%) |
| High School Diploma | 231 (46.9%) | 262 (53.1%) |
| College/Associate Degree | 256 (68.1%) | 120 (31.9%) |
| Bachelor's Degree or higher | 55 (74.3%) | 19 (25.7%) |
Occupancy by Age of Householder in Emporium borough
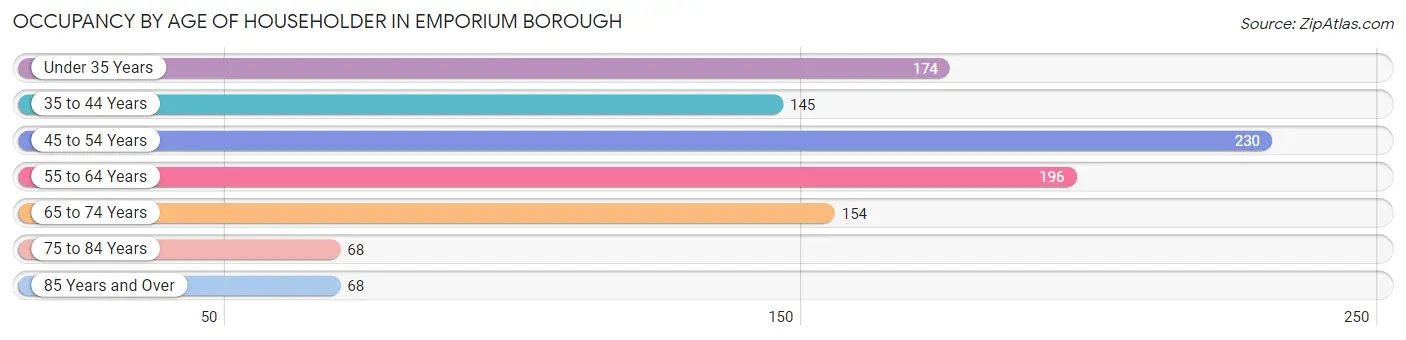
| Age Bracket | # Households | % Households |
| Under 35 Years | 174 | 16.8% |
| 35 to 44 Years | 145 | 14.0% |
| 45 to 54 Years | 230 | 22.2% |
| 55 to 64 Years | 196 | 18.9% |
| 65 to 74 Years | 154 | 14.9% |
| 75 to 84 Years | 68 | 6.6% |
| 85 Years and Over | 68 | 6.6% |
| Total | 1,035 | 100.0% |
Housing Finances in Emporium borough
Median Income by Occupancy in Emporium borough
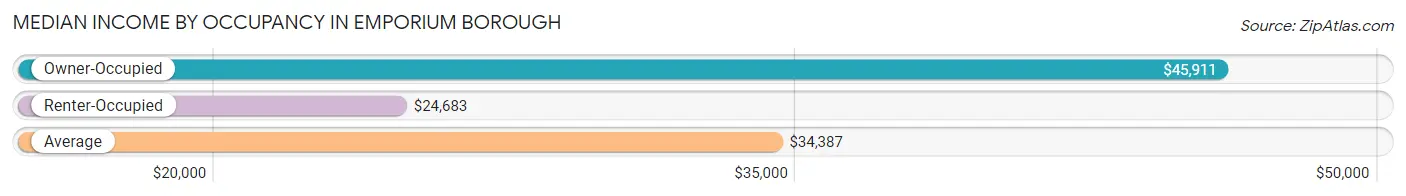
| Occupancy Type | # Households | Median Income |
| Owner-Occupied | 557 (53.8%) | $45,911 |
| Renter-Occupied | 478 (46.2%) | $24,683 |
| Average | 1,035 (100.0%) | $34,387 |
Occupancy by Householder Income Bracket in Emporium borough
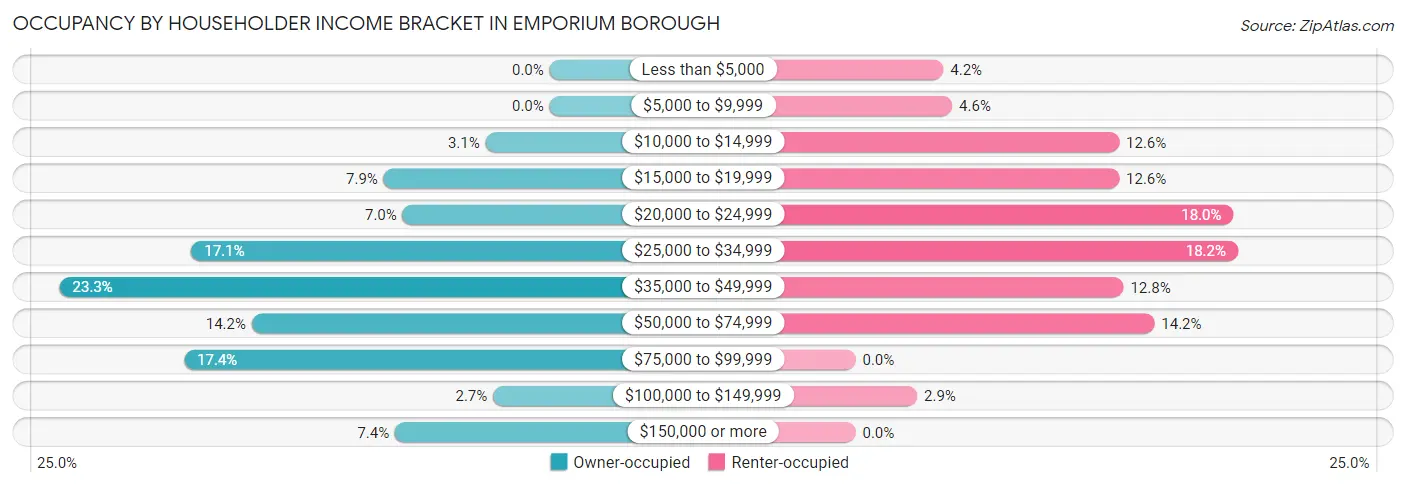
| Income Bracket | Owner-occupied | Renter-occupied |
| Less than $5,000 | 0 (0.0%) | 20 (4.2%) |
| $5,000 to $9,999 | 0 (0.0%) | 22 (4.6%) |
| $10,000 to $14,999 | 17 (3.0%) | 60 (12.6%) |
| $15,000 to $19,999 | 44 (7.9%) | 60 (12.6%) |
| $20,000 to $24,999 | 39 (7.0%) | 86 (18.0%) |
| $25,000 to $34,999 | 95 (17.1%) | 87 (18.2%) |
| $35,000 to $49,999 | 130 (23.3%) | 61 (12.8%) |
| $50,000 to $74,999 | 79 (14.2%) | 68 (14.2%) |
| $75,000 to $99,999 | 97 (17.4%) | 0 (0.0%) |
| $100,000 to $149,999 | 15 (2.7%) | 14 (2.9%) |
| $150,000 or more | 41 (7.4%) | 0 (0.0%) |
| Total | 557 (100.0%) | 478 (100.0%) |
Monthly Housing Cost Tiers in Emporium borough
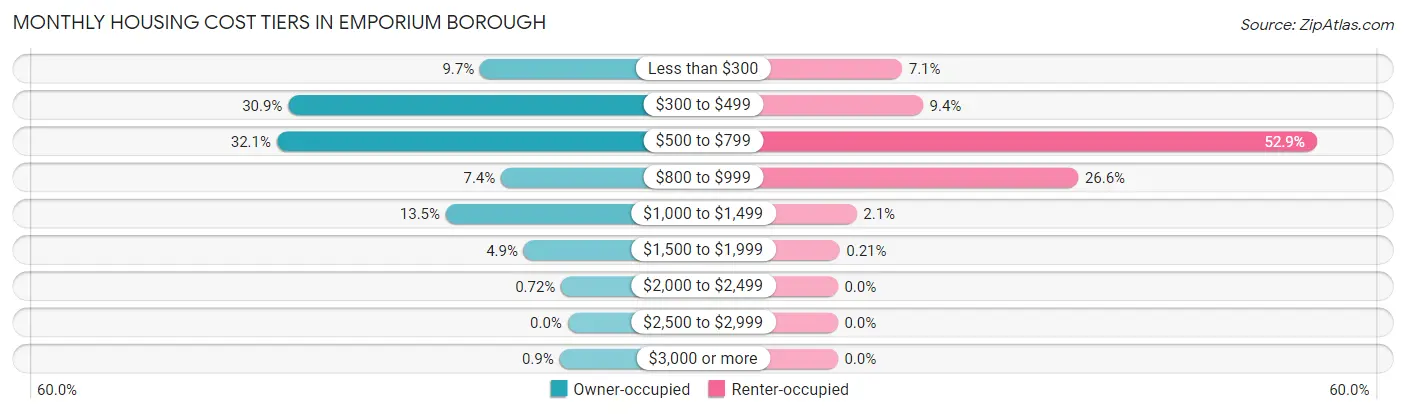
| Monthly Cost | Owner-occupied | Renter-occupied |
| Less than $300 | 54 (9.7%) | 34 (7.1%) |
| $300 to $499 | 172 (30.9%) | 45 (9.4%) |
| $500 to $799 | 179 (32.1%) | 253 (52.9%) |
| $800 to $999 | 41 (7.4%) | 127 (26.6%) |
| $1,000 to $1,499 | 75 (13.5%) | 10 (2.1%) |
| $1,500 to $1,999 | 27 (4.9%) | 1 (0.2%) |
| $2,000 to $2,499 | 4 (0.7%) | 0 (0.0%) |
| $2,500 to $2,999 | 0 (0.0%) | 0 (0.0%) |
| $3,000 or more | 5 (0.9%) | 0 (0.0%) |
| Total | 557 (100.0%) | 478 (100.0%) |
Physical Housing Characteristics in Emporium borough
Housing Structures in Emporium borough
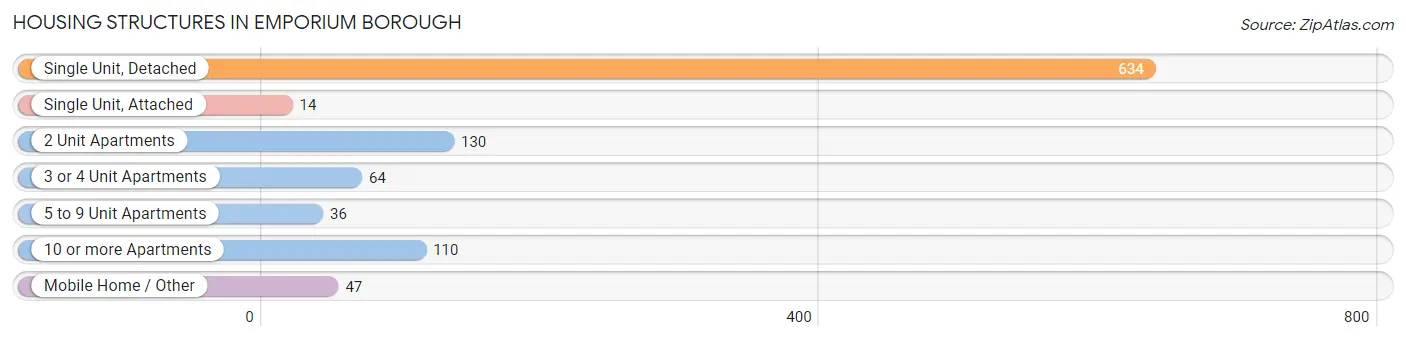
| Structure Type | # Housing Units | % Housing Units |
| Single Unit, Detached | 634 | 61.3% |
| Single Unit, Attached | 14 | 1.3% |
| 2 Unit Apartments | 130 | 12.6% |
| 3 or 4 Unit Apartments | 64 | 6.2% |
| 5 to 9 Unit Apartments | 36 | 3.5% |
| 10 or more Apartments | 110 | 10.6% |
| Mobile Home / Other | 47 | 4.5% |
| Total | 1,035 | 100.0% |
Housing Structures by Occupancy in Emporium borough
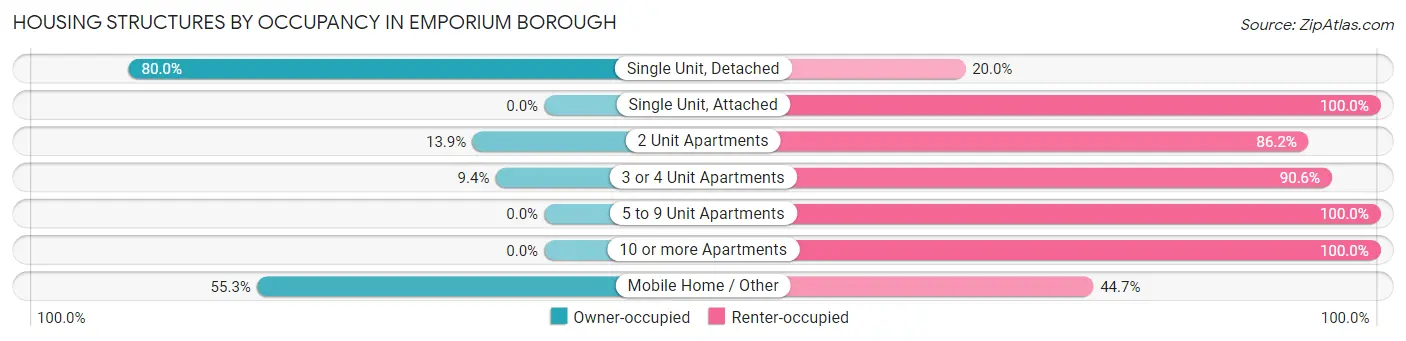
| Structure Type | Owner-occupied | Renter-occupied |
| Single Unit, Detached | 507 (80.0%) | 127 (20.0%) |
| Single Unit, Attached | 0 (0.0%) | 14 (100.0%) |
| 2 Unit Apartments | 18 (13.9%) | 112 (86.2%) |
| 3 or 4 Unit Apartments | 6 (9.4%) | 58 (90.6%) |
| 5 to 9 Unit Apartments | 0 (0.0%) | 36 (100.0%) |
| 10 or more Apartments | 0 (0.0%) | 110 (100.0%) |
| Mobile Home / Other | 26 (55.3%) | 21 (44.7%) |
| Total | 557 (53.8%) | 478 (46.2%) |
Housing Structures by Number of Rooms in Emporium borough
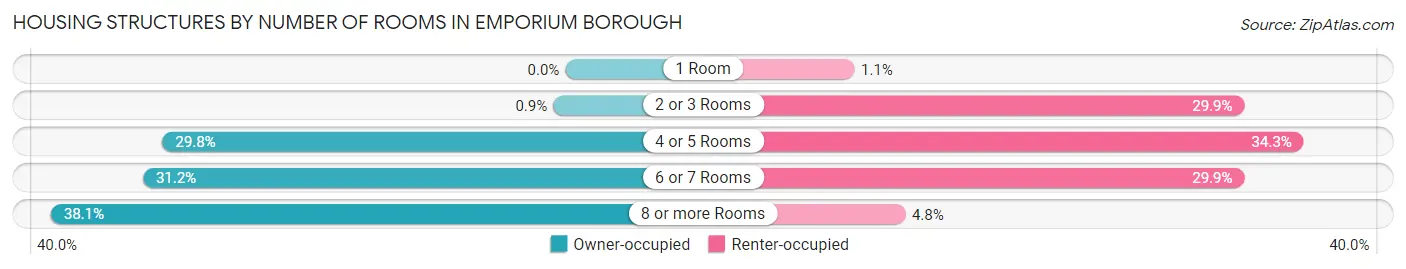
| Number of Rooms | Owner-occupied | Renter-occupied |
| 1 Room | 0 (0.0%) | 5 (1.1%) |
| 2 or 3 Rooms | 5 (0.9%) | 143 (29.9%) |
| 4 or 5 Rooms | 166 (29.8%) | 164 (34.3%) |
| 6 or 7 Rooms | 174 (31.2%) | 143 (29.9%) |
| 8 or more Rooms | 212 (38.1%) | 23 (4.8%) |
| Total | 557 (100.0%) | 478 (100.0%) |
Housing Structure by Heating Type in Emporium borough
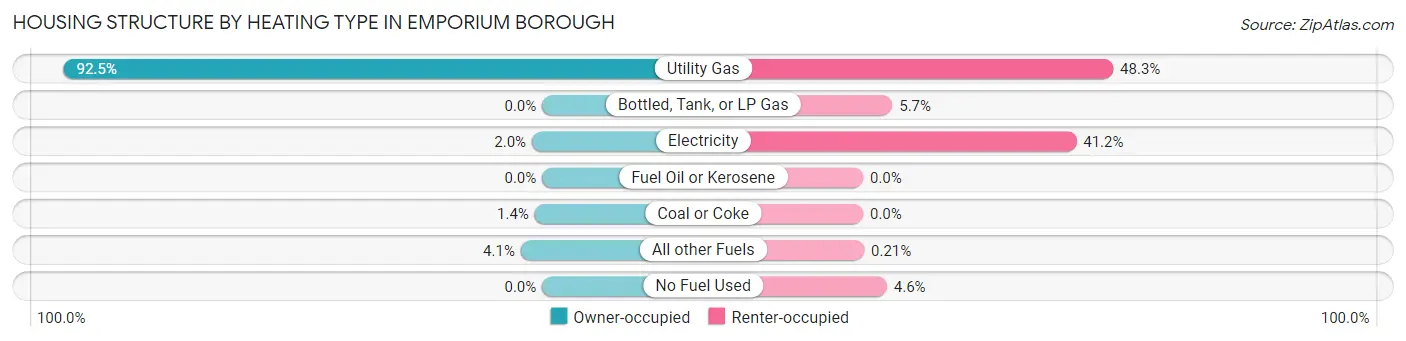
| Heating Type | Owner-occupied | Renter-occupied |
| Utility Gas | 515 (92.5%) | 231 (48.3%) |
| Bottled, Tank, or LP Gas | 0 (0.0%) | 27 (5.7%) |
| Electricity | 11 (2.0%) | 197 (41.2%) |
| Fuel Oil or Kerosene | 0 (0.0%) | 0 (0.0%) |
| Coal or Coke | 8 (1.4%) | 0 (0.0%) |
| All other Fuels | 23 (4.1%) | 1 (0.2%) |
| No Fuel Used | 0 (0.0%) | 22 (4.6%) |
| Total | 557 (100.0%) | 478 (100.0%) |
Household Vehicle Usage in Emporium borough
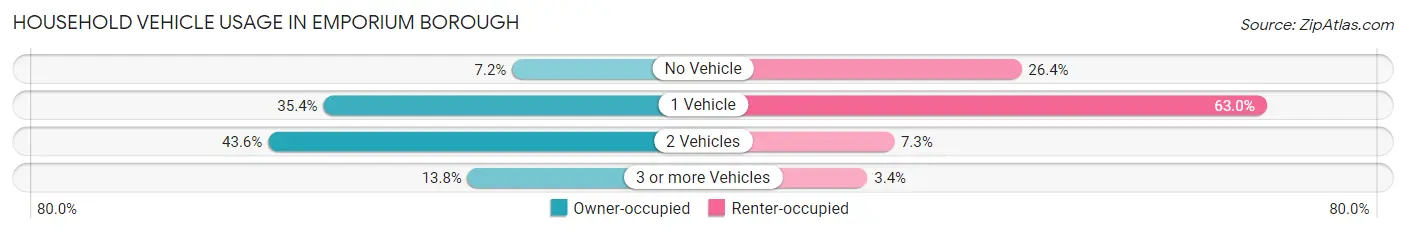
| Vehicles per Household | Owner-occupied | Renter-occupied |
| No Vehicle | 40 (7.2%) | 126 (26.4%) |
| 1 Vehicle | 197 (35.4%) | 301 (63.0%) |
| 2 Vehicles | 243 (43.6%) | 35 (7.3%) |
| 3 or more Vehicles | 77 (13.8%) | 16 (3.4%) |
| Total | 557 (100.0%) | 478 (100.0%) |
Real Estate & Mortgages in Emporium borough
Real Estate and Mortgage Overview in Emporium borough
| Characteristic | Without Mortgage | With Mortgage |
| Housing Units | 303 | 254 |
| Median Property Value | $71,500 | $69,700 |
| Median Household Income | $39,917 | $25 |
| Monthly Housing Costs | $446 | $5 |
| Real Estate Taxes | $1,238 | $6 |
Property Value by Mortgage Status in Emporium borough
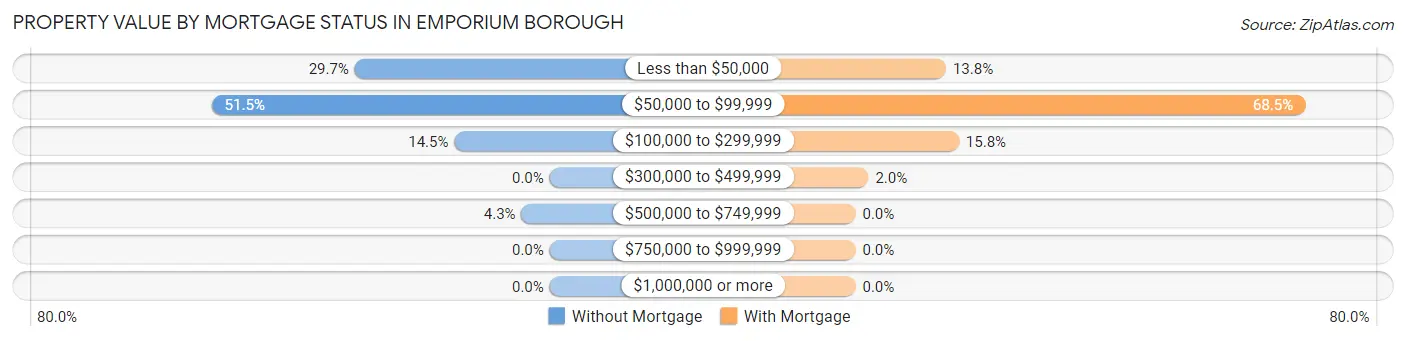
| Property Value | Without Mortgage | With Mortgage |
| Less than $50,000 | 90 (29.7%) | 35 (13.8%) |
| $50,000 to $99,999 | 156 (51.5%) | 174 (68.5%) |
| $100,000 to $299,999 | 44 (14.5%) | 40 (15.8%) |
| $300,000 to $499,999 | 0 (0.0%) | 5 (2.0%) |
| $500,000 to $749,999 | 13 (4.3%) | 0 (0.0%) |
| $750,000 to $999,999 | 0 (0.0%) | 0 (0.0%) |
| $1,000,000 or more | 0 (0.0%) | 0 (0.0%) |
| Total | 303 (100.0%) | 254 (100.0%) |
Household Income by Mortgage Status in Emporium borough
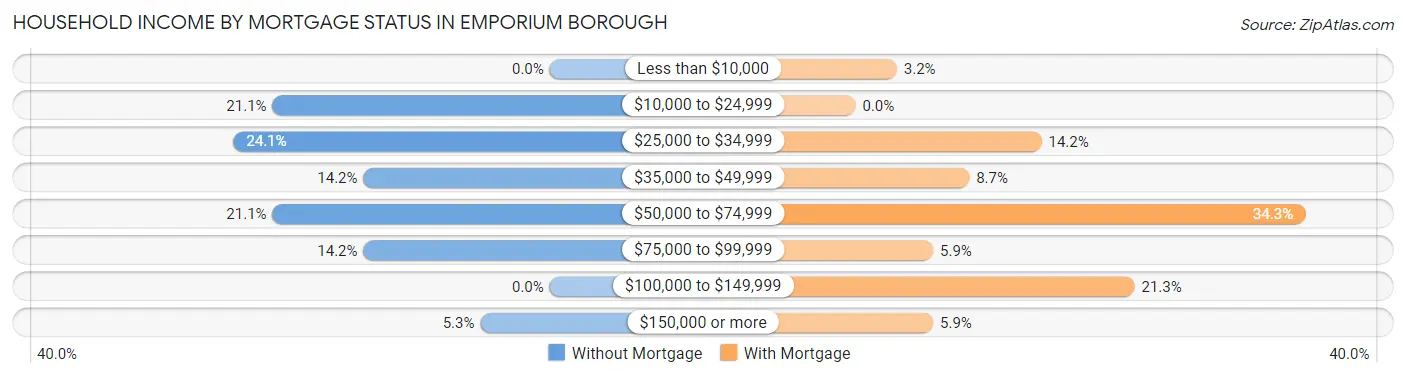
| Household Income | Without Mortgage | With Mortgage |
| Less than $10,000 | 0 (0.0%) | 8 (3.2%) |
| $10,000 to $24,999 | 64 (21.1%) | 0 (0.0%) |
| $25,000 to $34,999 | 73 (24.1%) | 36 (14.2%) |
| $35,000 to $49,999 | 43 (14.2%) | 22 (8.7%) |
| $50,000 to $74,999 | 64 (21.1%) | 87 (34.3%) |
| $75,000 to $99,999 | 43 (14.2%) | 15 (5.9%) |
| $100,000 to $149,999 | 0 (0.0%) | 54 (21.3%) |
| $150,000 or more | 16 (5.3%) | 15 (5.9%) |
| Total | 303 (100.0%) | 254 (100.0%) |
Property Value to Household Income Ratio in Emporium borough
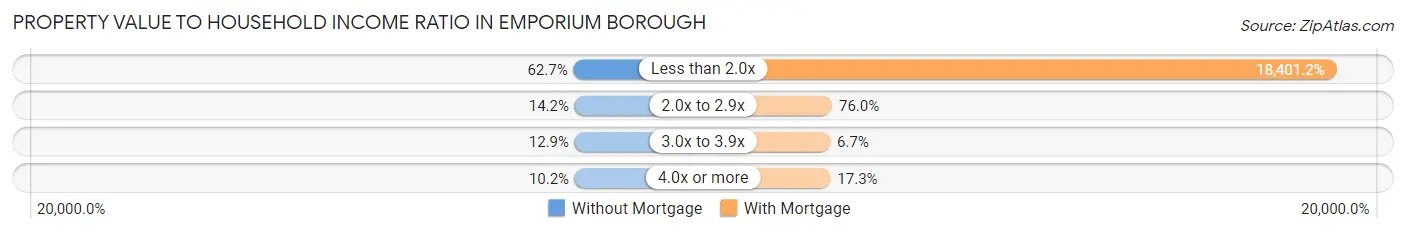
| Value-to-Income Ratio | Without Mortgage | With Mortgage |
| Less than 2.0x | 190 (62.7%) | 46,739 (18,401.2%) |
| 2.0x to 2.9x | 43 (14.2%) | 193 (76.0%) |
| 3.0x to 3.9x | 39 (12.9%) | 17 (6.7%) |
| 4.0x or more | 31 (10.2%) | 44 (17.3%) |
| Total | 303 (100.0%) | 254 (100.0%) |
Real Estate Taxes by Mortgage Status in Emporium borough
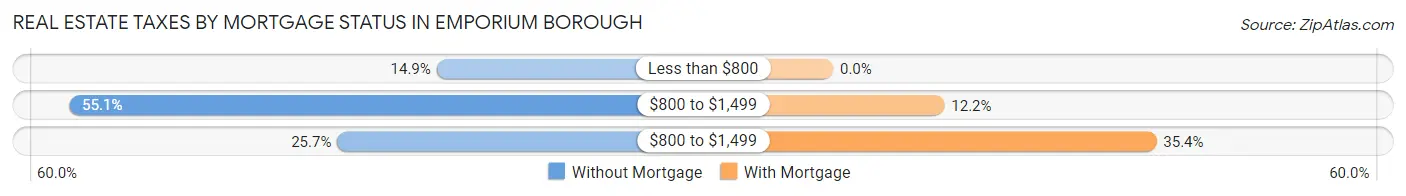
| Property Taxes | Without Mortgage | With Mortgage |
| Less than $800 | 45 (14.8%) | 0 (0.0%) |
| $800 to $1,499 | 167 (55.1%) | 31 (12.2%) |
| $800 to $1,499 | 78 (25.7%) | 90 (35.4%) |
| Total | 303 (100.0%) | 254 (100.0%) |
Health & Disability in Emporium borough
Health Insurance Coverage by Age in Emporium borough
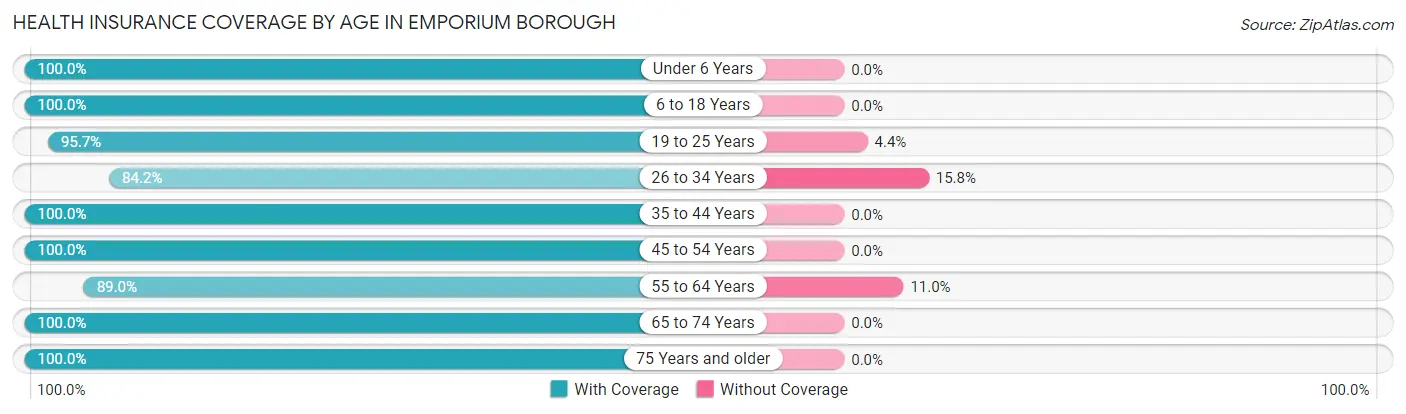
| Age Bracket | With Coverage | Without Coverage |
| Under 6 Years | 111 (100.0%) | 0 (0.0%) |
| 6 to 18 Years | 264 (100.0%) | 0 (0.0%) |
| 19 to 25 Years | 132 (95.7%) | 6 (4.3%) |
| 26 to 34 Years | 171 (84.2%) | 32 (15.8%) |
| 35 to 44 Years | 233 (100.0%) | 0 (0.0%) |
| 45 to 54 Years | 308 (100.0%) | 0 (0.0%) |
| 55 to 64 Years | 258 (89.0%) | 32 (11.0%) |
| 65 to 74 Years | 215 (100.0%) | 0 (0.0%) |
| 75 Years and older | 191 (100.0%) | 0 (0.0%) |
| Total | 1,883 (96.4%) | 70 (3.6%) |
Health Insurance Coverage by Citizenship Status in Emporium borough
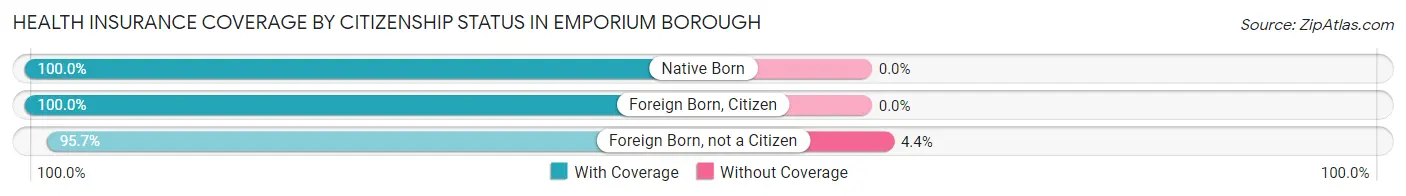
| Citizenship Status | With Coverage | Without Coverage |
| Native Born | 111 (100.0%) | 0 (0.0%) |
| Foreign Born, Citizen | 264 (100.0%) | 0 (0.0%) |
| Foreign Born, not a Citizen | 132 (95.7%) | 6 (4.3%) |
Health Insurance Coverage by Household Income in Emporium borough
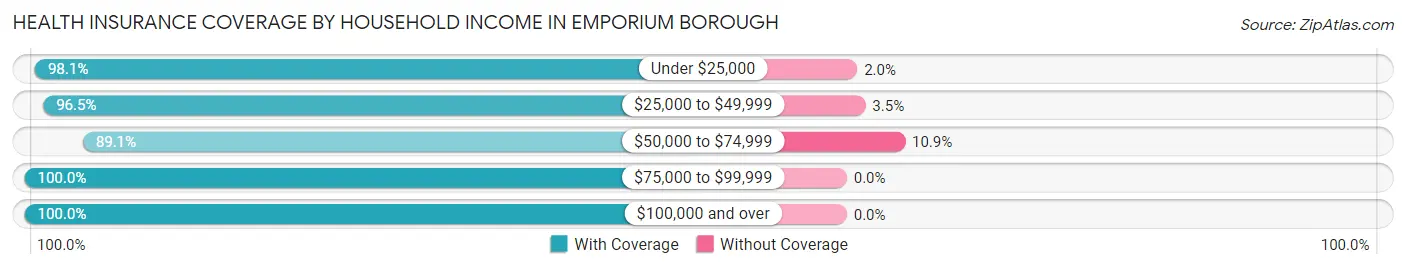
| Household Income | With Coverage | Without Coverage |
| Under $25,000 | 503 (98.1%) | 10 (1.9%) |
| $25,000 to $49,999 | 664 (96.5%) | 24 (3.5%) |
| $50,000 to $74,999 | 294 (89.1%) | 36 (10.9%) |
| $75,000 to $99,999 | 254 (100.0%) | 0 (0.0%) |
| $100,000 and over | 147 (100.0%) | 0 (0.0%) |
Public vs Private Health Insurance Coverage by Age in Emporium borough
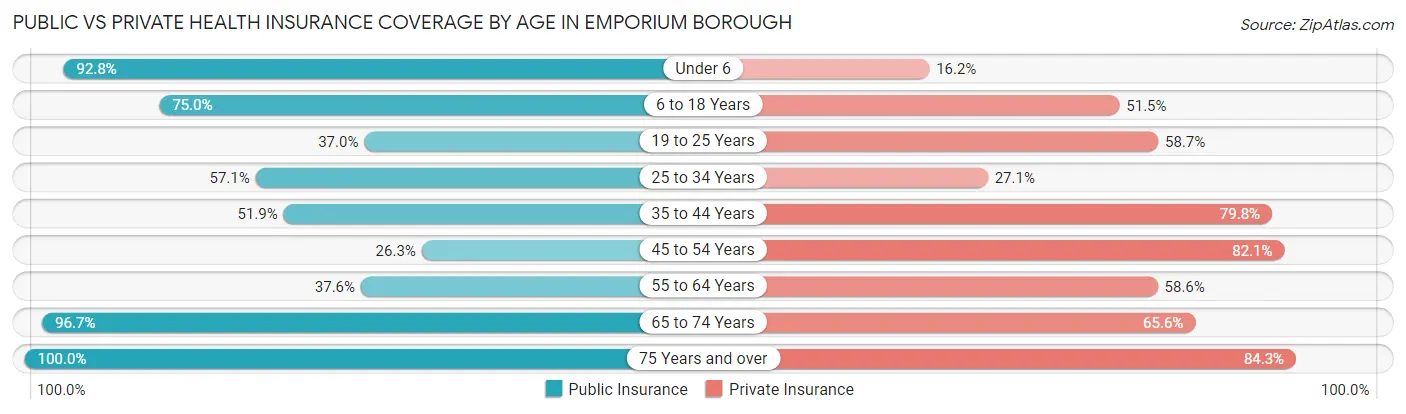
| Age Bracket | Public Insurance | Private Insurance |
| Under 6 | 103 (92.8%) | 18 (16.2%) |
| 6 to 18 Years | 198 (75.0%) | 136 (51.5%) |
| 19 to 25 Years | 51 (37.0%) | 81 (58.7%) |
| 25 to 34 Years | 116 (57.1%) | 55 (27.1%) |
| 35 to 44 Years | 121 (51.9%) | 186 (79.8%) |
| 45 to 54 Years | 81 (26.3%) | 253 (82.1%) |
| 55 to 64 Years | 109 (37.6%) | 170 (58.6%) |
| 65 to 74 Years | 208 (96.7%) | 141 (65.6%) |
| 75 Years and over | 191 (100.0%) | 161 (84.3%) |
| Total | 1,178 (60.3%) | 1,201 (61.5%) |
Disability Status by Sex by Age in Emporium borough
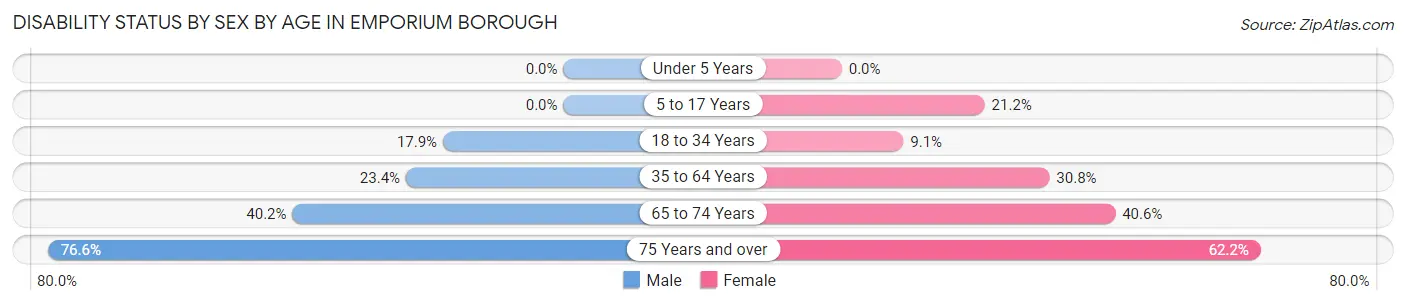
| Age Bracket | Male | Female |
| Under 5 Years | 0 (0.0%) | 0 (0.0%) |
| 5 to 17 Years | 0 (0.0%) | 28 (21.2%) |
| 18 to 34 Years | 32 (17.9%) | 18 (9.1%) |
| 35 to 64 Years | 101 (23.4%) | 123 (30.8%) |
| 65 to 74 Years | 33 (40.2%) | 54 (40.6%) |
| 75 Years and over | 49 (76.6%) | 79 (62.2%) |
Disability Class by Sex by Age in Emporium borough
Disability Class: Hearing Difficulty
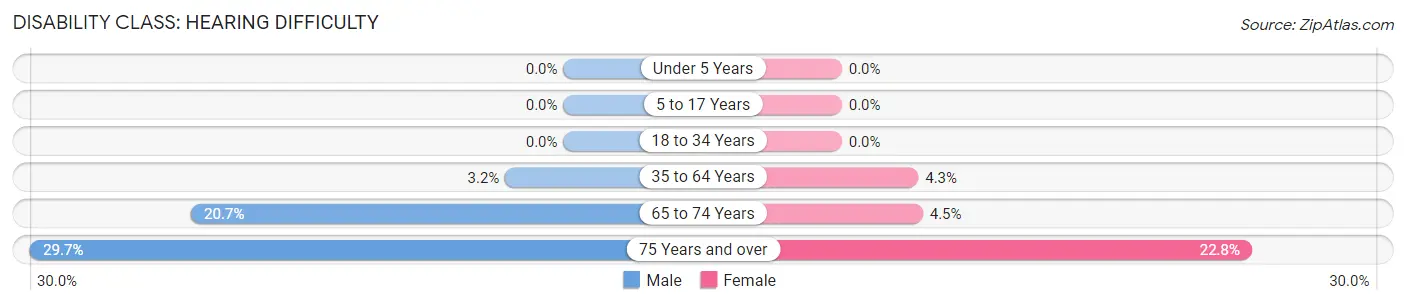
| Age Bracket | Male | Female |
| Under 5 Years | 0 (0.0%) | 0 (0.0%) |
| 5 to 17 Years | 0 (0.0%) | 0 (0.0%) |
| 18 to 34 Years | 0 (0.0%) | 0 (0.0%) |
| 35 to 64 Years | 14 (3.2%) | 17 (4.3%) |
| 65 to 74 Years | 17 (20.7%) | 6 (4.5%) |
| 75 Years and over | 19 (29.7%) | 29 (22.8%) |
Disability Class: Vision Difficulty
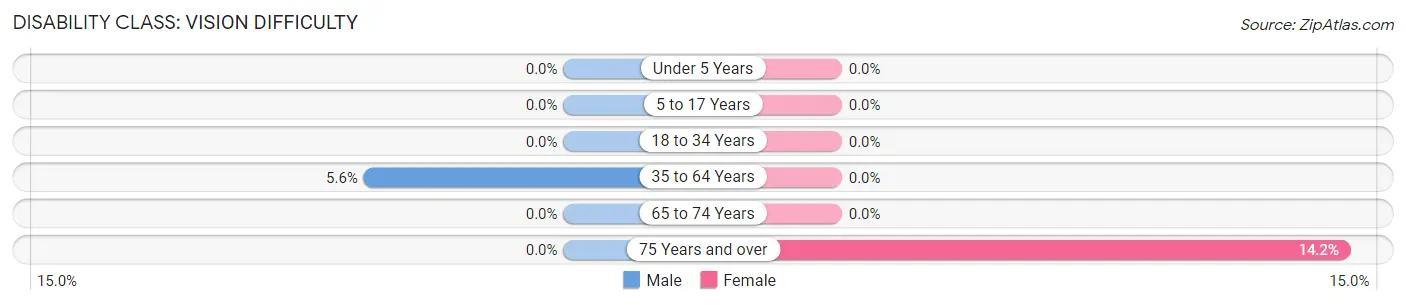
| Age Bracket | Male | Female |
| Under 5 Years | 0 (0.0%) | 0 (0.0%) |
| 5 to 17 Years | 0 (0.0%) | 0 (0.0%) |
| 18 to 34 Years | 0 (0.0%) | 0 (0.0%) |
| 35 to 64 Years | 24 (5.6%) | 0 (0.0%) |
| 65 to 74 Years | 0 (0.0%) | 0 (0.0%) |
| 75 Years and over | 0 (0.0%) | 18 (14.2%) |
Disability Class: Cognitive Difficulty
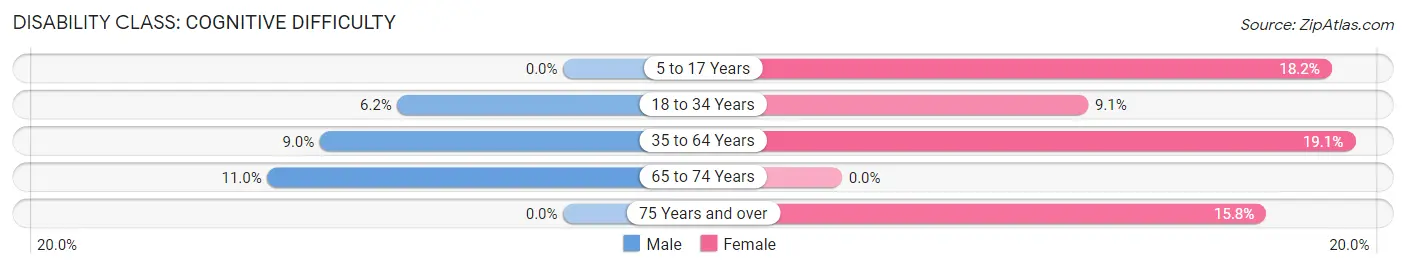
| Age Bracket | Male | Female |
| 5 to 17 Years | 0 (0.0%) | 24 (18.2%) |
| 18 to 34 Years | 11 (6.1%) | 18 (9.1%) |
| 35 to 64 Years | 39 (9.0%) | 76 (19.1%) |
| 65 to 74 Years | 9 (11.0%) | 0 (0.0%) |
| 75 Years and over | 0 (0.0%) | 20 (15.8%) |
Disability Class: Ambulatory Difficulty
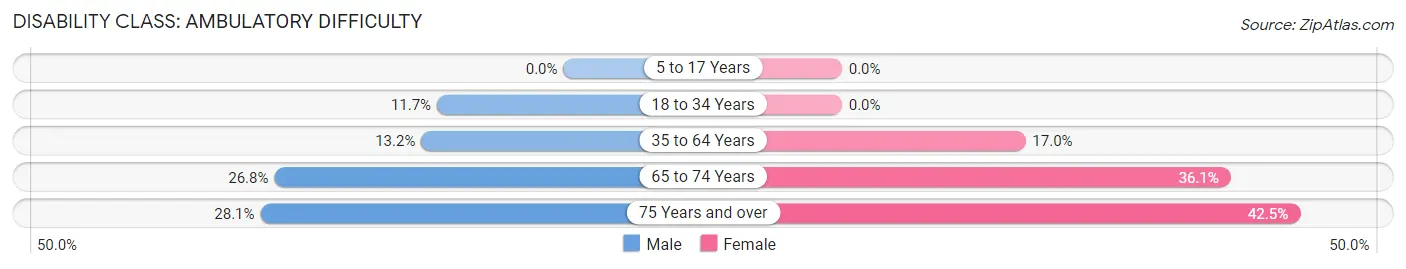
| Age Bracket | Male | Female |
| 5 to 17 Years | 0 (0.0%) | 0 (0.0%) |
| 18 to 34 Years | 21 (11.7%) | 0 (0.0%) |
| 35 to 64 Years | 57 (13.2%) | 68 (17.0%) |
| 65 to 74 Years | 22 (26.8%) | 48 (36.1%) |
| 75 Years and over | 18 (28.1%) | 54 (42.5%) |
Disability Class: Self-Care Difficulty
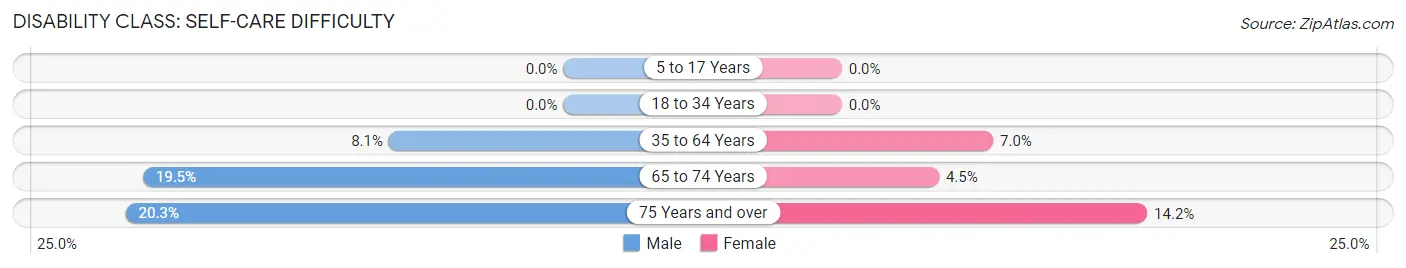
| Age Bracket | Male | Female |
| 5 to 17 Years | 0 (0.0%) | 0 (0.0%) |
| 18 to 34 Years | 0 (0.0%) | 0 (0.0%) |
| 35 to 64 Years | 35 (8.1%) | 28 (7.0%) |
| 65 to 74 Years | 16 (19.5%) | 6 (4.5%) |
| 75 Years and over | 13 (20.3%) | 18 (14.2%) |
Technology Access in Emporium borough
Computing Device Access in Emporium borough
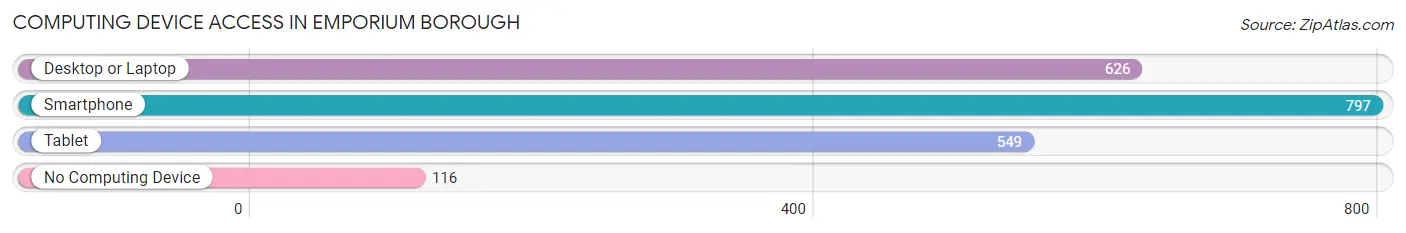
| Device Type | # Households | % Households |
| Desktop or Laptop | 626 | 60.5% |
| Smartphone | 797 | 77.0% |
| Tablet | 549 | 53.0% |
| No Computing Device | 116 | 11.2% |
| Total | 1,035 | 100.0% |
Internet Access in Emporium borough
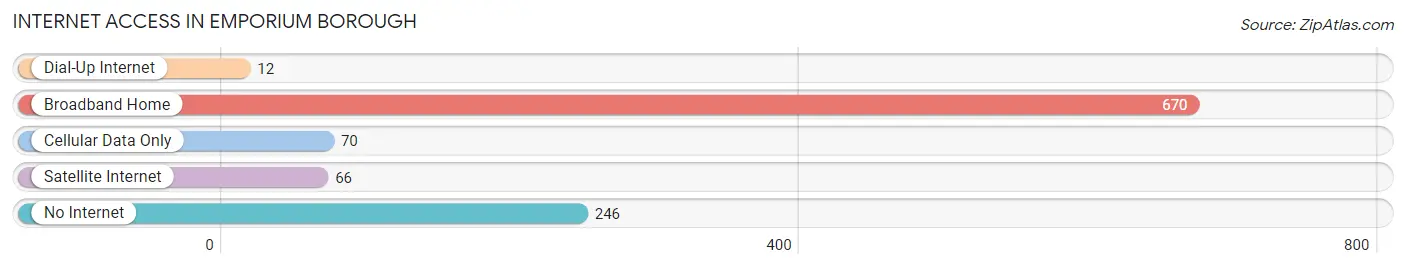
| Internet Type | # Households | % Households |
| Dial-Up Internet | 12 | 1.2% |
| Broadband Home | 670 | 64.7% |
| Cellular Data Only | 70 | 6.8% |
| Satellite Internet | 66 | 6.4% |
| No Internet | 246 | 23.8% |
| Total | 1,035 | 100.0% |
Emporium borough Summary
Emporium Borough is a small borough located in Cameron County, Pennsylvania. It is situated in the north-central part of the state, approximately two hours from Pittsburgh and three hours from Philadelphia. The borough is home to a population of approximately 1,500 people, and is the county seat of Cameron County.
History
The area that is now Emporium Borough was first settled in the late 1700s by a group of settlers from Connecticut. The settlers named the area “Emporium” after the Greek word for “marketplace”, as they believed the area would become a bustling trading center. The area was officially incorporated as a borough in 1876.
In the late 1800s, the borough experienced a period of rapid growth and development. The railroad arrived in 1883, connecting Emporium to the rest of the state and providing a major boost to the local economy. The railroad also brought an influx of new residents to the area, and the population of the borough grew from just over 500 in 1880 to nearly 1,500 by 1900.
The early 1900s saw the development of several industries in the borough, including lumber, coal, and oil. These industries provided employment for many of the borough’s residents, and helped to further fuel the area’s growth.
In the mid-1900s, the borough experienced a period of decline. The lumber and coal industries began to decline, and the population of the borough began to decrease. However, the borough has experienced a resurgence in recent years, and the population has begun to grow again.
Geography
Emporium Borough is located in the north-central part of Pennsylvania, approximately two hours from Pittsburgh and three hours from Philadelphia. The borough is situated in the Allegheny Mountains, and is surrounded by forests and rolling hills. The borough is located on the banks of the West Branch of the Susquehanna River, and is home to several small lakes and streams.
The borough covers an area of approximately 1.2 square miles, and is home to a population of approximately 1,500 people. The borough is served by two major highways, US Route 6 and PA Route 120.
Economy
The economy of Emporium Borough is largely based on tourism and retail. The borough is home to several small businesses, including restaurants, shops, and galleries. The borough is also home to several tourist attractions, including the Cameron County Historical Society Museum and the Emporium Railroad Museum.
The borough is also home to several manufacturing companies, including a paper mill and a furniture factory. These companies provide employment for many of the borough’s residents.
Demographics
As of the 2010 census, the population of Emporium Borough was 1,521. The racial makeup of the borough was 97.3% White, 0.7% African American, 0.2% Native American, 0.3% Asian, 0.1% from other races, and 1.4% from two or more races. Hispanic or Latino of any race were 0.7% of the population.
The median household income in the borough was $31,250, and the median family income was $37,500. The per capita income for the borough was $17,845. Approximately 17.2% of the population was below the poverty line.
Common Questions
What is Per Capita Income in Emporium borough?
Per Capita income in Emporium borough is $24,591.
What is the Median Family Income in Emporium borough?
Median Family Income in Emporium borough is $42,469.
What is the Median Household income in Emporium borough?
Median Household Income in Emporium borough is $34,387.
What is Income or Wage Gap in Emporium borough?
Income or Wage Gap in Emporium borough is 24.7%.
Women in Emporium borough earn 75.3 cents for every dollar earned by a man.
What is Inequality or Gini Index in Emporium borough?
Inequality or Gini Index in Emporium borough is 0.42.
What is the Total Population of Emporium borough?
Total Population of Emporium borough is 1,988.
What is the Total Male Population of Emporium borough?
Total Male Population of Emporium borough is 921.
What is the Total Female Population of Emporium borough?
Total Female Population of Emporium borough is 1,067.
What is the Ratio of Males per 100 Females in Emporium borough?
There are 86.32 Males per 100 Females in Emporium borough.
What is the Ratio of Females per 100 Males in Emporium borough?
There are 115.85 Females per 100 Males in Emporium borough.
What is the Median Population Age in Emporium borough?
Median Population Age in Emporium borough is 46.9 Years.
What is the Average Family Size in Emporium borough
Average Family Size in Emporium borough is 2.3 People.
What is the Average Household Size in Emporium borough
Average Household Size in Emporium borough is 1.9 People.
How Large is the Labor Force in Emporium borough?
There are 915 People in the Labor Forcein in Emporium borough.
What is the Percentage of People in the Labor Force in Emporium borough?
54.5% of People are in the Labor Force in Emporium borough.
What is the Unemployment Rate in Emporium borough?
Unemployment Rate in Emporium borough is 10.1%.