Ellwood City borough, PA Map & Demographics
Ellwood City borough Overview
$33,696
PER CAPITA INCOME
$73,636
AVG FAMILY INCOME
$57,325
AVG HOUSEHOLD INCOME
27.0%
WAGE / INCOME GAP [ % ]
73.0¢/ $1
WAGE / INCOME GAP [ $ ]
0.38
INEQUALITY / GINI INDEX
7,684
TOTAL POPULATION
3,810
MALE POPULATION
3,874
FEMALE POPULATION
98.35
MALES / 100 FEMALES
101.68
FEMALES / 100 MALES
45.4
MEDIAN AGE
2.6
AVG FAMILY SIZE
2.0
AVG HOUSEHOLD SIZE
4,503
LABOR FORCE [ PEOPLE ]
69.4%
PERCENT IN LABOR FORCE
5.3%
UNEMPLOYMENT RATE
Income in Ellwood City borough
Income Overview in Ellwood City borough
Per Capita Income in Ellwood City borough is $33,696, while median incomes of families and households are $73,636 and $57,325 respectively.
| Characteristic | Number | Measure |
| Per Capita Income | 7,684 | $33,696 |
| Median Family Income | 2,220 | $73,636 |
| Mean Family Income | 2,220 | $80,023 |
| Median Household Income | 3,749 | $57,325 |
| Mean Household Income | 3,749 | $68,329 |
| Income Deficit | 2,220 | $0 |
| Wage / Income Gap (%) | 7,684 | 27.04% |
| Wage / Income Gap ($) | 7,684 | 72.96¢ per $1 |
| Gini / Inequality Index | 7,684 | 0.38 |
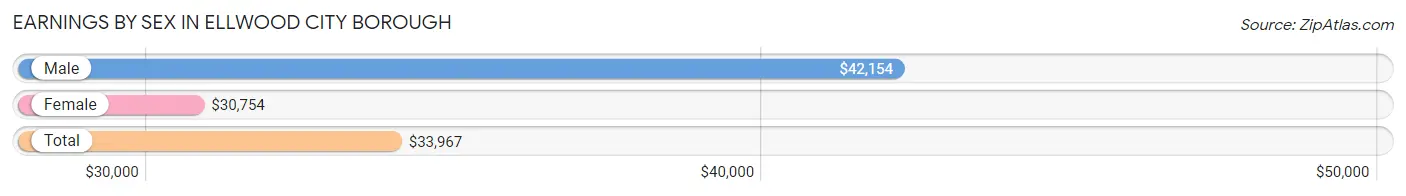
Earnings by Sex in Ellwood City borough
Average Earnings in Ellwood City borough are $33,967, $42,154 for men and $30,754 for women, a difference of 27.0%.
| Sex | Number | Average Earnings |
| Male | 2,455 (53.5%) | $42,154 |
| Female | 2,137 (46.5%) | $30,754 |
| Total | 4,592 (100.0%) | $33,967 |
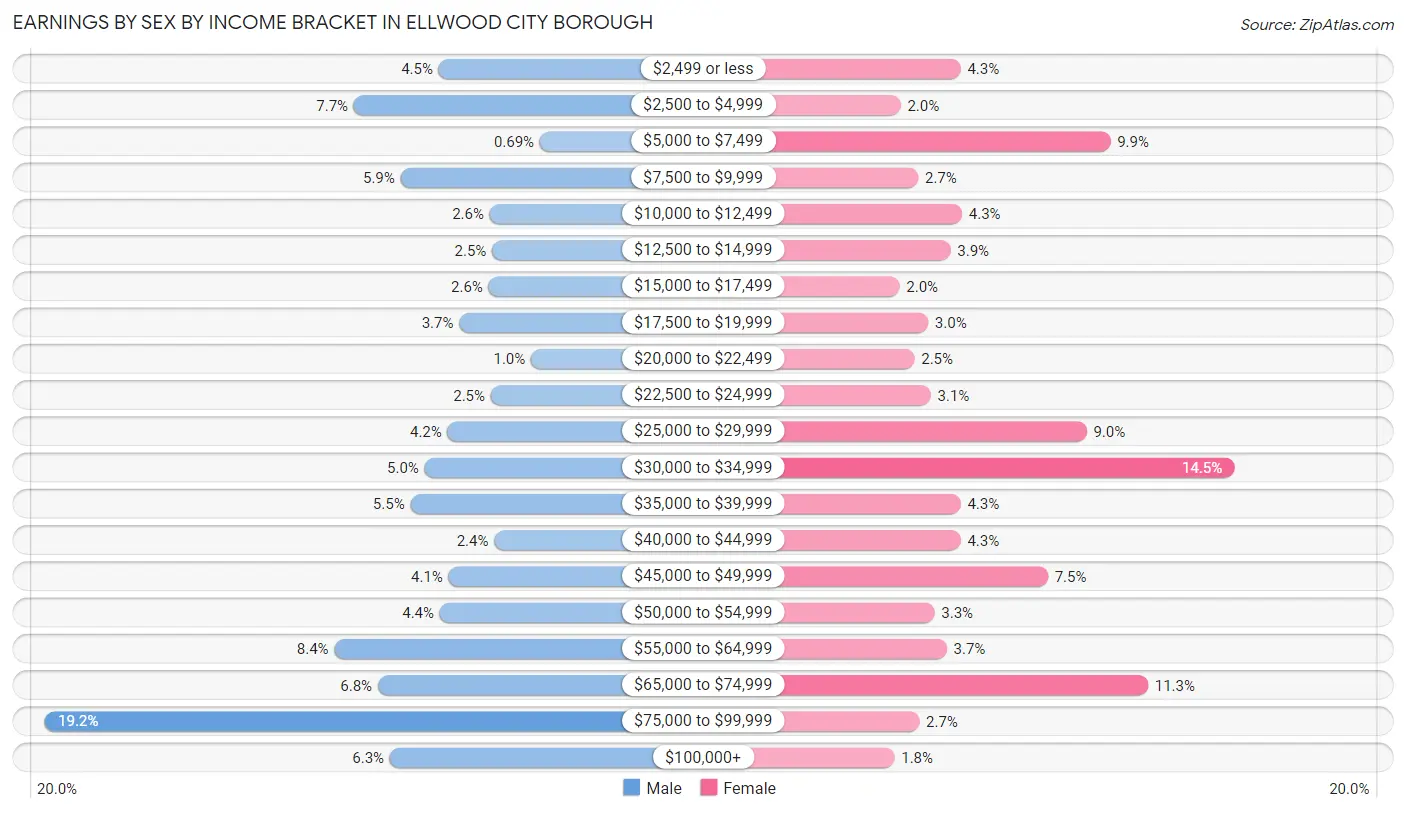
Earnings by Sex by Income Bracket in Ellwood City borough
The most common earnings brackets in Ellwood City borough are $75,000 to $99,999 for men (472 | 19.2%) and $30,000 to $34,999 for women (310 | 14.5%).
| Income | Male | Female |
| $2,499 or less | 110 (4.5%) | 91 (4.3%) |
| $2,500 to $4,999 | 188 (7.7%) | 43 (2.0%) |
| $5,000 to $7,499 | 17 (0.7%) | 211 (9.9%) |
| $7,500 to $9,999 | 145 (5.9%) | 57 (2.7%) |
| $10,000 to $12,499 | 63 (2.6%) | 92 (4.3%) |
| $12,500 to $14,999 | 61 (2.5%) | 83 (3.9%) |
| $15,000 to $17,499 | 64 (2.6%) | 42 (2.0%) |
| $17,500 to $19,999 | 91 (3.7%) | 65 (3.0%) |
| $20,000 to $22,499 | 25 (1.0%) | 54 (2.5%) |
| $22,500 to $24,999 | 62 (2.5%) | 67 (3.1%) |
| $25,000 to $29,999 | 102 (4.2%) | 192 (9.0%) |
| $30,000 to $34,999 | 123 (5.0%) | 310 (14.5%) |
| $35,000 to $39,999 | 136 (5.5%) | 91 (4.3%) |
| $40,000 to $44,999 | 59 (2.4%) | 91 (4.3%) |
| $45,000 to $49,999 | 101 (4.1%) | 161 (7.5%) |
| $50,000 to $54,999 | 109 (4.4%) | 70 (3.3%) |
| $55,000 to $64,999 | 206 (8.4%) | 80 (3.7%) |
| $65,000 to $74,999 | 166 (6.8%) | 241 (11.3%) |
| $75,000 to $99,999 | 472 (19.2%) | 58 (2.7%) |
| $100,000+ | 155 (6.3%) | 38 (1.8%) |
| Total | 2,455 (100.0%) | 2,137 (100.0%) |
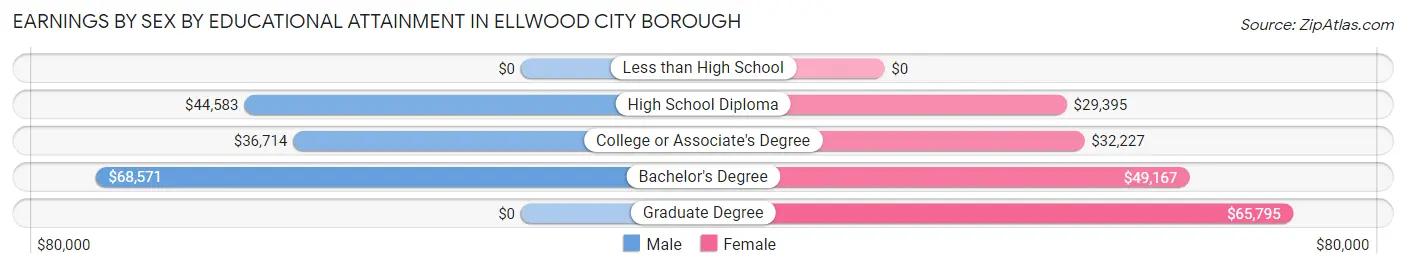
Earnings by Sex by Educational Attainment in Ellwood City borough
Average earnings in Ellwood City borough are $50,721 for men and $31,814 for women, a difference of 37.3%. Men with an educational attainment of bachelor's degree enjoy the highest average annual earnings of $68,571, while those with college or associate's degree education earn the least with $36,714. Women with an educational attainment of graduate degree earn the most with the average annual earnings of $65,795, while those with high school diploma education have the smallest earnings of $29,395.
| Educational Attainment | Male Income | Female Income |
| Less than High School | - | - |
| High School Diploma | $44,583 | $29,395 |
| College or Associate's Degree | $36,714 | $32,227 |
| Bachelor's Degree | $68,571 | $49,167 |
| Graduate Degree | - | - |
| Total | $50,721 | $31,814 |
Family Income in Ellwood City borough
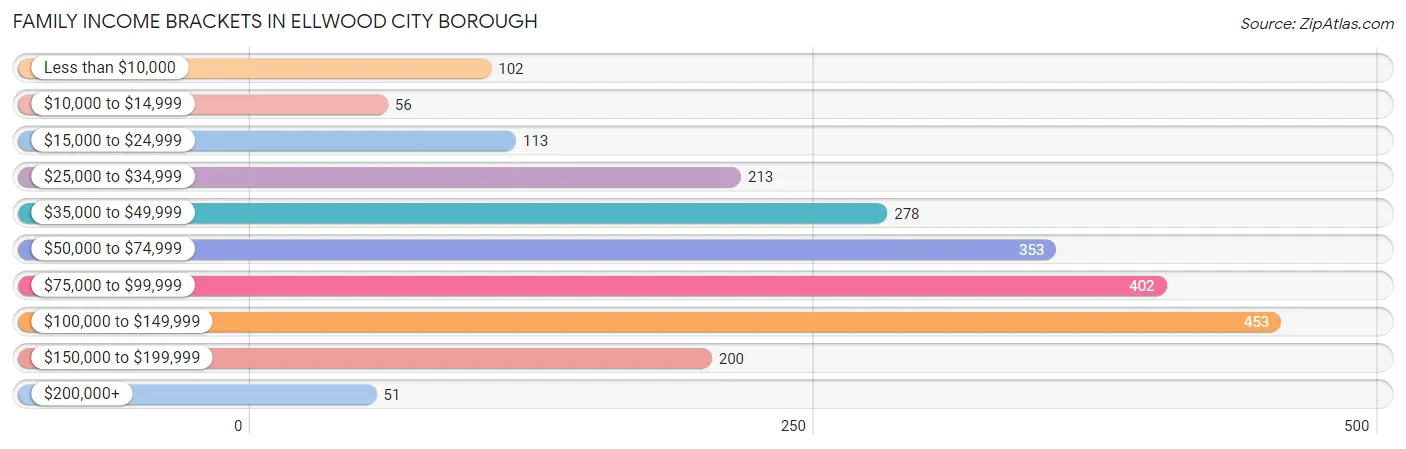
Family Income Brackets in Ellwood City borough
According to the Ellwood City borough family income data, there are 453 families falling into the $100,000 to $149,999 income range, which is the most common income bracket and makes up 20.4% of all families. Conversely, the $200,000+ income bracket is the least frequent group with only 51 families (2.3%) belonging to this category.
| Income Bracket | # Families | % Families |
| Less than $10,000 | 102 | 4.6% |
| $10,000 to $14,999 | 56 | 2.5% |
| $15,000 to $24,999 | 113 | 5.1% |
| $25,000 to $34,999 | 213 | 9.6% |
| $35,000 to $49,999 | 278 | 12.5% |
| $50,000 to $74,999 | 353 | 15.9% |
| $75,000 to $99,999 | 402 | 18.1% |
| $100,000 to $149,999 | 453 | 20.4% |
| $150,000 to $199,999 | 200 | 9.0% |
| $200,000+ | 51 | 2.3% |
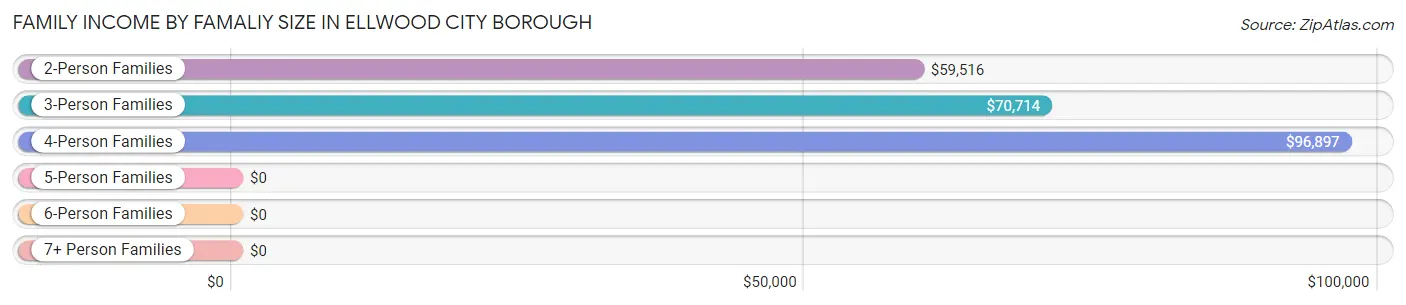
Family Income by Famaliy Size in Ellwood City borough
4-person families (300 | 13.5%) account for the highest median family income in Ellwood City borough with $96,897 per family, while 2-person families (1,414 | 63.7%) have the highest median income of $29,758 per family member.
| Income Bracket | # Families | Median Income |
| 2-Person Families | 1,414 (63.7%) | $59,516 |
| 3-Person Families | 446 (20.1%) | $70,714 |
| 4-Person Families | 300 (13.5%) | $96,897 |
| 5-Person Families | 39 (1.8%) | $0 |
| 6-Person Families | 21 (0.9%) | $0 |
| 7+ Person Families | 0 (0.0%) | $0 |
| Total | 2,220 (100.0%) | $73,636 |
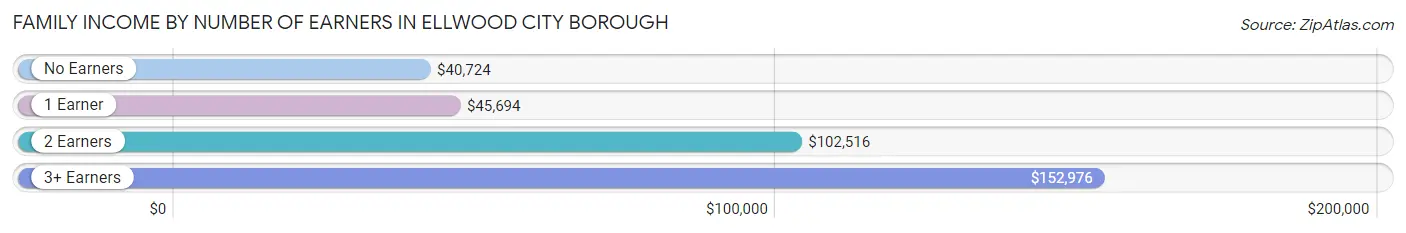
Family Income by Number of Earners in Ellwood City borough
The median family income in Ellwood City borough is $73,636, with families comprising 3+ earners (184) having the highest median family income of $152,976, while families with no earners (301) have the lowest median family income of $40,724, accounting for 8.3% and 13.6% of families, respectively.
| Number of Earners | # Families | Median Income |
| No Earners | 301 (13.6%) | $40,724 |
| 1 Earner | 824 (37.1%) | $45,694 |
| 2 Earners | 911 (41.0%) | $102,516 |
| 3+ Earners | 184 (8.3%) | $152,976 |
| Total | 2,220 (100.0%) | $73,636 |
Household Income in Ellwood City borough
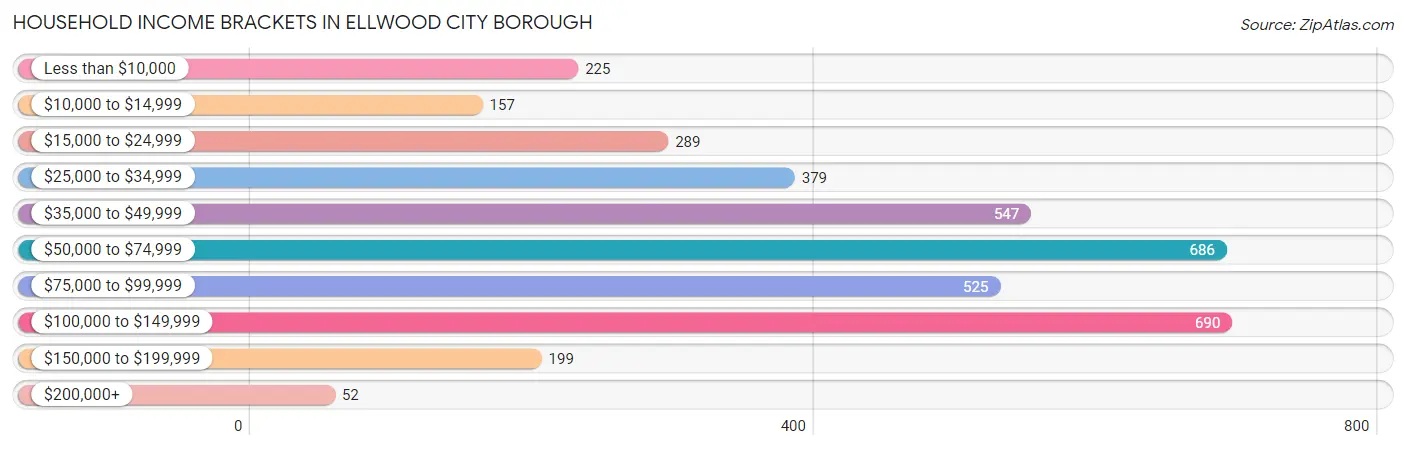
Household Income Brackets in Ellwood City borough
With 690 households falling in the category, the $100,000 to $149,999 income range is the most frequent in Ellwood City borough, accounting for 18.4% of all households. In contrast, only 52 households (1.4%) fall into the $200,000+ income bracket, making it the least populous group.
| Income Bracket | # Households | % Households |
| Less than $10,000 | 225 | 6.0% |
| $10,000 to $14,999 | 157 | 4.2% |
| $15,000 to $24,999 | 289 | 7.7% |
| $25,000 to $34,999 | 379 | 10.1% |
| $35,000 to $49,999 | 547 | 14.6% |
| $50,000 to $74,999 | 686 | 18.3% |
| $75,000 to $99,999 | 525 | 14.0% |
| $100,000 to $149,999 | 690 | 18.4% |
| $150,000 to $199,999 | 199 | 5.3% |
| $200,000+ | 52 | 1.4% |
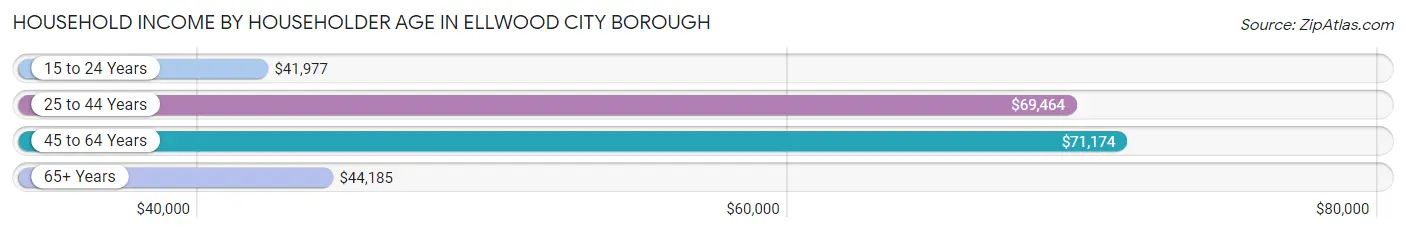
Household Income by Householder Age in Ellwood City borough
The median household income in Ellwood City borough is $57,325, with the highest median household income of $71,174 found in the 45 to 64 years age bracket for the primary householder. A total of 1,349 households (36.0%) fall into this category. Meanwhile, the 15 to 24 years age bracket for the primary householder has the lowest median household income of $41,977, with 162 households (4.3%) in this group.
| Income Bracket | # Households | Median Income |
| 15 to 24 Years | 162 (4.3%) | $41,977 |
| 25 to 44 Years | 1,132 (30.2%) | $69,464 |
| 45 to 64 Years | 1,349 (36.0%) | $71,174 |
| 65+ Years | 1,106 (29.5%) | $44,185 |
| Total | 3,749 (100.0%) | $57,325 |
Poverty in Ellwood City borough
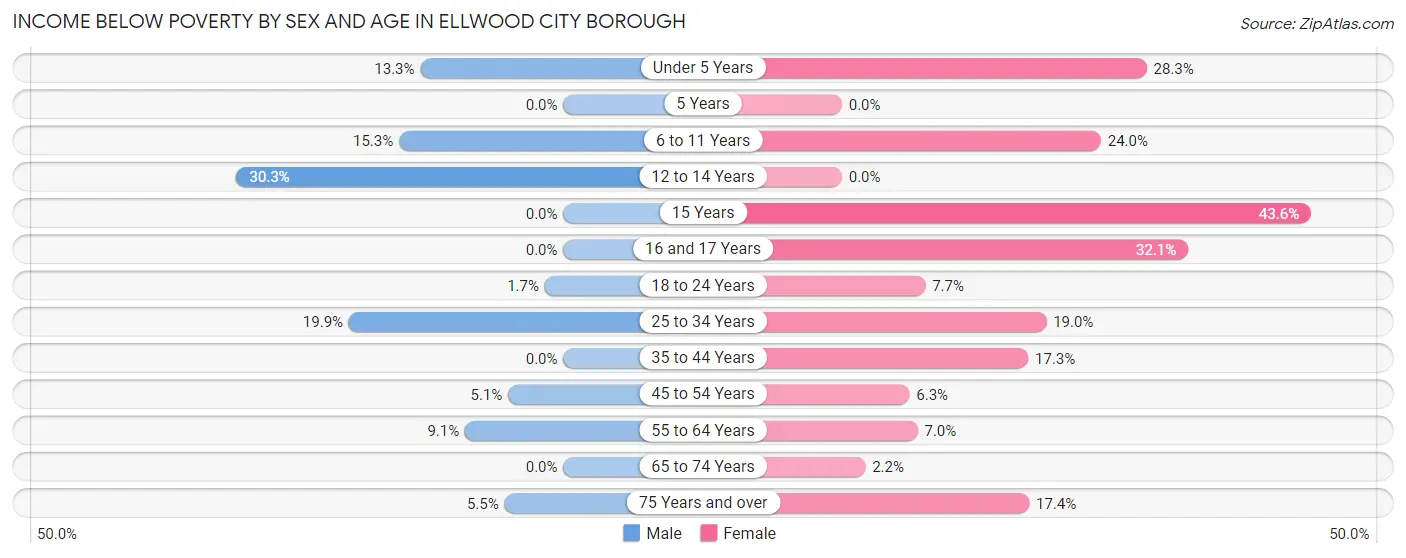
Income Below Poverty by Sex and Age in Ellwood City borough
With 8.9% poverty level for males and 12.0% for females among the residents of Ellwood City borough, 12 to 14 year old males and 15 year old females are the most vulnerable to poverty, with 54 males (30.3%) and 27 females (43.5%) in their respective age groups living below the poverty level.
| Age Bracket | Male | Female |
| Under 5 Years | 26 (13.3%) | 41 (28.3%) |
| 5 Years | 0 (0.0%) | 0 (0.0%) |
| 6 to 11 Years | 34 (15.2%) | 50 (24.0%) |
| 12 to 14 Years | 54 (30.3%) | 0 (0.0%) |
| 15 Years | 0 (0.0%) | 27 (43.5%) |
| 16 and 17 Years | 0 (0.0%) | 9 (32.1%) |
| 18 to 24 Years | 5 (1.7%) | 27 (7.7%) |
| 25 to 34 Years | 119 (19.9%) | 70 (19.0%) |
| 35 to 44 Years | 0 (0.0%) | 74 (17.3%) |
| 45 to 54 Years | 25 (5.1%) | 26 (6.3%) |
| 55 to 64 Years | 58 (9.1%) | 50 (7.0%) |
| 65 to 74 Years | 0 (0.0%) | 13 (2.2%) |
| 75 Years and over | 13 (5.5%) | 77 (17.4%) |
| Total | 334 (8.9%) | 464 (12.0%) |
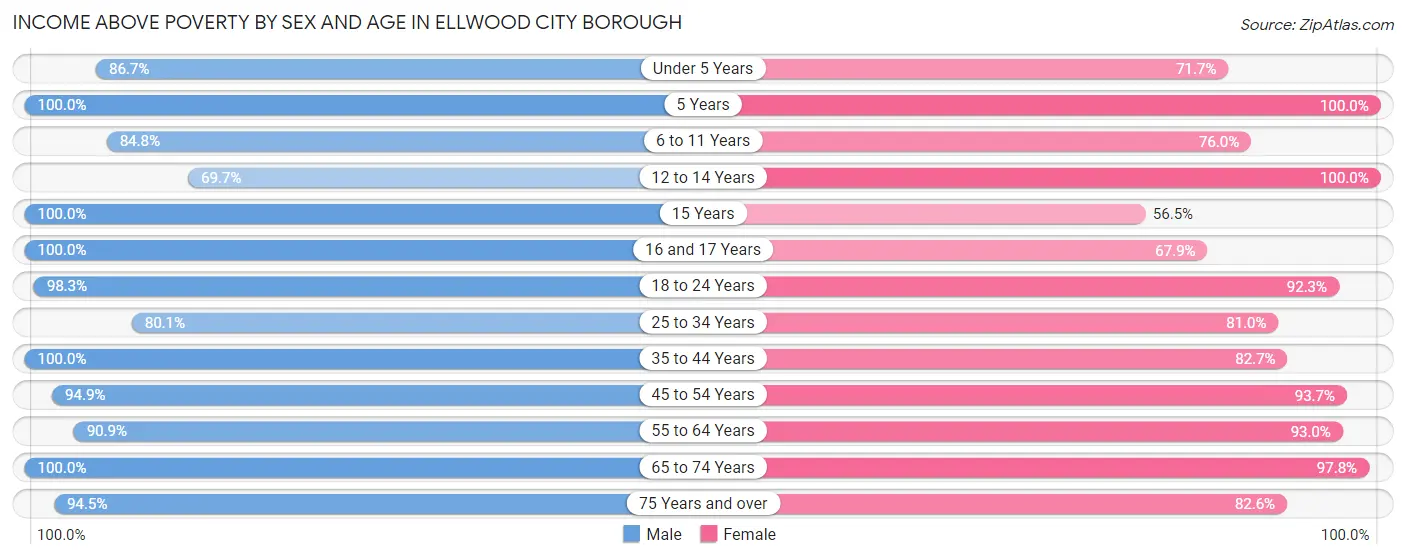
Income Above Poverty by Sex and Age in Ellwood City borough
According to the poverty statistics in Ellwood City borough, males aged 5 years and females aged 5 years are the age groups that are most secure financially, with 100.0% of males and 100.0% of females in these age groups living above the poverty line.
| Age Bracket | Male | Female |
| Under 5 Years | 170 (86.7%) | 104 (71.7%) |
| 5 Years | 15 (100.0%) | 47 (100.0%) |
| 6 to 11 Years | 189 (84.8%) | 158 (76.0%) |
| 12 to 14 Years | 124 (69.7%) | 48 (100.0%) |
| 15 Years | 14 (100.0%) | 35 (56.5%) |
| 16 and 17 Years | 113 (100.0%) | 19 (67.9%) |
| 18 to 24 Years | 285 (98.3%) | 322 (92.3%) |
| 25 to 34 Years | 479 (80.1%) | 299 (81.0%) |
| 35 to 44 Years | 453 (100.0%) | 354 (82.7%) |
| 45 to 54 Years | 463 (94.9%) | 389 (93.7%) |
| 55 to 64 Years | 578 (90.9%) | 661 (93.0%) |
| 65 to 74 Years | 297 (100.0%) | 585 (97.8%) |
| 75 Years and over | 225 (94.5%) | 366 (82.6%) |
| Total | 3,405 (91.1%) | 3,387 (87.9%) |
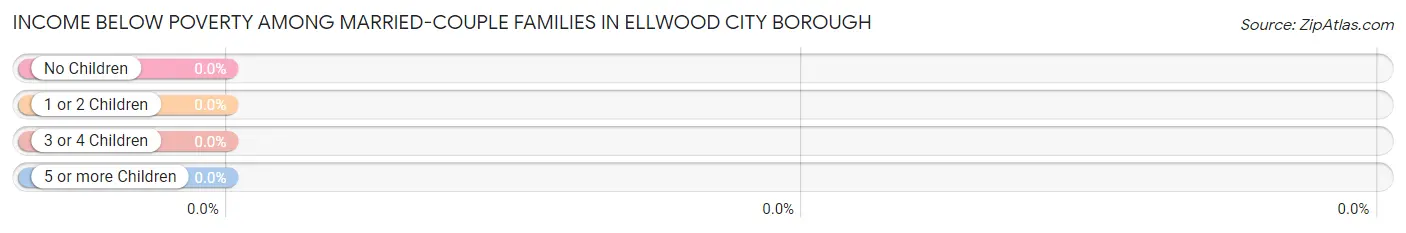
Income Below Poverty Among Married-Couple Families in Ellwood City borough
| Children | Above Poverty | Below Poverty |
| No Children | 1,085 (100.0%) | 0 (0.0%) |
| 1 or 2 Children | 327 (100.0%) | 0 (0.0%) |
| 3 or 4 Children | 49 (100.0%) | 0 (0.0%) |
| 5 or more Children | 0 (0.0%) | 0 (0.0%) |
| Total | 1,461 (100.0%) | 0 (0.0%) |
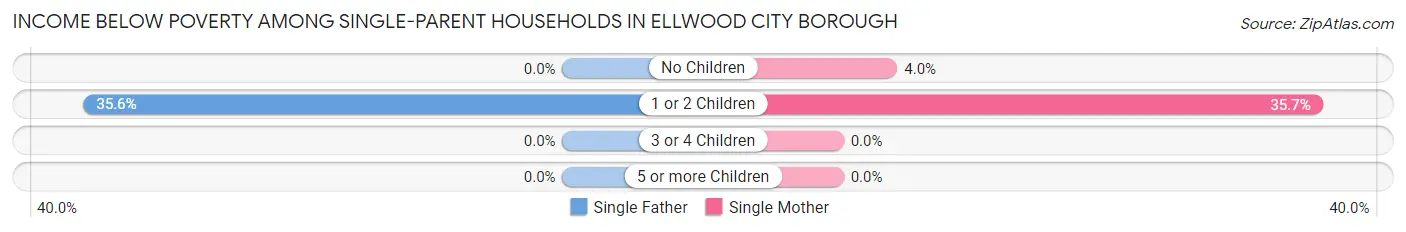
Income Below Poverty Among Single-Parent Households in Ellwood City borough
According to the poverty data in Ellwood City borough, 29.2% or 52 single-father households and 23.4% or 136 single-mother households are living below the poverty line. Among single-father households, those with 1 or 2 children have the highest poverty rate, with 52 households (35.6%) experiencing poverty. Likewise, among single-mother households, those with 1 or 2 children have the highest poverty rate, with 127 households (35.7%) falling below the poverty line.
| Children | Single Father | Single Mother |
| No Children | 0 (0.0%) | 9 (4.0%) |
| 1 or 2 Children | 52 (35.6%) | 127 (35.7%) |
| 3 or 4 Children | 0 (0.0%) | 0 (0.0%) |
| 5 or more Children | 0 (0.0%) | 0 (0.0%) |
| Total | 52 (29.2%) | 136 (23.4%) |
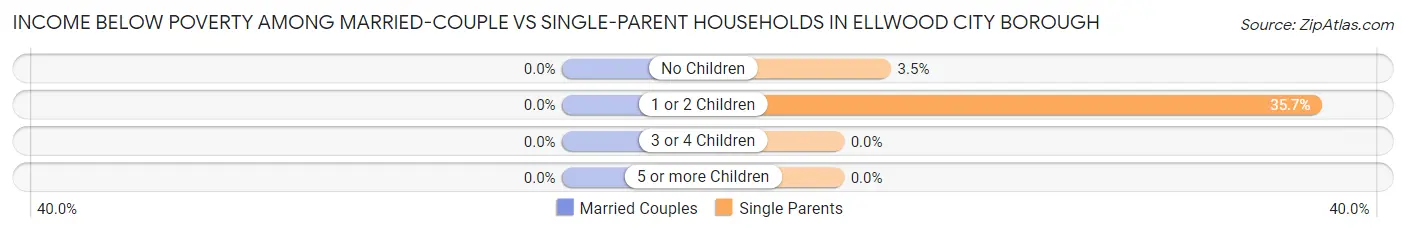
Income Below Poverty Among Married-Couple vs Single-Parent Households in Ellwood City borough
| Children | Married-Couple Families | Single-Parent Households |
| No Children | 0 (0.0%) | 9 (3.5%) |
| 1 or 2 Children | 0 (0.0%) | 179 (35.7%) |
| 3 or 4 Children | 0 (0.0%) | 0 (0.0%) |
| 5 or more Children | 0 (0.0%) | 0 (0.0%) |
| Total | 0 (0.0%) | 188 (24.8%) |
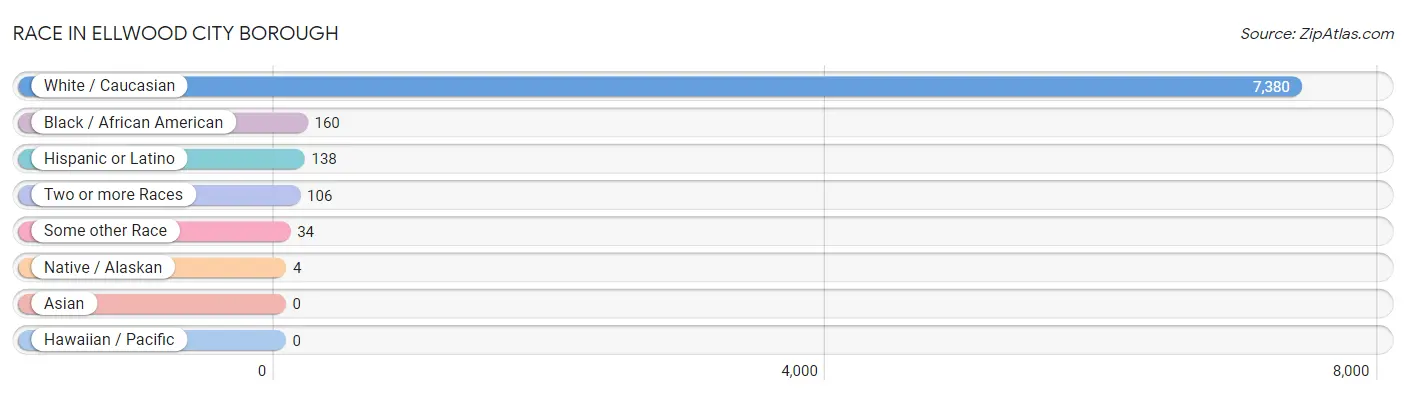
Race in Ellwood City borough
The most populous races in Ellwood City borough are White / Caucasian (7,380 | 96.0%), Black / African American (160 | 2.1%), and Hispanic or Latino (138 | 1.8%).
| Race | # Population | % Population |
| Asian | 0 | 0.0% |
| Black / African American | 160 | 2.1% |
| Hawaiian / Pacific | 0 | 0.0% |
| Hispanic or Latino | 138 | 1.8% |
| Native / Alaskan | 4 | 0.1% |
| White / Caucasian | 7,380 | 96.0% |
| Two or more Races | 106 | 1.4% |
| Some other Race | 34 | 0.4% |
| Total | 7,684 | 100.0% |
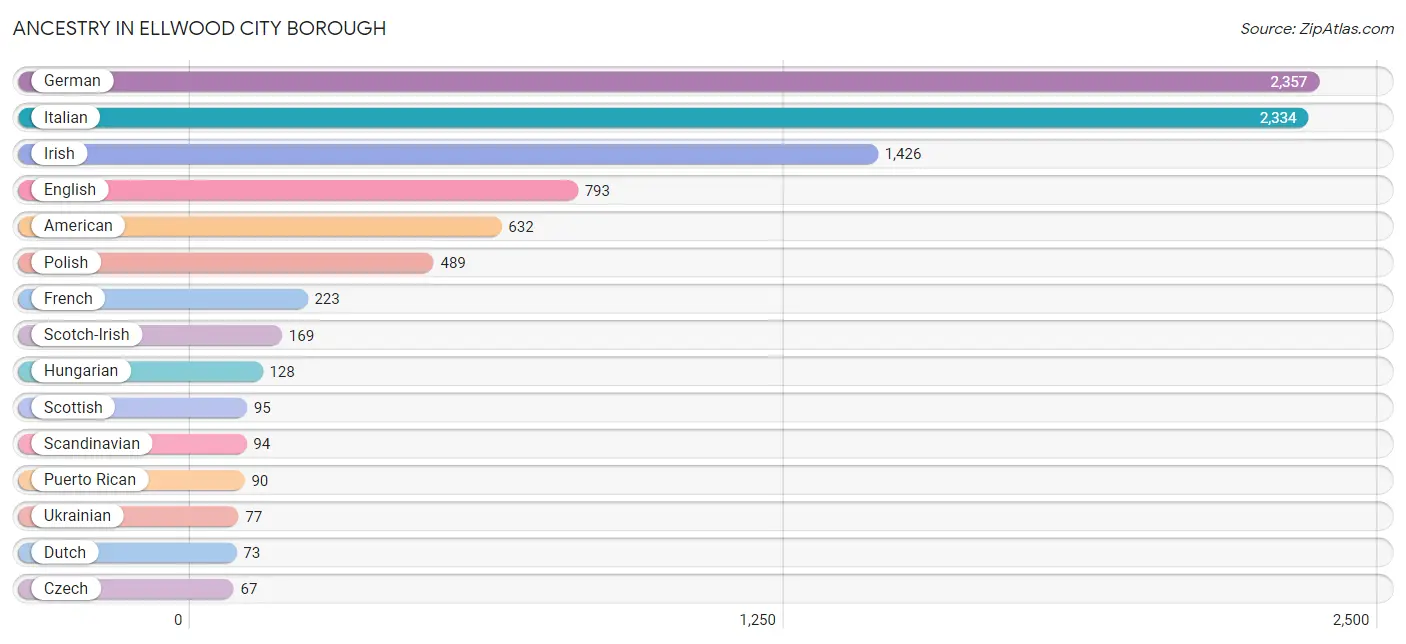
Ancestry in Ellwood City borough
The most populous ancestries reported in Ellwood City borough are German (2,357 | 30.7%), Italian (2,334 | 30.4%), Irish (1,426 | 18.6%), English (793 | 10.3%), and American (632 | 8.2%), together accounting for 98.1% of all Ellwood City borough residents.
| Ancestry | # Population | % Population |
| African | 9 | 0.1% |
| American | 632 | 8.2% |
| Austrian | 35 | 0.5% |
| Bhutanese | 10 | 0.1% |
| British | 14 | 0.2% |
| Burmese | 9 | 0.1% |
| Cherokee | 3 | 0.0% |
| Croatian | 32 | 0.4% |
| Czech | 67 | 0.9% |
| Czechoslovakian | 50 | 0.6% |
| Dominican | 1 | 0.0% |
| Dutch | 73 | 0.9% |
| English | 793 | 10.3% |
| European | 8 | 0.1% |
| French | 223 | 2.9% |
| French Canadian | 7 | 0.1% |
| German | 2,357 | 30.7% |
| Greek | 13 | 0.2% |
| Hungarian | 128 | 1.7% |
| Irish | 1,426 | 18.6% |
| Italian | 2,334 | 30.4% |
| Kiowa | 4 | 0.1% |
| Korean | 14 | 0.2% |
| Mexican | 47 | 0.6% |
| Native Hawaiian | 10 | 0.1% |
| Polish | 489 | 6.4% |
| Puerto Rican | 90 | 1.2% |
| Romanian | 42 | 0.5% |
| Russian | 63 | 0.8% |
| Scandinavian | 94 | 1.2% |
| Scotch-Irish | 169 | 2.2% |
| Scottish | 95 | 1.2% |
| Slovak | 22 | 0.3% |
| Subsaharan African | 9 | 0.1% |
| Swedish | 21 | 0.3% |
| Ukrainian | 77 | 1.0% |
| Welsh | 45 | 0.6% |
| Yugoslavian | 34 | 0.4% | View All 38 Rows |
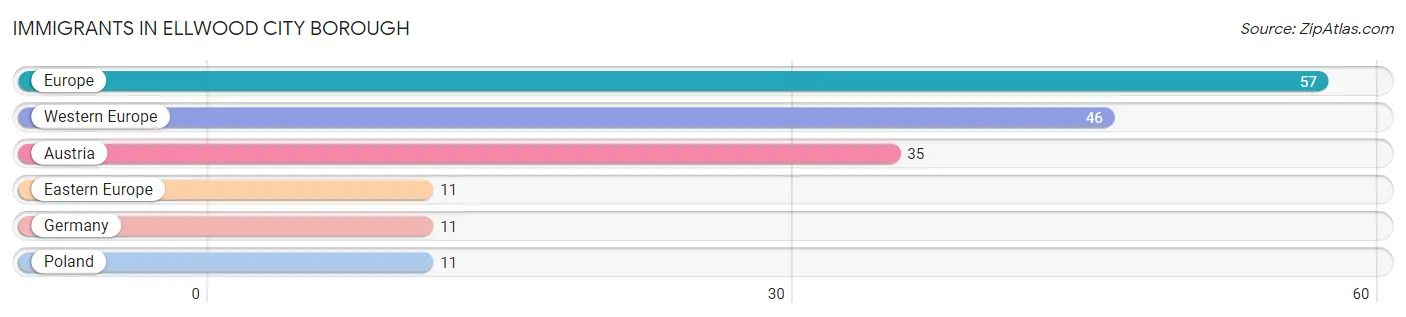
Immigrants in Ellwood City borough
The most numerous immigrant groups reported in Ellwood City borough came from Europe (57 | 0.7%), Western Europe (46 | 0.6%), Austria (35 | 0.5%), Eastern Europe (11 | 0.1%), and Germany (11 | 0.1%), together accounting for 2.1% of all Ellwood City borough residents.
| Immigration Origin | # Population | % Population |
| Austria | 35 | 0.5% |
| Eastern Europe | 11 | 0.1% |
| Europe | 57 | 0.7% |
| Germany | 11 | 0.1% |
| Poland | 11 | 0.1% |
| Western Europe | 46 | 0.6% | View All 6 Rows |
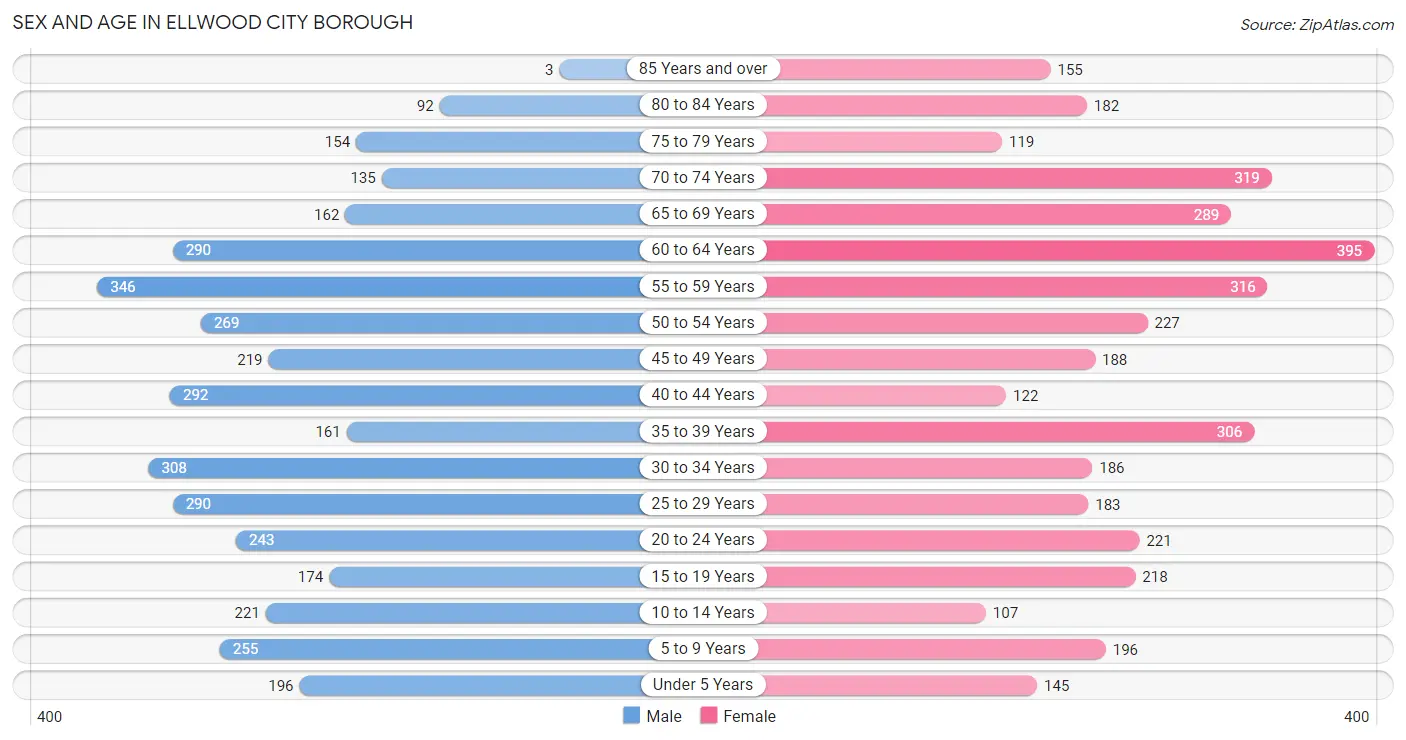
Sex and Age in Ellwood City borough
Sex and Age in Ellwood City borough
The most populous age groups in Ellwood City borough are 55 to 59 Years (346 | 9.1%) for men and 60 to 64 Years (395 | 10.2%) for women.
| Age Bracket | Male | Female |
| Under 5 Years | 196 (5.1%) | 145 (3.7%) |
| 5 to 9 Years | 255 (6.7%) | 196 (5.1%) |
| 10 to 14 Years | 221 (5.8%) | 107 (2.8%) |
| 15 to 19 Years | 174 (4.6%) | 218 (5.6%) |
| 20 to 24 Years | 243 (6.4%) | 221 (5.7%) |
| 25 to 29 Years | 290 (7.6%) | 183 (4.7%) |
| 30 to 34 Years | 308 (8.1%) | 186 (4.8%) |
| 35 to 39 Years | 161 (4.2%) | 306 (7.9%) |
| 40 to 44 Years | 292 (7.7%) | 122 (3.2%) |
| 45 to 49 Years | 219 (5.8%) | 188 (4.9%) |
| 50 to 54 Years | 269 (7.1%) | 227 (5.9%) |
| 55 to 59 Years | 346 (9.1%) | 316 (8.2%) |
| 60 to 64 Years | 290 (7.6%) | 395 (10.2%) |
| 65 to 69 Years | 162 (4.3%) | 289 (7.5%) |
| 70 to 74 Years | 135 (3.5%) | 319 (8.2%) |
| 75 to 79 Years | 154 (4.0%) | 119 (3.1%) |
| 80 to 84 Years | 92 (2.4%) | 182 (4.7%) |
| 85 Years and over | 3 (0.1%) | 155 (4.0%) |
| Total | 3,810 (100.0%) | 3,874 (100.0%) |
Families and Households in Ellwood City borough
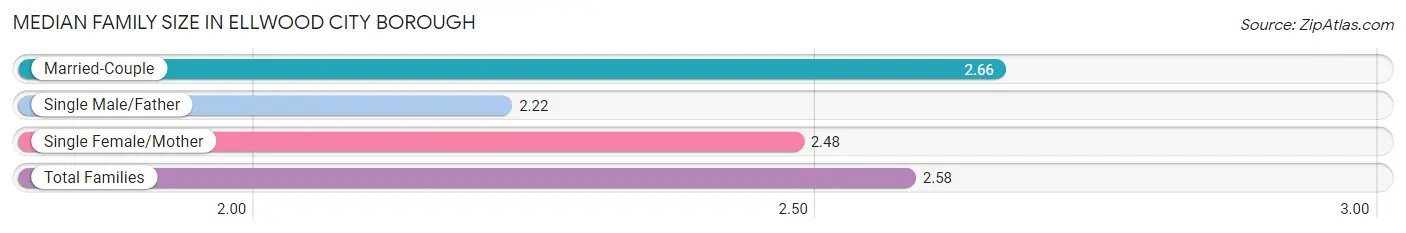
Median Family Size in Ellwood City borough
The median family size in Ellwood City borough is 2.58 persons per family, with married-couple families (1,461 | 65.8%) accounting for the largest median family size of 2.66 persons per family. On the other hand, single male/father families (178 | 8.0%) represent the smallest median family size with 2.22 persons per family.
| Family Type | # Families | Family Size |
| Married-Couple | 1,461 (65.8%) | 2.66 |
| Single Male/Father | 178 (8.0%) | 2.22 |
| Single Female/Mother | 581 (26.2%) | 2.48 |
| Total Families | 2,220 (100.0%) | 2.58 |
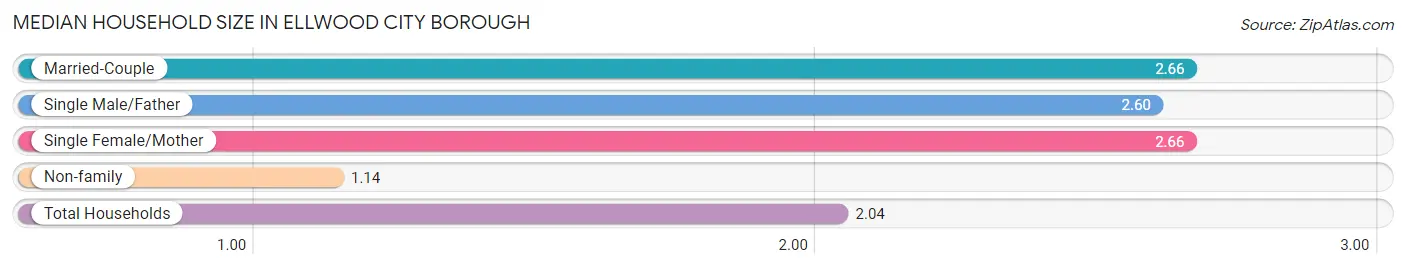
Median Household Size in Ellwood City borough
The median household size in Ellwood City borough is 2.04 persons per household, with married-couple households (1,461 | 39.0%) accounting for the largest median household size of 2.66 persons per household. non-family households (1,529 | 40.8%) represent the smallest median household size with 1.14 persons per household.
| Household Type | # Households | Household Size |
| Married-Couple | 1,461 (39.0%) | 2.66 |
| Single Male/Father | 178 (4.8%) | 2.60 |
| Single Female/Mother | 581 (15.5%) | 2.66 |
| Non-family | 1,529 (40.8%) | 1.14 |
| Total Households | 3,749 (100.0%) | 2.04 |
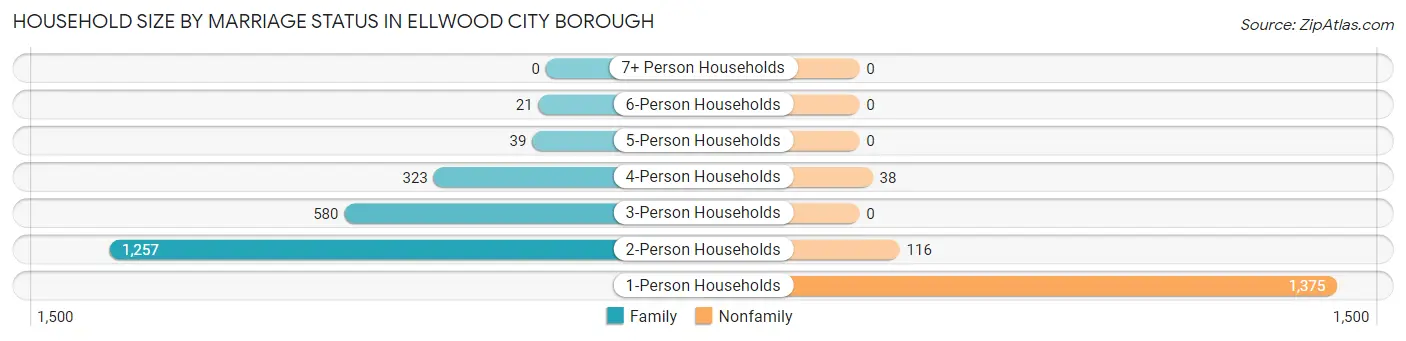
Household Size by Marriage Status in Ellwood City borough
Out of a total of 3,749 households in Ellwood City borough, 2,220 (59.2%) are family households, while 1,529 (40.8%) are nonfamily households. The most numerous type of family households are 2-person households, comprising 1,257, and the most common type of nonfamily households are 1-person households, comprising 1,375.
| Household Size | Family Households | Nonfamily Households |
| 1-Person Households | - | 1,375 (36.7%) |
| 2-Person Households | 1,257 (33.5%) | 116 (3.1%) |
| 3-Person Households | 580 (15.5%) | 0 (0.0%) |
| 4-Person Households | 323 (8.6%) | 38 (1.0%) |
| 5-Person Households | 39 (1.0%) | 0 (0.0%) |
| 6-Person Households | 21 (0.6%) | 0 (0.0%) |
| 7+ Person Households | 0 (0.0%) | 0 (0.0%) |
| Total | 2,220 (59.2%) | 1,529 (40.8%) |
Female Fertility in Ellwood City borough
Fertility by Age in Ellwood City borough
Average fertility rate in Ellwood City borough is 66.0 births per 1,000 women. Women in the age bracket of 20 to 34 years have the highest fertility rate with 136.0 births per 1,000 women. Women in the age bracket of 20 to 34 years acount for 84.2% of all women with births.
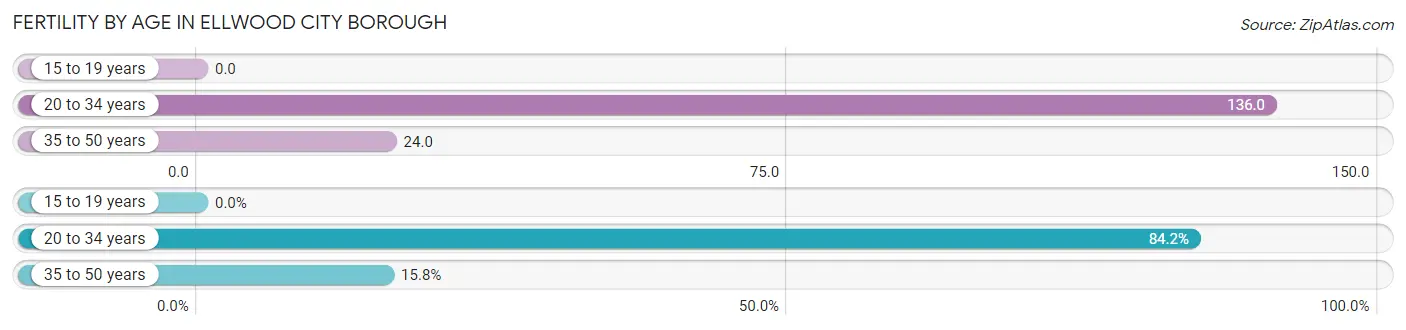
| Age Bracket | Women with Births | Births / 1,000 Women |
| 15 to 19 years | 0 (0.0%) | 0.0 |
| 20 to 34 years | 80 (84.2%) | 136.0 |
| 35 to 50 years | 15 (15.8%) | 24.0 |
| Total | 95 (100.0%) | 66.0 |
Fertility by Age by Marriage Status in Ellwood City borough
37.9% of women with births (95) in Ellwood City borough are married. The highest percentage of unmarried women with births falls into 35 to 50 years age bracket with 66.7% of them unmarried at the time of birth, while the lowest percentage of unmarried women with births belong to 20 to 34 years age bracket with 61.3% of them unmarried.
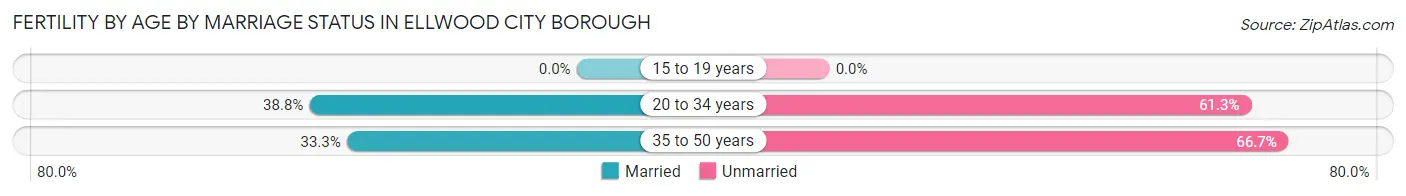
| Age Bracket | Married | Unmarried |
| 15 to 19 years | 0 (0.0%) | 0 (0.0%) |
| 20 to 34 years | 31 (38.8%) | 49 (61.3%) |
| 35 to 50 years | 5 (33.3%) | 10 (66.7%) |
| Total | 36 (37.9%) | 59 (62.1%) |
Fertility by Education in Ellwood City borough
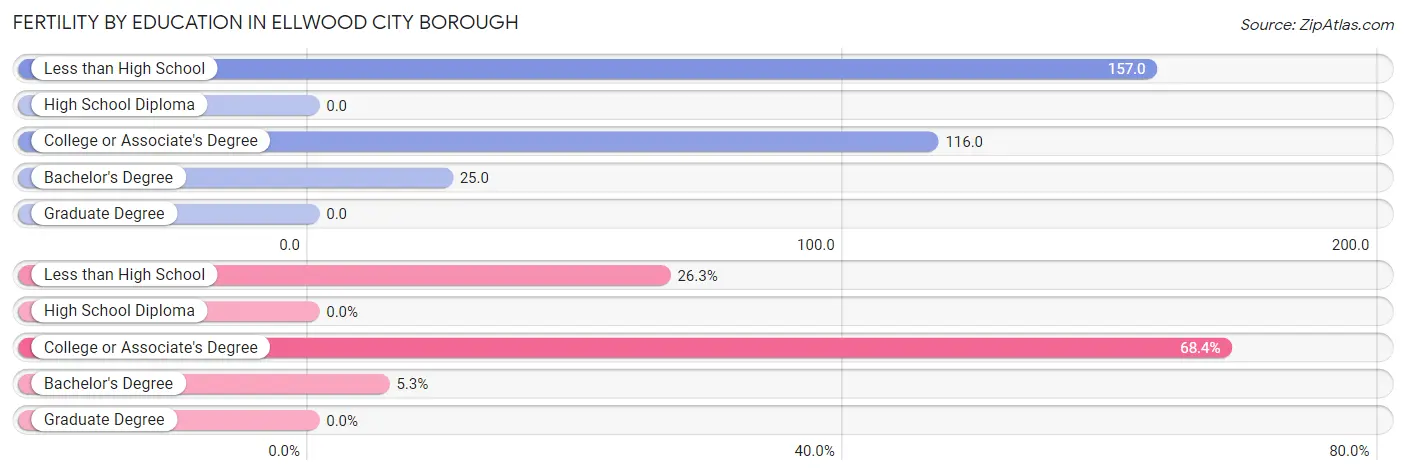
| Educational Attainment | Women with Births | Births / 1,000 Women |
| Less than High School | 25 (26.3%) | 157.0 |
| High School Diploma | 0 (0.0%) | 0.0 |
| College or Associate's Degree | 65 (68.4%) | 116.0 |
| Bachelor's Degree | 5 (5.3%) | 25.0 |
| Graduate Degree | 0 (0.0%) | 0.0 |
| Total | 95 (100.0%) | 66.0 |
Fertility by Education by Marriage Status in Ellwood City borough
62.1% of women with births in Ellwood City borough are unmarried. Women with the educational attainment of bachelor's degree are most likely to be married with 100.0% of them married at childbirth, while women with the educational attainment of less than high school are least likely to be married with 100.0% of them unmarried at childbirth.
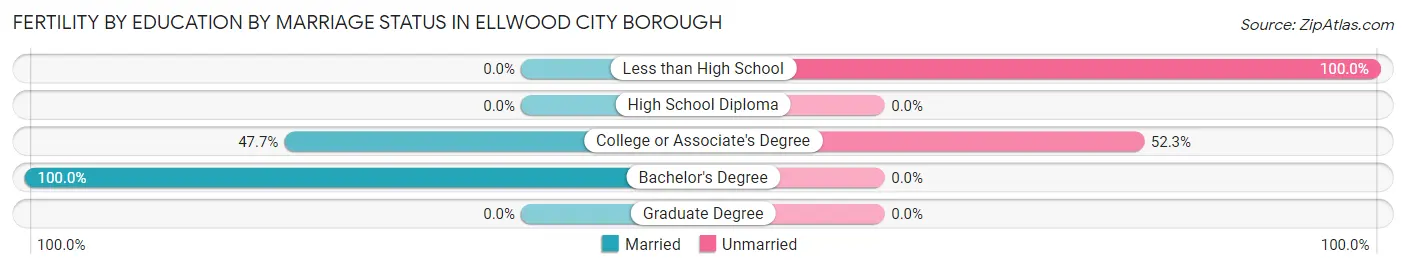
| Educational Attainment | Married | Unmarried |
| Less than High School | 0 (0.0%) | 25 (100.0%) |
| High School Diploma | 0 (0.0%) | 0 (0.0%) |
| College or Associate's Degree | 31 (47.7%) | 34 (52.3%) |
| Bachelor's Degree | 5 (100.0%) | 0 (0.0%) |
| Graduate Degree | 0 (0.0%) | 0 (0.0%) |
| Total | 36 (37.9%) | 59 (62.1%) |
Employment Characteristics in Ellwood City borough
Employment by Class of Employer in Ellwood City borough
Among the 4,119 employed individuals in Ellwood City borough, private company employees (3,044 | 73.9%), not-for-profit organizations (399 | 9.7%), and local government employees (223 | 5.4%) make up the most common classes of employment.
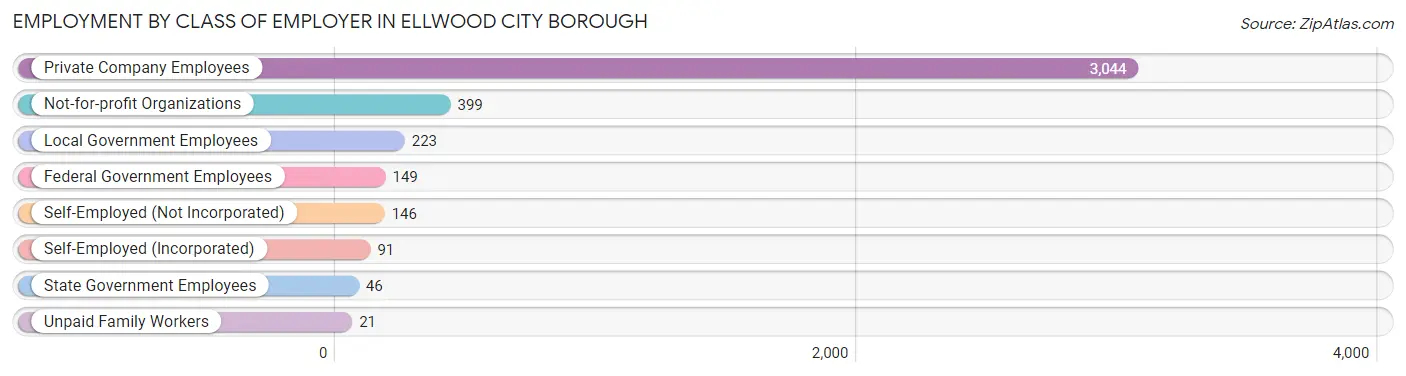
| Employer Class | # Employees | % Employees |
| Private Company Employees | 3,044 | 73.9% |
| Self-Employed (Incorporated) | 91 | 2.2% |
| Self-Employed (Not Incorporated) | 146 | 3.5% |
| Not-for-profit Organizations | 399 | 9.7% |
| Local Government Employees | 223 | 5.4% |
| State Government Employees | 46 | 1.1% |
| Federal Government Employees | 149 | 3.6% |
| Unpaid Family Workers | 21 | 0.5% |
| Total | 4,119 | 100.0% |
Employment Status by Age in Ellwood City borough
According to the labor force statistics for Ellwood City borough, out of the total population over 16 years of age (6,488), 69.4% or 4,503 individuals are in the labor force, with 5.3% or 239 of them unemployed. The age group with the highest labor force participation rate is 30 to 34 years, with 97.6% or 482 individuals in the labor force. Within the labor force, the 25 to 29 years age range has the highest percentage of unemployed individuals, with 12.2% or 54 of them being unemployed.
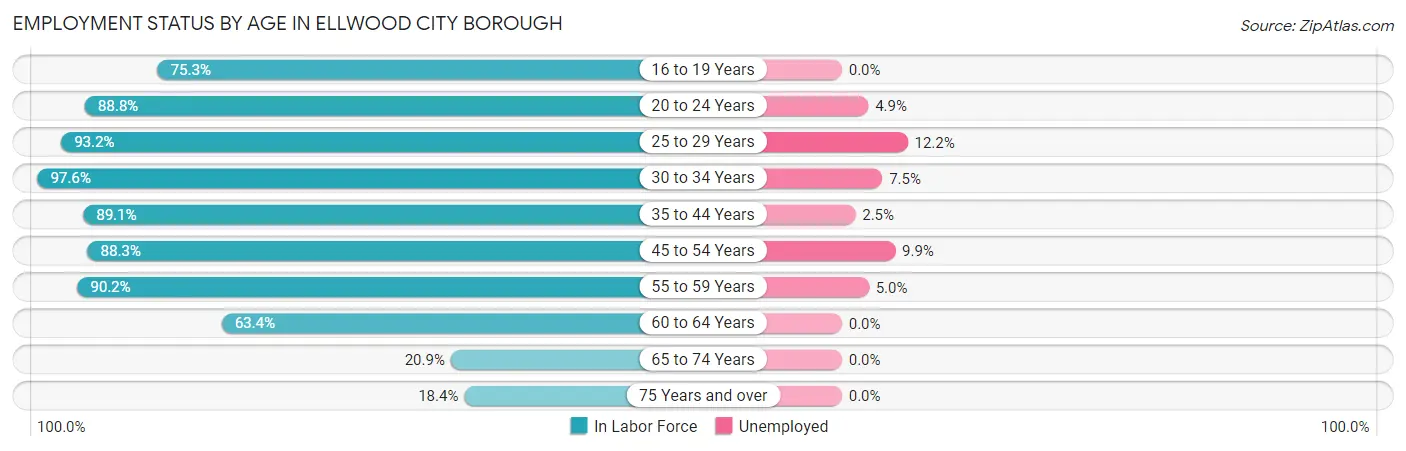
| Age Bracket | In Labor Force | Unemployed |
| 16 to 19 Years | 238 (75.3%) | 0 (0.0%) |
| 20 to 24 Years | 412 (88.8%) | 20 (4.9%) |
| 25 to 29 Years | 441 (93.2%) | 54 (12.2%) |
| 30 to 34 Years | 482 (97.6%) | 36 (7.5%) |
| 35 to 44 Years | 785 (89.1%) | 20 (2.5%) |
| 45 to 54 Years | 797 (88.3%) | 79 (9.9%) |
| 55 to 59 Years | 597 (90.2%) | 30 (5.0%) |
| 60 to 64 Years | 434 (63.4%) | 0 (0.0%) |
| 65 to 74 Years | 189 (20.9%) | 0 (0.0%) |
| 75 Years and over | 130 (18.4%) | 0 (0.0%) |
| Total | 4,503 (69.4%) | 239 (5.3%) |
Employment Status by Educational Attainment in Ellwood City borough
According to labor force statistics for Ellwood City borough, 86.3% of individuals (3,537) out of the total population between 25 and 64 years of age (4,098) are in the labor force, with 6.2% or 219 of them being unemployed. The group with the highest labor force participation rate are those with the educational attainment of less than high school, with 92.2% or 296 individuals in the labor force. Within the labor force, individuals with less than high school education have the highest percentage of unemployment, with 26.0% or 77 of them being unemployed.
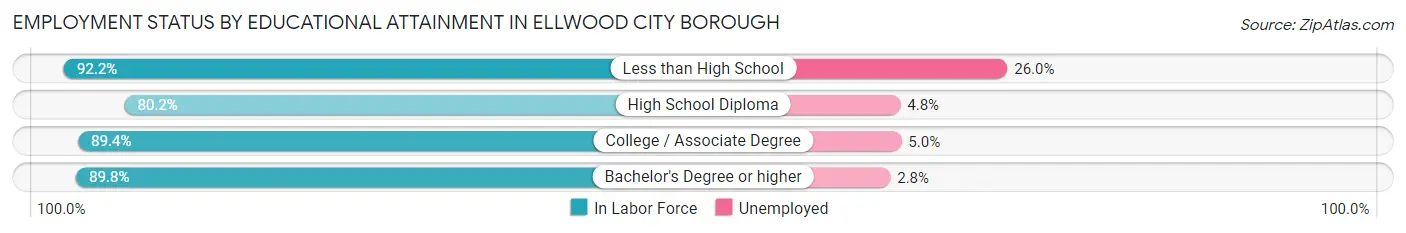
| Educational Attainment | In Labor Force | Unemployed |
| Less than High School | 296 (92.2%) | 83 (26.0%) |
| High School Diploma | 1,229 (80.2%) | 74 (4.8%) |
| College / Associate Degree | 1,202 (89.4%) | 67 (5.0%) |
| Bachelor's Degree or higher | 809 (89.8%) | 25 (2.8%) |
| Total | 3,537 (86.3%) | 254 (6.2%) |
Employment Occupations by Sex in Ellwood City borough
Management, Business, Science and Arts Occupations
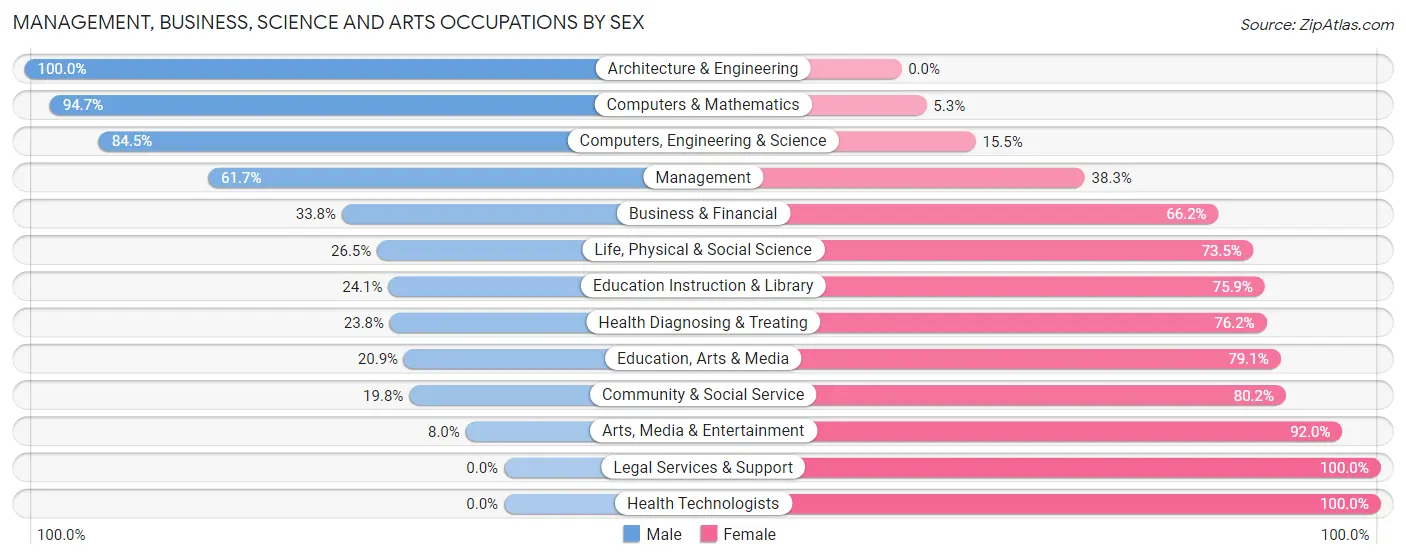
The most common Management, Business, Science and Arts occupations in Ellwood City borough are Management (431 | 10.1%), Community & Social Service (364 | 8.5%), Education Instruction & Library (203 | 4.8%), Computers, Engineering & Science (187 | 4.4%), and Business & Financial (136 | 3.2%).
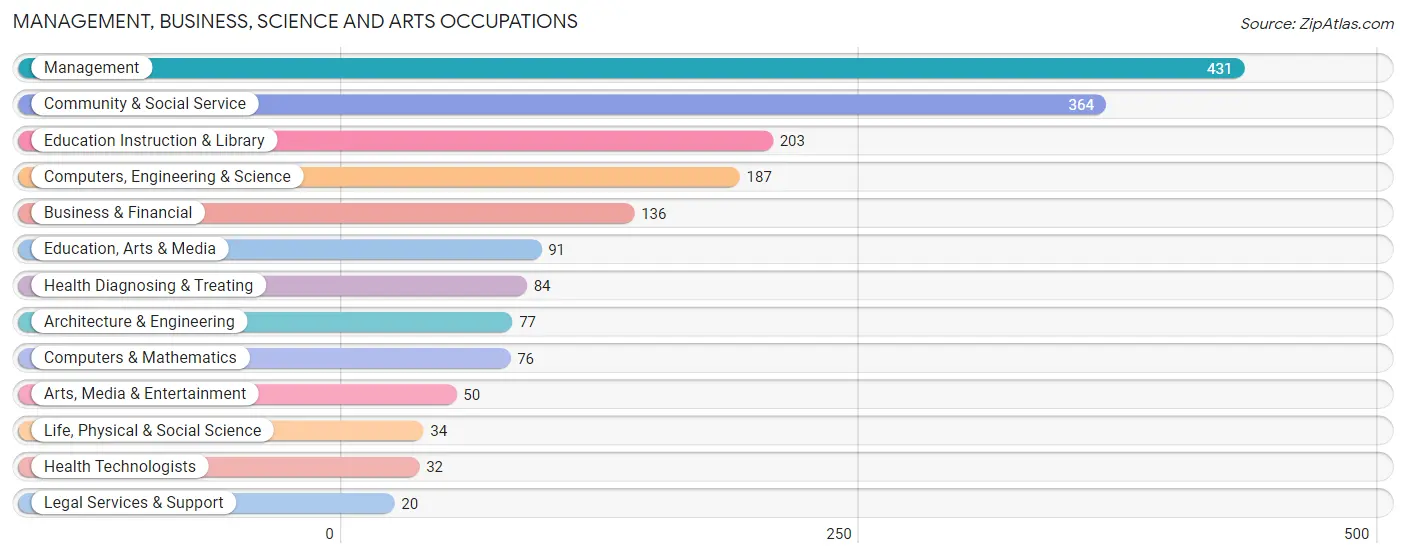
Management, Business, Science and Arts Occupations by Sex
Within the Management, Business, Science and Arts occupations in Ellwood City borough, the most male-oriented occupations are Architecture & Engineering (100.0%), Computers & Mathematics (94.7%), and Computers, Engineering & Science (84.5%), while the most female-oriented occupations are Legal Services & Support (100.0%), Health Technologists (100.0%), and Arts, Media & Entertainment (92.0%).
| Occupation | Male | Female |
| Management | 266 (61.7%) | 165 (38.3%) |
| Business & Financial | 46 (33.8%) | 90 (66.2%) |
| Computers, Engineering & Science | 158 (84.5%) | 29 (15.5%) |
| Computers & Mathematics | 72 (94.7%) | 4 (5.3%) |
| Architecture & Engineering | 77 (100.0%) | 0 (0.0%) |
| Life, Physical & Social Science | 9 (26.5%) | 25 (73.5%) |
| Community & Social Service | 72 (19.8%) | 292 (80.2%) |
| Education, Arts & Media | 19 (20.9%) | 72 (79.1%) |
| Legal Services & Support | 0 (0.0%) | 20 (100.0%) |
| Education Instruction & Library | 49 (24.1%) | 154 (75.9%) |
| Arts, Media & Entertainment | 4 (8.0%) | 46 (92.0%) |
| Health Diagnosing & Treating | 20 (23.8%) | 64 (76.2%) |
| Health Technologists | 0 (0.0%) | 32 (100.0%) |
| Total (Category) | 562 (46.8%) | 640 (53.2%) |
| Total (Overall) | 2,259 (52.9%) | 2,007 (47.0%) |
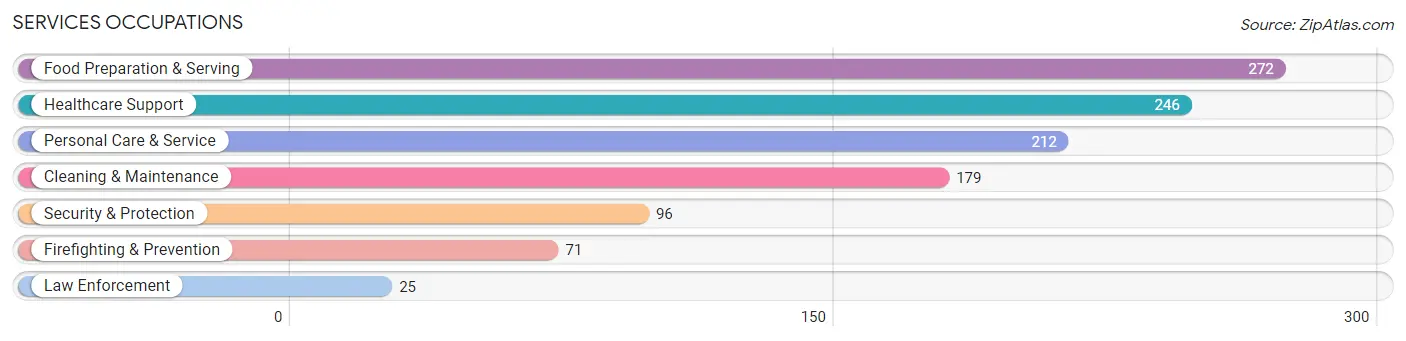
Services Occupations
The most common Services occupations in Ellwood City borough are Food Preparation & Serving (272 | 6.4%), Healthcare Support (246 | 5.8%), Personal Care & Service (212 | 5.0%), Cleaning & Maintenance (179 | 4.2%), and Security & Protection (96 | 2.2%).
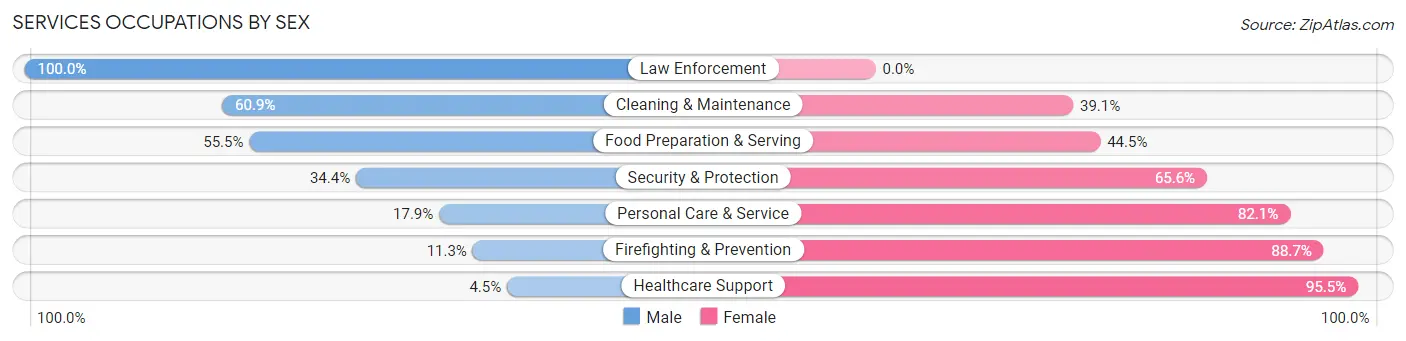
Services Occupations by Sex
Within the Services occupations in Ellwood City borough, the most male-oriented occupations are Law Enforcement (100.0%), Cleaning & Maintenance (60.9%), and Food Preparation & Serving (55.5%), while the most female-oriented occupations are Healthcare Support (95.5%), Firefighting & Prevention (88.7%), and Personal Care & Service (82.1%).
| Occupation | Male | Female |
| Healthcare Support | 11 (4.5%) | 235 (95.5%) |
| Security & Protection | 33 (34.4%) | 63 (65.6%) |
| Firefighting & Prevention | 8 (11.3%) | 63 (88.7%) |
| Law Enforcement | 25 (100.0%) | 0 (0.0%) |
| Food Preparation & Serving | 151 (55.5%) | 121 (44.5%) |
| Cleaning & Maintenance | 109 (60.9%) | 70 (39.1%) |
| Personal Care & Service | 38 (17.9%) | 174 (82.1%) |
| Total (Category) | 342 (34.0%) | 663 (66.0%) |
| Total (Overall) | 2,259 (52.9%) | 2,007 (47.0%) |
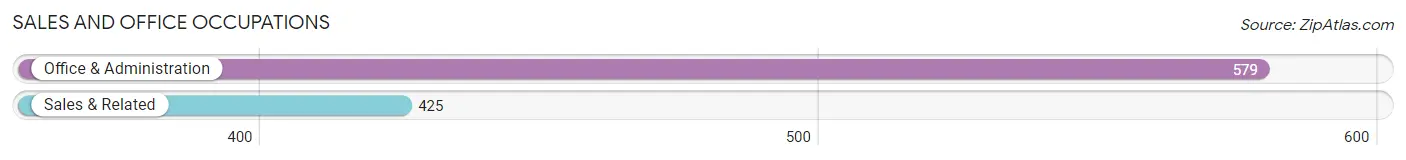
Sales and Office Occupations
The most common Sales and Office occupations in Ellwood City borough are Office & Administration (579 | 13.6%), and Sales & Related (425 | 10.0%).
Sales and Office Occupations by Sex
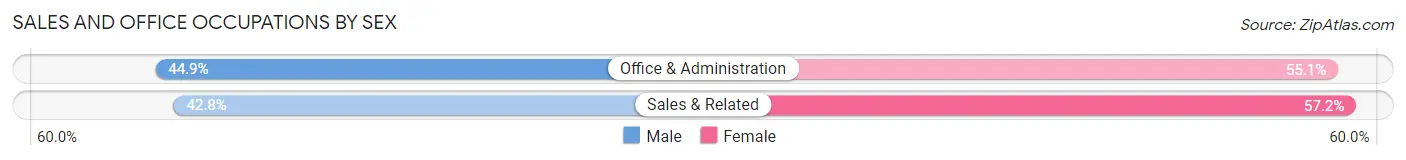
| Occupation | Male | Female |
| Sales & Related | 182 (42.8%) | 243 (57.2%) |
| Office & Administration | 260 (44.9%) | 319 (55.1%) |
| Total (Category) | 442 (44.0%) | 562 (56.0%) |
| Total (Overall) | 2,259 (52.9%) | 2,007 (47.0%) |
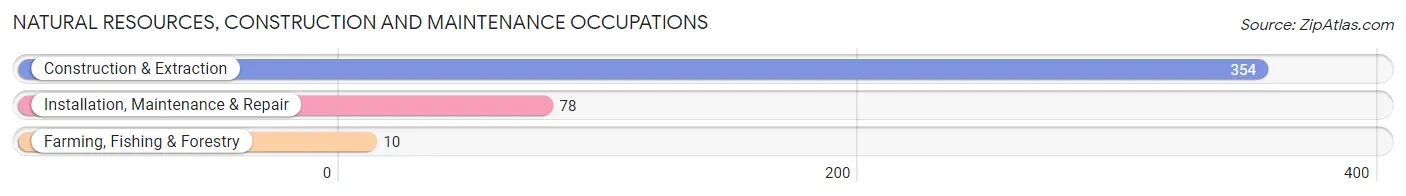
Natural Resources, Construction and Maintenance Occupations
The most common Natural Resources, Construction and Maintenance occupations in Ellwood City borough are Construction & Extraction (354 | 8.3%), Installation, Maintenance & Repair (78 | 1.8%), and Farming, Fishing & Forestry (10 | 0.2%).
Natural Resources, Construction and Maintenance Occupations by Sex
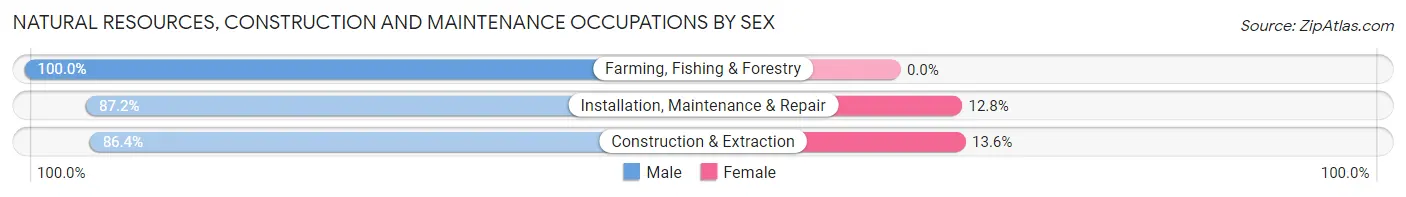
| Occupation | Male | Female |
| Farming, Fishing & Forestry | 10 (100.0%) | 0 (0.0%) |
| Construction & Extraction | 306 (86.4%) | 48 (13.6%) |
| Installation, Maintenance & Repair | 68 (87.2%) | 10 (12.8%) |
| Total (Category) | 384 (86.9%) | 58 (13.1%) |
| Total (Overall) | 2,259 (52.9%) | 2,007 (47.0%) |
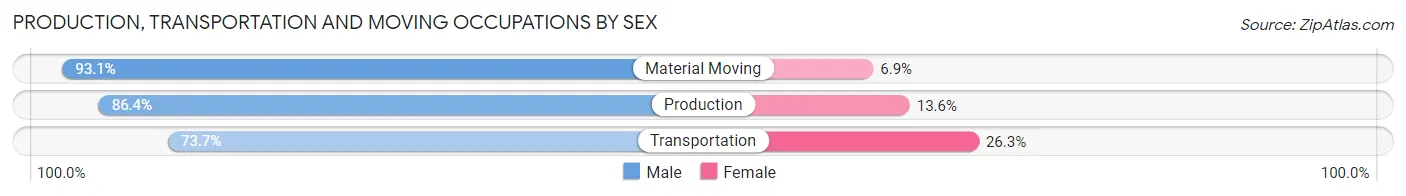
Production, Transportation and Moving Occupations
The most common Production, Transportation and Moving occupations in Ellwood City borough are Material Moving (245 | 5.7%), Production (235 | 5.5%), and Transportation (133 | 3.1%).
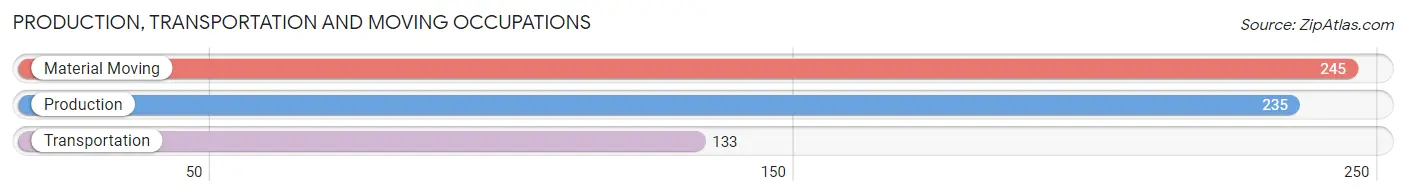
Production, Transportation and Moving Occupations by Sex
| Occupation | Male | Female |
| Production | 203 (86.4%) | 32 (13.6%) |
| Transportation | 98 (73.7%) | 35 (26.3%) |
| Material Moving | 228 (93.1%) | 17 (6.9%) |
| Total (Category) | 529 (86.3%) | 84 (13.7%) |
| Total (Overall) | 2,259 (52.9%) | 2,007 (47.0%) |
Employment Industries by Sex in Ellwood City borough
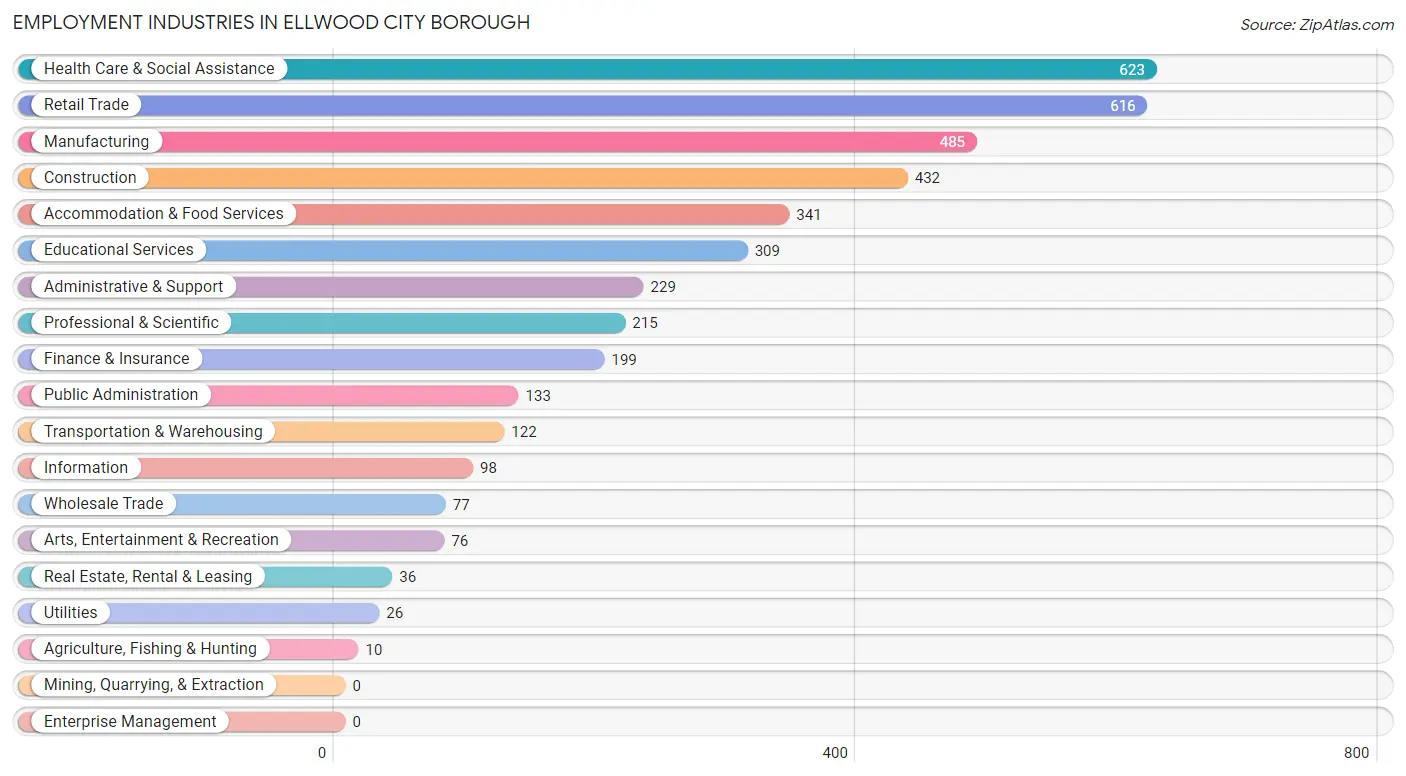
Employment Industries in Ellwood City borough
The major employment industries in Ellwood City borough include Health Care & Social Assistance (623 | 14.6%), Retail Trade (616 | 14.4%), Manufacturing (485 | 11.4%), Construction (432 | 10.1%), and Accommodation & Food Services (341 | 8.0%).
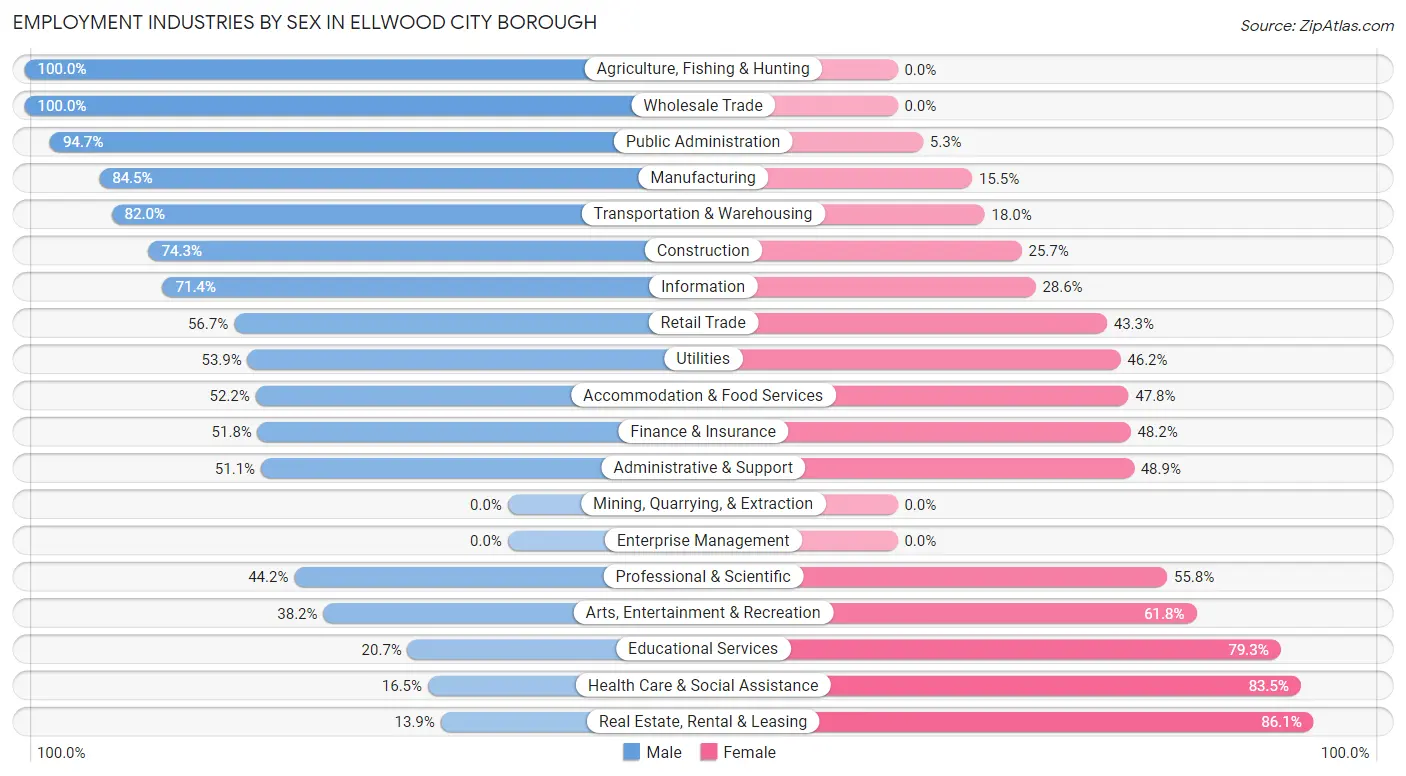
Employment Industries by Sex in Ellwood City borough
The Ellwood City borough industries that see more men than women are Agriculture, Fishing & Hunting (100.0%), Wholesale Trade (100.0%), and Public Administration (94.7%), whereas the industries that tend to have a higher number of women are Real Estate, Rental & Leasing (86.1%), Health Care & Social Assistance (83.5%), and Educational Services (79.3%).
| Industry | Male | Female |
| Agriculture, Fishing & Hunting | 10 (100.0%) | 0 (0.0%) |
| Mining, Quarrying, & Extraction | 0 (0.0%) | 0 (0.0%) |
| Construction | 321 (74.3%) | 111 (25.7%) |
| Manufacturing | 410 (84.5%) | 75 (15.5%) |
| Wholesale Trade | 77 (100.0%) | 0 (0.0%) |
| Retail Trade | 349 (56.7%) | 267 (43.3%) |
| Transportation & Warehousing | 100 (82.0%) | 22 (18.0%) |
| Utilities | 14 (53.8%) | 12 (46.2%) |
| Information | 70 (71.4%) | 28 (28.6%) |
| Finance & Insurance | 103 (51.8%) | 96 (48.2%) |
| Real Estate, Rental & Leasing | 5 (13.9%) | 31 (86.1%) |
| Professional & Scientific | 95 (44.2%) | 120 (55.8%) |
| Enterprise Management | 0 (0.0%) | 0 (0.0%) |
| Administrative & Support | 117 (51.1%) | 112 (48.9%) |
| Educational Services | 64 (20.7%) | 245 (79.3%) |
| Health Care & Social Assistance | 103 (16.5%) | 520 (83.5%) |
| Arts, Entertainment & Recreation | 29 (38.2%) | 47 (61.8%) |
| Accommodation & Food Services | 178 (52.2%) | 163 (47.8%) |
| Public Administration | 126 (94.7%) | 7 (5.3%) |
| Total | 2,259 (52.9%) | 2,007 (47.0%) |
Education in Ellwood City borough
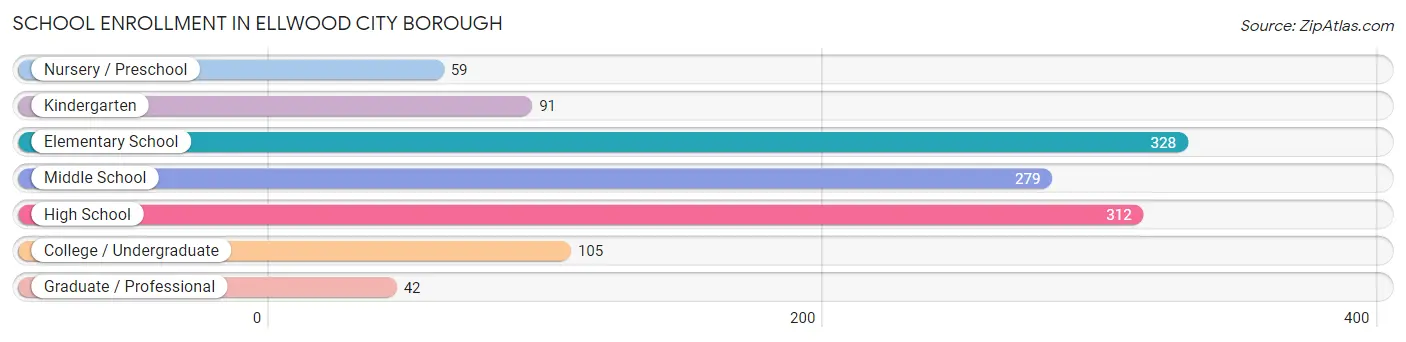
School Enrollment in Ellwood City borough
The most common levels of schooling among the 1,216 students in Ellwood City borough are elementary school (328 | 27.0%), high school (312 | 25.7%), and middle school (279 | 22.9%).
| School Level | # Students | % Students |
| Nursery / Preschool | 59 | 4.9% |
| Kindergarten | 91 | 7.5% |
| Elementary School | 328 | 27.0% |
| Middle School | 279 | 22.9% |
| High School | 312 | 25.7% |
| College / Undergraduate | 105 | 8.6% |
| Graduate / Professional | 42 | 3.5% |
| Total | 1,216 | 100.0% |
School Enrollment by Age by Funding Source in Ellwood City borough
Out of a total of 1,216 students who are enrolled in schools in Ellwood City borough, 126 (10.4%) attend a private institution, while the remaining 1,090 (89.6%) are enrolled in public schools. The age group of 25 to 34 year olds has the highest likelihood of being enrolled in private schools, with 21 (100.0% in the age bracket) enrolled. Conversely, the age group of 15 to 17 year olds has the lowest likelihood of being enrolled in a private school, with 217 (100.0% in the age bracket) attending a public institution.
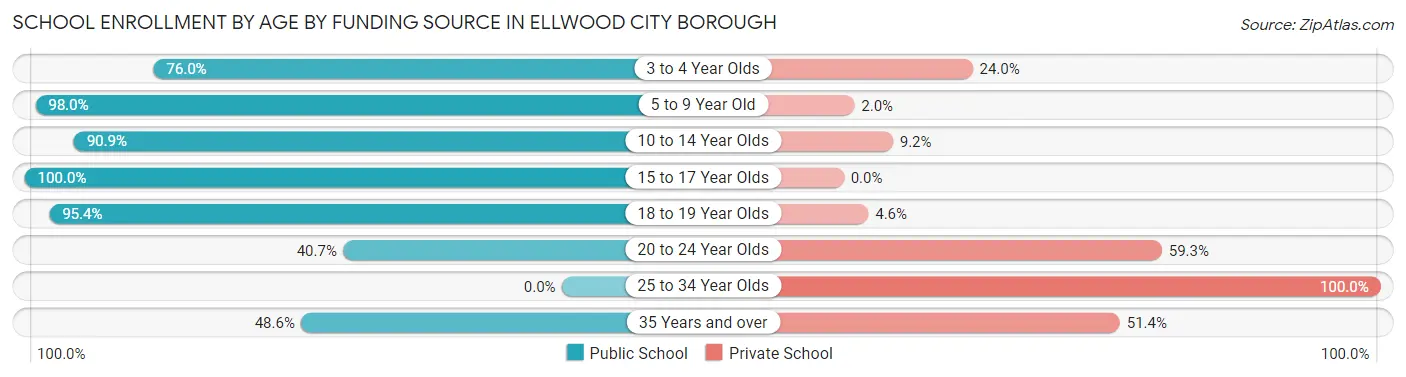
| Age Bracket | Public School | Private School |
| 3 to 4 Year Olds | 38 (76.0%) | 12 (24.0%) |
| 5 to 9 Year Old | 394 (98.0%) | 8 (2.0%) |
| 10 to 14 Year Olds | 298 (90.8%) | 30 (9.1%) |
| 15 to 17 Year Olds | 217 (100.0%) | 0 (0.0%) |
| 18 to 19 Year Olds | 104 (95.4%) | 5 (4.6%) |
| 20 to 24 Year Olds | 22 (40.7%) | 32 (59.3%) |
| 25 to 34 Year Olds | 0 (0.0%) | 21 (100.0%) |
| 35 Years and over | 17 (48.6%) | 18 (51.4%) |
| Total | 1,090 (89.6%) | 126 (10.4%) |
Educational Attainment by Field of Study in Ellwood City borough
Education (357 | 29.2%), business (247 | 20.2%), arts & humanities (159 | 13.0%), science & technology (109 | 8.9%), and psychology (72 | 5.9%) are the most common fields of study among 1,223 individuals in Ellwood City borough who have obtained a bachelor's degree or higher.
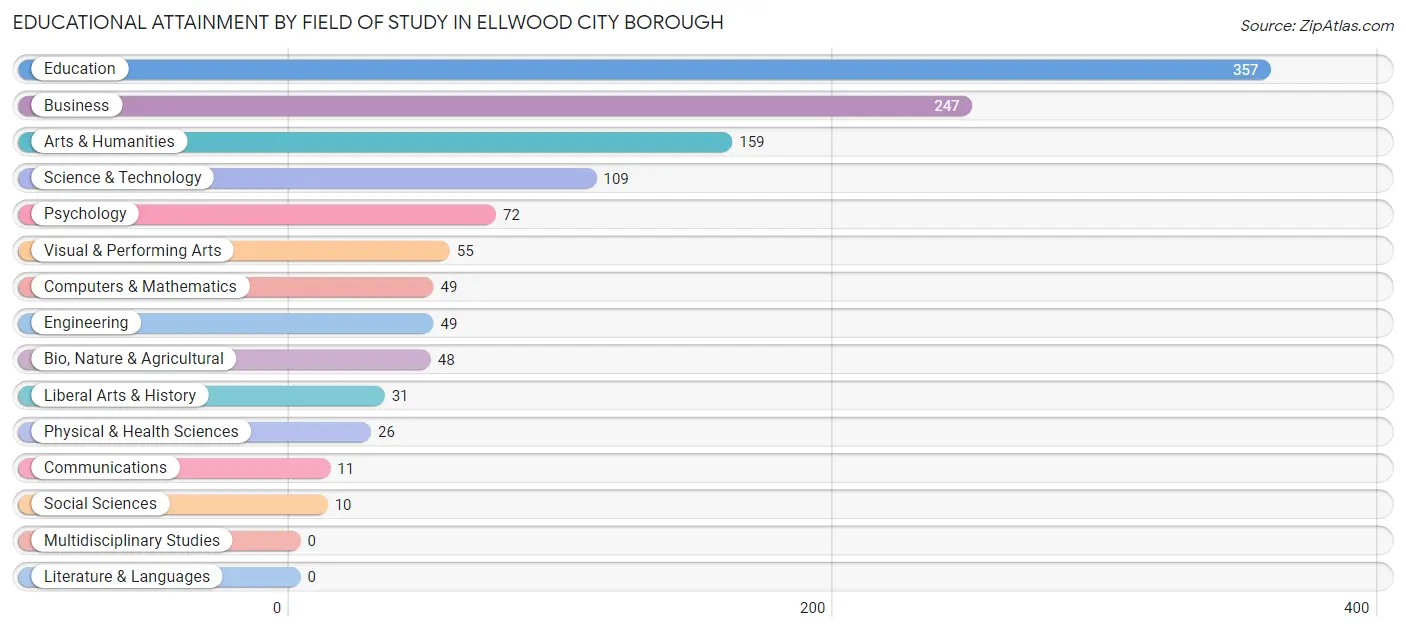
| Field of Study | # Graduates | % Graduates |
| Computers & Mathematics | 49 | 4.0% |
| Bio, Nature & Agricultural | 48 | 3.9% |
| Physical & Health Sciences | 26 | 2.1% |
| Psychology | 72 | 5.9% |
| Social Sciences | 10 | 0.8% |
| Engineering | 49 | 4.0% |
| Multidisciplinary Studies | 0 | 0.0% |
| Science & Technology | 109 | 8.9% |
| Business | 247 | 20.2% |
| Education | 357 | 29.2% |
| Literature & Languages | 0 | 0.0% |
| Liberal Arts & History | 31 | 2.5% |
| Visual & Performing Arts | 55 | 4.5% |
| Communications | 11 | 0.9% |
| Arts & Humanities | 159 | 13.0% |
| Total | 1,223 | 100.0% |
Transportation & Commute in Ellwood City borough
Vehicle Availability by Sex in Ellwood City borough
The most prevalent vehicle ownership categories in Ellwood City borough are males with 2 vehicles (902, accounting for 41.4%) and females with 2 vehicles (813, making up 46.7%).
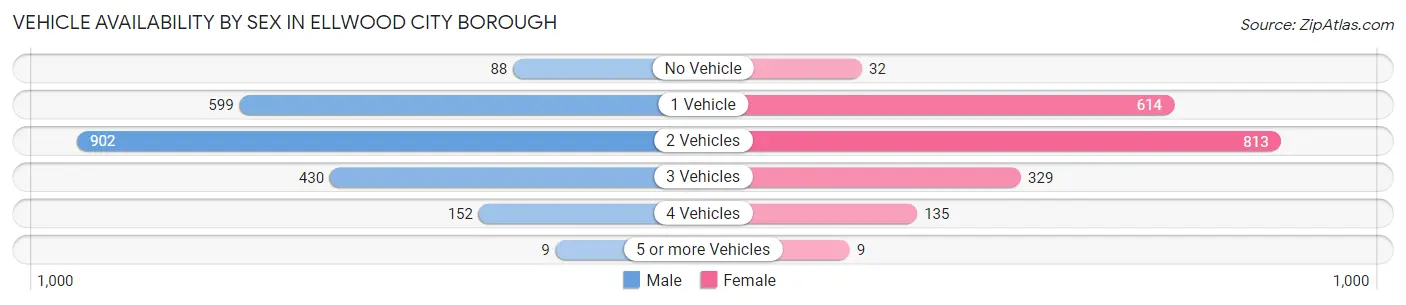
| Vehicles Available | Male | Female |
| No Vehicle | 88 (4.0%) | 32 (1.7%) |
| 1 Vehicle | 599 (27.5%) | 614 (31.8%) |
| 2 Vehicles | 902 (41.4%) | 813 (42.1%) |
| 3 Vehicles | 430 (19.7%) | 329 (17.0%) |
| 4 Vehicles | 152 (7.0%) | 135 (7.0%) |
| 5 or more Vehicles | 9 (0.4%) | 9 (0.5%) |
| Total | 2,180 (100.0%) | 1,932 (100.0%) |
Commute Time in Ellwood City borough
The most frequently occuring commute durations in Ellwood City borough are 20 to 24 minutes (675 commuters, 17.8%), 5 to 9 minutes (537 commuters, 14.1%), and 15 to 19 minutes (430 commuters, 11.3%).
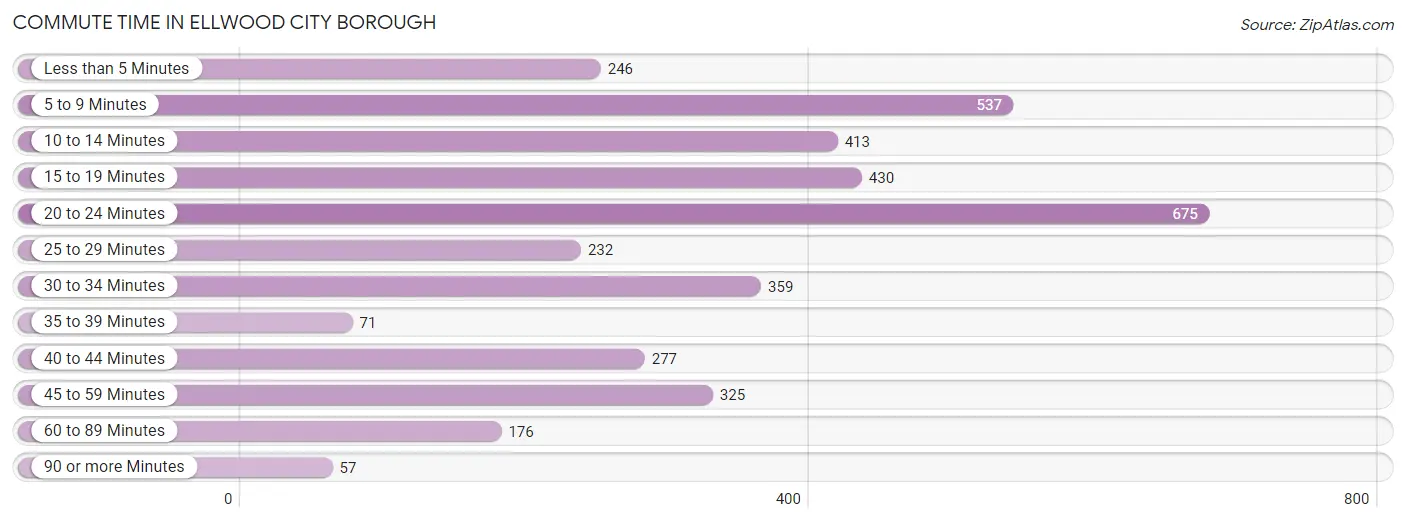
| Commute Time | # Commuters | % Commuters |
| Less than 5 Minutes | 246 | 6.5% |
| 5 to 9 Minutes | 537 | 14.1% |
| 10 to 14 Minutes | 413 | 10.9% |
| 15 to 19 Minutes | 430 | 11.3% |
| 20 to 24 Minutes | 675 | 17.8% |
| 25 to 29 Minutes | 232 | 6.1% |
| 30 to 34 Minutes | 359 | 9.5% |
| 35 to 39 Minutes | 71 | 1.9% |
| 40 to 44 Minutes | 277 | 7.3% |
| 45 to 59 Minutes | 325 | 8.6% |
| 60 to 89 Minutes | 176 | 4.6% |
| 90 or more Minutes | 57 | 1.5% |
Commute Time by Sex in Ellwood City borough
The most common commute times in Ellwood City borough are 20 to 24 minutes (361 commuters, 18.3%) for males and 5 to 9 minutes (328 commuters, 17.9%) for females.
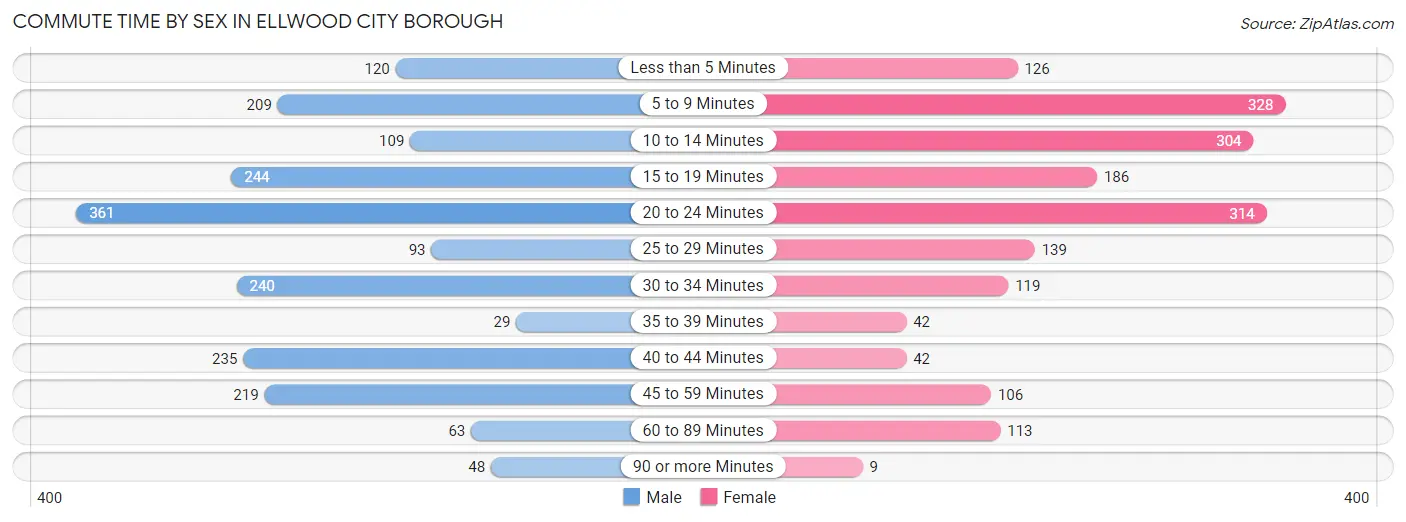
| Commute Time | Male | Female |
| Less than 5 Minutes | 120 (6.1%) | 126 (6.9%) |
| 5 to 9 Minutes | 209 (10.6%) | 328 (17.9%) |
| 10 to 14 Minutes | 109 (5.5%) | 304 (16.6%) |
| 15 to 19 Minutes | 244 (12.4%) | 186 (10.2%) |
| 20 to 24 Minutes | 361 (18.3%) | 314 (17.2%) |
| 25 to 29 Minutes | 93 (4.7%) | 139 (7.6%) |
| 30 to 34 Minutes | 240 (12.2%) | 119 (6.5%) |
| 35 to 39 Minutes | 29 (1.5%) | 42 (2.3%) |
| 40 to 44 Minutes | 235 (11.9%) | 42 (2.3%) |
| 45 to 59 Minutes | 219 (11.1%) | 106 (5.8%) |
| 60 to 89 Minutes | 63 (3.2%) | 113 (6.2%) |
| 90 or more Minutes | 48 (2.4%) | 9 (0.5%) |
Time of Departure to Work by Sex in Ellwood City borough
The most frequent times of departure to work in Ellwood City borough are 6:00 AM to 6:29 AM (339, 17.2%) for males and 8:00 AM to 8:29 AM (319, 17.4%) for females.
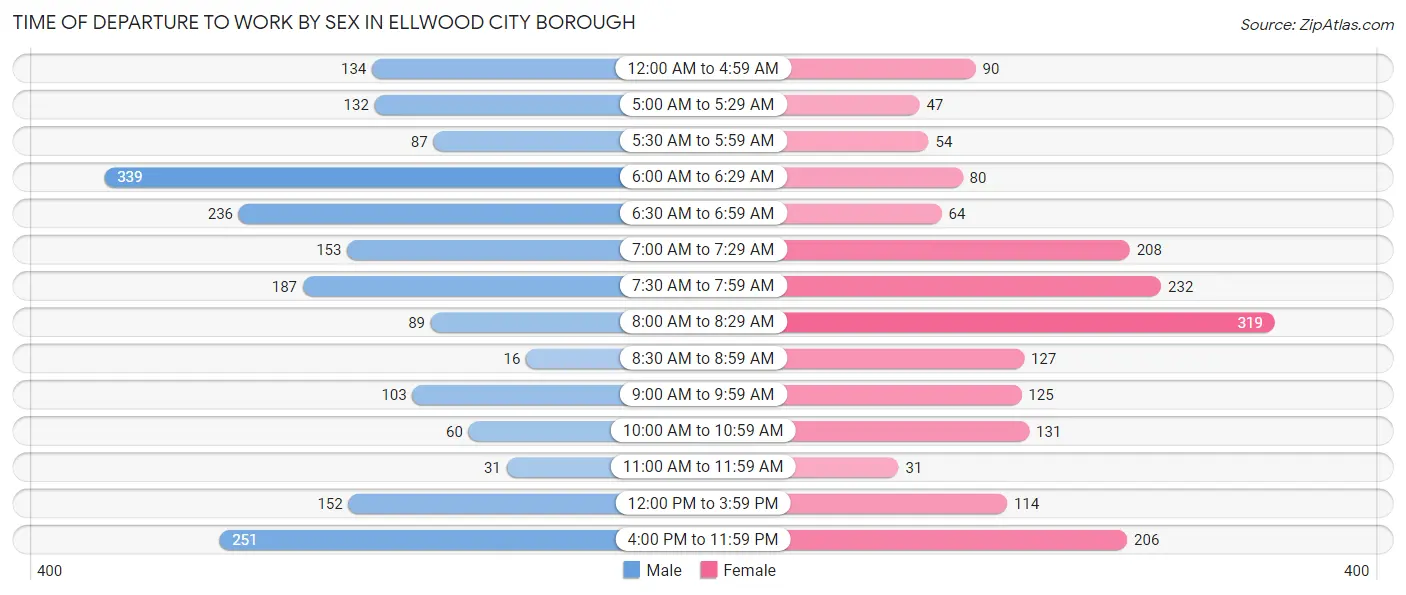
| Time of Departure | Male | Female |
| 12:00 AM to 4:59 AM | 134 (6.8%) | 90 (4.9%) |
| 5:00 AM to 5:29 AM | 132 (6.7%) | 47 (2.6%) |
| 5:30 AM to 5:59 AM | 87 (4.4%) | 54 (2.9%) |
| 6:00 AM to 6:29 AM | 339 (17.2%) | 80 (4.4%) |
| 6:30 AM to 6:59 AM | 236 (12.0%) | 64 (3.5%) |
| 7:00 AM to 7:29 AM | 153 (7.8%) | 208 (11.4%) |
| 7:30 AM to 7:59 AM | 187 (9.5%) | 232 (12.7%) |
| 8:00 AM to 8:29 AM | 89 (4.5%) | 319 (17.4%) |
| 8:30 AM to 8:59 AM | 16 (0.8%) | 127 (7.0%) |
| 9:00 AM to 9:59 AM | 103 (5.2%) | 125 (6.8%) |
| 10:00 AM to 10:59 AM | 60 (3.0%) | 131 (7.2%) |
| 11:00 AM to 11:59 AM | 31 (1.6%) | 31 (1.7%) |
| 12:00 PM to 3:59 PM | 152 (7.7%) | 114 (6.2%) |
| 4:00 PM to 11:59 PM | 251 (12.7%) | 206 (11.3%) |
| Total | 1,970 (100.0%) | 1,828 (100.0%) |
Housing Occupancy in Ellwood City borough
Occupancy by Ownership in Ellwood City borough
Of the total 3,749 dwellings in Ellwood City borough, owner-occupied units account for 2,615 (69.8%), while renter-occupied units make up 1,134 (30.2%).
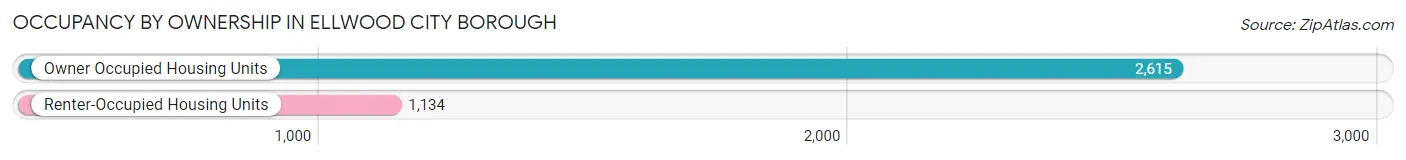
| Occupancy | # Housing Units | % Housing Units |
| Owner Occupied Housing Units | 2,615 | 69.8% |
| Renter-Occupied Housing Units | 1,134 | 30.2% |
| Total Occupied Housing Units | 3,749 | 100.0% |
Occupancy by Household Size in Ellwood City borough
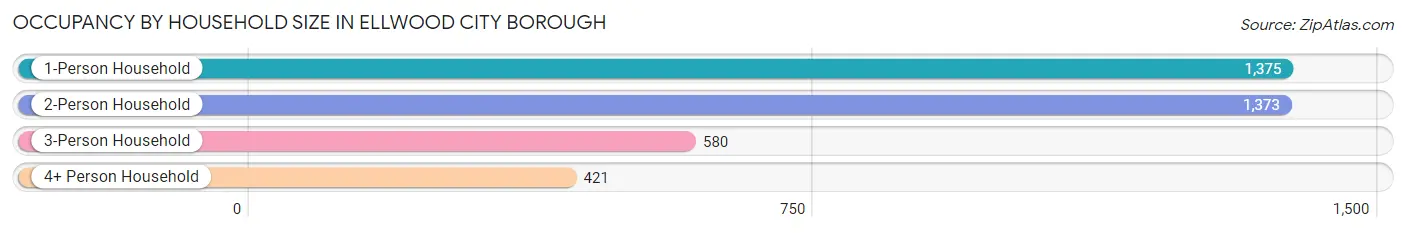
| Household Size | # Housing Units | % Housing Units |
| 1-Person Household | 1,375 | 36.7% |
| 2-Person Household | 1,373 | 36.6% |
| 3-Person Household | 580 | 15.5% |
| 4+ Person Household | 421 | 11.2% |
| Total Housing Units | 3,749 | 100.0% |
Occupancy by Ownership by Household Size in Ellwood City borough
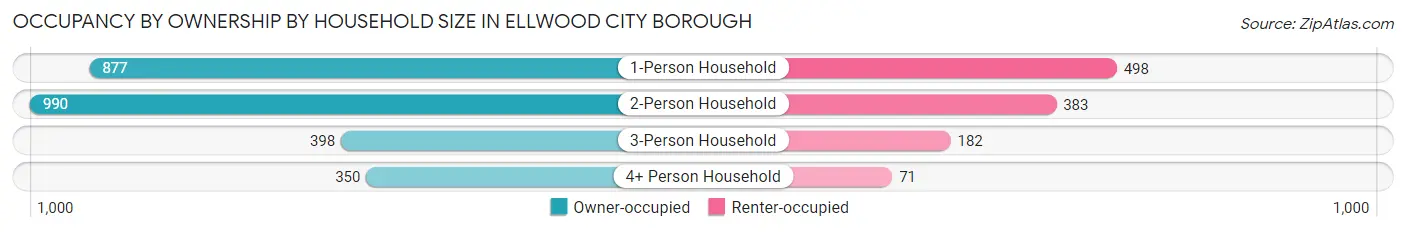
| Household Size | Owner-occupied | Renter-occupied |
| 1-Person Household | 877 (63.8%) | 498 (36.2%) |
| 2-Person Household | 990 (72.1%) | 383 (27.9%) |
| 3-Person Household | 398 (68.6%) | 182 (31.4%) |
| 4+ Person Household | 350 (83.1%) | 71 (16.9%) |
| Total Housing Units | 2,615 (69.8%) | 1,134 (30.2%) |
Occupancy by Educational Attainment in Ellwood City borough
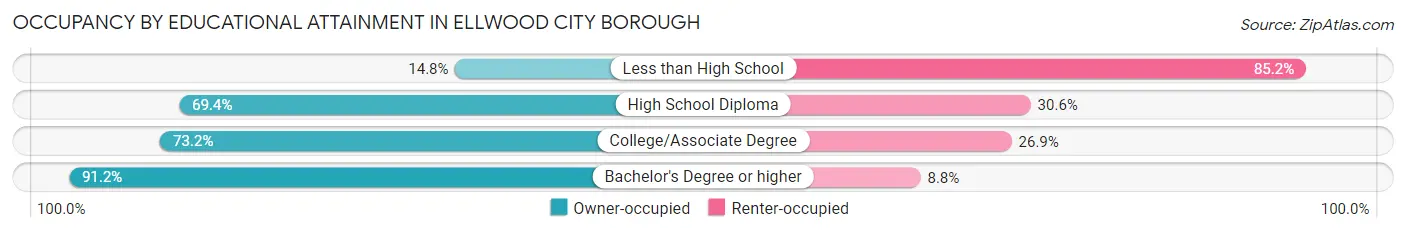
| Household Size | Owner-occupied | Renter-occupied |
| Less than High School | 54 (14.8%) | 311 (85.2%) |
| High School Diploma | 1,026 (69.4%) | 453 (30.6%) |
| College/Associate Degree | 820 (73.2%) | 301 (26.9%) |
| Bachelor's Degree or higher | 715 (91.2%) | 69 (8.8%) |
Occupancy by Age of Householder in Ellwood City borough
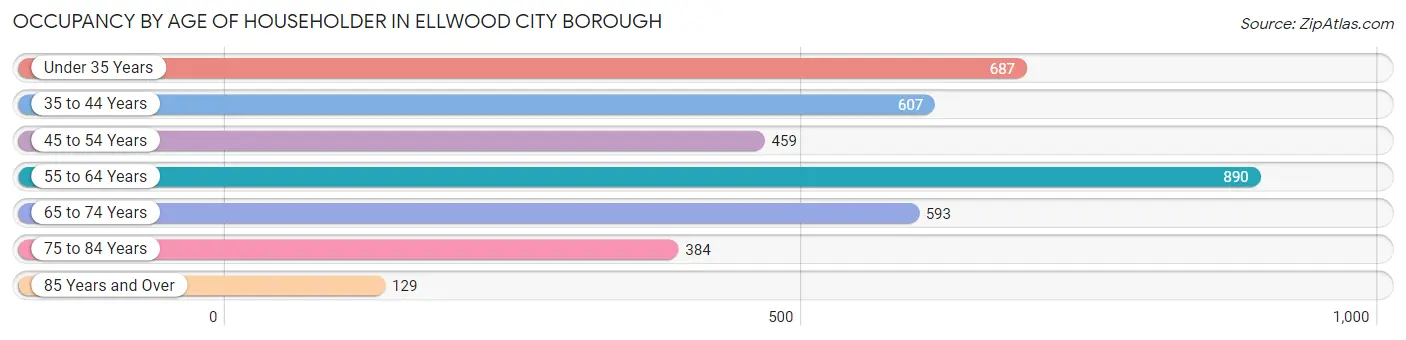
| Age Bracket | # Households | % Households |
| Under 35 Years | 687 | 18.3% |
| 35 to 44 Years | 607 | 16.2% |
| 45 to 54 Years | 459 | 12.2% |
| 55 to 64 Years | 890 | 23.7% |
| 65 to 74 Years | 593 | 15.8% |
| 75 to 84 Years | 384 | 10.2% |
| 85 Years and Over | 129 | 3.4% |
| Total | 3,749 | 100.0% |
Housing Finances in Ellwood City borough
Median Income by Occupancy in Ellwood City borough
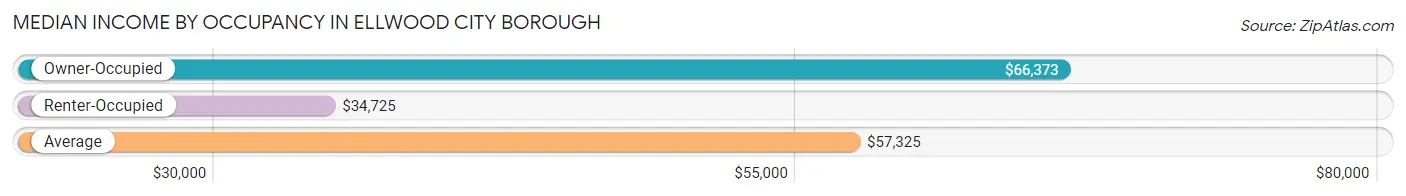
| Occupancy Type | # Households | Median Income |
| Owner-Occupied | 2,615 (69.8%) | $66,373 |
| Renter-Occupied | 1,134 (30.2%) | $34,725 |
| Average | 3,749 (100.0%) | $57,325 |
Occupancy by Householder Income Bracket in Ellwood City borough
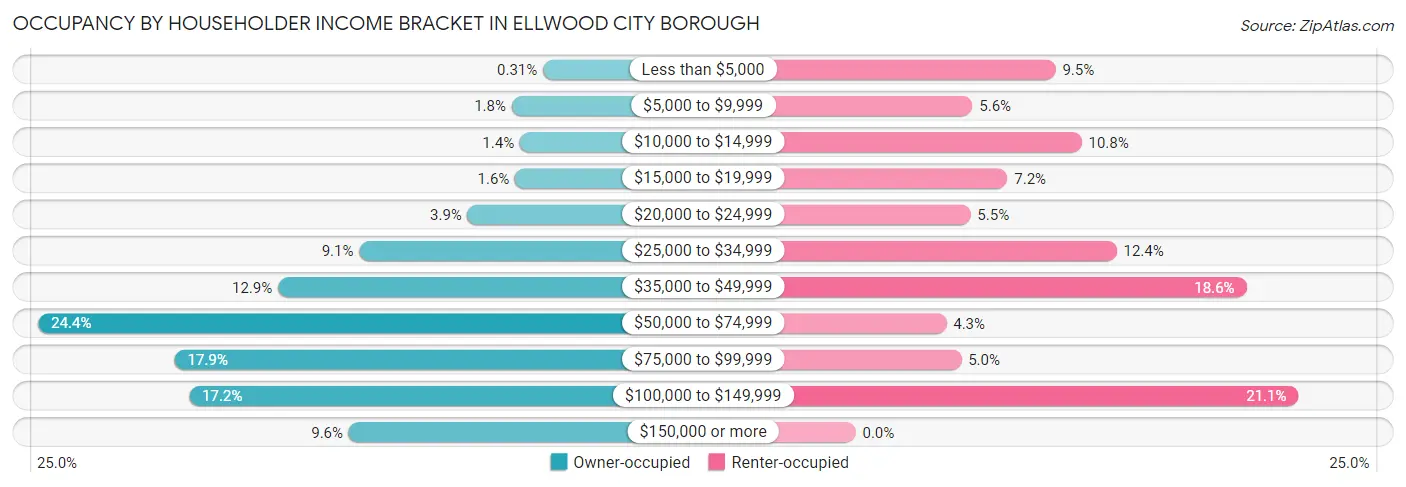
| Income Bracket | Owner-occupied | Renter-occupied |
| Less than $5,000 | 8 (0.3%) | 108 (9.5%) |
| $5,000 to $9,999 | 47 (1.8%) | 63 (5.6%) |
| $10,000 to $14,999 | 37 (1.4%) | 122 (10.8%) |
| $15,000 to $19,999 | 43 (1.6%) | 82 (7.2%) |
| $20,000 to $24,999 | 102 (3.9%) | 62 (5.5%) |
| $25,000 to $34,999 | 237 (9.1%) | 141 (12.4%) |
| $35,000 to $49,999 | 338 (12.9%) | 211 (18.6%) |
| $50,000 to $74,999 | 637 (24.4%) | 49 (4.3%) |
| $75,000 to $99,999 | 467 (17.9%) | 57 (5.0%) |
| $100,000 to $149,999 | 449 (17.2%) | 239 (21.1%) |
| $150,000 or more | 250 (9.6%) | 0 (0.0%) |
| Total | 2,615 (100.0%) | 1,134 (100.0%) |
Monthly Housing Cost Tiers in Ellwood City borough
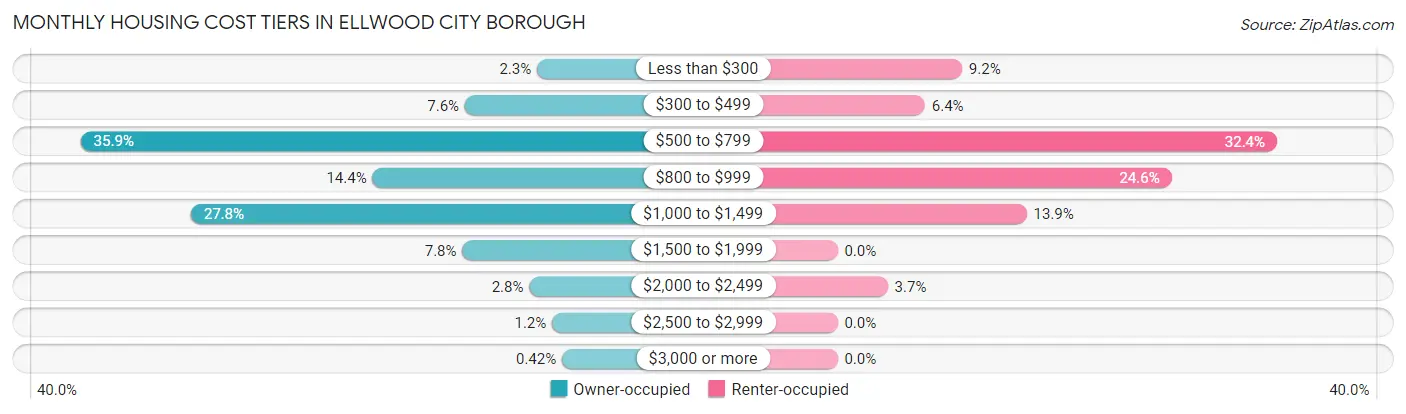
| Monthly Cost | Owner-occupied | Renter-occupied |
| Less than $300 | 59 (2.3%) | 104 (9.2%) |
| $300 to $499 | 198 (7.6%) | 73 (6.4%) |
| $500 to $799 | 938 (35.9%) | 367 (32.4%) |
| $800 to $999 | 376 (14.4%) | 279 (24.6%) |
| $1,000 to $1,499 | 726 (27.8%) | 158 (13.9%) |
| $1,500 to $1,999 | 203 (7.8%) | 0 (0.0%) |
| $2,000 to $2,499 | 74 (2.8%) | 42 (3.7%) |
| $2,500 to $2,999 | 30 (1.1%) | 0 (0.0%) |
| $3,000 or more | 11 (0.4%) | 0 (0.0%) |
| Total | 2,615 (100.0%) | 1,134 (100.0%) |
Physical Housing Characteristics in Ellwood City borough
Housing Structures in Ellwood City borough
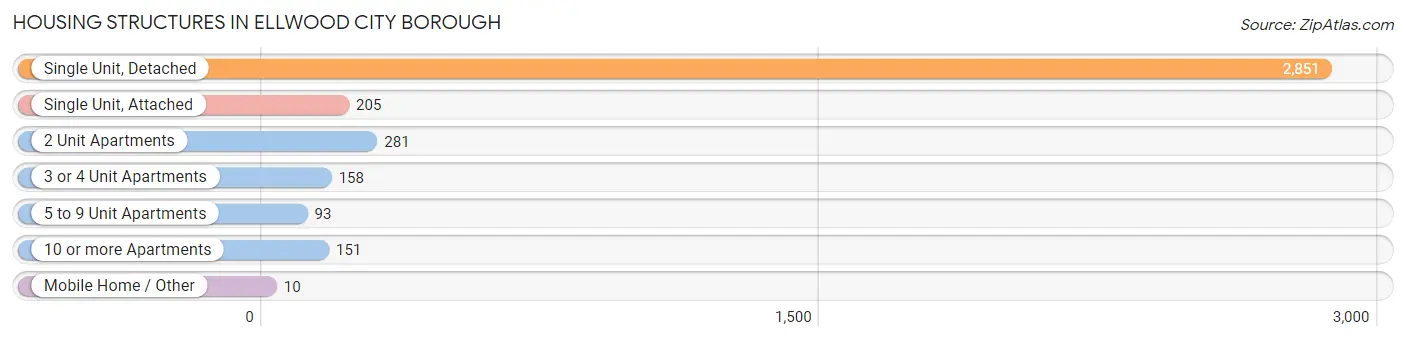
| Structure Type | # Housing Units | % Housing Units |
| Single Unit, Detached | 2,851 | 76.0% |
| Single Unit, Attached | 205 | 5.5% |
| 2 Unit Apartments | 281 | 7.5% |
| 3 or 4 Unit Apartments | 158 | 4.2% |
| 5 to 9 Unit Apartments | 93 | 2.5% |
| 10 or more Apartments | 151 | 4.0% |
| Mobile Home / Other | 10 | 0.3% |
| Total | 3,749 | 100.0% |
Housing Structures by Occupancy in Ellwood City borough
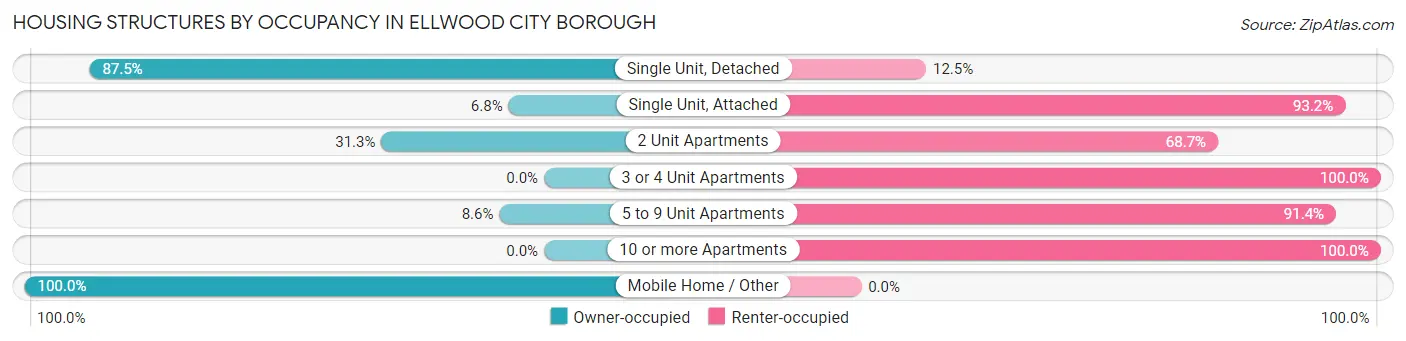
| Structure Type | Owner-occupied | Renter-occupied |
| Single Unit, Detached | 2,495 (87.5%) | 356 (12.5%) |
| Single Unit, Attached | 14 (6.8%) | 191 (93.2%) |
| 2 Unit Apartments | 88 (31.3%) | 193 (68.7%) |
| 3 or 4 Unit Apartments | 0 (0.0%) | 158 (100.0%) |
| 5 to 9 Unit Apartments | 8 (8.6%) | 85 (91.4%) |
| 10 or more Apartments | 0 (0.0%) | 151 (100.0%) |
| Mobile Home / Other | 10 (100.0%) | 0 (0.0%) |
| Total | 2,615 (69.8%) | 1,134 (30.2%) |
Housing Structures by Number of Rooms in Ellwood City borough
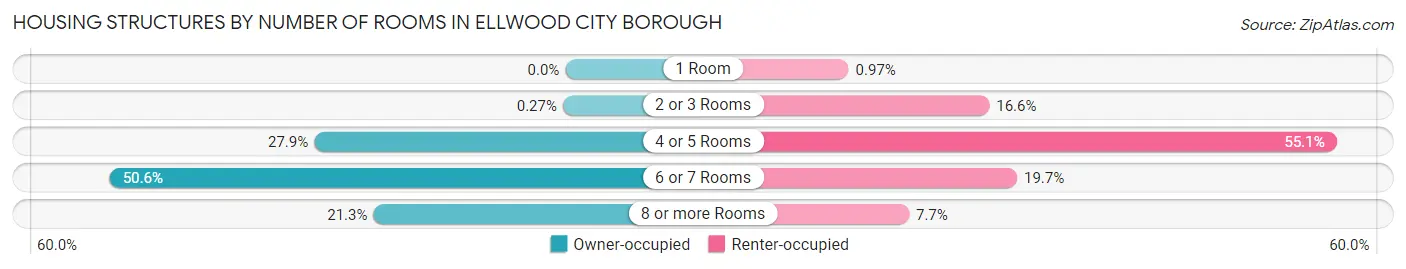
| Number of Rooms | Owner-occupied | Renter-occupied |
| 1 Room | 0 (0.0%) | 11 (1.0%) |
| 2 or 3 Rooms | 7 (0.3%) | 188 (16.6%) |
| 4 or 5 Rooms | 729 (27.9%) | 625 (55.1%) |
| 6 or 7 Rooms | 1,322 (50.5%) | 223 (19.7%) |
| 8 or more Rooms | 557 (21.3%) | 87 (7.7%) |
| Total | 2,615 (100.0%) | 1,134 (100.0%) |
Housing Structure by Heating Type in Ellwood City borough
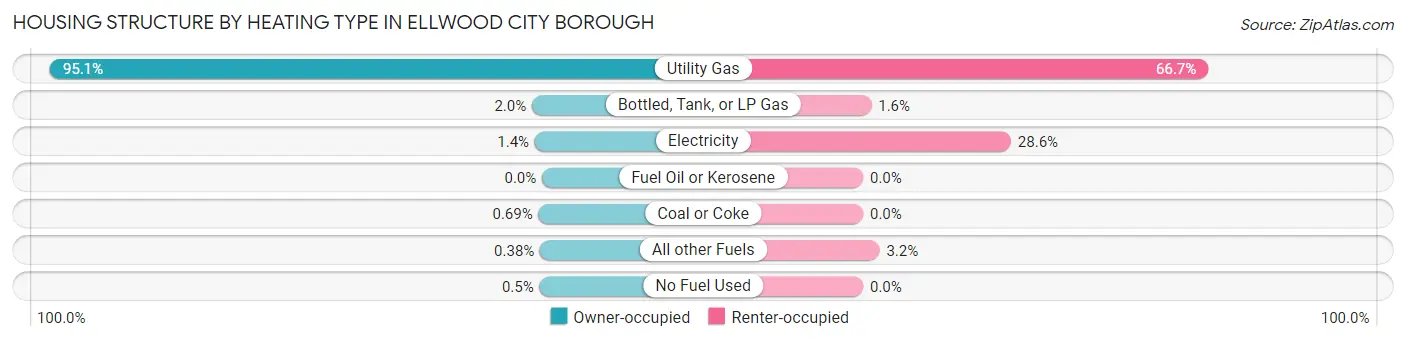
| Heating Type | Owner-occupied | Renter-occupied |
| Utility Gas | 2,487 (95.1%) | 756 (66.7%) |
| Bottled, Tank, or LP Gas | 51 (1.9%) | 18 (1.6%) |
| Electricity | 36 (1.4%) | 324 (28.6%) |
| Fuel Oil or Kerosene | 0 (0.0%) | 0 (0.0%) |
| Coal or Coke | 18 (0.7%) | 0 (0.0%) |
| All other Fuels | 10 (0.4%) | 36 (3.2%) |
| No Fuel Used | 13 (0.5%) | 0 (0.0%) |
| Total | 2,615 (100.0%) | 1,134 (100.0%) |
Household Vehicle Usage in Ellwood City borough
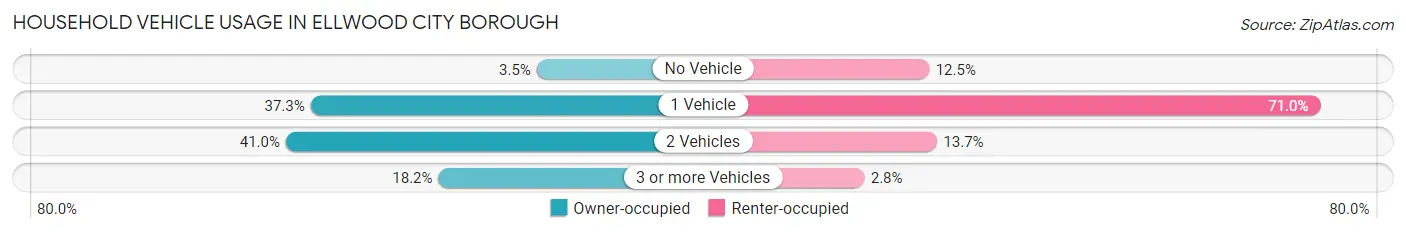
| Vehicles per Household | Owner-occupied | Renter-occupied |
| No Vehicle | 92 (3.5%) | 142 (12.5%) |
| 1 Vehicle | 975 (37.3%) | 805 (71.0%) |
| 2 Vehicles | 1,072 (41.0%) | 155 (13.7%) |
| 3 or more Vehicles | 476 (18.2%) | 32 (2.8%) |
| Total | 2,615 (100.0%) | 1,134 (100.0%) |
Real Estate & Mortgages in Ellwood City borough
Real Estate and Mortgage Overview in Ellwood City borough
| Characteristic | Without Mortgage | With Mortgage |
| Housing Units | 1,044 | 1,571 |
| Median Property Value | $110,000 | $125,100 |
| Median Household Income | $51,964 | $200 |
| Monthly Housing Costs | $576 | $11 |
| Real Estate Taxes | $2,111 | $28 |
Property Value by Mortgage Status in Ellwood City borough
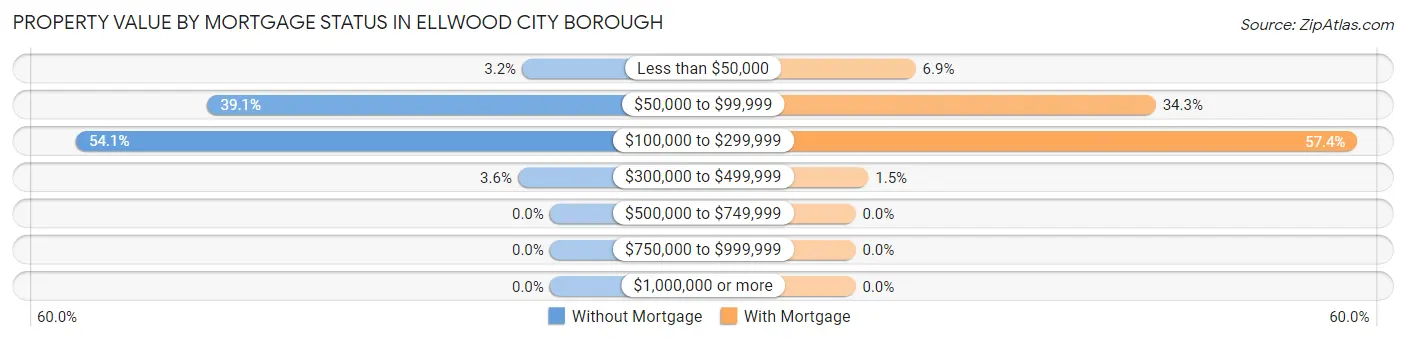
| Property Value | Without Mortgage | With Mortgage |
| Less than $50,000 | 33 (3.2%) | 108 (6.9%) |
| $50,000 to $99,999 | 408 (39.1%) | 539 (34.3%) |
| $100,000 to $299,999 | 565 (54.1%) | 901 (57.4%) |
| $300,000 to $499,999 | 38 (3.6%) | 23 (1.5%) |
| $500,000 to $749,999 | 0 (0.0%) | 0 (0.0%) |
| $750,000 to $999,999 | 0 (0.0%) | 0 (0.0%) |
| $1,000,000 or more | 0 (0.0%) | 0 (0.0%) |
| Total | 1,044 (100.0%) | 1,571 (100.0%) |
Household Income by Mortgage Status in Ellwood City borough
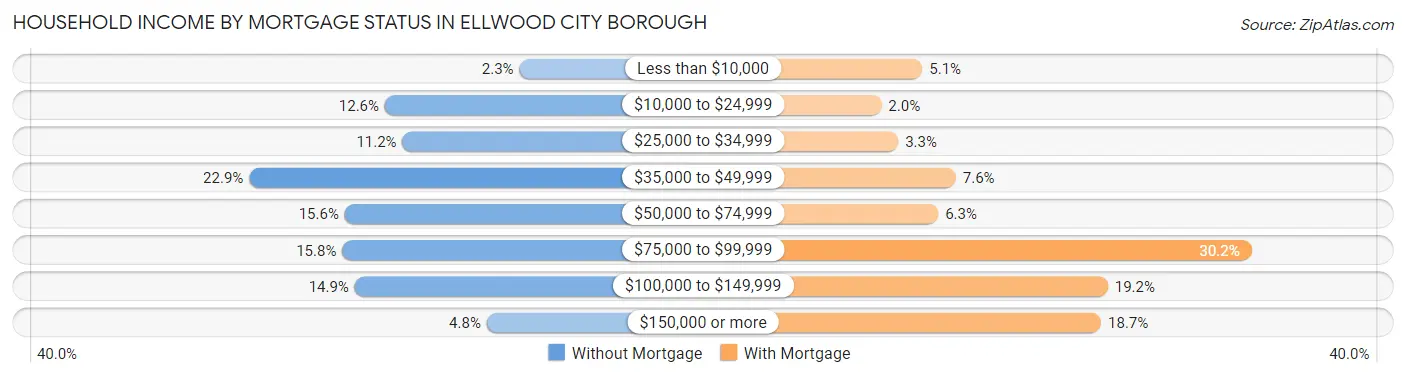
| Household Income | Without Mortgage | With Mortgage |
| Less than $10,000 | 24 (2.3%) | 80 (5.1%) |
| $10,000 to $24,999 | 131 (12.6%) | 31 (2.0%) |
| $25,000 to $34,999 | 117 (11.2%) | 51 (3.3%) |
| $35,000 to $49,999 | 239 (22.9%) | 120 (7.6%) |
| $50,000 to $74,999 | 163 (15.6%) | 99 (6.3%) |
| $75,000 to $99,999 | 165 (15.8%) | 474 (30.2%) |
| $100,000 to $149,999 | 155 (14.8%) | 302 (19.2%) |
| $150,000 or more | 50 (4.8%) | 294 (18.7%) |
| Total | 1,044 (100.0%) | 1,571 (100.0%) |
Property Value to Household Income Ratio in Ellwood City borough
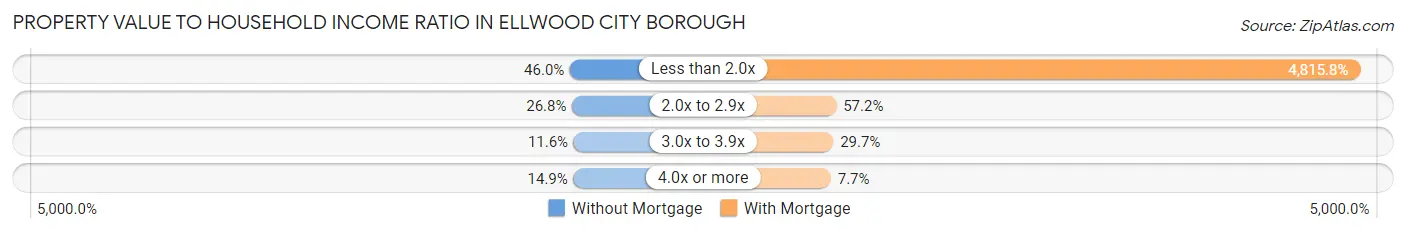
| Value-to-Income Ratio | Without Mortgage | With Mortgage |
| Less than 2.0x | 480 (46.0%) | 75,656 (4,815.8%) |
| 2.0x to 2.9x | 280 (26.8%) | 898 (57.2%) |
| 3.0x to 3.9x | 121 (11.6%) | 467 (29.7%) |
| 4.0x or more | 155 (14.8%) | 121 (7.7%) |
| Total | 1,044 (100.0%) | 1,571 (100.0%) |
Real Estate Taxes by Mortgage Status in Ellwood City borough
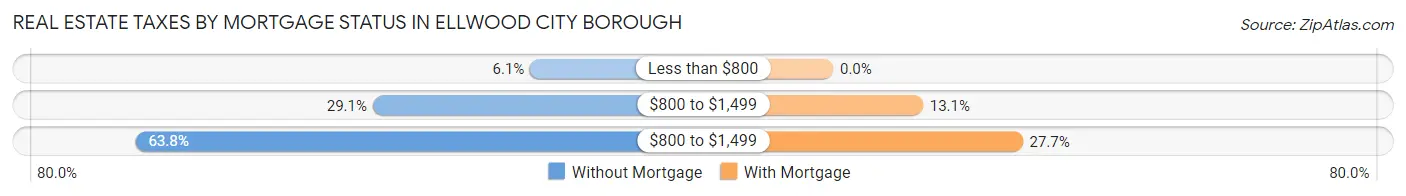
| Property Taxes | Without Mortgage | With Mortgage |
| Less than $800 | 64 (6.1%) | 0 (0.0%) |
| $800 to $1,499 | 304 (29.1%) | 206 (13.1%) |
| $800 to $1,499 | 666 (63.8%) | 435 (27.7%) |
| Total | 1,044 (100.0%) | 1,571 (100.0%) |
Health & Disability in Ellwood City borough
Health Insurance Coverage by Age in Ellwood City borough
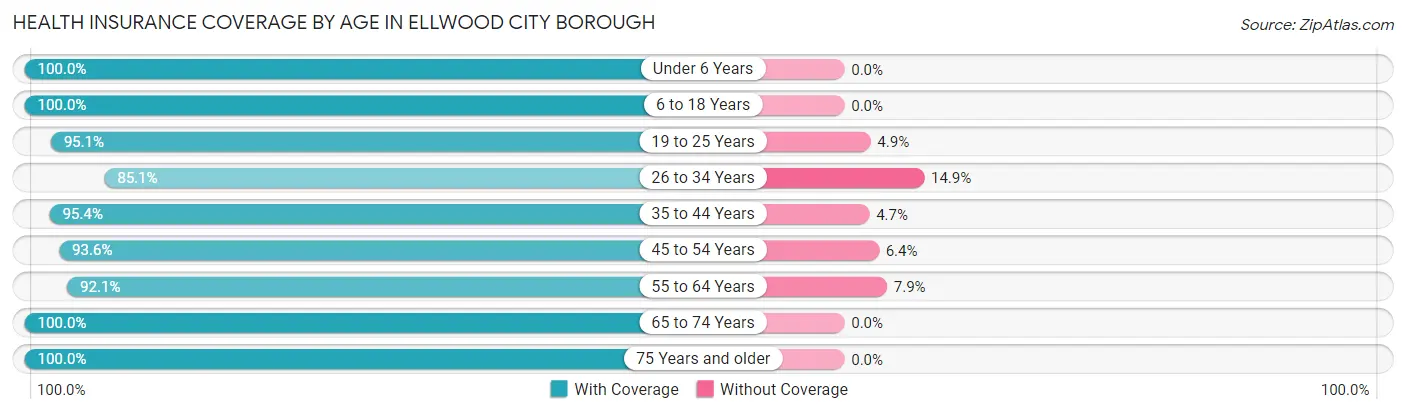
| Age Bracket | With Coverage | Without Coverage |
| Under 6 Years | 433 (100.0%) | 0 (0.0%) |
| 6 to 18 Years | 999 (100.0%) | 0 (0.0%) |
| 19 to 25 Years | 606 (95.1%) | 31 (4.9%) |
| 26 to 34 Years | 744 (85.1%) | 130 (14.9%) |
| 35 to 44 Years | 840 (95.4%) | 41 (4.6%) |
| 45 to 54 Years | 845 (93.6%) | 58 (6.4%) |
| 55 to 64 Years | 1,240 (92.1%) | 107 (7.9%) |
| 65 to 74 Years | 895 (100.0%) | 0 (0.0%) |
| 75 Years and older | 681 (100.0%) | 0 (0.0%) |
| Total | 7,283 (95.2%) | 367 (4.8%) |
Health Insurance Coverage by Citizenship Status in Ellwood City borough
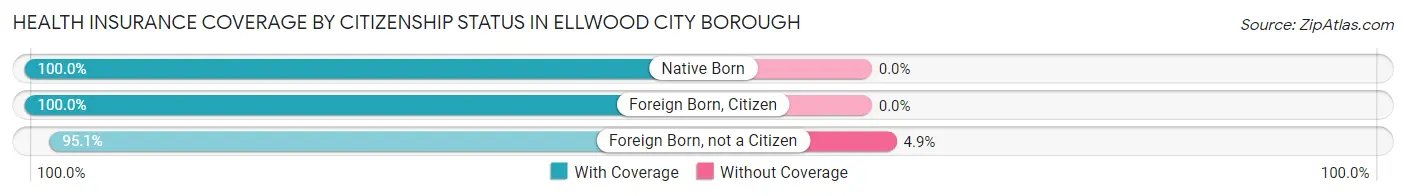
| Citizenship Status | With Coverage | Without Coverage |
| Native Born | 433 (100.0%) | 0 (0.0%) |
| Foreign Born, Citizen | 999 (100.0%) | 0 (0.0%) |
| Foreign Born, not a Citizen | 606 (95.1%) | 31 (4.9%) |
Health Insurance Coverage by Household Income in Ellwood City borough
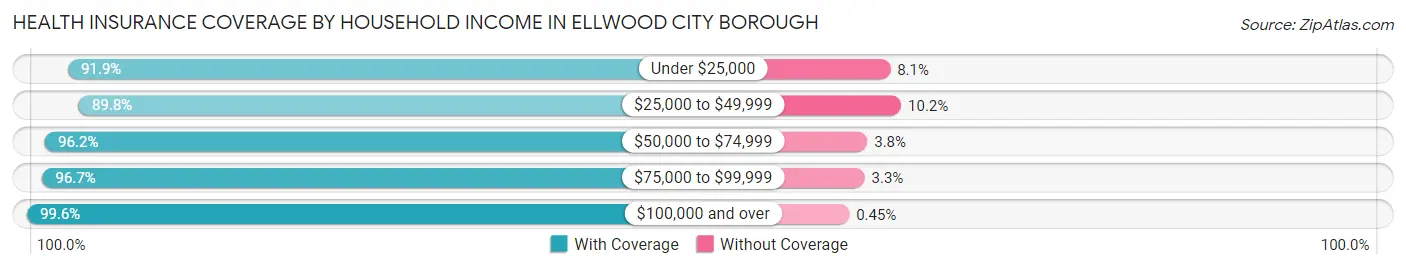
| Household Income | With Coverage | Without Coverage |
| Under $25,000 | 949 (91.9%) | 84 (8.1%) |
| $25,000 to $49,999 | 1,561 (89.8%) | 177 (10.2%) |
| $50,000 to $74,999 | 1,354 (96.2%) | 54 (3.8%) |
| $75,000 to $99,999 | 1,215 (96.7%) | 42 (3.3%) |
| $100,000 and over | 2,194 (99.6%) | 10 (0.4%) |
Public vs Private Health Insurance Coverage by Age in Ellwood City borough
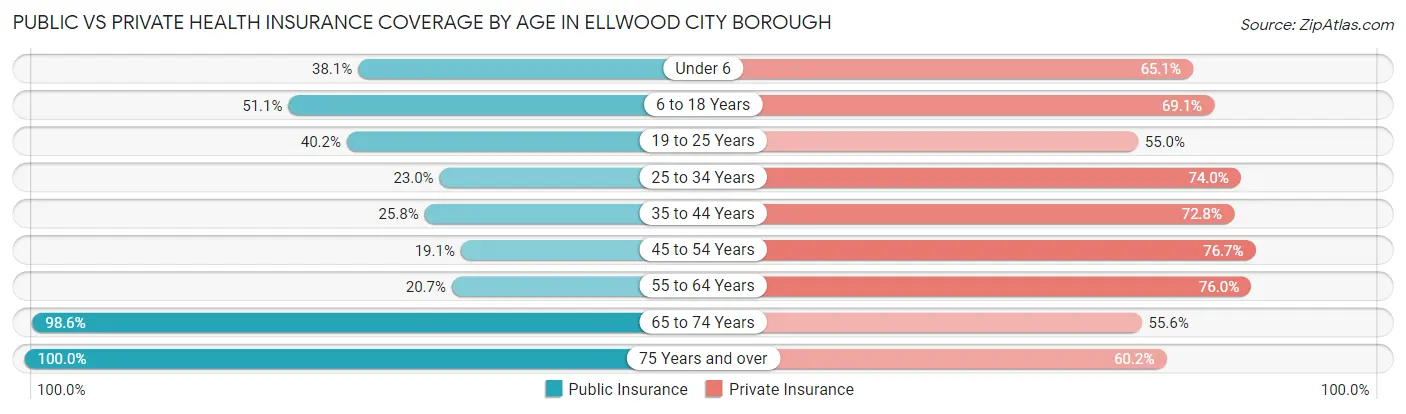
| Age Bracket | Public Insurance | Private Insurance |
| Under 6 | 165 (38.1%) | 282 (65.1%) |
| 6 to 18 Years | 510 (51.0%) | 690 (69.1%) |
| 19 to 25 Years | 256 (40.2%) | 350 (54.9%) |
| 25 to 34 Years | 201 (23.0%) | 647 (74.0%) |
| 35 to 44 Years | 227 (25.8%) | 641 (72.8%) |
| 45 to 54 Years | 172 (19.1%) | 693 (76.7%) |
| 55 to 64 Years | 279 (20.7%) | 1,023 (75.9%) |
| 65 to 74 Years | 882 (98.6%) | 498 (55.6%) |
| 75 Years and over | 681 (100.0%) | 410 (60.2%) |
| Total | 3,373 (44.1%) | 5,234 (68.4%) |
Disability Status by Sex by Age in Ellwood City borough
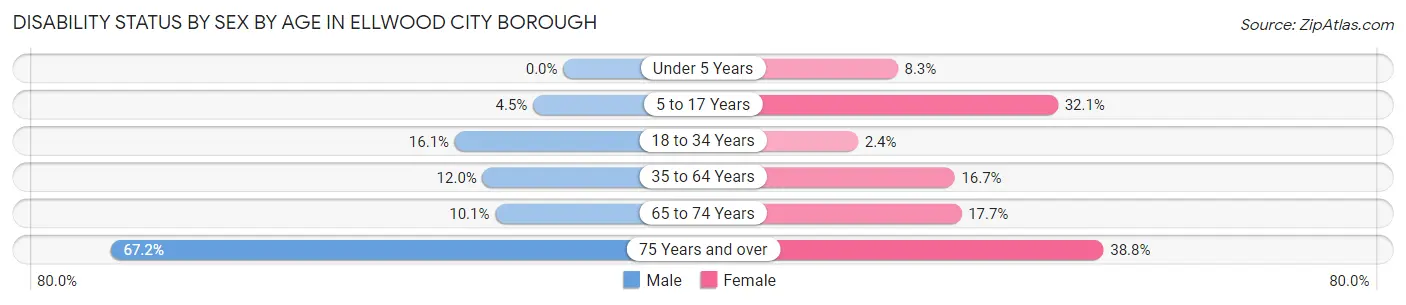
| Age Bracket | Male | Female |
| Under 5 Years | 0 (0.0%) | 12 (8.3%) |
| 5 to 17 Years | 27 (4.5%) | 126 (32.1%) |
| 18 to 34 Years | 143 (16.1%) | 17 (2.4%) |
| 35 to 64 Years | 189 (12.0%) | 260 (16.7%) |
| 65 to 74 Years | 30 (10.1%) | 106 (17.7%) |
| 75 Years and over | 160 (67.2%) | 172 (38.8%) |
Disability Class by Sex by Age in Ellwood City borough
Disability Class: Hearing Difficulty
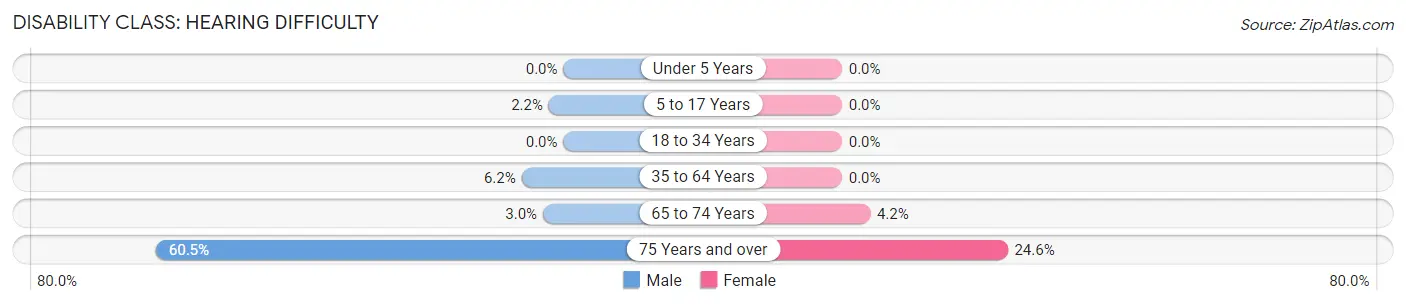
| Age Bracket | Male | Female |
| Under 5 Years | 0 (0.0%) | 0 (0.0%) |
| 5 to 17 Years | 13 (2.2%) | 0 (0.0%) |
| 18 to 34 Years | 0 (0.0%) | 0 (0.0%) |
| 35 to 64 Years | 98 (6.2%) | 0 (0.0%) |
| 65 to 74 Years | 9 (3.0%) | 25 (4.2%) |
| 75 Years and over | 144 (60.5%) | 109 (24.6%) |
Disability Class: Vision Difficulty
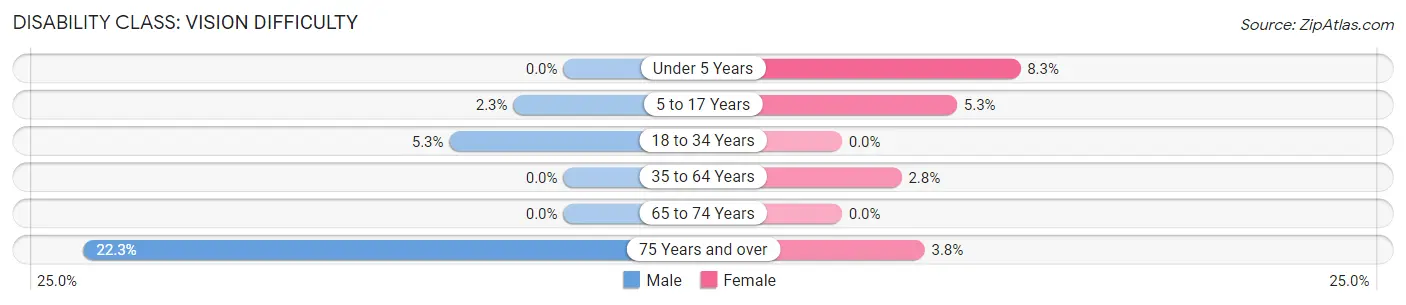
| Age Bracket | Male | Female |
| Under 5 Years | 0 (0.0%) | 12 (8.3%) |
| 5 to 17 Years | 14 (2.3%) | 21 (5.3%) |
| 18 to 34 Years | 47 (5.3%) | 0 (0.0%) |
| 35 to 64 Years | 0 (0.0%) | 43 (2.8%) |
| 65 to 74 Years | 0 (0.0%) | 0 (0.0%) |
| 75 Years and over | 53 (22.3%) | 17 (3.8%) |
Disability Class: Cognitive Difficulty
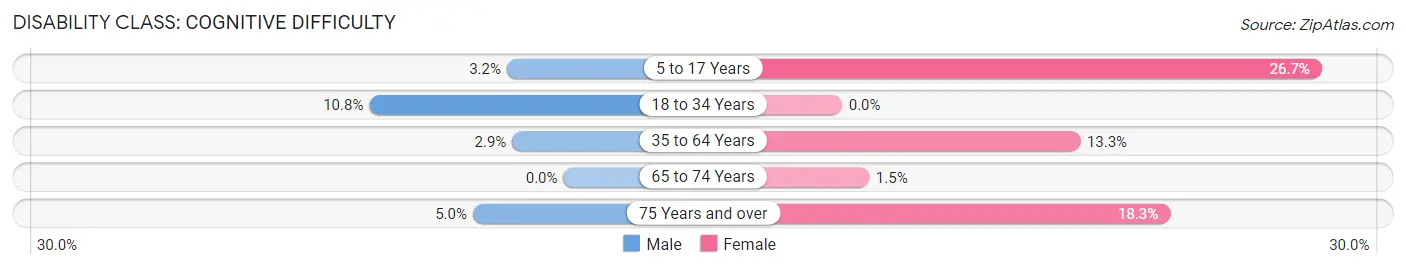
| Age Bracket | Male | Female |
| 5 to 17 Years | 19 (3.2%) | 105 (26.7%) |
| 18 to 34 Years | 96 (10.8%) | 0 (0.0%) |
| 35 to 64 Years | 45 (2.9%) | 206 (13.3%) |
| 65 to 74 Years | 0 (0.0%) | 9 (1.5%) |
| 75 Years and over | 12 (5.0%) | 81 (18.3%) |
Disability Class: Ambulatory Difficulty
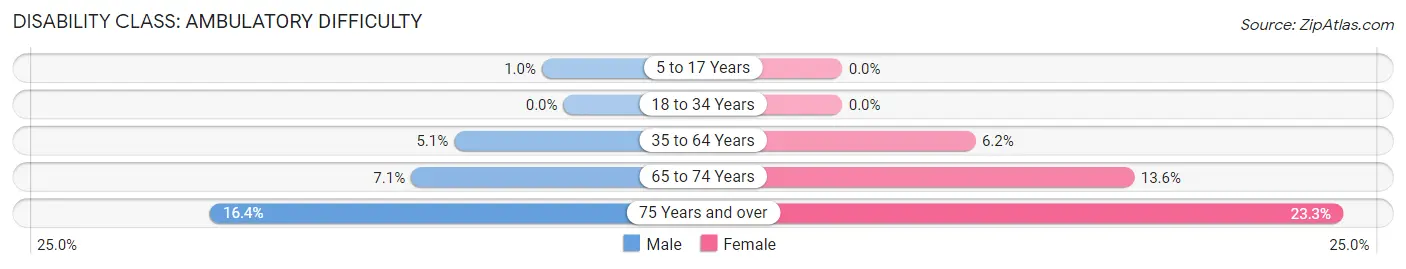
| Age Bracket | Male | Female |
| 5 to 17 Years | 6 (1.0%) | 0 (0.0%) |
| 18 to 34 Years | 0 (0.0%) | 0 (0.0%) |
| 35 to 64 Years | 80 (5.1%) | 96 (6.2%) |
| 65 to 74 Years | 21 (7.1%) | 81 (13.6%) |
| 75 Years and over | 39 (16.4%) | 103 (23.3%) |
Disability Class: Self-Care Difficulty
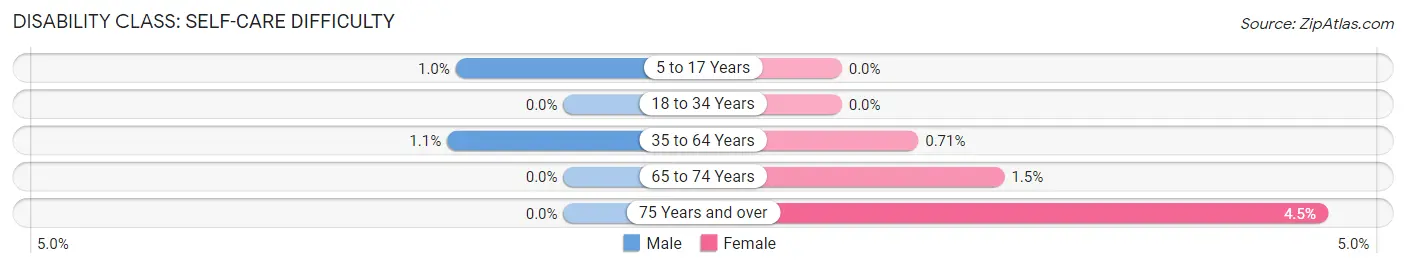
| Age Bracket | Male | Female |
| 5 to 17 Years | 6 (1.0%) | 0 (0.0%) |
| 18 to 34 Years | 0 (0.0%) | 0 (0.0%) |
| 35 to 64 Years | 17 (1.1%) | 11 (0.7%) |
| 65 to 74 Years | 0 (0.0%) | 9 (1.5%) |
| 75 Years and over | 0 (0.0%) | 20 (4.5%) |
Technology Access in Ellwood City borough
Computing Device Access in Ellwood City borough
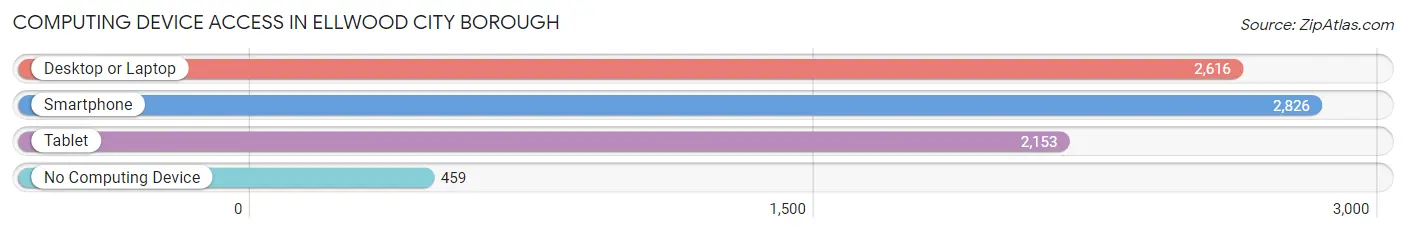
| Device Type | # Households | % Households |
| Desktop or Laptop | 2,616 | 69.8% |
| Smartphone | 2,826 | 75.4% |
| Tablet | 2,153 | 57.4% |
| No Computing Device | 459 | 12.2% |
| Total | 3,749 | 100.0% |
Internet Access in Ellwood City borough
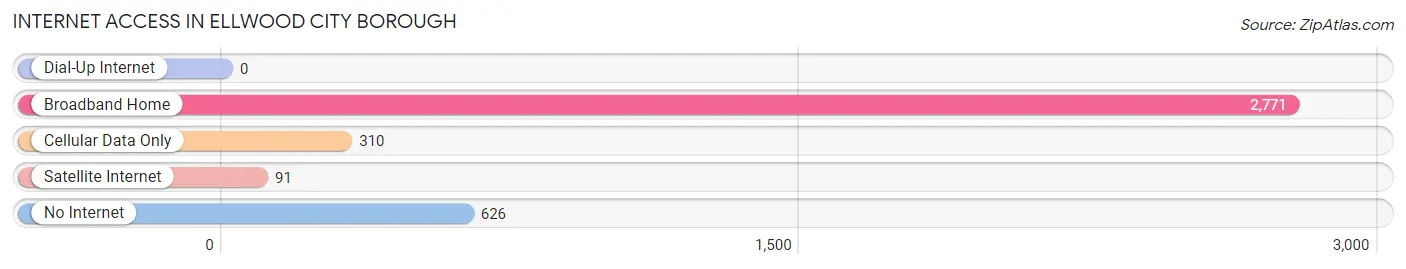
| Internet Type | # Households | % Households |
| Dial-Up Internet | 0 | 0.0% |
| Broadband Home | 2,771 | 73.9% |
| Cellular Data Only | 310 | 8.3% |
| Satellite Internet | 91 | 2.4% |
| No Internet | 626 | 16.7% |
| Total | 3,749 | 100.0% |
Ellwood City borough Summary
Ellwood City Borough is a small borough located in Lawrence County, Pennsylvania. It is situated along the banks of the Connoquenessing Creek, approximately 25 miles northwest of Pittsburgh. The borough is home to a population of approximately 8,000 people, and is the largest municipality in Lawrence County.
History
The area that is now Ellwood City Borough was first settled in the late 1700s by a group of settlers from New Jersey. The settlers were attracted to the area due to its abundance of natural resources, including timber and coal. The first permanent settlement was established in 1802, and the area was officially incorporated as a borough in 1891.
The borough was named after Colonel Ebenezer Ellwood, a prominent local businessman and landowner. Ellwood was a major contributor to the development of the area, and was instrumental in the construction of the first bridge across the Connoquenessing Creek.
Geography
Ellwood City Borough is located in western Pennsylvania, approximately 25 miles northwest of Pittsburgh. The borough is situated along the banks of the Connoquenessing Creek, and is bordered by North Sewickley Township to the north, Wayne Township to the east, and Perry Township to the south. The borough covers an area of approximately 2.5 square miles, and is home to a population of approximately 8,000 people.
The borough is located in a region of rolling hills and valleys, and is characterized by a humid continental climate. The average annual temperature is approximately 50 degrees Fahrenheit, and the average annual precipitation is approximately 40 inches.
Economy
The economy of Ellwood City Borough is largely based on manufacturing and retail. The borough is home to several manufacturing companies, including Ellwood National Forge, which produces steel forgings for the automotive and aerospace industries. Other major employers in the borough include Ellwood City Hospital, Ellwood City Medical Center, and Ellwood City Area School District.
The borough is also home to several retail establishments, including several restaurants, grocery stores, and specialty shops. The borough is also home to several small businesses, including a number of professional services firms.
Demographics
As of the 2010 census, the population of Ellwood City Borough was 8,313. The racial makeup of the borough was 95.3% White, 1.3% African American, 0.3% Native American, 0.7% Asian, 0.1% Pacific Islander, and 1.3% from other races. Hispanic or Latino of any race were 2.2% of the population.
The median household income in Ellwood City Borough was $37,917, and the median family income was $45,938. The per capita income for the borough was $19,945. Approximately 11.3% of the population was below the poverty line.
Ellwood City Borough is served by the Ellwood City Area School District, which consists of four elementary schools, one middle school, and one high school. The borough is also home to several churches, including the First United Methodist Church, the First Presbyterian Church, and the First Baptist Church.
Common Questions
What is Per Capita Income in Ellwood City borough?
Per Capita income in Ellwood City borough is $33,696.
What is the Median Family Income in Ellwood City borough?
Median Family Income in Ellwood City borough is $73,636.
What is the Median Household income in Ellwood City borough?
Median Household Income in Ellwood City borough is $57,325.
What is Income or Wage Gap in Ellwood City borough?
Income or Wage Gap in Ellwood City borough is 27.0%.
Women in Ellwood City borough earn 73.0 cents for every dollar earned by a man.
What is Inequality or Gini Index in Ellwood City borough?
Inequality or Gini Index in Ellwood City borough is 0.38.
What is the Total Population of Ellwood City borough?
Total Population of Ellwood City borough is 7,684.
What is the Total Male Population of Ellwood City borough?
Total Male Population of Ellwood City borough is 3,810.
What is the Total Female Population of Ellwood City borough?
Total Female Population of Ellwood City borough is 3,874.
What is the Ratio of Males per 100 Females in Ellwood City borough?
There are 98.35 Males per 100 Females in Ellwood City borough.
What is the Ratio of Females per 100 Males in Ellwood City borough?
There are 101.68 Females per 100 Males in Ellwood City borough.
What is the Median Population Age in Ellwood City borough?
Median Population Age in Ellwood City borough is 45.4 Years.
What is the Average Family Size in Ellwood City borough
Average Family Size in Ellwood City borough is 2.6 People.
What is the Average Household Size in Ellwood City borough
Average Household Size in Ellwood City borough is 2.0 People.
How Large is the Labor Force in Ellwood City borough?
There are 4,503 People in the Labor Forcein in Ellwood City borough.
What is the Percentage of People in the Labor Force in Ellwood City borough?
69.4% of People are in the Labor Force in Ellwood City borough.
What is the Unemployment Rate in Ellwood City borough?
Unemployment Rate in Ellwood City borough is 5.3%.