Economy borough, PA Map & Demographics
Economy borough Overview
$48,979
PER CAPITA INCOME
$107,083
AVG FAMILY INCOME
$86,983
AVG HOUSEHOLD INCOME
30.0%
WAGE / INCOME GAP [ % ]
70.0¢/ $1
WAGE / INCOME GAP [ $ ]
0.42
INEQUALITY / GINI INDEX
9,063
TOTAL POPULATION
4,493
MALE POPULATION
4,570
FEMALE POPULATION
98.32
MALES / 100 FEMALES
101.71
FEMALES / 100 MALES
50.9
MEDIAN AGE
2.8
AVG FAMILY SIZE
2.4
AVG HOUSEHOLD SIZE
4,858
LABOR FORCE [ PEOPLE ]
62.0%
PERCENT IN LABOR FORCE
3.3%
UNEMPLOYMENT RATE
Income in Economy borough
Income Overview in Economy borough
Per Capita Income in Economy borough is $48,979, while median incomes of families and households are $107,083 and $86,983 respectively.
| Characteristic | Number | Measure |
| Per Capita Income | 9,063 | $48,979 |
| Median Family Income | 2,717 | $107,083 |
| Mean Family Income | 2,717 | $134,404 |
| Median Household Income | 3,750 | $86,983 |
| Mean Household Income | 3,750 | $116,638 |
| Income Deficit | 2,717 | $0 |
| Wage / Income Gap (%) | 9,063 | 29.97% |
| Wage / Income Gap ($) | 9,063 | 70.03¢ per $1 |
| Gini / Inequality Index | 9,063 | 0.42 |
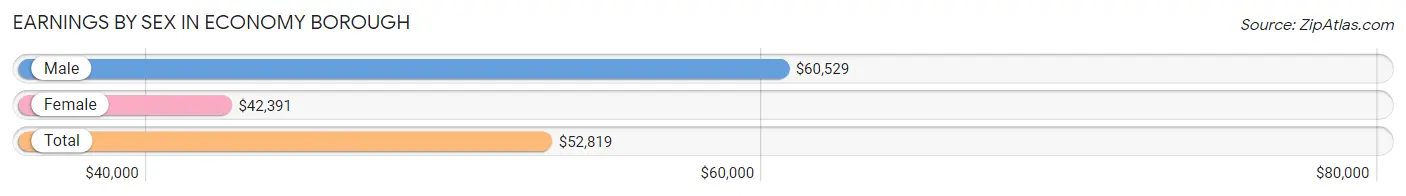
Earnings by Sex in Economy borough
Average Earnings in Economy borough are $52,819, $60,529 for men and $42,391 for women, a difference of 30.0%.
| Sex | Number | Average Earnings |
| Male | 2,744 (54.7%) | $60,529 |
| Female | 2,276 (45.3%) | $42,391 |
| Total | 5,020 (100.0%) | $52,819 |
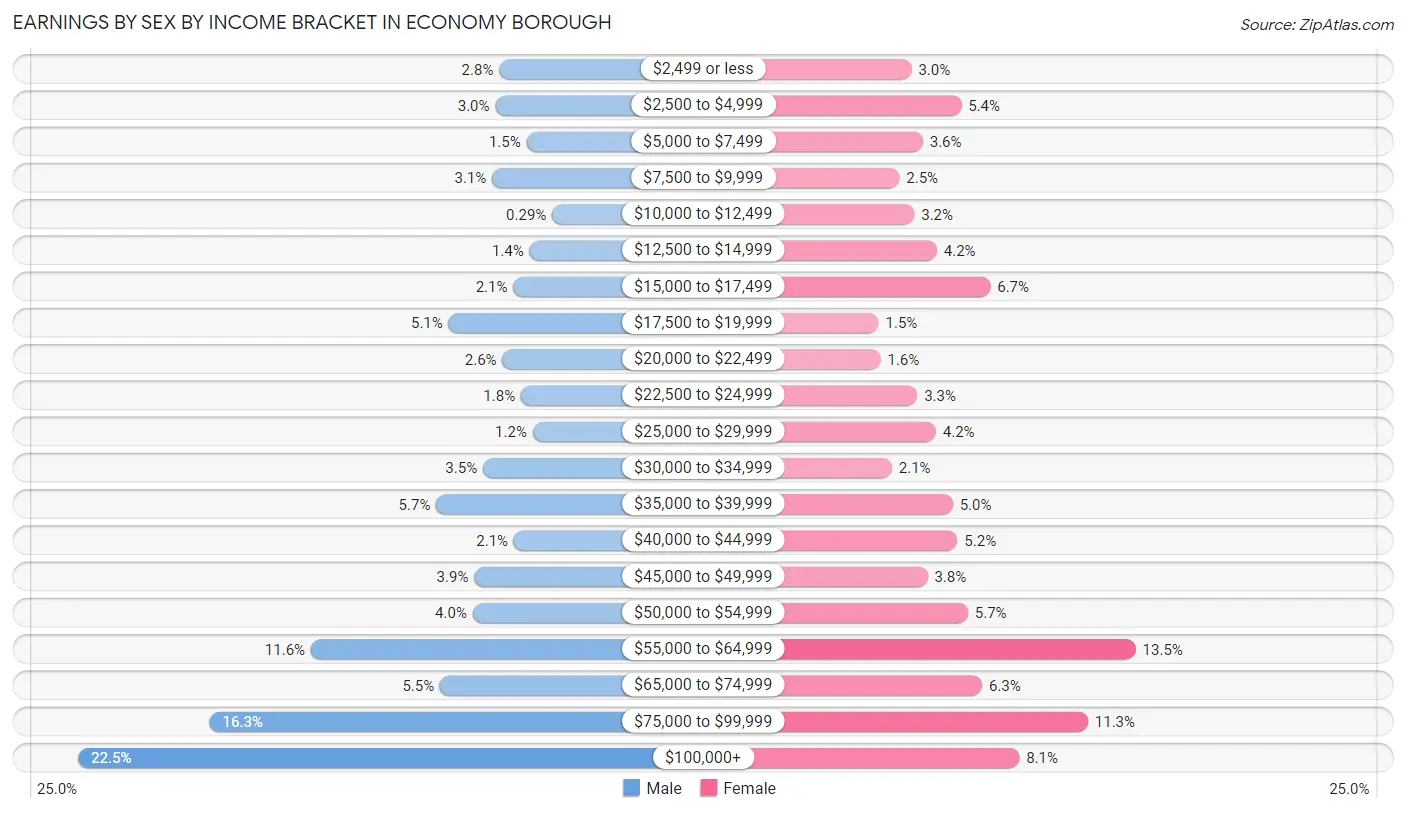
Earnings by Sex by Income Bracket in Economy borough
The most common earnings brackets in Economy borough are $100,000+ for men (617 | 22.5%) and $55,000 to $64,999 for women (308 | 13.5%).
| Income | Male | Female |
| $2,499 or less | 76 (2.8%) | 69 (3.0%) |
| $2,500 to $4,999 | 81 (2.9%) | 122 (5.4%) |
| $5,000 to $7,499 | 41 (1.5%) | 81 (3.6%) |
| $7,500 to $9,999 | 85 (3.1%) | 56 (2.5%) |
| $10,000 to $12,499 | 8 (0.3%) | 72 (3.2%) |
| $12,500 to $14,999 | 37 (1.3%) | 96 (4.2%) |
| $15,000 to $17,499 | 58 (2.1%) | 153 (6.7%) |
| $17,500 to $19,999 | 141 (5.1%) | 34 (1.5%) |
| $20,000 to $22,499 | 72 (2.6%) | 36 (1.6%) |
| $22,500 to $24,999 | 48 (1.8%) | 75 (3.3%) |
| $25,000 to $29,999 | 33 (1.2%) | 95 (4.2%) |
| $30,000 to $34,999 | 97 (3.5%) | 48 (2.1%) |
| $35,000 to $39,999 | 157 (5.7%) | 113 (5.0%) |
| $40,000 to $44,999 | 57 (2.1%) | 118 (5.2%) |
| $45,000 to $49,999 | 108 (3.9%) | 86 (3.8%) |
| $50,000 to $54,999 | 110 (4.0%) | 129 (5.7%) |
| $55,000 to $64,999 | 318 (11.6%) | 308 (13.5%) |
| $65,000 to $74,999 | 152 (5.5%) | 144 (6.3%) |
| $75,000 to $99,999 | 448 (16.3%) | 257 (11.3%) |
| $100,000+ | 617 (22.5%) | 184 (8.1%) |
| Total | 2,744 (100.0%) | 2,276 (100.0%) |
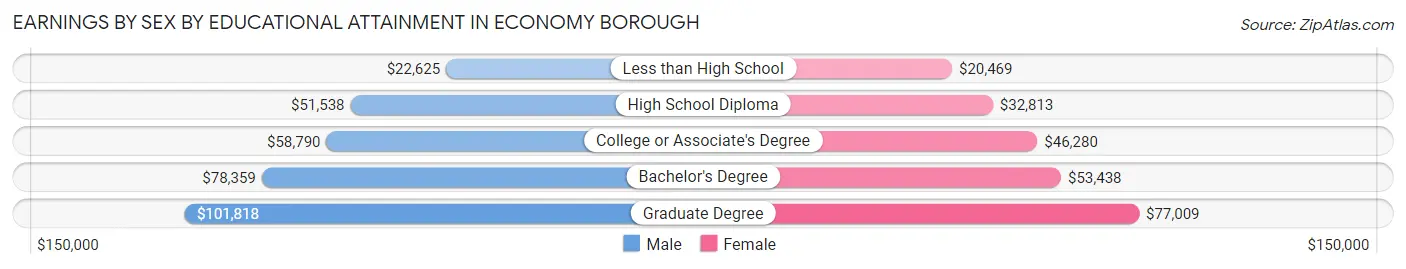
Earnings by Sex by Educational Attainment in Economy borough
Average earnings in Economy borough are $63,509 for men and $48,526 for women, a difference of 23.6%. Men with an educational attainment of graduate degree enjoy the highest average annual earnings of $101,818, while those with less than high school education earn the least with $22,625. Women with an educational attainment of graduate degree earn the most with the average annual earnings of $77,009, while those with less than high school education have the smallest earnings of $20,469.
| Educational Attainment | Male Income | Female Income |
| Less than High School | $22,625 | $20,469 |
| High School Diploma | $51,538 | $32,813 |
| College or Associate's Degree | $58,790 | $46,280 |
| Bachelor's Degree | $78,359 | $53,438 |
| Graduate Degree | $101,818 | $77,009 |
| Total | $63,509 | $48,526 |
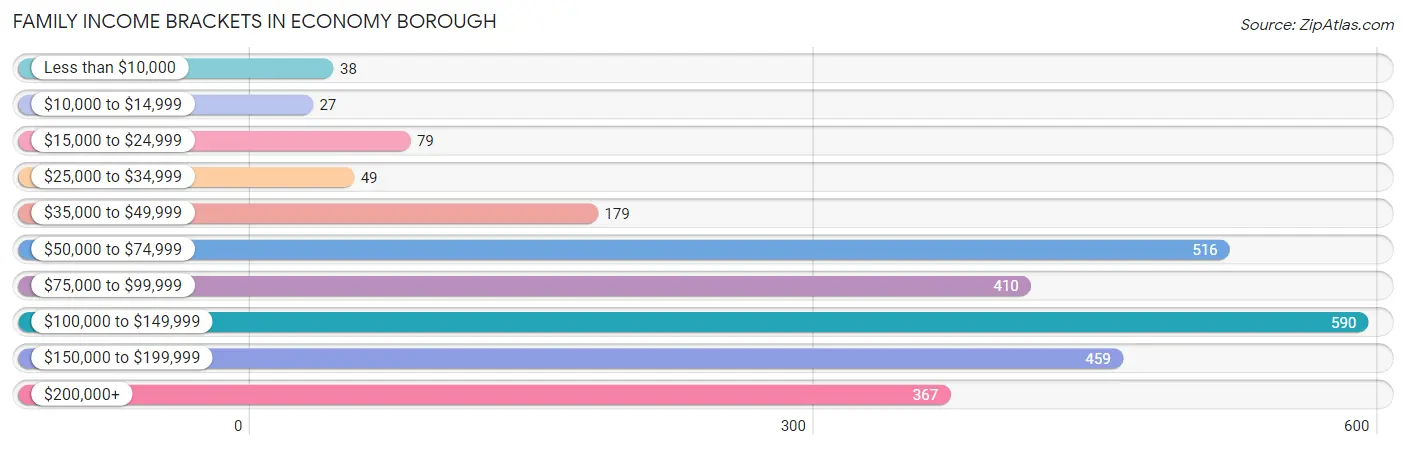
Family Income in Economy borough
Family Income Brackets in Economy borough
According to the Economy borough family income data, there are 590 families falling into the $100,000 to $149,999 income range, which is the most common income bracket and makes up 21.7% of all families. Conversely, the $10,000 to $14,999 income bracket is the least frequent group with only 27 families (1.0%) belonging to this category.
| Income Bracket | # Families | % Families |
| Less than $10,000 | 38 | 1.4% |
| $10,000 to $14,999 | 27 | 1.0% |
| $15,000 to $24,999 | 79 | 2.9% |
| $25,000 to $34,999 | 49 | 1.8% |
| $35,000 to $49,999 | 179 | 6.6% |
| $50,000 to $74,999 | 516 | 19.0% |
| $75,000 to $99,999 | 410 | 15.1% |
| $100,000 to $149,999 | 590 | 21.7% |
| $150,000 to $199,999 | 459 | 16.9% |
| $200,000+ | 367 | 13.5% |
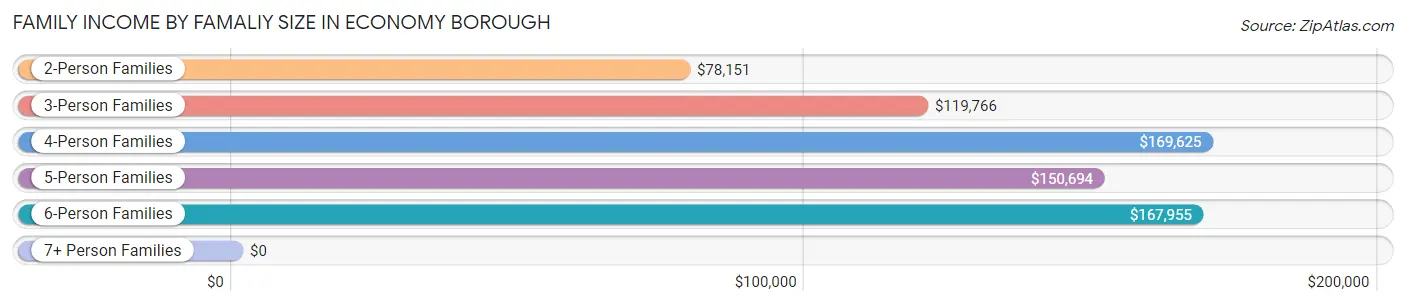
Family Income by Famaliy Size in Economy borough
4-person families (397 | 14.6%) account for the highest median family income in Economy borough with $169,625 per family, while 4-person families (397 | 14.6%) have the highest median income of $42,406 per family member.
| Income Bracket | # Families | Median Income |
| 2-Person Families | 1,575 (58.0%) | $78,151 |
| 3-Person Families | 565 (20.8%) | $119,766 |
| 4-Person Families | 397 (14.6%) | $169,625 |
| 5-Person Families | 125 (4.6%) | $150,694 |
| 6-Person Families | 42 (1.5%) | $167,955 |
| 7+ Person Families | 13 (0.5%) | $0 |
| Total | 2,717 (100.0%) | $107,083 |
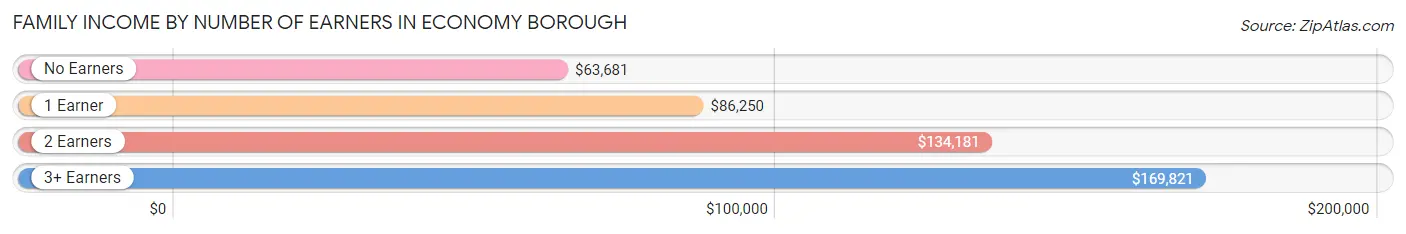
Family Income by Number of Earners in Economy borough
The median family income in Economy borough is $107,083, with families comprising 3+ earners (267) having the highest median family income of $169,821, while families with no earners (654) have the lowest median family income of $63,681, accounting for 9.8% and 24.1% of families, respectively.
| Number of Earners | # Families | Median Income |
| No Earners | 654 (24.1%) | $63,681 |
| 1 Earner | 623 (22.9%) | $86,250 |
| 2 Earners | 1,173 (43.2%) | $134,181 |
| 3+ Earners | 267 (9.8%) | $169,821 |
| Total | 2,717 (100.0%) | $107,083 |
Household Income in Economy borough
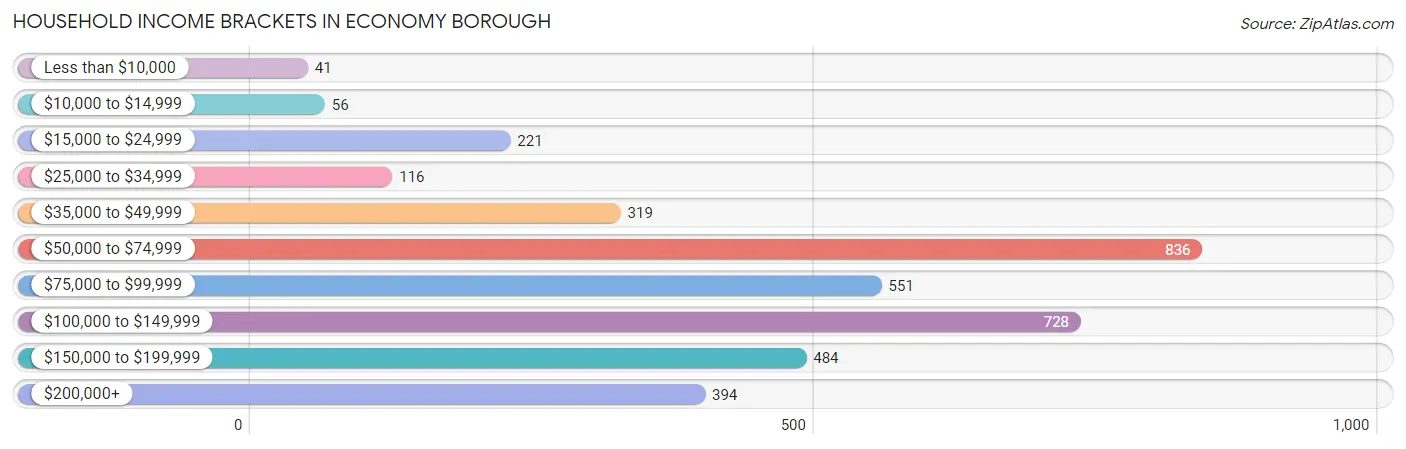
Household Income Brackets in Economy borough
With 836 households falling in the category, the $50,000 to $74,999 income range is the most frequent in Economy borough, accounting for 22.3% of all households. In contrast, only 41 households (1.1%) fall into the less than $10,000 income bracket, making it the least populous group.
| Income Bracket | # Households | % Households |
| Less than $10,000 | 41 | 1.1% |
| $10,000 to $14,999 | 56 | 1.5% |
| $15,000 to $24,999 | 221 | 5.9% |
| $25,000 to $34,999 | 116 | 3.1% |
| $35,000 to $49,999 | 319 | 8.5% |
| $50,000 to $74,999 | 836 | 22.3% |
| $75,000 to $99,999 | 551 | 14.7% |
| $100,000 to $149,999 | 728 | 19.4% |
| $150,000 to $199,999 | 484 | 12.9% |
| $200,000+ | 394 | 10.5% |
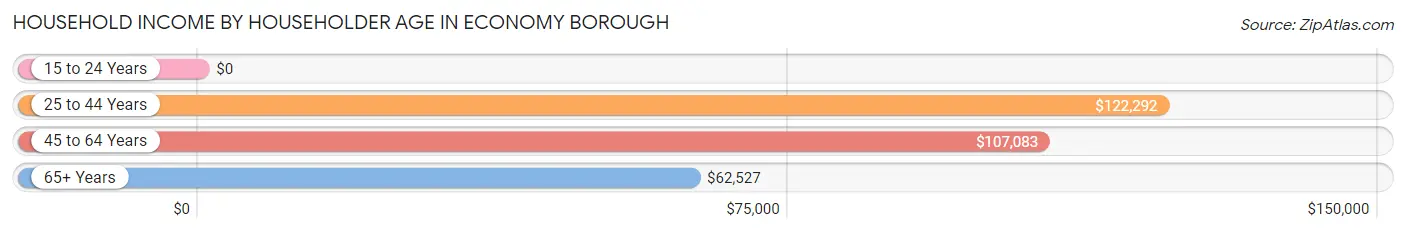
Household Income by Householder Age in Economy borough
The median household income in Economy borough is $86,983, with the highest median household income of $122,292 found in the 25 to 44 years age bracket for the primary householder. A total of 774 households (20.6%) fall into this category. Meanwhile, the 15 to 24 years age bracket for the primary householder has the lowest median household income of $0, with 6 households (0.2%) in this group.
| Income Bracket | # Households | Median Income |
| 15 to 24 Years | 6 (0.2%) | $0 |
| 25 to 44 Years | 774 (20.6%) | $122,292 |
| 45 to 64 Years | 1,397 (37.2%) | $107,083 |
| 65+ Years | 1,573 (41.9%) | $62,527 |
| Total | 3,750 (100.0%) | $86,983 |
Poverty in Economy borough
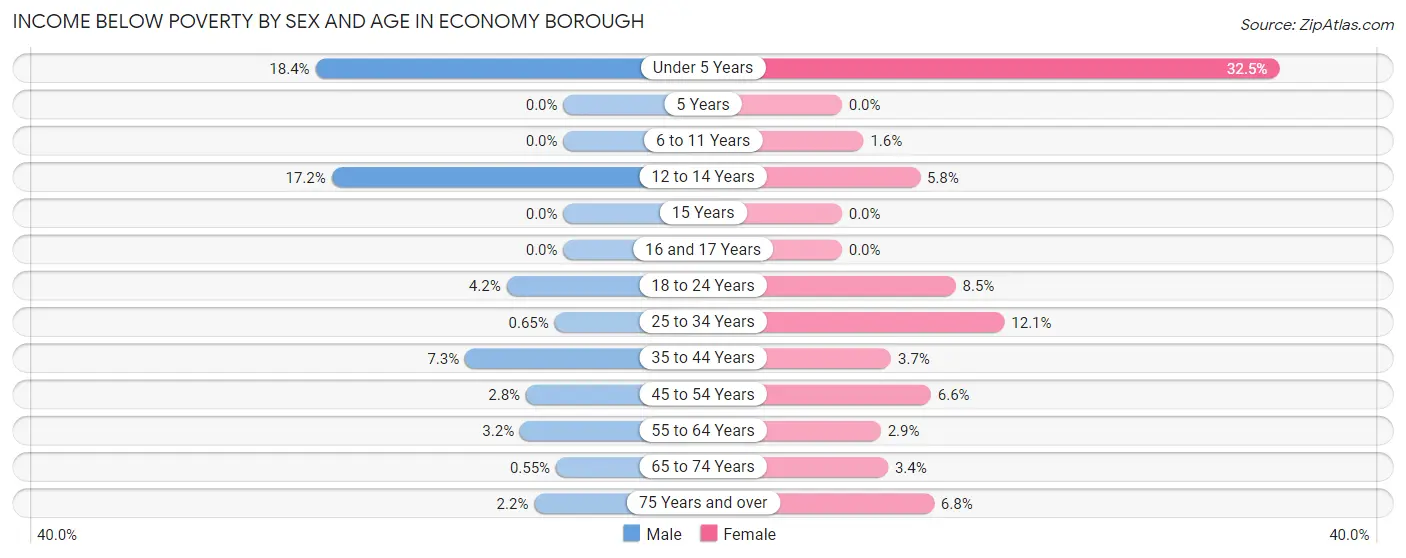
Income Below Poverty by Sex and Age in Economy borough
With 3.5% poverty level for males and 6.5% for females among the residents of Economy borough, under 5 year old males and under 5 year old females are the most vulnerable to poverty, with 37 males (18.4%) and 75 females (32.5%) in their respective age groups living below the poverty level.
| Age Bracket | Male | Female |
| Under 5 Years | 37 (18.4%) | 75 (32.5%) |
| 5 Years | 0 (0.0%) | 0 (0.0%) |
| 6 to 11 Years | 0 (0.0%) | 4 (1.6%) |
| 12 to 14 Years | 21 (17.2%) | 9 (5.8%) |
| 15 Years | 0 (0.0%) | 0 (0.0%) |
| 16 and 17 Years | 0 (0.0%) | 0 (0.0%) |
| 18 to 24 Years | 7 (4.2%) | 18 (8.5%) |
| 25 to 34 Years | 4 (0.6%) | 53 (12.1%) |
| 35 to 44 Years | 34 (7.3%) | 18 (3.7%) |
| 45 to 54 Years | 18 (2.8%) | 36 (6.6%) |
| 55 to 64 Years | 22 (3.2%) | 24 (2.9%) |
| 65 to 74 Years | 5 (0.5%) | 25 (3.4%) |
| 75 Years and over | 8 (2.2%) | 35 (6.8%) |
| Total | 156 (3.5%) | 297 (6.5%) |
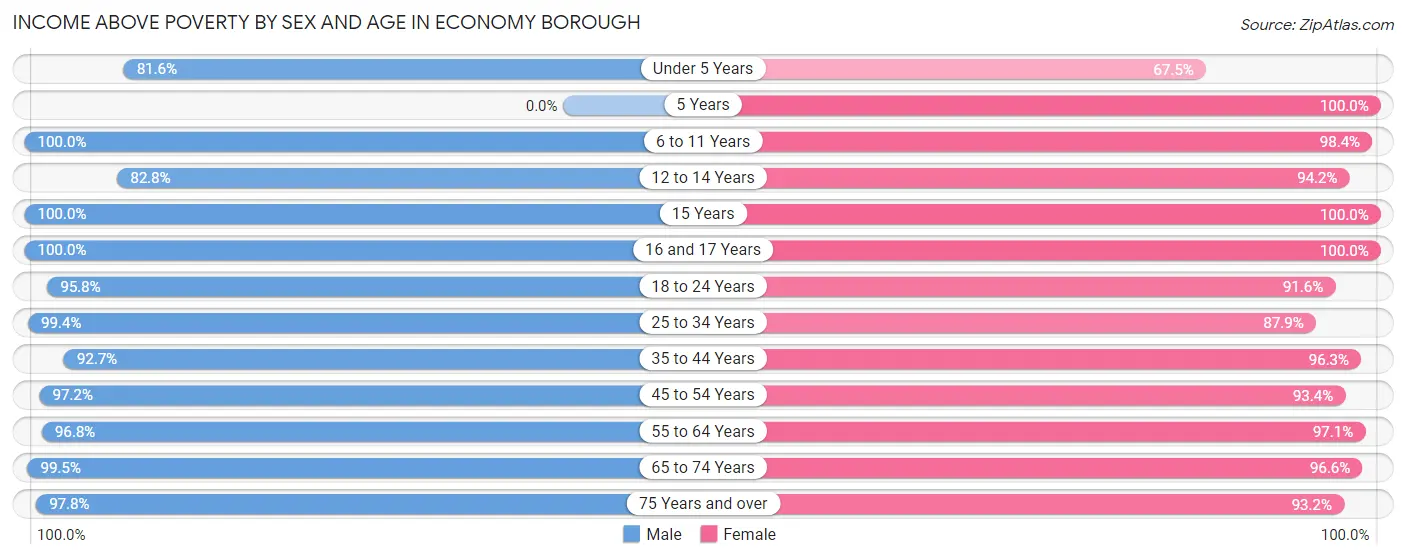
Income Above Poverty by Sex and Age in Economy borough
According to the poverty statistics in Economy borough, males aged 6 to 11 years and females aged 5 years are the age groups that are most secure financially, with 100.0% of males and 100.0% of females in these age groups living above the poverty line.
| Age Bracket | Male | Female |
| Under 5 Years | 164 (81.6%) | 156 (67.5%) |
| 5 Years | 0 (0.0%) | 27 (100.0%) |
| 6 to 11 Years | 180 (100.0%) | 245 (98.4%) |
| 12 to 14 Years | 101 (82.8%) | 146 (94.2%) |
| 15 Years | 24 (100.0%) | 30 (100.0%) |
| 16 and 17 Years | 100 (100.0%) | 119 (100.0%) |
| 18 to 24 Years | 159 (95.8%) | 195 (91.5%) |
| 25 to 34 Years | 607 (99.4%) | 386 (87.9%) |
| 35 to 44 Years | 432 (92.7%) | 474 (96.3%) |
| 45 to 54 Years | 629 (97.2%) | 509 (93.4%) |
| 55 to 64 Years | 662 (96.8%) | 806 (97.1%) |
| 65 to 74 Years | 909 (99.5%) | 703 (96.6%) |
| 75 Years and over | 362 (97.8%) | 477 (93.2%) |
| Total | 4,329 (96.5%) | 4,273 (93.5%) |
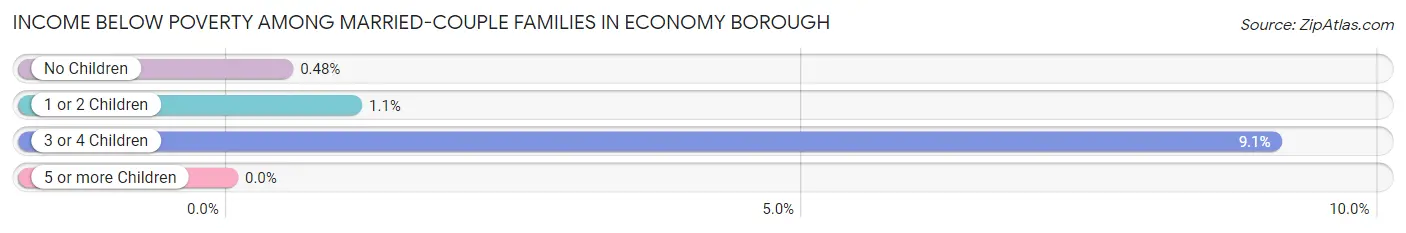
Income Below Poverty Among Married-Couple Families in Economy borough
The poverty statistics for married-couple families in Economy borough show that 0.9% or 21 of the total 2,397 families live below the poverty line. Families with 3 or 4 children have the highest poverty rate of 9.1%, comprising of 6 families. On the other hand, families with 5 or more children have the lowest poverty rate of 0.0%, which includes 0 families.
| Children | Above Poverty | Below Poverty |
| No Children | 1,663 (99.5%) | 8 (0.5%) |
| 1 or 2 Children | 640 (98.9%) | 7 (1.1%) |
| 3 or 4 Children | 60 (90.9%) | 6 (9.1%) |
| 5 or more Children | 13 (100.0%) | 0 (0.0%) |
| Total | 2,376 (99.1%) | 21 (0.9%) |
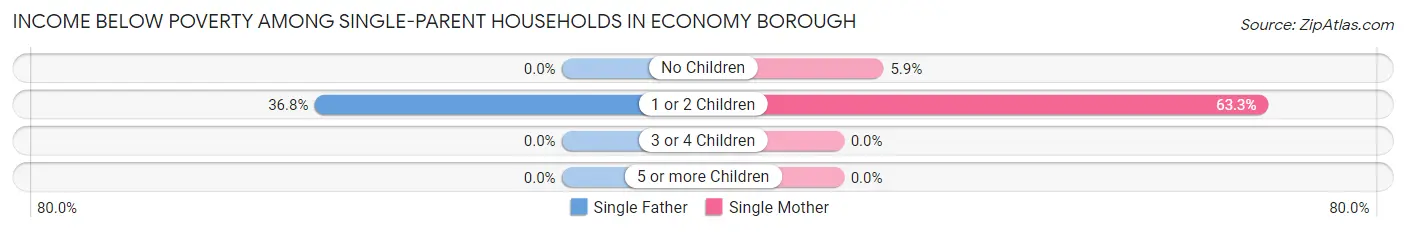
Income Below Poverty Among Single-Parent Households in Economy borough
According to the poverty data in Economy borough, 16.1% or 14 single-father households and 30.0% or 70 single-mother households are living below the poverty line. Among single-father households, those with 1 or 2 children have the highest poverty rate, with 14 households (36.8%) experiencing poverty. Likewise, among single-mother households, those with 1 or 2 children have the highest poverty rate, with 62 households (63.3%) falling below the poverty line.
| Children | Single Father | Single Mother |
| No Children | 0 (0.0%) | 8 (5.9%) |
| 1 or 2 Children | 14 (36.8%) | 62 (63.3%) |
| 3 or 4 Children | 0 (0.0%) | 0 (0.0%) |
| 5 or more Children | 0 (0.0%) | 0 (0.0%) |
| Total | 14 (16.1%) | 70 (30.0%) |
Income Below Poverty Among Married-Couple vs Single-Parent Households in Economy borough
The poverty data for Economy borough shows that 21 of the married-couple family households (0.9%) and 84 of the single-parent households (26.3%) are living below the poverty level. Within the married-couple family households, those with 3 or 4 children have the highest poverty rate, with 6 households (9.1%) falling below the poverty line. Among the single-parent households, those with 1 or 2 children have the highest poverty rate, with 76 household (55.9%) living below poverty.
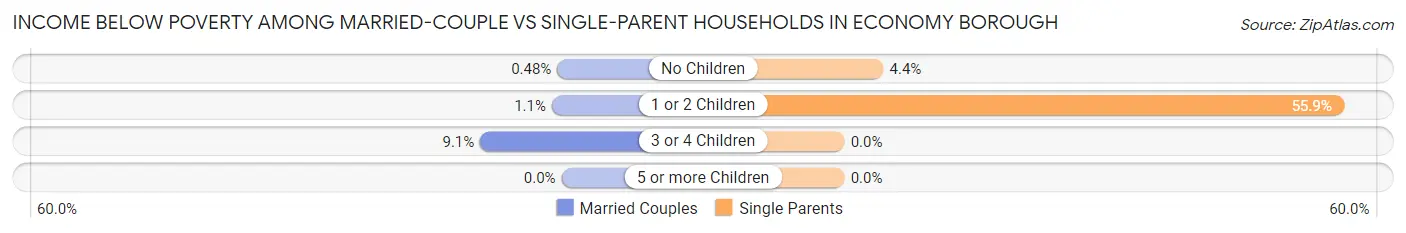
| Children | Married-Couple Families | Single-Parent Households |
| No Children | 8 (0.5%) | 8 (4.3%) |
| 1 or 2 Children | 7 (1.1%) | 76 (55.9%) |
| 3 or 4 Children | 6 (9.1%) | 0 (0.0%) |
| 5 or more Children | 0 (0.0%) | 0 (0.0%) |
| Total | 21 (0.9%) | 84 (26.3%) |
Race in Economy borough
The most populous races in Economy borough are White / Caucasian (8,521 | 94.0%), Two or more Races (332 | 3.7%), and Hispanic or Latino (143 | 1.6%).
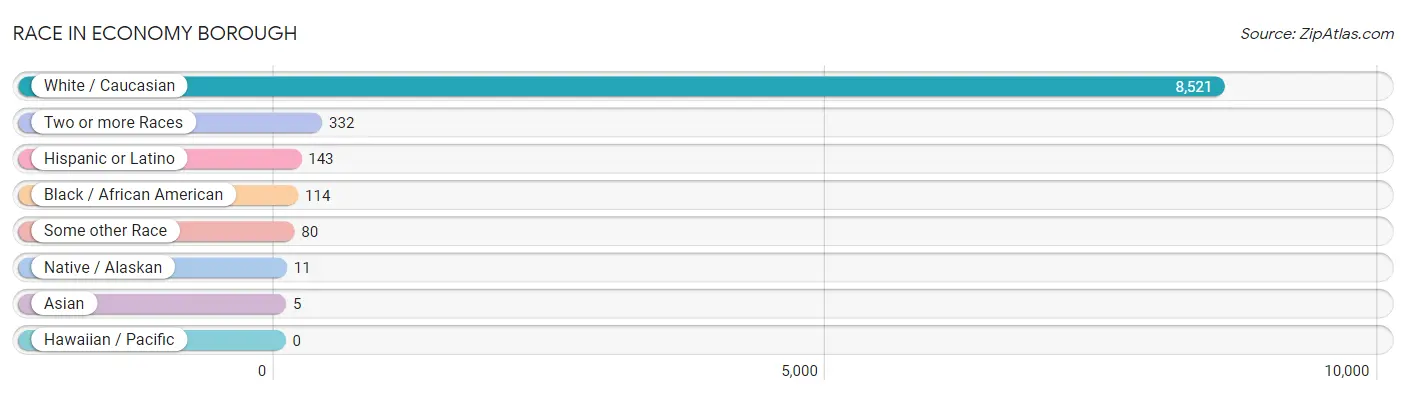
| Race | # Population | % Population |
| Asian | 5 | 0.1% |
| Black / African American | 114 | 1.3% |
| Hawaiian / Pacific | 0 | 0.0% |
| Hispanic or Latino | 143 | 1.6% |
| Native / Alaskan | 11 | 0.1% |
| White / Caucasian | 8,521 | 94.0% |
| Two or more Races | 332 | 3.7% |
| Some other Race | 80 | 0.9% |
| Total | 9,063 | 100.0% |
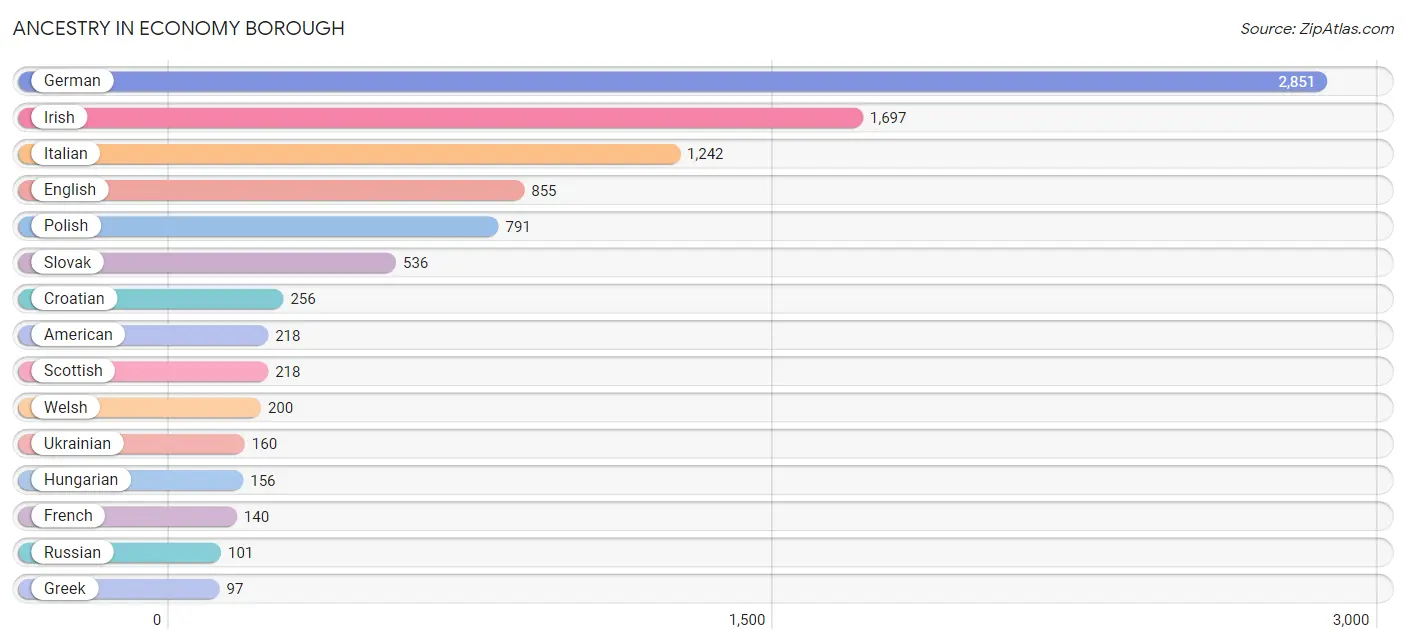
Ancestry in Economy borough
The most populous ancestries reported in Economy borough are German (2,851 | 31.5%), Irish (1,697 | 18.7%), Italian (1,242 | 13.7%), English (855 | 9.4%), and Polish (791 | 8.7%), together accounting for 82.0% of all Economy borough residents.
| Ancestry | # Population | % Population |
| American | 218 | 2.4% |
| Armenian | 6 | 0.1% |
| Austrian | 49 | 0.5% |
| Bahamian | 4 | 0.0% |
| Blackfeet | 3 | 0.0% |
| British | 28 | 0.3% |
| Carpatho Rusyn | 55 | 0.6% |
| Central American | 40 | 0.4% |
| Central American Indian | 29 | 0.3% |
| Cherokee | 24 | 0.3% |
| Croatian | 256 | 2.8% |
| Czech | 19 | 0.2% |
| Czechoslovakian | 12 | 0.1% |
| Dutch | 52 | 0.6% |
| Eastern European | 54 | 0.6% |
| English | 855 | 9.4% |
| European | 90 | 1.0% |
| French | 140 | 1.5% |
| French Canadian | 18 | 0.2% |
| German | 2,851 | 31.5% |
| Greek | 97 | 1.1% |
| Guatemalan | 29 | 0.3% |
| Hungarian | 156 | 1.7% |
| Irish | 1,697 | 18.7% |
| Italian | 1,242 | 13.7% |
| Korean | 25 | 0.3% |
| Lithuanian | 46 | 0.5% |
| Mexican | 7 | 0.1% |
| Norwegian | 27 | 0.3% |
| Pennsylvania German | 7 | 0.1% |
| Polish | 791 | 8.7% |
| Romanian | 10 | 0.1% |
| Russian | 101 | 1.1% |
| Salvadoran | 11 | 0.1% |
| Scandinavian | 23 | 0.3% |
| Scotch-Irish | 58 | 0.6% |
| Scottish | 218 | 2.4% |
| Serbian | 75 | 0.8% |
| Slavic | 45 | 0.5% |
| Slovak | 536 | 5.9% |
| Slovene | 8 | 0.1% |
| Subsaharan African | 20 | 0.2% |
| Swedish | 40 | 0.4% |
| Ukrainian | 160 | 1.8% |
| Welsh | 200 | 2.2% |
| Yugoslavian | 45 | 0.5% | View All 46 Rows |
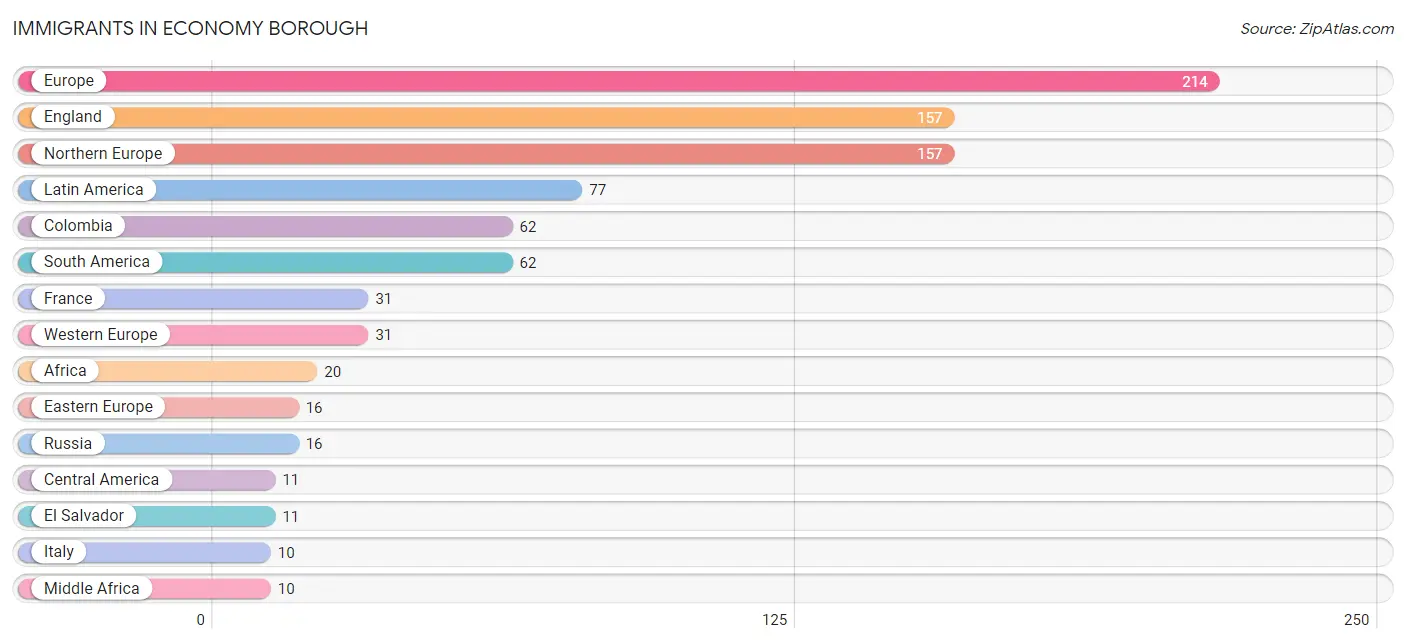
Immigrants in Economy borough
The most numerous immigrant groups reported in Economy borough came from Europe (214 | 2.4%), England (157 | 1.7%), Northern Europe (157 | 1.7%), Latin America (77 | 0.9%), and Colombia (62 | 0.7%), together accounting for 7.4% of all Economy borough residents.
| Immigration Origin | # Population | % Population |
| Africa | 20 | 0.2% |
| Asia | 5 | 0.1% |
| Caribbean | 4 | 0.0% |
| Central America | 11 | 0.1% |
| Colombia | 62 | 0.7% |
| Eastern Europe | 16 | 0.2% |
| El Salvador | 11 | 0.1% |
| England | 157 | 1.7% |
| Europe | 214 | 2.4% |
| France | 31 | 0.3% |
| Italy | 10 | 0.1% |
| Jamaica | 4 | 0.0% |
| Latin America | 77 | 0.9% |
| Middle Africa | 10 | 0.1% |
| Northern Europe | 157 | 1.7% |
| Philippines | 5 | 0.1% |
| Russia | 16 | 0.2% |
| South America | 62 | 0.7% |
| South Eastern Asia | 5 | 0.1% |
| Southern Europe | 10 | 0.1% |
| Western Africa | 10 | 0.1% |
| Western Europe | 31 | 0.3% |
| Zaire | 10 | 0.1% | View All 23 Rows |
Sex and Age in Economy borough
Sex and Age in Economy borough
The most populous age groups in Economy borough are 70 to 74 Years (468 | 10.4%) for men and 60 to 64 Years (530 | 11.6%) for women.
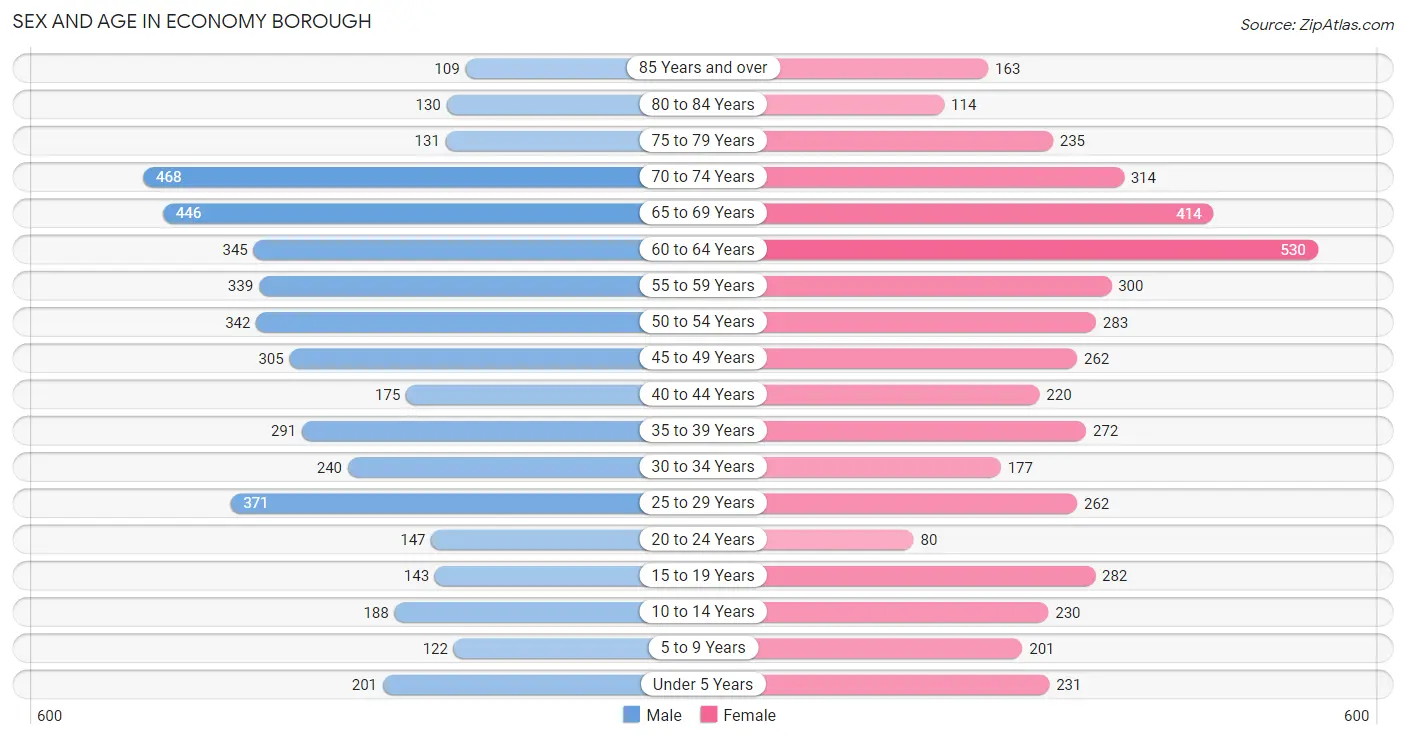
| Age Bracket | Male | Female |
| Under 5 Years | 201 (4.5%) | 231 (5.1%) |
| 5 to 9 Years | 122 (2.7%) | 201 (4.4%) |
| 10 to 14 Years | 188 (4.2%) | 230 (5.0%) |
| 15 to 19 Years | 143 (3.2%) | 282 (6.2%) |
| 20 to 24 Years | 147 (3.3%) | 80 (1.8%) |
| 25 to 29 Years | 371 (8.3%) | 262 (5.7%) |
| 30 to 34 Years | 240 (5.3%) | 177 (3.9%) |
| 35 to 39 Years | 291 (6.5%) | 272 (5.9%) |
| 40 to 44 Years | 175 (3.9%) | 220 (4.8%) |
| 45 to 49 Years | 305 (6.8%) | 262 (5.7%) |
| 50 to 54 Years | 342 (7.6%) | 283 (6.2%) |
| 55 to 59 Years | 339 (7.5%) | 300 (6.6%) |
| 60 to 64 Years | 345 (7.7%) | 530 (11.6%) |
| 65 to 69 Years | 446 (9.9%) | 414 (9.1%) |
| 70 to 74 Years | 468 (10.4%) | 314 (6.9%) |
| 75 to 79 Years | 131 (2.9%) | 235 (5.1%) |
| 80 to 84 Years | 130 (2.9%) | 114 (2.5%) |
| 85 Years and over | 109 (2.4%) | 163 (3.6%) |
| Total | 4,493 (100.0%) | 4,570 (100.0%) |
Families and Households in Economy borough
Median Family Size in Economy borough
The median family size in Economy borough is 2.80 persons per family, with single male/father families (87 | 3.2%) accounting for the largest median family size of 3.56 persons per family. On the other hand, single female/mother families (233 | 8.6%) represent the smallest median family size with 2.58 persons per family.
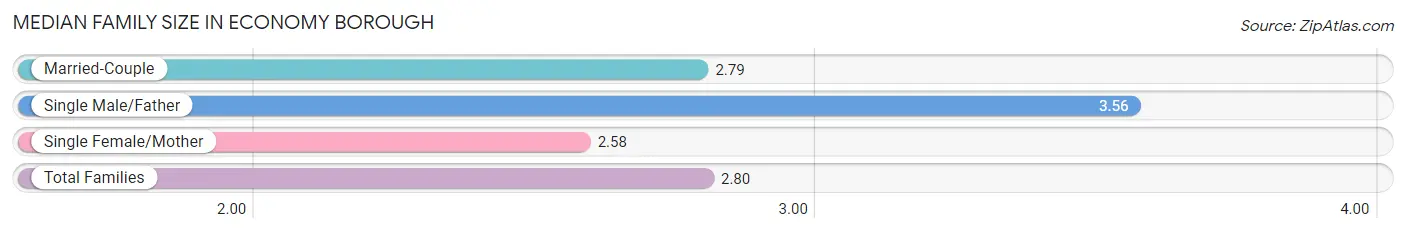
| Family Type | # Families | Family Size |
| Married-Couple | 2,397 (88.2%) | 2.79 |
| Single Male/Father | 87 (3.2%) | 3.56 |
| Single Female/Mother | 233 (8.6%) | 2.58 |
| Total Families | 2,717 (100.0%) | 2.80 |
Median Household Size in Economy borough
The median household size in Economy borough is 2.42 persons per household, with single male/father households (87 | 2.3%) accounting for the largest median household size of 4.06 persons per household. non-family households (1,033 | 27.6%) represent the smallest median household size with 1.22 persons per household.
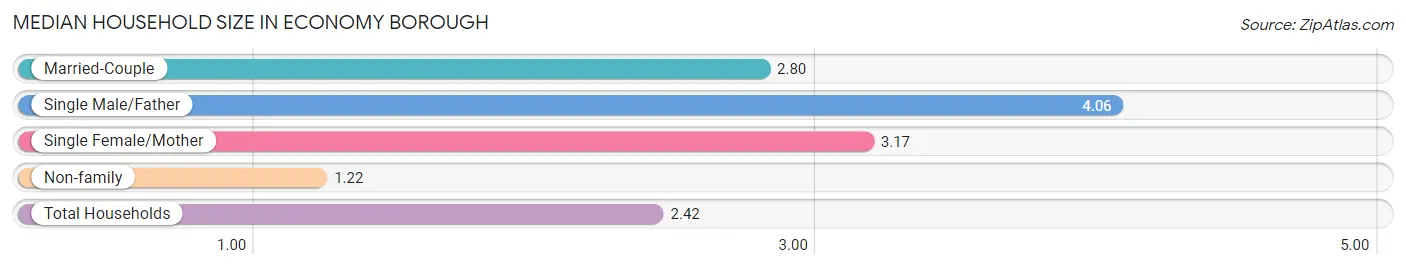
| Household Type | # Households | Household Size |
| Married-Couple | 2,397 (63.9%) | 2.80 |
| Single Male/Father | 87 (2.3%) | 4.06 |
| Single Female/Mother | 233 (6.2%) | 3.17 |
| Non-family | 1,033 (27.6%) | 1.22 |
| Total Households | 3,750 (100.0%) | 2.42 |
Household Size by Marriage Status in Economy borough
Out of a total of 3,750 households in Economy borough, 2,717 (72.5%) are family households, while 1,033 (27.6%) are nonfamily households. The most numerous type of family households are 2-person households, comprising 1,455, and the most common type of nonfamily households are 1-person households, comprising 831.
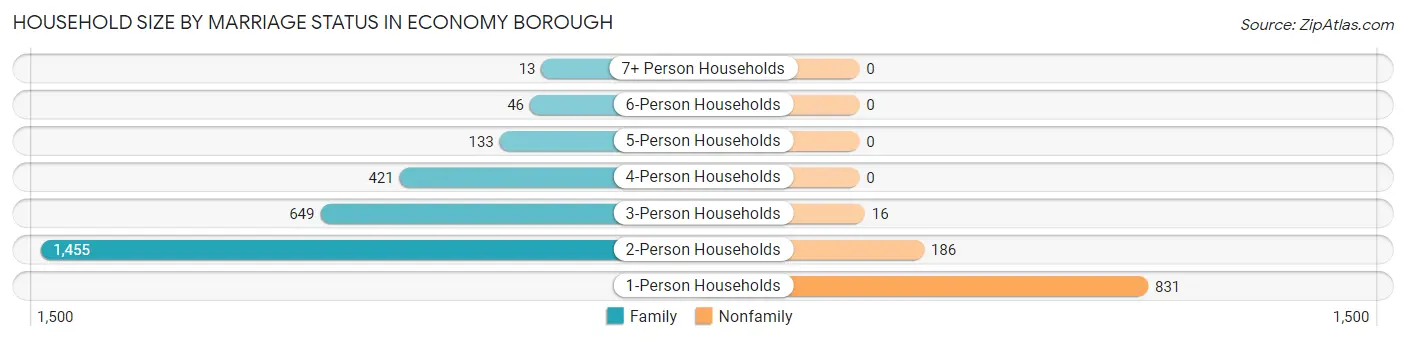
| Household Size | Family Households | Nonfamily Households |
| 1-Person Households | - | 831 (22.2%) |
| 2-Person Households | 1,455 (38.8%) | 186 (5.0%) |
| 3-Person Households | 649 (17.3%) | 16 (0.4%) |
| 4-Person Households | 421 (11.2%) | 0 (0.0%) |
| 5-Person Households | 133 (3.5%) | 0 (0.0%) |
| 6-Person Households | 46 (1.2%) | 0 (0.0%) |
| 7+ Person Households | 13 (0.4%) | 0 (0.0%) |
| Total | 2,717 (72.5%) | 1,033 (27.6%) |
Female Fertility in Economy borough
Fertility by Age in Economy borough
Average fertility rate in Economy borough is 35.0 births per 1,000 women. Women in the age bracket of 35 to 50 years have the highest fertility rate with 54.0 births per 1,000 women. Women in the age bracket of 35 to 50 years acount for 77.2% of all women with births.
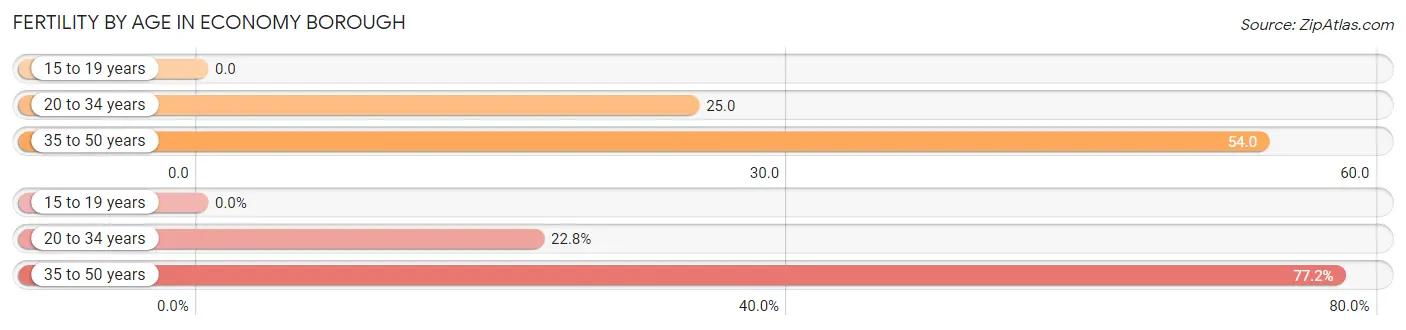
| Age Bracket | Women with Births | Births / 1,000 Women |
| 15 to 19 years | 0 (0.0%) | 0.0 |
| 20 to 34 years | 13 (22.8%) | 25.0 |
| 35 to 50 years | 44 (77.2%) | 54.0 |
| Total | 57 (100.0%) | 35.0 |
Fertility by Age by Marriage Status in Economy borough
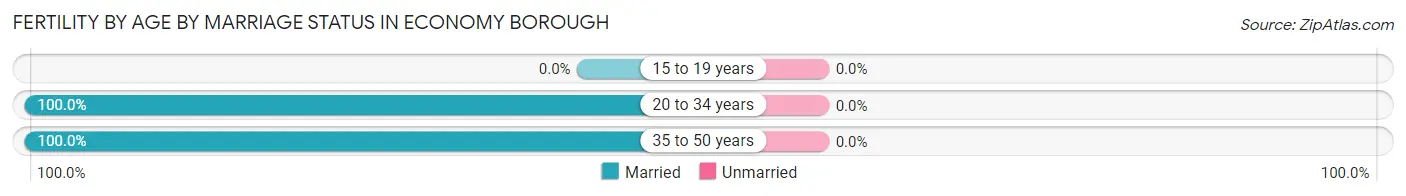
| Age Bracket | Married | Unmarried |
| 15 to 19 years | 0 (0.0%) | 0 (0.0%) |
| 20 to 34 years | 13 (100.0%) | 0 (0.0%) |
| 35 to 50 years | 44 (100.0%) | 0 (0.0%) |
| Total | 57 (100.0%) | 0 (0.0%) |
Fertility by Education in Economy borough
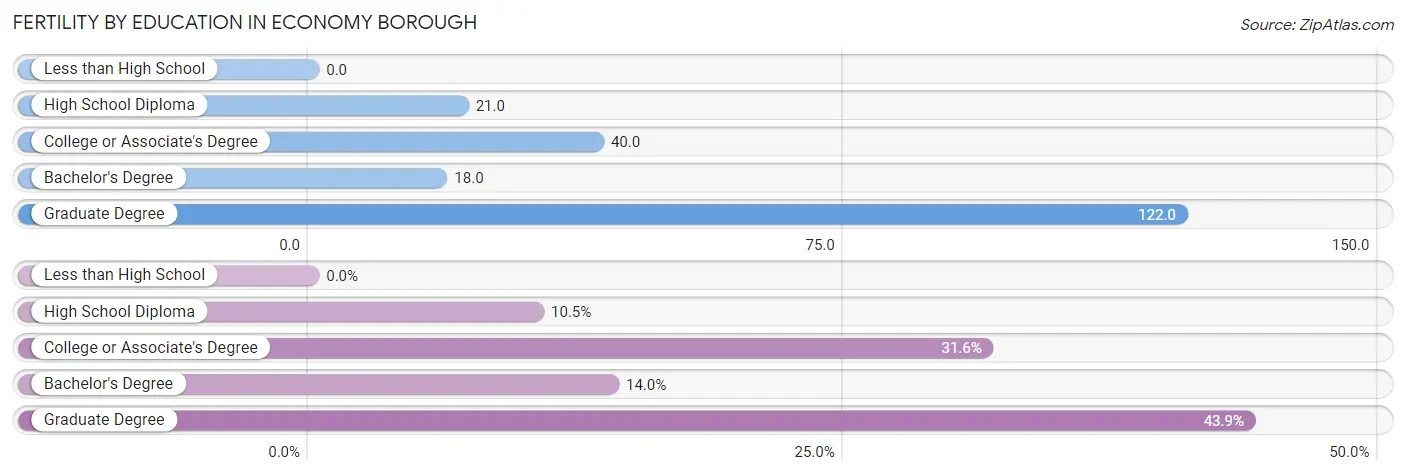
| Educational Attainment | Women with Births | Births / 1,000 Women |
| Less than High School | 0 (0.0%) | 0.0 |
| High School Diploma | 6 (10.5%) | 21.0 |
| College or Associate's Degree | 18 (31.6%) | 40.0 |
| Bachelor's Degree | 8 (14.0%) | 18.0 |
| Graduate Degree | 25 (43.9%) | 122.0 |
| Total | 57 (100.0%) | 35.0 |
Fertility by Education by Marriage Status in Economy borough
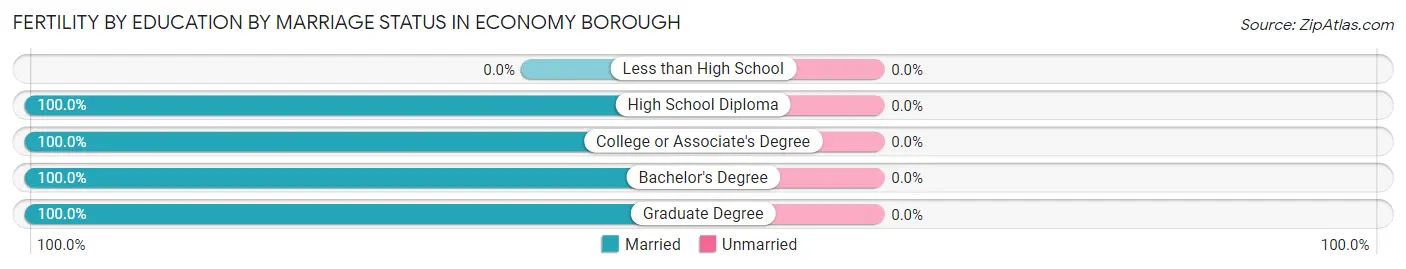
| Educational Attainment | Married | Unmarried |
| Less than High School | 0 (0.0%) | 0 (0.0%) |
| High School Diploma | 6 (100.0%) | 0 (0.0%) |
| College or Associate's Degree | 18 (100.0%) | 0 (0.0%) |
| Bachelor's Degree | 8 (100.0%) | 0 (0.0%) |
| Graduate Degree | 25 (100.0%) | 0 (0.0%) |
| Total | 57 (100.0%) | 0 (0.0%) |
Employment Characteristics in Economy borough
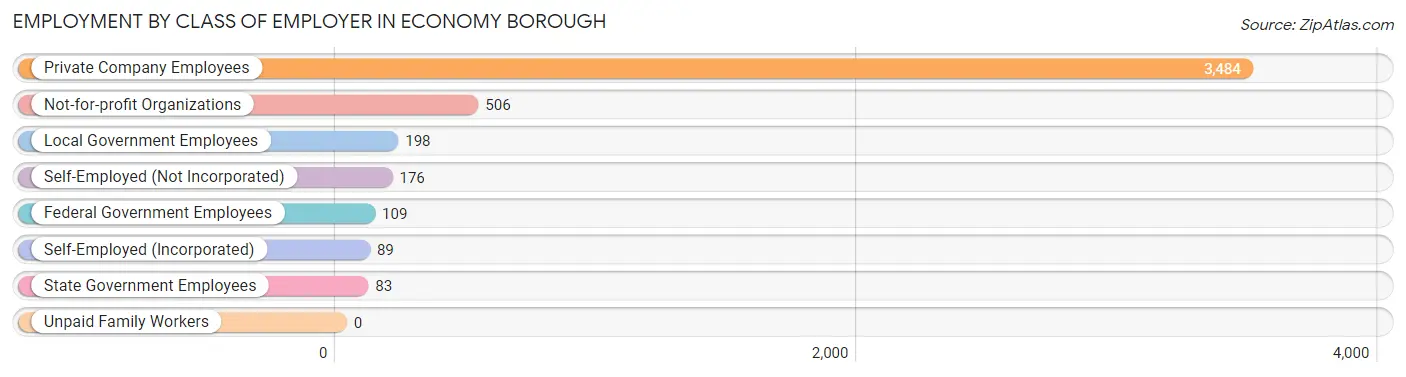
Employment by Class of Employer in Economy borough
Among the 4,645 employed individuals in Economy borough, private company employees (3,484 | 75.0%), not-for-profit organizations (506 | 10.9%), and local government employees (198 | 4.3%) make up the most common classes of employment.
| Employer Class | # Employees | % Employees |
| Private Company Employees | 3,484 | 75.0% |
| Self-Employed (Incorporated) | 89 | 1.9% |
| Self-Employed (Not Incorporated) | 176 | 3.8% |
| Not-for-profit Organizations | 506 | 10.9% |
| Local Government Employees | 198 | 4.3% |
| State Government Employees | 83 | 1.8% |
| Federal Government Employees | 109 | 2.4% |
| Unpaid Family Workers | 0 | 0.0% |
| Total | 4,645 | 100.0% |
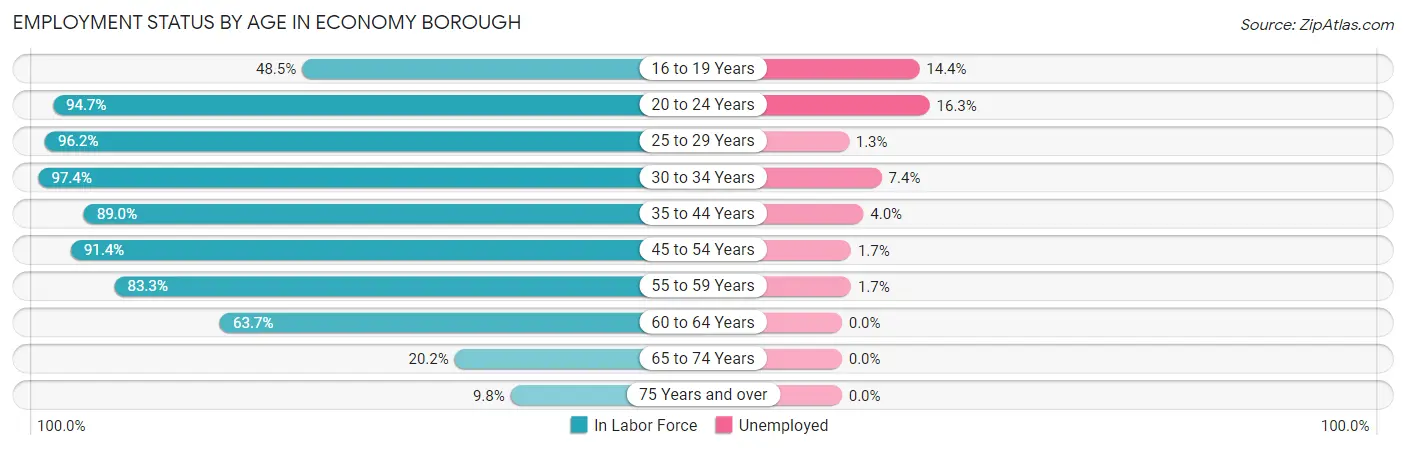
Employment Status by Age in Economy borough
According to the labor force statistics for Economy borough, out of the total population over 16 years of age (7,836), 62.0% or 4,858 individuals are in the labor force, with 3.3% or 160 of them unemployed. The age group with the highest labor force participation rate is 30 to 34 years, with 97.4% or 406 individuals in the labor force. Within the labor force, the 20 to 24 years age range has the highest percentage of unemployed individuals, with 16.3% or 35 of them being unemployed.
| Age Bracket | In Labor Force | Unemployed |
| 16 to 19 Years | 180 (48.5%) | 26 (14.4%) |
| 20 to 24 Years | 215 (94.7%) | 35 (16.3%) |
| 25 to 29 Years | 609 (96.2%) | 8 (1.3%) |
| 30 to 34 Years | 406 (97.4%) | 30 (7.4%) |
| 35 to 44 Years | 853 (89.0%) | 34 (4.0%) |
| 45 to 54 Years | 1,089 (91.4%) | 19 (1.7%) |
| 55 to 59 Years | 532 (83.3%) | 9 (1.7%) |
| 60 to 64 Years | 557 (63.7%) | 0 (0.0%) |
| 65 to 74 Years | 332 (20.2%) | 0 (0.0%) |
| 75 Years and over | 86 (9.8%) | 0 (0.0%) |
| Total | 4,858 (62.0%) | 160 (3.3%) |
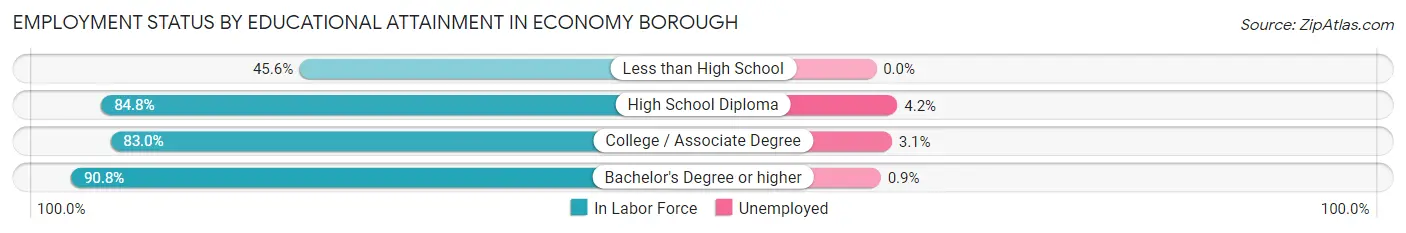
Employment Status by Educational Attainment in Economy borough
According to labor force statistics for Economy borough, 85.8% of individuals (4,045) out of the total population between 25 and 64 years of age (4,714) are in the labor force, with 2.5% or 101 of them being unemployed. The group with the highest labor force participation rate are those with the educational attainment of bachelor's degree or higher, with 90.8% or 1,662 individuals in the labor force. Within the labor force, individuals with high school diploma education have the highest percentage of unemployment, with 4.2% or 47 of them being unemployed.
| Educational Attainment | In Labor Force | Unemployed |
| Less than High School | 41 (45.6%) | 0 (0.0%) |
| High School Diploma | 1,130 (84.8%) | 56 (4.2%) |
| College / Associate Degree | 1,213 (83.0%) | 45 (3.1%) |
| Bachelor's Degree or higher | 1,662 (90.8%) | 16 (0.9%) |
| Total | 4,045 (85.8%) | 118 (2.5%) |
Employment Occupations by Sex in Economy borough
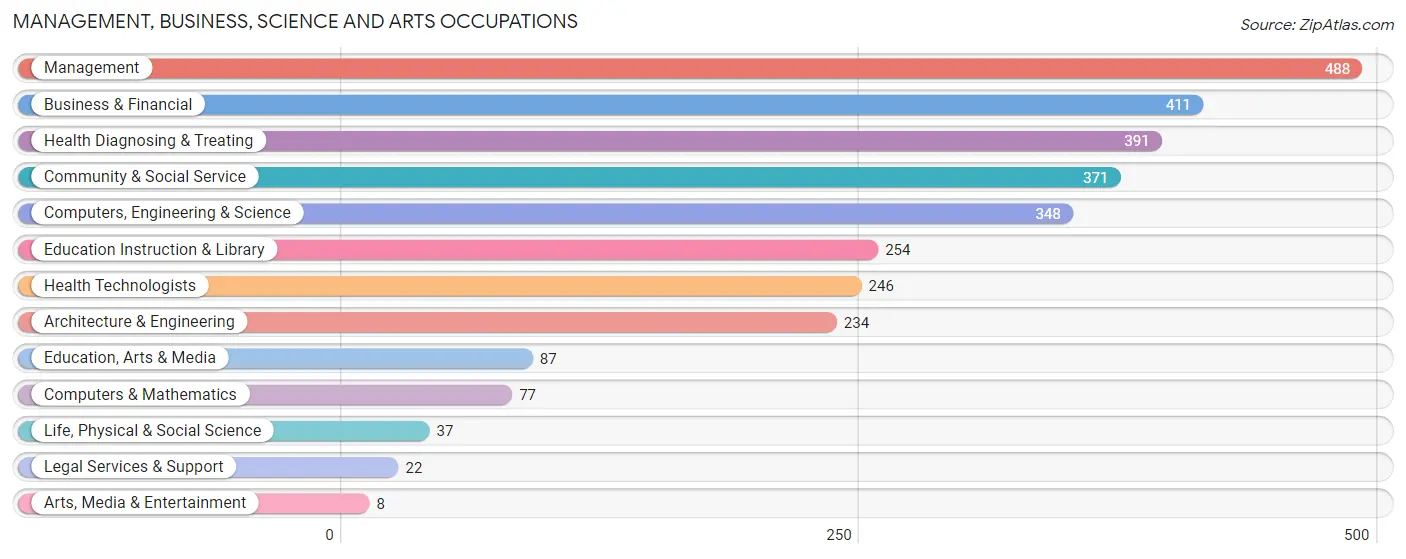
Management, Business, Science and Arts Occupations
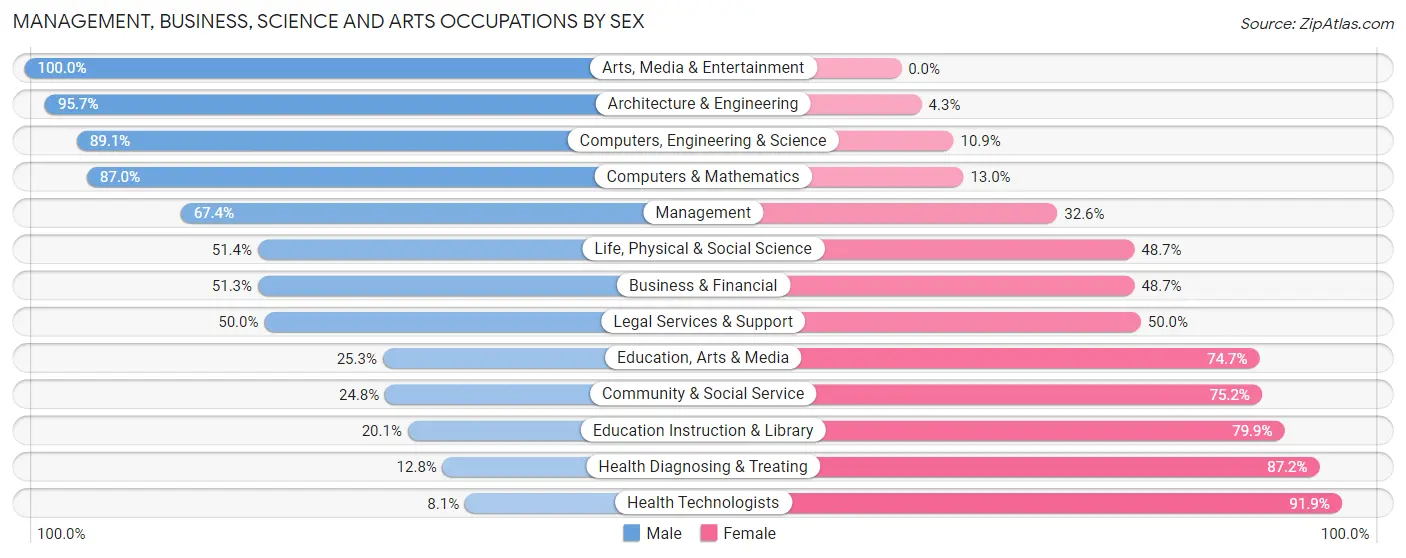
The most common Management, Business, Science and Arts occupations in Economy borough are Management (488 | 10.4%), Business & Financial (411 | 8.7%), Health Diagnosing & Treating (391 | 8.3%), Community & Social Service (371 | 7.9%), and Computers, Engineering & Science (348 | 7.4%).
Management, Business, Science and Arts Occupations by Sex
Within the Management, Business, Science and Arts occupations in Economy borough, the most male-oriented occupations are Arts, Media & Entertainment (100.0%), Architecture & Engineering (95.7%), and Computers, Engineering & Science (89.1%), while the most female-oriented occupations are Health Technologists (91.9%), Health Diagnosing & Treating (87.2%), and Education Instruction & Library (79.9%).
| Occupation | Male | Female |
| Management | 329 (67.4%) | 159 (32.6%) |
| Business & Financial | 211 (51.3%) | 200 (48.7%) |
| Computers, Engineering & Science | 310 (89.1%) | 38 (10.9%) |
| Computers & Mathematics | 67 (87.0%) | 10 (13.0%) |
| Architecture & Engineering | 224 (95.7%) | 10 (4.3%) |
| Life, Physical & Social Science | 19 (51.3%) | 18 (48.6%) |
| Community & Social Service | 92 (24.8%) | 279 (75.2%) |
| Education, Arts & Media | 22 (25.3%) | 65 (74.7%) |
| Legal Services & Support | 11 (50.0%) | 11 (50.0%) |
| Education Instruction & Library | 51 (20.1%) | 203 (79.9%) |
| Arts, Media & Entertainment | 8 (100.0%) | 0 (0.0%) |
| Health Diagnosing & Treating | 50 (12.8%) | 341 (87.2%) |
| Health Technologists | 20 (8.1%) | 226 (91.9%) |
| Total (Category) | 992 (49.4%) | 1,017 (50.6%) |
| Total (Overall) | 2,539 (54.1%) | 2,158 (45.9%) |
Services Occupations
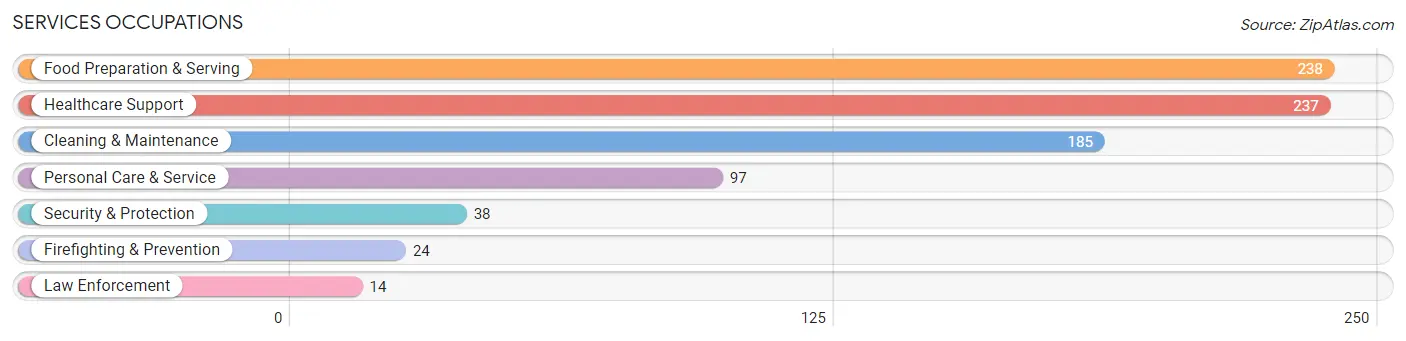
The most common Services occupations in Economy borough are Food Preparation & Serving (238 | 5.1%), Healthcare Support (237 | 5.1%), Cleaning & Maintenance (185 | 3.9%), Personal Care & Service (97 | 2.1%), and Security & Protection (38 | 0.8%).
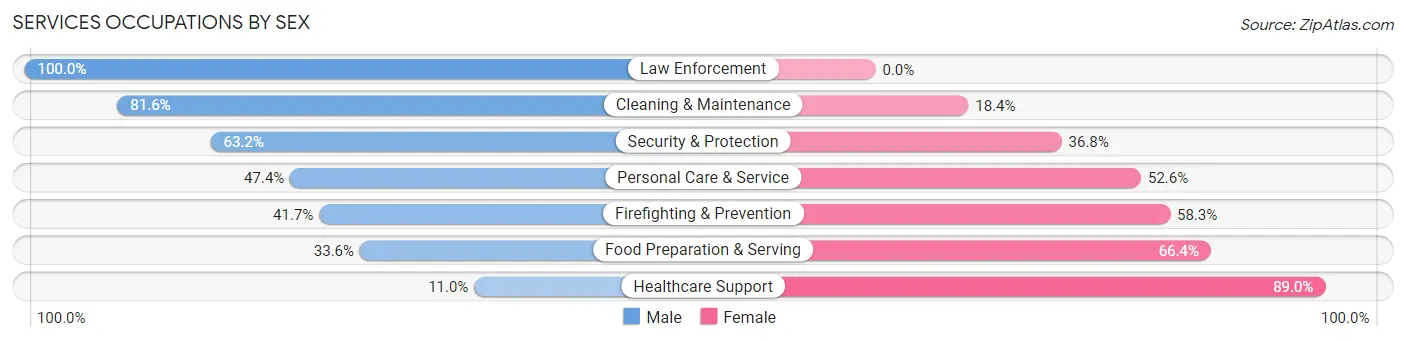
Services Occupations by Sex
Within the Services occupations in Economy borough, the most male-oriented occupations are Law Enforcement (100.0%), Cleaning & Maintenance (81.6%), and Security & Protection (63.2%), while the most female-oriented occupations are Healthcare Support (89.0%), Food Preparation & Serving (66.4%), and Firefighting & Prevention (58.3%).
| Occupation | Male | Female |
| Healthcare Support | 26 (11.0%) | 211 (89.0%) |
| Security & Protection | 24 (63.2%) | 14 (36.8%) |
| Firefighting & Prevention | 10 (41.7%) | 14 (58.3%) |
| Law Enforcement | 14 (100.0%) | 0 (0.0%) |
| Food Preparation & Serving | 80 (33.6%) | 158 (66.4%) |
| Cleaning & Maintenance | 151 (81.6%) | 34 (18.4%) |
| Personal Care & Service | 46 (47.4%) | 51 (52.6%) |
| Total (Category) | 327 (41.1%) | 468 (58.9%) |
| Total (Overall) | 2,539 (54.1%) | 2,158 (45.9%) |
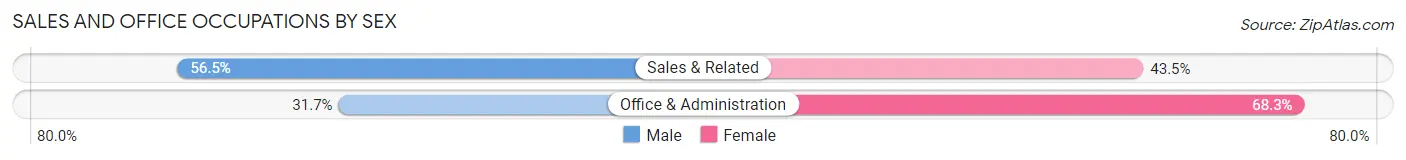
Sales and Office Occupations
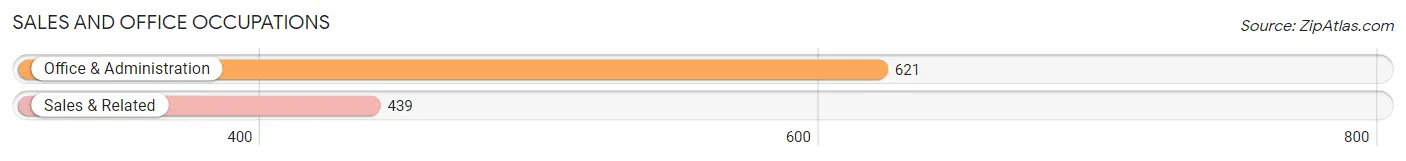
The most common Sales and Office occupations in Economy borough are Office & Administration (621 | 13.2%), and Sales & Related (439 | 9.3%).
Sales and Office Occupations by Sex
| Occupation | Male | Female |
| Sales & Related | 248 (56.5%) | 191 (43.5%) |
| Office & Administration | 197 (31.7%) | 424 (68.3%) |
| Total (Category) | 445 (42.0%) | 615 (58.0%) |
| Total (Overall) | 2,539 (54.1%) | 2,158 (45.9%) |
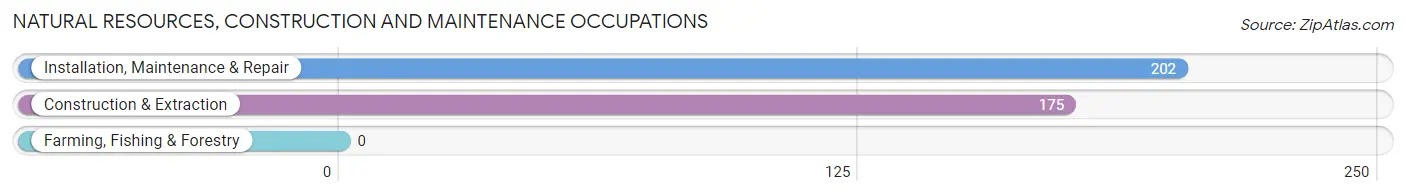
Natural Resources, Construction and Maintenance Occupations
The most common Natural Resources, Construction and Maintenance occupations in Economy borough are Installation, Maintenance & Repair (202 | 4.3%), and Construction & Extraction (175 | 3.7%).
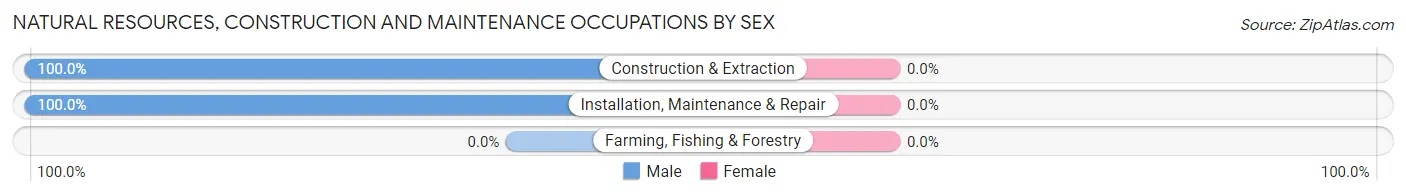
Natural Resources, Construction and Maintenance Occupations by Sex
| Occupation | Male | Female |
| Farming, Fishing & Forestry | 0 (0.0%) | 0 (0.0%) |
| Construction & Extraction | 175 (100.0%) | 0 (0.0%) |
| Installation, Maintenance & Repair | 202 (100.0%) | 0 (0.0%) |
| Total (Category) | 377 (100.0%) | 0 (0.0%) |
| Total (Overall) | 2,539 (54.1%) | 2,158 (45.9%) |
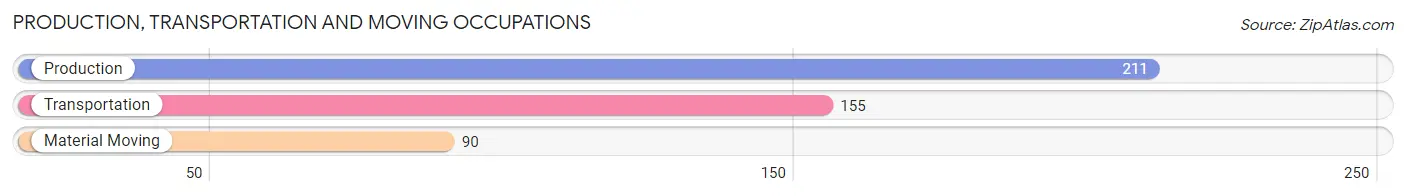
Production, Transportation and Moving Occupations
The most common Production, Transportation and Moving occupations in Economy borough are Production (211 | 4.5%), Transportation (155 | 3.3%), and Material Moving (90 | 1.9%).
Production, Transportation and Moving Occupations by Sex
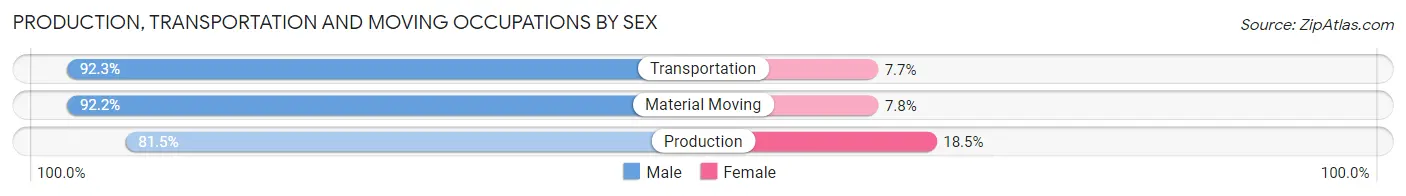
| Occupation | Male | Female |
| Production | 172 (81.5%) | 39 (18.5%) |
| Transportation | 143 (92.3%) | 12 (7.7%) |
| Material Moving | 83 (92.2%) | 7 (7.8%) |
| Total (Category) | 398 (87.3%) | 58 (12.7%) |
| Total (Overall) | 2,539 (54.1%) | 2,158 (45.9%) |
Employment Industries by Sex in Economy borough
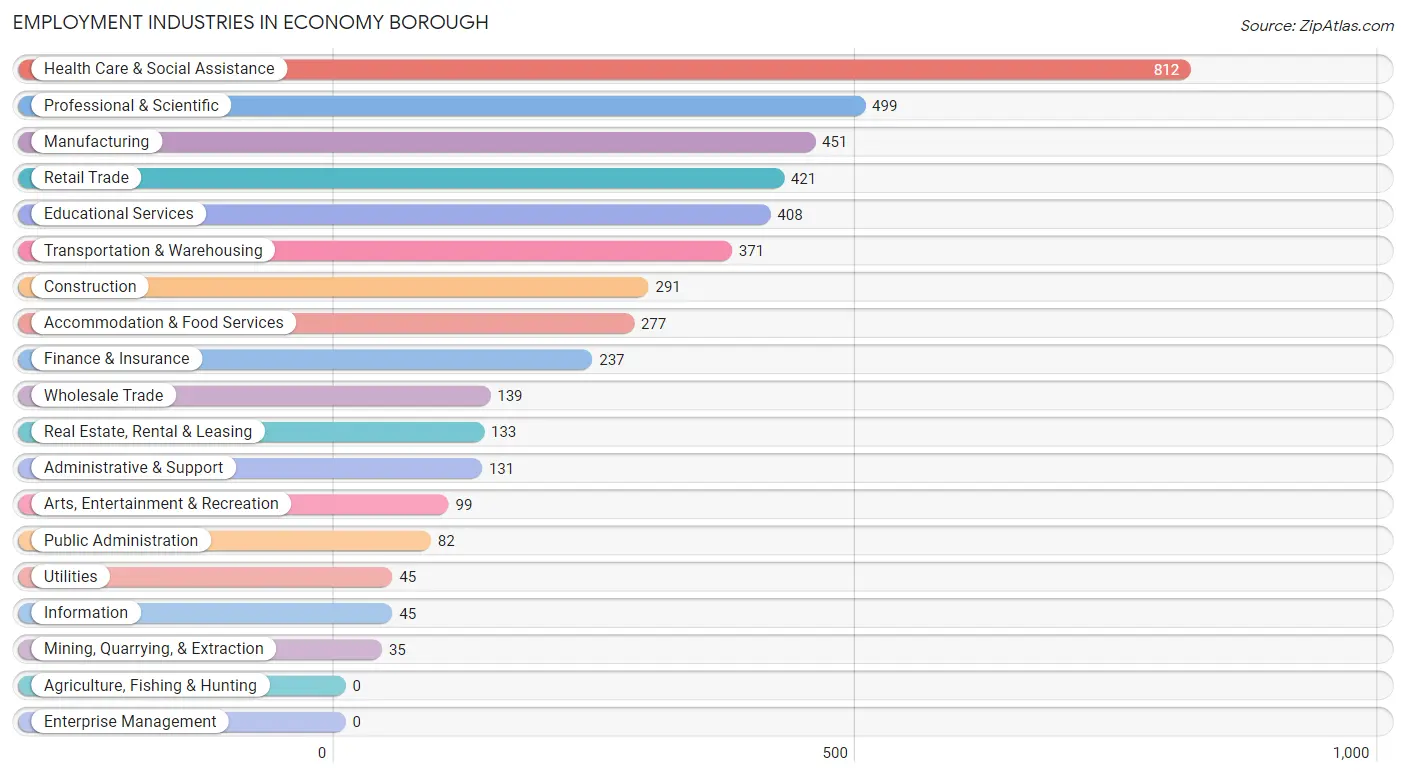
Employment Industries in Economy borough
The major employment industries in Economy borough include Health Care & Social Assistance (812 | 17.3%), Professional & Scientific (499 | 10.6%), Manufacturing (451 | 9.6%), Retail Trade (421 | 9.0%), and Educational Services (408 | 8.7%).
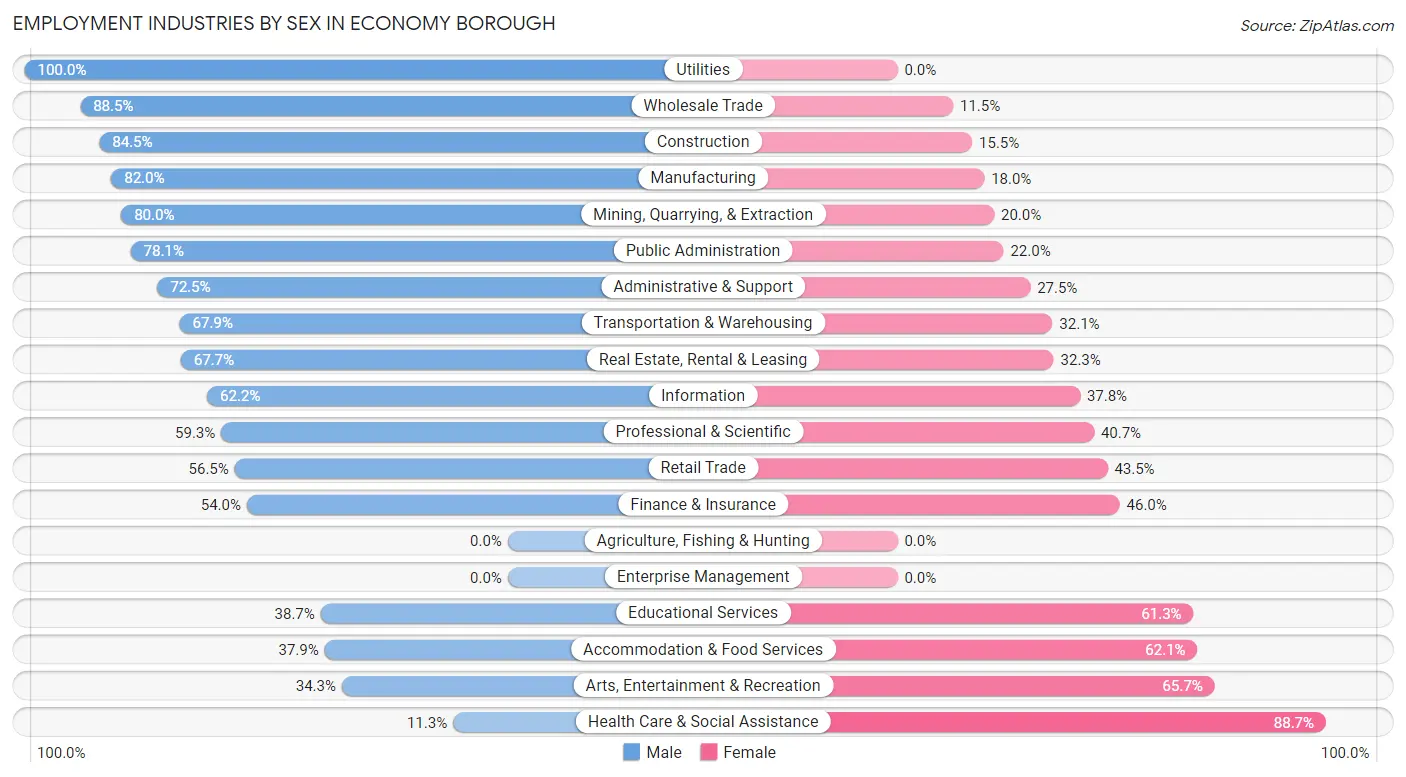
Employment Industries by Sex in Economy borough
The Economy borough industries that see more men than women are Utilities (100.0%), Wholesale Trade (88.5%), and Construction (84.5%), whereas the industries that tend to have a higher number of women are Health Care & Social Assistance (88.7%), Arts, Entertainment & Recreation (65.7%), and Accommodation & Food Services (62.1%).
| Industry | Male | Female |
| Agriculture, Fishing & Hunting | 0 (0.0%) | 0 (0.0%) |
| Mining, Quarrying, & Extraction | 28 (80.0%) | 7 (20.0%) |
| Construction | 246 (84.5%) | 45 (15.5%) |
| Manufacturing | 370 (82.0%) | 81 (18.0%) |
| Wholesale Trade | 123 (88.5%) | 16 (11.5%) |
| Retail Trade | 238 (56.5%) | 183 (43.5%) |
| Transportation & Warehousing | 252 (67.9%) | 119 (32.1%) |
| Utilities | 45 (100.0%) | 0 (0.0%) |
| Information | 28 (62.2%) | 17 (37.8%) |
| Finance & Insurance | 128 (54.0%) | 109 (46.0%) |
| Real Estate, Rental & Leasing | 90 (67.7%) | 43 (32.3%) |
| Professional & Scientific | 296 (59.3%) | 203 (40.7%) |
| Enterprise Management | 0 (0.0%) | 0 (0.0%) |
| Administrative & Support | 95 (72.5%) | 36 (27.5%) |
| Educational Services | 158 (38.7%) | 250 (61.3%) |
| Health Care & Social Assistance | 92 (11.3%) | 720 (88.7%) |
| Arts, Entertainment & Recreation | 34 (34.3%) | 65 (65.7%) |
| Accommodation & Food Services | 105 (37.9%) | 172 (62.1%) |
| Public Administration | 64 (78.0%) | 18 (22.0%) |
| Total | 2,539 (54.1%) | 2,158 (45.9%) |
Education in Economy borough
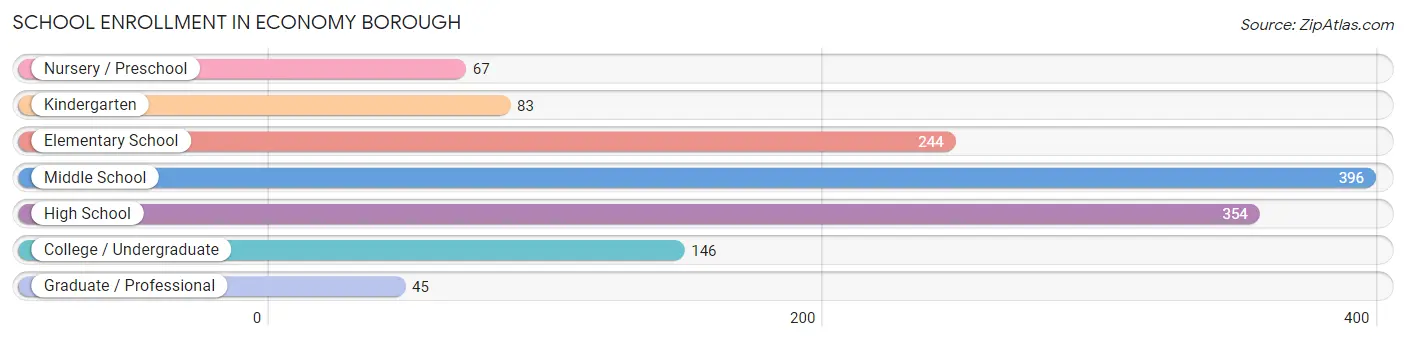
School Enrollment in Economy borough
The most common levels of schooling among the 1,335 students in Economy borough are middle school (396 | 29.7%), high school (354 | 26.5%), and elementary school (244 | 18.3%).
| School Level | # Students | % Students |
| Nursery / Preschool | 67 | 5.0% |
| Kindergarten | 83 | 6.2% |
| Elementary School | 244 | 18.3% |
| Middle School | 396 | 29.7% |
| High School | 354 | 26.5% |
| College / Undergraduate | 146 | 10.9% |
| Graduate / Professional | 45 | 3.4% |
| Total | 1,335 | 100.0% |
School Enrollment by Age by Funding Source in Economy borough
Out of a total of 1,335 students who are enrolled in schools in Economy borough, 199 (14.9%) attend a private institution, while the remaining 1,136 (85.1%) are enrolled in public schools. The age group of 3 to 4 year olds has the highest likelihood of being enrolled in private schools, with 42 (68.9% in the age bracket) enrolled. Conversely, the age group of 15 to 17 year olds has the lowest likelihood of being enrolled in a private school, with 273 (100.0% in the age bracket) attending a public institution.
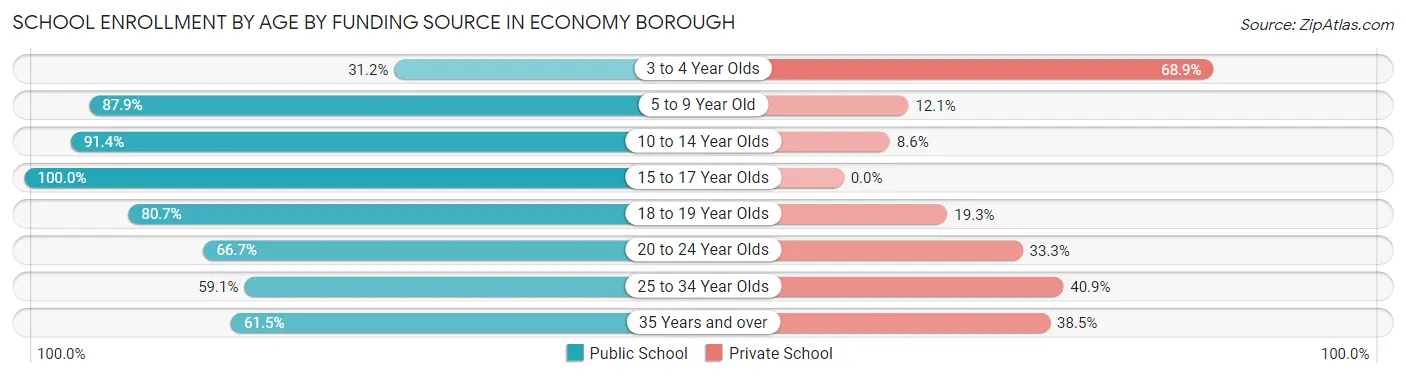
| Age Bracket | Public School | Private School |
| 3 to 4 Year Olds | 19 (31.1%) | 42 (68.9%) |
| 5 to 9 Year Old | 284 (87.9%) | 39 (12.1%) |
| 10 to 14 Year Olds | 382 (91.4%) | 36 (8.6%) |
| 15 to 17 Year Olds | 273 (100.0%) | 0 (0.0%) |
| 18 to 19 Year Olds | 71 (80.7%) | 17 (19.3%) |
| 20 to 24 Year Olds | 36 (66.7%) | 18 (33.3%) |
| 25 to 34 Year Olds | 39 (59.1%) | 27 (40.9%) |
| 35 Years and over | 32 (61.5%) | 20 (38.5%) |
| Total | 1,136 (85.1%) | 199 (14.9%) |
Educational Attainment by Field of Study in Economy borough
Business (663 | 23.7%), education (521 | 18.6%), science & technology (304 | 10.9%), engineering (261 | 9.3%), and social sciences (185 | 6.6%) are the most common fields of study among 2,797 individuals in Economy borough who have obtained a bachelor's degree or higher.
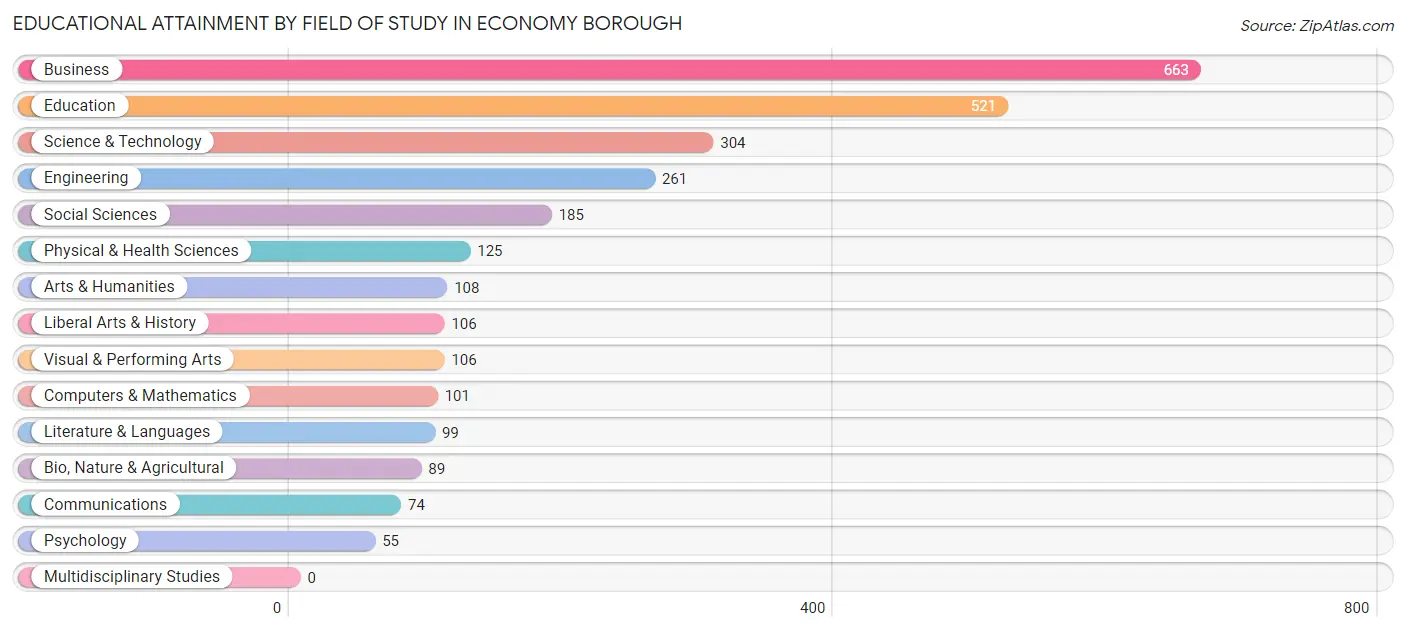
| Field of Study | # Graduates | % Graduates |
| Computers & Mathematics | 101 | 3.6% |
| Bio, Nature & Agricultural | 89 | 3.2% |
| Physical & Health Sciences | 125 | 4.5% |
| Psychology | 55 | 2.0% |
| Social Sciences | 185 | 6.6% |
| Engineering | 261 | 9.3% |
| Multidisciplinary Studies | 0 | 0.0% |
| Science & Technology | 304 | 10.9% |
| Business | 663 | 23.7% |
| Education | 521 | 18.6% |
| Literature & Languages | 99 | 3.5% |
| Liberal Arts & History | 106 | 3.8% |
| Visual & Performing Arts | 106 | 3.8% |
| Communications | 74 | 2.6% |
| Arts & Humanities | 108 | 3.9% |
| Total | 2,797 | 100.0% |
Transportation & Commute in Economy borough
Vehicle Availability by Sex in Economy borough
The most prevalent vehicle ownership categories in Economy borough are males with 2 vehicles (1,160, accounting for 45.9%) and females with 2 vehicles (932, making up 54.8%).
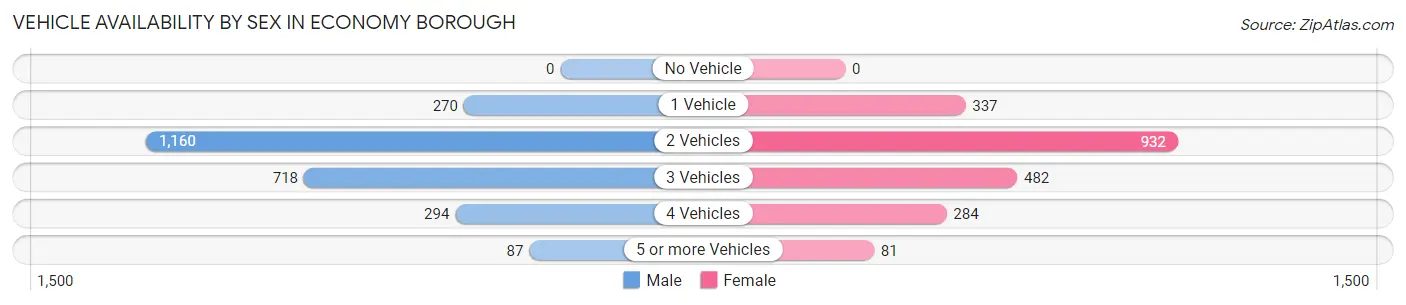
| Vehicles Available | Male | Female |
| No Vehicle | 0 (0.0%) | 0 (0.0%) |
| 1 Vehicle | 270 (10.7%) | 337 (15.9%) |
| 2 Vehicles | 1,160 (45.9%) | 932 (44.1%) |
| 3 Vehicles | 718 (28.4%) | 482 (22.8%) |
| 4 Vehicles | 294 (11.6%) | 284 (13.4%) |
| 5 or more Vehicles | 87 (3.4%) | 81 (3.8%) |
| Total | 2,529 (100.0%) | 2,116 (100.0%) |
Commute Time in Economy borough
The most frequently occuring commute durations in Economy borough are 20 to 24 minutes (740 commuters, 18.1%), 30 to 34 minutes (660 commuters, 16.2%), and 15 to 19 minutes (579 commuters, 14.2%).
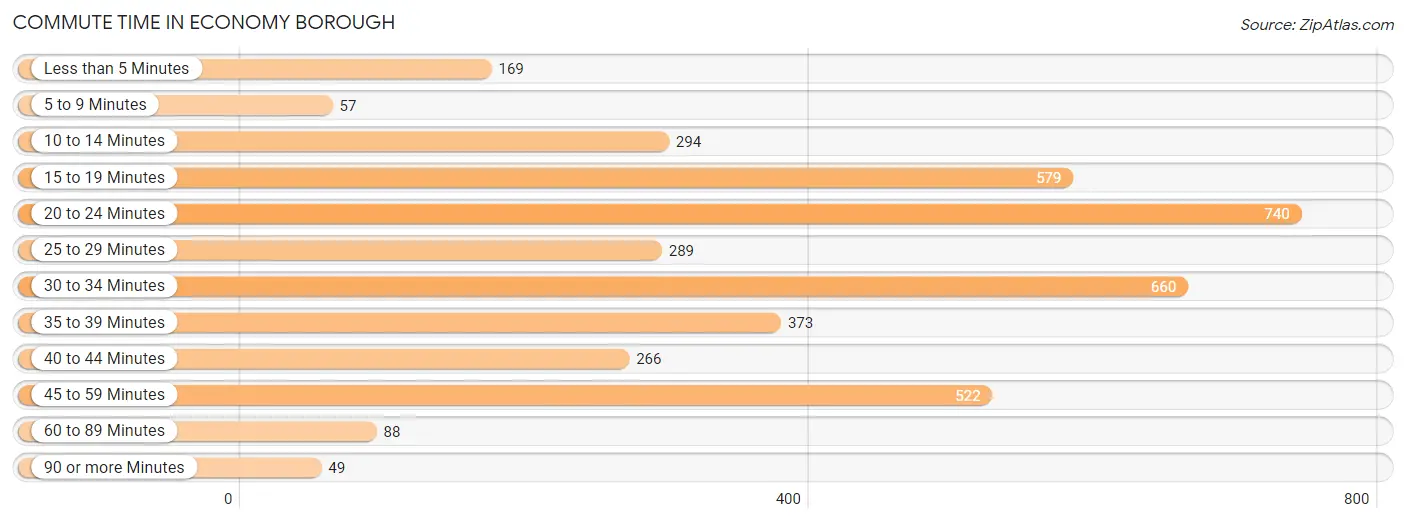
| Commute Time | # Commuters | % Commuters |
| Less than 5 Minutes | 169 | 4.1% |
| 5 to 9 Minutes | 57 | 1.4% |
| 10 to 14 Minutes | 294 | 7.2% |
| 15 to 19 Minutes | 579 | 14.2% |
| 20 to 24 Minutes | 740 | 18.1% |
| 25 to 29 Minutes | 289 | 7.1% |
| 30 to 34 Minutes | 660 | 16.2% |
| 35 to 39 Minutes | 373 | 9.1% |
| 40 to 44 Minutes | 266 | 6.5% |
| 45 to 59 Minutes | 522 | 12.8% |
| 60 to 89 Minutes | 88 | 2.1% |
| 90 or more Minutes | 49 | 1.2% |
Commute Time by Sex in Economy borough
The most common commute times in Economy borough are 20 to 24 minutes (404 commuters, 18.2%) for males and 20 to 24 minutes (336 commuters, 17.9%) for females.
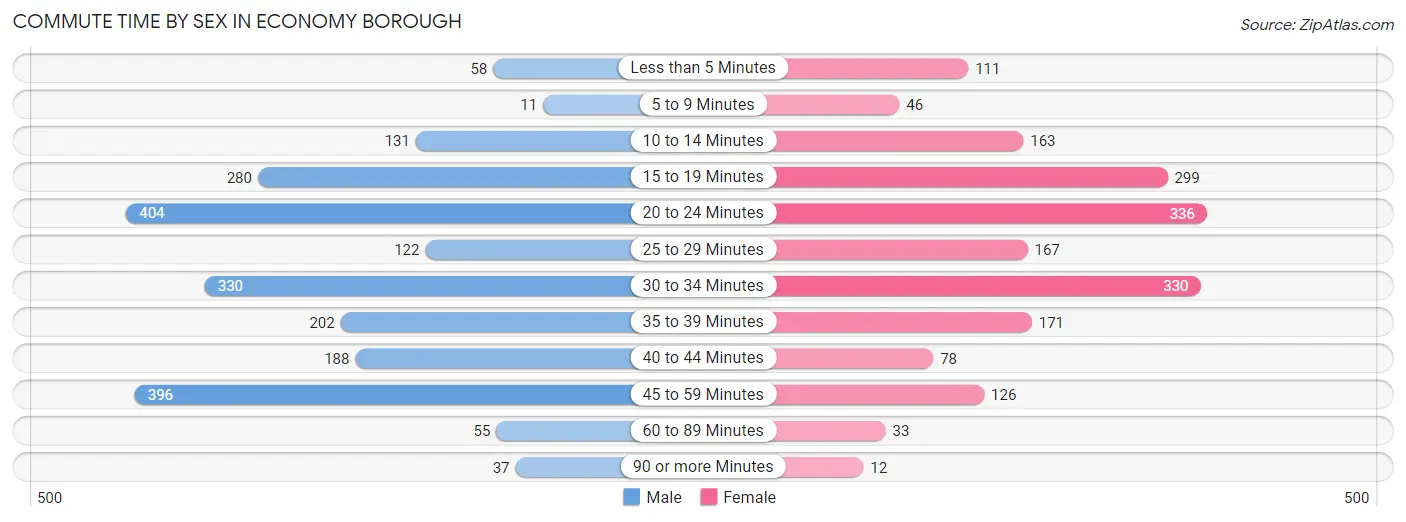
| Commute Time | Male | Female |
| Less than 5 Minutes | 58 (2.6%) | 111 (5.9%) |
| 5 to 9 Minutes | 11 (0.5%) | 46 (2.5%) |
| 10 to 14 Minutes | 131 (5.9%) | 163 (8.7%) |
| 15 to 19 Minutes | 280 (12.7%) | 299 (16.0%) |
| 20 to 24 Minutes | 404 (18.2%) | 336 (17.9%) |
| 25 to 29 Minutes | 122 (5.5%) | 167 (8.9%) |
| 30 to 34 Minutes | 330 (14.9%) | 330 (17.6%) |
| 35 to 39 Minutes | 202 (9.1%) | 171 (9.1%) |
| 40 to 44 Minutes | 188 (8.5%) | 78 (4.2%) |
| 45 to 59 Minutes | 396 (17.9%) | 126 (6.7%) |
| 60 to 89 Minutes | 55 (2.5%) | 33 (1.8%) |
| 90 or more Minutes | 37 (1.7%) | 12 (0.6%) |
Time of Departure to Work by Sex in Economy borough
The most frequent times of departure to work in Economy borough are 7:00 AM to 7:29 AM (491, 22.2%) for males and 7:30 AM to 7:59 AM (297, 15.9%) for females.
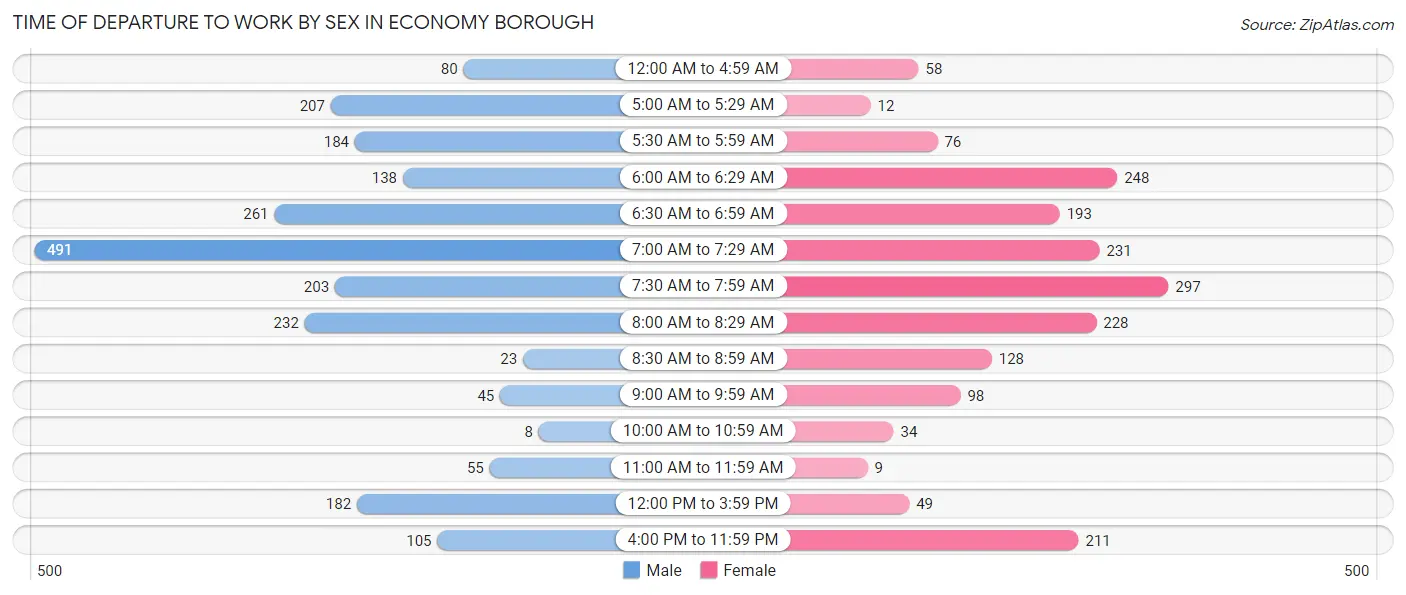
| Time of Departure | Male | Female |
| 12:00 AM to 4:59 AM | 80 (3.6%) | 58 (3.1%) |
| 5:00 AM to 5:29 AM | 207 (9.3%) | 12 (0.6%) |
| 5:30 AM to 5:59 AM | 184 (8.3%) | 76 (4.1%) |
| 6:00 AM to 6:29 AM | 138 (6.2%) | 248 (13.3%) |
| 6:30 AM to 6:59 AM | 261 (11.8%) | 193 (10.3%) |
| 7:00 AM to 7:29 AM | 491 (22.2%) | 231 (12.3%) |
| 7:30 AM to 7:59 AM | 203 (9.2%) | 297 (15.9%) |
| 8:00 AM to 8:29 AM | 232 (10.5%) | 228 (12.2%) |
| 8:30 AM to 8:59 AM | 23 (1.0%) | 128 (6.8%) |
| 9:00 AM to 9:59 AM | 45 (2.0%) | 98 (5.2%) |
| 10:00 AM to 10:59 AM | 8 (0.4%) | 34 (1.8%) |
| 11:00 AM to 11:59 AM | 55 (2.5%) | 9 (0.5%) |
| 12:00 PM to 3:59 PM | 182 (8.2%) | 49 (2.6%) |
| 4:00 PM to 11:59 PM | 105 (4.7%) | 211 (11.3%) |
| Total | 2,214 (100.0%) | 1,872 (100.0%) |
Housing Occupancy in Economy borough
Occupancy by Ownership in Economy borough
Of the total 3,750 dwellings in Economy borough, owner-occupied units account for 3,487 (93.0%), while renter-occupied units make up 263 (7.0%).
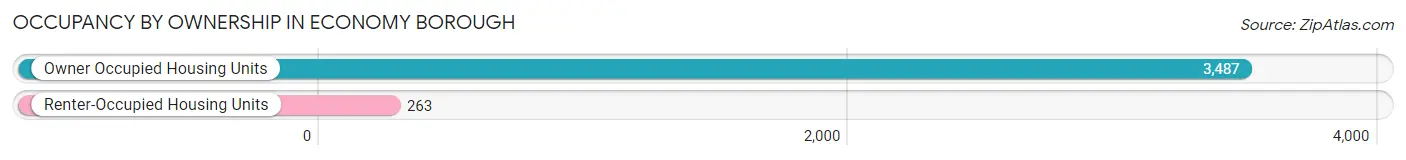
| Occupancy | # Housing Units | % Housing Units |
| Owner Occupied Housing Units | 3,487 | 93.0% |
| Renter-Occupied Housing Units | 263 | 7.0% |
| Total Occupied Housing Units | 3,750 | 100.0% |
Occupancy by Household Size in Economy borough
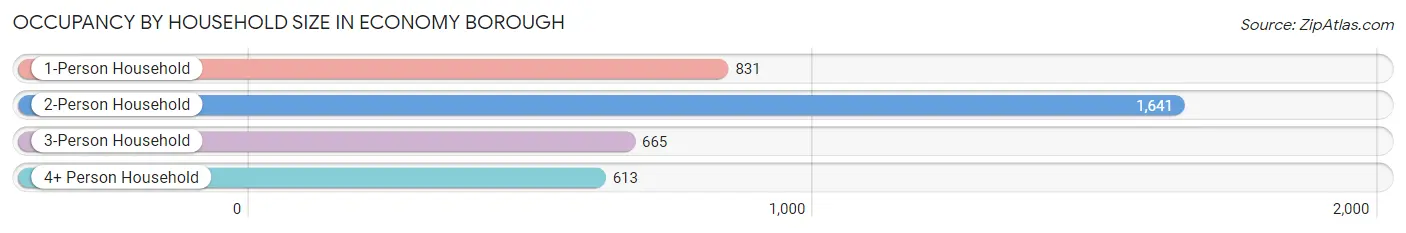
| Household Size | # Housing Units | % Housing Units |
| 1-Person Household | 831 | 22.2% |
| 2-Person Household | 1,641 | 43.8% |
| 3-Person Household | 665 | 17.7% |
| 4+ Person Household | 613 | 16.4% |
| Total Housing Units | 3,750 | 100.0% |
Occupancy by Ownership by Household Size in Economy borough
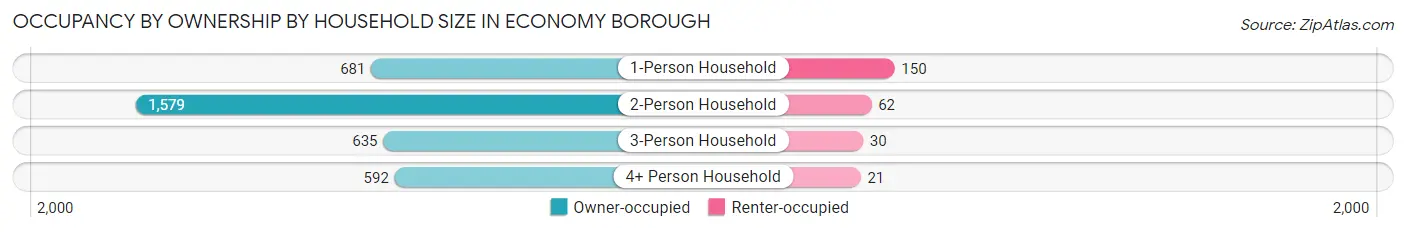
| Household Size | Owner-occupied | Renter-occupied |
| 1-Person Household | 681 (82.0%) | 150 (18.0%) |
| 2-Person Household | 1,579 (96.2%) | 62 (3.8%) |
| 3-Person Household | 635 (95.5%) | 30 (4.5%) |
| 4+ Person Household | 592 (96.6%) | 21 (3.4%) |
| Total Housing Units | 3,487 (93.0%) | 263 (7.0%) |
Occupancy by Educational Attainment in Economy borough
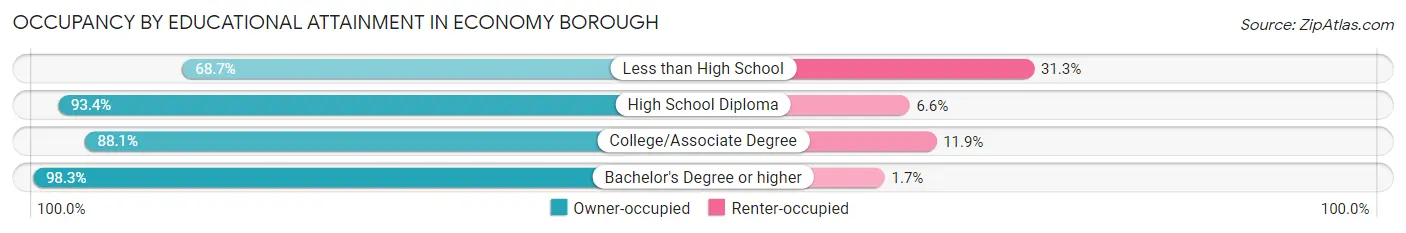
| Household Size | Owner-occupied | Renter-occupied |
| Less than High School | 79 (68.7%) | 36 (31.3%) |
| High School Diploma | 1,031 (93.4%) | 73 (6.6%) |
| College/Associate Degree | 962 (88.1%) | 130 (11.9%) |
| Bachelor's Degree or higher | 1,415 (98.3%) | 24 (1.7%) |
Occupancy by Age of Householder in Economy borough
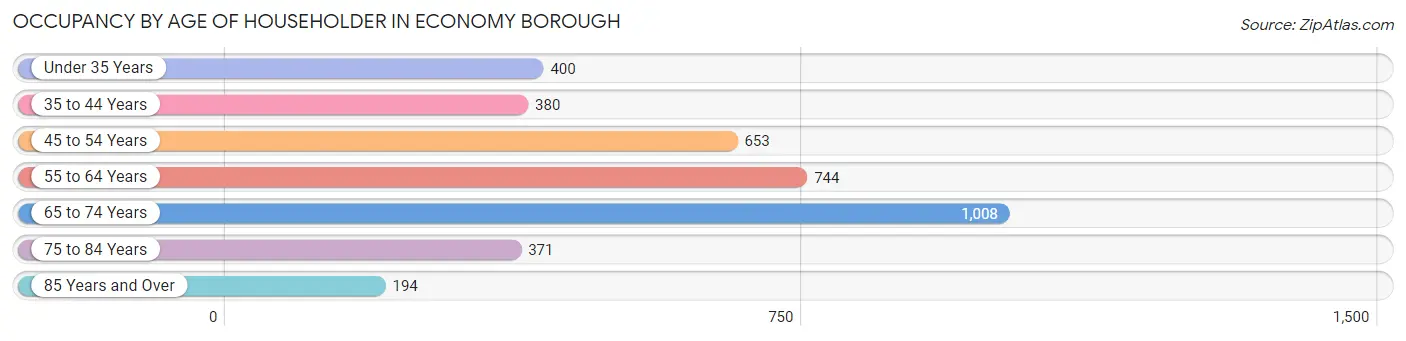
| Age Bracket | # Households | % Households |
| Under 35 Years | 400 | 10.7% |
| 35 to 44 Years | 380 | 10.1% |
| 45 to 54 Years | 653 | 17.4% |
| 55 to 64 Years | 744 | 19.8% |
| 65 to 74 Years | 1,008 | 26.9% |
| 75 to 84 Years | 371 | 9.9% |
| 85 Years and Over | 194 | 5.2% |
| Total | 3,750 | 100.0% |
Housing Finances in Economy borough
Median Income by Occupancy in Economy borough
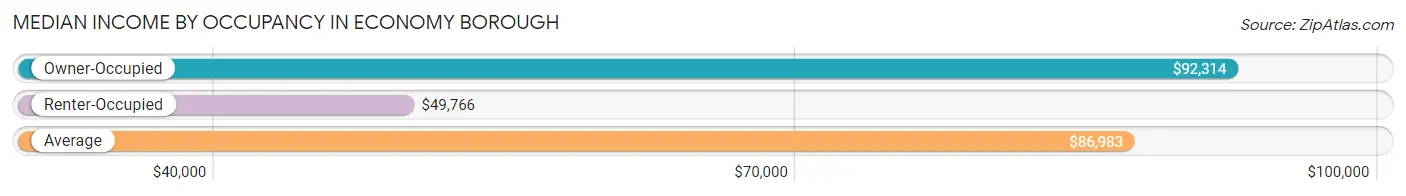
| Occupancy Type | # Households | Median Income |
| Owner-Occupied | 3,487 (93.0%) | $92,314 |
| Renter-Occupied | 263 (7.0%) | $49,766 |
| Average | 3,750 (100.0%) | $86,983 |
Occupancy by Householder Income Bracket in Economy borough
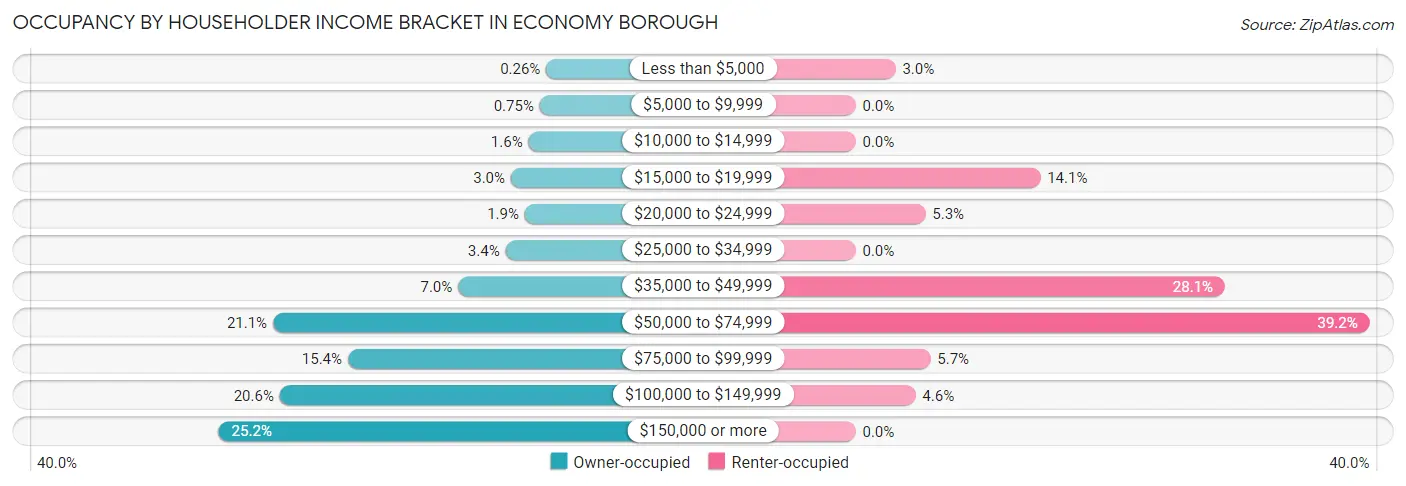
| Income Bracket | Owner-occupied | Renter-occupied |
| Less than $5,000 | 9 (0.3%) | 8 (3.0%) |
| $5,000 to $9,999 | 26 (0.7%) | 0 (0.0%) |
| $10,000 to $14,999 | 56 (1.6%) | 0 (0.0%) |
| $15,000 to $19,999 | 103 (2.9%) | 37 (14.1%) |
| $20,000 to $24,999 | 66 (1.9%) | 14 (5.3%) |
| $25,000 to $34,999 | 117 (3.4%) | 0 (0.0%) |
| $35,000 to $49,999 | 243 (7.0%) | 74 (28.1%) |
| $50,000 to $74,999 | 735 (21.1%) | 103 (39.2%) |
| $75,000 to $99,999 | 536 (15.4%) | 15 (5.7%) |
| $100,000 to $149,999 | 717 (20.6%) | 12 (4.6%) |
| $150,000 or more | 879 (25.2%) | 0 (0.0%) |
| Total | 3,487 (100.0%) | 263 (100.0%) |
Monthly Housing Cost Tiers in Economy borough
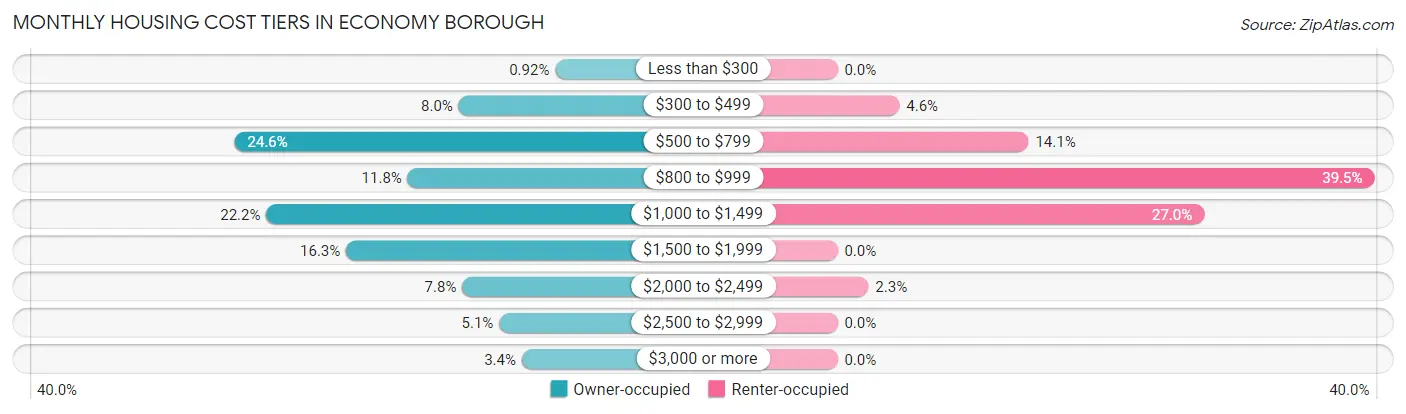
| Monthly Cost | Owner-occupied | Renter-occupied |
| Less than $300 | 32 (0.9%) | 0 (0.0%) |
| $300 to $499 | 280 (8.0%) | 12 (4.6%) |
| $500 to $799 | 856 (24.5%) | 37 (14.1%) |
| $800 to $999 | 411 (11.8%) | 104 (39.5%) |
| $1,000 to $1,499 | 774 (22.2%) | 71 (27.0%) |
| $1,500 to $1,999 | 569 (16.3%) | 0 (0.0%) |
| $2,000 to $2,499 | 271 (7.8%) | 6 (2.3%) |
| $2,500 to $2,999 | 176 (5.1%) | 0 (0.0%) |
| $3,000 or more | 118 (3.4%) | 0 (0.0%) |
| Total | 3,487 (100.0%) | 263 (100.0%) |
Physical Housing Characteristics in Economy borough
Housing Structures in Economy borough
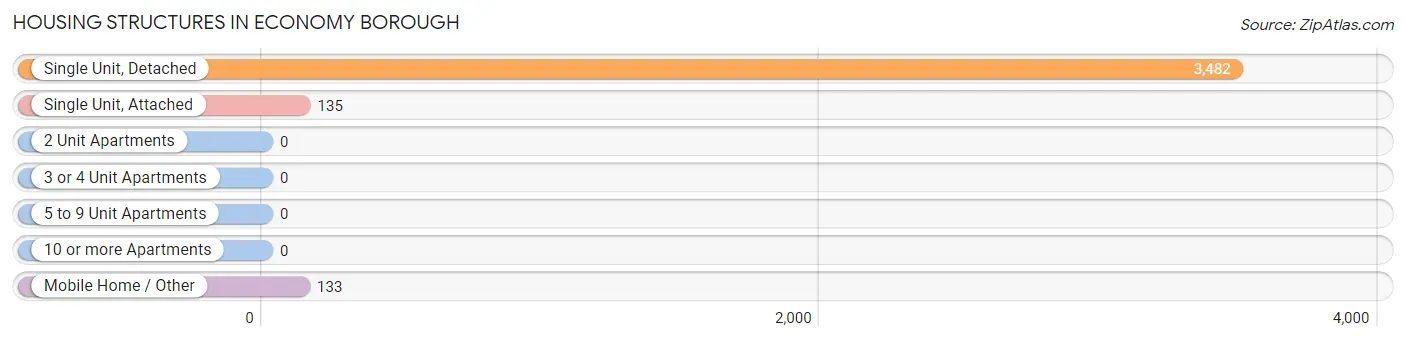
| Structure Type | # Housing Units | % Housing Units |
| Single Unit, Detached | 3,482 | 92.8% |
| Single Unit, Attached | 135 | 3.6% |
| 2 Unit Apartments | 0 | 0.0% |
| 3 or 4 Unit Apartments | 0 | 0.0% |
| 5 to 9 Unit Apartments | 0 | 0.0% |
| 10 or more Apartments | 0 | 0.0% |
| Mobile Home / Other | 133 | 3.5% |
| Total | 3,750 | 100.0% |
Housing Structures by Occupancy in Economy borough
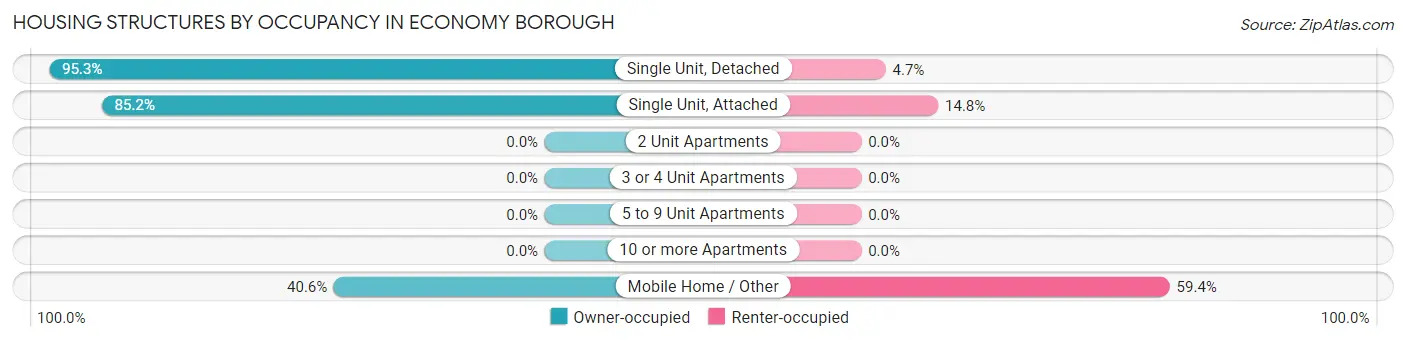
| Structure Type | Owner-occupied | Renter-occupied |
| Single Unit, Detached | 3,318 (95.3%) | 164 (4.7%) |
| Single Unit, Attached | 115 (85.2%) | 20 (14.8%) |
| 2 Unit Apartments | 0 (0.0%) | 0 (0.0%) |
| 3 or 4 Unit Apartments | 0 (0.0%) | 0 (0.0%) |
| 5 to 9 Unit Apartments | 0 (0.0%) | 0 (0.0%) |
| 10 or more Apartments | 0 (0.0%) | 0 (0.0%) |
| Mobile Home / Other | 54 (40.6%) | 79 (59.4%) |
| Total | 3,487 (93.0%) | 263 (7.0%) |
Housing Structures by Number of Rooms in Economy borough
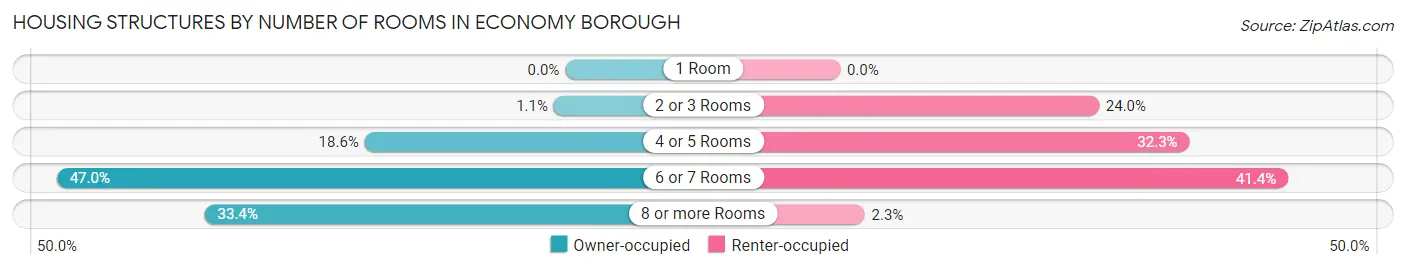
| Number of Rooms | Owner-occupied | Renter-occupied |
| 1 Room | 0 (0.0%) | 0 (0.0%) |
| 2 or 3 Rooms | 37 (1.1%) | 63 (23.9%) |
| 4 or 5 Rooms | 647 (18.5%) | 85 (32.3%) |
| 6 or 7 Rooms | 1,640 (47.0%) | 109 (41.4%) |
| 8 or more Rooms | 1,163 (33.4%) | 6 (2.3%) |
| Total | 3,487 (100.0%) | 263 (100.0%) |
Housing Structure by Heating Type in Economy borough
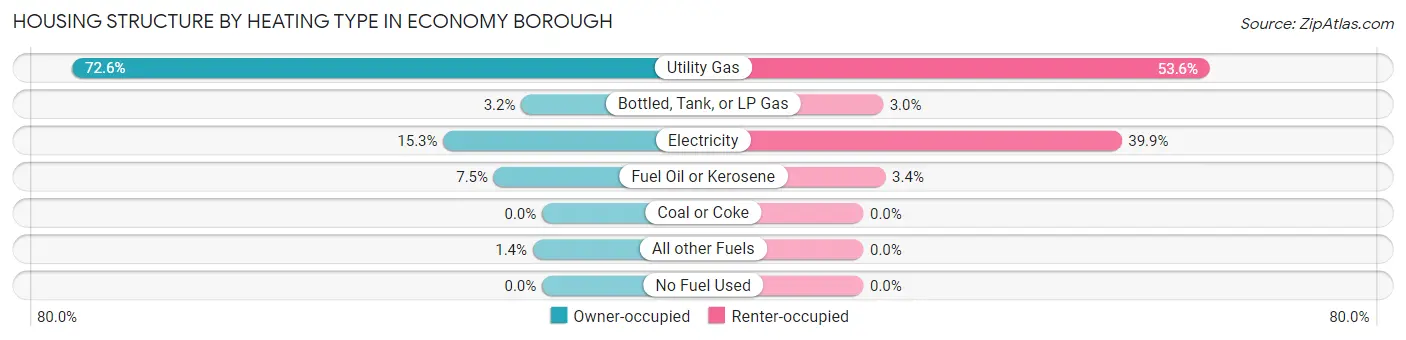
| Heating Type | Owner-occupied | Renter-occupied |
| Utility Gas | 2,533 (72.6%) | 141 (53.6%) |
| Bottled, Tank, or LP Gas | 112 (3.2%) | 8 (3.0%) |
| Electricity | 532 (15.3%) | 105 (39.9%) |
| Fuel Oil or Kerosene | 260 (7.5%) | 9 (3.4%) |
| Coal or Coke | 0 (0.0%) | 0 (0.0%) |
| All other Fuels | 50 (1.4%) | 0 (0.0%) |
| No Fuel Used | 0 (0.0%) | 0 (0.0%) |
| Total | 3,487 (100.0%) | 263 (100.0%) |
Household Vehicle Usage in Economy borough
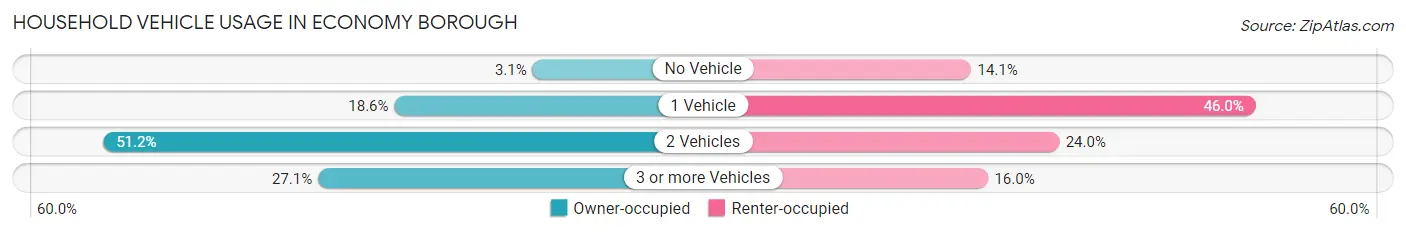
| Vehicles per Household | Owner-occupied | Renter-occupied |
| No Vehicle | 108 (3.1%) | 37 (14.1%) |
| 1 Vehicle | 648 (18.6%) | 121 (46.0%) |
| 2 Vehicles | 1,785 (51.2%) | 63 (23.9%) |
| 3 or more Vehicles | 946 (27.1%) | 42 (16.0%) |
| Total | 3,487 (100.0%) | 263 (100.0%) |
Real Estate & Mortgages in Economy borough
Real Estate and Mortgage Overview in Economy borough
| Characteristic | Without Mortgage | With Mortgage |
| Housing Units | 1,759 | 1,728 |
| Median Property Value | $237,400 | $230,000 |
| Median Household Income | $68,576 | $566 |
| Monthly Housing Costs | $733 | $118 |
| Real Estate Taxes | $3,792 | $23 |
Property Value by Mortgage Status in Economy borough
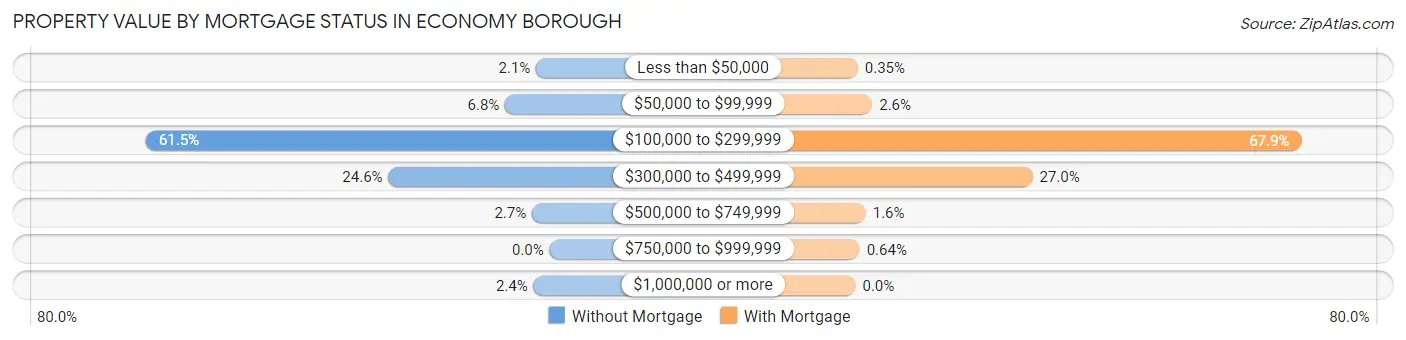
| Property Value | Without Mortgage | With Mortgage |
| Less than $50,000 | 36 (2.1%) | 6 (0.4%) |
| $50,000 to $99,999 | 119 (6.8%) | 44 (2.5%) |
| $100,000 to $299,999 | 1,082 (61.5%) | 1,174 (67.9%) |
| $300,000 to $499,999 | 432 (24.6%) | 466 (27.0%) |
| $500,000 to $749,999 | 47 (2.7%) | 27 (1.6%) |
| $750,000 to $999,999 | 0 (0.0%) | 11 (0.6%) |
| $1,000,000 or more | 43 (2.4%) | 0 (0.0%) |
| Total | 1,759 (100.0%) | 1,728 (100.0%) |
Household Income by Mortgage Status in Economy borough
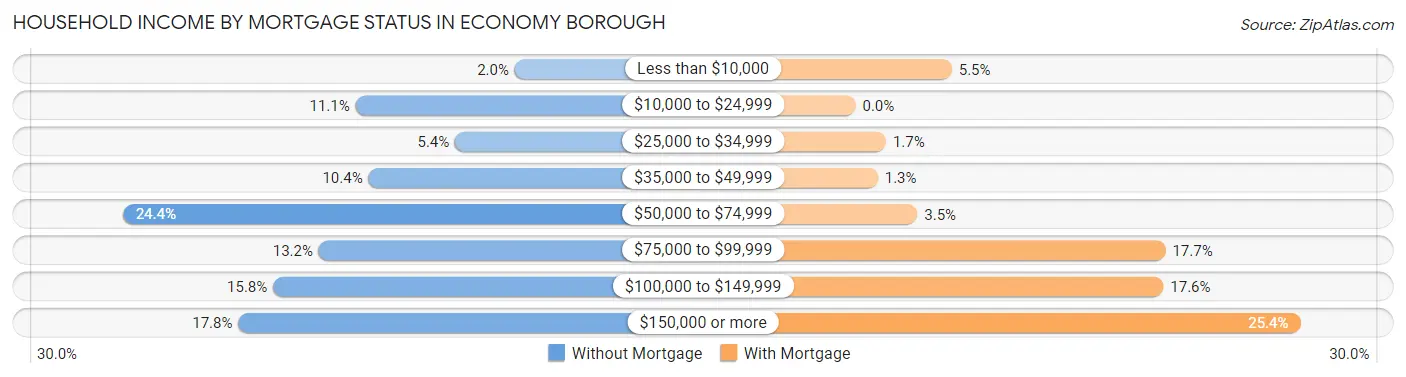
| Household Income | Without Mortgage | With Mortgage |
| Less than $10,000 | 35 (2.0%) | 95 (5.5%) |
| $10,000 to $24,999 | 195 (11.1%) | 0 (0.0%) |
| $25,000 to $34,999 | 95 (5.4%) | 30 (1.7%) |
| $35,000 to $49,999 | 182 (10.3%) | 22 (1.3%) |
| $50,000 to $74,999 | 429 (24.4%) | 61 (3.5%) |
| $75,000 to $99,999 | 232 (13.2%) | 306 (17.7%) |
| $100,000 to $149,999 | 278 (15.8%) | 304 (17.6%) |
| $150,000 or more | 313 (17.8%) | 439 (25.4%) |
| Total | 1,759 (100.0%) | 1,728 (100.0%) |
Property Value to Household Income Ratio in Economy borough
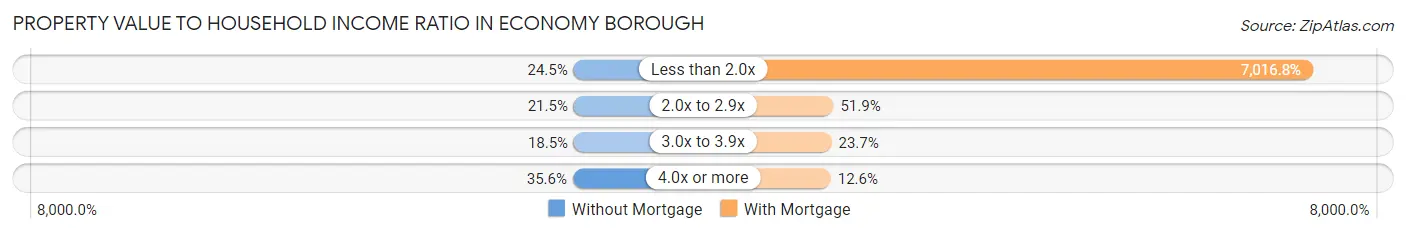
| Value-to-Income Ratio | Without Mortgage | With Mortgage |
| Less than 2.0x | 430 (24.4%) | 121,250 (7,016.8%) |
| 2.0x to 2.9x | 378 (21.5%) | 896 (51.8%) |
| 3.0x to 3.9x | 325 (18.5%) | 410 (23.7%) |
| 4.0x or more | 626 (35.6%) | 217 (12.6%) |
| Total | 1,759 (100.0%) | 1,728 (100.0%) |
Real Estate Taxes by Mortgage Status in Economy borough
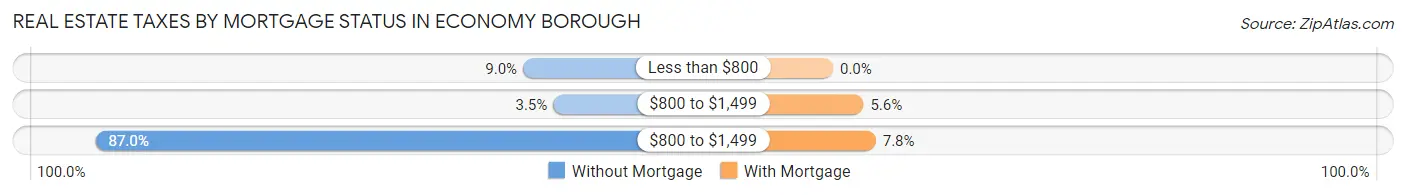
| Property Taxes | Without Mortgage | With Mortgage |
| Less than $800 | 158 (9.0%) | 0 (0.0%) |
| $800 to $1,499 | 61 (3.5%) | 96 (5.6%) |
| $800 to $1,499 | 1,531 (87.0%) | 135 (7.8%) |
| Total | 1,759 (100.0%) | 1,728 (100.0%) |
Health & Disability in Economy borough
Health Insurance Coverage by Age in Economy borough
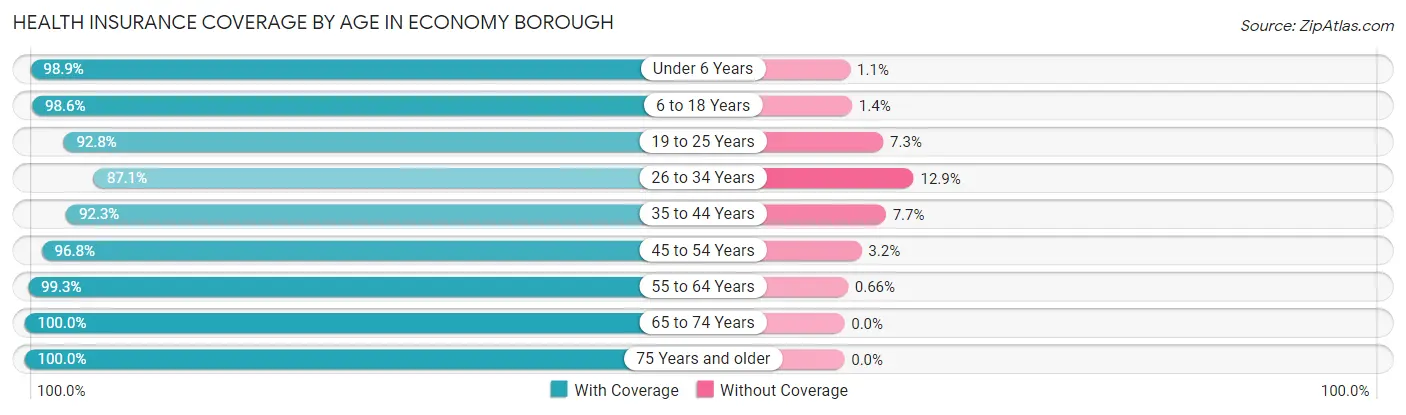
| Age Bracket | With Coverage | Without Coverage |
| Under 6 Years | 454 (98.9%) | 5 (1.1%) |
| 6 to 18 Years | 1,040 (98.6%) | 15 (1.4%) |
| 19 to 25 Years | 422 (92.7%) | 33 (7.2%) |
| 26 to 34 Years | 789 (87.1%) | 117 (12.9%) |
| 35 to 44 Years | 884 (92.3%) | 74 (7.7%) |
| 45 to 54 Years | 1,154 (96.8%) | 38 (3.2%) |
| 55 to 64 Years | 1,504 (99.3%) | 10 (0.7%) |
| 65 to 74 Years | 1,642 (100.0%) | 0 (0.0%) |
| 75 Years and older | 882 (100.0%) | 0 (0.0%) |
| Total | 8,771 (96.8%) | 292 (3.2%) |
Health Insurance Coverage by Citizenship Status in Economy borough
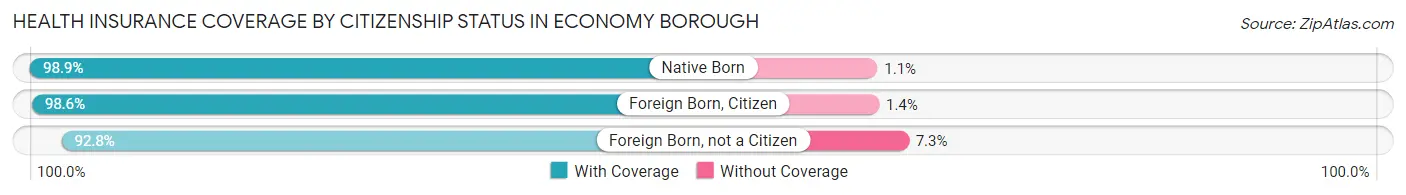
| Citizenship Status | With Coverage | Without Coverage |
| Native Born | 454 (98.9%) | 5 (1.1%) |
| Foreign Born, Citizen | 1,040 (98.6%) | 15 (1.4%) |
| Foreign Born, not a Citizen | 422 (92.7%) | 33 (7.2%) |
Health Insurance Coverage by Household Income in Economy borough
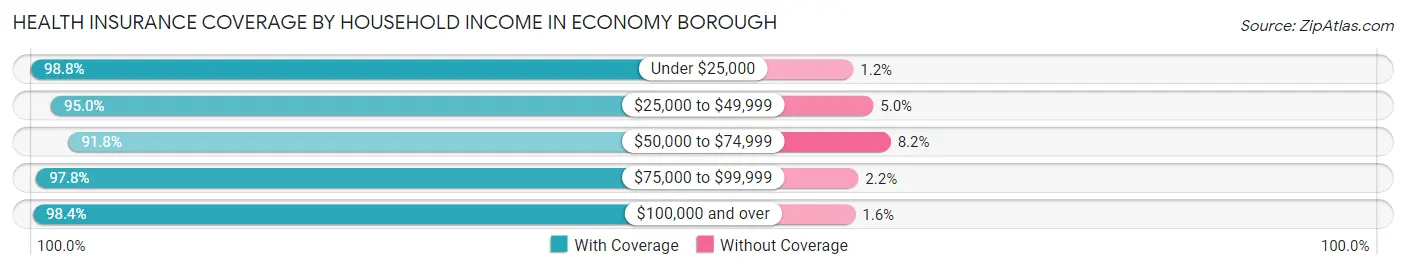
| Household Income | With Coverage | Without Coverage |
| Under $25,000 | 481 (98.8%) | 6 (1.2%) |
| $25,000 to $49,999 | 783 (95.0%) | 41 (5.0%) |
| $50,000 to $74,999 | 1,573 (91.8%) | 141 (8.2%) |
| $75,000 to $99,999 | 1,254 (97.8%) | 28 (2.2%) |
| $100,000 and over | 4,680 (98.4%) | 76 (1.6%) |
Public vs Private Health Insurance Coverage by Age in Economy borough
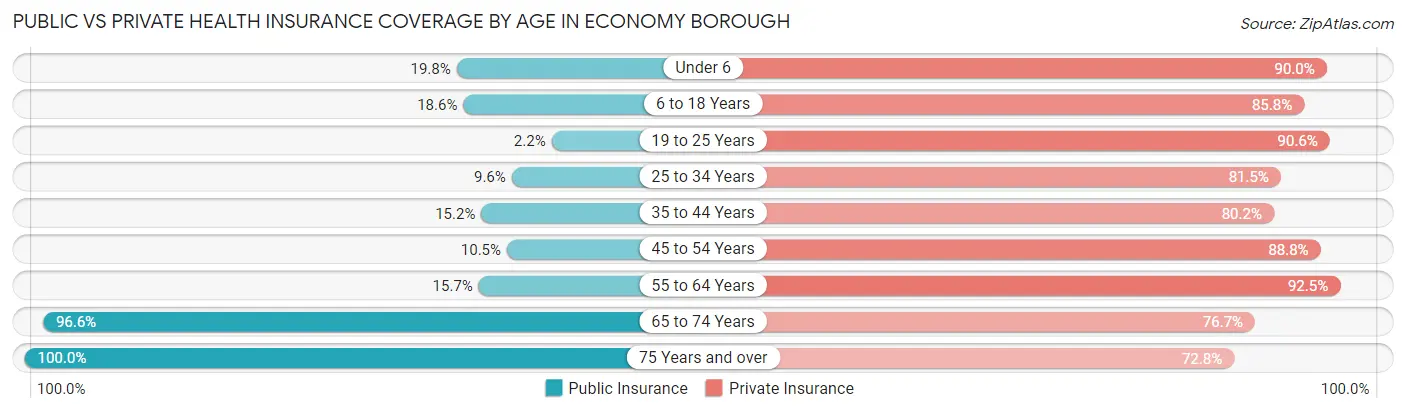
| Age Bracket | Public Insurance | Private Insurance |
| Under 6 | 91 (19.8%) | 413 (90.0%) |
| 6 to 18 Years | 196 (18.6%) | 905 (85.8%) |
| 19 to 25 Years | 10 (2.2%) | 412 (90.5%) |
| 25 to 34 Years | 87 (9.6%) | 738 (81.5%) |
| 35 to 44 Years | 146 (15.2%) | 768 (80.2%) |
| 45 to 54 Years | 125 (10.5%) | 1,059 (88.8%) |
| 55 to 64 Years | 238 (15.7%) | 1,400 (92.5%) |
| 65 to 74 Years | 1,586 (96.6%) | 1,259 (76.7%) |
| 75 Years and over | 882 (100.0%) | 642 (72.8%) |
| Total | 3,361 (37.1%) | 7,596 (83.8%) |
Disability Status by Sex by Age in Economy borough
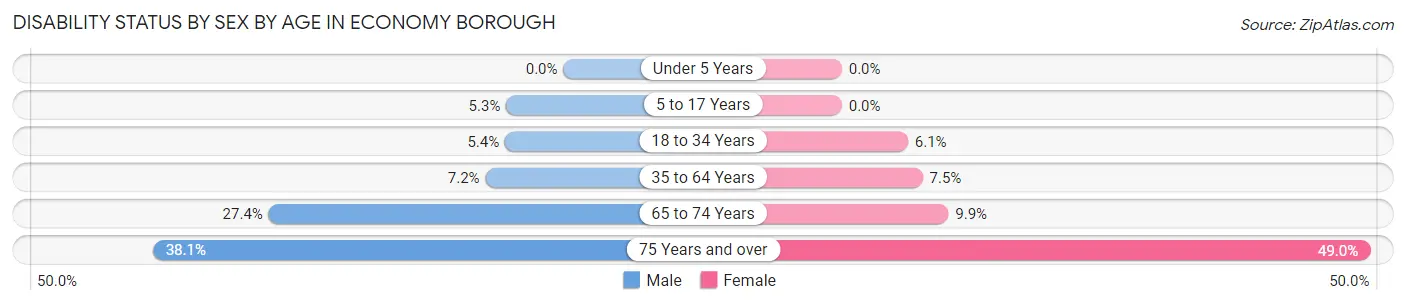
| Age Bracket | Male | Female |
| Under 5 Years | 0 (0.0%) | 0 (0.0%) |
| 5 to 17 Years | 23 (5.3%) | 0 (0.0%) |
| 18 to 34 Years | 42 (5.4%) | 40 (6.1%) |
| 35 to 64 Years | 130 (7.2%) | 140 (7.5%) |
| 65 to 74 Years | 250 (27.4%) | 72 (9.9%) |
| 75 Years and over | 141 (38.1%) | 251 (49.0%) |
Disability Class by Sex by Age in Economy borough
Disability Class: Hearing Difficulty
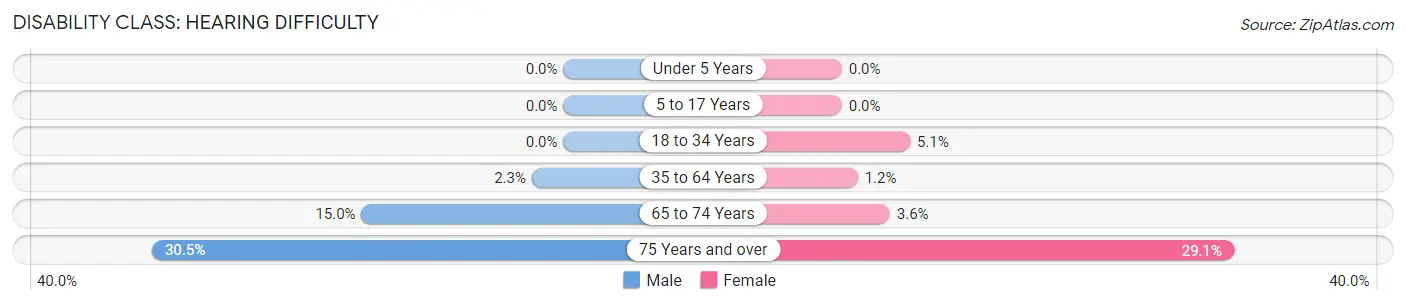
| Age Bracket | Male | Female |
| Under 5 Years | 0 (0.0%) | 0 (0.0%) |
| 5 to 17 Years | 0 (0.0%) | 0 (0.0%) |
| 18 to 34 Years | 0 (0.0%) | 33 (5.1%) |
| 35 to 64 Years | 42 (2.3%) | 22 (1.2%) |
| 65 to 74 Years | 137 (15.0%) | 26 (3.6%) |
| 75 Years and over | 113 (30.5%) | 149 (29.1%) |
Disability Class: Vision Difficulty
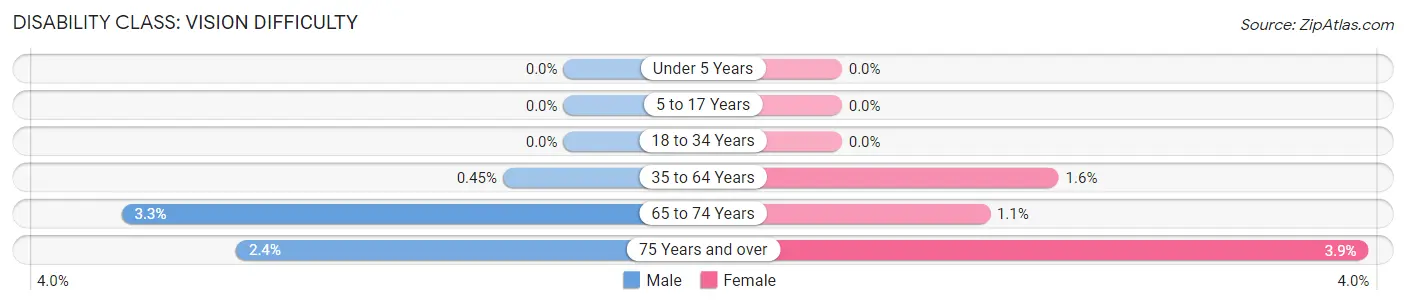
| Age Bracket | Male | Female |
| Under 5 Years | 0 (0.0%) | 0 (0.0%) |
| 5 to 17 Years | 0 (0.0%) | 0 (0.0%) |
| 18 to 34 Years | 0 (0.0%) | 0 (0.0%) |
| 35 to 64 Years | 8 (0.4%) | 30 (1.6%) |
| 65 to 74 Years | 30 (3.3%) | 8 (1.1%) |
| 75 Years and over | 9 (2.4%) | 20 (3.9%) |
Disability Class: Cognitive Difficulty
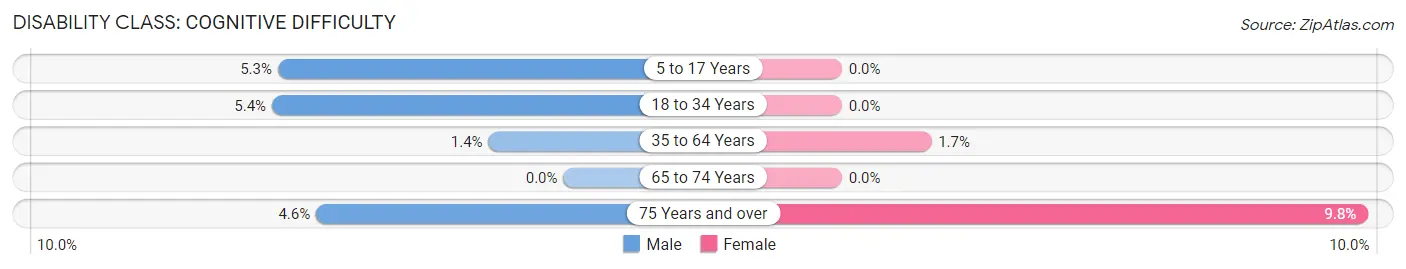
| Age Bracket | Male | Female |
| 5 to 17 Years | 23 (5.3%) | 0 (0.0%) |
| 18 to 34 Years | 42 (5.4%) | 0 (0.0%) |
| 35 to 64 Years | 25 (1.4%) | 31 (1.7%) |
| 65 to 74 Years | 0 (0.0%) | 0 (0.0%) |
| 75 Years and over | 17 (4.6%) | 50 (9.8%) |
Disability Class: Ambulatory Difficulty
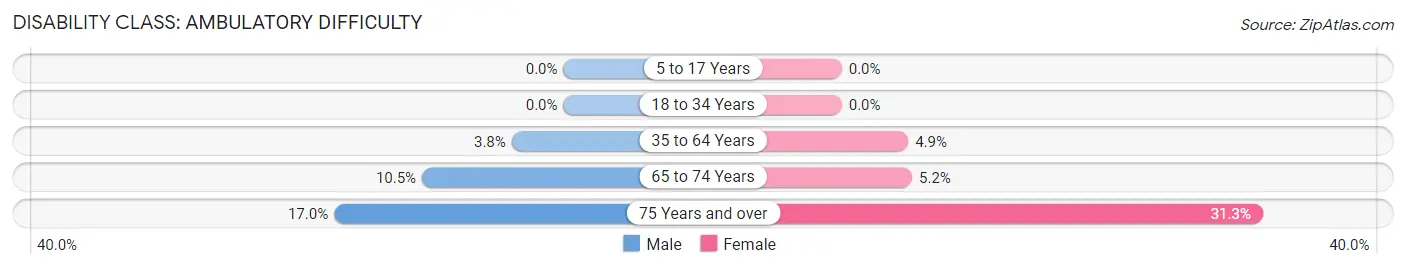
| Age Bracket | Male | Female |
| 5 to 17 Years | 0 (0.0%) | 0 (0.0%) |
| 18 to 34 Years | 0 (0.0%) | 0 (0.0%) |
| 35 to 64 Years | 69 (3.8%) | 92 (4.9%) |
| 65 to 74 Years | 96 (10.5%) | 38 (5.2%) |
| 75 Years and over | 63 (17.0%) | 160 (31.2%) |
Disability Class: Self-Care Difficulty
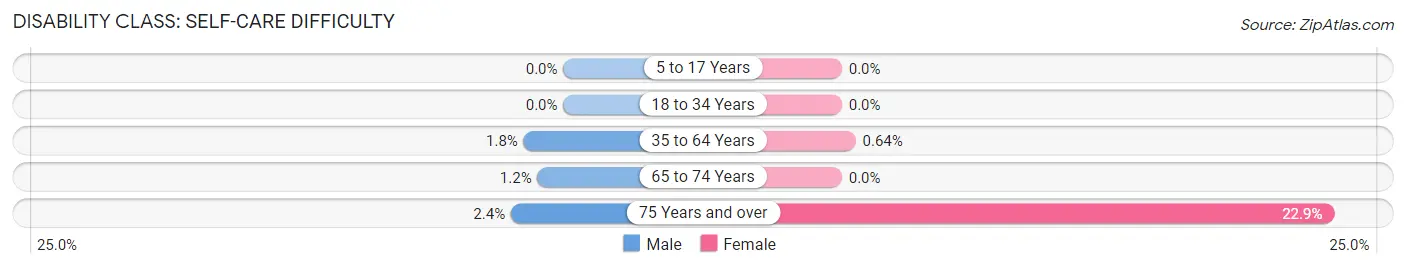
| Age Bracket | Male | Female |
| 5 to 17 Years | 0 (0.0%) | 0 (0.0%) |
| 18 to 34 Years | 0 (0.0%) | 0 (0.0%) |
| 35 to 64 Years | 33 (1.8%) | 12 (0.6%) |
| 65 to 74 Years | 11 (1.2%) | 0 (0.0%) |
| 75 Years and over | 9 (2.4%) | 117 (22.9%) |
Technology Access in Economy borough
Computing Device Access in Economy borough
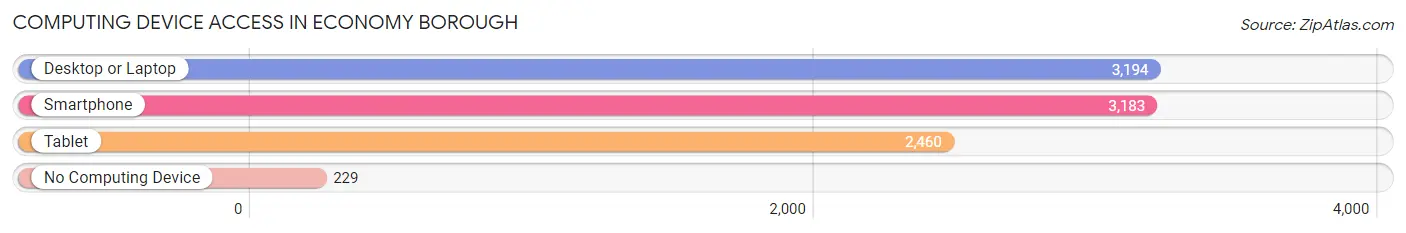
| Device Type | # Households | % Households |
| Desktop or Laptop | 3,194 | 85.2% |
| Smartphone | 3,183 | 84.9% |
| Tablet | 2,460 | 65.6% |
| No Computing Device | 229 | 6.1% |
| Total | 3,750 | 100.0% |
Internet Access in Economy borough
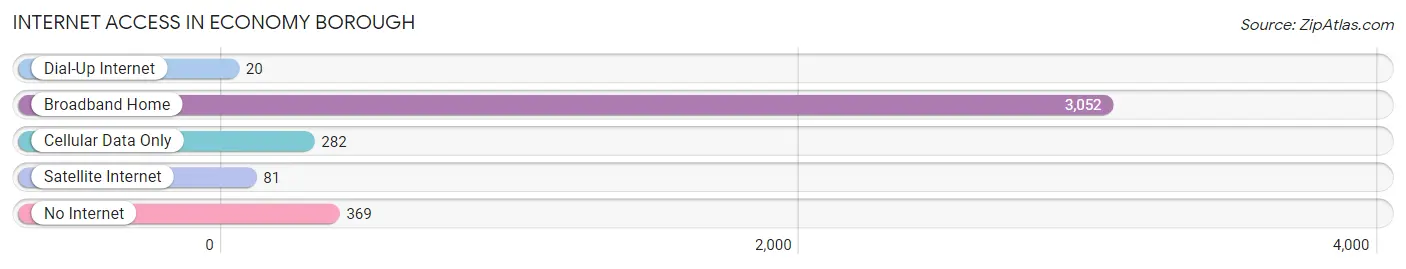
| Internet Type | # Households | % Households |
| Dial-Up Internet | 20 | 0.5% |
| Broadband Home | 3,052 | 81.4% |
| Cellular Data Only | 282 | 7.5% |
| Satellite Internet | 81 | 2.2% |
| No Internet | 369 | 9.8% |
| Total | 3,750 | 100.0% |
Economy borough Summary
Economy Borough is a borough located in Beaver County, Pennsylvania, United States. The population was 1,845 at the 2010 census.
History
Economy Borough was founded in 1832 by a group of settlers from the Economy Society of Economy, Pennsylvania. The Economy Society was a religious group founded by Johann Georg Rapp in 1824. The group was based on the principles of communal living and shared ownership of property. The settlers of Economy Borough were among the first to practice these principles in the United States.
The Economy Society was dissolved in 1832, and the settlers of Economy Borough began to develop the area as a separate community. The first post office was established in 1833, and the borough was officially incorporated in 1836.
Economy Borough was named after the Economy Society, and the name is derived from the Greek word oikonomia, which means “household management.”
Geography
Economy Borough is located at 40 41 17 North 80 17 45 West 40 6879 80 2958
According to the United States Census Bureau, the borough has a total area of 0.7 square miles (1.8 km2), all of it land.
Economy Borough is bordered by the boroughs of Baden and Ambridge to the north, and by the townships of Raccoon and Hanover to the south.
Economy
The economy of Economy Borough is largely based on manufacturing and retail. The borough is home to several factories, including a steel mill, a paper mill, and a plastics plant. The borough also has several retail stores, including a grocery store, a hardware store, and a pharmacy.
Demographics
As of the census of 2000, there were 1,845 people, 745 households, and 517 families residing in the borough. The population density was 2,619.3 people per square mile (1,011.2/km2). There were 790 housing units at an average density of 1,118.2 per square mile (431.2/km2). The racial makeup of the borough was 97.9% White, 0.7% African American, 0.2% Native American, 0.2% Asian, 0.1% from other races, and 0.9% from two or more races. Hispanic or Latino of any race were 0.7% of the population.
There were 745 households, out of which 28.2% had children under the age of 18 living with them, 51.7% were married couples living together, 12.2% had a female householder with no husband present, and 32.2% were non-families. 28.2% of all households were made up of individuals, and 14.2% had someone living alone who was 65 years of age or older. The average household size was 2.47 and the average family size was 3.03.
In the borough the population was spread out, with 22.7% under the age of 18, 7.2% from 18 to 24, 28.2% from 25 to 44, 22.7% from 45 to 64, and 19.2% who were 65 years of age or older. The median age was 40 years. For every 100 females, there were 91.2 males. For every 100 females age 18 and over, there were 87.2 males.
The median income for a household in the borough was $35,938, and the median income for a family was $43,125. Males had a median income of $31,964 versus $22,500 for females. The per capita income for the borough was $17,845. About 6.2% of families and 8.2% of the population were below the poverty line, including 10.2% of those under age 18 and 8.2% of those age 65 or over.
Common Questions
What is Per Capita Income in Economy borough?
Per Capita income in Economy borough is $48,979.
What is the Median Family Income in Economy borough?
Median Family Income in Economy borough is $107,083.
What is the Median Household income in Economy borough?
Median Household Income in Economy borough is $86,983.
What is Income or Wage Gap in Economy borough?
Income or Wage Gap in Economy borough is 30.0%.
Women in Economy borough earn 70.0 cents for every dollar earned by a man.
What is Inequality or Gini Index in Economy borough?
Inequality or Gini Index in Economy borough is 0.42.
What is the Total Population of Economy borough?
Total Population of Economy borough is 9,063.
What is the Total Male Population of Economy borough?
Total Male Population of Economy borough is 4,493.
What is the Total Female Population of Economy borough?
Total Female Population of Economy borough is 4,570.
What is the Ratio of Males per 100 Females in Economy borough?
There are 98.32 Males per 100 Females in Economy borough.
What is the Ratio of Females per 100 Males in Economy borough?
There are 101.71 Females per 100 Males in Economy borough.
What is the Median Population Age in Economy borough?
Median Population Age in Economy borough is 50.9 Years.
What is the Average Family Size in Economy borough
Average Family Size in Economy borough is 2.8 People.
What is the Average Household Size in Economy borough
Average Household Size in Economy borough is 2.4 People.
How Large is the Labor Force in Economy borough?
There are 4,858 People in the Labor Forcein in Economy borough.
What is the Percentage of People in the Labor Force in Economy borough?
62.0% of People are in the Labor Force in Economy borough.
What is the Unemployment Rate in Economy borough?
Unemployment Rate in Economy borough is 3.3%.