Earlston, PA Map & Demographics
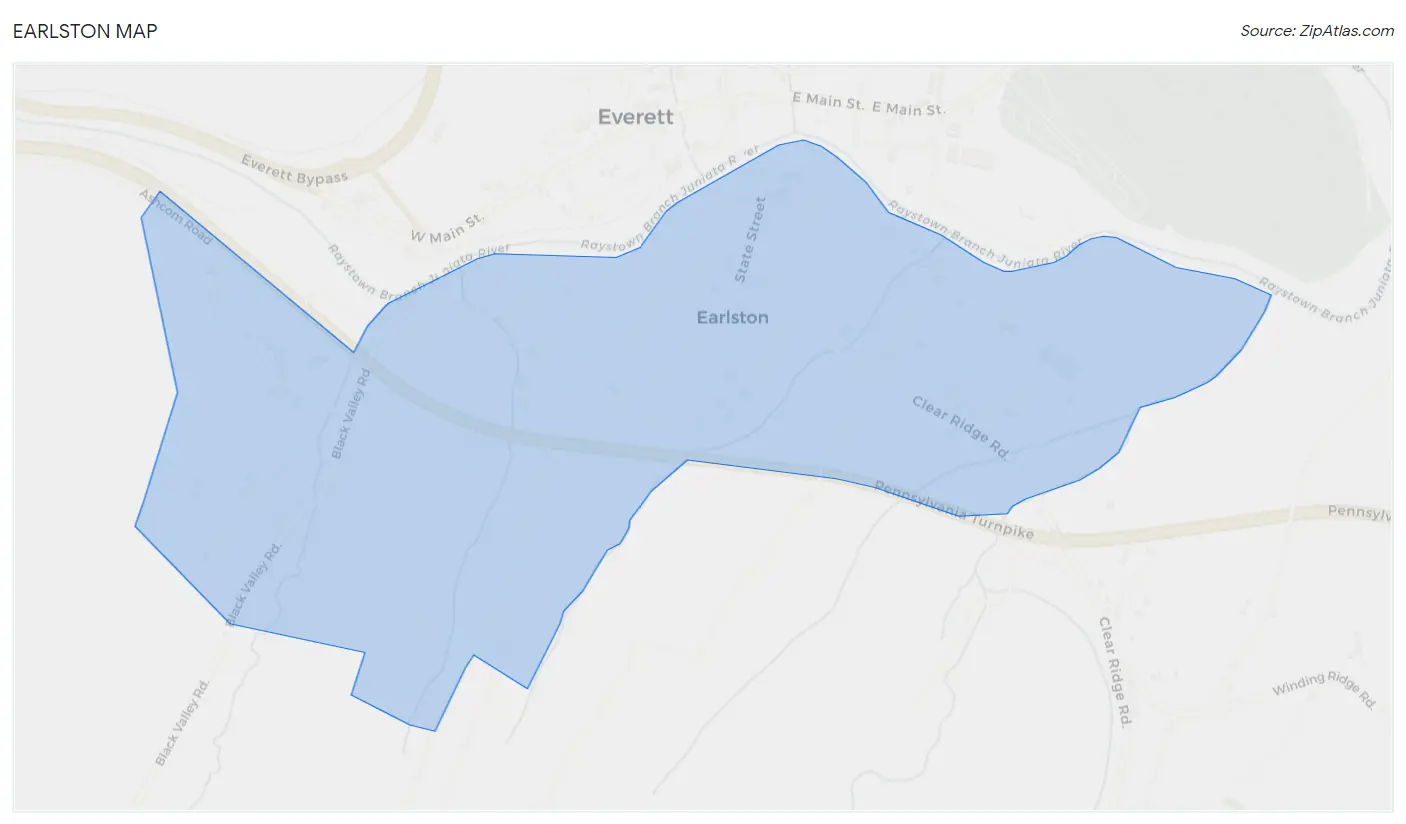
Earlston Map
Earlston Overview
$32,655
PER CAPITA INCOME
$73,221
AVG FAMILY INCOME
$58,866
AVG HOUSEHOLD INCOME
13.5%
WAGE / INCOME GAP [ % ]
86.5¢/ $1
WAGE / INCOME GAP [ $ ]
0.35
INEQUALITY / GINI INDEX
971
TOTAL POPULATION
439
MALE POPULATION
532
FEMALE POPULATION
82.52
MALES / 100 FEMALES
121.18
FEMALES / 100 MALES
41.6
MEDIAN AGE
2.8
AVG FAMILY SIZE
2.2
AVG HOUSEHOLD SIZE
593
LABOR FORCE [ PEOPLE ]
67.4%
PERCENT IN LABOR FORCE
3.0%
UNEMPLOYMENT RATE
Income in Earlston
Income Overview in Earlston
Per Capita Income in Earlston is $32,655, while median incomes of families and households are $73,221 and $58,866 respectively.
| Characteristic | Number | Measure |
| Per Capita Income | 971 | $32,655 |
| Median Family Income | 231 | $73,221 |
| Mean Family Income | 231 | $80,088 |
| Median Household Income | 445 | $58,866 |
| Mean Household Income | 445 | $66,524 |
| Income Deficit | 231 | $0 |
| Wage / Income Gap (%) | 971 | 13.49% |
| Wage / Income Gap ($) | 971 | 86.51¢ per $1 |
| Gini / Inequality Index | 971 | 0.35 |
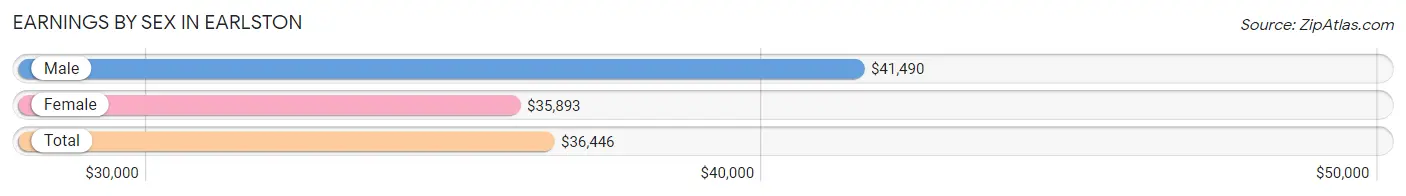
Earnings by Sex in Earlston
Average Earnings in Earlston are $36,446, $41,490 for men and $35,893 for women, a difference of 13.5%.
| Sex | Number | Average Earnings |
| Male | 285 (48.1%) | $41,490 |
| Female | 308 (51.9%) | $35,893 |
| Total | 593 (100.0%) | $36,446 |
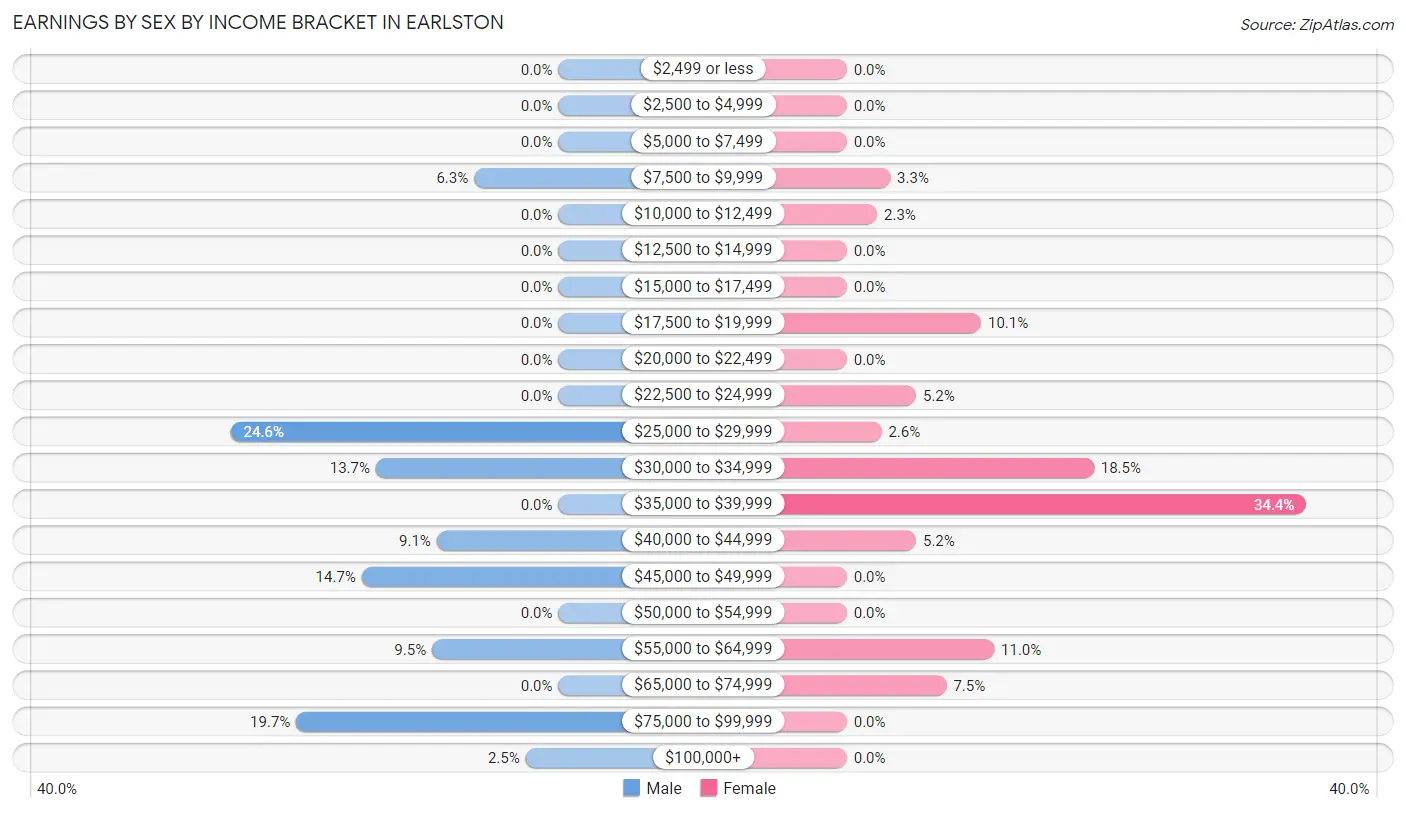
Earnings by Sex by Income Bracket in Earlston
The most common earnings brackets in Earlston are $25,000 to $29,999 for men (70 | 24.6%) and $35,000 to $39,999 for women (106 | 34.4%).
| Income | Male | Female |
| $2,499 or less | 0 (0.0%) | 0 (0.0%) |
| $2,500 to $4,999 | 0 (0.0%) | 0 (0.0%) |
| $5,000 to $7,499 | 0 (0.0%) | 0 (0.0%) |
| $7,500 to $9,999 | 18 (6.3%) | 10 (3.3%) |
| $10,000 to $12,499 | 0 (0.0%) | 7 (2.3%) |
| $12,500 to $14,999 | 0 (0.0%) | 0 (0.0%) |
| $15,000 to $17,499 | 0 (0.0%) | 0 (0.0%) |
| $17,500 to $19,999 | 0 (0.0%) | 31 (10.1%) |
| $20,000 to $22,499 | 0 (0.0%) | 0 (0.0%) |
| $22,500 to $24,999 | 0 (0.0%) | 16 (5.2%) |
| $25,000 to $29,999 | 70 (24.6%) | 8 (2.6%) |
| $30,000 to $34,999 | 39 (13.7%) | 57 (18.5%) |
| $35,000 to $39,999 | 0 (0.0%) | 106 (34.4%) |
| $40,000 to $44,999 | 26 (9.1%) | 16 (5.2%) |
| $45,000 to $49,999 | 42 (14.7%) | 0 (0.0%) |
| $50,000 to $54,999 | 0 (0.0%) | 0 (0.0%) |
| $55,000 to $64,999 | 27 (9.5%) | 34 (11.0%) |
| $65,000 to $74,999 | 0 (0.0%) | 23 (7.5%) |
| $75,000 to $99,999 | 56 (19.7%) | 0 (0.0%) |
| $100,000+ | 7 (2.5%) | 0 (0.0%) |
| Total | 285 (100.0%) | 308 (100.0%) |
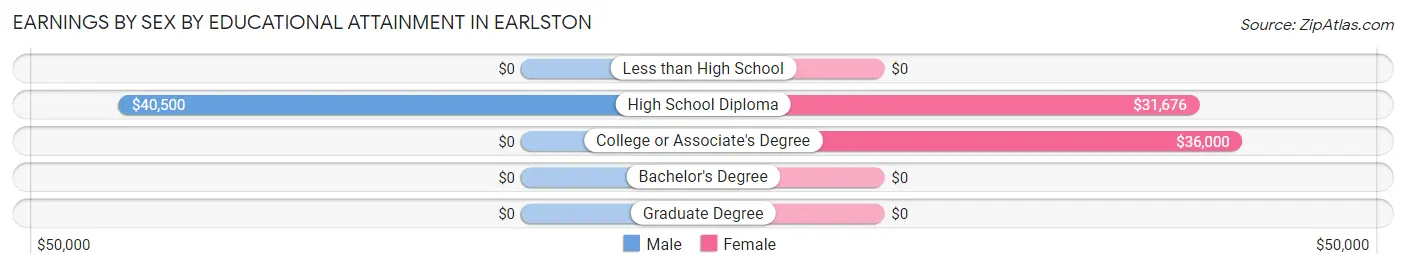
Earnings by Sex by Educational Attainment in Earlston
Average earnings in Earlston are $47,976 for men and $36,107 for women, a difference of 24.7%. Men with an educational attainment of high school diploma enjoy the highest average annual earnings of $40,500, while those with high school diploma education earn the least with $40,500. Women with an educational attainment of college or associate's degree earn the most with the average annual earnings of $36,000, while those with high school diploma education have the smallest earnings of $31,676.
| Educational Attainment | Male Income | Female Income |
| Less than High School | - | - |
| High School Diploma | $40,500 | $31,676 |
| College or Associate's Degree | - | - |
| Bachelor's Degree | - | - |
| Graduate Degree | - | - |
| Total | $47,976 | $36,107 |
Family Income in Earlston
Family Income Brackets in Earlston
According to the Earlston family income data, there are 68 families falling into the $25,000 to $34,999 income range, which is the most common income bracket and makes up 29.4% of all families.
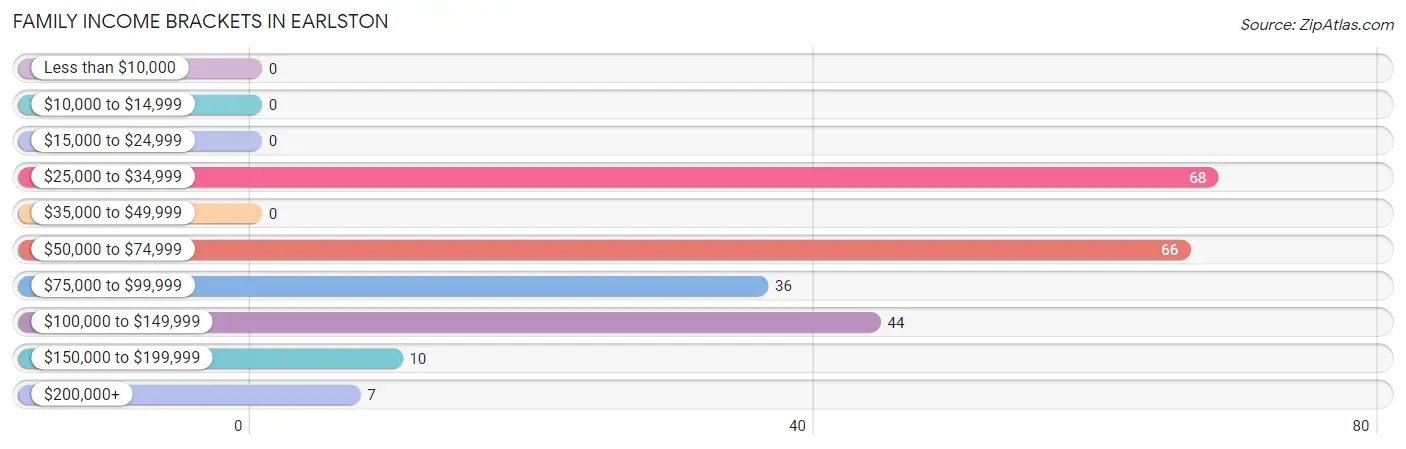
| Income Bracket | # Families | % Families |
| Less than $10,000 | 0 | 0.0% |
| $10,000 to $14,999 | 0 | 0.0% |
| $15,000 to $24,999 | 0 | 0.0% |
| $25,000 to $34,999 | 68 | 29.4% |
| $35,000 to $49,999 | 0 | 0.0% |
| $50,000 to $74,999 | 66 | 28.6% |
| $75,000 to $99,999 | 36 | 15.6% |
| $100,000 to $149,999 | 44 | 19.0% |
| $150,000 to $199,999 | 10 | 4.3% |
| $200,000+ | 7 | 3.0% |
Family Income by Famaliy Size in Earlston
2-person families (157 | 68.0%) account for the highest median family income in Earlston with $58,672 per family, while 2-person families (157 | 68.0%) have the highest median income of $29,336 per family member.
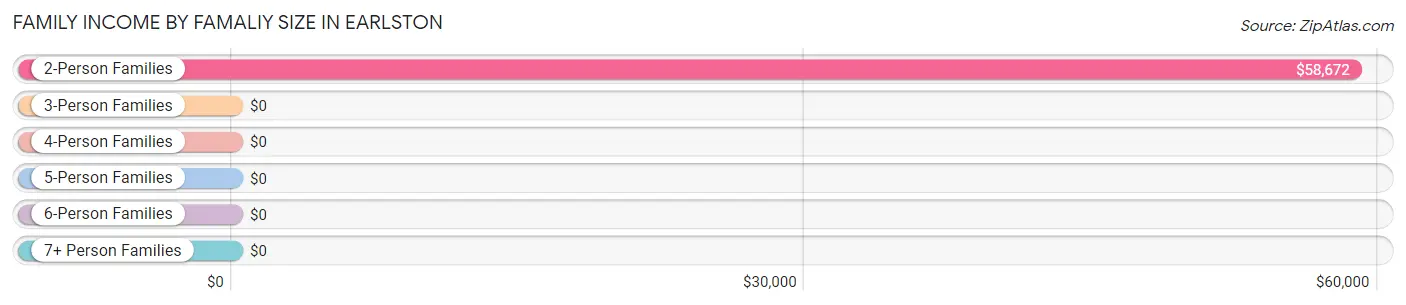
| Income Bracket | # Families | Median Income |
| 2-Person Families | 157 (68.0%) | $58,672 |
| 3-Person Families | 20 (8.7%) | $0 |
| 4-Person Families | 54 (23.4%) | $0 |
| 5-Person Families | 0 (0.0%) | $0 |
| 6-Person Families | 0 (0.0%) | $0 |
| 7+ Person Families | 0 (0.0%) | $0 |
| Total | 231 (100.0%) | $73,221 |
Family Income by Number of Earners in Earlston
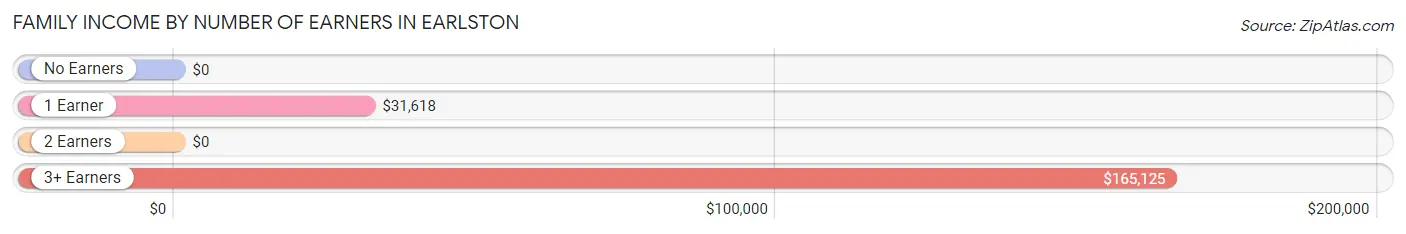
| Number of Earners | # Families | Median Income |
| No Earners | 50 (21.6%) | $0 |
| 1 Earner | 88 (38.1%) | $31,618 |
| 2 Earners | 60 (26.0%) | $0 |
| 3+ Earners | 33 (14.3%) | $165,125 |
| Total | 231 (100.0%) | $73,221 |
Household Income in Earlston
Household Income Brackets in Earlston
With 123 households falling in the category, the $50,000 to $74,999 income range is the most frequent in Earlston, accounting for 27.6% of all households.
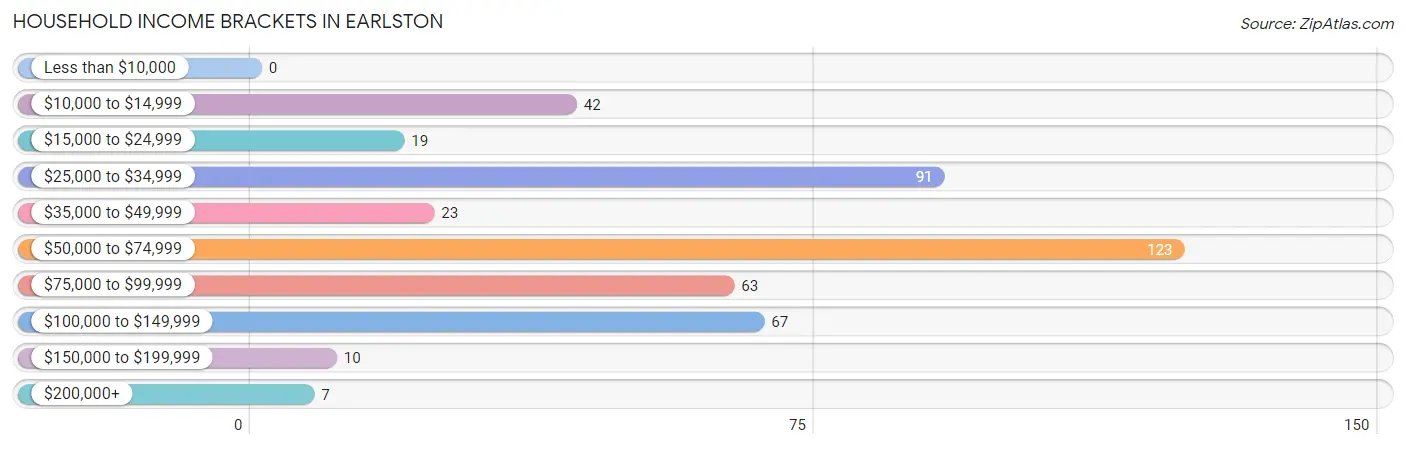
| Income Bracket | # Households | % Households |
| Less than $10,000 | 0 | 0.0% |
| $10,000 to $14,999 | 42 | 9.4% |
| $15,000 to $24,999 | 19 | 4.3% |
| $25,000 to $34,999 | 91 | 20.4% |
| $35,000 to $49,999 | 23 | 5.2% |
| $50,000 to $74,999 | 123 | 27.6% |
| $75,000 to $99,999 | 63 | 14.2% |
| $100,000 to $149,999 | 67 | 15.1% |
| $150,000 to $199,999 | 10 | 2.2% |
| $200,000+ | 7 | 1.6% |
Household Income by Householder Age in Earlston
The median household income in Earlston is $58,866, with the highest median household income of $95,509 found in the 45 to 64 years age bracket for the primary householder. A total of 165 households (37.1%) fall into this category. Meanwhile, the 15 to 24 years age bracket for the primary householder has the lowest median household income of $0, with 41 households (9.2%) in this group.
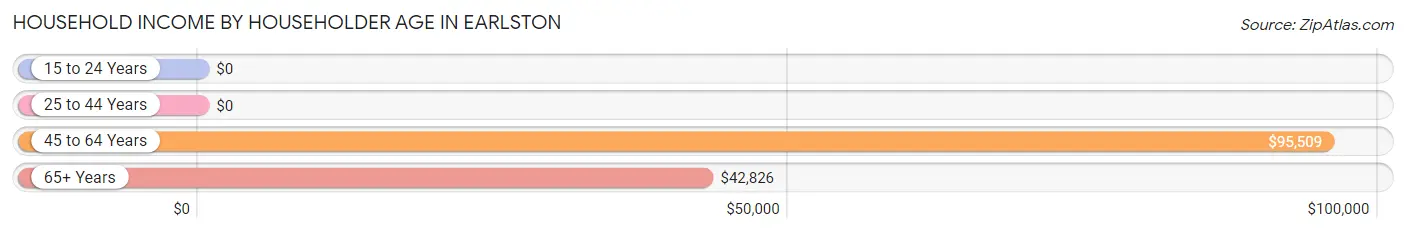
| Income Bracket | # Households | Median Income |
| 15 to 24 Years | 41 (9.2%) | $0 |
| 25 to 44 Years | 111 (24.9%) | $0 |
| 45 to 64 Years | 165 (37.1%) | $95,509 |
| 65+ Years | 128 (28.8%) | $42,826 |
| Total | 445 (100.0%) | $58,866 |
Poverty in Earlston
Income Below Poverty by Sex and Age in Earlston
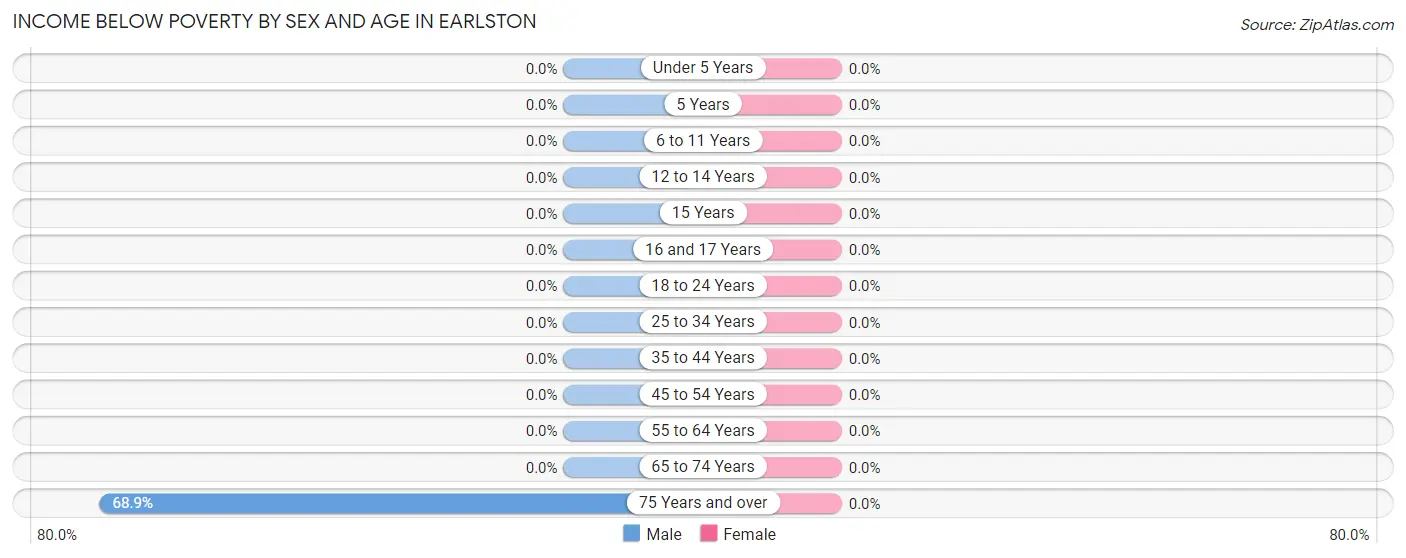
| Age Bracket | Male | Female |
| Under 5 Years | 0 (0.0%) | 0 (0.0%) |
| 5 Years | 0 (0.0%) | 0 (0.0%) |
| 6 to 11 Years | 0 (0.0%) | 0 (0.0%) |
| 12 to 14 Years | 0 (0.0%) | 0 (0.0%) |
| 15 Years | 0 (0.0%) | 0 (0.0%) |
| 16 and 17 Years | 0 (0.0%) | 0 (0.0%) |
| 18 to 24 Years | 0 (0.0%) | 0 (0.0%) |
| 25 to 34 Years | 0 (0.0%) | 0 (0.0%) |
| 35 to 44 Years | 0 (0.0%) | 0 (0.0%) |
| 45 to 54 Years | 0 (0.0%) | 0 (0.0%) |
| 55 to 64 Years | 0 (0.0%) | 0 (0.0%) |
| 65 to 74 Years | 0 (0.0%) | 0 (0.0%) |
| 75 Years and over | 42 (68.9%) | 0 (0.0%) |
| Total | 42 (9.6%) | 0 (0.0%) |
Income Above Poverty by Sex and Age in Earlston
According to the poverty statistics in Earlston, males aged 6 to 11 years and females aged 6 to 11 years are the age groups that are most secure financially, with 100.0% of males and 100.0% of females in these age groups living above the poverty line.
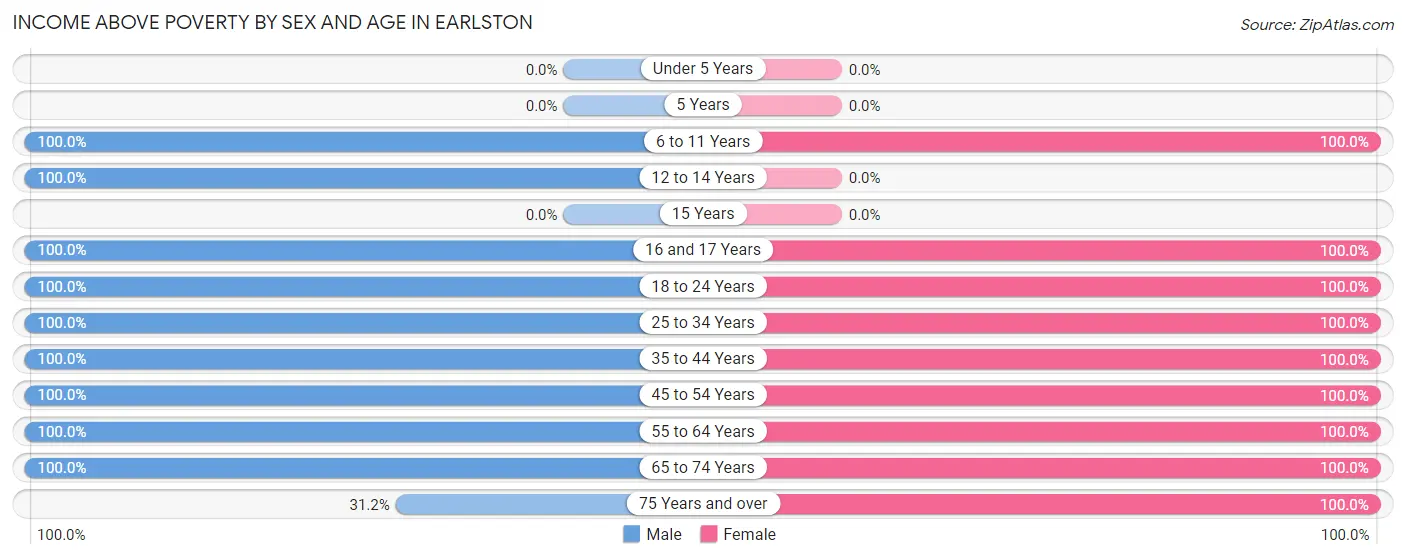
| Age Bracket | Male | Female |
| Under 5 Years | 0 (0.0%) | 0 (0.0%) |
| 5 Years | 0 (0.0%) | 0 (0.0%) |
| 6 to 11 Years | 27 (100.0%) | 26 (100.0%) |
| 12 to 14 Years | 16 (100.0%) | 0 (0.0%) |
| 15 Years | 0 (0.0%) | 0 (0.0%) |
| 16 and 17 Years | 18 (100.0%) | 46 (100.0%) |
| 18 to 24 Years | 43 (100.0%) | 58 (100.0%) |
| 25 to 34 Years | 63 (100.0%) | 104 (100.0%) |
| 35 to 44 Years | 16 (100.0%) | 87 (100.0%) |
| 45 to 54 Years | 122 (100.0%) | 26 (100.0%) |
| 55 to 64 Years | 49 (100.0%) | 77 (100.0%) |
| 65 to 74 Years | 24 (100.0%) | 47 (100.0%) |
| 75 Years and over | 19 (31.1%) | 39 (100.0%) |
| Total | 397 (90.4%) | 510 (100.0%) |
Income Below Poverty Among Married-Couple Families in Earlston
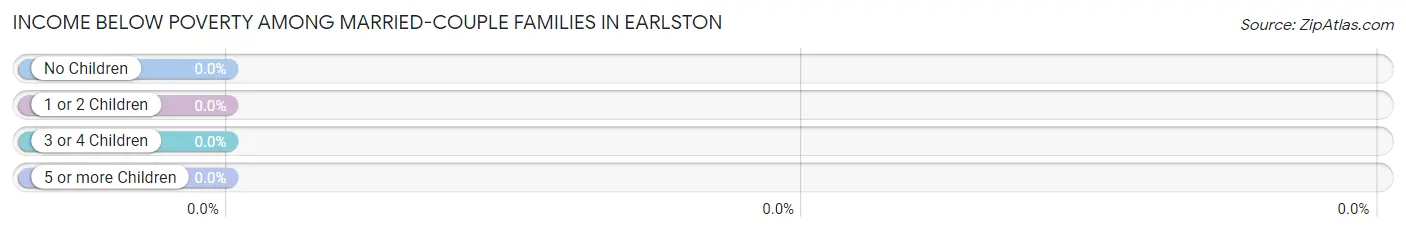
| Children | Above Poverty | Below Poverty |
| No Children | 147 (100.0%) | 0 (0.0%) |
| 1 or 2 Children | 37 (100.0%) | 0 (0.0%) |
| 3 or 4 Children | 0 (0.0%) | 0 (0.0%) |
| 5 or more Children | 0 (0.0%) | 0 (0.0%) |
| Total | 184 (100.0%) | 0 (0.0%) |
Income Below Poverty Among Single-Parent Households in Earlston
| Children | Single Father | Single Mother |
| No Children | 0 (0.0%) | 0 (0.0%) |
| 1 or 2 Children | 0 (0.0%) | 0 (0.0%) |
| 3 or 4 Children | 0 (0.0%) | 0 (0.0%) |
| 5 or more Children | 0 (0.0%) | 0 (0.0%) |
| Total | 0 (0.0%) | 0 (0.0%) |
Income Below Poverty Among Married-Couple vs Single-Parent Households in Earlston
| Children | Married-Couple Families | Single-Parent Households |
| No Children | 0 (0.0%) | 0 (0.0%) |
| 1 or 2 Children | 0 (0.0%) | 0 (0.0%) |
| 3 or 4 Children | 0 (0.0%) | 0 (0.0%) |
| 5 or more Children | 0 (0.0%) | 0 (0.0%) |
| Total | 0 (0.0%) | 0 (0.0%) |
Race in Earlston
The most populous races in Earlston are White / Caucasian (855 | 88.0%), Asian (70 | 7.2%), and Two or more Races (46 | 4.7%).
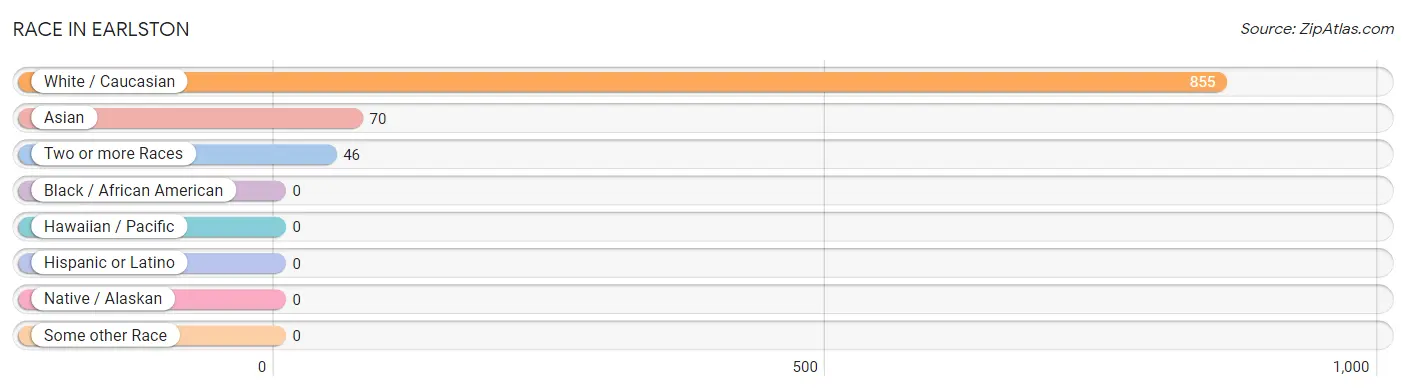
| Race | # Population | % Population |
| Asian | 70 | 7.2% |
| Black / African American | 0 | 0.0% |
| Hawaiian / Pacific | 0 | 0.0% |
| Hispanic or Latino | 0 | 0.0% |
| Native / Alaskan | 0 | 0.0% |
| White / Caucasian | 855 | 88.0% |
| Two or more Races | 46 | 4.7% |
| Some other Race | 0 | 0.0% |
| Total | 971 | 100.0% |
Ancestry in Earlston
The most populous ancestries reported in Earlston are German (154 | 15.9%), Irish (129 | 13.3%), American (66 | 6.8%), English (62 | 6.4%), and Dutch (50 | 5.1%), together accounting for 47.5% of all Earlston residents.
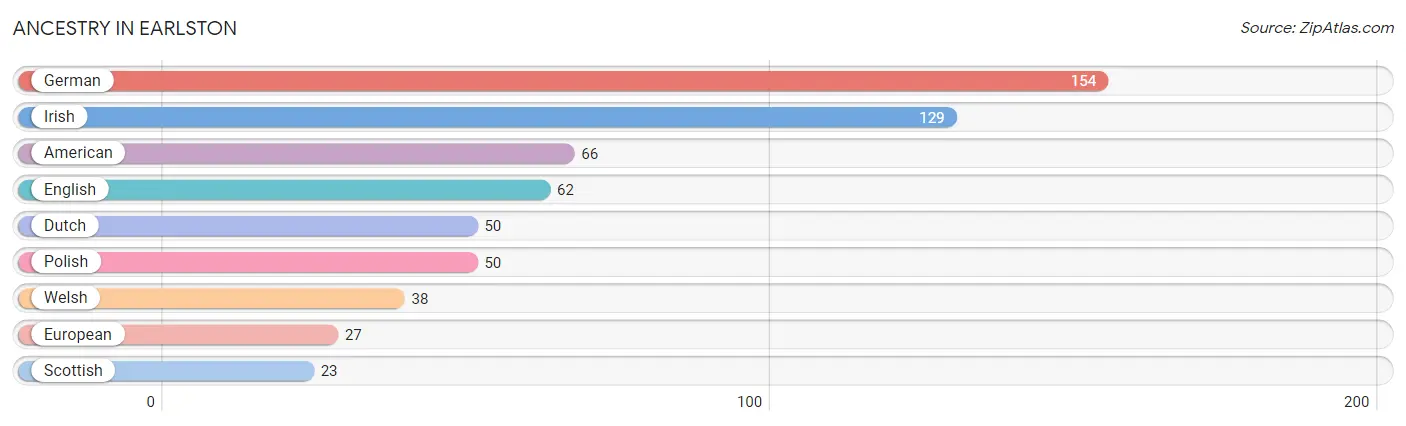
| Ancestry | # Population | % Population |
| American | 66 | 6.8% |
| Dutch | 50 | 5.1% |
| English | 62 | 6.4% |
| European | 27 | 2.8% |
| German | 154 | 15.9% |
| Irish | 129 | 13.3% |
| Polish | 50 | 5.1% |
| Scottish | 23 | 2.4% |
| Welsh | 38 | 3.9% | View All 9 Rows |
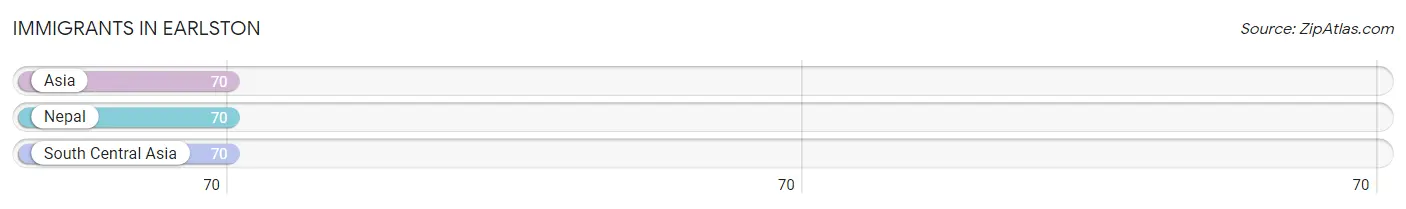
Immigrants in Earlston
The most numerous immigrant groups reported in Earlston came from Asia (70 | 7.2%), Nepal (70 | 7.2%), and South Central Asia (70 | 7.2%), together accounting for 21.6% of all Earlston residents.
| Immigration Origin | # Population | % Population |
| Asia | 70 | 7.2% |
| Nepal | 70 | 7.2% |
| South Central Asia | 70 | 7.2% | View All 3 Rows |
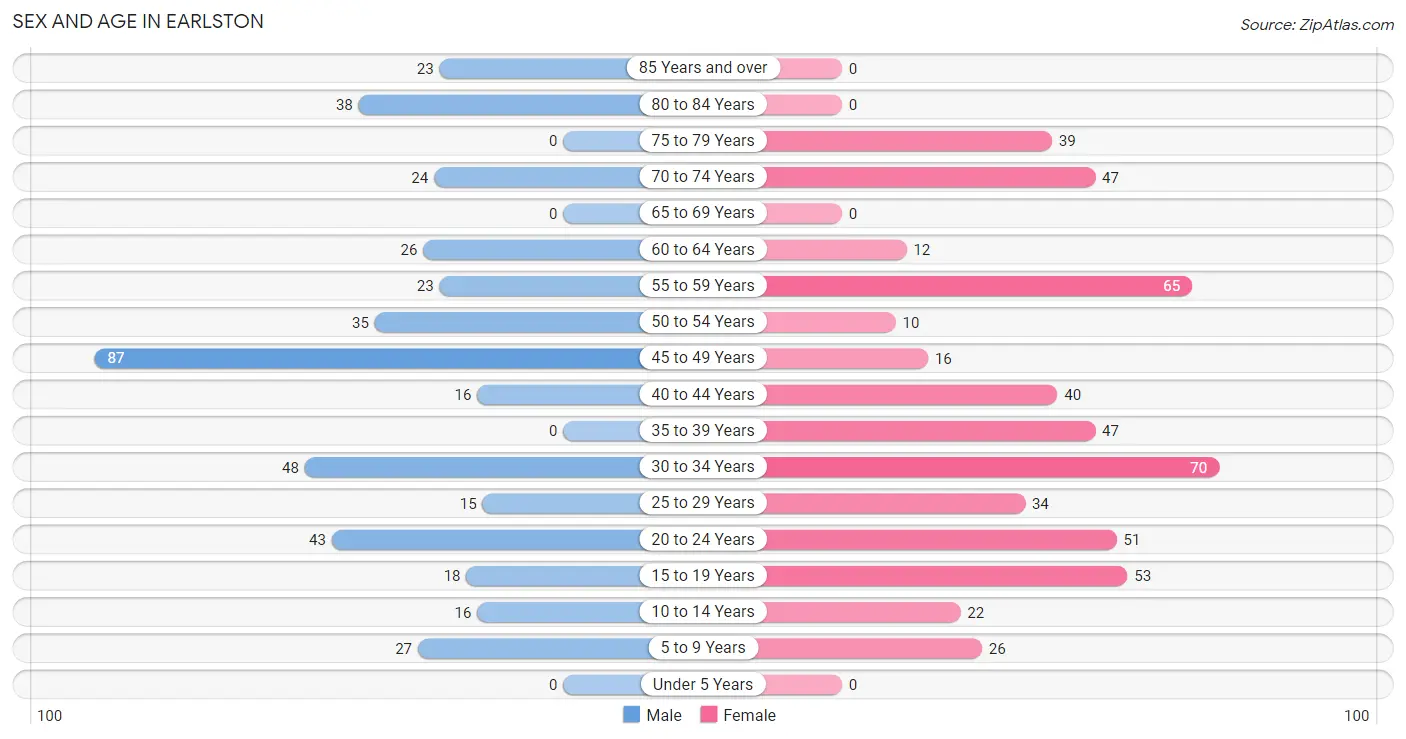
Sex and Age in Earlston
Sex and Age in Earlston
The most populous age groups in Earlston are 45 to 49 Years (87 | 19.8%) for men and 30 to 34 Years (70 | 13.2%) for women.
| Age Bracket | Male | Female |
| Under 5 Years | 0 (0.0%) | 0 (0.0%) |
| 5 to 9 Years | 27 (6.1%) | 26 (4.9%) |
| 10 to 14 Years | 16 (3.6%) | 22 (4.1%) |
| 15 to 19 Years | 18 (4.1%) | 53 (10.0%) |
| 20 to 24 Years | 43 (9.8%) | 51 (9.6%) |
| 25 to 29 Years | 15 (3.4%) | 34 (6.4%) |
| 30 to 34 Years | 48 (10.9%) | 70 (13.2%) |
| 35 to 39 Years | 0 (0.0%) | 47 (8.8%) |
| 40 to 44 Years | 16 (3.6%) | 40 (7.5%) |
| 45 to 49 Years | 87 (19.8%) | 16 (3.0%) |
| 50 to 54 Years | 35 (8.0%) | 10 (1.9%) |
| 55 to 59 Years | 23 (5.2%) | 65 (12.2%) |
| 60 to 64 Years | 26 (5.9%) | 12 (2.3%) |
| 65 to 69 Years | 0 (0.0%) | 0 (0.0%) |
| 70 to 74 Years | 24 (5.5%) | 47 (8.8%) |
| 75 to 79 Years | 0 (0.0%) | 39 (7.3%) |
| 80 to 84 Years | 38 (8.7%) | 0 (0.0%) |
| 85 Years and over | 23 (5.2%) | 0 (0.0%) |
| Total | 439 (100.0%) | 532 (100.0%) |
Families and Households in Earlston
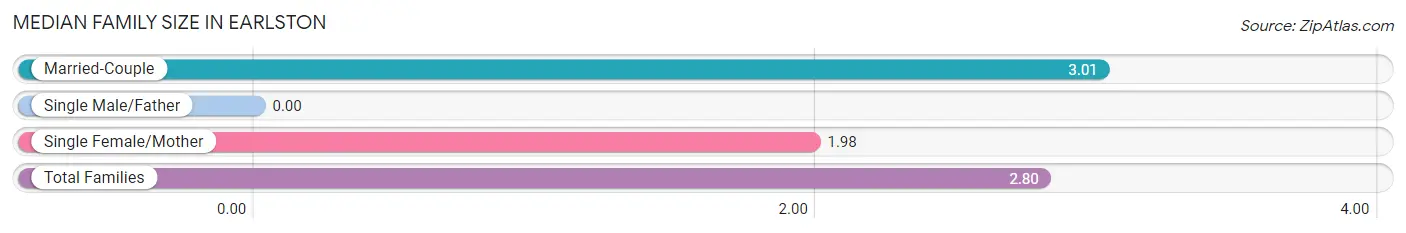
Median Family Size in Earlston
| Family Type | # Families | Family Size |
| Married-Couple | 184 (79.6%) | 3.01 |
| Single Male/Father | 0 (0.0%) | - |
| Single Female/Mother | 47 (20.3%) | 1.98 |
| Total Families | 231 (100.0%) | 2.80 |
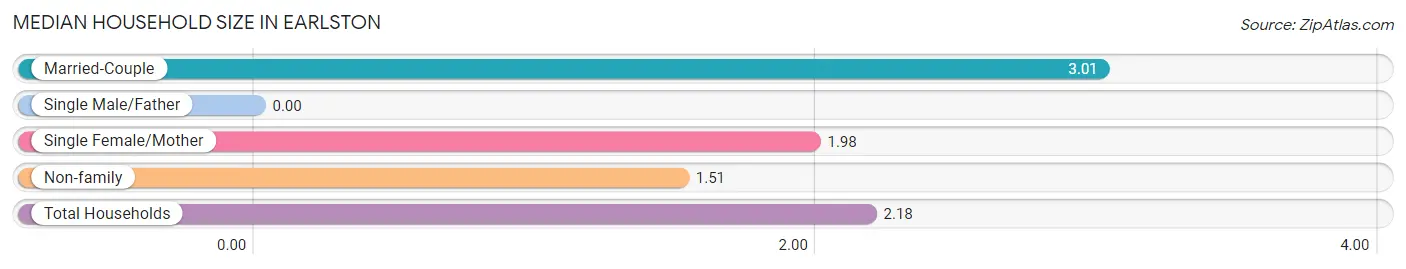
Median Household Size in Earlston
| Household Type | # Households | Household Size |
| Married-Couple | 184 (41.3%) | 3.01 |
| Single Male/Father | 0 (0.0%) | - |
| Single Female/Mother | 47 (10.6%) | 1.98 |
| Non-family | 214 (48.1%) | 1.51 |
| Total Households | 445 (100.0%) | 2.18 |
Household Size by Marriage Status in Earlston
Out of a total of 445 households in Earlston, 231 (51.9%) are family households, while 214 (48.1%) are nonfamily households. The most numerous type of family households are 2-person households, comprising 157, and the most common type of nonfamily households are 1-person households, comprising 134.
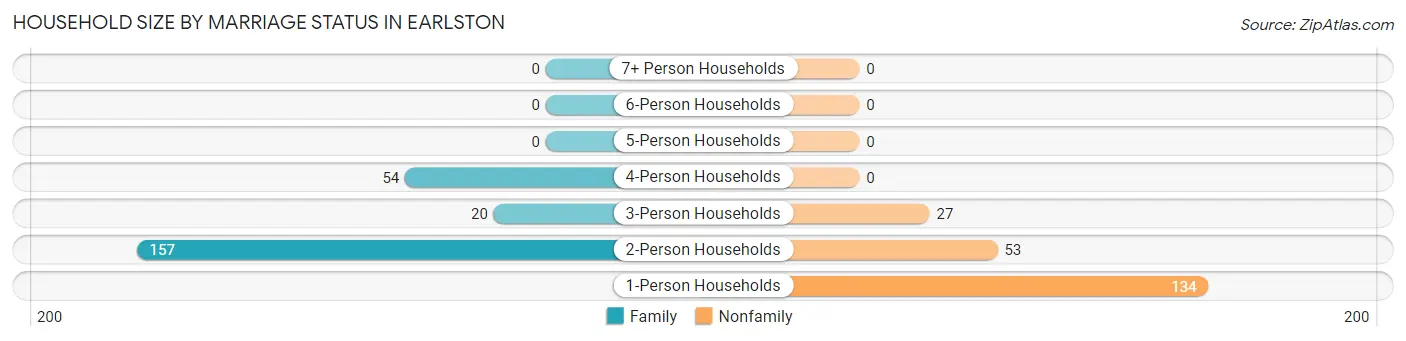
| Household Size | Family Households | Nonfamily Households |
| 1-Person Households | - | 134 (30.1%) |
| 2-Person Households | 157 (35.3%) | 53 (11.9%) |
| 3-Person Households | 20 (4.5%) | 27 (6.1%) |
| 4-Person Households | 54 (12.1%) | 0 (0.0%) |
| 5-Person Households | 0 (0.0%) | 0 (0.0%) |
| 6-Person Households | 0 (0.0%) | 0 (0.0%) |
| 7+ Person Households | 0 (0.0%) | 0 (0.0%) |
| Total | 231 (51.9%) | 214 (48.1%) |
Female Fertility in Earlston
Fertility by Age in Earlston
| Age Bracket | Women with Births | Births / 1,000 Women |
| 15 to 19 years | 0 (0.0%) | 0.0 |
| 20 to 34 years | 0 (0.0%) | 0.0 |
| 35 to 50 years | 0 (0.0%) | 0.0 |
| Total | 0 (0.0%) | 0.0 |
Fertility by Age by Marriage Status in Earlston
| Age Bracket | Married | Unmarried |
| 15 to 19 years | 0 (0.0%) | 0 (0.0%) |
| 20 to 34 years | 0 (0.0%) | 0 (0.0%) |
| 35 to 50 years | 0 (0.0%) | 0 (0.0%) |
| Total | 0 (0.0%) | 0 (0.0%) |
Fertility by Education in Earlston
| Educational Attainment | Women with Births | Births / 1,000 Women |
| Less than High School | 0 (0.0%) | 0.0 |
| High School Diploma | 0 (0.0%) | 0.0 |
| College or Associate's Degree | 0 (0.0%) | 0.0 |
| Bachelor's Degree | 0 (0.0%) | 0.0 |
| Graduate Degree | 0 (0.0%) | 0.0 |
| Total | 0 (0.0%) | 0.0 |
Fertility by Education by Marriage Status in Earlston
| Educational Attainment | Married | Unmarried |
| Less than High School | 0 (0.0%) | 0 (0.0%) |
| High School Diploma | 0 (0.0%) | 0 (0.0%) |
| College or Associate's Degree | 0 (0.0%) | 0 (0.0%) |
| Bachelor's Degree | 0 (0.0%) | 0 (0.0%) |
| Graduate Degree | 0 (0.0%) | 0 (0.0%) |
| Total | 0 (0.0%) | 0 (0.0%) |
Employment Characteristics in Earlston
Employment by Class of Employer in Earlston
Among the 568 employed individuals in Earlston, private company employees (452 | 79.6%), not-for-profit organizations (61 | 10.7%), and self-employed (incorporated) (55 | 9.7%) make up the most common classes of employment.
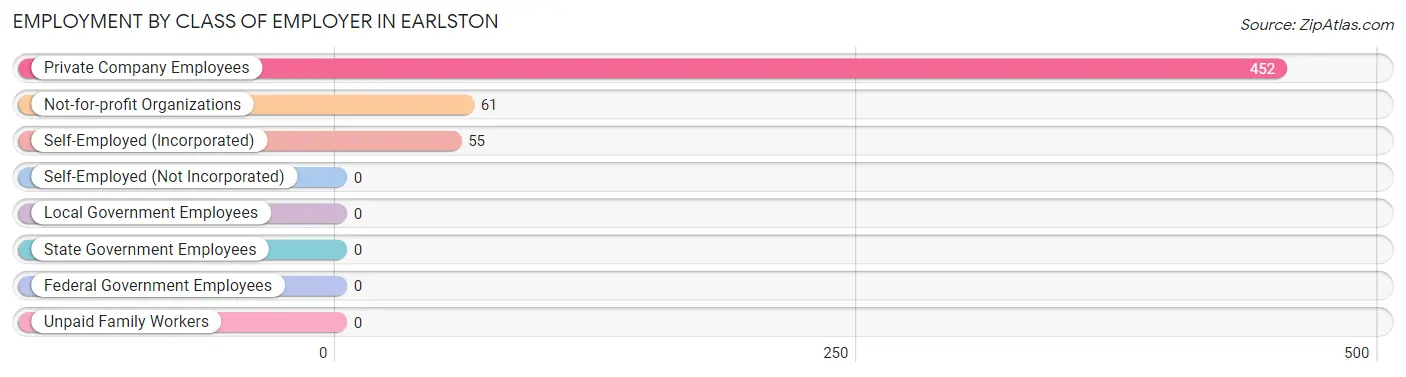
| Employer Class | # Employees | % Employees |
| Private Company Employees | 452 | 79.6% |
| Self-Employed (Incorporated) | 55 | 9.7% |
| Self-Employed (Not Incorporated) | 0 | 0.0% |
| Not-for-profit Organizations | 61 | 10.7% |
| Local Government Employees | 0 | 0.0% |
| State Government Employees | 0 | 0.0% |
| Federal Government Employees | 0 | 0.0% |
| Unpaid Family Workers | 0 | 0.0% |
| Total | 568 | 100.0% |
Employment Status by Age in Earlston
According to the labor force statistics for Earlston, out of the total population over 16 years of age (880), 67.4% or 593 individuals are in the labor force, with 3.0% or 18 of them unemployed. The age group with the highest labor force participation rate is 20 to 24 years, with 100.0% or 94 individuals in the labor force. Within the labor force, the 45 to 54 years age range has the highest percentage of unemployed individuals, with 12.2% or 18 of them being unemployed.
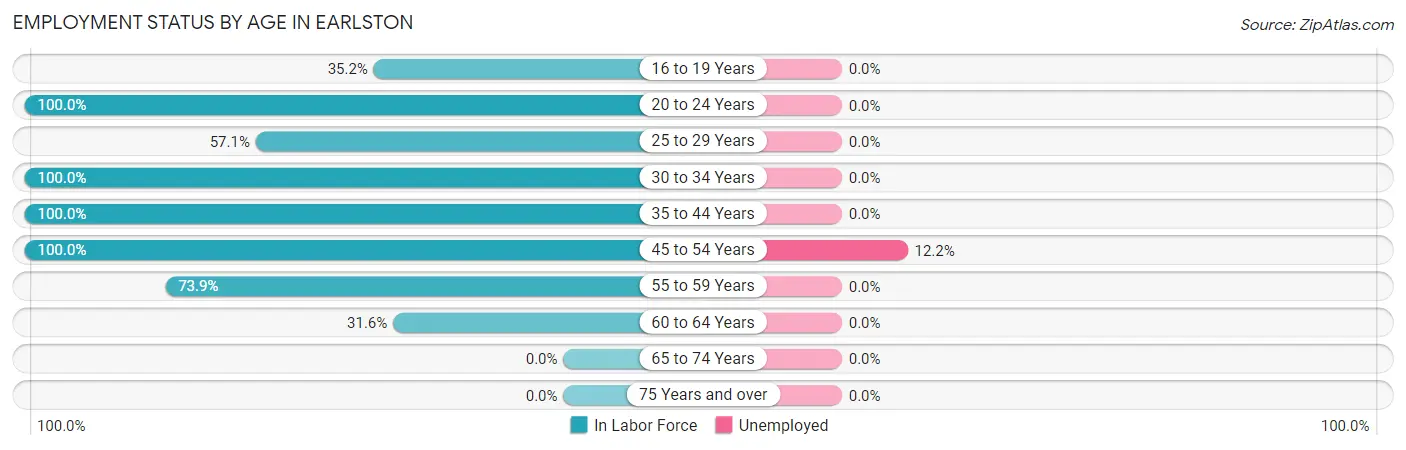
| Age Bracket | In Labor Force | Unemployed |
| 16 to 19 Years | 25 (35.2%) | 0 (0.0%) |
| 20 to 24 Years | 94 (100.0%) | 0 (0.0%) |
| 25 to 29 Years | 28 (57.1%) | 0 (0.0%) |
| 30 to 34 Years | 118 (100.0%) | 0 (0.0%) |
| 35 to 44 Years | 103 (100.0%) | 0 (0.0%) |
| 45 to 54 Years | 148 (100.0%) | 18 (12.2%) |
| 55 to 59 Years | 65 (73.9%) | 0 (0.0%) |
| 60 to 64 Years | 12 (31.6%) | 0 (0.0%) |
| 65 to 74 Years | 0 (0.0%) | 0 (0.0%) |
| 75 Years and over | 0 (0.0%) | 0 (0.0%) |
| Total | 593 (67.4%) | 18 (3.0%) |
Employment Status by Educational Attainment in Earlston
According to labor force statistics for Earlston, 87.1% of individuals (474) out of the total population between 25 and 64 years of age (544) are in the labor force, with 3.8% or 18 of them being unemployed. The group with the highest labor force participation rate are those with the educational attainment of less than high school, with 100.0% or 13 individuals in the labor force. Within the labor force, individuals with high school diploma education have the highest percentage of unemployment, with 9.3% or 18 of them being unemployed.
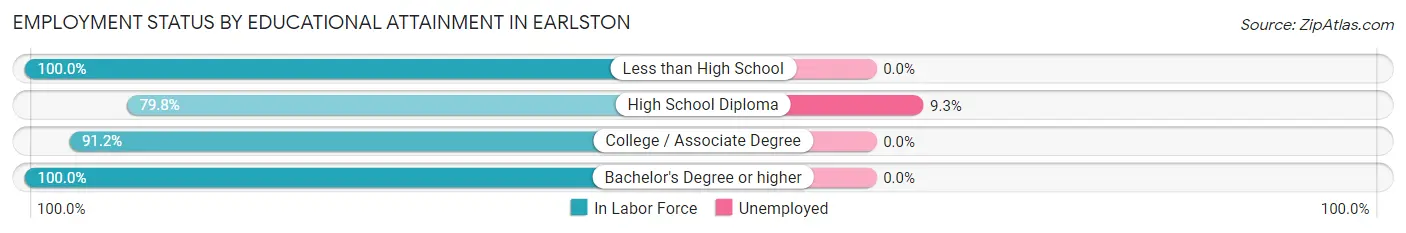
| Educational Attainment | In Labor Force | Unemployed |
| Less than High School | 13 (100.0%) | 0 (0.0%) |
| High School Diploma | 193 (79.8%) | 23 (9.3%) |
| College / Associate Degree | 218 (91.2%) | 0 (0.0%) |
| Bachelor's Degree or higher | 50 (100.0%) | 0 (0.0%) |
| Total | 474 (87.1%) | 21 (3.8%) |
Employment Occupations by Sex in Earlston
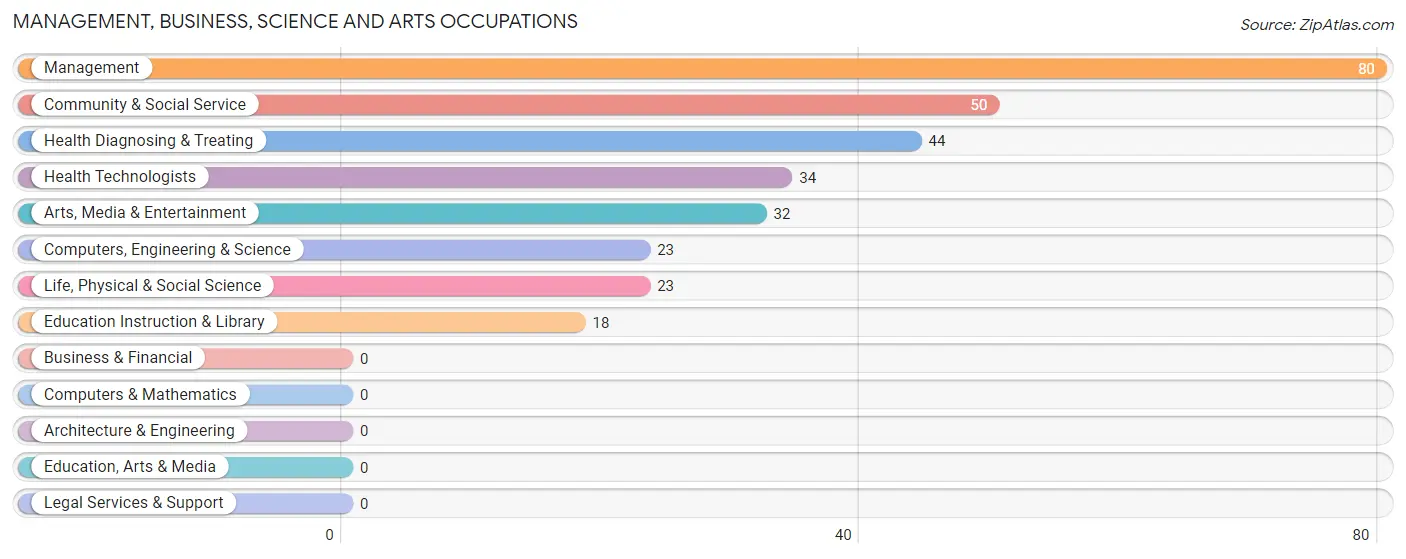
Management, Business, Science and Arts Occupations
The most common Management, Business, Science and Arts occupations in Earlston are Management (80 | 13.9%), Community & Social Service (50 | 8.7%), Health Diagnosing & Treating (44 | 7.6%), Health Technologists (34 | 5.9%), and Arts, Media & Entertainment (32 | 5.6%).
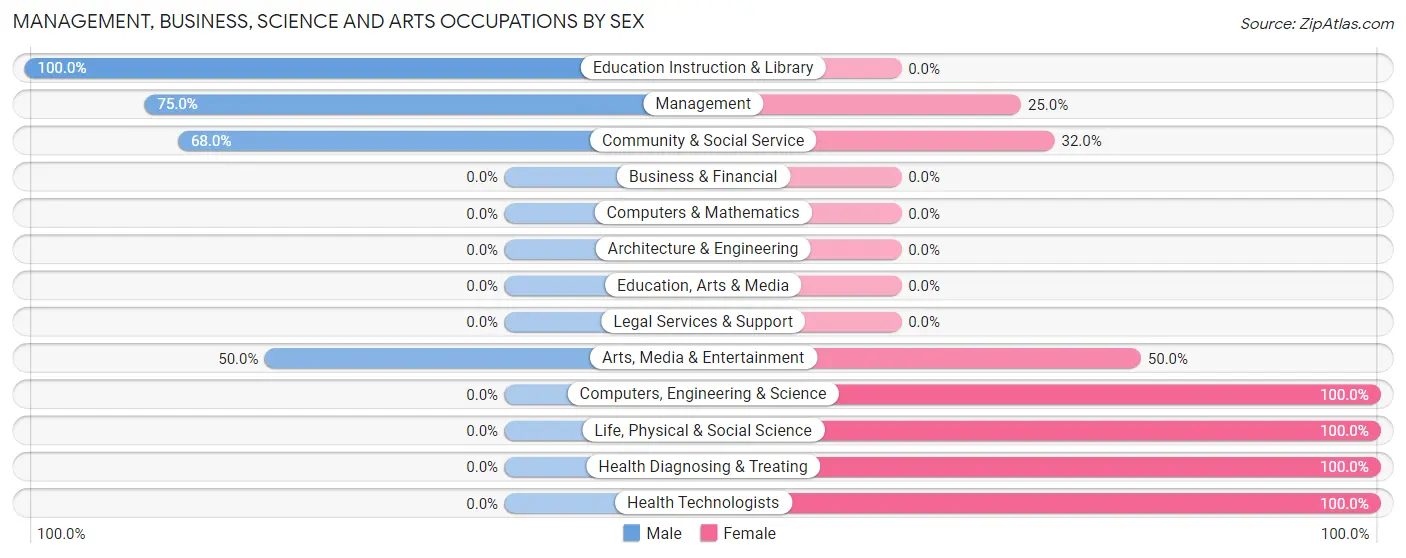
Management, Business, Science and Arts Occupations by Sex
Within the Management, Business, Science and Arts occupations in Earlston, the most male-oriented occupations are Education Instruction & Library (100.0%), Management (75.0%), and Community & Social Service (68.0%), while the most female-oriented occupations are Computers, Engineering & Science (100.0%), Life, Physical & Social Science (100.0%), and Health Diagnosing & Treating (100.0%).
| Occupation | Male | Female |
| Management | 60 (75.0%) | 20 (25.0%) |
| Business & Financial | 0 (0.0%) | 0 (0.0%) |
| Computers, Engineering & Science | 0 (0.0%) | 23 (100.0%) |
| Computers & Mathematics | 0 (0.0%) | 0 (0.0%) |
| Architecture & Engineering | 0 (0.0%) | 0 (0.0%) |
| Life, Physical & Social Science | 0 (0.0%) | 23 (100.0%) |
| Community & Social Service | 34 (68.0%) | 16 (32.0%) |
| Education, Arts & Media | 0 (0.0%) | 0 (0.0%) |
| Legal Services & Support | 0 (0.0%) | 0 (0.0%) |
| Education Instruction & Library | 18 (100.0%) | 0 (0.0%) |
| Arts, Media & Entertainment | 16 (50.0%) | 16 (50.0%) |
| Health Diagnosing & Treating | 0 (0.0%) | 44 (100.0%) |
| Health Technologists | 0 (0.0%) | 34 (100.0%) |
| Total (Category) | 94 (47.7%) | 103 (52.3%) |
| Total (Overall) | 267 (46.4%) | 308 (53.6%) |
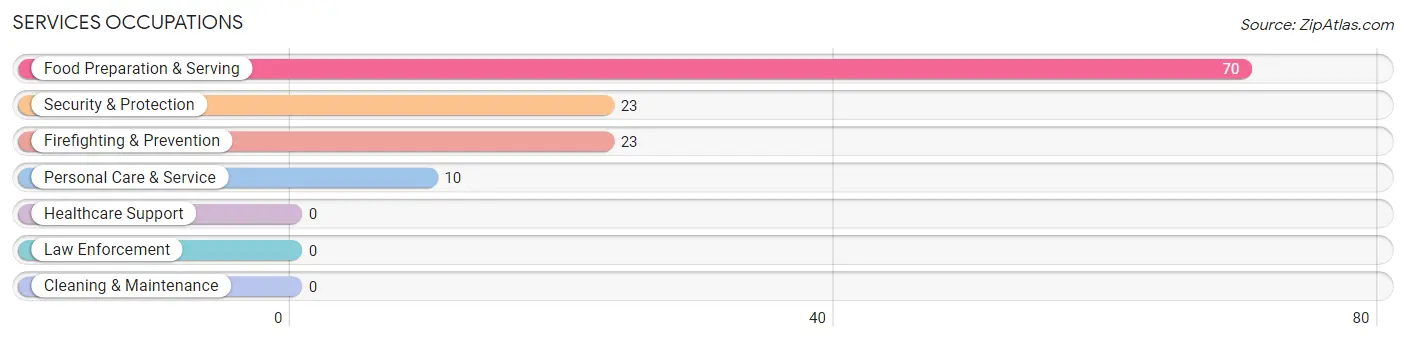
Services Occupations
The most common Services occupations in Earlston are Food Preparation & Serving (70 | 12.2%), Security & Protection (23 | 4.0%), Firefighting & Prevention (23 | 4.0%), and Personal Care & Service (10 | 1.7%).
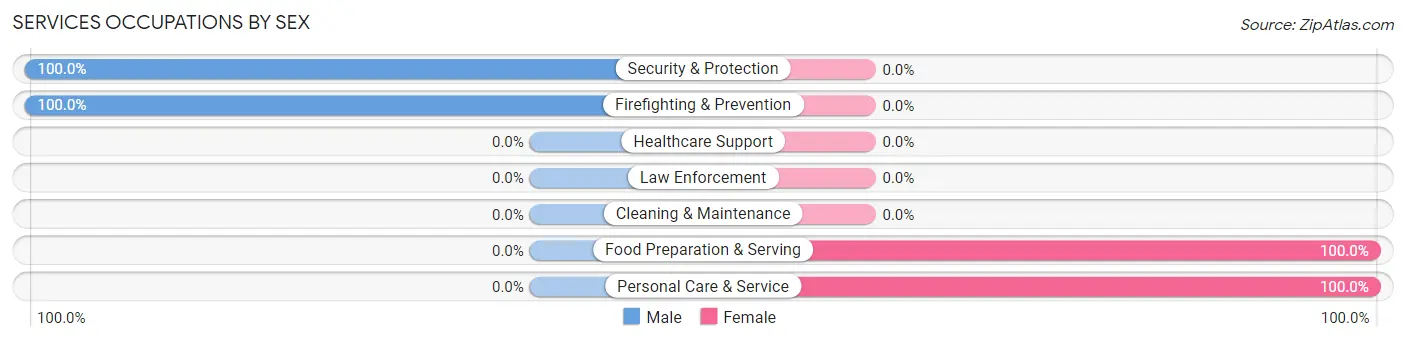
Services Occupations by Sex
Within the Services occupations in Earlston, the most male-oriented occupations are Security & Protection (100.0%), and Firefighting & Prevention (100.0%), while the most female-oriented occupations are Food Preparation & Serving (100.0%), and Personal Care & Service (100.0%).
| Occupation | Male | Female |
| Healthcare Support | 0 (0.0%) | 0 (0.0%) |
| Security & Protection | 23 (100.0%) | 0 (0.0%) |
| Firefighting & Prevention | 23 (100.0%) | 0 (0.0%) |
| Law Enforcement | 0 (0.0%) | 0 (0.0%) |
| Food Preparation & Serving | 0 (0.0%) | 70 (100.0%) |
| Cleaning & Maintenance | 0 (0.0%) | 0 (0.0%) |
| Personal Care & Service | 0 (0.0%) | 10 (100.0%) |
| Total (Category) | 23 (22.3%) | 80 (77.7%) |
| Total (Overall) | 267 (46.4%) | 308 (53.6%) |
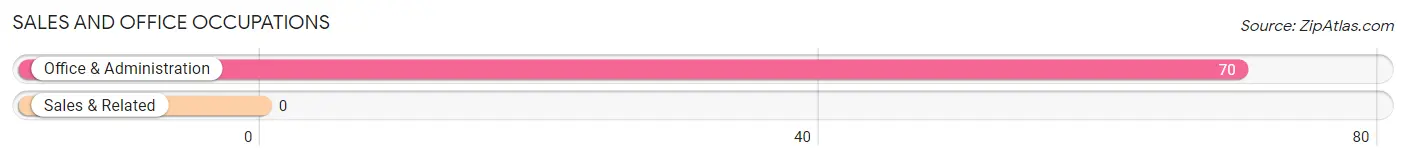
Sales and Office Occupations
The most common Sales and Office occupations in Earlston are , and Office & Administration (70 | 12.2%).
Sales and Office Occupations by Sex
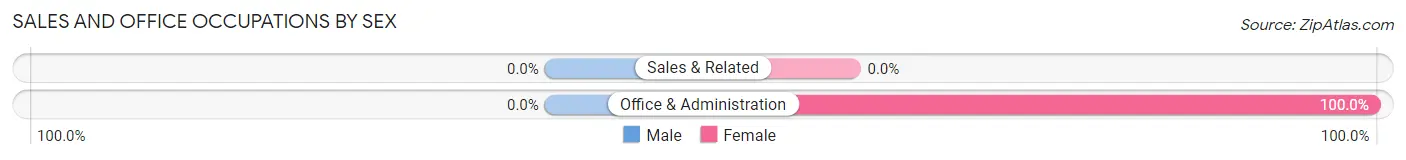
| Occupation | Male | Female |
| Sales & Related | 0 (0.0%) | 0 (0.0%) |
| Office & Administration | 0 (0.0%) | 70 (100.0%) |
| Total (Category) | 0 (0.0%) | 70 (100.0%) |
| Total (Overall) | 267 (46.4%) | 308 (53.6%) |
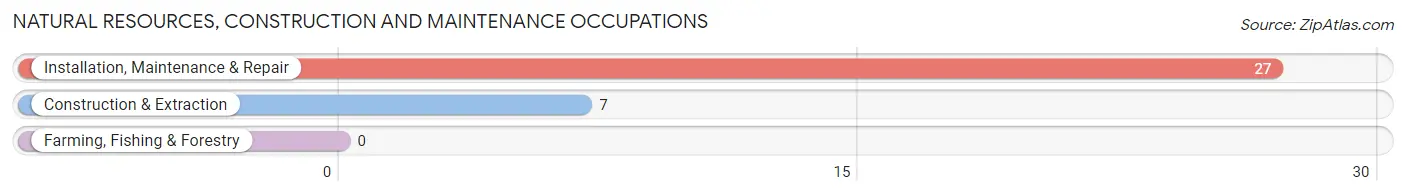
Natural Resources, Construction and Maintenance Occupations
The most common Natural Resources, Construction and Maintenance occupations in Earlston are Installation, Maintenance & Repair (27 | 4.7%), and Construction & Extraction (7 | 1.2%).
Natural Resources, Construction and Maintenance Occupations by Sex
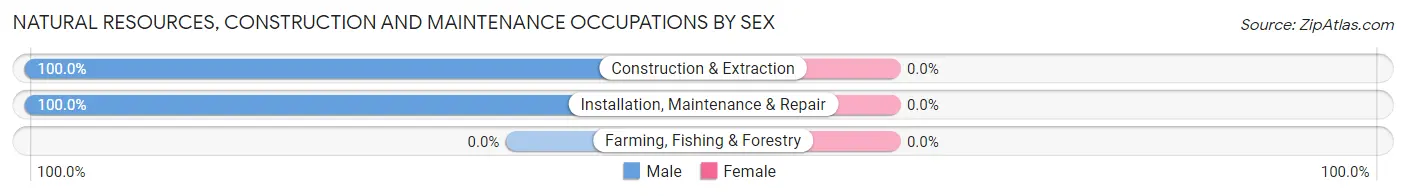
| Occupation | Male | Female |
| Farming, Fishing & Forestry | 0 (0.0%) | 0 (0.0%) |
| Construction & Extraction | 7 (100.0%) | 0 (0.0%) |
| Installation, Maintenance & Repair | 27 (100.0%) | 0 (0.0%) |
| Total (Category) | 34 (100.0%) | 0 (0.0%) |
| Total (Overall) | 267 (46.4%) | 308 (53.6%) |
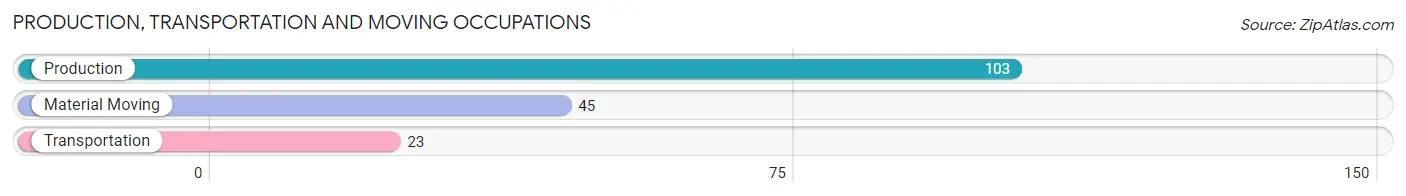
Production, Transportation and Moving Occupations
The most common Production, Transportation and Moving occupations in Earlston are Production (103 | 17.9%), Material Moving (45 | 7.8%), and Transportation (23 | 4.0%).
Production, Transportation and Moving Occupations by Sex
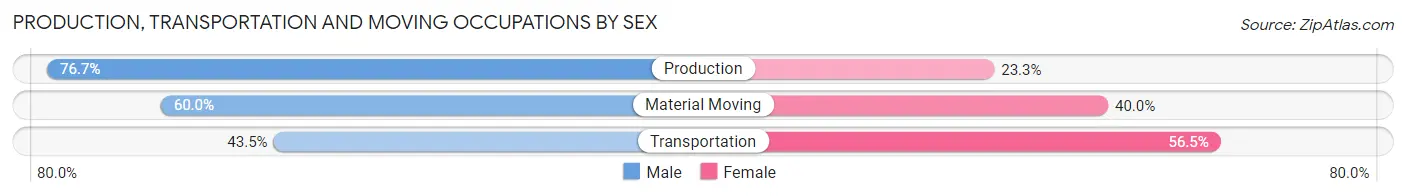
| Occupation | Male | Female |
| Production | 79 (76.7%) | 24 (23.3%) |
| Transportation | 10 (43.5%) | 13 (56.5%) |
| Material Moving | 27 (60.0%) | 18 (40.0%) |
| Total (Category) | 116 (67.8%) | 55 (32.2%) |
| Total (Overall) | 267 (46.4%) | 308 (53.6%) |
Employment Industries by Sex in Earlston
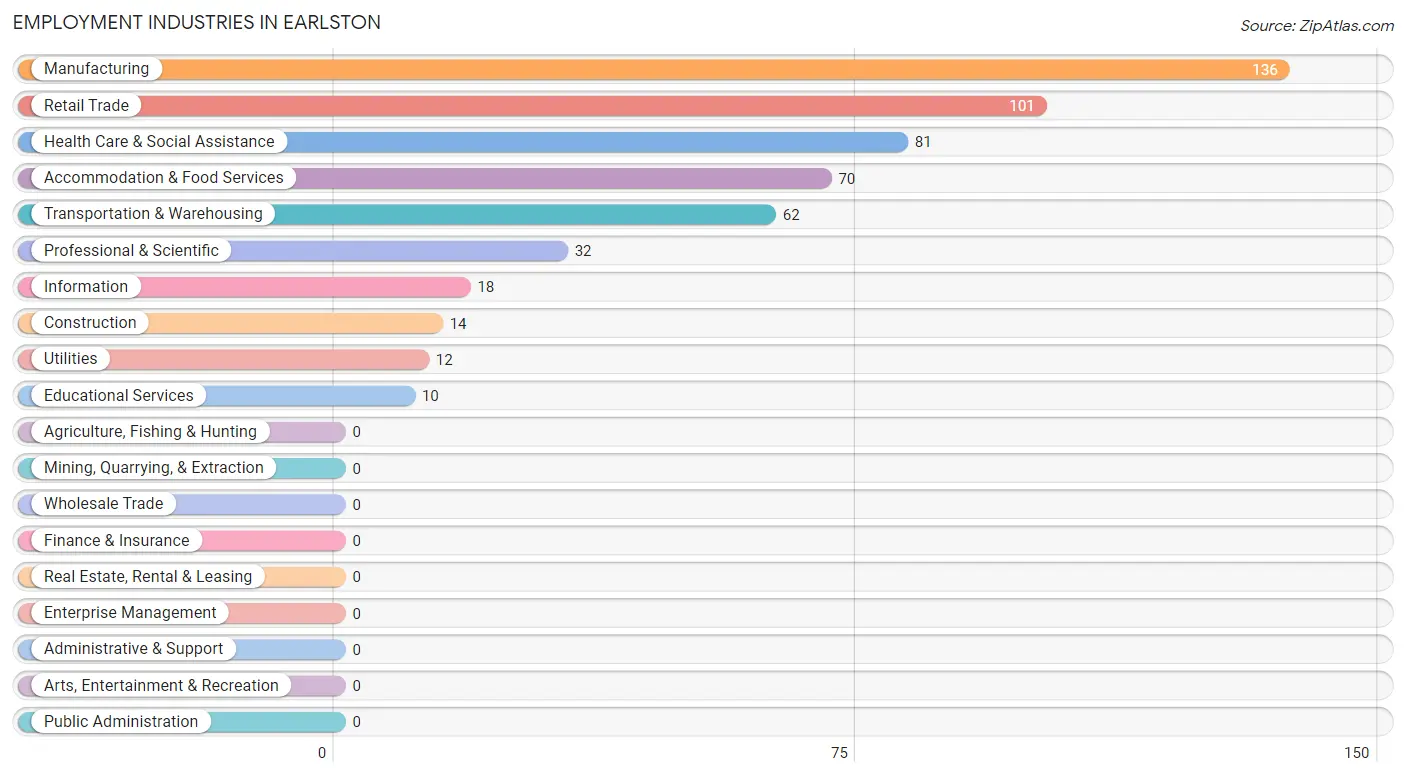
Employment Industries in Earlston
The major employment industries in Earlston include Manufacturing (136 | 23.6%), Retail Trade (101 | 17.6%), Health Care & Social Assistance (81 | 14.1%), Accommodation & Food Services (70 | 12.2%), and Transportation & Warehousing (62 | 10.8%).
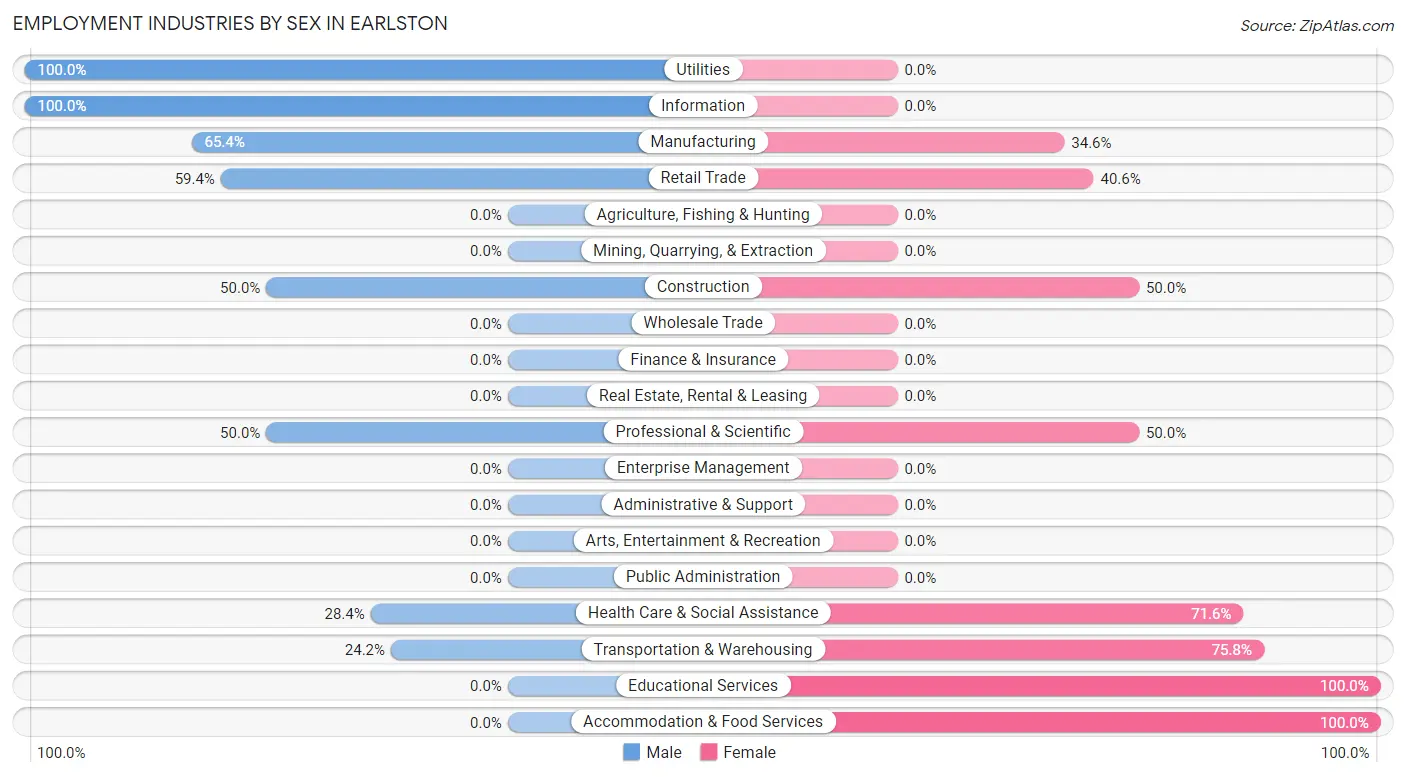
Employment Industries by Sex in Earlston
The Earlston industries that see more men than women are Utilities (100.0%), Information (100.0%), and Manufacturing (65.4%), whereas the industries that tend to have a higher number of women are Educational Services (100.0%), Accommodation & Food Services (100.0%), and Transportation & Warehousing (75.8%).
| Industry | Male | Female |
| Agriculture, Fishing & Hunting | 0 (0.0%) | 0 (0.0%) |
| Mining, Quarrying, & Extraction | 0 (0.0%) | 0 (0.0%) |
| Construction | 7 (50.0%) | 7 (50.0%) |
| Manufacturing | 89 (65.4%) | 47 (34.6%) |
| Wholesale Trade | 0 (0.0%) | 0 (0.0%) |
| Retail Trade | 60 (59.4%) | 41 (40.6%) |
| Transportation & Warehousing | 15 (24.2%) | 47 (75.8%) |
| Utilities | 12 (100.0%) | 0 (0.0%) |
| Information | 18 (100.0%) | 0 (0.0%) |
| Finance & Insurance | 0 (0.0%) | 0 (0.0%) |
| Real Estate, Rental & Leasing | 0 (0.0%) | 0 (0.0%) |
| Professional & Scientific | 16 (50.0%) | 16 (50.0%) |
| Enterprise Management | 0 (0.0%) | 0 (0.0%) |
| Administrative & Support | 0 (0.0%) | 0 (0.0%) |
| Educational Services | 0 (0.0%) | 10 (100.0%) |
| Health Care & Social Assistance | 23 (28.4%) | 58 (71.6%) |
| Arts, Entertainment & Recreation | 0 (0.0%) | 0 (0.0%) |
| Accommodation & Food Services | 0 (0.0%) | 70 (100.0%) |
| Public Administration | 0 (0.0%) | 0 (0.0%) |
| Total | 267 (46.4%) | 308 (53.6%) |
Education in Earlston
School Enrollment in Earlston
The most common levels of schooling among the 155 students in Earlston are high school (102 | 65.8%), elementary school (27 | 17.4%), and kindergarten (26 | 16.8%).
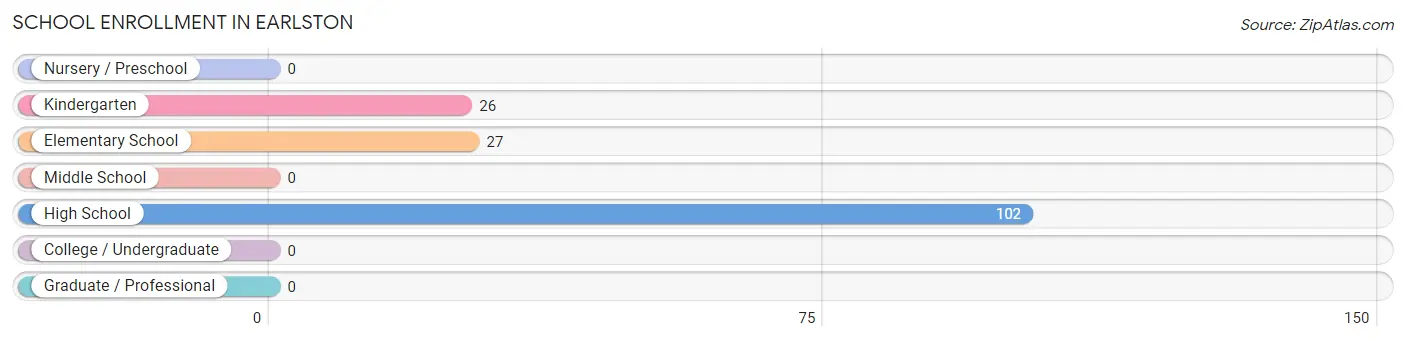
| School Level | # Students | % Students |
| Nursery / Preschool | 0 | 0.0% |
| Kindergarten | 26 | 16.8% |
| Elementary School | 27 | 17.4% |
| Middle School | 0 | 0.0% |
| High School | 102 | 65.8% |
| College / Undergraduate | 0 | 0.0% |
| Graduate / Professional | 0 | 0.0% |
| Total | 155 | 100.0% |
School Enrollment by Age by Funding Source in Earlston
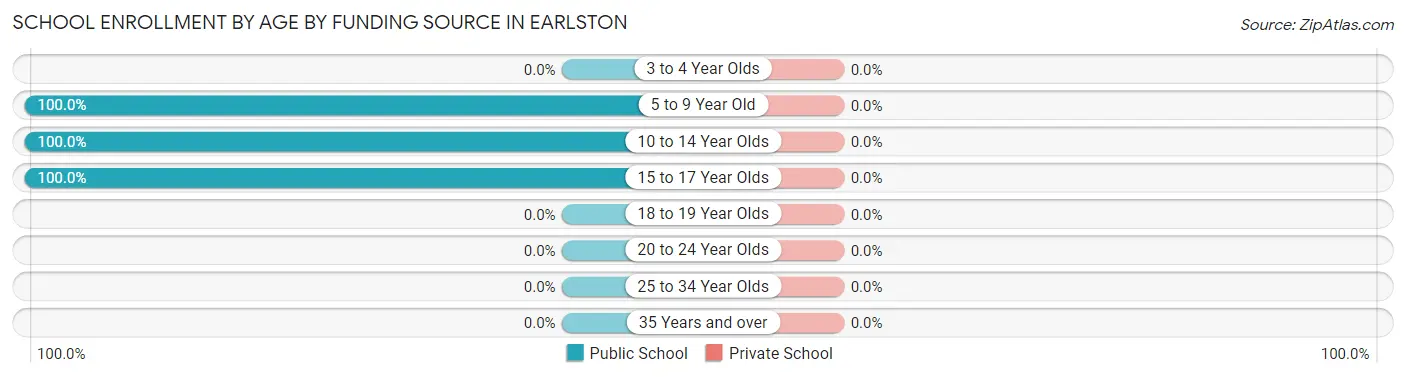
| Age Bracket | Public School | Private School |
| 3 to 4 Year Olds | 0 (0.0%) | 0 (0.0%) |
| 5 to 9 Year Old | 53 (100.0%) | 0 (0.0%) |
| 10 to 14 Year Olds | 38 (100.0%) | 0 (0.0%) |
| 15 to 17 Year Olds | 64 (100.0%) | 0 (0.0%) |
| 18 to 19 Year Olds | 0 (0.0%) | 0 (0.0%) |
| 20 to 24 Year Olds | 0 (0.0%) | 0 (0.0%) |
| 25 to 34 Year Olds | 0 (0.0%) | 0 (0.0%) |
| 35 Years and over | 0 (0.0%) | 0 (0.0%) |
| Total | 155 (100.0%) | 0 (0.0%) |
Educational Attainment by Field of Study in Earlston
Science & technology (34 | 68.0%), and visual & performing arts (16 | 32.0%) are the most common fields of study among 50 individuals in Earlston who have obtained a bachelor's degree or higher.
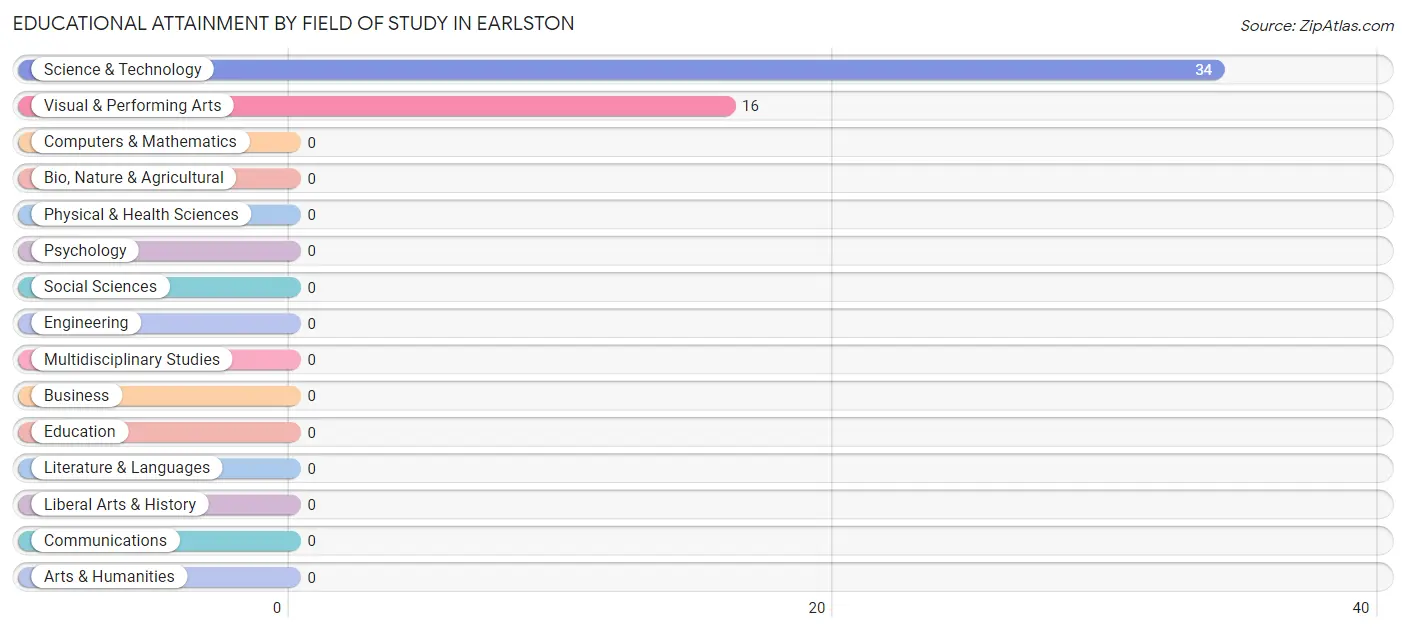
| Field of Study | # Graduates | % Graduates |
| Computers & Mathematics | 0 | 0.0% |
| Bio, Nature & Agricultural | 0 | 0.0% |
| Physical & Health Sciences | 0 | 0.0% |
| Psychology | 0 | 0.0% |
| Social Sciences | 0 | 0.0% |
| Engineering | 0 | 0.0% |
| Multidisciplinary Studies | 0 | 0.0% |
| Science & Technology | 34 | 68.0% |
| Business | 0 | 0.0% |
| Education | 0 | 0.0% |
| Literature & Languages | 0 | 0.0% |
| Liberal Arts & History | 0 | 0.0% |
| Visual & Performing Arts | 16 | 32.0% |
| Communications | 0 | 0.0% |
| Arts & Humanities | 0 | 0.0% |
| Total | 50 | 100.0% |
Transportation & Commute in Earlston
Vehicle Availability by Sex in Earlston
The most prevalent vehicle ownership categories in Earlston are males with 2 vehicles (152, accounting for 56.9%) and females with 2 vehicles (196, making up 50.5%).
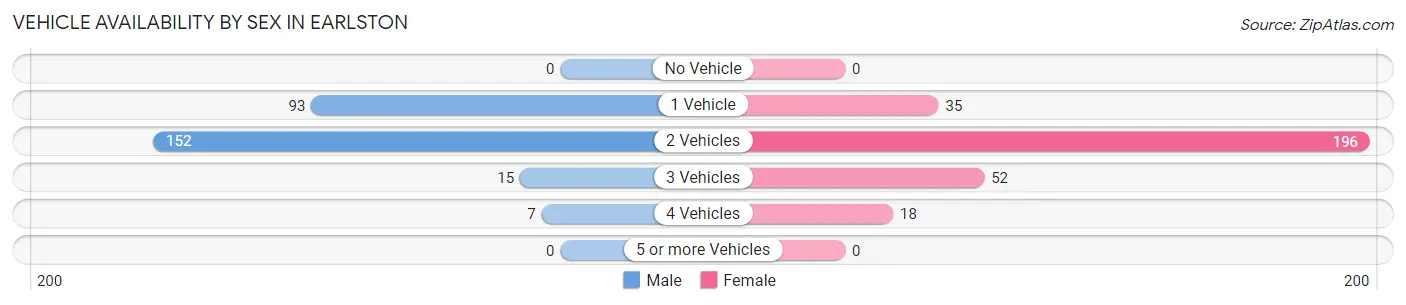
| Vehicles Available | Male | Female |
| No Vehicle | 0 (0.0%) | 0 (0.0%) |
| 1 Vehicle | 93 (34.8%) | 35 (11.6%) |
| 2 Vehicles | 152 (56.9%) | 196 (65.1%) |
| 3 Vehicles | 15 (5.6%) | 52 (17.3%) |
| 4 Vehicles | 7 (2.6%) | 18 (6.0%) |
| 5 or more Vehicles | 0 (0.0%) | 0 (0.0%) |
| Total | 267 (100.0%) | 301 (100.0%) |
Commute Time in Earlston
The most frequently occuring commute durations in Earlston are 15 to 19 minutes (173 commuters, 30.5%), 10 to 14 minutes (161 commuters, 28.3%), and 5 to 9 minutes (128 commuters, 22.5%).
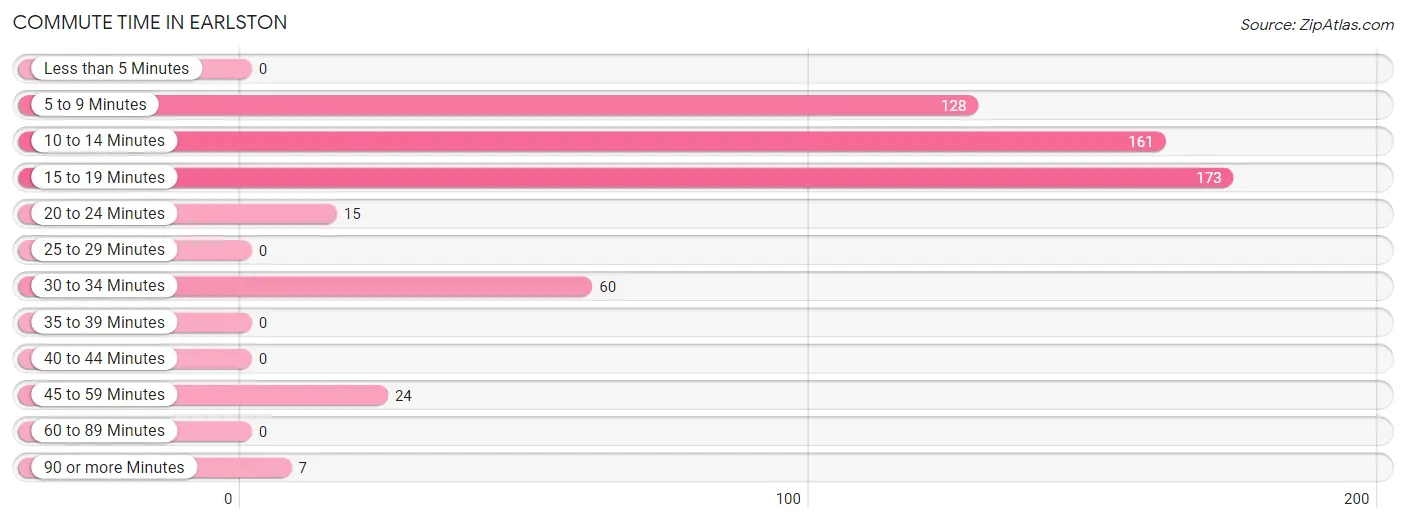
| Commute Time | # Commuters | % Commuters |
| Less than 5 Minutes | 0 | 0.0% |
| 5 to 9 Minutes | 128 | 22.5% |
| 10 to 14 Minutes | 161 | 28.3% |
| 15 to 19 Minutes | 173 | 30.5% |
| 20 to 24 Minutes | 15 | 2.6% |
| 25 to 29 Minutes | 0 | 0.0% |
| 30 to 34 Minutes | 60 | 10.6% |
| 35 to 39 Minutes | 0 | 0.0% |
| 40 to 44 Minutes | 0 | 0.0% |
| 45 to 59 Minutes | 24 | 4.2% |
| 60 to 89 Minutes | 0 | 0.0% |
| 90 or more Minutes | 7 | 1.2% |
Commute Time by Sex in Earlston
The most common commute times in Earlston are 10 to 14 minutes (104 commuters, 39.0%) for males and 15 to 19 minutes (105 commuters, 34.9%) for females.
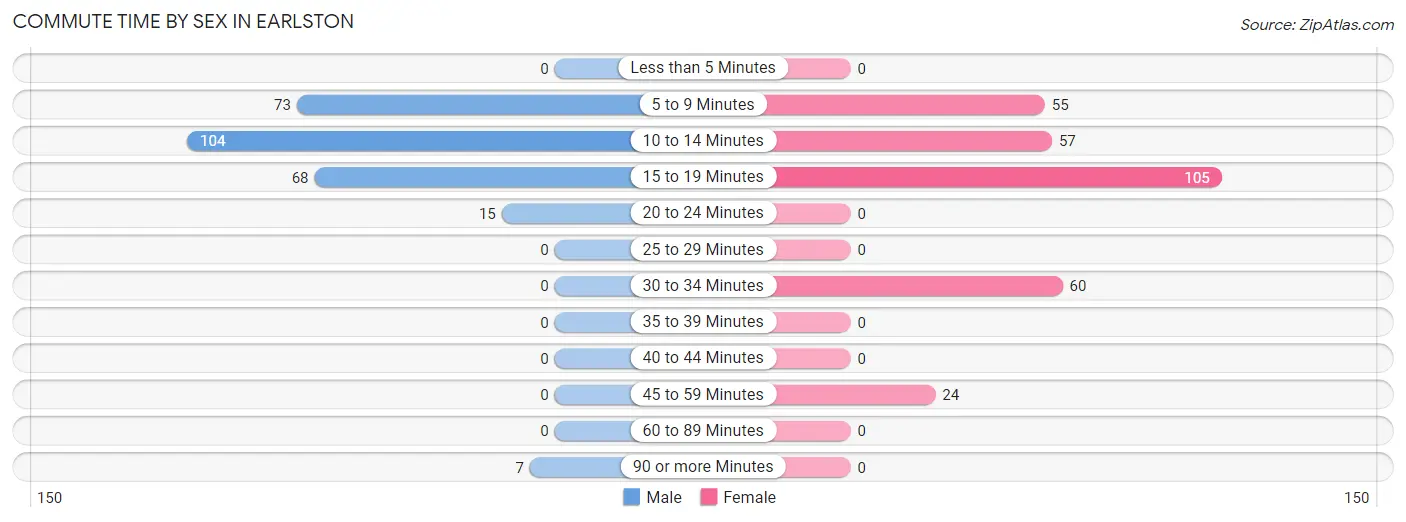
| Commute Time | Male | Female |
| Less than 5 Minutes | 0 (0.0%) | 0 (0.0%) |
| 5 to 9 Minutes | 73 (27.3%) | 55 (18.3%) |
| 10 to 14 Minutes | 104 (39.0%) | 57 (18.9%) |
| 15 to 19 Minutes | 68 (25.5%) | 105 (34.9%) |
| 20 to 24 Minutes | 15 (5.6%) | 0 (0.0%) |
| 25 to 29 Minutes | 0 (0.0%) | 0 (0.0%) |
| 30 to 34 Minutes | 0 (0.0%) | 60 (19.9%) |
| 35 to 39 Minutes | 0 (0.0%) | 0 (0.0%) |
| 40 to 44 Minutes | 0 (0.0%) | 0 (0.0%) |
| 45 to 59 Minutes | 0 (0.0%) | 24 (8.0%) |
| 60 to 89 Minutes | 0 (0.0%) | 0 (0.0%) |
| 90 or more Minutes | 7 (2.6%) | 0 (0.0%) |
Time of Departure to Work by Sex in Earlston
The most frequent times of departure to work in Earlston are 6:30 AM to 6:59 AM (70, 26.2%) for males and 5:30 AM to 5:59 AM (93, 30.9%) for females.
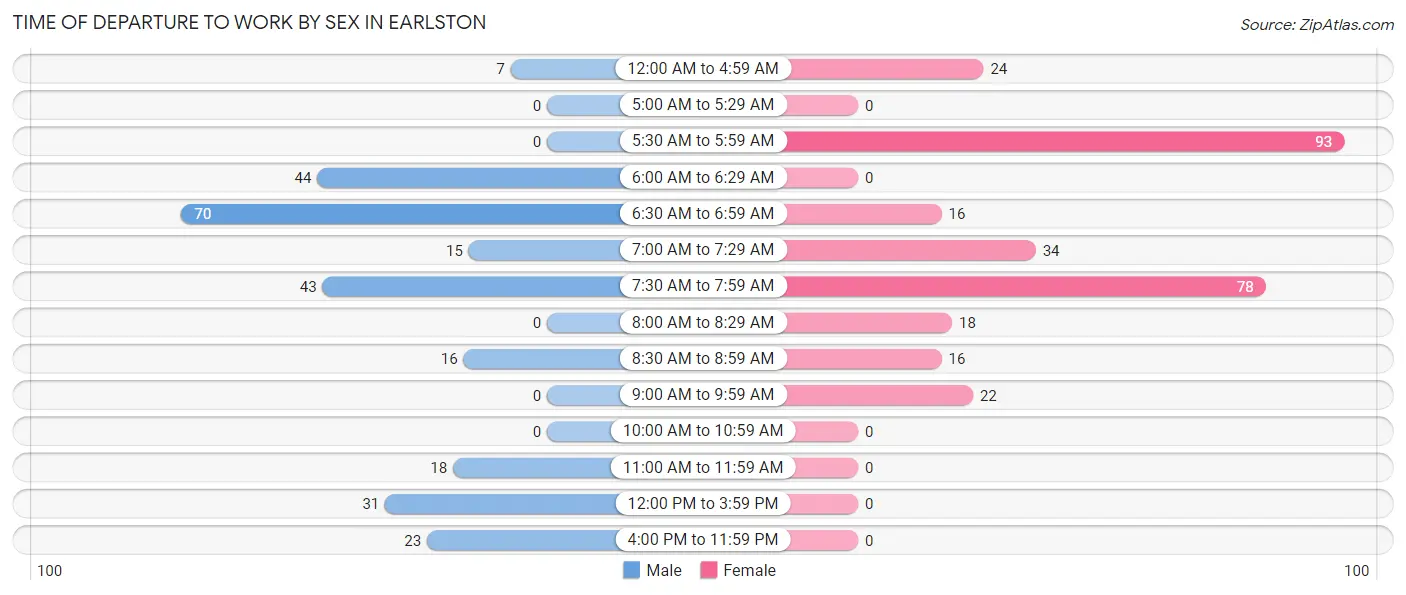
| Time of Departure | Male | Female |
| 12:00 AM to 4:59 AM | 7 (2.6%) | 24 (8.0%) |
| 5:00 AM to 5:29 AM | 0 (0.0%) | 0 (0.0%) |
| 5:30 AM to 5:59 AM | 0 (0.0%) | 93 (30.9%) |
| 6:00 AM to 6:29 AM | 44 (16.5%) | 0 (0.0%) |
| 6:30 AM to 6:59 AM | 70 (26.2%) | 16 (5.3%) |
| 7:00 AM to 7:29 AM | 15 (5.6%) | 34 (11.3%) |
| 7:30 AM to 7:59 AM | 43 (16.1%) | 78 (25.9%) |
| 8:00 AM to 8:29 AM | 0 (0.0%) | 18 (6.0%) |
| 8:30 AM to 8:59 AM | 16 (6.0%) | 16 (5.3%) |
| 9:00 AM to 9:59 AM | 0 (0.0%) | 22 (7.3%) |
| 10:00 AM to 10:59 AM | 0 (0.0%) | 0 (0.0%) |
| 11:00 AM to 11:59 AM | 18 (6.7%) | 0 (0.0%) |
| 12:00 PM to 3:59 PM | 31 (11.6%) | 0 (0.0%) |
| 4:00 PM to 11:59 PM | 23 (8.6%) | 0 (0.0%) |
| Total | 267 (100.0%) | 301 (100.0%) |
Housing Occupancy in Earlston
Occupancy by Ownership in Earlston
Of the total 445 dwellings in Earlston, owner-occupied units account for 315 (70.8%), while renter-occupied units make up 130 (29.2%).
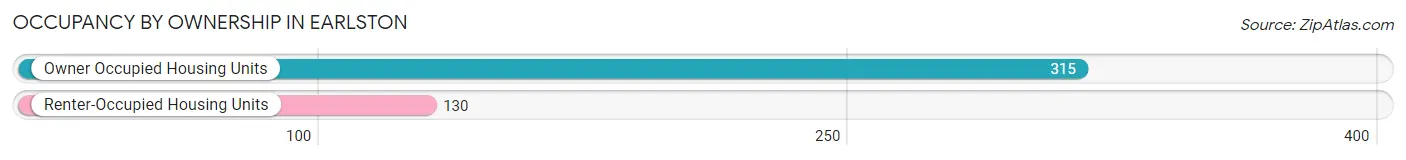
| Occupancy | # Housing Units | % Housing Units |
| Owner Occupied Housing Units | 315 | 70.8% |
| Renter-Occupied Housing Units | 130 | 29.2% |
| Total Occupied Housing Units | 445 | 100.0% |
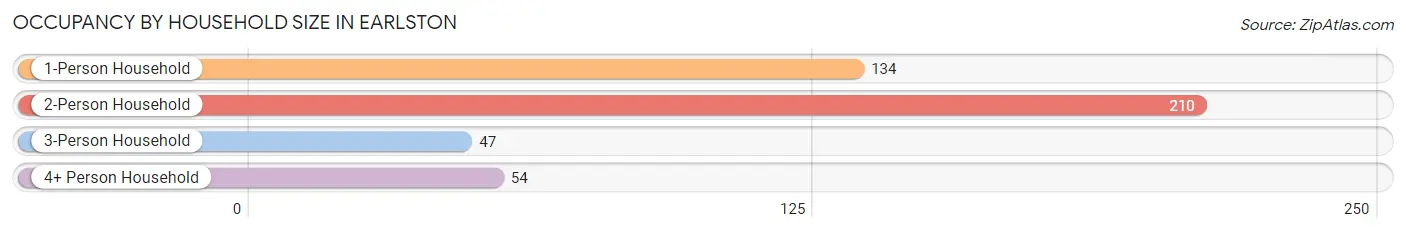
Occupancy by Household Size in Earlston
| Household Size | # Housing Units | % Housing Units |
| 1-Person Household | 134 | 30.1% |
| 2-Person Household | 210 | 47.2% |
| 3-Person Household | 47 | 10.6% |
| 4+ Person Household | 54 | 12.1% |
| Total Housing Units | 445 | 100.0% |
Occupancy by Ownership by Household Size in Earlston
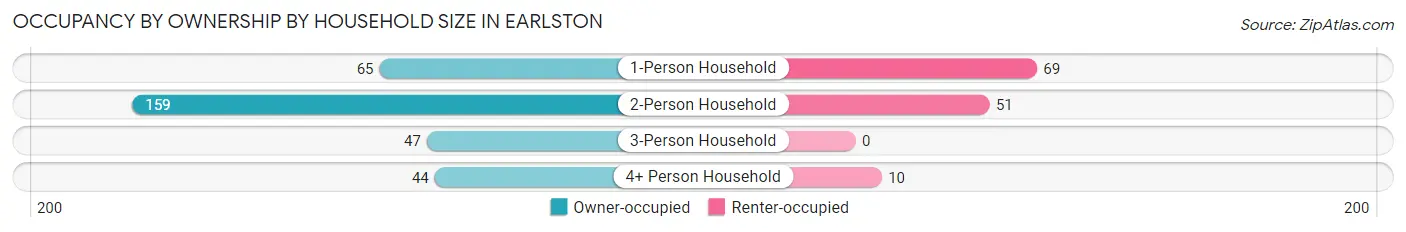
| Household Size | Owner-occupied | Renter-occupied |
| 1-Person Household | 65 (48.5%) | 69 (51.5%) |
| 2-Person Household | 159 (75.7%) | 51 (24.3%) |
| 3-Person Household | 47 (100.0%) | 0 (0.0%) |
| 4+ Person Household | 44 (81.5%) | 10 (18.5%) |
| Total Housing Units | 315 (70.8%) | 130 (29.2%) |
Occupancy by Educational Attainment in Earlston
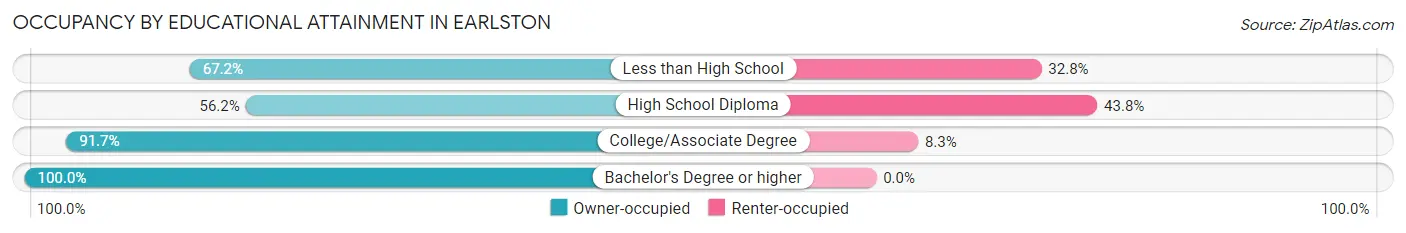
| Household Size | Owner-occupied | Renter-occupied |
| Less than High School | 39 (67.2%) | 19 (32.8%) |
| High School Diploma | 127 (56.2%) | 99 (43.8%) |
| College/Associate Degree | 133 (91.7%) | 12 (8.3%) |
| Bachelor's Degree or higher | 16 (100.0%) | 0 (0.0%) |
Occupancy by Age of Householder in Earlston
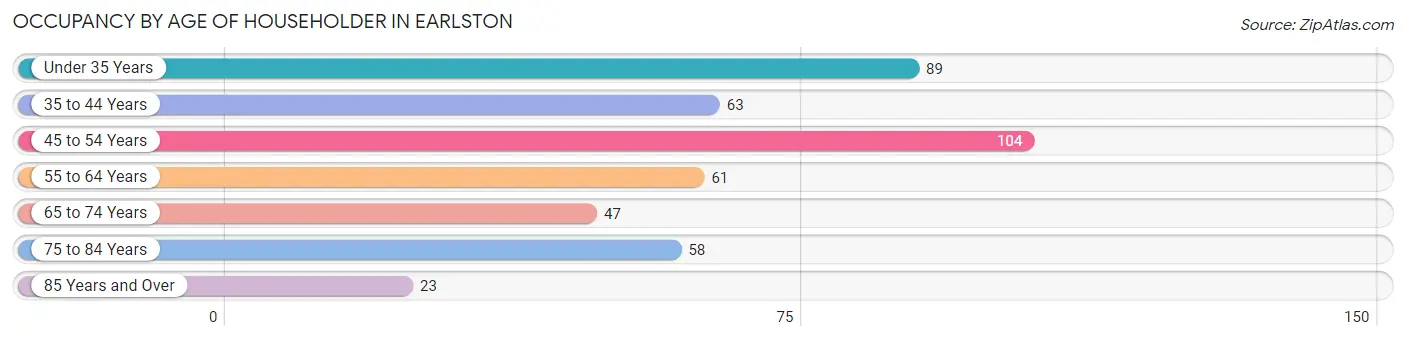
| Age Bracket | # Households | % Households |
| Under 35 Years | 89 | 20.0% |
| 35 to 44 Years | 63 | 14.2% |
| 45 to 54 Years | 104 | 23.4% |
| 55 to 64 Years | 61 | 13.7% |
| 65 to 74 Years | 47 | 10.6% |
| 75 to 84 Years | 58 | 13.0% |
| 85 Years and Over | 23 | 5.2% |
| Total | 445 | 100.0% |
Housing Finances in Earlston
Median Income by Occupancy in Earlston
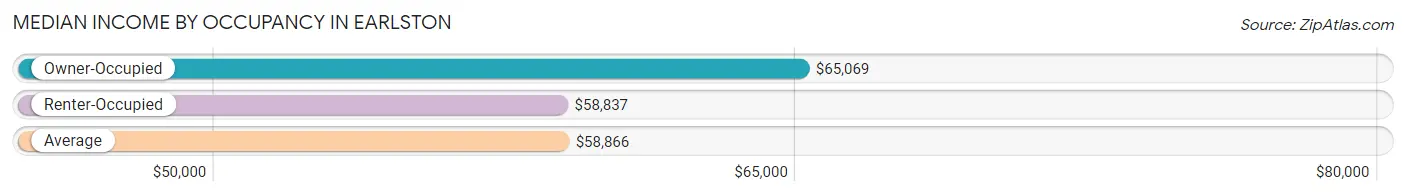
| Occupancy Type | # Households | Median Income |
| Owner-Occupied | 315 (70.8%) | $65,069 |
| Renter-Occupied | 130 (29.2%) | $58,837 |
| Average | 445 (100.0%) | $58,866 |
Occupancy by Householder Income Bracket in Earlston
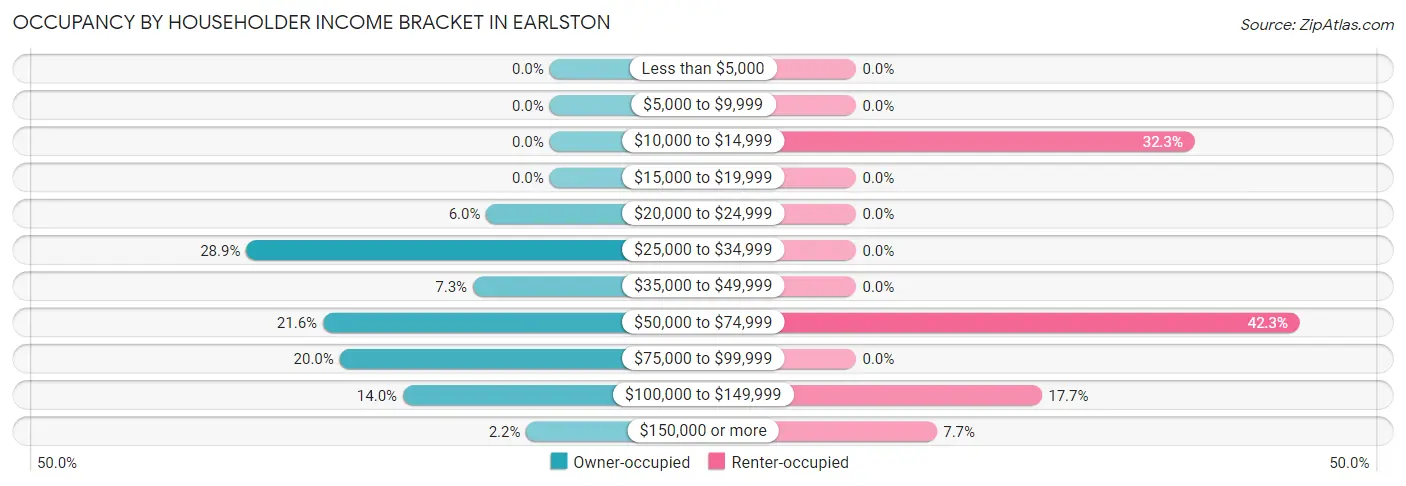
| Income Bracket | Owner-occupied | Renter-occupied |
| Less than $5,000 | 0 (0.0%) | 0 (0.0%) |
| $5,000 to $9,999 | 0 (0.0%) | 0 (0.0%) |
| $10,000 to $14,999 | 0 (0.0%) | 42 (32.3%) |
| $15,000 to $19,999 | 0 (0.0%) | 0 (0.0%) |
| $20,000 to $24,999 | 19 (6.0%) | 0 (0.0%) |
| $25,000 to $34,999 | 91 (28.9%) | 0 (0.0%) |
| $35,000 to $49,999 | 23 (7.3%) | 0 (0.0%) |
| $50,000 to $74,999 | 68 (21.6%) | 55 (42.3%) |
| $75,000 to $99,999 | 63 (20.0%) | 0 (0.0%) |
| $100,000 to $149,999 | 44 (14.0%) | 23 (17.7%) |
| $150,000 or more | 7 (2.2%) | 10 (7.7%) |
| Total | 315 (100.0%) | 130 (100.0%) |
Monthly Housing Cost Tiers in Earlston
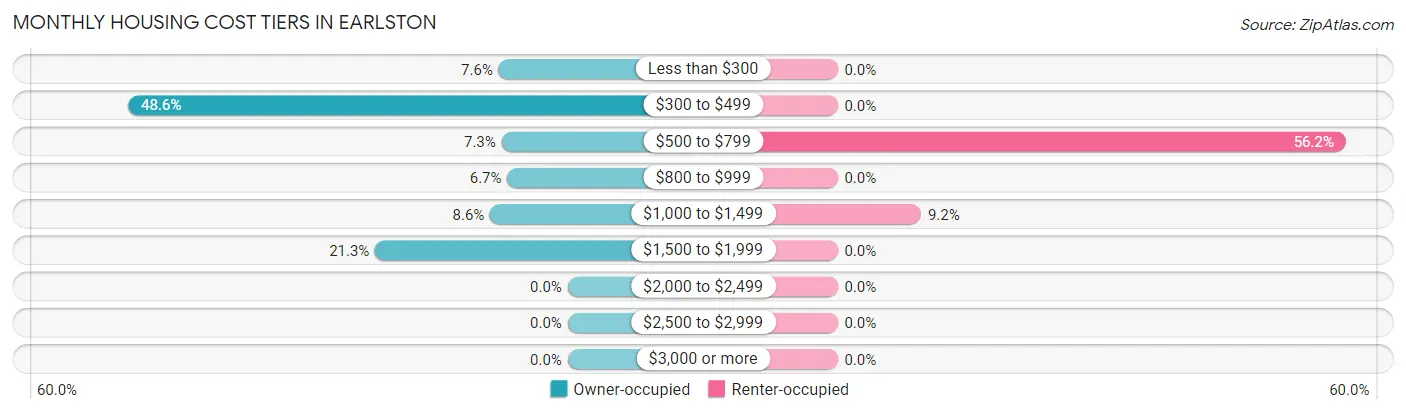
| Monthly Cost | Owner-occupied | Renter-occupied |
| Less than $300 | 24 (7.6%) | 0 (0.0%) |
| $300 to $499 | 153 (48.6%) | 0 (0.0%) |
| $500 to $799 | 23 (7.3%) | 73 (56.1%) |
| $800 to $999 | 21 (6.7%) | 0 (0.0%) |
| $1,000 to $1,499 | 27 (8.6%) | 12 (9.2%) |
| $1,500 to $1,999 | 67 (21.3%) | 0 (0.0%) |
| $2,000 to $2,499 | 0 (0.0%) | 0 (0.0%) |
| $2,500 to $2,999 | 0 (0.0%) | 0 (0.0%) |
| $3,000 or more | 0 (0.0%) | 0 (0.0%) |
| Total | 315 (100.0%) | 130 (100.0%) |
Physical Housing Characteristics in Earlston
Housing Structures in Earlston
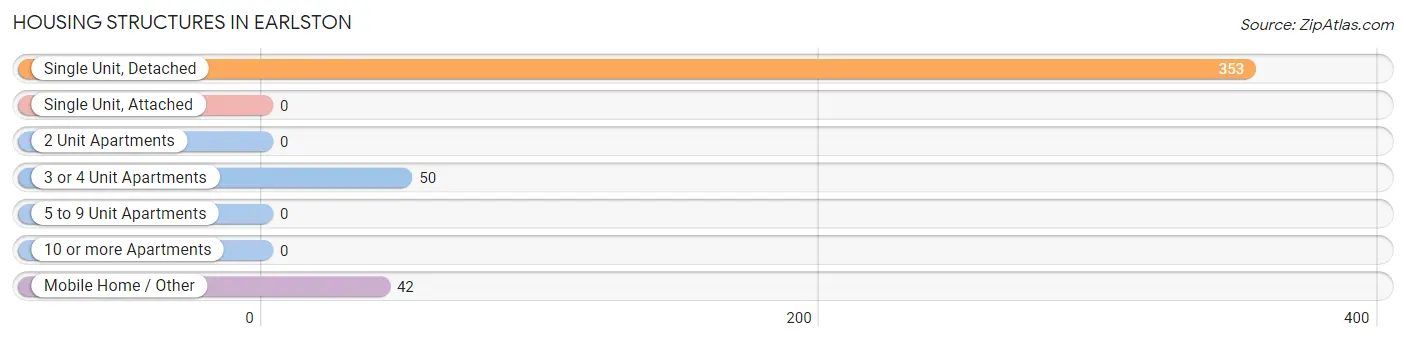
| Structure Type | # Housing Units | % Housing Units |
| Single Unit, Detached | 353 | 79.3% |
| Single Unit, Attached | 0 | 0.0% |
| 2 Unit Apartments | 0 | 0.0% |
| 3 or 4 Unit Apartments | 50 | 11.2% |
| 5 to 9 Unit Apartments | 0 | 0.0% |
| 10 or more Apartments | 0 | 0.0% |
| Mobile Home / Other | 42 | 9.4% |
| Total | 445 | 100.0% |
Housing Structures by Occupancy in Earlston
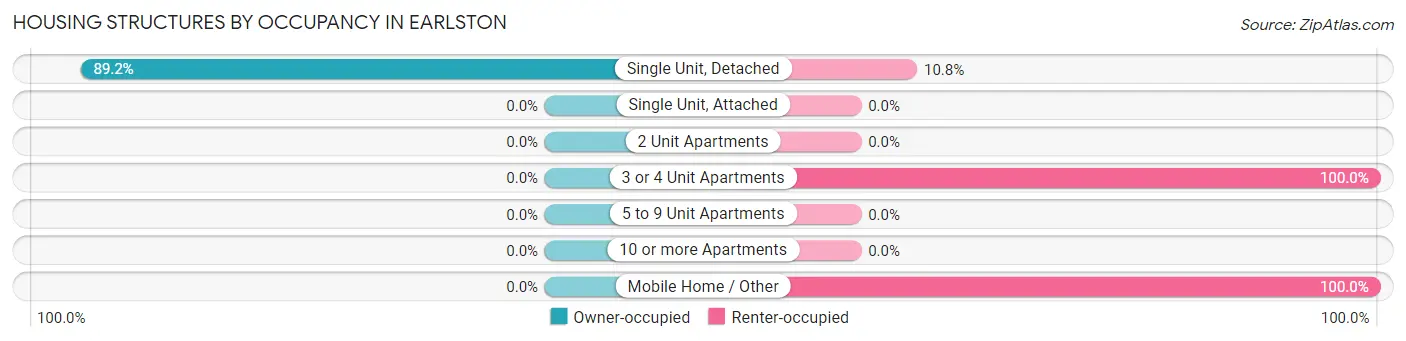
| Structure Type | Owner-occupied | Renter-occupied |
| Single Unit, Detached | 315 (89.2%) | 38 (10.8%) |
| Single Unit, Attached | 0 (0.0%) | 0 (0.0%) |
| 2 Unit Apartments | 0 (0.0%) | 0 (0.0%) |
| 3 or 4 Unit Apartments | 0 (0.0%) | 50 (100.0%) |
| 5 to 9 Unit Apartments | 0 (0.0%) | 0 (0.0%) |
| 10 or more Apartments | 0 (0.0%) | 0 (0.0%) |
| Mobile Home / Other | 0 (0.0%) | 42 (100.0%) |
| Total | 315 (70.8%) | 130 (29.2%) |
Housing Structures by Number of Rooms in Earlston
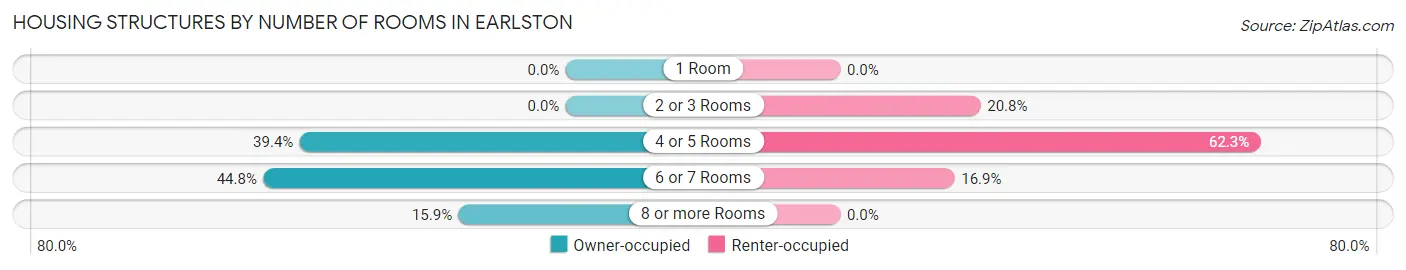
| Number of Rooms | Owner-occupied | Renter-occupied |
| 1 Room | 0 (0.0%) | 0 (0.0%) |
| 2 or 3 Rooms | 0 (0.0%) | 27 (20.8%) |
| 4 or 5 Rooms | 124 (39.4%) | 81 (62.3%) |
| 6 or 7 Rooms | 141 (44.8%) | 22 (16.9%) |
| 8 or more Rooms | 50 (15.9%) | 0 (0.0%) |
| Total | 315 (100.0%) | 130 (100.0%) |
Housing Structure by Heating Type in Earlston
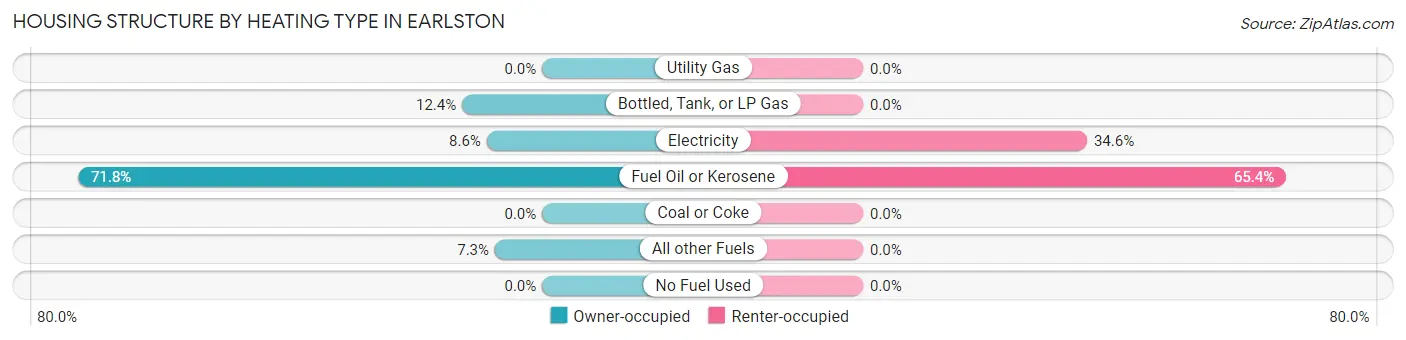
| Heating Type | Owner-occupied | Renter-occupied |
| Utility Gas | 0 (0.0%) | 0 (0.0%) |
| Bottled, Tank, or LP Gas | 39 (12.4%) | 0 (0.0%) |
| Electricity | 27 (8.6%) | 45 (34.6%) |
| Fuel Oil or Kerosene | 226 (71.8%) | 85 (65.4%) |
| Coal or Coke | 0 (0.0%) | 0 (0.0%) |
| All other Fuels | 23 (7.3%) | 0 (0.0%) |
| No Fuel Used | 0 (0.0%) | 0 (0.0%) |
| Total | 315 (100.0%) | 130 (100.0%) |
Household Vehicle Usage in Earlston
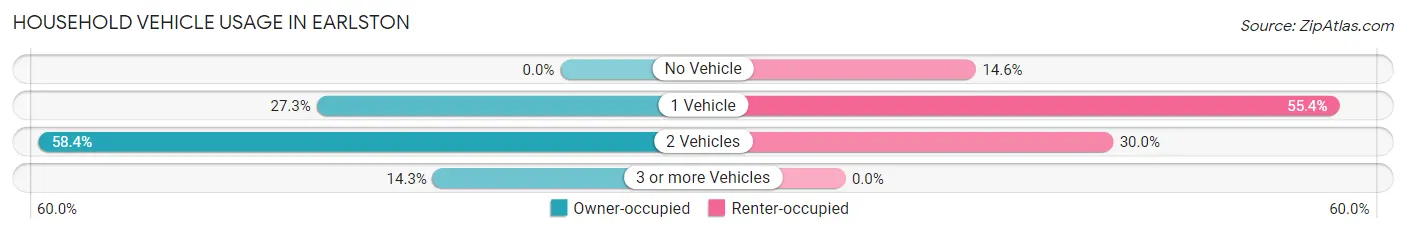
| Vehicles per Household | Owner-occupied | Renter-occupied |
| No Vehicle | 0 (0.0%) | 19 (14.6%) |
| 1 Vehicle | 86 (27.3%) | 72 (55.4%) |
| 2 Vehicles | 184 (58.4%) | 39 (30.0%) |
| 3 or more Vehicles | 45 (14.3%) | 0 (0.0%) |
| Total | 315 (100.0%) | 130 (100.0%) |
Real Estate & Mortgages in Earlston
Real Estate and Mortgage Overview in Earlston
| Characteristic | Without Mortgage | With Mortgage |
| Housing Units | 177 | 138 |
| Median Property Value | $176,500 | $164,200 |
| Median Household Income | $44,946 | $7 |
| Monthly Housing Costs | $380 | $0 |
| Real Estate Taxes | $926 | $21 |
Property Value by Mortgage Status in Earlston
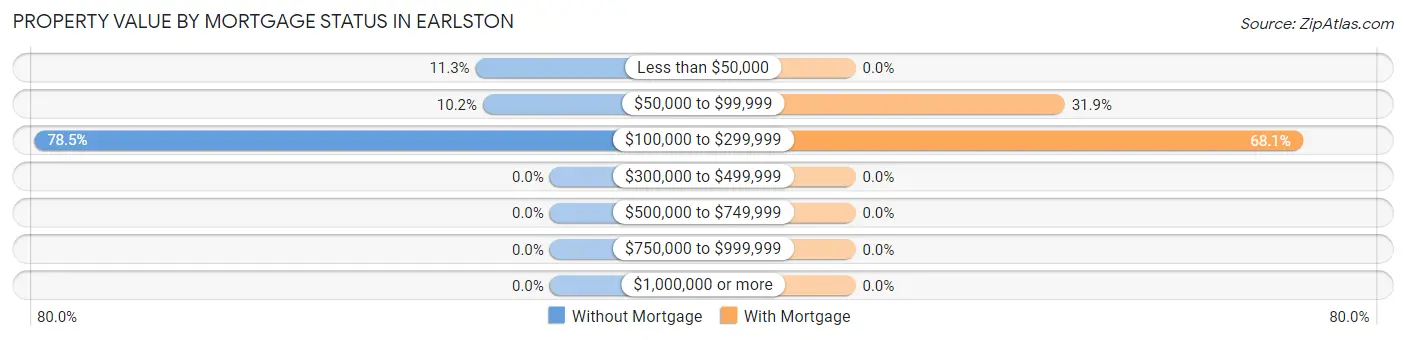
| Property Value | Without Mortgage | With Mortgage |
| Less than $50,000 | 20 (11.3%) | 0 (0.0%) |
| $50,000 to $99,999 | 18 (10.2%) | 44 (31.9%) |
| $100,000 to $299,999 | 139 (78.5%) | 94 (68.1%) |
| $300,000 to $499,999 | 0 (0.0%) | 0 (0.0%) |
| $500,000 to $749,999 | 0 (0.0%) | 0 (0.0%) |
| $750,000 to $999,999 | 0 (0.0%) | 0 (0.0%) |
| $1,000,000 or more | 0 (0.0%) | 0 (0.0%) |
| Total | 177 (100.0%) | 138 (100.0%) |
Household Income by Mortgage Status in Earlston
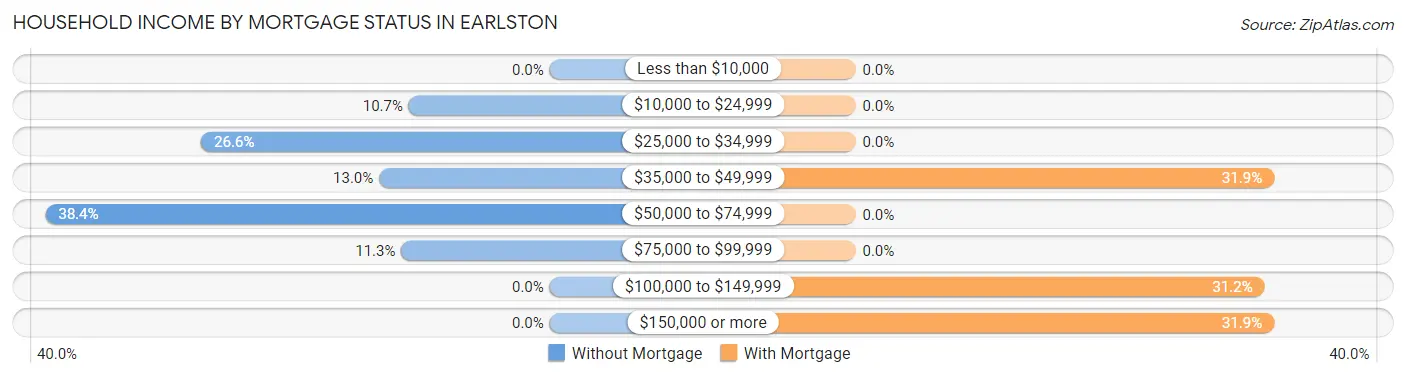
| Household Income | Without Mortgage | With Mortgage |
| Less than $10,000 | 0 (0.0%) | 0 (0.0%) |
| $10,000 to $24,999 | 19 (10.7%) | 0 (0.0%) |
| $25,000 to $34,999 | 47 (26.6%) | 0 (0.0%) |
| $35,000 to $49,999 | 23 (13.0%) | 44 (31.9%) |
| $50,000 to $74,999 | 68 (38.4%) | 0 (0.0%) |
| $75,000 to $99,999 | 20 (11.3%) | 0 (0.0%) |
| $100,000 to $149,999 | 0 (0.0%) | 43 (31.2%) |
| $150,000 or more | 0 (0.0%) | 44 (31.9%) |
| Total | 177 (100.0%) | 138 (100.0%) |
Property Value to Household Income Ratio in Earlston
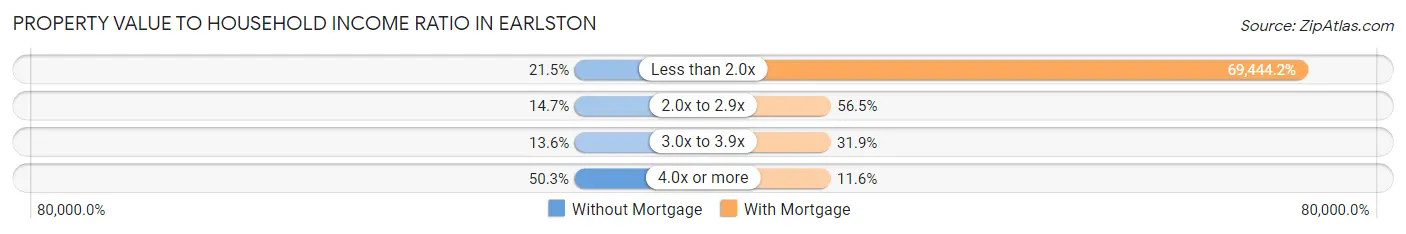
| Value-to-Income Ratio | Without Mortgage | With Mortgage |
| Less than 2.0x | 38 (21.5%) | 95,833 (69,444.2%) |
| 2.0x to 2.9x | 26 (14.7%) | 78 (56.5%) |
| 3.0x to 3.9x | 24 (13.6%) | 44 (31.9%) |
| 4.0x or more | 89 (50.3%) | 16 (11.6%) |
| Total | 177 (100.0%) | 138 (100.0%) |
Real Estate Taxes by Mortgage Status in Earlston
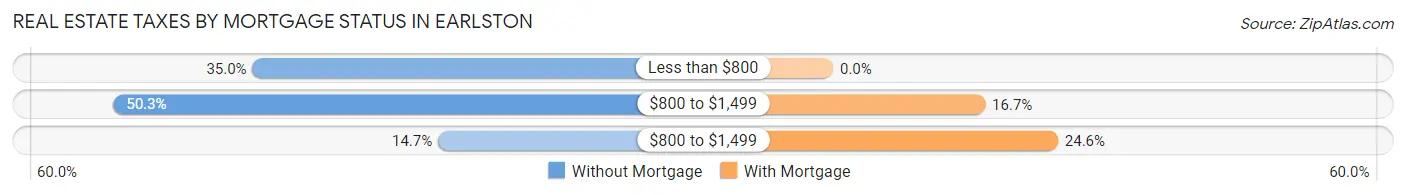
| Property Taxes | Without Mortgage | With Mortgage |
| Less than $800 | 62 (35.0%) | 0 (0.0%) |
| $800 to $1,499 | 89 (50.3%) | 23 (16.7%) |
| $800 to $1,499 | 26 (14.7%) | 34 (24.6%) |
| Total | 177 (100.0%) | 138 (100.0%) |
Health & Disability in Earlston
Health Insurance Coverage by Age in Earlston
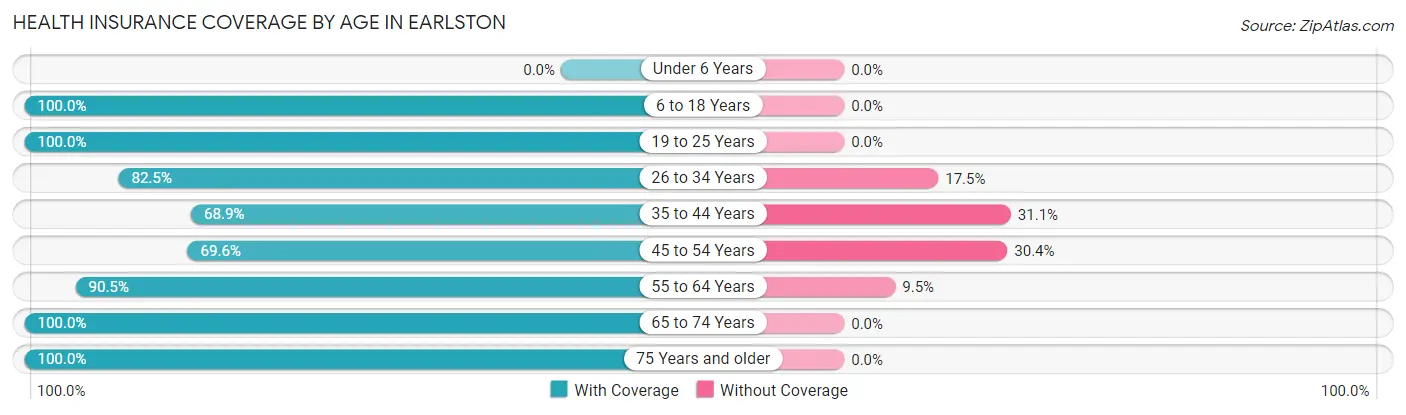
| Age Bracket | With Coverage | Without Coverage |
| Under 6 Years | 0 (0.0%) | 0 (0.0%) |
| 6 to 18 Years | 162 (100.0%) | 0 (0.0%) |
| 19 to 25 Years | 107 (100.0%) | 0 (0.0%) |
| 26 to 34 Years | 127 (82.5%) | 27 (17.5%) |
| 35 to 44 Years | 71 (68.9%) | 32 (31.1%) |
| 45 to 54 Years | 103 (69.6%) | 45 (30.4%) |
| 55 to 64 Years | 114 (90.5%) | 12 (9.5%) |
| 65 to 74 Years | 71 (100.0%) | 0 (0.0%) |
| 75 Years and older | 100 (100.0%) | 0 (0.0%) |
| Total | 855 (88.0%) | 116 (11.9%) |
Health Insurance Coverage by Citizenship Status in Earlston
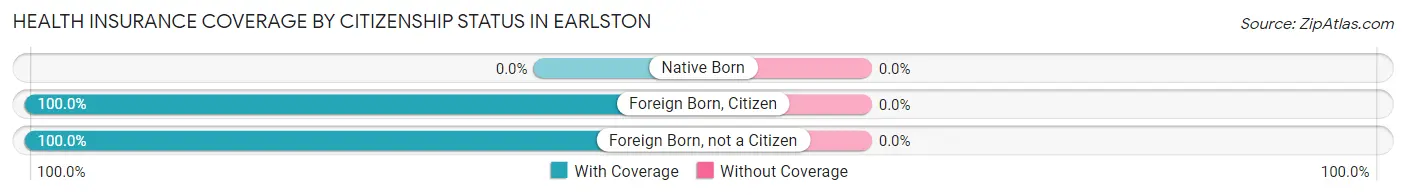
| Citizenship Status | With Coverage | Without Coverage |
| Native Born | 0 (0.0%) | 0 (0.0%) |
| Foreign Born, Citizen | 162 (100.0%) | 0 (0.0%) |
| Foreign Born, not a Citizen | 107 (100.0%) | 0 (0.0%) |
Health Insurance Coverage by Household Income in Earlston
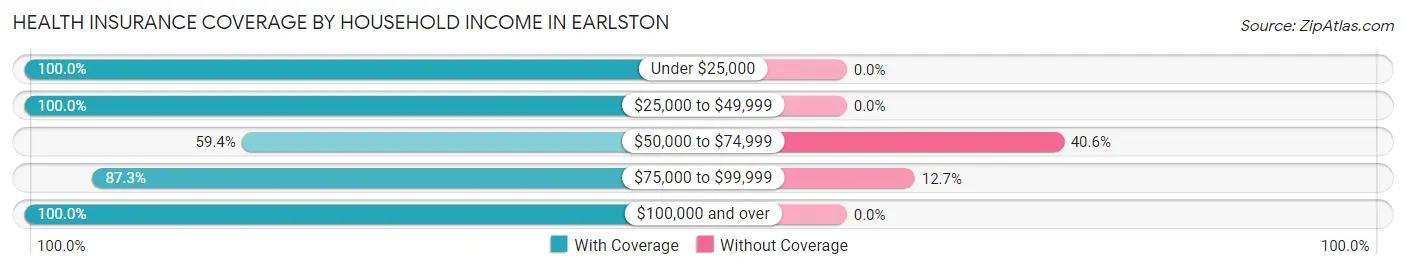
| Household Income | With Coverage | Without Coverage |
| Under $25,000 | 61 (100.0%) | 0 (0.0%) |
| $25,000 to $49,999 | 234 (100.0%) | 0 (0.0%) |
| $50,000 to $74,999 | 130 (59.4%) | 89 (40.6%) |
| $75,000 to $99,999 | 185 (87.3%) | 27 (12.7%) |
| $100,000 and over | 245 (100.0%) | 0 (0.0%) |
Public vs Private Health Insurance Coverage by Age in Earlston
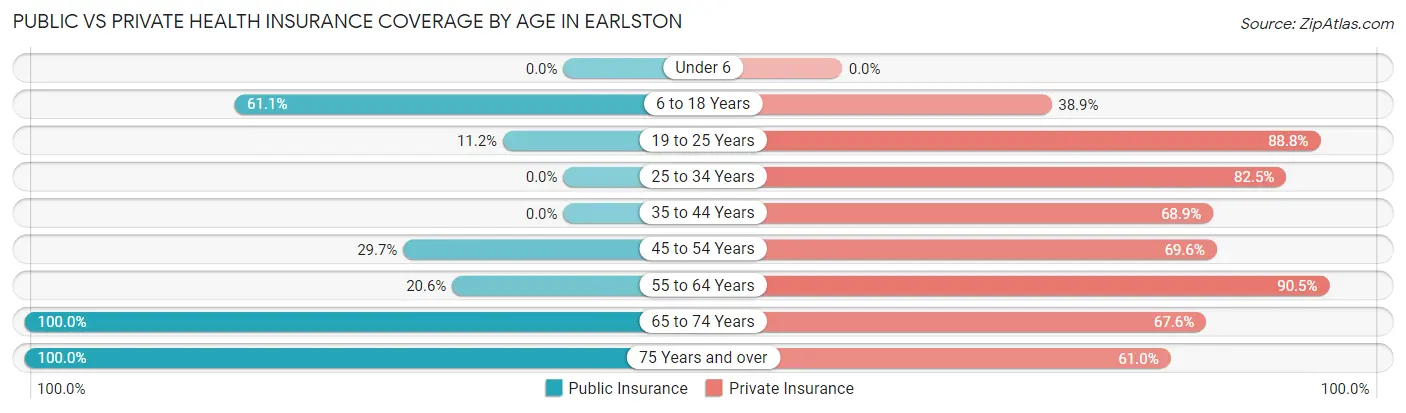
| Age Bracket | Public Insurance | Private Insurance |
| Under 6 | 0 (0.0%) | 0 (0.0%) |
| 6 to 18 Years | 99 (61.1%) | 63 (38.9%) |
| 19 to 25 Years | 12 (11.2%) | 95 (88.8%) |
| 25 to 34 Years | 0 (0.0%) | 127 (82.5%) |
| 35 to 44 Years | 0 (0.0%) | 71 (68.9%) |
| 45 to 54 Years | 44 (29.7%) | 103 (69.6%) |
| 55 to 64 Years | 26 (20.6%) | 114 (90.5%) |
| 65 to 74 Years | 71 (100.0%) | 48 (67.6%) |
| 75 Years and over | 100 (100.0%) | 61 (61.0%) |
| Total | 352 (36.2%) | 682 (70.2%) |
Disability Status by Sex by Age in Earlston
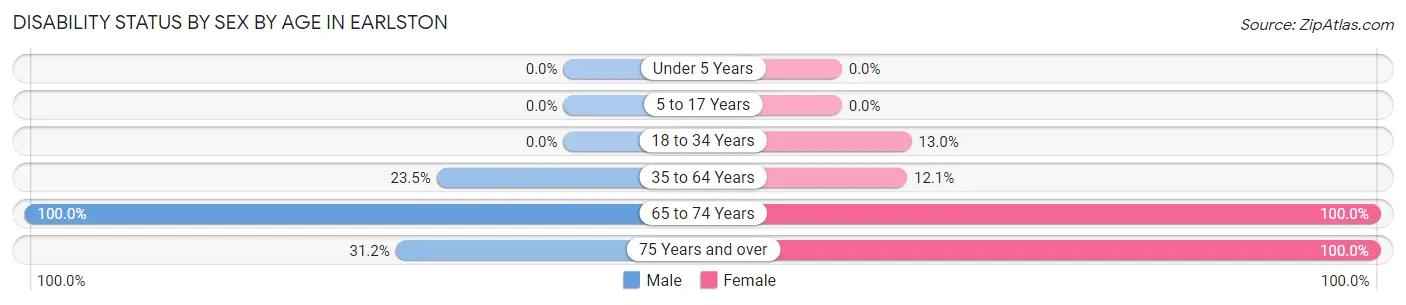
| Age Bracket | Male | Female |
| Under 5 Years | 0 (0.0%) | 0 (0.0%) |
| 5 to 17 Years | 0 (0.0%) | 0 (0.0%) |
| 18 to 34 Years | 0 (0.0%) | 21 (13.0%) |
| 35 to 64 Years | 44 (23.5%) | 23 (12.1%) |
| 65 to 74 Years | 24 (100.0%) | 47 (100.0%) |
| 75 Years and over | 19 (31.1%) | 39 (100.0%) |
Disability Class by Sex by Age in Earlston
Disability Class: Hearing Difficulty
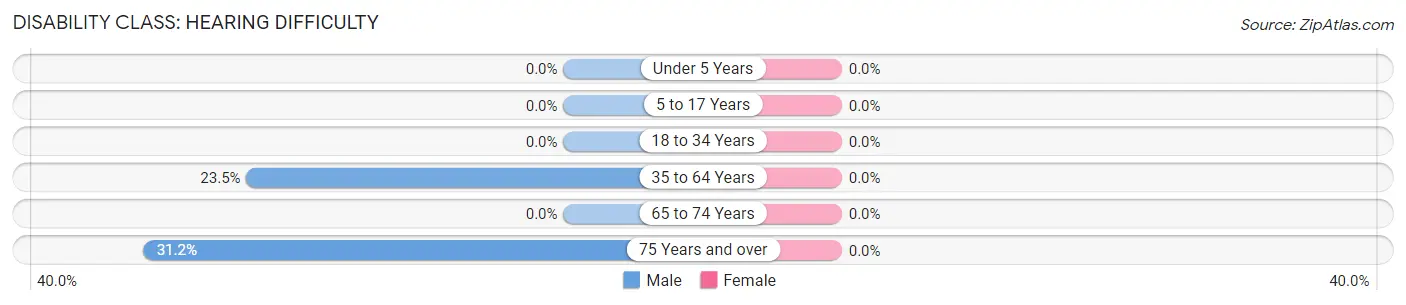
| Age Bracket | Male | Female |
| Under 5 Years | 0 (0.0%) | 0 (0.0%) |
| 5 to 17 Years | 0 (0.0%) | 0 (0.0%) |
| 18 to 34 Years | 0 (0.0%) | 0 (0.0%) |
| 35 to 64 Years | 44 (23.5%) | 0 (0.0%) |
| 65 to 74 Years | 0 (0.0%) | 0 (0.0%) |
| 75 Years and over | 19 (31.1%) | 0 (0.0%) |
Disability Class: Vision Difficulty
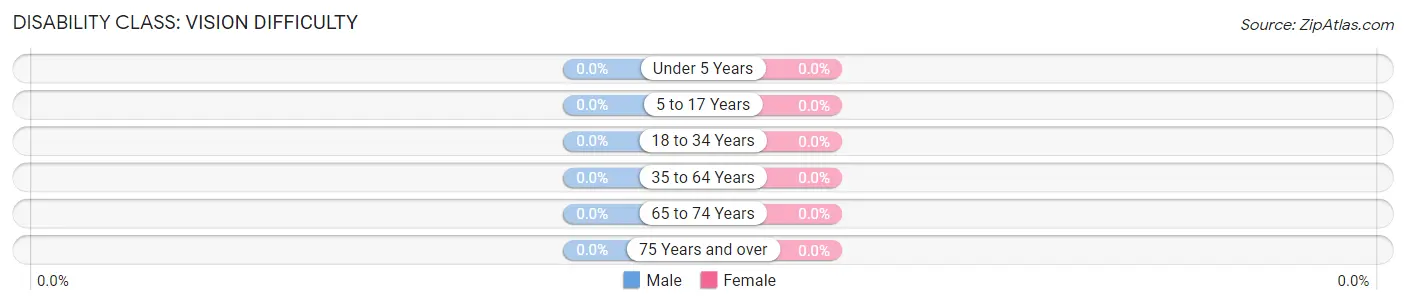
| Age Bracket | Male | Female |
| Under 5 Years | 0 (0.0%) | 0 (0.0%) |
| 5 to 17 Years | 0 (0.0%) | 0 (0.0%) |
| 18 to 34 Years | 0 (0.0%) | 0 (0.0%) |
| 35 to 64 Years | 0 (0.0%) | 0 (0.0%) |
| 65 to 74 Years | 0 (0.0%) | 0 (0.0%) |
| 75 Years and over | 0 (0.0%) | 0 (0.0%) |
Disability Class: Cognitive Difficulty
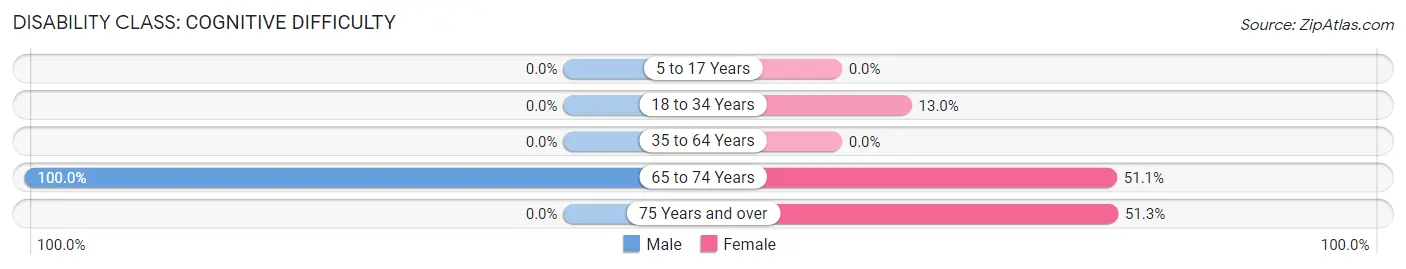
| Age Bracket | Male | Female |
| 5 to 17 Years | 0 (0.0%) | 0 (0.0%) |
| 18 to 34 Years | 0 (0.0%) | 21 (13.0%) |
| 35 to 64 Years | 0 (0.0%) | 0 (0.0%) |
| 65 to 74 Years | 24 (100.0%) | 24 (51.1%) |
| 75 Years and over | 0 (0.0%) | 20 (51.3%) |
Disability Class: Ambulatory Difficulty
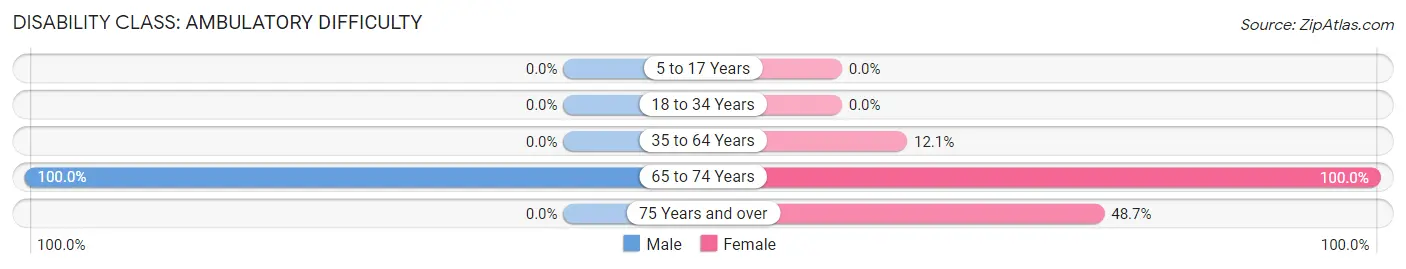
| Age Bracket | Male | Female |
| 5 to 17 Years | 0 (0.0%) | 0 (0.0%) |
| 18 to 34 Years | 0 (0.0%) | 0 (0.0%) |
| 35 to 64 Years | 0 (0.0%) | 23 (12.1%) |
| 65 to 74 Years | 24 (100.0%) | 47 (100.0%) |
| 75 Years and over | 0 (0.0%) | 19 (48.7%) |
Disability Class: Self-Care Difficulty
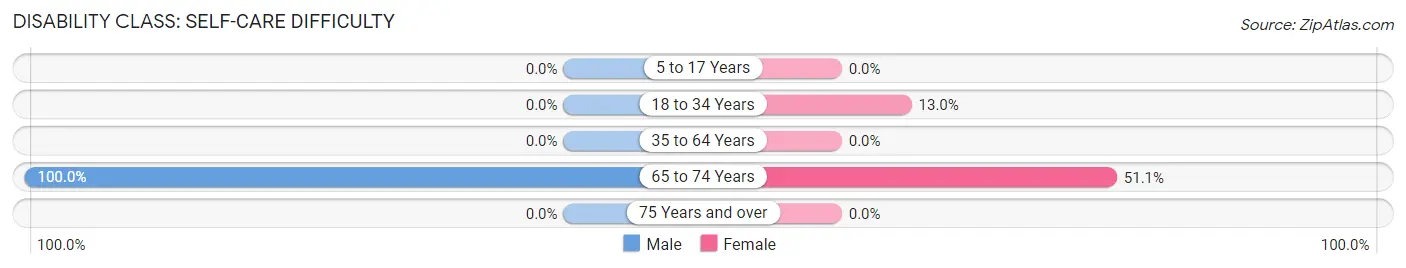
| Age Bracket | Male | Female |
| 5 to 17 Years | 0 (0.0%) | 0 (0.0%) |
| 18 to 34 Years | 0 (0.0%) | 21 (13.0%) |
| 35 to 64 Years | 0 (0.0%) | 0 (0.0%) |
| 65 to 74 Years | 24 (100.0%) | 24 (51.1%) |
| 75 Years and over | 0 (0.0%) | 0 (0.0%) |
Technology Access in Earlston
Computing Device Access in Earlston
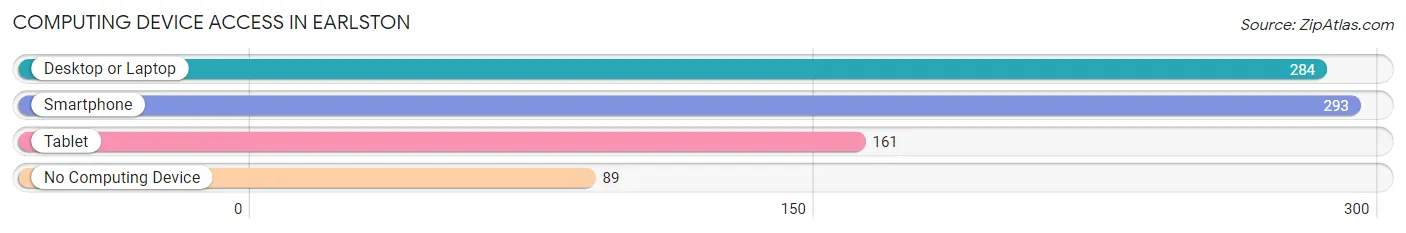
| Device Type | # Households | % Households |
| Desktop or Laptop | 284 | 63.8% |
| Smartphone | 293 | 65.8% |
| Tablet | 161 | 36.2% |
| No Computing Device | 89 | 20.0% |
| Total | 445 | 100.0% |
Internet Access in Earlston
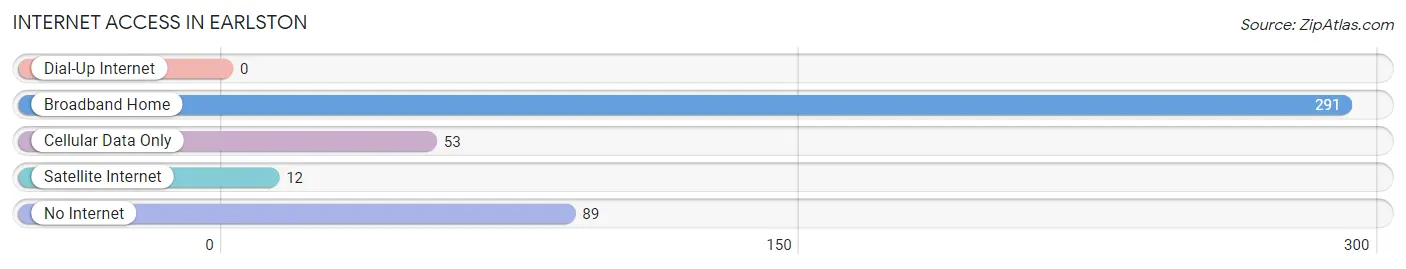
| Internet Type | # Households | % Households |
| Dial-Up Internet | 0 | 0.0% |
| Broadband Home | 291 | 65.4% |
| Cellular Data Only | 53 | 11.9% |
| Satellite Internet | 12 | 2.7% |
| No Internet | 89 | 20.0% |
| Total | 445 | 100.0% |
Earlston Summary
Earlston is a small borough located in the south-central region of Pennsylvania, United States. It is situated in the northern part of York County, approximately 8 miles south of the city of York. The borough is bordered by the townships of North Hopewell, East Hopewell, and Chanceford. According to the 2010 census, the population of Earlston was 1,845.
History
The area that is now Earlston was first settled in the late 1700s by German immigrants. The town was originally known as “Earl’s Town” after the Earl family, who were among the first settlers. The town was officially incorporated in 1872.
In the late 1800s, Earlston was a thriving agricultural community. The town was home to several mills, including a flour mill, a saw mill, and a grist mill. The town also had a blacksmith shop, a general store, and a post office.
In the early 1900s, Earlston began to experience a decline in population as many of its residents moved away in search of better economic opportunities. The town’s population continued to decline until the 1950s, when it began to slowly increase again.
Geography
Earlston is located in the northern part of York County, approximately 8 miles south of the city of York. The borough is bordered by the townships of North Hopewell, East Hopewell, and Chanceford.
The borough has a total area of 0.7 square miles, all of which is land. The terrain is mostly flat, with some rolling hills. The borough is located in the Piedmont region of Pennsylvania, which is characterized by rolling hills and valleys.
Economy
Earlston’s economy is largely based on agriculture. The town is home to several farms, which produce a variety of crops, including corn, soybeans, wheat, and hay. The town also has several small businesses, including a grocery store, a hardware store, and a restaurant.
Demographics
According to the 2010 census, the population of Earlston was 1,845. The racial makeup of the borough was 95.3% White, 1.2% African American, 0.2% Native American, 0.7% Asian, 0.1% Pacific Islander, 0.9% from other races, and 1.6% from two or more races. Hispanic or Latino of any race were 2.2% of the population.
The median household income in Earlston was $45,938, and the median family income was $51,250. The per capita income for the borough was $20,945. About 8.2% of families and 10.2% of the population were below the poverty line, including 14.2% of those under age 18 and 5.2% of those age 65 or over.
Common Questions
What is Per Capita Income in Earlston?
Per Capita income in Earlston is $32,655.
What is the Median Family Income in Earlston?
Median Family Income in Earlston is $73,221.
What is the Median Household income in Earlston?
Median Household Income in Earlston is $58,866.
What is Income or Wage Gap in Earlston?
Income or Wage Gap in Earlston is 13.5%.
Women in Earlston earn 86.5 cents for every dollar earned by a man.
What is Inequality or Gini Index in Earlston?
Inequality or Gini Index in Earlston is 0.35.
What is the Total Population of Earlston?
Total Population of Earlston is 971.
What is the Total Male Population of Earlston?
Total Male Population of Earlston is 439.
What is the Total Female Population of Earlston?
Total Female Population of Earlston is 532.
What is the Ratio of Males per 100 Females in Earlston?
There are 82.52 Males per 100 Females in Earlston.
What is the Ratio of Females per 100 Males in Earlston?
There are 121.18 Females per 100 Males in Earlston.
What is the Median Population Age in Earlston?
Median Population Age in Earlston is 41.6 Years.
What is the Average Family Size in Earlston
Average Family Size in Earlston is 2.8 People.
What is the Average Household Size in Earlston
Average Household Size in Earlston is 2.2 People.
How Large is the Labor Force in Earlston?
There are 593 People in the Labor Forcein in Earlston.
What is the Percentage of People in the Labor Force in Earlston?
67.4% of People are in the Labor Force in Earlston.
What is the Unemployment Rate in Earlston?
Unemployment Rate in Earlston is 3.0%.