Eagles Mere borough, PA Map & Demographics
Eagles Mere borough Overview
$99,394
PER CAPITA INCOME
$126,250
AVG FAMILY INCOME
$102,500
AVG HOUSEHOLD INCOME
0.51
INEQUALITY / GINI INDEX
100
TOTAL POPULATION
44
MALE POPULATION
56
FEMALE POPULATION
78.57
MALES / 100 FEMALES
127.27
FEMALES / 100 MALES
67.2
MEDIAN AGE
2.1
AVG FAMILY SIZE
1.7
AVG HOUSEHOLD SIZE
36
LABOR FORCE [ PEOPLE ]
37.1%
PERCENT IN LABOR FORCE
8.3%
UNEMPLOYMENT RATE
Income in Eagles Mere borough
Income Overview in Eagles Mere borough
Per Capita Income in Eagles Mere borough is $99,394, while median incomes of families and households are $126,250 and $102,500 respectively.
| Characteristic | Number | Measure |
| Per Capita Income | 100 | $99,394 |
| Median Family Income | 36 | $126,250 |
| Mean Family Income | 36 | $183,994 |
| Median Household Income | 60 | $102,500 |
| Mean Household Income | 60 | $165,087 |
| Income Deficit | 36 | $0 |
| Wage / Income Gap (%) | 100 | 0.00% |
| Wage / Income Gap ($) | 100 | 100.00¢ per $1 |
| Gini / Inequality Index | 100 | 0.51 |
Earnings by Sex in Eagles Mere borough
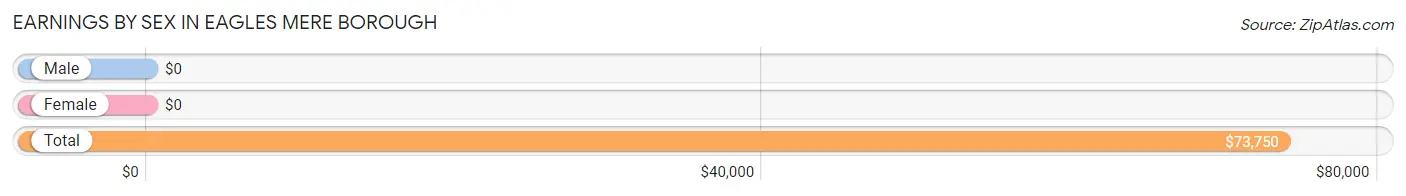
| Sex | Number | Average Earnings |
| Male | 21 (51.2%) | $0 |
| Female | 20 (48.8%) | $0 |
| Total | 41 (100.0%) | $73,750 |
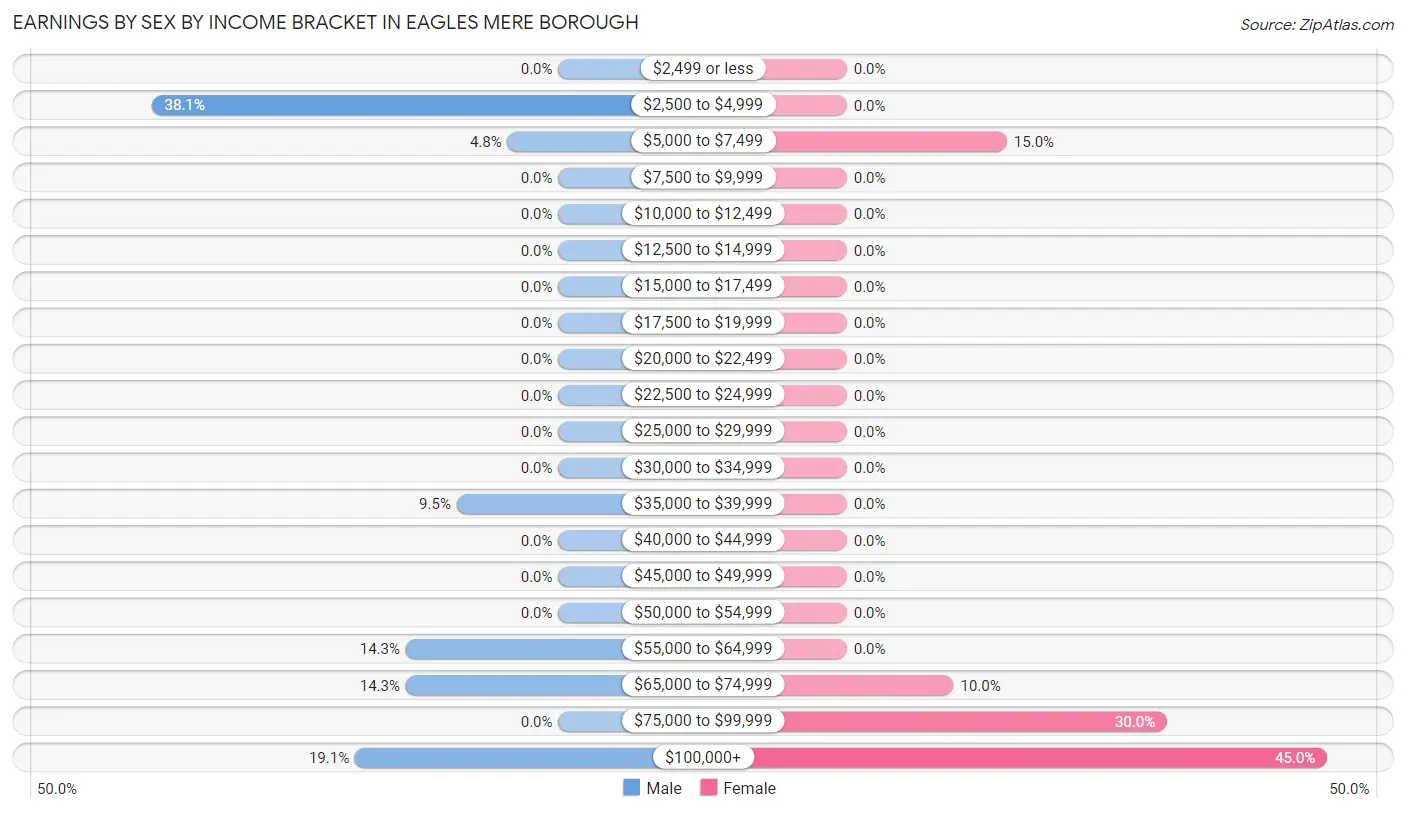
Earnings by Sex by Income Bracket in Eagles Mere borough
The most common earnings brackets in Eagles Mere borough are $2,500 to $4,999 for men (8 | 38.1%) and $100,000+ for women (9 | 45.0%).
| Income | Male | Female |
| $2,499 or less | 0 (0.0%) | 0 (0.0%) |
| $2,500 to $4,999 | 8 (38.1%) | 0 (0.0%) |
| $5,000 to $7,499 | 1 (4.8%) | 3 (15.0%) |
| $7,500 to $9,999 | 0 (0.0%) | 0 (0.0%) |
| $10,000 to $12,499 | 0 (0.0%) | 0 (0.0%) |
| $12,500 to $14,999 | 0 (0.0%) | 0 (0.0%) |
| $15,000 to $17,499 | 0 (0.0%) | 0 (0.0%) |
| $17,500 to $19,999 | 0 (0.0%) | 0 (0.0%) |
| $20,000 to $22,499 | 0 (0.0%) | 0 (0.0%) |
| $22,500 to $24,999 | 0 (0.0%) | 0 (0.0%) |
| $25,000 to $29,999 | 0 (0.0%) | 0 (0.0%) |
| $30,000 to $34,999 | 0 (0.0%) | 0 (0.0%) |
| $35,000 to $39,999 | 2 (9.5%) | 0 (0.0%) |
| $40,000 to $44,999 | 0 (0.0%) | 0 (0.0%) |
| $45,000 to $49,999 | 0 (0.0%) | 0 (0.0%) |
| $50,000 to $54,999 | 0 (0.0%) | 0 (0.0%) |
| $55,000 to $64,999 | 3 (14.3%) | 0 (0.0%) |
| $65,000 to $74,999 | 3 (14.3%) | 2 (10.0%) |
| $75,000 to $99,999 | 0 (0.0%) | 6 (30.0%) |
| $100,000+ | 4 (19.1%) | 9 (45.0%) |
| Total | 21 (100.0%) | 20 (100.0%) |
Earnings by Sex by Educational Attainment in Eagles Mere borough
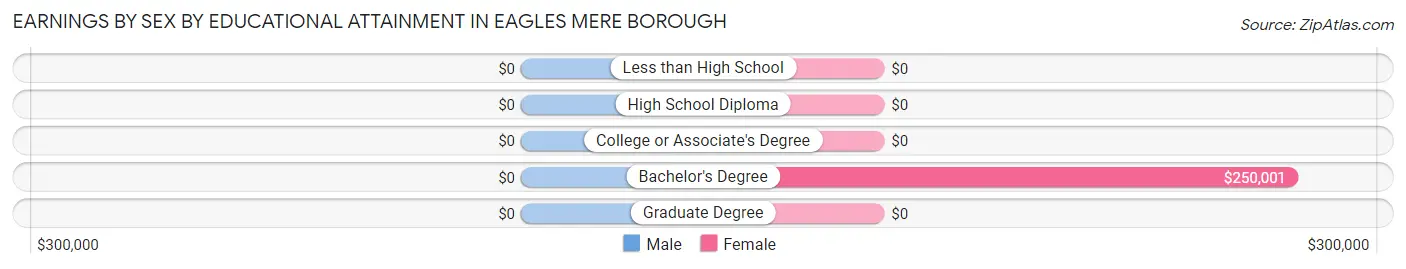
| Educational Attainment | Male Income | Female Income |
| Less than High School | - | - |
| High School Diploma | - | - |
| College or Associate's Degree | - | - |
| Bachelor's Degree | - | - |
| Graduate Degree | - | - |
| Total | - | - |
Family Income in Eagles Mere borough
Family Income Brackets in Eagles Mere borough
According to the Eagles Mere borough family income data, there are 10 families falling into the $150,000 to $199,999 income range, which is the most common income bracket and makes up 27.8% of all families.
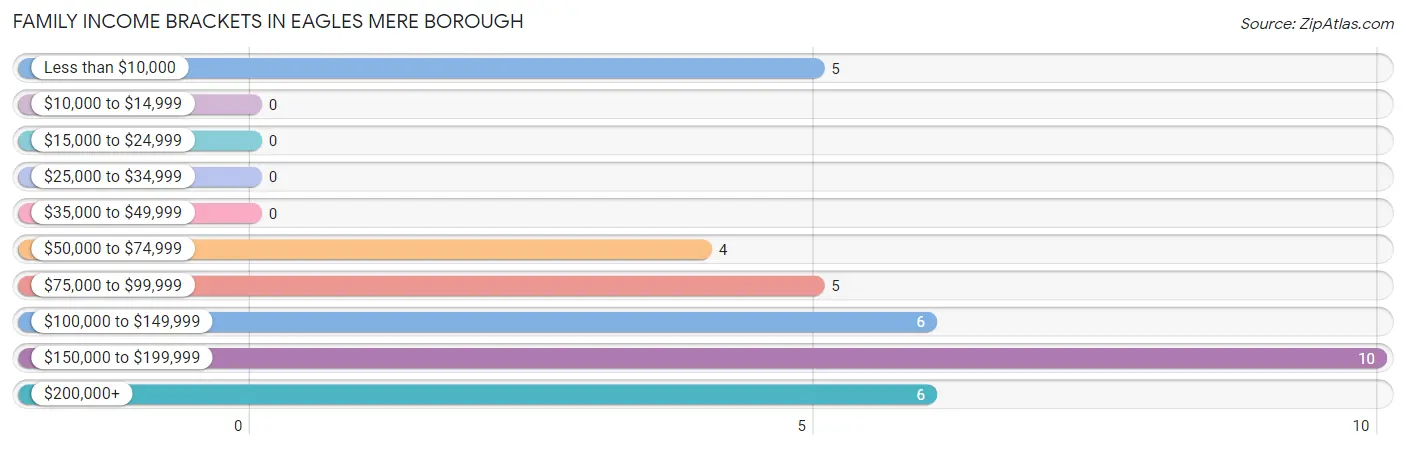
| Income Bracket | # Families | % Families |
| Less than $10,000 | 5 | 13.9% |
| $10,000 to $14,999 | 0 | 0.0% |
| $15,000 to $24,999 | 0 | 0.0% |
| $25,000 to $34,999 | 0 | 0.0% |
| $35,000 to $49,999 | 0 | 0.0% |
| $50,000 to $74,999 | 4 | 11.1% |
| $75,000 to $99,999 | 5 | 13.9% |
| $100,000 to $149,999 | 6 | 16.7% |
| $150,000 to $199,999 | 10 | 27.8% |
| $200,000+ | 6 | 16.7% |
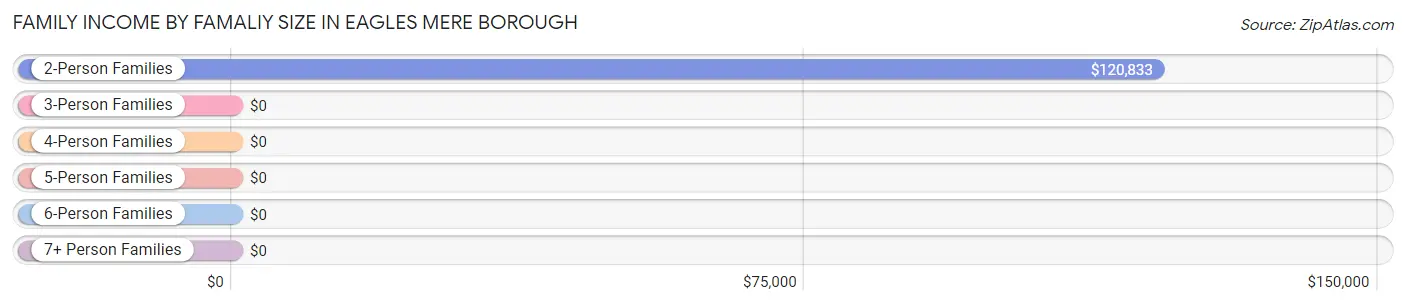
Family Income by Famaliy Size in Eagles Mere borough
2-person families (32 | 88.9%) account for the highest median family income in Eagles Mere borough with $120,833 per family, while 2-person families (32 | 88.9%) have the highest median income of $60,416 per family member.
| Income Bracket | # Families | Median Income |
| 2-Person Families | 32 (88.9%) | $120,833 |
| 3-Person Families | 0 (0.0%) | $0 |
| 4-Person Families | 4 (11.1%) | $0 |
| 5-Person Families | 0 (0.0%) | $0 |
| 6-Person Families | 0 (0.0%) | $0 |
| 7+ Person Families | 0 (0.0%) | $0 |
| Total | 36 (100.0%) | $126,250 |
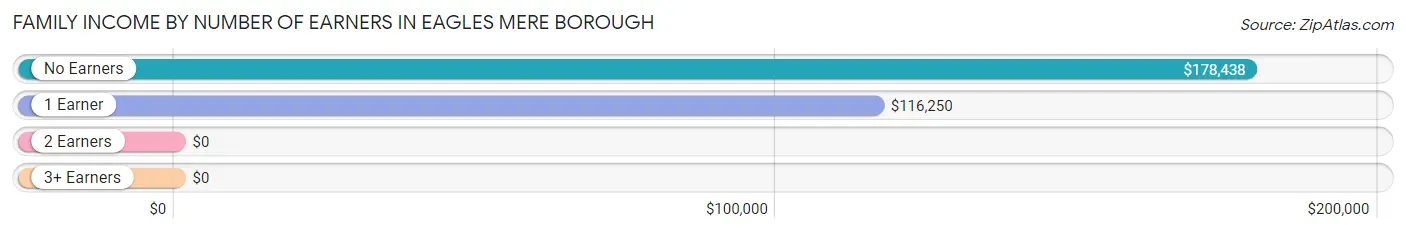
Family Income by Number of Earners in Eagles Mere borough
| Number of Earners | # Families | Median Income |
| No Earners | 11 (30.6%) | $178,438 |
| 1 Earner | 21 (58.3%) | $116,250 |
| 2 Earners | 4 (11.1%) | $0 |
| 3+ Earners | 0 (0.0%) | $0 |
| Total | 36 (100.0%) | $126,250 |
Household Income in Eagles Mere borough
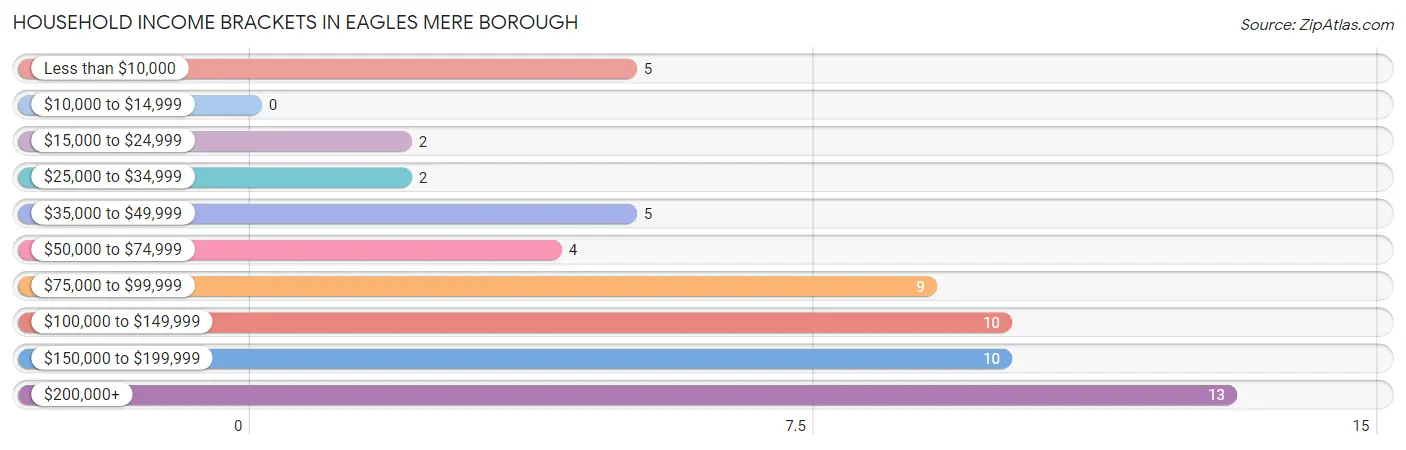
Household Income Brackets in Eagles Mere borough
With 13 households falling in the category, the $200,000+ income range is the most frequent in Eagles Mere borough, accounting for 21.7% of all households.
| Income Bracket | # Households | % Households |
| Less than $10,000 | 5 | 8.3% |
| $10,000 to $14,999 | 0 | 0.0% |
| $15,000 to $24,999 | 2 | 3.3% |
| $25,000 to $34,999 | 2 | 3.3% |
| $35,000 to $49,999 | 5 | 8.3% |
| $50,000 to $74,999 | 4 | 6.7% |
| $75,000 to $99,999 | 9 | 15.0% |
| $100,000 to $149,999 | 10 | 16.7% |
| $150,000 to $199,999 | 10 | 16.7% |
| $200,000+ | 13 | 21.7% |
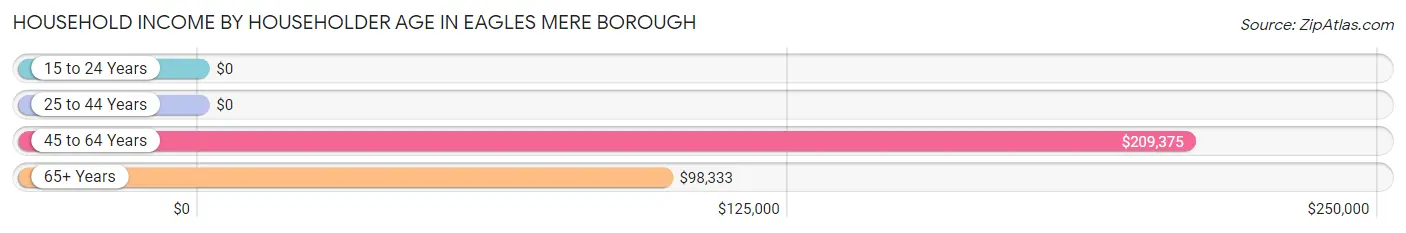
Household Income by Householder Age in Eagles Mere borough
The median household income in Eagles Mere borough is $102,500, with the highest median household income of $209,375 found in the 45 to 64 years age bracket for the primary householder. A total of 23 households (38.3%) fall into this category.
| Income Bracket | # Households | Median Income |
| 15 to 24 Years | 0 (0.0%) | $0 |
| 25 to 44 Years | 3 (5.0%) | $0 |
| 45 to 64 Years | 23 (38.3%) | $209,375 |
| 65+ Years | 34 (56.7%) | $98,333 |
| Total | 60 (100.0%) | $102,500 |
Poverty in Eagles Mere borough
Income Below Poverty by Sex and Age in Eagles Mere borough
With 4.5% poverty level for males and 10.7% for females among the residents of Eagles Mere borough, 75 year old and over males and 12 to 14 year old females are the most vulnerable to poverty, with 2 males (22.2%) and 1 females (100.0%) in their respective age groups living below the poverty level.
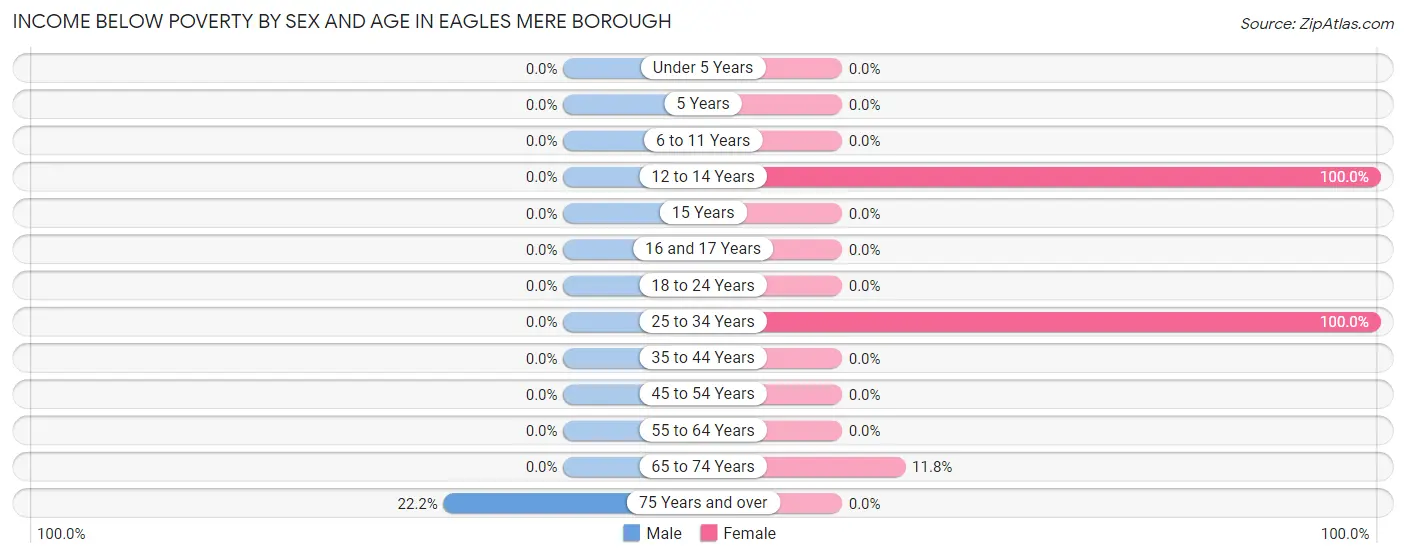
| Age Bracket | Male | Female |
| Under 5 Years | 0 (0.0%) | 0 (0.0%) |
| 5 Years | 0 (0.0%) | 0 (0.0%) |
| 6 to 11 Years | 0 (0.0%) | 0 (0.0%) |
| 12 to 14 Years | 0 (0.0%) | 1 (100.0%) |
| 15 Years | 0 (0.0%) | 0 (0.0%) |
| 16 and 17 Years | 0 (0.0%) | 0 (0.0%) |
| 18 to 24 Years | 0 (0.0%) | 0 (0.0%) |
| 25 to 34 Years | 0 (0.0%) | 3 (100.0%) |
| 35 to 44 Years | 0 (0.0%) | 0 (0.0%) |
| 45 to 54 Years | 0 (0.0%) | 0 (0.0%) |
| 55 to 64 Years | 0 (0.0%) | 0 (0.0%) |
| 65 to 74 Years | 0 (0.0%) | 2 (11.8%) |
| 75 Years and over | 2 (22.2%) | 0 (0.0%) |
| Total | 2 (4.5%) | 6 (10.7%) |
Income Above Poverty by Sex and Age in Eagles Mere borough
According to the poverty statistics in Eagles Mere borough, males aged 6 to 11 years and females aged 16 and 17 years are the age groups that are most secure financially, with 100.0% of males and 100.0% of females in these age groups living above the poverty line.
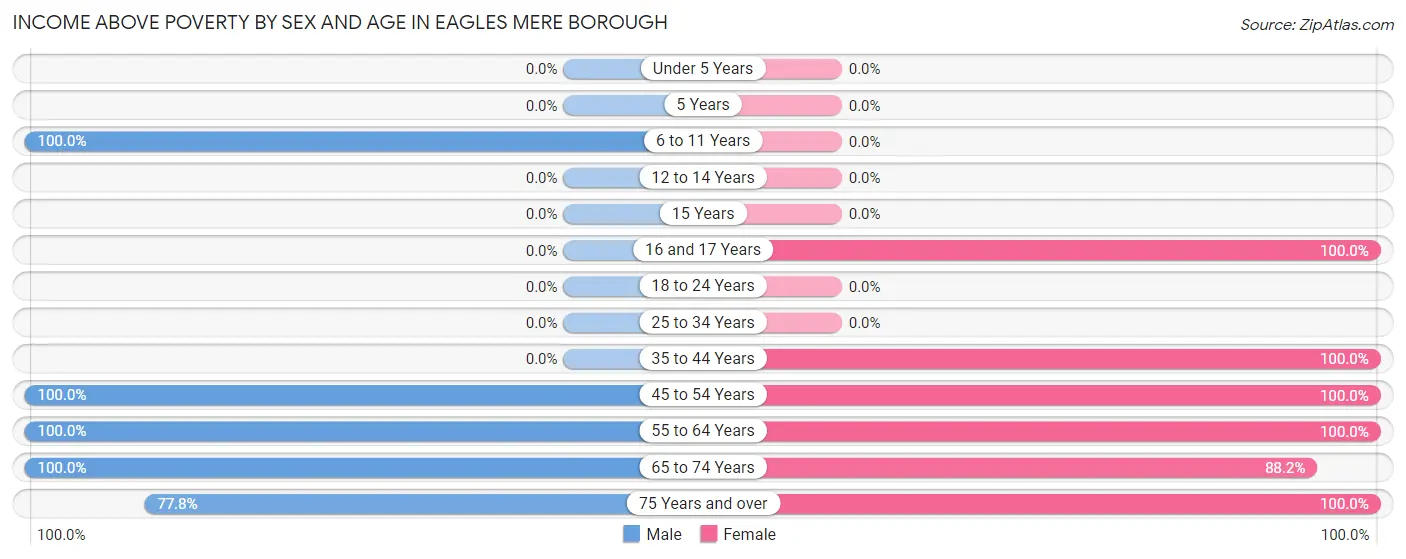
| Age Bracket | Male | Female |
| Under 5 Years | 0 (0.0%) | 0 (0.0%) |
| 5 Years | 0 (0.0%) | 0 (0.0%) |
| 6 to 11 Years | 2 (100.0%) | 0 (0.0%) |
| 12 to 14 Years | 0 (0.0%) | 0 (0.0%) |
| 15 Years | 0 (0.0%) | 0 (0.0%) |
| 16 and 17 Years | 0 (0.0%) | 2 (100.0%) |
| 18 to 24 Years | 0 (0.0%) | 0 (0.0%) |
| 25 to 34 Years | 0 (0.0%) | 0 (0.0%) |
| 35 to 44 Years | 0 (0.0%) | 2 (100.0%) |
| 45 to 54 Years | 6 (100.0%) | 4 (100.0%) |
| 55 to 64 Years | 7 (100.0%) | 22 (100.0%) |
| 65 to 74 Years | 20 (100.0%) | 15 (88.2%) |
| 75 Years and over | 7 (77.8%) | 5 (100.0%) |
| Total | 42 (95.5%) | 50 (89.3%) |
Income Below Poverty Among Married-Couple Families in Eagles Mere borough
The poverty statistics for married-couple families in Eagles Mere borough show that 6.1% or 2 of the total 33 families live below the poverty line. Families with no children have the highest poverty rate of 6.9%, comprising of 2 families. On the other hand, families with 1 or 2 children have the lowest poverty rate of 0.0%, which includes 0 families.
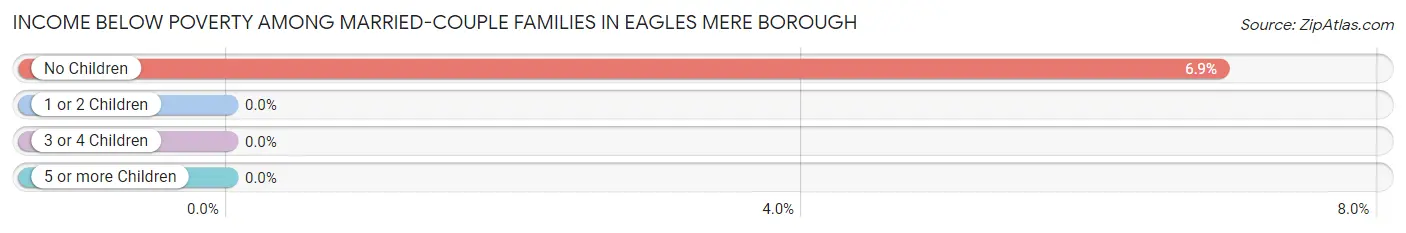
| Children | Above Poverty | Below Poverty |
| No Children | 27 (93.1%) | 2 (6.9%) |
| 1 or 2 Children | 4 (100.0%) | 0 (0.0%) |
| 3 or 4 Children | 0 (0.0%) | 0 (0.0%) |
| 5 or more Children | 0 (0.0%) | 0 (0.0%) |
| Total | 31 (93.9%) | 2 (6.1%) |
Income Below Poverty Among Single-Parent Households in Eagles Mere borough
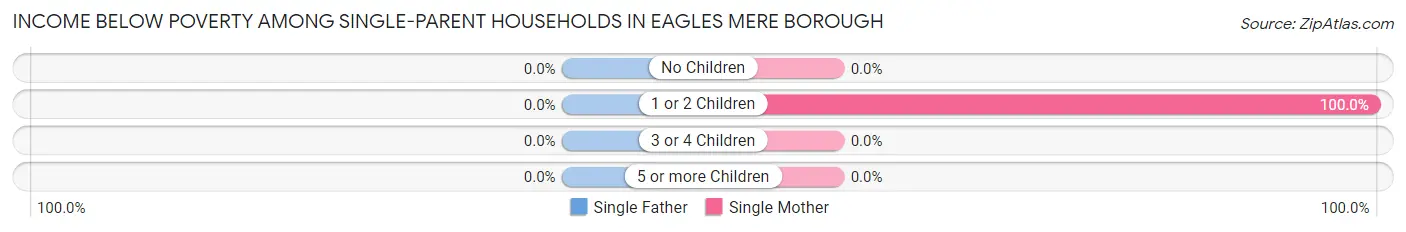
| Children | Single Father | Single Mother |
| No Children | 0 (0.0%) | 0 (0.0%) |
| 1 or 2 Children | 0 (0.0%) | 3 (100.0%) |
| 3 or 4 Children | 0 (0.0%) | 0 (0.0%) |
| 5 or more Children | 0 (0.0%) | 0 (0.0%) |
| Total | 0 (0.0%) | 3 (100.0%) |
Income Below Poverty Among Married-Couple vs Single-Parent Households in Eagles Mere borough
The poverty data for Eagles Mere borough shows that 2 of the married-couple family households (6.1%) and 3 of the single-parent households (100.0%) are living below the poverty level. Within the married-couple family households, those with no children have the highest poverty rate, with 2 households (6.9%) falling below the poverty line. Among the single-parent households, those with 1 or 2 children have the highest poverty rate, with 3 household (100.0%) living below poverty.
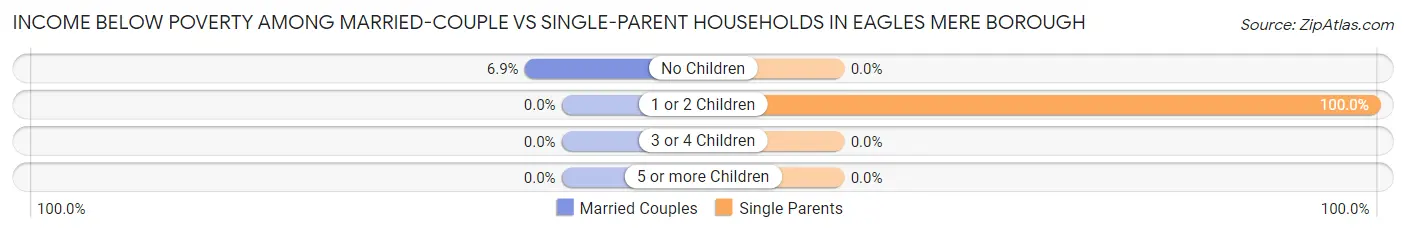
| Children | Married-Couple Families | Single-Parent Households |
| No Children | 2 (6.9%) | 0 (0.0%) |
| 1 or 2 Children | 0 (0.0%) | 3 (100.0%) |
| 3 or 4 Children | 0 (0.0%) | 0 (0.0%) |
| 5 or more Children | 0 (0.0%) | 0 (0.0%) |
| Total | 2 (6.1%) | 3 (100.0%) |
Race in Eagles Mere borough
The most populous races in Eagles Mere borough are , and White / Caucasian (100 | 100.0%).
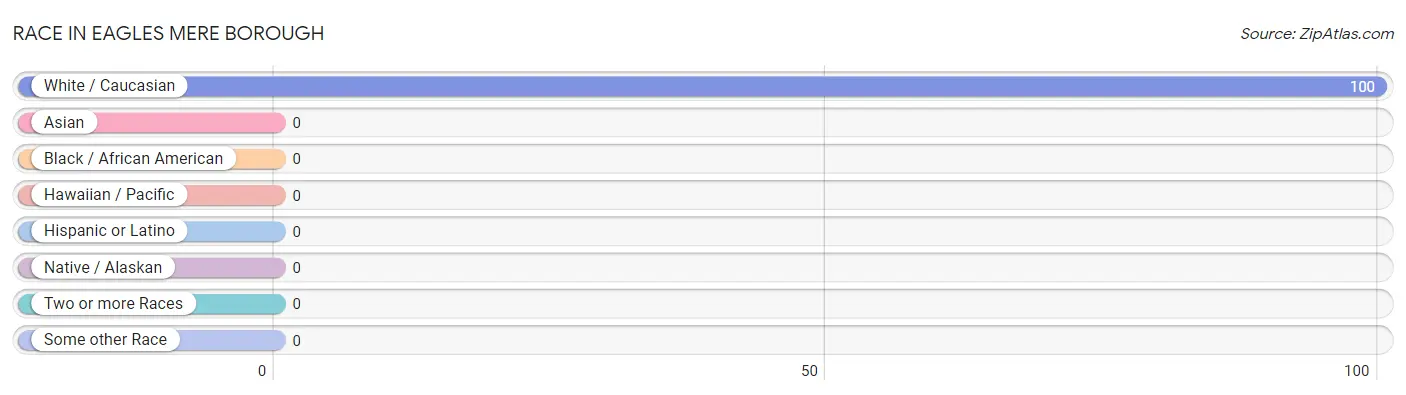
| Race | # Population | % Population |
| Asian | 0 | 0.0% |
| Black / African American | 0 | 0.0% |
| Hawaiian / Pacific | 0 | 0.0% |
| Hispanic or Latino | 0 | 0.0% |
| Native / Alaskan | 0 | 0.0% |
| White / Caucasian | 100 | 100.0% |
| Two or more Races | 0 | 0.0% |
| Some other Race | 0 | 0.0% |
| Total | 100 | 100.0% |
Ancestry in Eagles Mere borough
The most populous ancestries reported in Eagles Mere borough are German (39 | 39.0%), English (33 | 33.0%), Irish (19 | 19.0%), Italian (7 | 7.0%), and Scottish (6 | 6.0%), together accounting for 104.0% of all Eagles Mere borough residents.
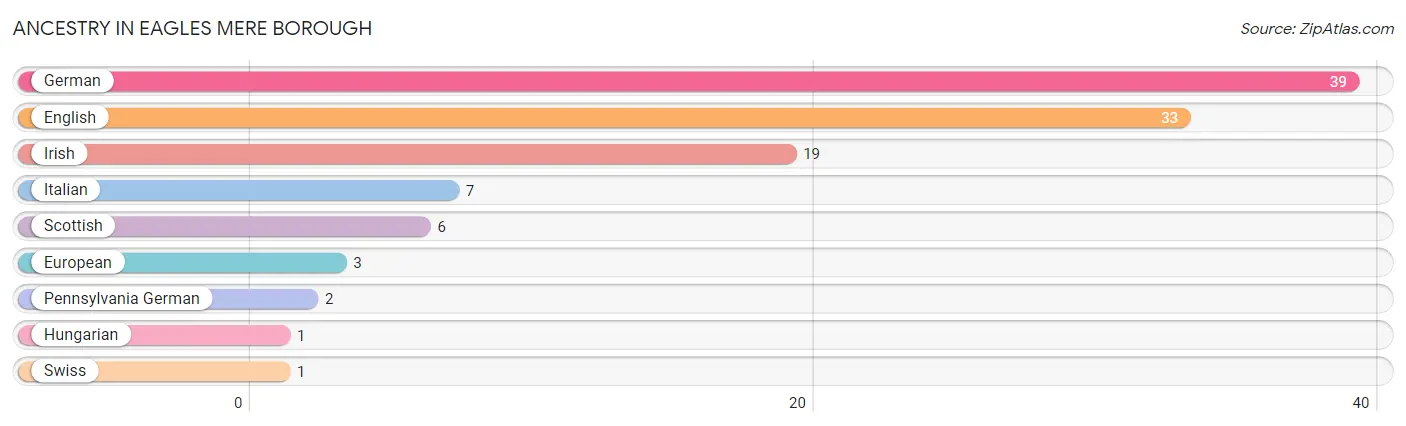
| Ancestry | # Population | % Population |
| English | 33 | 33.0% |
| European | 3 | 3.0% |
| German | 39 | 39.0% |
| Hungarian | 1 | 1.0% |
| Irish | 19 | 19.0% |
| Italian | 7 | 7.0% |
| Pennsylvania German | 2 | 2.0% |
| Scottish | 6 | 6.0% |
| Swiss | 1 | 1.0% | View All 9 Rows |
Immigrants in Eagles Mere borough
The most numerous immigrant groups reported in Eagles Mere borough came from Canada (3 | 3.0%), Eastern Europe (1 | 1.0%), Europe (1 | 1.0%), and Hungary (1 | 1.0%), together accounting for 6.0% of all Eagles Mere borough residents.
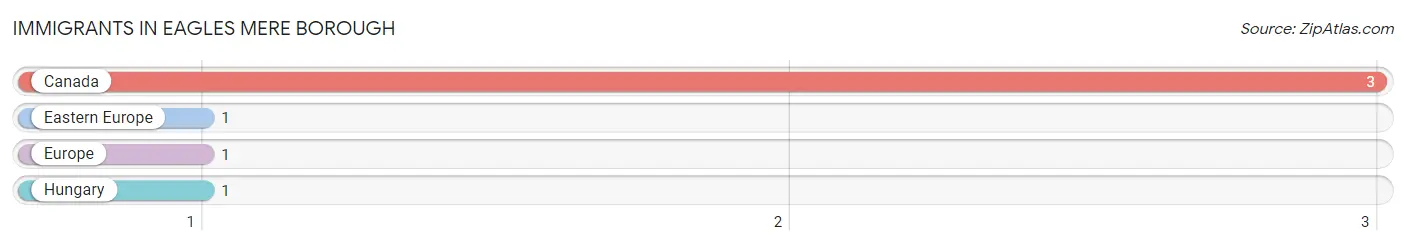
| Immigration Origin | # Population | % Population |
| Canada | 3 | 3.0% |
| Eastern Europe | 1 | 1.0% |
| Europe | 1 | 1.0% |
| Hungary | 1 | 1.0% | View All 4 Rows |
Sex and Age in Eagles Mere borough
Sex and Age in Eagles Mere borough
The most populous age groups in Eagles Mere borough are 70 to 74 Years (11 | 25.0%) for men and 55 to 59 Years (13 | 23.2%) for women.
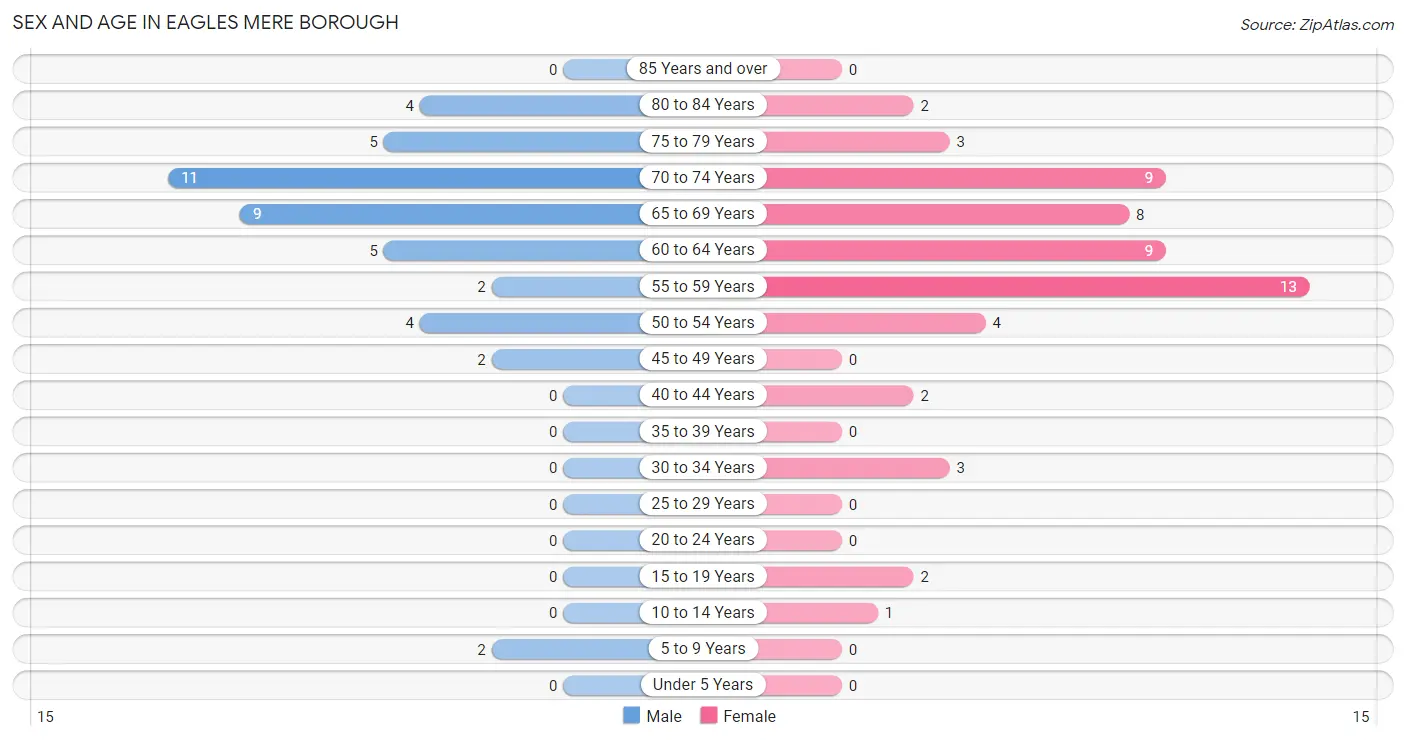
| Age Bracket | Male | Female |
| Under 5 Years | 0 (0.0%) | 0 (0.0%) |
| 5 to 9 Years | 2 (4.5%) | 0 (0.0%) |
| 10 to 14 Years | 0 (0.0%) | 1 (1.8%) |
| 15 to 19 Years | 0 (0.0%) | 2 (3.6%) |
| 20 to 24 Years | 0 (0.0%) | 0 (0.0%) |
| 25 to 29 Years | 0 (0.0%) | 0 (0.0%) |
| 30 to 34 Years | 0 (0.0%) | 3 (5.4%) |
| 35 to 39 Years | 0 (0.0%) | 0 (0.0%) |
| 40 to 44 Years | 0 (0.0%) | 2 (3.6%) |
| 45 to 49 Years | 2 (4.5%) | 0 (0.0%) |
| 50 to 54 Years | 4 (9.1%) | 4 (7.1%) |
| 55 to 59 Years | 2 (4.5%) | 13 (23.2%) |
| 60 to 64 Years | 5 (11.4%) | 9 (16.1%) |
| 65 to 69 Years | 9 (20.4%) | 8 (14.3%) |
| 70 to 74 Years | 11 (25.0%) | 9 (16.1%) |
| 75 to 79 Years | 5 (11.4%) | 3 (5.4%) |
| 80 to 84 Years | 4 (9.1%) | 2 (3.6%) |
| 85 Years and over | 0 (0.0%) | 0 (0.0%) |
| Total | 44 (100.0%) | 56 (100.0%) |
Families and Households in Eagles Mere borough
Median Family Size in Eagles Mere borough
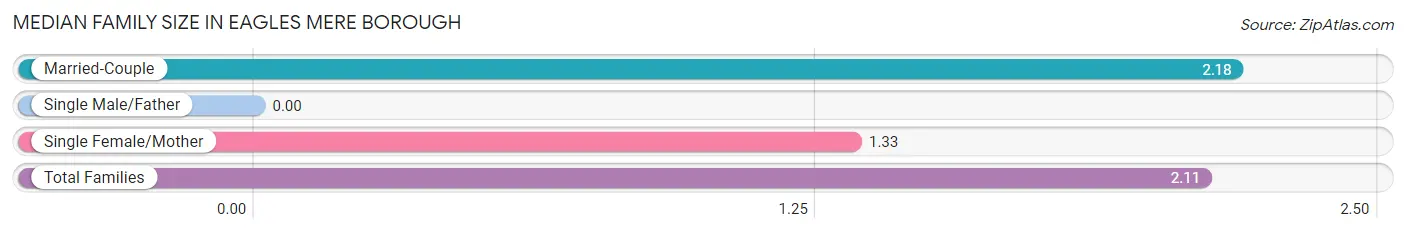
| Family Type | # Families | Family Size |
| Married-Couple | 33 (91.7%) | 2.18 |
| Single Male/Father | 0 (0.0%) | - |
| Single Female/Mother | 3 (8.3%) | 1.33 |
| Total Families | 36 (100.0%) | 2.11 |
Median Household Size in Eagles Mere borough
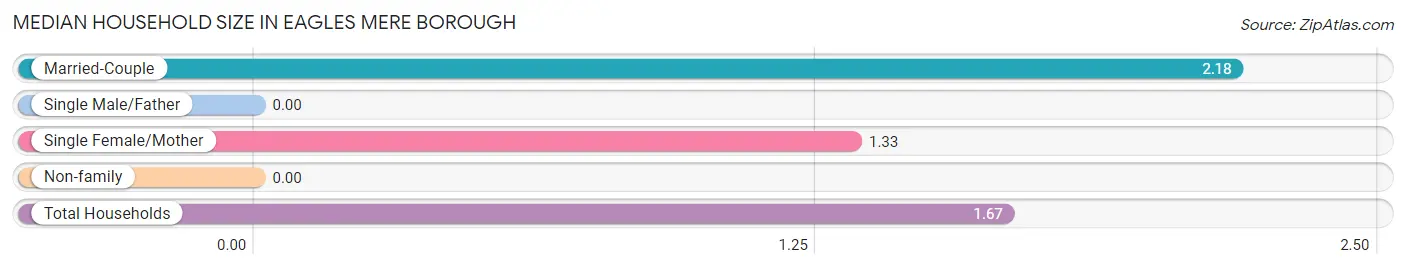
| Household Type | # Households | Household Size |
| Married-Couple | 33 (55.0%) | 2.18 |
| Single Male/Father | 0 (0.0%) | - |
| Single Female/Mother | 3 (5.0%) | 1.33 |
| Non-family | 24 (40.0%) | - |
| Total Households | 60 (100.0%) | 1.67 |
Household Size by Marriage Status in Eagles Mere borough
Out of a total of 60 households in Eagles Mere borough, 36 (60.0%) are family households, while 24 (40.0%) are nonfamily households. The most numerous type of family households are 2-person households, comprising 32, and the most common type of nonfamily households are 1-person households, comprising 24.
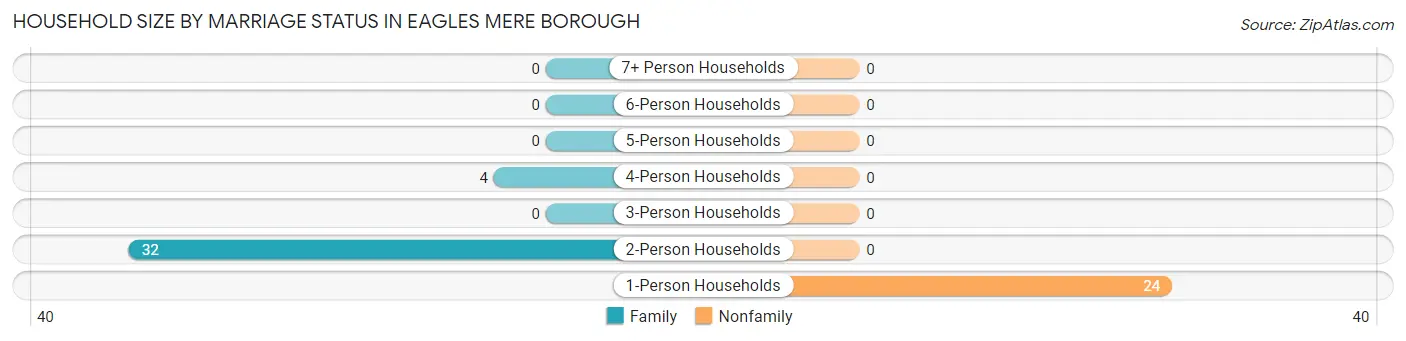
| Household Size | Family Households | Nonfamily Households |
| 1-Person Households | - | 24 (40.0%) |
| 2-Person Households | 32 (53.3%) | 0 (0.0%) |
| 3-Person Households | 0 (0.0%) | 0 (0.0%) |
| 4-Person Households | 4 (6.7%) | 0 (0.0%) |
| 5-Person Households | 0 (0.0%) | 0 (0.0%) |
| 6-Person Households | 0 (0.0%) | 0 (0.0%) |
| 7+ Person Households | 0 (0.0%) | 0 (0.0%) |
| Total | 36 (60.0%) | 24 (40.0%) |
Female Fertility in Eagles Mere borough
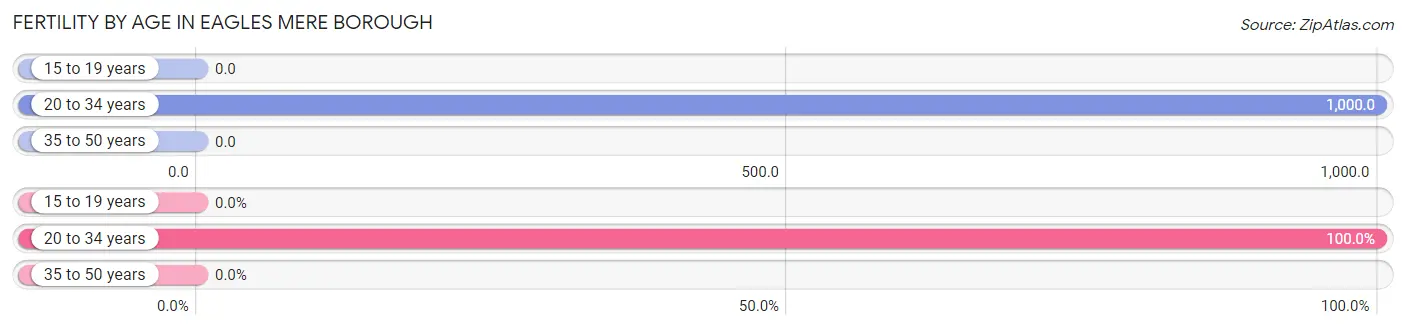
Fertility by Age in Eagles Mere borough
Average fertility rate in Eagles Mere borough is 429.0 births per 1,000 women. Women in the age bracket of 20 to 34 years have the highest fertility rate with 1,000.0 births per 1,000 women. Women in the age bracket of 20 to 34 years acount for 100.0% of all women with births.
| Age Bracket | Women with Births | Births / 1,000 Women |
| 15 to 19 years | 0 (0.0%) | 0.0 |
| 20 to 34 years | 3 (100.0%) | 1,000.0 |
| 35 to 50 years | 0 (0.0%) | 0.0 |
| Total | 3 (100.0%) | 429.0 |
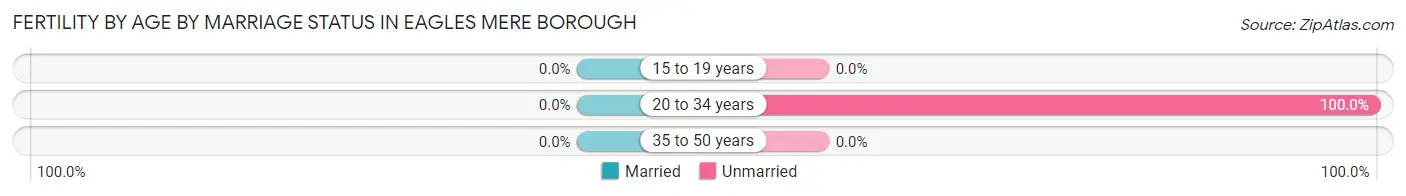
Fertility by Age by Marriage Status in Eagles Mere borough
| Age Bracket | Married | Unmarried |
| 15 to 19 years | 0 (0.0%) | 0 (0.0%) |
| 20 to 34 years | 0 (0.0%) | 3 (100.0%) |
| 35 to 50 years | 0 (0.0%) | 0 (0.0%) |
| Total | 0 (0.0%) | 3 (100.0%) |
Fertility by Education in Eagles Mere borough
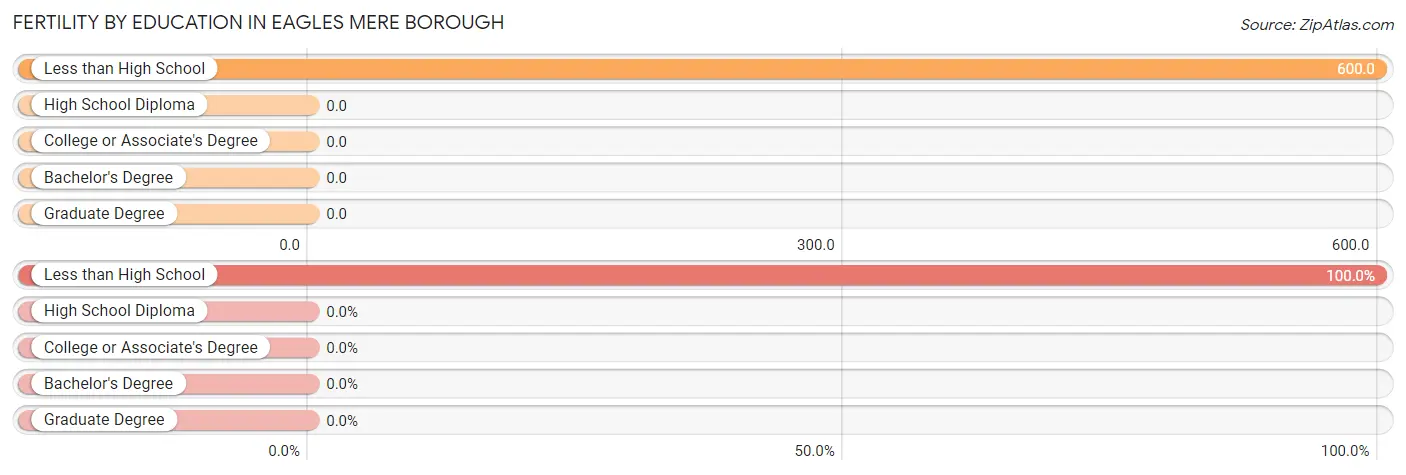
| Educational Attainment | Women with Births | Births / 1,000 Women |
| Less than High School | 3 (100.0%) | 600.0 |
| High School Diploma | 0 (0.0%) | 0.0 |
| College or Associate's Degree | 0 (0.0%) | 0.0 |
| Bachelor's Degree | 0 (0.0%) | 0.0 |
| Graduate Degree | 0 (0.0%) | 0.0 |
| Total | 3 (100.0%) | 429.0 |
Fertility by Education by Marriage Status in Eagles Mere borough
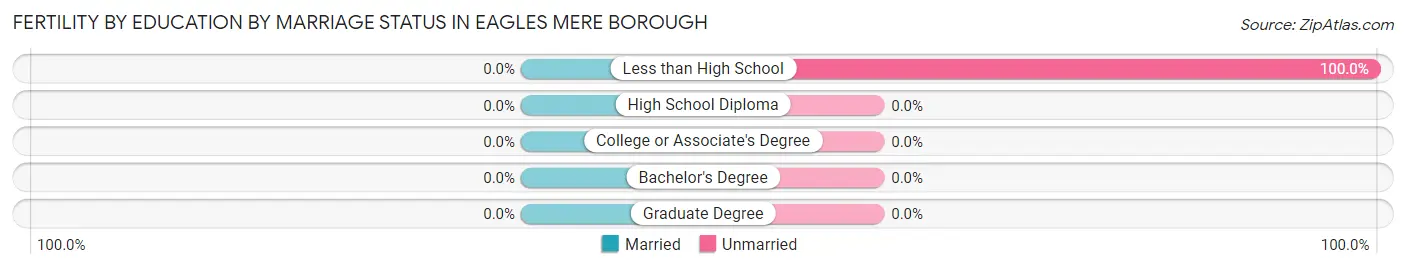
| Educational Attainment | Married | Unmarried |
| Less than High School | 0 (0.0%) | 3 (100.0%) |
| High School Diploma | 0 (0.0%) | 0 (0.0%) |
| College or Associate's Degree | 0 (0.0%) | 0 (0.0%) |
| Bachelor's Degree | 0 (0.0%) | 0 (0.0%) |
| Graduate Degree | 0 (0.0%) | 0 (0.0%) |
| Total | 0 (0.0%) | 3 (100.0%) |
Employment Characteristics in Eagles Mere borough
Employment by Class of Employer in Eagles Mere borough
Among the 33 employed individuals in Eagles Mere borough, private company employees (25 | 75.8%), self-employed (incorporated) (4 | 12.1%), and local government employees (4 | 12.1%) make up the most common classes of employment.
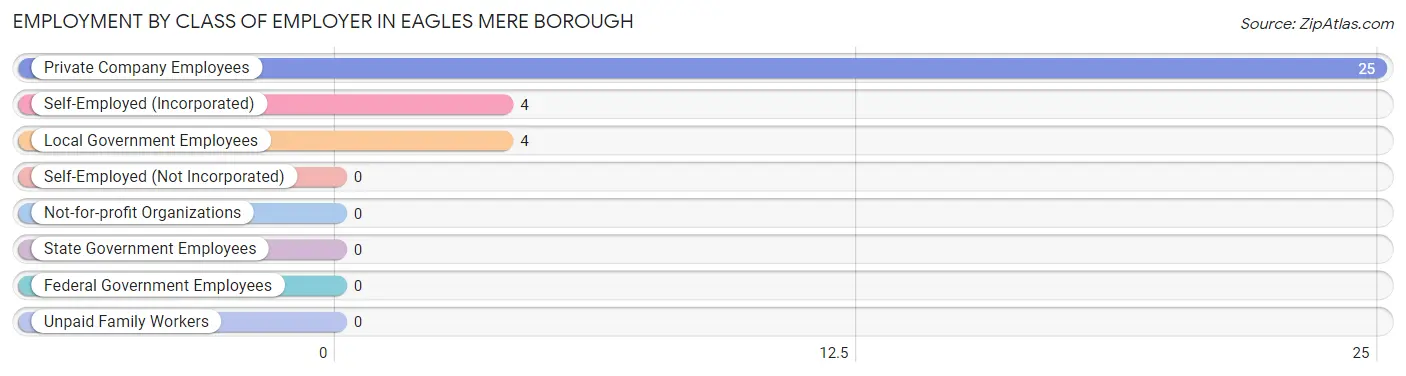
| Employer Class | # Employees | % Employees |
| Private Company Employees | 25 | 75.8% |
| Self-Employed (Incorporated) | 4 | 12.1% |
| Self-Employed (Not Incorporated) | 0 | 0.0% |
| Not-for-profit Organizations | 0 | 0.0% |
| Local Government Employees | 4 | 12.1% |
| State Government Employees | 0 | 0.0% |
| Federal Government Employees | 0 | 0.0% |
| Unpaid Family Workers | 0 | 0.0% |
| Total | 33 | 100.0% |
Employment Status by Age in Eagles Mere borough
According to the labor force statistics for Eagles Mere borough, out of the total population over 16 years of age (97), 37.1% or 36 individuals are in the labor force, with 8.3% or 3 of them unemployed. The age group with the highest labor force participation rate is 30 to 34 years, with 100.0% or 3 individuals in the labor force. Within the labor force, the 55 to 59 years age range has the highest percentage of unemployed individuals, with 30.0% or 3 of them being unemployed.
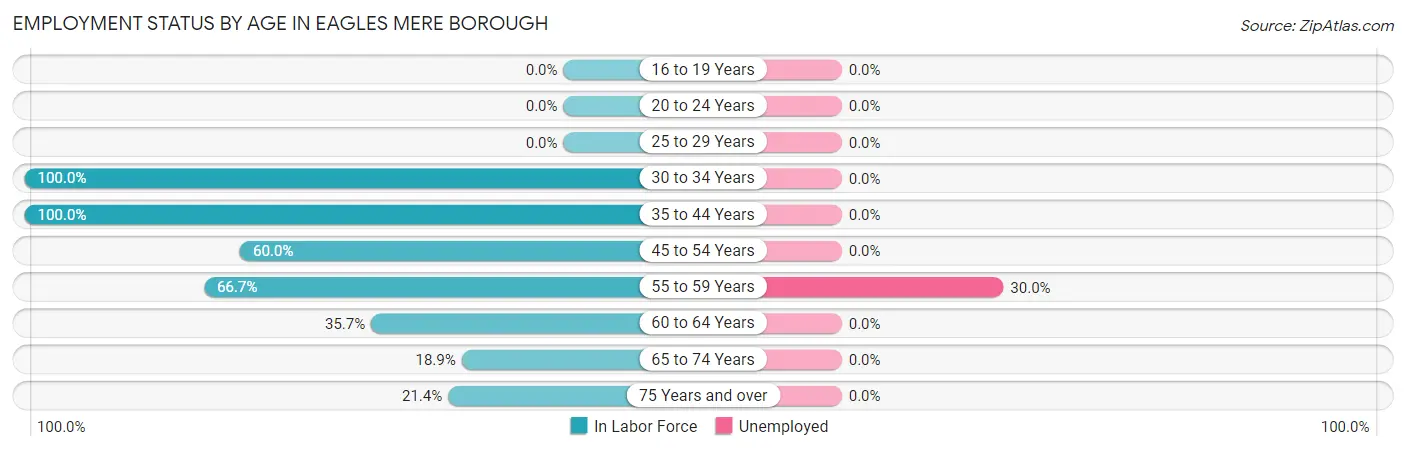
| Age Bracket | In Labor Force | Unemployed |
| 16 to 19 Years | 0 (0.0%) | 0 (0.0%) |
| 20 to 24 Years | 0 (0.0%) | 0 (0.0%) |
| 25 to 29 Years | 0 (0.0%) | 0 (0.0%) |
| 30 to 34 Years | 3 (100.0%) | 0 (0.0%) |
| 35 to 44 Years | 2 (100.0%) | 0 (0.0%) |
| 45 to 54 Years | 6 (60.0%) | 0 (0.0%) |
| 55 to 59 Years | 10 (66.7%) | 3 (30.0%) |
| 60 to 64 Years | 5 (35.7%) | 0 (0.0%) |
| 65 to 74 Years | 7 (18.9%) | 0 (0.0%) |
| 75 Years and over | 3 (21.4%) | 0 (0.0%) |
| Total | 36 (37.1%) | 3 (8.3%) |
Employment Status by Educational Attainment in Eagles Mere borough
According to labor force statistics for Eagles Mere borough, 59.1% of individuals (26) out of the total population between 25 and 64 years of age (44) are in the labor force, with 11.5% or 3 of them being unemployed. The group with the highest labor force participation rate are those with the educational attainment of less than high school, with 100.0% or 3 individuals in the labor force. Within the labor force, individuals with bachelor's degree or higher education have the highest percentage of unemployment, with 13.0% or 3 of them being unemployed.
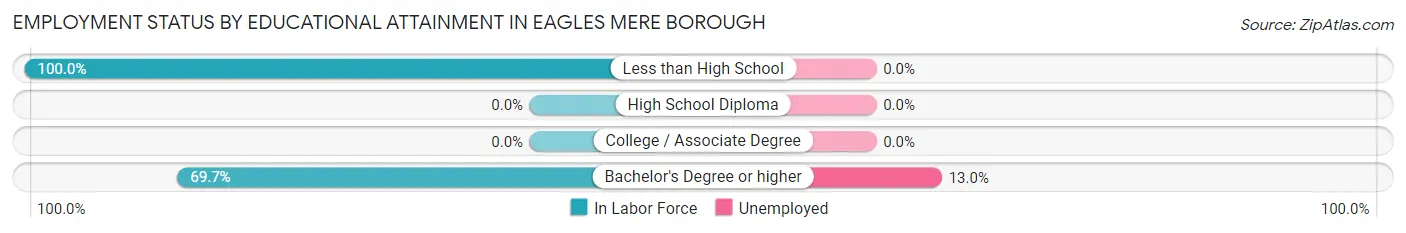
| Educational Attainment | In Labor Force | Unemployed |
| Less than High School | 3 (100.0%) | 0 (0.0%) |
| High School Diploma | 0 (0.0%) | 0 (0.0%) |
| College / Associate Degree | 0 (0.0%) | 0 (0.0%) |
| Bachelor's Degree or higher | 23 (69.7%) | 4 (13.0%) |
| Total | 26 (59.1%) | 5 (11.5%) |
Employment Occupations by Sex in Eagles Mere borough
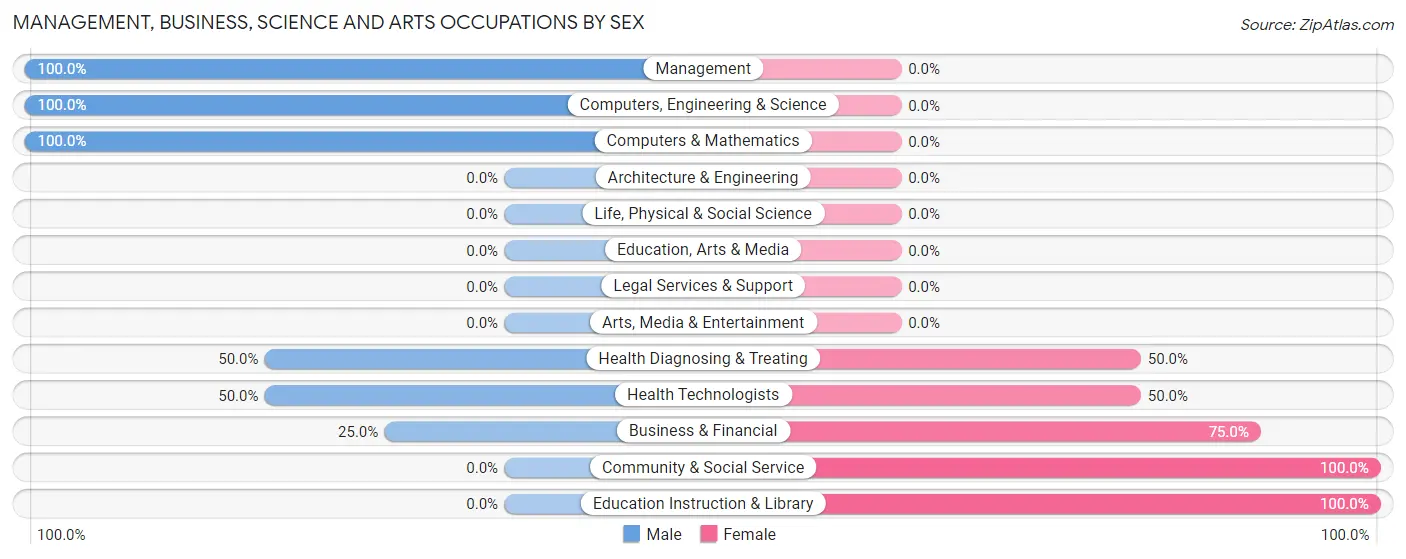
Management, Business, Science and Arts Occupations
The most common Management, Business, Science and Arts occupations in Eagles Mere borough are Business & Financial (12 | 36.4%), Health Diagnosing & Treating (4 | 12.1%), Health Technologists (4 | 12.1%), Community & Social Service (3 | 9.1%), and Education Instruction & Library (3 | 9.1%).
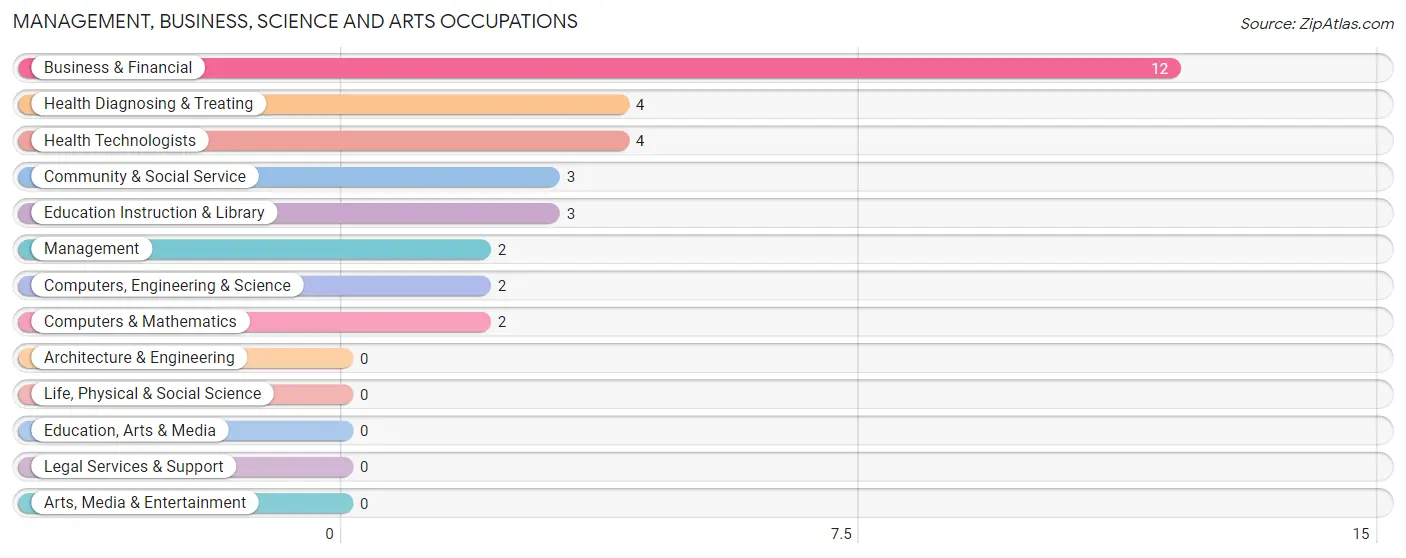
Management, Business, Science and Arts Occupations by Sex
Within the Management, Business, Science and Arts occupations in Eagles Mere borough, the most male-oriented occupations are Management (100.0%), Computers, Engineering & Science (100.0%), and Computers & Mathematics (100.0%), while the most female-oriented occupations are Community & Social Service (100.0%), Education Instruction & Library (100.0%), and Business & Financial (75.0%).
| Occupation | Male | Female |
| Management | 2 (100.0%) | 0 (0.0%) |
| Business & Financial | 3 (25.0%) | 9 (75.0%) |
| Computers, Engineering & Science | 2 (100.0%) | 0 (0.0%) |
| Computers & Mathematics | 2 (100.0%) | 0 (0.0%) |
| Architecture & Engineering | 0 (0.0%) | 0 (0.0%) |
| Life, Physical & Social Science | 0 (0.0%) | 0 (0.0%) |
| Community & Social Service | 0 (0.0%) | 3 (100.0%) |
| Education, Arts & Media | 0 (0.0%) | 0 (0.0%) |
| Legal Services & Support | 0 (0.0%) | 0 (0.0%) |
| Education Instruction & Library | 0 (0.0%) | 3 (100.0%) |
| Arts, Media & Entertainment | 0 (0.0%) | 0 (0.0%) |
| Health Diagnosing & Treating | 2 (50.0%) | 2 (50.0%) |
| Health Technologists | 2 (50.0%) | 2 (50.0%) |
| Total (Category) | 9 (39.1%) | 14 (60.9%) |
| Total (Overall) | 16 (48.5%) | 17 (51.5%) |
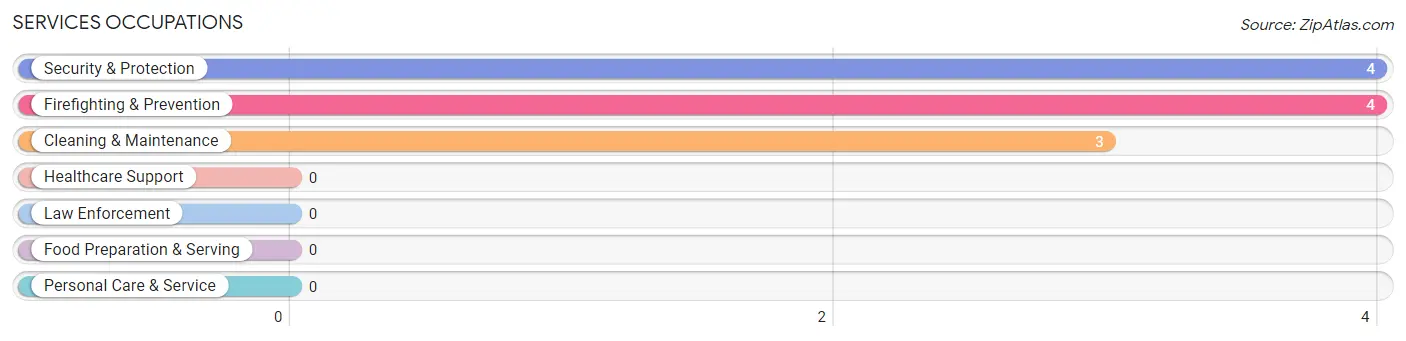
Services Occupations
The most common Services occupations in Eagles Mere borough are Security & Protection (4 | 12.1%), Firefighting & Prevention (4 | 12.1%), and Cleaning & Maintenance (3 | 9.1%).
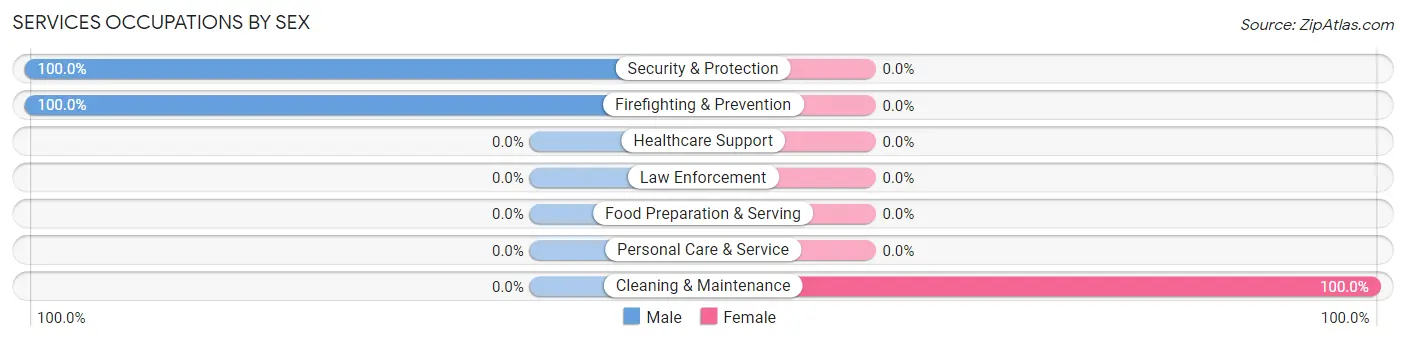
Services Occupations by Sex
| Occupation | Male | Female |
| Healthcare Support | 0 (0.0%) | 0 (0.0%) |
| Security & Protection | 4 (100.0%) | 0 (0.0%) |
| Firefighting & Prevention | 4 (100.0%) | 0 (0.0%) |
| Law Enforcement | 0 (0.0%) | 0 (0.0%) |
| Food Preparation & Serving | 0 (0.0%) | 0 (0.0%) |
| Cleaning & Maintenance | 0 (0.0%) | 3 (100.0%) |
| Personal Care & Service | 0 (0.0%) | 0 (0.0%) |
| Total (Category) | 4 (57.1%) | 3 (42.9%) |
| Total (Overall) | 16 (48.5%) | 17 (51.5%) |
Sales and Office Occupations
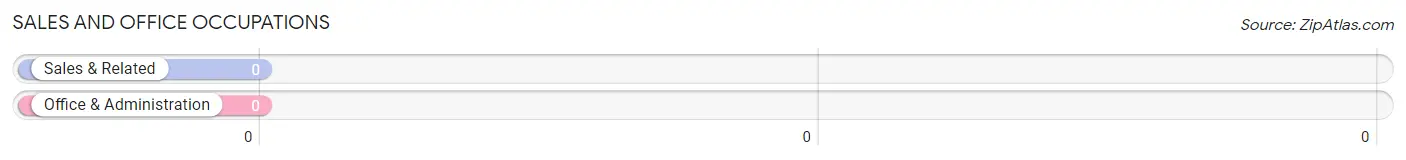
Sales and Office Occupations by Sex
| Occupation | Male | Female |
| Sales & Related | 0 (0.0%) | 0 (0.0%) |
| Office & Administration | 0 (0.0%) | 0 (0.0%) |
| Total (Category) | 0 (0.0%) | 0 (0.0%) |
| Total (Overall) | 16 (48.5%) | 17 (51.5%) |
Natural Resources, Construction and Maintenance Occupations
The most common Natural Resources, Construction and Maintenance occupations in Eagles Mere borough are , and Construction & Extraction (3 | 9.1%).
Natural Resources, Construction and Maintenance Occupations by Sex

| Occupation | Male | Female |
| Farming, Fishing & Forestry | 0 (0.0%) | 0 (0.0%) |
| Construction & Extraction | 3 (100.0%) | 0 (0.0%) |
| Installation, Maintenance & Repair | 0 (0.0%) | 0 (0.0%) |
| Total (Category) | 3 (100.0%) | 0 (0.0%) |
| Total (Overall) | 16 (48.5%) | 17 (51.5%) |
Production, Transportation and Moving Occupations
Production, Transportation and Moving Occupations by Sex
| Occupation | Male | Female |
| Production | 0 (0.0%) | 0 (0.0%) |
| Transportation | 0 (0.0%) | 0 (0.0%) |
| Material Moving | 0 (0.0%) | 0 (0.0%) |
| Total (Category) | 0 (0.0%) | 0 (0.0%) |
| Total (Overall) | 16 (48.5%) | 17 (51.5%) |
Employment Industries by Sex in Eagles Mere borough
Employment Industries in Eagles Mere borough
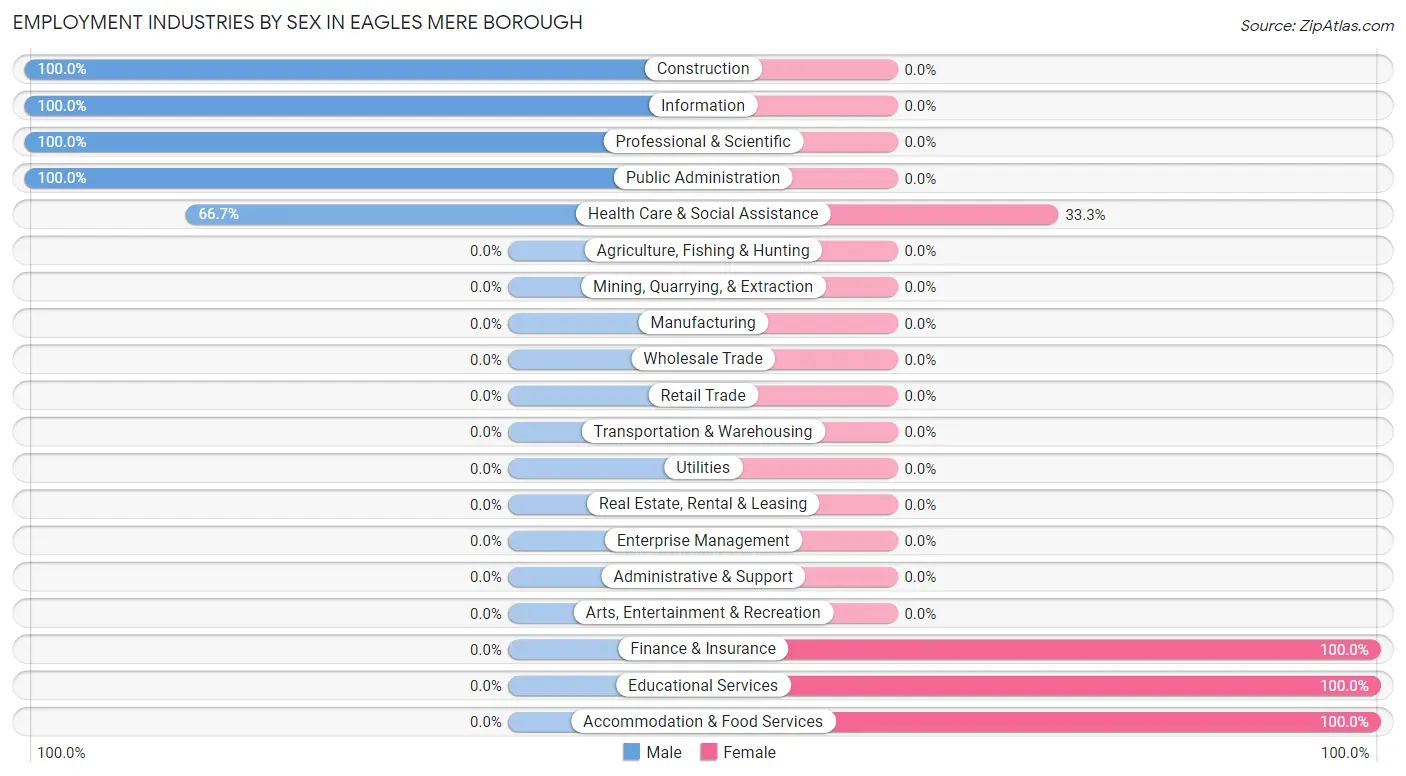
The major employment industries in Eagles Mere borough include Finance & Insurance (9 | 27.3%), Health Care & Social Assistance (6 | 18.2%), Public Administration (4 | 12.1%), Construction (3 | 9.1%), and Information (3 | 9.1%).

Employment Industries by Sex in Eagles Mere borough
The Eagles Mere borough industries that see more men than women are Construction (100.0%), Information (100.0%), and Professional & Scientific (100.0%), whereas the industries that tend to have a higher number of women are Finance & Insurance (100.0%), Educational Services (100.0%), and Accommodation & Food Services (100.0%).
| Industry | Male | Female |
| Agriculture, Fishing & Hunting | 0 (0.0%) | 0 (0.0%) |
| Mining, Quarrying, & Extraction | 0 (0.0%) | 0 (0.0%) |
| Construction | 3 (100.0%) | 0 (0.0%) |
| Manufacturing | 0 (0.0%) | 0 (0.0%) |
| Wholesale Trade | 0 (0.0%) | 0 (0.0%) |
| Retail Trade | 0 (0.0%) | 0 (0.0%) |
| Transportation & Warehousing | 0 (0.0%) | 0 (0.0%) |
| Utilities | 0 (0.0%) | 0 (0.0%) |
| Information | 3 (100.0%) | 0 (0.0%) |
| Finance & Insurance | 0 (0.0%) | 9 (100.0%) |
| Real Estate, Rental & Leasing | 0 (0.0%) | 0 (0.0%) |
| Professional & Scientific | 2 (100.0%) | 0 (0.0%) |
| Enterprise Management | 0 (0.0%) | 0 (0.0%) |
| Administrative & Support | 0 (0.0%) | 0 (0.0%) |
| Educational Services | 0 (0.0%) | 3 (100.0%) |
| Health Care & Social Assistance | 4 (66.7%) | 2 (33.3%) |
| Arts, Entertainment & Recreation | 0 (0.0%) | 0 (0.0%) |
| Accommodation & Food Services | 0 (0.0%) | 3 (100.0%) |
| Public Administration | 4 (100.0%) | 0 (0.0%) |
| Total | 16 (48.5%) | 17 (51.5%) |
Education in Eagles Mere borough
School Enrollment in Eagles Mere borough
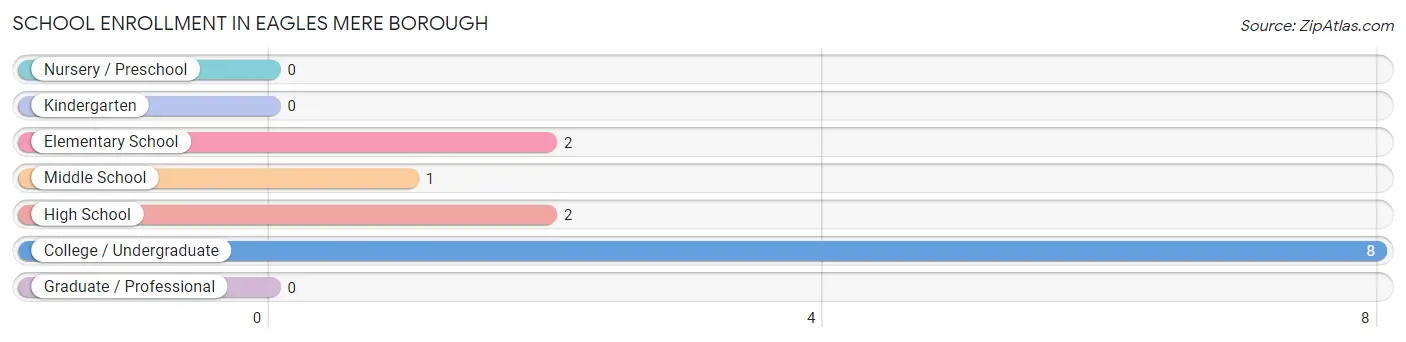
The most common levels of schooling among the 13 students in Eagles Mere borough are college / undergraduate (8 | 61.5%), elementary school (2 | 15.4%), and high school (2 | 15.4%).
| School Level | # Students | % Students |
| Nursery / Preschool | 0 | 0.0% |
| Kindergarten | 0 | 0.0% |
| Elementary School | 2 | 15.4% |
| Middle School | 1 | 7.7% |
| High School | 2 | 15.4% |
| College / Undergraduate | 8 | 61.5% |
| Graduate / Professional | 0 | 0.0% |
| Total | 13 | 100.0% |
School Enrollment by Age by Funding Source in Eagles Mere borough
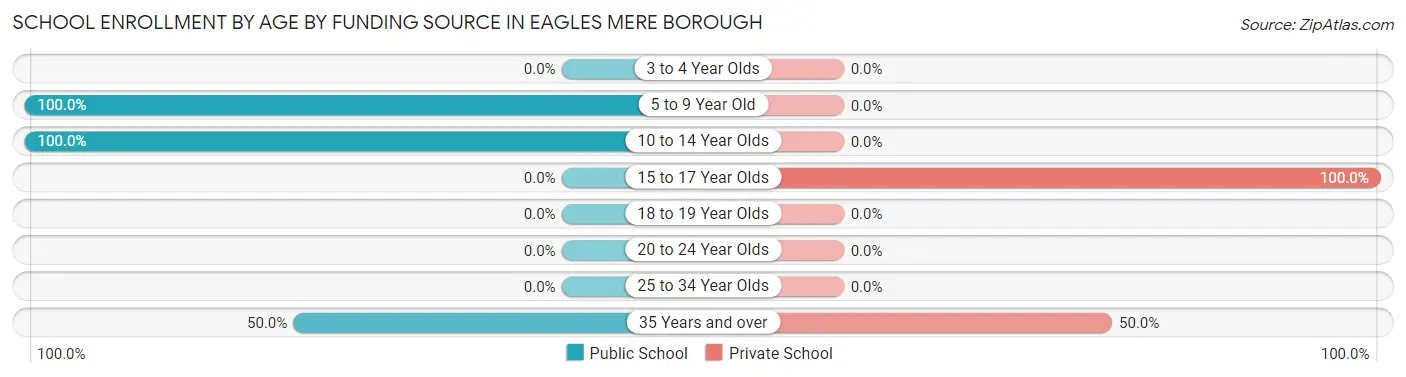
Out of a total of 13 students who are enrolled in schools in Eagles Mere borough, 6 (46.2%) attend a private institution, while the remaining 7 (53.8%) are enrolled in public schools. The age group of 15 to 17 year olds has the highest likelihood of being enrolled in private schools, with 2 (100.0% in the age bracket) enrolled. Conversely, the age group of 5 to 9 year old has the lowest likelihood of being enrolled in a private school, with 2 (100.0% in the age bracket) attending a public institution.
| Age Bracket | Public School | Private School |
| 3 to 4 Year Olds | 0 (0.0%) | 0 (0.0%) |
| 5 to 9 Year Old | 2 (100.0%) | 0 (0.0%) |
| 10 to 14 Year Olds | 1 (100.0%) | 0 (0.0%) |
| 15 to 17 Year Olds | 0 (0.0%) | 2 (100.0%) |
| 18 to 19 Year Olds | 0 (0.0%) | 0 (0.0%) |
| 20 to 24 Year Olds | 0 (0.0%) | 0 (0.0%) |
| 25 to 34 Year Olds | 0 (0.0%) | 0 (0.0%) |
| 35 Years and over | 4 (50.0%) | 4 (50.0%) |
| Total | 7 (53.8%) | 6 (46.2%) |
Educational Attainment by Field of Study in Eagles Mere borough
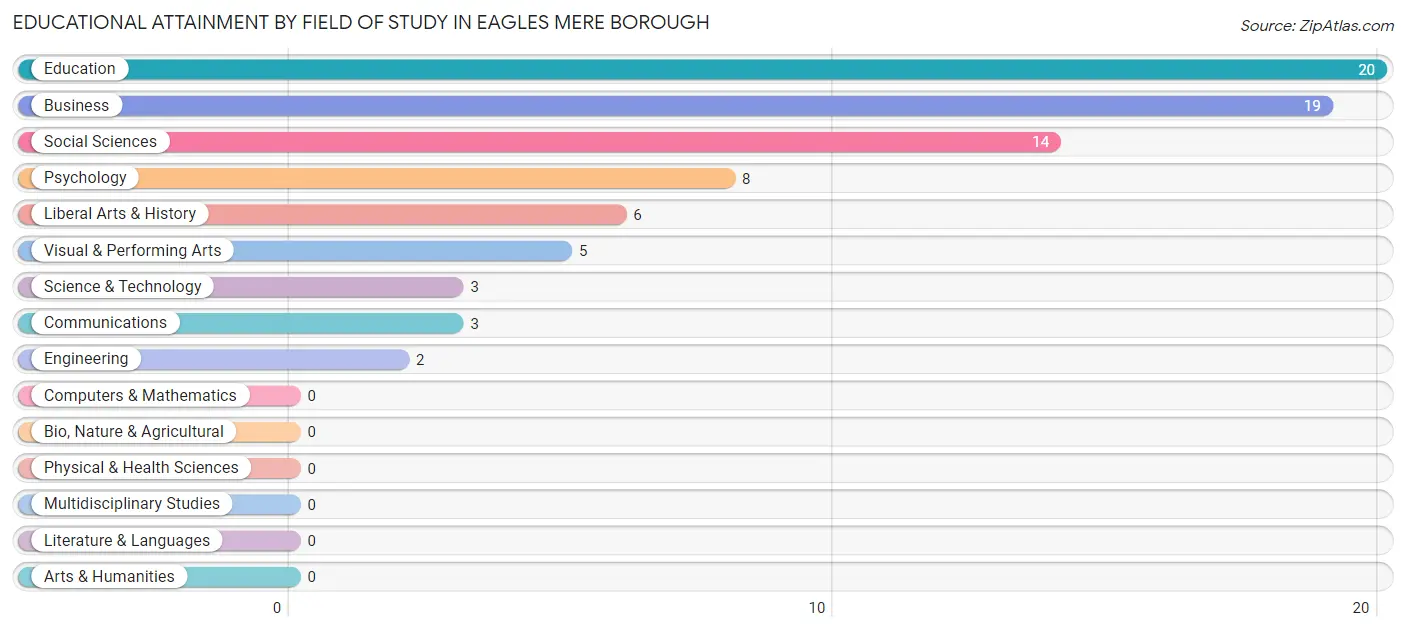
Education (20 | 25.0%), business (19 | 23.7%), social sciences (14 | 17.5%), psychology (8 | 10.0%), and liberal arts & history (6 | 7.5%) are the most common fields of study among 80 individuals in Eagles Mere borough who have obtained a bachelor's degree or higher.
| Field of Study | # Graduates | % Graduates |
| Computers & Mathematics | 0 | 0.0% |
| Bio, Nature & Agricultural | 0 | 0.0% |
| Physical & Health Sciences | 0 | 0.0% |
| Psychology | 8 | 10.0% |
| Social Sciences | 14 | 17.5% |
| Engineering | 2 | 2.5% |
| Multidisciplinary Studies | 0 | 0.0% |
| Science & Technology | 3 | 3.7% |
| Business | 19 | 23.7% |
| Education | 20 | 25.0% |
| Literature & Languages | 0 | 0.0% |
| Liberal Arts & History | 6 | 7.5% |
| Visual & Performing Arts | 5 | 6.2% |
| Communications | 3 | 3.7% |
| Arts & Humanities | 0 | 0.0% |
| Total | 80 | 100.0% |
Transportation & Commute in Eagles Mere borough
Vehicle Availability by Sex in Eagles Mere borough
The most prevalent vehicle ownership categories in Eagles Mere borough are males with 2 vehicles (12, accounting for 75.0%) and females with 2 vehicles (12, making up 70.6%).
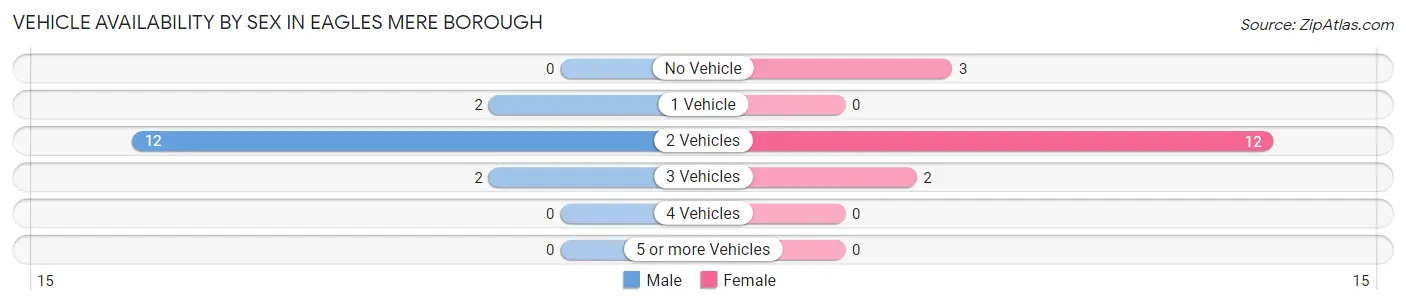
| Vehicles Available | Male | Female |
| No Vehicle | 0 (0.0%) | 3 (17.6%) |
| 1 Vehicle | 2 (12.5%) | 0 (0.0%) |
| 2 Vehicles | 12 (75.0%) | 12 (70.6%) |
| 3 Vehicles | 2 (12.5%) | 2 (11.8%) |
| 4 Vehicles | 0 (0.0%) | 0 (0.0%) |
| 5 or more Vehicles | 0 (0.0%) | 0 (0.0%) |
| Total | 16 (100.0%) | 17 (100.0%) |
Commute Time in Eagles Mere borough
The most frequently occuring commute durations in Eagles Mere borough are 45 to 59 minutes (8 commuters, 28.6%), 30 to 34 minutes (5 commuters, 17.9%), and 15 to 19 minutes (4 commuters, 14.3%).
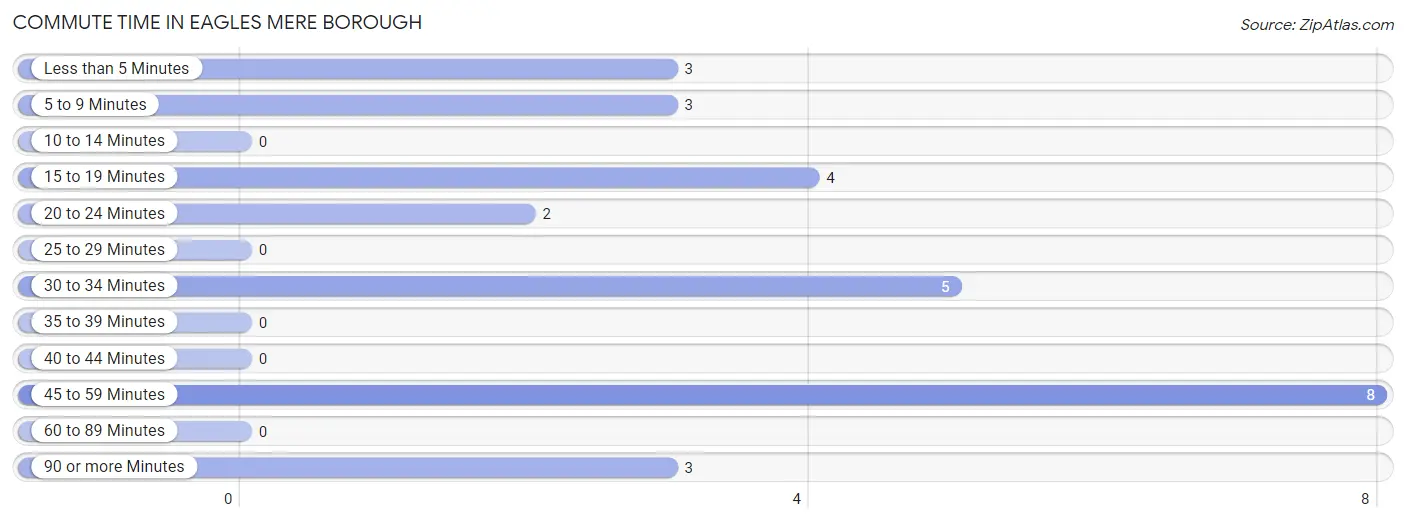
| Commute Time | # Commuters | % Commuters |
| Less than 5 Minutes | 3 | 10.7% |
| 5 to 9 Minutes | 3 | 10.7% |
| 10 to 14 Minutes | 0 | 0.0% |
| 15 to 19 Minutes | 4 | 14.3% |
| 20 to 24 Minutes | 2 | 7.1% |
| 25 to 29 Minutes | 0 | 0.0% |
| 30 to 34 Minutes | 5 | 17.9% |
| 35 to 39 Minutes | 0 | 0.0% |
| 40 to 44 Minutes | 0 | 0.0% |
| 45 to 59 Minutes | 8 | 28.6% |
| 60 to 89 Minutes | 0 | 0.0% |
| 90 or more Minutes | 3 | 10.7% |
Commute Time by Sex in Eagles Mere borough
The most common commute times in Eagles Mere borough are 15 to 19 minutes (4 commuters, 28.6%) for males and 45 to 59 minutes (6 commuters, 42.9%) for females.
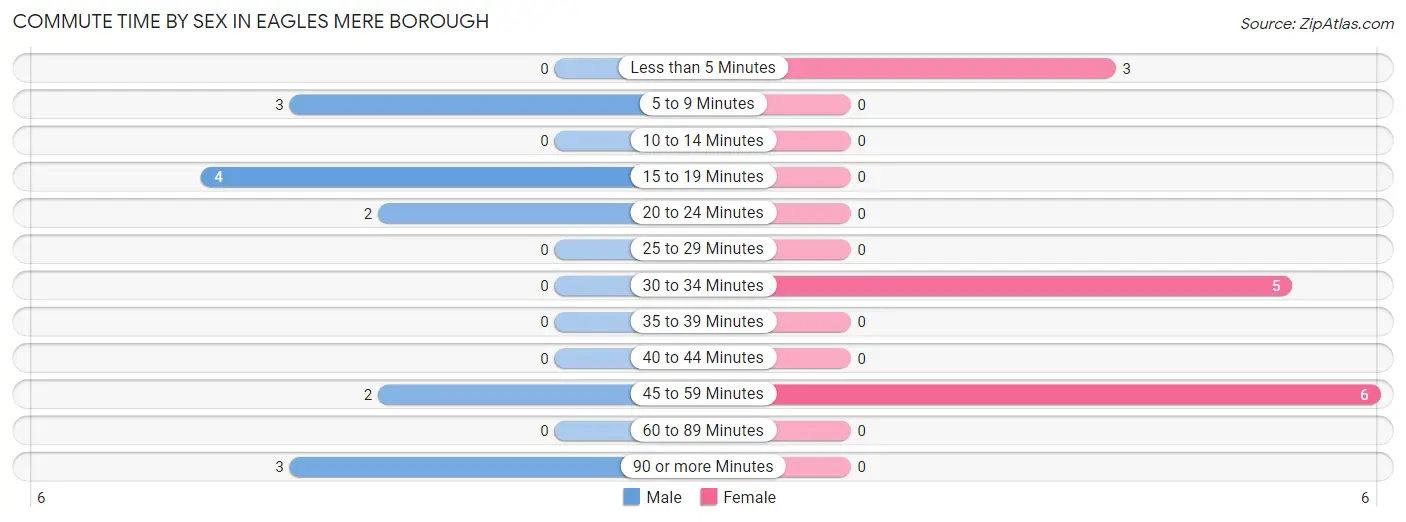
| Commute Time | Male | Female |
| Less than 5 Minutes | 0 (0.0%) | 3 (21.4%) |
| 5 to 9 Minutes | 3 (21.4%) | 0 (0.0%) |
| 10 to 14 Minutes | 0 (0.0%) | 0 (0.0%) |
| 15 to 19 Minutes | 4 (28.6%) | 0 (0.0%) |
| 20 to 24 Minutes | 2 (14.3%) | 0 (0.0%) |
| 25 to 29 Minutes | 0 (0.0%) | 0 (0.0%) |
| 30 to 34 Minutes | 0 (0.0%) | 5 (35.7%) |
| 35 to 39 Minutes | 0 (0.0%) | 0 (0.0%) |
| 40 to 44 Minutes | 0 (0.0%) | 0 (0.0%) |
| 45 to 59 Minutes | 2 (14.3%) | 6 (42.9%) |
| 60 to 89 Minutes | 0 (0.0%) | 0 (0.0%) |
| 90 or more Minutes | 3 (21.4%) | 0 (0.0%) |
Time of Departure to Work by Sex in Eagles Mere borough
The most frequent times of departure to work in Eagles Mere borough are 6:30 AM to 6:59 AM (4, 28.6%) for males and 8:00 AM to 8:29 AM (5, 35.7%) for females.
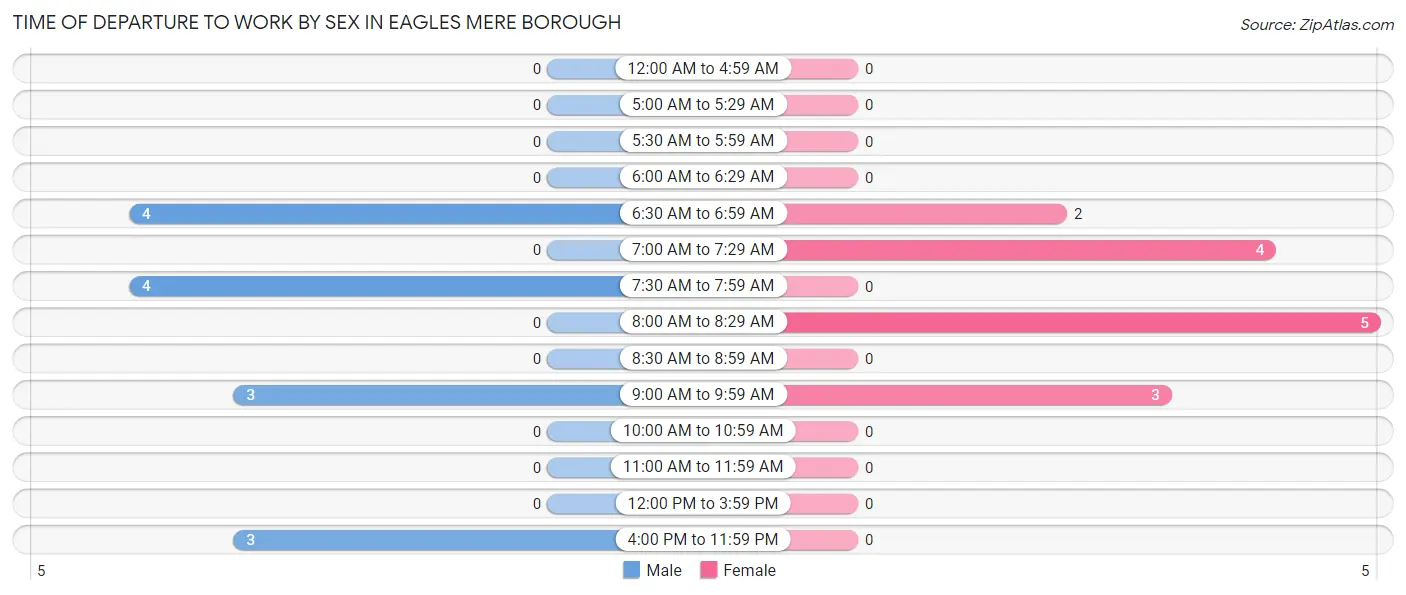
| Time of Departure | Male | Female |
| 12:00 AM to 4:59 AM | 0 (0.0%) | 0 (0.0%) |
| 5:00 AM to 5:29 AM | 0 (0.0%) | 0 (0.0%) |
| 5:30 AM to 5:59 AM | 0 (0.0%) | 0 (0.0%) |
| 6:00 AM to 6:29 AM | 0 (0.0%) | 0 (0.0%) |
| 6:30 AM to 6:59 AM | 4 (28.6%) | 2 (14.3%) |
| 7:00 AM to 7:29 AM | 0 (0.0%) | 4 (28.6%) |
| 7:30 AM to 7:59 AM | 4 (28.6%) | 0 (0.0%) |
| 8:00 AM to 8:29 AM | 0 (0.0%) | 5 (35.7%) |
| 8:30 AM to 8:59 AM | 0 (0.0%) | 0 (0.0%) |
| 9:00 AM to 9:59 AM | 3 (21.4%) | 3 (21.4%) |
| 10:00 AM to 10:59 AM | 0 (0.0%) | 0 (0.0%) |
| 11:00 AM to 11:59 AM | 0 (0.0%) | 0 (0.0%) |
| 12:00 PM to 3:59 PM | 0 (0.0%) | 0 (0.0%) |
| 4:00 PM to 11:59 PM | 3 (21.4%) | 0 (0.0%) |
| Total | 14 (100.0%) | 14 (100.0%) |
Housing Occupancy in Eagles Mere borough
Occupancy by Ownership in Eagles Mere borough
Of the total 60 dwellings in Eagles Mere borough, owner-occupied units account for 57 (95.0%), while renter-occupied units make up 3 (5.0%).
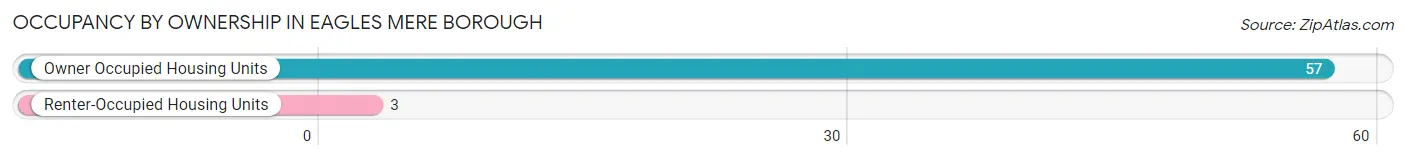
| Occupancy | # Housing Units | % Housing Units |
| Owner Occupied Housing Units | 57 | 95.0% |
| Renter-Occupied Housing Units | 3 | 5.0% |
| Total Occupied Housing Units | 60 | 100.0% |
Occupancy by Household Size in Eagles Mere borough
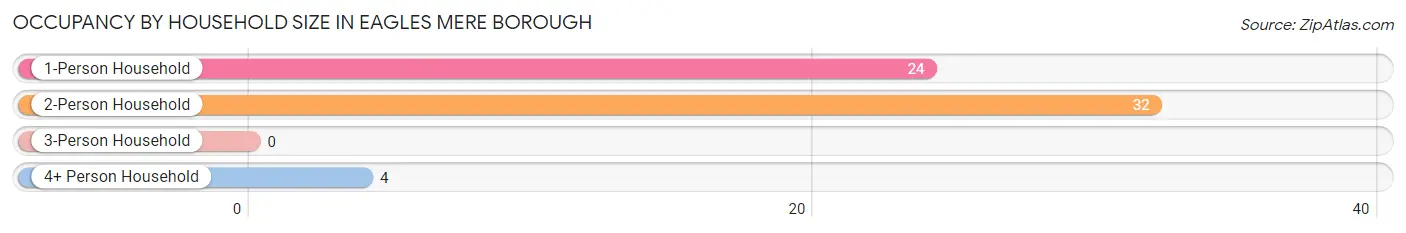
| Household Size | # Housing Units | % Housing Units |
| 1-Person Household | 24 | 40.0% |
| 2-Person Household | 32 | 53.3% |
| 3-Person Household | 0 | 0.0% |
| 4+ Person Household | 4 | 6.7% |
| Total Housing Units | 60 | 100.0% |
Occupancy by Ownership by Household Size in Eagles Mere borough
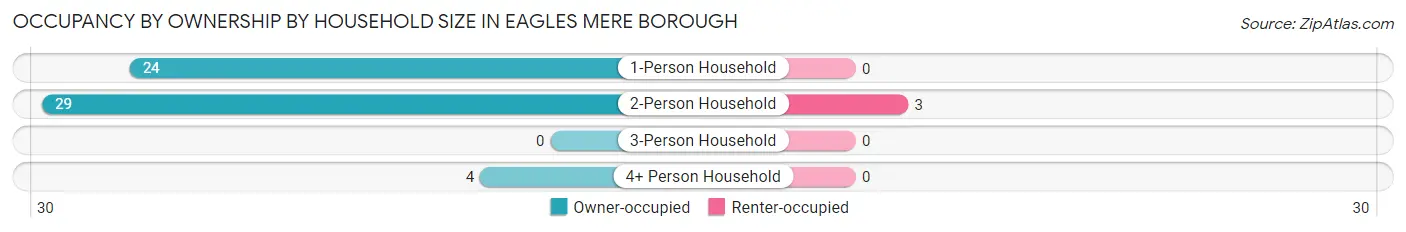
| Household Size | Owner-occupied | Renter-occupied |
| 1-Person Household | 24 (100.0%) | 0 (0.0%) |
| 2-Person Household | 29 (90.6%) | 3 (9.4%) |
| 3-Person Household | 0 (0.0%) | 0 (0.0%) |
| 4+ Person Household | 4 (100.0%) | 0 (0.0%) |
| Total Housing Units | 57 (95.0%) | 3 (5.0%) |
Occupancy by Educational Attainment in Eagles Mere borough
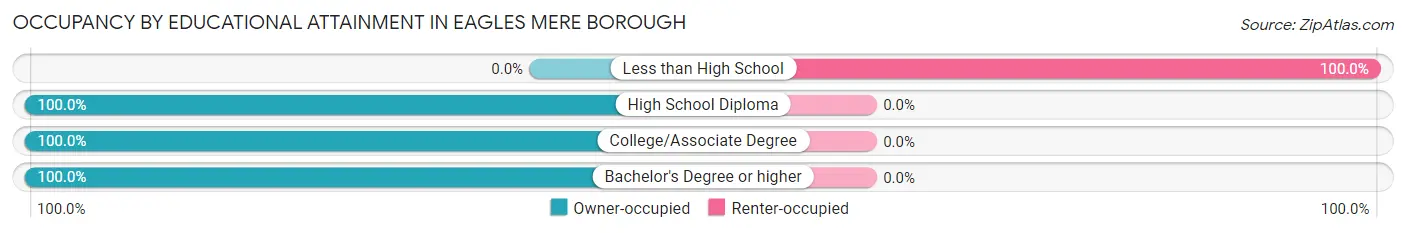
| Household Size | Owner-occupied | Renter-occupied |
| Less than High School | 0 (0.0%) | 3 (100.0%) |
| High School Diploma | 1 (100.0%) | 0 (0.0%) |
| College/Associate Degree | 10 (100.0%) | 0 (0.0%) |
| Bachelor's Degree or higher | 46 (100.0%) | 0 (0.0%) |
Occupancy by Age of Householder in Eagles Mere borough
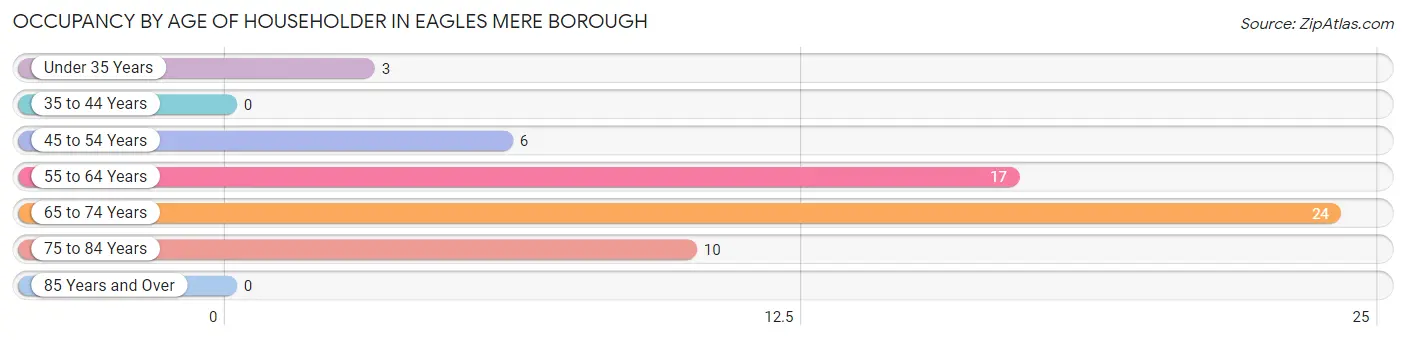
| Age Bracket | # Households | % Households |
| Under 35 Years | 3 | 5.0% |
| 35 to 44 Years | 0 | 0.0% |
| 45 to 54 Years | 6 | 10.0% |
| 55 to 64 Years | 17 | 28.3% |
| 65 to 74 Years | 24 | 40.0% |
| 75 to 84 Years | 10 | 16.7% |
| 85 Years and Over | 0 | 0.0% |
| Total | 60 | 100.0% |
Housing Finances in Eagles Mere borough
Median Income by Occupancy in Eagles Mere borough
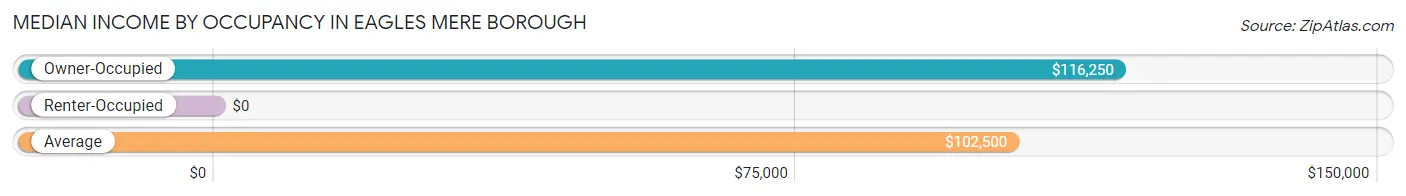
| Occupancy Type | # Households | Median Income |
| Owner-Occupied | 57 (95.0%) | $116,250 |
| Renter-Occupied | 3 (5.0%) | $0 |
| Average | 60 (100.0%) | $102,500 |
Occupancy by Householder Income Bracket in Eagles Mere borough
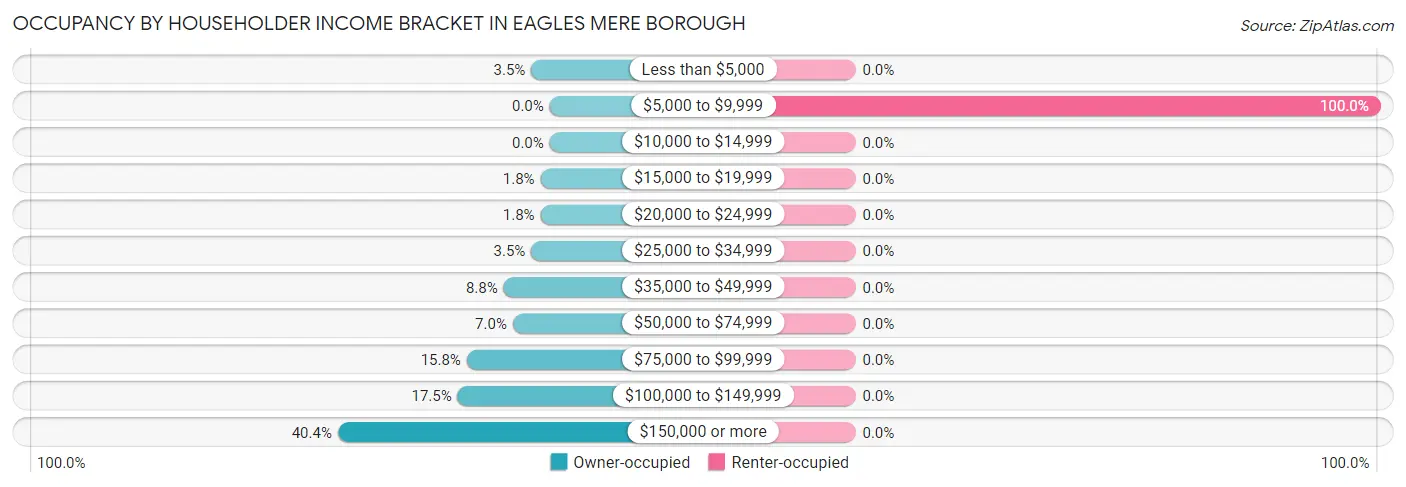
| Income Bracket | Owner-occupied | Renter-occupied |
| Less than $5,000 | 2 (3.5%) | 0 (0.0%) |
| $5,000 to $9,999 | 0 (0.0%) | 3 (100.0%) |
| $10,000 to $14,999 | 0 (0.0%) | 0 (0.0%) |
| $15,000 to $19,999 | 1 (1.8%) | 0 (0.0%) |
| $20,000 to $24,999 | 1 (1.8%) | 0 (0.0%) |
| $25,000 to $34,999 | 2 (3.5%) | 0 (0.0%) |
| $35,000 to $49,999 | 5 (8.8%) | 0 (0.0%) |
| $50,000 to $74,999 | 4 (7.0%) | 0 (0.0%) |
| $75,000 to $99,999 | 9 (15.8%) | 0 (0.0%) |
| $100,000 to $149,999 | 10 (17.5%) | 0 (0.0%) |
| $150,000 or more | 23 (40.4%) | 0 (0.0%) |
| Total | 57 (100.0%) | 3 (100.0%) |
Monthly Housing Cost Tiers in Eagles Mere borough
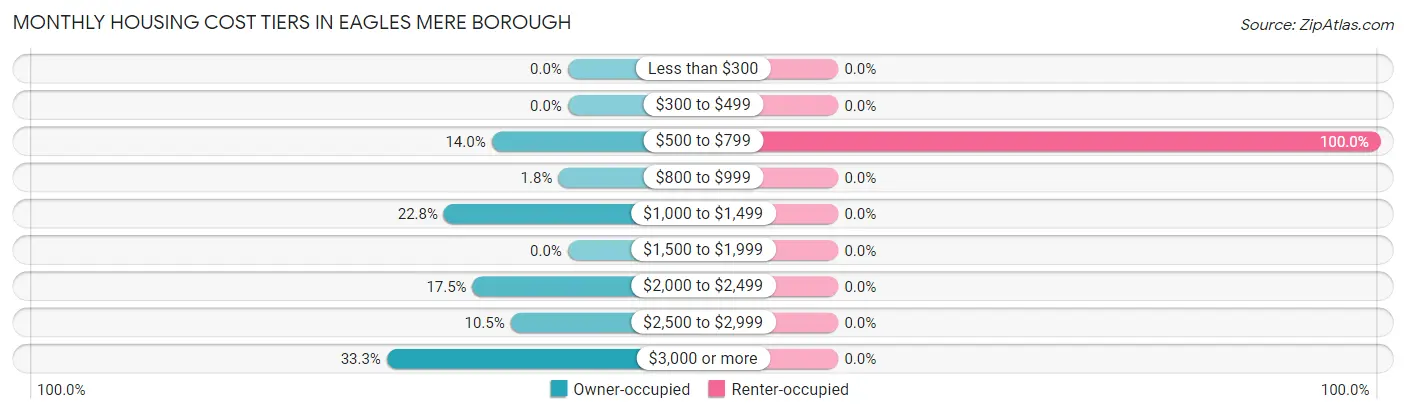
| Monthly Cost | Owner-occupied | Renter-occupied |
| Less than $300 | 0 (0.0%) | 0 (0.0%) |
| $300 to $499 | 0 (0.0%) | 0 (0.0%) |
| $500 to $799 | 8 (14.0%) | 3 (100.0%) |
| $800 to $999 | 1 (1.8%) | 0 (0.0%) |
| $1,000 to $1,499 | 13 (22.8%) | 0 (0.0%) |
| $1,500 to $1,999 | 0 (0.0%) | 0 (0.0%) |
| $2,000 to $2,499 | 10 (17.5%) | 0 (0.0%) |
| $2,500 to $2,999 | 6 (10.5%) | 0 (0.0%) |
| $3,000 or more | 19 (33.3%) | 0 (0.0%) |
| Total | 57 (100.0%) | 3 (100.0%) |
Physical Housing Characteristics in Eagles Mere borough
Housing Structures in Eagles Mere borough
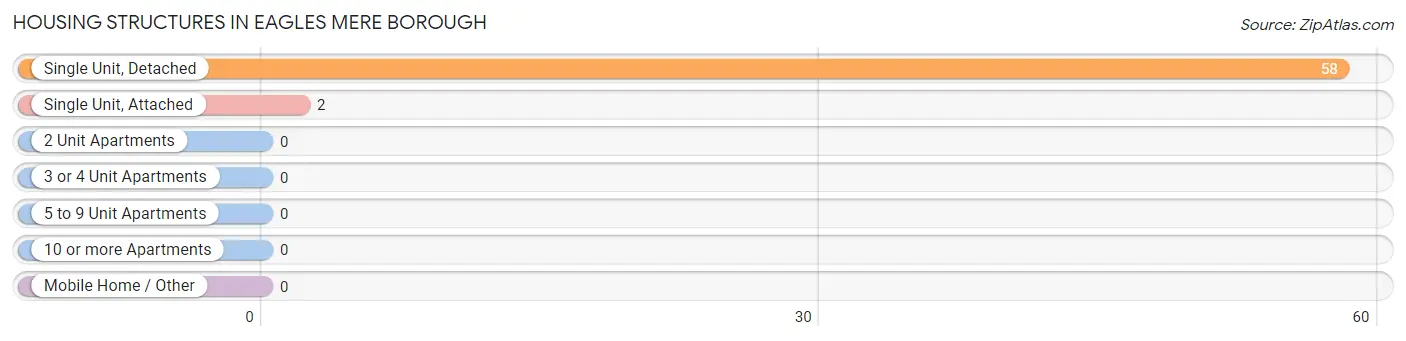
| Structure Type | # Housing Units | % Housing Units |
| Single Unit, Detached | 58 | 96.7% |
| Single Unit, Attached | 2 | 3.3% |
| 2 Unit Apartments | 0 | 0.0% |
| 3 or 4 Unit Apartments | 0 | 0.0% |
| 5 to 9 Unit Apartments | 0 | 0.0% |
| 10 or more Apartments | 0 | 0.0% |
| Mobile Home / Other | 0 | 0.0% |
| Total | 60 | 100.0% |
Housing Structures by Occupancy in Eagles Mere borough
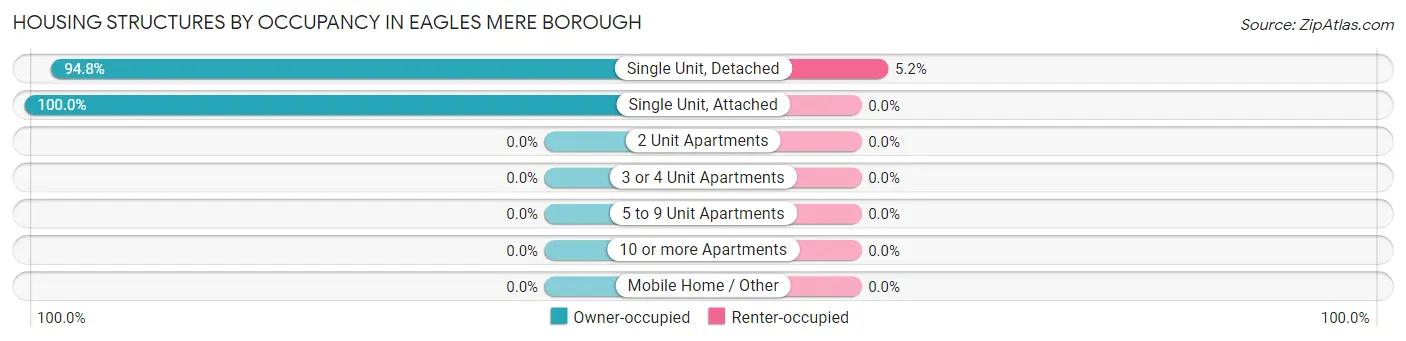
| Structure Type | Owner-occupied | Renter-occupied |
| Single Unit, Detached | 55 (94.8%) | 3 (5.2%) |
| Single Unit, Attached | 2 (100.0%) | 0 (0.0%) |
| 2 Unit Apartments | 0 (0.0%) | 0 (0.0%) |
| 3 or 4 Unit Apartments | 0 (0.0%) | 0 (0.0%) |
| 5 to 9 Unit Apartments | 0 (0.0%) | 0 (0.0%) |
| 10 or more Apartments | 0 (0.0%) | 0 (0.0%) |
| Mobile Home / Other | 0 (0.0%) | 0 (0.0%) |
| Total | 57 (95.0%) | 3 (5.0%) |
Housing Structures by Number of Rooms in Eagles Mere borough
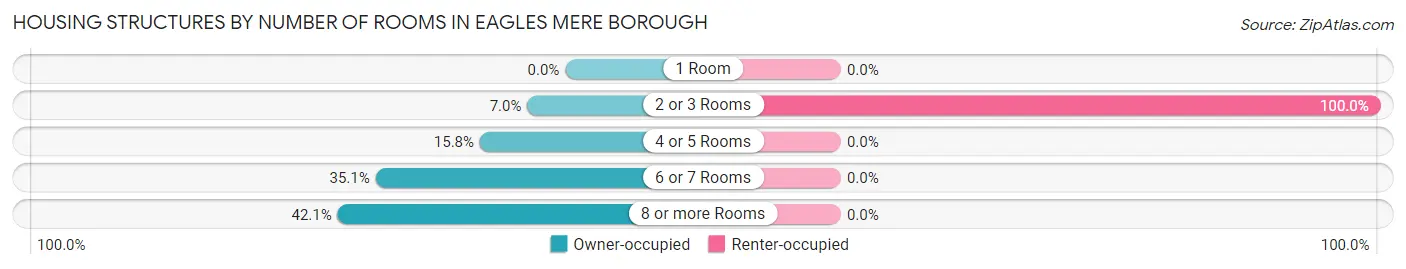
| Number of Rooms | Owner-occupied | Renter-occupied |
| 1 Room | 0 (0.0%) | 0 (0.0%) |
| 2 or 3 Rooms | 4 (7.0%) | 3 (100.0%) |
| 4 or 5 Rooms | 9 (15.8%) | 0 (0.0%) |
| 6 or 7 Rooms | 20 (35.1%) | 0 (0.0%) |
| 8 or more Rooms | 24 (42.1%) | 0 (0.0%) |
| Total | 57 (100.0%) | 3 (100.0%) |
Housing Structure by Heating Type in Eagles Mere borough
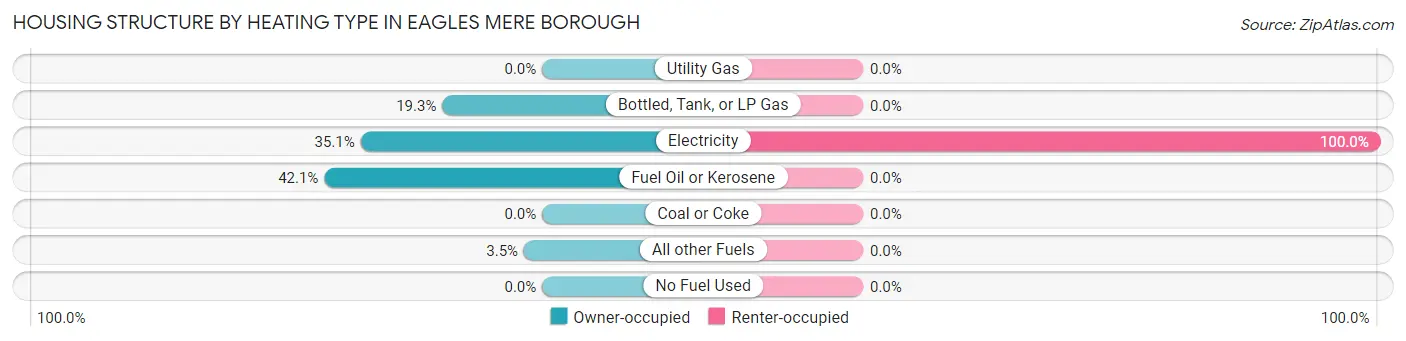
| Heating Type | Owner-occupied | Renter-occupied |
| Utility Gas | 0 (0.0%) | 0 (0.0%) |
| Bottled, Tank, or LP Gas | 11 (19.3%) | 0 (0.0%) |
| Electricity | 20 (35.1%) | 3 (100.0%) |
| Fuel Oil or Kerosene | 24 (42.1%) | 0 (0.0%) |
| Coal or Coke | 0 (0.0%) | 0 (0.0%) |
| All other Fuels | 2 (3.5%) | 0 (0.0%) |
| No Fuel Used | 0 (0.0%) | 0 (0.0%) |
| Total | 57 (100.0%) | 3 (100.0%) |
Household Vehicle Usage in Eagles Mere borough
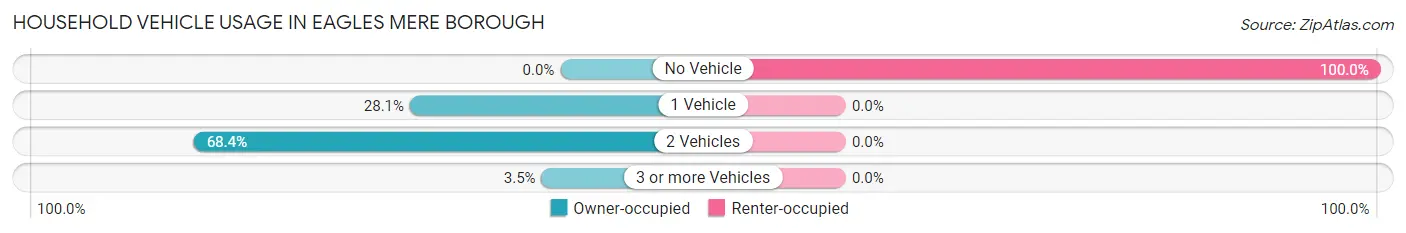
| Vehicles per Household | Owner-occupied | Renter-occupied |
| No Vehicle | 0 (0.0%) | 3 (100.0%) |
| 1 Vehicle | 16 (28.1%) | 0 (0.0%) |
| 2 Vehicles | 39 (68.4%) | 0 (0.0%) |
| 3 or more Vehicles | 2 (3.5%) | 0 (0.0%) |
| Total | 57 (100.0%) | 3 (100.0%) |
Real Estate & Mortgages in Eagles Mere borough
Real Estate and Mortgage Overview in Eagles Mere borough
| Characteristic | Without Mortgage | With Mortgage |
| Housing Units | 17 | 40 |
| Median Property Value | $437,500 | $722,200 |
| Median Household Income | $91,563 | $18 |
| Monthly Housing Costs | $950 | $19 |
| Real Estate Taxes | $4,071 | $0 |
Property Value by Mortgage Status in Eagles Mere borough
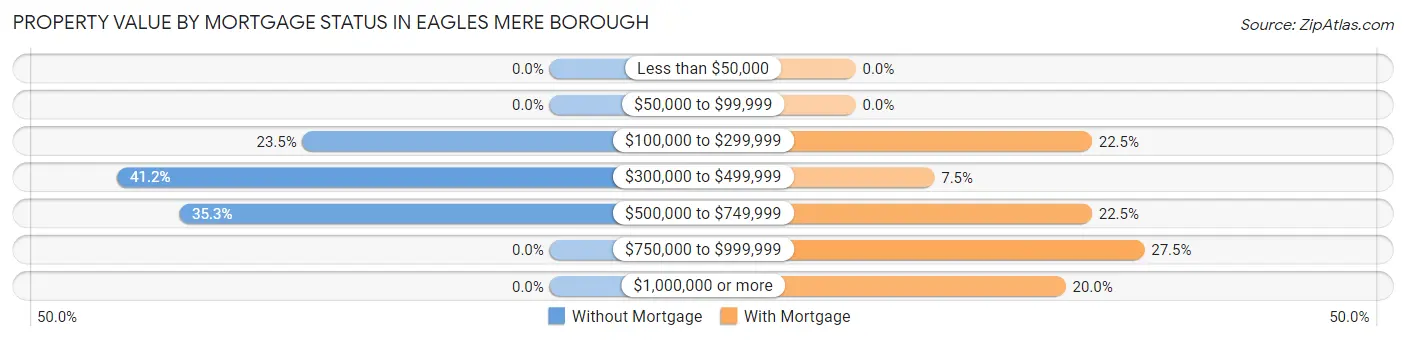
| Property Value | Without Mortgage | With Mortgage |
| Less than $50,000 | 0 (0.0%) | 0 (0.0%) |
| $50,000 to $99,999 | 0 (0.0%) | 0 (0.0%) |
| $100,000 to $299,999 | 4 (23.5%) | 9 (22.5%) |
| $300,000 to $499,999 | 7 (41.2%) | 3 (7.5%) |
| $500,000 to $749,999 | 6 (35.3%) | 9 (22.5%) |
| $750,000 to $999,999 | 0 (0.0%) | 11 (27.5%) |
| $1,000,000 or more | 0 (0.0%) | 8 (20.0%) |
| Total | 17 (100.0%) | 40 (100.0%) |
Household Income by Mortgage Status in Eagles Mere borough
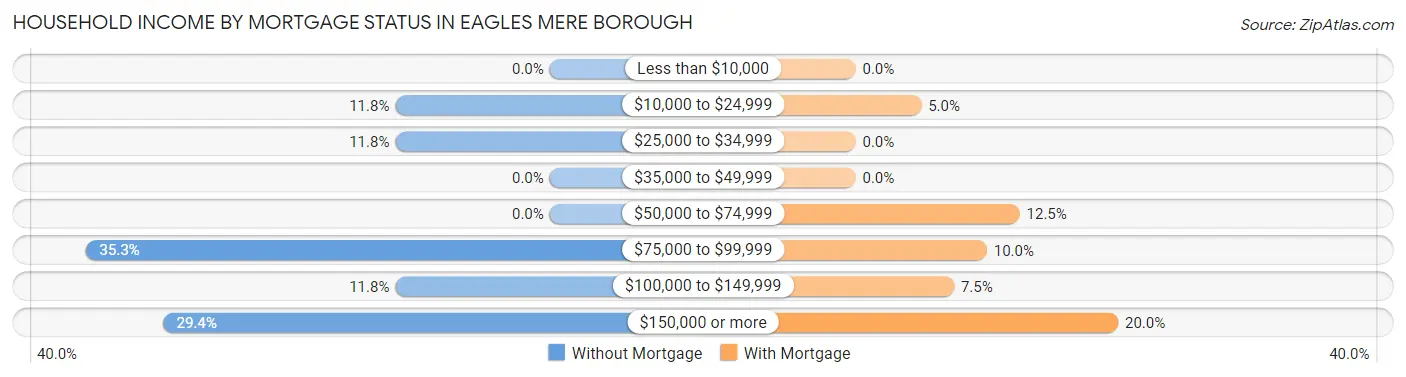
| Household Income | Without Mortgage | With Mortgage |
| Less than $10,000 | 0 (0.0%) | 0 (0.0%) |
| $10,000 to $24,999 | 2 (11.8%) | 2 (5.0%) |
| $25,000 to $34,999 | 2 (11.8%) | 0 (0.0%) |
| $35,000 to $49,999 | 0 (0.0%) | 0 (0.0%) |
| $50,000 to $74,999 | 0 (0.0%) | 5 (12.5%) |
| $75,000 to $99,999 | 6 (35.3%) | 4 (10.0%) |
| $100,000 to $149,999 | 2 (11.8%) | 3 (7.5%) |
| $150,000 or more | 5 (29.4%) | 8 (20.0%) |
| Total | 17 (100.0%) | 40 (100.0%) |
Property Value to Household Income Ratio in Eagles Mere borough
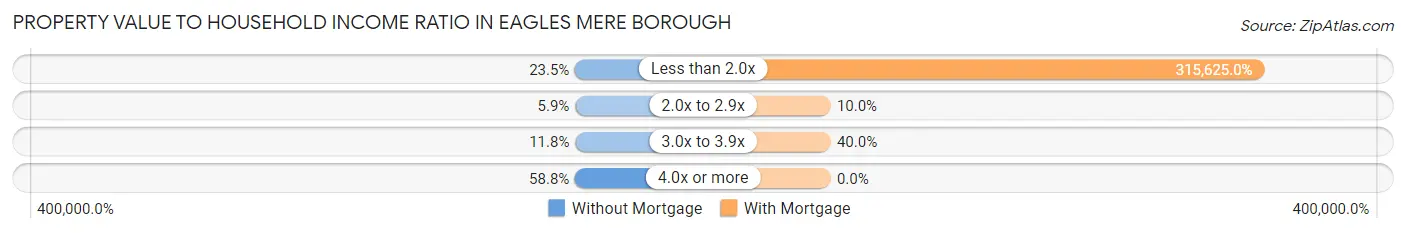
| Value-to-Income Ratio | Without Mortgage | With Mortgage |
| Less than 2.0x | 4 (23.5%) | 126,250 (315,625.0%) |
| 2.0x to 2.9x | 1 (5.9%) | 4 (10.0%) |
| 3.0x to 3.9x | 2 (11.8%) | 16 (40.0%) |
| 4.0x or more | 10 (58.8%) | 0 (0.0%) |
| Total | 17 (100.0%) | 40 (100.0%) |
Real Estate Taxes by Mortgage Status in Eagles Mere borough
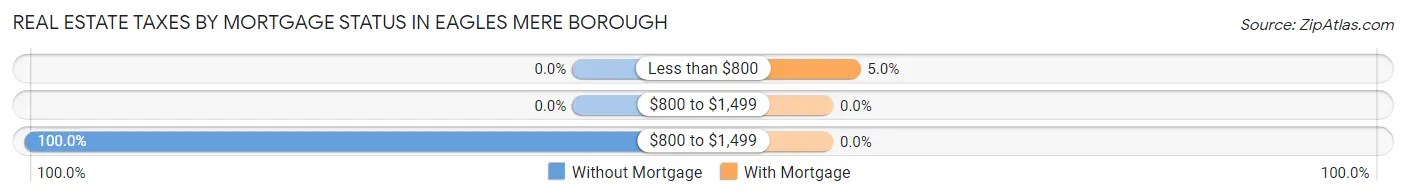
| Property Taxes | Without Mortgage | With Mortgage |
| Less than $800 | 0 (0.0%) | 2 (5.0%) |
| $800 to $1,499 | 0 (0.0%) | 0 (0.0%) |
| $800 to $1,499 | 17 (100.0%) | 0 (0.0%) |
| Total | 17 (100.0%) | 40 (100.0%) |
Health & Disability in Eagles Mere borough
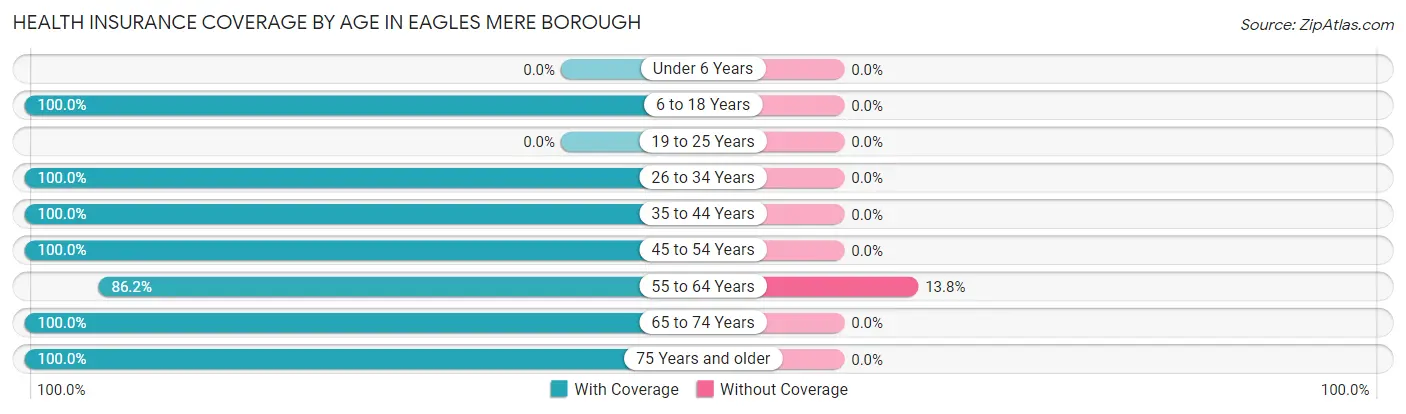
Health Insurance Coverage by Age in Eagles Mere borough
| Age Bracket | With Coverage | Without Coverage |
| Under 6 Years | 0 (0.0%) | 0 (0.0%) |
| 6 to 18 Years | 5 (100.0%) | 0 (0.0%) |
| 19 to 25 Years | 0 (0.0%) | 0 (0.0%) |
| 26 to 34 Years | 3 (100.0%) | 0 (0.0%) |
| 35 to 44 Years | 2 (100.0%) | 0 (0.0%) |
| 45 to 54 Years | 10 (100.0%) | 0 (0.0%) |
| 55 to 64 Years | 25 (86.2%) | 4 (13.8%) |
| 65 to 74 Years | 37 (100.0%) | 0 (0.0%) |
| 75 Years and older | 14 (100.0%) | 0 (0.0%) |
| Total | 96 (96.0%) | 4 (4.0%) |
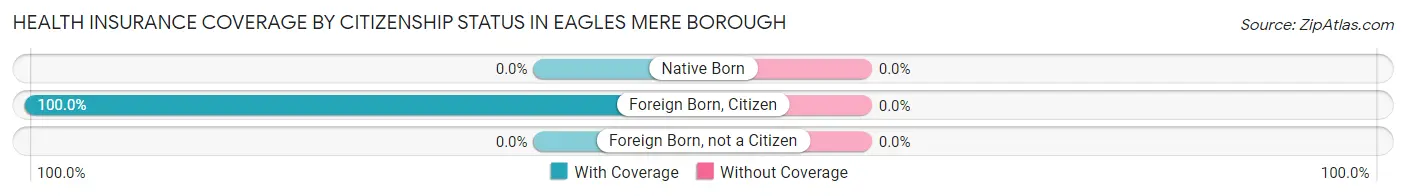
Health Insurance Coverage by Citizenship Status in Eagles Mere borough
| Citizenship Status | With Coverage | Without Coverage |
| Native Born | 0 (0.0%) | 0 (0.0%) |
| Foreign Born, Citizen | 5 (100.0%) | 0 (0.0%) |
| Foreign Born, not a Citizen | 0 (0.0%) | 0 (0.0%) |
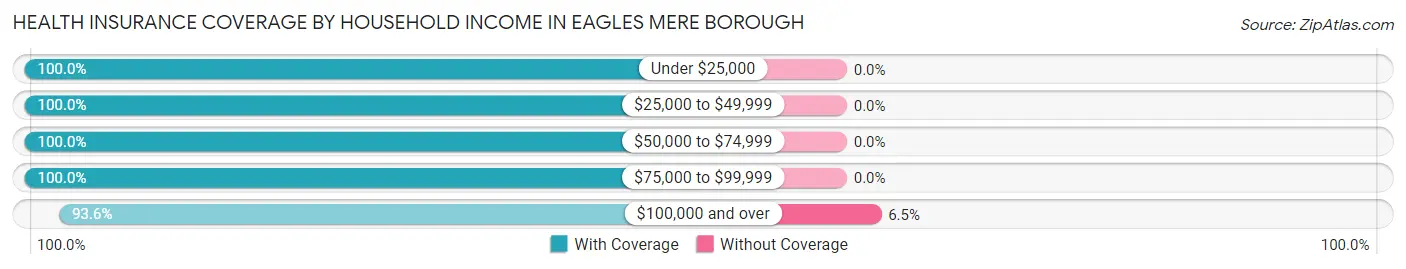
Health Insurance Coverage by Household Income in Eagles Mere borough
| Household Income | With Coverage | Without Coverage |
| Under $25,000 | 10 (100.0%) | 0 (0.0%) |
| $25,000 to $49,999 | 7 (100.0%) | 0 (0.0%) |
| $50,000 to $74,999 | 8 (100.0%) | 0 (0.0%) |
| $75,000 to $99,999 | 13 (100.0%) | 0 (0.0%) |
| $100,000 and over | 58 (93.5%) | 4 (6.5%) |
Public vs Private Health Insurance Coverage by Age in Eagles Mere borough
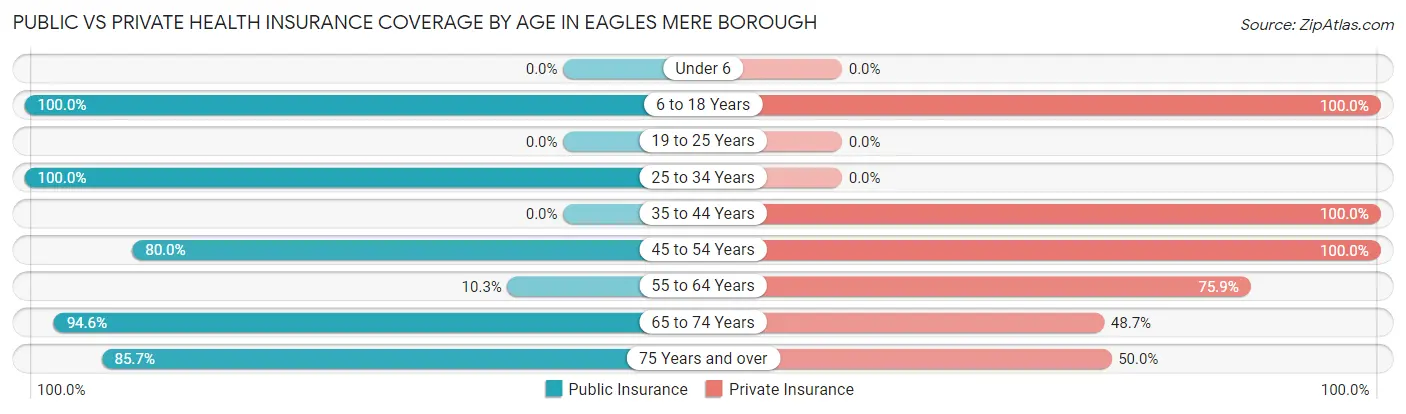
| Age Bracket | Public Insurance | Private Insurance |
| Under 6 | 0 (0.0%) | 0 (0.0%) |
| 6 to 18 Years | 5 (100.0%) | 5 (100.0%) |
| 19 to 25 Years | 0 (0.0%) | 0 (0.0%) |
| 25 to 34 Years | 3 (100.0%) | 0 (0.0%) |
| 35 to 44 Years | 0 (0.0%) | 2 (100.0%) |
| 45 to 54 Years | 8 (80.0%) | 10 (100.0%) |
| 55 to 64 Years | 3 (10.3%) | 22 (75.9%) |
| 65 to 74 Years | 35 (94.6%) | 18 (48.6%) |
| 75 Years and over | 12 (85.7%) | 7 (50.0%) |
| Total | 66 (66.0%) | 64 (64.0%) |
Disability Status by Sex by Age in Eagles Mere borough
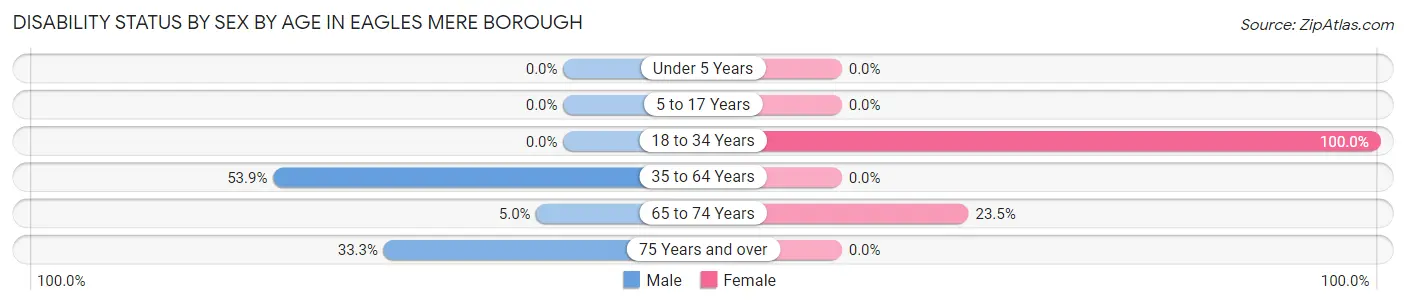
| Age Bracket | Male | Female |
| Under 5 Years | 0 (0.0%) | 0 (0.0%) |
| 5 to 17 Years | 0 (0.0%) | 0 (0.0%) |
| 18 to 34 Years | 0 (0.0%) | 3 (100.0%) |
| 35 to 64 Years | 7 (53.8%) | 0 (0.0%) |
| 65 to 74 Years | 1 (5.0%) | 4 (23.5%) |
| 75 Years and over | 3 (33.3%) | 0 (0.0%) |
Disability Class by Sex by Age in Eagles Mere borough
Disability Class: Hearing Difficulty
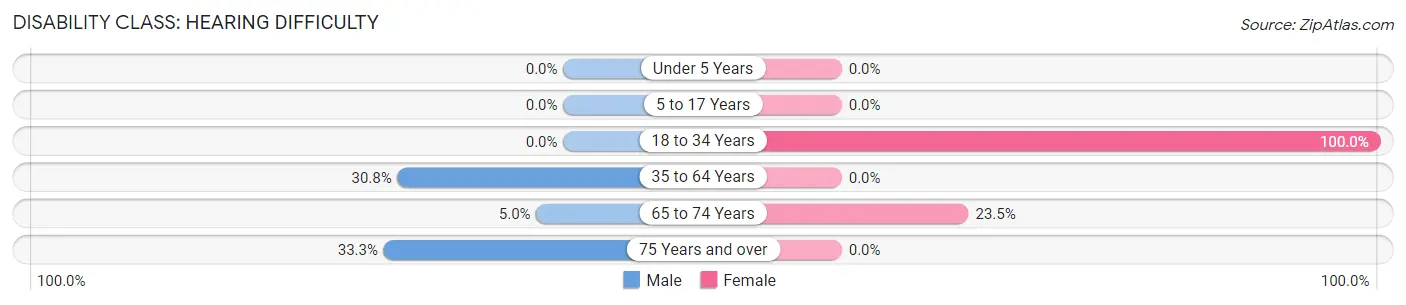
| Age Bracket | Male | Female |
| Under 5 Years | 0 (0.0%) | 0 (0.0%) |
| 5 to 17 Years | 0 (0.0%) | 0 (0.0%) |
| 18 to 34 Years | 0 (0.0%) | 3 (100.0%) |
| 35 to 64 Years | 4 (30.8%) | 0 (0.0%) |
| 65 to 74 Years | 1 (5.0%) | 4 (23.5%) |
| 75 Years and over | 3 (33.3%) | 0 (0.0%) |
Disability Class: Vision Difficulty
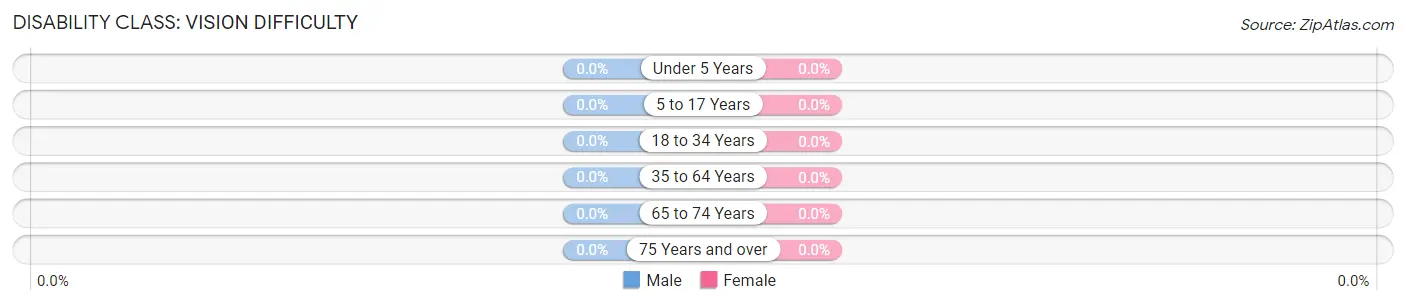
| Age Bracket | Male | Female |
| Under 5 Years | 0 (0.0%) | 0 (0.0%) |
| 5 to 17 Years | 0 (0.0%) | 0 (0.0%) |
| 18 to 34 Years | 0 (0.0%) | 0 (0.0%) |
| 35 to 64 Years | 0 (0.0%) | 0 (0.0%) |
| 65 to 74 Years | 0 (0.0%) | 0 (0.0%) |
| 75 Years and over | 0 (0.0%) | 0 (0.0%) |
Disability Class: Cognitive Difficulty
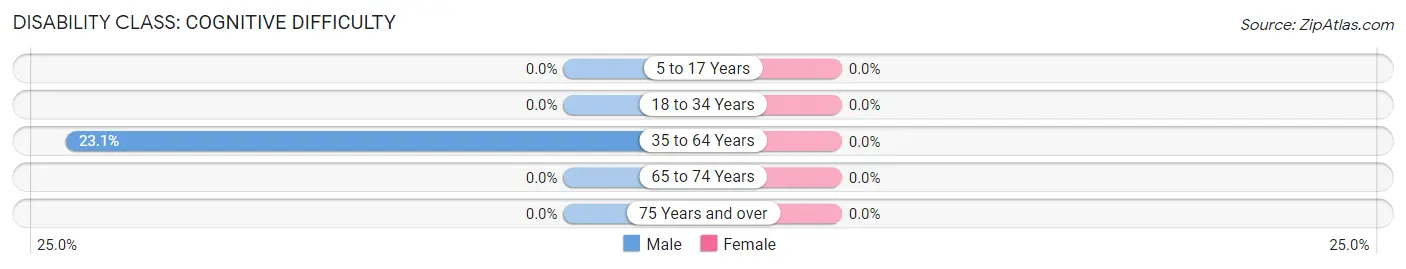
| Age Bracket | Male | Female |
| 5 to 17 Years | 0 (0.0%) | 0 (0.0%) |
| 18 to 34 Years | 0 (0.0%) | 0 (0.0%) |
| 35 to 64 Years | 3 (23.1%) | 0 (0.0%) |
| 65 to 74 Years | 0 (0.0%) | 0 (0.0%) |
| 75 Years and over | 0 (0.0%) | 0 (0.0%) |
Disability Class: Ambulatory Difficulty
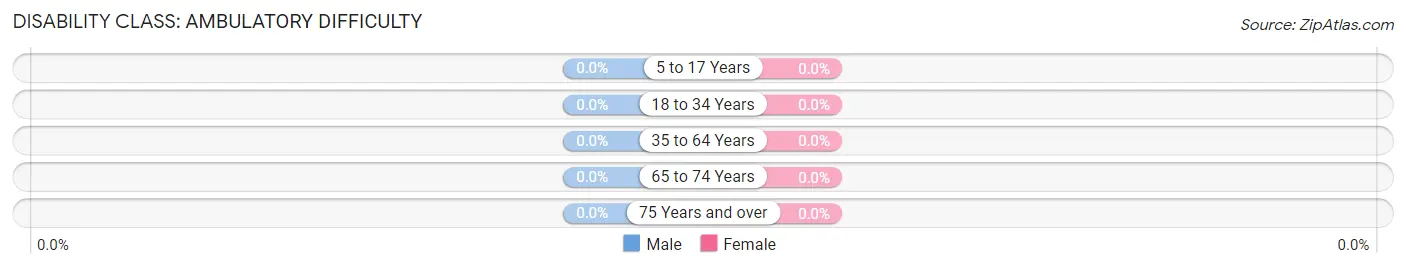
| Age Bracket | Male | Female |
| 5 to 17 Years | 0 (0.0%) | 0 (0.0%) |
| 18 to 34 Years | 0 (0.0%) | 0 (0.0%) |
| 35 to 64 Years | 0 (0.0%) | 0 (0.0%) |
| 65 to 74 Years | 0 (0.0%) | 0 (0.0%) |
| 75 Years and over | 0 (0.0%) | 0 (0.0%) |
Disability Class: Self-Care Difficulty
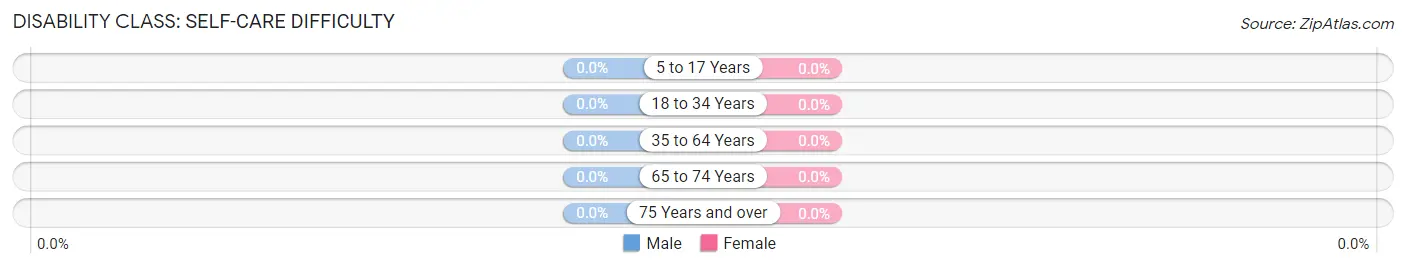
| Age Bracket | Male | Female |
| 5 to 17 Years | 0 (0.0%) | 0 (0.0%) |
| 18 to 34 Years | 0 (0.0%) | 0 (0.0%) |
| 35 to 64 Years | 0 (0.0%) | 0 (0.0%) |
| 65 to 74 Years | 0 (0.0%) | 0 (0.0%) |
| 75 Years and over | 0 (0.0%) | 0 (0.0%) |
Technology Access in Eagles Mere borough
Computing Device Access in Eagles Mere borough
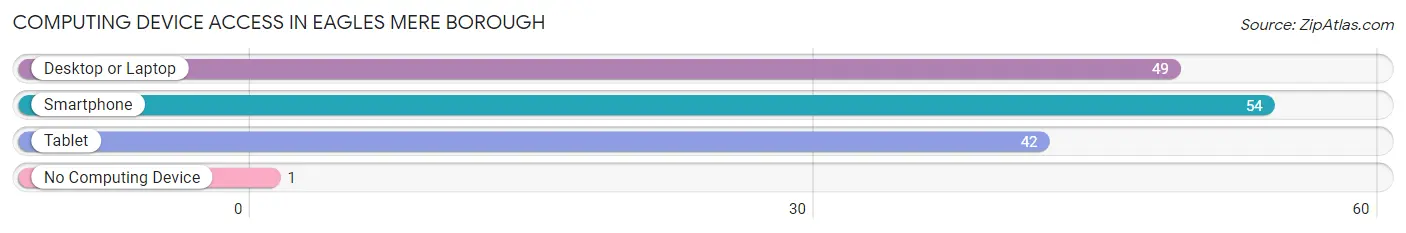
| Device Type | # Households | % Households |
| Desktop or Laptop | 49 | 81.7% |
| Smartphone | 54 | 90.0% |
| Tablet | 42 | 70.0% |
| No Computing Device | 1 | 1.7% |
| Total | 60 | 100.0% |
Internet Access in Eagles Mere borough
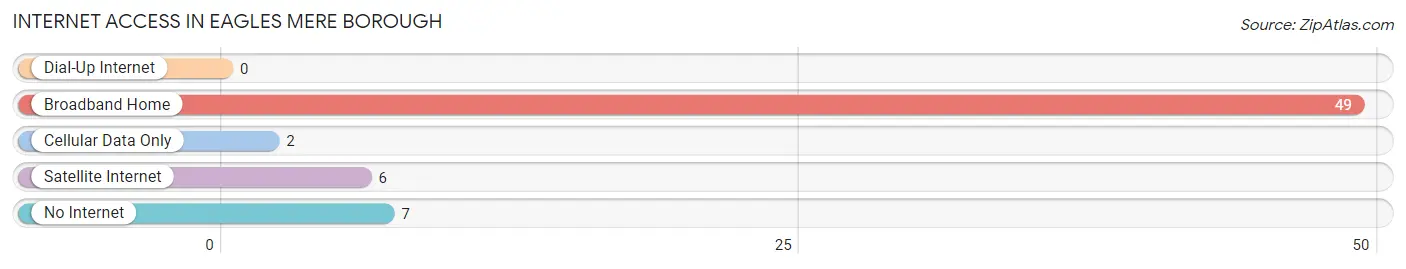
| Internet Type | # Households | % Households |
| Dial-Up Internet | 0 | 0.0% |
| Broadband Home | 49 | 81.7% |
| Cellular Data Only | 2 | 3.3% |
| Satellite Internet | 6 | 10.0% |
| No Internet | 7 | 11.7% |
| Total | 60 | 100.0% |
Eagles Mere borough Summary
Eagles Mere Borough is a small borough located in Sullivan County, Pennsylvania. It is situated in the Endless Mountains region of the state, and is surrounded by the Loyalsock State Forest. The borough is home to a population of just over 200 people, and is known for its picturesque scenery and outdoor recreation opportunities.
History
The area that is now Eagles Mere Borough was first settled in the late 1700s by a group of settlers from Connecticut. The settlers were attracted to the area due to its abundance of natural resources, including timber and water. The area was originally known as “Eaglesmere”, and was officially incorporated as a borough in 1891.
The borough was named after the nearby Eagles Mere Lake, which was named after the bald eagles that were once plentiful in the area. The lake was a popular destination for tourists in the late 19th and early 20th centuries, and the town of Eagles Mere was a popular summer resort. The town was home to several hotels, including the Eagles Mere Hotel, which was built in 1891 and is still standing today.
Geography
Eagles Mere Borough is located in the Endless Mountains region of Pennsylvania. It is situated in the western part of Sullivan County, and is bordered by the Loyalsock State Forest to the north and east. The borough is located at an elevation of 1,890 feet, and has a total area of 0.6 square miles.
The borough is home to several bodies of water, including Eagles Mere Lake, which is the largest lake in the area. The lake is fed by several small streams, and is a popular destination for fishing, swimming, and boating. Other bodies of water in the area include the Eagles Mere Creek, which flows through the borough, and the Loyalsock Creek, which forms the western border of the borough.
Economy
The economy of Eagles Mere Borough is largely based on tourism. The borough is home to several hotels and resorts, as well as a variety of restaurants and shops. The area is also popular for its outdoor recreation opportunities, including fishing, hiking, and camping.
The borough is also home to several small businesses, including a lumber mill, a sawmill, and a furniture factory. The borough is also home to a small airport, which is used for private and recreational flights.
Demographics
As of the 2010 census, the population of Eagles Mere Borough was 203. The racial makeup of the borough was 97.5% White, 0.5% African American, 0.5% Native American, 0.5% Asian, and 1.0% from two or more races. The median household income was $41,250, and the median family income was $50,000.
The population of Eagles Mere Borough is largely made up of retirees and seasonal residents. The borough is home to several retirement communities, and is a popular destination for vacationers and second-home owners. The borough is also home to a small number of full-time residents, many of whom are employed in the tourism industry.
Common Questions
What is Per Capita Income in Eagles Mere borough?
Per Capita income in Eagles Mere borough is $99,394.
What is the Median Family Income in Eagles Mere borough?
Median Family Income in Eagles Mere borough is $126,250.
What is the Median Household income in Eagles Mere borough?
Median Household Income in Eagles Mere borough is $102,500.
What is Inequality or Gini Index in Eagles Mere borough?
Inequality or Gini Index in Eagles Mere borough is 0.51.
What is the Total Population of Eagles Mere borough?
Total Population of Eagles Mere borough is 100.
What is the Total Male Population of Eagles Mere borough?
Total Male Population of Eagles Mere borough is 44.
What is the Total Female Population of Eagles Mere borough?
Total Female Population of Eagles Mere borough is 56.
What is the Ratio of Males per 100 Females in Eagles Mere borough?
There are 78.57 Males per 100 Females in Eagles Mere borough.
What is the Ratio of Females per 100 Males in Eagles Mere borough?
There are 127.27 Females per 100 Males in Eagles Mere borough.
What is the Median Population Age in Eagles Mere borough?
Median Population Age in Eagles Mere borough is 67.2 Years.
What is the Average Family Size in Eagles Mere borough
Average Family Size in Eagles Mere borough is 2.1 People.
What is the Average Household Size in Eagles Mere borough
Average Household Size in Eagles Mere borough is 1.7 People.
How Large is the Labor Force in Eagles Mere borough?
There are 36 People in the Labor Forcein in Eagles Mere borough.
What is the Percentage of People in the Labor Force in Eagles Mere borough?
37.1% of People are in the Labor Force in Eagles Mere borough.
What is the Unemployment Rate in Eagles Mere borough?
Unemployment Rate in Eagles Mere borough is 8.3%.