Dickson City borough, PA Map & Demographics
Dickson City borough Overview
$35,244
PER CAPITA INCOME
$70,706
AVG FAMILY INCOME
$56,679
AVG HOUSEHOLD INCOME
28.7%
WAGE / INCOME GAP [ % ]
71.3¢/ $1
WAGE / INCOME GAP [ $ ]
$15,413
FAMILY INCOME DEFICIT
0.43
INEQUALITY / GINI INDEX
6,026
TOTAL POPULATION
2,755
MALE POPULATION
3,271
FEMALE POPULATION
84.23
MALES / 100 FEMALES
118.73
FEMALES / 100 MALES
45.7
MEDIAN AGE
2.8
AVG FAMILY SIZE
2.1
AVG HOUSEHOLD SIZE
2,950
LABOR FORCE [ PEOPLE ]
61.2%
PERCENT IN LABOR FORCE
8.1%
UNEMPLOYMENT RATE
Income in Dickson City borough
Income Overview in Dickson City borough
Per Capita Income in Dickson City borough is $35,244, while median incomes of families and households are $70,706 and $56,679 respectively.
| Characteristic | Number | Measure |
| Per Capita Income | 6,026 | $35,244 |
| Median Family Income | 1,497 | $70,706 |
| Mean Family Income | 1,497 | $89,981 |
| Median Household Income | 2,811 | $56,679 |
| Mean Household Income | 2,811 | $74,256 |
| Income Deficit | 1,497 | $15,413 |
| Wage / Income Gap (%) | 6,026 | 28.67% |
| Wage / Income Gap ($) | 6,026 | 71.33¢ per $1 |
| Gini / Inequality Index | 6,026 | 0.43 |
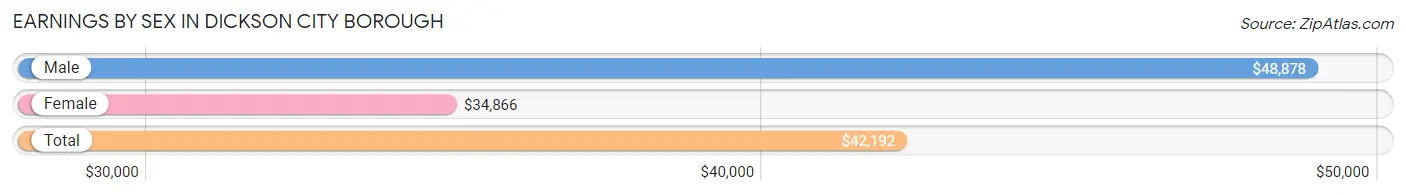
Earnings by Sex in Dickson City borough
Average Earnings in Dickson City borough are $42,192, $48,878 for men and $34,866 for women, a difference of 28.7%.
| Sex | Number | Average Earnings |
| Male | 1,473 (50.7%) | $48,878 |
| Female | 1,434 (49.3%) | $34,866 |
| Total | 2,907 (100.0%) | $42,192 |
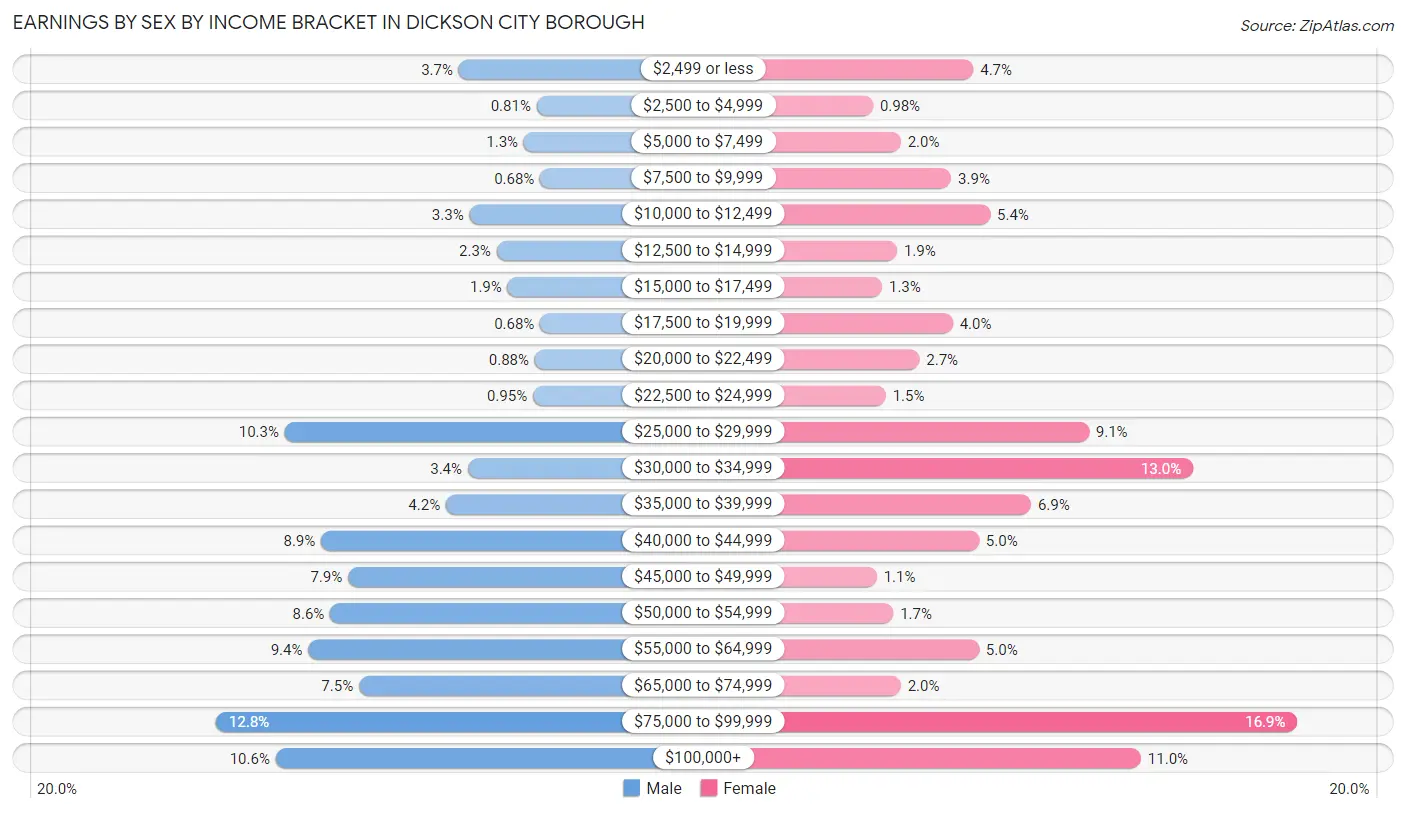
Earnings by Sex by Income Bracket in Dickson City borough
The most common earnings brackets in Dickson City borough are $75,000 to $99,999 for men (189 | 12.8%) and $75,000 to $99,999 for women (242 | 16.9%).
| Income | Male | Female |
| $2,499 or less | 55 (3.7%) | 68 (4.7%) |
| $2,500 to $4,999 | 12 (0.8%) | 14 (1.0%) |
| $5,000 to $7,499 | 19 (1.3%) | 29 (2.0%) |
| $7,500 to $9,999 | 10 (0.7%) | 56 (3.9%) |
| $10,000 to $12,499 | 49 (3.3%) | 77 (5.4%) |
| $12,500 to $14,999 | 34 (2.3%) | 27 (1.9%) |
| $15,000 to $17,499 | 28 (1.9%) | 19 (1.3%) |
| $17,500 to $19,999 | 10 (0.7%) | 57 (4.0%) |
| $20,000 to $22,499 | 13 (0.9%) | 39 (2.7%) |
| $22,500 to $24,999 | 14 (0.9%) | 21 (1.5%) |
| $25,000 to $29,999 | 151 (10.2%) | 130 (9.1%) |
| $30,000 to $34,999 | 50 (3.4%) | 186 (13.0%) |
| $35,000 to $39,999 | 62 (4.2%) | 99 (6.9%) |
| $40,000 to $44,999 | 131 (8.9%) | 71 (5.0%) |
| $45,000 to $49,999 | 116 (7.9%) | 16 (1.1%) |
| $50,000 to $54,999 | 126 (8.6%) | 25 (1.7%) |
| $55,000 to $64,999 | 138 (9.4%) | 71 (5.0%) |
| $65,000 to $74,999 | 110 (7.5%) | 29 (2.0%) |
| $75,000 to $99,999 | 189 (12.8%) | 242 (16.9%) |
| $100,000+ | 156 (10.6%) | 158 (11.0%) |
| Total | 1,473 (100.0%) | 1,434 (100.0%) |
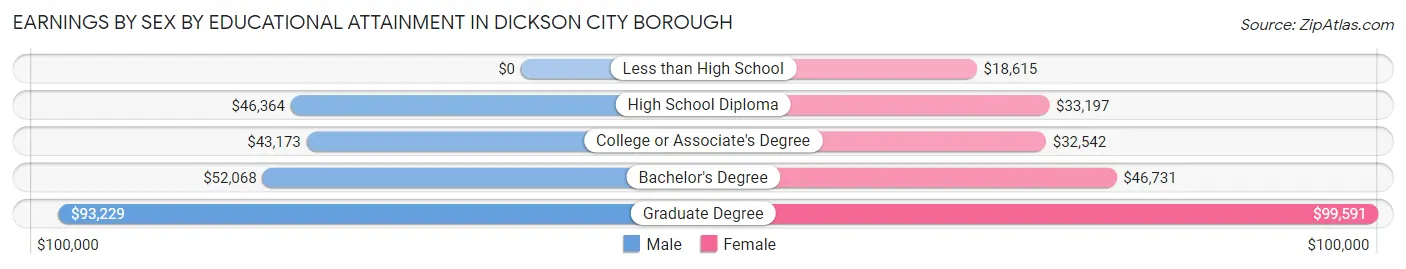
Earnings by Sex by Educational Attainment in Dickson City borough
Average earnings in Dickson City borough are $50,407 for men and $38,404 for women, a difference of 23.8%. Men with an educational attainment of graduate degree enjoy the highest average annual earnings of $93,229, while those with college or associate's degree education earn the least with $43,173. Women with an educational attainment of graduate degree earn the most with the average annual earnings of $99,591, while those with less than high school education have the smallest earnings of $18,615.
| Educational Attainment | Male Income | Female Income |
| Less than High School | - | - |
| High School Diploma | $46,364 | $33,197 |
| College or Associate's Degree | $43,173 | $32,542 |
| Bachelor's Degree | $52,068 | $46,731 |
| Graduate Degree | $93,229 | $99,591 |
| Total | $50,407 | $38,404 |
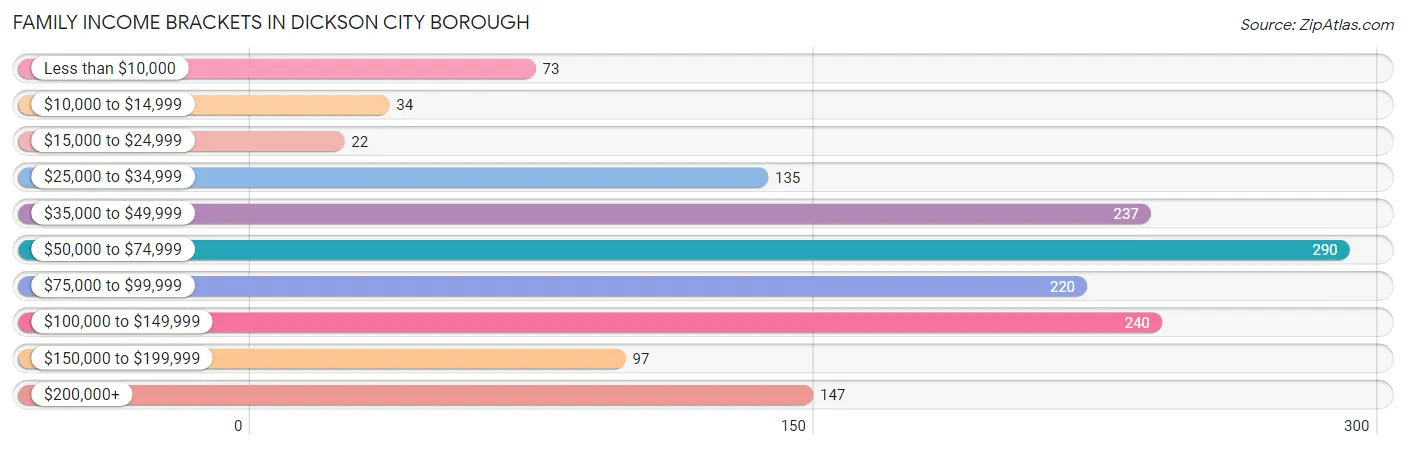
Family Income in Dickson City borough
Family Income Brackets in Dickson City borough
According to the Dickson City borough family income data, there are 290 families falling into the $50,000 to $74,999 income range, which is the most common income bracket and makes up 19.4% of all families. Conversely, the $15,000 to $24,999 income bracket is the least frequent group with only 22 families (1.5%) belonging to this category.
| Income Bracket | # Families | % Families |
| Less than $10,000 | 73 | 4.9% |
| $10,000 to $14,999 | 34 | 2.3% |
| $15,000 to $24,999 | 22 | 1.5% |
| $25,000 to $34,999 | 135 | 9.0% |
| $35,000 to $49,999 | 237 | 15.8% |
| $50,000 to $74,999 | 290 | 19.4% |
| $75,000 to $99,999 | 220 | 14.7% |
| $100,000 to $149,999 | 240 | 16.0% |
| $150,000 to $199,999 | 97 | 6.5% |
| $200,000+ | 147 | 9.8% |
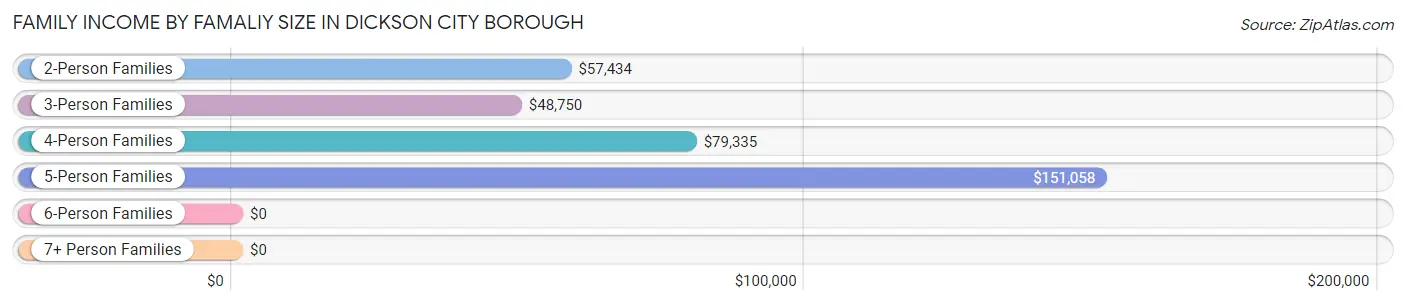
Family Income by Famaliy Size in Dickson City borough
5-person families (167 | 11.2%) account for the highest median family income in Dickson City borough with $151,058 per family, while 5-person families (167 | 11.2%) have the highest median income of $30,212 per family member.
| Income Bracket | # Families | Median Income |
| 2-Person Families | 841 (56.2%) | $57,434 |
| 3-Person Families | 300 (20.0%) | $48,750 |
| 4-Person Families | 189 (12.6%) | $79,335 |
| 5-Person Families | 167 (11.2%) | $151,058 |
| 6-Person Families | 0 (0.0%) | $0 |
| 7+ Person Families | 0 (0.0%) | $0 |
| Total | 1,497 (100.0%) | $70,706 |
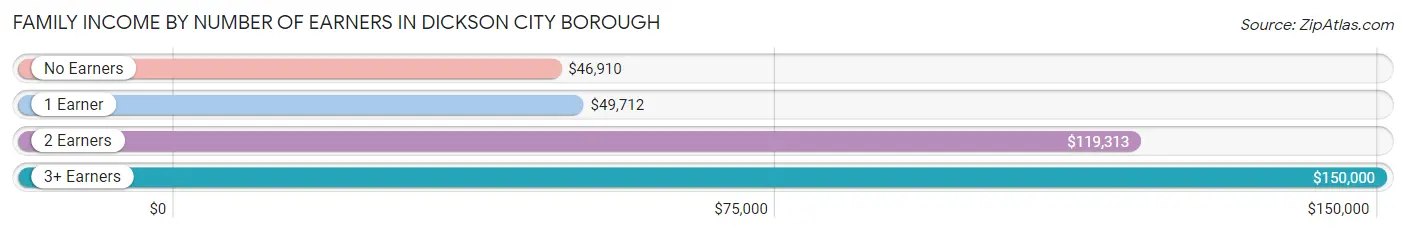
Family Income by Number of Earners in Dickson City borough
The median family income in Dickson City borough is $70,706, with families comprising 3+ earners (124) having the highest median family income of $150,000, while families with no earners (389) have the lowest median family income of $46,910, accounting for 8.3% and 26.0% of families, respectively.
| Number of Earners | # Families | Median Income |
| No Earners | 389 (26.0%) | $46,910 |
| 1 Earner | 541 (36.1%) | $49,712 |
| 2 Earners | 443 (29.6%) | $119,313 |
| 3+ Earners | 124 (8.3%) | $150,000 |
| Total | 1,497 (100.0%) | $70,706 |
Household Income in Dickson City borough
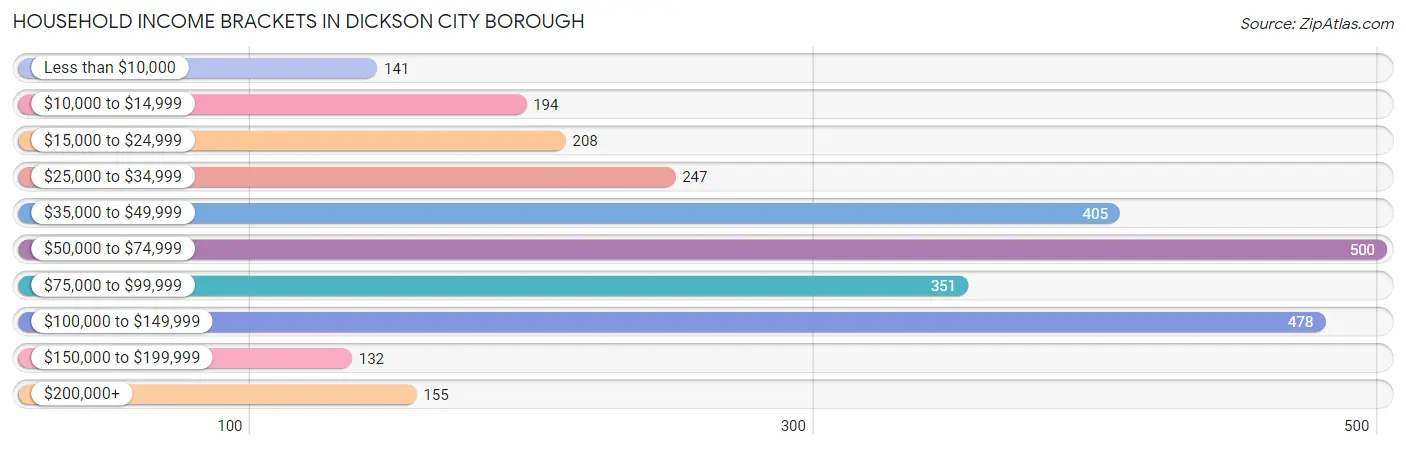
Household Income Brackets in Dickson City borough
With 500 households falling in the category, the $50,000 to $74,999 income range is the most frequent in Dickson City borough, accounting for 17.8% of all households. In contrast, only 132 households (4.7%) fall into the $150,000 to $199,999 income bracket, making it the least populous group.
| Income Bracket | # Households | % Households |
| Less than $10,000 | 141 | 5.0% |
| $10,000 to $14,999 | 194 | 6.9% |
| $15,000 to $24,999 | 208 | 7.4% |
| $25,000 to $34,999 | 247 | 8.8% |
| $35,000 to $49,999 | 405 | 14.4% |
| $50,000 to $74,999 | 500 | 17.8% |
| $75,000 to $99,999 | 351 | 12.5% |
| $100,000 to $149,999 | 478 | 17.0% |
| $150,000 to $199,999 | 132 | 4.7% |
| $200,000+ | 155 | 5.5% |
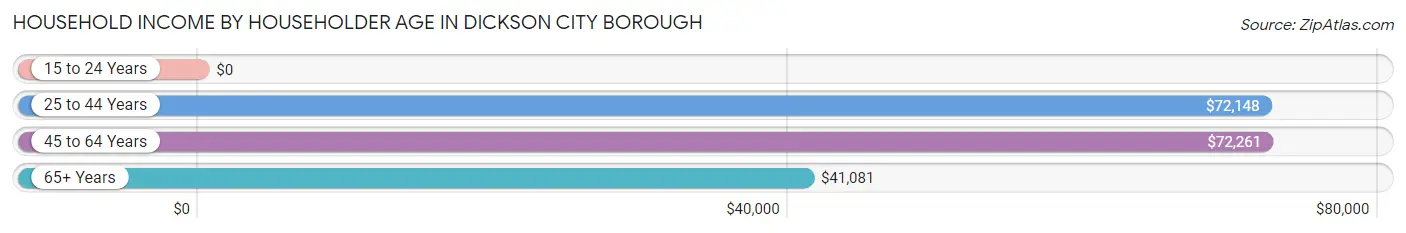
Household Income by Householder Age in Dickson City borough
The median household income in Dickson City borough is $56,679, with the highest median household income of $72,261 found in the 45 to 64 years age bracket for the primary householder. A total of 1,091 households (38.8%) fall into this category. Meanwhile, the 15 to 24 years age bracket for the primary householder has the lowest median household income of $0, with 26 households (0.9%) in this group.
| Income Bracket | # Households | Median Income |
| 15 to 24 Years | 26 (0.9%) | $0 |
| 25 to 44 Years | 779 (27.7%) | $72,148 |
| 45 to 64 Years | 1,091 (38.8%) | $72,261 |
| 65+ Years | 915 (32.6%) | $41,081 |
| Total | 2,811 (100.0%) | $56,679 |
Poverty in Dickson City borough
Income Below Poverty by Sex and Age in Dickson City borough
With 9.1% poverty level for males and 14.9% for females among the residents of Dickson City borough, 6 to 11 year old males and 25 to 34 year old females are the most vulnerable to poverty, with 85 males (36.5%) and 137 females (45.4%) in their respective age groups living below the poverty level.
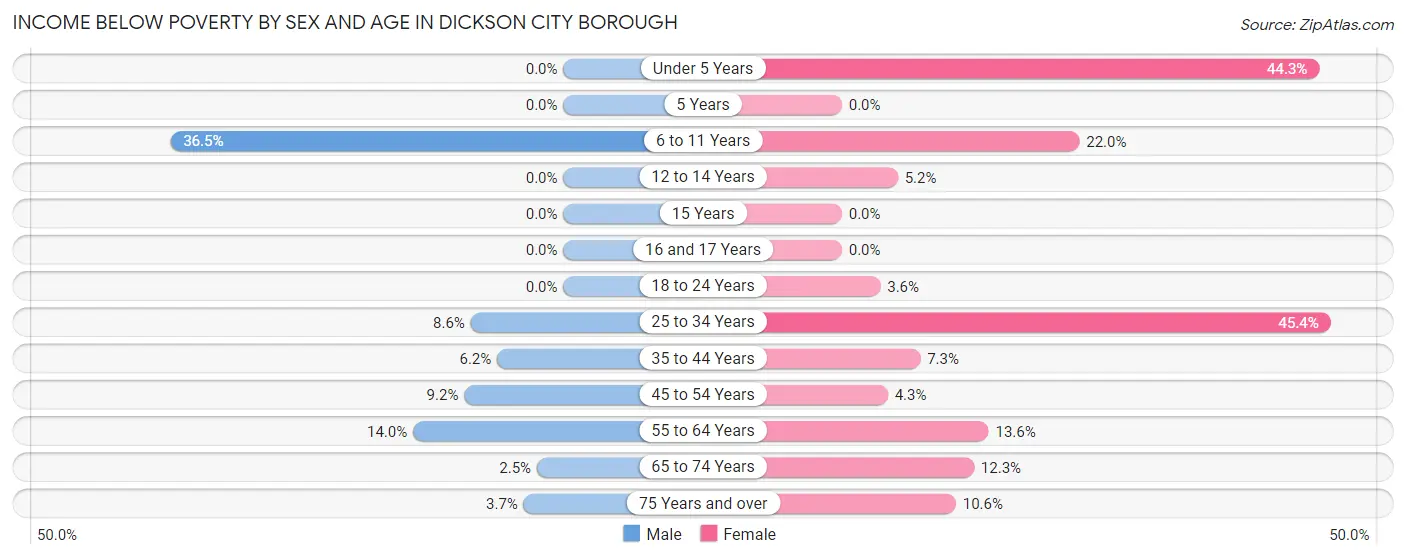
| Age Bracket | Male | Female |
| Under 5 Years | 0 (0.0%) | 70 (44.3%) |
| 5 Years | 0 (0.0%) | 0 (0.0%) |
| 6 to 11 Years | 85 (36.5%) | 67 (22.0%) |
| 12 to 14 Years | 0 (0.0%) | 11 (5.2%) |
| 15 Years | 0 (0.0%) | 0 (0.0%) |
| 16 and 17 Years | 0 (0.0%) | 0 (0.0%) |
| 18 to 24 Years | 0 (0.0%) | 3 (3.6%) |
| 25 to 34 Years | 30 (8.6%) | 137 (45.4%) |
| 35 to 44 Years | 24 (6.1%) | 27 (7.3%) |
| 45 to 54 Years | 38 (9.2%) | 21 (4.3%) |
| 55 to 64 Years | 54 (14.0%) | 58 (13.6%) |
| 65 to 74 Years | 7 (2.5%) | 51 (12.3%) |
| 75 Years and over | 11 (3.7%) | 42 (10.6%) |
| Total | 249 (9.1%) | 487 (14.9%) |
Income Above Poverty by Sex and Age in Dickson City borough
According to the poverty statistics in Dickson City borough, males aged under 5 years and females aged 15 years are the age groups that are most secure financially, with 100.0% of males and 100.0% of females in these age groups living above the poverty line.
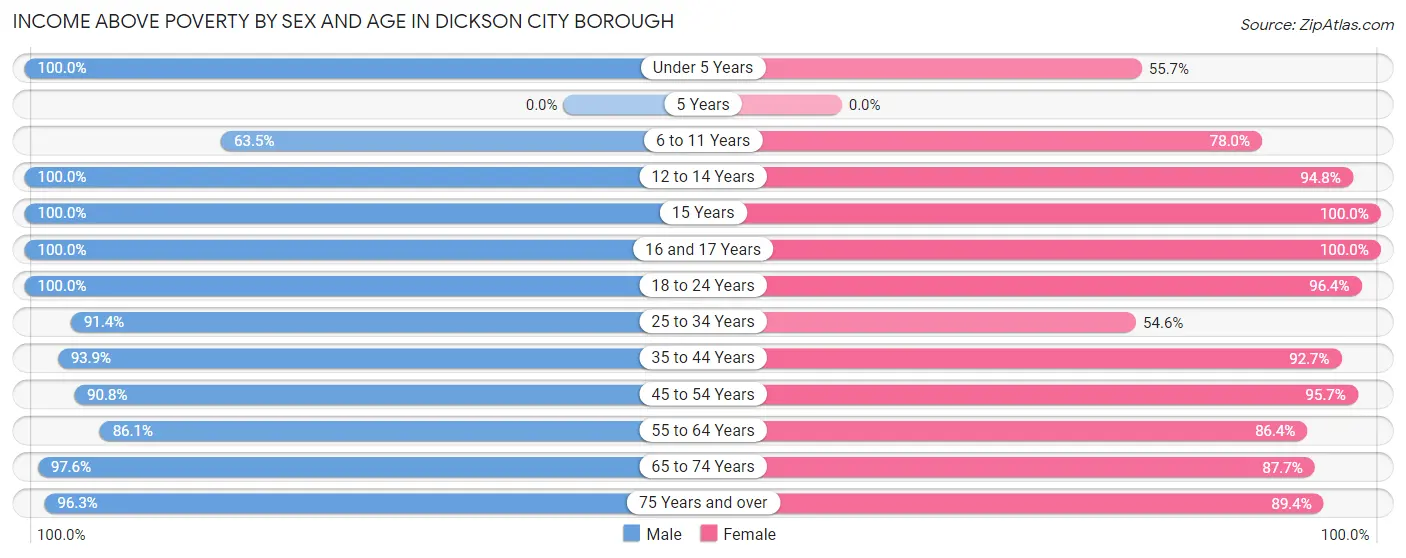
| Age Bracket | Male | Female |
| Under 5 Years | 138 (100.0%) | 88 (55.7%) |
| 5 Years | 0 (0.0%) | 0 (0.0%) |
| 6 to 11 Years | 148 (63.5%) | 237 (78.0%) |
| 12 to 14 Years | 110 (100.0%) | 201 (94.8%) |
| 15 Years | 24 (100.0%) | 15 (100.0%) |
| 16 and 17 Years | 23 (100.0%) | 93 (100.0%) |
| 18 to 24 Years | 87 (100.0%) | 81 (96.4%) |
| 25 to 34 Years | 319 (91.4%) | 165 (54.6%) |
| 35 to 44 Years | 366 (93.9%) | 344 (92.7%) |
| 45 to 54 Years | 375 (90.8%) | 472 (95.7%) |
| 55 to 64 Years | 333 (86.1%) | 368 (86.4%) |
| 65 to 74 Years | 279 (97.6%) | 365 (87.7%) |
| 75 Years and over | 288 (96.3%) | 355 (89.4%) |
| Total | 2,490 (90.9%) | 2,784 (85.1%) |
Income Below Poverty Among Married-Couple Families in Dickson City borough
The poverty statistics for married-couple families in Dickson City borough show that 2.8% or 29 of the total 1,025 families live below the poverty line. Families with 3 or 4 children have the highest poverty rate of 5.6%, comprising of 9 families. On the other hand, families with 1 or 2 children have the lowest poverty rate of 0.0%, which includes 0 families.
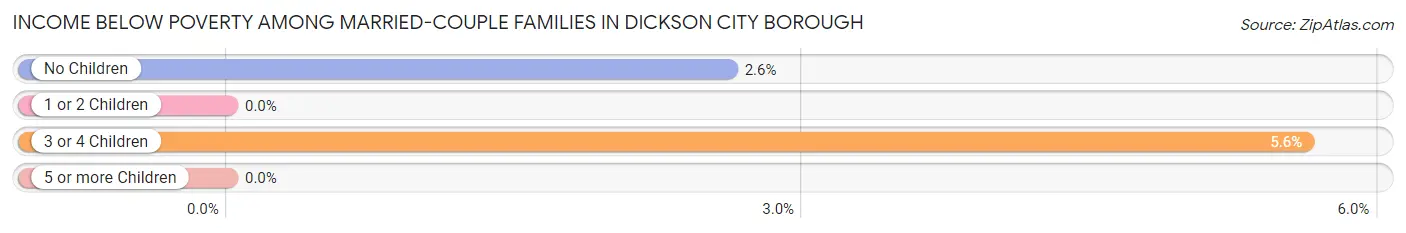
| Children | Above Poverty | Below Poverty |
| No Children | 746 (97.4%) | 20 (2.6%) |
| 1 or 2 Children | 99 (100.0%) | 0 (0.0%) |
| 3 or 4 Children | 151 (94.4%) | 9 (5.6%) |
| 5 or more Children | 0 (0.0%) | 0 (0.0%) |
| Total | 996 (97.2%) | 29 (2.8%) |
Income Below Poverty Among Single-Parent Households in Dickson City borough
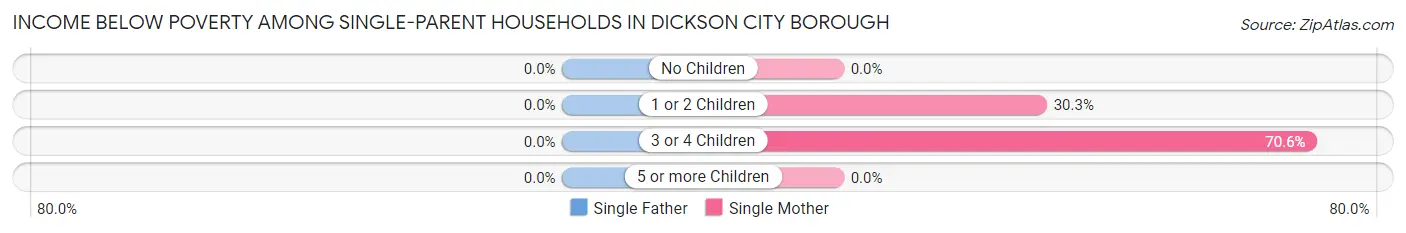
| Children | Single Father | Single Mother |
| No Children | 0 (0.0%) | 0 (0.0%) |
| 1 or 2 Children | 0 (0.0%) | 59 (30.3%) |
| 3 or 4 Children | 0 (0.0%) | 24 (70.6%) |
| 5 or more Children | 0 (0.0%) | 0 (0.0%) |
| Total | 0 (0.0%) | 83 (28.0%) |
Income Below Poverty Among Married-Couple vs Single-Parent Households in Dickson City borough
The poverty data for Dickson City borough shows that 29 of the married-couple family households (2.8%) and 83 of the single-parent households (17.6%) are living below the poverty level. Within the married-couple family households, those with 3 or 4 children have the highest poverty rate, with 9 households (5.6%) falling below the poverty line. Among the single-parent households, those with 3 or 4 children have the highest poverty rate, with 24 household (70.6%) living below poverty.
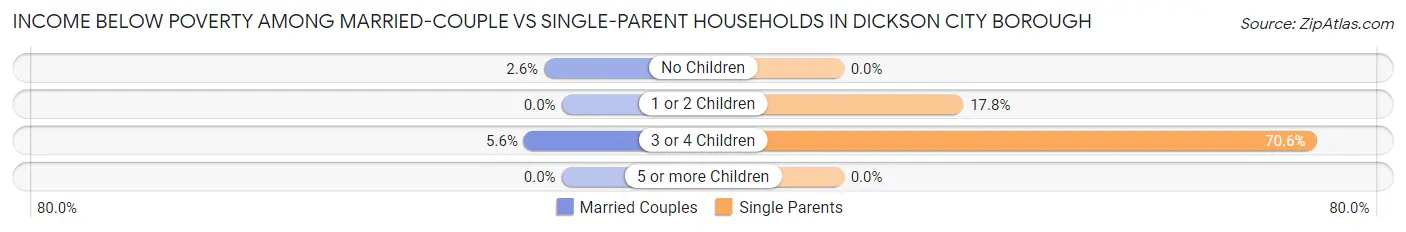
| Children | Married-Couple Families | Single-Parent Households |
| No Children | 20 (2.6%) | 0 (0.0%) |
| 1 or 2 Children | 0 (0.0%) | 59 (17.8%) |
| 3 or 4 Children | 9 (5.6%) | 24 (70.6%) |
| 5 or more Children | 0 (0.0%) | 0 (0.0%) |
| Total | 29 (2.8%) | 83 (17.6%) |
Race in Dickson City borough
The most populous races in Dickson City borough are White / Caucasian (5,654 | 93.8%), Hispanic or Latino (219 | 3.6%), and Two or more Races (169 | 2.8%).
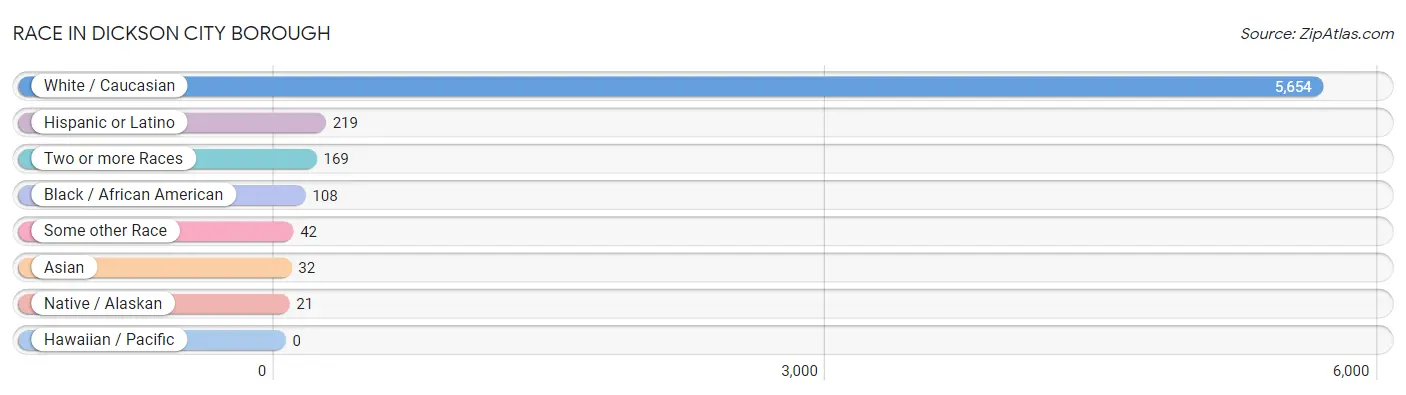
| Race | # Population | % Population |
| Asian | 32 | 0.5% |
| Black / African American | 108 | 1.8% |
| Hawaiian / Pacific | 0 | 0.0% |
| Hispanic or Latino | 219 | 3.6% |
| Native / Alaskan | 21 | 0.4% |
| White / Caucasian | 5,654 | 93.8% |
| Two or more Races | 169 | 2.8% |
| Some other Race | 42 | 0.7% |
| Total | 6,026 | 100.0% |
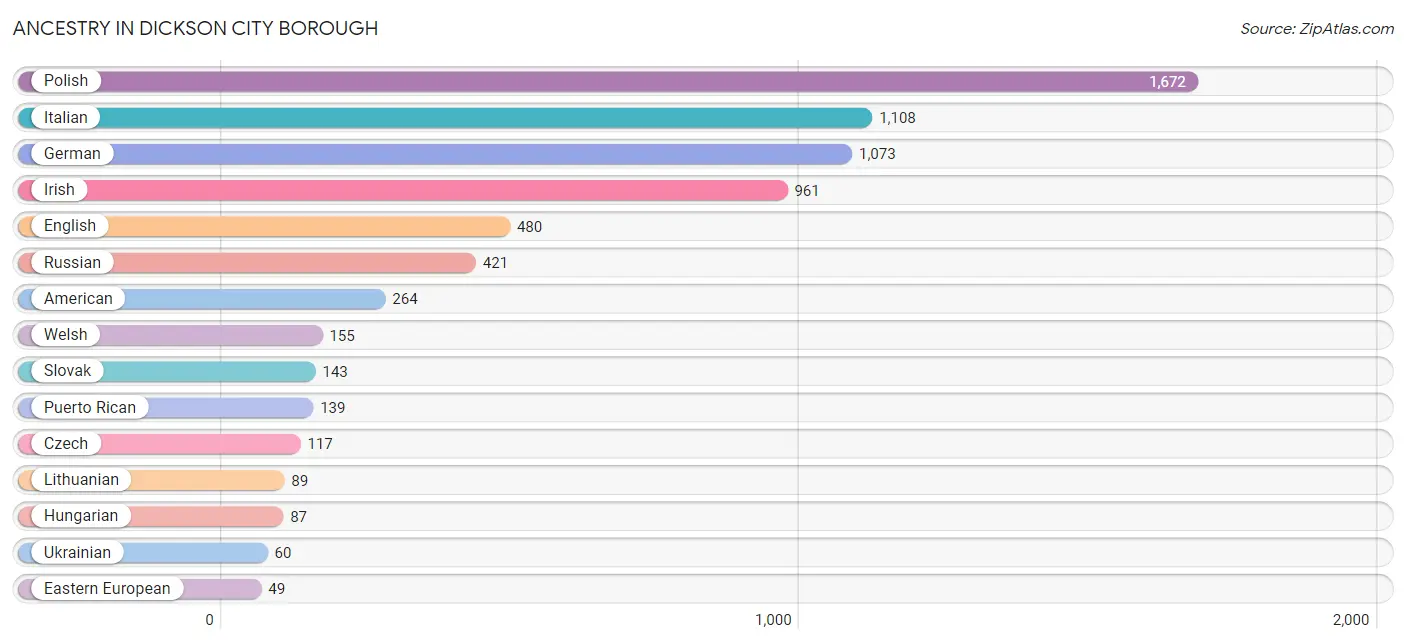
Ancestry in Dickson City borough
The most populous ancestries reported in Dickson City borough are Polish (1,672 | 27.8%), Italian (1,108 | 18.4%), German (1,073 | 17.8%), Irish (961 | 16.0%), and English (480 | 8.0%), together accounting for 87.9% of all Dickson City borough residents.
| Ancestry | # Population | % Population |
| American | 264 | 4.4% |
| Austrian | 3 | 0.1% |
| Brazilian | 31 | 0.5% |
| British | 7 | 0.1% |
| Central American | 1 | 0.0% |
| Colombian | 17 | 0.3% |
| Czech | 117 | 1.9% |
| Czechoslovakian | 12 | 0.2% |
| Danish | 2 | 0.0% |
| Dominican | 46 | 0.8% |
| Dutch | 8 | 0.1% |
| Eastern European | 49 | 0.8% |
| Ecuadorian | 15 | 0.3% |
| English | 480 | 8.0% |
| European | 26 | 0.4% |
| French | 19 | 0.3% |
| German | 1,073 | 17.8% |
| Greek | 9 | 0.2% |
| Guatemalan | 1 | 0.0% |
| Hungarian | 87 | 1.4% |
| Indian (Asian) | 22 | 0.4% |
| Irish | 961 | 16.0% |
| Italian | 1,108 | 18.4% |
| Jamaican | 1 | 0.0% |
| Lithuanian | 89 | 1.5% |
| Lumbee | 9 | 0.2% |
| Navajo | 2 | 0.0% |
| Pennsylvania German | 13 | 0.2% |
| Polish | 1,672 | 27.8% |
| Puerto Rican | 139 | 2.3% |
| Russian | 421 | 7.0% |
| Scandinavian | 9 | 0.2% |
| Scotch-Irish | 9 | 0.2% |
| Scottish | 23 | 0.4% |
| Slovak | 143 | 2.4% |
| South American | 32 | 0.5% |
| South American Indian | 15 | 0.3% |
| Swedish | 12 | 0.2% |
| Swiss | 9 | 0.2% |
| Thai | 10 | 0.2% |
| Ukrainian | 60 | 1.0% |
| Welsh | 155 | 2.6% | View All 42 Rows |
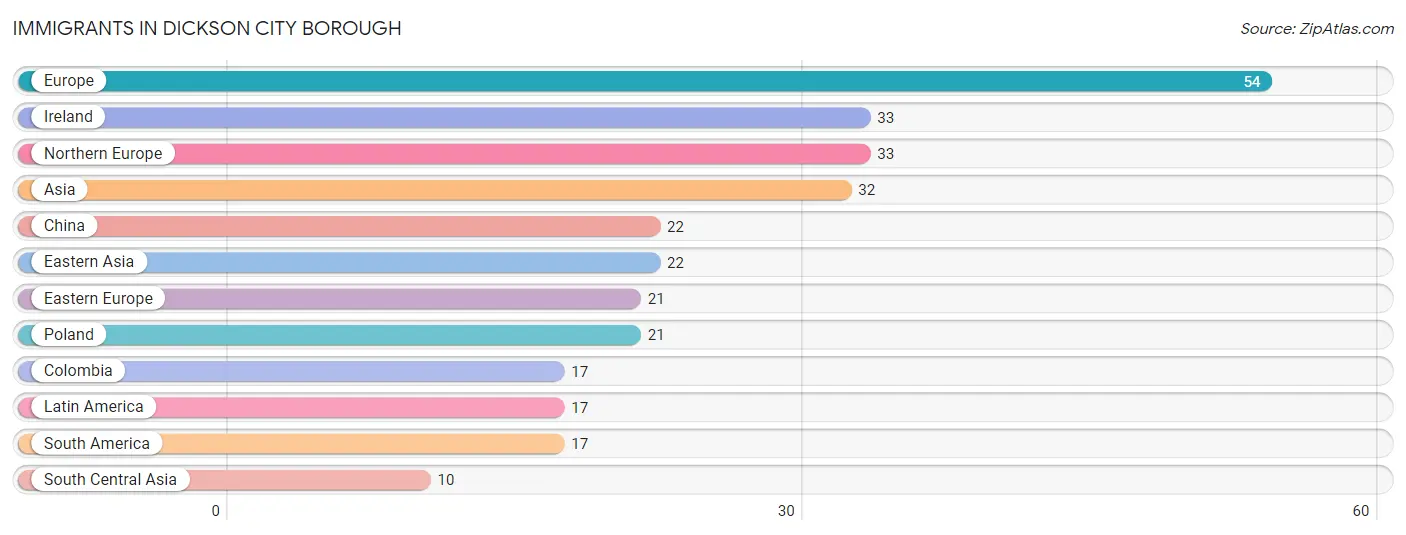
Immigrants in Dickson City borough
The most numerous immigrant groups reported in Dickson City borough came from Europe (54 | 0.9%), Ireland (33 | 0.5%), Northern Europe (33 | 0.5%), Asia (32 | 0.5%), and China (22 | 0.4%), together accounting for 2.9% of all Dickson City borough residents.
| Immigration Origin | # Population | % Population |
| Asia | 32 | 0.5% |
| China | 22 | 0.4% |
| Colombia | 17 | 0.3% |
| Eastern Asia | 22 | 0.4% |
| Eastern Europe | 21 | 0.4% |
| Europe | 54 | 0.9% |
| Ireland | 33 | 0.5% |
| Latin America | 17 | 0.3% |
| Northern Europe | 33 | 0.5% |
| Poland | 21 | 0.4% |
| South America | 17 | 0.3% |
| South Central Asia | 10 | 0.2% | View All 12 Rows |
Sex and Age in Dickson City borough
Sex and Age in Dickson City borough
The most populous age groups in Dickson City borough are 40 to 44 Years (283 | 10.3%) for men and 10 to 14 Years (325 | 9.9%) for women.
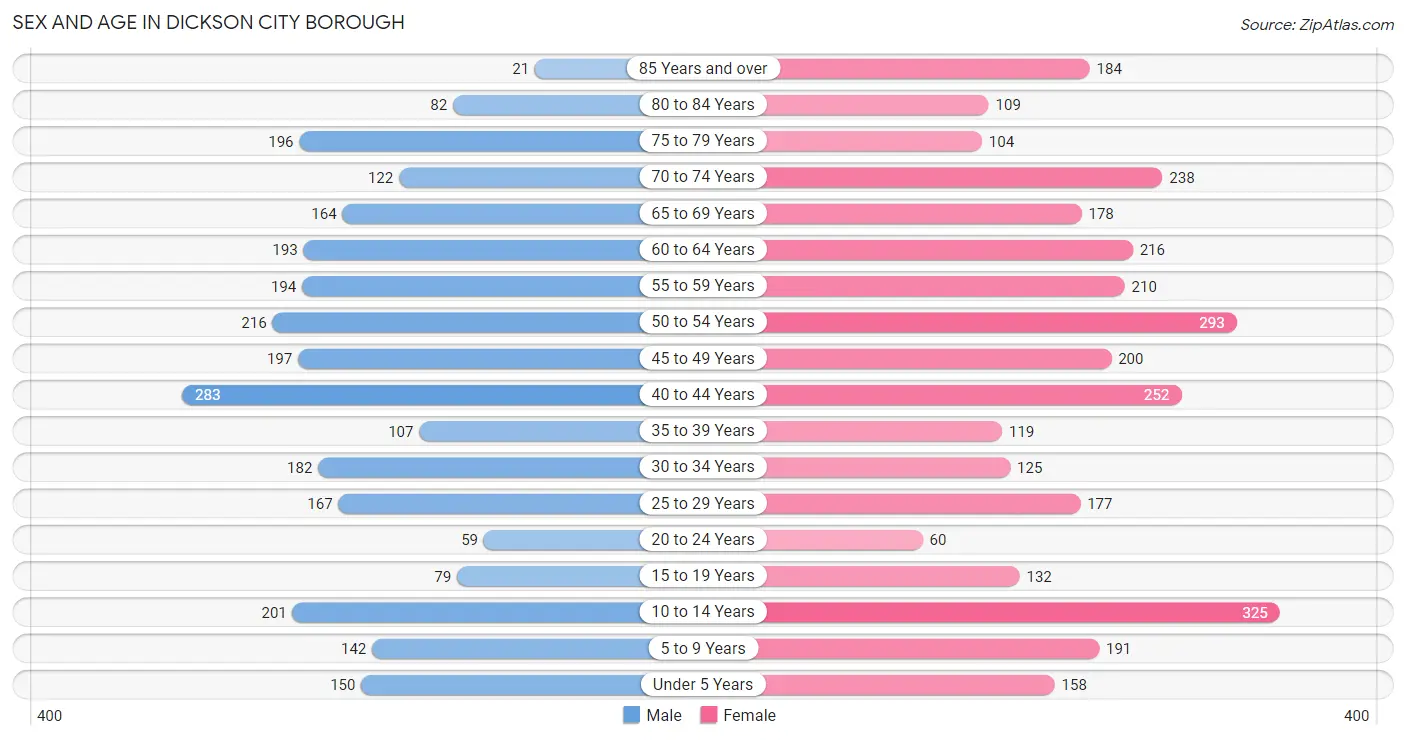
| Age Bracket | Male | Female |
| Under 5 Years | 150 (5.4%) | 158 (4.8%) |
| 5 to 9 Years | 142 (5.1%) | 191 (5.8%) |
| 10 to 14 Years | 201 (7.3%) | 325 (9.9%) |
| 15 to 19 Years | 79 (2.9%) | 132 (4.0%) |
| 20 to 24 Years | 59 (2.1%) | 60 (1.8%) |
| 25 to 29 Years | 167 (6.1%) | 177 (5.4%) |
| 30 to 34 Years | 182 (6.6%) | 125 (3.8%) |
| 35 to 39 Years | 107 (3.9%) | 119 (3.6%) |
| 40 to 44 Years | 283 (10.3%) | 252 (7.7%) |
| 45 to 49 Years | 197 (7.1%) | 200 (6.1%) |
| 50 to 54 Years | 216 (7.8%) | 293 (9.0%) |
| 55 to 59 Years | 194 (7.0%) | 210 (6.4%) |
| 60 to 64 Years | 193 (7.0%) | 216 (6.6%) |
| 65 to 69 Years | 164 (5.9%) | 178 (5.4%) |
| 70 to 74 Years | 122 (4.4%) | 238 (7.3%) |
| 75 to 79 Years | 196 (7.1%) | 104 (3.2%) |
| 80 to 84 Years | 82 (3.0%) | 109 (3.3%) |
| 85 Years and over | 21 (0.8%) | 184 (5.6%) |
| Total | 2,755 (100.0%) | 3,271 (100.0%) |
Families and Households in Dickson City borough
Median Family Size in Dickson City borough
The median family size in Dickson City borough is 2.82 persons per family, with single male/father families (176 | 11.8%) accounting for the largest median family size of 2.97 persons per family. On the other hand, single female/mother families (296 | 19.8%) represent the smallest median family size with 2.66 persons per family.
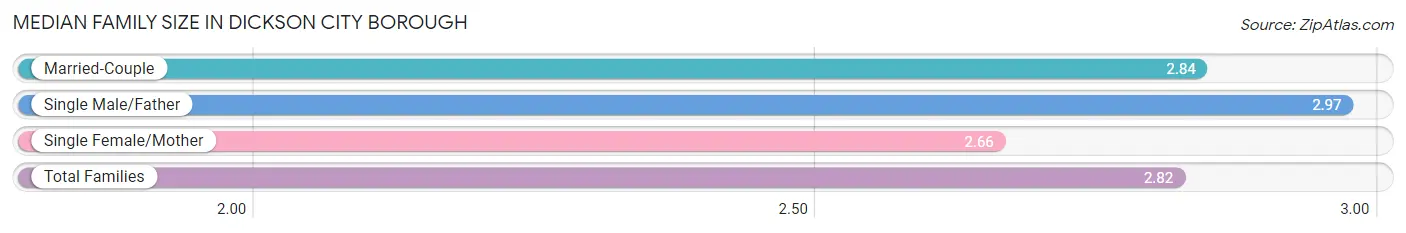
| Family Type | # Families | Family Size |
| Married-Couple | 1,025 (68.5%) | 2.84 |
| Single Male/Father | 176 (11.8%) | 2.97 |
| Single Female/Mother | 296 (19.8%) | 2.66 |
| Total Families | 1,497 (100.0%) | 2.82 |
Median Household Size in Dickson City borough
The median household size in Dickson City borough is 2.14 persons per household, with single male/father households (176 | 6.3%) accounting for the largest median household size of 3.57 persons per household. non-family households (1,314 | 46.7%) represent the smallest median household size with 1.26 persons per household.
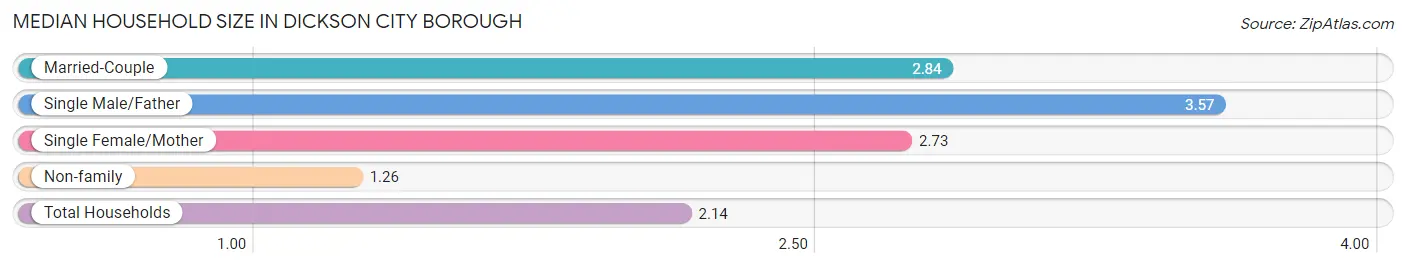
| Household Type | # Households | Household Size |
| Married-Couple | 1,025 (36.5%) | 2.84 |
| Single Male/Father | 176 (6.3%) | 3.57 |
| Single Female/Mother | 296 (10.5%) | 2.73 |
| Non-family | 1,314 (46.7%) | 1.26 |
| Total Households | 2,811 (100.0%) | 2.14 |
Household Size by Marriage Status in Dickson City borough
Out of a total of 2,811 households in Dickson City borough, 1,497 (53.3%) are family households, while 1,314 (46.7%) are nonfamily households. The most numerous type of family households are 2-person households, comprising 836, and the most common type of nonfamily households are 1-person households, comprising 984.
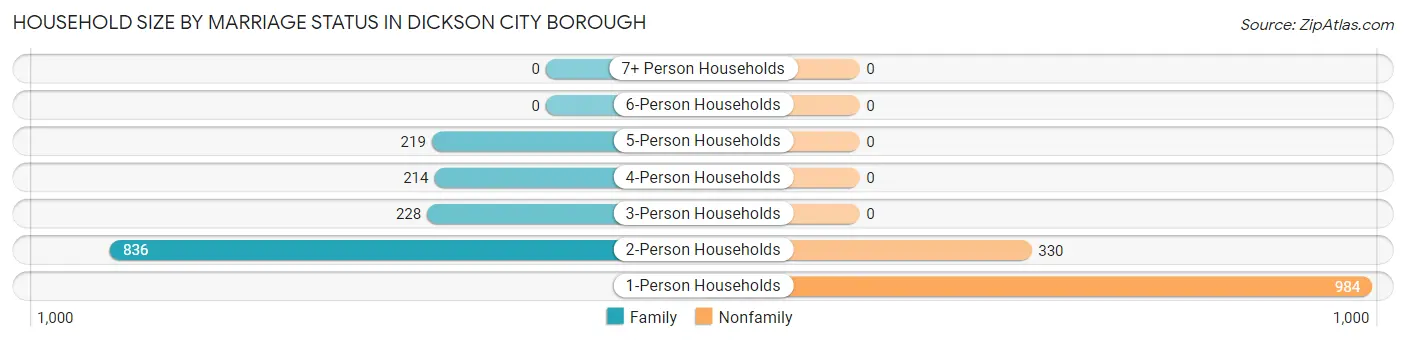
| Household Size | Family Households | Nonfamily Households |
| 1-Person Households | - | 984 (35.0%) |
| 2-Person Households | 836 (29.7%) | 330 (11.7%) |
| 3-Person Households | 228 (8.1%) | 0 (0.0%) |
| 4-Person Households | 214 (7.6%) | 0 (0.0%) |
| 5-Person Households | 219 (7.8%) | 0 (0.0%) |
| 6-Person Households | 0 (0.0%) | 0 (0.0%) |
| 7+ Person Households | 0 (0.0%) | 0 (0.0%) |
| Total | 1,497 (53.3%) | 1,314 (46.7%) |
Female Fertility in Dickson City borough
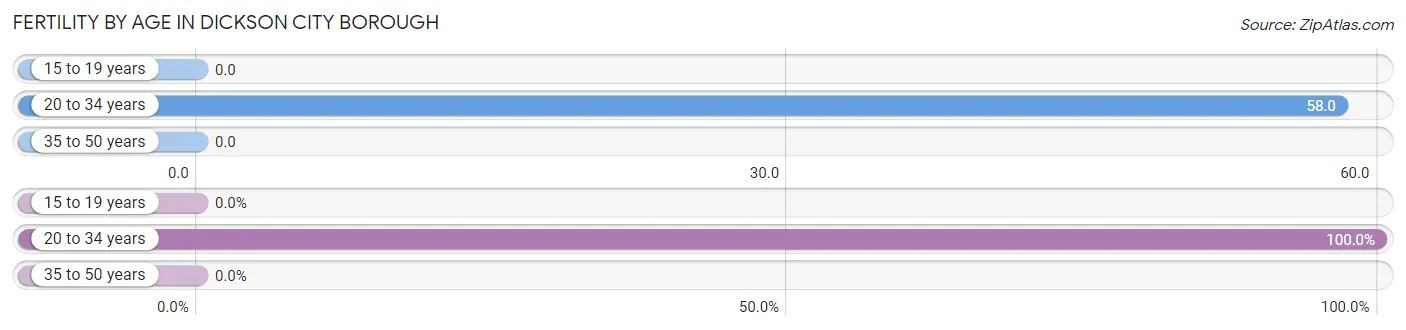
Fertility by Age in Dickson City borough
Average fertility rate in Dickson City borough is 19.0 births per 1,000 women. Women in the age bracket of 20 to 34 years have the highest fertility rate with 58.0 births per 1,000 women. Women in the age bracket of 20 to 34 years acount for 100.0% of all women with births.
| Age Bracket | Women with Births | Births / 1,000 Women |
| 15 to 19 years | 0 (0.0%) | 0.0 |
| 20 to 34 years | 21 (100.0%) | 58.0 |
| 35 to 50 years | 0 (0.0%) | 0.0 |
| Total | 21 (100.0%) | 19.0 |
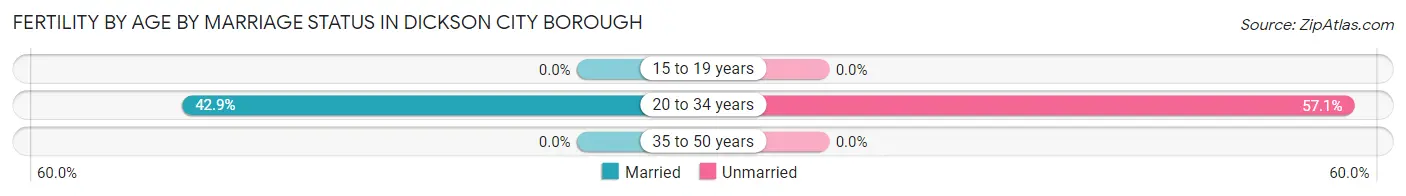
Fertility by Age by Marriage Status in Dickson City borough
42.9% of women with births (21) in Dickson City borough are married. The highest percentage of unmarried women with births falls into 20 to 34 years age bracket with 57.1% of them unmarried at the time of birth, while the lowest percentage of unmarried women with births belong to 20 to 34 years age bracket with 57.1% of them unmarried.
| Age Bracket | Married | Unmarried |
| 15 to 19 years | 0 (0.0%) | 0 (0.0%) |
| 20 to 34 years | 9 (42.9%) | 12 (57.1%) |
| 35 to 50 years | 0 (0.0%) | 0 (0.0%) |
| Total | 9 (42.9%) | 12 (57.1%) |
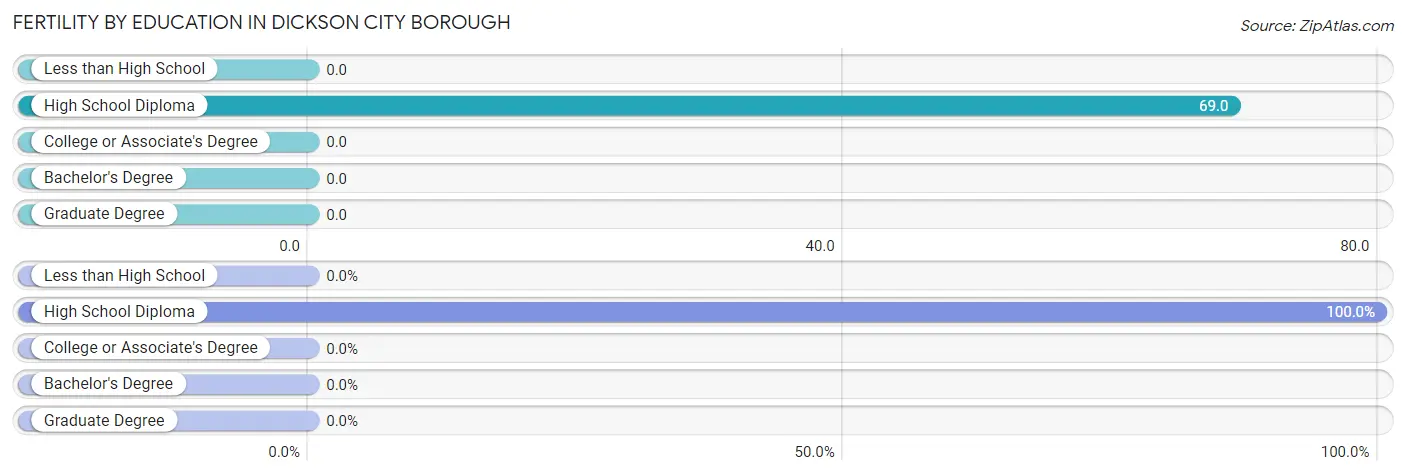
Fertility by Education in Dickson City borough
| Educational Attainment | Women with Births | Births / 1,000 Women |
| Less than High School | 0 (0.0%) | 0.0 |
| High School Diploma | 21 (100.0%) | 69.0 |
| College or Associate's Degree | 0 (0.0%) | 0.0 |
| Bachelor's Degree | 0 (0.0%) | 0.0 |
| Graduate Degree | 0 (0.0%) | 0.0 |
| Total | 21 (100.0%) | 19.0 |
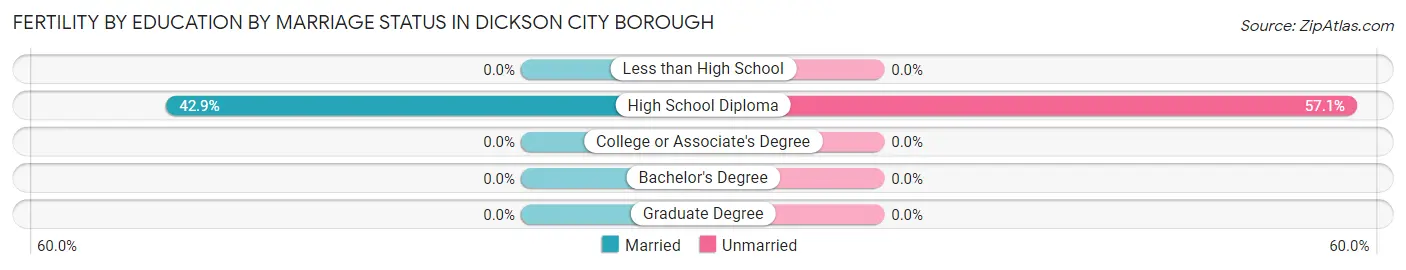
Fertility by Education by Marriage Status in Dickson City borough
57.1% of women with births in Dickson City borough are unmarried. Women with the educational attainment of high school diploma are most likely to be married with 42.9% of them married at childbirth, while women with the educational attainment of high school diploma are least likely to be married with 57.1% of them unmarried at childbirth.
| Educational Attainment | Married | Unmarried |
| Less than High School | 0 (0.0%) | 0 (0.0%) |
| High School Diploma | 9 (42.9%) | 12 (57.1%) |
| College or Associate's Degree | 0 (0.0%) | 0 (0.0%) |
| Bachelor's Degree | 0 (0.0%) | 0 (0.0%) |
| Graduate Degree | 0 (0.0%) | 0 (0.0%) |
| Total | 9 (42.9%) | 12 (57.1%) |
Employment Characteristics in Dickson City borough
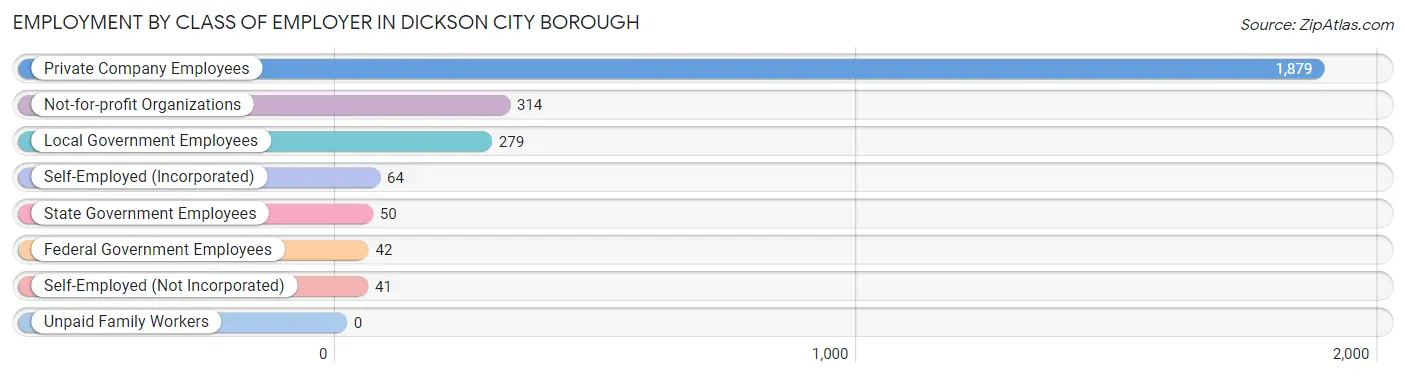
Employment by Class of Employer in Dickson City borough
Among the 2,669 employed individuals in Dickson City borough, private company employees (1,879 | 70.4%), not-for-profit organizations (314 | 11.8%), and local government employees (279 | 10.4%) make up the most common classes of employment.
| Employer Class | # Employees | % Employees |
| Private Company Employees | 1,879 | 70.4% |
| Self-Employed (Incorporated) | 64 | 2.4% |
| Self-Employed (Not Incorporated) | 41 | 1.5% |
| Not-for-profit Organizations | 314 | 11.8% |
| Local Government Employees | 279 | 10.4% |
| State Government Employees | 50 | 1.9% |
| Federal Government Employees | 42 | 1.6% |
| Unpaid Family Workers | 0 | 0.0% |
| Total | 2,669 | 100.0% |
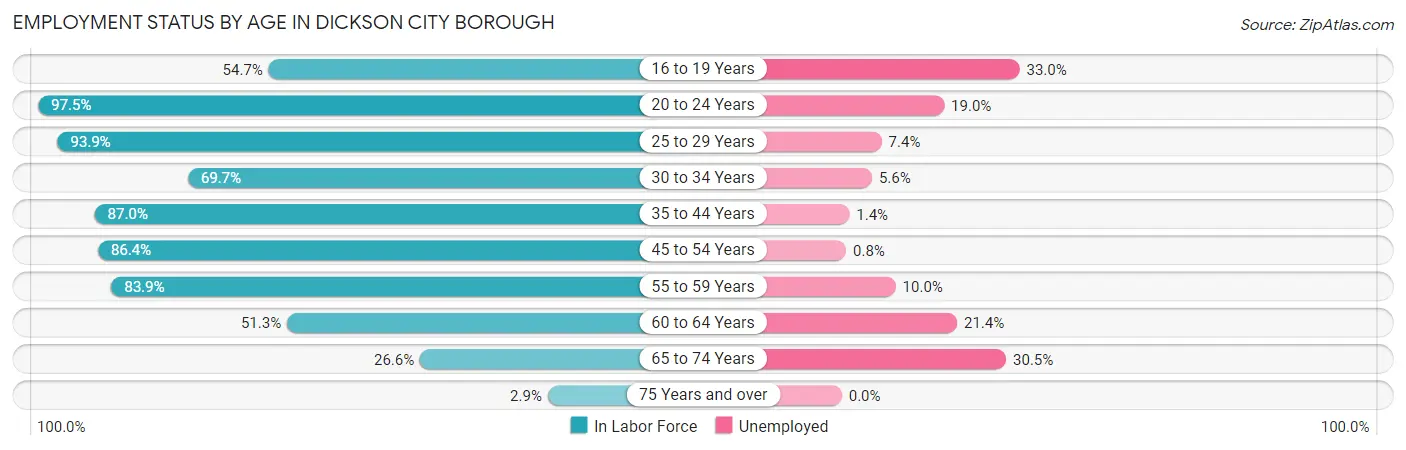
Employment Status by Age in Dickson City borough
According to the labor force statistics for Dickson City borough, out of the total population over 16 years of age (4,820), 61.2% or 2,950 individuals are in the labor force, with 8.1% or 239 of them unemployed. The age group with the highest labor force participation rate is 20 to 24 years, with 97.5% or 116 individuals in the labor force. Within the labor force, the 16 to 19 years age range has the highest percentage of unemployed individuals, with 33.0% or 31 of them being unemployed.
| Age Bracket | In Labor Force | Unemployed |
| 16 to 19 Years | 94 (54.7%) | 31 (33.0%) |
| 20 to 24 Years | 116 (97.5%) | 22 (19.0%) |
| 25 to 29 Years | 323 (93.9%) | 24 (7.4%) |
| 30 to 34 Years | 214 (69.7%) | 12 (5.6%) |
| 35 to 44 Years | 662 (87.0%) | 9 (1.4%) |
| 45 to 54 Years | 783 (86.4%) | 6 (0.8%) |
| 55 to 59 Years | 339 (83.9%) | 34 (10.0%) |
| 60 to 64 Years | 210 (51.3%) | 45 (21.4%) |
| 65 to 74 Years | 187 (26.6%) | 57 (30.5%) |
| 75 Years and over | 20 (2.9%) | 0 (0.0%) |
| Total | 2,950 (61.2%) | 239 (8.1%) |
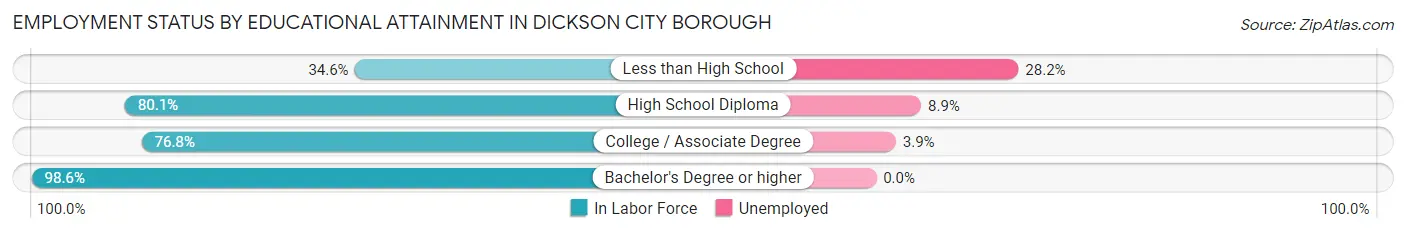
Employment Status by Educational Attainment in Dickson City borough
According to labor force statistics for Dickson City borough, 80.8% of individuals (2,530) out of the total population between 25 and 64 years of age (3,131) are in the labor force, with 5.1% or 129 of them being unemployed. The group with the highest labor force participation rate are those with the educational attainment of bachelor's degree or higher, with 98.6% or 876 individuals in the labor force. Within the labor force, individuals with less than high school education have the highest percentage of unemployment, with 28.2% or 24 of them being unemployed.
| Educational Attainment | In Labor Force | Unemployed |
| Less than High School | 85 (34.6%) | 69 (28.2%) |
| High School Diploma | 896 (80.1%) | 100 (8.9%) |
| College / Associate Degree | 674 (76.8%) | 34 (3.9%) |
| Bachelor's Degree or higher | 876 (98.6%) | 0 (0.0%) |
| Total | 2,530 (80.8%) | 160 (5.1%) |
Employment Occupations by Sex in Dickson City borough
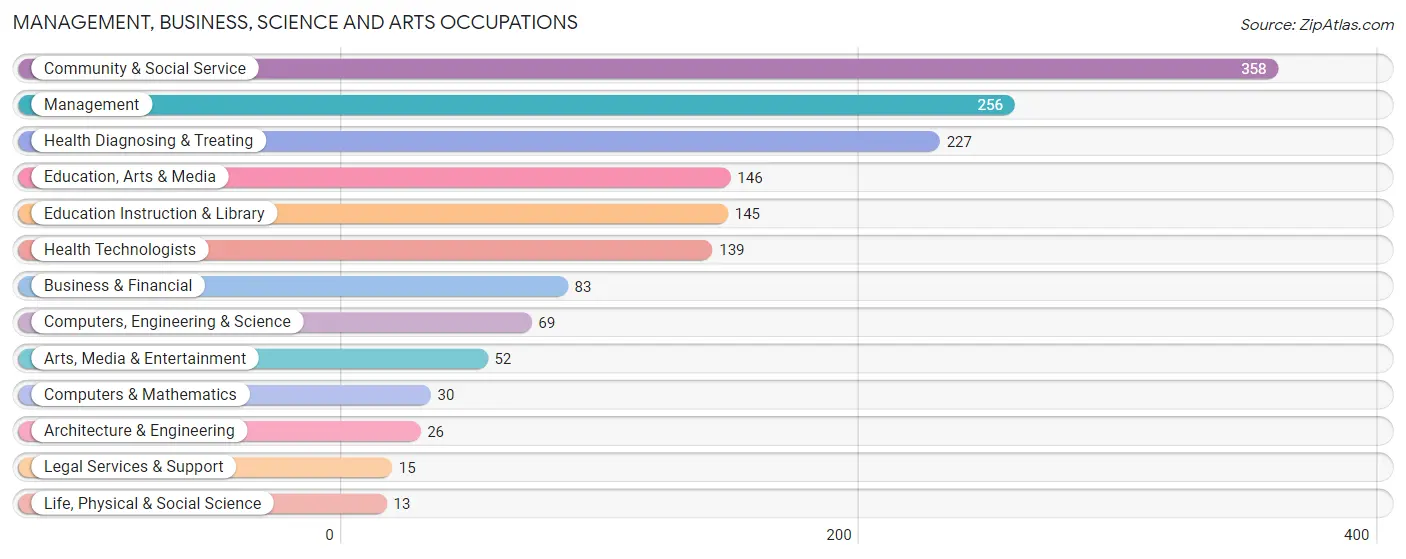
Management, Business, Science and Arts Occupations
The most common Management, Business, Science and Arts occupations in Dickson City borough are Community & Social Service (358 | 13.2%), Management (256 | 9.5%), Health Diagnosing & Treating (227 | 8.4%), Education, Arts & Media (146 | 5.4%), and Education Instruction & Library (145 | 5.3%).
Management, Business, Science and Arts Occupations by Sex
Within the Management, Business, Science and Arts occupations in Dickson City borough, the most male-oriented occupations are Architecture & Engineering (100.0%), Arts, Media & Entertainment (73.1%), and Computers & Mathematics (70.0%), while the most female-oriented occupations are Life, Physical & Social Science (100.0%), Health Technologists (91.4%), and Health Diagnosing & Treating (78.8%).
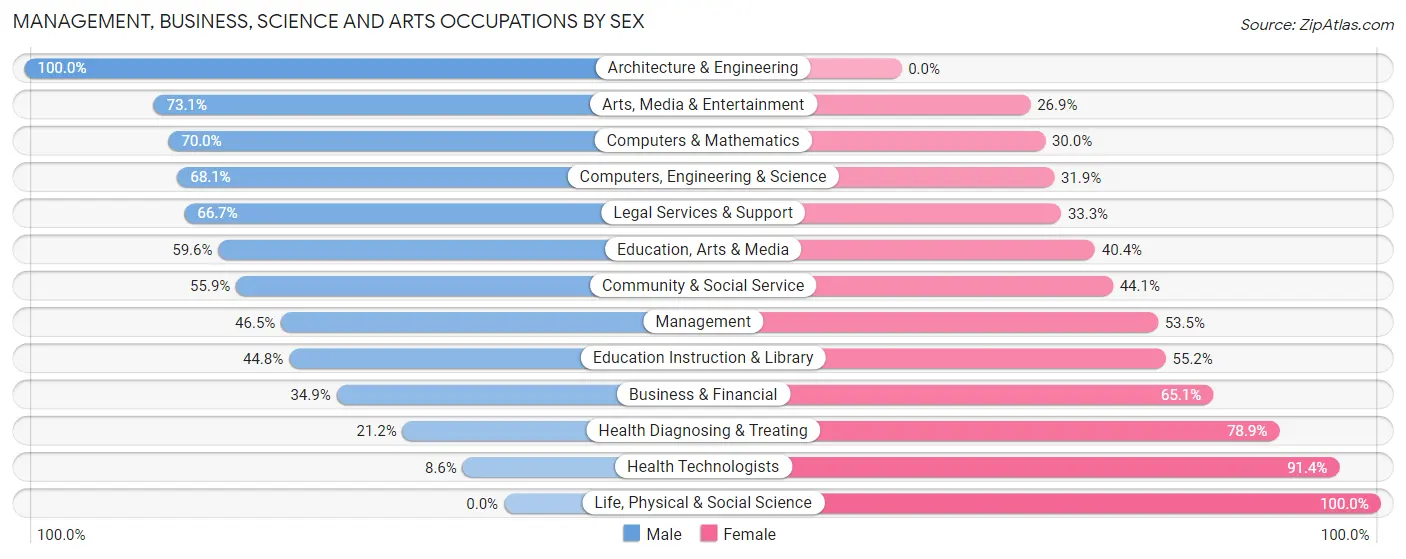
| Occupation | Male | Female |
| Management | 119 (46.5%) | 137 (53.5%) |
| Business & Financial | 29 (34.9%) | 54 (65.1%) |
| Computers, Engineering & Science | 47 (68.1%) | 22 (31.9%) |
| Computers & Mathematics | 21 (70.0%) | 9 (30.0%) |
| Architecture & Engineering | 26 (100.0%) | 0 (0.0%) |
| Life, Physical & Social Science | 0 (0.0%) | 13 (100.0%) |
| Community & Social Service | 200 (55.9%) | 158 (44.1%) |
| Education, Arts & Media | 87 (59.6%) | 59 (40.4%) |
| Legal Services & Support | 10 (66.7%) | 5 (33.3%) |
| Education Instruction & Library | 65 (44.8%) | 80 (55.2%) |
| Arts, Media & Entertainment | 38 (73.1%) | 14 (26.9%) |
| Health Diagnosing & Treating | 48 (21.1%) | 179 (78.8%) |
| Health Technologists | 12 (8.6%) | 127 (91.4%) |
| Total (Category) | 443 (44.6%) | 550 (55.4%) |
| Total (Overall) | 1,376 (50.8%) | 1,332 (49.2%) |
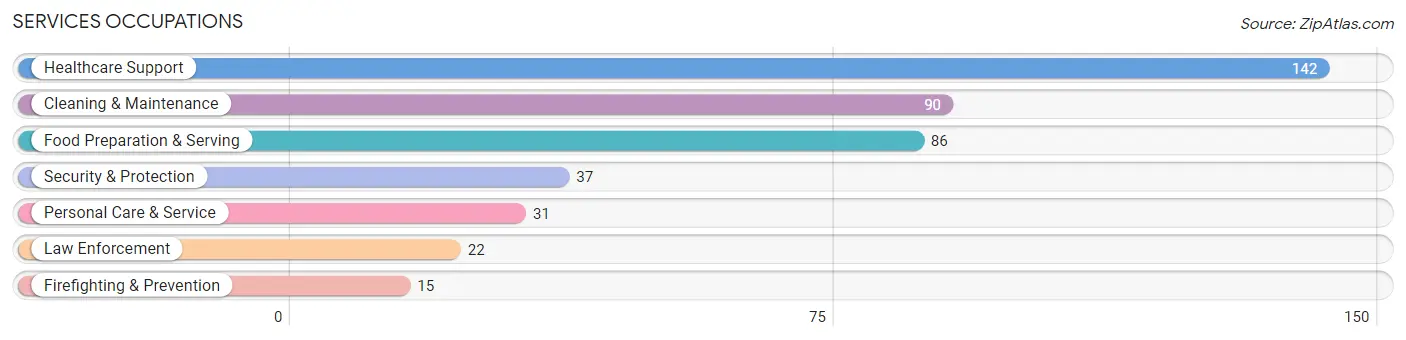
Services Occupations
The most common Services occupations in Dickson City borough are Healthcare Support (142 | 5.2%), Cleaning & Maintenance (90 | 3.3%), Food Preparation & Serving (86 | 3.2%), Security & Protection (37 | 1.4%), and Personal Care & Service (31 | 1.1%).
Services Occupations by Sex
Within the Services occupations in Dickson City borough, the most male-oriented occupations are Security & Protection (100.0%), Firefighting & Prevention (100.0%), and Law Enforcement (100.0%), while the most female-oriented occupations are Healthcare Support (93.0%), Food Preparation & Serving (88.4%), and Personal Care & Service (74.2%).
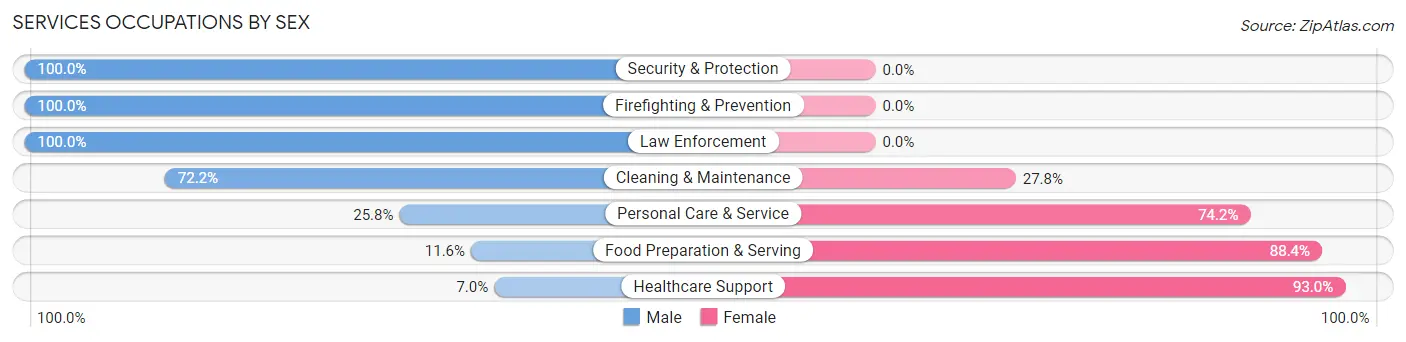
| Occupation | Male | Female |
| Healthcare Support | 10 (7.0%) | 132 (93.0%) |
| Security & Protection | 37 (100.0%) | 0 (0.0%) |
| Firefighting & Prevention | 15 (100.0%) | 0 (0.0%) |
| Law Enforcement | 22 (100.0%) | 0 (0.0%) |
| Food Preparation & Serving | 10 (11.6%) | 76 (88.4%) |
| Cleaning & Maintenance | 65 (72.2%) | 25 (27.8%) |
| Personal Care & Service | 8 (25.8%) | 23 (74.2%) |
| Total (Category) | 130 (33.7%) | 256 (66.3%) |
| Total (Overall) | 1,376 (50.8%) | 1,332 (49.2%) |
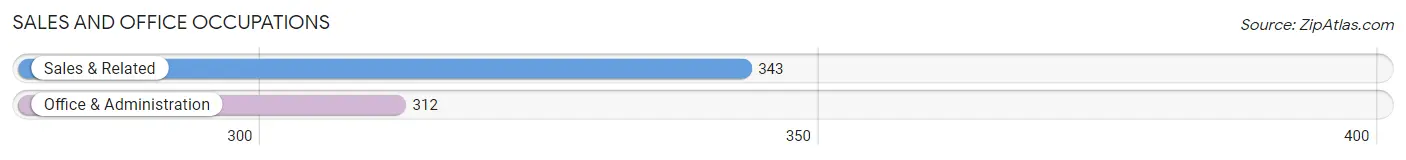
Sales and Office Occupations
The most common Sales and Office occupations in Dickson City borough are Sales & Related (343 | 12.7%), and Office & Administration (312 | 11.5%).
Sales and Office Occupations by Sex
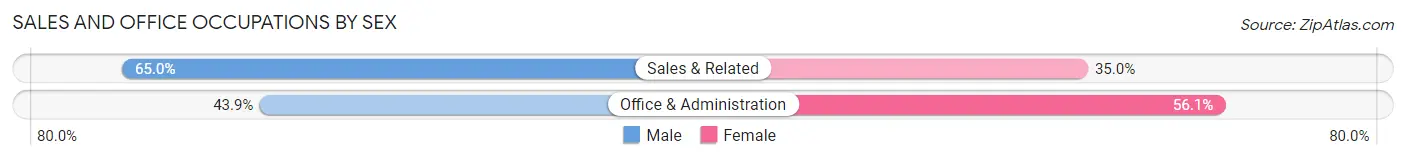
| Occupation | Male | Female |
| Sales & Related | 223 (65.0%) | 120 (35.0%) |
| Office & Administration | 137 (43.9%) | 175 (56.1%) |
| Total (Category) | 360 (55.0%) | 295 (45.0%) |
| Total (Overall) | 1,376 (50.8%) | 1,332 (49.2%) |
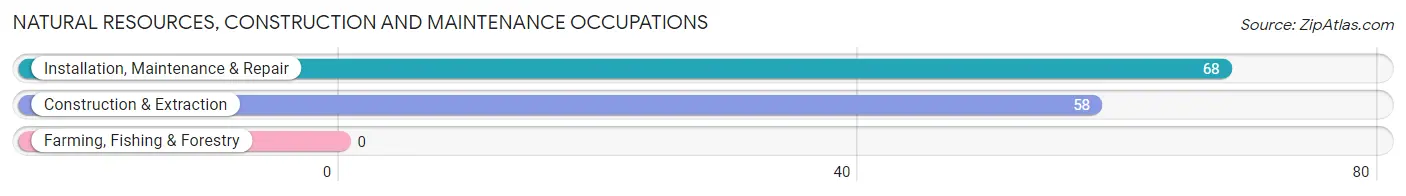
Natural Resources, Construction and Maintenance Occupations
The most common Natural Resources, Construction and Maintenance occupations in Dickson City borough are Installation, Maintenance & Repair (68 | 2.5%), and Construction & Extraction (58 | 2.1%).
Natural Resources, Construction and Maintenance Occupations by Sex
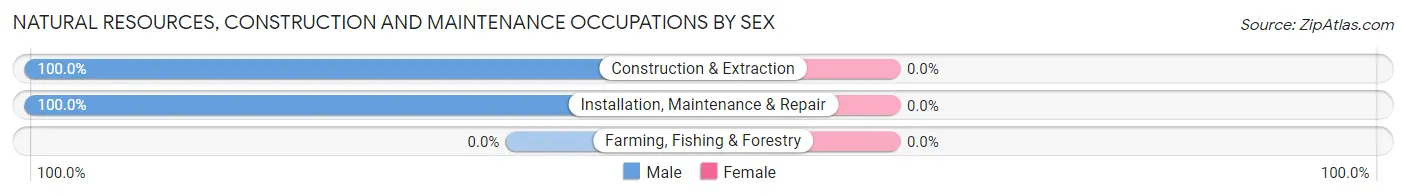
| Occupation | Male | Female |
| Farming, Fishing & Forestry | 0 (0.0%) | 0 (0.0%) |
| Construction & Extraction | 58 (100.0%) | 0 (0.0%) |
| Installation, Maintenance & Repair | 68 (100.0%) | 0 (0.0%) |
| Total (Category) | 126 (100.0%) | 0 (0.0%) |
| Total (Overall) | 1,376 (50.8%) | 1,332 (49.2%) |
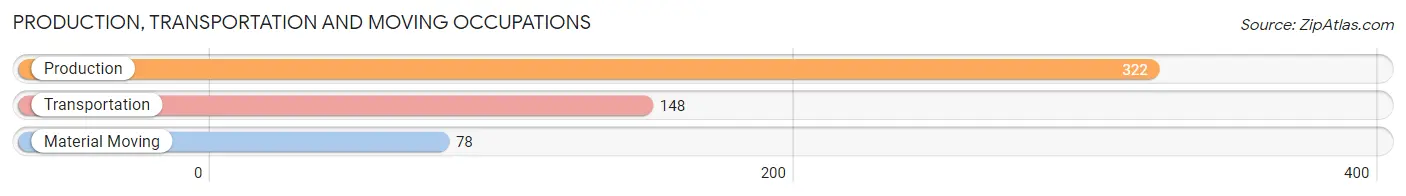
Production, Transportation and Moving Occupations
The most common Production, Transportation and Moving occupations in Dickson City borough are Production (322 | 11.9%), Transportation (148 | 5.5%), and Material Moving (78 | 2.9%).
Production, Transportation and Moving Occupations by Sex
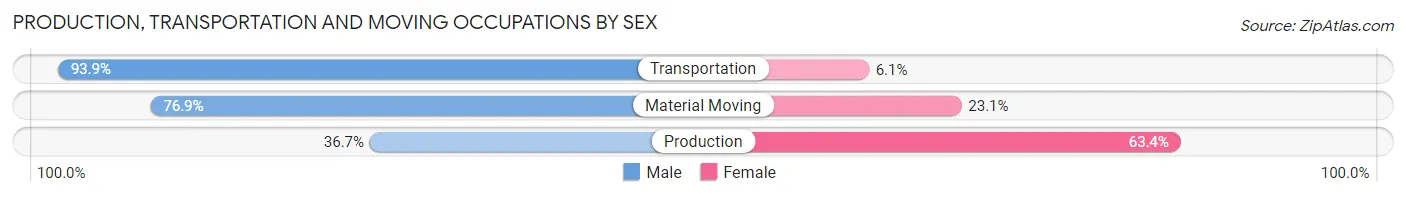
| Occupation | Male | Female |
| Production | 118 (36.6%) | 204 (63.3%) |
| Transportation | 139 (93.9%) | 9 (6.1%) |
| Material Moving | 60 (76.9%) | 18 (23.1%) |
| Total (Category) | 317 (57.9%) | 231 (42.1%) |
| Total (Overall) | 1,376 (50.8%) | 1,332 (49.2%) |
Employment Industries by Sex in Dickson City borough
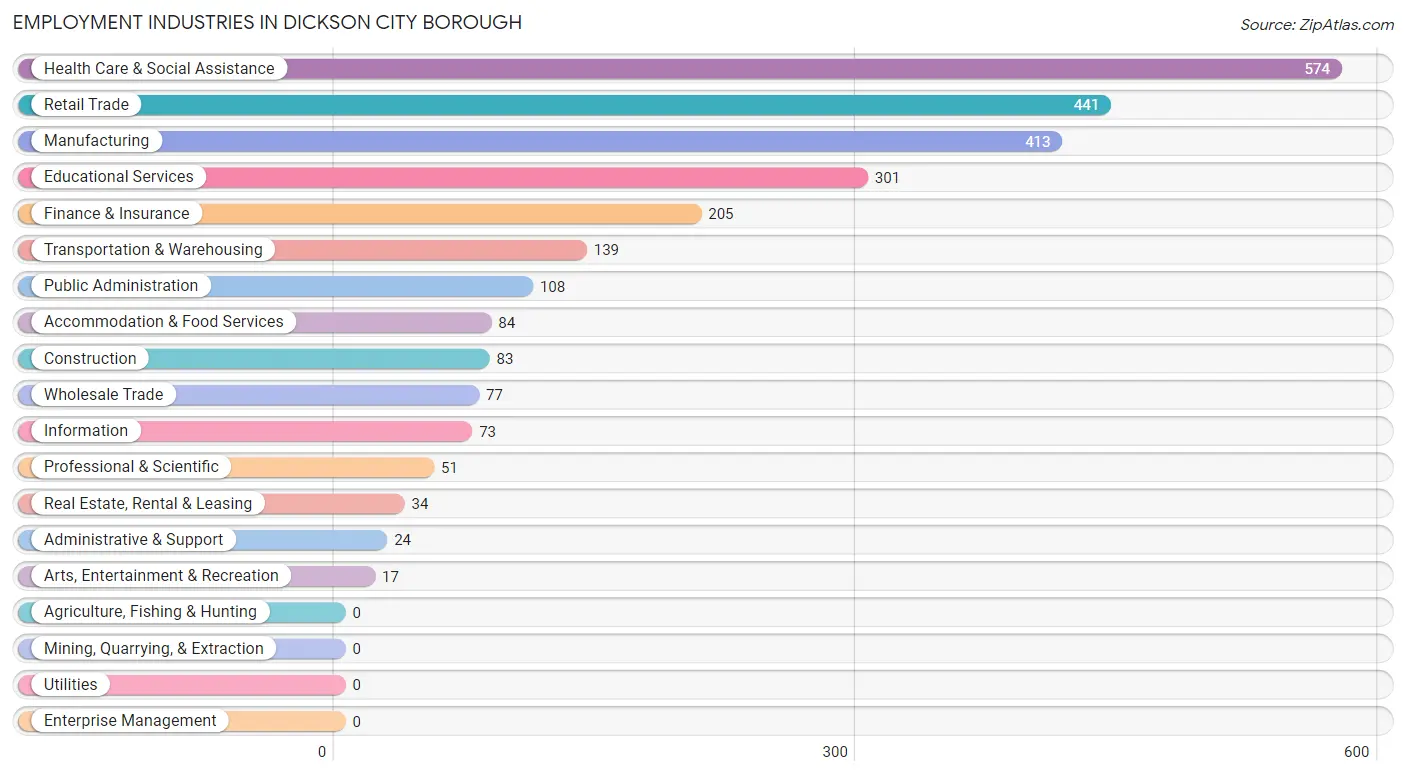
Employment Industries in Dickson City borough
The major employment industries in Dickson City borough include Health Care & Social Assistance (574 | 21.2%), Retail Trade (441 | 16.3%), Manufacturing (413 | 15.2%), Educational Services (301 | 11.1%), and Finance & Insurance (205 | 7.6%).
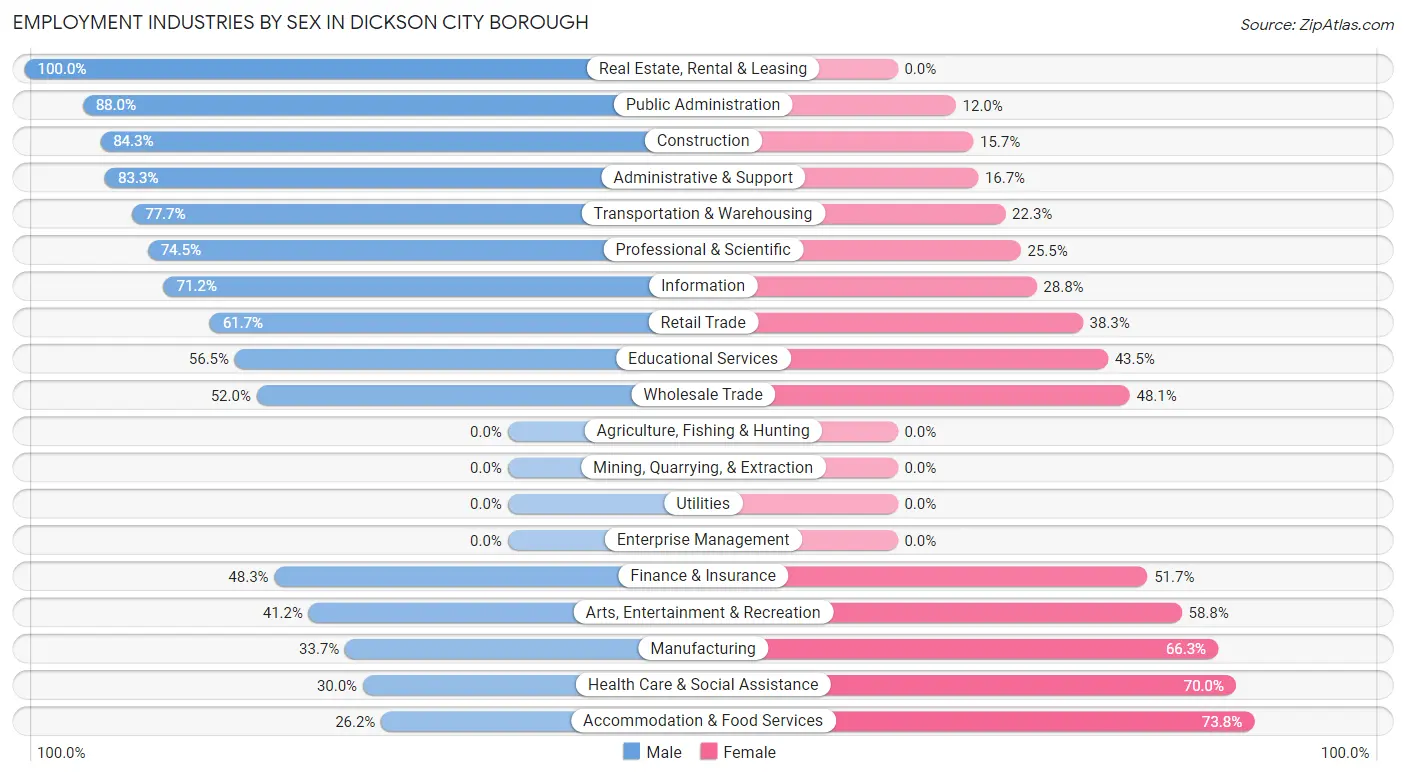
Employment Industries by Sex in Dickson City borough
The Dickson City borough industries that see more men than women are Real Estate, Rental & Leasing (100.0%), Public Administration (88.0%), and Construction (84.3%), whereas the industries that tend to have a higher number of women are Accommodation & Food Services (73.8%), Health Care & Social Assistance (70.0%), and Manufacturing (66.3%).
| Industry | Male | Female |
| Agriculture, Fishing & Hunting | 0 (0.0%) | 0 (0.0%) |
| Mining, Quarrying, & Extraction | 0 (0.0%) | 0 (0.0%) |
| Construction | 70 (84.3%) | 13 (15.7%) |
| Manufacturing | 139 (33.7%) | 274 (66.3%) |
| Wholesale Trade | 40 (51.9%) | 37 (48.0%) |
| Retail Trade | 272 (61.7%) | 169 (38.3%) |
| Transportation & Warehousing | 108 (77.7%) | 31 (22.3%) |
| Utilities | 0 (0.0%) | 0 (0.0%) |
| Information | 52 (71.2%) | 21 (28.8%) |
| Finance & Insurance | 99 (48.3%) | 106 (51.7%) |
| Real Estate, Rental & Leasing | 34 (100.0%) | 0 (0.0%) |
| Professional & Scientific | 38 (74.5%) | 13 (25.5%) |
| Enterprise Management | 0 (0.0%) | 0 (0.0%) |
| Administrative & Support | 20 (83.3%) | 4 (16.7%) |
| Educational Services | 170 (56.5%) | 131 (43.5%) |
| Health Care & Social Assistance | 172 (30.0%) | 402 (70.0%) |
| Arts, Entertainment & Recreation | 7 (41.2%) | 10 (58.8%) |
| Accommodation & Food Services | 22 (26.2%) | 62 (73.8%) |
| Public Administration | 95 (88.0%) | 13 (12.0%) |
| Total | 1,376 (50.8%) | 1,332 (49.2%) |
Education in Dickson City borough
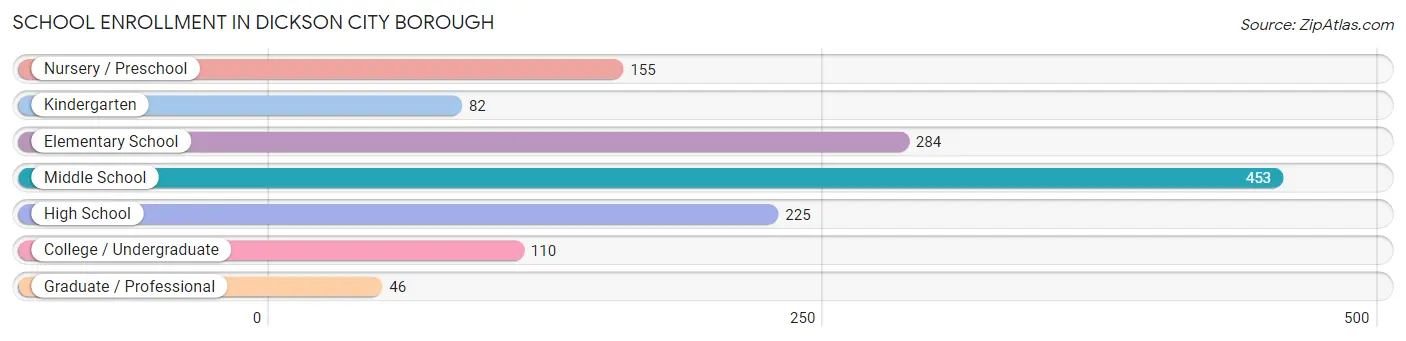
School Enrollment in Dickson City borough
The most common levels of schooling among the 1,355 students in Dickson City borough are middle school (453 | 33.4%), elementary school (284 | 21.0%), and high school (225 | 16.6%).
| School Level | # Students | % Students |
| Nursery / Preschool | 155 | 11.4% |
| Kindergarten | 82 | 6.0% |
| Elementary School | 284 | 21.0% |
| Middle School | 453 | 33.4% |
| High School | 225 | 16.6% |
| College / Undergraduate | 110 | 8.1% |
| Graduate / Professional | 46 | 3.4% |
| Total | 1,355 | 100.0% |
School Enrollment by Age by Funding Source in Dickson City borough
Out of a total of 1,355 students who are enrolled in schools in Dickson City borough, 489 (36.1%) attend a private institution, while the remaining 866 (63.9%) are enrolled in public schools. The age group of 20 to 24 year olds has the highest likelihood of being enrolled in private schools, with 28 (100.0% in the age bracket) enrolled. Conversely, the age group of 15 to 17 year olds has the lowest likelihood of being enrolled in a private school, with 155 (97.5% in the age bracket) attending a public institution.
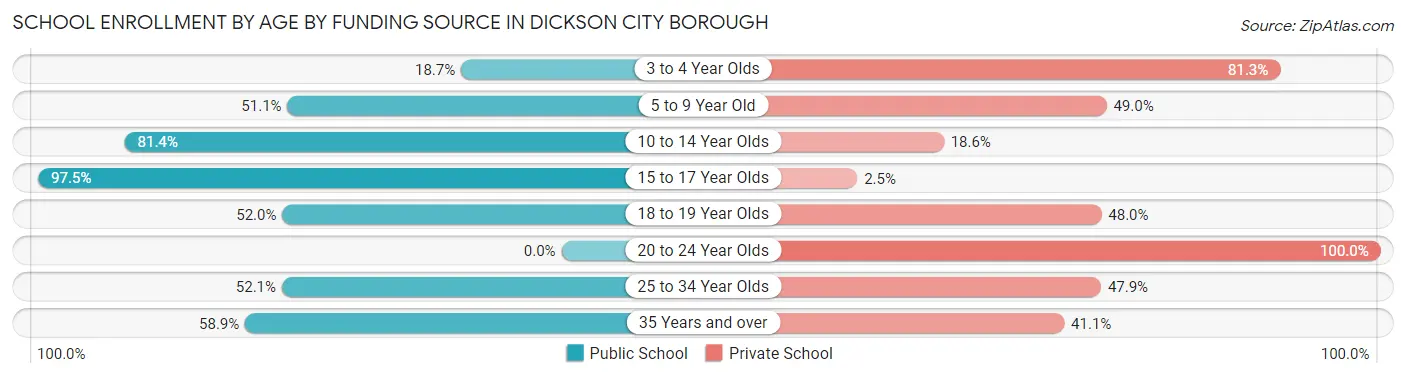
| Age Bracket | Public School | Private School |
| 3 to 4 Year Olds | 29 (18.7%) | 126 (81.3%) |
| 5 to 9 Year Old | 170 (51.0%) | 163 (48.9%) |
| 10 to 14 Year Olds | 428 (81.4%) | 98 (18.6%) |
| 15 to 17 Year Olds | 155 (97.5%) | 4 (2.5%) |
| 18 to 19 Year Olds | 26 (52.0%) | 24 (48.0%) |
| 20 to 24 Year Olds | 0 (0.0%) | 28 (100.0%) |
| 25 to 34 Year Olds | 25 (52.1%) | 23 (47.9%) |
| 35 Years and over | 33 (58.9%) | 23 (41.1%) |
| Total | 866 (63.9%) | 489 (36.1%) |
Educational Attainment by Field of Study in Dickson City borough
Arts & humanities (217 | 16.8%), business (209 | 16.1%), computers & mathematics (207 | 16.0%), education (163 | 12.6%), and social sciences (80 | 6.2%) are the most common fields of study among 1,295 individuals in Dickson City borough who have obtained a bachelor's degree or higher.
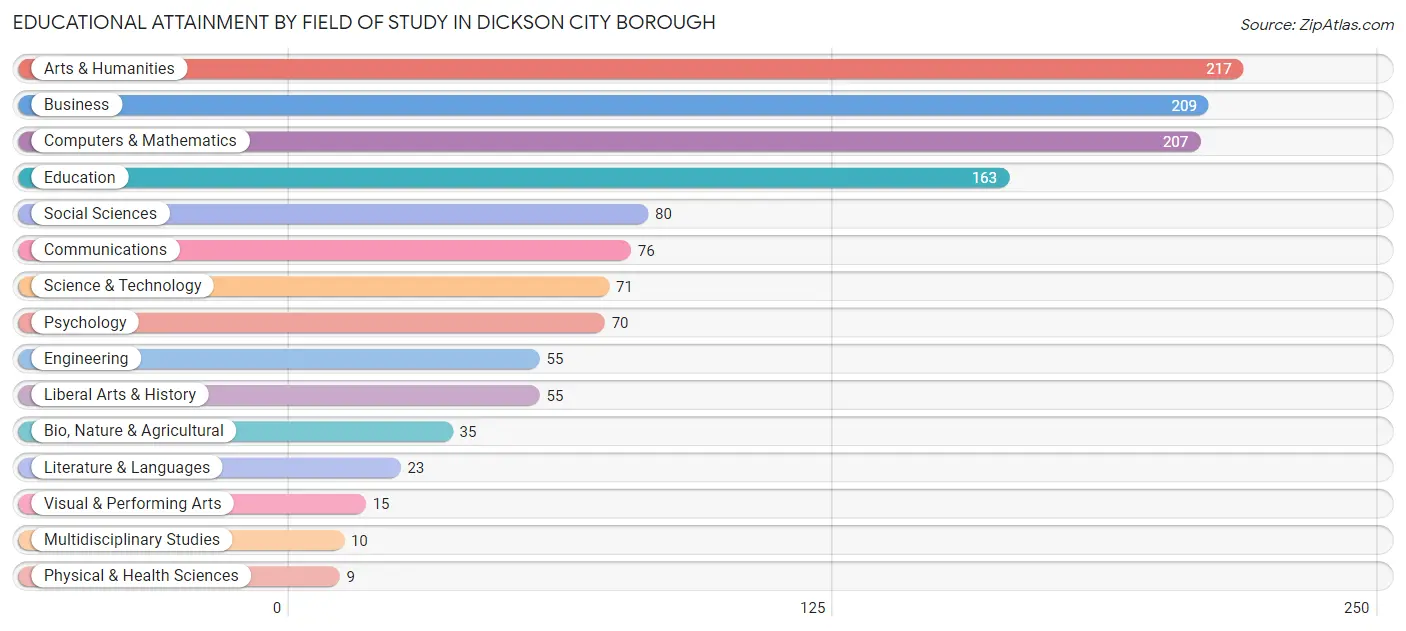
| Field of Study | # Graduates | % Graduates |
| Computers & Mathematics | 207 | 16.0% |
| Bio, Nature & Agricultural | 35 | 2.7% |
| Physical & Health Sciences | 9 | 0.7% |
| Psychology | 70 | 5.4% |
| Social Sciences | 80 | 6.2% |
| Engineering | 55 | 4.3% |
| Multidisciplinary Studies | 10 | 0.8% |
| Science & Technology | 71 | 5.5% |
| Business | 209 | 16.1% |
| Education | 163 | 12.6% |
| Literature & Languages | 23 | 1.8% |
| Liberal Arts & History | 55 | 4.3% |
| Visual & Performing Arts | 15 | 1.2% |
| Communications | 76 | 5.9% |
| Arts & Humanities | 217 | 16.8% |
| Total | 1,295 | 100.0% |
Transportation & Commute in Dickson City borough
Vehicle Availability by Sex in Dickson City borough
The most prevalent vehicle ownership categories in Dickson City borough are males with 2 vehicles (730, accounting for 53.7%) and females with 2 vehicles (816, making up 55.9%).
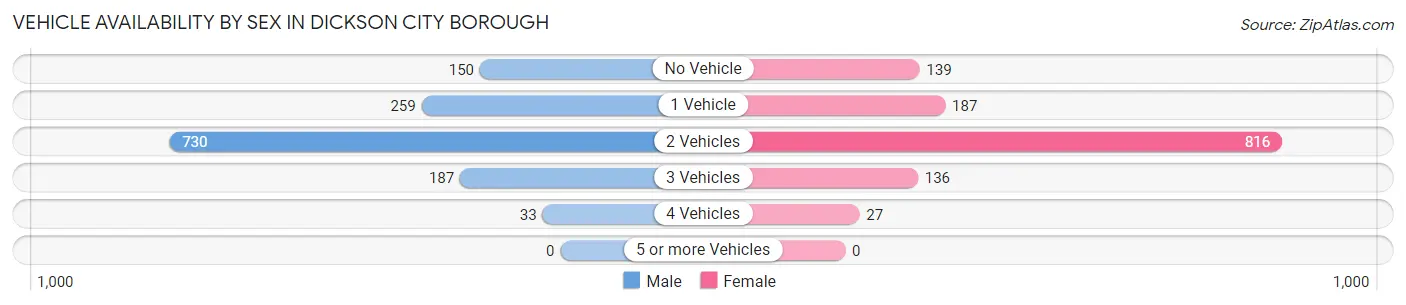
| Vehicles Available | Male | Female |
| No Vehicle | 150 (11.0%) | 139 (10.6%) |
| 1 Vehicle | 259 (19.1%) | 187 (14.3%) |
| 2 Vehicles | 730 (53.7%) | 816 (62.5%) |
| 3 Vehicles | 187 (13.8%) | 136 (10.4%) |
| 4 Vehicles | 33 (2.4%) | 27 (2.1%) |
| 5 or more Vehicles | 0 (0.0%) | 0 (0.0%) |
| Total | 1,359 (100.0%) | 1,305 (100.0%) |
Commute Time in Dickson City borough
The most frequently occuring commute durations in Dickson City borough are 5 to 9 minutes (557 commuters, 22.1%), 15 to 19 minutes (507 commuters, 20.1%), and 10 to 14 minutes (486 commuters, 19.3%).
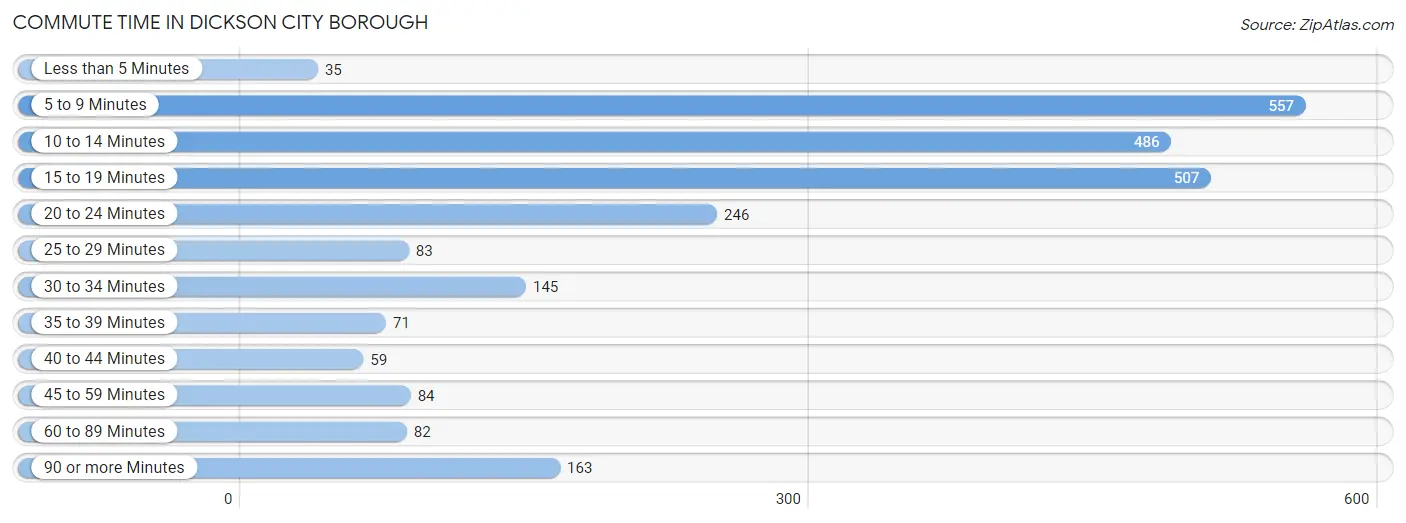
| Commute Time | # Commuters | % Commuters |
| Less than 5 Minutes | 35 | 1.4% |
| 5 to 9 Minutes | 557 | 22.1% |
| 10 to 14 Minutes | 486 | 19.3% |
| 15 to 19 Minutes | 507 | 20.1% |
| 20 to 24 Minutes | 246 | 9.8% |
| 25 to 29 Minutes | 83 | 3.3% |
| 30 to 34 Minutes | 145 | 5.8% |
| 35 to 39 Minutes | 71 | 2.8% |
| 40 to 44 Minutes | 59 | 2.3% |
| 45 to 59 Minutes | 84 | 3.3% |
| 60 to 89 Minutes | 82 | 3.3% |
| 90 or more Minutes | 163 | 6.5% |
Commute Time by Sex in Dickson City borough
The most common commute times in Dickson City borough are 5 to 9 minutes (273 commuters, 20.7%) for males and 5 to 9 minutes (284 commuters, 23.7%) for females.
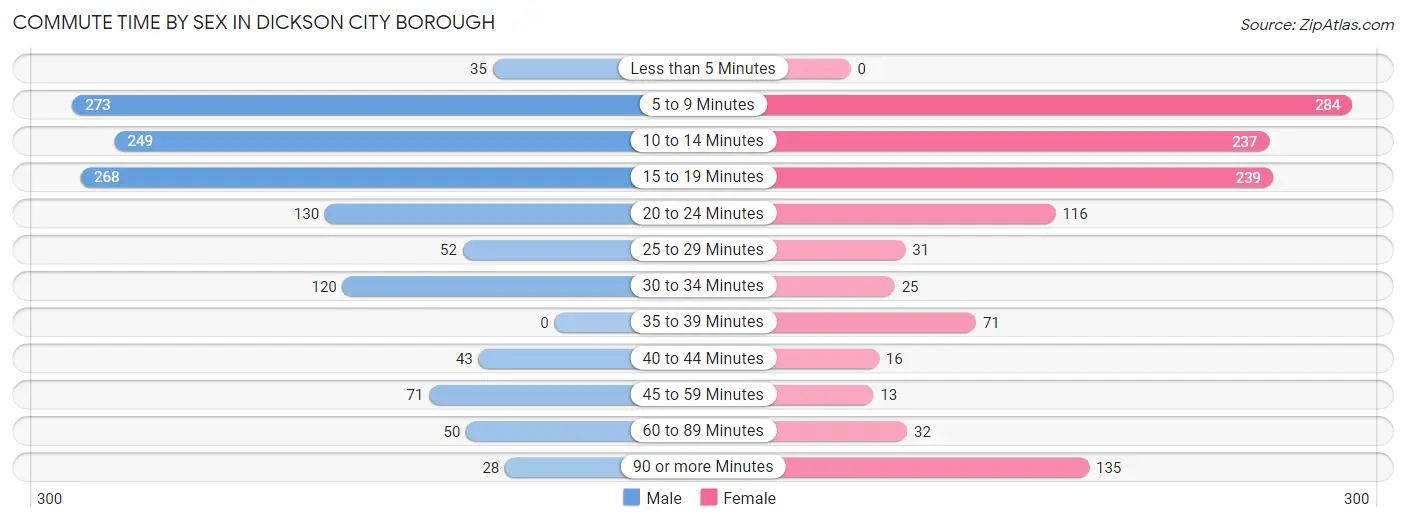
| Commute Time | Male | Female |
| Less than 5 Minutes | 35 (2.6%) | 0 (0.0%) |
| 5 to 9 Minutes | 273 (20.7%) | 284 (23.7%) |
| 10 to 14 Minutes | 249 (18.9%) | 237 (19.8%) |
| 15 to 19 Minutes | 268 (20.3%) | 239 (19.9%) |
| 20 to 24 Minutes | 130 (9.9%) | 116 (9.7%) |
| 25 to 29 Minutes | 52 (3.9%) | 31 (2.6%) |
| 30 to 34 Minutes | 120 (9.1%) | 25 (2.1%) |
| 35 to 39 Minutes | 0 (0.0%) | 71 (5.9%) |
| 40 to 44 Minutes | 43 (3.3%) | 16 (1.3%) |
| 45 to 59 Minutes | 71 (5.4%) | 13 (1.1%) |
| 60 to 89 Minutes | 50 (3.8%) | 32 (2.7%) |
| 90 or more Minutes | 28 (2.1%) | 135 (11.3%) |
Time of Departure to Work by Sex in Dickson City borough
The most frequent times of departure to work in Dickson City borough are 7:30 AM to 7:59 AM (247, 18.7%) for males and 6:30 AM to 6:59 AM (247, 20.6%) for females.
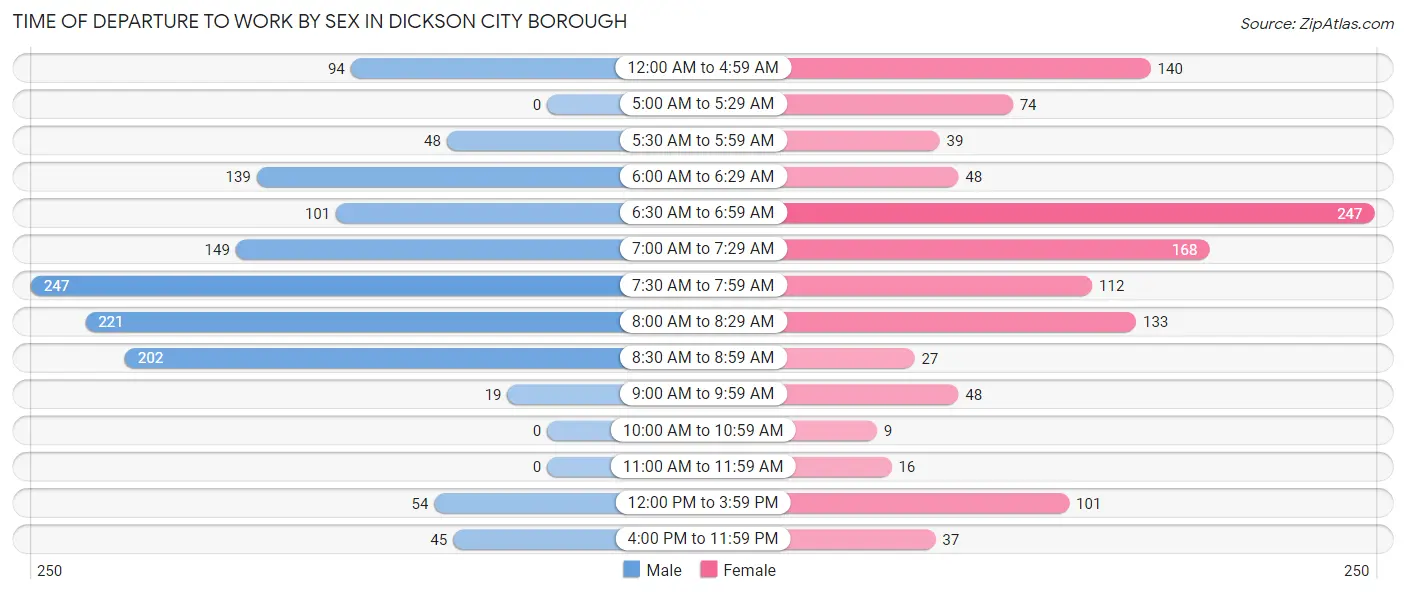
| Time of Departure | Male | Female |
| 12:00 AM to 4:59 AM | 94 (7.1%) | 140 (11.7%) |
| 5:00 AM to 5:29 AM | 0 (0.0%) | 74 (6.2%) |
| 5:30 AM to 5:59 AM | 48 (3.6%) | 39 (3.3%) |
| 6:00 AM to 6:29 AM | 139 (10.5%) | 48 (4.0%) |
| 6:30 AM to 6:59 AM | 101 (7.7%) | 247 (20.6%) |
| 7:00 AM to 7:29 AM | 149 (11.3%) | 168 (14.0%) |
| 7:30 AM to 7:59 AM | 247 (18.7%) | 112 (9.3%) |
| 8:00 AM to 8:29 AM | 221 (16.8%) | 133 (11.1%) |
| 8:30 AM to 8:59 AM | 202 (15.3%) | 27 (2.2%) |
| 9:00 AM to 9:59 AM | 19 (1.4%) | 48 (4.0%) |
| 10:00 AM to 10:59 AM | 0 (0.0%) | 9 (0.7%) |
| 11:00 AM to 11:59 AM | 0 (0.0%) | 16 (1.3%) |
| 12:00 PM to 3:59 PM | 54 (4.1%) | 101 (8.4%) |
| 4:00 PM to 11:59 PM | 45 (3.4%) | 37 (3.1%) |
| Total | 1,319 (100.0%) | 1,199 (100.0%) |
Housing Occupancy in Dickson City borough
Occupancy by Ownership in Dickson City borough
Of the total 2,811 dwellings in Dickson City borough, owner-occupied units account for 1,895 (67.4%), while renter-occupied units make up 916 (32.6%).
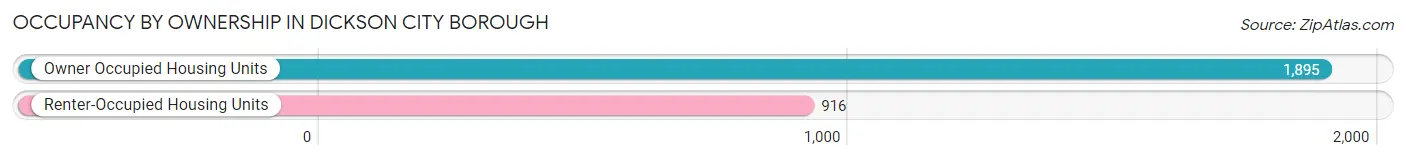
| Occupancy | # Housing Units | % Housing Units |
| Owner Occupied Housing Units | 1,895 | 67.4% |
| Renter-Occupied Housing Units | 916 | 32.6% |
| Total Occupied Housing Units | 2,811 | 100.0% |
Occupancy by Household Size in Dickson City borough
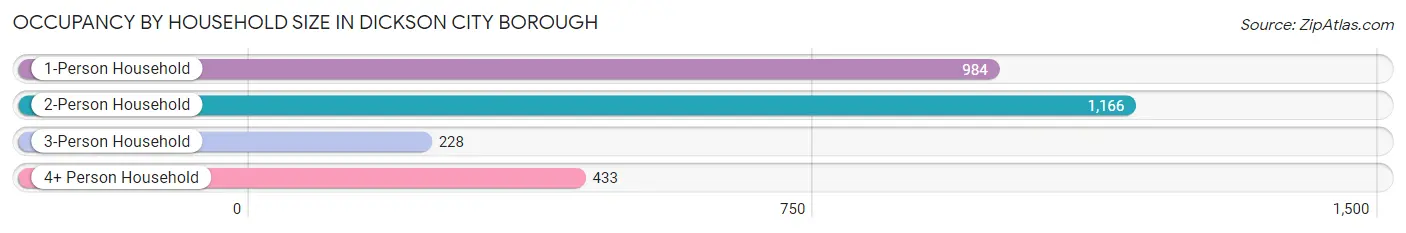
| Household Size | # Housing Units | % Housing Units |
| 1-Person Household | 984 | 35.0% |
| 2-Person Household | 1,166 | 41.5% |
| 3-Person Household | 228 | 8.1% |
| 4+ Person Household | 433 | 15.4% |
| Total Housing Units | 2,811 | 100.0% |
Occupancy by Ownership by Household Size in Dickson City borough
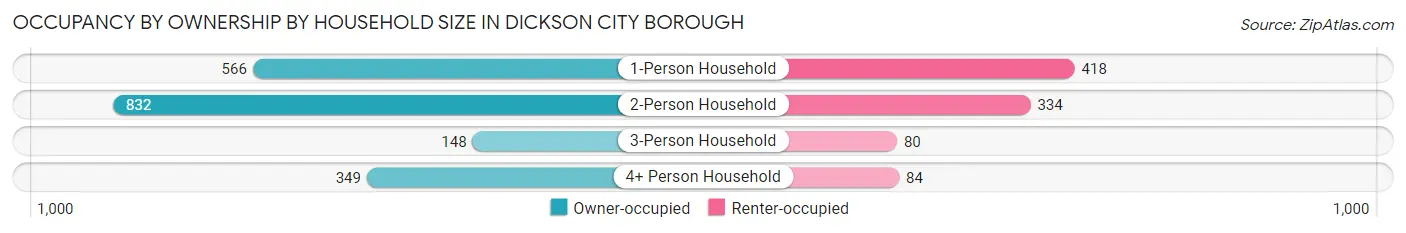
| Household Size | Owner-occupied | Renter-occupied |
| 1-Person Household | 566 (57.5%) | 418 (42.5%) |
| 2-Person Household | 832 (71.4%) | 334 (28.6%) |
| 3-Person Household | 148 (64.9%) | 80 (35.1%) |
| 4+ Person Household | 349 (80.6%) | 84 (19.4%) |
| Total Housing Units | 1,895 (67.4%) | 916 (32.6%) |
Occupancy by Educational Attainment in Dickson City borough
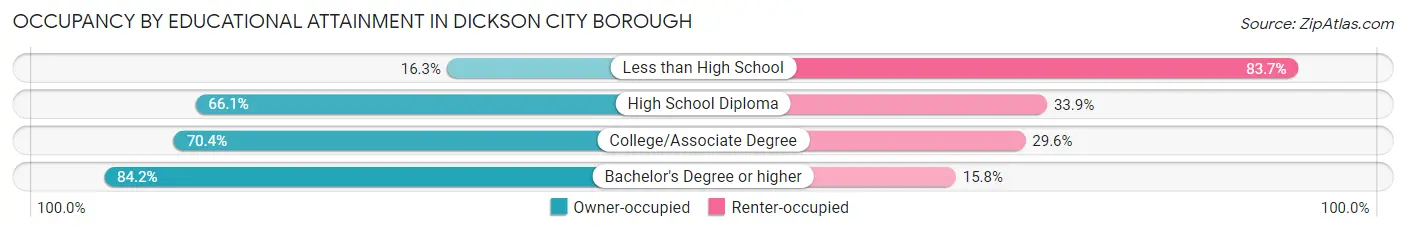
| Household Size | Owner-occupied | Renter-occupied |
| Less than High School | 44 (16.3%) | 226 (83.7%) |
| High School Diploma | 693 (66.1%) | 355 (33.9%) |
| College/Associate Degree | 507 (70.4%) | 213 (29.6%) |
| Bachelor's Degree or higher | 651 (84.2%) | 122 (15.8%) |
Occupancy by Age of Householder in Dickson City borough
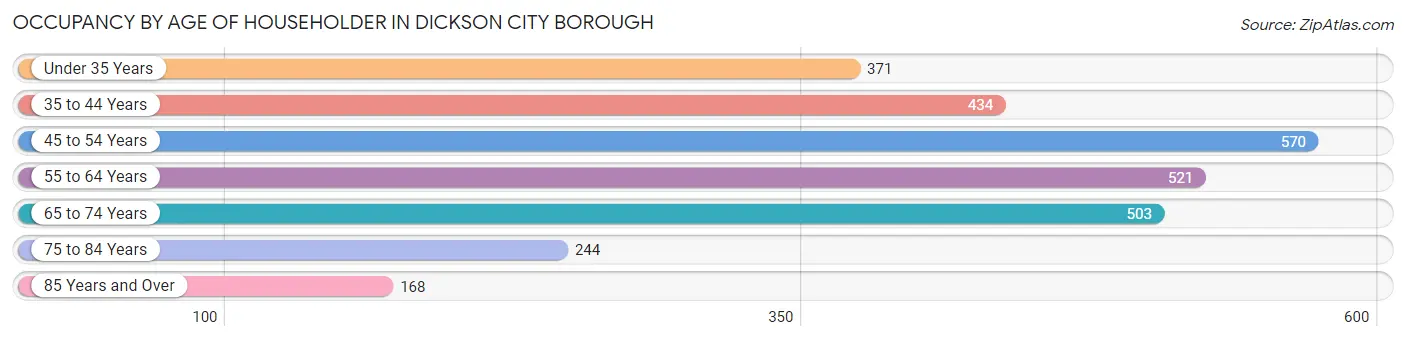
| Age Bracket | # Households | % Households |
| Under 35 Years | 371 | 13.2% |
| 35 to 44 Years | 434 | 15.4% |
| 45 to 54 Years | 570 | 20.3% |
| 55 to 64 Years | 521 | 18.5% |
| 65 to 74 Years | 503 | 17.9% |
| 75 to 84 Years | 244 | 8.7% |
| 85 Years and Over | 168 | 6.0% |
| Total | 2,811 | 100.0% |
Housing Finances in Dickson City borough
Median Income by Occupancy in Dickson City borough
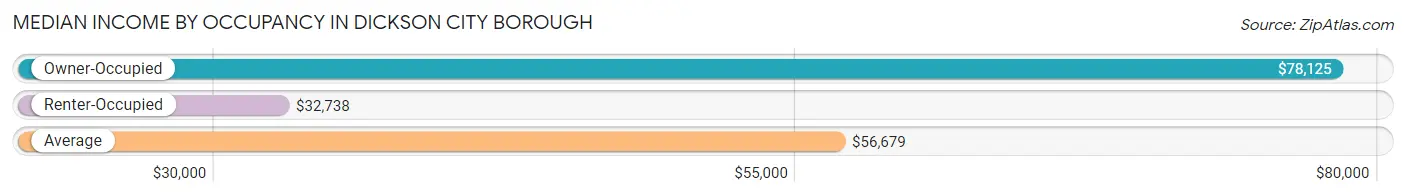
| Occupancy Type | # Households | Median Income |
| Owner-Occupied | 1,895 (67.4%) | $78,125 |
| Renter-Occupied | 916 (32.6%) | $32,738 |
| Average | 2,811 (100.0%) | $56,679 |
Occupancy by Householder Income Bracket in Dickson City borough
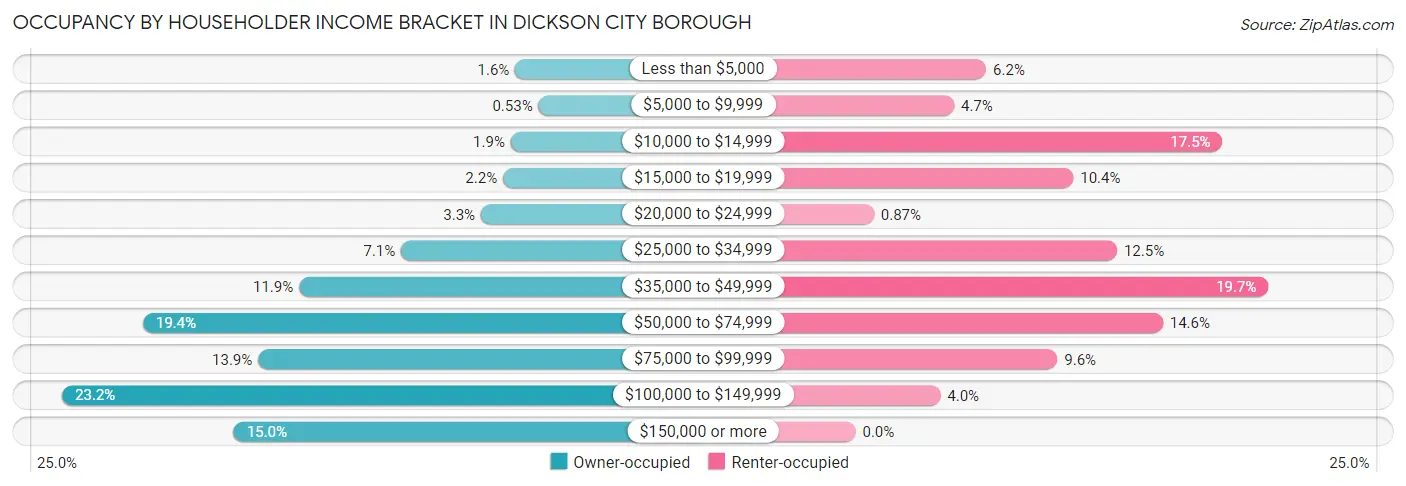
| Income Bracket | Owner-occupied | Renter-occupied |
| Less than $5,000 | 31 (1.6%) | 57 (6.2%) |
| $5,000 to $9,999 | 10 (0.5%) | 43 (4.7%) |
| $10,000 to $14,999 | 35 (1.8%) | 160 (17.5%) |
| $15,000 to $19,999 | 42 (2.2%) | 95 (10.4%) |
| $20,000 to $24,999 | 62 (3.3%) | 8 (0.9%) |
| $25,000 to $34,999 | 134 (7.1%) | 114 (12.4%) |
| $35,000 to $49,999 | 226 (11.9%) | 180 (19.7%) |
| $50,000 to $74,999 | 367 (19.4%) | 134 (14.6%) |
| $75,000 to $99,999 | 263 (13.9%) | 88 (9.6%) |
| $100,000 to $149,999 | 440 (23.2%) | 37 (4.0%) |
| $150,000 or more | 285 (15.0%) | 0 (0.0%) |
| Total | 1,895 (100.0%) | 916 (100.0%) |
Monthly Housing Cost Tiers in Dickson City borough
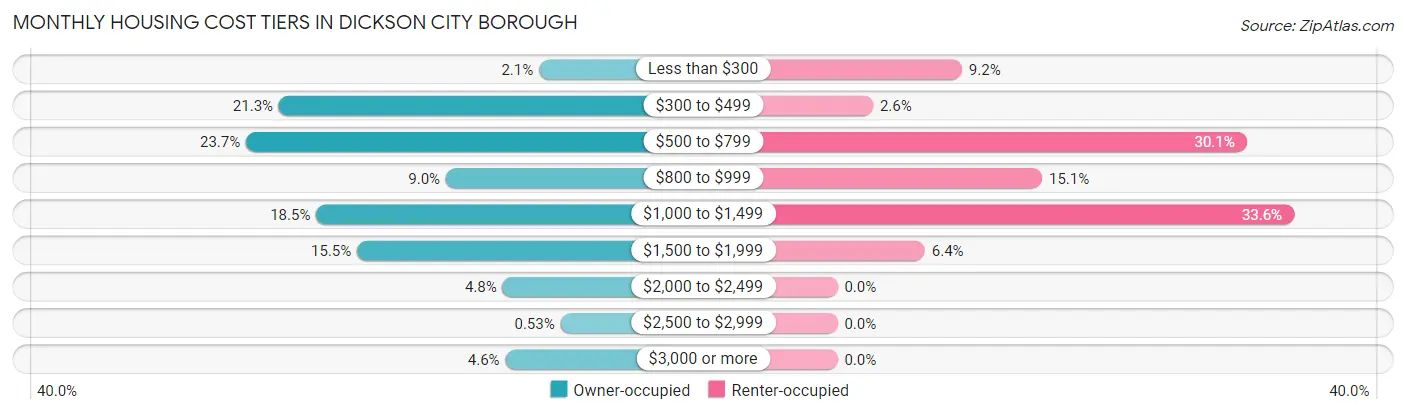
| Monthly Cost | Owner-occupied | Renter-occupied |
| Less than $300 | 40 (2.1%) | 84 (9.2%) |
| $300 to $499 | 403 (21.3%) | 24 (2.6%) |
| $500 to $799 | 449 (23.7%) | 276 (30.1%) |
| $800 to $999 | 170 (9.0%) | 138 (15.1%) |
| $1,000 to $1,499 | 351 (18.5%) | 308 (33.6%) |
| $1,500 to $1,999 | 294 (15.5%) | 59 (6.4%) |
| $2,000 to $2,499 | 91 (4.8%) | 0 (0.0%) |
| $2,500 to $2,999 | 10 (0.5%) | 0 (0.0%) |
| $3,000 or more | 87 (4.6%) | 0 (0.0%) |
| Total | 1,895 (100.0%) | 916 (100.0%) |
Physical Housing Characteristics in Dickson City borough
Housing Structures in Dickson City borough
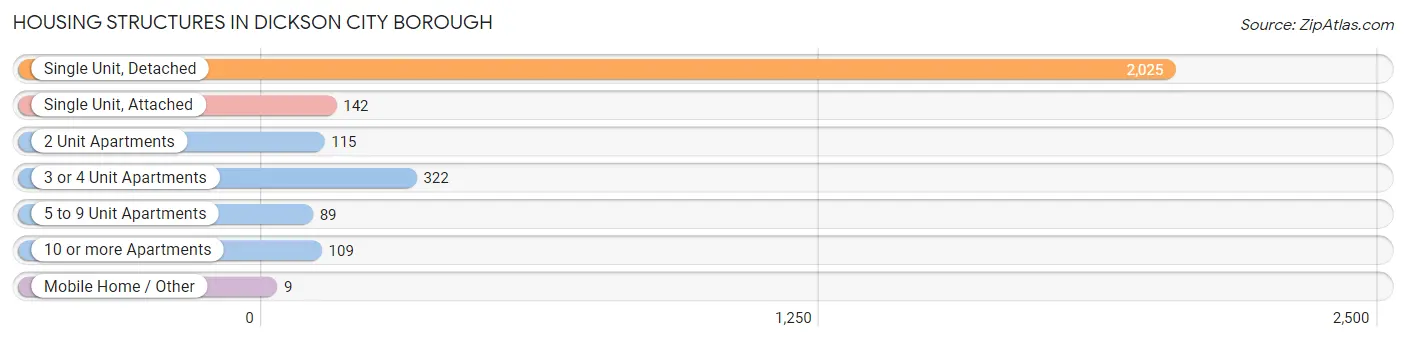
| Structure Type | # Housing Units | % Housing Units |
| Single Unit, Detached | 2,025 | 72.0% |
| Single Unit, Attached | 142 | 5.1% |
| 2 Unit Apartments | 115 | 4.1% |
| 3 or 4 Unit Apartments | 322 | 11.5% |
| 5 to 9 Unit Apartments | 89 | 3.2% |
| 10 or more Apartments | 109 | 3.9% |
| Mobile Home / Other | 9 | 0.3% |
| Total | 2,811 | 100.0% |
Housing Structures by Occupancy in Dickson City borough
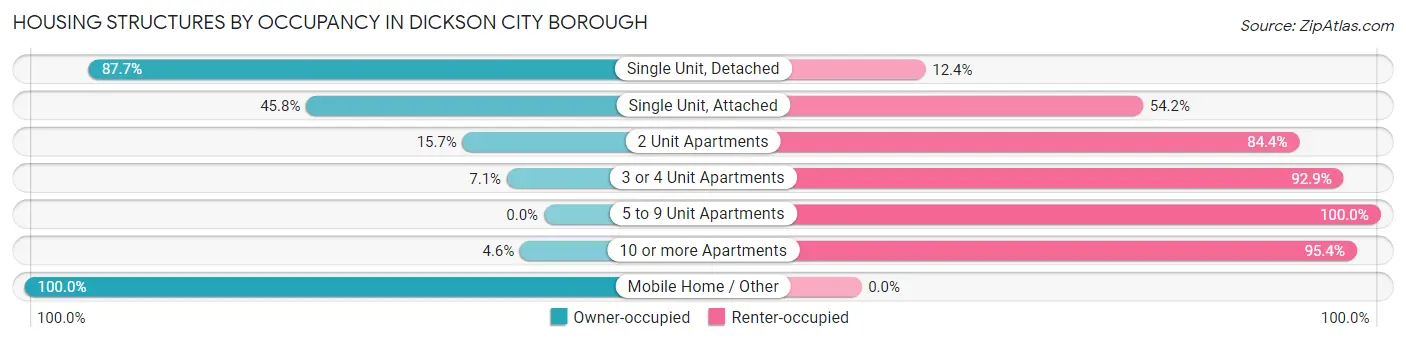
| Structure Type | Owner-occupied | Renter-occupied |
| Single Unit, Detached | 1,775 (87.6%) | 250 (12.3%) |
| Single Unit, Attached | 65 (45.8%) | 77 (54.2%) |
| 2 Unit Apartments | 18 (15.7%) | 97 (84.4%) |
| 3 or 4 Unit Apartments | 23 (7.1%) | 299 (92.9%) |
| 5 to 9 Unit Apartments | 0 (0.0%) | 89 (100.0%) |
| 10 or more Apartments | 5 (4.6%) | 104 (95.4%) |
| Mobile Home / Other | 9 (100.0%) | 0 (0.0%) |
| Total | 1,895 (67.4%) | 916 (32.6%) |
Housing Structures by Number of Rooms in Dickson City borough
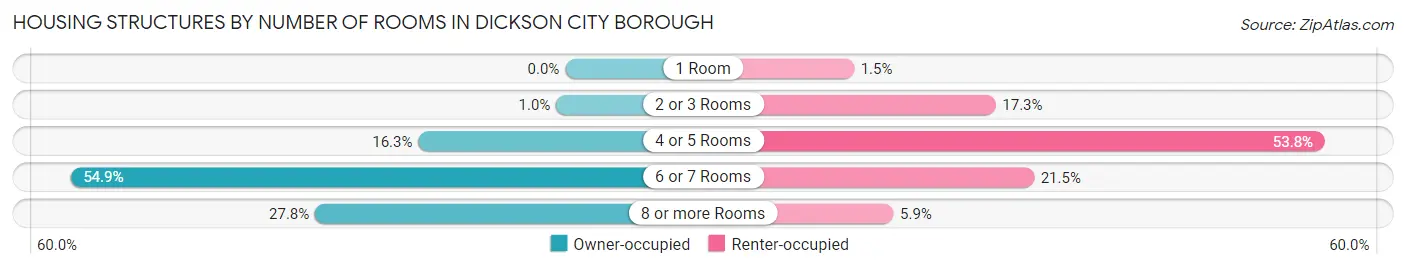
| Number of Rooms | Owner-occupied | Renter-occupied |
| 1 Room | 0 (0.0%) | 14 (1.5%) |
| 2 or 3 Rooms | 19 (1.0%) | 158 (17.2%) |
| 4 or 5 Rooms | 309 (16.3%) | 493 (53.8%) |
| 6 or 7 Rooms | 1,041 (54.9%) | 197 (21.5%) |
| 8 or more Rooms | 526 (27.8%) | 54 (5.9%) |
| Total | 1,895 (100.0%) | 916 (100.0%) |
Housing Structure by Heating Type in Dickson City borough
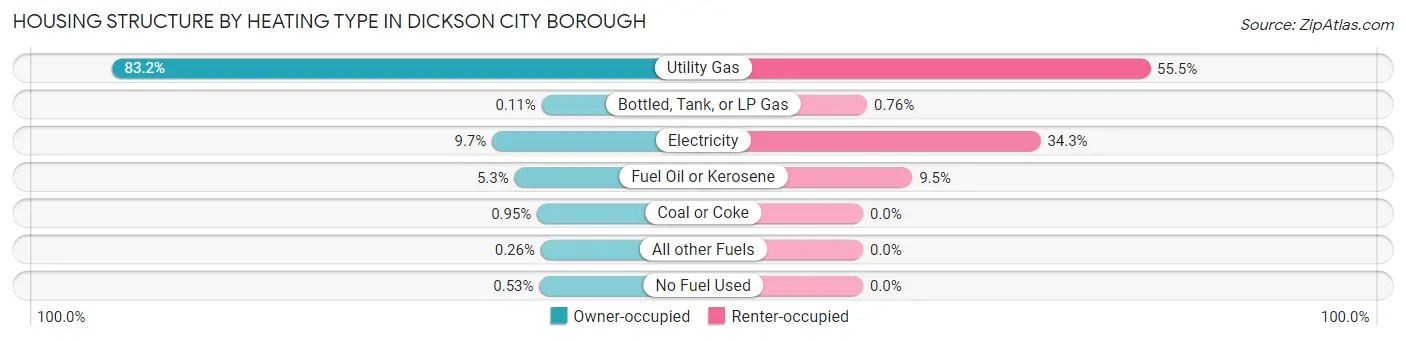
| Heating Type | Owner-occupied | Renter-occupied |
| Utility Gas | 1,576 (83.2%) | 508 (55.5%) |
| Bottled, Tank, or LP Gas | 2 (0.1%) | 7 (0.8%) |
| Electricity | 183 (9.7%) | 314 (34.3%) |
| Fuel Oil or Kerosene | 101 (5.3%) | 87 (9.5%) |
| Coal or Coke | 18 (0.9%) | 0 (0.0%) |
| All other Fuels | 5 (0.3%) | 0 (0.0%) |
| No Fuel Used | 10 (0.5%) | 0 (0.0%) |
| Total | 1,895 (100.0%) | 916 (100.0%) |
Household Vehicle Usage in Dickson City borough
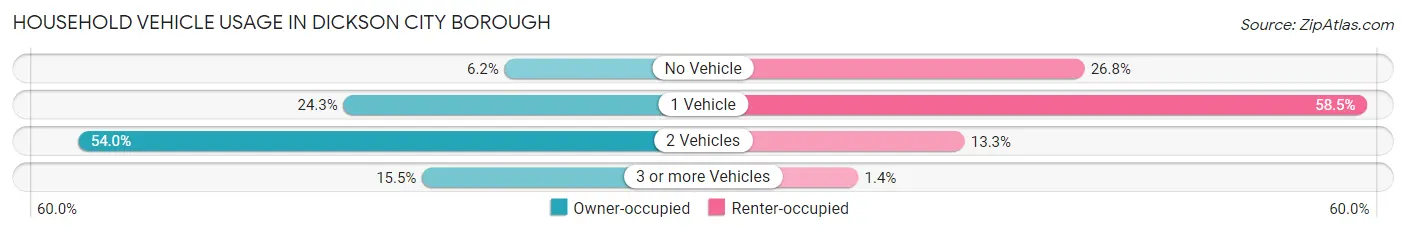
| Vehicles per Household | Owner-occupied | Renter-occupied |
| No Vehicle | 118 (6.2%) | 245 (26.8%) |
| 1 Vehicle | 460 (24.3%) | 536 (58.5%) |
| 2 Vehicles | 1,024 (54.0%) | 122 (13.3%) |
| 3 or more Vehicles | 293 (15.5%) | 13 (1.4%) |
| Total | 1,895 (100.0%) | 916 (100.0%) |
Real Estate & Mortgages in Dickson City borough
Real Estate and Mortgage Overview in Dickson City borough
| Characteristic | Without Mortgage | With Mortgage |
| Housing Units | 988 | 907 |
| Median Property Value | $165,000 | $193,000 |
| Median Household Income | $56,813 | $164 |
| Monthly Housing Costs | $537 | $87 |
| Real Estate Taxes | $1,896 | $0 |
Property Value by Mortgage Status in Dickson City borough
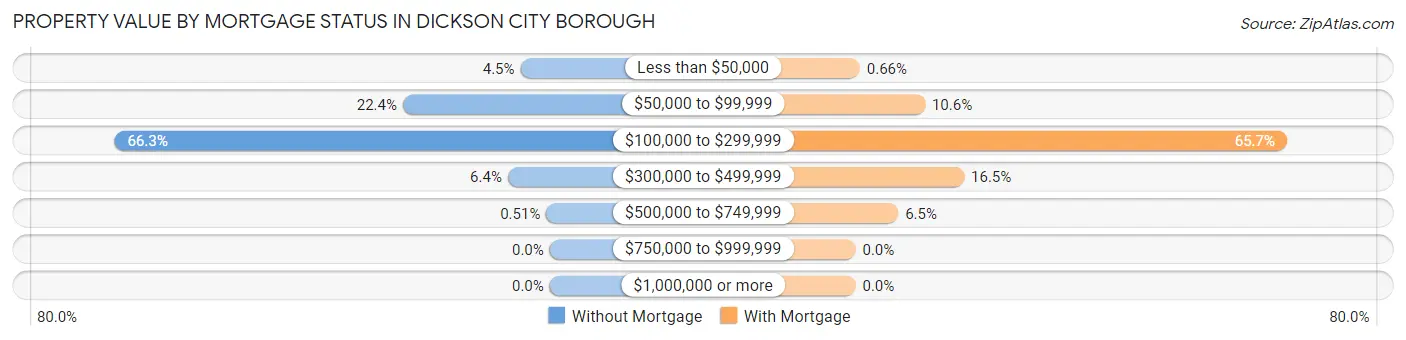
| Property Value | Without Mortgage | With Mortgage |
| Less than $50,000 | 44 (4.4%) | 6 (0.7%) |
| $50,000 to $99,999 | 221 (22.4%) | 96 (10.6%) |
| $100,000 to $299,999 | 655 (66.3%) | 596 (65.7%) |
| $300,000 to $499,999 | 63 (6.4%) | 150 (16.5%) |
| $500,000 to $749,999 | 5 (0.5%) | 59 (6.5%) |
| $750,000 to $999,999 | 0 (0.0%) | 0 (0.0%) |
| $1,000,000 or more | 0 (0.0%) | 0 (0.0%) |
| Total | 988 (100.0%) | 907 (100.0%) |
Household Income by Mortgage Status in Dickson City borough
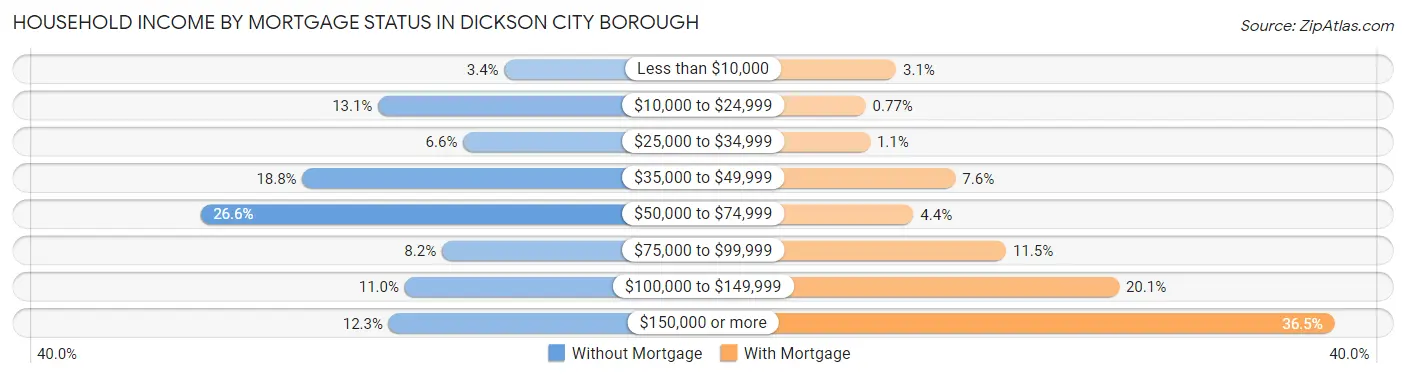
| Household Income | Without Mortgage | With Mortgage |
| Less than $10,000 | 34 (3.4%) | 28 (3.1%) |
| $10,000 to $24,999 | 129 (13.1%) | 7 (0.8%) |
| $25,000 to $34,999 | 65 (6.6%) | 10 (1.1%) |
| $35,000 to $49,999 | 186 (18.8%) | 69 (7.6%) |
| $50,000 to $74,999 | 263 (26.6%) | 40 (4.4%) |
| $75,000 to $99,999 | 81 (8.2%) | 104 (11.5%) |
| $100,000 to $149,999 | 109 (11.0%) | 182 (20.1%) |
| $150,000 or more | 121 (12.2%) | 331 (36.5%) |
| Total | 988 (100.0%) | 907 (100.0%) |
Property Value to Household Income Ratio in Dickson City borough
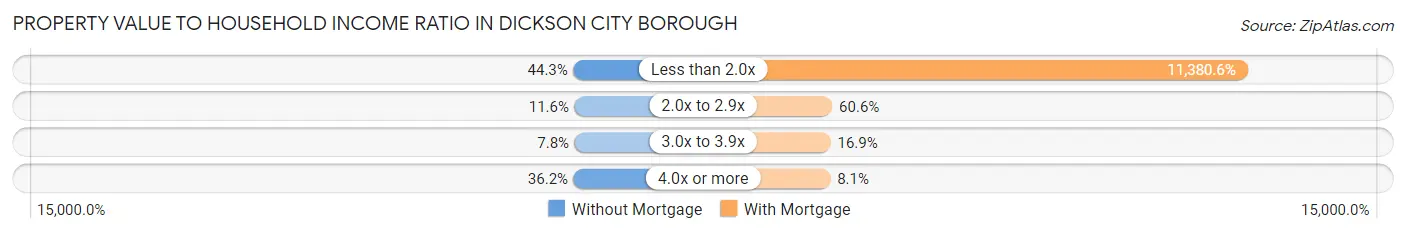
| Value-to-Income Ratio | Without Mortgage | With Mortgage |
| Less than 2.0x | 438 (44.3%) | 103,222 (11,380.6%) |
| 2.0x to 2.9x | 115 (11.6%) | 550 (60.6%) |
| 3.0x to 3.9x | 77 (7.8%) | 153 (16.9%) |
| 4.0x or more | 358 (36.2%) | 73 (8.1%) |
| Total | 988 (100.0%) | 907 (100.0%) |
Real Estate Taxes by Mortgage Status in Dickson City borough
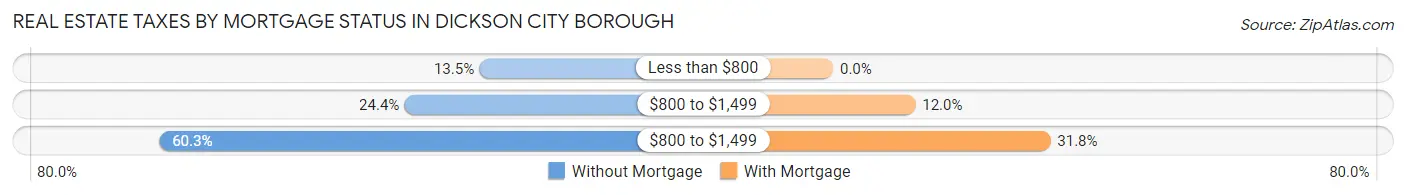
| Property Taxes | Without Mortgage | With Mortgage |
| Less than $800 | 133 (13.5%) | 0 (0.0%) |
| $800 to $1,499 | 241 (24.4%) | 109 (12.0%) |
| $800 to $1,499 | 596 (60.3%) | 288 (31.8%) |
| Total | 988 (100.0%) | 907 (100.0%) |
Health & Disability in Dickson City borough
Health Insurance Coverage by Age in Dickson City borough
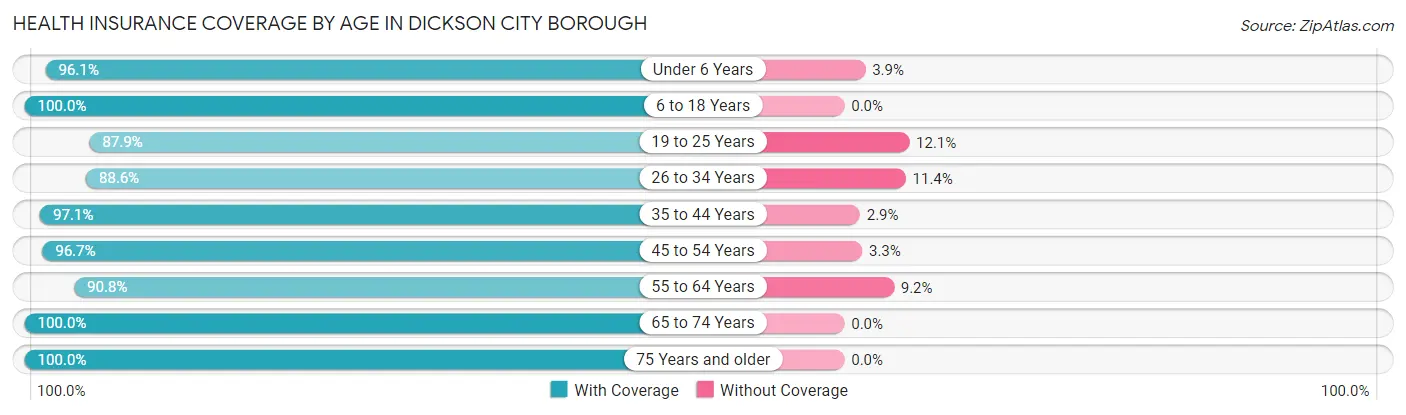
| Age Bracket | With Coverage | Without Coverage |
| Under 6 Years | 296 (96.1%) | 12 (3.9%) |
| 6 to 18 Years | 1,042 (100.0%) | 0 (0.0%) |
| 19 to 25 Years | 160 (87.9%) | 22 (12.1%) |
| 26 to 34 Years | 542 (88.6%) | 70 (11.4%) |
| 35 to 44 Years | 739 (97.1%) | 22 (2.9%) |
| 45 to 54 Years | 876 (96.7%) | 30 (3.3%) |
| 55 to 64 Years | 738 (90.8%) | 75 (9.2%) |
| 65 to 74 Years | 702 (100.0%) | 0 (0.0%) |
| 75 Years and older | 696 (100.0%) | 0 (0.0%) |
| Total | 5,791 (96.2%) | 231 (3.8%) |
Health Insurance Coverage by Citizenship Status in Dickson City borough
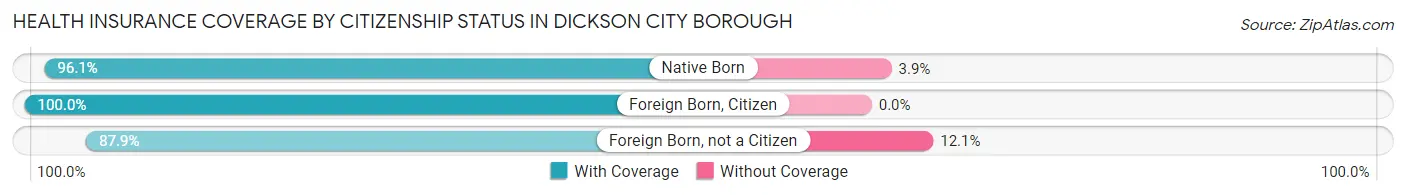
| Citizenship Status | With Coverage | Without Coverage |
| Native Born | 296 (96.1%) | 12 (3.9%) |
| Foreign Born, Citizen | 1,042 (100.0%) | 0 (0.0%) |
| Foreign Born, not a Citizen | 160 (87.9%) | 22 (12.1%) |
Health Insurance Coverage by Household Income in Dickson City borough
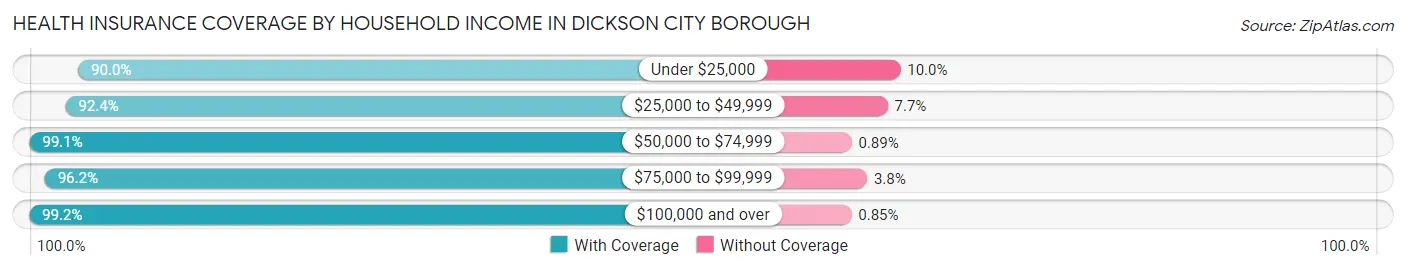
| Household Income | With Coverage | Without Coverage |
| Under $25,000 | 763 (90.0%) | 85 (10.0%) |
| $25,000 to $49,999 | 1,002 (92.3%) | 83 (7.6%) |
| $50,000 to $74,999 | 1,108 (99.1%) | 10 (0.9%) |
| $75,000 to $99,999 | 916 (96.2%) | 36 (3.8%) |
| $100,000 and over | 1,982 (99.2%) | 17 (0.9%) |
Public vs Private Health Insurance Coverage by Age in Dickson City borough
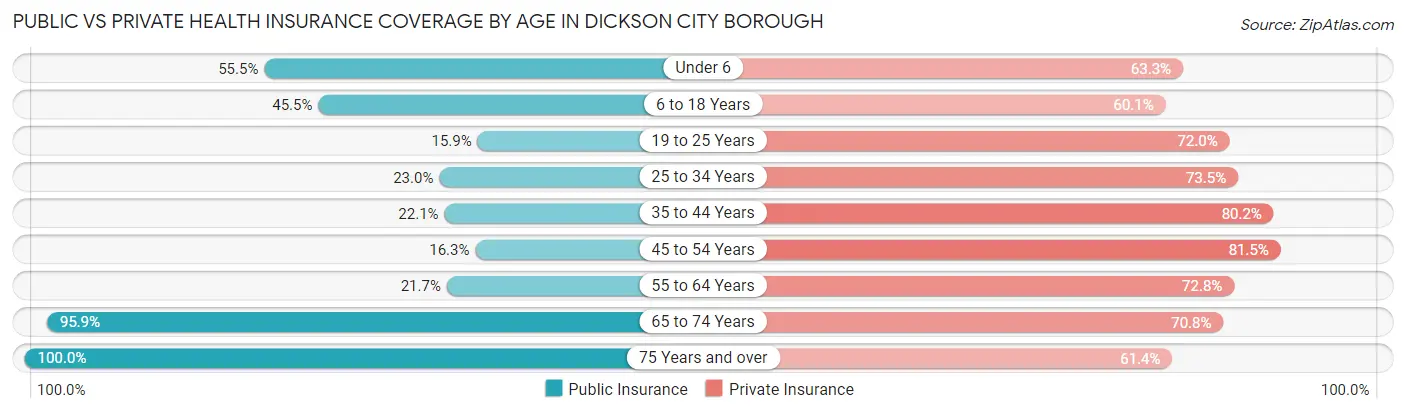
| Age Bracket | Public Insurance | Private Insurance |
| Under 6 | 171 (55.5%) | 195 (63.3%) |
| 6 to 18 Years | 474 (45.5%) | 626 (60.1%) |
| 19 to 25 Years | 29 (15.9%) | 131 (72.0%) |
| 25 to 34 Years | 141 (23.0%) | 450 (73.5%) |
| 35 to 44 Years | 168 (22.1%) | 610 (80.2%) |
| 45 to 54 Years | 148 (16.3%) | 738 (81.5%) |
| 55 to 64 Years | 176 (21.6%) | 592 (72.8%) |
| 65 to 74 Years | 673 (95.9%) | 497 (70.8%) |
| 75 Years and over | 696 (100.0%) | 427 (61.4%) |
| Total | 2,676 (44.4%) | 4,266 (70.8%) |
Disability Status by Sex by Age in Dickson City borough
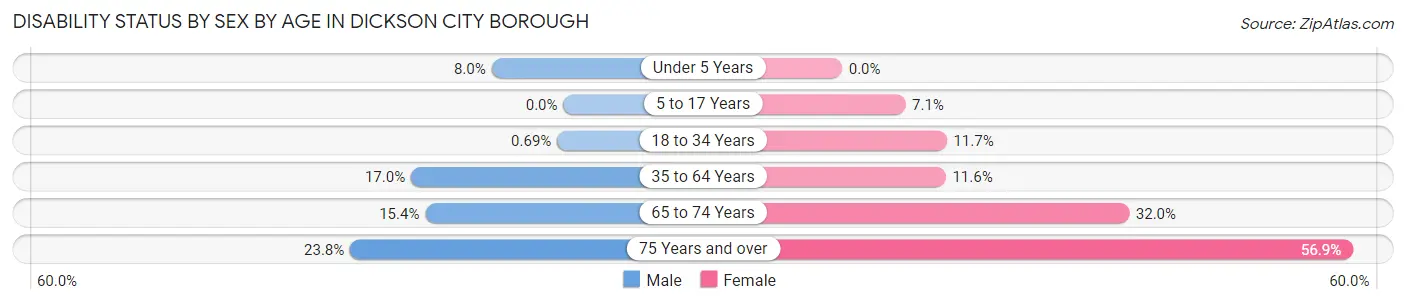
| Age Bracket | Male | Female |
| Under 5 Years | 12 (8.0%) | 0 (0.0%) |
| 5 to 17 Years | 0 (0.0%) | 44 (7.0%) |
| 18 to 34 Years | 3 (0.7%) | 45 (11.7%) |
| 35 to 64 Years | 202 (17.0%) | 149 (11.6%) |
| 65 to 74 Years | 44 (15.4%) | 133 (32.0%) |
| 75 Years and over | 71 (23.7%) | 226 (56.9%) |
Disability Class by Sex by Age in Dickson City borough
Disability Class: Hearing Difficulty
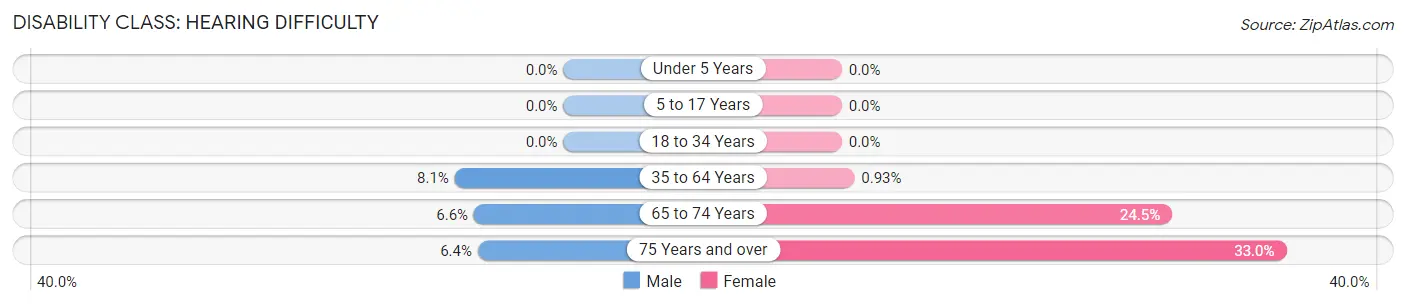
| Age Bracket | Male | Female |
| Under 5 Years | 0 (0.0%) | 0 (0.0%) |
| 5 to 17 Years | 0 (0.0%) | 0 (0.0%) |
| 18 to 34 Years | 0 (0.0%) | 0 (0.0%) |
| 35 to 64 Years | 96 (8.1%) | 12 (0.9%) |
| 65 to 74 Years | 19 (6.6%) | 102 (24.5%) |
| 75 Years and over | 19 (6.4%) | 131 (33.0%) |
Disability Class: Vision Difficulty
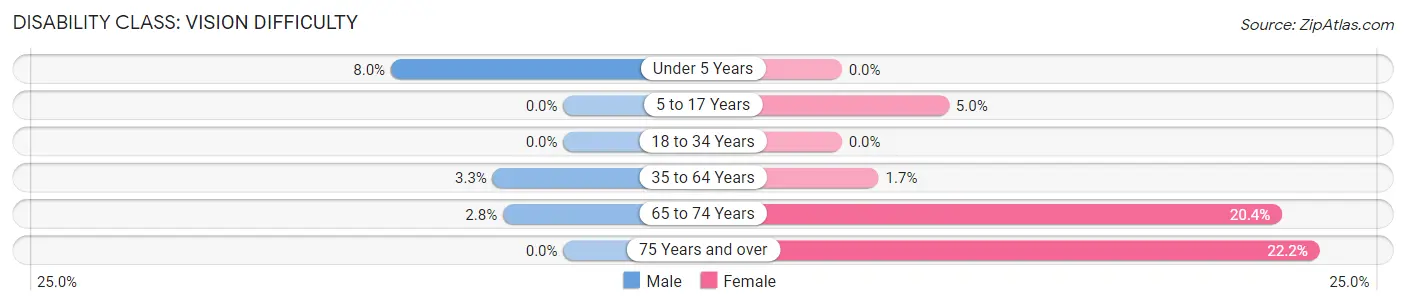
| Age Bracket | Male | Female |
| Under 5 Years | 12 (8.0%) | 0 (0.0%) |
| 5 to 17 Years | 0 (0.0%) | 31 (5.0%) |
| 18 to 34 Years | 0 (0.0%) | 0 (0.0%) |
| 35 to 64 Years | 39 (3.3%) | 22 (1.7%) |
| 65 to 74 Years | 8 (2.8%) | 85 (20.4%) |
| 75 Years and over | 0 (0.0%) | 88 (22.2%) |
Disability Class: Cognitive Difficulty
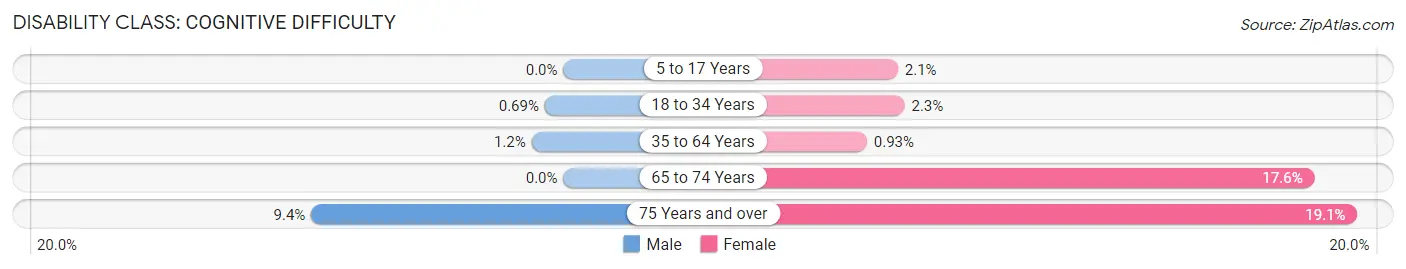
| Age Bracket | Male | Female |
| 5 to 17 Years | 0 (0.0%) | 13 (2.1%) |
| 18 to 34 Years | 3 (0.7%) | 9 (2.3%) |
| 35 to 64 Years | 14 (1.2%) | 12 (0.9%) |
| 65 to 74 Years | 0 (0.0%) | 73 (17.5%) |
| 75 Years and over | 28 (9.4%) | 76 (19.1%) |
Disability Class: Ambulatory Difficulty
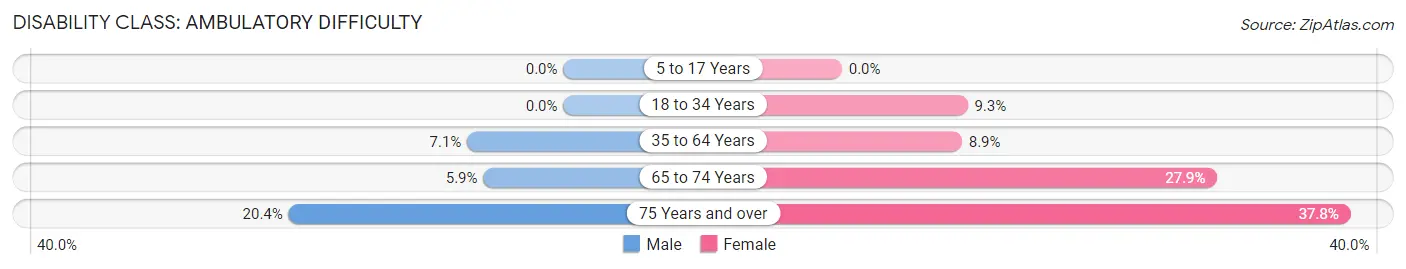
| Age Bracket | Male | Female |
| 5 to 17 Years | 0 (0.0%) | 0 (0.0%) |
| 18 to 34 Years | 0 (0.0%) | 36 (9.3%) |
| 35 to 64 Years | 85 (7.1%) | 115 (8.9%) |
| 65 to 74 Years | 17 (5.9%) | 116 (27.9%) |
| 75 Years and over | 61 (20.4%) | 150 (37.8%) |
Disability Class: Self-Care Difficulty
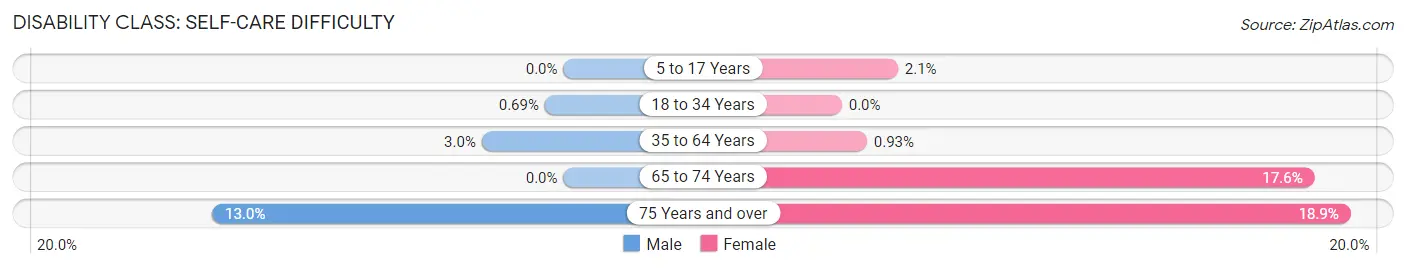
| Age Bracket | Male | Female |
| 5 to 17 Years | 0 (0.0%) | 13 (2.1%) |
| 18 to 34 Years | 3 (0.7%) | 0 (0.0%) |
| 35 to 64 Years | 36 (3.0%) | 12 (0.9%) |
| 65 to 74 Years | 0 (0.0%) | 73 (17.5%) |
| 75 Years and over | 39 (13.0%) | 75 (18.9%) |
Technology Access in Dickson City borough
Computing Device Access in Dickson City borough
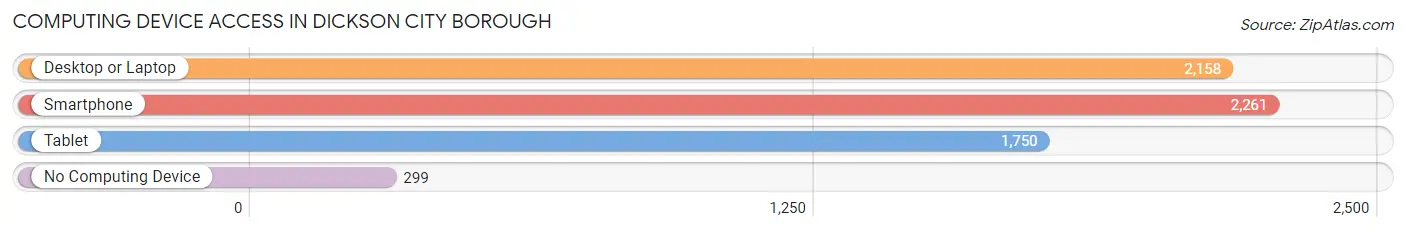
| Device Type | # Households | % Households |
| Desktop or Laptop | 2,158 | 76.8% |
| Smartphone | 2,261 | 80.4% |
| Tablet | 1,750 | 62.3% |
| No Computing Device | 299 | 10.6% |
| Total | 2,811 | 100.0% |
Internet Access in Dickson City borough
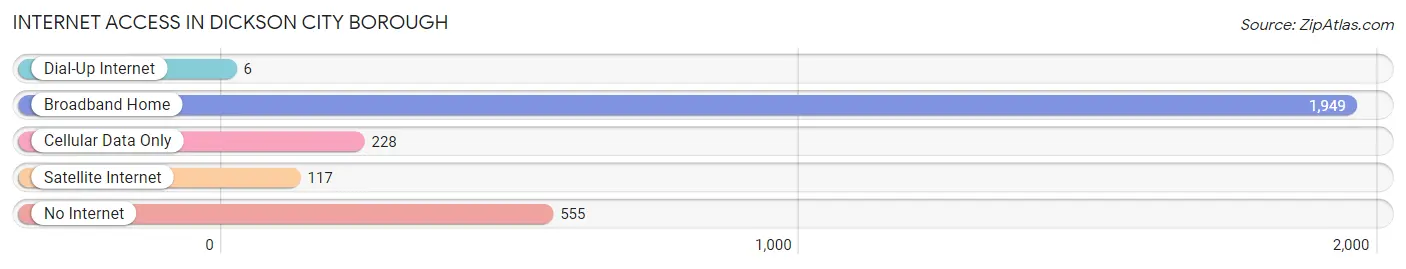
| Internet Type | # Households | % Households |
| Dial-Up Internet | 6 | 0.2% |
| Broadband Home | 1,949 | 69.3% |
| Cellular Data Only | 228 | 8.1% |
| Satellite Internet | 117 | 4.2% |
| No Internet | 555 | 19.7% |
| Total | 2,811 | 100.0% |
Dickson City borough Summary
Dickson City Borough is a small borough located in Lackawanna County, Pennsylvania. It is situated in the Scranton-Wilkes Barre-Hazleton Metropolitan Statistical Area and is part of the larger Scranton-Wilkes Barre-Hazleton Combined Statistical Area. The borough is home to a population of 6,070 people, as of the 2010 census.
History
Dickson City Borough was founded in 1891 by John Dickson, a Scottish immigrant who had come to the area in search of work. He purchased a large tract of land and began to develop it into a small town. The town was named after him and was incorporated as a borough in 1895.
The borough was originally a small farming community, but it soon began to grow as the coal industry in the area began to expand. The town was home to several coal mines, and the population began to grow rapidly. By the early 1900s, the town had become a bustling industrial center.
The borough continued to grow throughout the 20th century, and by the 2000 census, the population had reached 6,070. The borough has remained relatively stable since then, and the population has remained steady.
Geography
Dickson City Borough is located in northeastern Pennsylvania, in Lackawanna County. It is situated in the Scranton-Wilkes Barre-Hazleton Metropolitan Statistical Area and is part of the larger Scranton-Wilkes Barre-Hazleton Combined Statistical Area.
The borough is located in the Lackawanna Valley, and is bordered by the cities of Scranton and Carbondale to the west, and the boroughs of Throop and Olyphant to the east. The borough is located at an elevation of 1,068 feet above sea level.
The borough covers a total area of 1.3 square miles, all of which is land. The borough is located in the Susquehanna River watershed and is drained by the Lackawanna River.
Economy
Dickson City Borough is a small, rural community with a largely agricultural economy. The borough is home to several small farms, and the local economy is largely based on the production of dairy products, vegetables, and fruits.
The borough is also home to several small businesses, including restaurants, retail stores, and service providers. The borough is also home to a number of manufacturing companies, including a paper mill and a plastics factory.
Demographics
As of the 2010 census, the population of Dickson City Borough was 6,070. The racial makeup of the borough was 97.2% White, 0.9% African American, 0.2% Native American, 0.7% Asian, 0.1% Pacific Islander, and 0.9% from other races. Hispanic or Latino of any race were 2.2% of the population.
The median household income in the borough was $41,944, and the median family income was $50,917. The per capita income was $20,945. About 8.3% of families and 10.2% of the population were below the poverty line, including 14.2% of those under age 18 and 6.2% of those age 65 or over.
Common Questions
What is Per Capita Income in Dickson City borough?
Per Capita income in Dickson City borough is $35,244.
What is the Median Family Income in Dickson City borough?
Median Family Income in Dickson City borough is $70,706.
What is the Median Household income in Dickson City borough?
Median Household Income in Dickson City borough is $56,679.
What is Income or Wage Gap in Dickson City borough?
Income or Wage Gap in Dickson City borough is 28.7%.
Women in Dickson City borough earn 71.3 cents for every dollar earned by a man.
What is Family Income Deficit in Dickson City borough?
Family Income Deficit in Dickson City borough is $15,413.
Families that are below poverty line in Dickson City borough earn $15,413 less on average than the poverty threshold level.
What is Inequality or Gini Index in Dickson City borough?
Inequality or Gini Index in Dickson City borough is 0.43.
What is the Total Population of Dickson City borough?
Total Population of Dickson City borough is 6,026.
What is the Total Male Population of Dickson City borough?
Total Male Population of Dickson City borough is 2,755.
What is the Total Female Population of Dickson City borough?
Total Female Population of Dickson City borough is 3,271.
What is the Ratio of Males per 100 Females in Dickson City borough?
There are 84.23 Males per 100 Females in Dickson City borough.
What is the Ratio of Females per 100 Males in Dickson City borough?
There are 118.73 Females per 100 Males in Dickson City borough.
What is the Median Population Age in Dickson City borough?
Median Population Age in Dickson City borough is 45.7 Years.
What is the Average Family Size in Dickson City borough
Average Family Size in Dickson City borough is 2.8 People.
What is the Average Household Size in Dickson City borough
Average Household Size in Dickson City borough is 2.1 People.
How Large is the Labor Force in Dickson City borough?
There are 2,950 People in the Labor Forcein in Dickson City borough.
What is the Percentage of People in the Labor Force in Dickson City borough?
61.2% of People are in the Labor Force in Dickson City borough.
What is the Unemployment Rate in Dickson City borough?
Unemployment Rate in Dickson City borough is 8.1%.